UNITED STATES
SECURITIES AND EXCHANGE COMMISSION
Washington, D.C. 20549
FORM N-CSR
CERTIFIED SHAREHOLDER REPORT
OF
REGISTERED MANAGEMENT INVESTMENT COMPANIES
Investment Company Act file number: 811-5445
Name of Registrant: Vanguard Fenway Funds
Address of Registrant: | P.O. Box 2600 |
| Valley Forge, PA 19482 |
|
|
Name and address of agent for service: | Heidi Stam, Esquire |
| P.O. Box 876 |
| Valley Forge, PA 19482 |
Registrant’s telephone number, including area code: (610) 669-1000
Date of fiscal year end: September 30
Date of reporting period: October 1, 2006–September 30, 2007
Item 1: Reports to Shareholders |
|
|

> | Returns for Vanguard Equity Income Fund exceeded those of its benchmark measures for the 2007 fiscal year. The fund’s Investor Shares returned 16.3%, and Admiral Shares, 16.4%. |
> | Energy and industrials firms with a global reach were the fund’s strongest contributors, overcoming weakness in the financial sector. |
> | The fund’s returns over the past decade have solidly outpaced the average return among peer funds. |
Contents |
|
|
|
Your Fund’s Total Returns | 1 |
Chairman’s Letter | 2 |
Advisors’ Report | 7 |
Fund Profile | 10 |
Performance Summary | 11 |
Financial Statements | 13 |
Your Fund’s After-Tax Returns | 26 |
About Your Fund’s Expenses | 27 |
Glossary | 29 |
Please note: The opinions expressed in this report are just that—informed opinions. They should not be considered promises or advice. Also, please keep in mind that the information and opinions cover the period through the date on the cover of this report. Of course, the risks of investing in your fund are spelled out in the prospectus.
Your Fund’s Total Returns
Fiscal Year Ended September 30, 2007 |
|
|
| Ticker | Total |
| Symbol | Returns |
Vanguard Equity Income Fund |
|
|
Investor Shares | VEIPX | 16.3% |
Admiral™ Shares1 | VEIRX | 16.4 |
Spliced Equity Income Index2 |
| 15.3 |
Average Equity Income Fund3 |
| 15.6 |
Your Fund’s Performance at a Glance |
|
|
|
|
September 30, 2006–September 30, 2007 |
|
|
|
|
|
|
| Distributions Per Share | |
| Starting | Ending | Income | Capital |
| Share Price | Share Price | Dividends | Gains |
Vanguard Equity Income Fund |
|
|
|
|
Investor Shares | $25.21 | $27.01 | $0.730 | $1.418 |
Admiral Shares | 52.84 | 56.62 | 1.595 | 2.972 |
1 A lower-cost class of shares available to many longtime shareholders and to those with significant investments in the fund.
2 Russell 1000 Value Index through July 31, 2007; FTSE High Dividend Yield Index thereafter.
3 Derived from data provided by Lipper Inc.
1

Chairman’s Letter
Dear Shareholder,
Vanguard Equity Income Fund performed well in a year in which its largest sector, financial stocks, suffered repeated blows. The fund’s advisors decreased the portfolio’s exposure to financials before troubles in the mortgage market triggered a summer slowdown in the sector. Strong gains among energy and industrial stocks offset weakness among banks and consumer loan companies.
The fund’s Investor Shares gained 16.3%; Admiral Shares returned 16.4%. The fund’s performance was ahead of both its benchmark index and the average return among its peer funds. During the fiscal year, the fund’s benchmark index changed from the Russell 1000 Value Index to the FTSE High Dividend Yield Index, which is more consistent with the fund’s income-oriented mandate. At the end of the fiscal year, the Equity Income Fund’s dividend yields were 2.84% and 2.95% for Investor and Admiral Shares, respectively.
Strong returns for U.S. stocks; even better for markets abroad
U.S. stocks produced excellent returns for the fiscal year. The gains came despite a midsummer shakeup brought on by problems in the subprime mortgage-loan market. Financials stocks—which represent a sizable share of the U.S. market’s value—were hardest hit, as investment banking and consumer lending businesses throttled back.
2
The broad U.S. equity market returned 17.1% for the year. Returns from large-capitalization stocks outpaced those of small-caps, and growth-oriented stocks outperformed their value-oriented counterparts. As investors took account of risk, they seemed to exhibit a preference for large-cap growth stocks, which seem better positioned to thrive in a period of economic uncertainty.
Although not immune from the effects of the turmoil in U.S. credit markets, international stocks handily surpassed the returns of domestic stocks over the 12 months. The dollar’s ongoing weakness further enhanced foreign market gains for U.S.-based investors.
The bond market was shaken, but regained ground in the end
Turmoil in the corporate bond and subprime lending markets caused a “flight to quality” that drove prices of U.S. Treasury bonds sharply higher, particularly toward the end of the fiscal period. As the bonds’ prices rose, their yields fell. The declines were greatest among Treasury securities with the shortest maturities. The yield of the 3-month Treasury bill, which started the fiscal year at 4.89%, dropped more than a full percentage point to 3.81%.
As short-term yields fell, the yield curve—which illustrates the relationship between short- and long-term bond yields—returned to its usual, upward-sloping pattern. The curve had been mildly inverted at the start
Market Barometer |
|
|
| |
| Average Annual Total Returns | |||
| Periods Ended September 30, 2007 | |||
| One Year | Three Years | Five Years | |
Stocks |
|
|
| |
Russell 1000 Index (Large-caps) | 16.9% | 13.8% | 16.0% | |
Russell 2000 Index (Small-caps) | 12.3 | 13.4 | 18.8 | |
Dow Jones Wilshire 5000 Index (Entire market) | 17.1 | 14.0 | 16.5 | |
MSCI All Country World Index ex USA (International) | 31.1 | 26.5 | 26.3 | |
|
|
|
| |
Bonds |
|
|
| |
Lehman U.S. Aggregate Bond Index (Broad taxable market) | 5.1% | 3.9% | 4.1% | |
Lehman Municipal Bond Index | 3.1 | 3.9 | 4.0 | |
Citigroup 3-Month Treasury Bill Index | 5.0 | 4.0 | 2.8 | |
|
|
|
| |
CPI |
|
|
| |
Consumer Price Index | 2.8% | 3.2% | 2.9% | |
3
of the period, with yields of shorter-term bonds above those of longer-term issues. For the year ended September 30, the broad taxable bond market returned 5.1%. Returns from tax-exempt bonds were lower, as these issues did not benefit from the late-summer rally in Treasuries.
Fund benefited from excellent stock selection, prescient positioning
A year ago, I reported that the fund’s financial stocks, particularly the so-called money center banks, boosted returns as they benefited from record levels of corporate bond issuance and an active merger-and-acquisition market. In the most recent fiscal year, financials were the fund’s weakest sector, gaining less than 1% as a group. At roughly 30% of fund holdings, on average, the sector created a strong performance headwind. Your fund’s managers scaled back on financial holdings early in the fiscal year, anticipating troubles for mortgage-lending and corporate finance firms.
At the same time, the advisors’ stock choices in other sectors performed very well. Integrated oil companies were among the larger contributors. Domestic energy stocks rallied as the price of a barrel of oil climbed from the $60 range to just over $80 by the end of the period. Also performing well were industrial conglomerates (General Electric, Deere & Co., 3M, Goodrich) and consumer staples companies (Coca-Cola, Procter & Gamble, Altria Group). The three sectors, which together made up another one-third of fund holdings, on average, contributed more than half of the fund’s gain. All of
Expense Ratios1 |
|
|
|
Your fund compared with its peer group |
|
|
|
|
|
|
|
| Investor | Admiral | Average Equity |
| Shares | Shares | Fund Income |
Equity Income Fund | 0.29% | 0.17% | 1.37% |
1 Fund expense ratios reflect the 12 months ended September 30, 2007. Peer-group expense ratio is derived from data provided by Lipper Inc. and captures information through year-end 2006.
4
these sectors are as dependent on global markets as on domestic markets. This global reach was a positive during the 12 months ended June 30 when the U.S. economy grew at just below 2%, a four-year low.
The fund’s managers also made good stock selections within the smaller information technology and telecommunication sectors. Finnish firm Nokia, for instance, a large weighting in the fund, advanced 96% during the year. The mobile phone maker has gained market share by offering an array of Internet-based services to mobile phone users. AT&T and Verizon Communications were also top performers.
The fund’s solid return relative to its index reflected not only skillful stock selection but also success in avoiding some of the market’s potholes. In addition to the advisors’ prescient pullback from financials stocks, the fund had limited exposure to consumer discretionary stocks, a weak sector during the period.
This discussion of fund performance is based on the entire portfolio, which is split between two managers: Wellington Management Company, LLP, and Vanguard Quantitative Equity Group. A separate Advisors’ Report begins on page 7.
Total Returns |
|
Ten Years Ended September 30, 2007 |
|
| Average |
| Annual Return |
Equity Income Fund Investor Shares | 8.5% |
Spliced Equity Income Index1 | 8.9 |
Average Equity Income Fund2 | 6.6 |
The figures shown represent past performance, which is not a guarantee of future results. (Current performance may be lower or higher than the performance data cited. For performance data current to the most recent month-end, visit our website at www.vanguard.com/performance.) Note, too, that both investment returns and principal value can fluctuate widely, so an investor’s shares, when sold, could be worth more or less than their original cost.
1 Russell 1000 Value Index through July 31, 2007; FTSE High Dividend Yield Index thereafter.
2 Derived from data provided by Lipper Inc.
5
Long-term track record gives fund an advantage
Your fund emphasizes dividend-paying stocks with low prices relative to earnings, a strategy that has produced solid long-term results. As the table below shows, the Equity Income Fund Investor Shares’ average annual total return of 8.5% over the past decade exceeds that of its average peer fund by nearly 2 percentage points per year.
In evaluating your fund’s outperformance, note that the 6.6% average return among Equity Income’s peer funds for the past ten years is in line with the 6.9% return of the broad market, as measured by the Dow Jones Wilshire 5000 Index, for the same period. This was the case despite the outperformance of value stocks that began with the bursting of the tech bubble in 2000 and ended this summer. In contrast, your fund was able to capture more of the value segment’s performance advantage as a result of the disciplined investment strategies employed by the fund’s advisors. Your fund’s performance has also benefited from an extremely low expense ratio—less than a quarter of the peer-group average expense ratio.
Uncertainty is par for the course
After several years of unusual calm, the financial markets experienced a jolt in the third quarter. Stock market volatility increased sharply, and a number of other long-established trends seemed to shift into reverse. The changes were dramatic, but a long-term perspective suggests that these occasional—and unpredictable—dislocations are an enduring feature of the financial markets.
The best response to uncertainty is diversification both within and across asset classes, which is why we counsel investors to hold a broadly diversified portfolio of stocks and fixed income investments in proportions consistent with their goals, risk tolerance, and time horizon. Vanguard Equity Income Fund can play a valuable role in such a portfolio.
Thank you for entrusting your assets to Vanguard.
Sincerely,

John J. Brennan
Chairman and Chief Executive Officer
October 12, 2007
6
Advisors’ Report
During the year ended September 30, 2007, the Investor Shares of Vanguard Equity Income Fund returned 16.3% and the lower-cost Admiral Shares returned 16.4%. This performance reflects the combined efforts of your fund’s two independent advisors. The use of two advisors provides exposure to distinct, yet complementary, investment approaches, enhancing the diversification of your fund.
The advisors, the percentage of the fund’s assets each manages, and a brief description of their investment strategies are presented in the table below. Each advisor has also prepared a discussion of the investment environment that existed during the fiscal year and of how the portfolio positioning reflects this assessment. These comments were prepared on October 12, 2007.
Wellington Management Company, LLP
Portfolio Managers:
John R. Ryan, Senior Vice President, Managing Partner
W. Michael Reckmeyer, III, CFA, Vice President
The financials sector has clearly dominated the headlines in recent months, and is particularly important given its influence on the health of the broader market, as well as its significant representation in our investment universe of higher-yielding stocks.
At the beginning of the fiscal year, we began to position the portfolio for a more difficult environment in the financial services area, namely by reducing our exposure to subprime mortgage and capital-market-related risk. We expressed
Vanguard Equity Income Fund Investment Advisors | ||||
| ||||
| Fund Assets Managed |
| ||
Investment Advisor | % | $ Million | Investment Strategy | |
Wellington Management | 58 | 3,317 | A fundamental approach to seeking desirable stocks. | |
Company, LLP |
|
| Our selections typically offer above-average dividend | |
|
|
| yields, below-average valuations, and the potential for | |
|
|
| dividend increases in the future. | |
Vanguard Quantitative Equity Group | 39 | 2,209 | Quantitative management using models that assess | |
|
|
| valuation, marketplace sentiment, and balance-sheet | |
|
|
| characteristics of companies versus their peers. | |
Cash investments1 | 3 | 176 | — | |
1 These short-term reserves are invested by Vanguard in equity index products to simulate investments in stocks. Each advisor also may maintain a modest cash position.
7
this view through the elimination of Washington Mutual, which had meaningful exposure to subprime loans, and by reducing our position in Wells Fargo. Among capital-market-oriented stocks, we reduced our position in Citigroup and eliminated Merrill Lynch. Our worries relating to this sector turned to reality over the past few months as the subprime issues finally came to a head.
Although we remain cautious on the financials sector, we are selectively trying to find companies that can capitalize on the dislocation in the financial markets. Wells Fargo, with its AAA balance sheet, is positioned to benefit from this disruption, and we have since increased our position.
Outside of the financials sector, our purchases over the past 12 months exhibited no overall theme. Rather, they reflected bottom-up stock selection consistent with our diversified investment approach. We initiated positions in Nokia, Intel, and SUPERVALU and, consistent with the strong performance of conglomerates in both industrials and energy, added to existing positions in General Electric, ConocoPhillips, and Chevron. Our sales concentrated on companies that had reached or approached our target prices, such as Goodrich and Alcoa, or had weakened due to eroding company fundamentals or external pressures.
The deceleration in the pace of U.S. economic growth is owed to the sharp market dislocations over the past few months. We are not expecting a recession, but the risks of one are clearly higher due to the dislocation in the capital markets, weak housing markets, and rising energy and food prices, all of which are taxing consumer confidence.
Vanguard Quantitative Equity Group
Portfolio Manager: James P. Stetler, Principal
The 2007 fiscal year was an eventful period in the U.S. equity market. Through the first eight months of the period, value stocks continued to outperform growth issues, as had been the case in most recent years. Then in June, the tide began to turn as market volatility rose and investors began to worry about a deteriorating housing market, subprime mortgage defaults, rising oil prices, and inflation. For June and July, the Russell 1000 Value Index was off nearly –7%, while its growth counterpart was down about –3%. A change in market leadership was under way and continued through the fund’s September 30 fiscal year-end. The market did recover from its summer swoon, as a result of the Federal Reserve Board’s cutting its federal funds target rate by 0.5% on September 18.
The fiscal year was also eventful for our portion of the Equity Income Fund, as we modified the strategy (portfolio construction and risk-control parameters) used to manage
8
the portfolio. Historically, we have emphasized valuation characteristics in building the portfolio. We have broadened that approach in our stock-ranking methodology to include other factors, such as market sentiment and earnings quality. This approach provides a more diversified set of stock-selection signals and a greater degree of risk control than our previous method. The timing of the modification was fortuitous, in that our valuation model did not perform well this period, while both the market sentiment and earnings-quality models were positive contributors to the portfolio’s overall return. Consumer discretionary stocks Station Casinos, Mattel, and Avon Products were among the largest positive contributors to our return, despite the sector’s overall weak performance for the 12 months, while McClatchy Newspapers and underweights in the energy and utility sectors at the beginning of the period were the major detractors from the portfolio’s results.
Over the long run, our quantitative process has demonstrably added value, and we continue to believe that by stressing reasonable valuation, high earnings quality, and market acceptance, combined with disciplined risk control, our stock selections can offer an attractive portfolio as part of a diversified investment plan.
9
Fund Profile
As of September 30, 2007
Portfolio Characteristics |
|
| |
|
| Comparative | Broad |
| Fund | Index1 | Index2 |
Number of Stocks | 170 | 508 | 4,887 |
Median Market Cap | $96.0B | $112.0B | $36.1B |
Price/Earnings Ratio | 14.5x | 15.2x | 18.1x |
Price/Book Ratio | 2.6x | 2.6x | 2.8x |
Yield |
| 3.0% | 1.7% |
Investor Shares | 2.8% |
|
|
Admiral Shares | 3.0% |
|
|
Return on Equity | 21.8% | 21.4% | 18.8% |
Earnings Growth Rate | 21.8% | 17.5% | 21.6% |
Foreign Holdings | 4.5% | 0.0% | 0.0% |
Turnover Rate | 51% | — | — |
Expense Ratio |
| — | — |
Investor Shares | 0.29% |
|
|
Admiral Shares | 0.17% |
|
|
Short-Term Reserves | 0.6% | — | — |
Sector Diversification (% of equity exposure) | |||
|
| Comparative | Broad |
| Fund | Index1 | Index2 |
Consumer Discretionary | 2.9% | 5.9% | 10.4% |
Consumer Staples | 12.2 | 13.0 | 8.2 |
Energy | 15.0 | 13.1 | 11.2 |
Financials | 25.4 | 24.8 | 20.0 |
Health Care | 8.8 | 11.0 | 11.6 |
Industrials | 12.1 | 12.7 | 11.8 |
Information Technology | 2.3 | 0.7 | 16.0 |
Materials | 6.0 | 4.8 | 3.7 |
Telecommunication Services | 7.0 | 6.1 | 3.5 |
Utilities | 8.3 | 7.9 | 3.6 |
Volatility Measures3 |
| |
| Fund Versus | Fund Versus |
| Spliced Index4 | Broad Index2 |
R-Squared | 0.94 | 0.84 |
Beta | 0.86 | 0.78 |
Ten Largest Holdings5 (% of portfolio) |
| |
|
|
|
ExxonMobil Corp. | integrated oil and gas | 6.1% |
General Electric Co. | industrial conglomerates | 5.5 |
Chevron Corp. | integrated oil and gas | 4.3 |
AT&T Inc. | integrated telecommunication services | 4.2 |
Bank of America Corp. | diversified financial services | 3.7 |
ConocoPhillips Co. | integrated oil and gas | 3.6 |
Citigroup, Inc. | diversified financial services | 2.8 |
Altria Group, Inc. | tobacco | 2.3 |
Verizon Communications Inc. | integrated telecommunication services | 2.1 |
JPMorgan Chase & Co. | diversified financial services | 2.1 |
Top Ten |
| 36.7% |
Investment Focus

1 FTSE High Dividend Yield Index.
2 Dow Jones Wilshire 5000 Index.
3 For an explanation of R-squared, beta, and other terms used here, see the Glossary on page 29.
4 Russell 1000 Value Index through July 31, 2007; FTSE High Dividend Yield Index thereafter.
5 “Ten Largest Holdings” excludes any temporary cash investments and equity index products.
10
Performance Summary
All of the returns in this report represent past performance, which is not a guarantee of future results that may be achieved by the fund. (Current performance may be lower or higher than the performance data cited. For performance data current to the most recent month-end, visit our website at www.vanguard.com/performance.) Note, too, that both investment returns and principal value can fluctuate widely, so an investor’s shares, when sold, could be worth more or less than their original cost. The returns shown do not reflect taxes that a shareholder would pay on fund distributions or on the sale of fund shares.
Cumulative Performance: September 30, 1997–September 30, 2007
Initial Investment of $10,000
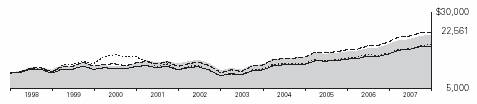
| Average Annual Total Returns | Final Value | ||
| Periods Ended September 30, 2007 | of a $10,000 | ||
| One Year | Five Years | Ten Years | Investment |
Equity Income Fund Investor Shares1 | 16.29% | 16.15% | 8.48% | $22,561 |
Dow Jones Wilshire 5000 Index | 17.08 | 16.53 | 6.85 | 19,399 |
Spliced Equity Income Index2 | 15.33 | 18.25 | 8.89 | 23,428 |
Average Equity Income Fund3 | 15.59 | 15.57 | 6.57 | 18,902 |
|
|
|
| Final Value |
|
|
| Since | of a $100,000 |
| One Year | Five Years | Inception4 | Investment |
Equity Income Fund Admiral Shares | 16.44% | 16.29% | 8.38% | $163,753 |
Dow Jones Wilshire 5000 Index | 17.08 | 16.53 | 7.30 | 154,041 |
Spliced Equity Income Index2 | 15.33 | 18.25 | 9.33 | 172,759 |
1 Total return figures do not include the account service fee that may be applicable to certain accounts with balances below $10,000.
2 Russell 1000 Value Index through July 31, 2007; FTSE High Dividend Yield Index thereafter.
3 Derived from data provided by Lipper Inc.
4 Performance for the fund's Admiral Shares and its comparative standards is calculated since the inception of the share class: August 13, 2001.
11
Fiscal-Year Total Returns (%): September 30, 1997–September 30, 2007
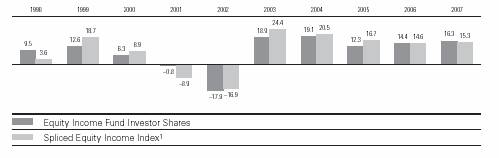
1 Russell 1000 Value Index through July 31, 2007; FTSE High Dividend Yield Index thereafter.
Note: See Financial Highlights tables on pages 19 and 20 for dividend and capital gains information.
12
Financial Statements
Statement of Net Assets
As of September 30, 2007
The fund provides a complete list of its holdings four times in each fiscal year, at the quarter-ends. For the second and fourth fiscal quarters, the lists appear in the fund’s semiannual and annual reports to shareholders. For the first and third fiscal quarters, the fund files the lists with the Securities and Exchange Commission on Form N-Q. Shareholders can look up the fund’s Forms N-Q on the SEC’s website at www.sec.gov. Forms N-Q may also be reviewed and copied at the SEC’s Public Reference Room (see the back cover of this report for further information).
|
| Market |
|
| Value• |
| Shares | ($000) |
Common Stocks (97.4%)1 |
|
|
Consumer Discretionary (2.7%) |
|
|
McDonald's Corp. | 848,005 | 46,191 |
Home Depot, Inc. | 750,400 | 24,343 |
General Motors Corp. | 384,700 | 14,119 |
Carnival Corp. | 179,400 | 8,688 |
Whirlpool Corp. | 95,100 | 8,473 |
Regal Entertainment Group Class A | 364,800 | 8,007 |
Gannett Co., Inc. | 182,600 | 7,980 |
Newell Rubbermaid, Inc. | 255,500 | 7,364 |
Eastman Kodak Co. | 263,000 | 7,038 |
CBS Corp. | 203,600 | 6,413 |
Mattel, Inc. | 271,228 | 6,363 |
Asbury Automotive Group, Inc. | 251,470 | 4,982 |
Cooper Tire & Rubber Co. | 135,400 | 3,304 |
|
| 153,265 |
Consumer Staples (11.9%) |
|
|
Altria Group, Inc. | 1,853,655 | 128,885 |
The Procter & Gamble Co. | 1,088,620 | 76,574 |
Kimberly-Clark Corp. | 754,175 | 52,988 |
Kellogg Co. | 849,910 | 47,595 |
The Coca-Cola Co. | 786,005 | 45,172 |
General Mills, Inc. | 771,473 | 44,753 |
PepsiCo, Inc. | 599,200 | 43,897 |
Colgate-Palmolive Co. | 606,800 | 43,277 |
ConAgra Foods, Inc. | 1,542,200 | 40,298 |
Kraft Foods Inc. | 1,006,234 | 34,725 |
SUPERVALU INC. | 800,700 | 31,235 |
Diageo PLC ADR | 305,150 | 26,771 |
Reynolds American Inc. | 174,700 | 11,109 |
Sysco Corp. | 285,700 | 10,168 |
Molson Coors Brewing Co. Class B | 99,800 | 9,947 |
Carolina Group | 120,300 | 9,892 |
Anheuser-Busch Cos., Inc. | 116,600 | 5,829 |
Universal Corp. (VA) | 109,600 | 5,365 |
J.M. Smucker Co. | 98,000 | 5,235 |
|
| Market |
|
| Value• |
| Shares | ($000) |
Alberto-Culver Co. | 94,200 | 2,335 |
H.J. Heinz Co. | 16,900 | 781 |
|
| 676,831 |
Energy (14.5%) |
|
|
ExxonMobil Corp. | 3,727,805 | 345,046 |
Chevron Corp. | 2,619,100 | 245,095 |
ConocoPhillips Co. | 2,368,400 | 207,874 |
Royal Dutch Shell PLC ADR |
|
|
Class B | 289,277 | 23,750 |
General Maritime Corp. | 115,500 | 3,224 |
|
| 824,989 |
Financials (24.3%) |
|
|
Capital Markets (2.4%) |
|
|
UBS AG (New York Shares) | 1,270,600 | 67,659 |
Bank of New York Mellon Corp. | 1,006,570 | 44,430 |
American Capital Strategies, Ltd. | 224,300 | 9,584 |
Federated Investors, Inc. | 131,100 | 5,205 |
MCG Capital Corp. | 334,468 | 4,813 |
Northern Trust Corp. | 39,200 | 2,598 |
|
|
|
Commercial Banks (8.1%) |
|
|
U.S. Bancorp | 3,002,779 | 97,680 |
Wells Fargo & Co. | 2,681,430 | 95,513 |
Wachovia Corp. | 1,459,924 | 73,215 |
PNC Financial Services Group | 876,882 | 59,716 |
Lloyds TSB Group PLC ADR | 722,500 | 32,122 |
SunTrust Banks, Inc. | 198,300 | 15,005 |
KeyCorp | 327,900 | 10,601 |
Synovus Financial Corp. | 341,900 | 9,590 |
Regions Financial Corp. | 315,000 | 9,286 |
Comerica, Inc. | 170,400 | 8,738 |
Bank of Hawaii Corp. | 150,200 | 7,938 |
UnionBanCal Corp. | 131,058 | 7,655 |
National City Corp. | 283,500 | 7,113 |
Central Pacific Financial Co. | 214,900 | 6,275 |
City National Corp. | 85,100 | 5,915 |
13
|
| Market |
|
| Value• |
| Shares | ($000) |
Pacific Capital Bancorp | 218,200 | 5,739 |
United Bankshares, Inc. | 60,544 | 1,843 |
Peoples Bancorp, Inc. | 68,100 | 1,783 |
M & T Bank Corp. | 15,500 | 1,603 |
First BanCorp Puerto Rico | 144,400 | 1,372 |
Great Southern Bancorp, Inc. | 53,300 | 1,324 |
Trustmark Corp. | 34,636 | 971 |
First Bancorp (NC) | 33,000 | 673 |
Fifth Third Bancorp | 14,100 | 478 |
BB&T Corp. | 11,700 | 473 |
Colonial BancGroup, Inc. | 16,200 | 350 |
City Holding Co. | 6,880 | 251 |
|
|
|
Consumer Finance (0.0%) |
|
|
Advanta Corp. Class B | 91,492 | 2,509 |
|
|
|
Diversified Financial Services (8.6%) |
|
|
Bank of America Corp. | 4,237,138 | 213,001 |
Citigroup, Inc. | 3,379,366 | 157,715 |
JPMorgan Chase & Co. | 2,646,900 | 121,281 |
|
|
|
Insurance (3.5%) |
|
|
The Chubb Corp. | 1,236,400 | 66,321 |
The Allstate Corp. | 736,100 | 42,098 |
ACE Ltd. | 617,700 | 37,414 |
The Travelers Cos., Inc. | 342,600 | 17,247 |
XL Capital Ltd. Class A | 147,000 | 11,642 |
PartnerRe Ltd. | 109,100 | 8,618 |
Endurance Specialty Holdings Ltd. | 161,200 | 6,698 |
Nationwide Financial Services, Inc. | 112,900 | 6,076 |
The Hartford Financial Services Group Inc. | 30,400 | 2,814 |
Cincinnati Financial Corp. | 57,600 | 2,495 |
|
|
|
Real Estate (0.8%) |
|
|
Host Hotels & Resorts Inc. REIT | 2,133,900 | 47,885 |
|
|
|
Thrifts & Mortgage Finance (0.9%) |
|
|
Fannie Mae | 424,000 | 25,783 |
Washington Mutual, Inc. | 468,164 | 16,531 |
Freddie Mac | 104,600 | 6,172 |
|
| 1,389,811 |
Health Care (8.4%) |
|
|
Wyeth | 2,296,698 | 102,318 |
Johnson & Johnson | 994,505 | 65,339 |
Abbott Laboratories | 1,211,370 | 64,954 |
Pfizer Inc. | 2,527,431 | 61,745 |
Bristol-Myers Squibb Co. | 1,500,532 | 43,245 |
Merck & Co., Inc. | 833,914 | 43,105 |
Baxter International, Inc. | 747,900 | 42,092 |
GlaxoSmithKline PLC ADR | 573,800 | 30,526 |
Eli Lilly & Co. | 438,249 | 24,950 |
|
| Market |
|
| Value• |
| Shares | ($000) |
Hillenbrand Industries, Inc. | 39,200 | 2,157 |
LCA-Vision Inc. | 12,100 | 356 |
|
| 480,787 |
Industrials (11.7%) |
|
|
General Electric Co. | 7,546,772 | 312,436 |
3M Co. | 668,500 | 62,558 |
Pitney Bowes, Inc. | 1,263,500 | 57,388 |
Waste Management, Inc. | 1,056,200 | 39,861 |
American Standard Cos., Inc. | 1,033,500 | 36,813 |
Deere & Co. | 226,900 | 33,677 |
United Parcel Service, Inc. | 294,100 | 22,087 |
R.R. Donnelley & Sons Co. | 543,500 | 19,870 |
Honeywell International Inc. | 298,462 | 17,750 |
Caterpillar, Inc. | 223,200 | 17,506 |
Raytheon Co. | 260,700 | 16,638 |
Northrop Grumman Corp. | 196,300 | 15,311 |
Emerson Electric Co. | 119,600 | 6,365 |
GATX Corp. | 132,500 | 5,664 |
Steelcase Inc. | 244,400 | 4,394 |
|
| 668,318 |
Information Technology (2.0%) |
|
|
Nokia Corp. ADR | 1,480,600 | 56,159 |
Intel Corp. | 1,532,700 | 39,636 |
Maxim Integrated Products, Inc. | 218,300 | 6,407 |
Automatic Data Processing, Inc. | 104,100 | 4,781 |
Analog Devices, Inc. | 62,200 | 2,249 |
Methode Electronics, Inc. Class A | 85,500 | 1,287 |
United Online, Inc. | 40,000 | 600 |
Microchip Technology, Inc. | 13,100 | 476 |
|
| 111,595 |
Materials (5.8%) |
|
|
Dow Chemical Co. | 1,750,245 | 75,366 |
Air Products & Chemicals, Inc. | 519,500 | 50,786 |
E.I. du Pont de Nemours & Co. | 958,827 | 47,519 |
PPG Industries, Inc. | 462,400 | 34,934 |
Packaging Corp. of America | 1,167,500 | 33,939 |
Alcoa Inc. | 464,600 | 18,175 |
Nucor Corp. | 204,600 | 12,168 |
International Paper Co. | 330,120 | 11,841 |
^Southern Peru Copper Corp. (U.S. Shares) | 89,400 | 11,070 |
Lubrizol Corp. | 129,600 | 8,432 |
RPM International, Inc. | 316,700 | 7,585 |
Eastman Chemical Co. | 108,600 | 7,247 |
Freeport-McMoRan Copper & Gold, Inc. Class B | 55,300 | 5,800 |
14
|
|
| Market |
|
|
| Value• |
|
| Shares | ($000) |
| Sonoco Products Co. | 173,939 | 5,249 |
| Bemis Co., Inc. | 84,100 | 2,448 |
| Olin Corp. | 24,500 | 548 |
|
|
| 333,107 |
Telecommunication Services (6.8%) |
|
| |
| AT&T Inc. | 5,656,205 | 239,314 |
| Verizon Communications Inc. | 2,741,357 | 121,387 |
| Chunghwa Telecom Co., Ltd. ADR | 906,830 | 16,758 |
| Alaska Communications Systems Holdings, Inc. | 386,270 | 5,582 |
| Embarq Corp. | 82,000 | 4,559 |
|
|
| 387,600 |
Utilities (8.1%) |
|
| |
| FPL Group, Inc. | 1,570,066 | 95,586 |
| Exelon Corp. | 954,300 | 71,916 |
| American Electric Power Co., Inc. | 1,021,900 | 47,089 |
| Dominion Resources, Inc. | 368,765 | 31,087 |
| Consolidated Edison Inc. | 665,500 | 30,813 |
| Southern Co. | 740,700 | 26,873 |
| SCANA Corp. | 562,200 | 21,780 |
| Duke Energy Corp. | 778,134 | 14,543 |
| Public Service Enterprise Group, Inc. | 156,500 | 13,770 |
| Entergy Corp. | 123,400 | 13,363 |
| FirstEnergy Corp. | 204,600 | 12,959 |
| PG&E Corp. | 262,800 | 12,562 |
| Edison International | 225,000 | 12,476 |
| Sempra Energy | 205,100 | 11,920 |
| Northeast Utilities | 280,600 | 8,017 |
| Puget Energy, Inc. | 305,600 | 7,478 |
| Portland General Electric Co. | 245,400 | 6,822 |
| Xcel Energy, Inc. | 290,266 | 6,252 |
| Alliant Energy Corp. | 129,927 | 4,979 |
| Atmos Energy Corp. | 152,200 | 4,310 |
| TXU Corp. | 49,798 | 3,410 |
| Westar Energy, Inc. | 75,800 | 1,862 |
| WGL Holdings Inc. | 22,000 | 746 |
| Northwest Natural Gas Co. | 6,300 | 288 |
| NiSource, Inc. | 12,900 | 247 |
|
|
| 461,148 |
Exchange-Traded Funds (1.2%) |
|
| |
2 | Vanguard Value ETF | 963,400 | 68,816 |
Total Common Stocks |
|
| |
(Cost $4,369,971) |
| 5,556,267 | |
Temporary Cash Investments (2.7%)1 |
|
| |
Money Market Fund (2.0%) |
|
| |
3 | Vanguard Market Liquidity Fund, 5.153% | 102,967,797 | 102,968 |
3 | Vanguard Market Liquidity Fund, 5.153%—Note G | 10,867,200 | 10,867 |
|
|
| 113,835 |
|
| Face | Market |
|
| Amount | Value• |
|
| ($000) | ($000) |
Repurchase Agreement (0.5%) |
|
| |
| JPMorgan Securities Inc. 5.100%, 10/1/07 (Dated 9/28/07, |
|
|
| Repurchase Value $30,515,000, collateralized |
|
|
| by Federal National Mortgage Assn. 6.000%, 9/1/37) | 30,500 | 30,500 |
|
|
|
|
U.S. Agency Obligation (0.2%) |
|
| |
4 | Federal National Mortgage Assn. |
|
|
5 | 5.203%, 10/3/07 | 9,500 | 9,497 |
Total Temporary Cash Investments |
|
| |
(Cost $153,832) |
| 153,832 | |
Total Investments (100.1%) |
|
| |
(Cost $4,523,803) |
| 5,710,099 | |
Other Assets and Liabilities (-0.1%) |
|
| |
Other Assets—Note C |
| 16,587 | |
Liabilities—Note G |
| (25,035) | |
|
|
| (8,448) |
Net Assets (100%) |
| 5,701,651 | |
At September 30, 2007, net assets consisted of:6 | |
|
|
| Amount |
| ($000) |
Paid-in Capital | 4,244,315 |
Overdistributed Net |
|
Investment Income | (529) |
Accumulated Net |
|
Realized Gains | 268,590 |
Unrealized Appreciation |
|
Investment Securities | 1,186,296 |
Futures Contracts | 2,979 |
Net Assets | 5,701,651 |
15
| Market |
| Value• |
| ($000) |
Investor Shares—Net Assets |
|
Applicable to 127,561,596 outstanding |
|
$.001 par value shares of beneficial |
|
interest (unlimited authorization) | 3,445,488 |
Net Asset Value Per Share— |
|
Investor Shares | $27.01 |
|
|
Admiral Shares—Net Assets |
|
Applicable to 39,850,612 outstanding |
|
$.001 par value shares of beneficial interest |
|
(unlimited authorization) | 2,256,163 |
Net Asset Value Per Share— |
|
Admiral Shares | $56.62 |
• | See Note A in Notes to Financial Statements. |
^ | Part of security position is on loan to broker-dealers. See Note G in Notes to Financial Statements. |
1 The fund invests a portion of its cash reserves in equity markets through the use of index futures contracts. After giving effect to futures investments, the fund’s effective common stock and temporary cash investment positions represent 99.4% and 0.7%, respectively, of net assets. See Note E in Notes to Financial Statements.
2 Considered an affiliated company of the fund as the issuer is another member of The Vanguard Group.
3 Affiliated money market fund available only to Vanguard funds and certain trusts and accounts managed by Vanguard. Rate shown is the 7-day yield.
4 The issuer operates under a congressional charter; its securities are neither issued nor guaranteed by the U.S. government. If needed, access to additional funding from the U.S. Treasury (beyond the issuer’s line of credit) would require congressional action.
5 Securities with a value of $9,497,000 have been segregated as initial margin for open futures contracts.
6 See Note E in Notes to Financial Statements for the tax-basis components of net assets.
ADR—American Depositary Receipt.
REIT—Real Estate Investment Trust.
16
Statement of Operations
| Year Ended |
| September 30, 2007 |
| ($000) |
Investment Income |
|
Income |
|
Dividends1 | 157,468 |
Interest1 | 9,874 |
Security Lending | 454 |
Total Income | 167,796 |
Expenses |
|
Investment Advisory Fees—Note B |
|
Basic Fee | 4,138 |
Performance Adjustment | (70) |
The Vanguard Group—Note C |
|
Management and Administrative |
|
Investor Shares | 6,446 |
Admiral Shares | 1,669 |
Marketing and Distribution |
|
Investor Shares | 682 |
Admiral Shares | 323 |
Custodian Fees | 51 |
Auditing Fees | 25 |
Shareholders’ Reports |
|
Investor Shares | 98 |
Admiral Shares | 8 |
Trustees’ Fees and Expenses | 7 |
Total Expenses | 13,377 |
Expenses Paid Indirectly—Note D | (77) |
Net Expenses | 13,300 |
Net Investment Income | 154,496 |
Realized Net Gain (Loss) |
|
Investment Securities Sold1 | 349,958 |
Futures Contracts | 12,388 |
Realized Net Gain (Loss) | 362,346 |
Change in Unrealized Appreciation (Depreciation) |
|
Investment Securities | 291,477 |
Futures Contracts | 391 |
Change in Unrealized Appreciation (Depreciation) | 291,868 |
Net Increase (Decrease) in Net Assets Resulting from Operations | 808,710 |
1 Dividend income, interest income, and realized net gain (loss) from affiliated companies of the fund were $1,710,000, $6,422,000, and $0, respectively.
17
Statement of Changes in Net Assets
| Year Ended September 30, | |
| 2007 | 2006 |
| ($000) | ($000) |
Increase (Decrease) in Net Assets |
|
|
Operations |
|
|
Net Investment Income | 154,496 | 130,951 |
Realized Net Gain (Loss) | 362,346 | 251,082 |
Change in Unrealized Appreciation (Depreciation) | 291,868 | 216,668 |
Net Increase (Decrease) in Net Assets Resulting from Operations | 808,710 | 598,701 |
Distributions |
|
|
Net Investment Income |
|
|
Investor Shares | (92,731) | (83,049) |
Admiral Shares | (61,257) | (49,152) |
Realized Capital Gain1 |
|
|
Investor Shares | (174,299) | (124,461) |
Admiral Shares | (105,036) | (65,693) |
Total Distributions | (433,323) | (322,355) |
Capital Share Transactions—Note H |
|
|
Investor Shares | 176,982 | (73,058) |
Admiral Shares | 330,863 | 263,647 |
Net Increase (Decrease) from Capital Share Transactions | 507,845 | 190,589 |
Total Increase (Decrease) | 883,232 | 466,935 |
Net Assets |
|
|
Beginning of Period | 4,818,419 | 4,351,484 |
End of Period2 | 5,701,651 | 4,818,419 |
1 Includes fiscal 2007 and 2006 short-term gain distributions totaling $30,140,000 and $20,387,000, respectively. Short-term gain distributions are treated as ordinary income dividends for tax purposes.
2 Net Assets—End of Period includes undistributed (overdistributed) net investment income of ($529,000) and ($1,037,000).
18
Financial Highlights
Investor Shares |
|
|
|
|
| |
|
|
|
|
|
| |
|
|
|
|
|
| |
|
|
|
| |||
For a Share Outstanding | Year Ended September 30, | |||||
Throughout Each Period | 2007 | 2006 | 2005 | 2004 | 2003 | |
Net Asset Value, Beginning of Period | $25.21 | $23.73 | $22.82 | $20.11 | $17.36 | |
Investment Operations |
|
|
|
|
| |
Net Investment Income | .733 | .703 | .653 | .576 | .50 | |
Net Realized and Unrealized Gain (Loss) |
|
|
|
|
| |
on Investments | 3.215 | 2.541 | 2.069 | 3.196 | 2.75 | |
Total from Investment Operations | 3.948 | 3.244 | 2.722 | 3.772 | 3.25 | |
Distributions |
|
|
|
|
| |
Dividends from Net Investment Income | (.730) | (.710) | (.640) | (.585) | (.50) | |
Distributions from Realized Capital Gains | (1.418) | (1.054) | (1.172) | (.477) | — | |
Total Distributions | (2.148) | (1.764) | (1.812) | (1.062) | (.50) | |
Net Asset Value, End of Period | $27.01 | $25.21 | $23.73 | $22.82 | $20.11 | |
|
|
|
|
|
| |
Total Return1 | 16.29% | 14.39% | 12.27% | 19.07% | 18.87% | |
|
|
|
|
|
| |
Ratios/Supplemental Data |
|
|
|
|
| |
Net Assets, End of Period (Millions) | $3,445 | $3,035 | $2,934 | $2,838 | $2,221 | |
Ratio of Total Expenses to |
|
|
|
|
| |
Average Net Assets2 | 0.29% | 0.31% | 0.32% | 0.32% | 0.45% | |
Ratio of Net Investment Income to |
|
|
|
|
| |
Average Net Assets | 2.79% | 2.94% | 2.80% | 2.61% | 2.61% | |
Portfolio Turnover Rate | 51% | 26% | 42% | 36% | 55% | |
1 Total returns do not reflect the account service fee that may be applicable to certain accounts with balances below $10,000.
2 Includes performance-based investment advisory fee increases (decreases) of 0.00%, (0.01%), (0.01%), 0.00%, and 0.03%.
19
Admiral Shares |
|
|
|
|
|
|
|
|
|
|
|
|
|
|
|
|
|
|
|
|
| ||
For a Share Outstanding | Year Ended September 30, | ||||
Throughout Each Period | 2007 | 2006 | 2005 | 2004 | 2003 |
Net Asset Value, Beginning of Period | $52.84 | $49.74 | $47.83 | $42.15 | $36.39 |
Investment Operations |
|
|
|
|
|
Net Investment Income | 1.601 | 1.545 | 1.434 | 1.255 | 1.078 |
Net Realized and Unrealized Gain (Loss) |
|
|
|
|
|
on Investments | 6.746 | 5.324 | 4.338 | 6.698 | 5.770 |
Total from Investment Operations | 8.347 | 6.869 | 5.772 | 7.953 | 6.848 |
Distributions |
|
|
|
|
|
Dividends from Net Investment Income | (1.595) | (1.560) | (1.406) | (1.273) | (1.088) |
Distributions from Realized Capital Gains | (2.972) | (2.209) | (2.456) | (1.000) | — |
Total Distributions | (4.567) | (3.769) | (3.862) | (2.273) | (1.088) |
Net Asset Value, End of Period | $56.62 | $52.84 | $49.74 | $47.83 | $42.15 |
|
|
|
|
|
|
Total Return | 16.44% | 14.55% | 12.42% | 19.19% | 18.98% |
|
|
|
|
|
|
Ratios/Supplemental Data |
|
|
|
|
|
Net Assets, End of Period (Millions) | $2,256 | $1,783 | $1,417 | $610 | $416 |
Ratio of Total Expenses to |
|
|
|
|
|
Average Net Assets1 | 0.17% | 0.17% | 0.19% | 0.22% | 0.35% |
Ratio of Net Investment Income to |
|
|
|
|
|
Average Net Assets | 2.91% | 3.08% | 2.96% | 2.71% | 2.71% |
Portfolio Turnover Rate | 51% | 26% | 42% | 36% | 55% |
1 Includes performance-based investment advisory fee increases (decreases) of 0.00%, (0.01%), (0.01%), 0.00%, and 0.03%. See accompanying Notes, which are an integral part of the Financial Statements.
20
Notes to Financial Statements
Vanguard Equity Income Fund is registered under the Investment Company Act of 1940 as an open-end investment company, or mutual fund. The fund files reports with the SEC under the company name Vanguard Fenway Funds. The fund offers two classes of shares, Investor Shares and Admiral Shares. Investor Shares are available to any investor who meets the fund’s minimum purchase requirements. Admiral Shares are designed for investors who meet certain administrative, service, tenure, and account-size criteria.
A. The following significant accounting policies conform to generally accepted accounting principles for U.S. mutual funds. The fund consistently follows such policies in preparing its financial statements.
1. Security Valuation: Securities are valued as of the close of trading on the New York Stock Exchange (generally 4 p.m., Eastern time) on the valuation date. Equity securities are valued at the latest quoted sales prices or official closing prices taken from the primary market in which each security trades; such securities not traded on the valuation date are valued at the mean of the latest quoted bid and asked prices. Securities for which market quotations are not readily available, or whose values have been materially affected by events occurring before the fund’s pricing time but after the close of the securities’ primary markets, are valued by methods deemed by the board of trustees to represent fair value. Investments in Vanguard Market Liquidity Fund are valued at that fund’s net asset value. Temporary cash investments acquired over 60 days to maturity are valued using the latest bid prices or using valuations based on a matrix system (which considers such factors as security prices, yields, maturities, and ratings), both as furnished by independent pricing services. Other temporary cash investments are valued at amortized cost, which approximates market value.
2. Futures Contracts: The fund uses index futures contracts to a limited extent, with the objective of maintaining full exposure to the stock market while maintaining liquidity. The fund may purchase or sell futures contracts to achieve a desired level of investment, whether to accommodate portfolio turnover or cash flows from capital share transactions. The primary risks associated with the use of futures contracts are imperfect correlation between changes in market values of stocks held by the fund and the prices of futures contracts, and the possibility of an illiquid market.
Futures contracts are valued at their quoted daily settlement prices. The aggregate principal amounts of the contracts are not recorded in the Statement of Net Assets. Fluctuations in the value of the contracts are recorded in the Statement of Net Assets as an asset (liability) and in the Statement of Operations as unrealized appreciation (depreciation) until the contracts are closed, when they are recorded as realized futures gains (losses).
3. Repurchase Agreements: The fund may invest in repurchase agreements. Securities pledged as collateral for repurchase agreements are held by a custodian bank until the agreements mature. Each agreement requires that the market value of the collateral be sufficient to cover payments of interest and principal; however, in the event of default or bankruptcy by the other party to the agreement, retention of the collateral may be subject to legal proceedings.
4. Federal Income Taxes: The fund intends to continue to qualify as a regulated investment company and distribute all of its taxable income. Accordingly, no provision for federal income taxes is required in the financial statements.
5. Distributions: Distributions to shareholders are recorded on the ex-dividend date.
6. Security Lending: The fund may lend its securities to qualified institutional borrowers to earn additional income. Security loans are required to be secured at all times by collateral at least equal to the market value of securities loaned. The fund invests cash collateral received in Vanguard Market
21
Liquidity Fund, and records a liability for the return of the collateral, during the period the securities are on loan. Security lending income represents the income earned on investing cash collateral, less expenses associated with the loan.
7. Other: Dividend income is recorded on the ex-dividend date. Interest income includes income distributions received from Vanguard Market Liquidity Fund and is accrued daily. Security transactions are accounted for on the date securities are bought or sold. Costs used to determine realized gains (losses) on the sale of investment securities are those of the specific securities sold.
Each class of shares has equal rights as to assets and earnings, except that each class separately bears certain class-specific expenses related to maintenance of shareholder accounts (included in Management and Administrative expenses) and shareholder reporting. Marketing and distribution expenses are allocated to each class of shares based on a method approved by the board of trustees. Income, other non-class-specific expenses, and gains and losses on investments are allocated to each class of shares based on its relative net assets.
B. Wellington Management Company, LLP, provides investment advisory services to a portion of the fund for a fee calculated at an annual percentage rate of average net assets managed by the advisor. The basic fee for Wellington Management Company, LLP, is subject to quarterly adjustments based on performance for the preceding three years relative to the Lipper Equity Income Average.
The Vanguard Group provides investment advisory services to a portion of the fund on an at-cost basis; the fund paid Vanguard advisory fees of $721,000 for the year ended September 30, 2007.
For the year ended September 30, 2007, the aggregate investment advisory fee represented an effective annual basic rate of 0.08% of the fund’s average net assets before a decrease of $70,000 based on performance.
C. The Vanguard Group furnishes at cost corporate management, administrative, marketing, and distribution services. The costs of such services are allocated to the fund under methods approved by the board of trustees. The fund has committed to provide up to 0.40% of its net assets in capital contributions to Vanguard. At September 30, 2007, the fund had contributed capital of $481,000 to Vanguard (included in Other Assets), representing 0.01% of the fund’s net assets and 0.48% of Vanguard’s capitalization. The fund’s trustees and officers are also directors and officers of Vanguard.
D. The fund has asked its investment advisors to direct certain security trades, subject to obtaining the best price and execution, to brokers who have agreed to rebate to the fund part of the commissions generated. Such rebates are used solely to reduce the fund’s management and administrative expenses. The fund’s custodian bank has also agreed to reduce its fees when the fund maintains cash on deposit in the non-interest-bearing custody account. For the year ended September 30, 2007, these arrangements reduced the fund’s management and administrative expenses by $64,000 and custodian fees by $13,000.
E. Distributions are determined on a tax basis and may differ from net investment income and realized capital gains for financial reporting purposes. Differences may be permanent or temporary. Permanent differences are reclassified among capital accounts in the financial statements to reflect their tax character. Temporary differences arise when certain items of income, expense, gain, or loss are
22
recognized in different periods for financial statement and tax purposes; these differences will reverse at some time in the future. Differences in classification may also result from the treatment of short-term gains as ordinary income for tax purposes.
The fund used a tax accounting practice to treat a portion of the price of capital shares redeemed during the year as distributions from realized capital gains. Accordingly, the fund has reclassified $34,882,000 from accumulated net realized gains to paid-in capital.
For tax purposes, at September 30, 2007, the fund had $30,051,000 of ordinary income and $248,615,000 of long-term capital gains available for distribution.
At September 30, 2007, the cost of investment securities for tax purposes was $4,523,826,000. Net unrealized appreciation of investment securities for tax purposes was $1,186,273,000, consisting of unrealized gains of $1,229,008,000 on securities that had risen in value since their purchase and $42,735,000 in unrealized losses on securities that had fallen in value since their purchase.
At September 30, 2007, the aggregate settlement value of open futures contracts expiring in December 2007 and the related unrealized appreciation (depreciation) were:
|
|
| ($000) |
|
| Aggregate | Unrealized |
| Number of | Settlement | Appreciation |
Futures Contracts | Long Contracts | Value | (Depreciation) |
S&P 500 Index | 282 | 108,436 | 2,976 |
E-mini S&P 500 Index | 41 | 3,153 | 3 |
Unrealized appreciation (depreciation) on open futures contracts is required to be treated as realized gain (loss) for tax purposes.
F. During the year ended September 30, 2007, the fund purchased $3,001,656,000 of investment securities and sold $2,666,528,000 of investment securities other than temporary cash investments.
G. The market value of securities on loan to broker-dealers at September 30, 2007, was $10,513,000, for which the fund received cash collateral of $10,867,000.
23
H. Capital share transactions for each class of shares were:
|
| Year Ended September 30, | ||
|
| 2007 |
| 2006 |
| Amount | Shares | Amount | Shares |
| ($000) | (000) | ($000) | (000) |
Investor Shares |
|
|
|
|
Issued | 709,555 | 27,339 | 555,813 | 23,157 |
Issued in Lieu of Cash Distributions | 244,816 | 9,571 | 188,442 | 8,066 |
Redeemed | (777,389) | (29,743) | (817,313) | (34,482) |
Net Increase (Decrease)—Investor Shares | 176,982 | 7,167 | (73,058) | (3,259) |
Admiral Shares |
|
|
|
|
Issued | 524,010 | 9,574 | 426,653 | 8,510 |
Issued in Lieu of Cash Distributions | 138,185 | 2,575 | 92,378 | 1,884 |
Redeemed | (331,332) | (6,045) | (255,384) | (5,137) |
Net Increase (Decrease)—Admiral Shares | 330,863 | 6,104 | 263,647 | 5,257 |
I. In June 2006, the Financial Accounting Standards Board issued Interpretation No. 48 (“FIN 48”), “Accounting for Uncertainty in Income Taxes.” FIN 48 establishes the minimum threshold for recognizing, and a system for measuring, the benefits of tax-return positions in financial statements, and is effective for the fund’s fiscal year beginning October 1, 2007. Management has analyzed the fund’s tax positions taken on federal income tax returns for all open tax years (tax years ended September 30, 2004–2007) for purposes of implementing FIN 48, and has concluded that as of September 30, 2007, no provision for income tax would be required in the fund’s financial statements.
24
Report of Independent Registered Public Accounting Firm
To the Trustees of Vanguard Fenway Funds and the Shareholders of Vanguard Equity Income Fund:
In our opinion, the accompanying statement of net assets and the related statements of operations and of changes in net assets and the financial highlights present fairly, in all material respects, the financial position of Vanguard Equity Income Fund (the “Fund”) at September 30, 2007, the results of its operations for the year then ended, the changes in its net assets for each of the two years in the period then ended, and the financial highlights for each of the five years in the period then ended, in conformity with accounting principles generally accepted in the United States of America. These financial statements and financial highlights (hereafter referred to as “financial statements”) are the responsibility of the Fund’s management; our responsibility is to express an opinion on these financial statements based on our audits. We conducted our audits of these financial statements in accordance with the standards of the Public Company Accounting Oversight Board (United States), which require that we plan and perform the audit to obtain reasonable assurance about whether the financial statements are free of material misstatement. An audit includes examining, on a test basis, evidence supporting the amounts and disclosures in the financial statements, assessing the accounting principles used and significant estimates made by management, and evaluating the overall financial statement presentation. We believe that our audits, which included confirmation of securities at September 30, 2007 by correspondence with the custodians and brokers, and by agreement to the underlying ownership records for Vanguard Market Liquidity Fund, provide a reasonable basis for our opinion.
PricewaterhouseCoopers LLP
Philadelphia, Pennsylvania
November 7, 2007
Special 2007 tax information (unaudited) for Vanguard Equity Income Fund
This information for the fiscal year ended September 30, 2007, is included pursuant to provisions of the Internal Revenue Code.
The fund distributed $280,871,000 as capital gain dividends (from net long-term capital gains) to shareholders during the fiscal year, all of which is designated as a 20% rate gain distribution.
The fund distributed $153,644,000 of qualified dividend income to shareholders during the fiscal year.
For corporate shareholders, 77.9% of investment income (dividend income plus short-term gains, if any) qualifies for the dividends-received deduction.
25
Your Fund’s After-Tax Returns
This table presents returns for your fund both before and after taxes. The after-tax returns are shown in two ways: (1) assuming that an investor owned the fund during the entire period and paid taxes on the fund’s distributions, and (2) assuming that an investor paid taxes on the fund’s distributions and sold all shares at the end of each period.
Calculations are based on the highest individual federal income tax and capital gains tax rates in effect at the times of the distributions and the hypothetical sales. State and local taxes were not considered. After-tax returns reflect any qualified dividend income, using actual prior-year figures and estimates for 2007. (In the example, returns after the sale of fund shares may be higher than those assuming no sale. This occurs when the sale would have produced a capital loss. The calculation assumes that the investor received a tax deduction for the loss.)
The table shows returns for Investor Shares only; returns for other share classes will differ. Please note that your actual after-tax returns will depend on your tax situation and may differ from those shown. Also note that if you own the fund in a tax-deferred account, such as an individual retirement account or a 401(k) plan, this information does not apply to you. Such accounts are not subject to current taxes.
Finally, keep in mind that a fund’s performance—whether before or after taxes—does not guarantee future results.
Average Annual Total Returns: Equity Income Investor Shares1 | |||
Periods Ended September 30, 2007 |
|
|
|
| One | Five | Ten |
| Year | Years | Years |
Returns Before Taxes | 16.29% | 16.15% | 8.48% |
Returns After Taxes on Distributions | 14.76 | 14.92 | 6.92 |
Returns After Taxes on Distributions and Sale of Fund Shares | 12.12 | 13.83 | 6.65 |
1 Total return figures do not include the account service fee that may be applicable to certain accounts with balances below $10,000.
26
About Your Fund’s Expenses
As a shareholder of the fund, you incur ongoing costs, which include costs for portfolio management, administrative services, and shareholder reports (like this one), among others. Operating expenses, which are deducted from a fund’s gross income, directly reduce the investment return of the fund.
A fund’s expenses are expressed as a percentage of its average net assets. This figure is known as the expense ratio. The following examples are intended to help you understand the ongoing costs (in dollars) of investing in your fund and to compare these costs with those of other mutual funds. The examples are based on an investment of $1,000 made at the beginning of the period shown and held for the entire period.
The table below illustrates your fund’s costs in two ways:
• Based on actual fund return. This section helps you to estimate the actual expenses that you paid over the period. The “Ending Account Value” shown is derived from the fund’s actual return, and the third column shows the dollar amount that would have been paid by an investor who started with $1,000 in the fund. You may use the information here, together with the amount you invested, to estimate the expenses that you paid over the period.
To do so, simply divide your account value by $1,000 (for example, an $8,600 account value divided by $1,000 = 8.6), then multiply the result by the number given for your fund under the heading “Expenses Paid During Period.”
• Based on hypothetical 5% yearly return. This section is intended to help you compare your fund’s costs with those of other mutual funds. It assumes that the fund had a yearly return of 5% before expenses, but that the expense ratio is unchanged. In this case—because the return used is not the fund’s actual return—the results do not apply to your investment. The example is useful in making comparisons because the Securities and Exchange Commission requires all mutual funds to calculate expenses based on a 5% return. You can assess your fund’s costs by comparing this hypothetical example with the hypothetical examples that appear in shareholder reports of other funds.
Six Months Ended September 30, 2007 |
|
|
|
| Beginning | Ending | Expenses |
| Account Value | Account Value | Paid During |
Equity Income Fund | 3/31/2007 | 9/30/2007 | Period1 |
Based on Actual Fund Return |
|
|
|
Investor Shares | $1,000.00 | $1,073.49 | $1.46 |
Admiral Shares | 1,000.00 | 1,074.14 | 0.88 |
Based on Hypothetical 5% Yearly Return |
|
|
|
Investor Shares | $1,000.00 | $1,023.66 | $1.42 |
Admiral Shares | 1,000.00 | 1,024.22 | 0.86 |
1 The calculations are based on expenses incurred in the most recent six-month period. The fund’s annualized six-month expense ratios for that period are 0.28% for Investor Shares and 0.17% for Admiral Shares. The dollar amounts shown as “Expenses Paid” are equal to the annualized expense ratio multiplied by the average account value over the period, multiplied by the number of days in the most recent six-month period, then divided by the number of days in the most recent 12-month period.
27
Note that the expenses shown in the table on page 27 are meant to highlight and help you compare ongoing costs only and do not reflect transaction costs incurred by the fund for buying and selling securities. Further, the expenses do not include the account service fee described in the prospectus. If such a fee were applied to your account, your costs would be higher. Your fund does not charge transaction fees, such as purchase or redemption fees, nor does it carry a “sales load.”
The calculations assume no shares were bought or sold during the period. Your actual costs may have been higher or lower, depending on the amount of your investment and the timing of any purchases or redemptions.
You can find more information about the fund’s expenses, including annual expense ratios, in the Financial Statements section of this report. For additional information on operating expenses and other shareholder costs, please refer to your fund’s current prospectus.
28
Glossary
Beta. A measure of the magnitude of a fund’s past share-price fluctuations in relation to the ups and downs of a given market index. The index is assigned a beta of 1.00. Compared with a given index, a fund with a beta of 1.20 typically would have seen its share price rise or fall by 12% when the index rose or fell by 10%. A fund’s beta should be reviewed in conjunction with its R-squared (see definition below). The lower the R-squared, the less correlation there is between the fund and the index, and the less reliable beta is as an indicator of volatility.
Earnings Growth Rate. The average annual rate of growth in earnings over the past five years for the stocks now in a fund.
Equity Exposure. A measure that reflects a fund’s investments in stocks and stock futures. Any holdings in short-term reserves are excluded.
Expense Ratio. The percentage of a fund’s average net assets used to pay its annual administrative and advisory expenses. These expenses directly reduce returns to investors.
Foreign Holdings. The percentage of a fund represented by stocks or depositary receipts of companies based outside the United States.
Inception Date. The date on which the assets of a fund (or one of its share classes) are first invested in accordance with the fund’s investment objective. For funds with a subscription period, the inception date is the day after that period ends. Investment performance is measured from the inception date.
Median Market Cap. An indicator of the size of companies in which a fund invests; the midpoint of market capitalization (market price x shares outstanding) of a fund’s stocks, weighted by the proportion of the fund’s assets invested in each stock. Stocks representing half of the fund’s assets have market capitalizations above the median, and the rest are below it.
Price/Book Ratio. The share price of a stock divided by its net worth, or book value, per share. For a fund, the weighted average price/book ratio of the stocks it holds.
Price/Earnings Ratio. The ratio of a stock’s current price to its per-share earnings over the past year. For a fund, the weighted average P/E of the stocks it holds. P/E is an indicator of market expectations about corporate prospects; the higher the P/E, the greater the expectations for a company’s future growth.
R-Squared. A measure of how much of a fund’s past returns can be explained by the returns from the market in general, as measured by a given index. If a fund’s total returns were precisely synchronized with an index’s returns, its R-squared would be 1.00. If the fund’s returns bore no relationship to the index’s returns, its R-squared would be 0.
Return on Equity. The annual average rate of return generated by a company during the past five years for each dollar of shareholder’s equity (net income divided by shareholder’s equity). For a fund, the weighted average return on equity for the companies whose stocks it holds.
Short-Term Reserves. The percentage of a fund invested in highly liquid, short-term securities that can be readily converted to cash.
Turnover Rate. An indication of the fund’s trading activity. Funds with high turnover rates incur higher transaction costs and may be more likely to distribute capital gains (which may be taxable to investors). The turnover rate excludes in-kind transactions, which have minimal impact on costs.
Yield. A snapshot of a fund’s income from interest and dividends. The yield, expressed as a percentage of the fund’s net asset value, is based on income earned over the past 30 days and is annualized, or projected forward for the coming year. The index yield is based on the current annualized rate of income provided by securities in the index.
29
This page intentionally left blank.
This page intentionally left blank.
The People Who Govern Your Fund
The trustees of your mutual fund are there to see that the fund is operated and managed in your best interests since, as a shareholder, you are a part owner of the fund. Your fund’s trustees also serve on the board of directors of The Vanguard Group, Inc., which is owned by the Vanguard funds and provides services to them on an at-cost basis.
A majority of Vanguard’s board members are independent, meaning that they have no affiliation with Vanguard or the funds they oversee, apart from the sizable personal investments they have made as private individuals.
Our independent board members bring distinguished backgrounds in business, academia, and public service to their task of working with Vanguard officers to establish the policies and oversee the activities of the funds. Among board members’ responsibilities are selecting investment advisors for the funds; monitoring fund operations, performance, and costs; reviewing contracts; nominating and selecting new trustees/directors; and electing Vanguard officers.
Each trustee serves a fund until its termination; or until the trustee’s retirement, resignation, or death; or otherwise as specified in the fund’s organizational documents. Any trustee may be removed at a shareholders’ meeting by a vote representing two-thirds of the net asset value of all shares of the fund together with shares of other Vanguard funds organized within the same trust. The table on these two pages shows information for each trustee and executive officer of the fund. The mailing address of the trustees and officers is P.O. Box 876, Valley Forge, PA 19482.
Chairman of the Board, Chief Executive Officer, and Trustee | |
|
|
John J. Brennan1 |
|
Born 1954 | Principal Occupation(s) During the Past Five Years: Chairman of the Board, Chief Executive |
Trustee since May 1987; | Officer, and Director/Trustee of The Vanguard Group, Inc., and of each of the investment |
Chairman of the Board and | companies served by The Vanguard Group. |
Chief Executive Officer |
|
148 Vanguard Funds Overseen |
|
|
|
Independent Trustees |
|
|
|
Charles D. Ellis |
|
Born 1937 | Principal Occupation(s) During the Past Five Years: Applecore Partners (pro bono ventures |
Trustee since January 2001 | in education); Senior Advisor to Greenwich Associates (international business strategy |
148 Vanguard Funds Overseen | consulting); Successor Trustee of Yale University; Overseer of the Stern School of Business |
| at New York University; Trustee of the Whitehead Institute for Biomedical Research. |
|
|
Rajiv L. Gupta |
|
Born 1945 | Principal Occupation(s) During the Past Five Years: Chairman, President, and |
Trustee since December 20012 | Chief Executive Officer of Rohm and Haas Co. (chemicals); Board Member of |
148 Vanguard Funds Overseen | the American Chemistry Council; Director of Tyco International, Ltd. (diversified |
| manufacturing and services) since 2005; Trustee of Drexel University and of the |
| Chemical Heritage Foundation. |
|
|
Amy Gutmann |
|
Born 1949 | Principal Occupation(s) During the Past Five Years: President of the University of |
Trustee since June 2006 | Pennsylvania since 2004; Professor in the School of Arts and Sciences, Annenberg School |
148 Vanguard Funds Overseen | for Communication, and Graduate School of Education of the University of Pennsylvania |
| since 2004; Provost (2001–2004) and Laurance S. Rockefeller Professor of Politics and |
| the University Center for Human Values (1990–2004), Princeton University; Director of |
| Carnegie Corporation of New York since 2005 and of Schuylkill River Development |
| Corporation and Greater Philadelphia Chamber of Commerce since 2004. |
JoAnn Heffernan Heisen |
|
Born 1950 | Principal Occupation(s) During the Past Five Years: Corporate Vice President and |
Trustee since July 1998 | Chief Global Diversity Officer since 2006, Vice President and Chief Information |
148 Vanguard Funds Overseen | Officer (1997–2005), and Member of the Executive Committee of Johnson & |
| Johnson (pharmaceuticals/consumer products); Director of the University Medical |
| Center at Princeton and Women’s Research and Education Institute. |
|
|
André F. Perold |
|
Born 1952 | Principal Occupation(s) During the Past Five Years: George Gund Professor of Finance |
Trustee since December 2004 | and Banking, Harvard Business School; Senior Associate Dean, Director of Faculty |
148 Vanguard Funds Overseen | Recruiting, and Chair of Finance Faculty, Harvard Business School; Director and Chairman |
| of UNX, Inc. (equities trading firm) since 2003; Chair of the Investment Committee of |
| HighVista Strategies LLC (private investment firm) since 2005. |
|
|
Alfred M. Rankin, Jr. |
|
Born 1941 | Principal Occupation(s) During the Past Five Years: Chairman, President, Chief Executive |
Trustee since January 1993 | Officer, and Director of NACCO Industries, Inc. (forklift trucks/housewares/lignite); Director |
148 Vanguard Funds Overseen | of Goodrich Corporation (industrial products/aircraft systems and services). |
|
|
|
|
J. Lawrence Wilson |
|
Born 1936 | Principal Occupation(s) During the Past Five Years: Retired Chairman and Chief Executive |
Trustee since April 1985 | Officer of Rohm and Haas Co. (chemicals); Director of Cummins Inc. (diesel engines) and |
148 Vanguard Funds Overseen | AmerisourceBergen Corp. (pharmaceutical distribution); Trustee of Vanderbilt University |
| and of Culver Educational Foundation. |
|
|
Executive Officers1 |
|
|
|
Thomas J. Higgins |
|
Born 1957 | Principal Occupation(s) During the Past Five Years: Principal of The Vanguard Group, Inc.; |
Treasurer since July 1998 | Treasurer of each of the investment companies served by The Vanguard Group. |
148 Vanguard Funds Overseen |
|
|
|
|
|
Heidi Stam |
|
Born 1956 | Principal Occupation(s) During the Past Five Years: Managing Director of The Vanguard |
Secretary since July 2005 | Group, Inc., since 2006; General Counsel of The Vanguard Group since 2005; Secretary of |
148 Vanguard Funds Overseen | The Vanguard Group, and of each of the investment companies served by The Vanguard |
| Group, since 2005; Principal of The Vanguard Group (1997–2006). |
Vanguard Senior Management Team |
|
| |
|
|
|
|
R. Gregory Barton | Kathleen C. Gubanich | F. William McNabb, III | Ralph K. Packard |
Mortimer J. Buckley | Paul A. Heller | Michael S. Miller | George U. Sauter |
Founder |
|
John C. Bogle |
Chairman and Chief Executive Officer, 1974–1996 |
1 Officers of the funds are “interested persons” as defined in the Investment Company Act of 1940.
2 December 2002 for Vanguard Equity Income Fund, Vanguard Growth Equity Fund, the Vanguard Municipal Bond Funds, and the Vanguard State Tax-Exempt Funds.
More information about the trustees is in the Statement of Additional Information, available from The Vanguard Group.
|
|
| P.O. Box 2600 |
| Valley Forge, PA 19482-2600 |

Connect with Vanguard® > www.vanguard.com
Fund Information > 800-662-7447 | Vanguard, Admiral, Connect with Vanguard, and the ship |
| logo are trademarks of The Vanguard Group, Inc. |
Direct Investor Account Services > 800-662-2739 |
|
|
|
Institutional Investor Services > 800-523-1036 | All other marks are the exclusive property of their |
| respective owners. |
Text Telephone for People |
|
With Hearing Impairment > 800-952-3335 |
|
| All comparative mutual fund data are from Lipper Inc. |
| or Morningstar, Inc., unless otherwise noted. |
|
|
|
|
| You can obtain a free copy of Vanguard’s proxy voting |
This material may be used in conjunction | guidelines by visiting our website, www.vanguard.com, |
with the offering of shares of any Vanguard | and searching for “proxy voting guidelines,” or by calling |
fund only if preceded or accompanied by | Vanguard at 800-662-2739. The guidelines are also |
the fund’s current prospectus. | available from the SEC’s website, www.sec.gov. In |
| addition, you may obtain a free report on how your fund |
| voted the proxies for securities it owned during the 12 |
| months ended June 30. To get the report, visit either |
| www.vanguard.com or www.sec.gov. |
|
|
|
|
| You can review and copy information about your fund |
| at the SEC’s Public Reference Room in Washington, D.C. |
| To find out more about this public service, call the SEC |
| at 202-551-8090. Information about your fund is also |
| available on the SEC’s website, and you can receive |
| copies of this information, for a fee, by sending a |
| request in either of two ways: via e-mail addressed to |
| publicinfo@sec.gov or via regular mail addressed to the |
| Public Reference Section, Securities and Exchange |
| Commission, Washington, DC 20549-0102. |
|
|
|
|
|
|
|
|
|
|
| © 2007 The Vanguard Group, Inc. |
| All rights reserved. |
| Vanguard Marketing Corporation, Distributor. |
|
|
| Q650 112007 |
|
|


> | Vanguard Growth Equity Fund returned 25.3% for the fiscal year ended September 30, 2007. |
> | The fund’s gain easily outpaced both the return of its growth stock benchmark and the average return from similar mutual funds. |
> | Every sector represented in the fund contributed to its advance, with the biggest boost coming from information technology holdings. |
Contents |
|
|
|
Your Fund’s Total Returns | 1 |
Chairman’s Letter | 2 |
Advisor’s Report | 7 |
Fund Profile | 9 |
Performance Summary | 10 |
Financial Statements | 11 |
Your Fund’s After-Tax Returns | 19 |
About Your Fund’s Expenses | 20 |
Trustees Approve Advisory Agreement | 22 |
Glossary | 23 |
Please note: The opinions expressed in this report are just that—informed opinions. They should not be considered promises or advice. Also, please keep in mind that the information and opinions cover the period through the date on the cover of this report. Of course, the risks of investing in your fund are spelled out in the prospectus.
Your Fund’s Total Returns
Fiscal Year Ended September 30, 2007 |
|
|
| Ticker | Total |
| Symbol | Returns |
Vanguard Growth Equity Fund | VGEQX | 25.3% |
Russell 1000 Growth Index |
| 19.4 |
Average Large-Cap Growth Fund1 |
| 20.4 |
Your Fund’s Performance at a Glance |
|
|
|
|
September 30, 2006–September 30, 2007 |
|
|
|
|
|
|
| Distributions Per Share | |
| Starting | Ending | Income | Capital |
| Share Price | Share Price | Dividends | Gains |
Vanguard Growth Equity Fund | $10.52 | $13.18 | $0.000 | $0.000 |
1 Derived from data provided by Lipper Inc.
1

Chairman’s Letter
Dear Shareholder,
Vanguard Growth Equity Fund posted a fiscal-year return that was significantly higher than the prior year’s result and, in fact, was its best in four years. For the 12 months ended September 30, 2007, the fund returned 25.3%, compared with 4.7% in the previous fiscal year.
Every industry sector in which the fund invested advanced during the period, with information technology stocks playing a particularly prominent role in your fund’s performance. The fund’s return also outdistanced that of its benchmark, the Russell 1000 Growth Index, and the average return posted by its growth fund competitors.
Strong returns for U.S. stocks; even better for markets abroad
U.S. stocks produced excellent returns for the fiscal year. The gains came despite a midsummer shakeup brought on by problems in the subprime mortgage-loan market. Financials stocks—which represent a sizable share of the U.S. market’s value—were hardest hit, as investment banking and consumer lending businesses throttled back.
The broad U.S. equity market returned 17.1% for the year. Returns from large-capitalization stocks outpaced those of small-caps, and growth-oriented stocks outperformed their value-oriented counterparts. As investors took account of risk, they seemed to exhibit a preference for large-cap growth stocks, which seem better positioned to thrive in a period of economic uncertainty.
2
Although not immune from the effects of the turmoil in U.S. credit markets, international stocks handily surpassed the returns of domestic stocks over the 12 months. The dollar’s ongoing weakness further enhanced foreign market gains for U.S.-based investors.
The bond market was shaken, but regained ground in the end
Turmoil in the corporate bond and subprime lending markets caused a “flight to quality” that drove prices of U.S. Treasury bonds sharply higher, particularly toward the end of the fiscal period. As the bonds’ prices rose, their yields fell. The declines were greatest among Treasury securities with the shortest maturities. The yield of the 3-month Treasury bill, which started the fiscal year at 4.89%, dropped more than a full percentage point to 3.81%.
As short-term yields fell, the yield curve—which illustrates the relationship between short- and long-term bond yields—returned to its usual, upward-sloping pattern. The curve had been mildly inverted at the start of the period, with yields of shorter-term bonds above those of longer-term issues. For the year ended September 30, the broad taxable bond market returned 5.1%. Returns from tax-exempt bonds were lower, as these issues did not benefit from the late-summer rally in Treasuries.
Market Barometer |
|
|
|
| Average Annual Total Returns | ||
| Periods Ended September 30, 2007 | ||
| One Year | Three Years | Five Years |
Stocks |
|
|
|
Russell 1000 Index (Large-caps) | 16.9% | 13.8% | 16.0% |
Russell 2000 Index (Small-caps) | 12.3 | 13.4 | 18.8 |
Dow Jones Wilshire 5000 Index (Entire market) | 17.1 | 14.0 | 16.5 |
MSCI All Country World Index ex USA (International) | 31.1 | 26.5 | 26.3 |
|
|
|
|
Bonds |
|
|
|
Lehman U.S. Aggregate Bond Index (Broad taxable market) | 5.1% | 3.9% | 4.1% |
Lehman Municipal Bond Index | 3.1 | 3.9 | 4.0 |
Citigroup 3-Month Treasury Bill Index | 5.0 | 4.0 | 2.8 |
|
|
|
|
CPI |
|
|
|
Consumer Price Index | 2.8% | 3.2% | 2.9% |
3
Strong showing by tech stocks helped boost the fund’s return
A strong stock market undergirded the fund’s performance during the fiscal year, despite the turmoil in the credit markets sparked by subprime mortgage defaults toward the end of the period. Within this generally favorable environment, market trends helped large-cap growth stocks, and your fund’s advisor added value by selecting companies that outperformed the benchmark in nearly every sector to record an impressive gain.
Because Growth Equity invests across economic sectors in roughly the same proportions as those represented in the Russell 1000 Growth Index, information technology stocks continued to represent by far the largest industry weighting.
Reflecting the strength of these stocks during the past year, the fund’s tech holdings contributed more than 7 percentage points to its return. Stand-outs included top-ten holdings Apple, Cisco Systems, and Google. In fact, these three stocks alone accounted for 5 percentage points (about one-fifth) of the fund’s total return for the period. The fund’s advisor significantly overweighted Cisco and Google in a notably successful example of its strategy of seeking the most promising companies within each sector.
The advisor was even more successful relative to the index in selecting stocks within the consumer discretionary sector, where its casino and gaming holdings did particularly well. Reflecting the global nature of today’s economy, the advisor’s
Total Returns |
|
Ten Years Ended September 30, 2007 |
|
| Average |
| Annual Return |
Growth Equity Fund1 | 5.1% |
Russell 1000 Growth Index | 4.1 |
Average Large-Cap Growth Fund2 | 4.5 |
The figures shown represent past performance, which is not a guarantee of future results. (Current performance may be lower or higher than the performance data cited. For performance data current to the most recent month-end, visit our website at www.vanguard.com/performance.) Note, too, that both investment returns and principal value can fluctuate widely, so an investor’s shares, when sold, could be worth more or less than their original cost.
1 Prior to June 12, 2000, the fund was organized as the Turner Growth Equity Fund.
2 Derived from data provided by Lipper Inc.
4
gaming stocks—which are headquartered in the United States—benefited from the growth of overseas operations. The fund’s holdings in the health care and financial sectors also performed better than those sectors did in the index.
Notable laggards within the portfolio included holdings in consumer staples and telecommunication services. The fund’s holdings in these sectors finished in positive territory, but they trailed the performance of their respective industries as measured by the index. Also, the fund’s sole airline investment—US Airways—was a particular drag on an otherwise stellar performance.
The fund has a solid relative long-term record
The past ten years have included the culmination of a historic bull market, a tenacious bear market, and then a steady year-by-year recovery that largely favored value stocks over growth stocks. Vanguard Growth Equity Fund’s performance during this period was solid considering the headwind it faced much of the time as investors leaned toward smaller companies with classic value characteristics. The fund’s average annual ten-year return now stands at 5.1%—a modest performance that trails the broad market, but one that beats the average annual returns of the Russell 1000 Growth Index and the fund’s large-cap growth peers. The table on page 10 shows
Expense Ratios1 |
|
|
Your fund compared with its peer group |
|
|
|
| Average |
|
| Large-Cap |
| Fund | Growth Fund |
Growth Equity Fund | 0.68% | 1.43% |
1 Fund expense ratio reflects the 12 months ended September 30, 2007. Peer-group expense ratio is derived from data provided by Lipper Inc. and captures information through year-end 2006.
5
how these performance differences would have affected a hypothetical $10,000 investment made in the fund and these two yardsticks.
Long-time investors in the Growth Equity Fund know that its aggressive pursuit of above-average results comes with the risk of underperformance in any given year. While the advisor’s disciplined pursuit of outsized gains from larger, fast-growing companies was well rewarded in the past 12 months, we know that it is unrealistic to expect superior returns every year. However, we believe the skill and experience of Turner Investment Partners, your fund’s advisor, will continue to serve shareholders well over the long term, as witnessed by the fund’s outperformance of its benchmark and peer-group average over the past five- and ten-year periods.
Besides advisory expertise, your fund also benefits from operating expenses that are far below average—an advantage that gives your investment a head start every year in our efforts to outdistance our competitors. (The costs of your fund and its competitors are described on page 5.)
Keeping an even keel through the ups and downs
The fund’s impressive performance of the last fiscal year might tempt inexperienced investors to change prudent long-term plans by hastily shifting into this or any other investment that has done well recently. But academic research and experience continue to point toward a “steady as she goes” course as the wisest one. Whether the fund is experiencing a harsh fiscal year or an outstanding one, we temper our reaction by reminding ourselves that the stock market will never go in one direction without eventually changing direction—and usually then without advance notice.
The Growth Equity Fund provides concentrated exposure to large-cap growth stocks, which makes it suitable as just one element of a well-diversified portfolio of stock, bond, and money market investments. It bears repeating that building ballast into your investment program—by seeking balance among the major asset classes and diversification within them—can be the best way to navigate the sometimes-rough seas of the financial markets and help you reach your long-term goals.
Thank you for entrusting your assets to Vanguard.
Sincerely,

John J. Brennan
Chairman and Chief Executive Officer
October 16, 2007
6
Advisor’s Report
During the 12-month period ended September 30, 2007, investors were concerned about the weakening housing market, subprime mortgage problems that roiled financial services companies worldwide, higher oil prices, the weakening dollar, and slower economic growth. However, in late summer, investors seemed hopeful that the worst credit-related problems in the housing and subprime mortgage markets were over and that the Federal Reserve Board would be proactive in keeping the economy from sagging into a recession. The Fed took action in September by cutting short-term interest rates by one-half percentage point, to 4.75%—the first rate reduction in four years and the steepest in nearly five years. That helped stocks to rebound more than 8% from their mid-August lows, allowing the Standard & Poor’s 500 Index to end the 12-month period with a 16.4% gain.
During the period, growth stocks, which generally produce better returns in a slowing economy than do value stocks, were finally able to take the performance lead: the Russell 1000 Growth Index outperformed the Russell 1000 Value Index by almost five percentage points. With the market inclined to reward companies with superior growth prospects, the Vanguard Growth Equity Fund in turn outperformed its performance benchmark—the Russell 1000 Growth Index—by almost six percentage points.
Our successes and shortfalls
Among market sectors, the results of the consumer discretionary sector were noteworthy, accounting for almost half of the fund’s outperformance of its benchmark. Key contributors to performance were gaming stocks Las Vegas Sands and Wynn Resorts. Both companies’ investments in Macau, the only place in China where gambling is legal, have boosted their earnings significantly. Additionally, Google, a long-term holding, posted strong results, as it continues to benefit from increased spending on Internet advertising.
The fund’s health care holdings generated a gain of about 20%, versus 11% for the index sector. Leading the way were medical device manufacturer Intuitive Surgical and pharmaceutical company Shire. Demand is strong for Intuitive Surgical’s da Vinci robotic system, used increasingly in prostatectomy and hysterectomy procedures because it is less invasive for the patient. Shire continues to profit from strong sales of its drugs for attention deficit disorder and hyperactivity.
Transportation holdings were major detractors from the fund’s results, with US Airways performing especially poorly. Factors that hindered US Airways (as well as other airlines) included rising fuel prices, aggressive domestic competition, and the industry’s failure to consolidate (a consolidation was much anticipated by Wall Street). We sold US Airways and redeployed the proceeds to other transportation stocks that we believe have more attractive prospects.
7
Our outlook
Looking ahead, we think that the Federal Reserve is likely to cut rates further to prevent a recession. That said, the economy is showing signs of a slowdown, as reflected in the reduced estimates for gross domestic product and corporate earnings. In such an environment, we expect investors to continue to favor growth companies. Also, the broad market appears to be trading at a reasonable valuation, with the S&P 500 Index selling at approximately 15 times next year’s earnings on average. And despite their recent outperformance, growth stocks remain inexpensive in comparison with value stocks.
In managing the Vanguard Growth Equity Fund, our focus, as always, is on owning companies that we believe have superior earnings prospects. Accordingly, the expected aggregate earnings-growth rate of the fund’s holdings over the next 12 months continues to exceed that of the broad market and the Russell 1000 Growth Index. Also, the fund’s price/earnings-to-growth ratio remains at a discount to the benchmark. As is our practice, we have kept the fund’s sector weightings similar to those of the index, leaving security selection as the primary driver of performance.
Bob Turner
Chairman and Chief Investment Officer
Turner Investment Partners
October 16, 2007
8
Fund Profile
As of September 30, 2007
Portfolio Characteristics | |||
|
| Comparative | Broad |
| Fund | Index1 | Index2 |
Number of Stocks | 69 | 698 | 4,887 |
Median Market Cap | $28.6B | $38.2B | $36.1B |
Price/Earnings Ratio | 32.5x | 21.6x | 18.1x |
Price/Book Ratio | 5.3x | 4.4x | 2.8x |
Yield | 0.0% | 1.1% | 1.7% |
Return on Equity | 18.3% | 21.2% | 18.8% |
Earnings Growth Rate | 23.7% | 22.8% | 21.6% |
Foreign Holdings | 7.6% | 0.0% | 0.0% |
Turnover Rate | 131% | — | — |
Expense Ratio | 0.68% | — | — |
Short-Term Reserves | 3.1% | — | — |
Sector Diversification (% of equity exposure) | |||
|
| Comparative | Broad |
| Fund | Index1 | Index2 |
Consumer Discretionary | 12.0% | 12.7% | 10.4% |
Consumer Staples | 8.4 | 9.8 | 8.2 |
Energy | 6.6 | 8.4 | 11.2 |
Financials | 7.8 | 7.1 | 20.0 |
Health Care | 15.7 | 15.7 | 11.6 |
Industrials | 12.8 | 13.1 | 11.8 |
Information Technology | 31.5 | 27.5 | 16.0 |
Materials | 2.8 | 3.2 | 3.7 |
Telecommunication Services | 2.4 | 0.9 | 3.5 |
Utilities | 0.0 | 1.6 | 3.6 |
Volatility Measures3 | ||
| Fund Versus | Fund Versus |
| Comparative Index1 | Broad Index2 |
R-Squared | 0.85 | 0.79 |
Beta | 1.16 | 1.17 |
Ten Largest Holdings4 (% of total net assets) | ||
|
|
|
Cisco Systems, Inc. | communications equipment | 4.7% |
Intel Corp. | semiconductors | 4.0 |
Google Inc. | internet software and services | 3.3 |
The Coca-Cola Co. | soft drinks | 2.5 |
Apple Inc. | computer hardware | 2.5 |
General Electric Co. | industrial conglomerates | 2.4 |
Schlumberger Ltd. | oil and gas equipment and services | 2.2 |
PepsiCo, Inc. | soft drinks | 2.1 |
Broadcom Corp. | semiconductors | 2.1 |
CVS/Caremark Corp. | drug retail | 2.0 |
Top Ten |
| 27.8% |
Investment Focus
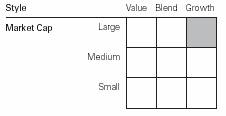
1 Russell 1000 Growth Index.
2 Dow Jones Wilshire 5000 Index.
3 For an explanation of R-squared, beta, and other terms used here, see the Glossary on page 23.
4 “Ten Largest Holdings” excludes any temporary cash investments and equity index products.
9
Performance Summary
All of the returns in this report represent past performance, which is not a guarantee of future results that may be achieved by the fund. (Current performance may be lower or higher than the performance data cited. For performance data current to the most recent month-end, visit our website at www.vanguard.com/performance.) Note, too, that both investment returns and principal value can fluctuate widely, so an investor’s shares, when sold, could be worth more or less than their original cost. The returns shown do not reflect taxes that a shareholder would pay on fund distributions or on the sale of fund shares.
Cumulative Performance: September 30, 1997–September 30, 2007
Initial Investment of $10,000
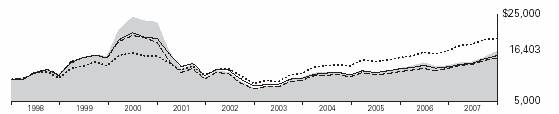
| Average Annual Total Returns | Final Value | ||
| Periods Ended September 30, 2007 | of a $10,000 | ||
| One Year | Five Years | Ten Years | Investment |
Growth Equity Fund1 | 25.29% | 15.94% | 5.07% | $16,403 |
Dow Jones Wilshire 5000 Index | 17.08 | 16.53 | 6.85 | 19,399 |
Russell 1000 Growth Index | 19.35 | 13.84 | 4.06 | 14,894 |
Average Large-Cap Growth Fund2 | 20.44 | 12.74 | 4.47 | 15,484 |
Fiscal-Year Total Returns (%): September 30, 1997–September 30, 2007
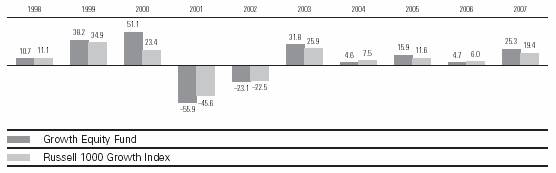
1 Total returns do not include the account service fee that may be applicable to certain accounts with balances below $10,000.
2 Derived from data provided by Lipper Inc.
Note: See Financial Highlights table on page 15 for dividend and capital gains information.
10
Financial Statements
Statement of Net Assets
As of September 30, 2007
The fund provides a complete list of its holdings four times in each fiscal year, at the quarter-ends. For the second and fourth fiscal quarters, the lists appear in the fund’s semiannual and annual reports to shareholders. For the first and third fiscal quarters, the fund files the lists with the Securities and Exchange Commission on Form N-Q. Shareholders can look up the fund’s Forms N-Q on the SEC’s website at www.sec.gov. Forms N-Q may also be reviewed and copied at the SEC’s Public Reference Room (see the back cover of this report for further information).
|
|
| Market |
|
|
| Value• |
|
| Shares | ($000) |
Common Stocks (97.7%) |
|
| |
Consumer Discretionary (11.7%) |
|
| |
* | Amazon.com, Inc. | 170,090 | 15,844 |
* | Coach, Inc. | 309,731 | 14,641 |
| Wynn Resorts Ltd. | 84,870 | 13,372 |
* | Las Vegas Sands Corp. | 95,020 | 12,678 |
| Target Corp. | 195,340 | 12,418 |
| Guess ?, Inc. | 223,610 | 10,964 |
* | Expedia, Inc. | 324,440 | 10,343 |
* | GameStop Corp. Class A | 158,440 | 8,928 |
| Johnson Controls, Inc. | 70,240 | 8,296 |
* | Under Armour, Inc. | 114,950 | 6,876 |
|
|
| 114,360 |
Consumer Staples (8.3%) |
|
| |
| The Coca-Cola Co. | 428,450 | 24,623 |
| PepsiCo, Inc. | 285,610 | 20,924 |
| CVS/Caremark Corp. | 502,150 | 19,900 |
* | Hansen Natural Corp. | 134,090 | 7,600 |
| Bunge Ltd. | 67,280 | 7,229 |
|
|
| 80,276 |
Energy (6.5%) |
|
| |
| Schlumberger Ltd. | 203,670 | 21,385 |
| XTO Energy, Inc. | 266,860 | 16,503 |
| Williams Cos., Inc. | 433,710 | 14,772 |
* | Cameron International Corp. | 114,370 | 10,555 |
|
|
| 63,215 |
Financials (7.6%) |
|
| |
| CME Group, Inc. | 33,050 | 19,412 |
| The Goldman Sachs Group, Inc. | 84,450 | 18,304 |
| T. Rowe Price Group Inc. | 180,140 | 10,032 |
* | IntercontinentalExchange Inc. | 60,020 | 9,117 |
| Franklin Resources Corp. | 71,100 | 9,065 |
| Nymex Holdings Inc. | 63,020 | 8,204 |
|
|
| 74,134 |
Health Care (15.3%) |
|
| |
| Baxter International, Inc. | 349,790 | 19,686 |
* | Gilead Sciences, Inc. | 472,850 | 19,325 |
| Allergan, Inc. | 256,830 | 16,558 |
* | St. Jude Medical, Inc. | 353,240 | 15,567 |
|
|
| Market |
|
|
| Value• |
|
| Shares | ($000) |
| Shire Pharmaceuticals |
|
|
| Group PLC ADR | 203,680 | 15,068 |
* | Thermo Fisher Scientific, Inc. | 248,610 | 14,350 |
* | Celgene Corp. | 182,360 | 13,004 |
* | Intuitive Surgical, Inc. | 47,850 | 11,006 |
| Schering-Plough Corp. | 331,570 | 10,488 |
* | Express Scripts Inc. | 174,176 | 9,723 |
* | Charles River Laboratories, Inc. | 82,670 | 4,642 |
|
|
| 149,417 |
Industrials (12.5%) |
|
| |
| General Electric Co. | 565,010 | 23,391 |
| Deere & Co. | 126,690 | 18,803 |
| C.H. Robinson Worldwide Inc. | 285,630 | 15,507 |
| ABB Ltd. ADR | 477,330 | 12,520 |
| Roper Industries Inc. | 167,510 | 10,972 |
* | McDermott International, Inc. | 196,260 | 10,614 |
| Oshkosh Truck Corp. | 143,710 | 8,906 |
| Precision Castparts Corp. | 52,870 | 7,824 |
* | Suntech Power Holdings Co., Ltd. ADR | 160,400 | 6,400 |
* | First Solar, Inc. | 46,300 | 5,451 |
* | Stericycle, Inc. | 30,754 | 1,758 |
|
|
| 122,146 |
Information Technology (30.7%) |
|
| |
| Communications Equipment (9.0%) |
|
|
* | Cisco Systems, Inc. | 1,377,130 | 45,597 |
| Nokia Corp. ADR | 358,240 | 13,588 |
* | Research In Motion Ltd. | 117,250 | 11,555 |
* | Juniper Networks, Inc. | 296,310 | 10,848 |
* | F5 Networks, Inc. | 161,840 | 6,019 |
|
|
|
|
| Computers & Peripherals (3.6%) |
|
|
* | Apple Inc. | 158,310 | 24,307 |
* | SanDisk Corp. | 186,240 | 10,262 |
|
|
|
|
| Internet Software & Services (4.3%) |
|
|
* | Google Inc. | 56,910 | 32,283 |
* | VeriSign, Inc. | 295,384 | 9,966 |
11
|
|
| Market |
|
|
| Value• |
|
| Shares | ($000) |
| IT Services (1.1%) |
|
|
| MasterCard, Inc. Class A | 72,740 | 10,763 |
|
|
|
|
| Semiconductors & Semiconductor Equipment (9.9%) |
|
|
| Intel Corp. | 1,492,470 | 38,595 |
* | Broadcom Corp. | 569,100 | 20,738 |
| KLA-Tencor Corp. | 267,770 | 14,936 |
| Applied Materials, Inc. | 653,300 | 13,523 |
* | NVIDIA Corp. | 242,215 | 8,778 |
|
|
|
|
| Software (2.8%) |
|
|
* | salesforce.com, Inc. | 183,570 | 9,421 |
* | Activision, Inc. | 416,700 | 8,997 |
*^ | VMware Inc. | 104,630 | 8,894 |
|
|
| 299,070 |
Materials (2.7%) |
|
| |
| Monsanto Co. | 226,940 | 19,458 |
| Nucor Corp. | 120,470 | 7,164 |
|
|
| 26,622 |
Telecommunication Services (2.4%) |
|
| |
* | NII Holdings Inc. | 182,220 | 14,969 |
| Rogers Communications, Inc. B-shares | 175,940 | 8,010 |
|
|
| 22,979 |
Total Common Stocks |
|
| |
(Cost $756,879) |
| 952,219 | |
Temporary Cash Investments (3.2%) |
|
| |
1 | Vanguard Market Liquidity Fund, 5.153% | 30,703,120 | 30,703 |
1 | Vanguard Market Liquidity Fund, 5.153%—Note G | 790,500 | 791 |
Total Temporary Cash Investments |
|
| |
(Cost $31,494) |
| 31,494 | |
Total Investments (100.9%) |
|
| |
(Cost $788,373) |
| 983,713 | |
|
| Market |
|
| Value• |
|
| ($000) |
Other Assets and Liabilities (–0.9%) |
|
|
Other Assets—Note C |
| 16,818 |
Liabilities—Note G |
| (25,753) |
|
| (8,935) |
Net Assets (100%) |
|
|
Applicable to 73,941,791 outstanding $.001 |
|
|
par value shares of beneficial interest |
|
|
(unlimited authorization) |
| 974,778 |
Net Asset Value Per Share |
| $13.18 |
At September 30, 2007, net assets consisted of:2 | ||
| Amount | Per |
| ($000) | Share |
Paid-in Capital | 1,261,188 | $17.05 |
Overdistributed Net |
|
|
Investment Income | (156) | — |
Accumulated Net |
|
|
Realized Losses | (481,594) | (6.51) |
Unrealized Appreciation | 195,340 | 2.64 |
Net Assets | 974,778 | $13.18 |
• | See Note A in Notes to Financial Statements. |
* | Non-income-producing security. |
^ | Part of security position is on loan to broker-dealers. See Note G in Notes to Financial Statements. |
1 Affiliated money market fund available only to Vanguard funds and certain trusts and accounts managed by Vanguard. Rate shown is the 7-day yield.
2 See Note E in Notes to Financial Statements for the tax-basis components of net assets.
ADR—American Depositary Receipt.
12
Statement of Operations
| Year Ended |
| September 30, 2007 |
| ($000) |
Investment Income |
|
Income |
|
Dividends | 5,656 |
Interest1 | 549 |
Security Lending | 69 |
Total Income | 6,274 |
Expenses |
|
Investment Advisory Fees—Note B |
|
Basic Fee | 2,872 |
Performance Adjustment | 308 |
The Vanguard Group—Note C |
|
Management and Administrative | 1,935 |
Marketing and Distribution | 188 |
Custodian Fees | 35 |
Auditing Fees | 20 |
Shareholders’ Reports | 30 |
Trustees’ Fees and Expenses | 1 |
Total Expenses | 5,389 |
Expenses Paid Indirectly—Note D | (186) |
Net Expenses | 5,203 |
Net Investment Income | 1,071 |
Realized Net Gain (Loss) on Investment Securities Sold | 62,822 |
Change in Unrealized Appreciation (Depreciation) of Investment Securities | 120,725 |
Net Increase (Decrease) in Net Assets Resulting from Operations | 184,618 |
1 Interest income from an affiliated company of the fund was $549,000.
13
Statement of Changes in Net Assets
| Year Ended September 30, | |
| 2007 | 2006 |
| ($000) | ($000) |
Increase (Decrease) in Net Assets |
|
|
Operations |
|
|
Net Investment Income (Loss) | 1,071 | (280) |
Realized Net Gain (Loss) | 62,822 | 51,651 |
Change in Unrealized Appreciation (Depreciation) | 120,725 | (19,950) |
Net Increase (Decrease) in Net Assets Resulting from Operations | 184,618 | 31,421 |
Distributions |
|
|
Net Investment Income | — | (71) |
Realized Capital Gain | — | — |
Total Distributions | — | (71) |
Capital Share Transactions—Note H |
|
|
Issued | 248,529 | 194,867 |
Issued in Lieu of Cash Distributions | — | 68 |
Redeemed | (217,555) | (180,174) |
Net Increase (Decrease) from Capital Share Transactions | 30,974 | 14,761 |
Total Increase (Decrease) | 215,592 | 46,111 |
Net Assets |
|
|
Beginning of Period | 759,186 | 713,075 |
End of Period1 | 974,778 | 759,186 |
1 Net Assets—End of Period includes undistributed (overdistributed) net investment income of ($156,000) and ($1,227,000).
14
Financial Highlights
| Year Ended September 30, | ||||
For a Share Outstanding Throughout Each Period | 2007 | 2006 | 2005 | 2004 | 2003 |
Net Asset Value, Beginning of Period | $10.52 | $10.05 | $8.68 | $8.32 | $6.33 |
Investment Operations |
|
|
|
|
|
Net Investment Income (Loss) | .02 | (.009) | .001 | .01 | .018 |
Net Realized and Unrealized Gain (Loss) |
|
|
|
|
|
on Investments | 2.64 | .480 | 1.380 | .37 | 1.990 |
Total from Investment Operations | 2.66 | .471 | 1.381 | .38 | 2.008 |
Distributions |
|
|
|
|
|
Dividends from Net Investment Income | — | (.001) | (.011) | (.02) | (.018) |
Distributions from Realized Capital Gains | — | — | — | — | — |
Total Distributions | — | (.001) | (.011) | (.02) | (.018) |
Net Asset Value, End of Period | $13.18 | $10.52 | $10.05 | $8.68 | $8.32 |
|
|
|
|
|
|
Total Return1 | 25.29% | 4.69% | 15.92% | 4.56% | 31.79% |
|
|
|
|
|
|
Ratios/Supplemental Data |
|
|
|
|
|
Net Assets, End of Period (Millions) | $975 | $759 | $713 | $765 | $724 |
Ratio of Total Expenses to |
|
|
|
|
|
Average Net Assets2 | 0.68% | 0.91% | 0.88% | 0.72% | 0.54% |
Ratio of Net Investment Income (Loss) |
|
|
|
|
|
to Average Net Assets | 0.14% | (0.04%) | 0.01% | 0.14% | 0.25% |
Portfolio Turnover Rate | 131% | 147% | 147% | 162% | 220% |
1 Total returns do not include the account service fee that may be applicable to certain accounts with balances below $10,000.
2 Includes performance-based investment advisory fee increases (decreases) of 0.04%, 0.19%, 0.11%, (0.04%), and (0.29%).
See accompanying Notes, which are an integral part of the Financial Statements.
15
Notes to Financial Statements
Vanguard Growth Equity Fund is registered under the Investment Company Act of 1940 as an open-end investment company, or mutual fund. The fund files reports with the SEC under the company name Vanguard Fenway Funds.
A. The following significant accounting policies conform to generally accepted accounting principles for U.S. mutual funds. The fund consistently follows such policies in preparing its financial statements.
1. Security Valuation: Securities are valued as of the close of trading on the New York Stock Exchange (generally 4 p.m., Eastern time) on the valuation date. Equity securities are valued at the latest quoted sales prices or official closing prices taken from the primary market in which each security trades; such securities not traded on the valuation date are valued at the mean of the latest quoted bid and asked prices. Securities for which market quotations are not readily available, or whose values have been materially affected by events occurring before the fund’s pricing time but after the close of the securities’ primary markets, are valued by methods deemed by the board of trustees to represent fair value. Investments in Vanguard Market Liquidity Fund are valued at that fund’s net asset value.
2. Federal Income Taxes: The fund intends to continue to qualify as a regulated investment company and distribute all of its taxable income. Accordingly, no provision for federal income taxes is required in the financial statements.
3. Distributions: Distributions to shareholders are recorded on the ex-dividend date.
4. Security Lending: The fund may lend its securities to qualified institutional borrowers to earn additional income. Security loans are required to be secured at all times by collateral at least equal to the market value of securities loaned. The fund invests cash collateral received in Vanguard Market Liquidity Fund, and records a liability for the return of the collateral, during the period the securities are on loan. Security lending income represents the income earned on investing cash collateral, less expenses associated with the loan.
5. Other: Dividend income is recorded on the ex-dividend date. Interest income includes income distributions received from Vanguard Market Liquidity Fund and is accrued daily. Security transactions are accounted for on the date securities are bought or sold. Costs used to determine realized gains (losses) on the sale of investment securities are those of the specific securities sold.
B. Turner Investment Partners provides investment advisory services to the fund for a fee calculated at an annual percentage rate of average net assets. The basic fee is subject to quarterly adjustments based on the fund’s performance for the preceding three years relative to the Russell 1000 Growth Index. For the year ended September 30, 2007, the investment advisory fee represented an effective annual basic rate of 0.36% of the fund’s average net assets before an increase of $308,000 (0.04%) based on performance.
C. The Vanguard Group furnishes at cost corporate management, administrative, marketing, and distribution services. The costs of such services are allocated to the fund under methods approved by the board of trustees. The fund has committed to provide up to 0.40% of its net assets in capital contributions to Vanguard. At September 30, 2007, the fund had contributed capital of $73,000 to Vanguard (included in Other Assets), representing 0.01% of the fund’s net assets and 0.07% of Vanguard’s capitalization. The fund’s trustees and officers are also directors and officers of Vanguard.
16
D. The fund has asked its investment advisor to direct certain security trades, subject to obtaining the best price and execution, to brokers who have agreed to rebate to the fund part of the commissions generated. Such rebates are used solely to reduce the fund’s management and administrative expenses. For the year ended September 30, 2007, these arrangements reduced the fund’s expenses by $186,000 (an annual rate of 0.02% of average net assets).
E. Distributions are determined on a tax basis and may differ from net investment income and realized capital gains for financial reporting purposes. Differences may be permanent or temporary. Permanent differences are reclassified among capital accounts in the financial statements to reflect their tax character. Temporary differences arise when certain items of income, expense, gain, or loss are recognized in different periods for financial statement and tax purposes; these differences will reverse at some time in the future. Differences in classification may also result from the treatment of short-term gains as ordinary income for tax purposes.
For tax purposes, at September 30, 2007, the fund had $1,258,000 of ordinary income available for distribution. The fund had available realized losses of $481,442,000 to offset future net capital gains of $344,960,000 through September 30, 2010, and $136,482,000 through September 30, 2011.
At September 30, 2007, the cost of investment securities for tax purposes was $788,373,000. Net unrealized appreciation of investment securities for tax purposes was $195,340,000, consisting of unrealized gains of $196,254,000 on securities that had risen in value since their purchase and $914,000 in unrealized losses on securities that had fallen in value since their purchase.
F. During the year ended September 30, 2007, the fund purchased $1,033,906,000 of investment securities and sold $1,023,103,000 of investment securities other than temporary cash investments.
G. The market value of securities on loan to broker-dealers at September 30, 2007, was $791,000, for which the fund received cash collateral of $791,000.
H. Capital shares issued and redeemed were:
| Year Ended September 30, | |
| 2007 | 2006 |
| Shares | Shares |
| (000) | (000) |
Issued | 20,867 | 18,437 |
Issued in Lieu of Cash Distributions | — | 6 |
Redeemed | (19,088) | (17,218) |
Net Increase (Decrease) in Shares Outstanding | 1,779 | 1,225 |
I. In June 2006, the Financial Accounting Standards Board issued Interpretation No. 48 (“FIN 48”), “Accounting for Uncertainty in Income Taxes.” FIN 48 establishes the minimum threshold for recognizing, and a system for measuring, the benefits of tax-return positions in financial statements, and is effective for the fund’s fiscal year beginning October 1, 2007. Management has analyzed the fund’s tax positions taken on federal income tax returns for all open tax years (tax years ended September 30, 2004–2007) for purposes of implementing FIN 48, and has concluded that as of September 30, 2007, no provision for income tax would be required in the fund’s financial statements.
17
Report of Independent Registered Public Accounting Firm
To the Trustees of Vanguard Fenway Funds and the Shareholders of Vanguard Growth Equity Fund:
In our opinion, the accompanying statement of net assets and the related statements of operations and of changes in net assets and the financial highlights present fairly, in all material respects, the financial position of Vanguard Growth Equity Fund (the “Fund”) at September 30, 2007, the results of its operations for the year then ended, the changes in its net assets for each of the two years in the period then ended, and the financial highlights for each of the five years in the period then ended, in conformity with accounting principles generally accepted in the United States of America. These financial statements and financial highlights (hereafter referred to as “financial statements”) are the responsibility of the Fund’s management; our responsibility is to express an opinion on these financial statements based on our audits. We conducted our audits of these financial statements in accordance with the standards of the Public Company Accounting Oversight Board (United States), which require that we plan and perform the audit to obtain reasonable assurance about whether the financial statements are free of material misstatement. An audit includes examining, on a test basis, evidence supporting the amounts and disclosures in the financial statements, assessing the accounting principles used and significant estimates made by management, and evaluating the overall financial statement presentation. We believe that our audits, which included confirmation of securities at September 30, 2007 by correspondence with the custodian and by agreement to the underlying ownership records for Vanguard Market Liquidity Fund, provide a reasonable basis for our opinion.
PricewaterhouseCoopers LLP
Philadelphia, Pennsylvania
November 7, 2007
18
Your Fund’s After-Tax Returns
This table presents returns for your fund both before and after taxes. The after-tax returns are shown in two ways: (1) assuming that an investor owned the fund during the entire period and paid taxes on the fund’s distributions, and (2) assuming that an investor paid taxes on the fund’s distributions and sold all shares at the end of each period.
Calculations are based on the highest individual federal income tax and capital gains tax rates in effect at the times of the distributions and the hypothetical sales. State and local taxes were not considered. After-tax returns reflect any qualified dividend income, using actual prior-year figures and estimates for 2007. (In the example, returns after the sale of fund shares may be higher than those assuming no sale. This occurs when the sale would have produced a capital loss. The calculation assumes that the investor received a tax deduction for the loss.)
Please note that your actual after-tax returns will depend on your tax situation and may differ from those shown. Also note that if you own the fund in a tax-deferred account, such as an individual retirement account or a 401(k) plan, this information does not apply to you. Such accounts are not subject to current taxes.
Finally, keep in mind that a fund’s performance—whether before or after taxes—does not guarantee future results.
Average Annual Total Returns: Growth Equity Fund1 |
|
|
|
Periods Ended September 30, 2007 |
|
|
|
| One | Five | Ten |
| Year | Years | Years |
Returns Before Taxes | 25.29% | 15.94% | 5.07% |
Returns After Taxes on Distributions | 25.29 | 15.90 | 3.34 |
Returns After Taxes on Distributions and Sale of Fund Shares | 16.44 | 14.04 | 3.57 |
1 Total returns do not include the account service fee that may be applicable to certain accounts with balances below $10,000.
19
About Your Fund’s Expenses
As a shareholder of the fund, you incur ongoing costs, which include costs for portfolio management, administrative services, and shareholder reports (like this one), among others. Operating expenses, which are deducted from a fund’s gross income, directly reduce the investment return of the fund.
A fund’s expenses are expressed as a percentage of its average net assets. This figure is known as the expense ratio. The following examples are intended to help you understand the ongoing costs (in dollars) of investing in your fund and to compare these costs with those of other mutual funds. The examples are based on an investment of $1,000 made at the beginning of the period shown and held for the entire period.
The table below illustrates your fund’s costs in two ways:
• Based on actual fund return. This section helps you to estimate the actual expenses that you paid over the period. The “Ending Account Value” shown is derived from the fund’s actual return, and the third column shows the dollar amount that would have been paid by an investor who started with $1,000 in the fund. You may use the information here, together with the amount you invested, to estimate the expenses that you paid over the period.
To do so, simply divide your account value by $1,000 (for example, an $8,600 account value divided by $1,000 = 8.6), then multiply the result by the number given for your fund under the heading “Expenses Paid During Period.”
• Based on hypothetical 5% yearly return. This section is intended to help you compare your fund’s costs with those of other mutual funds. It assumes that the fund had a yearly return of 5% before expenses, but that the expense ratio is unchanged. In this case—because the return used is not the fund’s actual return—the results do not apply to your investment. The example is useful in making comparisons because the Securities and Exchange Commission requires all mutual funds to calculate expenses based on a 5% return. You can assess your fund’s costs by comparing this hypothetical example with the hypothetical examples that appear in shareholder reports of other funds.
Six Months Ended September 30, 2007 |
|
|
|
| Beginning | Ending | Expenses |
| Account Value | Account Value | Paid During |
Growth Equity Fund | 3/31/2007 | 9/30/2007 | Period1 |
Based on Actual Fund Return | $1,000.00 | $1,176.79 | $3.98 |
Based on Hypothetical 5% Yearly Return | 1,000.00 | 1,021.41 | 3.70 |
Note that the expenses shown in the table are meant to highlight and help you compare ongoing costs only and do not reflect transaction costs incurred by the fund for buying and selling securities. Further, the expenses do not include the account service fee described in the prospectus. If such a fee were applied to your account, your costs would be higher. Your fund does not charge transaction fees, such as purchase or redemption fees, nor does it carry a “sales load.”
1 The calculations are based on expenses incurred in the most recent six-month period. The fund’s annualized six-month expense ratio for that period is 0.73%. The dollar amounts shown as “Expenses Paid” are equal to the annualized expense ratio multiplied by the average account value over the period, multiplied by the number of days in the most recent six-month period, then divided by the number of days in the most recent 12-month period.
20
The calculations assume no shares were bought or sold during the period. Your actual costs may have been higher or lower, depending on the amount of your investment and the timing of any purchases or redemptions.
You can find more information about the fund’s expenses, including annual expense ratios, in the Financial Statements section of this report. For additional information on operating expenses and other shareholder costs, please refer to your fund’s current prospectus.
21
Trustees Approve Advisory Agreement
The board of trustees of Vanguard Growth Equity Fund has renewed the fund’s investment advisory agreement with Turner Investment Partners. The board determined that the retention of Turner was in the best interests of the fund and its shareholders.
The board based its decision upon an evaluation of Turner’s investment staff, portfolio management process, and performance. The trustees considered the factors discussed below, among others. However, no single factor determined whether the board approved the agreement. Rather, it was the totality of the circumstances that drove the board’s decision.
Nature, extent, and quality of services
The board considered the quality of the fund’s investment management over both the short and long term and took into account the organizational depth and stability of the firm. The board noted that Turner Investment Partners has 16 years of experience in managing growth equity portfolios. Bob Turner, co-founder of Turner Investment Partners, has been the portfolio manager since the fund’s inception in 1992. The Fund was adopted by Vanguard in 2000.
The board concluded that the advisor’s experience, stability, depth, and performance, among other factors, warranted continuation of the advisory agreement.
Investment performance
The board considered the short- and long-term performance of the fund, including any periods of outperformance or underperformance of a relevant benchmark and peer group. The board concluded that the advisor has carried out the fund’s investment strategy in disciplined fashion, and the results have been in line with expectations. Since the fund’s adoption in 2000 performance has been competitive versus its benchmark and peer group. Information about the fund’s most recent performance can be found in the Performance Summary section of this report.
Cost
The board concluded that the fund’s expense ratio was far below the average expense ratio charged by funds in its peer group. The board noted that the fund’s advisory fee was also well below the peer-group average. Information about the fund’s expense ratio appears in the About Your Fund’s Expenses section of this report as well as in the Financial Statements section, which also includes information about the advisory fee rate. The board did not consider profitability of Turner Investment Partners in determining whether to approve the advisory fee, because Turner is independent of Vanguard and the advisory fee is the result of arm’s-length negotiations.
The benefit of economies of scale
The board concluded that the fund’s shareholders benefit from economies of scale because of breakpoints in the fund’s advisory fee schedule. The breakpoints reduce the effective rate of the fee as the fund’s assets increase.
The board will consider whether to renew the advisory agreement again after a one-year period.
22
Glossary
Beta. A measure of the magnitude of a fund’s past share-price fluctuations in relation to the ups and downs of a given market index. The index is assigned a beta of 1.00. Compared with a given index, a fund with a beta of 1.20 typically would have seen its share price rise or fall by 12% when the index rose or fell by 10%. A fund’s beta should be reviewed in conjunction with its R-squared (see definition below). The lower the R-squared, the less correlation there is between the fund and the index, and the less reliable beta is as an indicator of volatility.
Earnings Growth Rate. The average annual rate of growth in earnings over the past five years for the stocks now in a fund.
Equity Exposure. A measure that reflects a fund’s investments in stocks and stock futures. Any holdings in short-term reserves are excluded.
Expense Ratio. The percentage of a fund’s average net assets used to pay its annual administrative and advisory expenses. These expenses directly reduce returns to investors.
Foreign Holdings. The percentage of a fund represented by stocks or depositary receipts of companies based outside the United States.
Inception Date. The date on which the assets of a fund (or one of its share classes) are first invested in accordance with the fund’s investment objective. For funds with a subscription period, the inception date is the day after that period ends. Investment performance is measured from the inception date.
Median Market Cap. An indicator of the size of companies in which a fund invests; the midpoint of market capitalization (market price x shares outstanding) of a fund’s stocks, weighted by the proportion of the fund’s assets invested in each stock. Stocks representing half of the fund’s assets have market capitalizations above the median, and the rest are below it.
Price/Book Ratio. The share price of a stock divided by its net worth, or book value, per share. For a fund, the weighted average price/book ratio of the stocks it holds.
Price/Earnings Ratio. The ratio of a stock’s current price to its per-share earnings over the past year. For a fund, the weighted average P/E of the stocks it holds. P/E is an indicator of market expectations about corporate prospects; the higher the P/E, the greater the expectations for a company’s future growth.
R-Squared. A measure of how much of a fund’s past returns can be explained by the returns from the market in general, as measured by a given index. If a fund’s total returns were precisely synchronized with an index’s returns, its R-squared would be 1.00. If the fund’s returns bore no relationship to the index’s returns, its R-squared would be 0.
Return on Equity. The annual average rate of return generated by a company during the past five years for each dollar of shareholder’s equity (net income divided by shareholder’s equity). For a fund, the weighted average return on equity for the companies whose stocks it holds.
Short-Term Reserves. The percentage of a fund invested in highly liquid, short-term securities that can be readily converted to cash.
Turnover Rate. An indication of the fund’s trading activity. Funds with high turnover rates incur higher transaction costs and may be more likely to distribute capital gains (which may be taxable to investors). The turnover rate excludes in-kind transactions, which have minimal impact on costs.
Yield. A snapshot of a fund’s income from interest and dividends. The yield, expressed as a percentage of the fund’s net asset value, is based on income earned over the past 30 days and is annualized, or projected forward for the coming year. The index yield is based on the current annualized rate of income provided by securities in the index.
23
The People Who Govern Your Fund
The trustees of your mutual fund are there to see that the fund is operated and managed in your best interests since, as a shareholder, you are a part owner of the fund. Your fund’s trustees also serve on the board of directors of The Vanguard Group, Inc., which is owned by the Vanguard funds and provides services to them on an at-cost basis.
A majority of Vanguard’s board members are independent, meaning that they have no affiliation with Vanguard or the funds they oversee, apart from the sizable personal investments they have made as private individuals.
Our independent board members bring distinguished backgrounds in business, academia, and public service to their task of working with Vanguard officers to establish the policies and oversee the activities of the funds. Among board members’ responsibilities are selecting investment advisors for the funds; monitoring fund operations, performance, and costs; reviewing contracts; nominating and selecting new trustees/directors; and electing Vanguard officers.
Each trustee serves a fund until its termination; or until the trustee’s retirement, resignation, or death; or otherwise as specified in the fund’s organizational documents. Any trustee may be removed at a shareholders’ meeting by a vote representing two-thirds of the net asset value of all shares of the fund together with shares of other Vanguard funds organized within the same trust. The table on these two pages shows information for each trustee and executive officer of the fund. The mailing address of the trustees and officers is P.O. Box 876, Valley Forge, PA 19482.
Chairman of the Board, Chief Executive Officer, and Trustee | |
|
|
John J. Brennan1 |
|
Born 1954 | Principal Occupation(s) During the Past Five Years: Chairman of the Board, Chief Executive |
Trustee since May 1987; | Officer, and Director/Trustee of The Vanguard Group, Inc., and of each of the investment |
Chairman of the Board and | companies served by The Vanguard Group. |
Chief Executive Officer |
|
148 Vanguard Funds Overseen |
|
|
|
Independent Trustees |
|
|
|
Charles D. Ellis |
|
Born 1937 | Principal Occupation(s) During the Past Five Years: Applecore Partners (pro bono ventures |
Trustee since January 2001 | in education); Senior Advisor to Greenwich Associates (international business strategy |
148 Vanguard Funds Overseen | consulting); Successor Trustee of Yale University; Overseer of the Stern School of Business |
| at New York University; Trustee of the Whitehead Institute for Biomedical Research. |
|
|
Rajiv L. Gupta |
|
Born 1945 | Principal Occupation(s) During the Past Five Years: Chairman, President, and |
Trustee since December 20012 | Chief Executive Officer of Rohm and Haas Co. (chemicals); Board Member of |
148 Vanguard Funds Overseen | the American Chemistry Council; Director of Tyco International, Ltd. (diversified |
| manufacturing and services) since 2005; Trustee of Drexel University and of the |
| Chemical Heritage Foundation. |
|
|
Amy Gutmann |
|
Born 1949 | Principal Occupation(s) During the Past Five Years: President of the University of |
Trustee since June 2006 | Pennsylvania since 2004; Professor in the School of Arts and Sciences, Annenberg School |
148 Vanguard Funds Overseen | for Communication, and Graduate School of Education of the University of Pennsylvania |
| since 2004; Provost (2001–2004) and Laurance S. Rockefeller Professor of Politics and |
| the University Center for Human Values (1990–2004), Princeton University; Director of |
| Carnegie Corporation of New York since 2005 and of Schuylkill River Development |
| Corporation and Greater Philadelphia Chamber of Commerce since 2004. |
JoAnn Heffernan Heisen |
|
Born 1950 | Principal Occupation(s) During the Past Five Years: Corporate Vice President and |
Trustee since July 1998 | Chief Global Diversity Officer since 2006, Vice President and Chief Information |
148 Vanguard Funds Overseen | Officer (1997–2005), and Member of the Executive Committee of Johnson & |
| Johnson (pharmaceuticals/consumer products); Director of the University Medical |
| Center at Princeton and Women’s Research and Education Institute. |
|
|
André F. Perold |
|
Born 1952 | Principal Occupation(s) During the Past Five Years: George Gund Professor of Finance |
Trustee since December 2004 | and Banking, Harvard Business School; Senior Associate Dean, Director of Faculty |
148 Vanguard Funds Overseen | Recruiting, and Chair of Finance Faculty, Harvard Business School; Director and Chairman |
| of UNX, Inc. (equities trading firm) since 2003; Chair of the Investment Committee of |
| HighVista Strategies LLC (private investment firm) since 2005. |
|
|
Alfred M. Rankin, Jr. |
|
Born 1941 | Principal Occupation(s) During the Past Five Years: Chairman, President, Chief Executive |
Trustee since January 1993 | Officer, and Director of NACCO Industries, Inc. (forklift trucks/housewares/lignite); Director |
148 Vanguard Funds Overseen | of Goodrich Corporation (industrial products/aircraft systems and services). |
|
|
|
|
J. Lawrence Wilson |
|
Born 1936 | Principal Occupation(s) During the Past Five Years: Retired Chairman and Chief Executive |
Trustee since April 1985 | Officer of Rohm and Haas Co. (chemicals); Director of Cummins Inc. (diesel engines) and |
148 Vanguard Funds Overseen | AmerisourceBergen Corp. (pharmaceutical distribution); Trustee of Vanderbilt University |
| and of Culver Educational Foundation. |
|
|
Executive Officers1 |
|
|
|
Thomas J. Higgins |
|
Born 1957 | Principal Occupation(s) During the Past Five Years: Principal of The Vanguard Group, Inc.; |
Treasurer since July 1998 | Treasurer of each of the investment companies served by The Vanguard Group. |
148 Vanguard Funds Overseen |
|
|
|
|
|
Heidi Stam |
|
Born 1956 | Principal Occupation(s) During the Past Five Years: Managing Director of The Vanguard |
Secretary since July 2005 | Group, Inc., since 2006; General Counsel of The Vanguard Group since 2005; Secretary of |
148 Vanguard Funds Overseen | The Vanguard Group, and of each of the investment companies served by The Vanguard |
| Group, since 2005; Principal of The Vanguard Group (1997–2006). |
Vanguard Senior Management Team |
|
| |
|
|
|
|
R. Gregory Barton | Kathleen C. Gubanich | F. William McNabb, III | Ralph K. Packard |
Mortimer J. Buckley | Paul A. Heller | Michael S. Miller | George U. Sauter |
Founder |
|
John C. Bogle |
Chairman and Chief Executive Officer, 1974–1996 |
1 Officers of the funds are “interested persons” as defined in the Investment Company Act of 1940.
2 December 2002 for Vanguard Equity Income Fund, Vanguard Growth Equity Fund, the Vanguard Municipal Bond Funds, and the Vanguard State Tax-Exempt Funds.
More information about the trustees is in the Statement of Additional Information, available from The Vanguard Group.
|
|
| P.O. Box 2600 |
| Valley Forge, PA 19482-2600 |

Connect with Vanguard® > www.vanguard.com
Fund Information > 800-662-7447 | Vanguard, Connect with Vanguard, and the ship logo are |
| trademarks of The Vanguard Group, Inc. |
Direct Investor Account Services > 800-662-2739 |
|
|
|
Institutional Investor Services > 800-523-1036 | All other marks are the exclusive property of their |
| respective owners. |
Text Telephone for People |
|
With Hearing Impairment > 800-952-3335 |
|
| All comparative mutual fund data are from Lipper Inc. |
| or Morningstar, Inc., unless otherwise noted. |
|
|
|
|
| You can obtain a free copy of Vanguard’s proxy voting |
This material may be used in conjunction | guidelines by visiting our website, www.vanguard.com, |
with the offering of shares of any Vanguard | and searching for “proxy voting guidelines,” or by |
fund only if preceded or accompanied by | calling Vanguard at 800-662-2739. The guidelines are |
the fund’s current prospectus. | also available from the SEC’s website, www.sec.gov. |
| In addition, you may obtain a free report on how your |
| fund voted the proxies for securities it owned during |
| the 12 months ended June 30. To get the report, visit |
| either www.vanguard.com or www.sec.gov. |
|
|
|
|
| You can review and copy information about your fund |
| at the SEC’s Public Reference Room in Washington, D.C. |
| To find out more about this public service, call the SEC |
| at 202-551-8090. Information about your fund is also |
| available on the SEC’s website, and you can receive |
| copies of this information, for a fee, by sending a |
| request in either of two ways: via e-mail addressed to |
| publicinfo@sec.gov or via regular mail addressed to the |
| Public Reference Section, Securities and Exchange |
| Commission, Washington, DC 20549-0102. |
|
|
|
|
|
|
|
|
|
|
| © 2007 The Vanguard Group, Inc. |
| All rights reserved. |
| Vanguard Marketing Corporation, Distributor. |
|
|
| Q5440 112007 |
|
|

> | Vanguard PRIMECAP Core Fund returned 16.1%, an impressive performance, but a bit less than its comparative standards. |
> | The fund’s health care stocks were a weak spot; materials stocks were a strength. |
> | Despite brief periods of turmoil, the financial markets performed strongly during the full 12 months. |
Contents |
|
|
|
Your Fund’s Total Returns | 1 |
Chairman’s Letter | 2 |
Advisor’s Report | 7 |
Fund Profile | 10 |
Performance Summary | 11 |
Financial Statements | 12 |
Your Fund’s After-Tax Returns | 22 |
About Your Fund’s Expenses | 23 |
Glossary | 25 |
Please note: The opinions expressed in this report are just that—informed opinions. They should not be considered promises or advice. Also, please keep in mind that the information and opinions cover the period through the date on the cover of this report. Of course, the risks of investing in your fund are spelled out in the prospectus.
Your Fund’s Total Returns
Fiscal Year Ended September 30, 2007 |
|
|
| Ticker | Total |
| Symbol | Returns |
Vanguard PRIMECAP Core Fund | VPCCX | 16.1% |
MSCI US Prime Market 750 Index |
| 17.2 |
Average Multi-Cap Core Fund1 |
| 17.0 |
Your Fund’s Performance at a Glance |
|
|
|
|
September 30, 2006–September 30, 2007 |
|
|
|
|
|
|
| Distributions Per Share | |
| Starting | Ending | Income | Capital |
| Share Price | Share Price | Dividends | Gains |
Vanguard PRIMECAP Core Fund | $12.28 | $14.03 | $0.095 | $0.111 |
1 Derived from data provided by Lipper Inc.
1

Chairman’s Letter
Dear Shareholder,
Vanguard PRIMECAP Core Fund returned an impressive 16.1% during the 12 months ended September 30. This result was nevertheless a bit below the returns of its market benchmark and peer-group average. The fund’s large positions in a number of underperforming health care stocks acted as a brake on performance. The outstanding returns of a few materials and energy stocks made up for most of the weak spots.
If you own Vanguard PRIMECAP Core Fund in a taxable account, you may wish to review our report on the fund’s after-tax returns on page 22.
Strong returns for U.S. stocks; even better for markets abroad
U.S. stocks produced excellent returns for the fiscal year. The gains came despite a midsummer shakeup brought on by problems in the subprime mortgage-loan market. Financials stocks—which represent a sizable share of the U.S. market’s value—were hardest hit, as investment banking and consumer lending businesses throttled back.
The broad U.S. equity market returned 17.1% for the year. Returns from large-capitalization stocks outpaced those of small-caps, and growth-oriented stocks outperformed their value-oriented counterparts. As investors took account of risk, they seemed to exhibit a preference for
2
large-cap growth stocks, which seem better positioned to thrive in a period of economic uncertainty.
Although not immune from the effects of the turmoil in U.S. credit markets, international stocks handily surpassed the returns of domestic stocks over the 12 months. The dollar’s ongoing weakness further enhanced foreign market gains for U.S.-based investors.
The bond market was shaken, but regained ground in the end
Turmoil in the corporate bond and subprime lending markets caused a “flight to quality” that drove prices of U.S. Treasury bonds sharply higher, particularly toward the end of the fiscal period. As the bonds’ prices rose, their yields fell. The declines were greatest among Treasury securities with the shortest maturities. The yield of the 3-month Treasury bill, which started the fiscal year at 4.89%, dropped more than a full percentage point to 3.81%.
As short-term yields fell, the yield curve—which illustrates the relationship between short- and long-term bond yields—returned to its usual, upward-sloping pattern. The curve had been mildly inverted at the start of the period, with yields of shorter-term bonds above those of longer-term issues. For the year ended September 30, the broad taxable bond market returned 5.1%. Returns from tax-exempt bonds were lower, as these issues did not benefit from the late-summer rally in Treasuries.
Market Barometer |
|
|
|
|
| Average Annual Total Returns | |
| Periods Ended September 30, 2007 | ||
| One Year | Three Years | Five Years |
Stocks |
|
|
|
Russell 1000 Index (Large-caps) | 16.9% | 13.8% | 16.0% |
Russell 2000 Index (Small-caps) | 12.3 | 13.4 | 18.8 |
Dow Jones Wilshire 5000 Index (Entire market) | 17.1 | 14.0 | 16.5 |
MSCI All Country World Index ex USA (International) | 31.1 | 26.5 | 26.3 |
|
|
|
|
Bonds |
|
|
|
Lehman U.S. Aggregate Bond Index (Broad taxable market) | 5.1% | 3.9% | 4.1% |
Lehman Municipal Bond Index | 3.1 | 3.9 | 4.0 |
Citigroup 3-Month Treasury Bill Index | 5.0 | 4.0 | 2.8 |
|
|
|
|
CPI |
|
|
|
Consumer Price Index | 2.8% | 3.2% | 2.9% |
3
Some positions fell flat, but your fund held up well
In the nearly three years since its inception, Vanguard PRIMECAP Core Fund has built a distinctive portfolio, with significant commitments to technology, health care, and consumer discretionary stocks. The fund’s advisor, PRIMECAP Management Company, has identified a number of software, health care, and tech-oriented retailing and electronics companies, that, in the managers’ estimation, boast underappreciated long-term growth prospects.
As a group, these sizable positions performed respectably during the past year, but not as well as their broad market sectors. On balance, in fact, they kept the fund a few steps behind its benchmark. The fund’s health care stocks were notably weak. Large holdings in biotech companies such as Amgen and pharmaceuticals giants such as Pfizer weighed on portfolio performance as the companies struggled with regulatory issues.
Even as its most important positions produced mixed results, however, the fund earned outstanding returns from smaller pockets of the portfolio, such as materials stocks. Potash Corp. of Saskatchewan, the world’s largest producer of the eponymous compound, was a notable contributor. Potash is used as fertilizer. As the price of grain has surged, Potash’s stock price has rallied, returning more than 200% during the past
Expense Ratios1 |
|
|
Your fund compared with its peer group |
|
|
|
| Average |
|
| Multi-Cap |
| Fund | Core Fund |
PRIMECAP Core Fund | 0.55% | 1.30% |
1 Fund expense ratio reflects the 12 months ended September 30, 2007. Peer-group expense ratio is derived from data provided by Lipper Inc. and captures information through year-end 2006.
4
12 months. Monsanto, which has also benefited from the boom in agricultural commodities, and a handful of metals and paper products companies generated strong returns, too. The fund’s relatively small position in energy stocks produced an impressive gain as oil prices touched all-time highs.
Over the past three years, fund’s profile has emerged
Since its December 2004 inception, the fund has outpaced the market and its peer group. Although the period is brief, it has made clear how shareholders can expect this fund to be managed over the long term. The advisor uses in-depth research to identify attractive opportunities and invests heavily in its convictions—that pharmaceuticals companies stand on the threshold of a long period of higher-than-expected growth, for example, or that software companies will profit from the Internet’s growing global reach.
The fund’s portfolio rarely bears much resemblance to market indexes. By extension, its returns can also differ significantly from those of its benchmark index. Over time, we expect these differences to result in performance superior to that of the market and the fund’s peer group. This expectation reflects not only our confidence in the advisor, but also the knowledge that the fund’s low expense ratio gives it a head start in the race for superior net returns.
Total Returns |
|
December 9, 2004,1 Through September 30, 2007 |
|
| Average |
| Annual Return |
PRIMECAP Core Fund | 13.7% |
MSCI US Prime Market 750 Index | 12.1 |
Average Multi-Cap Core Fund2 | 11.4 |
The figures shown represent past performance, which is not a guarantee of future results. (Current performance may be lower or higher than the performance data cited. For performance data current to the most recent month-end, visit our website at www.vanguard.com/performance.) Note, too, that both investment returns and principal value can fluctuate widely, so an investor’s shares, when sold, could be worth more or less than their original cost.
1 Fund’s inception date.
2 Derived from data provided by Lipper Inc.
5
Uncertainty is par for the course
After several years of unusual calm, the financial markets experienced a jolt in the third quarter. Stock market volatility increased sharply, and several other long-established trends seemed to go into reverse. The shift was dramatic, but a long-term perspective suggests that these occasional—and unpredictable—dislocations are an enduring feature of the financial markets.
The best response to uncertainty may be diversification both within and across asset classes, which is why we counsel investors to hold a broadly diversified portfolio of stocks and fixed income investments in proportions consistent with their goals, risk tolerance, and time horizon. Vanguard PRIMECAP Core Fund can play a valuable role in such a portfolio.
Thank you for entrusting your assets to Vanguard.

John J. Brennan
Chairman and Chief Executive Officer
October 12, 2007
6
Advisor’s Report
During the past 12 months, Vanguard PRIMECAP Core Fund returned 16.1%, trailing the 17.2% return of the MSCI US Prime Market 750 Index and the 17.0% average return of multi-capitalization core funds.
Investment environment
In recent years, investors have favored stocks with high relative free cash flow and dividend yields and disfavored stocks that, in our view, offered compelling growth prospects—a theme that we’ve explored in several of our recent shareholder letters. These dynamics had pushed the valuation differential between growth and value stocks toward historical lows, even as growth-oriented companies had increased earnings at an impressive clip.
This multiyear trend began to reverse in fiscal 2007, providing a more favorable environment for growth stocks and the PRIMECAP Core Fund. For the past 12 months, growth stocks, as represented by the Russell 1000 Growth Index, were up 19.35%, while value stocks, as represented by the Russell 1000 Value Index, had a total return of 14.45%. Many traditional growth stocks still trade at small premiums, or in many cases discounts, to traditional value stocks. Even if this valuation anomaly were to persist, we would expect growth companies to outperform the broad market by virtue of their superior earnings growth. If growth stocks’ recent valuation compression continues to reverse and the historical premium awarded to earnings growth begins to return, it could provide a favorable tailwind for some of the major positions in our portfolio, most notably technology and health care stocks.
Our successes
The fund’s most significant contributor was Potash Corp. of Saskatchewan, which returned more than 200% over the full 12 months. Potash controls 75% of the world’s excess capacity of potash, which is used as fertilizer. That gives the company significant leverage in setting prices. Dietary changes in the developing world such as increased beef consumption are pushing demand for—and the prices of—grain, corn, and other feedstocks to record levels. There is little land being cleared for agriculture, putting a premium on the value of fertilizers that can increase the yields of existing farmland.
Research In Motion was another significant contributor. The stock returned 188% during the full 12 months, benefiting from strong sales of its wireless e-mail devices and technologies. In the energy sector, the fund benefited from its position in Schlum-berger, which provides the services and technology to help energy producers tap new reserves and gain efficiencies from existing projects. The stock was up about 70% during the past year.
7
Our shortfalls
The portfolio’s significant detractors included biotech companies Amgen and Sepracor and Southwest Airlines. Amgen has sustained significant regulatory setbacks. Approval changes at the U.S. Food and Drug Administration and changes in reimbursement policies for Amgen’s anemia drugs put significant pressure on therapies that account for about 40% of company revenues. Sepracor has also struggled with changing reimbursement policies, and market acceptance of the sleep aid Lunesta was less than expected. Southwest Airlines was hit by spiking fuel prices, but overall fundamentals remain solid.
Outlook
Although we were disappointed by the performance of Amgen and Sepracor, we remain optimistic about the health care sector. The major pharmaceuticals and smaller biotech companies boast above-average long-term growth prospects, as the emergence of a global middle class produces significant demand for pharmaceuticals. We also expect these companies to benefit from a dramatic increase in the use of drugs and other therapies by the aging baby boom generation. People over age 65 are consuming an increasing amount of prescription drugs per capita, and this consumption is relatively insensitive to the economic cycle. Despite these unusually favorable prospects, large pharmaceutical stocks trade at market-like valuations.
Our information technology stocks also seem positioned to benefit from rising wealth around the world. China’s and India’s enormous populations are accelerating the need for systems to manage the increasing amount of data and the transmission of information around the world. This bodes well for software and equipment technology companies. We’ve also found attractive prospects in the consumer discretionary sector, primarily companies that have demonstrated an ability to turn research and development into profitable long-term growth. Examples include electronics giant Sony and Internet innovators such as Google and Amazon.com.
We remain pessimistic about most financials companies. The recent problems in the subprime mortgage market are likely just the beginning of consequences for loose lending standards, in our view. Risky loans are routinely packaged into collateralized debt obligations (CDOs), which are in turn often repackaged into additional CDOs (called CDO-squared); the underlying credit risk has been sliced, diced, and often redistributed in highly concentrated forms. The proliferation of these products makes it difficult to pinpoint
8
precisely where the risk ultimately resides, though we believe the publicly traded financial firms continue to retain some of this risk, often in new and less understood forms. Reflecting this view, we have minimal exposure to banks and the financial sector overall.
In closing, we would like to thank you for entrusting your hard-earned capital with us. We will continue to work diligently to prove worthy of that trust.
Joel P. Fried |
| Howard B. Schow |
Portfolio Manager |
| Portfolio Manager |
| Theo A. Kolokotrones |
|
| Portfolio Manager |
|
Mitchell J. Milias |
| Alfred W. Mordecai |
Portfolio Manager |
| Portfolio Manager |
| David H. Van Slooten |
|
| Portfolio Manager |
|
PRIMECAP Management Company, LLP | October 16, 2007 |
9
Fund Profile
As of September 30, 2007
Portfolio Characteristics |
|
|
|
| Comparative |
| Fund | Index1 |
Number of Stocks | 137 | 747 |
Median Market Cap | $43.6B | $50.2B |
Price/Earnings Ratio | 21.5x | 17.4x |
Price/Book Ratio | 3.4x | 2.9x |
Yield | 0.6% | 1.8% |
Return on Equity | 18.2% | 19.6% |
Earnings Growth Rate | 23.5% | 21.9% |
Foreign Holdings | 18.5% | 0.0% |
Turnover Rate | 10% | — |
Expense Ratio | 0.55% | — |
Short-Term Reserves | 4.7% | — |
Sector Diversification (% of equity exposure) | ||
|
| Comparative |
| Fund | Index1 |
Consumer Discretionary | 16.2% | 10.0% |
Consumer Staples | 0.6 | 9.0 |
Energy | 7.1 | 11.5 |
Financials | 7.6 | 19.5 |
Health Care | 21.1 | 11.7 |
Industrials | 11.5 | 11.2 |
Information Technology | 27.6 | 16.2 |
Materials | 7.4 | 3.4 |
Telecommunication Services | 0.9 | 3.9 |
Utilities | 0.0 | 3.6 |
Ten Largest Holdings2 (% of total net assets) |
| |
|
|
|
Eli Lilly & Co. | pharmaceuticals | 3.6% |
Novartis AG ADR | pharmaceuticals | 3.2 |
Medtronic, Inc. | health care equipment | 3.0 |
Amgen, Inc. | biotechnology | 2.8 |
ASML Holding NV (New York) | semiconductor equipment | 2.6 |
Texas Instruments, Inc. | semiconductors | 2.4 |
Southwest Airlines Co. | airlines | 2.4 |
Schlumberger Ltd. | oil and gas equipment and services | 2.3 |
Oracle Corp. | systems software | 2.3 |
Intuit, Inc. | application software | 2.1 |
Top Ten |
| 26.7% |
Investment Focus
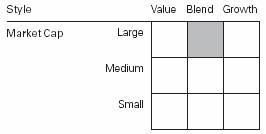
1 MSCI US Prime Market 750 Index.
2 “Ten Largest Holdings” excludes any temporary cash investments and equity index products. See page 25 for a glossary of investment terms.
10
Performance Summary
All of the returns in this report represent past performance, which is not a guarantee of future results that may be achieved by the fund. (Current performance may be lower or higher than the performance data cited. For performance data current to the most recent month-end, visit our website at www.vanguard.com/performance.) Note, too, that both investment returns and principal value can fluctuate widely, so an investor’s shares, when sold, could be worth more or less than their original cost. The returns shown do not reflect taxes that a shareholder would pay on fund distributions or on the sale of fund shares.
Cumulative Performance: December 9, 2004–September 30, 2007
Initial Investment of $10,000
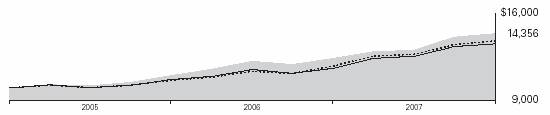
| Average Annual Total Returns | Final Value | |
| Periods Ended September 30, 2007 | of a $10,000 | |
| One Year | Since Inception1 | Investment |
PRIMECAP Core Fund2 | 16.10% | 13.74% | $14,356 |
MSCI US Prime Market 750 Index | 17.24 | 12.11 | 13,784 |
Average Multi-Cap Core Fund3 | 17.00 | 11.41 | 13,543 |
Fiscal-Year Total Returns (%): December 9, 2004–September 30, 2007
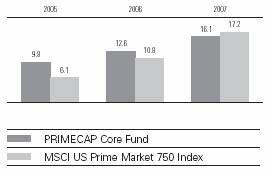
1 Performance for the fund and its comparative standards is calculated since the fund's inception: December 9, 2004.
2 Total returns do not reflect the 1% fee assessed on redemptions of shares held for less than one year, or the account service fee that may be applicable to certain accounts with balances below $10,000.
3 Derived from data provided by Lipper Inc.
Note: See Financial Highlights table on page 17 for dividend and capital gains information.
11
Financial Statements
Statement of Net Assets
As of September 30, 2007
The fund provides a complete list of its holdings four times in each fiscal year, at the quarter-ends. For the second and fourth fiscal quarters, the lists appear in the fund’s semiannual and annual reports to shareholders. For the first and third fiscal quarters, the fund files the lists with the Securities and Exchange Commission on Form N-Q. Shareholders can look up the fund’s Forms N-Q on the SEC’s website at www.sec.gov. Forms N-Q may also be reviewed and copied at the SEC’s Public Reference Room (see the back cover of this report for further information).
|
|
| Market |
|
|
| Value• |
|
| Shares | ($000) |
Common Stocks (95.4%) |
|
| |
Consumer Discretionary (15.5%) |
|
| |
| Sony Corp. ADR | 1,420,000 | 68,245 |
| Whirlpool Corp. | 623,800 | 55,581 |
* | Bed Bath & Beyond, Inc. | 1,489,791 | 50,832 |
| TJX Cos., Inc. | 1,267,625 | 36,850 |
* | Kohl’s Corp. | 639,700 | 36,674 |
* | Amazon.com, Inc. | 368,000 | 34,279 |
* | DIRECTV Group, Inc. | 1,120,725 | 27,211 |
| The Walt Disney Co. | 787,900 | 27,096 |
| Nordstrom, Inc. | 460,400 | 21,588 |
| Mattel, Inc. | 905,200 | 21,236 |
| Best Buy Co., Inc. | 442,600 | 20,368 |
* | Chico’s FAS, Inc. | 1,425,200 | 20,024 |
| Target Corp. | 276,450 | 17,574 |
* | Comcast Corp. Class A | 692,700 | 16,749 |
* | CarMax, Inc. | 688,900 | 14,005 |
* | Viacom Inc. Class B | 263,400 | 10,265 |
| Lowe’s Cos., Inc. | 317,000 | 8,882 |
| Eastman Kodak Co. | 300,000 | 8,028 |
| Idearc Inc. | 150,000 | 4,720 |
| News Corp., Class A | 180,000 | 3,958 |
* | Expedia, Inc. | 108,250 | 3,451 |
* | IAC/InterActiveCorp | 108,250 | 3,212 |
| Citadel Broadcasting Corp. | 53,979 | 224 |
|
|
| 511,052 |
Consumer Staples (0.6%) |
|
| |
| Avon Products, Inc. | 350,000 | 13,135 |
| Costco Wholesale Corp. | 100,000 | 6,137 |
|
|
| 19,272 |
Energy (6.8%) |
|
| |
| Schlumberger Ltd. | 728,900 | 76,534 |
| Arch Coal, Inc. | 909,000 | 30,670 |
| EnCana Corp. | 470,700 | 29,113 |
* | National Oilwell Varco Inc. | 181,700 | 26,256 |
| EOG Resources, Inc. | 300,000 | 21,699 |
| Murphy Oil Corp. | 167,000 | 11,672 |
| ConocoPhillips Co. | 80,000 | 7,022 |
| Chevron Corp. | 64,440 | 6,030 |
* | Transocean Inc. | 48,425 | 5,474 |
|
|
| Market |
|
|
| Value• |
|
| Shares | ($000) |
| GlobalSantaFe Corp. | 70,000 | 5,321 |
| Peabody Energy Corp. | 50,500 | 2,417 |
* | Exterran Holdings, Inc. | 15,000 | 1,205 |
| Noble Corp. | 22,200 | 1,089 |
| Pioneer Natural Resources Co. | 4,900 | 220 |
* | Pride International, Inc. | 5,500 | 201 |
|
|
| 224,923 |
Financials (7.3%) |
|
| |
* | Berkshire Hathaway Inc.Class B | 10,400 | 41,101 |
| Bank of New York Mellon Corp. | 890,192 | 39,293 |
| Marsh & McLennan Cos., Inc. | 1,523,175 | 38,841 |
| American International Group, Inc. | 553,625 | 37,453 |
| Fannie Mae | 272,100 | 16,546 |
* | Discover Financial Services | 737,500 | 15,340 |
| Washington Mutual, Inc. | 373,400 | 13,185 |
| The Chubb Corp. | 210,000 | 11,264 |
| MBIA, Inc. | 117,425 | 7,169 |
| Fifth Third Bancorp | 176,800 | 5,990 |
| Citigroup, Inc. | 127,000 | 5,927 |
| Progressive Corp. of Ohio | 144,500 | 2,805 |
| Capital One Financial Corp. | 30,000 | 1,993 |
| Freddie Mac | 22,200 | 1,310 |
| Wells Fargo & Co. | 20,000 | 712 |
| AFLAC Inc. | 10,000 | 570 |
| JPMorgan Chase & Co. | 10,000 | 458 |
| State Street Corp. | 5,000 | 341 |
| TCF Financial Corp. | 5,000 | 131 |
|
|
| 240,429 |
Health Care (20.2%) |
|
| |
| Eli Lilly & Co. | 2,112,400 | 120,259 |
| Novartis AG ADR | 1,942,600 | 106,765 |
| Medtronic, Inc. | 1,742,500 | 98,294 |
* | Amgen, Inc. | 1,631,200 | 92,277 |
| GlaxoSmithKline PLC ADR | 1,188,500 | 63,228 |
| Roche Holdings AG | 320,000 | 57,943 |
* | Boston Scientific Corp. | 3,607,491 | 50,324 |
12
|
|
| Market |
|
|
| Value• |
|
| Shares | ($000) |
* | Biogen Idec Inc. | 330,000 | 21,889 |
* | Waters Corp. | 280,000 | 18,738 |
* | Sepracor Inc. | 680,400 | 18,711 |
| Wyeth | 250,000 | 11,138 |
| Sanofi-Aventis ADR | 150,000 | 6,363 |
* | Genzyme Corp. | 9,100 | 564 |
|
|
| 666,493 |
Industrials (10.9%) |
|
| |
| Southwest Airlines Co. | 5,280,925 | 78,158 |
| United Parcel Service, Inc. | 618,415 | 46,443 |
* | McDermott International, Inc. | 760,000 | 41,101 |
| FedEx Corp. | 304,900 | 31,938 |
| Avery Dennison Corp. | 340,000 | 19,387 |
* | AMR Corp. | 791,600 | 17,645 |
| Fluor Corp. | 120,000 | 17,278 |
| The Boeing Co. | 164,400 | 17,260 |
| General Electric Co. | 408,000 | 16,891 |
| 3M Co. | 170,000 | 15,909 |
| Union Pacific Corp. | 120,000 | 13,567 |
| Canadian National Railway Co. | 226,000 | 12,882 |
| Caterpillar, Inc. | 146,650 | 11,502 |
| Burlington Northern Santa Fe Corp. | 100,000 | 8,117 |
| Deere & Co. | 46,800 | 6,946 |
| Canadian Pacific Railway Ltd. | 59,830 | 4,205 |
| Norfolk Southern Corp. | 21,900 | 1,137 |
| Chicago Bridge & Iron Co. N.V. | 19,000 | 818 |
* | UAL Corp. | 13,600 | 633 |
|
|
| 361,817 |
Information Technology (26.2%) |
|
| |
| Communications Equipment (5.5%) |
|
|
| Corning, Inc. | 2,218,875 | 54,695 |
* | Research In Motion Ltd. | 462,900 | 45,619 |
| LM Ericsson Telephone Co. ADR Class B | 578,000 | 23,004 |
| QUALCOMM Inc. | 486,800 | 20,572 |
| Motorola, Inc. | 1,000,000 | 18,530 |
* | Nortel Networks Corp. | 675,750 | 11,474 |
* | Comverse Technology, Inc. | 386,725 | 7,657 |
|
|
|
|
| Computers & Peripherals (1.6%) |
|
|
* | EMC Corp. | 2,611,000 | 54,309 |
* | Dell Inc. | 10,000 | 276 |
|
|
|
|
| Electronic Equipment & Instruments (0.4%) |
|
|
* | Agilent Technologies, Inc. | 315,000 | 11,617 |
|
|
|
|
| Internet Software & Services (2.4%) |
|
|
* | Google Inc. | 52,400 | 29,725 |
* | eBay Inc. | 744,600 | 29,054 |
* | Yahoo! Inc. | 724,500 | 19,446 |
* | VeriSign, Inc. | 8,000 | 270 |
|
|
| Market |
|
|
| Value• |
|
| Shares | ($000) |
| IT Services (0.6%) |
|
|
| Accenture Ltd. | 380,500 | 15,315 |
| Paychex, Inc. | 100,000 | 4,100 |
|
|
|
|
| Semiconductors & Semiconductor Equipment (8.7%) |
|
|
* | ASML Holding NV (New York) | 2,646,700 | 86,971 |
| Texas Instruments, Inc. | 2,202,000 | 80,571 |
| Intel Corp. | 1,748,700 | 45,221 |
| Applied Materials, Inc. | 1,266,700 | 26,221 |
| Altera Corp. | 1,080,000 | 26,006 |
| KLA-Tencor Corp. | 288,000 | 16,065 |
* | Micron Technology, Inc. | 350,000 | 3,885 |
| Intersil Corp. | 30,000 | 1,003 |
* | Verigy Ltd. | 38,567 | 953 |
| Xilinx, Inc. | 36,000 | 941 |
* | NVIDIA Corp. | 15,200 | 551 |
|
|
|
|
| Software (7.0%) |
|
|
* | Oracle Corp. | 3,515,500 | 76,111 |
* | Intuit, Inc. | 2,318,400 | 70,247 |
| Microsoft Corp. | 1,659,900 | 48,901 |
* | Symantec Corp. | 1,779,500 | 34,487 |
* | VMware Inc. | 18,100 | 1,539 |
|
|
| 865,336 |
Materials (7.1%) |
|
| |
| Potash Corp. of |
|
|
| Saskatchewan, Inc. | 605,800 | 64,033 |
| Monsanto Co. | 486,350 | 41,700 |
| Praxair, Inc. | 433,775 | 36,333 |
| Vulcan Materials Co. | 252,000 | 22,466 |
| Alcoa Inc. | 406,900 | 15,918 |
| Newmont Mining Corp. (Holding Co.) | 330,000 | 14,761 |
* | Domtar Corp. | 1,739,372 | 14,263 |
| Weyerhaeuser Co. | 161,767 | 11,696 |
| Freeport-McMoRan Copper & Gold, Inc. Class B | 91,120 | 9,558 |
| Dow Chemical Co. | 79,000 | 3,402 |
| International Paper Co. | 10,000 | 359 |
|
|
| 234,489 |
Telecommunication Services (0.8%) |
|
| |
| Sprint Nextel Corp. | 1,379,950 | 26,219 |
| Embarq Corp. | 18,000 | 1,001 |
|
|
| 27,220 |
Utilities (0.0%) |
|
| |
| Sierra Pacific Resources | 63,100 | 993 |
Total Common Stocks |
|
| |
(Cost $2,619,586) |
| 3,152,024 | |
13
|
| Market |
|
| Value• |
| Shares | ($000) |
Temporary Cash Investment (4.7%) |
|
|
1 Vanguard Market Liquidity Fund, 5.153% |
|
|
(Cost $154,510) | 154,509,557 | 154,510 |
Total Investments (100.1%) |
|
|
(Cost $2,774,096) |
| 3,306,534 |
Other Assets and Liabilities (–0.1%) |
|
|
Other Assets—Note C |
| 12,911 |
Liabilities |
| (14,106) |
|
| (1,195) |
Net Assets (100%) |
|
|
Applicable to 235,613,564 outstanding |
|
|
$.001 par value shares of beneficial |
|
|
interest (unlimited authorization) |
| 3,305,339 |
Net Asset Value Per Share |
| $14.03 |
At September 30, 2007, net assets consisted of:2 | ||
| Amount | Per |
| ($000) | Share |
Paid-in Capital | 2,720,860 | $11.55 |
Undistributed Net |
|
|
Investment Income | 11,773 | .05 |
Accumulated Net |
|
|
Realized Gains | 40,260 | .17 |
Unrealized Appreciation |
|
|
Investment Securities | 532,438 | 2.26 |
Foreign Currencies | 8 | — |
Net Assets | 3,305,339 | $14.03 |
• | See Note A in Notes to Financial Statements. |
* | Non-income-producing security. |
1 Affiliated money market fund available only to Vanguard funds and certain trusts and accounts managed by Vanguard. Rate shown is the 7-day yield.
2 See Note D in Notes to Financial Statements for the tax-basis components of net assets.
ADR—American Depositary Receipt.
14
Statement of Operations
| Year Ended |
| September 30, 2007 |
| ($000) |
Investment Income |
|
Income |
|
Dividends1 | 26,559 |
Interest2 | 9,177 |
Security Lending | 83 |
Total Income | 35,819 |
Expenses |
|
Investment Advisory Fees—Note B | 9,069 |
The Vanguard Group—Note C |
|
Management and Administrative | 5,590 |
Marketing and Distribution | 695 |
Custodian Fees | 39 |
Auditing Fees | 20 |
Shareholders’ Reports | 52 |
Trustees’ Fees and Expenses | 4 |
Total Expenses | 15,469 |
Net Investment Income | 20,350 |
Realized Net Gain (Loss) |
|
Investment Securities Sold | 49,965 |
Foreign Currencies | (9) |
Realized Net Gain (Loss) | 49,956 |
Change in Unrealized Appreciation (Depreciation) |
|
Investment Securities | 340,614 |
Foreign Currencies | 5 |
Change in Unrealized Appreciation (Depreciation) | 340,619 |
Net Increase (Decrease) in Net Assets Resulting from Operations | 410,925 |
1 Dividends are net of foreign withholding taxes of $588,000.
2 Interest income from an affiliated company of the fund was $9,177,000.
15
Statement of Changes in Net Assets
| Year Ended September 30, | |
| 2007 | 2006 |
| ($000) | ($000) |
Increase (Decrease) in Net Assets |
|
|
Operations |
|
|
Net Investment Income | 20,350 | 14,570 |
Realized Net Gain (Loss) | 49,956 | 16,324 |
Change in Unrealized Appreciation (Depreciation) | 340,619 | 137,589 |
Net Increase (Decrease) in Net Assets Resulting from Operations | 410,925 | 168,483 |
Distributions |
|
|
Net Investment Income | (18,806) | (5,225) |
Realized Capital Gain1 | (21,974) | (3,030) |
Total Distributions | (40,780) | (8,255) |
Capital Share Transactions—Note F |
|
|
Issued | 1,135,559 | 1,275,807 |
Issued in Lieu of Cash Distributions | 37,043 | 7,589 |
Redeemed2 | (445,147) | (178,080) |
Net Increase (Decrease) from Capital Share Transactions | 727,455 | 1,105,316 |
Total Increase (Decrease) | 1,097,600 | 1,265,544 |
Net Assets |
|
|
Beginning of Period | 2,207,739 | 942,195 |
End of Period3 | 3,305,339 | 2,207,739 |
1 Includes fiscal 2007 and 2006 short-term gain distributions totaling $6,533,000 and $3,030,000, respectively. Short-term gain distributions are treated as ordinary income dividends for tax purposes.
2 Net of redemption fees of $1,350,000 and $760,000.
3 Net Assets—End of Period includes undistributed net investment income of $11,773,000 and $11,441,000.
16
Financial Highlights
| Year Ended | 20041 to | |
| September 30, | Sept. 30, | |
For a Share Outstanding Throughout Each Period | 2007 | 2006 | 2005 |
Net Asset Value, Beginning of Period | $12.28 | $10.98 | $10.00 |
Investment Operations |
|
|
|
Net Investment Income | .095 | .090 | .03 |
Net Realized and Unrealized Gain (Loss) on Investments | 1.861 | 1.289 | .95 |
Total from Investment Operations | 1.956 | 1.379 | .98 |
Distributions |
|
|
|
Dividends from Net Investment Income | (.095) | (.050) | — |
Distributions from Realized Capital Gains | (.111) | (.029) | — |
Total Distributions | (.206) | (.079) | — |
Net Asset Value, End of Period | $14.03 | $12.28 | $10.98 |
|
|
|
|
Total Return2 | 16.10% | 12.61% | 9.80% |
|
|
|
|
Ratios/Supplemental Data |
|
|
|
Net Assets, End of Period (Millions) | $3,305 | $2,208 | $942 |
Ratio of Total Expenses to Average Net Assets | 0.55% | 0.60% | 0.72%* |
Ratio of Net Investment Income to Average Net Assets | 0.73% | 0.90% | 0.58%* |
Portfolio Turnover Rate | 10% | 5% | 6% |
1 Inception.
2 Total returns do not reflect the 1% fee assessed on redemptions of shares held for less than one year, or the account service fee that may be applicable to certain accounts with balances below $10,000.
* | Annualized. |
See accompanying Notes, which are an integral part of the Financial Statements.
17
Notes to Financial Statements
Vanguard PRIMECAP Core Fund is registered under the Investment Company Act of 1940 as an open-end investment company, or mutual fund. The fund files reports with the SEC under the company name Vanguard Fenway Funds.
A. The following significant accounting policies conform to generally accepted accounting principles for U.S. mutual funds. The fund consistently follows such policies in preparing its financial statements.
1. Security Valuation: Securities are valued as of the close of trading on the New York Stock Exchange (generally 4 p.m., Eastern time) on the valuation date. Equity securities are valued at the latest quoted sales prices or official closing prices taken from the primary market in which each security trades; such securities not traded on the valuation date are valued at the mean of the latest quoted bid and asked prices. Securities for which market quotations are not readily available, or whose values have been affected by events occurring before the fund’s pricing time but after the close of the securities’ primary markets, are valued at their fair values calculated according to procedures adopted by the board of trustees. These procedures include obtaining quotations from an independent pricing service, monitoring news to identify significant market- or security-specific events, and evaluating changes in the values of foreign market proxies (for example, ADRs, futures contracts, or exchange-traded funds) between the time the foreign markets close and the fund’s pricing time. When fair-value pricing is employed, the prices of securities used by a fund to calculate its net asset value may differ from quoted or published prices for the same securities. Investments in Vanguard Market Liquidity Fund are valued at that fund’s net asset value.
2. Foreign Currency: Securities and other assets and liabilities denominated in foreign currencies are translated into U.S. dollars using exchange rates obtained from an independent third party as of the fund’s pricing time on the valuation date. Realized gains (losses) and unrealized appreciation (depreciation) on investment securities include the effects of changes in exchange rates since the securities were purchased, combined with the effects of changes in security prices. Fluctuations in the value of other assets and liabilities resulting from changes in exchange rates are recorded as unrealized foreign currency gains (losses) until the assets or liabilities are settled in cash, at which time they are recorded as realized foreign currency gains (losses).
3. Federal Income Taxes: The fund intends to continue to qualify as a regulated investment company and distribute all of its taxable income. Accordingly, no provision for federal income taxes is required in the financial statements.
4. Distributions: Distributions to shareholders are recorded on the ex-dividend date.
5. Security Lending: The fund may lend its securities to qualified institutional borrowers to earn additional income. Security loans are required to be secured at all times by collateral at least equal to the market value of securities loaned. The fund invests cash collateral received in Vanguard Market Liquidity Fund, and records a liability for the return of the collateral, during the period the securities are on loan. Security lending income represents the income earned on investing cash collateral, less expenses associated with the loan.
6. Other: Dividend income is recorded on the ex-dividend date. Interest income includes income distributions received from Vanguard Market Liquidity Fund and is accrued daily. Security transactions are accounted for on the date securities are bought or sold. Costs used to determine realized gains (losses) on the sale of investment securities are those of the specific securities sold. Fees assessed on redemptions of capital shares are credited to paid-in capital.
18
B. PRIMECAP Management Company provides investment advisory services to the fund for a fee calculated at an annual percentage rate of average net assets. For the year ended September 30, 2007, the investment advisory fee represented an effective annual rate of 0.32% of the fund’s average net assets.
C. The Vanguard Group furnishes at cost corporate management, administrative, marketing, and distribution services. The costs of such services are allocated to the fund under methods approved by the board of trustees. The fund has committed to provide up to 0.40% of its net assets in capital contributions to Vanguard. At September 30, 2007, the fund had contributed capital of $269,000 to Vanguard (included in Other Assets), representing 0.01% of the fund’s net assets and 0.27% of Vanguard’s capitalization. The fund’s trustees and officers are also directors and officers of Vanguard.
D. Distributions are determined on a tax basis and may differ from net investment income and realized capital gains for financial reporting purposes. Differences may be permanent or temporary. Permanent differences are reclassified among capital accounts in the financial statements to reflect their tax character. Temporary differences arise when certain items of income, expense, gain, or loss are recognized in different periods for financial statement and tax purposes; these differences will reverse at some time in the future. Differences in classification may also result from the treatment of short-term gains as ordinary income for tax purposes.
During the year ended September 30, 2007, the fund realized net foreign currency losses of $9,000, which decreased distributable net investment for tax purposes; accordingly, such losses have been reclassified from accumulated net realized gains to undistributed net investment income.
The fund used a tax accounting practice to treat a portion of the price of capital shares redeemed during the year as distributions from net investment income and realized capital gains. Accordingly, the fund has reclassified $1,203,000 from undistributed net investment income, and $2,829,000 from accumulated net realized gains, to paid-in capital.
For tax purposes, at September 30, 2007, the fund had $28,610,000 of ordinary income and $25,155,000 of long-term capital gains available for distribution.
At September 30, 2007, the cost of investment securities for tax purposes was $ 2,774,096,000. Net unrealized appreciation of investment securities for tax purposes was $532,438,000, consisting of unrealized gains of $630,431,000 on securities that had risen in value since their purchase and $97,993,000 in unrealized losses on securities that had fallen in value since their purchase.
E. During the year ended September 30, 2007, the fund purchased $1,004,509,000 of investment
securities and sold $269,998,000 of investment securities, other than temporary cash investments.
19
F. Capital shares issued and redeemed were:
| Year Ended September 30, | |
| 2007 | 2006 |
| Shares | Shares |
| (000) | (000) |
Issued | 86,606 | 108,570 |
Issued in Lieu of Cash Distributions | 2,917 | 660 |
Redeemed | (33,765) | (15,210) |
Net Increase (Decrease) in Shares Outstanding | 55,758 | 94,020 |
G. In June 2006, the Financial Accounting Standards Board issued Interpretation No. 48 (“FIN 48”), “Accounting for Uncertainty in Income Taxes.” FIN 48 establishes the minimum threshold for recognizing, and a system for measuring, the benefits of tax-return positions in financial statements, and is effective for the fund’s fiscal year beginning October 1, 2007. Management has analyzed the fund’s tax positions taken on federal income tax returns for all open tax years (tax years ended September 30, 2005–2007) for purposes of implementing FIN 48, and has concluded that as of September 30, 2007, no provision for income tax would be required in the fund’s financial statements.
20
Report of Independent Registered Public Accounting Firm
To the Trustees of Vanguard Fenway Funds and the Shareholders of Vanguard PRIMECAP Core Fund:
In our opinion, the accompanying statement of net assets and the related statements of operations and of changes in net assets and the financial highlights present fairly, in all material respects, the financial position of Vanguard PRIMECAP Core Fund (the “Fund”) at September 30, 2007, the results of its operations for the year then ended, the changes in its net assets for each of the two years in the period then ended and the financial highlights for each of the periods indicated, in conformity with accounting principles generally accepted in the United States of America. These financial statements and financial highlights (hereafter referred to as “financial statements”) are the responsibility of the Fund’s management; our responsibility is to express an opinion on these financial statements based on our audits. We conducted our audits of these financial statements in accordance with the standards of the Public Company Accounting Oversight Board (United States), which require that we plan and perform the audit to obtain reasonable assurance about whether the financial statements are free of material misstatement. An audit includes examining, on a test basis, evidence supporting the amounts and disclosures in the financial statements, assessing the accounting principles used and significant estimates made by management, and evaluating the overall financial statement presentation. We believe that our audits, which included confirmation of securities at September 30, 2007 by correspondence with the custodian and by agreement to the underlying ownership records for Vanguard Market Liquidity Fund, provide a reasonable basis for our opinion.
PricewaterhouseCoopers LLP
Philadelphia, Pennsylvania
November 7, 2007
Special 2007 tax information (unaudited) for Vanguard PRIMECAP Core Fund
This information for the fiscal year ended September 30, 2007, is included pursuant to provisions of the Internal Revenue Code.
The fund distributed $17,351,000 as capital gain dividends (from net long-term capital gains) to shareholders during the fiscal year.
The fund distributed $18,075,000 of qualified dividend income to shareholders during the fiscal year.
For corporate shareholders, 55.9% of investment income (dividend income plus short-term gains, if any) qualifies for the dividends-received deduction.
21
Your Fund’s After-Tax Returns
This table presents returns for your fund both before and after taxes. The after-tax returns are shown in two ways: (1) assuming that an investor owned the fund during the entire period and paid taxes on the fund’s distributions, and (2) assuming that an investor paid taxes on the fund’s distributions and sold all shares at the end of each period.
Calculations are based on the highest individual federal income tax and capital gains tax rates in effect at the times of the distributions and the hypothetical sales. State and local taxes were not considered. After-tax returns reflect any qualified dividend income, using actual prior-year figures and estimates for 2007. (In the example, returns after the sale of fund shares may be higher than those assuming no sale. This occurs when the sale would have produced a capital loss. The calculation assumes that the investor received a tax deduction for the loss.)
Please note that your actual after-tax returns will depend on your tax situation and may differ from those shown. Also note that if you own the fund in a tax-deferred account, such as an individual retirement account or a 401(k) plan, this information does not apply to you. Such accounts are not subject to current taxes.
Finally, keep in mind that a fund’s performance—whether before or after taxes—does not guarantee future results.
Average Annual Total Returns: PRIMECAP Core Fund1 |
|
|
Periods Ended September 30, 2007 |
|
|
| One | Since |
| Year | Inception2 |
Returns Before Taxes | 16.10% | 13.74% |
Returns After Taxes on Distributions | 15.76 | 13.57 |
Returns After Taxes on Distributions and Sale of Fund Shares | 10.72 | 11.81 |
1 Total returns do not reflect the 1% fee assessed on redemptions of shares held for less than one year, or the account service fee that may be applicable to certain accounts with balances below $10,000.
2 December 9, 2004.
22
About Your Fund’s Expenses
As a shareholder of the fund, you incur ongoing costs, which include costs for portfolio management, administrative services, and shareholder reports (like this one), among others. Operating expenses, which are deducted from a fund’s gross income, directly reduce the investment return of the fund.
A fund’s expenses are expressed as a percentage of its average net assets. This figure is known as the expense ratio. The following examples are intended to help you understand the ongoing costs (in dollars) of investing in your fund and to compare these costs with those of other mutual funds. The examples are based on an investment of $1,000 made at the beginning of the period shown and held for the entire period.
The table below illustrates your fund’s costs in two ways:
• Based on actual fund return. This section helps you to estimate the actual expenses that you paid over the period. The “Ending Account Value” shown is derived from the fund’s actual return, and the third column shows the dollar amount that would have been paid by an investor who started with $1,000 in the fund. You may use the information here, together with the amount you invested, to estimate the expenses that you paid over the period.
To do so, simply divide your account value by $1,000 (for example, an $8,600 account value divided by $1,000 = 8.6), then multiply the result by the number given for your fund under the heading “Expenses Paid During Period.”
• Based on hypothetical 5% yearly return. This section is intended to help you compare your fund’s costs with those of other mutual funds. It assumes that the fund had a yearly return of 5% before expenses, but that the expense ratio is unchanged. In this case—because the return used is not the fund’s actual return—the results do not apply to your investment. The example is useful in making comparisons because the Securities and Exchange Commission requires all mutual funds to calculate expenses based on a 5% return. You can assess your fund’s costs by comparing this hypothetical example with the hypothetical examples that appear in shareholder reports of other funds.
Six Months Ended September 30, 2007 |
|
|
|
| Beginning | Ending | Expenses |
| Account Value | Account Value | Paid During |
PRIMECAP Core Fund | 3/31/2007 | 9/30/2007 | Period1 |
Based on Actual Fund Return | $1,000.00 | $1,102.12 | $2.85 |
Based on Hypothetical 5% Yearly Return | 1,000.00 | 1,022.36 | 2.74 |
Note that the expenses shown in the table are meant to highlight and help you compare ongoing costs only and do not reflect transaction costs incurred by the fund for buying and selling securities. Further, the expenses do not include the 1% fee on redemptions of shares held for less than one year, nor do they include the account service fee described in the prospectus. If such fees were applied to your account, your costs would be higher. Your fund does not carry a “sales load.”
1 The calculations are based on expenses incurred in the most recent six-month period. The fund’s annualized six-month expense ratio for that period is 0.54%. The dollar amounts shown as “Expenses Paid” are equal to the annualized expense ratio multiplied by the average account value over the period, multiplied by the number of days in the most recent six-month period, then divided by the number of days in the most recent 12-month period.
23
The calculations assume no shares were bought or sold during the period. Your actual costs may have been higher or lower, depending on the amount of your investment and the timing of any purchases or redemptions.
You can find more information about the fund’s expenses in the Financial Statements section of this report. For additional information on operating expenses and other shareholder costs, please refer to your fund’s current prospectus.
24
Glossary
Earnings Growth Rate. The average annual rate of growth in earnings over the past five years for the stocks now in a fund.
Equity Exposure. A measure that reflects a fund’s investments in stocks and stock futures. Any holdings in short-term reserves are excluded.
Expense Ratio. The percentage of a fund’s average net assets used to pay its annual administrative and advisory expenses. These expenses directly reduce returns to investors.
Foreign Holdings. The percentage of a fund represented by stocks or depositary receipts of companies based outside the United States.
Inception Date. The date on which the assets of a fund (or one of its share classes) are first invested in accordance with the fund’s investment objective. For funds with a subscription period, the inception date is the day after that period ends. Investment performance is measured from the inception date.
Median Market Cap. An indicator of the size of companies in which a fund invests; the midpoint of market capitalization (market price x shares outstanding) of a fund’s stocks, weighted by the proportion of the fund’s assets invested in each stock. Stocks representing half of the fund’s assets have market capitalizations above the median, and the rest are below it.
Price/Book Ratio. The share price of a stock divided by its net worth, or book value, per share. For a fund, the weighted average price/book ratio of the stocks it holds.
Price/Earnings Ratio. The ratio of a stock’s current price to its per-share earnings over the past year. For a fund, the weighted average P/E of the stocks it holds. P/E is an indicator of market expectations about corporate prospects; the higher the P/E, the greater the expectations for a company’s future growth.
Return on Equity. The annual average rate of return generated by a company during the past five years for each dollar of shareholder’s equity (net income divided by shareholder’s equity). For a fund, the weighted average return on equity for the companies whose stocks it holds.
Short-Term Reserves. The percentage of a fund invested in highly liquid, short-term securities that can be readily converted to cash.
Turnover Rate. An indication of the fund’s trading activity. Funds with high turnover rates incur higher transaction costs and may be more likely to distribute capital gains (which may be taxable to investors). The turnover rate excludes in-kind transactions, which have minimal impact on costs.
Yield. A snapshot of a fund’s income from interest and dividends. The yield, expressed as a percentage of the fund’s net asset value, is based on income earned over the past 30 days and is annualized, or projected forward for the coming year. The index yield is based on the current annualized rate of income provided by securities in the index.
25
This page intentionally left blank.
This page intentionally left blank.
The People Who Govern Your Fund
The trustees of your mutual fund are there to see that the fund is operated and managed in your best interests since, as a shareholder, you are a part owner of the fund. Your fund’s trustees also serve on the board of directors of The Vanguard Group, Inc., which is owned by the Vanguard funds and provides services to them on an at-cost basis.
A majority of Vanguard’s board members are independent, meaning that they have no affiliation with Vanguard or the funds they oversee, apart from the sizable personal investments they have made as private individuals.
Our independent board members bring distinguished backgrounds in business, academia, and public service to their task of working with Vanguard officers to establish the policies and oversee the activities of the funds. Among board members’ responsibilities are selecting investment advisors for the funds; monitoring fund operations, performance, and costs; reviewing contracts; nominating and selecting new trustees/directors; and electing Vanguard officers.
Each trustee serves a fund until its termination; or until the trustee’s retirement, resignation, or death; or otherwise as specified in the fund’s organizational documents. Any trustee may be removed at a shareholders’ meeting by a vote representing two-thirds of the net asset value of all shares of the fund together with shares of other Vanguard funds organized within the same trust. The table on these two pages shows information for each trustee and executive officer of the fund. The mailing address of the trustees and officers is P.O. Box 876, Valley Forge, PA 19482.
Chairman of the Board, Chief Executive Officer, and Trustee | |
|
|
John J. Brennan1 |
|
Born 1954 | Principal Occupation(s) During the Past Five Years: Chairman of the Board, Chief Executive |
Trustee since May 1987; | Officer, and Director/Trustee of The Vanguard Group, Inc., and of each of the investment |
Chairman of the Board and | companies served by The Vanguard Group. |
Chief Executive Officer |
|
148 Vanguard Funds Overseen |
|
|
|
Independent Trustees |
|
|
|
Charles D. Ellis |
|
Born 1937 | Principal Occupation(s) During the Past Five Years: Applecore Partners (pro bono ventures |
Trustee since January 2001 | in education); Senior Advisor to Greenwich Associates (international business strategy |
148 Vanguard Funds Overseen | consulting); Successor Trustee of Yale University; Overseer of the Stern School of Business |
| at New York University; Trustee of the Whitehead Institute for Biomedical Research. |
|
|
Rajiv L. Gupta |
|
Born 1945 | Principal Occupation(s) During the Past Five Years: Chairman, President, and |
Trustee since December 20012 | Chief Executive Officer of Rohm and Haas Co. (chemicals); Board Member of |
148 Vanguard Funds Overseen | the American Chemistry Council; Director of Tyco International, Ltd. (diversified |
| manufacturing and services) since 2005; Trustee of Drexel University and of the |
| Chemical Heritage Foundation. |
|
|
Amy Gutmann |
|
Born 1949 | Principal Occupation(s) During the Past Five Years: President of the University of |
Trustee since June 2006 | Pennsylvania since 2004; Professor in the School of Arts and Sciences, Annenberg School |
148 Vanguard Funds Overseen | for Communication, and Graduate School of Education of the University of Pennsylvania |
| since 2004; Provost (2001–2004) and Laurance S. Rockefeller Professor of Politics and |
| the University Center for Human Values (1990–2004), Princeton University; Director of |
| Carnegie Corporation of New York since 2005 and of Schuylkill River Development |
| Corporation and Greater Philadelphia Chamber of Commerce since 2004. |
JoAnn Heffernan Heisen |
|
Born 1950 | Principal Occupation(s) During the Past Five Years: Corporate Vice President and |
Trustee since July 1998 | Chief Global Diversity Officer since 2006, Vice President and Chief Information |
148 Vanguard Funds Overseen | Officer (1997–2005), and Member of the Executive Committee of Johnson & |
| Johnson (pharmaceuticals/consumer products); Director of the University Medical |
| Center at Princeton and Women’s Research and Education Institute. |
|
|
André F. Perold |
|
Born 1952 | Principal Occupation(s) During the Past Five Years: George Gund Professor of Finance |
Trustee since December 2004 | and Banking, Harvard Business School; Senior Associate Dean, Director of Faculty |
148 Vanguard Funds Overseen | Recruiting, and Chair of Finance Faculty, Harvard Business School; Director and Chairman |
| of UNX, Inc. (equities trading firm) since 2003; Chair of the Investment Committee of |
| HighVista Strategies LLC (private investment firm) since 2005. |
|
|
Alfred M. Rankin, Jr. |
|
Born 1941 | Principal Occupation(s) During the Past Five Years: Chairman, President, Chief Executive |
Trustee since January 1993 | Officer, and Director of NACCO Industries, Inc. (forklift trucks/housewares/lignite); Director |
148 Vanguard Funds Overseen | of Goodrich Corporation (industrial products/aircraft systems and services). |
|
|
|
|
J. Lawrence Wilson |
|
Born 1936 | Principal Occupation(s) During the Past Five Years: Retired Chairman and Chief Executive |
Trustee since April 1985 | Officer of Rohm and Haas Co. (chemicals); Director of Cummins Inc. (diesel engines) and |
148 Vanguard Funds Overseen | AmerisourceBergen Corp. (pharmaceutical distribution); Trustee of Vanderbilt University |
| and of Culver Educational Foundation. |
|
|
Executive Officers1 |
|
|
|
Thomas J. Higgins |
|
Born 1957 | Principal Occupation(s) During the Past Five Years: Principal of The Vanguard Group, Inc.; |
Treasurer since July 1998 | Treasurer of each of the investment companies served by The Vanguard Group. |
148 Vanguard Funds Overseen |
|
|
|
|
|
Heidi Stam |
|
Born 1956 | Principal Occupation(s) During the Past Five Years: Managing Director of The Vanguard |
Secretary since July 2005 | Group, Inc., since 2006; General Counsel of The Vanguard Group since 2005; Secretary of |
148 Vanguard Funds Overseen | The Vanguard Group, and of each of the investment companies served by The Vanguard |
| Group, since 2005; Principal of The Vanguard Group (1997–2006). |
Vanguard Senior Management Team |
|
| |
|
|
|
|
R. Gregory Barton | Kathleen C. Gubanich | F. William McNabb, III | Ralph K. Packard |
Mortimer J. Buckley | Paul A. Heller | Michael S. Miller | George U. Sauter |
Founder |
|
John C. Bogle |
Chairman and Chief Executive Officer, 1974–1996 |
1 Officers of the funds are “interested persons” as defined in the Investment Company Act of 1940.
2 December 2002 for Vanguard Equity Income Fund, Vanguard Growth Equity Fund, the Vanguard Municipal Bond Funds, and the Vanguard State Tax-Exempt Funds.
More information about the trustees is in the Statement of Additional Information, available from The Vanguard Group.
|
|
| P.O. Box 2600 |
| Valley Forge, PA 19482-2600 |

Connect with Vanguard® > www.vanguard.com
Fund Information > 800-662-7447 | Vanguard, Connect with Vanguard, and the ship logo |
| are trademarks of The Vanguard Group, Inc. |
Direct Investor Account Services > 800-662-2739 |
|
|
|
Institutional Investor Services > 800-523-1036 | All other marks are the exclusive property of their |
| respective owners. |
Text Telephone for People |
|
With Hearing Impairment > 800-952-3335 |
|
| All comparative mutual fund data are from Lipper Inc. |
| or Morningstar, Inc., unless otherwise noted. |
|
|
|
|
| You can obtain a free copy of Vanguard’s proxy voting |
| guidelines by visiting our website, www.vanguard.com, |
This material may be used in conjunction | and searching for “proxy voting guidelines,” or by |
with the offering of shares of any Vanguard | calling Vanguard at 800-662-2739. The guidelines are |
fund only if preceded or accompanied by | also available from the SEC’s website, www.sec.gov. |
the fund’s current prospectus. | In addition, you may obtain a free report on how your |
| fund voted the proxies for securities it owned during |
| the 12 months ended June 30. To get the report, visit |
| either www.vanguard.com or www.sec.gov. |
|
|
|
|
| You can review and copy information about your fund |
| at the SEC’s Public Reference Room in Washington, D.C. |
| To find out more about this public service, call the SEC |
| at 202-551-8090. Information about your fund is also |
| available on the SEC’s website, and you can receive |
| copies of this information, for a fee, by sending a |
| request in either of two ways: via e-mail addressed to |
| publicinfo@sec.gov or via regular mail addressed to the |
| Public Reference Section, Securities and Exchange |
| Commission, Washington, DC 20549-0102. |
|
|
|
|
|
|
|
|
|
|
| © 2007 The Vanguard Group, Inc. |
| All rights reserved. |
| Vanguard Marketing Corporation, Distributor. |
|
|
| Q12200 112007 |
Item 2: Code of Ethics. The Registrant has adopted a code of ethics that applies to the Registrant’s principal executive officer, principal financial officer, principal accounting officer or controller or persons performing similar functions. The Code of Ethics was amended during the reporting period covered by this report to make certain technical, non-material changes.
Item 3: Audit Committee Financial Expert. The following members of the Audit Committee have been determined by the Registrant’s Board of Trustees to be Audit Committee Financial Experts serving on its Audit Committee, and to be independent: Charles D. Ellis, Rajiv L. Gupta, JoAnn Heffernan Heisen, André F. Perold, Alfred M. Rankin, Jr., and J. Lawrence Wilson.
Item 4: Principal Accountant Fees and Services.
(a) Audit Fees.
Audit Fees of the Registrant
Fiscal Year Ended September 30, 2007: $65,000
Fiscal Year Ended September 30, 2006: $62,000
Aggregate Audit Fees of Registered Investment Companies in the Vanguard Group.
Fiscal Year Ended September 30, 2007: $2,835,320
Fiscal Year Ended September 30, 2006: $2,347,620
(b) Audit-Related Fees.
Fiscal Year Ended September 30, 2007: $630,400
Fiscal Year Ended September 30, 2006: $530,000
Includes fees billed in connection with assurance and related services provided to the Registrant, The Vanguard Group, Inc., Vanguard Marketing Corporation, and other registered investment companies in the Vanguard Group.
(c) Tax Fees.
Fiscal Year Ended September 30, 2007: $215,900
Fiscal Year Ended September 30, 2006: $101,300
Includes fees billed in connection with tax compliance, planning and advice services provided to the Registrant, The Vanguard Group, Inc., Vanguard Marketing Corporation, and other registered investment companies in the Vanguard Group and related to income and excise taxes.
(d) All Other Fees.
Fiscal Year Ended September 30, 2007: $0
Fiscal Year Ended September 30, 2006: $0
Includes fees billed for services related to risk management and privacy matters. Services were provided to the Registrant, The Vanguard Group, Inc., Vanguard Marketing Corporation, and other registered investment companies in the Vanguard Group.
(e) (1) Pre-Approval Policies. The policy of the Registrant’s Audit Committee is to consider and, if appropriate, approve before the principal accountant is engaged for such services, all specific audit and non-audit services provided to: (1) the Registrant; (2) The Vanguard Group, Inc.; (3) other entities controlled by The Vanguard Group, Inc. that provide ongoing services to the Registrant; and (4) other registered investment companies in the Vanguard Group. In making a determination, the Audit Committee considers whether the services are consistent with maintaining the principal accountant’s independence.
In the event of a contingency situation in which the principal accountant is needed to provide services in between scheduled Audit Committee meetings, the Chairman of the Audit Committee would be called on to consider and, if appropriate, pre-approve audit or permitted non-audit services in an amount sufficient to complete services through the next Audit Committee meeting, and to determine if such services would be consistent with maintaining the accountant’s independence. At the next scheduled Audit Committee meeting, services and fees would be presented to the Audit Committee for formal consideration, and, if appropriate, approval by the entire Audit Committee. The Audit Committee would again consider whether such services and fees are consistent with maintaining the principal accountant’s independence.
The Registrant’s Audit Committee is informed at least annually of all audit and non-audit services provided by the principal accountant to the Vanguard complex, whether such services are provided to: (1) the Registrant; (2) The Vanguard Group, Inc.; (3) other entities controlled by The Vanguard Group, Inc. that provide ongoing services to the Registrant; or (4) other registered investment companies in the Vanguard Group.
(2) No percentage of the principal accountant’s fees or services were approved pursuant to the waiver provision of paragraph (c)(7)(i)(C) of Rule 2-01 of Regulation S-X.
(f) For the most recent fiscal year, over 50% of the hours worked under the principal accountant’s engagement were not performed by persons other than full-time, permanent employees of the principal accountant.
(g) Aggregate Non-Audit Fees.
Fiscal Year Ended September 30, 2007: $215,900
Fiscal Year Ended September 30, 2006: $101,300
Includes fees billed for non-audit services provided to the Registrant, The Vanguard Group, Inc., Vanguard Marketing Corporation, and other registered investment companies in the Vanguard Group.
(h) For the most recent fiscal year, the Audit Committee has determined that the provision of all non-audit services was consistent with maintaining the principal accountant’s independence.
Item 5: Not Applicable.
Item 6: Not Applicable.
Item 7: Not Applicable.
Item 8: Not Applicable.
Item 9: Not Applicable.
Item 10: Not Applicable.
Item 11: Controls and Procedures.
(a) Disclosure Controls and Procedures. The Principal Executive and Financial Officers concluded that the Registrant's Disclosure Controls and Procedures are effective based on their evaluation of the Disclosure Controls and Procedures as of a date within 90 days of the filing date of this report.
(b) Internal Control Over Financial Reporting. There were no significant changes in Registrant’s Internal Control Over Financial Reporting or in other factors that could significantly affect this control subsequent to the date of the evaluation, including any corrective actions with regard to significant deficiencies and material weaknesses.
Item 12: Exhibits.
| (a) | Code of Ethics. |
| (b) | Certifications. |
Pursuant to the requirements of the Securities Exchange Act of 1934 and the Investment Company Act of 1940, the registrant has duly caused this report to be signed on its behalf by the undersigned, thereunto duly authorized.
| VANGUARD FENWAY FUNDS |
|
|
By: | (signature) |
| (HEIDI STAM) |
| JOHN J. BRENNAN* |
| CHIEF EXECUTIVE OFFICER |
|
|
Date: November 14, 2007 | |
Pursuant to the requirements of the Securities Exchange Act of 1934 and the Investment Company Act of 1940, this report has been signed below by the following persons on behalf of the registrant and in the capacities and on the dates indicated.
| VANGUARD FENWAY FUNDS |
|
|
By: | (signature) |
| (HEIDI STAM) |
| JOHN J. BRENNAN* |
| CHIEF EXECUTIVE OFFICER |
|
|
Date: November 14, 2007 | |
| VANGUARD FENWAY FUNDS |
|
|
By: | (signature) |
| (HEIDI STAM) |
| THOMAS J. HIGGINS |
| TREASURER |
|
|
Date: November 14, 2007 | |
*By Power of Attorney. See File Number 333-145624, filed on August 22, 2007. Incorporated by Reference.