UNITED STATES
SECURITIES AND EXCHANGE COMMISSION
Washington, D.C. 20549
FORM N-CSR
CERTIFIED SHAREHOLDER REPORT OF REGISTERED
MANAGEMENT INVESTMENT COMPANIES
| | |
Investment Company Act file number | | 811-05426 |
AIM Investment Funds (Invesco Investment Funds)
(Exact name of registrant as specified in charter)
11 Greenway Plaza, Suite 1000 Houston, Texas 77046
(Address of principal executive offices) (Zip code)
Sheri Morris 11 Greenway Plaza, Suite 1000 Houston, Texas 77046
(Name and address of agent for service)
| | | | |
| Registrant’s telephone number, including area code: | | (713) 626-1919 | | |
| | | | | | |
| Date of fiscal year end: | | 10/31 | | | | |
| | | |
| Date of reporting period: | | 10/31/22 | | | | |
| ITEM 1. | REPORTS TO STOCKHOLDERS. |
(a) The Registrant’s annual report transmitted to shareholders pursuant to Rule 30e-1 under the Investment Company Act of 1940 is as follows:
(b) Not applicable.

| | |
| | |
| Annual Report to Shareholders | | October 31, 2022 |
Invesco Balanced-Risk Allocation Fund
Nasdaq:
A: ABRZX ∎ C: ABRCX ∎ R: ABRRX ∎ Y: ABRYX ∎ R5: ABRIX ∎ R6: ALLFX
Management’s Discussion of Fund Performance
| | | | |
| |
Performance summary | |
For the fiscal year ended October 31, 2022, Class A shares of Invesco Balanced-Risk Allocation Fund (the Fund), at net asset value (NAV), outperformed the Custom Invesco Balanced-Risk Allocation Style Index, the Fund’s style-specific benchmark. | |
Your Fund’s long-term performance appears later in this report. | |
| |
Fund vs. Indexes | |
Total returns, 10/31/21 to 10/31/22, at net asset value (NAV). Performance shown does not include applicable contingent deferred sales charges (CDSC) or front-end sales charges, which would have reduced performance. | |
Class A Shares | | | -13.99 | % |
Class C Shares | | | -14.57 | |
Class R Shares | | | -14.21 | |
Class Y Shares | | | -13.78 | |
Class R5 Shares | | | -13.72 | |
Class R6 Shares | | | -13.69 | |
S&P 500 Index▼ (Broad Market Index) | | | -14.61 | |
Custom Invesco Balanced-Risk Allocation Style Index∎ (Style-Specific Index) | | | -16.98 | |
Lipper Alternative Global Macro Funds Index¨ (Peer Group Index) | | | -11.64 | |
| |
Source(s): ▼RIMES Technologies Corp.; ∎Invesco, RIMES Technologies Corp.; ¨Lipper Inc. | | | | |
Market conditions and your Fund
For the fiscal year ended October 31, 2022, the Fund at NAV reported negative absolute performance as two of the macro factors in which the Fund invests: growth (equities) and defensive (fixed-income) detracted from Fund performance. The Fund invests in derivatives, such as swaps, options, and futures, which are expected to correspond to the performance of US and international fixed-income, equity and commodity markets. The strategic allocation portion of the investment process involves first selecting representative assets for each asset class from a universe of more than 50 assets. Next, we seek to construct the portfolio so that an approximately equal amount of risk comes from our three asset classes: growth (equities), defensive (fixed-income) and real return (commodities). Tactical adjustments to the Fund’s portfolio are then made on a monthly basis to try and take advantage of short-term market dynamics.
The Fund’s strategic exposure to the growth macro factor, obtained through the use of swaps and futures, detracted from results for the fiscal year, with five of the six markets in which the Fund invests delivering negative returns as a consequence of the resurgence of inflation and central bank efforts to combat the strongest rise in prices in decades. Amongst the equity markets that the Fund invests in, only the UK was able to post positive results as the sector make-up of that market had a higher exposure to sectors that performed well in this environment including energy and staples. Japan equities were a very mild detractor as the Bank of Japan (BOJ) bucked the trend of other central banks by not raising rates and maintaining a very accommodative policy. US large- and small-caps fell over the fiscal year both as a result of aggressive hiking by the US Federal
Reserve as well as a sector make-up that tilted toward growth-oriented sectors like technology, which were relative underperformers. European equities fell on rate hikes and inflationary pressures as well as the war between Russia and Ukraine, which has raised fears of energy security and the follow through impact on economic activity. Emerging markets were the lead detractor from the Fund’s absolute performance within the growth macro factor largely on the poor performance of China, which continues to struggle with COVID-19 outbreaks and economic shutdowns resulting from their zero COVID-19 policy. Tactical shifts in the Fund’s positioning through the fiscal year proved difficult as there was no persistent performance month-to-month, which made getting on the right side of the trend a challenge.
The Fund’s strategic exposure to the real return macro factor, obtained through the use of swaps, futures and commodity-linked notes contributed to the Fund’s absolute performance for the fiscal year. Our motivation for holding commodities has been to help offset weakness in equity and fixed-income performance during periods of unexpected inflation. In aggregate, that is the result we achieved even though performance was mixed across the commodity complexes. Contribution to returns was led by the energy complex as prices for oil, distillates and natural gas all rose over the fiscal year. The price behavior for energy was spurred not only by tight supply issues stemming from longstanding underinvestment and the additional pressures brought through Russia’s invasion of Ukraine, but also on what has been steady demand. Agricultural commodities also bolstered results as adverse weather impacted crops such as the soy complex and corn. Corn prices also saw an increase from the Russia/ Ukraine war in that Ukraine is a major producer
of corn along its border with Russia and as grain embargoes were put into place. Metals did not fare as well over the fiscal year. Concerns that the aggressive central bank hiking would plunge economies into recession led to demand destruction for industrial metals like aluminum and copper, both of which saw prices fall. Gold and silver prices also fell on a combination of a strong dollar and higher real rates. Tactical shifts over the fiscal year in the real return macro factor produced modest losses for the Fund as strong early period commodity performance became volatile later in the fiscal year creating whipsaw losses.
The Fund’s strategic exposure to the defensive macro factor, obtained through the use of swaps and futures, was the largest detractor from the Fund’s absolute performance during the fiscal year due to a combination of strong inflation readings and aggressive actions by central banks. Japan government bonds were the top performer among the Fund’s defensive macro factor holdings, turning in a flat result for the fiscal year. The BOJ’s approach of not joining other major central banks in raising rates in the fiscal year and lower inflation readings than the rest of the world left yields relatively unchanged over the fiscal year. The remaining bond markets in which the Fund invests, including Australia, Canada, UK, US and Germany, generated losses as their respective central banks hiked rates to the highest levels in at least a decade and as inflation climbed to the highest readings in several decades. Periods of high inflation and higher rates are damaging to bond returns as their fixed coupon payments become less attractive, which has a downward impact on bond prices. Tactical shifts in the defense macro factor produced gains for the Fund in the fiscal year as factors such as the rising inflation and rate environment led our models to be underweight in these exposures.
Please note that our strategy is principally implemented with derivative instruments that include futures, options, commodity-linked notes and total return swaps. Therefore, all or most of the performance of the strategy, both positive and negative, can be attributed to these instruments. Derivatives can be a cost-effective way to gain exposure to asset classes. However, derivatives may amplify traditional investment risks through the creation of leverage and may be less liquid than traditional securities.
Thank you for your continued investment in Invesco Balanced-Risk Allocation Fund. As always, we welcome your comments and questions.
Portfolio manager(s):
Mark Ahnrud
John Burrello
Chris Devine
Scott Hixon
Christian Ulrich
| | |
| 2 | | Invesco Balanced-Risk Allocation Fund |
Scott Wolle
The views and opinions expressed in management’s discussion of Fund performance are those of Invesco Advisers, Inc. and its affiliates. These views and opinions are subject to change at any time based on factors such as market and economic conditions. These views and opinions may not be relied upon as investment advice or recommendations, or as an offer for a particular security. The information is not a complete analysis of every aspect of any market, country, industry, security or the Fund. Statements of fact are from sources considered reliable, but Invesco Advisers, Inc. makes no representation or warranty as to their completeness or accuracy. Although historical performance is no guarantee of future results, these insights may help you understand our investment management philosophy.
| | |
| 3 | | Invesco Balanced-Risk Allocation Fund |
Your Fund’s Long-Term Performance
Results of a $10,000 Investment – Oldest Share Class(es)
Fund and index data from 10/31/12
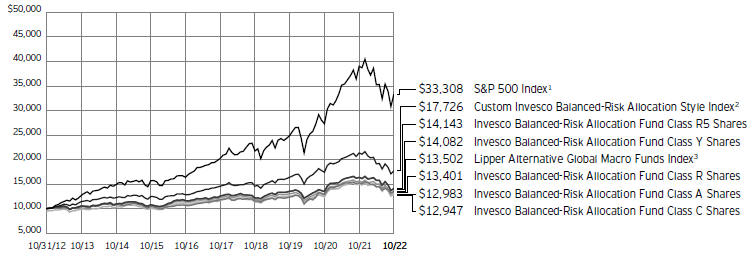
1 Source: RIMES Technologies Corp.
2 Source: Invesco, RIMES Technologies Corp.
3 Source: Lipper Inc.
Past performance cannot guarantee future results.
The data shown in the chart include reinvested distributions, applicable sales charges and Fund expenses including management
fees. Index results include reinvested dividends, but they do not reflect sales charges. Performance of the peer group, if applicable, reflects fund expenses and management fees;
performance of a market index does not. Performance shown in the chart does not reflect deduction of taxes a shareholder would pay on Fund distributions or sale of Fund shares.
| | |
| 4 | | Invesco Balanced-Risk Allocation Fund |
| | | | |
| |
Average Annual Total Returns | |
As of 10/31/22, including maximum applicable sales charges | |
Class A Shares | | | | |
Inception (6/2/09) | | | 5.07 | % |
10 Years | | | 2.64 | |
5 Years | | | 0.91 | |
1 Year | | | -18.69 | |
Class C Shares | | | | |
Inception (6/2/09) | | | 5.03 | % |
10 Years | | | 2.62 | |
5 Years | | | 1.32 | |
1 Year | | | -15.25 | |
Class R Shares | | | | |
Inception (6/2/09) | | | 5.24 | % |
10 Years | | | 2.97 | |
5 Years | | | 1.80 | |
1 Year | | | -14.21 | |
Class Y Shares | | | | |
Inception (6/2/09) | | | 5.78 | % |
10 Years | | | 3.48 | |
5 Years | | | 2.31 | |
1 Year | | | -13.78 | |
Class R5 Shares | | | | |
Inception (6/2/09) | | | 5.81 | % |
10 Years | | | 3.53 | |
5 Years | | | 2.35 | |
1 Year | | | -13.72 | |
Class R6 Shares | | | | |
Inception (9/24/12) | | | 3.45 | % |
10 Years | | | 3.61 | |
5 Years | | | 2.44 | |
1 Year | | | -13.69 | |
The performance data quoted represent past performance and cannot guarantee future results; current performance may be lower or higher. Please visit invesco.com/performance for the most recent month-end performance. Performance figures reflect reinvested distributions, changes in net asset value and the effect of the maximum sales charge unless otherwise stated. Performance figures do not reflect deduction of taxes a shareholder would pay on Fund distributions or sale of Fund shares. Investment return and principal value will fluctuate so that you may have a gain or loss when you sell shares.
Class A share performance reflects the maximum 5.50% sales charge, and Class C share performance reflects the applicable contingent deferred sales charge (CDSC) for the period involved. The CDSC on Class C shares is 1% for the first year after purchase. Class R, Class Y, Class R5 and Class R6 shares do not have a front-end sales charge or a CDSC; therefore, performance is at net asset value.
The performance of the Fund’s share classes will differ primarily due to different sales charge structures and class expenses.
Fund performance reflects any applicable fee waivers and/or expense reimbursements. Had the adviser not waived fees
and/or reimbursed expenses currently or in the past, returns would have been lower. See current prospectus for more information.
| | |
| 5 | | Invesco Balanced-Risk Allocation Fund |
Supplemental Information
Invesco Balanced-Risk Allocation Fund’s investment objective is to provide total return with a low to moderate correlation to traditional financial market indices.
| ∎ | Unless otherwise stated, information presented in this report is as of October 31, 2022, and is based on total net assets. |
| ∎ | Unless otherwise noted, all data is provided by Invesco. |
| ∎ | To access your Fund’s reports/prospectus, visit invesco.com/fundreports. |
About indexes used in this report
| ∎ | The S&P 500® Index is an unmanaged index considered representative of the US stock market. |
| ∎ | The Custom Invesco Balanced-Risk Allocation Style Index is composed of 60% MSCI World Index and 40% Bloomberg U.S. Aggregate Bond Index. Effective December 1, 2009, the fixed income component of the Custom Balanced-Risk Allocation Style Index changed from the JP Morgan GBI Global (Traded) Index to the Bloomberg U.S. Aggregate Bond Index. The MSCI World Index is considered representative of stocks of developed countries. The index return is computed using the net return, which withholds applicable taxes for non-resident investors. The Bloomberg U.S. Aggregate Bond Index is considered representative of the US investment-grade, fixed-rate bond market. The JP Morgan GBI Global (Traded) Index is considered representative of fixed-rate debt of developed government bond markets. |
| ∎ | The Lipper Alternative Global Macro Funds Index is an unmanaged index considered representative of alternative global macro funds tracked by Lipper. |
| ∎ | The Fund is not managed to track the performance of any particular index, including the index(es) described here, and consequently, the performance of the Fund may deviate significantly from the performance of the index(es). |
| ∎ | A direct investment cannot be made in an index. Unless otherwise indicated, index results include reinvested dividends, and they do not reflect sales charges. Performance of the peer group, if applicable, reflects fund expenses; performance of a market index does not. |
|
|
This report must be accompanied or preceded by a currently effective Fund prospectus, which contains more complete information, including sales charges and expenses. Investors should read it carefully before investing. |
|
| NOT FDIC INSURED | MAY LOSE VALUE | NO BANK GUARANTEE |
| | |
| 6 | | Invesco Balanced-Risk Allocation Fund |
Fund Information
Target Risk Contribution and Notional Asset Weights as of October 31, 2022
| | | | | | | | | | |
| Asset Class | | Target Risk Contribution* | | Notional
Asset
Weights** |
Equities and Options | | | | 25.72 | % | | | | 44.99 | % |
Fixed Income | | | | 36.59 | | | | | 68.32 | |
Commodities | | | | 37.69 | | | | | 25.49 | |
Total | | | | 100.00 | % | | | | 138.80 | % |
| * | Reflects the risk that each asset class is expected to contribute to the overall risk of the Fund as measured by standard deviation and estimates of risk based on historical data. Standard deviation measures the annualized fluctuations (volatility) of monthly returns. |
| ** | Proprietary models determine the Notional Asset Weights necessary to achieve the Target Risk Contributions. Total Notional Asset Weight greater than 100% is achieved through derivatives and other instruments that create leverage. |
| | |
| 7 | | Invesco Balanced-Risk Allocation Fund |
Consolidated Schedule of Investments
October 31, 2022
| | | | | | | | | | | | | | | | |
| | | Interest Rate | | | Maturity Date | | | Principal Amount (000) | | | Value | |
|
| |
U.S. Treasury Securities–34.46% | | | | | | | | | | | | | | | | |
U.S. Treasury Bills–13.69%(a) | | | | | | | | | | | | | | | | |
U.S. Treasury Bills | | | 1.71 | % | | | 12/08/2022 | | | $ | 95,800 | | | $ | 95,630,647 | |
|
| |
U.S. Treasury Bills | | | 2.84 | % | | | 01/26/2023 | | | | 91,000 | | | | 90,134,249 | |
|
| |
U.S. Treasury Bills | | | 3.39 | % | | | 03/09/2023 | | | | 63,400 | | | | 62,457,735 | |
|
| |
| | | | | | | | | | | | | | | 248,222,631 | |
|
| |
| | | | |
U.S. Treasury Floating Rate Notes–20.77% | | | | | | | | | | | | | | | | |
U.S. Treasury Floating Rate Notes (3 mo. U.S. Treasury Bill Money Market Yield Rate - 0.02%)(b) | | | 4.09 | % | | | 01/31/2024 | | | | 114,500 | | | | 114,487,008 | |
|
| |
U.S. Treasury Floating Rate Notes (3 mo. U.S. Treasury Bill Money Market Yield Rate - 0.08%)(b) | | | 4.04 | % | | | 04/30/2024 | | | | 128,300 | | | | 128,113,689 | |
|
| |
U.S. Treasury Floating Rate Notes (3 mo. U.S. Treasury Bill Money Market Yield Rate + 0.04%)(b) | | | 4.15 | % | | | 07/31/2024 | | | | 134,000 | | | | 133,869,651 | |
|
| |
| | | | | | | | | | | | | | | 376,470,348 | |
|
| |
Total U.S. Treasury Securities (Cost $625,471,229) | | | | | | | | | | | | | | | 624,692,979 | |
|
| |
| | | | |
| | | | | | Expiration
Date | | | | | | | |
Commodity-Linked Securities–3.77% | | | | | | | | | | | | | | | | |
Canadian Imperial Bank of Commerce EMTN, U.S. Federal Funds Effective Rate minus 0.02% (linked to the Canadian Imperial Bank of Commerce Custom 7 Agriculture Commodity Index, multiplied by 2) (Canada)(c)(d) | | | | | | | 11/30/2022 | | | | 22,850 | | | | 32,296,681 | |
|
| |
RBC Capital Markets LLC, Commodity-Linked Notes, U.S. Federal Funds Effective Rate minus 0.04% (linked to the RBC Enhanced Agricultural Basket 07 Excess Return Index) (Canada)(c)(d) | | | | | | | 12/05/2022 | | | | 25,600 | | | | 36,062,128 | |
|
| |
Total Commodity-Linked Securities (Cost $61,278,726) | | | | | | | | | | | | | | | 68,358,809 | |
|
| |
| | | | |
| | | | | | | | | Shares | | | | |
Money Market Funds–53.89% | | | | | | | | | | | | | | | | |
Invesco Government & Agency Portfolio, Institutional Class, 3.07%(e)(f) | | | | | | | | | | | 263,828,894 | | | | 263,828,894 | |
|
| |
Invesco Liquid Assets Portfolio, Institutional Class, 3.03%(e)(f) | | | | | | | | | | | 60,960,429 | | | | 60,972,621 | |
|
| |
Invesco Liquidity Funds PLC, Invesco US Dollar Liquidity Portfolio (Ireland), Institutional Class, 3.16%(e)(f) | | | | | | | | | | | 174,522,956 | | | | 174,522,956 | |
|
| |
Invesco Treasury Obligations Portfolio, Institutional Class, 3.12%(e)(f) | | | | | | | | | | | 380,000,000 | | | | 380,000,000 | |
|
| |
Invesco Treasury Portfolio, Institutional Class, 3.08%(e)(f) | | | | | | | | | | | 97,546,164 | | | | 97,546,164 | |
|
| |
Total Money Market Funds (Cost $976,864,608) | | | | | | | | | | | | | | | 976,870,635 | |
|
| |
| | | | |
Options Purchased–1.84% | | | | | | | | | | | | | | | | |
(Cost $26,462,914)(g) | | | | | | | | | | | | | | | 33,248,201 | |
|
| |
TOTAL INVESTMENTS IN SECURITIES–93.96% (Cost $1,690,077,477) | | | | | | | | | | | | | | | 1,703,170,624 | |
|
| |
OTHER ASSETS LESS LIABILITIES–6.04% | | | | | | | | | | | | | | | 109,426,676 | |
|
| |
NET ASSETS–100.00% | | | | | | | | | | | | | | $ | 1,812,597,300 | |
|
| |
Investment Abbreviations:
EMTN – European Medium-Term Notes
See accompanying Notes to Consolidated Financial Statements which are an integral part of the financial statements.
| | |
| 8 | | Invesco Balanced-Risk Allocation Fund |
Notes to Consolidated Schedule of Investments:
| (a) | Security traded on a discount basis. The interest rate shown represents the discount rate at the time of purchase by the Fund. |
| (b) | Interest or dividend rate is redetermined periodically. Rate shown is the rate in effect on October 31, 2022. |
| (c) | Security purchased or received in a transaction exempt from registration under the Securities Act of 1933, as amended (the “1933 Act”). The security may be resold pursuant to an exemption from registration under the 1933 Act, typically to qualified institutional buyers. The aggregate value of these securities at October 31, 2022 was $68,358,809, which represented 3.77% of the Fund’s Net Assets. |
| (d) | The Reference Entity Components table below includes additional information regarding the underlying components of certain reference entities that are not publicly available. |
| (e) | Affiliated issuer. The issuer and/or the Fund is a wholly-owned subsidiary of Invesco Ltd., or is affiliated by having an investment adviser that is under common control of Invesco Ltd. The table below shows the Fund’s transactions in, and earnings from, its investments in affiliates for the fiscal year ended October 31, 2022. |
| | | | | | | | | | | | | | | | | | | | | | | | | | | | |
| | | Value
October 31, 2021 | | | Purchases at Cost | | | Proceeds from Sales | | | Change in
Unrealized
Appreciation
(Depreciation) | | | Realized
Gain | | | Value
October 31, 2022 | | | Dividend Income | |
| | | | | | | |
| Investments in Affiliated Money Market Funds: | | | | | | | | | | | | | | | | | | | | | | | | | | | | |
| | | | | | | |
Invesco Government & Agency Portfolio, Institutional Class | | $ | 389,413,824 | | | $ | 727,002,206 | | | $ | (852,587,136 | ) | | $ | - | | | $ | - | | | | $263,828,894 | | | | $2,454,884 | |
| | | | | | | |
Invesco Liquid Assets Portfolio, Institutional Class | | | 129,916,815 | | | | 519,287,290 | | | | (588,207,517 | ) | | | (95,866 | ) | | | 71,899 | | | | 60,972,621 | | | | 643,279 | |
| | | | | | | |
Invesco Liquidity Funds PLC, Invesco US Dollar Liquidity Portfolio, Institutional Class | | | 143,068,345 | | | | 1,043,364,213 | | | | (1,011,909,602 | ) | | | - | | | | - | | | | 174,522,956 | | | | 1,639,040 | |
| | | | | | | |
Invesco Treasury Obligations Portfolio, Institutional Class | | | 524,000,000 | | | | - | | | | (144,000,000 | ) | | | - | | | | - | | | | 380,000,000 | | | | 3,670,414 | |
| | | | | | | |
Invesco Treasury Portfolio, Institutional | | | | | | | | | | | | | | | | | | | | | | | | | | | | |
| | | | | | | |
Class | | | 156,128,941 | | | | 830,859,664 | | | | (889,442,441 | ) | | | - | | | | - | | | | 97,546,164 | | | | 531,848 | |
| | | | | | | |
Total | | $ | 1,342,527,925 | | | $ | 3,120,513,373 | | | $ | (3,486,146,696 | ) | | $ | (95,866 | ) | | $ | 71,899 | | | | $976,870,635 | | | | $8,939,465 | |
| (f) | The rate shown is the 7-day SEC standardized yield as of October 31, 2022. |
| (g) | The table below details options purchased. |
Open Exchange-Traded Index Options Purchased
| | | | | | | | | | | | | | | | | | | | | | | | | | | | | | |
| Description | | Type of
Contract | | | Expiration
Date | | | Number of
Contracts | | | Exercise Price | | | Notional Value* | | | Value |
Equity Risk | | | | | | | | | | | | | | | | | | | | | | | | | | | | | | |
EURO STOXX 50 Index | | | Put | | | | 12/16/2022 | | | | 120 | | | | EUR | | | | 3,800.00 | | | | EUR | | | | 4,560,000 | | | $ 263,863 |
EURO STOXX 50 Index | | | Put | | | | 12/16/2022 | | | | 120 | | | | EUR | | | | 3,900.00 | | | | EUR | | | | 4,680,000 | | | 357,193 |
EURO STOXX 50 Index | | | Put | | | | 05/19/2023 | | | | 120 | | | | EUR | | | | 3,500.00 | | | | EUR | | | | 4,200,000 | | | 241,686 |
EURO STOXX 50 Index | | | Put | | | | 06/16/2023 | | | | 130 | | | | EUR | | | | 3,600.00 | | | | EUR | | | | 4,680,000 | | | 336,855 |
EURO STOXX 50 Index | | | Put | | | | 07/21/2023 | | | | 120 | | | | EUR | | | | 3,400.00 | | | | EUR | | | | 4,080,000 | | | 238,484 |
EURO STOXX 50 Index | | | Put | | | | 08/18/2023 | | | | 130 | | | | EUR | | | | 3,500.00 | | | | EUR | | | | 4,550,000 | | | 320,796 |
EURO STOXX 50 Index | | | Put | | | | 09/15/2023 | | | | 120 | | | | EUR | | | | 3,350.00 | | | | EUR | | | | 4,020,000 | | | 245,600 |
EURO STOXX 50 Index | | | Put | | | | 10/20/2023 | | | | 120 | | | | EUR | | | | 3,200.00 | | | | EUR | | | | 3,840,000 | | | 209,548 |
EURO STOXX 50 Index | | | Put | | | | 03/17/2023 | | | | 130 | | | | EUR | | | | 4,150.00 | | | | EUR | | | | 5,395,000 | | | 704,029 |
EURO STOXX 50 Index | | | Put | | | | 01/20/2023 | | | | 130 | | | | EUR | | | | 4,000.00 | | | | EUR | | | | 5,200,000 | | | 516,716 |
EURO STOXX 50 Index | | | Put | | | | 02/17/2023 | | | | 120 | | | | EUR | | | | 3,600.00 | | | | EUR | | | | 4,320,000 | | | 198,520 |
EURO STOXX 50 Index | | | Put | | | | 04/21/2023 | | | | 120 | | | | EUR | | | | 3,700.00 | | | | EUR | | | | 4,440,000 | | | 306,555 |
FTSE 100 Index | | | Put | | | | 05/19/2023 | | | | 50 | | | | GBP | | | | 7,225.00 | | | | GBP | | | | 3,612,500 | | | 230,507 |
FTSE 100 Index | | | Put | | | | 06/16/2023 | | | | 50 | | | | GBP | | | | 7,375.00 | | | | GBP | | | | 3,687,500 | | | 286,700 |
FTSE 100 Index | | | Put | | | | 07/21/2023 | | | | 50 | | | | GBP | | | | 6,950.00 | | | | GBP | | | | 3,475,000 | | | 199,830 |
FTSE 100 Index | | | Put | | | | 08/18/2023 | | | | 50 | | | | GBP | | | | 7,200.00 | | | | GBP | | | | 3,600,000 | | | 267,204 |
FTSE 100 Index | | | Put | | | | 09/15/2023 | | | | 50 | | | | GBP | | | | 7,000.00 | | | | GBP | | | | 3,500,000 | | | 230,220 |
FTSE 100 Index | | | Put | | | | 10/20/2023 | | | | 50 | | | | GBP | | | | 6,800.00 | | | | GBP | | | | 3,400,000 | | | 207,571 |
FTSE 100 Index | | | Put | | | | 11/18/2022 | | | | 50 | | | | GBP | | | | 6,900.00 | | | | GBP | | | | 3,450,000 | | | 22,936 |
FTSE 100 Index | | | Put | | | | 12/16/2022 | | | | 50 | | | | GBP | | | | 6,800.00 | | | | GBP | | | | 3,400,000 | | | 38,131 |
FTSE 100 Index | | | Put | | | | 01/20/2023 | | | | 50 | | | | GBP | | | | 7,350.00 | | | | GBP | | | | 3,675,000 | | | 192,089 |
FTSE 100 Index | | | Put | | | | 02/17/2023 | | | | 50 | | | | GBP | | | | 7,175.00 | | | | GBP | | | | 3,587,500 | | | 160,552 |
FTSE 100 Index | | | Put | | | | 03/17/2023 | | | | 50 | | | | GBP | | | | 7,025.00 | | | | GBP | | | | 3,512,500 | | | 148,797 |
FTSE 100 Index | | | Put | | | | 04/21/2023 | | | | 50 | | | | GBP | | | | 7,250.00 | | | | GBP | | | | 3,625,000 | | | 221,906 |
See accompanying Notes to Consolidated Financial Statements which are an integral part of the financial statements.
| | |
| 9 | | Invesco Balanced-Risk Allocation Fund |
Open Exchange-Traded Index Options Purchased–(continued)
| | | | | | | | | | | | | | | | | | | | | | | | |
| Description | | Type of
Contract | | Expiration
Date | | Number of
Contracts | | Exercise Price | | | Notional Value* | | | Value |
MSCI Emerging Markets Index | | Put | | 04/21/2023 | | 75 | | | USD | | | | 1,110.00 | | | | USD | | | | 8,325,000 | | | $ 1,888,125 |
MSCI Emerging Markets Index | | Put | | 05/19/2023 | | 75 | | | USD | | | | 1,030.00 | | | | USD | | | | 7,725,000 | | | 1,336,875 |
MSCI Emerging Markets Index | | Put | | 06/16/2023 | | 75 | | | USD | | | | 1,030.00 | | | | USD | | | | 7,725,000 | | | 1,362,750 |
MSCI Emerging Markets Index | | Put | | 07/21/2023 | | 70 | | | USD | | | | 975.00 | | | | USD | | | | 6,825,000 | | | 994,700 |
MSCI Emerging Markets Index | | Put | | 08/18/2023 | | 70 | | | USD | | | | 970.00 | | | | USD | | | | 6,790,000 | | | 987,350 |
MSCI Emerging Markets Index | | Put | | 09/15/2023 | | 70 | | | USD | | | | 950.00 | | | | USD | | | | 6,650,000 | | | 926,800 |
MSCI Emerging Markets Index | | Put | | 10/20/2023 | | 70 | | | USD | | | | 850.00 | | | | USD | | | | 5,950,000 | | | 588,700 |
MSCI Emerging Markets Index | | Put | | 11/18/2022 | | 75 | | | USD | | | | 1,210.00 | | | | USD | | | | 9,075,000 | | | 2,600,250 |
MSCI Emerging Markets Index | | Put | | 12/16/2022 | | 75 | | | USD | | | | 1,170.00 | | | | USD | | | | 8,775,000 | | | 2,355,375 |
MSCI Emerging Markets Index | | Put | | 01/20/2023 | | 75 | | | USD | | | | 1,180.00 | | | | USD | | | | 8,850,000 | | | 2,410,875 |
MSCI Emerging Markets Index | | Put | | 02/17/2023 | | 75 | | | USD | | | | 1,170.00 | | | | USD | | | | 8,775,000 | | | 2,302,125 |
MSCI Emerging Markets Index | | Put | | 03/17/2023 | | 75 | | | USD | | | | 1,130.00 | | | | USD | | | | 8,475,000 | | | 1,999,500 |
Nikkei 225 Index | | Put | | 06/09/2023 | | 28 | | | JPY | | | | 25,500.00 | | | | JPY | | | | 714,000,000 | | | 218,434 |
Nikkei 225 Index | | Put | | 06/09/2023 | | 28 | | | JPY | | | | 26,000.00 | | | | JPY | | | | 728,000,000 | | | 248,562 |
Nikkei 225 Index | | Put | | 09/08/2023 | | 28 | | | JPY | | | | 25,750.00 | | | | JPY | | | | 721,000,000 | | | 297,522 |
Nikkei 225 Index | | Put | | 09/08/2023 | | 28 | | | JPY | | | | 26,500.00 | | | | JPY | | | | 742,000,000 | | | 350,247 |
Nikkei 225 Index | | Put | | 09/08/2023 | | 28 | | | JPY | | | | 27,750.00 | | | | JPY | | | | 777,000,000 | | | 457,581 |
Nikkei 225 Index | | Put | | 12/08/2023 | | 28 | | | JPY | | | | 25,000.00 | | | | JPY | | | | 700,000,000 | | | 310,703 |
Nikkei 225 Index | | Put | | 12/09/2022 | | 28 | | | JPY | | | | 27,250.00 | | | | JPY | | | | 763,000,000 | | | 115,808 |
Nikkei 225 Index | | Put | | 12/09/2022 | | 28 | | | JPY | | | | 26,750.00 | | | | JPY | | | | 749,000,000 | | | 82,854 |
Nikkei 225 Index | | Put | | 03/10/2023 | | 28 | | | JPY | | | | 28,500.00 | | | | JPY | | | | 798,000,000 | | | 357,779 |
Nikkei 225 Index | | Put | | 03/10/2023 | | 28 | | | JPY | | | | 25,500.00 | | | | JPY | | | | 714,000,000 | | | 139,346 |
Nikkei 225 Index | | Put | | 03/10/2023 | | 28 | | | JPY | | | | 25,750.00 | | | | JPY | | | | 721,000,000 | | | 151,585 |
Nikkei 225 Index | | Put | | 06/09/2023 | | 28 | | | JPY | | | | 27,250.00 | | | | JPY | | | | 763,000,000 | | | 340,832 |
S&P 500 Index | | Put | | 05/19/2023 | | 8 | | | USD | | | | 4,075.00 | | | | USD | | | | 3,260,000 | | | 270,840 |
S&P 500 Index | | Put | | 06/16/2023 | | 8 | | | USD | | | | 4,050.00 | | | | USD | | | | 3,240,000 | | | 270,840 |
S&P 500 Index | | Put | | 08/18/2023 | | 9 | | | USD | | | | 4,100.00 | | | | USD | | | | 3,690,000 | | | 347,310 |
S&P 500 Index | | Put | | 09/15/2023 | | 9 | | | USD | | | | 3,900.00 | | | | USD | | | | 3,510,000 | | | 278,190 |
S&P 500 Index | | Put | | 10/20/2023 | | 8 | | | USD | | | | 3,625.00 | | | | USD | | | | 2,900,000 | | | 182,440 |
S&P 500 Index | | Put | | 11/18/2022 | | 8 | | | USD | | | | 4,450.00 | | | | USD | | | | 3,560,000 | | | 459,320 |
S&P 500 Index | | Put | | 12/16/2022 | | 8 | | | USD | | | | 4,475.00 | | | | USD | | | | 3,580,000 | | | 474,400 |
S&P 500 Index | | Put | | 01/20/2023 | | 8 | | | USD | | | | 4,650.00 | | | | USD | | | | 3,720,000 | | | 599,640 |
S&P 500 Index | | Put | | 02/17/2023 | | 9 | | | USD | | | | 4,375.00 | | | | USD | | | | 3,937,500 | | | 450,495 |
S&P 500 Index | | Put | | 03/17/2023 | | 8 | | | USD | | | | 4,225.00 | | | | USD | | | | 3,380,000 | | | 319,080 |
S&P 500 Index | | Put | | 04/21/2023 | | 8 | | | USD | | | | 4,425.00 | | | | USD | | | | 3,540,000 | | | 439,840 |
S&P 500 Index | | Put | | 07/21/2023 | | 8 | | | USD | | | | 3,750.00 | | | | USD | | | | 3,000,000 | | | 184,840 |
Total Index Options Purchased | | | | | | | | | | | | | | | | | | | | | | | | $33,248,201 |
| * | Notional Value is calculated by multiplying the Number of Contracts by the Exercise Price by the multiplier. |
Open Futures Contracts(a)
| | | | | | | | | | | | | | | | | | | | |
|
| |
| Long Futures Contracts | | Number of
Contracts | | | Expiration
Month | | | Notional Value | | | Value | | | Unrealized
Appreciation
(Depreciation) | |
|
| |
Commodity Risk | | | | | | | | | | | | | | | | | | | | |
|
| |
Brent Crude | | | 426 | | | | December-2022 | | | $ | 38,774,520 | | | $ | 2,627,257 | | | $ | 2,627,257 | |
|
| |
Gasoline Reformulated Blendstock Oxygenate Blending | | | 392 | | | | November-2022 | | | | 41,583,125 | | | | 802,879 | | | | 802,879 | |
|
| |
Low Sulphur Gas Oil | | | 32 | | | | December-2022 | | | | 3,263,200 | | | | 282,777 | | | | 282,777 | |
|
| |
Natural Gas | | | 197 | | | | November-2022 | | | | 12,519,350 | | | | (3,507,892 | ) | | | (3,507,892 | ) |
|
| |
New York Harbor Ultra-Low Sulfur Diesel | | | 289 | | | | November-2022 | | | | 44,596,226 | | | | 2,307,068 | | | | 2,307,068 | |
|
| |
WTI Crude | | | 458 | | | | January-2023 | | | | 38,517,800 | | | | 547,869 | | | | 547,869 | |
|
| |
Subtotal | | | | | | | | | | | | | | | 3,059,958 | | | | 3,059,958 | |
|
| |
See accompanying Notes to Consolidated Financial Statements which are an integral part of the financial statements.
| | |
| 10 | | Invesco Balanced-Risk Allocation Fund |
Open Futures Contracts(a)–(continued)
| | | | | | | | | | | | | | | | | | | | |
|
| |
| Long Futures Contracts | | Number of
Contracts | | | Expiration
Month | | | Notional
Value | | | Value | | | Unrealized
Appreciation
(Depreciation) | |
|
| |
Equity Risk | | | | | | | | | | | | | | | | | | | | |
|
| |
E-Mini Russell 2000 Index | | | 1,010 | | | | December-2022 | | | $ | 93,576,500 | | | $ | (2,591,155 | ) | | $ | (2,591,155 | ) |
|
| |
EURO STOXX 50 Index | | | 30 | | | | December-2022 | | | | 1,072,646 | | | | (12,029 | ) | | | (12,029 | ) |
|
| |
FTSE 100 Index | | | 100 | | | | December-2022 | | | | 8,150,878 | | | | (424,740 | ) | | | (424,740 | ) |
|
| |
MSCI Emerging Markets Index | | | 740 | | | | December-2022 | | | | 31,583,200 | | | | (4,577,141 | ) | | | (4,577,141 | ) |
|
| |
Nikkei 225 Index | | | 63 | | | | December-2022 | | | | 11,672,551 | | | | 51,590 | | | | 51,590 | |
|
| |
Subtotal | | | | | | | | | | | | | | | (7,553,475 | ) | | | (7,553,475 | ) |
|
| |
Interest Rate Risk | | | | | | | | | | | | | | | | | | | | |
|
| |
Australia 10 Year Bonds | | | 3,815 | | | | December-2022 | | | | 289,126,538 | | | | (3,762,807 | ) | | | (3,762,807 | ) |
|
| |
Canada 10 Year Bonds | | | 2,965 | | | | December-2022 | | | | 267,760,818 | | | | (4,127,680 | ) | | | (4,127,680 | ) |
|
| |
Euro-Bund | | | 1,382 | | | | December-2022 | | | | 189,075,967 | | | | (9,547,674 | ) | | | (9,547,674 | ) |
|
| |
Japan 10 Year Bonds | | | 137 | | | | December-2022 | | | | 137,069,101 | | | | 156,456 | | | | 156,456 | |
|
| |
Long Gilt | | | 2,085 | | | | December-2022 | | | | 244,200,692 | | | | (13,668,873 | ) | | | (13,668,873 | ) |
|
| |
U.S. Treasury Long Bonds | | | 893 | | | | December-2022 | | | | 107,606,500 | | | | (13,139,466 | ) | | | (13,139,466 | ) |
|
| |
Subtotal | | | | | | | | | | | | | | | (44,090,044 | ) | | | (44,090,044 | ) |
|
| |
Subtotal–Long Futures Contracts | | | | | | | | | | | | | | | (48,583,561 | ) | | | (48,583,561 | ) |
|
| |
| | | | | |
Short Futures Contracts | | | | | | | | | | | | | | | | | | | | |
|
| |
Equity Risk | | | | | | | | | | | | | | | | | | | | |
|
| |
E-Mini S&P 500 Index | | | 104 | | | | December-2022 | | | | (20,191,600 | ) | | | (1,095,452 | ) | | | (1,095,452 | ) |
|
| |
Total Futures Contracts | | | | | | | | | | | | | | $ | (49,679,013 | ) | | $ | (49,679,013 | ) |
|
| |
| (a) | Futures contracts collateralized by $65,895,001 cash held with Merrill Lynch International, the futures commission merchant. |
Open Over-The-Counter Total Return Swap Agreements(a)(b)
| | | | | | | | | | | | | | | | | | | | | | | | | | | | | | | | | | |
| Counterparty | | Pay/
Receive | | Reference Entity(c) | | Fixed Rate | | | Payment Frequency | | Number of Contracts | | | Maturity Date | | Notional Value | | | Upfront
Payments
Paid
(Received) | | Value | | | Unrealized
Appreciation
(Depreciation) | |
Commodity Risk | | | | | | | | | | | | | | | | | | | | | | | | | | | | | | | | | | |
J.P. Morgan Chase Bank, N.A. | | Receive | | J.P. Morgan Contag Beta Gas Oil Excess Return Index | | | 0.25 | % | | Monthly | | | 94,300 | | | March-2023 | | | USD | | | | 41,198,472 | | | $– | | $ | 284,758 | | | $ | 284,758 | |
Merrill Lynch International | | Receive | | MLCX Natural Gas Annual Excess Return Index | | | 0.25 | | | Monthly | | | 151,000 | | | June-2023 | | | USD | | | | 20,070,074 | | | – | | | 0 | | | | 0 | |
Morgan Stanley Capital Services LLC | | Receive | | S&P GSCI Aluminum Dynamic Index Excess Return | | | 0.30 | | | Monthly | | | 78,000 | | | July-2023 | | | USD | | | | 8,112,101 | | | – | | | 8,174 | | | | 8,174 | |
Royal Bank of Canada | | Receive | | RBC Enhanced Agricultural Basket 07 Excess Return Index | | | 0.35 | | | Monthly | | | 235,000 | | | May-2023 | | | USD | | | | 30,391,869 | | | – | | | 0 | | | | 0 | |
Subtotal – Appreciation | | | | | | | | | | | | | | | | | | | | | | | | | | – | | | 292,932 | | | | 292,932 | |
| | | | | | | | | | | |
Commodity Risk | | | | | | | | | | | | | | | | | | | | | | | | | | | | | | | | | | |
Barclays Bank PLC | | Receive | | Barclays Commodity Strategy 1452 Excess Return Index | | | 0.26 | | | Monthly | | | 2,700 | | | November-2022 | | | USD | | | | 1,689,448 | | | – | | | (24,024 | ) | | | (24,024 | ) |
Canadian Imperial Bank of Commerce | | Receive | | Canadian Imperial Bank of Commerce Dynamic Roll LME Copper Excess Return Index 2 | | | 0.27 | | | Monthly | | | 260,000 | | | August-2023 | | | USD | | | | 24,014,562 | | | – | | | (387,010 | ) | | | (387,010 | ) |
Subtotal – Depreciation | | | | | | | | | | | | | | | | | | | | | | | | | | – | | | (411,034 | ) | | | (411,034 | ) |
Total – Total Return Swap Agreements | | | | | | | | | | | | | | | | | | | $– | | $ | (118,102 | ) | | $ | (118,102 | ) |
| (a) | Open Over-The-Counter Total Return Swap Agreements are collateralized by cash held with the swap Counterparties in the amount of $3,540,000. |
| (b) | The Fund receives or pays payments based on any positive or negative return on the Reference Entity, respectively. |
| (c) | The Reference Entity Components table below includes additional information regarding the underlying components of certain reference entities that are not publicly available. |
See accompanying Notes to Consolidated Financial Statements which are an integral part of the financial statements.
| | |
| 11 | | Invesco Balanced-Risk Allocation Fund |
| | | | | | | | | | | | | | | | | | | | | | | | | | | | | | | | | | | | | | | | |
| Open Over-The-Counter Total Return Swap Agreements(a)(b) | |
|
| |
| Counterparty | | Pay/
Receive | | | Reference
Entity(c) | | Floating
Rate Index | | | Payment
Frequency | | | Number
of
Contracts | | | Maturity Date | | | Notional Value | | | Upfront
Payments
Paid
(Received) | | Value | | | Unrealized
Appreciation
(Depreciation) | |
|
| |
| | | | | | | | | | | |
Equity Risk | | | | | | | | | | | | | | | | | | | | | | | | | | | | | | | | | | | | | | | | |
|
| |
| | | | | | | | | | | |
BNP Paribas S.A. | | | Receive | | | Invesco U.S. Low Volatility Total Return Index | |
| SOFR +
0.050% |
| | | Monthly | | | | 3,400 | | | | November-2022 | | | | USD | | | | 19,021,130 | | | $– | | $ | 1,203,868 | | | $ | 1,203,868 | |
|
| |
| | | | | | | | | | | |
BNP Paribas S.A. | | | Receive | | | Invesco US Large Cap Broad Quality Total Return Index | |
| SOFR +
0.280% |
| | | Monthly | | | | 2,350 | | | | November-2022 | | | | USD | | | | 19,152,101 | | | – | | | 813,898 | | | | 813,898 | |
|
| |
| | | | | | | | | | | |
BNP Paribas S.A. | | | Receive | | | MSCI EMU Minimum Volatility Index | |
| 1 mo.
EURIBOR
- 0.400% |
| | | Monthly | | | | 9,600 | | | | March-2023 | | | | EUR | | | | 26,015,328 | | | – | | | 904,225 | | | | 904,225 | |
|
| |
| | | | | | | | | | | |
BNP Paribas S.A. | | | Receive | | | MSCI EMU Momentum Index | |
| 1 mo.
EURIBOR
- 0.360% |
| | | Monthly | | | | 5,900 | | | | December-2022 | | | | EUR | | | | 26,419,244 | | | – | | | 1,247,576 | | | | 1,247,576 | |
|
| |
| | | | | | | | | | | |
BNP Paribas S.A. | | | Receive | | | MSCI Japan Minimum Volatility Index | |
| TONAR -
0.400% |
| | | Monthly | | | | 57,066 | | | | February-2023 | | | | JPY | | | | 150,665,653 | | | – | | | 18,398 | | | | 18,398 | |
|
| |
| | | | | | | | | | | |
BNP Paribas S.A. | | | Receive | | | MSCI Japan Minimum Volatility Index | |
| TONAR -
0.420% |
| | | Monthly | | | | 100,000 | | | | January-2023 | | | | JPY | | | | 264,020,000 | | | – | | | 32,240 | | | | 32,240 | |
|
| |
| | | | | | | | | | | |
BNP Paribas S.A. | | | Receive | | | MSCI Japan Quality Index | |
| TONAR -
0.330% |
| | | Monthly | | | | 47,594 | | | | February-2023 | | | | JPY | | | | 124,345,512 | | | – | | | 38,352 | | | | 38,352 | |
|
| |
| | | | | | | | | | | |
Citibank, N.A. | | | Receive | | | MSCI Japan Minimum Volatility Index | |
| TONAR -
0.420% |
| | | Monthly | | | | 1,794,732 | | | | January-2023 | | | | JPY | | | | 4,738,451,426 | | | – | | | 578,630 | | | | 578,630 | |
|
| |
| | | | | | | | | | | |
Goldman Sachs International | | | Receive | | | MSCI Emerging Markets Minimum Volatility Index | |
| SOFR +
0.700% |
| | | Monthly | | | | 13,104 | | | | December-2022 | | | | USD | | | | 21,845,154 | | | – | | | 92,121 | | | | 92,121 | |
|
| |
| | | | | | | | | | | |
Goldman Sachs International | | | Receive | | | MSCI Japan Minimum Volatility Index | |
| TONAR -
0.390% |
| | | Monthly | | | | 686,810 | | | | January-2023 | | | | JPY | | | | 1,813,315,762 | | | – | | | 221,431 | | | | 221,431 | |
|
| |
| | | | | | | | | | | |
Goldman Sachs International | | | Receive | | | MSCI Japan Minimum Volatility Index | |
| TONAR -
0.400% |
| | | Monthly | | | | 81,392 | | | | February-2023 | | | | JPY | | | | 214,891,158 | | | – | | | 26,241 | | | | 26,241 | |
|
| |
| | | | | | | | | | | |
Goldman Sachs International | | | Receive | | | MSCI Japan Quality Index | |
| TONAR -
0.300% |
| | | Monthly | | | | 697,469 | | | | January-2023 | | | | JPY | | | | 1,822,228,433 | | | – | | | 562,028 | | | | 562,028 | |
|
| |
See accompanying Notes to Consolidated Financial Statements which are an integral part of the financial statements.
| | |
| 12 | | Invesco Balanced-Risk Allocation Fund |
| | | | | | | | | | | | | | | | | | | | | | | | | | | | | | | | | | |
| Open Over-The-Counter Total Return Swap Agreements(a)(b)–(continued) | |
|
| |
| Counterparty | | Pay/
Receive | | Reference
Entity(c) | | Floating
Rate
Index | | Payment
Frequency | | Number of
Contracts | | | Maturity Date | | | Notional Value | | | Upfront
Payments
Paid
(Received) | | Value | | | Unrealized
Appreciation
(Depreciation) | |
|
| |
| | | | | | | | | | | |
Goldman Sachs International | | Receive | | MSCI Japan Quality Index | | TONAR -
0.310% | | Monthly | | | 150,000 | | | | January-2023 | | | | JPY | | | | 391,894,500 | | | $– | | $ | 120,872 | | | $ | 120,872 | |
|
| |
| | | | | | | | | | | |
Goldman Sachs International | | Receive | | MSCI Japan Quality Index | | TONAR -
0.330% | | Monthly | | | 1,800,000 | | | | January-2023 | | | | JPY | | | | 4,702,734,000 | | | – | | | 1,450,459 | | | | 1,450,459 | |
|
| |
| | | | | | | | | | | |
Goldman Sachs International | | Receive | | MSCI Japan Quality Index | | TONAR -
0.330% | | Monthly | | | 64,937 | | | | February-2023 | | | | JPY | | | | 169,656,354 | | | – | | | 52,327 | | | | 52,327 | |
|
| |
| | | | | | | | | | | |
J.P. Morgan Chase Bank, N.A. | | Receive | | Invesco UK Broad Low Volatility Net Total Return Index | | SONIA +
0.190% | | Monthly | | | 2,605 | | | | November-2022 | | | | GBP | | | | 11,497,428 | | | – | | | 483,083 | | | | 483,083 | |
|
| |
| | | | | | | | | | | |
J.P. Morgan Chase Bank, N.A. | | Receive | | Invesco UK Broad Price Momentum Net Total Return Index | | SONIA +
0.190% | | Monthly | | | 1,966 | | | | November-2022 | | | | GBP | | | | 10,506,599 | | | – | | | 375,226 | | | | 375,226 | |
|
| |
| | | | | | | | | | | |
J.P. Morgan Chase Bank, N.A. | | Receive | | Invesco UK Broad Price Momentum Net Total Return Index | | SONIA +
0.190% | | Monthly | | | 1,960 | | | | November-2022 | | | | GBP | | | | 10,474,534 | | | – | | | 374,080 | | | | 374,080 | |
|
| |
| | | | | | | | | | | |
J.P. Morgan Chase Bank, N.A. | | Receive | | Invesco UK Broad Price Momentum Net Total Return Index | | SONIA +
0.230% | | Monthly | | | 224 | | | | November-2022 | | | | GBP | | | | 1,197,090 | | | – | | | 42,752 | | | | 42,752 | |
|
| |
| | | | | | | | | | | |
J.P. Morgan Chase Bank, N.A. | | Receive | | Invesco UK Broad Quality Net Total Return Index | | SONIA +
0.230% | | Monthly | | | 1,760 | | | | November-2022 | | | | GBP | | | | 10,479,304 | | | – | | | 437,718 | | | | 437,718 | |
|
| |
| | | | | | | | | | | |
J.P. Morgan Chase Bank, N.A. | | Receive | | Invesco UK Broad Quality Net Total Return Index | | SONIA +
0.230% | | Monthly | | | 180 | | | | November-2022 | | | | GBP | | | | 1,071,747 | | | – | | | 44,767 | | | | 44,767 | |
|
| |
| | | | | | | | | | | |
J.P. Morgan Chase Bank, N.A. | | Receive | | Invesco US Large Cap Broad Price Momentum Total Return Index | | SOFR +
0.280% | | Monthly | | | 3,000 | | | | November-2022 | | | | USD | | | | 20,407,410 | | | – | | | 1,575,636 | | | | 1,575,636 | |
|
| |
See accompanying Notes to Consolidated Financial Statements which are an integral part of the financial statements.
| | |
| 13 | | Invesco Balanced-Risk Allocation Fund |
| | | | | | | | | | | | | | | | | | | | | | | | | | | | | | | | | | | | | | |
| Open Over-The-Counter Total Return Swap Agreements(a)(b)–(continued) | |
|
| |
| Counterparty | | Pay/
Receive | | Reference
Entity(c) | | Floating
Rate Index | | | Payment
Frequency | | | Number of
Contracts | | | Maturity Date | | | Notional Value | | | Upfront
Payments
Paid
(Received) | | Value | | | Unrealized
Appreciation
(Depreciation) | |
|
| |
| | | | | | | | | | | |
J.P. Morgan Chase Bank, N.A. | | Receive | | MSCI Emerging Markets Minimum Volatility Index | |
| SOFR +
0.680% |
| | | Monthly | | | | 1,344 | | | | December-2022 | | | | USD | | | | 2,240,529 | | | $– | | $ | 9,448 | | | $ | 9,448 | |
|
| |
| | | | | | | | | | | |
J.P. Morgan Chase Bank, N.A. | | Receive | | MSCI Emerging Markets Minimum Volatility Index | |
| SOFR +
0.700% |
| | | Monthly | | | | 3,000 | | | | January-2023 | | | | USD | | | | 5,001,180 | | | – | | | 21,090 | | | | 21,090 | |
|
| |
| | | | | | | | | | | |
J.P. Morgan Chase Bank, N.A. | | Receive | | MSCI Emerging Markets Minimum Volatility Index | |
| SOFR +
0.790% |
| | | Monthly | | | | 7,580 | | | | January-2023 | | | | USD | | | | 12,636,315 | | | – | | | 53,287 | | | | 53,287 | |
|
| |
| | | | | | | | | | | |
Merrill Lynch International | | Receive | | Invesco UK Broad Low Volatility Net Total Return Index | |
| SONIA +
0.190% |
| | | Monthly | | | | 2,395 | | | | November-2022 | | | | GBP | | | | 10,570,572 | | | – | | | 444,140 | | | | 444,140 | |
|
| |
| | | | | | | | | | | |
Merrill Lynch International | | Receive | | Invesco UK Broad Quality Net Total Return Index | |
| SONIA +
0.190% |
| | | Monthly | | | | 1,760 | | | | November-2022 | | | | GBP | | | | 10,479,304 | | | – | | | 437,718 | | | | 437,718 | |
|
| |
| | | | | | | | | | | |
Merrill Lynch International | | Receive | | MSCI Emerging Markets Minimum Volatility Index | |
| SOFR +
0.680% |
| | | Monthly | | | | 1,455 | | | | November-2022 | | | | USD | | | | 2,425,572 | | | – | | | 10,229 | | | | 10,229 | |
|
| |
| | | | | | | | | | | |
Merrill Lynch International | | Receive | | MSCI Emerging Markets Minimum Volatility Index | |
| SOFR+
0.720% |
| | | Monthly | | | | 8,017 | | | | March-2023 | | | | USD | | | | 13,364,820 | | | – | | | 56,359 | | | | 56,359 | |
|
| |
| | | | | | | | | | | |
Merrill Lynch International | | Receive | | MSCI EMU Quality Volatility Index | |
| 1 mo.
EURIBOR
- 0.250% |
| | | Monthly | | | | 7,700 | | | | January-2023 | | | | EUR | | | | 26,039,783 | | | – | | | 788,832 | | | | 788,832 | |
|
| |
| | | | | | | | | |
Subtotal - Appreciation | | | | | | | | | | | | | | | | | | | | | | | | | | – | | | 12,517,031 | | | | 12,517,031 | |
|
| |
See accompanying Notes to Consolidated Financial Statements which are an integral part of the financial statements.
| | |
| 14 | | Invesco Balanced-Risk Allocation Fund |
| | | | | | | | | | | | | | | | | | | | | | | | | | | | | | | | | | | | | | | | | | |
| Open Over-The-Counter Total Return Swap Agreements(a)(b)–(continued) | |
|
| |
| Counterparty | | Pay/
Receive | | | Reference
Entity(c) | | Floating
Rate
Index | | | Payment
Frequency | | | Number of
Contracts | | | Maturity Date | | | Notional Value | | | Upfront
Payments
Paid
(Received) | | | Value | | | Unrealized
Appreciation
(Depreciation) | |
|
| |
Equity Risk | | | | | | | | | | | | | | | | | | | | | | | | | | | | | | | | | | | | | | | | | | |
|
| |
| | | | | | | | | | | |
Goldman Sachs International | | | Receive | | | Invesco Emerging Markets + Korea Large Cap Broad Price Momentum Net Total Return Index | |
| SOFR +
0.760% |
| | | Monthly | | | | 1,590 | | | | November-2022 | | | | USD | | | | 9,503,684 | | | | $– | | | $ | (123,491 | ) | | $ | (123,491 | ) |
|
| |
| | | | | | | | | | | |
J.P. Morgan Chase Bank, N.A. | | | Receive | | | Invesco Emerging Markets + Korea Large Cap Broad Price Momentum Net Total Return Index | |
| SOFR +
0.550% |
| | | Monthly | | | | 7,510 | | | | November-2022 | | | | USD | | | | 44,888,472 | | | | – | | | | (583,282 | ) | | | (583,282 | ) |
|
| |
| | | | | | | | | | | |
J.P. Morgan Chase Bank, N.A. | | | Receive | | | Invesco Emerging Markets + Korea Large Cap Broad Price Momentum Net Total Return Index | |
| SOFR+
0.680% |
| | | Monthly | | | | 600 | | | | January-2023 | | | | USD | | | | 3,586,296 | | | | – | | | | (46,600 | ) | | | (46,600 | ) |
|
| |
Subtotal - Depreciation | | | | | | | | | | | | | | | | | | | | | | | | | | | – | | | | (753,373 | ) | | | (753,373 | ) |
|
| |
Total - Total Return Swap Agreements | | | | | | | | | | | | | | | | $– | | | $ | 11,763,658 | | | $ | 11,763,658 | |
|
| |
| (a) | Open Over-The-Counter Total Return Swap Agreements are collateralized by cash held with the swap Counterparties in the amount of $3,540,000. |
| (b) | The Fund receives or pays payments based on any positive or negative return on the Reference Entity, respectively. |
| (c) | The Reference Entity Components table below includes additional information regarding the underlying components of certain reference entities that are not publicly available. |
| | | | |
| Reference Entity Components |
|
|
| Reference Entity | | Underlying Components | | Percentage |
|
|
| | |
| Canadian Imperial Bank of Commerce Custom 7 Agriculture Commodity Index | | | | |
| | |
| | Long Futures Contracts | | |
| |
| | |
| | Coffee | | 6.14% |
| |
| | |
| | Corn | | 8.08 |
| |
| | |
| | Cotton | | 18.63 |
| |
| | |
| | Lean Hogs | | 0.49 |
| |
| | |
| | Live Cattle | | 0.88 |
| |
| | |
| | Soybean | | 18.59 |
| |
| | |
| | Soybean Oil | | 14.00 |
| |
| | |
| | Soymeal | | 20.29 |
| |
| | |
| | Sugar | | 6.22 |
| |
| | |
| | Wheat | | 6.68 |
| |
| | |
| | Total | | 100.00% |
| |
| | |
See accompanying Notes to Consolidated Financial Statements which are an integral part of the financial statements.
| | |
| 15 | | Invesco Balanced-Risk Allocation Fund |
| | | | |
| Reference Entity Components–(continued) |
|
|
| Reference Entity | | Underlying Components | | Percentage |
|
|
| | |
| RBC Enhanced Agricultural Basket 07 Excess Return Index | | | | |
| | |
| | Long Futures Contracts | | |
| |
| | |
| | Coffee | | 6.14% |
| |
| | |
| | Corn | | 8.08 |
| |
| | |
| | Cotton | | 18.63 |
| |
| | |
| | Lean Hogs | | 0.49 |
| |
| | |
| | Live Cattle | | 0.88 |
| |
| | |
| | Soybean | | 18.59 |
| |
| | |
| | Soybean Oil | | 14.00 |
| |
| | |
| | Soymeal | | 20.29 |
| |
| | |
| | Sugar | | 6.22 |
| |
| | |
| | Wheat | | 6.68 |
| |
| | |
| | Total | | 100.00% |
| |
| | |
| | |
J.P. Morgan Contag Beta Gas Oil Excess Return Index | | | | |
| | |
| | Long Futures Contracts | | |
| |
| | |
| | Gas Oil | | 100.00% |
| |
| | |
| | |
MLCX Natural Gas Annual Excess Return Index | | | | |
| | |
| | Long Futures Contracts | | |
| |
| | |
| | Natural Gas | | 100.00% |
| |
| | |
| | |
S&P GSCI Aluminum Dynamic Roll Index Excess Return | | | | |
| | |
| | Long Futures Contracts | | |
| |
| | |
| | Aluminum | | 100.00% |
| |
| | |
| | |
Barclays Commodity Strategy 1452 Excess Return Index | | | | |
| | |
| | Long Futures Contracts | | |
| |
| | |
| | Copper | | 100.00% |
| |
| | |
| | |
| Canadian Imperial Bank of Commerce Dynamic Roll LME Copper Excess Return Index 2 | | | | |
| | |
| | Long Futures Contracts | | |
| |
| | |
| | Copper | | 100.00% |
| |
| | |
| | |
| Abbreviations: |
| |
| EMU | | –European Economic and Monetary Union |
| EUR | | –Euro |
| EURIBOR | | –Euro Interbank Offered Rate |
| GBP | | –British Pound Sterling |
| JPY | | –Japanese Yen |
| SOFR | | –Secured Overnight Financing Rate |
| SONIA | | –Sterling Overnight Index Average |
| TONAR | | –Tokyo Overnight Average Rate |
| USD | | –U.S. Dollar |
See accompanying Notes to Consolidated Financial Statements which are an integral part of the financial statements.
| | |
| 16 | | Invesco Balanced-Risk Allocation Fund |
Consolidated Statement of Assets and Liabilities
October 31, 2022
| | | | |
Assets: | | | | |
| |
Investments in unaffiliated securities, at value
(Cost $713,212,869) | | $ | 726,299,989 | |
|
| |
| |
Investments in affiliated money market funds, at value (Cost $976,864,608) | | | 976,870,635 | |
|
| |
Other investments: | | | | |
Swaps receivable – OTC | | | 19,958 | |
|
| |
Unrealized appreciation on swap agreements – OTC | | | 12,809,963 | |
|
| |
Deposits with brokers: | | | | |
Cash collateral – exchange-traded futures contracts | | | 65,895,001 | |
|
| |
Cash collateral – OTC Derivatives | | | 3,540,000 | |
|
| |
Cash | | | 11,227,936 | |
|
| |
Foreign currencies, at value (Cost $26,761,162) | | | 27,020,662 | |
|
| |
Receivable for: | | | | |
Fund shares sold | | | 728,515 | |
|
| |
Dividends | | | 2,415,857 | |
|
| |
Interest | | | 144,840 | |
|
| |
Investment for trustee deferred compensation and retirement plans | | | 464,633 | |
|
| |
Other assets | | | 74,524 | |
|
| |
Total assets | | | 1,827,512,513 | |
|
| |
| |
Liabilities: | | | | |
Other investments: | | | | |
Variation margin payable - futures contracts | | | 6,995,641 | |
|
| |
Swaps payable – OTC | | | 2,989,734 | |
|
| |
Unrealized depreciation on swap agreements-OTC | | | 1,164,407 | |
|
| |
Payable for: | | | | |
Fund shares reacquired | | | 2,030,467 | |
|
| |
Accrued fees to affiliates | | | 1,077,694 | |
|
| |
Accrued trustees’ and officers’ fees and benefits | | | 1,436 | |
|
| |
Accrued other operating expenses | | | 140,398 | |
|
| |
Trustee deferred compensation and retirement plans | | | 515,436 | |
|
| |
Total liabilities | | | 14,915,213 | |
|
| |
Net assets applicable to shares outstanding | | $ | 1,812,597,300 | |
|
| |
| | | | |
Net assets consist of: | | | | |
Shares of beneficial interest | | $ | 2,042,884,957 | |
|
| |
Distributable earnings (loss) | | | (230,287,657 | ) |
|
| |
| | $ | 1,812,597,300 | |
|
| |
| |
Net Assets: | | | | |
Class A | | $ | 852,411,928 | |
|
| |
Class C | | $ | 100,108,616 | |
|
| |
Class R | | $ | 16,270,138 | |
|
| |
Class Y | | $ | 792,547,449 | |
|
| |
Class R5 | | $ | 12,873,720 | |
|
| |
Class R6 | | $ | 38,385,449 | |
|
| |
|
Shares outstanding, no par value, with an unlimited number of shares authorized: | |
Class A | | | 103,416,264 | |
|
| |
Class C | | | 13,073,758 | |
|
| |
Class R | | | 2,027,848 | |
|
| |
Class Y | | | 93,736,603 | |
|
| |
Class R5 | | | 1,521,516 | |
|
| |
Class R6 | | | 4,522,802 | |
|
| |
Class A: | | | | |
Net asset value per share | | $ | 8.24 | |
|
| |
Maximum offering price per share
(Net asset value of $8.24 ÷ 94.50%) | | $ | 8.72 | |
|
| |
Class C: | | | | |
Net asset value and offering price per share | | $ | 7.66 | |
|
| |
Class R: | | | | |
Net asset value and offering price per share | | $ | 8.02 | |
|
| |
Class Y: | | | | |
Net asset value and offering price per share | | $ | 8.46 | |
|
| |
Class R5: | | | | |
Net asset value and offering price per share | | $ | 8.46 | |
|
| |
Class R6: | | | | |
Net asset value and offering price per share | | $ | 8.49 | |
|
| |
See accompanying Notes to Consolidated Financial Statements which are an integral part of the financial statements.
| | |
| 17 | | Invesco Balanced-Risk Allocation Fund |
Consolidated Statement of Operations
For the year ended October 31, 2022
| | | | |
Investment income: | | | | |
| |
Interest | | $ | 9,017,500 | |
|
| |
Dividends from affiliated money market funds (net of foreign withholding taxes of $223,188) | | | 8,939,465 | |
|
| |
Total investment income | | | 17,956,965 | |
|
| |
| |
Expenses: | | | | |
Advisory fees | | | 19,210,676 | |
|
| |
Administrative services fees | | | 314,409 | |
|
| |
Custodian fees | | | 155,001 | |
|
| |
Distribution fees: | | | | |
Class A | | �� | 2,462,592 | |
|
| |
Class C | | | 1,347,978 | |
|
| |
Class R | | | 86,952 | |
|
| |
Transfer agent fees – A, C, R and Y | | | 2,602,424 | |
|
| |
Transfer agent fees – R5 | | | 14,718 | |
|
| |
Transfer agent fees – R6 | | | 13,873 | |
|
| |
Trustees’ and officers’ fees and benefits | | | 35,248 | |
|
| |
Registration and filing fees | | | 145,060 | |
|
| |
Reports to shareholders | | | 63,812 | |
|
| |
Professional services fees | | | 98,874 | |
|
| |
Other | | | 923,305 | |
|
| |
Total expenses | | | 27,474,922 | |
|
| |
Less: Fees waived and/or expense offset arrangement(s) | | | (814,679 | ) |
|
| |
Net expenses | | | 26,660,243 | |
|
| |
Net investment income (loss) | | | (8,703,278 | ) |
|
| |
| |
Realized and unrealized gain (loss) from: | | | | |
Net realized gain (loss) from: | | | | |
Unaffiliated investment securities | | | 22,389,586 | |
|
| |
Affiliated investment securities | | | 71,899 | |
|
| |
Foreign currencies | | | (11,797,136 | ) |
|
| |
Futures contracts | | | (238,084,688 | ) |
|
| |
Swap agreements | | | (91,398,926 | ) |
|
| |
| | | (318,819,265 | ) |
|
| |
Change in net unrealized appreciation (depreciation) of: | | | | |
Unaffiliated investment securities | | | 18,797,063 | |
|
| |
Affiliated investment securities | | | (95,866 | ) |
|
| |
Foreign currencies | | | 346,207 | |
|
| |
Futures contracts | | | (7,544,637 | ) |
|
| |
Swap agreements | | | 7,949,922 | |
|
| |
| | | 19,452,689 | |
|
| |
Net realized and unrealized gain (loss) | | | (299,366,576 | ) |
|
| |
Net increase (decrease) in net assets resulting from operations | | $ | (308,069,854 | ) |
|
| |
See accompanying Notes to Consolidated Financial Statements which are an integral part of the financial statements.
| | |
| 18 | | Invesco Balanced-Risk Allocation Fund |
Consolidated Statement of Changes in Net Assets
For the years ended October 31, 2022 and 2021
| | | | | | | | |
| | | 2022 | | | 2021 | |
|
| |
Operations: | | | | | | | | |
Net investment income (loss) | | $ | (8,703,278 | ) | | $ | (29,679,403 | ) |
|
| |
Net realized gain (loss) | | | (318,819,265 | ) | | | 484,770,750 | |
|
| |
Change in net unrealized appreciation | | | 19,452,689 | | | | 14,666,344 | |
|
| |
Net increase (decrease) in net assets resulting from operations | | | (308,069,854 | ) | | | 469,757,691 | |
|
| |
| | |
Distributions to shareholders from distributable earnings: | | | | | | | | |
Class A | | | (225,061,518 | ) | | | (10,563,728 | ) |
|
| |
Class C | | | (34,535,946 | ) | | | (1,416,700 | ) |
|
| |
Class R | | | (3,731,479 | ) | | | (148,478 | ) |
|
| |
Class Y | | | (220,623,925 | ) | | | (15,303,622 | ) |
|
| |
Class R5 | | | (3,417,238 | ) | | | (246,913 | ) |
|
| |
Class R6 | | | (9,736,632 | ) | | | (2,626,550 | ) |
|
| |
Total distributions from distributable earnings | | | (497,106,738 | ) | | | (30,305,991 | ) |
|
| |
| | |
Share transactions–net: | | | | | | | | |
Class A | | | 127,096,042 | | | | 91,241,745 | |
|
| |
Class C | | | (13,473,598 | ) | | | (235,030,332 | ) |
|
| |
Class R | | | 4,973,468 | | | | (364,637 | ) |
|
| |
Class Y | | | 85,280,229 | | | | (125,674,098 | ) |
|
| |
Class R5 | | | 1,621,069 | | | | (1,898,401 | ) |
|
| |
Class R6 | | | 5,266,488 | | | | (131,933,646 | ) |
|
| |
Net increase (decrease) in net assets resulting from share transactions | | | 210,763,698 | | | | (403,659,369 | ) |
|
| |
Net increase (decrease) in net assets | | | (594,412,894 | ) | | | 35,792,331 | |
|
| |
| | |
Net assets: | | | | | | | | |
Beginning of year | | | 2,407,010,194 | | | | 2,371,217,863 | |
|
| |
End of year | | $ | 1,812,597,300 | | | $ | 2,407,010,194 | |
|
| |
See accompanying Notes to Consolidated Financial Statements which are an integral part of the financial statements.
| | |
| 19 | | Invesco Balanced-Risk Allocation Fund |
Consolidated Financial Highlights
The following schedule presents financial highlights for a share of the Fund outstanding throughout the periods indicated.
| | | | | | | | | | | | | | | | | | | | | | | | | | | | | | | | | | | | | | | | | | | | | | | | | | | | | | | | | | | | | | | | | | | | | | |
| | | Net asset
value,
beginning
of period | | Net
investment
income
(loss)(a) | | Net gains
(losses) on securities
(both
realized and
unrealized) | | Total from
investment
operations | | Dividends
from net
investment
income | | Distributions
from net
realized
gains | | Total
distributions | | Net asset
value, end
of period | | Total
return (b) | | Net assets,
end of period
(000’s omitted) | | Ratio of
expenses
to average net assets
with fee waivers
and/or
expenses
absorbed | | Ratio of
expenses
to average net
assets without
fee waivers
and/or
expenses
absorbed | | Ratio of net
investment
income
(loss)
to average
net assets | | Portfolio
turnover (c) |
Class A | | | | | | | | | | | | | | | | | | | | | | | | | | | | | | | | | | | | | | | | | | | | | | | | | | | | | | | | | | | | | | | | | | | | | | |
Year ended 10/31/22 | | | $ | 12.09 | | | | $ | (0.04 | ) | | | $ | (1.29 | ) | | | $ | (1.33 | ) | | | $ | (1.43 | ) | | | $ | (1.09 | ) | | | $ | (2.52 | ) | | | $ | 8.24 | | | | | (13.99 | )% | | | $ | 852,412 | | | | | 1.31 | % | | | | 1.35 | % | | | | (0.47 | )% | | | | 92 | % |
Year ended 10/31/21 | | | | 10.12 | | | | | (0.15 | ) | | | | 2.25 | | | | | 2.10 | | | | | (0.13 | ) | | | | - | | | | | (0.13 | ) | | | | 12.09 | | | | | 20.91 | | | | | 1,093,094 | | | | | 1.31 | | | | | 1.33 | | | | | (1.26 | ) | | | | 16 | |
Year ended 10/31/20 | | | | 11.33 | | | | | (0.05 | ) | | | | 0.01 | | | | | (0.04 | ) | | | | (0.67 | ) | | | | (0.50 | ) | | | | (1.17 | ) | | | | 10.12 | | | | | (0.55 | ) | | | | 831,513 | | | | | 1.24 | | | | | 1.30 | | | | | (0.53 | ) | | | | 81 | |
Year ended 10/31/19 | | | | 10.21 | | | | | 0.10 | | | | | 1.02 | | | | | 1.12 | | | | | - | | | | | - | | | | | - | | | | | 11.33 | | | | | 10.97 | | | | | 968,345 | | | | | 1.24 | | | | | 1.29 | | | | | 0.95 | | | | | 11 | |
Year ended 10/31/18 | | | | 11.28 | | | | | 0.03 | | | | | (0.40 | ) | | | | (0.37 | ) | | | | - | | | | | (0.70 | ) | | | | (0.70 | ) | | | | 10.21 | | | | | (3.57 | ) | | | | 1,016,131 | | | | | 1.21 | | | | | 1.27 | | | | | 0.32 | | | | | 116 | |
Class C | | | | | | | | | | | | | | | | | | | | | | | | | | | | | | | | | | | | | | | | | | | | | | | | | | | | | | | | | | | | | | | | | | | | | | |
Year ended 10/31/22 | | | | 11.36 | | | | | (0.11 | ) | | | | (1.19 | ) | | | | (1.30 | ) | | | | (1.31 | ) | | | | (1.09 | ) | | | | (2.40 | ) | | | | 7.66 | | | | | (14.57 | ) | | | | 100,109 | | | | | 2.06 | | | | | 2.10 | | | | | (1.22 | ) | | | | 92 | |
Year ended 10/31/21 | | | | 9.50 | | | | | (0.22 | ) | | | | 2.12 | | | | | 1.90 | | | | | (0.04 | ) | | | | - | | | | | (0.04 | ) | | | | 11.36 | | | | | 20.04 | | | | | 167,794 | | | | | 2.06 | | | | | 2.08 | | | | | (2.01 | ) | | | | 16 | |
Year ended 10/31/20 | | | | 10.69 | | | | | (0.12 | ) | | | | 0.00 | | | | | (0.12 | ) | | | | (0.57 | ) | | | | (0.50 | ) | | | | (1.07 | ) | | | | 9.50 | | | | | (1.36 | ) | | | | 349,294 | | | | | 1.99 | | | | | 2.05 | | | | | (1.28 | ) | | | | 81 | |
Year ended 10/31/19 | | | | 9.70 | | | | | 0.02 | | | | | 0.97 | | | | | 0.99 | | | | | - | | | | | - | | | | | - | | | | | 10.69 | | | | | 10.21 | | | | | 527,251 | | | | | 1.99 | | | | | 2.04 | | | | | 0.20 | | | | | 11 | |
Year ended 10/31/18 | | | | 10.83 | | | | | (0.04 | ) | | | | (0.39 | ) | | | | (0.43 | ) | | | | - | | | | | (0.70 | ) | | | | (0.70 | ) | | | | 9.70 | | | | | (4.31 | ) | | | | 735,308 | | | | | 1.96 | | | | | 2.02 | | | | | (0.43 | ) | | | | 116 | |
Class R | | | | | | | | | | | | | | | | | | | | | | | | | | | | | | | | | | | | | | | | | | | | | | | | | | | | | | | | | | | | | | | | | | | | | | |
Year ended 10/31/22 | | | | 11.82 | | | | | (0.07 | ) | | | | (1.25 | ) | | | | (1.32 | ) | | | | (1.39 | ) | | | | (1.09 | ) | | | | (2.48 | ) | | | | 8.02 | | | | | (14.21 | ) | | | | 16,270 | | | | | 1.56 | | | | | 1.60 | | | | | (0.72 | ) | | | | 92 | |
Year ended 10/31/21 | | | | 9.90 | | | | | (0.17 | ) | | | | 2.19 | | | | | 2.02 | | | | | (0.10 | ) | | | | - | | | | | (0.10 | ) | | | | 11.82 | | | | | 20.52 | | | | | 17,666 | | | | | 1.56 | | | | | 1.58 | | | | | (1.51 | ) | | | | 16 | |
Year ended 10/31/20 | | | | 11.10 | | | | | (0.08 | ) | | | | 0.02 | | | | | (0.06 | ) | | | | (0.64 | ) | | | | (0.50 | ) | | | | (1.14 | ) | | | | 9.90 | | | | | (0.77 | ) | | | | 15,202 | | | | | 1.49 | | | | | 1.55 | | | | | (0.78 | ) | | | | 81 | |
Year ended 10/31/19 | | | | 10.02 | | | | | 0.07 | | | | | 1.01 | | | | | 1.08 | | | | | - | | | | | - | | | | | - | | | | | 11.10 | | | | | 10.78 | | | | | 18,343 | | | | | 1.49 | | | | | 1.54 | | | | | 0.70 | | | | | 11 | |
Year ended 10/31/18 | | | | 11.11 | | | | | 0.01 | | | | | (0.40 | ) | | | | (0.39 | ) | | | | - | | | | | (0.70 | ) | | | | (0.70 | ) | | | | 10.02 | | | | | (3.82 | ) | | | | 19,989 | | | | | 1.46 | | | | | 1.52 | | | | | 0.07 | | | | | 116 | |
Class Y | | | | | | | | | | | | | | | | | | | | | | | | | | | | | | | | | | | | | | | | | | | | | | | | | | | | | | | | | | | | | | | | | | | | | | |
Year ended 10/31/22 | | | | 12.34 | | | | | (0.02 | ) | | | | (1.31 | ) | | | | (1.33 | ) | | | | (1.46 | ) | | | | (1.09 | ) | | | | (2.55 | ) | | | | 8.46 | | | | | (13.66 | ) | | | | 792,547 | | | | | 1.06 | | | | | 1.10 | | | | | (0.22 | ) | | | | 92 | |
Year ended 10/31/21 | | | | 10.33 | | | | | (0.12 | ) | | | | 2.29 | | | | | 2.17 | | | | | (0.16 | ) | | | | - | | | | | (0.16 | ) | | | | 12.34 | | | | | 21.18 | | | | | 1,062,698 | | | | | 1.06 | | | | | 1.08 | | | | | (1.01 | ) | | | | 16 | |
Year ended 10/31/20 | | | | 11.55 | | | | | (0.03 | ) | | | | 0.01 | | | | | (0.02 | ) | | | | (0.70 | ) | | | | (0.50 | ) | | | | (1.20 | ) | | | | 10.33 | | | | | (0.34 | ) | | | | 1,000,148 | | | | | 0.99 | | | | | 1.05 | | | | | (0.28 | ) | | | | 81 | |
Year ended 10/31/19 | | | | 10.37 | | | | | 0.13 | | | | | 1.05 | | | | | 1.18 | | | | | - | | | | | - | | | | | - | | | | | 11.55 | | | | | 11.38 | | | | | 1,431,442 | | | | | 0.99 | | | | | 1.04 | | | | | 1.20 | | | | | 11 | |
Year ended 10/31/18 | | | | 11.43 | | | | | 0.06 | | | | | (0.42 | ) | | | | (0.36 | ) | | | | - | | | | | (0.70 | ) | | | | (0.70 | ) | | | | 10.37 | | | | | (3.42 | ) | | | | 1,718,473 | | | | | 0.96 | | | | | 1.02 | | | | | 0.57 | | | | | 116 | |
Class R5 | | | | | | | | | | | | | | | | | | | | | | | | | | | | | | | | | | | | | | | | | | | | | | | | | | | | | | | | | | | | | | | | | | | | | | |
Year ended 10/31/22 | | | | 12.35 | | | | | (0.02 | ) | | | | (1.31 | ) | | | | (1.33 | ) | | | | (1.47 | ) | | | | (1.09 | ) | | | | (2.56 | ) | | | | 8.46 | | | | | (13.72 | ) | | | | 12,874 | | | | | 1.04 | | | | | 1.08 | | | | | (0.20 | ) | | | | 92 | |
Year ended 10/31/21 | | | | 10.34 | | | | | (0.12 | ) | | | | 2.30 | | | | | 2.18 | | | | | (0.17 | ) | | | | - | | | | | (0.17 | ) | | | | 12.35 | | | | | 21.22 | | | | | 16,750 | | | | | 1.02 | | | | | 1.04 | | | | | (0.97 | ) | | | | 16 | |
Year ended 10/31/20 | | | | 11.56 | | | | | (0.03 | ) | | | | 0.02 | | | | | (0.01 | ) | | | | (0.71 | ) | | | | (0.50 | ) | | | | (1.21 | ) | | | | 10.34 | | | | | (0.26 | ) | | | | 15,707 | | | | | 0.94 | | | | | 1.00 | | | | | (0.23 | ) | | | | 81 | |
Year ended 10/31/19 | | | | 10.38 | | | | | 0.14 | | | | | 1.04 | | | | | 1.18 | | | | | - | | | | | - | | | | | - | | | | | 11.56 | | | | | 11.37 | | | | | 45,497 | | | | | 0.92 | | | | | 0.97 | | | | | 1.27 | | | | | 11 | |
Year ended 10/31/18 | | | | 11.43 | | | | | 0.07 | | | | | (0.42 | ) | | | | (0.35 | ) | | | | - | | | | | (0.70 | ) | | | | (0.70 | ) | | | | 10.38 | | | | | (3.34 | ) | | | | 50,691 | | | | | 0.92 | | | | | 0.98 | | | | | 0.61 | | | | | 116 | |
Class R6 | | | | | | | | | | | | | | | | | | | | | | | | | | | | | | | | | | | | | | | | | | | | | | | | | | | | | | | | | | | | | | | | | | | | | | |
Year ended 10/31/22 | | | | 12.38 | | | | | (0.01 | ) | | | | (1.32 | ) | | | | (1.33 | ) | | | | (1.47 | ) | | | | (1.09 | ) | | | | (2.56 | ) | | | | 8.49 | | | | | (13.62 | ) | | | | 38,385 | | | | | 0.97 | | | | | 1.01 | | | | | (0.13 | ) | | | | 92 | |
Year ended 10/31/21 | | | | 10.37 | | | | | (0.11 | ) | | | | 2.30 | | | | | 2.19 | | | | | (0.18 | ) | | | | - | | | | | (0.18 | ) | | | | 12.38 | | | | | 21.26 | | | | | 49,008 | | | | | 0.95 | | | | | 0.97 | | | | | (0.90 | ) | | | | 16 | |
Year ended 10/31/20 | | | | 11.59 | | | | | (0.02 | ) | | | | 0.02 | | | | | 0.00 | | | | | (0.72 | ) | | | | (0.50 | ) | | | | (1.22 | ) | | | | 10.37 | | | | | (0.21 | ) | | | | 159,353 | | | | | 0.86 | | | | | 0.92 | | | | | (0.15 | ) | | | | 81 | |
Year ended 10/31/19 | | | | 10.40 | | | | | 0.15 | | | | | 1.04 | | | | | 1.19 | | | | | - | | | | | - | | | | | - | | | | | 11.59 | | | | | 11.44 | | | | | 255,753 | | | | | 0.87 | | | | | 0.92 | | | | | 1.32 | | | | | 11 | |
Year ended 10/31/18 | | | | 11.44 | | | | | 0.07 | | | | | (0.41 | ) | | | | (0.34 | ) | | | | - | | | | | (0.70 | ) | | | | (0.70 | ) | | | | 10.40 | | | | | (3.24 | ) | | | | 398,406 | | | | | 0.86 | | | | | 0.92 | | | | | 0.67 | | | | | 116 | |
| (a) | Calculated using average shares outstanding. |
| (b) | Includes adjustments in accordance with accounting principles generally accepted in the United States of America and as such, the net asset value for financial reporting purposes and the returns based upon those net asset values may differ from the net asset value and returns for shareholder transactions. Does not include sales charges and is not annualized for periods less than one year, if applicable. |
| (c) | Portfolio turnover is calculated at the fund level and is not annualized for periods less than one year, if applicable. |
See accompanying Notes to Consolidated Financial Statements which are an integral part of the financial statements.
| | |
| 20 | | Invesco Balanced-Risk Allocation Fund |
Notes to Consolidated Financial Statements
October 31, 2022
NOTE 1–Significant Accounting Policies
Invesco Balanced-Risk Allocation Fund (the “Fund”) is a series portfolio of AIM Investment Funds (Invesco Investment Funds) (the “Trust”). The Trust is organized as a Delaware statutory trust and is registered under the Investment Company Act of 1940, as amended (the “1940 Act”), as an open-end series management investment company authorized to issue an unlimited number of shares of beneficial interest. Information presented in these consolidated financial statements pertains only to the Fund and the Invesco Cayman Commodity Fund I Ltd. (the “Subsidiary”), a wholly-owned subsidiary of the Fund organized under the laws of the Cayman Islands. Matters affecting the Fund or each class will be voted on exclusively by the shareholders of the Fund or each class.
The Fund will seek to gain exposure to the commodity markets primarily through investments in the Subsidiary. The Subsidiary was organized by the Fund to invest in commodity-linked derivatives and other securities that may provide leveraged and non-leveraged exposure to commodities. The Fund may invest up to 25% of its total assets in the Subsidiary.
The Fund’s investment objective is to provide total return with a low to moderate correlation to traditional financial market indices.
The Fund currently consists of six different classes of shares: Class A, Class C, Class R, Class Y, Class R5 and Class R6. Class Y shares are available only to certain investors. Class A shares are sold with a front-end sales charge unless certain waiver criteria are met. Under certain circumstances, load waived shares may be subject to contingent deferred sales charges (“CDSC”). Class C shares are sold with a CDSC. Class R, Class Y, Class R5 and Class R6 shares are sold at net asset value. Class C shares held for eight years after purchase are eligible for automatic conversion into Class A shares of the same Fund (the “Conversion Feature”). The automatic conversion pursuant to the Conversion Feature will generally occur at the end of the month following the eighth anniversary after a purchase of Class C shares.
The Fund is an investment company and accordingly follows the investment company accounting and reporting guidance in accordance with Financial Accounting Standards Board Accounting Standards Codification Topic 946, Financial Services – Investment Companies.
The following is a summary of the significant accounting policies followed by the Fund in the preparation of its consolidated financial statements.
| A. | Security Valuations – Securities, including restricted securities, are valued according to the following policy. |
Fixed income securities (including convertible debt securities) generally are valued on the basis of prices provided by independent pricing services. Prices provided by the pricing service may be determined without exclusive reliance on quoted prices, and may reflect appropriate factors such as institution-size trading in similar groups of securities, developments related to specific securities, dividend rate (for unlisted equities), yield (for debt obligations), quality, type of issue, coupon rate (for debt obligations), maturity (for debt obligations), individual trading characteristics and other market data. Pricing services generally value debt obligations assuming orderly transactions of institutional round lot size, but a fund may hold or transact in the same securities in smaller, odd lot sizes. Odd lots often trade at lower prices than institutional round lots, and their value may be adjusted accordingly. Debt obligations are subject to interest rate and credit risks. In addition, all debt obligations involve some risk of default with respect to interest and/or principal payments.
A security listed or traded on an exchange is generally valued at its trade price or official closing price that day as of the close of the exchange where the security is principally traded, or lacking any trades or official closing price on a particular day, the security may be valued at the closing bid price on that day. Securities traded in the over-the-counter market are valued based on prices furnished by independent pricing services or market makers. When such securities are valued using prices provided by an independent pricing service they may be considered fair valued. Futures contracts are valued at the daily settlement price set by an exchange on which they are principally traded. U.S. exchange-traded options are valued at the mean between the last bid and asked prices from the exchange on which they are principally traded. Non-U.S. exchange-traded options are valued at the final settlement price set by the exchange on which they trade. Options not listed on an exchange and swaps generally are valued using pricing provided from independent pricing services.
Securities of investment companies that are not exchange-traded (e.g., open-end mutual funds) are valued using such company’s end-of-business-day net asset value per share.
Deposits, other obligations of U.S. and non-U.S. banks and financial institutions are valued at their daily account value.
Swap agreements are fair valued using an evaluated quote, if available, provided by an independent pricing service. Evaluated quotes provided by the pricing service are valued based on a model which may include end-of-day net present values, spreads, ratings, industry, company performance and returns of referenced assets. Centrally cleared swap agreements are valued at the daily settlement price determined by the relevant exchange or clearinghouse.
Foreign securities’ (including foreign exchange contracts) prices are converted into U.S. dollar amounts using the applicable exchange rates as of the close of the New York Stock Exchange (“NYSE”). If market quotations are available and reliable for foreign exchange-traded equity securities, the securities will be valued at the market quotations. Invesco Advisers, Inc. (the “Adviser” or “Invesco”) may use various pricing services to obtain market quotations as well as fair value prices. Because trading hours for certain foreign securities end before the close of the NYSE, closing market quotations may become not representative of market value in the Adviser’s judgment (“unreliable”). If between the time trading ends on a particular security and the close of the customary trading session on the NYSE, a significant event occurs that makes the closing price of the security unreliable, the Adviser may fair value the security. If the event is likely to have affected the closing price of the security, the security will be valued at fair value in good faith in accordance with Board-approved policies and related Adviser procedures (“Valuation Procedures”). Adjustments to closing prices to reflect fair value may also be based on a screening process of an independent pricing service to indicate the degree of certainty, based on historical data, that the closing price in the principal market where a foreign security trades is not the current value as of the close of the NYSE. Foreign securities’ prices meeting the degree of certainty that the price is not reflective of current value will be priced at the indication of fair value from the independent pricing service. Multiple factors may be considered by the independent pricing service in determining adjustments to reflect fair value and may include information relating to sector indices, American Depositary Receipts and domestic and foreign index futures. Foreign securities may have additional risks including exchange rate changes, potential for sharply devalued currencies and high inflation, political and economic upheaval, the relative lack of issuer information, relatively low market liquidity and the potential lack of strict financial and accounting controls and standards.
Unlisted securities will be valued using prices provided by independent pricing services or by another method that the Adviser, in its judgment, believes better reflects the security’s fair value in accordance with the Valuation Procedures.
Securities for which market prices are not provided by any of the above methods may be valued based upon quotes furnished by independent sources. The last bid price may be used to value equity securities. The mean between the last bid and asked prices may be used to value debt obligations, including corporate loans.
Securities for which market quotations are not readily available are fair valued by the Adviser in accordance with the Valuation Procedures. If a fair value price provided by a pricing service is unreliable, the Adviser will fair value the security using the Valuation Procedures. Issuer specific events, market trends, bid/asked quotes of brokers and information providers and other market data may be reviewed in the course of making a good faith determination of a security’s fair value.
The Fund may invest in securities that are subject to interest rate risk, meaning the risk that the prices will generally fall as interest rates rise and, conversely, the prices will generally rise as interest rates fall. Specific securities differ in their sensitivity to changes in interest rates depending on their individual characteristics. Changes in interest rates may result in increased market volatility, which may affect the value and/or liquidity of certain Fund investments.
Valuations change in response to many factors including the historical and prospective earnings of the issuer, the value of the issuer’s assets, general market conditions which are not specifically related to the particular issuer, such as real or perceived adverse economic conditions, changes in the general outlook for revenues or corporate earnings, changes in interest or currency rates, regional or global instability, natural or environmental disasters, widespread disease or other public health issues, war, acts of terrorism, significant governmental actions or adverse investor sentiment generally and market liquidity. Because of the
| | |
| 21 | | Invesco Balanced-Risk Allocation Fund |
inherent uncertainties of valuation, the values reflected in the consolidated financial statements may materially differ from the value received upon actual sale of those investments.
The price the Fund could receive upon the sale of any investment may differ from the Adviser’s valuation of the investment, particularly for securities that are valued using a fair valuation technique. When fair valuation techniques are applied, the Adviser uses available information, including both observable and unobservable inputs and assumptions, to determine a methodology that will result in a valuation that the Adviser believes approximates market value. Fund securities that are fair valued may be subject to greater fluctuation in their value from one day to the next than would be the case if market quotations were used. Because of the inherent uncertainties of valuation, and the degree of subjectivity in such decisions, the Fund could realize a greater or lesser than expected gain or loss upon the sale of the investment.
| B. | Securities Transactions and Investment Income – Securities transactions are accounted for on a trade date basis. Realized gains or losses on sales are computed on the basis of specific identification of the securities sold. Interest income (net of withholding tax, if any) is recorded on an accrual basis from settlement date and includes coupon interest and amortization of premium and accretion of discount on debt securities as applicable. Pay-in-kind interest income and non-cash dividend income received in the form of securities in-lieu of cash are recorded at the fair value of the securities received. Dividend income (net of withholding tax, if any) is recorded on the ex-dividend date. |
The Fund may periodically participate in litigation related to Fund investments. As such, the Fund may receive proceeds from litigation settlements. Any proceeds received are included in the Consolidated Statement of Operations as realized gain (loss) for investments no longer held and as unrealized gain (loss) for investments still held.
Brokerage commissions and mark ups are considered transaction costs and are recorded as an increase to the cost basis of securities purchased and/or a reduction of proceeds on a sale of securities. Such transaction costs are included in the determination of net realized and unrealized gain (loss) from investment securities reported in the Consolidated Statement of Operations and the Consolidated Statement of Changes in Net Assets and the net realized and unrealized gains (losses) on securities per share in the Consolidated Financial Highlights. Transaction costs are included in the calculation of the Fund’s net asset value and, accordingly, they reduce the Fund’s total returns. These transaction costs are not considered operating expenses and are not reflected in net investment income reported in the Consolidated Statement of Operations and the Consolidated Statement of Changes in Net Assets, or the net investment income per share and the ratios of expenses and net investment income reported in the Consolidated Financial Highlights, nor are they limited by any expense limitation arrangements between the Fund and the investment adviser.
The Fund allocates income and realized and unrealized capital gains and losses to a class based on the relative net assets of each class.
| C. | Country Determination – For the purposes of making investment selection decisions and presentation in the Consolidated Schedule of Investments, the investment adviser may determine the country in which an issuer is located and/or credit risk exposure based on various factors. These factors include the laws of the country under which the issuer is organized, where the issuer maintains a principal office, the country in which the issuer derives 50% or more of its total revenues, the country that has the primary market for the issuer’s securities and its “country of risk” as determined by a third party service provider, as well as other criteria. Among the other criteria that may be evaluated for making this determination are the country in which the issuer maintains 50% or more of its assets, the type of security, financial guarantees and enhancements, the nature of the collateral and the sponsor organization. Country of issuer and/or credit risk exposure has been determined to be the United States of America, unless otherwise noted. |
| D. | Distributions – Distributions from net investment income and net realized capital gain, if any, are generally declared and paid annually and recorded on the ex-dividend date. The Fund may elect to treat a portion of the proceeds from redemptions as distributions for federal income tax purposes. |
| E. | Federal Income Taxes – The Fund intends to comply with the requirements of Subchapter M of the Internal Revenue Code of 1986, as amended (the “Internal Revenue Code”), necessary to qualify as a regulated investment company and to distribute substantially all of the Fund’s taxable earnings to shareholders. As such, the Fund will not be subject to federal income taxes on otherwise taxable income (including net realized capital gain) that is distributed to shareholders. Therefore, no provision for federal income taxes is recorded in the consolidated financial statements. |
The Fund recognizes the tax benefits of uncertain tax positions only when the position is more likely than not to be sustained. Management has analyzed the Fund’s uncertain tax positions and concluded that no liability for unrecognized tax benefits should be recorded related to uncertain tax positions. Management is not aware of any tax positions for which it is reasonably possible that the total amounts of unrecognized tax benefits will change materially in the next 12 months.
The Subsidiary is classified as a controlled foreign corporation under Subchapter N of the Internal Revenue Code. Therefore, the Fund is required to increase its taxable income by its share of the Subsidiary’s income. Net investment losses of the Subsidiary cannot be deducted by the Fund in the current period nor carried forward to offset taxable income in future periods.
The Fund files tax returns in the U.S. Federal jurisdiction and certain other jurisdictions. Generally the Fund is subject to examinations by such taxing authorities for up to three years after the filing of the return for the tax period.
| F. | Expenses – Fees provided for under the Rule 12b-1 plan of a particular class of the Fund are charged to the operations of such class. Transfer agency fees and expenses and other shareholder recordkeeping fees and expenses attributable to Class R5 and Class R6 are allocated based on relative net assets of Class R5 and Class R6. Sub-accounting fees attributable to Class R5 are charged to the operations of the class. Transfer agency fees and expenses and other shareholder recordkeeping fees and expenses relating to all other classes are allocated among those classes based on relative net assets. All other expenses are allocated among the classes based on relative net assets. |
| G. | Accounting Estimates – The financial statements are prepared on a consolidated basis in conformity with accounting principles generally accepted in the United States of America (“GAAP”), which requires management to make estimates and assumptions that affect the reported amounts of assets and liabilities at the date of the financial statements and the reported amounts of revenues and expenses during the reporting period including estimates and assumptions related to taxation. Actual results could differ from those estimates by a significant amount. The accompanying financial statements reflect the financial position of the Fund and its Subsidiary and the results of operations on a consolidated basis. All inter-company accounts and transactions have been eliminated in consolidation. |
In addition, the Fund monitors for material events or transactions that may occur or become known after the period-end date and before the date the consolidated financial statements are released to print.
| H. | Indemnifications – Under the Trust’s organizational documents, each Trustee, officer, employee or other agent of the Trust, and under the Subsidiary’s organizational documents, the directors and officers of the Subsidiary, are indemnified against certain liabilities that may arise out of the performance of their duties to the Fund and/or the Subsidiary, respectively. Additionally, in the normal course of business, the Fund enters into contracts, including the Fund’s servicing agreements, that contain a variety of indemnification clauses. The Fund’s maximum exposure under these arrangements is unknown as this would involve future claims that may be made against the Fund that have not yet occurred. The risk of material loss as a result of such indemnification claims is considered remote. |
| I. | Structured Securities – The Fund may invest in structured securities. Structured securities are a type of derivative security whose value is determined by reference to changes in the value of underlying securities, currencies, interest rates, commodities, indices or other financial indicators (“reference instruments”). Most structured securities are fixed-income securities that have maturities of three years or less. Structured securities may be positively or negatively indexed (i.e., their principal value or interest rates may increase or decrease if the underlying reference instrument appreciates) and may have return characteristics similar to direct investments in the underlying reference instrument. |
Structured securities may entail a greater degree of market risk than other types of debt securities because the investor bears the risk of the reference instruments. In addition to the credit risk of structured securities and the normal risks of price changes in response to changes in interest rates, the principal amount of structured notes or indexed securities may decrease as a result of changes in the value of the underlying reference instruments. Changes in the daily
| | |
| 22 | | Invesco Balanced-Risk Allocation Fund |
value of structured securities are recorded as unrealized gains (losses) in the Consolidated Statement of Operations. When the structured securities mature or are sold, the Fund recognizes a realized gain (loss) on the Consolidated Statement of Operations.
| J. | Foreign Currency Translations – Foreign currency is valued at the close of the NYSE based on quotations posted by banks and major currency dealers. Portfolio securities and other assets and liabilities denominated in foreign currencies are translated into U.S. dollar amounts at the date of valuation. Purchases and sales of portfolio securities (net of foreign taxes withheld on disposition) and income items denominated in foreign currencies are translated into U.S. dollar amounts on the respective dates of such transactions. The Fund does not separately account for the portion of the results of operations resulting from changes in foreign exchange rates on investments and the fluctuations arising from changes in market prices of securities held. The combined results of changes in foreign exchange rates and the fluctuation of market prices on investments (net of estimated foreign tax withholding) are included with the net realized and unrealized gain or loss from investments in the Consolidated Statement of Operations. Reported net realized foreign currency gains or losses arise from (1) sales of foreign currencies, (2) currency gains or losses realized between the trade and settlement dates on securities transactions, and (3) the difference between the amounts of dividends, interest, and foreign withholding taxes recorded on the Fund’s books and the U.S. dollar equivalent of the amounts actually received or paid. Net unrealized foreign currency gains and losses arise from changes in the fair values of assets and liabilities, other than investments in securities at fiscal period end, resulting from changes in exchange rates. |
The Fund may invest in foreign securities, which may be subject to foreign taxes on income, gains on investments or currency repatriation, a portion of which may be recoverable. Foreign taxes, if any, are recorded based on the tax regulations and rates that exist in the foreign markets in which the Fund invests and are shown in the Consolidated Statement of Operations.
| K. | Forward Foreign Currency Contracts – The Fund may engage in foreign currency transactions either on a spot (i.e. for prompt delivery and settlement) basis, or through forward foreign currency contracts, to manage or minimize currency or exchange rate risk. |
The Fund may also enter into forward foreign currency contracts for the purchase or sale of a security denominated in a foreign currency in order to “lock in” the U.S. dollar price of that security, or the Fund may also enter into forward foreign currency contracts that do not provide for physical exchange of the two currencies on the settlement date, but instead are settled by a single cash payment calculated as the difference between the agreed upon exchange rate and the spot rate at settlement based upon an agreed upon notional amount (non-deliverable forwards).
A forward foreign currency contract is an obligation between two parties (“Counterparties”) to purchase or sell a specific currency for an agreed-upon price at a future date. The use of forward foreign currency contracts for hedging does not eliminate fluctuations in the price of the underlying securities the Fund owns or intends to acquire but establishes a rate of exchange in advance. Fluctuations in the value of these contracts are measured by the difference in the contract date and reporting date exchange rates and are recorded as unrealized appreciation (depreciation) until the contracts are closed. When the contracts are closed, realized gains (losses) are recorded. Realized and unrealized gains (losses) on the contracts are included in the Consolidated Statement of Operations. The primary risks associated with forward foreign currency contracts include failure of the Counterparty to meet the terms of the contract and the value of the foreign currency changing unfavorably. These risks may be in excess of the amounts reflected in the Consolidated Statement of Assets and Liabilities.
| L. | Futures Contracts – The Fund may enter into futures contracts to equitize the Fund’s cash holdings or to manage exposure to interest rate, equity, commodity and market price movements and/or currency risks. A futures contract is an agreement between Counterparties to purchase or sell a specified underlying security, currency or commodity (or delivery of a cash settlement price, in the case of an index future) for a fixed price at a future date. The Fund currently invests only in exchange-traded futures and they are standardized as to maturity date and underlying financial instrument or asset. Initial margin deposits required upon entering into futures contracts are satisfied by the segregation of specific securities or cash as collateral at the futures commission merchant (broker). During the period the futures contracts are open, changes in the value of the contracts are recognized as unrealized gains or losses by recalculating the value of the contracts on a daily basis. Subsequent or variation margin payments are received or made depending upon whether unrealized gains or losses are incurred. These amounts are reflected as receivables or payables on the Consolidated Statement of Assets and Liabilities. When the contracts are closed or expire, the Fund recognizes a realized gain or loss equal to the difference between the proceeds from, or cost of, the closing transaction and the Fund’s basis in the contract. The net realized gain (loss) and the change in unrealized gain (loss) on futures contracts held during the period is included on the Consolidated Statement of Operations. The primary risks associated with futures contracts are market risk and the absence of a liquid secondary market. If the Fund were unable to liquidate a futures contract and/or enter into an offsetting closing transaction, the Fund would continue to be subject to market risk with respect to the value of the contracts and continue to be required to maintain the margin deposits on the futures contracts. Futures contracts have minimal Counterparty risk since the exchange’s clearinghouse, as Counterparty to all exchange-traded futures, guarantees the futures against default. Risks may exceed amounts recognized in the Consolidated Statement of Assets and Liabilities. |
| M. | Put Options Purchased – The Fund may purchase put options including options on securities indexes, or foreign currency and/or futures contracts. By purchasing a put option, the Fund obtains the right (but not the obligation) to sell the option’s underlying instrument at a fixed strike price. In return for this right, the Fund pays an option premium. The option’s underlying instrument may be a security, securities index, or a futures contract. Put options may be used by the Fund to hedge securities it owns by locking in a minimum price at which the Fund can sell. If security prices fall, the put option could be exercised to offset all or a portion of the Fund’s resulting losses. At the same time, because the maximum the Fund has at risk is the cost of the option, purchasing put options does not eliminate the potential for the Fund to profit from an increase in the value of the securities hedged. Realized and unrealized gains and losses on put options purchased are included in the Consolidated Statement of Operations as Net realized gain (loss) from and Change in net unrealized appreciation (depreciation) of Investment securities. A risk in buying an option is that the Fund pays a premium whether or not the option is exercised. In addition, there can be no assurance that a liquid secondary market will exist for any option purchased. |
| N. | Swap Agreements – The Fund may enter into various swap transactions, including interest rate, total return, index, currency and credit default swap contracts (“CDS”) for investment purposes or to manage interest rate, currency, commodity or credit risk. Such transactions are agreements between Counterparties. These agreements may contain among other conditions, events of default and termination events, and various covenants and representations such as provisions that require the Fund to maintain a pre-determined level of net assets, and/or provide limits regarding the decline of the Fund’s net asset value (“NAV”) per share over specific periods of time. If the Fund were to trigger such provisions and have open derivative positions at that time, the Counterparty may be able to terminate such agreement and request immediate payment in an amount equal to the net liability positions, if any. |
Interest rate, total return, index, and currency swap agreements are two-party contracts entered into primarily to exchange the returns (or differentials in rates of returns) earned or realized on particular predetermined investments or instruments. The gross returns to be exchanged or “swapped” between the parties are calculated with respect to a notional amount, i.e., the return on or increase in value of a particular dollar amount invested at a particular interest rate or return of an underlying asset, in a particular foreign currency, or in a “basket” of securities representing a particular index. At the maturity date, a net cash flow is exchanged where the total return is equivalent to the return of the underlying reference less a financing rate, if any. As a receiver, the Fund would receive payments based on any positive total return and would owe payments in the event of a negative total return. As the payer, the Fund would owe payments on any net positive total return, and would receive payment in the event of a negative total return.
A total return swap is an agreement in which one party makes payments based on a set rate, either fixed or variable, while the other party makes payments based on the return of an underlying asset, which includes both the income generated and capital gains, if any. The unrealized appreciation (depreciation) on total return swaps includes dividends on the underlying securities and financing rate payable from the Counterparty. At the maturity date, a net cash flow is exchanged where the total return is equivalent to the return of the underlying reference less a financing rate, if any. As a receiver, the Fund would receive payments based on any positive total return and would owe payments in the event of a negative total return. As the payer, the Fund would owe payments on any net positive total return, and would receive payment in the event of a negative total return.
| | |
| 23 | | Invesco Balanced-Risk Allocation Fund |
Changes in the value of swap agreements are recognized as unrealized gains (losses) in the Consolidated Statement of Operations by “marking to market“ on a daily basis to reflect the value of the swap agreement at the end of each trading day. Payments received or paid at the beginning of the agreement are reflected as such on the Consolidated Statement of Assets and Liabilities and may be referred to as upfront payments. The Fund accrues for the fixed payment stream and amortizes upfront payments, if any, on swap agreements on a daily basis with the net amount, recorded as a component of realized gain (loss) on the Consolidated Statement of Operations. A liquidation payment received or made at the termination of a swap agreement is recorded as realized gain (loss) on the Consolidated Statement of Operations. Cash held as collateral is recorded as deposits with brokers on the Consolidated Statement of Assets and Liabilities. Entering into these agreements involves, to varying degrees, lack of liquidity and elements of credit, market, and Counterparty risk in excess of amounts recognized on the Consolidated Statement of Assets and Liabilities. Such risks involve the possibility that a swap is difficult to sell or liquidate; the Counterparty does not honor its obligations under the agreement and unfavorable interest rates and market fluctuations. It is possible that developments in the swaps market, including potential government regulation, could adversely affect the Fund’s ability to terminate existing swap agreements or to realize amounts to be received under such agreements. Additionally, an International Swaps and Derivatives Association Master Agreement (“ISDA Master Agreement”) includes credit related contingent features which allow Counterparties to OTC derivatives to terminate derivative contracts prior to maturity in the event that, for example, the Fund’s net assets decline by a stated percentage or the Fund fails to meet the terms of its ISDA master agreements, which would cause the Fund to accelerate payment of any net liability owed to the Counterparty. A short position in a security poses more risk than holding the same security long. As there is no limit on how much the price of the security can increase, the Fund’s exposure is unlimited.
| O. | Leverage Risk – Leverage exists when the Fund can lose more than it originally invests because it purchases or sells an instrument or enters into a transaction without investing an amount equal to the full economic exposure of the instrument or transaction. |
| P. | Other Risks – The Fund will seek to gain exposure to commodity markets primarily through an investment in the Subsidiary and through investments in commodity futures and swaps, commodity related exchange-traded funds and exchange-traded notes and commodity linked notes, some or all of which will be owned through the Subsidiary. The Subsidiary, unlike the Fund, may invest without limitation in commodities, commodity-linked derivatives and other securities, such as exchange-traded and commodity-linked notes, that may provide leveraged and non-leveraged exposure to commodity markets. The Fund is indirectly exposed to the risks associated with the Subsidiary’s investments. |
During the period, the Fund experienced a low interest rate environment created in part by the Federal Reserve Board (FRB) and certain foreign central banks keeping the federal funds and equivalent foreign rates near historical lows. Increases in the federal funds and equivalent foreign rates may expose fixed income markets to heightened volatility and reduced liquidity for certain fixed income investments, particularly those with longer maturities. In addition, decreases in fixed income dealer market-making capacity may also potentially lead to heightened volatility and reduced liquidity in the fixed income markets. As a result, the value of the Fund’s investments and share price may decline. Changes in central bank policies could also result in higher than normal shareholder redemptions, which could potentially increase portfolio turnover and the Fund’s transaction costs.
Policy changes by the U.S. government or its regulatory agencies and political events within the U.S. and abroad may, among other things, affect investor and consumer confidence and increase volatility in the financial markets, perhaps suddenly and to a significant degree, which may adversely impact the Fund’s operations, universe of potential investment options, and return potential.
In addition to risks associated with the underlying commodities, investments in commodity-linked notes may be subject to additional risks, such as non-payment of interest and loss of principal, counterparty risk, lack of a secondary market and risk of greater volatility than traditional equity and debt securities. The value of the commodity-linked notes the Fund buys may fluctuate significantly because the values of the underlying investments to which they are linked are themselves volatile. Additionally, certain commodity-linked notes employ “economic” leverage by requiring payment by the issuer of an amount that is a multiple of the price increase or decrease of the underlying commodity, commodity index, or other economic variable. Such economic leverage will increase the volatility of the value of these commodity-linked notes and the Fund to the extent it invests in such notes.
| Q. | COVID-19 Risk – The COVID-19 strain of coronavirus has resulted in instances of market closures and dislocations, extreme volatility, liquidity constraints and increased trading costs. Efforts to contain its spread have resulted in travel restrictions, disruptions of healthcare systems, business operations (including business closures) and supply chains, layoffs, lower consumer demand and employee availability, and defaults and credit downgrades, among other significant economic impacts that have disrupted global economic activity across many industries. Such economic impacts may exacerbate other pre-existing political, social and economic risks locally or globally and cause general concern and uncertainty. The full economic impact and ongoing effects of COVID-19 (or other future epidemics or pandemics) at the macro-level and on individual businesses are unpredictable and may result in significant and prolonged effects on the Fund’s performance. |
NOTE 2–Advisory Fees and Other Fees Paid to Affiliates
The Trust has entered into a master investment advisory agreement with the Adviser. Under the terms of the investment advisory agreement, the Fund accrues daily and pays monthly an advisory fee to the Adviser less the amount paid by the Subsidiary to the Adviser based on the annual rate of the Fund’s average daily net assets as follows:
| | | | |
| Average Daily Net Assets | | Rate | |
|
| |
First $250 million | | | 0.950% | |
|
| |
Next $250 million | | | 0.925% | |
|
| |
Next $500 million | | | 0.900% | |
|
| |
Next $1.5 billion | | | 0.875% | |
|
| |
Next $2.5 billion | | | 0.850% | |
|
| |
Next $2.5 billion | | | 0.825% | |
|
| |
Next $2.5 billion | | | 0.800% | |
|
| |
Over $10 billion | | | 0.775% | |
|
| |
For the year ended October 31, 2022, the effective advisory fee rate incurred by the Fund was 0.90%.
The Subsidiary has entered into a separate contract with the Adviser whereby the Adviser provides investment advisory and other services to the Subsidiary. In consideration of these services, the Subsidiary pays an advisory fee to the Adviser based on the annual rate of the Subsidiary’s average daily net assets as set forth in the table above.
Under the terms of a master sub-advisory agreement between the Adviser and each of Invesco Asset Management Deutschland GmbH, Invesco Asset Management Limited, Invesco Asset Management (Japan) Limited, Invesco Hong Kong Limited, Invesco Senior Secured Management, Inc. and Invesco Canada Ltd. and separate sub-advisory agreements with Invesco Capital Management LLC and Invesco Asset Management (India) Private Limited (collectively, the “Affiliated Sub-Advisers”) the Adviser, not the Fund, will pay 40% of the fees paid to the Adviser to any such Affiliated Sub-Adviser(s) that provide(s) discretionary investment management services to the Fund based on the percentage of assets allocated to such Affiliated Sub-Adviser(s).
The Adviser has contractually agreed, through at least June 30, 2023, to waive advisory fees and/or reimburse expenses to the extent necessary to limit total annual fund operating expenses after fee waiver and/or expense reimbursement (excluding certain items discussed below) of Class A, Class C, Class R, Class Y, Class R5
| | |
| 24 | | Invesco Balanced-Risk Allocation Fund |
and Class R6 shares to 2.00%, 2.75%, 2.25%, 1.75%, 1.75% and 1.75%, respectively, of the Fund’s average daily net assets (the “expense limits”). In determining the Adviser’s obligation to waive advisory fees and/or reimburse expenses, the following expenses are not taken into account, and could cause the total annual fund operating expenses after fee waiver and/or expense reimbursement to exceed the numbers reflected above: (1) interest; (2) taxes; (3) dividend expense on short sales; (4) extraordinary or non-routine items, including litigation expenses; and (5) expenses that the Fund has incurred but did not actually pay because of an expense offset arrangement. Acquired Fund Fees and Expenses are not operating expenses of the Fund directly, but are fees and expenses, including management fees of the investment companies in which the Fund invests. As a result, the total annual fund operating expenses after expense reimbursement may exceed the expense limits above. Unless Invesco continues the fee waiver agreement, it will terminate on June 30, 2023. During its term, the fee waiver agreement cannot be terminated or amended to increase the expense limits or reduce the advisory fee waiver without approval of the Board of Trustees. The Adviser did not waive fees and/or reimburse expenses during the period under these expense limits.
Further, the Adviser has contractually agreed, through at least June 30, 2024, to waive the advisory fee payable by the Fund in an amount equal to 100% of the net advisory fees the Adviser receives from the affiliated money market funds on investments by the Fund of uninvested cash in such affiliated money market funds.
For the year ended October 31, 2022, the Adviser waived advisory fees of $810,989.
The Trust has entered into a master administrative services agreement with Invesco pursuant to which the Fund has agreed to pay Invesco for certain administrative costs incurred in providing accounting services to the Fund. For the year ended October 31, 2022, expenses incurred under the agreement are shown in the Consolidated Statement of Operations as Administrative services fees. Invesco has entered into a sub-administration agreement whereby State Street Bank and Trust Company (“SSB”) serves as fund accountant and provides certain administrative services to the Fund. Pursuant to a custody agreement with the Trust on behalf of the Fund, SSB also serves as the Fund’s custodian.
The Trust has entered into a transfer agency and service agreement with Invesco Investment Services, Inc. (“IIS”) pursuant to which the Fund has agreed to pay IIS a fee for providing transfer agency and shareholder services to the Fund and reimburse IIS for certain expenses incurred by IIS in the course of providing such services. IIS may make payments to intermediaries that provide omnibus account services, sub-accounting services and/or networking services. All fees payable by IIS to intermediaries that provide omnibus account services or sub-accounting services are charged back to the Fund, subject to certain limitations approved by the Trust’s Board of Trustees. For the year ended October 31, 2022, expenses incurred under the agreement are shown in the Consolidated Statement of Operations as Transfer agent fees.
The Trust has entered into master distribution agreements with Invesco Distributors, Inc. (“IDI”) to serve as the distributor for the Class A, Class C, Class R, Class Y, Class R5 and Class R6 shares of the Fund. The Trust has adopted plans pursuant to Rule 12b-1 under the 1940 Act with respect to the Fund’s Class A, Class C and Class R shares (collectively, the “Plans”). The Fund, pursuant to the Plans, pays IDI compensation at the annual rate of 0.25% of the Fund’s average daily net assets of Class A shares, 1.00% of the average daily net assets of Class C shares and 0.50% of the average daily net assets of Class R shares. The fees are accrued daily and paid monthly. Of the Plan payments, up to 0.25% of the average daily net assets of each class of shares may be paid to furnish continuing personal shareholder services to customers who purchase and own shares of such classes. Any amounts not paid as a service fee under the Plans would constitute an asset-based sales charge. Rules of the Financial Industry Regulatory Authority (“FINRA”) impose a cap on the total sales charges, including asset-based sales charges, that may be paid by any class of shares of the Fund. For the year ended October 31, 2022, expenses incurred under the Plans are shown in the Consolidated Statement of Operations as Distribution fees.
Front-end sales commissions and CDSC (collectively, the “sales charges”) are not recorded as expenses of the Fund. Front-end sales commissions are deducted from proceeds from the sales of Fund shares prior to investment in Class A shares of the Fund. CDSC are deducted from redemption proceeds prior to remittance to the shareholder. During the year ended October 31, 2022, IDI advised the Fund that IDI retained $126,431 in front-end sales commissions from the sale of Class A shares and $1,837 and $9,945 from Class A and Class C shares, respectively, for CDSC imposed upon redemptions by shareholders.
Certain officers and trustees of the Trust are officers and directors of the Adviser, IIS and/or IDI.
NOTE 3–Additional Valuation Information
GAAP defines fair value as the price that would be received to sell an asset or paid to transfer a liability in an orderly transaction between market participants at the measurement date, under current market conditions. GAAP establishes a hierarchy that prioritizes the inputs to valuation methods, giving the highest priority to readily available unadjusted quoted prices in an active market for identical assets (Level 1) and the lowest priority to significant unobservable inputs (Level 3), generally when market prices are not readily available. Based on the valuation inputs, the securities or other investments are tiered into one of three levels. Changes in valuation methods may result in transfers in or out of an investment’s assigned level:
| | |
| Level 1 - | | Prices are determined using quoted prices in an active market for identical assets. |
| Level 2 - | | Prices are determined using other significant observable inputs. Observable inputs are inputs that other market participants may use in pricing a security. These may include quoted prices for similar securities, interest rates, prepayment speeds, credit risk, yield curves, loss severities, default rates, discount rates, volatilities and others. |
Level 3 - | | Prices are determined using significant unobservable inputs. In situations where quoted prices or observable inputs are unavailable (for example, when there is little or no market activity for an investment at the end of the period), unobservable inputs may be used. Unobservable inputs reflect the Adviser’s assumptions about the factors market participants would use in determining fair value of the securities or instruments and would be based on the best available information. |
The following is a summary of the tiered valuation input levels, as of October 31, 2022. The level assigned to the securities valuations may not be an indication of the risk or liquidity associated with investing in those securities. Because of the inherent uncertainties of valuation, the values reflected in the consolidated financial statements may materially differ from the value received upon actual sale of those investments.
| | | | | | | | | | | | | | | | |
| | | Level 1 | | | Level 2 | | | Level 3 | | | Total | |
|
| |
Investments in Securities | | | | | | | | | | | | | | | | |
|
| |
U.S. Treasury Securities | | $ | – | | | $ | 624,692,979 | | | | $– | | | $ | 624,692,979 | |
|
| |
Commodity-Linked Securities | | | – | | | | 68,358,809 | | | | – | | | | 68,358,809 | |
|
| |
Money Market Funds | | | 976,870,635 | | | | – | | | | – | | | | 976,870,635 | |
|
| |
Options Purchased | | | 33,248,201 | | | | – | | | | – | | | | 33,248,201 | |
|
| |
Total Investments in Securities | | | 1,010,118,836 | | | | 693,051,788 | | | | – | | | | 1,703,170,624 | |
|
| |
| | | | |
Other Investments – Assets* | | | | | | | | | | | | | | | | |
|
| |
Futures Contracts | | | 6,775,896 | | | | – | | | | – | | | | 6,775,896 | |
|
| |
Swap Agreements | | | – | | | | 12,809,963 | | | | – | | | | 12,809,963 | |
|
| |
| | | 6,775,896 | | | | 12,809,963 | | | | – | | | | 19,585,859 | |
|
| |
| | |
| 25 | | Invesco Balanced-Risk Allocation Fund |
| | | | | | | | | | | | | | | | |
| | | Level 1 | | | Level 2 | | | Level 3 | | | Total | |
|
| |
Other Investments - Liabilities* | | | | | | | | | | | | | | | | |
|
| |
Futures Contracts | | $ | (56,454,909 | ) | | $ | – | | | | $– | | | $ | (56,454,909 | ) |
|
| |
Swap Agreements | | | – | | | | (1,164,407 | ) | | | – | | | | (1,164,407 | ) |
|
| |
| | | (56,454,909 | ) | | | (1,164,407 | ) | | | – | | | | (57,619,316 | ) |
|
| |
Total Other Investments | | | (49,679,013 | ) | | | 11,645,556 | | | | – | | | | (38,033,457 | ) |
|
| |
Total Investments | | $ | 960,439,823 | | | $ | 704,697,344 | | | | $– | | | $ | 1,665,137,167 | |
|
| |
| * | Unrealized appreciation (depreciation). |
NOTE 4–Derivative Investments
The Fund may enter into an ISDA Master Agreement under which a fund may trade OTC derivatives. An OTC transaction entered into under an ISDA Master Agreement typically involves a collateral posting arrangement, payment netting provisions and close-out netting provisions. These netting provisions allow for reduction of credit risk through netting of contractual obligations. The enforceability of the netting provisions of the ISDA Master Agreement depends on the governing law of the ISDA Master Agreement, among other factors.
For financial reporting purposes, the Fund does not offset OTC derivative assets or liabilities that are subject to ISDA Master Agreements in the Consolidated Statement of Assets and Liabilities.
Value of Derivative Investments at Period-End
The table below summarizes the value of the Fund’s derivative investments, detailed by primary risk exposure, held as of October 31, 2022:
| | | | | | | | | | | | | | | | |
| | | Value | |
| | | Commodity | | | Equity | | | Interest | | | | |
| Derivative Assets | | Risk | | | Risk | | | Rate Risk | | | Total | |
|
| |
Unrealized appreciation on futures contracts – Exchange-Traded(a) | | $ | 6,567,850 | | | $ | 51,590 | | | $ | 156,456 | | | $ | 6,775,896 | |
|
| |
Unrealized appreciation on swap agreements – OTC | | | 292,932 | | | | 12,517,031 | | | | – | | | | 12,809,963 | |
|
| |
Options purchased, at value – Exchange-Traded(b) | | | – | | | | 33,248,201 | | | | – | | | | 33,248,201 | |
|
| |
Total Derivative Assets | | | 6,860,782 | | | | 45,816,822 | | | | 156,456 | | | | 52,834,060 | |
|
| |
Derivatives not subject to master netting agreements | | | (6,567,850 | ) | | | (33,299,791 | ) | | | (156,456 | ) | | | (40,024,097 | ) |
|
| |
Total Derivative Assets subject to master netting agreements | | $ | 292,932 | | | $ | 12,517,031 | | | $ | – | | | $ | 12,809,963 | |
|
| |
| | | | | | | | | | | | | | | | |
| | | Value | |
| | | Commodity | | | Equity | | | Interest | | | | |
| Derivative Liabilities | | Risk | | | Risk | | | Rate Risk | | | Total | |
|
| |
Unrealized depreciation on futures contracts – Exchange-Traded(a) | | $ | (3,507,892 | ) | | $ | (8,700,517 | ) | | $ | (44,246,500 | ) | | $ | (56,454,909 | ) |
|
| |
Unrealized depreciation on swap agreements – OTC | | | (411,034 | ) | | | (753,373 | ) | | | – | | | | (1,164,407 | ) |
|
| |
Total Derivative Liabilities | | | (3,918,926 | ) | | | (9,453,890 | ) | | | (44,246,500 | ) | | | (57,619,316 | ) |
|
| |
Derivatives not subject to master netting agreements | | | 3,507,892 | | | | 8,700,517 | | | | 44,246,500 | | | | 56,454,909 | |
|
| |
Total Derivative Liabilities subject to master netting agreements | | $ | (411,034 | ) | | $ | (753,373 | ) | | $ | – | | | $ | (1,164,407 | ) |
|
| |
| (a) | The daily variation margin receivable (payable) at period-end is recorded in the Consolidated Statement of Assets and Liabilities. |
| (b) | Options purchased, at value as reported in the Consolidated Schedule of Investments. |
Offsetting Assets and Liabilities
The table below reflects the Fund’s exposure to Counterparties subject to either an ISDA Master Agreement or other agreement for OTC derivative transactions as of October 31, 2022.
| | | | | | | | | | | | | | | | | | | | | | | | |
| | | Financial | | | Financial | | | | | | | | | | | | | |
| | | Derivative | | | Derivative | | | | | | Collateral | | | | |
| | | Assets | | | Liabilities | | | | | | (Received)/Pledged | | | | |
| | | Swap | | | Swap | | | Net Value of | | | | | | | | | Net | |
| Counterparty | | Agreements | | | Agreements | | | Derivatives | | | Non-Cash | | | Cash | | | Amount(a) | |
|
| |
Fund | | | | | | | | | | | | | | | | | | | | | | | | |
|
| |
BNP Paribas S.A. | | $ | 4,259,354 | | | $ | (53,655 | ) | | $ | 4,205,699 | | | | $– | | | $ | (4,205,699 | ) | | $ | – | |
|
| |
Citibank, N.A. | | | 586,049 | | | | – | | | | 586,049 | | | | – | | | | (250,000 | ) | | | 336,049 | |
|
| |
Goldman Sachs International | | | 2,537,221 | | | | (172,476 | ) | | | 2,364,745 | | | | – | | | | (1,760,000 | ) | | | 604,745 | |
|
| |
J.P. Morgan Chase Bank, N.A. | | | 3,417,087 | | | | (811,348 | ) | | | 2,605,739 | | | | – | | | | (2,605,739 | ) | | | – | |
|
| |
Merrill Lynch International | | | 1,737,278 | | | | (55,244 | ) | | | 1,682,034 | | | | – | | | | (1,640,000 | ) | | | 42,034 | |
|
| |
Subtotal - Fund | | | 12,536,989 | | | | (1,092,723 | ) | | | 11,444,266 | | | | – | | | | (10,461,438 | ) | | | 982,828 | |
|
| |
Subsidary | | | | | | | | | | | | | | | | | | | | | | | | |
Barclays Bank PLC | | | – | | | | (24,201 | ) | | | (24,201 | ) | | | – | | | | – | | | | (24,201 | ) |
|
| |
Canadian Imperial Bank of Commerce | | | – | | | | (390,688 | ) | | | (390,688 | ) | | | – | | | | – | | | | (390,688 | ) |
|
| |
| | |
| 26 | | Invesco Balanced-Risk Allocation Fund |
| | | | | | | | | | | | | | | | | | | | | | | | |
| | | Financial | | | Financial | | | | | | | | | | | | | |
| | | Derivative | | | Derivative | | | | | | Collateral | | | | |
| | | Assets | | | Liabilities | | | | | | (Received)/Pledged | | | | |
| | | Swap | | | Swap | | | Net Value of | | | | | | | | | Net | |
| Counterparty | | Agreements | | | Agreements | | | Derivatives | | | Non-Cash | | | Cash | | | Amount(a) | |
|
| |
J.P. Morgan Chase Bank, N.A. | | $ | 284,758 | | | $ | (2,215 | ) | | $ | 282,543 | | | | $– | | | $ | (282,543 | ) | | $ | – | |
|
| |
Merrill Lynch International | | | – | | | | (1,975,504 | ) | | | (1,975,504 | ) | | | – | | | | 1,975,504 | | | | – | |
|
| |
Morgan Stanley Capital Services LLC | | | 8,174 | | | | (981 | ) | | | 7,193 | | | | – | | | | – | | | | 7,193 | |
|
| |
Royal Bank of Canada | | | – | | | | (667,829 | ) | | | (667,829 | ) | | | – | | | | 667,829 | | | | – | |
|
| |
Subtotal - Subsidary | | | 292,932 | | | | (3,061,418 | ) | | | (2,768,486 | ) | | | – | | | | 2,360,790 | | | | (407,696 | ) |
|
| |
Total | | $ | 12,829,921 | | | $ | (4,154,141 | ) | | $ | 8,675,780 | | | | $– | | | $ | (8,100,648 | ) | | $ | 575,132 | |
|
| |
| (a) | The Fund and the Subsidiary are recognized as separate legal entities and as such are subject to separate netting arrangements with the Counterparty. |
Effect of Derivative Investments for the year ended October 31, 2022
The table below summarizes the gains (losses) on derivative investments, detailed by primary risk exposure, recognized in earnings during the period:
| | | | | | | | | | | | | | | | |
| | | Location of Gain (Loss) on | |
| | | Consolidated Statement of Operations | |
| | | Commodity | | | Equity | | | Interest | | | | |
| | | Risk | | | Risk | | | Rate Risk | | | Total | |
|
| |
Realized Gain (Loss): | | | | | | | | | | | | | | | | |
Futures contracts | | $ | 48,255,161 | | | $ | (89,205,347 | ) | | $ | (197,134,502 | ) | | $ | (238,084,688 | ) |
|
| |
Options purchased(a) | | | - | | | | (4,749,098 | ) | | | - | | | | (4,749,098 | ) |
|
| |
Swap agreements | | | (1,142 | ) | | | (92,763,738 | ) | | | 1,365,954 | | | | (91,398,926 | ) |
|
| |
Change in Net Unrealized Appreciation (Depreciation): | | | | | | | | | | | | | | | | |
Futures contracts | | | (1,405,340 | ) | | | (15,054,448 | ) | | | 8,915,151 | | | | (7,544,637 | ) |
|
| |
Options purchased(a) | | | - | | | | 17,901,028 | | | | - | | | | 17,901,028 | |
|
| |
Swap agreements | | | 7,315,811 | | | | 634,111 | | | | - | | | | 7,949,922 | |
|
| |
Total | | $ | 54,164,490 | | | $ | (183,237,492 | ) | | $ | (186,853,397 | ) | | $ | (315,926,399 | ) |
|
| |
| (a) | Options purchased, at value as reported in the Consolidated Schedule of Investments. |
The table below summarizes the average notional value of derivatives held during the period.
| | | | | | | | | | | | |
| | | | | | Equity | | | | |
| | | Futures | | | Options | | | Swap | |
| | | Contracts | | | Purchased | | | Agreements | |
|
| |
Average notional value | | $ | 2,068,411,994 | | | $ | 395,680,263 | | | $ | 863,872,979 | |
|
| |
Average contracts | | | – | | | | 3,977 | | | | – | |
|
| |
NOTE 5–Expense Offset Arrangement(s)
The expense offset arrangement is comprised of transfer agency credits which result from balances in demand deposit accounts used by the transfer agent for clearing shareholder transactions. For the year ended October 31, 2022, the Fund received credits from this arrangement, which resulted in the reduction of the Fund’s total expenses of $3,690.
NOTE 6–Trustees’ and Officers’ Fees and Benefits
Trustees’ and Officers’ Fees and Benefits include amounts accrued by the Fund to pay remuneration to certain Trustees and Officers of the Fund. Trustees have the option to defer compensation payable by the Fund, and Trustees’ and Officers’ Fees and Benefits also include amounts accrued by the Fund to fund such deferred compensation amounts. Those Trustees who defer compensation have the option to select various Invesco Funds in which their deferral accounts shall be deemed to be invested. Finally, certain current Trustees were eligible to participate in a retirement plan that provided for benefits to be paid upon retirement to Trustees over a period of time based on the number of years of service. The Fund may have certain former Trustees who also participate in a retirement plan and receive benefits under such plan. Trustees’ and Officers’ Fees and Benefits include amounts accrued by the Fund to fund such retirement benefits. Obligations under the deferred compensation and retirement plans represent unsecured claims against the general assets of the Fund.
NOTE 7–Cash Balances
The Fund is permitted to temporarily carry a negative or overdrawn balance in its account with SSB, the custodian bank. Such balances, if any at period-end, are shown in the Consolidated Statement of Assets and Liabilities under the payable caption Amount due custodian. To compensate the custodian bank for such overdrafts, the overdrawn Fund may either (1) leave funds as a compensating balance in the account so the custodian bank can be compensated by earning the additional interest; or (2) compensate by paying the custodian bank at a rate agreed upon by the custodian bank and Invesco, not to exceed the contractually agreed upon rate. The Fund may not purchase additional securities when any borrowings from banks or broker-dealers exceed 5% of the Fund’s total assets, or when any borrowings from an Invesco Fund are outstanding.
| | |
| 27 | | Invesco Balanced-Risk Allocation Fund |
NOTE 8–Distributions to Shareholders and Tax Components of Net Assets
Tax Character of Distributions to Shareholders Paid During the Fiscal Years Ended October 31, 2022 and 2021:
| | | | | | | | | | | | |
| | | 2022 | | | | | | 2021 | |
|
| |
Ordinary income* | | $ | 428,299,995 | | | | | | | $ | 30,305,991 | |
|
| |
Long-term capital gain | | | 68,806,743 | | | | | | | | – | |
|
| |
Total distributions | | $ | 497,106,738 | | | | | | | $ | 30,305,991 | |
|
| |
| * | Includes short-term capital gain distributions, if any. |
Tax Components of Net Assets at Period-End:
| | | | |
| | | 2022 | |
|
| |
Net unrealized appreciation (depreciation) – investments | | $ | (4,442,021 | ) |
|
| |
Net unrealized appreciation – foreign currencies | | | 738,730 | |
|
| |
Temporary book/tax differences | | | (382,276 | ) |
|
| |
Capital loss carryforward | | | (226,202,090 | ) |
|
| |
Shares of beneficial interest | | | 2,042,884,957 | |
|
| |
Total net assets | | $ | 1,812,597,300 | |
|
| |
The difference between book-basis and tax-basis unrealized appreciation (depreciation) is due to differences in the timing of recognition of gains and losses on investments for tax and book purposes. The Fund’s net unrealized appreciation (depreciation) difference is attributable primarily to derivative instruments.
The temporary book/tax differences are a result of timing differences between book and tax recognition of income and/or expenses. The Fund’s temporary book/tax differences are the result of the trustee deferral of compensation and retirement plan benefits.
Capital loss carryforward is calculated and reported as of a specific date. Results of transactions and other activity after that date may affect the amount of capital loss carryforward actually available for the Fund to utilize. The ability to utilize capital loss carryforward in the future may be limited under the Internal Revenue Code and related regulations based on the results of future transactions.
The Fund has a capital loss carryforward as of October 31, 2022, as follows:
| | | | | | | | | | | | |
Capital Loss Carryforward* | |
| Expiration | | Short-Term | | | Long-Term | | | Total | |
|
| |
Not subject to expiration | | | $115,328,279 | | | | $110,873,811 | | | | $226,202,090 | |
|
| |
| * | Capital loss carryforward is reduced for limitations, if any, to the extent required by the Internal Revenue Code and may be further limited depending upon a variety of factors, including the realization of net unrealized gains or losses as of the date of any reorganization. |
NOTE 9–Investment Transactions
The aggregate amount of investment securities (other than short-term securities, U.S. Government obligations and money market funds, if any) purchased and sold by the Fund during the year ended October 31, 2022 was $30,602,596 and $24,839,378, respectively. Cost of investments, including any derivatives, on a tax basis includes the adjustments for financial reporting purposes as of the most recently completed federal income tax reporting period-end.
| | | | |
Unrealized Appreciation (Depreciation) of Investments on a Tax Basis | |
Aggregate unrealized appreciation of investments | | $ | 39,240,751 | |
|
| |
Aggregate unrealized (depreciation) of investments | | | (43,682,772 | ) |
|
| |
Net unrealized appreciation (depreciation) of investments | | $ | (4,442,021 | ) |
|
| |
Cost of investments for tax purposes is $1,669,579,188.
NOTE 10–Reclassification of Permanent Differences
Primarily as a result of differing book/tax treatment of foreign currency transactions, net operating losses, derivative instruments and income from the Subsidiary, on October 31, 2022, undistributed net investment income (loss) was increased by $1,128,768, undistributed net realized gain (loss) was increased by $118,284,907 and shares of beneficial interest was decreased by $119,413,675. This reclassification had no effect on the net assets of the Fund.
NOTE 11–Share Information
| | | | | | | | | | | | | | | | |
| | | Summary of Share Activity | |
|
| |
| | |
| | | Year ended | | | Year ended | |
| | | October 31, 2022(a) | | | October 31, 2021 | |
| | | Shares | | | Amount | | | Shares | | | Amount | |
|
| |
Sold: | | | | | | | | | | | | | | | | |
Class A | | | 7,675,989 | | | $ | 73,144,192 | | | | 7,717,868 | | | $ | 89,718,206 | |
|
| |
Class C | | | 1,764,890 | | | | 15,574,741 | | | | 1,858,756 | | | | 20,404,306 | |
|
| |
Class R | | | 512,017 | | | | 4,634,315 | | | | 395,503 | | | | 4,525,565 | |
|
| |
Class Y | | | 23,303,511 | | | | 228,108,540 | | | | 19,773,947 | | | | 234,498,165 | |
|
| |
Class R5 | | | 98,801 | | | | 961,133 | | | | 128,696 | | | | 1,486,744 | |
|
| |
Class R6 | | | 862,016 | | | | 8,179,105 | | | | 1,393,714 | | | | 16,794,691 | |
|
| |
| | |
| 28 | | Invesco Balanced-Risk Allocation Fund |
| | | | | | | | | | | | | | | | |
| | | Summary of Share Activity | |
|
| |
| | |
| | | Year ended | | | Year ended | |
| | | October 31, 2022(a) | | | October 31, 2021 | |
| | | Shares | | | Amount | | | Shares | | | Amount | |
|
| |
| | | | |
Issued as reinvestment of dividends: | | | | | | | | | | | | | | | | |
Class A | | | 21,402,812 | | | $ | 205,895,058 | | | | 882,471 | | | $ | 9,645,406 | |
|
| |
Class C | | | 3,455,498 | | | | 31,099,481 | | | | 121,143 | | | | 1,251,404 | |
|
| |
Class R | | | 393,370 | | | | 3,693,741 | | | | 13,746 | | | | 147,216 | |
|
| |
Class Y | | | 17,644,226 | | | | 173,795,631 | | | | 1,089,355 | | | | 12,124,526 | |
|
| |
Class R5 | | | 330,794 | | | | 3,258,322 | | | | 22,093 | | | | 245,897 | |
|
| |
Class R6 | | | 854,002 | | | | 8,437,540 | | | | 229,616 | | | | 2,562,519 | |
|
| |
| | | | |
Automatic conversion of Class C shares to Class A shares: | | | | | | | | | | | | | | | | |
Class A | | | 3,448,280 | | | | 31,918,195 | | | | 18,455,595 | | | | 209,165,274 | |
|
| |
Class C | | | (3,697,763 | ) | | | (31,918,195 | ) | | | (19,548,435 | ) | | | (209,165,274 | ) |
|
| |
| | | | |
Reacquired: | | | | | | | | | | | | | | | | |
Class A | | | (19,509,831 | ) | | | (183,861,403 | ) | | | (18,796,945 | ) | | | (217,287,141 | ) |
|
| |
Class C | | | (3,218,052 | ) | | | (28,229,625 | ) | | | (4,412,659 | ) | | | (47,520,768 | ) |
|
| |
Class R | | | (371,925 | ) | | | (3,354,588 | ) | | | (451,008 | ) | | | (5,037,418 | ) |
|
| |
Class Y | | | (33,306,794 | ) | | | (316,623,942 | ) | | | (31,568,339 | ) | | | (372,296,789 | ) |
|
| |
Class R5 | | | (263,981 | ) | | | (2,598,386 | ) | | | (313,605 | ) | | | (3,631,042 | ) |
|
| |
Class R6 | | | (1,150,430 | ) | | | (11,350,157 | ) | | | (13,027,447 | ) | | | (151,290,856 | ) |
|
| |
Net increase (decrease) in share activity | | | 20,227,430 | | | $ | 210,763,698 | | | | (36,035,935 | ) | | $ | (403,659,369 | ) |
|
| |
| (a) | There are entities that are record owners of more than 5% of the outstanding shares of the Fund and in the aggregate own 58% of the outstanding shares of the Fund. IDI has an agreement with these entities to sell Fund shares. The Fund, Invesco and/or Invesco affiliates may make payments to these entities, which are considered to be related to the Fund, for providing services to the Fund, Invesco and/or Invesco affiliates including but not limited to services such as securities brokerage, distribution, third party record keeping and account servicing. The Fund has no knowledge as to whether all or any portion of the shares owned of record by these entities are also owned beneficially. |
| | |
| 29 | | Invesco Balanced-Risk Allocation Fund |
Report of Independent Registered Public Accounting Firm
To the Board of Trustees of AIM Investment Funds (Invesco Investment Funds) and Shareholders of Invesco Balanced-Risk Allocation Fund
Opinion on the Consolidated Financial Statements
We have audited the accompanying consolidated statement of assets and liabilities, including the consolidated schedule of investments, of Invesco Balanced-Risk Allocation Fund and its subsidiary (one of the funds constituting AIM Investment Funds (Invesco Investment Funds), referred to hereafter as the “Fund”) as of October 31, 2022, the related consolidated statement of operations for the year ended October 31, 2022, the consolidated statement of changes in net assets for each of the two years in the period ended October 31, 2022, including the related notes, and the consolidated financial highlights for each of the five years in the period ended October 31, 2022 (collectively referred to as the “consolidated financial statements”). In our opinion, the consolidated financial statements present fairly, in all material respects, the financial position of the Fund as of October 31, 2022, the results of its operations for the year then ended, the changes in its net assets for each of the two years in the period ended October 31, 2022 and the financial highlights for each of the five years in the period ended October 31, 2022 in conformity with accounting principles generally accepted in the United States of America.
Basis for Opinion
These consolidated financial statements are the responsibility of the Fund’s management. Our responsibility is to express an opinion on the Fund’s consolidated financial statements based on our audits. We are a public accounting firm registered with the Public Company Accounting Oversight Board (United States) (PCAOB) and are required to be independent with respect to the Fund in accordance with the U.S. federal securities laws and the applicable rules and regulations of the Securities and Exchange Commission and the PCAOB.
We conducted our audits of these consolidated financial statements in accordance with the standards of the PCAOB. Those standards require that we plan and perform the audit to obtain reasonable assurance about whether the consolidated financial statements are free of material misstatement, whether due to error or fraud.
Our audits included performing procedures to assess the risks of material misstatement of the consolidated financial statements, whether due to error or fraud, and performing procedures that respond to those risks. Such procedures included examining, on a test basis, evidence regarding the amounts and disclosures in the consolidated financial statements. Our audits also included evaluating the accounting principles used and significant estimates made by management, as well as evaluating the overall presentation of the consolidated financial statements. Our procedures included confirmation of securities owned as of October 31, 2022 by correspondence with the custodian, transfer agent and brokers; when replies were not received from brokers, we performed other auditing procedures. We believe that our audits provide a reasonable basis for our opinion.
/s/PricewaterhouseCoopers LLP
Houston, Texas
December 23, 2022
We have served as the auditor of one or more of the investment companies in the Invesco group of investment companies since at least 1995. We have not been able to determine the specific year we began serving as auditor.
| | |
| 30 | | Invesco Balanced-Risk Allocation Fund |
Calculating your ongoing Fund expenses
Example
As a shareholder of the Fund, you incur two types of costs: (1) transaction costs, which may include sales charges (loads) on purchase payments or contingent deferred sales charges on redemptions, if any; and (2) ongoing costs, including management fees, distribution and/or service (12b-1) fees, and other Fund expenses. This example is intended to help you understand your ongoing costs (in dollars) of investing in the Fund and to compare these costs with ongoing costs of investing in other mutual funds. The example is based on an investment of $1,000 invested at the beginning of the period and held for the entire period May 1, 2022 through October 31, 2022.
In addition to the fees and expenses which the Fund bears directly, the Fund indirectly bears a pro-rata share of the fees and expenses of the underlying funds in which the Fund invests. The amount of fees and expenses incurred indirectly by the Fund will vary because the underlying funds have varied expenses and fee levels and the Fund may own different proportions of the underlying funds at different times. Estimated underlying fund expenses are not expenses that are incurred directly by the Fund. They are expenses that are incurred directly by the underlying funds and are deducted from the value of the underlying funds the Fund invests in. The effect of the estimated underlying fund expenses that the Fund bears indirectly are included in the Fund’s total return.
Actual expenses
The table below provides information about actual account values and actual expenses. You may use the information in this table, together with the amount you invested, to estimate the expenses that you paid over the period. Simply divide your account value by $1,000 (for example, an $8,600 account value divided by $1,000 = 8.6), then multiply the result by the number in the table under the heading entitled “Actual Expenses Paid During Period” to estimate the expenses you paid on your account during this period.
Hypothetical example for comparison purposes
The table below also provides information about hypothetical account values and hypothetical expenses based on the Fund’s actual expense ratio and an assumed rate of return of 5% per year before expenses, which is not the Fund’s actual return.
The hypothetical account values and expenses may not be used to estimate the actual ending account balance or expenses you paid for the period. You may use this information to compare the ongoing costs of investing in the Fund and other funds. To do so, compare this 5% hypothetical example with the 5% hypothetical examples that appear in the shareholder reports of the other funds.
Please note that the expenses shown in the table are meant to highlight your ongoing costs only and do not reflect any transaction costs, such as sales charges (loads) on purchase payments or contingent deferred sales charges on redemptions, if any. Therefore, the hypothetical information is useful in comparing ongoing costs only, and will not help you determine the relative total costs of owning different funds. In addition, expenses shown in the table do not include the expenses of the underlying funds, which are borne indirectly by the Fund. If transaction costs and indirect expenses were included, your costs would have been higher.
| | | | | | | | | | | | |
| | | | | ACTUAL | | HYPOTHETICAL (5% annual return before expenses) | | |
| | | Beginning Account Value (05/01/22) | | Ending Account Value (10/31/22)1 | | Expenses Paid During Period2 | | Ending Account Value (10/31/22) | | Expenses Paid During Period2 | | Annualized Expense Ratio |
Class A | | $1,000.00 | | $893.70 | | $6.40 | | $1,018.45 | | $6.82 | | 1.34% |
Class C | | 1,000.00 | | 891.70 | | 9.97 | | 1,014.67 | | 10.61 | | 2.09 |
Class R | | 1,000.00 | | 893.10 | | 7.59 | | 1,017.19 | | 8.08 | | 1.59 |
Class Y | | 1,000.00 | | 895.10 | | 5.21 | | 1,019.71 | | 5.55 | | 1.09 |
Class R5 | | 1,000.00 | | 895.20 | | 5.06 | | 1,019.86 | | 5.40 | | 1.06 |
Class R6 | | 1,000.00 | | 896.50 | | 4.73 | | 1,020.21 | | 5.04 | | 0.99 |
| 1 | The actual ending account value is based on the actual total return of the Fund for the period May 1, 2022 through October 31, 2022, after actual expenses and will differ from the hypothetical ending account value which is based on the Fund’s expense ratio and a hypothetical annual return of 5% before expenses. |
| 2 | Expenses are equal to the Fund’s annualized expense ratio as indicated above multiplied by the average account value over the period, multiplied by 184/365 to reflect the most recent fiscal half year. |
| | |
| 31 | | Invesco Balanced-Risk Allocation Fund |
Approval of Investment Advisory and Sub-Advisory Contracts
At meetings held on June 13, 2022, the Board of Trustees (the Board or the Trustees) of AIM Investment Funds (Invesco Investment Funds) as a whole, and the independent Trustees, who comprise over 75% of the Board, voting separately, approved the continuance of the Invesco Balanced-Risk Allocation Fund’s (the Fund) Master Investment Advisory Agreement with Invesco Advisers, Inc. (Invesco Advisers and the investment advisory agreement) and the Master Intergroup Sub-Advisory Contract for Mutual Funds with Invesco Asset Management Deutschland GmbH, Invesco Asset Management Limited, Invesco Asset Management (Japan) Limited, Invesco Hong Kong Limited, Invesco Senior Secured Management, Inc. and Invesco Canada Ltd. and separate sub-advisory contracts with Invesco Capital Management LLC and Invesco Asset Management (India) Private Limited (collectively, the Affiliated Sub-Advisers and the sub-advisory contracts) for another year, effective July 1, 2022. After evaluating the factors discussed below, among others, the Board approved the renewal of the Fund’s investment advisory agreement and the sub-advisory contracts and determined that the compensation payable thereunder by the Fund to Invesco Advisers and by Invesco Advisers to the Affiliated Sub-Advisers is fair and reasonable.
The Board’s Evaluation Process
The Board has established an Investments Committee, which in turn has established Sub-Committees that meet throughout the year to review the performance of funds advised by Invesco Advisers (the Invesco Funds). The Sub-Committees meet regularly with portfolio managers for their assigned Invesco Funds and other members of management to review detailed information about investment performance and portfolio attributes of these funds. The Board has established additional standing and ad hoc committees that meet regularly throughout the year to review matters within their purview. The Board took into account evaluations and reports that it received from its committees and sub-committees, as well as the information provided to the Board and its committees and sub-committees throughout the year, in considering whether to approve each Invesco Fund’s investment advisory agreement and sub-advisory contracts.
As part of the contract renewal process, the Board reviews and considers information provided in response to detailed requests for information submitted to management by the independent Trustees with assistance from legal counsel to the independent Trustees and the Senior Officer, an officer of the Invesco Funds who reports directly to the independent Trustees. The Board receives comparative investment performance and fee and expense data regarding the Invesco Funds prepared by Broadridge Financial Solutions, Inc. (Broadridge), an independent mutual fund data provider, as well as information on the composition of the peer groups provided by Broadridge and its methodology for determining peer groups. The Board also receives an independent written evaluation from the Senior Officer. The Senior Officer’s evaluation is prepared as part of his responsibility to manage the process by which the Invesco Funds’ proposed management fees are negotiated during the annual contract renewal
process to ensure they are negotiated in a manner that is at arms’ length and reasonable in accordance with certain negotiated regulatory requirements. In addition to meetings with Invesco Advisers and fund counsel throughout the year and as part of meetings convened on May 2, 2022 and June 13, 2022, the independent Trustees also discussed the continuance of the investment advisory agreement and sub-advisory contracts in separate sessions with the Senior Officer and with independent legal counsel.
The discussion below is a summary of the Senior Officer’s independent written evaluation with respect to the Fund’s investment advisory agreement and sub-advisory contracts, as well as a discussion of the material factors and related conclusions that formed the basis for the Board’s approval of the Fund’s investment advisory agreement and sub-advisory contracts. The Trustees’ review and conclusions are based on the comprehensive consideration of all information presented to them during the course of the year and in prior years and are not the result of any single determinative factor. Moreover, one Trustee may have weighed a particular piece of information or factor differently than another Trustee. The information received and considered by the Board was current as of various dates prior to the Board’s approval on June 13, 2022.
Factors and Conclusions and Summary of Independent Written Fee Evaluation
| A. | Nature, Extent and Quality of Services Provided by Invesco Advisers and the Affiliated Sub-Advisers |
The Board reviewed the nature, extent and quality of the advisory services provided to the Fund by Invesco Advisers under the Fund’s investment advisory agreement, and the credentials and experience of the officers and employees of Invesco Advisers who provide these services, including the Fund’s portfolio manager(s). The Board’s review included consideration of Invesco Advisers’ investment process and oversight, credit analysis, and research capabilities. The Board considered information regarding Invesco Advisers’ programs for and resources devoted to risk management, including management of investment, enterprise, operational, liquidity, valuation and compliance risks, and technology used to manage such risks. The Board also received and reviewed information about Invesco Advisers’ role as administrator of the Invesco Funds’ liquidity risk management program. The Board received a description of, and reports related to, Invesco Advisers’ global security program and business continuity plans and of its approach to data privacy and cybersecurity, including related testing. The Board considered how the cybersecurity and business continuity plans of Invesco Advisers and its key service providers operated in the remote and hybrid working environment resulting from the novel coronavirus (“COVID-19”) pandemic and paved the way for a hybrid working framework in a normalized environment as employees return to the office. The Board also considered non-advisory services that Invesco Advisers and its affiliates provide to the Invesco Funds, such as various back office support functions, third party oversight, internal audit, valuation, portfolio trading and legal and compliance. The Board observed that Invesco Advisers’ systems preparedness and ongoing investment enabled
Invesco Advisers to manage, operate and oversee the Invesco Funds with minimal impact or disruption through challenging environments. The Board reviewed and considered the benefits to shareholders of investing in a Fund that is part of the family of funds under the umbrella of Invesco Ltd., Invesco Advisers’ parent company, and noted Invesco Ltd.’s depth and experience in running an investment management business, as well as its commitment of financial and other resources to such business. The Board concluded that the nature, extent and quality of the services provided to the Fund by Invesco Advisers are appropriate and satisfactory.
The Board reviewed the services that may be provided by the Affiliated Sub-Advisers under the sub-advisory contracts and the credentials and experience of the officers and employees of the Affiliated Sub-Advisers who provide these services. The Board noted the Affiliated Sub-Advisers’ expertise with respect to certain asset classes and that the Affiliated Sub-Advisers have offices and personnel that are located in financial centers around the world. As a result, the Board noted that the Affiliated Sub-Advisers can provide research and investment analysis on the markets and economies of various countries in which the Fund may invest, make recommendations regarding securities and assist with security trades. The Board concluded that the sub-advisory contracts may benefit the Fund and its shareholders by permitting Invesco Advisers to use the resources and talents of the Affiliated Sub-Advisers in managing the Fund. The Board concluded that the nature, extent and quality of the services that may be provided to the Fund by the Affiliated Sub-Advisers are appropriate and satisfactory.
| B. | Fund Investment Performance |
The Board considered Fund investment performance as a relevant factor in considering whether to approve the investment advisory agreement. The Board did not view Fund investment performance as a relevant factor in considering whether to approve the sub-advisory contracts for the Fund, as no Affiliated Sub-Adviser currently manages assets of the Fund.
The Board compared the Fund’s investment performance over multiple time periods ending December 31, 2021 to the performance of funds in the Broadridge performance universe and against the Custom Invesco Balanced-Risk Allocation Style Index (Index). The Board noted that performance of Class A shares of the Fund was in the third quintile of its performance universe for the one, three and five year periods (the first quintile being the best performing funds and the fifth quintile being the worst performing funds). The Board noted that performance of Class A shares of the Fund was below the performance of the Index for the one, three and five year periods. The Board recognized that the performance data reflects a snapshot in time as of a particular date and that selecting a different performance period could produce different results. The Board also reviewed more recent Fund performance as well as other performance metrics, which did not change its conclusions.
| | |
| 32 | | Invesco Balanced-Risk Allocation Fund |
| C. | Advisory and Sub-Advisory Fees and Fund Expenses |
The Board compared the Fund’s contractual management fee rate to the contractual management fee rates of funds in the Fund’s Broadridge expense group. The Board noted that the contractual management fee rate for Class A shares of the Fund was above the median contractual management fee rate of funds in its expense group. The Board noted that the term “contractual management fee” for funds in the expense group may include both advisory and certain non-portfolio management administrative services fees, but that Broadridge is not able to provide information on a fund by fund basis as to what is included. The Board also reviewed the methodology used by Broadridge in calculating expense group information, which includes using each fund’s contractual management fee schedule (including any applicable breakpoints) as reported in the most recent prospectus or statement of additional information for each fund in the expense group. The Board also considered comparative information regarding the Fund’s total expense ratio and its various components. The Board noted that the Fund’s contractual management fees and its total expense ratio were in the fourth quintile of its expense group, and its actual management fees were in the fifth quintile of its expense group, and discussed with management reasons for such relative actual and contractual management fees and total expenses.
The Board noted that Invesco Advisers has contractually agreed to waive fees and/or limit expenses of the Fund for the term disclosed in the Fund’s registration statement in an amount necessary to limit total annual operating expenses to a specified percentage of average daily net assets for each class of the Fund.
The Board also considered the fees charged by Invesco Advisers and its affiliates to other client accounts that are similarly managed. Invesco Advisers reviewed with the Board differences in the scope of services it provides to the Invesco Funds relative to that provided by Invesco Advisers and its affiliates to certain other types of client accounts, including, among others: management of cash flows as a result of redemptions and purchases; necessary infrastructure such as officers, office space, technology, legal and distribution; oversight of service providers; costs and business risks associated with launching new funds and sponsoring and maintaining the product line; and compliance with federal and state laws and regulations. Invesco Advisers also advised the Board that many of the similarly managed client accounts have all-inclusive fee structures, which are not easily un-bundled.
The Board also compared the Fund’s effective advisory fee rate (defined for this purpose as the advisory fee rate after advisory fee waivers and before other expense limitations/waivers) to the effective advisory fee rates of other similarly managed third-party mutual funds advised or sub-advised by Invesco Advisers and its affiliates, based on asset balances as of December 31, 2021.
The Board also considered the services that may be provided by the Affiliated Sub-Advisers pursuant to the sub-advisory contracts, as well as the fees payable by Invesco Advisers to the Affiliated Sub-Advisers pursuant to the sub-advisory contracts.
| D. | Economies of Scale and Breakpoints |
The Board considered the extent to which there may be economies of scale in the provision of advisory services to the Fund and the Invesco Funds, and the extent to which such economies of scale are shared with the Fund and the Invesco Funds. The Board considered that the Fund benefits from economies of scale through contractual breakpoints in the Fund’s advisory fee schedule, which generally operate to reduce the Fund’s expense ratio as it grows in size. The Board noted that the Fund also shares in economies of scale through Invesco Advisers’ ability to negotiate lower fee arrangements with third party service providers. The Board noted that the Fund may also benefit from economies of scale through initial fee setting, fee waivers and expense reimbursements, as well as Invesco Advisers’ investment in its business, including investments in business infrastructure, technology and cybersecurity.
| E. | Profitability and Financial Resources |
The Board reviewed information from Invesco Advisers concerning the costs of the advisory and other services that Invesco Advisers and its affiliates provide to the Fund and the Invesco Funds and the profitability of Invesco Advisers and its affiliates in providing these services in the aggregate and on an individual Fund-by-Fund basis. The Board considered the methodology used for calculating profitability and the periodic review and enhancement of such methodology. The Board noted that Invesco Advisers continues to operate at a net profit from services Invesco Advisers and its affiliates provide to the Invesco Funds in the aggregate and to most Funds individually. The Board did not deem the level of profits realized by Invesco Advisers and its affiliates from providing such services to be excessive, given the nature, extent and quality of the services provided. The Board noted that Invesco Advisers provided information demonstrating that Invesco Advisers is financially sound and has the resources necessary to perform its obligations under the investment advisory agreement, and provided representations indicating that the Affiliated Sub-Advisers are financially sound and have the resources necessary to perform their obligations under the sub-advisory contracts.
| F. | Collateral Benefits to Invesco Advisers and its Affiliates |
The Board considered various other benefits received by Invesco Advisers and its affiliates from the relationship with the Fund, including the fees received for providing administrative, transfer agency and distribution services to the Fund. The Board received comparative information regarding fees charged for these services, including information provided by Broadridge and other independent sources. The Board reviewed the performance of Invesco Advisers and its affiliates in providing these services and the organizational structure employed to provide these services. The Board noted that these services are provided to the Fund pursuant to written contracts that are reviewed and subject to approval on an annual basis by the Board based on its determination that the services are required for the operation of the Fund.
The Board considered the benefits realized by Invesco Advisers and the Affiliated Sub-Advisers as a result of portfolio brokerage transactions executed through “soft dollar” arrangements. Invesco Advisers noted that the Fund does not execute brokerage
transactions through “soft dollar” arrangements to any significant degree.
The Board considered that the Fund’s uninvested cash and cash collateral from any securities lending arrangements may be invested in registered money market funds or, with regard to securities lending cash collateral, unregistered funds that comply with Rule 2a-7 (collectively referred to as “affiliated money market funds”) advised by Invesco Advisers. The Board considered information regarding the returns of the affiliated money market funds relative to comparable overnight investments, as well as the fees paid by the affiliated money market funds to Invesco Advisers and its affiliates. In this regard, the Board noted that Invesco Advisers receives advisory fees from these affiliated money market funds attributable to the Fund’s investments. The Board also noted that Invesco Advisers has contractually agreed to waive through varying periods an amount equal to 100% of the net advisory fee Invesco Advisers receives from the affiliated money market funds with respect to the Fund’s investment in the affiliated money market funds of uninvested cash, but not cash collateral. The Board concluded that the advisory fees payable to Invesco Advisers from the Fund’s investment of cash collateral from any securities lending arrangements in the affiliated money market funds are for services that are not duplicative of services provided by Invesco Advisers to the Fund.
The Board considered that Invesco Advisers may serve as the Fund’s affiliated securities lending agent and evaluated the benefits realized by Invesco Advisers when serving in such role, including the compensation received. The Board considered Invesco Advisers’ securities lending platform and corporate governance structure for securities lending, including Invesco Advisers’ Securities Lending Governance Committee and its related responsibilities. The Board noted that to the extent the Fund utilizes Invesco Advisers as an affiliated securities lending agent, the Fund conducts its securities lending in accordance with, and in reliance upon, no-action letters issued by the SEC staff that provide guidance on how an affiliate may act as a direct agent lender and receive compensation for those services without obtaining exemptive relief. The Board considered information provided by Invesco Advisers related to the performance of Invesco Advisers as securities lending agent, including a summary of the securities lending services provided to the Fund by Invesco Advisers and the compensation paid to Invesco Advisers for such services, as well as any revenues generated for the Fund in connection with such securities lending activity and the allocation of such revenue between the Fund and Invesco Advisers.
The Board also received information about commissions that an affiliated broker may receive for executing certain trades for the Fund. Invesco Advisers and the Affiliated Sub-Advisers advised the Board of the benefits to the Fund of executing trades through the affiliated broker and that such trades were executed in compliance with rules under the federal securities laws and consistent with best execution obligations.
| | |
| 33 | | Invesco Balanced-Risk Allocation Fund |
Tax Information
Form 1099-DIV, Form 1042-S and other year-end tax information provide shareholders with actual calendar year amounts that should be included in their tax returns. Shareholders should consult their tax advisers.
The following distribution information is being provided as required by the Internal Revenue Code or to meet a specific state’s requirement.
The Fund designates the following amounts or, if subsequently determined to be different, the maximum amount allowable for its fiscal year ended October 31, 2022:
| | | | | | | | |
Federal and State Income Tax | | | | | | |
Long-Term Capital Gain Distributions | | | $68,806,743 | | | | | |
Qualified Dividend Income* | | | 0.00 | % | | | | |
Corporate Dividends Received Deduction* | | | 0.00 | % | | | | |
U.S. Treasury Obligations* | | | 0.26 | % | | | | |
Qualified Business Income* | | | 0.00 | % | | | | |
Business Interest Income* | | | 0.00 | % | | | | |
|
| * The above percentages are based on ordinary income dividends paid to shareholders during the Fund’s fiscal year. | |
| | | | | | | | |
Non-Resident Alien Shareholders | | | | | | |
Short-Term Capital Gain Distributions | | | $145,875,892 | | | | | |
| | |
| 34 | | Invesco Balanced-Risk Allocation Fund |
Trustees and Officers
The address of each trustee and officer is AIM Investment Funds (Invesco Investment Funds) (the “Trust”), 11 Greenway Plaza, Suite 1000, Houston, Texas 77046-1173. The trustees serve for the life of the Trust, subject to their earlier death, incapacitation, resignation, retirement or removal as more specifically provided in the Trust’s organizational documents. Each officer serves for a one year term or until their successors are elected and qualified. Column two below includes length of time served with predecessor entities, if any.
| | | | | | | | |
Name, Year of Birth and Position(s) Held with the Trust | | Trustee and/or Officer Since | | Principal Occupation(s) During Past 5 Years | | Number of Funds in Fund Complex Overseen by Trustee | | Other Directorship(s) Held by Trustee During Past 5 Years |
| Interested Trustee | | | | | | | | |
Martin L. Flanagan1 – 1960 Trustee and Vice Chair | | 2007 | | Executive Director, Chief Executive Officer and President, Invesco Ltd. (ultimate parent of Invesco and a global investment management firm); Trustee and Vice Chair, The Invesco Funds; Vice Chair, Investment Company Institute; and Member of Executive Board, SMU Cox School of Business Formerly: Advisor to the Board, Invesco Advisers, Inc. (formerly known as Invesco Institutional (N.A.), Inc.); Chairman and Chief Executive Officer, Invesco Advisers, Inc. (registered investment adviser); Director, Chairman, Chief Executive Officer and President, Invesco Holding Company (US), Inc. (formerly IVZ Inc.) (holding company), Invesco Group Services, Inc. (service provider) and Invesco North American Holdings, Inc. (holding company); Director, Chief Executive Officer and President, Invesco Holding Company Limited (parent of Invesco and a global investment management firm); Director, Invesco Ltd.; Chairman, Investment Company Institute and President, Co-Chief Executive Officer, Co-President, Chief Operating Officer and Chief Financial Officer, Franklin Resources, Inc. (global investment management organization) | | 189 | | None |
| 1 | Mr. Flanagan is considered an interested person (within the meaning of Section 2(a)(19) of the 1940 Act) of the Trust because he is an officer of the Adviser to the Trust, and an officer and a director of Invesco Ltd., ultimate parent of the Adviser. |
| | |
| T-1 | | Invesco Balanced-Risk Allocation Fund |
Trustees and Officers–(continued)
| | | | | | | | |
Name, Year of Birth and Position(s) Held with the Trust | | Trustee and/or Officer Since | | Principal Occupation(s) During Past 5 Years | | Number of Funds in Fund Complex Overseen by Trustee | | Other Directorship(s) Held by Trustee During Past 5 Years |
| Independent Trustees | | | | | | | | |
Beth Ann Brown - 1968 Trustee (2019) and Chair (August 2022) | | 2019 | | Independent Consultant Formerly: Head of Intermediary Distribution, Managing Director, Strategic Relations, Managing Director, Head of National Accounts, Senior Vice President, National Account Manager and Senior Vice President, Key Account Manager, Columbia Management Investment Advisers LLC; Vice President, Key Account Manager, Liberty Funds Distributor, Inc.; and Trustee of certain Oppenheimer Funds | | 189 | | Director, Board of Directors of Caron Engineering Inc.; Advisor, Board of Advisors of Caron Engineering Inc.; President and Director, Acton Shapleigh Youth Conservation Corps (non-profit) Formerly: President and Director Director of Grahamtastic Connection (non-profit) |
Cynthia Hostetler -1962 Trustee | | 2017 | | Non-Executive Director and Trustee of a number of public and private business corporations Formerly: Director, Aberdeen Investment Funds (4 portfolios); Director, Artio Global Investment LLC (mutual fund complex); Director, Edgen Group, Inc. (specialized energy and infrastructure products distributor); Director, Genesee & Wyoming, Inc. (railroads); Head of Investment Funds and Private Equity, Overseas Private Investment Corporation; President, First Manhattan Bancorporation, Inc.; and Attorney, Simpson Thacher & Bartlett LLP | | 189 | | Resideo Technologies, Inc. (smart home technology); Vulcan Materials Company (construction materials company); Trilinc Global Impact Fund; Textainer Group Holdings, (shipping container leasing company); Investment Company Institute (professional organization); and Independent Directors Council (professional organization) |
Eli Jones - 1961 Trustee | | 2016 | | Professor and Dean Emeritus, Mays Business School - Texas A&M University Formerly: Dean of Mays Business School-Texas A&M University; Professor and Dean, Walton College of Business, University of Arkansas and E.J. Ourso College of Business, Louisiana State University; and Director, Arvest Bank | | 189 | | Insperity, Inc. (formerly known as Administaff) (human resources provider); and Member of Regional Board of Directors and Board of Directors, First Financial Bancorp (regional bank) |
Elizabeth Krentzman - 1959 Trustee | | 2019 | | Formerly: Principal and Chief Regulatory Advisor for Asset Management Services and U.S. Mutual Fund Leader of Deloitte & Touche LLP; General Counsel of the Investment Company Institute (trade association); National Director of the Investment Management Regulatory Consulting Practice, Principal, Director and Senior Manager of Deloitte & Touche LLP; Assistant Director of the Division of Investment Management - Office of Disclosure and Investment Adviser Regulation of the U.S. Securities and Exchange Commission and various positions with the Division of Investment Management – Office of Regulatory Policy of the U.S. Securities and Exchange Commission; Associate at Ropes & Gray LLP; and Trustee of certain Oppenheimer Funds | | 189 | | Formerly: Member of the Cartica Funds Board of Directors (private investment fund); Trustee of the University of Florida National Board Foundation; and Member of the University of Florida Law Center Association, Inc. Board of Trustees, Audit Committee and Membership Committee |
Anthony J. LaCava, Jr. - 1956 Trustee | | 2019 | | Formerly: Director and Member of the Audit Committee, Blue Hills Bank (publicly traded financial institution) and Managing Partner, KPMG LLP | | 189 | | Blue Hills Bank; Chairman, Bentley University; Member, Business School Advisory Council; and Nominating Committee, KPMG LLP |
Prema Mathai-Davis - 1950 Trustee | | 2001 | | Retired Formerly: Co-Founder & Partner of Quantalytics Research, LLC, (a FinTech Investment Research Platform for the Self-Directed Investor); Trustee of YWCA Retirement Fund; CEO of YWCA of the USA; Board member of the NY Metropolitan Transportation Authority; Commissioner of the NYC Department of Aging; and Board member of Johns Hopkins Bioethics Institute | | 189 | | Member of Board of Positive Planet US (non-profit) and HealthCare Chaplaincy Network (non-profit) |
| | |
| T-2 | | Invesco Balanced-Risk Allocation Fund |
Trustees and Officers–(continued)
| | | | | | | | |
Name, Year of Birth and Position(s) Held with the Trust | | Trustee and/or Officer Since | | Principal Occupation(s) During Past 5 Years | | Number of Funds in Fund Complex Overseen by Trustee | | Other Directorship(s) Held by Trustee During Past 5 Years |
| Independent Trustees–(continued) | | | | |
Joel W. Motley - 1952 Trustee | | 2019 | | Director of Office of Finance, Federal Home Loan Bank System; Managing Director of Carmona Motley Inc. (privately held financial advisor); Member of the Council on Foreign Relations and its Finance and Budget Committee; Chairman Emeritus of Board of Human Rights Watch and Member of its Investment Committee; and Member of Investment Committee Board of Historic Hudson Valley (non-profit cultural organization); Member of the Board, Blue Ocean Acquisition Corp.; and Member of the Vestry and the Investment Committee of Trinity Church Wall Street. Formerly: Managing Director of Public Capital Advisors, LLC (privately held financial advisor); Managing Director of Carmona Motley Hoffman, Inc. (privately held financial advisor); Trustee of certain Oppenheimer Funds; and Director of Columbia Equity Financial Corp. (privately held financial advisor) | | 189 | | Member of Board of Trust for Mutual Understanding (non-profit promoting the arts and environment); Member of Board of Greenwall Foundation (bioethics research foundation) and its Investment Committee; Member of Board of Friends of the LRC (non-profit legal advocacy); and Board Member and Investment Committee Member of Pulitzer Center for Crisis Reporting (non-profit journalism) |
Teresa M. Ressel - 1962 Trustee | | 2017 | | Non-executive director and trustee of a number of public and private business corporations Formerly: Chief Executive Officer, UBS Securities LLC (investment banking); Chief Operating Officer, UBS AG Americas (investment banking); Sr. Management Team Olayan America, The Olayan Group (international investor/commercial/industrial); Assistant Secretary for Management & Budget and Designated Chief Financial Officer, U.S. Department of Treasury and Director, ON Semiconductor Corporation (semiconductor manufacturing) | | 189 | | None |
Robert C. Troccoli - 1949 Trustee | | 2016 | | Retired Formerly: Adjunct Professor, University of Denver – Daniels College of Business; and Managing Partner, KPMG LLP | | 189 | | None |
Daniel S. Vandivort -1954 Trustee | | 2019 | | President, Flyway Advisory Services LLC (consulting and property management) Formerly: President and Chief Investment Officer, previously Head of Fixed Income, Weiss Peck and Greer/Robeco Investment Management; Trustee and Chair, Weiss Peck and Greer Funds Board; and various capacities at CS First Boston including Head of Fixed Income at First Boston Asset Management. | | 189 | | Formerly: Trustee and Governance Chair, Oppenheimer Funds; Treasurer, Chairman of the Audit and Finance Committee, Huntington Disease Foundation of America |
| | |
| T-3 | | Invesco Balanced-Risk Allocation Fund |
Trustees and Officers–(continued)
| | | | | | | | |
Name, Year of Birth and Position(s) Held with the Trust | | Trustee and/or Officer Since | | Principal Occupation(s) During Past 5 Years | | Number of Funds in Fund Complex Overseen by Trustee | | Other Directorship(s) Held by Trustee During Past 5 Years |
| Officers | | | | | | | | |
Sheri Morris - 1964 President and Principal Executive Officer | | 1999 | | Director, Invesco Trust Company; Head of Global Fund Services, Invesco Ltd.; President and Principal Executive Officer, The Invesco Funds; Vice President, Invesco Exchange-Traded Fund Trust, Invesco Exchange-Traded Fund Trust II, Invesco India Exchange-Traded Fund Trust, Invesco Actively Managed Exchange-Traded Fund Trust, Invesco Actively Managed Exchange-Traded Commodity Fund Trust and Invesco Exchange-Traded Self-Indexed Fund Trust; and Vice President, OppenheimerFunds, Inc. Formerly: Vice President, Treasurer and Principal Financial Officer, The Invesco Funds; Vice President, Invesco AIM Advisers, Inc., Invesco AIM Capital Management, Inc. and Invesco AIM Private Asset Management, Inc.; Assistant Vice President and Assistant Treasurer, The Invesco Funds; Vice President and Assistant Vice President, Invesco Advisers, Inc.; Assistant Vice President, Invesco AIM Capital Management, Inc. and Invesco AIM Private Asset Management, Inc.; Treasurer, Invesco Exchange-Traded Fund Trust, Invesco Exchange-Traded Fund Trust II, Invesco India Exchange-Traded Fund Trust and Invesco Actively Managed Exchange-Traded Fund Trust; and Senior Vice President, Invesco Advisers, Inc. (formerly known as Invesco Institutional (N.A.), Inc.) (registered investment adviser) | | N/A | | N/A |
Jeffrey H. Kupor - 1968 Senior Vice President, Chief Legal Officer and Secretary | | 2018 | | Head of Legal of the Americas, Invesco Ltd.; Senior Vice President and Secretary, Invesco Advisers, Inc. (formerly known as Invesco Institutional (N.A.), Inc.) (registered investment adviser); Secretary, Invesco Distributors, Inc. (formerly known as Invesco AIM Distributors, Inc.); Vice President and Secretary, Invesco Investment Services, Inc. (formerly known as Invesco AIM Investment Services, Inc.); Senior Vice President, Chief Legal Officer and Secretary, The Invesco Funds; Secretary and General Counsel, Invesco Investment Advisers LLC (formerly known as Van Kampen Asset Management); Secretary and General Counsel, Invesco Capital Markets, Inc. (formerly known as Van Kampen Funds Inc.); Chief Legal Officer, Invesco Exchange-Traded Fund Trust, Invesco Exchange-Traded Fund Trust II, Invesco India Exchange-Traded Fund Trust, Invesco Actively Managed Exchange-Traded Fund Trust, Invesco Actively Managed Exchange-Traded Commodity Fund Trust and Invesco Exchange-Traded Self-Indexed Fund Trust;; Secretary and Vice President, Harbourview Asset Management Corporation; Secretary and Vice President, OppenheimerFunds, Inc. and Invesco Managed Accounts, LLC; Secretary and Senior Vice President, OFI Global Institutional, Inc.; Secretary and Vice President, OFI SteelPath, Inc.; Secretary and Vice President, Oppenheimer Acquisition Corp.; Secretary and Vice President, Shareholder Services, Inc.; and Secretary and Vice President, Trinity Investment Management Corporation Formerly: Senior Vice President, Invesco Distributors, Inc.; Secretary and Vice President, Jemstep, Inc.; Head of Legal, Worldwide Institutional, Invesco Ltd.; Secretary and General Counsel, INVESCO Private Capital Investments, Inc.; Senior Vice President, Secretary and General Counsel, Invesco Management Group, Inc. (formerly known as Invesco AIM Management Group, Inc.); Assistant Secretary, INVESCO Asset Management (Bermuda) Ltd.; Secretary and General Counsel, Invesco Private Capital, Inc.; Assistant Secretary and General Counsel, INVESCO Realty, Inc.; Secretary and General Counsel, Invesco Senior Secured Management, Inc.; Secretary, Sovereign G./P. Holdings Inc.; Secretary, Invesco Indexing LLC; and Secretary, W.L. Ross & Co., LLC | | N/A | | N/A |
Andrew R. Schlossberg - 1974 Senior Vice President | | 2019 | | Senior Vice President, Invesco Group Services, Inc.; Head of the Americas and Senior Managing Director, Invesco Ltd.; Director and Senior Vice President, Invesco Advisers, Inc. (formerly known as Invesco Institutional (N.A.), Inc.) (registered investment adviser); Director and Chairman, Invesco Investment Services, Inc. (formerly known as Invesco AIM Investment Services, Inc.) (registered transfer agent); Senior Vice President, The Invesco Funds; and Director, Invesco Investment Advisers LLC (formerly known as Van Kampen Asset Management) Formerly: Director, President and Chairman, Invesco Insurance Agency, Inc.; Director, Invesco UK Limited; Director and Chief Executive, Invesco Asset Management Limited and Invesco Fund Managers Limited; Assistant Vice President, The Invesco Funds; Senior Vice President, Invesco Advisers, Inc. (formerly known as Invesco Institutional (N.A.), Inc.) (registered investment adviser); Director and Chief Executive, Invesco Administration Services Limited and Invesco Global Investment Funds Limited; Director, Invesco Distributors, Inc.; Head of EMEA, Invesco Ltd.; President, Invesco Actively Managed Exchange-Traded Commodity Fund Trust, Invesco Actively Managed Exchange-Traded Fund Trust, Invesco Exchange-Traded Fund Trust, Invesco Exchange-Traded Fund Trust II and Invesco India Exchange-Traded Fund Trust; and Managing Director and Principal Executive Officer, Invesco Capital Management LLC | | N/A | | N/A |
| | |
| T-4 | | Invesco Balanced-Risk Allocation Fund |
Trustees and Officers–(continued)
| | | | | | | | |
Name, Year of Birth and Position(s) Held with the Trust | | Trustee and/or Officer Since | | Principal Occupation(s) During Past 5 Years | | Number of Funds in Fund Complex Overseen by Trustee | | Other Directorship(s) Held by Trustee During Past 5 Years |
| Officers–(continued) | | | | | | | | |
John M. Zerr - 1962 Senior Vice President | | 2006 | | Chief Operating Officer of the Americas; Senior Vice President, Invesco Advisers, Inc. (formerly known as Invesco Institutional (N.A.), Inc.) (registered investment adviser); Senior Vice President, Invesco Distributors, Inc. (formerly known as Invesco AIM Distributors, Inc.); Director and Vice President, Invesco Investment Services, Inc. (formerly known as Invesco AIM Investment Services, Inc.) Senior Vice President, The Invesco Funds; Managing Director, Invesco Capital Management LLC; Director, Invesco Investment Advisers LLC (formerly known as Van Kampen Asset Management); Senior Vice President, Invesco Capital Markets, Inc. (formerly known as Van Kampen Funds Inc.); Manager, Invesco Indexing LLC; Manager, Invesco Specialized Products, LLC; Member, Invesco Canada Funds Advisory Board; Director, President and Chief Executive Officer, Invesco Corporate Class Inc. (corporate mutual fund company); and Director, Chairman, President and Chief Executive Officer, Invesco Canada Ltd. (formerly known as Invesco Trimark Ltd./Invesco Trimark Ltèe) (registered investment adviser and registered transfer agent); President, Invesco, Inc.; President, Invesco Global Direct Real Estate Feeder GP Ltd.; President, Invesco IP Holdings (Canada) Ltd; President, Invesco Global Direct Real Estate GP Ltd.; President, Invesco Financial Services Ltd. / Services Financiers Invesco Ltée; and Director and Chairman, Invesco Trust Company Formerly: President, Trimark Investments Ltd/Services Financiers Invesco Ltee; Director and Senior Vice President, Invesco Insurance Agency, Inc.; Director and Senior Vice President, Invesco Management Group, Inc. (formerly known as Invesco AIM Management Group, Inc.); Secretary and General Counsel, Invesco Management Group, Inc. (formerly known as Invesco AIM Management Group, Inc.); Secretary, Invesco Investment Services, Inc. (formerly known as Invesco AIM Investment Services, Inc.); Chief Legal Officer and Secretary, The Invesco Funds; Secretary and General Counsel, Invesco Investment Advisers LLC (formerly known as Van Kampen Asset Management); Secretary and General Counsel, Invesco Capital Markets, Inc. (formerly known as Van Kampen Funds Inc.); Chief Legal Officer, Invesco Exchange-Traded Fund Trust, Invesco Exchange-Traded Fund Trust II, Invesco India Exchange-Traded Fund Trust, Invesco Actively Managed Exchange-Traded Fund Trust, Invesco Actively Managed Exchange-Traded Commodity Fund Trust and Invesco Exchange-Traded Self-Indexed Fund Trust; Secretary, Invesco Indexing LLC; Director, Secretary, General Counsel and Senior Vice President, Van Kampen Exchange Corp.; Director, Vice President and Secretary, IVZ Distributors, Inc. (formerly known as INVESCO Distributors, Inc.); Director and Vice President, INVESCO Funds Group, Inc.; Director and Vice President, Van Kampen Advisors Inc.; Director, Vice President, Secretary and General Counsel, Van Kampen Investor Services Inc.; Director and Secretary, Invesco Distributors, Inc. (formerly known as Invesco AIM Distributors, Inc.); Director, Senior Vice President, General Counsel and Secretary, Invesco AIM Advisers, Inc. and Van Kampen Investments Inc.; Director, Vice President and Secretary, Fund Management Company; Director, Senior Vice President, Secretary, General Counsel and Vice President, Invesco AIM Capital Management, Inc.; and Chief Operating Officer and General Counsel, Liberty Ridge Capital, Inc. (an investment adviser) | | N/A | | N/A |
Gregory G. McGreevey - 1962 Senior Vice President | | 2012 | | Senior Managing Director, Invesco Ltd.; Director, Chairman, President, and Chief Executive Officer, Invesco Advisers, Inc. (formerly known as Invesco Institutional (N.A.), Inc.) (registered investment adviser); Director, Invesco Mortgage Capital, Inc. and Invesco Senior Secured Management, Inc.; Senior Vice President, The Invesco Funds; President, SNW Asset Management Corporation and Invesco Managed Accounts, LLC; Chairman and Director, Invesco Private Capital, Inc.; Chairman and Director, INVESCO Private Capital Investments, Inc.; Chairman and Director, INVESCO Realty, Inc.; and Senior Vice President, Invesco Group Services, Inc. Formerly: Senior Vice President, Invesco Management Group, Inc. and Invesco Advisers, Inc.; Assistant Vice President, The Invesco Funds | | N/A | | N/A |
Adrien Deberghes - 1967 Principal Financial Officer, Treasurer and Vice President | | 2020 | | Head of the Fund Office of the CFO and Fund Administration; Vice President, Invesco Advisers, Inc.; Principal Financial Officer, Treasurer and Vice President, The Invesco Funds; Vice President, Invesco Exchange-Traded Fund Trust, Invesco Exchange-Traded Fund Trust II, Invesco India Exchange-Traded Fund Trust, Invesco Actively Managed Exchange-Traded Fund Trust, Invesco Actively Managed Exchange-Traded Commodity Fund Trust and Invesco Exchange-Traded Self-Indexed Fund Trust Formerly: Senior Vice President and Treasurer, Fidelity Investments | | N/A | | N/A |
Crissie M. Wisdom - 1969 Anti-Money Laundering Compliance Officer | | 2013 | | Anti-Money Laundering and OFAC Compliance Officer for Invesco U.S. entities including: Invesco Advisers, Inc. and its affiliates, Invesco Capital Markets, Inc., Invesco Distributors, Inc., Invesco Investment Services, Inc., The Invesco Funds, Invesco Capital Management, LLC, Invesco Trust Company; and Fraud Prevention Manager for Invesco Investment Services, Inc. | | N/A | | N/A |
| | |
| T-5 | | Invesco Balanced-Risk Allocation Fund |
Trustees and Officers–(continued)
| | | | | | | | |
Name, Year of Birth and Position(s) Held with the Trust | | Trustee and/or Officer Since | | Principal Occupation(s) During Past 5 Years | | Number of Funds in Fund Complex Overseen by Trustee | | Other Directorship(s) Held by Trustee During Past 5 Years |
| Officers–(continued) | | | | | | | | |
Todd F. Kuehl - 1969 Chief Compliance Officer and Senior Vice President | | 2020 | | Chief Compliance Officer, Invesco Advisers, Inc. (registered investment adviser); and Chief Compliance Officer and Senior Vice President, The Invesco Funds Formerly: Managing Director and Chief Compliance Officer, Legg Mason (Mutual Funds); Chief Compliance Officer, Legg Mason Private Portfolio Group (registered investment adviser) | | N/A | | N/A |
James Bordewick, Jr. - 1959 Senior Vice President and Senior Officer | | 2022 | | Senior Vice President and Senior Officer, The Invesco Funds; and Chief Legal Officer, KingsCrowd, Inc. (research and analytical platform for investment in private capital markets) Formerly, Chief Operating Officer and Head of Legal and Regulatory, Netcapital (private capital investment platform); Managing Director, General Counsel of asset management and Chief Compliance Officer for asset management and private banking, Bank of America Corporation; Chief Legal Officer, Columbia Funds and BofA Funds; Senior Vice President and Associate General Counsel, MFS Investment Management; Chief Legal Officer, MFS Funds; Associate, Ropes & Gray; Associate, Gaston Snow & Ely Bartlett | | N/A | | N/A |
The Statement of Additional Information of the Trust includes additional information about the Fund’s Trustees and is available upon request, without charge, by calling 1.800.959.4246. Please refer to the Fund’s Statement of Additional Information for information on the Fund’s sub-advisers.
| | | | | | |
| Office of the Fund | | Investment Adviser | | Distributor | | Auditors |
| 11 Greenway Plaza, Suite 1000 | | Invesco Advisers, Inc. | | Invesco Distributors, Inc. | | PricewaterhouseCoopers LLP |
| Houston, TX 77046-1173 | | 1555 Peachtree Street, N.E. | | 11 Greenway Plaza, Suite 1000 | | 1000 Louisiana Street, Suite 5800 |
| | Atlanta, GA 30309 | | Houston, TX 77046-1173 | | Houston, TX 77002-5021 |
| | | |
| Counsel to the Fund | | Counsel to the Independent Trustees | | Transfer Agent | | Custodian |
| Stradley Ronon Stevens & Young, LLP | | Goodwin Procter LLP | | Invesco Investment Services, Inc. | | State Street Bank and Trust Company |
| 2005 Market Street, Suite 2600 | | 901 New York Avenue, N.W. | | 11 Greenway Plaza, Suite 1000 | | 225 Franklin Street |
| Philadelphia, PA 19103-7018 | | Washington, D.C. 20001 | | Houston, TX 77046-1173 | | Boston, MA 02110-2801 |
| | |
| T-6 | | Invesco Balanced-Risk Allocation Fund |
(This page intentionally left blank)
(This page intentionally left blank)
(This page intentionally left blank)

Go paperless with eDelivery
Visit invesco.com/edelivery to enjoy the convenience and security of anytime electronic access to your investment documents.
With eDelivery, you can elect to have any or all of the following materials delivered straight to your inbox to download, save and print from your own computer:
∎ Fund reports and prospectuses
∎ Quarterly statements
∎ Daily confirmations
∎ Tax forms
Invesco mailing information
Send general correspondence to Invesco Investment Services, Inc., P.O. Box 219078, Kansas City, MO 64121-9078.
Important notice regarding delivery of security holder documents
To reduce Fund expenses, only one copy of most shareholder documents may be mailed to shareholders with multiple accounts at the same address (Householding). Mailing of your shareholder documents may be householded indefinitely unless you instruct us otherwise. If you do not want the mailing of these documents to be combined with those for other members of your household, please contact Invesco Investment Services, Inc. at 800 959 4246 or contact your financial institution. We will begin sending you individual copies for each account within 30 days after receiving your request.
Fund holdings and proxy voting information
The Fund provides a complete list of its portfolio holdings four times each year, at the end of each fiscal quarter. For the second and fourth quarters, the list appears, respectively, in the Fund’s semiannual and annual reports to shareholders. For the first and third quarters, the Fund files the list with the Securities and Exchange Commission (SEC) as an exhibit to its reports on Form N-PORT. The most recent list of portfolio holdings is available at invesco.com/completeqtrholdings. Shareholders can also look up the Fund’s Form N-PORT filings on the SEC website, sec.gov. The SEC file numbers for the Fund are shown below.
A description of the policies and procedures that the Fund uses to determine how to vote proxies relating to portfolio securities is available without charge, upon request, from our Client Services department at 800 959 4246, or at invesco.com/corporate/about-us/esg. The information is also available on the SEC website, sec.gov.
Information regarding how the Fund voted proxies related to its portfolio securities during the most recent 12-month period ended June 30 is available at invesco.com/proxysearch. This information is also available on the SEC website, sec.gov.
Invesco Advisers, Inc. is an investment adviser; it provides investment advisory services to individual and institutional clients and does not sell securities. Invesco Distributors, Inc. is the US distributor for Invesco Ltd.’s retail mutual funds, exchange-traded funds and institutional money market funds. Both are wholly owned, indirect subsidiaries of Invesco Ltd.

| | | | |
| SEC file number(s): 811-05426 and 033-19338 | | Invesco Distributors, Inc. | | IBRA-AR-1 |

| | |
| | |
| Annual Report to Shareholders | | October 31, 2022 |
Invesco Balanced-Risk Commodity Strategy Fund
Nasdaq:
A: BRCAX ∎ C: BRCCX ∎ R: BRCRX ∎ Y: BRCYX ∎ R5: BRCNX ∎ R6: IBRFX
Management’s Discussion of Fund Performance
| | | | |
| |
Performance summary For the fiscal year ended October 31, 2022, Class A shares of Invesco Balanced-Risk Commodity Strategy Fund (the Fund), at net asset value (NAV), underperformed the Bloomberg Commodity Index, the Fund’s broad market/style-specific benchmark. Your Fund’s long-term performance appears later in this report. | |
| |
Fund vs. Indexes | |
Total returns, 10/31/21 to 10/31/22, at net asset value (NAV). Performance shown does not include applicable contingent deferred sales charges (CDSC) or front-end sales charges, which would have reduced performance. | |
Class A Shares | | | 6.63 | % |
Class C Shares | | | 5.69 | |
Class R Shares | | | 6.17 | |
Class Y Shares | | | 6.80 | |
Class R5 Shares | | | 6.76 | |
Class R6 Shares | | | 6.77 | |
Bloomberg Commodity Index▼ (Broad Market/Style-Specific Index) | | | 11.15 | |
|
Source(s): ▼RIMES Technologies Corp. | |
Market conditions and your Fund
The fiscal year ended October 31, 2022, provided positive returns for commodities due to gains in the energy and agriculture sectors that were favorably impacted by the war between Russia and Ukraine. Given Russia is the third largest oil producer in the world and Russia and Ukraine combined produce approximately one-third of the world’s wheat, the war has led to supply disruptions and an energy crisis in Europe resulting from sanctions on Russian output. Industrial metals and precious metals declined as inflation remains at a high and persistent level causing central banks to take aggressive actions in the form of interest rate increases that have resulted in fears of a global economic recession. Moreover, the environment has seen both high volatility and a high divergence of returns across commodity complexes and individual exposures. Commodities surged after Russia invaded Ukraine in March 2022 with prices reaching a peak in early June; afterwards, recession fears gripped the markets and there was a general decline that saw many commodities fall back to their pre-war levels. With that background in mind, the Fund invests with a strategic long bias in four commodity complexes – agriculture, energy, industrial metals and precious metals – and then makes tactical adjustments on a monthly basis to try to take advantage of short-term market dynamics. Gains in the energy sector dominated net results during the fiscal year, and in fact, energy’s contribution was more than 100% of net total returns due to the war’s supply disruptions and the subsequent impact on oil, natural gas and refined products. The Fund’s ability to tactically adjust its exposure to assets detracted from the Fund’s relative performance over the fiscal year mainly due to the Fund being underweight and even periodically net short natural gas and wheat leading up to and into Russia’s in-
vasion of Ukraine. Overall, the Fund under-performed the Bloomberg Commodity Index, primarily due to the monthly tactical positioning in energy.
Sanctions on Russian oil and natural gas forced Europe to source products from alternative producers in an already tight market which propelled energy to be the top contributing sub-complex in the Fund. Compounding the supply imbalance was limited excess refined product capacity in the US for gasoline, diesel and heating oil while OPEC implemented a production cut late in the fiscal year despite protest from the White House. Gains were exceptional in the energy sector with all assets up significantly due to supply/demand imbalances. As a result, top contributors based on allocation weights were heating oil, unleaded gasoline, gasoil and Brent crude. Tactical positioning in energy was the Fund’s primary detractor mostly due to pre-war positioning that was net short natural gas while concurrently being underweight in heating oil and gasoil.
The Fund’s strategic positioning within the agriculture sector contributed to overall results as positive returns from grains and livestock were able to overcome losses in soft commodities including cotton, coffee and sugar. Gains in wheat and corn dominated headlines but the Fund’s leading contributors were soymeal, soybeans and soybean oil that were rewarded by poor weather across North and South America that impaired production. Soybean oil further benefited from temporary shortages of palm oil and sunflower oil from Ukraine, as well as its crossover use as a biofuel given the soaring prices of refined petroleum products such as diesel. Cotton and coffee prices suffered due to demand fears as soaring energy prices and tight monetary policy raised the risk of a global economic slowdown. Tactical agriculture exposure was a net detractor mainly due to the Fund’s net
short position in wheat in the pre-war period of early 2022.
Strategic positioning in industrial metals was a detractor from the Fund’s relative performance as it was the worst-performing of the four primary sub-complexes. Copper was the worst performing commodity in the Fund’s universe as demand for metal has declined along with Chinese economic activity. China is both a primary consumer and processor of the metal
along with aluminum and the country’s ongoing zero-COVID-19 policy has resulted in three straight reported declines in manufacturing activity. Global central bank efforts to contain inflation have led to a spike in interest rates which has reduced spending on new construction and industrial metals demand in tandem. Tactical exposure was favorable as the Fund was underweight across the fiscal year.
The Fund’s strategic exposure to precious metals also detracted from overall results as both gold and silver declined. Rising interest rates and the US dollar weighed on the price of gold despite elevated levels of inflation as investors currently believe the US Federal Reserve and other central banks will be successful in their battle with inflation. Silver’s losses were compounded by the metal’s crossover use as an industrial metal making it more economically sensitive than gold. Tactical exposure was favorable as the Fund was net underweight across the fiscal year.
Please note that our strategy is principally implemented with derivative instruments that include futures, total return swaps and commodity-linked notes. Therefore, all or most of the performance of the strategy, both positive and negative, can be attributed to these instruments. Derivatives can be a cost-effective way to gain exposure to asset classes. However, derivatives may amplify traditional investment risks through the creation of leverage and may be less liquid than traditional securities.
Thank you for your continued investment in Invesco Balanced-Risk Commodity Strategy Fund.
Portfolio manager(s):
Mark Ahnrud
Chris Devine
Scott Hixon
Christian Ulrich
Scott Wolle
The views and opinions expressed in management’s discussion of Fund performance are those of Invesco Advisers, Inc. and its affiliates. These views and opinions are subject to change at any time based on factors such as market and economic conditions. These views and opinions may not be relied upon as investment advice or recommendations, or as an offer for a particular security. The information is not a complete analysis of every aspect of any market, country, industry, security or the Fund. Statements of fact are from sources considered reliable, but Invesco Advisers, Inc.
| | |
| 2 | | Invesco Balanced-Risk Commodity Strategy Fund |
makes no representation or warranty as to their completeness or accuracy. Although historical performance is no guarantee of future results, these insights may help you understand our investment management philosophy.
See important Fund and, if applicable, index disclosures later in this report.
| | |
| 3 | | Invesco Balanced-Risk Commodity Strategy Fund |
Your Fund’s Long-Term Performance
Results of a $10,000 Investment – Oldest Share Class(es)
Fund and index data from 10/31/12
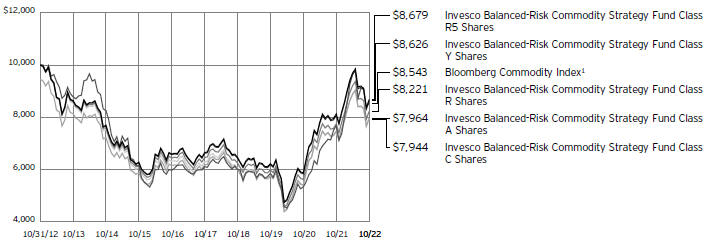
1 Source: RIMES Technologies Corp.
Past performance cannot guarantee future results.
The data shown in the chart include reinvested distributions, applicable sales charges and Fund expenses including management
fees. Index results include reinvested dividends, but they do not reflect sales charges. Performance of the peer group, if applicable, reflects fund expenses and management fees;
performance of a market index does not. Performance shown in the chart does not reflect deduction of taxes a shareholder would pay on Fund distributions or sale of Fund shares.
| | |
| 4 | | Invesco Balanced-Risk Commodity Strategy Fund |
| | | | |
| |
Average Annual Total Returns | |
As of 10/31/22, including maximum applicable sales charges | |
| |
Class A Shares | | | | |
Inception (11/30/10) | | | -1.37 | % |
10 Years | | | -2.25 | |
5 Years | | | 4.01 | |
1 Year | | | 0.72 | |
| |
Class C Shares | | | | |
Inception (11/30/10) | | | -1.40 | % |
10 Years | | | -2.28 | |
5 Years | | | 4.41 | |
1 Year | | | 4.80 | |
| |
Class R Shares | | | | |
Inception (11/30/10) | | | -1.13 | % |
10 Years | | | -1.94 | |
5 Years | | | 4.93 | |
1 Year | | | 6.17 | |
| |
Class Y Shares | | | | |
Inception (11/30/10) | | | -0.64 | % |
10 Years | | | -1.47 | |
5 Years | | | 5.43 | |
1 Year | | | 6.80 | |
| |
Class R5 Shares | | | | |
Inception (11/30/10) | | | -0.60 | % |
10 Years | | | -1.41 | |
5 Years | | | 5.47 | |
1 Year | | | 6.76 | |
| |
Class R6 Shares | | | | |
Inception (9/24/12) | | | -1.67 | % |
10 Years | | | -1.37 | |
5 Years | | | 5.48 | |
1 Year | | | 6.77 | |
The performance data quoted represent past performance and cannot guarantee future results; current performance may be lower or higher. Please visit invesco.com/performance for the most recent month-end performance. Performance figures reflect reinvested distributions, changes in net asset value and the effect of the maximum sales charge unless otherwise stated. Performance figures do not reflect deduction of taxes a shareholder would pay on Fund distributions or sale of Fund shares. Investment return and principal value will fluctuate so that you may have a gain or loss when you sell shares.
Class A share performance reflects the maximum 5.50% sales charge, and Class C share performance reflects the applicable contingent deferred sales charge (CDSC) for the period involved. The CDSC on Class C shares is 1% for the first year after purchase. Class R, Class Y, Class R5 and Class R6 shares do not have a front-end sales charge or a CDSC; therefore, performance is at net asset value.
The performance of the Fund’s share classes will differ primarily due to different sales charge structures and class expenses.
Fund performance reflects any applicable fee waivers and/or expense reimbursements. Had the adviser not waived fees
and/or reimbursed expenses currently or in the past, returns would have been lower. See current prospectus for more information.
| | |
| 5 | | Invesco Balanced-Risk Commodity Strategy Fund |
Supplemental Information
Invesco Balanced-Risk Commodity Strategy Fund’s investment objective is to provide total return.
| ∎ | Unless otherwise stated, information presented in this report is as of October 31, 2022, and is based on total net assets. |
| ∎ | Unless otherwise noted, all data is provided by Invesco. |
| ∎ | To access your Fund’s reports/prospectus, visit invesco.com/fundreports. |
About indexes used in this report
| ∎ | The Bloomberg Commodity Index is an unmanaged index designed to be a highly liquid and diversified benchmark for the commodity futures market. |
| ∎ | The Fund is not managed to track the performance of any particular index, including the index(es) described here, and consequently, the performance of the Fund may deviate significantly from the performance of the index(es). |
| ∎ | A direct investment cannot be made in an index. Unless otherwise indicated, index results include reinvested dividends, and they do not reflect sales charges. Performance of the peer group, if applicable, reflects fund expenses; performance of a market index does not. |
|
|
This report must be accompanied or preceded by a currently effective Fund prospectus, which contains more complete information, including sales charges and expenses. Investors should read it carefully before investing. |
|
| NOT FDIC INSURED | MAY LOSE VALUE | NO BANK GUARANTEE |
| | |
| 6 | | Invesco Balanced-Risk Commodity Strategy Fund |
Fund Information
Target Risk Contribution and Notional Asset Weights as of October 31, 2022
| | | | |
| Asset Class | | Target
Risk
Contribution* | | Notional
Asset
Weights** |
| | |
Agriculture | | 20.36% | | 28.35% |
Energy | | 64.89 | | 44.58 |
Industrial Metals | | 9.88 | | 14.22 |
Precious Metals | | 4.87 | | 13.70 |
Total | | 100.00% | | 100.85% |
| * | Reflects the risk that each asset class is expected to contribute to the overall risk of the Fund as measured by standard deviation and estimates of risk based on historical data. Standard deviation measures the annualized fluctuations (volatility) of monthly returns. |
| ** | Proprietary models determine the Notional Asset Weights necessary to achieve the Target Risk Contributions. Total Notional Asset Weight greater than 100% is achieved through derivatives and other instruments that create leverage. |
| | |
| 7 | | Invesco Balanced-Risk Commodity Strategy Fund |
Consolidated Schedule of Investments
October 31, 2022
| | | | | | | | | | | | | | | | |
| | | Interest
Rate | | | Maturity
Date | | | Principal
Amount
(000) | | | Value | |
U.S. Treasury Securities–30.15% | | | | | | | | | | | | | |
U.S. Treasury Bills–9.78%(a) | | | | | | | | | | | | | |
U.S. Treasury Bills | | | 1.48 | % | | | 11/25/2022 | | | $ | 59,300 | | | $ | 59,241,886 | |
U.S. Treasury Bills | | | 1.71 | % | | | 12/08/2022 | | | | 56,200 | | | | 56,100,651 | |
| | | | | | | | | | | | | | | | 115,342,537 | |
| | | |
U.S. Treasury Floating Rate Notes–20.37%(b) | | | | | | | | | | | | | |
U.S. Treasury Floating Rate Notes (3 mo. U.S. Treasury Bill Money Market Yield Rate - 0.02%) | | | 4.10 | % | | | 01/31/2024 | | | | 80,200 | | | | 80,190,900 | |
U.S. Treasury Floating Rate Notes (3 mo. U.S. Treasury Bill Money Market Yield Rate - 0.08%) | | | 4.04 | % | | | 04/30/2024 | | | | 74,500 | | | | 74,391,815 | |
U.S. Treasury Floating Rate Notes (3 mo. U.S. Treasury Bill Money Market Yield Rate + 0.04%) | | | 4.15 | % | | | 07/31/2024 | | | | 85,600 | | | | 85,516,732 | |
| | | | | | | | | | | | | | | | 240,099,447 | |
Total U.S. Treasury Securities (Cost $355,642,491) | | | | | | | | | | | | | | | 355,441,984 | |
| | | | |
| | | | | | Expiration
Date | | | | | | | |
Commodity-Linked Securities–6.97% | | | | | | | | | | | | | |
Barclays Bank PLC (United Kingdom), U.S. Federal Funds Effective Rate minus 0.06% (linked to the Barclays Gold Nearby Total Return Index, multiplied by 2.5)(c) | | | | 11/21/2022 | | | | 15,200 | | | | 11,141,453 | |
Barclays Bank PLC (United Kingdom), U.S. Federal Funds Effective Rate minus 0.06% (linked to the Barclays Copper Roll Yield Total Return Index, multiplied by 2)(c) | | | | 08/01/2023 | | | | 14,730 | | | | 12,757,762 | |
Citigroup Global Markets Holdings Inc.,, 1 month SOFR plus 0.04% (linked to the S&P GSCI Gold Excess Return Index, multiplied by 2.5)(c) | | | | 11/30/2023 | | | | 33,500 | | | | 32,837,224 | |
Societe Generale S.A. (France), U.S. Federal Funds Effective Rate minus 0.02% (linked to the Societe Generale Soybean Meal Index, multiplied by 2)(c) | | | | 12/22/2022 | | | | 17,500 | | | | 25,469,019 | |
Total Commodity-Linked Securities (Cost $80,930,000) | | | | | | | | | | | | 82,205,458 | |
| | | | |
| | | | | | | | | Shares | | | | |
Money Market Funds–56.66% | | | | | | | | | | | | | |
Invesco Government & Agency Portfolio, Institutional Class, 3.07%(d)(e) | | | | | | | | 161,006,414 | | | | 161,006,414 | |
Invesco Liquid Assets Portfolio, Institutional Class, 3.03%(d)(e) | | | | | | | | 114,006,606 | | | | 114,029,407 | |
Invesco Liquidity Funds PLC, Invesco US Dollar Liquidity Portfolio (Ireland), Institutional Class, 3.16%(d)(e) | | | | | | | | 209,004,299 | | | | 209,004,299 | |
Invesco Treasury Portfolio, Institutional Class, 3.08%(d)(e) | | | | | | | | 184,007,331 | | | | 184,007,331 | |
Total Money Market Funds (Cost $668,001,883) | | | | | | | | | | | | 668,047,451 | |
TOTAL INVESTMENTS IN SECURITIES-93.78% (Cost $1,104,574,374) | | | | | | | | | | | | 1,105,694,893 | |
OTHER ASSETS LESS LIABILITIES-6.22% | | | | | | | | | | | | 73,386,734 | |
NET ASSETS-100.00% | | | | | | | | | | | $ | 1,179,081,627 | |
Investment Abbreviations:
SOFR – Secured Overnight Financing Rate
See accompanying Notes to Consolidated Financial Statements which are an integral part of the financial statements.
| | |
| 8 | | Invesco Balanced-Risk Commodity Strategy Fund |
Notes to Consolidated Schedule of Investments:
| (a) | Security traded on a discount basis. The interest rate shown represents the discount rate at the time of purchase by the Fund. |
| (b) | Interest or dividend rate is redetermined periodically. Rate shown is the rate in effect on October 31, 2022. |
| (c) | Security purchased or received in a transaction exempt from registration under the Securities Act of 1933, as amended (the “1933 Act”). The security may be resold pursuant to an exemption from registration under the 1933 Act, typically to qualified institutional buyers. The aggregate value of these securities at October 31, 2022 was $82,205,458, which represented 6.97% of the Fund’s Net Assets. |
| (d) | Affiliated issuer. The issuer and/or the Fund is a wholly-owned subsidiary of Invesco Ltd., or is affiliated by having an investment adviser that is under common control of Invesco Ltd. The table below shows the Fund’s transactions in, and earnings from, its investments in affiliates for the fiscal year ended October 31, 2022. |
| | | | | | | | | | | | | | | | | | | | | | | | | | | | |
| | | Value
October 31, 2021 | | | Purchases
at Cost | | | Proceeds
from Sales | | | Change in
Unrealized
Appreciation | | | Realized
Gain
(Loss) | | | Value
October 31, 2022 | | | Dividend Income | |
| Investments in Affiliated Money Market Funds: | | | | | | | | | | | | | | | | | | | | | | | | | | | | |
Invesco Government & Agency Portfolio, Institutional Class | | $ | 219,699,971 | | | $ | 435,059,306 | | | $ | (493,752,863 | ) | | $ | - | | | $ | - | | | $ | 161,006,414 | | | $ | 1,698,803 | |
Invesco Liquid Assets Portfolio, Institutional Class | | | 155,968,493 | | | | 310,756,647 | | | | (352,680,616 | ) | | | 60,468 | | | | (75,585) | | | | 114,029,407 | | | | 1,213,772 | |
Invesco Liquidity Funds PLC, Invesco US Dollar Liquidity Portfolio, Institutional Class | | | 317,059,908 | | | | 1,696,227,438 | | | | (1,804,283,047 | ) | | | - | | | | - | | | | 209,004,299 | | | | 2,156,749 | |
Invesco Treasury Portfolio, Institutional Class | | | 251,085,682 | | | | 497,210,635 | | | | (564,288,986 | ) | | | - | | | | - | | | | 184,007,331 | | | | 1,842,087 | |
Total | | $ | 943,814,054 | | | $ | 2,939,254,026 | | | $ | (3,215,005,512 | ) | | $ | 60,468 | | | $ | (75,585) | | | $ | 668,047,451 | | | $ | 6,911,411 | |
| (e) | The rate shown is the 7-day SEC standardized yield as of October 31, 2022. |
| | | | | | | | | | | | | | | | | | | | |
| Open Futures Contracts(a) | |
|
| |
| Long Futures Contracts | | Number of
Contracts | | | Expiration
Month | | | Notional
Value | | | Value | | | Unrealized
Appreciation
(Depreciation) | |
|
| |
Commodity Risk | | | | | | | | | | | | | | | | | | | | |
Coffee ’C’ | | | 308 | | | | March-2023 | | | $ | 20,102,775 | | | $ | (5,185,946 | ) | | $ | (5,185,946 | ) |
Corn | | | 1,122 | | | | December-2022 | | | | 38,793,150 | | | | 1,936,153 | | | | 1,936,153 | |
Natural Gas | | | 537 | | | | November-2022 | | | | 34,126,350 | | | | (8,881,709 | ) | | | (8,881,709 | ) |
Soybeans | | | 1,100 | | | | July-2023 | | | | 79,103,750 | | | | 1,276,621 | | | | 1,276,621 | |
Wheat | | | 240 | | | | December-2022 | | | | 10,587,000 | | | | (1,427,581 | ) | | | (1,427,581 | ) |
Total Futures Contracts | | | | | | | | | | | | | | $ | (12,282,462 | ) | | $ | (12,282,462 | ) |
| (a) | Futures contracts collateralized by $51,865,000 cash held with Goldman Sachs & Co., the futures commission merchant. |
Open Over-The-Counter Total Return Swap Agreements(a)(b)
| | | | | | | | | | | | | | | | | | | | | | | | | | | | | | | | | | | | |
| Counterparty | | Pay/
Receive | | Reference
Entity(c) | | Fixed
Rate | | | Payment
Frequency | | Number of
Contracts | | | Maturity Date | | Notional Value | | | Upfront
Payments
Paid
(Received) | | | Value | | | Unrealized
Appreciation
(Depreciation) | |
Commodity Risk | | | | | | | | | | | | | | | | | | | | | | | | | | | | | | | | | | |
Barclays Bank PLC | | Receive | | Barclays Brent Crude Roll Yield Index | | | 0.35 | % | | Monthly | | | 33,600 | | | February–2023 | | | USD | | | | 19,281,000 | | | | $– | | | $ | 531,105 | | | $ | 531,105 | |
Barclays Bank PLC | | Receive | | Barclays WTI Crude Roll Yield Excess Return Index | | | 0.35 | | | Monthly | | | 228,500 | | | March–2023 | | | USD | | | | 93,418,066 | | | | – | | | | 1,995,056 | | | | 1,995,056 | |
Goldman Sachs International | | Receive | | S&P GSCI Soybean Meal Excess Return Index | | | 0.42 | | | Monthly | | | 23,050 | | | December–2022 | | | USD | | | | 27,185,862 | | | | – | | | | 1,858,982 | | | | 1,858,982 | |
J.P. Morgan Chase Bank, N.A. | | Pay | | S&P GSCI Gold Index Excess Return | | | 0.09 | | | Monthly | | | 40,500 | | | July–2023 | | | USD | | | | 4,851,240 | | | | – | | | | 39,301 | | | | 39,301 | |
J.P. Morgan Chase Bank, N.A. | | Receive | | J.P. Morgan Contag Beta Gas Oil Excess Return Index | | | 0.25 | | | Monthly | | | 214,500 | | | March–2023 | | | USD | | | | 93,712,326 | | | | – | | | | 647,726 | | | | 647,726 | |
Macquarie Bank Ltd. | | Pay | | Macquarie Single Commodity Nickel type A Excess Return Index | | | 0.17 | | | Monthly | | | 212,000 | | | February–2023 | | | USD | | | | 29,999,102 | | | | – | | | | 695,763 | | | | 695,763 | |
See accompanying Notes to Consolidated Financial Statements which are an integral part of the financial statements.
| | |
| 9 | | Invesco Balanced-Risk Commodity Strategy Fund |
Open Over-The-Counter Total Return Swap Agreements(a)(b)–(continued)
| | | | | | | | | | | | | | | | | | | | | | | | | | | | | | | | | | |
| Counterparty | | Pay/
Receive | | Reference
Entity(c) | | Fixed
Rate | | | Payment
Frequency | | Number of
Contracts | | | Maturity Date | | Notional Value | | | Upfront
Payments
Paid
(Received) | | Value | | | Unrealized
Appreciation
(Depreciation) | |
Macquarie Bank Ltd. | | Pay | | Macquarie Single Commodity Zinc type A Excess Return Index | | | 0.12 | % | | Monthly | | | 65,000 | | | October–2023 | | | USD | | | | 12,394,961 | | | $– | | $ | 891,586 | | | $ | 891,586 | |
Macquarie Bank Ltd. | | Receive | | Macquarie Aluminium Dynamic Selection Index | | | 0.30 | | | Monthly | | | 1,470,000 | | | February–2023 | | | USD | | | | 76,976,697 | | | – | | | 298,557 | | | | 298,557 | |
Merrill Lynch International | | Pay | | Merrill Lynch Gold Excess Return Index | | | 0.01 | | | Monthly | | | 9,000 | | | September–2023 | | | USD | | | | 1,675,845 | | | – | | | 0 | | | | 0 | |
Merrill Lynch International | | Pay | | MLCIAPLH Excess Return Index | | | 0.00 | | | Monthly | | | 360,000 | | | September–2023 | | | USD | | | | 2,973,996 | | | – | | | 0 | | | | 0 | |
Merrill Lynch International | | Pay | | MLCX2CCER Excess Return Index | | | 0.00 | | | Monthly | | | 321,000 | | | December–2022 | | | USD | | | | 15,778,402 | | | – | | | 0 | | | | 0 | |
Merrill Lynch International | | Pay | | MLCX2LCER Excess Return Index | | | 0.06 | | | Monthly | | | 260,000 | | | March–2023 | | | USD | | | | 16,030,066 | | | – | | | 0 | | | | 0 | |
Merrill Lynch International | | Receive | | Merrill Lynch Soybean Meal Index | | | 0.30 | | | Monthly | | | 19,200 | | | February–2023 | | | USD | | | | 15,930,472 | | | – | | | 0 | | | | 0 | |
Merrill Lynch International | | Receive | | MLCX Dynamic Enhanced Copper Excess Return Index | | | 0.25 | | | Monthly | | | 76,800 | | | February–2023 | | | USD | | | | 54,017,426 | | | – | | | 0 | | | | 0 | |
Merrill Lynch International | | Receive | | MLCX Natural Gas Annual Excess Return Index | | | 0.25 | | | Monthly | | | 281,300 | | | June–2023 | | | USD | | | | 37,388,821 | | | – | | | 0 | | | | 0 | |
Merrill Lynch International | | Receive | | MLCX1XBE Excess Return Index | | | 0.10 | | | Monthly | | | 132,700 | | | September–2023 | | | USD | | | | 54,376,280 | | | – | | | 0 | | | | 0 | |
Morgan Stanley Capital Services LLC | | Receive | | Morgan Stanley MSCY2XB0 Index | | | 0.15 | | | Monthly | | | 57,500 | | | September–2023 | | | USD | | | | 44,548,338 | | | – | | | 1,575,673 | | | | 1,575,673 | |
Morgan Stanley Capital Services LLC | | Receive | | MS Soybean Oil Dynamic Roll | | | 0.30 | | | Monthly | | | 168,700 | | | April–2023 | | | USD | | | | 46,298,804 | | | – | | | 4,065,670 | | | | 4,065,670 | |
Royal Bank of Canada | | Receive | | RBC Enhanced Brent Crude Oil 01 Excess Return Index | | | 0.35 | | | Monthly | | | 87,900 | | | December–2022 | | | USD | | | | 45,515,262 | | | – | | | 0 | | | | 0 | |
Subtotal – Appreciation | | | | | | | | | | | | | | | | – | | | 12,599,419 | | | | 12,599,419 | |
Commodity Risk | | | | | | | | | | | | | | | | | | | | | | | | | | | |
BNP Paribas S.A. | | Receive | | BNP Paribas Commodity Daily Dynamic Curve CO Index | | | 0.25 | | | Monthly | | | 51,500 | | | August–2023 | | | USD | | | | 30,878,355 | | | – | | | (535,214 | ) | | | (535,214 | ) |
Canadian Imperial Bank of Commerce | | Receive | | Canadian Imperial Bank of Commerce Dynamic Roll LME Copper Excess Return Index 2 | | | 0.27 | | | Monthly | | | 147,500 | | | August–2023 | | | USD | | | | 13,623,646 | | | – | | | (219,554 | ) | | | (219,554 | ) |
Cargill, Inc. | | Receive | | Cargill Single Commodity Index | | | 0.41 | | | Monthly | | | 26,300 | | | June–2023 | | | USD | | | | 6,068,054 | | | – | | | (161,072 | ) | | | (161,072 | ) |
Goldman Sachs International | | Receive | | Enhanced Strategy AB31 on the S&P GSCI Cotton Excess Return Index | | | 0.45 | | | Monthly | | | 932,000 | | | December–2022 | | | USD | | | | 53,264,480 | | | – | | | (7,101,066 | ) | | | (7,101,066 | ) |
Macquarie Bank Ltd. | | Receive | | Macquarie Single Commodity Silver type A Excess Return Index | | | 0.16 | | | Monthly | | | 139,500 | | | February–2023 | | | USD | | | | 27,557,067 | | | – | | | (327,560 | ) | | | (327,560 | ) |
See accompanying Notes to Consolidated Financial Statements which are an integral part of the financial statements.
| | |
| 10 | | Invesco Balanced-Risk Commodity Strategy Fund |
Open Over-The-Counter Total Return Swap Agreements(a)(b)–(continued)
| | | | | | | | | | | | | | | | | | | | | | | | | | | | | | | | | | | | | | |
| Counterparty | | Pay/
Receive | | Reference
Entity(c) | | Fixed
Rate | | | Payment
Frequency | | | Number of
Contracts | | | Maturity Date | | | Notional Value | | | Upfront
Payments
Paid
(Received) | | Value | | | Unrealized
Appreciation
(Depreciation) | |
Morgan Stanley Capital Services LLC | | Pay | | Morgan
Stanley
MSCY2KW0
Index | | | 0.05 | % | | | Monthly | | | | 22,200 | | | | December–2022 | | | | USD | | | | 6,571,164 | | | $– | | $ | (184,642 | ) | | $ | (184,642 | ) |
UBS AG | | Receive | | UBS
Modified
Roll Select
Heating Oil
Strategy | | | 0.30 | | | | Monthly | | | | 724,000 | | | | December–2022 | | | | USD | | | | 96,379,242 | | | – | | | (793,214 | ) | | | (793,214 | ) |
Subtotal – Depreciation | | | | | | | | | | | | | | | | | | | | | | | – | | | (9,322,322 | ) | | | (9,322,322 | ) |
Total – Total Return Swap Agreements | | | $– | | $ | 3,277,097 | | | $ | 3,277,097 | |
| (a) | Open Over-The-Counter Total Return Swap Agreements are collateralized by cash held with the swap Counterparties in the amount of $7,070,000. |
| (b) | The Fund receives or pays payments based on any positive or negative return on the Reference Entity, respectively. |
| (c) | The Reference Entity Components table below includes additional information regarding the underlying components of certain reference entities that are not publicly available. |
| | | | |
| Reference Entity Components |
| Reference Entity | | Underlying Components | | Percentage |
| | |
| Barclays Brent Crude Roll Yield Index | | | | |
| | |
| | Long Futures Contracts | | |
| | |
| | Brent Crude | | 100.00% |
| | |
| | |
| Barclays WTI Crude Roll Yield Excess Return Index | | | | |
| | |
| | Long Futures Contracts | | |
| | |
| | WTI Crude | | 100.00% |
| | |
| | |
| S&P GSCI Soybean Meal Excess Return Index | | | | |
| | |
| | Long Futures Contracts | | |
| | |
| | Soybean Meal | | 100.00% |
| | |
| | |
| S&P GSCI Gold Index Excess Return | | | | |
| | |
| | Long Futures Contracts | | |
| | |
| | Gold | | 100.00% |
| | |
| | |
| J.P. Morgan Contag Beta Gas Oil Excess Return Index | | | | |
| | |
| | Long Futures Contracts | | |
| | |
| | Gas Oil | | 100.00% |
| | |
| | |
| Macquarie Aluminum Dynamic Selection Index | | | | |
| | |
| | Long Futures Contracts | | |
| | |
| | Aluminum | | 100.00% |
| | |
| | |
| Macquarie Single Commodity Nickel type A Excess Return Index | | | | |
| | |
| | Long Futures Contracts | | |
| | |
| | Nickel | | 100.00% |
| | |
| | |
| Macquarie Single Commodity Zinc type A Excess Return Index | | | | |
| | |
| | Long Futures Contracts | | |
| | |
| | Zinc | | 100.00% |
| | |
| | |
| Merrill Lynch Gold Excess Return Index | | | | |
| | |
| | Long Futures Contracts | | |
| | |
| | Gold | | 100.00% |
| | |
| | |
| MLCIAPLH Excess Return Index | | | | |
| | |
| | Long Futures Contracts | | |
| | |
| | Lean Hogs | | 100.00% |
| | |
See accompanying Notes to Consolidated Financial Statements which are an integral part of the financial statements.
| | |
| 11 | | Invesco Balanced-Risk Commodity Strategy Fund |
| | | | |
| Reference Entity Components–(continued) |
| Reference Entity | | Underlying Components | | Percentage |
| | |
| MLCX2CCER Excess Return Index | | | | |
| | |
| | Long Futures Contracts | | |
| | |
| | Cocoa | | 100.00% |
| | |
| | |
| MLCX2LCER Excess Return Index | | | | |
| | |
| | Long Futures Contracts | | |
| | |
| | Live Cattle | | 100.00% |
| | |
| | |
| Merrill Lynch Soybean Meal Index | | | | |
| | |
| | Long Futures Contracts | | |
| | |
| | Soybean Meal | | 100.00% |
| | |
| | |
| MLCX Dynamic Enhanced Copper Excess Return Index | | | | |
| | |
| | Long Futures Contracts | | |
| | |
| | Copper | | 100.00% |
| | |
| | |
| MLCX Natural Gas Annual Excess Return Index | | | | |
| | |
| | Long Futures Contracts | | |
| | |
| | Natural Gas | | 100.00% |
| | |
| | |
| MLCX1XBE Excess Return Index | | | | |
| | |
| | Long Futures Contracts | | |
| | |
| | Gasoline Unleaded | | 100.00% |
| | |
| | |
| Morgan Stanley MSCY2XB0 Index | | | | |
| | |
| | Long Futures Contracts | | |
| | |
| | Gasoline RBOB | | 100.00% |
| | |
| | |
| MS Soybean Oil Dynamic Roll Index | | | | |
| | |
| | Long Futures Contracts | | |
| | |
| | Soybean Oil | | 100.00% |
| | |
| | |
| RBC Enhanced Brent Crude Oil 01 Excess Return Index | | | | |
| | |
| | Long Futures Contracts | | |
| | |
| | Brent Crude | | 100.00% |
| | |
| | |
| BNP Paribas Commodity Daily Dynamic Curve CO Index | | | | |
| | |
| | Long Futures Contracts | | |
| | |
| | Brent Crude | | 100.00% |
| | |
| | |
| Canadian Imperial Bank of Commerce Dynamic Roll LME Copper Excess Return Index 2 | | | | |
| | |
| | Long Futures Contracts | | |
| | |
| | Copper | | 100.00% |
| | |
| | |
| Cargill Single Commodity Index | | | | |
| | |
| | Long Futures Contracts | | |
| | |
| | Sugar | | 100.00% |
| | |
| | |
| Enhanced Strategy AB31 on the S&P GSCI Cotton Excess Return Index | | | | |
| | |
| | Long Futures Contracts | | |
| | |
| | Cotton | | 100.00% |
| | |
See accompanying Notes to Consolidated Financial Statements which are an integral part of the financial statements.
| | |
| 12 | | Invesco Balanced-Risk Commodity Strategy Fund |
| | | | |
| Reference Entity Components–(continued) |
| Reference Entity | | Underlying Components | | Percentage |
| | |
| Macquarie Single Commodity Silver type A Excess Return Index | | | | |
| | |
| | Long Futures Contracts | | |
| | |
| | Silver | | 100.00% |
| | |
| | |
| Morgan Stanley MSCY2KW0 Index | | | | |
| | |
| | Long Futures Contracts | | |
| | |
| | Kansas Wheat | | 100.00% |
| | |
| | |
| UBS Modified Roll Select Heating Oil Strategy | | | | |
| | |
| | Long Futures Contracts | | |
| | |
| | Heating Oil | | 100.00% |
| | |
See accompanying Notes to Consolidated Financial Statements which are an integral part of the financial statements.
| | |
| 13 | | Invesco Balanced-Risk Commodity Strategy Fund |
Consolidated Statement of Assets and Liabilities
October 31, 2022
| | | | |
Assets: | | | | |
Investments in unaffiliated securities, at value
(Cost $436,572,491) | | $ | 437,647,442 | |
Investments in affiliated money market funds, at value
(Cost $668,001,883) | | | 668,047,451 | |
Other investments: | | | | |
Variation margin receivable – futures contracts | | | 6,601,242 | |
Swaps receivable – OTC | | | 11,500,303 | |
Unrealized appreciation on swap agreements – OTC | | | 12,599,419 | |
Deposits with brokers: | | | | |
Cash collateral – exchange-traded futures contracts | | | 51,865,000 | |
Cash collateral – OTC Derivatives | | | 7,070,000 | |
Cash | | | 31,560,382 | |
Receivable for: | | | | |
Fund shares sold | | | 953,992 | |
Dividends | | | 1,737,531 | |
Interest | | | 638,982 | |
Investment for trustee deferred compensation and retirement plans | | | 56,713 | |
Other assets | | | 49,579 | |
Total assets | | | 1,230,328,036 | |
| |
Liabilities: | | | | |
Other investments: | | | | |
Swaps payable – OTC | | | 5,380,312 | |
Unrealized depreciation on swap agreements – OTC | | | 9,322,322 | |
Payable for: | | | | |
Investments purchased | | | 33,500,000 | |
Fund shares reacquired | | | 1,950,444 | |
Accrued fees to affiliates | | | 678,813 | |
Accrued trustees’ and officers’ fees and benefits | | | 1,187 | |
Accrued other operating expenses | | | 308,474 | |
Trustee deferred compensation and retirement plans | | | 104,857 | |
Total liabilities | | | 51,246,409 | |
Net assets applicable to shares outstanding | | $ | 1,179,081,627 | |
| | | | |
Net assets consist of: | | | | |
Shares of beneficial interest | | $ | 1,093,434,744 | |
Distributable earnings | | | 85,646,883 | |
| | | $ | 1,179,081,627 | |
| |
Net Assets: | | | | |
Class A | | $ | 86,967,987 | |
Class C | | $ | 26,354,554 | |
Class R | | $ | 11,778,994 | |
Class Y | | $ | 515,659,498 | |
Class R5 | | $ | 154,844,844 | |
Class R6 | | $ | 383,475,750 | |
|
Shares outstanding, no par value, with an unlimited number of shares authorized: | |
Class A | | | 11,952,776 | |
Class C | | | 3,962,225 | |
Class R | | | 1,660,318 | |
Class Y | | | 68,735,734 | |
Class R5 | | | 20,534,664 | |
Class R6 | | | 50,726,170 | |
Class A: | | | | |
Net asset value per share | | $ | 7.28 | |
Maximum offering price per share
(Net asset value of $7.28 ÷ 94.50%) | | $ | 7.70 | |
Class C: | | | | |
Net asset value and offering price per share | | $ | 6.65 | |
Class R: | | | | |
Net asset value and offering price per share | | $ | 7.09 | |
Class Y: | | | | |
Net asset value and offering price per share | | $ | 7.50 | |
Class R5: | | | | |
Net asset value and offering price per share | | $ | 7.54 | |
Class R6: | | | | |
Net asset value and offering price per share | | $ | 7.56 | |
See accompanying Notes to Consolidated Financial Statements which are an integral part of the financial statements.
| | |
| 14 | | Invesco Balanced-Risk Commodity Strategy Fund |
Consolidated Statement of Operations
For the year ended October 31, 2022
| | | | |
Investment income: | | | | |
Interest | | $ | 5,450,342 | |
Dividends from affiliated money market funds | | | 6,911,411 | |
Total investment income | | | 12,361,753 | |
| |
Expenses: | | | | |
Advisory fees | | | 13,801,331 | |
Administrative services fees | | | 214,876 | |
Custodian fees | | | 114,811 | |
Distribution fees: | | | | |
Class A | | | 183,440 | |
Class C | | | 237,166 | |
Class R | | | 37,521 | |
Transfer agent fees – A, C, R and Y | | | 1,916,848 | |
Transfer agent fees – R5 | | | 168,781 | |
Transfer agent fees – R6 | | | 131,234 | |
Trustees’ and officers’ fees and benefits | | | 32,383 | |
Registration and filing fees | | | 176,679 | |
Reports to shareholders | | | 233,605 | |
Professional services fees | | | 88,158 | |
Other | | | (6,648 | ) |
Total expenses | | | 17,330,185 | |
Less: Fees waived, expenses reimbursed and/or expense offset arrangement(s) | | | (2,370,138 | ) |
Net expenses | | | 14,960,047 | |
Net investment income (loss) | | | (2,598,294 | ) |
| |
Realized and unrealized gain (loss) from: | | | | |
Net realized gain (loss) from: | | | | |
Unaffiliated investment securities | | | 30,757,584 | |
Affiliated investment securities | | | (75,585 | ) |
Futures contracts | | | 70,015,050 | |
Swap agreements | | | 52,260,726 | |
| | | | 152,957,775 | |
Change in net unrealized appreciation (depreciation) of: | | | | |
Unaffiliated investment securities | | | (33,380,764 | ) |
Affiliated investment securities | | | 60,468 | |
Futures contracts | | | (37,927,439 | ) |
Swap agreements | | | 8,734,618 | |
| | | | (62,513,117 | ) |
Net realized and unrealized gain | | | 90,444,658 | |
Net increase in net assets resulting from operations | | $ | 87,846,364 | |
See accompanying Notes to Consolidated Financial Statements which are an integral part of the financial statements.
| | |
| 15 | | Invesco Balanced-Risk Commodity Strategy Fund |
Consolidated Statement of Changes in Net Assets
For the years ended October 31, 2022 and 2021
| | | | | | | | |
| | | 2022 | | | 2021 | |
Operations: | | | | | | | | |
Net investment income (loss) | | $ | (2,598,294 | ) | | $ | (11,587,526 | ) |
Net realized gain | | | 152,957,775 | | | | 222,479,514 | |
Change in net unrealized appreciation (depreciation) | | | (62,513,117 | ) | | | 62,178,589 | |
Net increase in net assets resulting from operations | | | 87,846,364 | | | | 273,070,577 | |
| | |
Distributions to shareholders from distributable earnings: | | | | | | | | |
Class A | | | (6,880,799 | ) | | | – | |
Class C | | | (2,650,024 | ) | | | – | |
Class R | | | (435,805 | ) | | | – | |
Class Y | | | (128,443,740 | ) | | | – | |
Class R5 | | | (22,431,534 | ) | | | – | |
Class R6 | | | (53,113,623 | ) | | | – | |
Total distributions from distributable earnings | | | (213,955,525 | ) | | | – | |
| | |
Share transactions–net: | | | | | | | | |
Class A | | | 49,014,032 | | | | 20,958,217 | |
Class C | | | 11,850,576 | | | | 10,493,372 | |
Class R | | | 9,747,043 | | | | 748,742 | |
Class Y | | | (319,309,638 | ) | | | 439,936,930 | |
Class R5 | | | 9,937,358 | | | | (43,724,049 | ) |
Class R6 | | | (48,603,744 | ) | | | 286,291,421 | |
Net increase (decrease) in net assets resulting from share transactions | | | (287,364,373 | ) | | | 714,704,633 | |
Net increase (decrease) in net assets | | | (413,473,534 | ) | | | 987,775,210 | |
| | |
Net assets: | | | | | | | | |
Beginning of year | | | 1,592,555,161 | | | | 604,779,951 | |
End of year | | $ | 1,179,081,627 | | | $ | 1,592,555,161 | |
See accompanying Notes to Consolidated Financial Statements which are an integral part of the financial statements.
| | |
| 16 | | Invesco Balanced-Risk Commodity Strategy Fund |
Consolidated Financial Highlights
The following schedule presents financial highlights for a share of the Fund outstanding throughout the periods indicated.
| | | | | | | | | | | | | | | | | | | | | | | | | | | | | | | | | | | | | | | | | | | | | | | | | | | | | | | | | | | | | | | | | | | | | | |
| | | Net asset
value,
beginning
of period | | Net
investment
income
(loss)(a) | | Net gains
(losses)
on securities
(both
realized and
unrealized) | | Total from
investment
operations | | Dividends
from net
investment
income | | Distributions
from net
realized
gains | | Total
distributions | | Net asset
value, end
of period | | Total
return (b) | | Net assets,
end of period
(000’s omitted) | | Ratio of
expenses
to average
net assets
with fee waivers
and/or
expenses
absorbed | | Ratio of
expenses
to average net assets without
fee waivers
and/or
expenses
absorbed | | Ratio of net
investment
income
(loss)
to average
net assets | | Portfolio
turnover (c) |
Class A | | | | | | | | | | | | | | | | | | | | | | | | | | | | | | | | | | | | | | | | | | | | | | | | | | | | | | | | | | | | | | | | | | | | | | |
Year ended 10/31/22 | | | $ | 8.01 | | | | $ | (0.03 | ) | | | $ | 0.47 | | | | $ | 0.44 | | | | $ | (1.17 | ) | | | | $ – | | | | $ | (1.17 | ) | | | $ | 7.28 | | | | | 6.63 | % | | | $ | 86,968 | | | | | 1.31 | % | | | | 1.56 | % | | | | (0.41 | )% | | | | 106 | % |
Year ended 10/31/21 | | | | 5.81 | | | | | (0.10 | ) | | | | 2.30 | | | | | 2.20 | | | | | – | | | | | – | | | | | – | | | | | 8.01 | | | | | 37.87 | | | | | 45,976 | | | | | 1.33 | | | | | 1.67 | | | | | (1.29 | ) | | | | 14 | |
Year ended 10/31/20 | | | | 6.22 | | | | | (0.03 | ) | | | | (0.32 | ) | | | | (0.35 | ) | | | | (0.06 | ) | | | | – | | | | | (0.06 | ) | | | | 5.81 | | | | | (5.75 | ) | | | | 17,291 | | | | | 1.31 | | | | | 1.73 | | | | | (0.51 | ) | | | | 186 | |
Year ended 10/31/19 | | | | 6.50 | | | | | 0.05 | | | | | (0.32 | ) | | | | (0.27 | ) | | | | (0.01 | ) | | | | (0.00 | ) | | | | (0.01 | ) | | | | 6.22 | | | | | (4.15 | ) | | | | 24,633 | | | | | 1.31 | (d) | | | | 1.58 | (d) | | | | 0.79 | (d) | | | | 9 | |
Year ended 10/31/18 | | | | 6.70 | | | | | 0.01 | | | | | (0.21 | ) | | | | (0.20 | ) | | | | – | | | | | – | | | | | – | | | | | 6.50 | | | | | (2.98 | ) | | | | 34,543 | | | | | 1.42 | | | | | 1.51 | | | | | 0.14 | | | | | 96 | |
Class C | | | | | | | | | | | | | | | | | | | | | | | | | | | | | | | | | | | | | | | | | | | | | | | | | | | | | | | | | | | | | | | | | | | | | | |
Year ended 10/31/22 | | | | 7.44 | | | | | (0.08 | ) | | | | 0.42 | | | | | 0.34 | | | | | (1.13 | ) | | | | – | | | | | (1.13 | ) | | | | 6.65 | | | | | 5.69 | | | | | 26,355 | | | | | 2.06 | | | | | 2.31 | | | | | (1.16 | ) | | | | 106 | |
Year ended 10/31/21 | | | | 5.43 | | | | | (0.14 | ) | | | | 2.15 | | | | | 2.01 | | | | | – | | | | | – | | | | | – | | | | | 7.44 | | | | | 37.02 | | | | | 17,125 | | | | | 2.08 | | | | | 2.42 | | | | | (2.04 | ) | | | | 14 | |
Year ended 10/31/20 | | | | 5.87 | | | | | (0.07 | ) | | | | (0.32 | ) | | | | (0.39 | ) | | | | (0.05 | ) | | | | – | | | | | (0.05 | ) | | | | 5.43 | | | | | (6.63 | ) | | | | 4,393 | | | | | 2.06 | | | | | 2.48 | | | | | (1.26 | ) | | | | 186 | |
Year ended 10/31/19 | | | | 6.16 | | | | | 0.00 | | | | | (0.29 | ) | | | | (0.29 | ) | | | | – | | | | | (0.00 | ) | | | | (0.00 | ) | | | | 5.87 | | | | | (4.66 | ) | | | | 6,083 | | | | | 2.06 | (d) | | | | 2.33 | (d) | | | | 0.04 | (d) | | | | 9 | |
Year ended 10/31/18 | | | | 6.40 | | | | | (0.04 | ) | | | | (0.20 | ) | | | | (0.24 | ) | | | | – | | | | | – | | | | | – | | | | | 6.16 | | | | | (3.75 | ) | | | | 9,555 | | | | | 2.17 | | | | | 2.26 | | | | | (0.61 | ) | | | | 96 | |
Class R | | | | | | | | | | | | | | | | | | | | | | | | | | | | | | | | | | | | | | | | | | | | | | | | | | | | | | | | | | | | | | | | | | | | | | |
Year ended 10/31/22 | | | | 7.85 | | | | | (0.05 | ) | | | | 0.45 | | | | | 0.40 | | | | | (1.16 | ) | | | | – | | | | | (1.16 | ) | | | | 7.09 | | | | | 6.17 | | | | | 11,779 | | | | | 1.56 | | | | | 1.81 | | | | | (0.66 | ) | | | | 106 | |
Year ended 10/31/21 | | | | 5.70 | | | | | (0.11 | ) | | | | 2.26 | | | | | 2.15 | | | | | – | | | | | – | | | | | – | | | | | 7.85 | | | | | 37.72 | | | | | 2,932 | | | | | 1.58 | | | | | 1.92 | | | | | (1.54 | ) | | | | 14 | |
Year ended 10/31/20 | | | | 6.12 | | | | | (0.04 | ) | | | | (0.33 | ) | | | | (0.37 | ) | | | | (0.05 | ) | | | | – | | | | | (0.05 | ) | | | | 5.70 | | | | | (6.03 | ) | | | | 1,603 | | | | | 1.56 | | | | | 1.98 | | | | | (0.76 | ) | | | | 186 | |
Year ended 10/31/19 | | | | 6.40 | | | | | 0.03 | | | | | (0.30 | ) | | | | (0.27 | ) | | | | (0.01 | ) | | | | (0.00 | ) | | | | (0.01 | ) | | | | 6.12 | | | | | (4.25 | ) | | | | 1,404 | | | | | 1.56 | (d) | | | | 1.83 | (d) | | | | 0.54 | (d) | | | | 9 | |
Year ended 10/31/18 | | | | 6.62 | | | | | (0.01 | ) | | | | (0.21 | ) | | | | (0.22 | ) | | | | – | | | | | – | | | | | – | | | | | 6.40 | | | | | (3.32 | ) | | | | 1,622 | | | | | 1.67 | | | | | 1.76 | | | | | (0.11 | ) | | | | 96 | |
Class Y | | | | | | | | | | | | | | | | | | | | | | | | | | | | | | | | | | | | | | | | | | | | | | | | | | | | | | | | | | | | | | | | | | | | | | |
Year ended 10/31/22 | | | | 8.22 | | | | | (0.01 | ) | | | | 0.47 | | | | | 0.46 | | | | | (1.18 | ) | | | | – | | | | | (1.18 | ) | | | | 7.50 | | | | | 6.80 | | | | | 515,659 | | | | | 1.06 | | | | | 1.31 | | | | | (0.16 | ) | | | | 106 | |
Year ended 10/31/21 | | | | 5.94 | | | | | (0.08 | ) | | | | 2.36 | | | | | 2.28 | | | | | – | | | | | – | | | | | – | | | | | 8.22 | | | | | 38.38 | | | | | 896,762 | | | | | 1.08 | | | | | 1.42 | | | | | (1.04 | ) | | | | 14 | |
Year ended 10/31/20 | | | | 6.36 | | | | | (0.01 | ) | | | | (0.35 | ) | | | | (0.36 | ) | | | | (0.06 | ) | | | | – | | | | | (0.06 | ) | | | | 5.94 | | | | | (5.74 | ) | | | | 316,851 | | | | | 1.06 | | | | | 1.48 | | | | | (0.26 | ) | | | | 186 | |
Year ended 10/31/19 | | | | 6.63 | | | | | 0.07 | | | | | (0.33 | ) | | | | (0.26 | ) | | | | (0.01 | ) | | | | (0.00 | ) | | | | (0.01 | ) | | | | 6.36 | | | | | (3.84 | ) | | | | 726,446 | | | | | 1.06 | (d) | | | | 1.33 | (d) | | | | 1.04 | (d) | | | | 9 | |
Year ended 10/31/18 | | | | 6.82 | | | | | 0.03 | | | | | (0.22 | ) | | | | (0.19 | ) | | | | (0.00 | ) | | | | – | | | | | (0.00 | ) | | | | 6.63 | | | | | (2.77 | ) | | | | 1,327,952 | | | | | 1.17 | | | | | 1.26 | | | | | 0.39 | | | | | 96 | |
Class R5 | | | | | | | | | | | | | | | | | | | | | | | | | | | | | | | | | | | | | | | | | | | | | | | | | | | | | | | | | | | | | | | | | | | | | | |
Year ended 10/31/22 | | | | 8.26 | | | | | (0.01 | ) | | | | 0.47 | | | | | 0.46 | | | | | (1.18 | ) | | | | – | | | | | (1.18 | ) | | | | 7.54 | | | | | 6.76 | | | | | 154,845 | | | | | 1.06 | | | | | 1.17 | | | | | (0.16 | ) | | | | 106 | |
Year ended 10/31/21 | | | | 5.97 | | | | | (0.08 | ) | | | | 2.37 | | | | | 2.29 | | | | | – | | | | | – | | | | | – | | | | | 8.26 | | | | | 38.36 | | | | | 156,985 | | | | | 1.08 | | | | | 1.17 | | | | | (1.04 | ) | | | | 14 | |
Year ended 10/31/20 | | | | 6.38 | | | | | (0.02 | ) | | | | (0.33 | ) | | | | (0.35 | ) | | | | (0.06 | ) | | | | – | | | | | (0.06 | ) | | | | 5.97 | | | | | (5.57 | ) | | | | 148,151 | | | | | 1.06 | | | | | 1.28 | | | | | (0.26 | ) | | | | 186 | |
Year ended 10/31/19 | | | | 6.65 | | | | | 0.07 | | | | | (0.32 | ) | | | | (0.25 | ) | | | | (0.02 | ) | | | | (0.00 | ) | | | | (0.02 | ) | | | | 6.38 | | | | | (3.79 | ) | | | | 140,393 | | | | | 1.06 | (d) | | | | 1.17 | (d) | | | | 1.04 | (d) | | | | 9 | |
Year ended 10/31/18 | | | | 6.84 | | | | | 0.03 | | | | | (0.22 | ) | | | | (0.19 | ) | | | | (0.00 | ) | | | | – | | | | | (0.00 | ) | | | | 6.65 | | | | | (2.74 | ) | | | | 167,687 | | | | | 1.11 | | | | | 1.19 | | | | | 0.45 | | | | | 96 | |
Class R6 | | | | | | | | | | | | | | | | | | | | | | | | | | | | | | | | | | | | | | | | | | | | | | | | | | | | | | | | | | | | | | | | | | | | | | |
Year ended 10/31/22 | | | | 8.28 | | | | | (0.01 | ) | | | | 0.47 | | | | | 0.46 | | | | | (1.18 | ) | | | | – | | | | | (1.18 | ) | | | | 7.56 | | | | | 6.77 | | | | | 383,476 | | | | | 1.04 | | | | | 1.10 | | | | | (0.14 | ) | | | | 106 | |
Year ended 10/31/21 | | | | 5.98 | | | | | (0.08 | ) | | | | 2.38 | | | | | 2.30 | | | | | – | | | | | – | | | | | – | | | | | 8.28 | | | | | 38.46 | | | | | 472,776 | | | | | 1.04 | | | | | 1.08 | | | | | (1.00 | ) | | | | 14 | |
Year ended 10/31/20 | | | | 6.40 | | | | | (0.02 | ) | | | | (0.34 | ) | | | | (0.36 | ) | | | | (0.06 | ) | | | | – | | | | | (0.06 | ) | | | | 5.98 | | | | | (5.71 | ) | | | | 116,491 | | | | | 1.06 | | | | | 1.19 | | | | | (0.26 | ) | | | | 186 | |
Year ended 10/31/19 | | | | 6.67 | | | | | 0.07 | | | | | (0.32 | ) | | | | (0.25 | ) | | | | (0.02 | ) | | | | (0.00 | ) | | | | (0.02 | ) | | | | 6.40 | | | | | (3.72 | ) | | | | 119,820 | | | | | 1.01 | (d) | | | | 1.08 | (d) | | | | 1.09 | (d) | | | | 9 | |
Year ended 10/31/18 | | | | 6.86 | | | | | 0.04 | | | | | (0.23 | ) | | | | (0.19 | ) | | | | (0.00 | ) | | | | – | | | | | (0.00 | ) | | | | 6.67 | | | | | (2.72 | ) | | | | 19,244 | | | | | 1.01 | | | | | 1.09 | | | | | 0.55 | | | | | 96 | |
| (a) | Calculated using average shares outstanding. |
| (b) | Includes adjustments in accordance with accounting principles generally accepted in the United States of America and as such, the net asset value for financial reporting purposes and the returns based upon those net asset values may differ from the net asset value and returns for shareholder transactions. Does not include sales charges and is not annualized for periods less than one year, if applicable. |
| (c) | Portfolio turnover is calculated at the fund level and is not annualized for periods less than one year, if applicable. |
| (d) | In addition to the fees and expenses which the Fund bears directly, the Fund indirectly bears a pro rata share of the fees and expenses of the underlying funds in which the Fund invests. Because the underlying funds have varied expenses and fee levels and the Fund may own different proportions at different times, the amount of fees and expenses incurred indirectly by the Fund will vary. Estimated underlying fund expenses are not expenses that are incurred directly by the Fund. They are expenses that are incurred directly by the underlying funds and are deducted from the value of the funds the Fund invests in. The effect of the estimated underlying fund expenses that the Fund bears indirectly is included in the Fund’s total return. Estimated acquired fund fees from underlying funds were 0.11%. |
See accompanying Notes to Consolidated Financial Statements which are an integral part of the financial statements.
| | |
| 17 | | Invesco Balanced-Risk Commodity Strategy Fund |
Notes to Consolidated Financial Statements
October 31, 2022
NOTE 1–Significant Accounting Policies
Invesco Balanced-Risk Commodity Strategy Fund (the “Fund”) is a series portfolio of AIM Investment Funds (Invesco Investment Funds) (the “Trust”). The Trust is organized as a Delaware statutory trust and is registered under the Investment Company Act of 1940, as amended (the “1940 Act”), as an open-end series management investment company authorized to issue an unlimited number of shares of beneficial interest. Information presented in these consolidated financial statements pertains only to the Fund and the Invesco Cayman Commodity Fund III Ltd. (the “Subsidiary”), a wholly-owned subsidiary of the Fund organized under the laws of the Cayman Islands. Matters affecting the Fund or each class will be voted on exclusively by the shareholders of the Fund or each class.
The Fund will seek to gain exposure to the commodity markets primarily through investments in the Subsidiary. The Subsidiary was organized by the Fund to invest in commodity-linked derivatives and other securities that may provide leveraged and non-leveraged exposure to commodities. The Fund may invest up to 25% of its total assets in the Subsidiary.
The Fund’s investment objective is to provide total return.
The Fund currently consists of six different classes of shares: Class A, Class C, Class R, Class Y, Class R5 and Class R6. Class Y shares are available only to certain investors. Class A shares are sold with a front-end sales charge unless certain waiver criteria are met. Under certain circumstances, load waived shares may be subject to contingent deferred sales charges (“CDSC”). Class C shares are sold with a CDSC. Class R, Class Y, Class R5 and Class R6 shares are sold at net asset value. Class C shares held for eight years after purchase are eligible for automatic conversion into Class A shares of the same Fund (the “Conversion Feature”). The automatic conversion pursuant to the Conversion Feature will generally occur at the end of the month following the eighth anniversary after a purchase of Class C shares.
The Fund is an investment company and accordingly follows the investment company accounting and reporting guidance in accordance with Financial Accounting Standards Board Accounting Standards Codification Topic 946, Financial Services – Investment Companies.
The following is a summary of the significant accounting policies followed by the Fund in the preparation of its consolidated financial statements.
| A. | Security Valuations – Securities, including restricted securities, are valued according to the following policy. |
Fixed income securities (including convertible debt securities) generally are valued on the basis of prices provided by independent pricing services. Prices provided by the pricing service may be determined without exclusive reliance on quoted prices, and may reflect appropriate factors such as institution-size trading in similar groups of securities, developments related to specific securities, dividend rate (for unlisted equities), yield (for debt obligations), quality, type of issue, coupon rate (for debt obligations), maturity (for debt obligations), individual trading characteristics and other market data. Pricing services generally value debt obligations assuming orderly transactions of institutional round lot size, but a fund may hold or transact in the same securities in smaller, odd lot sizes. Odd lots often trade at lower prices than institutional round lots, and their value may be adjusted accordingly. Debt obligations are subject to interest rate and credit risks. In addition, all debt obligations involve some risk of default with respect to interest and/or principal payments.
A security listed or traded on an exchange is generally valued at its trade price or official closing price that day as of the close of the exchange where the security is principally traded, or lacking any trades or official closing price on a particular day, the security may be valued at the closing bid price on that day.
Securities traded in the over-the-counter market are valued based on prices furnished by independent pricing services or market makers. When such securities are valued using prices provided by an independent pricing service they may be considered fair valued. Futures contracts are valued at the daily settlement price set by an exchange on which they are principally traded. U.S. exchange-traded options are valued at the mean between the last bid and asked prices from the exchange on which they are principally traded. Non-U.S. exchange-traded options are valued at the final settlement price set by the exchange on which they trade. Options not listed on an exchange and swaps generally are valued using pricing provided from independent pricing services.
Securities of investment companies that are not exchange-traded (e.g., open-end mutual funds) are valued using such company’s end-of-business-day net asset value per share.
Deposits, other obligations of U.S. and non-U.S. banks and financial institutions are valued at their daily account value.
Swap agreements are fair valued using an evaluated quote, if available, provided by an independent pricing service. Evaluated quotes provided by the pricing service are valued based on a model which may include end-of-day net present values, spreads, ratings, industry, company performance and returns of referenced assets. Centrally cleared swap agreements are valued at the daily settlement price determined by the relevant exchange or clearinghouse.
Foreign securities’ (including foreign exchange contracts) prices are converted into U.S. dollar amounts using the applicable exchange rates as of the close of the New York Stock Exchange (“NYSE”). If market quotations are available and reliable for foreign exchange-traded equity securities, the securities will be valued at the market quotations. Invesco Advisers, Inc. (the “Adviser” or “Invesco”) may use various pricing services to obtain market quotations as well as fair value prices. Because trading hours for certain foreign securities end before the close of the NYSE, closing market quotations may become not representative of market value in the Adviser’s judgment (“unreliable”). If between the time trading ends on a particular security and the close of the customary trading session on the NYSE, a significant event occurs that makes the closing price of the security unreliable, the Adviser may fair value the security. If the event is likely to have affected the closing price of the security, the security will be valued at fair value in good faith in accordance with Board-approved policies and related Adviser procedures (“Valuation Procedures”). Adjustments to closing prices to reflect fair value may also be based on a screening process of an independent pricing service to indicate the degree of certainty, based on historical data, that the closing price in the principal market where a foreign security trades is not the current value as of the close of the NYSE. Foreign securities’ prices meeting the degree of certainty that the price is not reflective of current value will be priced at the indication of fair value from the independent pricing service. Multiple factors may be considered by the independent pricing service in determining adjustments to reflect fair value and may include information relating to sector indices, American Depositary Receipts and domestic and foreign index futures. Foreign securities may have additional risks including exchange rate changes, potential for sharply devalued currencies and high inflation, political and economic upheaval, the relative lack of issuer information, relatively low market liquidity and the potential lack of strict financial and accounting controls and standards.
Unlisted securities will be valued using prices provided by independent pricing services or by another method that the Adviser, in its judgment, believes better reflects the security’s fair value in accordance with the Valuation Procedures.
Securities for which market prices are not provided by any of the above methods may be valued based upon quotes furnished by independent sources. The last bid price may be used to value equity securities. The mean between the last bid and asked prices may be used to value debt obligations, including corporate loans.
Securities for which market quotations are not readily available are fair valued by the Adviser in accordance with the Valuation Procedures. If a fair value price provided by a pricing service is unreliable, the Adviser will fair value the security using the Valuation Procedures. Issuer specific events, market trends, bid/asked quotes of brokers and information providers and other market data may be reviewed in the course of making a good faith determination of a security’s fair value.
The Fund may invest in securities that are subject to interest rate risk, meaning the risk that the prices will generally fall as interest rates rise and, conversely, the prices will generally rise as interest rates fall. Specific securities differ in their sensitivity to changes in interest rates depending on their individual characteristics. Changes in interest rates may result in increased market volatility, which may affect the value and/or liquidity of certain Fund investments.
Valuations change in response to many factors including the historical and prospective earnings of the issuer, the value of the issuer’s assets, general market conditions which are not specifically related to the particular issuer, such as real or perceived adverse economic conditions, changes in the general outlook for revenues or corporate earnings, changes in interest or currency rates, regional or global instability, natural or environmental disasters, widespread disease or other public health issues, war, acts of terrorism, significant governmental actions or adverse investor sentiment generally and market liquidity. Because of the
| | |
| 18 | | Invesco Balanced-Risk Commodity Strategy Fund |
inherent uncertainties of valuation, the values reflected in the consolidated financial statements may materially differ from the value received upon actual sale of those investments.
The price the Fund could receive upon the sale of any investment may differ from the Adviser’s valuation of the investment, particularly for securities that are valued using a fair valuation technique. When fair valuation techniques are applied, the Adviser uses available information, including both observable and unobservable inputs and assumptions, to determine a methodology that will result in a valuation that the Adviser believes approximates market value. Fund securities that are fair valued may be subject to greater fluctuation in their value from one day to the next than would be the case if market quotations were used. Because of the inherent uncertainties of valuation, and the degree of subjectivity in such decisions, the Fund could realize a greater or lesser than expected gain or loss upon the sale of the investment.
| B. | Securities Transactions and Investment Income – Securities transactions are accounted for on a trade date basis. Realized gains or losses on sales are computed on the basis of specific identification of the securities sold. Interest income (net of withholding tax, if any) is recorded on an accrual basis from settlement date and includes coupon interest and amortization of premium and accretion of discount on debt securities as applicable. Pay-in-kind interest income and non-cash dividend income received in the form of securities in-lieu of cash are recorded at the fair value of the securities received. Dividend income (net of withholding tax, if any) is recorded on the ex-dividend date. |
The Fund may periodically participate in litigation related to Fund investments. As such, the Fund may receive proceeds from litigation settlements. Any proceeds received are included in the Consolidated Statement of Operations as realized gain (loss) for investments no longer held and as unrealized gain (loss) for investments still held.
Brokerage commissions and mark ups are considered transaction costs and are recorded as an increase to the cost basis of securities purchased and/or a reduction of proceeds on a sale of securities. Such transaction costs are included in the determination of net realized and unrealized gain (loss) from investment securities reported in the Consolidated Statement of Operations and the Consolidated Statement of Changes in Net Assets and the net realized and unrealized gains (losses) on securities per share in the Consolidated Financial Highlights. Transaction costs are included in the calculation of the Fund’s net asset value and, accordingly, they reduce the Fund’s total returns. These transaction costs are not considered operating expenses and are not reflected in net investment income reported in the Consolidated Statement of Operations and the Consolidated Statement of Changes in Net Assets, or the net investment income per share and the ratios of expenses and net investment income reported in the Consolidated Financial Highlights, nor are they limited by any expense limitation arrangements between the Fund and the investment adviser.
The Fund allocates income and realized and unrealized capital gains and losses to a class based on the relative net assets of each class.
| C. | Country Determination – For the purposes of making investment selection decisions and presentation in the Consolidated Schedule of Investments, the investment adviser may determine the country in which an issuer is located and/or credit risk exposure based on various factors. These factors include the laws of the country under which the issuer is organized, where the issuer maintains a principal office, the country in which the issuer derives 50% or more of its total revenues, the country that has the primary market for the issuer’s securities and its “country of risk” as determined by a third party service provider, as well as other criteria. Among the other criteria that may be evaluated for making this determination are the country in which the issuer maintains 50% or more of its assets, the type of security, financial guarantees and enhancements, the nature of the collateral and the sponsor organization. Country of issuer and/or credit risk exposure has been determined to be the United States of America, unless otherwise noted. |
| D. | Distributions – Distributions from net investment income and net realized capital gain, if any, are generally declared and paid annually and recorded on the ex-dividend date. The Fund may elect to treat a portion of the proceeds from redemptions as distributions for federal income tax purposes. |
| E. | Federal Income Taxes – The Fund intends to comply with the requirements of Subchapter M of the Internal Revenue Code of 1986, as amended (the “Internal Revenue Code”), necessary to qualify as a regulated investment company and to distribute substantially all of the Fund’s taxable earnings to shareholders. As such, the Fund will not be subject to federal income taxes on otherwise taxable income (including net realized capital gain) that is distributed to shareholders. Therefore, no provision for federal income taxes is recorded in the consolidated financial statements. |
The Fund recognizes the tax benefits of uncertain tax positions only when the position is more likely than not to be sustained. Management has analyzed the Fund’s uncertain tax positions and concluded that no liability for unrecognized tax benefits should be recorded related to uncertain tax positions. Management is not aware of any tax positions for which it is reasonably possible that the total amounts of unrecognized tax benefits will change materially in the next 12 months.
The Subsidiary is classified as a controlled foreign corporation under Subchapter N of the Internal Revenue Code. Therefore, the Fund is required to increase its taxable income by its share of the Subsidiary’s income. Net investment losses of the Subsidiary cannot be deducted by the Fund in the current period nor carried forward to offset taxable income in future periods.
The Fund files tax returns in the U.S. Federal jurisdiction and certain other jurisdictions. Generally the Fund is subject to examinations by such taxing authorities for up to three years after the filing of the return for the tax period.
| F. | Expenses – Fees provided for under the Rule 12b-1 plan of a particular class of the Fund are charged to the operations of such class. Transfer agency fees and expenses and other shareholder recordkeeping fees and expenses attributable to Class R5 and Class R6 are allocated based on relative net assets of Class R5 and Class R6. Sub-accounting fees attributable to Class R5 are charged to the operations of the class. Transfer agency fees and expenses and other shareholder recordkeeping fees and expenses relating to all other classes are allocated among those classes based on relative net assets. All other expenses are allocated among the classes based on relative net assets. |
| G. | Accounting Estimates – The financial statements are prepared on a consolidated basis in conformity with accounting principles generally accepted in the United States of America (“GAAP”), which requires management to make estimates and assumptions that affect the reported amounts of assets and liabilities at the date of the financial statements and the reported amounts of revenues and expenses during the reporting period including estimates and assumptions related to taxation. Actual results could differ from those estimates by a significant amount. The accompanying financial statements reflect the financial position of the Fund and its Subsidiary and the results of operations on a consolidated basis. All inter-company accounts and transactions have been eliminated in consolidation. |
In addition, the Fund monitors for material events or transactions that may occur or become known after the period-end date and before the date the consolidated financial statements are released to print.
| H. | Indemnifications – Under the Trust’s organizational documents, each Trustee, officer, employee or other agent of the Trust, and under the Subsidiary’s organizational documents, the directors and officers of the Subsidiary, are indemnified against certain liabilities that may arise out of the performance of their duties to the Fund and/or the Subsidiary, respectively. Additionally, in the normal course of business, the Fund enters into contracts, including the Fund’s servicing agreements, that contain a variety of indemnification clauses. The Fund’s maximum exposure under these arrangements is unknown as this would involve future claims that may be made against the Fund that have not yet occurred. The risk of material loss as a result of such indemnification claims is considered remote. |
| I. | Structured Securities – The Fund may invest in structured securities. Structured securities are a type of derivative security whose value is determined by reference to changes in the value of underlying securities, currencies, interest rates, commodities, indices or other financial indicators (“reference instruments”). Most structured securities are fixed-income securities that have maturities of three years or less. Structured securities may be positively or negatively indexed (i.e., their principal value or interest rates may increase or decrease if the underlying reference instrument appreciates) and may have return characteristics similar to direct investments in the underlying reference instrument. |
Structured securities may entail a greater degree of market risk than other types of debt securities because the investor bears the risk of the reference instruments. In addition to the credit risk of structured securities and the normal risks of price changes in response to changes in interest rates, the principal amount of structured notes or indexed securities may decrease as a result of changes in the value of the underlying reference instruments. Changes in the daily
| | |
| 19 | | Invesco Balanced-Risk Commodity Strategy Fund |
value of structured securities are recorded as unrealized gains (losses) in the Consolidated Statement of Operations. When the structured securities mature or are sold, the Fund recognizes a realized gain (loss) on the Consolidated Statement of Operations.
| J. | Futures Contracts – The Fund may enter into futures contracts to equitize the Fund’s cash holdings or to manage exposure to interest rate, equity and market price movements and/or currency risks. A futures contract is an agreement between two parties (“Counterparties”) to purchase or sell a specified underlying security, currency or commodity (or delivery of a cash settlement price, in the case of an index future) for a fixed price at a future date. The Fund currently invests only in exchange-traded futures and they are standardized as to maturity date and underlying financial instrument. Initial margin deposits required upon entering into futures contracts are satisfied by the segregation of specific securities or cash as collateral at the futures commission merchant (broker). During the period the futures contracts are open, changes in the value of the contracts are recognized as unrealized gains or losses by recalculating the value of the contracts on a daily basis. Subsequent or variation margin payments are received or made on non-LME futures contracts depending upon whether unrealized gains or losses are incurred. These amounts are reflected as receivables or payables on the Consolidated Statement of Assets and Liabilities. For LME contracts, subsequent or variation margin payments are not made and the value of the contracts is presented as unrealized appreciation or depreciation on the Consolidated Statement of Assets and Liabilities. When LME or non-LME contracts are closed or expire, the Fund recognizes a realized gain or loss equal to the difference between the proceeds from, or cost of, the closing transaction and the Fund’s basis in the contract. The net realized gain (loss) and the change in unrealized gain (loss) on futures contracts held during the period is included on the Consolidated Statement of Operations. For settlement of LME commodity futures contracts, cash is not transferred until the settled futures contracts expire. Net realized gains or losses on LME contracts which have been closed out but for which the contract has not yet expired are reflected as a receivable or payable on the Consolidated Statements of Assets and Liabilities. The primary risks associated with futures contracts are market risk and the absence of a liquid secondary market. If the Fund were unable to liquidate a futures contract and/or enter into an offsetting closing transaction, the Fund would continue to be subject to market risk with respect to the value of the contracts and continue to be required to maintain the margin deposits on the futures contracts. Futures contracts have minimal Counterparty risk since the exchange’s clearinghouse, as Counterparty to all exchange-traded futures, guarantees the futures against default. Risks may exceed amounts recognized in the Consolidated Statement of Assets and Liabilities. |
| K. | Swap Agreements – The Fund may enter into various swap transactions, including interest rate, total return, index, currency and credit default swap contracts (“CDS”) for investment purposes or to manage interest rate, currency, commodity or credit risk. Such transactions are agreements between Counterparties. These agreements may contain among other conditions, events of default and termination events, and various covenants and representations such as provisions that require the Fund to maintain a pre-determined level of net assets, and/or provide limits regarding the decline of the Fund’s net asset value (“NAV”) per share over specific periods of time. If the Fund were to trigger such provisions and have open derivative positions at that time, the Counterparty may be able to terminate such agreement and request immediate payment in an amount equal to the net liability positions, if any. |
Interest rate, total return, index, and currency swap agreements are two-party contracts entered into primarily to exchange the returns (or differentials in rates of returns) earned or realized on particular predetermined investments or instruments. The gross returns to be exchanged or “swapped” between the parties are calculated with respect to a notional amount, i.e., the return on or increase in value of a particular dollar amount invested at a particular interest rate or return of an underlying asset, in a particular foreign currency, or in a “basket” of securities representing a particular index. At the maturity date, a net cash flow is exchanged where the total return is equivalent to the return of the underlying reference less a financing rate, if any. As a receiver, the Fund would receive payments based on any positive total return and would owe payments in the event of a negative total return. As the payer, the Fund would owe payments on any net positive total return, and would receive payment in the event of a negative total return.
A total return swap is an agreement in which one party makes payments based on a set rate, either fixed or variable, while the other party makes payments based on the return of an underlying asset, which includes both the income generated and capital gains, if any. The unrealized appreciation (depreciation) on total return swaps includes dividends on the underlying securities and financing rate payable from the Counterparty. At the maturity date, a net cash flow is exchanged where the total return is equivalent to the return of the underlying reference less a financing rate, if any. As a receiver, the Fund would receive payments based on any positive total return and would owe payments in the event of a negative total return. As the payer, the Fund would owe payments on any net positive total return, and would receive payment in the event of a negative total return.
Changes in the value of swap agreements are recognized as unrealized gains (losses) in the Consolidated Statement of Operations by “marking to market” on a daily basis to reflect the value of the swap agreement at the end of each trading day. Payments received or paid at the beginning of the agreement are reflected as such on the Consolidated Statement of Assets and Liabilities and may be referred to as upfront payments. The Fund accrues for the fixed payment stream and amortizes upfront payments, if any, on swap agreements on a daily basis with the net amount, recorded as a component of realized gain (loss) on the Consolidated Statement of Operations. A liquidation payment received or made at the termination of a swap agreement is recorded as realized gain (loss) on the Consolidated Statement of Operations. Cash held as collateral is recorded as deposits with brokers on the Consolidated Statement of Assets and Liabilities. Entering into these agreements involves, to varying degrees, lack of liquidity and elements of credit, market, and Counterparty risk in excess of amounts recognized on the Consolidated Statement of Assets and Liabilities. Such risks involve the possibility that a swap is difficult to sell or liquidate; the Counterparty does not honor its obligations under the agreement and unfavorable interest rates and market fluctuations. It is possible that developments in the swaps market, including potential government regulation, could adversely affect the Fund’s ability to terminate existing swap agreements or to realize amounts to be received under such agreements. Additionally, an International Swaps and Derivatives Association Master Agreement (“ISDA Master Agreement”) includes credit related contingent features which allow Counterparties to OTC derivatives to terminate derivative contracts prior to maturity in the event that, for example, the Fund’s net assets decline by a stated percentage or the Fund fails to meet the terms of its ISDA master agreements, which would cause the Fund to accelerate payment of any net liability owed to the Counterparty. A short position in a security poses more risk than holding the same security long. As there is no limit on how much the price of the security can increase, the Fund’s exposure is unlimited.
| L. | Leverage Risk – Leverage exists when the Fund can lose more than it originally invests because it purchases or sells an instrument or enters into a transaction without investing an amount equal to the full economic exposure of the instrument or transaction. |
| M. | Other Risks – The Fund will seek to gain exposure to commodity markets primarily through an investment in the Subsidiary and through investments in commodity futures and swaps, commodity related exchange-traded funds and exchange-traded notes and commodity linked notes, some or all of which will be owned through the Subsidiary. The Subsidiary, unlike the Fund, may invest without limitation in commodities, commodity-linked derivatives and other securities, such as exchange-traded and commodity-linked notes, that may provide leveraged and non-leveraged exposure to commodity markets. The Fund is indirectly exposed to the risks associated with the Subsidiary’s investments. |
During the period, the Fund experienced a low interest rate environment created in part by the Federal Reserve Board (FRB) and certain foreign central banks keeping the federal funds and equivalent foreign rates near historical lows. Increases in the federal funds and equivalent foreign rates may expose fixed income markets to heightened volatility and reduced liquidity for certain fixed income investments, particularly those with longer maturities. In addition, decreases in fixed income dealer market-making capacity may also potentially lead to heightened volatility and reduced liquidity in the fixed income markets. As a result, the value of the Fund’s investments and share price may decline. Changes in central bank policies could also result in higher than normal shareholder redemptions, which could potentially increase portfolio turnover and the Fund’s transaction costs.
Policy changes by the U.S. government or its regulatory agencies and political events within the U.S. and abroad may, among other things, affect investor and consumer confidence and increase volatility in the financial markets, perhaps suddenly and to a significant degree, which may adversely impact the Fund’s operations, universe of potential investment options, and return potential.
| | |
| 20 | | Invesco Balanced-Risk Commodity Strategy Fund |
In addition to risks associated with the underlying commodities, investments in commodity-linked notes may be subject to additional risks, such as non-payment of interest and loss of principal, counterparty risk, lack of a secondary market and risk of greater volatility than traditional equity and debt securities. The value of the commodity-linked notes the Fund buys may fluctuate significantly because the values of the underlying investments to which they are linked are themselves volatile. Additionally, certain commodity-linked notes employ “economic” leverage by requiring payment by the issuer of an amount that is a multiple of the price increase or decrease of the underlying commodity, commodity index, or other economic variable. Such economic leverage will increase the volatility of the value of these commodity-linked notes and the Fund to the extent it invests in such notes.
Active trading of portfolio securities may result in added expenses, a lower return and increased tax liability.
| N. | COVID-19 Risk – The COVID-19 strain of coronavirus has resulted in instances of market closures and dislocations, extreme volatility, liquidity constraints and increased trading costs. Efforts to contain its spread have resulted in travel restrictions, disruptions of healthcare systems, business operations (including business closures) and supply chains, layoffs, lower consumer demand and employee availability, and defaults and credit downgrades, among other significant economic impacts that have disrupted global economic activity across many industries. Such economic impacts may exacerbate other pre-existing political, social and economic risks locally or globally and cause general concern and uncertainty. The full economic impact and ongoing effects of COVID-19 (or other future epidemics or pandemics) at the macro-level and on individual businesses are unpredictable and may result in significant and prolonged effects on the Fund’s performance. |
NOTE 2–Advisory Fees and Other Fees Paid to Affiliates
The Trust has entered into a master investment advisory agreement with the Adviser. Under the terms of the investment advisory agreement, the Fund accrues daily and pays monthly an advisory fee to the Adviser less the amount paid by the Subsidiary to the Adviser based on the annual rate of the Fund’s average daily net assets as follows:
| | | | |
| Average Daily Net Assets | | Rate | |
|
| |
First $ 250 million | | | 1.050% | |
|
| |
Next $250 million | | | 1.025% | |
|
| |
Next $500 million | | | 1.000% | |
|
| |
Next $1.5 billion | | | 0.975% | |
|
| |
Next $2.5 billion | | | 0.950% | |
|
| |
Next $2.5 billion | | | 0.925% | |
|
| |
Next $2.5 billion | | | 0.900% | |
|
| |
Over $10 billion | | | 0.875% | |
|
| |
For the year ended October 31, 2022, the effective advisory fee rate incurred by the Fund was 1.01%.
The Subsidiary has entered into a separate contract with the Adviser whereby the Adviser provides investment advisory and other services to the Subsidiary. In consideration of these services, the Subsidiary pays an advisory fee to the Adviser based on the annual rate of the Subsidiary’s average daily net assets as set forth in the table above.
Under the terms of a master sub-advisory agreement between the Adviser and each of Invesco Asset Management Deutschland GmbH, Invesco Asset Management Limited, Invesco Asset Management (Japan) Limited, Invesco Hong Kong Limited, Invesco Senior Secured Management, Inc. and Invesco Canada Ltd. and separate sub-advisory agreements with Invesco Capital Management LLC and Invesco Asset Management (India) Private Limited (collectively, the “Affiliated Sub-Advisers”) the Adviser, not the Fund, will pay 40% of the fees paid to the Adviser to any such Affiliated Sub-Adviser(s) that provide(s) discretionary investment management services to the Fund based on the percentage of assets allocated to such Affiliated Sub-Adviser(s).
The Adviser has contractually agreed, through at least February 29, 2024, to waive advisory fees and/or reimburse expenses to the extent necessary to limit total annual fund operating expenses after fee waivers and/or reimbursements (excluding certain items discussed below) of Class A, Class C, Class R, Class Y, Class R5 and Class R6 shares to 1.40%, 2.15%, 1.65%, 1.15%, 1.15% and 1.15%, respectively, of the Fund’s average daily net assets (the “expense limits”). In determining the Adviser’s obligation to waive advisory fees and/or reimburse expenses, the following expenses are not taken into account, and could cause the total annual fund operating expenses after fee waiver and/or expense reimbursement to exceed the numbers reflected above: (1) interest; (2) taxes; (3) dividend expense on short sales; (4) extraordinary or non-routine items, including litigation expenses; and (5) expenses that the Fund has incurred but did not actually pay because of an expense offset arrangement. Acquired Fund Fees and Expenses are not operating expenses of the Fund directly, but are fees and expenses, including management fees, of the investment companies in which the Fund invests. As a result, the total annual fund operating expenses after expense reimbursement may exceed the expense limits above. Unless Invesco continues the fee waiver agreement, it will terminate on February 29, 2024. During its term, the fee waiver agreement cannot be terminated or amended to increase the expense limits or reduce the advisory fee waiver without approval of the Board of Trustees.
Further, the Adviser has contractually agreed, through at least June 30, 2024, to waive the advisory fee payable by the Fund in an amount equal to 100% of the net advisory fees the Adviser receives from the affiliated money market funds on investments by the Fund of uninvested cash in such affiliated money market funds.
For the year ended October 31, 2022, the Adviser waived advisory fees of $776,946 and reimbursed class level expenses of $141,242, $45,571, $14,625, $1,307,589, $83,479 and $0 of Class A, Class C, Class R, Class Y, Class R5 and Class R6 shares, respectively.
The Trust has entered into a master administrative services agreement with Invesco pursuant to which the Fund has agreed to pay Invesco for certain administrative costs incurred in providing accounting services to the Fund. For the year ended October 31, 2022, expenses incurred under the agreement are shown in the Consolidated Statement of Operations as Administrative services fees. Invesco has entered into a sub-administration agreement whereby State Street Bank and Trust Company (“SSB”) serves as fund accountant and provides certain administrative services to the Fund. Pursuant to a custody agreement with the Trust on behalf of the Fund, SSB also serves as the Fund’s custodian.
The Trust has entered into a transfer agency and service agreement with Invesco Investment Services, Inc. (“IIS”) pursuant to which the Fund has agreed to pay IIS a fee for providing transfer agency and shareholder services to the Fund and reimburse IIS for certain expenses incurred by IIS in the course of providing such services. IIS may make payments to intermediaries that provide omnibus account services, sub-accounting services and/or networking services. All fees payable by IIS to intermediaries that provide omnibus account services or sub-accounting services are charged back to the Fund, subject to certain limitations approved by the Trust’s Board of Trustees. For the year ended October 31, 2022, expenses incurred under the agreement are shown in the Consolidated Statement of Operations as Transfer agent fees.
The Trust has entered into master distribution agreements with Invesco Distributors, Inc. (“IDI”) to serve as the distributor for the Class A, Class C, Class R, Class Y, Class R5 and Class R6 shares of the Fund. The Trust has adopted plans pursuant to Rule 12b-1 under the 1940 Act with respect to the Fund’s Class A, Class C and Class R shares (collectively, the “Plans”). The Fund, pursuant to the Plans, pays IDI compensation at the annual rate of 0.25% of the Fund’s average daily net assets of Class A shares, 1.00% of the average daily net assets of Class C shares and 0.50% of the average daily net assets of Class R shares. The fees are accrued daily and paid monthly. Of the Plan payments, up to 0.25% of the average daily net assets of each class of shares may be paid to furnish continuing personal shareholder services to customers who purchase and own shares of such classes. Any amounts not paid as a service fee under the Plans would constitute an asset-based sales charge. Rules of
| | |
| 21 | | Invesco Balanced-Risk Commodity Strategy Fund |
the Financial Industry Regulatory Authority (“FINRA”) impose a cap on the total sales charges, including asset-based sales charges, that may be paid by any class of shares of the Fund. For the year ended October 31, 2022, expenses incurred under the Plans are shown in the Consolidated Statement of Operations as Distribution fees.
Front-end sales commissions and CDSC (collectively, the “sales charges”) are not recorded as expenses of the Fund. Front-end sales commissions are deducted from proceeds from the sales of Fund shares prior to investment in Class A shares of the Fund. CDSC are deducted from redemption proceeds prior to remittance to the shareholder. During the year ended October 31, 2022, IDI advised the Fund that IDI retained $52,669 in front-end sales commissions from the sale of Class A shares and $2,418 and $8,355 from Class A and Class C shares, respectively, for CDSC imposed upon redemptions by shareholders.
Certain officers and trustees of the Trust are officers and directors of the Adviser, IIS and/or IDI.
NOTE 3–Additional Valuation Information
GAAP defines fair value as the price that would be received to sell an asset or paid to transfer a liability in an orderly transaction between market participants at the measurement date, under current market conditions. GAAP establishes a hierarchy that prioritizes the inputs to valuation methods, giving the highest priority to readily available unadjusted quoted prices in an active market for identical assets (Level 1) and the lowest priority to significant unobservable inputs (Level 3), generally when market prices are not readily available. Based on the valuation inputs, the securities or other investments are tiered into one of three levels. Changes in valuation methods may result in transfers in or out of an investment’s assigned level:
| | Level 1 - | Prices are determined using quoted prices in an active market for identical assets. |
| | Level 2 - | Prices are determined using other significant observable inputs. Observable inputs are inputs that other market participants may use in pricing a security. These may include quoted prices for similar securities, interest rates, prepayment speeds, credit risk, yield curves, loss severities, default rates, discount rates, volatilities and others. |
| | Level 3 - | Prices are determined using significant unobservable inputs. In situations where quoted prices or observable inputs are unavailable (for example, when there is little or no market activity for an investment at the end of the period), unobservable inputs may be used. Unobservable inputs reflect the Adviser’s assumptions about the factors market participants would use in determining fair value of the securities or instruments and would be based on the best available information. |
The following is a summary of the tiered valuation input levels, as of October 31, 2022. The level assigned to the securities valuations may not be an indication of the risk or liquidity associated with investing in those securities. Because of the inherent uncertainties of valuation, the values reflected in the consolidated financial statements may materially differ from the value received upon actual sale of those investments.
| | | | | | | | | | | | | | | | |
| | | Level 1 | | | Level 2 | | | Level 3 | | | Total | |
Investments in Securities | | | | | | | | | | | | | | | | |
U.S. Treasury Securities | | $ | – | | | $ | 355,441,984 | | | | $– | | | $ | 355,441,984 | |
Commodity-Linked Securities | | | – | | | | 82,205,458 | | | | – | | | | 82,205,458 | |
Money Market Funds | | | 668,047,451 | | | | – | | | | – | | | | 668,047,451 | |
Total Investments in Securities | | | 668,047,451 | | | | 437,647,442 | | | | – | | | | 1,105,694,893 | |
| | | | |
Other Investments - Assets* | | | | | | | | | | | | | | | | |
Futures Contracts | | | 3,212,774 | | | | – | | | | – | | | | 3,212,774 | |
Swap Agreements | | | – | | | | 12,599,419 | | | | – | | | | 12,599,419 | |
| | | | 3,212,774 | | | | 12,599,419 | | | | – | | | | 15,812,193 | |
| | | | |
Other Investments - Liabilities* | | | | | | | | | | | | | | | | |
Futures Contracts | | | (15,495,236 | ) | | | – | | | | – | | | | (15,495,236 | ) |
Swap Agreements | | | – | | | | (9,322,322 | ) | | | – | | | | (9,322,322 | ) |
| | | | (15,495,236 | ) | | | (9,322,322 | ) | | | – | | | | (24,817,558 | ) |
Total Other Investments | | | (12,282,462 | ) | | | 3,277,097 | | | | – | | | | (9,005,365 | ) |
Total Investments | | $ | 655,764,989 | | | $ | 440,924,539 | | | | $– | | | $ | 1,096,689,528 | |
| * | Unrealized appreciation (depreciation). |
NOTE 4–Derivative Investments
The Fund may enter into an ISDA Master Agreement under which a fund may trade OTC derivatives. An OTC transaction entered into under an ISDA Master Agreement typically involves a collateral posting arrangement, payment netting provisions and close-out netting provisions. These netting provisions allow for reduction of credit risk through netting of contractual obligations. The enforceability of the netting provisions of the ISDA Master Agreement depends on the governing law of the ISDA Master Agreement, among other factors.
For financial reporting purposes, the Fund does not offset OTC derivative assets or liabilities that are subject to ISDA Master Agreements in the Consolidated Statement of Assets and Liabilities.
Value of Derivative Investments at Period-End
The table below summarizes the value of the Fund’s derivative investments, detailed by primary risk exposure, held as of October 31, 2022:
| | | | |
| | | Value | |
| Derivative Assets | | Commodity
Risk | |
Unrealized appreciation on futures contracts – Exchange-Traded(a) | | $ | 3,212,774 | |
Unrealized appreciation on swap agreements – OTC | | | 12,599,419 | |
Total Derivative Assets | | | 15,812,193 | |
Derivatives not subject to master netting agreements | | | (3,212,774 | ) |
Total Derivative Assets subject to master netting agreements | | $ | 12,599,419 | |
| | |
| 22 | | Invesco Balanced-Risk Commodity Strategy Fund |
| | | | |
| | | Value | |
| Derivative Liabilities | | Commodity
Risk | |
Unrealized depreciation on futures contracts – Exchange-Traded(a) | | $ | (15,495,236 | ) |
Unrealized depreciation on swap agreements – OTC | | | (9,322,322 | ) |
Total Derivative Liabilities | | | (24,817,558 | ) |
Derivatives not subject to master netting agreements | | | 15,495,236 | |
Total Derivative Liabilities subject to master netting agreements | | $ | (9,322,322 | ) |
| (a) | The daily variation margin receivable (payable) at period-end is recorded in the Consolidated Statement of Assets and Liabilities. |
Offsetting Assets and Liabilities
The table below reflects the Fund’s exposure to Counterparties subject to either an ISDA Master Agreement or other agreement for OTC derivative transactions as of October 31, 2022.
| | | | | | | | | | | | | | | | | | | | | | |
| | | Financial
Derivative
Assets | | | Financial
Derivative
Liabilities | | | | | | Collateral
(Received)/Pledged | | | | |
| Counterparty | | Swap
Agreements | | | Swap
Agreements | | | Net Value of
Derivatives | | | Non-Cash | | Cash | | | Net
Amount | |
Barclays Bank PLC | | $ | 2,526,161 | | | $ | (15,905 | ) | | $ | 2,510,256 | | | $– | | $ | (2,510,256 | ) | | $ | – | |
BNP Paribas S.A. | | | – | | | | (539,779 | ) | | | (539,779 | ) | | – | | | 470,000 | | | | (69,779 | ) |
Canadian Imperial Bank of Commerce | | | – | | | | (221,640 | ) | | | (221,640 | ) | | – | | | – | | | | (221,640 | ) |
Cargill, Inc. | | | – | | | | (162,813 | ) | | | (162,813 | ) | | – | | | 162,813 | | | | – | |
Goldman Sachs International | | | 1,858,983 | | | | (7,124,848 | ) | | | (5,265,865 | ) | | – | | | 5,150,000 | | | | (115,865 | ) |
J.P. Morgan Chase Bank, N.A. | | | 687,027 | | | | (5,122 | ) | | | 681,905 | | | – | | | (681,905 | ) | | | – | |
Macquarie Bank Ltd. | | | 1,885,904 | | | | (333,947 | ) | | | 1,551,957 | | | – | | | (210,000 | ) | | | 1,341,957 | |
Merrill Lynch International | | | 7,043,826 | | | | (5,284,095 | ) | | | 1,759,731 | | | – | | | (1,759,731 | ) | | | – | |
Morgan Stanley Capital Services LLC | | | 5,641,343 | | | | (193,070 | ) | | | 5,448,273 | | | – | | | (5,430,000 | ) | | | 18,273 | |
Royal Bank of Canada | | | 4,456,477 | | | | (12,604 | ) | | | 4,443,873 | | | – | | | (4,443,873 | ) | | | – | |
UBS AG | | | – | | | | (808,811 | ) | | | (808,811 | ) | | – | | | 808,811 | | | | – | |
Total | | $ | 24,099,721 | | | $ | (14,702,634 | ) | | $ | 9,397,087 | | | $– | | $ | (8,444,141 | ) | | $ | 952,946 | |
Effect of Derivative Investments for the year ended October 31, 2022
The table below summarizes the gains (losses) on derivative investments, detailed by primary risk exposure, recognized in earnings during the period:
| | |
| | | Location of Gain (Loss) on |
| | | Consolidated Statement of Operations |
| | | Commodity
Risk |
Realized Gain: | | |
Futures contracts | | $ 70,015,050 |
Swap agreements | | 52,260,726 |
Change in Net Unrealized Appreciation (Depreciation): | | |
Futures contracts | | (37,927,439) |
Swap agreements | | 8,734,618 |
Total | | $ 93,082,955 |
The table below summarizes the average notional value of derivatives held during the period.
| | | | | | | | | | | | |
| | | Futures
Contracts | | | | | | Swap
Agreements | |
Average notional value | | $ | 327,674,351 | | | | | | | $ | 1,043,288,017 | |
NOTE 5–Expense Offset Arrangement(s)
The expense offset arrangement is comprised of transfer agency credits which result from balances in demand deposit accounts used by the transfer agent for clearing shareholder transactions. For the year ended October 31, 2022, the Fund received credits from this arrangement, which resulted in the reduction of the Fund’s total expenses of $686.
NOTE 6–Trustees’ and Officers’ Fees and Benefits
Trustees’ and Officers’ Fees and Benefits include amounts accrued by the Fund to pay remuneration to certain Trustees and Officers of the Fund. Trustees have the option to defer compensation payable by the Fund, and Trustees’ and Officers’ Fees and Benefits also include amounts accrued by the Fund to fund such deferred
23 Invesco Balanced-Risk Commodity Strategy Fund
compensation amounts. Those Trustees who defer compensation have the option to select various Invesco Funds in which their deferral accounts shall be deemed to be invested. Finally, certain current Trustees were eligible to participate in a retirement plan that provided for benefits to be paid upon retirement to Trustees over a period of time based on the number of years of service. The Fund may have certain former Trustees who also participate in a retirement plan and receive benefits under such plan. Trustees’ and Officers’ Fees and Benefits include amounts accrued by the Fund to fund such retirement benefits. Obligations under the deferred compensation and retirement plans represent unsecured claims against the general assets of the Fund.
NOTE 7–Cash Balances
The Fund is permitted to temporarily carry a negative or overdrawn balance in its account with SSB, the custodian bank. Such balances, if any at period-end, are shown in the Consolidated Statement of Assets and Liabilities under the payable caption Amount due custodian. To compensate the custodian bank for such overdrafts, the overdrawn Fund may either (1) leave funds as a compensating balance in the account so the custodian bank can be compensated by earning the additional interest; or (2) compensate by paying the custodian bank at a rate agreed upon by the custodian bank and Invesco, not to exceed the contractually agreed upon rate. The Fund may not purchase additional securities when any borrowings from banks or broker-dealers exceed 5% of the Fund’s total assets, or when any borrowings from an Invesco Fund are outstanding.
NOTE 8–Distributions to Shareholders and Tax Components of Net Assets
Tax Character of Distributions to Shareholders Paid During the Fiscal Years Ended October 31, 2022 and 2021:
| | | | | | |
| | | 2022 | | | | 2021 |
Ordinary income* | | $213,955,525 | | | | $– |
| * | Includes short-term capital gain distributions, if any. |
Tax Components of Net Assets at Period-End:
| | | | |
| | | 2022 | |
Undistributed ordinary income | | $ | 91,826,443 | |
Net unrealized appreciation – investments | | | 1,053,488 | |
Temporary book/tax differences | | | (91,953 | ) |
Capital loss carryforward | | | (7,141,095 | ) |
Shares of beneficial interest | | | 1,093,434,744 | |
Total net assets | | $ | 1,179,081,627 | |
The difference between book-basis and tax-basis unrealized appreciation (depreciation) is due to differences in the timing of recognition of gains and losses on investments for tax and book purposes. The Fund’s net unrealized appreciation (depreciation) difference is attributable primarily to Subsidiary differences.
The temporary book/tax differences are a result of timing differences between book and tax recognition of income and/or expenses. The Fund’s temporary book/tax differences are the result of the trustee deferral of compensation and retirement plan benefits.
Capital loss carryforward is calculated and reported as of a specific date. Results of transactions and other activity after that date may affect the amount of capital loss carryforward actually available for the Fund to utilize. The ability to utilize capital loss carryforward in the future may be limited under the Internal Revenue Code and related regulations based on the results of future transactions.
The Fund has a capital loss carryforward as of October 31, 2022, as follows:
| | | | | | | | | | | | | | | | | | |
| Capital Loss Carryforward* | |
|
| |
| Expiration | | Short-Term | | | | | | Long-Term | | | | | Total | |
|
| |
Not subject to expiration | | $ | 7,141,095 | | | | | | | $– | | | | | | $ | 7,141,095 | |
|
| |
| * | Capital loss carryforward is reduced for limitations, if any, to the extent required by the Internal Revenue Code and may be further limited depending upon a variety of factors, including the realization of net unrealized gains or losses as of the date of any reorganization. |
NOTE 9–Investment Transactions
The aggregate amount of investment securities (other than short-term securities, U.S. Government obligations and money market funds, if any) purchased and sold by the Fund during the year ended October 31, 2022 was $93,230,000 and $139,315,072, respectively. Cost of investments, including any derivatives, on a tax basis includes the adjustments for financial reporting purposes as of the most recently completed federal income tax reporting period-end.
| | | | |
Unrealized Appreciation (Depreciation) of Investments on a Tax Basis | |
Aggregate unrealized appreciation of investments | | | $23,826,780 | |
|
| |
Aggregate unrealized (depreciation) of investments | | | (22,773,292 | ) |
|
| |
Net unrealized appreciation of investments | | | $ 1,053,488 | |
|
| |
Cost of investments for tax purposes is $1,095,636,040.
NOTE 10–Reclassification of Permanent Differences
Primarily as a result of differing book/tax treatment of income from the Subsidiary, on October 31, 2022, undistributed net investment income (loss) was increased by $85,864,920 and undistributed net realized gain was decreased by $85,864,920. This reclassification had no effect on the net assets or the distributable earnings of the Fund.
| | |
| 24 | | Invesco Balanced-Risk Commodity Strategy Fund |
NOTE 11–Share Information
| | | | | | | | | | | | | | | | |
| | | Summary of Share Activity | |
| | | Year ended | | | Year ended | |
| | | October 31, 2022(a) | | | October 31, 2021 | |
| | | Shares | | | Amount | | | Shares | | | Amount | |
Sold: | | | | | | | | | | | | | | | | |
Class A | | | 10,005,503 | | | $ | 78,497,690 | | | | 5,621,619 | | | $ | 42,637,268 | |
Class C | | | 2,282,984 | | | | 16,402,860 | | | | 1,726,047 | | | | 12,129,709 | |
Class R | | | 1,688,747 | | | | 12,822,228 | | | | 182,131 | | | | 1,380,411 | |
Class Y | | | 41,531,853 | | | | 326,502,418 | | | | 94,018,115 | | | | 736,285,871 | |
Class R5 | | | 3,312,197 | | | | 26,956,361 | | | | 1,368,949 | | | | 10,698,962 | |
Class R6 | | | 33,672,573 | | | | 270,113,458 | | | | 56,113,064 | | | | 435,488,836 | |
| | | | |
Issued as reinvestment of dividends: | | | | | | | | | | | | | | | | |
Class A | | | 879,856 | | | | 5,930,231 | | | | - | | | | - | |
Class C | | | 374,025 | | | | 2,318,957 | | | | - | | | | - | |
Class R | | | 66,005 | | | | 434,310 | | | | - | | | | - | |
Class Y | | | 15,387,911 | | | | 106,638,220 | | | | - | | | | - | |
Class R5 | | | 3,217,990 | | | | 22,429,386 | | | | - | | | | - | |
Class R6 | | | 618,840 | | | | 4,325,695 | | | | - | | | | - | |
| | | | |
Automatic conversion of Class C shares to Class A shares: | | | | | | | | | | | | | | | | |
Class A | | | 87,779 | | | | 672,462 | | | | 49,518 | | | | 364,740 | |
Class C | | | (95,624 | ) | | | (672,462 | ) | | | (53,128 | ) | | | (364,740 | ) |
| | | | |
Reacquired: | | | | | | | | | | | | | | | | |
Class A | | | (4,757,894 | ) | | | (36,086,351 | ) | | | (2,912,281 | ) | | | (22,043,791 | ) |
Class C | | | (901,355 | ) | | | (6,198,779 | ) | | | (179,974 | ) | | | (1,271,597 | ) |
Class R | | | (468,097 | ) | | | (3,509,495 | ) | | | (89,754 | ) | | | (631,669 | ) |
Class Y | | | (97,250,116 | ) | | | (752,450,276 | ) | | | (38,297,924 | ) | | | (296,348,941 | ) |
Class R5 | | | (5,004,803 | ) | | | (39,448,389 | ) | | | (7,184,371 | ) | | | (54,423,011 | ) |
Class R6 | | | (40,672,733 | ) | | | (323,042,897 | ) | | | (18,482,950 | ) | | | (149,197,415 | ) |
Net increase (decrease) in share activity | | | (36,024,359 | ) | | $ | (287,364,373 | ) | | | 91,879,061 | | | $ | 714,704,633 | |
| (a) | There are entities that are record owners of more than 5% of the outstanding shares of the Fund and in the aggregate own 77% of the outstanding shares of the Fund. IDI has an agreement with these entities to sell Fund shares. The Fund, Invesco and/or Invesco affiliates may make payments to these entities, which are considered to be related to the Fund, for providing services to the Fund, Invesco and/or Invesco affiliates including but not limited to services such as securities brokerage, distribution, third party record keeping and account servicing. The Fund has no knowledge as to whether all or any portion of the shares owned of record by these entities are also owned beneficially. |
25 Invesco Balanced-Risk Commodity Strategy Fund
Report of Independent Registered Public Accounting Firm
To the Board of Trustees of AIM Investment Funds (Invesco Investment Funds) and Shareholders of Invesco Balanced-Risk Commodity Strategy Fund
Opinion on the Consolidated Financial Statements
We have audited the accompanying consolidated statement of assets and liabilities, including the consolidated schedule of investments, of Invesco Balanced-Risk Commodity Strategy Fund and its subsidiary (one of the funds constituting AIM Investment Funds (Invesco Investment Funds), referred to hereafter as the “Fund”) as of October 31, 2022, the related consolidated statement of operations for the year ended October 31, 2022, the consolidated statement of changes in net assets for each of the two years in the period ended October 31, 2022, including the related notes, and the consolidated financial highlights for each of the five years in the period ended October 31, 2022 (collectively referred to as the “consolidated financial statements”). In our opinion, the consolidated financial statements present fairly, in all material respects, the financial position of the Fund as of October 31, 2022, the results of its operations for the year then ended, the changes in its net assets for each of the two years in the period ended October 31, 2022 and the financial highlights for each of the five years in the period ended October 31, 2022 in conformity with accounting principles generally accepted in the United States of America.
Basis for Opinion
These consolidated financial statements are the responsibility of the Fund’s management. Our responsibility is to express an opinion on the Fund’s consolidated financial statements based on our audits. We are a public accounting firm registered with the Public Company Accounting Oversight Board (United States) (PCAOB) and are required to be independent with respect to the Fund in accordance with the U.S. federal securities laws and the applicable rules and regulations of the Securities and Exchange Commission and the PCAOB.
We conducted our audits of these consolidated financial statements in accordance with the standards of the PCAOB. Those standards require that we plan and perform the audit to obtain reasonable assurance about whether the consolidated financial statements are free of material misstatement, whether due to error or fraud.
Our audits included performing procedures to assess the risks of material misstatement of the consolidated financial statements, whether due to error or fraud, and performing procedures that respond to those risks. Such procedures included examining, on a test basis, evidence regarding the amounts and disclosures in the consolidated financial statements. Our audits also included evaluating the accounting principles used and significant estimates made by management, as well as evaluating the overall presentation of the consolidated financial statements. Our procedures included confirmation of securities owned as of October 31, 2022 by correspondence with the custodian, transfer agent and brokers; when replies were not received from brokers, we performed other auditing procedures. We believe that our audits provide a reasonable basis for our opinion.
/s/PricewaterhouseCoopers LLP
Houston, Texas
December 23, 2022
We have served as the auditor of one or more of the investment companies in the Invesco group of investment companies since at least 1995. We have not been able to determine the specific year we began serving as auditor.
| | |
| 26 | | Invesco Balanced-Risk Commodity Strategy Fund |
Calculating your ongoing Fund expenses
Example
As a shareholder of the Fund, you incur two types of costs: (1) transaction costs, which may include sales charges (loads) on purchase payments or contingent deferred sales charges on redemptions, if any; and (2) ongoing costs, including management fees, distribution and/or service (12b-1) fees, and other Fund expenses. This example is intended to help you understand your ongoing costs (in dollars) of investing in the Fund and to compare these costs with ongoing costs of investing in other mutual funds. The example is based on an investment of $1,000 invested at the beginning of the period and held for the entire period May 1, 2022 through October 31, 2022.
In addition to the fees and expenses which the Fund bears directly, the Fund indirectly bears a pro-rata share of the fees and expenses of the underlying funds in which the Fund invests. The amount of fees and expenses incurred indirectly by the Fund will vary because the underlying funds have varied expenses and fee levels and the Fund may own different proportions of the underlying funds at different times. Estimated underlying fund expenses are not expenses that are incurred directly by the Fund. They are expenses that are incurred directly by the underlying funds and are deducted from the value of the underlying funds the Fund invests in. The effect of the estimated underlying fund expenses that the Fund bears indirectly are included in the Fund’s total return.
Actual expenses
The table below provides information about actual account values and actual expenses. You may use the information in this table, together with the amount you invested, to estimate the expenses that you paid over the period. Simply divide your account value by $1,000 (for example, an $8,600 account value divided by $1,000 = 8.6), then multiply the result by the number in the table under the heading entitled “Actual Expenses Paid During Period” to estimate the expenses you paid on your account during this period.
Hypothetical example for comparison purposes
The table below also provides information about hypothetical account values and hypothetical expenses based on the Fund’s actual expense ratio and an assumed rate of return of 5% per year before expenses, which is not the Fund’s actual return.
The hypothetical account values and expenses may not be used to estimate the actual ending account balance or expenses you paid for the period. You may use this information to compare the ongoing costs of investing in the Fund and other funds. To do so, compare this 5% hypothetical example with the 5% hypothetical examples that appear in the shareholder reports of the other funds.
Please note that the expenses shown in the table are meant to highlight your ongoing costs only and do not reflect any transaction costs, such as sales charges (loads) on purchase payments or contingent deferred sales charges on redemptions, if any. Therefore, the hypothetical information is useful in comparing ongoing costs only, and will not help you determine the relative total costs of owning different funds. In addition, expenses shown in the table do not include the expenses of the underlying funds, which are borne indirectly by the Fund. If transaction costs and indirect expenses were included, your costs would have been higher.
| | | | | | | | | | | | |
| | | | | ACTUAL | | HYPOTHETICAL
(5% annual return before
expenses) | | |
| | | Beginning
Account Value
(05/01/22) | | Ending
Account Value
(10/31/22)1 | | Expenses
Paid During
Period2 | | Ending
Account Value
(10/31/22) | | Expenses
Paid During
Period2 | | Annualized
Expense
Ratio |
Class A | | $1,000.00 | | $895.40 | | $6.21 | | $1,018.65 | | $6.61 | | 1.30% |
Class C | | 1,000.00 | | 891.40 | | 9.77 | | 1,014.87 | | 10.41 | | 2.05 |
Class R | | 1,000.00 | | 892.90 | | 7.40 | | 1,017.39 | | 7.88 | | 1.55 |
Class Y | | 1,000.00 | | 895.00 | | 5.02 | | 1,019.91 | | 5.35 | | 1.05 |
Class R5 | | 1,000.00 | | 895.50 | | 5.02 | | 1,019.91 | | 5.35 | | 1.05 |
Class R6 | | 1,000.00 | | 895.70 | | 4.97 | | 1,019.96 | | 5.30 | | 1.04 |
| 1 | The actual ending account value is based on the actual total return of the Fund for the period May 1, 2022 through October 31, 2022, after actual expenses and will differ from the hypothetical ending account value which is based on the Fund’s expense ratio and a hypothetical annual return of 5% before expenses. |
| 2 | Expenses are equal to the Fund’s annualized expense ratio as indicated above multiplied by the average account value over the period, multiplied by 184/365 to reflect the most recent fiscal half year. |
27 Invesco Balanced-Risk Commodity Strategy Fund
Approval of Investment Advisory and Sub-Advisory Contracts
At meetings held on June 13, 2022, the Board of Trustees (the Board or the Trustees) of AIM Investment Funds (Invesco Investment Funds) as a whole, and the independent Trustees, who comprise over 75% of the Board, voting separately, approved the continuance of the Invesco Balanced-Risk Commodity Strategy Fund’s (the Fund) Master Investment Advisory Agreement with Invesco Advisers, Inc. (Invesco Advisers and the investment advisory agreement) and the Master Intergroup Sub-Advisory Contract for Mutual Funds with Invesco Asset Management Deutschland GmbH, Invesco Asset Management Limited, Invesco Asset Management (Japan) Limited, Invesco Hong Kong Limited, Invesco Senior Secured Management, Inc. and Invesco Canada Ltd. and separate sub-advisory contracts with Invesco Capital Management LLC and Invesco Asset Management (India) Private Limited (collectively, the Affiliated Sub-Advisers and the sub-advisory contracts) for another year, effective July 1, 2022. After evaluating the factors discussed below, among others, the Board approved the renewal of the Fund’s investment advisory agreement and the sub-advisory contracts and determined that the compensation payable thereunder by the Fund to Invesco Advisers and by Invesco Advisers to the Affiliated Sub-Advisers is fair and reasonable.
The Board’s Evaluation Process
The Board has established an Investments Committee, which in turn has established Sub-Committees that meet throughout the year to review the performance of funds advised by Invesco Advisers (the Invesco Funds). The Sub-Committees meet regularly with portfolio managers for their assigned Invesco Funds and other members of management to review detailed information about investment performance and portfolio attributes of these funds. The Board has established additional standing and ad hoc committees that meet regularly throughout the year to review matters within their purview. The Board took into account evaluations and reports that it received from its committees and sub-committees, as well as the information provided to the Board and its committees and sub-committees throughout the year, in considering whether to approve each Invesco Fund’s investment advisory agreement and sub-advisory contracts.
As part of the contract renewal process, the Board reviews and considers information provided in response to detailed requests for information submitted to management by the independent Trustees with assistance from legal counsel to the independent Trustees and the Senior Officer, an officer of the Invesco Funds who reports directly to the independent Trustees. The Board receives comparative investment performance and fee and expense data regarding the Invesco Funds prepared by Broadridge Financial Solutions, Inc. (Broadridge), an independent mutual fund data provider, as well as information on the composition of the peer groups provided by Broadridge and its methodology for determining peer groups. The Board also receives an independent written evaluation from the Senior Officer. The Senior Officer’s evaluation is prepared as part of his responsibility to manage the process by which the Invesco Funds’ proposed management fees are negotiated during the annual contract renewal
process to ensure they are negotiated in a manner that is at arms’ length and reasonable in accordance with certain negotiated regulatory requirements. In addition to meetings with Invesco Advisers and fund counsel throughout the year and as part of meetings convened on May 2, 2022 and June 13, 2022, the independent Trustees also discussed the continuance of the investment advisory agreement and sub-advisory contracts in separate sessions with the Senior Officer and with independent legal counsel.
The discussion below is a summary of the Senior Officer’s independent written evaluation with respect to the Fund’s investment advisory agreement and sub-advisory contracts, as well as a discussion of the material factors and related conclusions that formed the basis for the Board’s approval of the Fund’s investment advisory agreement and sub-advisory contracts. The Trustees’ review and conclusions are based on the comprehensive consideration of all information presented to them during the course of the year and in prior years and are not the result of any single determinative factor. Moreover, one Trustee may have weighed a particular piece of information or factor differently than another Trustee. The information received and considered by the Board was current as of various dates prior to the Board’s approval on June 13, 2022.
Factors and Conclusions and Summary of Independent Written Fee Evaluation
| A. | Nature, Extent and Quality of Services Provided by Invesco Advisers and the Affiliated Sub-Advisers |
The Board reviewed the nature, extent and quality of the advisory services provided to the Fund by Invesco Advisers under the Fund’s investment advisory agreement, and the credentials and experience of the officers and employees of Invesco Advisers who provide these services, including the Fund’s portfolio manager(s). The Board’s review included consideration of Invesco Advisers’ investment process and oversight, credit analysis, and research capabilities. The Board considered information regarding Invesco Advisers’ programs for and resources devoted to risk management, including management of investment, enterprise, operational, liquidity, valuation and compliance risks, and technology used to manage such risks. The Board also received and reviewed information about Invesco Advisers’ role as administrator of the Invesco Funds’ liquidity risk management program. The Board received a description of, and reports related to, Invesco Advisers’ global security program and business continuity plans and of its approach to data privacy and cybersecurity, including related testing. The Board considered how the cybersecurity and business continuity plans of Invesco Advisers and its key service providers operated in the remote and hybrid working environment resulting from the novel coronavirus (“COVID-19”) pandemic and paved the way for a hybrid working framework in a normalized environment as employees return to the office. The Board also considered non-advisory services that Invesco Advisers and its affiliates provide to the Invesco Funds, such as various back office support functions, third party oversight, internal audit, valuation, portfolio trading and legal and compliance. The Board observed that Invesco Advisers’ systems preparedness and ongoing investment enabled
Invesco Advisers to manage, operate and oversee the Invesco Funds with minimal impact or disruption through challenging environments. The Board reviewed and considered the benefits to shareholders of investing in a Fund that is part of the family of funds under the umbrella of Invesco Ltd., Invesco Advisers’ parent company, and noted Invesco Ltd.’s depth and experience in running an investment management business, as well as its commitment of financial and other resources to such business. The Board concluded that the nature, extent and quality of the services provided to the Fund by Invesco Advisers are appropriate and satisfactory.
The Board reviewed the services that may be provided by the Affiliated Sub-Advisers under the sub-advisory contracts and the credentials and experience of the officers and employees of the Affiliated Sub-Advisers who provide these services. The Board noted the Affiliated Sub-Advisers’ expertise with respect to certain asset classes and that the Affiliated Sub-Advisers have offices and personnel that are located in financial centers around the world. As a result, the Board noted that the Affiliated Sub-Advisers can provide research and investment analysis on the markets and economies of various countries in which the Fund may invest, make recommendations regarding securities and assist with security trades. The Board concluded that the sub-advisory contracts may benefit the Fund and its shareholders by permitting Invesco Advisers to use the resources and talents of the Affiliated Sub-Advisers in managing the Fund. The Board concluded that the nature, extent and quality of the services that may be provided to the Fund by the Affiliated Sub-Advisers are appropriate and satisfactory.
| B. | Fund Investment Performance |
The Board considered Fund investment performance as a relevant factor in considering whether to approve the investment advisory agreement. The Board did not view Fund investment performance as a relevant factor in considering whether to approve the sub-advisory contracts for the Fund, as no Affiliated Sub-Adviser currently manages assets of the Fund.
The Board compared the Fund’s investment performance over multiple time periods ending December 31, 2021 to the performance of funds in the Broadridge performance universe and against the Bloomberg Commodity Index (Index). The Board noted that performance of Class A shares of the Fund was in the fifth quintile of its performance universe for the one year period and the fourth quintile for the three and five year periods (the first quintile being the best performing funds and the fifth quintile being the worst performing funds). The Board noted that performance of Class A shares of the Fund was below the performance of the Index for the one year period, reasonably comparable to the performance of the Index for the three year period, and above the performance of the Index for the five year period. The Board considered that the Fund’s tactical asset allocation strategy and underweight allocation to the energy sector impacted relative performance. The Board recognized that the performance data reflects a snapshot in time as of a particular date and that selecting a different performance period could produce different results. The Board also reviewed more recent Fund performance as well as other
| | |
| 28 | | Invesco Balanced-Risk Commodity Strategy Fund |
performance metrics, which did not change its conclusions.
| C. | Advisory and Sub-Advisory Fees and Fund Expenses |
The Board compared the Fund’s contractual management fee rate to the contractual management fee rates of funds in the Fund’s Broadridge expense group. The Board noted that the contractual management fee rate for Class A shares of the Fund was above the median contractual management fee rate of funds in its expense group. The Board noted that the term “contractual management fee” for funds in the expense group may include both advisory and certain non-portfolio management administrative services fees, but that Broadridge is not able to provide information on a fund by fund basis as to what is included. The Board also reviewed the methodology used by Broadridge in calculating expense group information, which includes using each fund’s contractual management fee schedule (including any applicable breakpoints) as reported in the most recent prospectus or statement of additional information for each fund in the expense group. The Board also considered comparative information regarding the Fund’s total expense ratio and its various components. The Board noted that the Fund’s contractual management fees and total expense ratio were in the fifth quintile of its expense group and discussed with management reasons for such relative contractual management fees and total expenses.
The Board noted that Invesco Advisers has contractually agreed to waive fees and/or limit expenses of the Fund for the term disclosed in the Fund’s registration statement in an amount necessary to limit total annual operating expenses to a specified percentage of average daily net assets for each class of the Fund.
The Board also considered the fees charged by Invesco Advisers and its affiliates to other client accounts that are similarly managed. Invesco Advisers reviewed with the Board differences in the scope of services it provides to the Invesco Funds relative to that provided by Invesco Advisers and its affiliates to certain other types of client accounts, including, among others: management of cash flows as a result of redemptions and purchases; necessary infrastructure such as officers, office space, technology, legal and distribution; oversight of service providers; costs and business risks associated with launching new funds and sponsoring and maintaining the product line; and compliance with federal and state laws and regulations. Invesco Advisers also advised the Board that many of the similarly managed client accounts have all-inclusive fee structures, which are not easily un-bundled.
The Board also considered the services that may be provided by the Affiliated Sub-Advisers pursuant to the sub-advisory contracts, as well as the fees payable by Invesco Advisers to the Affiliated Sub-Advisers pursuant to the sub-advisory contracts.
| D. | Economies of Scale and Breakpoints |
The Board considered the extent to which there may be economies of scale in the provision of advisory services to the Fund and the Invesco Funds, and the extent to which such economies of scale are shared with the Fund and the Invesco Funds. The Board considered that the Fund benefits from economies of scale through contractual breakpoints in the Fund’s
advisory fee schedule, which generally operate to reduce the Fund’s expense ratio as it grows in size. The Board noted that the Fund also shares in
economies of scale through Invesco Advisers’ ability to negotiate lower fee arrangements with third party service providers. The Board noted that the Fund may also benefit from economies of scale through initial fee setting, fee waivers and expense reimbursements, as well as Invesco Advisers’ investment in its business, including investments in business infrastructure, technology and cybersecurity.
| E. | Profitability and Financial Resources |
The Board reviewed information from Invesco Advisers concerning the costs of the advisory and other services that Invesco Advisers and its affiliates provide to the Fund and the Invesco Funds and the profitability of Invesco Advisers and its affiliates in providing these services in the aggregate and on an individual Fund-by-Fund basis. The Board considered the methodology used for calculating profitability and the periodic review and enhancement of such methodology. The Board noted that Invesco Advisers continues to operate at a net profit from services Invesco Advisers and its affiliates provide to the Invesco Funds in the aggregate and to most Funds individually. The Board did not deem the level of profits realized by Invesco Advisers and its affiliates from providing such services to be excessive, given the nature, extent and quality of the services provided. The Board noted that Invesco Advisers provided information demonstrating that Invesco Advisers is financially sound and has the resources necessary to perform its obligations under the investment advisory agreement, and provided representations indicating that the Affiliated Sub-Advisers are financially sound and have the resources necessary to perform their obligations under the sub-advisory contracts.
| F. | Collateral Benefits to Invesco Advisers and its Affiliates |
The Board considered various other benefits received by Invesco Advisers and its affiliates from the relationship with the Fund, including the fees received for providing administrative, transfer agency and distribution services to the Fund. The Board received comparative information regarding fees charged for these services, including information provided by Broadridge and other independent sources. The Board reviewed the performance of Invesco Advisers and its affiliates in providing these services and the organizational structure employed to provide these services. The Board noted that these services are provided to the Fund pursuant to written contracts that are reviewed and subject to approval on an annual basis by the Board based on its determination that the services are required for the operation of the Fund.
The Board considered the benefits realized by Invesco Advisers and the Affiliated Sub-Advisers as a result of portfolio brokerage transactions executed through “soft dollar” arrangements. Invesco Advisers noted that the Fund does not execute brokerage transactions through “soft dollar” arrangements to any significant degree.
The Board considered that the Fund’s uninvested cash and cash collateral from any securities lending arrangements may be invested in registered money market funds or, with regard to securities lending cash collateral, unregistered funds that comply with Rule 2a-7 (collectively referred to as “affiliated money market funds”) advised by Invesco Advisers. The Board considered information regarding the returns of the affiliated money market funds relative to comparable overnight investments, as well as the
fees paid by the affiliated money market funds to Invesco Advisers and its affiliates. In this regard, the Board noted that Invesco Advisers receives advisory fees from these affiliated money market funds attributable to the Fund’s investments. The Board also noted that Invesco Advisers has contractually agreed to waive through varying periods an amount equal to 100% of the net advisory fee Invesco Advisers receives from the affiliated money market funds with respect to the Fund’s investment in the affiliated money market funds of uninvested cash, but not cash collateral. The Board concluded that the advisory fees payable to Invesco Advisers from the Fund’s investment of cash collateral from any securities lending arrangements in the affiliated money market funds are for services that are not duplicative of services provided by Invesco Advisers to the Fund.
The Board considered that Invesco Advisers may serve as the Fund’s affiliated securities lending agent and evaluated the benefits realized by Invesco Advisers when serving in such role, including the compensation received. The Board considered Invesco Advisers’ securities lending platform and corporate governance structure for securities lending, including Invesco Advisers’ Securities Lending Governance Committee and its related responsibilities. The Board noted that to the extent the Fund utilizes Invesco Advisers as an affiliated securities lending agent, the Fund conducts its securities lending in accordance with, and in reliance upon, no-action letters issued by the SEC staff that provide guidance on how an affiliate may act as a direct agent lender and receive compensation for those services without obtaining exemptive relief. The Board considered information provided by Invesco Advisers related to the performance of Invesco Advisers as securities lending agent, including a summary of the securities lending services provided to the Fund by Invesco Advisers and the compensation paid to Invesco Advisers for such services, as well as any revenues generated for the Fund in connection with such securities lending activity and the allocation of such revenue between the Fund and Invesco Advisers.
The Board also received information about commissions that an affiliated broker may receive for executing certain trades for the Fund. Invesco Advisers and the Affiliated Sub-Advisers advised the Board of the benefits to the Fund of executing trades through the affiliated broker and that such trades were executed in compliance with rules under the federal securities laws and consistent with best execution obligations.
| | |
| 29 | | Invesco Balanced-Risk Commodity Strategy Fund |
Tax Information
Form 1099-DIV, Form 1042-S and other year-end tax information provide shareholders with actual calendar year amounts that should be included in their tax returns. Shareholders should consult their tax advisers.
The following distribution information is being provided as required by the Internal Revenue Code or to meet a specific state’s requirement.
The Fund designates the following amounts or, if subsequently determined to be different, the maximum amount allowable for its fiscal year ended October 31, 2022:
| | | | | | | | |
Federal and State Income Tax | | | | | | |
Qualified Dividend Income* | | | 0.00 | % | | | | |
Corporate Dividends Received Deduction* | | | 0.00 | % | | | | |
U.S. Treasury Obligations* | | | 0.14 | % | | | | |
Qualified Business Income* | | | 0.00 | % | | | | |
Business Interest Income* | | | 0.00 | % | | | | |
|
| * The above percentages are based on ordinary income dividends paid to shareholders during the Fund’s fiscal year. | |
| | |
| 30 | | Invesco Balanced-Risk Commodity Strategy Fund |
Trustees and Officers
The address of each trustee and officer is AIM Investment Funds (Invesco Investment Funds) (the “Trust”), 11 Greenway Plaza, Suite 1000, Houston, Texas 77046-1173. The trustees serve for the life of the Trust, subject to their earlier death, incapacitation, resignation, retirement or removal as more specifically provided in the Trust’s organizational documents. Each officer serves for a one year term or until their successors are elected and qualified. Column two below includes length of time served with predecessor entities, if any.
| | | | | | | | |
Name, Year of Birth and
Position(s) Held with the Trust | | Trustee and/or Officer
Since | | Principal Occupation(s) During Past 5 Years | | Number of Funds in Fund Complex Overseen by Trustee | | Other Directorship(s) Held by Trustee During Past 5 Years |
| Interested Trustee | | | | | | | | |
| Martin L. Flanagan1 – 1960 Trustee and Vice Chair | | 2007 | | Executive Director, Chief Executive Officer and President, Invesco Ltd. (ultimate parent of Invesco and a global investment management firm); Trustee and Vice Chair, The Invesco Funds; Vice Chair, Investment Company Institute; and Member of Executive Board, SMU Cox School of Business Formerly: Advisor to the Board, Invesco Advisers, Inc. (formerly known as Invesco Institutional (N.A.), Inc.); Chairman and Chief Executive Officer, Invesco Advisers, Inc. (registered investment adviser); Director, Chairman, Chief Executive Officer and President, Invesco Holding Company (US), Inc. (formerly IVZ Inc.) (holding company), Invesco Group Services, Inc. (service provider) and Invesco North American Holdings, Inc. (holding company); Director, Chief Executive Officer and President, Invesco Holding Company Limited (parent of Invesco and a global investment management firm); Director, Invesco Ltd.; Chairman, Investment Company Institute and President, Co-Chief Executive Officer, Co-President, Chief Operating Officer and Chief Financial Officer, Franklin Resources, Inc. (global investment management organization) | | 189 | | None |
| 1 | Mr. Flanagan is considered an interested person (within the meaning of Section 2(a)(19) of the 1940 Act) of the Trust because he is an officer of the Adviser to the Trust, and an officer and a director of Invesco Ltd., ultimate parent of the Adviser. |
| | |
| T-1 | | Invesco Balanced-Risk Commodity Strategy Fund |
Trustees and Officers–(continued)
| | | | | | | | |
Name, Year of Birth and Position(s) Held with the Trust | | Trustee and/or Officer Since | | Principal Occupation(s) During Past 5 Years | | Number of
Funds in Fund Complex
Overseen by
Trustee | | Other Directorship(s) Held by Trustee During Past 5 Years |
| Independent Trustees | | | | | | | | |
Beth Ann Brown – 1968 Trustee (2019) and Chair (August 2022) | | 2019 | | Independent Consultant Formerly: Head of Intermediary Distribution, Managing Director, Strategic Relations, Managing Director, Head of National Accounts, Senior Vice President, National Account Manager and Senior Vice President, Key Account Manager, Columbia Management Investment Advisers LLC; Vice President, Key Account Manager, Liberty Funds Distributor, Inc.; and Trustee of certain Oppenheimer Funds | | 189 | | Director, Board of Directors of Caron Engineering Inc.; Advisor, Board of Advisors of Caron Engineering Inc.; President and Director, Acton Shapleigh Youth Conservation Corps (non-profit) Formerly: President and Director Director of Grahamtastic Connection (non-profit) |
Cynthia Hostetler – 1962 Trustee | | 2017 | | Non-Executive Director and Trustee of a number of public and private business corporations Formerly: Director, Aberdeen Investment Funds (4 portfolios); Director, Artio Global Investment LLC (mutual fund complex); Director, Edgen Group, Inc. (specialized energy and infrastructure products distributor); Director, Genesee & Wyoming, Inc. (railroads); Head of Investment Funds and Private Equity, Overseas Private Investment Corporation; President, First Manhattan Bancorporation, Inc.; and Attorney, Simpson Thacher & Bartlett LLP | | 189 | | Resideo Technologies, Inc. (smart home technology); Vulcan Materials Company (construction materials company); Trilinc Global Impact Fund; Textainer Group Holdings, (shipping container leasing company); Investment Company Institute (professional organization); and Independent Directors Council (professional organization) |
Eli Jones – 1961 Trustee | | 2016 | | Professor and Dean Emeritus, Mays Business School - Texas A&M University Formerly: Dean of Mays Business School-Texas A&M University; Professor and Dean, Walton College of Business, University of Arkansas and E.J. Ourso College of Business, Louisiana State University; and Director, Arvest Bank | | 189 | | Insperity, Inc. (formerly known as Administaff) (human resources provider); and Member of Regional Board of Directors and Board of Directors, First Financial Bancorp (regional bank) |
Elizabeth Krentzman – 1959 Trustee | | 2019 | | Formerly: Principal and Chief Regulatory Advisor for Asset Management Services and U.S. Mutual Fund Leader of Deloitte & Touche LLP; General Counsel of the Investment Company Institute (trade association); National Director of the Investment Management Regulatory Consulting Practice, Principal, Director and Senior Manager of Deloitte & Touche LLP; Assistant Director of the Division of Investment Management - Office of Disclosure and Investment Adviser Regulation of the U.S. Securities and Exchange Commission and various positions with the Division of Investment Management - Office of Regulatory Policy of the U.S. Securities and Exchange Commission; Associate at Ropes & Gray LLP; and Trustee of certain Oppenheimer Funds | | 189 | | Formerly: Member of the Cartica Funds Board of Directors (private investment fund); Trustee of the University of Florida National Board Foundation; and Member of the University of Florida Law Center Association, Inc. Board of Trustees, Audit Committee and Membership Committee |
Anthony J. LaCava, Jr. – 1956 Trustee | | 2019 | | Formerly: Director and Member of the Audit Committee, Blue Hills Bank (publicly traded financial institution) and Managing Partner, KPMG LLP | | 189 | | Blue Hills Bank; Chairman, Bentley University; Member, Business School Advisory Council; and Nominating Committee, KPMG LLP |
Prema Mathai-Davis – 1950 Trustee | | 2001 | | Retired Formerly: Co-Founder & Partner of Quantalytics Research, LLC, (a FinTech Investment Research Platform for the Self-Directed Investor); Trustee of YWCA Retirement Fund; CEO of YWCA of the USA; Board member of the NY Metropolitan Transportation Authority; Commissioner of the NYC Department of Aging; and Board member of Johns Hopkins Bioethics Institute | | 189 | | Member of Board of Positive Planet US (non-profit) and HealthCare Chaplaincy Network (non-profit) |
| | |
| T-2 | | Invesco Balanced-Risk Commodity Strategy Fund |
Trustees and Officers–(continued)
| | | | | | | | |
Name, Year of Birth and Position(s) Held with the Trust | | Trustee and/or Officer Since | | Principal Occupation(s) During Past 5 Years | | Number of
Funds in Fund Complex
Overseen by
Trustee | | Other
Directorship(s)
Held by Trustee
During Past 5 Years |
| Independent Trustees–(continued) | | | | | | |
Joel W. Motley – 1952 Trustee | | 2019 | | Director of Office of Finance, Federal Home Loan Bank System; Managing Director of Carmona Motley Inc. (privately held financial advisor); Member of the Council on Foreign Relations and its Finance and Budget Committee; Chairman Emeritus of Board of Human Rights Watch and Member of its Investment Committee; and Member of Investment Committee Board of Historic Hudson Valley (non-profit cultural organization); Member of the Board, Blue Ocean Acquisition Corp.; and Member of the Vestry and the Investment Committee of Trinity Church Wall Street. Formerly: Managing Director of Public Capital Advisors, LLC (privately held financial advisor); Managing Director of Carmona Motley Hoffman, Inc. (privately held financial advisor); Trustee of certain Oppenheimer Funds; and Director of Columbia Equity Financial Corp. (privately held financial advisor) | | 189 | | Member of Board of Trust for Mutual Understanding (non-profit promoting the arts and environment); Member of Board of Greenwall Foundation (bioethics research foundation) and its Investment Committee; Member of Board of Friends of the LRC (non- profit legal advocacy); and Board Member and Investment Committee Member of Pulitzer Center for Crisis Reporting (non-profit journalism) |
Teresa M. Ressel – 1962 Trustee | | 2017 | | Non-executive director and trustee of a number of public and private business corporations Formerly: Chief Executive Officer, UBS Securities LLC (investment banking); Chief Operating Officer, UBS AG Americas (investment banking); Sr. Management Team Olayan America, The Olayan Group (international investor/commercial/industrial); Assistant Secretary for Management & Budget and Designated Chief Financial Officer, U.S. Department of Treasury and Director, ON Semiconductor Corporation (semiconductor manufacturing) | | 189 | | None |
Robert C. Troccoli – 1949 Trustee | | 2016 | | Retired Formerly: Adjunct Professor, University of Denver – Daniels College of Business; and Managing Partner, KPMG LLP | | 189 | | None |
Daniel S. Vandivort – 1954 Trustee | | 2019 | | President, Flyway Advisory Services LLC (consulting and property management) Formerly: President and Chief Investment Officer, previously Head of Fixed Income, Weiss Peck and Greer/Robeco Investment Management; Trustee and Chair, Weiss Peck and Greer Funds Board; and various capacities at CS First Boston including Head of Fixed Income at First Boston Asset Management. | | 189 | | Formerly: Trustee and Governance Chair, Oppenheimer Funds; Treasurer, Chairman of the Audit and Finance Committee, Huntington Disease Foundation of America |
| | |
| T-3 | | Invesco Balanced-Risk Commodity Strategy Fund |
Trustees and Officers–(continued)
| | | | | | | | |
Name, Year of Birth and Position(s) Held with the Trust | | Trustee and/or Officer Since | | Principal Occupation(s) During Past 5 Years | | Number of
Funds in Fund Complex
Overseen by
Trustee | | Other Directorship(s) Held by Trustee
During Past 5 Years |
| Officers | | | | | | | | |
Sheri Morris – 1964 President
and Principal Executive
Officer | | 1999 | | Director, Invesco Trust Company; Head of Global Fund Services, Invesco Ltd.; President and Principal Executive Officer, The Invesco Funds; Vice President, Invesco Exchange-Traded Fund Trust, Invesco Exchange-Traded Fund Trust II, Invesco India Exchange-Traded Fund Trust, Invesco Actively Managed Exchange-Traded Fund Trust, Invesco Actively Managed Exchange-Traded Commodity Fund Trust and Invesco Exchange-Traded Self-Indexed Fund Trust; and Vice President, OppenheimerFunds, Inc. Formerly: Vice President, Treasurer and Principal Financial Officer, The Invesco Funds; Vice President, Invesco AIM Advisers, Inc., Invesco AIM Capital Management, Inc. and Invesco AIM Private Asset Management, Inc.; Assistant Vice President and Assistant Treasurer, The Invesco Funds; Vice President and Assistant Vice President, Invesco Advisers, Inc.; Assistant Vice President, Invesco AIM Capital Management, Inc. and Invesco AIM Private Asset Management, Inc.; Treasurer, Invesco Exchange-Traded Fund Trust, Invesco Exchange-Traded Fund Trust II, Invesco India Exchange-Traded Fund Trust and Invesco Actively Managed Exchange-Traded Fund Trust; and Senior Vice President, Invesco Advisers, Inc. (formerly known as Invesco Institutional (N.A.), Inc.) (registered investment adviser) | | N/A | | N/A |
Jeffrey H. Kupor – 1968 Senior Vice President, Chief Legal Officer and Secretary | | 2018 | | Head of Legal of the Americas, Invesco Ltd.; Senior Vice President and Secretary, Invesco Advisers, Inc. (formerly known as Invesco Institutional (N.A.), Inc.) (registered investment adviser); Secretary, Invesco Distributors, Inc. (formerly known as Invesco AIM Distributors, Inc.); Vice President and Secretary, Invesco Investment Services, Inc. (formerly known as Invesco AIM Investment Services, Inc.); Senior Vice President, Chief Legal Officer and Secretary, The Invesco Funds; Secretary and General Counsel, Invesco Investment Advisers LLC (formerly known as Van Kampen Asset Management); Secretary and General Counsel, Invesco Capital Markets, Inc. (formerly known as Van Kampen Funds Inc.); Chief Legal Officer, Invesco Exchange-Traded Fund Trust, Invesco Exchange-Traded Fund Trust II, Invesco India Exchange-Traded Fund Trust, Invesco Actively Managed Exchange-Traded Fund Trust, Invesco Actively Managed Exchange-Traded Commodity Fund Trust and Invesco Exchange-Traded Self-Indexed Fund Trust;; Secretary and Vice President, Harbourview Asset Management Corporation; Secretary and Vice President, OppenheimerFunds, Inc. and Invesco Managed Accounts, LLC; Secretary and Senior Vice President, OFI Global Institutional, Inc.; Secretary and Vice President, OFI SteelPath, Inc.; Secretary and Vice President, Oppenheimer Acquisition Corp.; Secretary and Vice President, Shareholder Services, Inc.; and Secretary and Vice President, Trinity Investment Management Corporation Formerly: Senior Vice President, Invesco Distributors, Inc.; Secretary and Vice President, Jemstep, Inc.; Head of Legal, Worldwide Institutional, Invesco Ltd.; Secretary and General Counsel, INVESCO Private Capital Investments, Inc.; Senior Vice President, Secretary and General Counsel, Invesco Management Group, Inc. (formerly known as Invesco AIM Management Group, Inc.); Assistant Secretary, INVESCO Asset Management (Bermuda) Ltd.; Secretary and General Counsel, Invesco Private Capital, Inc.; Assistant Secretary and General Counsel, INVESCO Realty, Inc.; Secretary and General Counsel, Invesco Senior Secured Management, Inc.; Secretary, Sovereign G./P. Holdings Inc.; Secretary, Invesco Indexing LLC; and Secretary, W.L. Ross & Co., LLC | | N/A | | N/A |
Andrew R. Schlossberg – 1974 Senior Vice President | | 2019 | | Senior Vice President, Invesco Group Services, Inc.; Head of the Americas and Senior Managing Director, Invesco Ltd.; Director and Senior Vice President, Invesco Advisers, Inc. (formerly known as Invesco Institutional (N.A.), Inc.) (registered investment adviser); Director and Chairman, Invesco Investment Services, Inc. (formerly known as Invesco AIM Investment Services, Inc.) (registered transfer agent); Senior Vice President, The Invesco Funds; and Director, Invesco Investment Advisers LLC (formerly known as Van Kampen Asset Management) Formerly: Director, President and Chairman, Invesco Insurance Agency, Inc.; Director, Invesco UK Limited; Director and Chief Executive, Invesco Asset Management Limited and Invesco Fund Managers Limited; Assistant Vice President, The Invesco Funds; Senior Vice President, Invesco Advisers, Inc. (formerly known as Invesco Institutional (N.A.), Inc.) (registered investment adviser); Director and Chief Executive, Invesco Administration Services Limited and Invesco Global Investment Funds Limited; Director, Invesco Distributors, Inc.; Head of EMEA, Invesco Ltd.; President, Invesco Actively Managed Exchange-Traded Commodity Fund Trust, Invesco Actively Managed Exchange-Traded Fund Trust, Invesco Exchange-Traded Fund Trust, Invesco Exchange-Traded Fund Trust II and Invesco India Exchange-Traded Fund Trust; and Managing Director and Principal Executive Officer, Invesco Capital Management LLC | | N/A | | N/A |
| | |
| T-4 | | Invesco Balanced-Risk Commodity Strategy Fund |
Trustees and Officers–(continued)
| | | | | | | | |
Name, Year of Birth and Position(s) Held with the Trust | | Trustee and/or Officer Since | | Principal Occupation(s) During Past 5 Years | | Number of
Funds in Fund Complex
Overseen by
Trustee | | Other Directorship(s) Held by Trustee
During Past 5 Years |
| Officers–(continued) | | | | | | | | |
John M. Zerr – 1962
Senior Vice President | | 2006 | | Chief Operating Officer of the Americas; Senior Vice President, Invesco Advisers, Inc. (formerly known as Invesco Institutional (N.A.), Inc.) (registered investment adviser); Senior Vice President, Invesco Distributors, Inc. (formerly known as Invesco AIM Distributors, Inc.); Director and Vice President, Invesco Investment Services, Inc. (formerly known as Invesco AIM Investment Services, Inc.) Senior Vice President, The Invesco Funds; Managing Director, Invesco Capital Management LLC; Director, Invesco Investment Advisers LLC (formerly known as Van Kampen Asset Management); Senior Vice President, Invesco Capital Markets, Inc. (formerly known as Van Kampen Funds Inc.); Manager, Invesco Indexing LLC; Manager, Invesco Specialized Products, LLC; Member, Invesco Canada Funds Advisory Board; Director, President and Chief Executive Officer, Invesco Corporate Class Inc. (corporate mutual fund company); and Director, Chairman, President and Chief Executive Officer, Invesco Canada Ltd. (formerly known as Invesco Trimark Ltd./Invesco Trimark Ltèe) (registered investment adviser and registered transfer agent); President, Invesco, Inc.; President, Invesco Global Direct Real Estate Feeder GP Ltd.; President, Invesco IP Holdings (Canada) Ltd; President, Invesco Global Direct Real Estate GP Ltd.; President, Invesco Financial Services Ltd. / Services Financiers Invesco Ltée; and Director and Chairman, Invesco Trust Company Formerly: President, Trimark Investments Ltd/Services Financiers Invesco Ltee; Director and Senior Vice President, Invesco Insurance Agency, Inc.; Director and Senior Vice President, Invesco Management Group, Inc. (formerly known as Invesco AIM Management Group, Inc.); Secretary and General Counsel, Invesco Management Group, Inc. (formerly known as Invesco AIM Management Group, Inc.); Secretary, Invesco Investment Services, Inc. (formerly known as Invesco AIM Investment Services, Inc.); Chief Legal Officer and Secretary, The Invesco Funds; Secretary and General Counsel, Invesco Investment Advisers LLC (formerly known as Van Kampen Asset Management); Secretary and General Counsel, Invesco Capital Markets, Inc. (formerly known as Van Kampen Funds Inc.); Chief Legal Officer, Invesco Exchange-Traded Fund Trust, Invesco Exchange-Traded Fund Trust II, Invesco India Exchange-Traded Fund Trust, Invesco Actively Managed Exchange-Traded Fund Trust, Invesco Actively Managed Exchange-Traded Commodity Fund Trust and Invesco Exchange-Traded Self-Indexed Fund Trust; Secretary, Invesco Indexing LLC; Director, Secretary, General Counsel and Senior Vice President, Van Kampen Exchange Corp.; Director, Vice President and Secretary, IVZ Distributors, Inc. (formerly known as INVESCO Distributors, Inc.); Director and Vice President, INVESCO Funds Group, Inc.; Director and Vice President, Van Kampen Advisors Inc.; Director, Vice President, Secretary and General Counsel, Van Kampen Investor Services Inc.; Director and Secretary, Invesco Distributors, Inc. (formerly known as Invesco AIM Distributors, Inc.); Director, Senior Vice President, General Counsel and Secretary, Invesco AIM Advisers, Inc. and Van Kampen Investments Inc.; Director, Vice President and Secretary, Fund Management Company; Director, Senior Vice President, Secretary, General Counsel and Vice President, Invesco AIM Capital Management, Inc.; and Chief Operating Officer and General Counsel, Liberty Ridge Capital, Inc. (an investment adviser) | | N/A | | N/A |
Gregory G. McGreevey – 1962
Senior Vice President | | 2012 | | Senior Managing Director, Invesco Ltd.; Director, Chairman, President, and Chief Executive Officer, Invesco Advisers, Inc. (formerly known as Invesco Institutional (N.A.), Inc.) (registered investment adviser); Director, Invesco Mortgage Capital, Inc. and Invesco Senior Secured Management, Inc.; Senior Vice President, The Invesco Funds; President, SNW Asset Management Corporation and Invesco Managed Accounts, LLC; Chairman and Director, Invesco Private Capital, Inc.; Chairman and Director, INVESCO Private Capital Investments, Inc.; Chairman and Director, INVESCO Realty, Inc.; and Senior Vice President, Invesco Group Services, Inc. Formerly: Senior Vice President, Invesco Management Group, Inc. and Invesco Advisers, Inc.; Assistant Vice President, The Invesco Funds | | N/A | | N/A |
Adrien Deberghes – 1967
Principal Financial Officer,
Treasurer and Vice President | | 2020 | | Head of the Fund Office of the CFO and Fund Administration; Vice President, Invesco Advisers, Inc.; Principal Financial Officer, Treasurer and Vice President, The Invesco Funds; Vice President, Invesco Exchange-Traded Fund Trust, Invesco Exchange-Traded Fund Trust II, Invesco India Exchange-Traded Fund Trust, Invesco Actively Managed Exchange-Traded Fund Trust, Invesco Actively Managed Exchange-Traded Commodity Fund Trust and Invesco Exchange-Traded Self-Indexed Fund Trust Formerly: Senior Vice President and Treasurer, Fidelity Investments | | N/A | | N/A |
Crissie M. Wisdom – 1969
Anti-Money Laundering
Compliance Officer | | 2013 | | Anti-Money Laundering and OFAC Compliance Officer for Invesco U.S. entities including: Invesco Advisers, Inc. and its affiliates, Invesco Capital Markets, Inc., Invesco Distributors, Inc., Invesco Investment Services, Inc., The Invesco Funds, Invesco Capital Management, LLC, Invesco Trust Company; and Fraud Prevention Manager for Invesco Investment Services, Inc. | | N/A | | N/A |
| | |
| T-5 | | Invesco Balanced-Risk Commodity Strategy Fund |
Trustees and Officers–(continued)
| | | | | | | | |
Name, Year of Birth and Position(s) Held with the Trust | | Trustee and/or Officer Since | | Principal Occupation(s) During Past 5 Years | | Number of
Funds in Fund Complex
Overseen by
Trustee | | Other Directorship(s) Held by Trustee During Past 5 Years |
| Officers–(continued) | | | | | | | | |
Todd F. Kuehl – 1969 Chief Compliance Officer and Senior Vice President | | 2020 | | Chief Compliance Officer, Invesco Advisers, Inc. (registered investment adviser); and Chief Compliance Officer and Senior Vice President, The Invesco Funds Formerly: Managing Director and Chief Compliance Officer, Legg Mason (Mutual Funds); Chief Compliance Officer, Legg Mason Private Portfolio Group (registered investment adviser) | | N/A | | N/A |
James Bordewick, Jr. – 1959 Senior Vice President and Senior Officer | | 2022 | | Senior Vice President and Senior Officer, The Invesco Funds; and Chief Legal Officer, KingsCrowd, Inc. (research and analytical platform for investment in private capital markets) Formerly, Chief Operating Officer and Head of Legal and Regulatory, Netcapital (private capital investment platform); Managing Director, General Counsel of asset management and Chief Compliance Officer for asset management and private banking, Bank of America Corporation; Chief Legal Officer, Columbia Funds and BofA Funds; Senior Vice President and Associate General Counsel, MFS Investment Management; Chief Legal Officer, MFS Funds; Associate, Ropes & Gray; Associate, Gaston Snow & Ely Bartlett | | N/A | | N/A |
The Statement of Additional Information of the Trust includes additional information about the Fund’s Trustees and is available upon request, without charge, by calling 1.800.959.4246. Please refer to the Fund’s Statement of Additional Information for information on the Fund’s sub-advisers.
| | | | | | |
| Office of the Fund | | Investment Adviser | | Distributor | | Auditors |
11 Greenway Plaza, Suite 1000 Houston, TX 77046-1173 | | Invesco Advisers, Inc. 1555 Peachtree Street, N.E. Atlanta, GA 30309 | | Invesco Distributors, Inc. 11 Greenway Plaza, Suite 1000 Houston, TX 77046-1173 | | PricewaterhouseCoopers LLP 1000 Louisiana Street, Suite 5800 Houston, TX 77002-5021 |
| | | |
| Counsel to the Fund | | Counsel to the Independent Trustees | | Transfer Agent | | Custodian |
Stradley Ronon Stevens & Young, LLP 2005 Market Street, Suite 2600 Philadelphia, PA 19103-7018 | | Goodwin Procter LLP 901 New York Avenue, N.W. Washington, D.C. 20001 | | Invesco Investment Services, Inc. 11 Greenway Plaza, Suite 1000 Houston, TX 77046-1173 | | State Street Bank and Trust Company 225 Franklin Street Boston, MA 02110-2801 |
| | |
| T-6 | | Invesco Balanced-Risk Commodity Strategy Fund |
(This page intentionally left blank)
(This page intentionally left blank)
(This page intentionally left blank)

Go paperless with eDelivery
Visit invesco.com/edelivery to enjoy the convenience and security of anytime electronic access to your investment documents.
With eDelivery, you can elect to have any or all of the following materials delivered straight to your inbox to download, save and print from your own computer:
∎ Fund reports and prospectuses
∎ Quarterly statements
∎ Daily confirmations
∎ Tax forms
Invesco mailing information
Send general correspondence to Invesco Investment Services, Inc., P.O. Box 219078, Kansas City, MO 64121-9078.
Important notice regarding delivery of security holder documents
To reduce Fund expenses, only one copy of most shareholder documents may be mailed to shareholders with multiple accounts at the same address (Householding). Mailing of your shareholder documents may be householded indefinitely unless you instruct us otherwise. If you do not want the mailing of these documents to be combined with those for other members of your household, please contact Invesco Investment Services, Inc. at 800 959 4246 or contact your financial institution. We will begin sending you individual copies for each account within 30 days after receiving your request.
Fund holdings and proxy voting information
The Fund provides a complete list of its portfolio holdings four times each year, at the end of each fiscal quarter. For the second and fourth quarters, the list appears, respectively, in the Fund’s semiannual and annual reports to shareholders. For the first and third quarters, the Fund files the list with the Securities and Exchange Commission (SEC) as an exhibit to its reports on Form N-PORT. The most recent list of portfolio holdings is available at invesco.com/completeqtrholdings. Shareholders can also look up the Fund’s Form N-PORT filings on the SEC website, sec.gov. The SEC file numbers for the Fund are shown below.
A description of the policies and procedures that the Fund uses to determine how to vote proxies relating to portfolio securities is available without charge, upon request, from our Client Services department at 800 959 4246, or at invesco.com/ corporate/about-us/esg. The information is also available on the SEC website, sec.gov.
Information regarding how the Fund voted proxies related to its portfolio securities during the most recent 12-month period ended June 30 is available at invesco.com/proxysearch. This information is also available on the SEC website, sec.gov.
Invesco Advisers, Inc. is an investment adviser; it provides investment advisory services to individual and institutional clients and does not sell securities. Invesco Distributors, Inc. is the US distributor for Invesco Ltd.’s retail mutual funds, exchange-traded funds and institutional money market funds. Both are wholly owned, indirect subsidiaries of Invesco Ltd.

| | | | |
| SEC file number(s): 811-05426 and 033-19338 | | Invesco Distributors, Inc. | | BRCS-AR-1 |

| | |
| | |
| Annual Report to Shareholders | | October 31, 2022 |
Invesco Core Bond Fund
Nasdaq:
A: OPIGX ∎ C: OPBCX ∎ R: OPBNX ∎ Y: OPBYX ∎ R5:TRTMX ∎ R6: OPBIX
Management’s Discussion of Fund Performance
| | | | |
| |
Performance summary For the fiscal year ended October 31, 2022, Class A shares of Invesco Core Bond Fund (the Fund), at net asset value (NAV), underperformed the Bloomberg U.S. Aggregate Bond Index. Your Fund’s long-term performance appears later in this report. | |
| | |
Fund vs. Indexes | | | | |
Total returns, 10/31/21 to 10/31/22, at net asset value (NAV). Performance shown does not include applicable contingent deferred sales charges (CDSC) or front-end sales charges, which would have reduced performance. | |
Class A Shares | | | -17.43 | % |
Class C Shares | | | -18.07 | |
Class R Shares | | | -17.68 | |
Class Y Shares | | | -17.21 | |
Class R5 Shares | | | -17.36 | |
Class R6 Shares | | | -17.22 | |
Bloomberg U.S. Aggregate Bond Index▼ | | | -15.68 | |
Bloomberg U.S. Credit Index▼ | | | -18.91 | |
FTSE Broad Investment Grade Bond Index▼ | | | -15.94 | |
Source(s): ▼RIMES Technologies Corp. | | | | |
Market conditions and your Fund
In the fourth quarter of 2021, concerns about inflation heightened as US inflation rose 7%,1 its highest level in nearly 40 years. Though the US Federal Reserve (the Fed) left policy rates unchanged during the quarter, the Fed indicated its accommodative policies were coming to an end in 2022 through a willingness to raise interest rates to combat inflation and the announced reduction of its monthly bond purchase program. Additionally, US interest rate moves and inflation risk significantly affected fixed income valuations during the quarter. The two-year Treasury yield rose moderately from 0.27% to 0.73%, while the 10-year increased slightly from 1.48% to 1.52% during the quarter.2 The yield curve, as measured by the yield differential between two- and 10-year Treasuries, flattened during the quarter.
At the beginning of 2022, geopolitical and economic tensions between Ukraine and Russia culminated with the latter invading Ukrai-nian territory. World leaders levied sanctions against Russia that had material effects on its fixed income markets, particularly sovereign debt and corporates, and levels of liquidity. The Russia-Ukraine war exacerbated inflationary pressures while also exerting downward pressure on economic growth through a surge in commodity/energy prices. Additionally, surges of COVID-19 in China exacerbated supply chain issues and aggravated inflation. During the second quarter of 2022, the two-year Treasury yield rose significantly from 0.78% to 2.28%, while the 10-year increased slightly from 1.63% to 2.32%.2
In the second quarter of 2022, the macro backdrop of tightening financial conditions and slowing economic growth was negative for credit asset classes. Inflation, as measured by the Consumer Price Index, increased further to 9.1% and fixed income markets
experienced significant negative performance as all bond sectors felt the impact of rising interest rates with negative performance ranging from -0.9% (Bloomberg Asset-Backed Securities) to -9.8% (Bloomberg US Corporate High Yield).3 Credit spreads increased across all major credit-sensitive sectors, reflecting anticipation of an economic slowdown and increasing concerns about recession risk, with corporate spreads ending the second quarter above their long-term historical average. The Fed continued its rapid tightening of monetary policy in an effort to combat inflation via higher interest rates while simultaneously engineering a soft landing so as to not push the economy into a recession. The Fed aggressively raised its key Fed funds rate during the fiscal year, including a 0.50% hike in May, and three 0.75% hikes in June, July and November, the largest hikes since 1994, to a target Fed funds rate of 3.75-4.00%, the highest since 2008.4 At their November 2022 meeting, the Fed signaled that its hawkish policies would continue, though a slowing of the pace of rate increases was likely. While rates remained elevated across all maturities on the yield curve, the two-year Treasury rates increased from 2.92% to 4.51% during the fiscal year, while 10-year Treasury rates increased from 2.98% to 4.10%.2 At the end of the fiscal year, the yield curve remained inverted, which historically has been an indicator of a potential recession.
The Fund, at NAV, generated negative returns for the fiscal year and underperformed its broad market/style-specific benchmark. Overweight exposure to investment-grade corporates and underweight exposure to Treasuries were the most notable detractors from the Fund’s relative performance. Outperformance from the securitized sector was driven by security selection, specifically within the mortgage-backed securities sector. Secu-
rity selection in utilities sectors also contributed to the Fund’s relative performance during the fiscal year while security selection in industrial and financial institution sectors detracted from relative performance.
Overweight exposure to and security selection in commercial mortgage-backed securities, particularly conduit and single borrower issues, contributed to the Fund’s outperformance relative to its broad market/style-specific benchmark during the fiscal year. The Fund’s out-of-index exposure to US dollar-denominated emerging market (EM) corporate debt during the fiscal year also contributed to the Fund’s relative performance. Helping to support returns in US dollar-denominated EM corporate debt were accommodative central bank policies in the first half of the fiscal year.
The Fund’s allocation to cash holdings slightly contributed to relative Fund performance during the fiscal year as a result of rising Treasury rates.
The Fund benefited from incremental income earned from transactions in the highly liquid to-be-announced market for agency mortgage-backed securities (MBS). Such transactions involve the Fund selling an MBS to a financial institution, with an agreement to repurchase a substantially similar security at an agreed upon price and date. Cash received by the Fund as a result of this repurchase transaction may be invested in short-term instruments and the income from these investments, together with any additional fee income received from this activity, generates income for the Fund.
The Fund may use active duration and yield curve positioning for risk management and for generating excess return versus its broad market/style-specific benchmark. Duration measures a portfolio’s price sensitivity to interest rate changes. Yield curve positioning refers to actively emphasizing particular points (maturities) along the yield curve with favorable risk-return expectations. Duration of the portfolio was maintained close to that of the broad market/style-specific benchmark, on average and the timing of changes and the degree of variance from the Fund’s broad market/style-specific benchmark during the fiscal year detracted from relative returns, particularly amongst 7- to 10-year maturity securities. Buying and selling US Treasury futures and interest rate swaptions were important tools used for the management of interest rate risk and to maintain our targeted portfolio duration.
Part of the Fund’s strategy to manage credit and currency risk in the portfolio during the fiscal year entailed purchasing and selling credit and currency derivatives. We sought to manage credit market risk by purchasing and selling protection through credit default swaps at various points throughout the fiscal year. The currency management was carried out via currency forwards and options on an
as-needed basis and we believe this was effective in managing the currency positioning within the Fund.
We wish to remind you that the Fund is subject to interest rate risk, meaning when interest rates rise, the value of fixed-income securities tends to fall. The risk may be greater in the current market environment. The degree to which the value of fixed-income securities may decline due to rising interest rates may vary depending on the speed and magnitude of the increase in interest rates, as well as individual security characteristics, such as price, maturity, duration and coupon and market forces, such as supply and demand for similar securities. We are monitoring interest rates, as well as the market, economic and geopolitical factors that may impact the direction, speed and magnitude of changes to interest rates across the maturity spectrum, including the potential impact of monetary policy changes by the Fed and certain foreign central banks. If interest rates rise or fall faster than expected, markets may experience increased volatility, which may affect the value and/or liquidity of certain of the Fund’s investments.
Thank you for investing in Invesco Core Bond Fund and for sharing our long-term investment horizon.
| 1 | Source: US Bureau of Labor Statistics |
| 2 | Source: US Department of the Treasury |
| 4 | Source: Federal Reserve of Economic Data |
Portfolio manager(s):
Matt Brill
Michael Hyman
Todd Schomberg
The views and opinions expressed in management’s discussion of Fund performance are those of Invesco Advisers, Inc. and its affiliates. These views and opinions are subject to change at any time based on factors such as market and economic conditions. These views and opinions may not be relied upon as investment advice or recommendations, or as an offer for a particular security. The information is not a complete analysis of every aspect of any market, country, industry, security or the Fund. Statements of fact are from sources considered reliable, but Invesco Advisers, Inc. makes no representation or warranty as to their completeness or accuracy. Although historical performance is no guarantee of future results, these insights may help you understand our investment management philosophy.
See important Fund and, if applicable, index disclosures later in this report.
Your Fund’s Long-Term Performance
Results of a $10,000 Investment – Oldest Share Class(es)
Fund and index data from 10/31/12
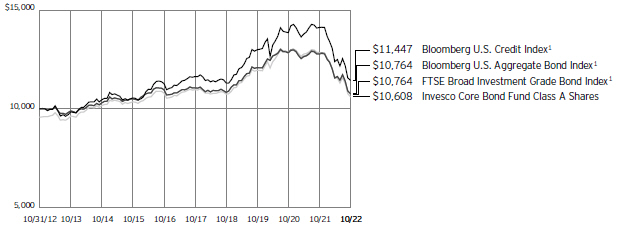
| 1 | Source: RIMES Technologies Corp. |
Past performance cannot guarantee future results.
The data shown in the chart include reinvested distributions, applicable sales charges and Fund expenses including management
fees. Index results include reinvested dividends, but they do not reflect sales charges. Performance of the peer group, if applicable, reflects fund expenses and management fees;
performance of a market index does not. Performance shown in the chart does not reflect deduction of taxes a shareholder would pay on Fund distributions or sale of Fund shares.
| | | | |
| |
Average Annual Total Returns | |
As of 10/31/22, including maximum applicable sales charges | |
| |
Class A Shares | | | | |
Inception (4/15/88) | | | 3.59 | % |
10 Years | | | 0.59 | |
5 Years | | | -1.52 | |
1 Year | | | -20.90 | |
| |
Class C Shares | | | | |
Inception (7/11/95) | | | 2.20 | % |
10 Years | | | 0.39 | |
5 Years | | | -1.48 | |
1 Year | | | -18.88 | |
| |
Class R Shares | | | | |
Inception (3/1/01) | | | 1.31 | % |
10 Years | | | 0.72 | |
5 Years | | | -0.99 | |
1 Year | | | -17.68 | |
| |
Class Y Shares | | | | |
Inception (4/27/98) | | | 2.23 | % |
10 Years | | | 1.25 | |
5 Years | | | -0.40 | |
1 Year | | | -17.21 | |
| |
Class R5 Shares | | | | |
10 Years | | | 1.11 | % |
5 Years | | | -0.51 | |
1 Year | | | -17.36 | |
| |
Class R6 Shares | | | | |
Inception (4/27/12) | | | 1.87 | % |
10 Years | | | 1.38 | |
5 Years | | | -0.34 | |
1 Year | | | -17.22 | |
Effective May 24, 2019, Class A, Class C, Class R, Class Y and Class I shares of the Oppenheimer Total Return Bond Fund, (the predecessor fund), were reorganized into Class A, Class C, Class R, Class Y and Class R6 shares, respectively, of the Invesco Oppenheimer Total Return Bond Fund. Note: The Fund was subsequently renamed the Invesco Core Bond Fund (the Fund). Returns shown above, for periods ending on or prior to May 24, 2019, for Class A, Class C, Class R, Class Y and Class R6 shares are those for Class A, Class C, Class R, Class Y and Class I shares of the predecessor fund. Share class returns will differ from the predecessor fund because of different expenses.
Class R5 shares incepted on May 24, 2019. Performance shown on and prior to that date is that of the predecessor fund’s Class A shares and includes the 12b-1 fees applicable to Class A shares.
The performance data quoted represent past performance and cannot guarantee future results; current performance may be lower or higher. Please visit invesco.com/ performance for the most recent month-end performance. Performance figures reflect reinvested distributions, changes in net asset value and the effect of the maximum sales charge unless otherwise stated. Performance figures do not reflect deduc-
tion of taxes a shareholder would pay on Fund distributions or sale of Fund shares. Investment return and principal value will fluctuate so that you may have a gain or loss when you sell shares.
Class A share performance reflects the maximum 4.25% sales charge, and Class C share performance reflects the applicable contingent deferred sales charge (CDSC) for the period involved. The CDSC on Class C shares is 1% for the first year after purchase. Class R, Class Y, Class R5 and Class R6 shares do not have a front-end sales charge or a CDSC; therefore, performance is at net asset value.
The performance of the Fund’s share classes will differ primarily due to different sales charge structures and class expenses.
Fund performance reflects any applicable fee waivers and/or expense reimbursements. Had the adviser not waived fees and/or reimbursed expenses currently or in the past, returns would have been lower. See current prospectus for more information.
Supplemental Information
Invesco Core Bond Fund’s investment objective is to seek total return.
| ∎ | | Unless otherwise stated, information presented in this report is as of October 31, 2022, and is based on total net assets. |
| ∎ | | Unless otherwise noted, all data is provided by Invesco. |
| ∎ | | To access your Fund’s reports/prospectus, visit invesco.com/fundreports. |
About indexes used in this report
| ∎ | | The Bloomberg U.S. Aggregate Bond Index is an unmanaged index considered representative of the US investment-grade, fixed-rate bond market. |
| ∎ | | The Bloomberg U.S. Credit Index is an unmanaged index considered representative of publicly issued, SEC-registered US corporate and specified foreign debentures and secured notes. |
| ∎ | | The FTSE Broad Investment Grade Bond Index is a multi-asset, multi-currency benchmark that provides a broad-based measure of the global fixed income markets. |
| ∎ | | The Fund is not managed to track the performance of any particular index, including the index(es) described here, and consequently, the performance of the Fund may deviate significantly from the performance of the index(es). |
| ∎ | | A direct investment cannot be made in an index. Unless otherwise indicated, index results include reinvested dividends, and they do not reflect sales charges. Performance of the peer group, if applicable, reflects fund expenses; performance of a market index does not. |
|
This report must be accompanied or preceded by a currently effective Fund prospectus, which contains more complete information, including sales charges and expenses. Investors should read it carefully before investing. |
NOT FDIC INSURED | MAY LOSE VALUE | NO BANK GUARANTEE |
Fund Information
| | | | | | |
| Portfolio Composition | | | | |
| By security type | | % of total investments |
| |
U.S. Dollar Denominated Bonds & Notes | | | 42.74 | % |
Asset-Backed Securities | | | 22.76 | |
U.S. Government Sponsored Agency Mortgage- Backed Securities | | | 21.00 | |
U.S. Treasury Securities | | | 5.87 | |
Security types each less than 1% of portfolio | | | 1.26 | |
Money Market Funds | | | 6.37 | |
Top Five Debt Issuers* | | | | |
| | | | | % of total net assets |
1. Federal National Mortgage Association | | | 21.30 | % |
2. U.S. Treasury | | | 7.29 | |
3. Government National Mortgage Association | | | 3.97 | |
4. Bank of America Corp. | | | 1.80 | |
5. PNC Financial Services Group, Inc. (The) | | | 1.66 | |
The Fund’s holdings are subject to change, and there is no assurance that the Fund will continue to hold any particular security.
* Excluding money market fund holdings, if any.
Data presented here are as of October 31, 2022.
Schedule of Investments(a)
October 31, 2022
| | | | | | | | |
| | | Principal
Amount | | | Value | |
U.S. Dollar Denominated Bonds & Notes–53.10% | |
Aerospace & Defense–1.09% | | | | | | | | |
Huntington Ingalls Industries, Inc., 3.84%, 05/01/2025 | | $ | 4,676,000 | | | $ | 4,454,781 | |
Lockheed Martin Corp., | | | | | | | | |
4.95%, 10/15/2025 | | | 2,285,000 | | | | 2,288,371 | |
5.10%, 11/15/2027 | | | 2,143,000 | | | | 2,148,867 | |
5.25%, 01/15/2033 | | | 2,559,000 | | | | 2,568,745 | |
4.15%, 06/15/2053 | | | 1,006,000 | | | | 804,690 | |
5.70%, 11/15/2054 | | | 1,556,000 | | | | 1,569,840 | |
4.30%, 06/15/2062 | | | 1,204,000 | | | | 963,131 | |
5.90%, 1’1/15/2063 | | | 1,556,000 | | | | 1,584,769 | |
| | | | | | | | 16,383,194 | |
| |
Agricultural & Farm Machinery–0.96% | | | | | |
Cargill, Inc., | | | | | | | | |
4.88%, 10/10/2025(b) | | | 2,604,000 | | | | 2,583,656 | |
3.63%, 04/22/2027(b) | | | 1,384,000 | | | | 1,298,304 | |
4.00%, 06/22/2032(b) | | | 1,672,000 | | | | 1,497,477 | |
5.13%, 10/11/2032(b) | | | 1,440,000 | | | | 1,405,647 | |
4.38%, 04/22/2052(b) | | | 1,208,000 | | | | 983,716 | |
CNH Industrial Capital LLC, 5.45%, 10/14/2025 | | | 3,516,000 | | | | 3,479,579 | |
John Deere Capital Corp., 4.55%, 10/11/2024 | | | 3,213,000 | | | | 3,197,967 | |
| | | | | | | | 14,446,346 | |
| | |
Airlines–0.62% | | | | | | | | |
American Airlines Pass-Through Trust, | | | | | | | | |
Series 2021-1, Class B, 3.95%, 07/11/2030 | | | 2,048,000 | | | | 1,606,977 | |
Series 2021-1, Class A, 2.88%, 07/11/2034 | | | 2,217,000 | | | | 1,732,017 | |
Delta Air Lines, Inc./SkyMiles IP Ltd., | | | | | | | | |
4.50%, 10/20/2025(b) | | | 1,494,193 | | | | 1,456,601 | |
4.75%, 10/20/2028(b) | | | 2,816,504 | | | | 2,622,030 | |
United Airlines Pass-Through Trust, | | | | | | | | |
Series 2020-1, Class A, 5.88%, 10/15/2027 | | | 1,926,954 | | | | 1,862,266 | |
Series 2019-2, Class AA, 2.70%, 05/01/2032 | | | 15,471 | | | | 12,305 | |
| | | | | | | | 9,292,196 | |
| | |
Apparel Retail–0.11% | | | | | | | | |
Ross Stores, Inc., 3.38%, 09/15/2024 | | | 1,657,000 | | | | 1,600,896 | |
| | |
Application Software–0.10% | | | | | | | | |
salesforce.com, inc., 2.90%, 07/15/2051 | | | 2,399,000 | | | | 1,548,632 | |
| |
Asset Management & Custody Banks–1.20% | | | | | |
Bank of New York Mellon Corp. (The), | | | | | | | | |
4.41%, 07/24/2026(c) | | | 3,274,000 | | | | 3,181,891 | |
4.60%, 07/26/2030(c) | | | 779,000 | | | | 731,387 | |
5.83%, 10/25/2033(c) | | | 2,278,000 | | | | 2,283,135 | |
Blackstone Holdings Finance Co. LLC, 6.20%, 04/22/2033(b) | | | 5,838,000 | | | | 5,827,959 | |
| | | | | | | | |
| | | Principal
Amount | | | Value | |
Asset Management & Custody Banks–(continued) | |
Blackstone Secured Lending Fund, | | | | | | | | |
2.13%, 02/15/2027 | | $ | 2,121,000 | | | $ | 1,713,834 | |
2.85%, 09/30/2028 | | | 1,242,000 | | | | 949,472 | |
Northern Trust Corp., 6.13%, 11/02/2032 | | | 2,672,000 | | | | 2,677,504 | |
State Street Corp., 4.16%, 08/04/2033(c) | | | 786,000 | | | | 696,801 | |
| | | | | | | | 18,061,983 | |
|
Automobile Manufacturers–1.69% | |
BMW US Capital LLC (Germany), | | | | | | | | |
3.89% (SOFR + 0.84%), 04/01/2025(b)(d) | | | 901,000 | | | | 896,671 | |
3.45%, 04/01/2027(b) | | | 1,281,000 | | | | 1,182,889 | |
3.70%, 04/01/2032(b) | | | 1,438,000 | | | | 1,236,145 | |
General Motors Financial Co., Inc., | | | | | | | | |
4.15%, 06/19/2023 | | | 1,230,000 | | | | 1,219,859 | |
3.80%, 04/07/2025 | | | 1,304,000 | | | | 1,233,209 | |
6.05%, 10/10/2025 | | | 5,431,000 | | | | 5,388,456 | |
5.00%, 04/09/2027 | | | 1,961,000 | | | | 1,854,786 | |
Hyundai Capital America, | |
5.75%, 04/06/2023(b) | | | 1,342,000 | | | | 1,342,985 | |
4.13%, 06/08/2023(b) | | | 1,635,000 | | | | 1,619,399 | |
2.00%, 06/15/2028(b) | | | 1,652,000 | | | | 1,286,737 | |
Nissan Motor Acceptance Co. LLC, 1.85%, 09/16/2026(b) | | | 1,754,000 | | | | 1,377,405 | |
PACCAR Financial Corp., 4.95%, 10/03/2025 | | | 3,562,000 | | | | 3,559,624 | |
Stellantis Finance US, Inc., 6.38%, 09/12/2032(b) | | | 1,032,000 | | | | 956,993 | |
Toyota Motor Credit Corp., 4.55%, 09/20/2027 | | | 2,351,000 | | | | 2,288,598 | |
| | | | | | | | 25,443,756 | |
| | |
Automotive Retail–0.22% | | | | | | | | |
Advance Auto Parts, Inc., 1.75%, 10/01/2027 | | | 2,451,000 | | | | 2,003,360 | |
AutoZone, Inc., 4.75%, 08/01/2032 | | | 1,482,000 | | | | 1,379,158 | |
| | | | | | | | 3,382,518 | |
| | |
Biotechnology–0.54% | | | | | | | | |
AbbVie, Inc., | |
3.85%, 06/15/2024 | | | 1,571,000 | | | | 1,539,218 | |
3.20%, 05/14/2026 | | | 4,350,000 | | | | 4,056,053 | |
CSL Finance PLC (Australia), | |
3.85%, 04/27/2027(b) | | | 779,000 | | | | 734,591 | |
4.05%, 04/27/2029(b) | | | 598,000 | | | | 549,798 | |
4.63%, 04/27/2042(b) | | | 593,000 | | | | 501,014 | |
4.75%, 04/27/2052(b) | | | 913,000 | | | | 767,596 | |
| | | | | | | | 8,148,270 | |
See accompanying Notes to Financial Statements which are an integral part of the financial statements.
| | | | | | | | |
| | | Principal
Amount | | | Value | |
Cable & Satellite–0.97% | |
Charter Communications Operating LLC/Charter Communications Operating Capital Corp., | | | | | | | | |
6.09% (3 mo. USD LIBOR + 1.65%), 02/01/2024(d) | | $ | 1,657,000 | | | $ | 1,668,175 | |
4.91%, 07/23/2025 | | | 4,350,000 | | | | 4,225,785 | |
3.50%, 06/01/2041 | | | 1,116,000 | | | | 706,724 | |
3.50%, 03/01/2042 | | | 1,922,000 | | | | 1,203,925 | |
3.90%, 06/01/2052 | | | 1,514,000 | | | | 940,274 | |
3.85%, 04/01/2061 | | | 1,597,000 | | | | 923,686 | |
Comcast Corp., | | | | | | | | |
5.25%, 11/07/2025 | | | 767,000 | | | | 766,793 | |
5.50%, 11/15/2032 | | | 4,203,000 | | | | 4,176,437 | |
| | | | | | | | 14,611,799 | |
|
Construction Machinery & Heavy Trucks–0.18% | |
Komatsu Finance America, Inc., 5.50%, 10/06/2027(b) | | | 2,647,000 | | | | 2,645,882 | |
| | |
Consumer Finance–0.31% | | | | | | | | |
American Express Co., | | | | | | | | |
4.99%, 05/26/2033(c) | | | 1,769,000 | | | | 1,607,387 | |
4.42%, 08/03/2033(c) | | | 3,407,000 | | | | 3,020,290 | |
| | | | | | | | 4,627,677 | |
|
Data Processing & Outsourced Services–0.58% | |
Fidelity National Information Services, Inc., | | | | | | | | |
4.70%, 07/15/2027 | | | 3,756,000 | | | | 3,596,247 | |
5.10%, 07/15/2032 | | | 3,756,000 | | | | 3,539,843 | |
PayPal Holdings, Inc., 5.05%, 06/01/2052 | | | 1,758,000 | | | | 1,526,871 | |
| | | | | | | | 8,662,961 | |
| | |
Distributors–0.08% | | | | | | | | |
Genuine Parts Co., 2.75%, 02/01/2032 | | | 1,593,000 | | | | 1,236,316 | |
| | |
Diversified Banks–10.45% | | | | | | | | |
Australia & New Zealand Banking Group Ltd. (Australia),
6.75%(b)(c)(e) | | | 2,590,000 | | | | 2,482,625 | |
Bank of America Corp., | | | | | | | | |
2.46%, 10/22/2025(c) | | | 7,536,000 | | | | 7,035,339 | |
4.38%, 04/27/2028(c) | | | 3,188,000 | | | | 2,967,012 | |
4.95%, 07/22/2028(c) | | | 2,270,000 | | | | 2,167,051 | |
2.69%, 04/22/2032(c) | | | 2,423,000 | | | | 1,875,604 | |
2.57%, 10/20/2032(c) | | | 1,463,000 | | | | 1,105,473 | |
2.97%, 02/04/2033(c) | | | 1,639,000 | | | | 1,272,314 | |
4.57%, 04/27/2033(c) | | | 2,655,000 | | | | 2,356,548 | |
5.02%, 07/22/2033(c) | | | 3,104,000 | | | | 2,850,205 | |
3.85%, 03/08/2037(c) | | | 655,000 | | | | 525,576 | |
Series TT, 6.13%(c)(e) | | | 5,314,000 | | | | 5,035,015 | |
Bank of Nova Scotia (The) (Canada), 8.63%, 10/27/2082(c) | | | 4,065,000 | | | | 4,089,862 | |
Barclays PLC (United Kingdom), | | | | | | | | |
7.44%, 11/02/2033(c) | | | 4,430,000 | | | | 4,425,452 | |
8.00%(c)(e) | | | 3,057,000 | | | | 2,746,268 | |
BPCE S.A. (France), 3.63% (SOFR + 0.57%),
01/14/2025(b)(d) | | | 2,634,000 | | | | 2,570,295 | |
| | | | | | | | |
| | | Principal
Amount | | | Value | |
Diversified Banks–(continued) | | | | | | | | |
Citigroup, Inc., | | | | | | | | |
5.61%, 09/29/2026(c) | | $ | 5,667,000 | | | $ | 5,595,702 | |
4.66%, 05/24/2028(c) | | | 1,609,000 | | | | 1,518,993 | |
4.41%, 03/31/2031(c) | | | 991,000 | | | | 885,461 | |
2.56%, 05/01/2032(c) | | | 1,557,000 | | | | 1,188,169 | |
2.52%, 11/03/2032(c) | | | 969,000 | | | | 726,101 | |
3.06%, 01/25/2033(c) | | | 864,000 | | | | 674,146 | |
3.79%, 03/17/2033(c) | | | 3,184,000 | | | | 2,641,442 | |
4.91%, 05/24/2033(c) | | | 1,829,000 | | | | 1,664,062 | |
2.90%, 11/03/2042(c) | | | 1,464,000 | | | | 927,095 | |
Citizens Bank N.A., 6.06%, 10/24/2025(c) | | | 5,626,000 | | | | 5,668,512 | |
Cooperatieve Rabobank U.A. (Netherlands), | | | | | | | | |
4.66%, 08/22/2028(b)(c) | | | 2,613,000 | | | | 2,418,955 | |
3.76%, 04/06/2033(b)(c) | | | 2,178,000 | | | | 1,756,555 | |
Fifth Third Bank N.A., | | | | | | | | |
5.85%, 10/27/2025(c) | | | 5,937,000 | | | | 5,946,927 | |
3.85%, 03/15/2026 | | | 983,000 | | | | 917,871 | |
HSBC Holdings PLC (United Kingdom), | | | | | | | | |
5.21%, 08/11/2028(c) | | | 2,416,000 | | | | 2,213,988 | |
5.40%, 08/11/2033(c) | | | 3,426,000 | | | | 2,975,152 | |
8.11%, 11/03/2033(c) | | | 4,477,000 | | | | 4,474,602 | |
JPMorgan Chase & Co., | | | | | | | | |
3.80%, 07/23/2024(c) | | | 1,481,000 | | | | 1,460,107 | |
2.08%, 04/22/2026(c) | | | 1,526,000 | | | | 1,389,962 | |
4.32%, 04/26/2028(c) | | | 3,147,000 | | | | 2,929,714 | |
4.85%, 07/25/2028(c) | | | 2,415,000 | | | | 2,297,610 | |
4.59%, 04/26/2033(c) | | | 1,901,000 | | | | 1,695,556 | |
4.91%, 07/25/2033(c) | | | 3,701,000 | | | | 3,370,633 | |
5.72%, 09/14/2033(c) | | | 5,096,000 | | | | 4,758,228 | |
KeyBank N.A., | | | | | | | | |
3.40%, 05/20/2026 | | | 1,304,000 | | | | 1,202,970 | |
4.90%, 08/08/2032 | | | 3,322,000 | | | | 2,948,743 | |
Mitsubishi UFJ Financial Group, Inc. (Japan), | | | | | | | | |
4.79%, 07/18/2025(c) | | | 7,913,000 | | | | 7,765,054 | |
5.02%, 07/20/2028(c) | | | 2,250,000 | | | | 2,139,803 | |
1.80%, 07/20/2033(c) | | | 2,859,000 | | | | 2,598,911 | |
Mizuho Financial Group, Inc. (Japan), 5.67%, 09/13/2033(c) | | | 3,579,000 | | | | 3,355,130 | |
Nordea Bank Abp (Finland), | | | | | | | | |
4.75%, 09/22/2025(b) | | | 3,029,000 | | | | 2,969,068 | |
5.38%, 09/22/2027(b) | | | 1,629,000 | | | | 1,570,987 | |
Standard Chartered PLC (United Kingdom), | | | | | | | | |
2.68%, 06/29/2032(b)(c) | | | 1,468,000 | | | | 1,028,650 | |
7.75%(b)(c)(e) | | | 3,784,000 | | | | 3,467,090 | |
Sumitomo Mitsui Financial Group, Inc. (Japan), 2.22%, 09/17/2031 | | | 2,211,000 | | | | 1,621,167 | |
Swedbank AB (Sweden), 5.34%, 09/20/2027(b) | | | 1,927,000 | | | | 1,835,327 | |
Toronto-Dominion Bank (The) (Canada), 8.13%, 10/31/2082(c) | | | 3,343,000 | | | | 3,388,966 | |
Truist Bank, 2.64%, 09/17/2029(c) | | | 1,855,000 | | | | 1,717,907 | |
See accompanying Notes to Financial Statements which are an integral part of the financial statements.
| | | | | | | | |
| | | Principal
Amount | | | Value | |
Diversified Banks–(continued) | |
U.S. Bancorp, | | | | | | | | |
4.55%, 07/22/2028(c) | | $ | 2,408,000 | | | $ | 2,290,499 | |
4.97%, 07/22/2033(c) | | | 1,838,000 | | | | 1,676,186 | |
5.85%, 10/21/2033(c) | | | 3,621,000 | | | | 3,611,976 | |
2.49%, 11/03/2036(c) | | | 3,525,000 | | | | 2,587,074 | |
Wells Fargo & Co., | | | | | | | | |
3.53%, 03/24/2028(c) | | | 1,629,000 | | | | 1,468,121 | |
4.81%, 07/25/2028(c) | | | 1,393,000 | | | | 1,320,362 | |
4.90%, 07/25/2033(c) | | | 1,366,000 | | | | 1,251,359 | |
4.61%, 04/25/2053(c) | | | 2,300,000 | | | | 1,837,954 | |
| | | | | | | | 157,253,486 | |
|
Diversified Capital Markets–1.25% | |
Credit Suisse AG (Switzerland), | | | | | | | | |
3.63%, 09/09/2024 | | | 1,315,000 | | | | 1,222,644 | |
5.00%, 07/09/2027 | | | 3,834,000 | | | | 3,450,637 | |
Credit Suisse Group AG (Switzerland), | | | | | | | | |
4.55%, 04/17/2026 | | | 1,392,000 | | | | 1,222,090 | |
6.44%, 08/11/2028(b)(c) | | | 3,663,000 | | | | 3,309,065 | |
4.19%, 04/01/2031(b)(c) | | | 1,365,000 | | | | 1,055,490 | |
3.09%, 05/14/2032(b)(c) | | | 1,255,000 | | | | 862,154 | |
6.54%, 08/12/2033(b)(c) | | | 5,136,000 | | | | 4,477,162 | |
UBS Group AG (Switzerland), | | | | | | | | |
4.13%, 04/15/2026(b) | | | 1,014,000 | | | | 946,142 | |
4.75%, 05/12/2028(b)(c) | | | 2,521,000 | | | | 2,312,045 | |
| | | | | | | | 18,857,429 | |
| | |
Diversified Chemicals–0.78% | | | | | | | | |
Celanese US Holdings LLC, | | | | | | | | |
5.90%, 07/05/2024 | | | 3,140,000 | | | | 3,086,261 | |
6.05%, 03/15/2025 | | | 3,361,000 | | | | 3,270,167 | |
6.17%, 07/15/2027 | | | 3,516,000 | | | | 3,319,847 | |
6.38%, 07/15/2032 | | | 2,332,000 | | | | 2,124,946 | |
| | | | | | | | 11,801,221 | |
| | |
Diversified REITs–0.67% | | | | | | | | |
VICI Properties L.P., | | | | | | | | |
4.75%, 02/15/2028 | | | 2,137,000 | | | | 1,950,002 | |
4.95%, 02/15/2030 | | | 2,137,000 | | | | 1,934,278 | |
5.13%, 05/15/2032 | | | 1,550,000 | | | | 1,376,865 | |
VICI Properties L.P./VICI Note Co., Inc., 5.63%, 05/01/2024(b) | | | 4,874,000 | | | | 4,817,023 | |
| | | | | | | | 10,078,168 | |
| | |
Electric Utilities–2.25% | | | | | | | | |
AEP Texas, Inc., | | | | | | | | |
3.95%, 06/01/2028(b) | | | 2,489,000 | | | | 2,256,753 | |
4.70%, 05/15/2032 | | | 881,000 | | | | 802,888 | |
5.25%, 05/15/2052 | | | 1,283,000 | | | | 1,121,513 | |
American Electric Power Co., Inc., | | | | | | | | |
5.75%, 11/01/2027 | | | 2,149,000 | | | | 2,143,305 | |
5.95%, 11/01/2032 | | | 1,560,000 | | | | 1,549,345 | |
Duke Energy Corp., | | | | | | | | |
4.30%, 03/15/2028 | | | 1,658,000 | | | | 1,559,971 | |
5.00%, 08/15/2052 | | | 2,612,000 | | | | 2,166,282 | |
EDP Finance B.V. (Portugal), 6.30%, 10/11/2027(b) | | | 912,000 | | | | 908,936 | |
Enel Finance America LLC (Italy), 7.10%, 10/14/2027(b) | | | 1,014,000 | | | | 1,011,656 | |
| | | | | | | | |
| | | Principal
Amount | | | Value | |
Electric Utilities–(continued) | | | | | | | | |
Enel Finance International N.V. (Italy), | | | | | | | | |
6.80%, 10/14/2025(b) | | $ | 2,054,000 | | | $ | 2,063,872 | |
7.50%, 10/14/2032(b) | | | 1,318,000 | | | | 1,321,947 | |
7.75%, 10/14/2052(b) | | | 1,602,000 | | | | 1,538,595 | |
National Rural Utilities Cooperative Finance Corp., | | | | | | | | |
2.75%, 04/15/2032 | | | 1,720,000 | | | | 1,381,069 | |
5.80%, 01/15/2033 | | | 1,513,000 | | | | 1,532,869 | |
NextEra Energy Capital Holdings, Inc., | | | | | | | | |
4.63%, 07/15/2027 | | | 3,241,000 | | | | 3,118,175 | |
5.00%, 07/15/2032 | | | 1,021,000 | | | | 971,200 | |
Southern Co. (The), | | | | | | | | |
5.15%, 10/06/2025 | | | 1,560,000 | | | | 1,553,881 | |
5.70%, 10/15/2032 | | | 1,521,000 | | | | 1,505,366 | |
Tampa Electric Co., | | | | | | | | |
3.88%, 07/12/2024 | | | 1,781,000 | | | | 1,735,880 | |
5.00%, 07/15/2052 | | | 1,046,000 | | | | 920,436 | |
Virginia Electric and Power Co., | | | | | | | | |
Series B, 3.75%, 05/15/2027 | | | 1,387,000 | | | | 1,301,832 | |
Series C, 4.63%, 05/15/2052 | | | 1,608,000 | | | | 1,337,690 | |
| | | | | | | | 33,803,461 | |
| |
Electrical Components & Equipment–0.46% | | | | | |
CenterPoint Energy Houston Electric LLC, | | | | | | | | |
Series AI, 4.45%, 10/01/2032 | | | 3,746,000 | | | | 3,515,052 | |
Series AJ, 4.85%, 10/01/2052 | | | 3,783,000 | | | | 3,337,490 | |
| | | | | | | | 6,852,542 | |
| |
Electronic Equipment & Instruments–0.08% | | | | | |
Vontier Corp., 2.95%, 04/01/2031 | | | 1,614,000 | | | | 1,135,433 | |
|
Financial Exchanges & Data–1.15% | |
Cboe Global Markets, Inc., 3.00%, 03/16/2032 | | | 3,897,000 | | | | 3,159,294 | |
Intercontinental Exchange, Inc., | | | | | | | | |
4.00%, 09/15/2027 | | | 2,305,000 | | | | 2,187,416 | |
4.35%, 06/15/2029 | | | 1,777,000 | | | | 1,684,914 | |
4.60%, 03/15/2033 | | | 1,548,000 | | | | 1,423,237 | |
4.95%, 06/15/2052 | | | 2,123,000 | | | | 1,842,162 | |
5.20%, 06/15/2062 | | | 1,609,000 | | | | 1,439,140 | |
Moody’s Corp., | | | | | | | | |
2.00%, 08/19/2031 | | | 1,300,000 | | | | 983,932 | |
4.25%, 08/08/2032 | | | 894,000 | | | | 806,169 | |
2.75%, 08/19/2041 | | | 1,482,000 | | | | 960,399 | |
3.75%, 02/25/2052 | | | 1,426,000 | | | | 1,009,453 | |
3.10%, 11/29/2061 | | | 3,249,000 | | | | 1,880,202 | |
| | | | | | | | 17,376,318 | |
|
General Merchandise Stores–0.42% | |
Dollar General Corp., | | | | | | | | |
4.63%, 11/01/2027 | | | 1,088,000 | | | | 1,051,495 | |
5.00%, 11/01/2032 | | | 958,000 | | | | 913,450 | |
5.50%, 11/01/2052 | | | 1,913,000 | | | | 1,778,363 | |
Target Corp., 4.50%, 09/15/2032 | | | 2,758,000 | | | | 2,603,974 | |
| | | | | | | | 6,347,282 | |
See accompanying Notes to Financial Statements which are an integral part of the financial statements.
| | |
| 10 | | Invesco Core Bond Fund |
| | | | | | | | |
| | | Principal
Amount | | | Value | |
Health Care Services–0.50% | |
Piedmont Healthcare, Inc., | | | | | | | | |
Series 2032, 2.04%, 01/01/2032 | | $ | 1,105,000 | | | $ | 820,313 | |
Series 2042, 2.72%, 01/01/2042 | | | 1,067,000 | | | | 681,502 | |
2.86%, 01/01/2052 | | | 1,219,000 | | | | 703,471 | |
Providence St. Joseph Health Obligated Group, Series 21-A, 2.70%, 10/01/2051 | | | 3,254,000 | | | | 1,744,777 | |
Roche Holdings, Inc., 2.31%, 03/10/2027(b) | | | 3,996,000 | | | | 3,569,302 | |
| | | | | | | | 7,519,365 | |
| |
Home Improvement Retail–1.00% | | | | | |
Home Depot, Inc. (The), | | | | | | | | |
4.50%, 09/15/2032 | | | 2,753,000 | | | | 2,611,977 | |
4.95%, 09/15/2052 | | | 1,391,000 | | | | 1,252,129 | |
Lowe’s Cos., Inc., | | | | | | | | |
5.00%, 04/15/2033 | | | 5,104,000 | | | | 4,819,966 | |
5.63%, 04/15/2053 | | | 3,813,000 | | | | 3,440,808 | |
5.80%, 09/15/2062 | | | 3,178,000 | | | | 2,847,927 | |
| | | | | | | | 14,972,807 | |
| | |
Homebuilding–0.08% | | | | | | | | |
M.D.C. Holdings, Inc., 3.97%, 08/06/2061 | | | 2,500,000 | | | | 1,249,705 | |
| |
Hotels, Resorts & Cruise Lines–0.36% | | | | | |
Expedia Group, Inc., | | | | | | | | |
4.63%, 08/01/2027 | | | 794,000 | | | | 743,726 | |
3.25%, 02/15/2030 | | | 5,712,000 | | | | 4,609,373 | |
| | | | | | | | 5,353,099 | |
| | |
Household Products–0.32% | | | | | | | | |
Church & Dwight Co., Inc., 5.60%, 11/15/2032 | | | 1,327,000 | | | | 1,324,545 | |
Colgate-Palmolive Co., 3.10%, 08/15/2027 | | | 3,716,000 | | | | 3,471,089 | |
| | | | | | | | 4,795,634 | |
| |
Hypermarkets & Super Centers–0.29% | | | | | |
Walmart, Inc., | | | | | | | | |
4.15%, 09/09/2032 | | | 2,629,000 | | | | 2,490,250 | |
4.50%, 09/09/2052 | | | 2,054,000 | | | | 1,827,777 | |
| | | | | | | | 4,318,027 | |
|
Independent Power Producers & Energy Traders–0.05% | |
AES Corp. (The), 1.38%, 01/15/2026 | | | 803,000 | | | | 694,042 | |
| | |
Industrial Conglomerates–0.43% | | | | | | | | |
Honeywell International, Inc., 5.00%, 02/15/2033 | | | 6,574,000 | | | | 6,521,505 | |
| | |
Insurance Brokers–0.17% | | | | | | | | |
Marsh & McLennan Cos., Inc., 6.25%, 11/01/2052 | | | 1,072,000 | | | | 1,096,112 | |
Willis North America, Inc., 4.65%, 06/15/2027 | | | 1,587,000 | | | | 1,494,443 | |
| | | | | | | | 2,590,555 | |
| | | | | | | | |
| | | Principal
Amount | | | Value | |
Integrated Oil & Gas–0.66% | | | | | | | | |
BP Capital Markets America, Inc., | | | | | | | | |
3.06%, 06/17/2041 | | $ | 1,967,000 | | | $ | 1,378,914 | |
2.94%, 06/04/2051 | | | 1,521,000 | | | | 948,346 | |
3.00%, 03/17/2052 | | | 1,011,000 | | | | 627,757 | |
BP Capital Markets PLC (United Kingdom), | | | | | | | | |
4.38%(c)(e) | | | 1,043,000 | | | | 981,724 | |
4.88%(c)(e) | | | 3,221,000 | | | | 2,728,589 | |
Shell International Finance B.V. (Netherlands), | | | | | | | | |
2.88%, 11/26/2041 | | | 2,463,000 | | | | 1,693,911 | |
3.00%, 11/26/2051 | | | 2,463,000 | | | | 1,588,535 | |
| | | | | | | | 9,947,776 | |
|
Integrated Telecommunication Services–0.91% | |
AT&T, Inc., | | | | | | | | |
3.69% (SOFR + 0.64%), 03/25/2024(d) | | | 2,067,000 | | | | 2,055,253 | |
4.30%, 02/15/2030 | | | 974,000 | | | | 888,980 | |
2.55%, 12/01/2033 | | | 3,743,000 | | | | 2,762,691 | |
Verizon Communications, Inc., | | | | | | | | |
1.75%, 01/20/2031 | | | 890,000 | | | | 660,890 | |
2.36%, 03/15/2032 | | | 6,006,000 | | | | 4,553,570 | |
2.85%, 09/03/2041 | | | 2,171,000 | | | | 1,422,249 | |
3.00%, 11/20/2060 | | | 1,129,000 | | | | 631,920 | |
3.70%, 03/22/2061 | | | 1,039,000 | | | | 681,295 | |
| | | | | | | | 13,656,848 | |
| |
Interactive Media & Services–0.59% | | | | | |
Meta Platforms, Inc., | | | | | | | | |
3.85%, 08/15/2032(b) | | | 4,106,000 | | | | 3,498,151 | |
4.45%, 08/15/2052(b) | | | 4,220,000 | | | | 3,139,109 | |
4.65%, 08/15/2062(b) | | | 2,928,000 | | | | 2,164,701 | |
| | | | | | | | 8,801,961 | |
| |
Internet & Direct Marketing Retail–0.08% | | | | | |
Amazon.com, Inc., 2.88%, 05/12/2041 | | | 1,783,000 | | | | 1,268,002 | |
| |
Investment Banking & Brokerage–1.53% | | | | | |
Charles Schwab Corp. (The), | | | | | | | | |
2.45%, 03/03/2027 | | | 783,000 | | | | 699,277 | |
3.92% (SOFR + 1.05%), 03/03/2027(d) | | | 2,731,000 | | | | 2,674,205 | |
2.90%, 03/03/2032 | | | 1,607,000 | | | | 1,306,236 | |
5.00%(c)(e) | | | 1,580,000 | | | | 1,406,200 | |
Goldman Sachs Group, Inc. (The), | | | | | | | | |
5.70%, 11/01/2024 | | | 3,041,000 | | | | 3,041,969 | |
3.50%, 04/01/2025 | | | 1,002,000 | | | | 949,884 | |
1.95%, 10/21/2027(c) | | | 1,476,000 | | | | 1,255,029 | |
3.91% (SOFR + 1.12%), 02/24/2028(d) | | | 1,031,000 | | | | 984,334 | |
4.48%, 08/23/2028(c) | | | 1,897,000 | | | | 1,763,157 | |
1.99%, 01/27/2032(c) | | | 1,081,000 | | | | 789,973 | |
2.65%, 10/21/2032(c) | | | 1,748,000 | | | | 1,325,494 | |
3.10%, 02/24/2033(c) | | | 1,138,000 | | | | 892,440 | |
3.44%, 02/24/2043(c) | | | 1,408,000 | | | | 961,022 | |
See accompanying Notes to Financial Statements which are an integral part of the financial statements.
| | |
| 11 | | Invesco Core Bond Fund |
| | | | | | | | |
| | | Principal
Amount | | | Value | |
Investment Banking & Brokerage–(continued) | |
Morgan Stanley, | | | | | | | | |
5.00%, 11/24/2025 | | $ | 1,082,000 | | | $ | 1,080,277 | |
2.19%, 04/28/2026(c) | | | 763,000 | | | | 696,755 | |
3.62%, 04/01/2031(c) | | | 965,000 | | | | 821,555 | |
2.24%, 07/21/2032(c) | | | 1,998,000 | | | | 1,475,191 | |
2.51%, 10/20/2032(c) | | | 1,090,000 | | | | 821,734 | |
| | | | | | | | 22,944,732 | |
| | |
Leisure Products–0.29% | | | | | | | | |
Brunswick Corp., | | | | | | | | |
4.40%, 09/15/2032 | | | 1,837,000 | | | | 1,462,199 | |
5.10%, 04/01/2052 | | | 4,308,000 | | | | 2,870,471 | |
| | | | | | | | 4,332,670 | |
| | |
Life & Health Insurance–2.25% | | | | | | | | |
Delaware Life Global Funding, | | | | | | | | |
Series 22-1, 3.31%, 03/10/2025(b) | | | 3,826,000 | | | | 3,550,796 | |
Series 21-1, 2.66%, 06/29/2026(b) | | | 10,423,000 | | | | 9,143,160 | |
F&G Global Funding,
2.00%, 09/20/2028(b) | | | 2,245,000 | | | | 1,788,940 | |
GA Global Funding Trust, | | | | | | | | |
2.25%, 01/06/2027(b) | | | 2,836,000 | | | | 2,441,119 | |
1.95%, 09/15/2028(b) | | | 2,544,000 | | | | 2,038,435 | |
2.90%, 01/06/2032(b) | | | 2,436,000 | | | | 1,848,946 | |
MAG Mutual Holding Co., 4.75%, 04/30/2041(f) | | | 9,203,000 | | | | 7,457,467 | |
Northwestern Mutual Global Funding, 4.35%, 09/15/2027(b) | | | 3,482,000 | | | | 3,337,620 | |
Prudential Financial, Inc., 6.00%, 09/01/2052(c) | | | 2,472,000 | | | | 2,261,124 | |
| | | | | | | | 33,867,607 | |
| | |
Managed Health Care–2.01% | | | | | | | | |
Elevance Health, Inc., | | | | | | | | |
5.50%, 10/15/2032 | | | 1,314,000 | | | | 1,309,764 | |
6.10%, 10/15/2052 | | | 938,000 | | | | 957,550 | |
Kaiser Foundation Hospitals, | | | | | | | | |
Series 2021, 2.81%, 06/01/2041 | | | 2,490,000 | | | | 1,670,441 | |
3.00%, 06/01/2051 | | | 2,595,000 | | | | 1,607,064 | |
UnitedHealth Group, Inc., | | | | | | | | |
5.00%, 10/15/2024 | | | 3,551,000 | | | | 3,554,114 | |
5.15%, 10/15/2025 | | | 2,476,000 | | | | 2,480,865 | |
3.70%, 05/15/2027 | | | 1,780,000 | | | | 1,683,458 | |
5.25%, 02/15/2028 | | | 3,040,000 | | | | 3,050,818 | |
5.30%, 02/15/2030 | | | 5,169,000 | | | | 5,171,491 | |
5.35%, 02/15/2033 | | | 4,444,000 | | | | 4,461,737 | |
5.88%, 02/15/2053 | | | 2,220,000 | | | | 2,268,813 | |
6.05%, 02/15/2063 | | | 2,040,000 | | | | 2,100,363 | |
| | | | | | | | 30,316,478 | |
|
Movies & Entertainment–0.43% | |
Warnermedia Holdings, Inc., | | | | | | | | |
5.05%, 03/15/2042(b) | | | 4,050,000 | | | | 2,969,720 | |
5.14%, 03/15/2052(b) | | | 5,023,000 | | | | 3,514,281 | |
| | | | | | | | 6,484,001 | |
| | |
Multi-line Insurance–0.22% | | | | | | | | |
Allianz SE (Germany), 3.20%(b)(c)(e) | | | 2,890,000 | | | | 1,958,842 | |
| | | | | | | | |
| | | Principal
Amount | | | Value | |
Multi-line Insurance–(continued) | |
Boardwalk Pipelines L.P., 3.60%, 09/01/2032 | | $ | 1,698,000 | | | $ | 1,348,099 | |
| | | | | | | | 3,306,941 | |
| | |
Multi-Utilities–0.42% | | | | | | | | |
Dominion Energy, Inc., Series C, 3.38%, 04/01/2030 | | | 830,000 | | | | 713,133 | |
WEC Energy Group, Inc., | | | | | | | | |
5.00%, 09/27/2025 | | | 3,710,000 | | | | 3,697,884 | |
5.15%, 10/01/2027 | | | 1,921,000 | | | | 1,892,123 | |
| | | | | | | | 6,303,140 | |
| | |
Office REITs–0.29% | | | | | | | | |
Office Properties Income Trust, | | | | | | | | |
4.25%, 05/15/2024 | | | 2,347,000 | | | | 2,132,300 | |
4.50%, 02/01/2025 | | | 1,483,000 | | | | 1,233,759 | |
2.65%, 06/15/2026 | | | 314,000 | | | | 229,153 | |
2.40%, 02/01/2027 | | | 1,201,000 | | | | 826,122 | |
| | | | | | | | 4,421,334 | |
| |
Oil & Gas Exploration & Production–0.40% | | | | | |
Aker BP ASA (Norway), 2.00%, 07/15/2026(b) | | | 1,535,000 | | | | 1,334,085 | |
EQT Corp., | | | | | | | | |
5.68%, 10/01/2025 | | | 3,604,000 | | | | 3,566,491 | |
5.70%, 04/01/2028 | | | 1,077,000 | | | | 1,049,687 | |
| | | | | | | | 5,950,263 | |
| |
Oil & Gas Storage & Transportation–1.51% | | | | | |
El Paso Natural Gas Co. LLC, 8.38%, 06/15/2032 | | | 832,000 | | | | 918,213 | |
Enbridge, Inc. (Canada), | | | | | | | | |
3.34% (SOFR + 0.63%), 02/16/2024(d) | | | 542,000 | | | | 536,110 | |
1.60%, 10/04/2026 | | | 864,000 | | | | 741,961 | |
Energy Transfer L.P., | | | | | | | | |
4.25%, 03/15/2023 | | | 1,024,000 | | | | 1,018,807 | |
4.00%, 10/01/2027 | | | 808,000 | | | | 731,576 | |
Kinder Morgan, Inc., | | | | | | | | |
7.75%, 01/15/2032 | | | 1,236,000 | | | | 1,345,256 | |
4.80%, 02/01/2033 | | | 2,212,000 | | | | 1,978,290 | |
5.45%, 08/01/2052 | | | 4,237,000 | | | | 3,591,886 | |
MPLX L.P., | | | | | | | | |
1.75%, 03/01/2026 | | | 909,000 | | | | 793,141 | |
4.25%, 12/01/2027 | | | 756,000 | | | | 697,689 | |
4.95%, 03/14/2052 | | | 2,947,000 | | | | 2,284,525 | |
ONEOK, Inc.,
6.35%, 01/15/2031 | | | 1,409,000 | | | | 1,391,727 | |
Targa Resources Corp., | | | | | | | | |
5.20%, 07/01/2027 | | | 1,916,000 | | | | 1,849,588 | |
6.25%, 07/01/2052 | | | 2,172,000 | | | | 1,945,714 | |
Williams Cos., Inc. (The), | | | | | | | | |
2.60%, 03/15/2031 | | | 2,649,000 | | | | 2,077,876 | |
3.50%, 10/15/2051 | | | 1,287,000 | | | | 826,497 | |
| | | | | | | | 22,728,856 | |
| |
Other Diversified Financial Services–0.78% | | | | | |
Corebridge Financial, Inc., 6.88%, 12/15/2052(b)(c) | | | 3,008,000 | | | | 2,717,403 | |
Jackson Financial, Inc.,
| | | | | | | | |
5.17%, 06/08/2027 | | | 1,409,000 | | | | 1,347,379 | |
5.67%, 06/08/2032 | | | 1,620,000 | | | | 1,476,033 | |
See accompanying Notes to Financial Statements which are an integral part of the financial statements.
| | |
| 12 | | Invesco Core Bond Fund |
| | | | | | | | |
| | | Principal
Amount | | | Value | |
Other Diversified Financial Services–(continued) | |
Pershing Square Holdings Ltd., | | | | | | | | |
3.25%, 11/15/2030(b) | | $ | 3,900,000 | | | $ | 2,989,759 | |
3.25%, 10/01/2031(b) | | | 4,300,000 | | | | 3,146,783 | |
| | | | | | | | 11,677,357 | |
| | |
Paper Packaging–0.28% | | | | | | | | |
Berry Global, Inc., 1.65%, 01/15/2027 | | | 5,120,000 | | | | 4,223,487 | |
| | |
Pharmaceuticals–0.27% | | | | | | | | |
Bayer US Finance II LLC (Germany), 3.88%, 12/15/2023(b) | | | 1,536,000 | | | | 1,506,596 | |
Mayo Clinic, Series 2021, 3.20%, 11/15/2061 | | | 1,964,000 | | | | 1,183,600 | |
Mylan, Inc., 3.13%, 01/15/2023(b) | | | 1,397,000 | | | | 1,388,402 | |
| | | | | | | | 4,078,598 | |
|
Precious Metals & Minerals–0.07% | |
Anglo American Capital PLC (South Africa), 3.63%, 09/11/2024(b) | | | 1,168,000 | | | | 1,123,541 | |
|
Property & Casualty Insurance–0.30% | |
Fairfax Financial Holdings Ltd. (Canada), 5.63%, 08/16/2032(b) | | | 3,084,000 | | | | 2,796,694 | |
Liberty Mutual Group, Inc., 5.50%, 06/15/2052(b) | | | 2,088,000 | | | | 1,721,879 | |
| | | | | | | | 4,518,573 | |
| | |
Railroads–1.07% | | | | | | | | |
CSX Corp., | | | | | | | | |
4.10%, 11/15/2032 | | | 3,331,000 | | | | 3,001,640 | |
4.50%, 11/15/2052 | | | 3,330,000 | | | | 2,719,844 | |
Union Pacific Corp., | | | | | | | | |
4.50%, 01/20/2033 | | | 3,789,000 | | | | 3,576,902 | |
4.95%, 09/09/2052 | | | 3,741,000 | | | | 3,372,691 | |
5.15%, 01/20/2063 | | | 3,828,000 | | | | 3,433,204 | |
| | | | | | | | 16,104,281 | |
| | |
Regional Banks–3.44% | | | | | | | | |
Citizens Financial Group, Inc., | | | | | | | | |
4.30%, 12/03/2025 | | | 2,321,000 | | | | 2,212,561 | |
2.50%, 02/06/2030 | | | 1,061,000 | | | | 822,576 | |
2.64%, 09/30/2032 | | | 4,070,000 | | | | 2,899,349 | |
Fifth Third Bancorp, | | | | | | | | |
6.36%, 10/27/2028(c) | | | 2,463,000 | | | | 2,475,263 | |
4.77%, 07/28/2030(c) | | | 2,873,000 | | | | 2,637,986 | |
4.34%, 04/25/2033(c) | | | 1,677,000 | | | | 1,456,621 | |
Huntington Bancshares, Inc., | | | | | | | | |
4.00%, 05/15/2025 | | | 1,313,000 | | | | 1,266,382 | |
4.44%, 08/04/2028(c) | | | 1,558,000 | | | | 1,451,474 | |
KeyCorp, | | | | | | | | |
2.25%, 04/06/2027 | | | 1,495,000 | | | | 1,282,071 | |
4.79%, 06/01/2033(c) | | | 1,117,000 | | | | 1,011,761 | |
PNC Financial Services Group, Inc. (The), | | | | | | | | |
5.67%, 10/28/2025(c) | | | 3,625,000 | | | | 3,630,288 | |
4.63%, 06/06/2033(c) | | | 3,933,000 | | | | 3,483,769 | |
6.04%, 10/28/2033(c) | | | 2,943,000 | | | | 2,959,831 | |
Series O, 8.12% (3 mo. USD LIBOR
+ 3.68%)(d)(e) | | | 3,742,000 | | | | 3,746,092 | |
Series U, 6.00%(c)(e) | | | 3,153,000 | | | | 2,932,290 | |
Series V, 6.20%(c)(e) | | | 8,683,000 | | | | 8,246,245 | |
| | | | | | | | |
| | | Principal
Amount | | | Value | |
Regional Banks–(continued) | |
Truist Financial Corp., | | | | | | | | |
4.12%, 06/06/2028(c) | | $ | 2,184,000 | | | $ | 2,021,672 | |
4.92%, 07/28/2033(c) | | | 4,842,000 | | | | 4,318,517 | |
6.12%, 10/28/2033(c) | | | 2,904,000 | | | | 2,913,283 | |
| | | | | | | | 51,768,031 | |
| | |
Residential REITs–0.27% | | | | | | | | |
American Homes 4 Rent L.P., | | | | | | | | |
3.63%, 04/15/2032 | | | 2,171,000 | | | | 1,750,752 | |
4.30%, 04/15/2052 | | | 1,058,000 | | | | 731,029 | |
Invitation Homes Operating Partnership L.P., | | | | | | | | |
2.30%, 11/15/2028 | | | 510,000 | | | | 406,376 | |
2.70%, 01/15/2034 | | | 1,646,000 | | | | 1,139,790 | |
| | | | | | | | 4,027,947 | |
| | |
Restaurants–0.30% | | | | | | | | |
McDonald’s Corp., 5.15%, 09/09/2052 | | | 3,374,000 | | | | 3,037,332 | |
Starbucks Corp., 3.00%, 02/14/2032 | | | 1,843,000 | | | | 1,527,127 | |
| | | | | | | | 4,564,459 | |
| | |
Retail REITs–0.82% | | | | | | | | |
Agree L.P., 4.80%, 10/01/2032 | | | 1,368,000 | | | | 1,203,693 | |
Kimco Realty Corp., | | | | | | | | |
1.90%, 03/01/2028 | | | 1,101,000 | | | | 895,263 | |
2.25%, 12/01/2031 | | | 1,425,000 | | | | 1,050,394 | |
Kite Realty Group L.P., 4.00%, 10/01/2026 | | | 1,842,000 | | | | 1,657,819 | |
Kite Realty Group Trust, 4.75%, 09/15/2030 | | | 697,000 | | | | 596,238 | |
Realty Income Corp., | | | | | | | | |
2.20%, 06/15/2028 | | | 1,369,000 | | | | 1,135,241 | |
3.25%, 01/15/2031 | | | 846,000 | | | | 704,259 | |
5.63%, 10/13/2032 | | | 1,924,000 | | | | 1,882,082 | |
2.85%, 12/15/2032 | | | 2,333,000 | | | | 1,827,882 | |
Scentre Group Trust 2 (Australia), 4.75%, 09/24/2080(b)(c) | | | 1,658,000 | | | | 1,403,945 | |
| | | | | | | | 12,356,816 | |
|
Semiconductor Equipment–0.09% | |
KLA Corp., 4.95%, 07/15/2052 | | | 1,604,000 | | | | 1,399,282 | |
| | |
Semiconductors–0.76% | | | | | | | | |
Broadcom, Inc., | | | | | | | | |
3.46%, 09/15/2026 | | | 4,691,000 | | | | 4,309,384 | |
3.42%, 04/15/2033(b) | | | 921,000 | | | | 701,040 | |
3.47%, 04/15/2034(b) | | | 1,647,000 | | | | 1,235,039 | |
3.14%, 11/15/2035(b) | | | 3,690,000 | | | | 2,564,900 | |
4.93%, 05/15/2037(b) | | | 836,000 | | | | 690,684 | |
QUALCOMM, Inc., | | | | | | | | |
2.15%, 05/20/2030 | | | 1,251,000 | | | | 1,026,327 | |
3.25%, 05/20/2050 | | | 1,214,000 | | | | 838,208 | |
| | | | | | | | 11,365,582 | |
| | |
Soft Drinks–0.11% | | | | | | | | |
PepsiCo, Inc., | | | | | | | | |
3.60%, 02/18/2028 | | | 1,009,000 | | | | 950,363 | |
3.90%, 07/18/2032 | | | 837,000 | | | | 775,946 | |
| | | | | | | | 1,726,309 | |
See accompanying Notes to Financial Statements which are an integral part of the financial statements.
| | |
| 13 | | Invesco Core Bond Fund |
| | | | | | | | |
| | | Principal
Amount | | | Value | |
Sovereign Debt–0.13% | |
Bermuda Government International Bond (Bermuda), 5.00%, 07/15/2032(b) | | $ | 2,109,000 | | | $ | 1,959,336 | |
|
Specialized Finance–0.11% | |
Blackstone Private Credit Fund, 7.05%, 09/29/2025(b) | | | 1,726,000 | | | | 1,712,000 | |
|
Specialized REITs–1.40% | |
American Tower Corp., | | | | | | | | |
3.00%, 06/15/2023 | | | 1,144,000 | | | | 1,127,839 | |
3.38%, 10/15/2026 | | | 4,350,000 | | | | 3,940,155 | |
2.70%, 04/15/2031 | | | 2,075,000 | | | | 1,620,072 | |
4.05%, 03/15/2032 | | | 1,124,000 | | | | 962,463 | |
Crown Castle, Inc., | | | | | | | | |
4.45%, 02/15/2026 | | | 4,350,000 | | | | 4,167,484 | |
2.50%, 07/15/2031 | | | 1,803,000 | | | | 1,388,956 | |
EPR Properties, | | | | | | | | |
4.75%, 12/15/2026 | | | 757,000 | | | | 652,534 | |
4.95%, 04/15/2028 | | | 1,903,000 | | | | 1,564,145 | |
3.60%, 11/15/2031 | | | 1,583,000 | | | | 1,070,246 | |
Extra Space Storage L.P., 2.35%, 03/15/2032 | | | 1,596,000 | | | | 1,156,877 | |
Prologis L.P.,
4.63%, 01/15/2033 | | | 3,726,000 | | | | 3,454,366 | |
| | | | | | | | 21,105,137 | |
|
Technology Hardware, Storage & Peripherals–0.49% | |
Apple, Inc., | | | | | | | | |
3.35%, 08/08/2032 | | | 3,369,000 | | | | 2,973,387 | |
4.38%, 05/13/2045 | | | 723,000 | | | | 631,835 | |
2.55%, 08/20/2060 | | | 3,283,000 | | | | 1,895,541 | |
2.80%, 02/08/2061 | | | 3,064,000 | | | | 1,822,055 | |
| | | | | | | | 7,322,818 | |
| | |
Trucking–0.62% | | | | | | | | |
Penske Truck Leasing Co. L.P./PTL Finance Corp., | | | | | | | | |
4.00%, 07/15/2025(b) | | | 687,000 | | | | 653,093 | |
3.40%, 11/15/2026(b) | | | 1,134,000 | | | | 1,026,454 | |
4.40%, 07/01/2027(b) | | | 775,000 | | | | 723,548 | |
Ryder System, Inc.,
4.63%, 06/01/2025 | | | 4,833,000 | | | | 4,693,600 | |
Triton Container International Ltd. (Bermuda), 2.05%, 04/15/2026(b) | | | 2,683,000 | | | | 2,267,887 | |
| | | | | | | | 9,364,582 | |
|
Wireless Telecommunication Services–0.84% | |
Rogers Communications, Inc. (Canada), 4.55%, 03/15/2052(b) | | | 5,290,000 | | | | 4,099,752 | |
T-Mobile USA, Inc., | | | | | | | | |
3.50%, 04/15/2025 | | | 4,350,000 | | | | 4,152,321 | |
3.40%, 10/15/2052 | | | 4,565,000 | | | | 2,959,494 | |
5.65%, 01/15/2053 | | | 1,594,000 | | | | 1,474,034 | |
| | | | | | | | 12,685,601 | |
Total U.S. Dollar Denominated Bonds & Notes
(Cost $901,465,747) | | | | 799,026,851 | |
| | | | | | | | |
| | | Principal
Amount | | | Value | |
Asset-Backed Securities–28.27% | | | | | |
Alternative Loan Trust, | | | | | | | | |
Series 2005-21CB, Class A7, 5.50%, 06/25/2035 | | $ | 575,183 | | | $ | 450,103 | |
Series 2005-29CB, Class A4, 5.00%, 07/25/2035 | | | 269,530 | | | | 165,359 | |
AmeriCredit Automobile Receivables Trust, | | | | | | | | |
Series 2018-3, Class C, 3.74%, 10/18/2024 | | | 1,919,990 | | | | 1,917,507 | |
Series 2019-2, Class C, 2.74%, 04/18/2025 | | | 1,645,000 | | | | 1,629,696 | |
Series 2019-2, Class D, 2.99%, 06/18/2025 | | | 4,570,000 | | | | 4,430,249 | |
Series 2019-3, Class D, 2.58%, 09/18/2025 | | | 2,285,000 | | | | 2,197,525 | |
AMSR Trust, Series 2021-SFR3, Class B, 1.73%, 10/17/2038(b) | | | 4,415,000 | | | | 3,716,627 | |
Angel Oak Mortgage Trust, | | | | | | | | |
Series 2020-1, Class A1, 2.47%, 12/25/2059(b)(g) | | | 581,710 | | | | 540,868 | |
Series 2020-3, Class A1, 1.69%, 04/25/2065(b)(g) | | | 1,810,662 | | | | 1,637,183 | |
Series 2021-3, Class A1, 1.07%, 05/25/2066(b)(g) | | | 1,114,810 | | | | 854,797 | |
Series 2021-7, Class A1, 1.98%, 10/25/2066(b)(g) | | | 2,668,461 | | | | 2,086,748 | |
Series 2022-1, Class A1, 2.88%, 12/25/2066(b)(h) | | | 4,623,814 | | | | 3,928,229 | |
Avis Budget Rental Car Funding (AESOP) LLC, Series 2022-1A, Class A, 3.83%, 08/21/2028(b) | | | 6,614,000 | | | | 6,217,046 | |
Bain Capital Credit CLO Ltd., Series 2017-2A, Class AR2, 5.54% (3 mo. USD LIBOR + 1.18%), 07/25/2034(b)(d) | | | 7,338,000 | | | | 7,038,265 | |
Banc of America Funding Trust, | | | | | | | | |
Series 2007-1, Class 1A3, 6.00%, 01/25/2037 | | | 176,072 | | | | 139,882 | |
Series 2007-C, Class 1A4, 3.18%, 05/20/2036(g) | | | 65,225 | | | | 61,559 | |
Banc of America Mortgage Trust, Series 2007-1, Class 1A24, 6.00%, 03/25/2037 | | | 194,951 | | | | 156,103 | |
Bank, Series 2019-BNK16, Class XA, IO, 0.94%, 02/15/2052(i) | | | 23,762,928 | | | | 1,027,963 | |
Bayview MSR Opportunity Master Fund Trust, | | | | | | | | |
Series 2021-4, Class A3, 3.00%, 10/25/2051(b)(g) | | | 3,767,656 | | | | 3,032,188 | |
Series 2021-4, Class A4, 2.50%, 10/25/2051(b)(g) | | | 3,768,532 | | | | 2,913,757 | |
Series 2021-4, Class A8, 2.50%, 10/25/2051(b)(g) | | | 3,591,043 | | | | 3,082,143 | |
Series 2021-5, Class A1, 3.00%, 11/25/2051(b)(g) | | | 3,990,285 | | | | 3,226,066 | |
Series 2021-5, Class A2, 2.50%, 11/25/2051(b)(g) | | | 4,868,321 | | | | 3,765,320 | |
Bear Stearns Adjustable Rate Mortgage Trust, | | | | | | | | |
Series 2005-9, Class A1, 0.76% (1 yr. U.S. Treasury Yield Curve Rate + 2.30%), 10/25/2035(d) | | | 159,853 | | | | 149,228 | |
Series 2006-1, Class A1, 0.65% (1 yr. U.S. Treasury Yield Curve Rate + 2.25%), 02/25/2036(d) | | | 358,080 | | | | 341,804 | |
See accompanying Notes to Financial Statements which are an integral part of the financial statements.
| | |
| 14 | | Invesco Core Bond Fund |
| | | | | | | | |
| | | Principal
Amount | | | Value | |
Benchmark Mortgage Trust, Series 2018-B1, Class XA, IO, 0.56%, 01/15/2051(i) | | $ | 28,075,978 | | | $ | 543,265 | |
BRAVO Residential Funding Trust, Series 2021-NQM2, Class A1, 0.97%, 03/25/2060(b)(g) | | | 1,116,090 | | | | 1,052,146 | |
BX Commercial Mortgage Trust, | | | | | | | | |
Series 2021-ACNT, Class A, 4.26% (1 mo. USD LIBOR + 0.85%), 11/15/2038(b)(d) | | | 2,220,000 | | | | 2,119,591 | |
Series 2021-VOLT, Class A, 4.11% (1 mo. USD LIBOR + 0.70%), 09/15/2036(b)(d) | | | 4,080,000 | | | | 3,882,721 | |
Series 2021-VOLT, Class B, 4.36% (1 mo. USD LIBOR + 0.95%), 09/15/2036(b)(d) | | | 3,595,000 | | | | 3,383,843 | |
Series 2021-XL2, Class B, 4.41% (1 mo. USD LIBOR + 1.00%), 10/15/2038(b)(d) | | | 1,450,309 | | | | 1,355,694 | |
BX Trust, | | | | | | | | |
Series 2022-CLS, Class A, 5.76%, 10/13/2027(b) | | | 1,625,000 | | | | 1,609,901 | |
Series 2022-LBA6, Class A, 4.38% (1 mo. Term SOFR + 1.00%), 01/15/2039(b)(d) | | | 3,670,000 | | | | 3,494,055 | |
Series 2022-LBA6, Class B, 4.68% (1 mo. Term SOFR + 1.30%), 01/15/2039(b)(d) | | | 2,265,000 | | | | 2,136,282 | |
Series 2022-LBA6, Class C, 4.98% (1 mo. Term SOFR + 1.60%), 01/15/2039(b)(d) | | | 1,215,000 | | | | 1,134,012 | |
CarMax Auto Owner Trust, Series 2022-4, Class A4, 5.70%, 07/17/2028 | | | 7,031,000 | | | | 7,021,910 | |
CCG Receivables Trust, | | | | | | | | |
Series 2019-2, Class B, 2.55%, 03/15/2027(b) | | | 1,845,000 | | | | 1,821,290 | |
Series 2019-2, Class C, 2.89%, 03/15/2027(b) | | | 900,000 | | | | 887,041 | |
CD Mortgage Trust, Series 2017- CD6, Class XA, IO, 0.88%, 11/13/2050(i) | | | 10,162,671 | | | | 291,301 | |
Cedar Funding IX CLO Ltd., Series 2018-9A, Class A1, 5.22% (3 mo. USD LIBOR + 0.98%), 04/20/2031(b)(d) | | | 3,687,000 | | | | 3,602,774 | |
Chase Home Lending Mortgage Trust, Series 2019-ATR1, Class A15, 4.00%, 04/25/2049(b)(g) | | | 77,496 | | | | 72,384 | |
Chase Mortgage Finance Trust, Series 2005-A2, Class 1A3, 3.02%, 01/25/2036(g) | | | 418,518 | | | | 367,023 | |
CIFC Funding Ltd. (Cayman Islands), | | | | | | | | |
Series 2014-5A, Class A1R2, 5.28% (3 mo. USD LIBOR + 1.20%), 10/17/2031(b)(d) | | | 1,497,000 | | | | 1,465,238 | |
Series 2016-1A, Class ARR, 5.36% (3 mo. USD LIBOR + 1.08%), 10/21/2031(b)(d) | | | 1,538,000 | | | | 1,483,872 | |
Citigroup Commercial Mortgage Trust, | | | | | | | | |
Series 2013-GC17, Class XA, IO, 0.99%, 11/10/2046(i) | | | 11,802,195 | | | | 74,261 | |
Series 2014-GC21, Class AA, 3.48%, 05/10/2047 | | | 428,301 | | | | 420,551 | |
Series 2017-C4, Class XA, IO, 1.06%, 10/12/2050(i) | | | 26,660,754 | | | | 952,674 | |
| | | | | | | | |
| | | Principal
Amount | | | Value | |
Citigroup Mortgage Loan Trust, Inc., | | | | | | | | |
Series 2006-AR1, Class 1A1, 3.15% (1 yr. U.S. Treasury Yield Curve Rate + 2.40%), 10/25/2035(d) | | $ | 708,208 | | | $ | 682,497 | |
Series 2021-INV3, Class A3, 2.50%, 05/25/2051(b)(g) | | | 3,804,129 | | | | 2,951,712 | |
CNH Equipment Trust, Series 2019-A, Class A4, 3.22%, 01/15/2026 | | | 1,765,543 | | | | 1,761,851 | |
COLT Mortgage Loan Trust, | | | | | | | | |
Series 2020-2, Class A1, 1.85%, 03/25/2065(b)(g) | | | 158,421 | | | | 155,111 | |
Series 2021-5, Class A1, 1.73%, 11/26/2066(b)(g) | | | 2,005,636 | | | | 1,650,605 | |
Series 2022-1, Class A1, 2.28%, 12/27/2066(b)(g) | | | 2,862,024 | | | | 2,357,086 | |
Series 2022-2, Class A1, 2.99%, 02/25/2067(b)(h) | | | 2,751,273 | | | | 2,324,746 | |
Series 2022-3, Class A1, 3.90%, 02/25/2067(b)(g) | | | 3,800,252 | | | | 3,356,595 | |
COMM Mortgage Trust, | | | | | | | | |
Series 2012-CR5, Class XA, IO, 1.37%, 12/10/2045(i) | | | 2,862,764 | | | | 29 | |
Series 2013-CR6, Class AM, 3.15%, 03/10/2046(b) | | | 2,945,000 | | | | 2,920,131 | |
Series 2014-CR20, Class ASB, 3.31%, 11/10/2047 | | | 408,003 | | | | 399,307 | |
Series 2014-LC15, Class AM, 4.20%, 04/10/2047 | | | 2,865,000 | | | | 2,759,678 | |
Series 2014-UBS6, Class AM, 4.05%, 12/10/2047 | | | 5,720,000 | | | | 5,438,209 | |
Credit Suisse Mortgage Capital Trust, | | | | | | | | |
Series 2021-NQM1, Class A1, 0.81%, 05/25/2065(b)(g) | | | 700,039 | | | | 639,468 | |
Series 2021-NQM2, Class A1, 1.18%, 02/25/2066(b)(g) | | | 923,417 | | | | 782,231 | |
Series 2022-ATH1, Class A1A, 2.87%, 01/25/2067(b)(g) | | | 3,670,658 | | | | 3,315,720 | |
Series 2022-ATH1, Class A1B, 3.35%, 01/25/2067(b)(g) | | | 1,890,000 | | | | 1,512,406 | |
Series 2022-ATH2, Class A1, 4.55%, 05/25/2067(b)(g) | | | 3,888,589 | | | | 3,617,680 | |
CSAIL Commercial Mortgage Trust, Series 2020-C19, Class A3, 2.56%, 03/15/2053 | | | 10,613,000 | | | | 8,595,927 | |
CSMC Mortgage-Backed Trust, Series 2006-6, Class 1A4, 6.00%, 07/25/2036 | | | 602,843 | | | | 322,772 | |
Dryden 93 CLO Ltd., Series 2021-93A, Class A1A, 5.16% (3 mo. USD LIBOR + 1.08%), 01/15/2034(b)(d) | | | 1,078,634 | | | | 1,040,573 | |
Ellington Financial Mortgage Trust, | | | | | | | | |
Series 2020-1, Class A1, 2.01%, 05/25/2065(b)(g) | | | 263,290 | | | | 254,462 | |
Series 2021-1, Class A1, 0.80%, 02/25/2066(b)(g) | | | 357,630 | | | | 281,190 | |
Series 2022-1, Class A1, 2.21%, 01/25/2067(b)(g) | | | 2,665,081 | | | | 2,122,102 | |
Series 2022-3, Class A1, 5.00%, 08/25/2067(b)(h) | | | 3,641,707 | | | | 3,424,927 | |
Extended Stay America Trust, Series 2021-ESH, Class B, 4.79% (1 mo. USD LIBOR + 1.38%), 07/15/2038(b)(d) | | | 1,688,813 | | | | 1,605,888 | |
See accompanying Notes to Financial Statements which are an integral part of the financial statements.
| | |
| 15 | | Invesco Core Bond Fund |
| | | | | | | | |
| | | Principal
Amount | | | Value | |
First Horizon Alternative Mortgage Securities Trust, Series 2005- FA8, Class 1A6, 4.24% (1 mo. USD LIBOR + 0.65%), 11/25/2035(d) | | $ | 367,570 | | | $ | 169,284 | |
Flagstar Mortgage Trust, | | | | | | | | |
Series 2021-11IN, Class A6, 3.70%, 11/25/2051(b)(g) | | | 6,076,901 | | | | 5,185,045 | |
Series 2021-8INV, Class A6, 2.50%, 09/25/2051(b)(g) | | | 1,311,577 | | | | 1,119,088 | |
FREMF Mortgage Trust, | | | | | | | | |
Series 2013-K26, Class C, 3.55%, 12/25/2045(b)(g) | | | 1,165,000 | | | | 1,159,526 | |
Series 2013-K27, Class C, 3.49%, 01/25/2046(b)(g) | | | 650,000 | | | | 646,550 | |
Series 2013-K28, Class C, 3.46%, 06/25/2046(b)(g) | | | 2,580,000 | | | | 2,530,599 | |
Series 2015-K44, Class B, 3.72%, 01/25/2048(b)(g) | | | 1,175,000 | | | | 1,116,652 | |
Series 2017-K62, Class B, 3.88%, 01/25/2050(b)(g) | | | 1,040,000 | | | | 968,106 | |
Series 2017-K724, Class B, 5.26%, 12/25/2049(b)(g) | | | 780,000 | | | | 757,956 | |
GoldenTree Loan Management US CLO 1 Ltd., Series 2021-9A, Class A, 5.31% (3 mo. USD LIBOR + 1.07%), 01/20/2033(b)(d) | | | 1,712,000 | | | | 1,654,930 | |
GoldenTree Loan Management US CLO 5 Ltd., Series 2019-5A, Class AR, 5.31% (3 mo. USD LIBOR + 1.07%), 10/20/2032(b)(d) | | | 2,190,000 | | | | 2,112,161 | |
Golub Capital Partners CLO 40(A) Ltd., Series 2019-40A, Class AR, 5.45% (3 mo. USD LIBOR + 1.09%), 01/25/2032(b)(d) | | | 5,264,000 | | | | 5,094,099 | |
GS Mortgage Securities Corp. Trust, Series 2022-SHIP, Class A, 4.11% (1 mo. Term SOFR + 0.73%), 08/15/2036(b)(d) | | | 1,615,000 | | | | 1,589,432 | |
GS Mortgage Securities Trust, | | | | | | | | |
Series 2013-GC16, Class AS, 4.65%, 11/10/2046 | | | 974,215 | | | | 954,524 | |
Series 2013-GCJ12, Class AAB, 2.68%, 06/10/2046 | | | 3 | | | | 3 | |
Series 2014-GC18, Class AAB, 3.65%, 01/10/2047 | | | 287,032 | | | | 283,616 | |
Series 2020-GC47, Class A5, 2.38%, 05/12/2053 | | | 3,780,000 | | | | 3,024,289 | |
GS Mortgage-Backed Securities Trust, Series 2021-INV1, Class A6, 2.50%, 12/25/2051(b)(g) | | | 3,232,833 | | | | 2,778,555 | |
GSR Mortgage Loan Trust, Series 2005-AR4, Class 6A1, 3.65%, 07/25/2035(g) | | | 63,818 | | | | 58,955 | |
Hertz Vehicle Financing III L.P., | | | | | | | | |
Series 2021-2A, Class A, 1.68%, 12/27/2027(b) | | | 1,322,000 | | | | 1,117,142 | |
Series 2021-2A, Class B, 2.12%, 12/27/2027(b) | | | 705,000 | | | | 593,632 | |
Hertz Vehicle Financing LLC, | | | | | | | | |
Series 2021-1A, Class A, 1.21%, 12/26/2025(b) | | | 978,000 | | | | 889,525 | |
Series 2021-1A, Class B, 1.56%, 12/26/2025(b) | | | 432,000 | | | | 393,503 | |
| | | | | | | | |
| | | Principal
Amount | | | Value | |
IP Lending LLC, 0.00%(f) | | $ | 5,493,000 | | | $ | 5,493,000 | |
JP Morgan Chase Commercial Mortgage Securities Trust, | | | | | | | | |
Series 2013-C16, Class AS, 4.52%, 12/15/2046 | | | 3,490,000 | | | | 3,414,836 | |
Series 2013-LC11, Class AS, 3.22%, 04/15/2046 | | | 1,722,000 | | | | 1,681,869 | |
Series 2014-C20, Class AS, 4.04%, 07/15/2047 | | | 3,950,000 | | | | 3,792,680 | |
JP Morgan Mortgage Trust, | | | | | | | | |
Series 2007-A1, Class 5A1, 2.84%, 07/25/2035(g) | | | 233,036 | | | | 225,312 | |
Series 2021-LTV2, Class A1, 2.52%, 05/25/2052(b)(g) | | | 4,576,167 | | | | 3,531,065 | |
JPMBB Commercial Mortgage Securities Trust, | | | | | | | | |
Series 2014-C25, Class AS, 4.07%, 11/15/2047 | | | 6,036,000 | | | | 5,732,501 | |
Series 2015-C27, Class XA, IO, 1.15%, 02/15/2048(i) | | | 32,254,391 | | | | 650,155 | |
Series 2015-C28, Class AS, 3.53%, 10/15/2048 | | | 3,400,000 | | | | 3,164,767 | |
KKR CLO 30 Ltd., Series 30A, Class A1R, 5.10% (3 mo. USD LIBOR + 1.02%), 10/17/2031(b)(d) | | | 3,771,000 | | | | 3,673,146 | |
LB Commercial Conduit Mortgage Trust, Series 1998-C1, Class IO, 0.82%, 02/18/2030(g) | | | 7,410 | | | | 0 | |
Lehman Structured Securities Corp., Series 2002-GE1, Class A, 0.00%, 07/26/2024(b)(g) | | | 6,493 | | | | 1,165 | |
Life Mortgage Trust, | | | | | | | | |
Series 2021-BMR, Class A, 4.11% (1 mo. USD LIBOR + 0.70%), 03/15/2038(b)(d) | | | 2,255,916 | | | | 2,159,691 | |
Series 2021-BMR, Class B, 4.29% (1 mo. USD LIBOR + 0.88%), 03/15/2038(b)(d) | | | 3,671,394 | | | | 3,460,741 | |
Series 2021-BMR, Class C, 4.51% (1 mo. USD LIBOR + 1.10%), 03/15/2038(b)(d) | | | 1,543,263 | | | | 1,451,862 | |
Madison Park Funding XLVIII Ltd., Series 2021-48A, Class A, 5.38% (3 mo. USD LIBOR + 1.15%), 04/19/2033(b)(d) | | | 10,755,000 | | | | 10,483,770 | |
Med Trust, | | | | | | | | |
Series 2021-MDLN, Class A, 4.36% (1 mo. USD LIBOR + 0.95%), 11/15/2038(b)(d) | | | 2,660,000 | | | | 2,538,553 | |
Series 2021-MDLN, Class B, 4.86% (1 mo. USD LIBOR + 1.45%), 11/15/2038(b)(d) | | | 4,303,000 | | | | 4,087,057 | |
Mello Mortgage Capital Acceptance Trust, | | | | | | | | |
Series 2021-INV2, Class A4, 2.50%, 08/25/2051(b)(g) | | | 2,471,623 | | | | 2,108,884 | |
Series 2021-INV3, Class A4, 2.50%, 10/25/2051(b)(g) | | | 2,444,801 | | | | 2,085,998 | |
MFA Trust, | | | | | | | | |
Series 2021-AEI1, Class A3, 2.50%, 08/25/2051(b)(g) | | | 2,711,604 | | | | 2,103,996 | |
Series 2021-AEI1, Class A4, 2.50%, 08/25/2051(b)(g) | | | 3,285,817 | | | | 2,821,152 | |
Series 2021-INV2, Class A1, 1.91%, 11/25/2056(b)(g) | | | 3,306,378 | | | | 2,628,932 | |
See accompanying Notes to Financial Statements which are an integral part of the financial statements.
| | |
| 16 | | Invesco Core Bond Fund |
| | | | | | | | |
| | | Principal
Amount | | | Value | |
MHP Commercial Mortgage Trust, | | | | | | | | |
Series 2021-STOR, Class A, 4.11% (1 mo. USD LIBOR + 0.70%), 07/15/2038(b)(d) | | $ | 1,945,000 | | | $ | 1,847,484 | |
Series 2021-STOR, Class B, 4.31% (1 mo. USD LIBOR + 0.90%), 07/15/2038(b)(d) | | | 1,460,000 | | | | 1,380,660 | |
Morgan Stanley Bank of America Merrill Lynch Trust, | | | | | | | | |
Series 2013-C9, Class AS, 3.46%, 05/15/2046 | | | 6,222,000 | | | | 6,115,517 | |
Series 2014-C19, Class AS, 3.83%, 12/15/2047 | | | 5,035,000 | | | | 4,768,656 | |
Morgan Stanley Capital I Trust, Series 2017-HR2, Class XA, IO, 0.87%, 12/15/2050(i) | | | 10,867,102 | | | | 375,782 | |
Neuberger Berman Loan Advisers CLO 24 Ltd., Series 2017-24A, Class AR, 5.25% (3 mo. USD LIBOR + 1.02%), 04/19/2030(b)(d) | | | 4,988,346 | | | | 4,887,646 | |
Neuberger Berman Loan Advisers CLO 40 Ltd., Series 2021-40A, Class A, 5.14% (3 mo. USD LIBOR + 1.06%), 04/16/2033(b)(d) | | | 3,402,000 | | | | 3,300,355 | |
New Residential Mortgage Loan Trust, Series 2022-NQM2, Class A1, 3.08%, 03/27/2062(b)(g) | | | 2,571,177 | | | | 2,193,732 | |
OBX Trust, | | | | | | | | |
Series 2022-NQM1, Class A1, 2.31%, 11/25/2061(b)(g) | | | 3,354,817 | | | | 2,685,618 | |
Series 2022-NQM2, Class A1, 2.94%, 01/25/2062(b)(g) | | | 3,929,972 | | | | 3,360,549 | |
Series 2022-NQM2, Class A1A, 2.78%, 01/25/2062(b)(h) | | | 2,554,691 | | | | 2,265,266 | |
Series 2022-NQM2, Class A1B, 3.38%, 01/25/2062(b)(h) | | | 2,305,000 | | | | 1,802,021 | |
Series 2022-NQM8, Class A1, 6.10%, 09/25/2062(b)(h) | | | 5,327,422 | | | | 5,150,975 | |
Oceanview Mortgage Trust, Series 2021-3, Class A5, 2.50%, 07/25/2051(b)(g) | | | 2,845,822 | | | | 2,446,617 | |
OCP CLO Ltd. (Cayman Islands), | | | | | | | | |
Series 2017-13A, Class A1AR, 5.04% (3 mo. USD LIBOR + 0.96%), 07/15/2030(b)(d) | | | 3,192,000 | | | | 3,118,112 | |
Series 2020-8RA, Class A1, 5.30% (3 mo. USD LIBOR + 1.22%), 01/17/2032(b)(d) | | | 6,027,000 | | | | 5,875,861 | |
Octagon Investment Partners 31 LLC, Series 2017-1A, Class AR, 5.29% (3 mo. USD LIBOR + 1.05%), 07/20/2030(b)(d) | | | 5,500,000 | | | | 5,383,406 | |
Octagon Investment Partners 49 Ltd., Series 2020-5A, Class A1, 5.30% (3 mo. USD LIBOR + 1.22%), 01/15/2033(b)(d) | | | 5,507,000 | | | | 5,362,326 | |
OHA Loan Funding Ltd., Series 2016-1A, Class AR, 5.50% (3 mo. USD LIBOR + 1.26%), 01/20/2033(b)(d) | | | 5,076,061 | | | | 4,933,713 | |
Onslow Bay Mortgage Loan Trust, Series 2021-NQM4, Class A1, 1.96%, 10/25/2061(b)(g) | | | 3,905,627 | | | | 3,048,458 | |
| | | | | | | | |
| | | Principal
Amount | | | Value | |
Prestige Auto Receivables Trust, Series 2019-1A, Class C, 2.70%, 10/15/2024(b) | | $ | 972,499 | | | $ | 969,133 | |
Progress Residential Trust, | | | | | | | | |
Series 2020-SFR1, Class A, 1.73%, 04/17/2037(b) | | | 6,818,387 | | | | 6,173,191 | |
Series 2021-SFR10, Class A, 2.39%, 12/17/2040(b) | | | 2,415,000 | | | | 1,991,857 | |
Series 2022-SFR5, Class A, 4.45%, 06/17/2039(b) | | | 3,226,440 | | | | 3,026,672 | |
Race Point VIII CLO Ltd., Series 2013-8A, Class AR2, 4.02% (3 mo. USD LIBOR + 1.04%), 02/20/2030(b)(d) | | | 4,248,609 | | | | 4,177,835 | |
Residential Accredit Loans, Inc. Trust, | | | | | | | | |
Series 2006-QS13, Class 1A8, 6.00%, 09/25/2036 | | | 48,749 | | | | 37,248 | |
Series 2007-QS6, Class A28, 5.75%, 04/25/2037 | | | 260,464 | | | | 210,107 | |
Residential Mortgage Loan Trust, Series 2020-1, Class A1, 2.38%, 01/26/2060(b)(g) | | | 585,491 | | | | 554,123 | |
RUN Trust, Series 2022-NQM1, Class A1, 4.00%, 03/25/2067(b) | | | 2,137,912 | | | | 1,921,972 | |
Santander Drive Auto Receivables Trust, | | | | | | | | |
Series 2019-2, Class D, 3.22%, 07/15/2025 | | | 2,034,671 | | | | 2,019,679 | |
Series 2019-3, Class D, 2.68%, 10/15/2025 | | | 1,806,307 | | | | 1,794,990 | |
SG Residential Mortgage Trust, | | | | | | | | |
Series 2022-1, Class A1, 3.17%, 03/27/2062(b)(g) | | | 4,464,656 | | | | 3,873,417 | |
Series 2022-1, Class A2, 3.58%, 03/27/2062(b)(g) | | | 1,883,377 | | | | 1,628,431 | |
Sonic Capital LLC, | | | | | | | | |
Series 2021-1A, Class A2I, 2.19%, 08/20/2051(b) | | | 1,839,850 | | | | 1,444,479 | |
Series 2021-1A, Class A2II, 2.64%, 08/20/2051(b) | | | 1,800,283 | | | | 1,260,511 | |
STAR Trust, | | | | | | | | |
Series 2021-1, Class A1, 1.22%, 05/25/2065(b)(g) | | | 2,069,588 | | | | 1,914,916 | |
Series 2021-SFR1, Class A, 4.01% (1 mo. USD LIBOR + 0.60%), 04/17/2038(b)(d) | | | 11,612,369 | | | | 11,189,720 | |
Starwood Mortgage Residential Trust, | | | | | | | | |
Series 2020-1, Class A1, 2.28%, 02/25/2050(b)(g) | | | 143,077 | | | | 141,889 | |
Series 2021-6, Class A1, 1.92%, 11/25/2066(b)(g) | | | 4,860,258 | | | | 3,805,973 | |
Series 2022-1, Class A1, 2.45%, 12/25/2066(b)(g) | | | 3,514,672 | | | | 2,855,423 | |
Symphony CLO XXII Ltd., Series 2020-22A, Class A1A, 5.48% (3 mo. USD LIBOR + 1.29%), 04/18/2033(b)(d) | | | 3,000,000 | | | | 2,916,600 | |
Synchrony Card Funding LLC, Series 2022-A2, Class A, 3.86%, 07/15/2028 | | | 5,365,000 | | | | 5,202,428 | |
Textainer Marine Containers VII Ltd., Series 2021-2A, Class A, 2.23%, 04/20/2046(b) | | | 4,540,800 | | | | 3,805,271 | |
TICP CLO XV Ltd., Series 2020-15A, Class A, 5.52% (3 mo. USD LIBOR + 1.28%), 04/20/2033(b)(d) | | | 4,685,000 | | | | 4,550,391 | |
See accompanying Notes to Financial Statements which are an integral part of the financial statements.
| | |
| 17 | | Invesco Core Bond Fund |
| | | | | | | | |
| | | Principal
Amount | | | Value | |
Tricon American Homes Trust, Series 2020-SFR2, Class A, 1.48%, 11/17/2039(b) | | $ | 4,417,247 | | | $ | 3,584,935 | |
UBS Commercial Mortgage Trust, Series 2017-C5, Class XA, IO, 1.07%, 11/15/2050(i) | | | 15,806,057 | | | | 533,636 | |
Verus Securitization Trust, | | | | | | | | |
Series 2020-1, Class A1, 2.42%, 01/25/2060(b)(h) | | | 881,348 | | | | 833,048 | |
Series 2020-1, Class A2, 2.64%, 01/25/2060(b)(h) | | | 1,110,605 | | | | 1,050,195 | |
Series 2020-INV1, Class A1, 0.33%, 03/25/2060(b)(g) | | | 233,094 | | | | 227,317 | |
Series 2021-1, Class A1B, 1.32%, 01/25/2066(b)(g) | | | 960,862 | | | | 747,596 | |
Series 2021-7, Class A1, 1.83%, 10/25/2066(b)(g) | | | 3,843,829 | | | | 3,092,186 | |
Series 2021-R1, Class A1, 0.82%, 10/25/2063(b)(g) | | | 1,397,210 | | | | 1,270,923 | |
Series 2022-1, Class A1, 2.72%, 01/25/2067(b)(h) | | | 2,611,055 | | | | 2,141,899 | |
Series 2022-3, Class A1, 4.13%, 02/25/2067(b)(h) | | | 4,063,888 | | | | 3,604,369 | |
Series 2022-7, Class A1, 5.15%, 07/25/2067(b)(h) | | | 1,352,606 | | | | 1,276,819 | |
Visio Trust, Series 2020-1R, Class A1, 1.31%, 11/25/2055(b) | | | 955,677 | | | | 877,697 | |
WaMu Mortgage Pass-Through Ctfs. Trust, | | | | | | | | |
Series 2003-AR10, Class A7, 4.24%, 10/25/2033(g) | | | 211,453 | | | | 197,189 | |
Series 2005-AR14, Class 1A4, 3.32%, 12/25/2035(g) | | | 323,210 | | | | 301,692 | |
Series 2005-AR16, Class 1A1, 2.79%, 12/25/2035(g) | | | 301,714 | | | | 274,328 | |
Wells Fargo Commercial Mortgage Trust, | | | | | | | | |
Series 2015-NXS1, Class ASB, 2.93%, 05/15/2048 | | | 1,822,102 | | | | 1,785,502 | |
Series 2017-C42, Class XA, IO, 0.86%, 12/15/2050(i) | | | 17,885,304 | | | | 624,768 | |
WFRBS Commercial Mortgage Trust, | | | | | | | | |
Series 2013-C14, Class AS, 3.49%, 06/15/2046 | | | 2,330,000 | | | | 2,282,709 | |
Series 2014-C20, Class AS, 4.18%, 05/15/2047 | | | 1,693,000 | | | | 1,626,877 | |
Series 2014-C25, Class AS, 3.98%, 11/15/2047 | | | 5,225,000 | | | | 4,958,835 | |
Series 2014-LC14, Class AS, 4.35%, 03/15/2047(g) | | | 2,174,838 | | | | 2,110,130 | |
Zaxby’s Funding LLC, Series 2021-1A, Class A2, 3.24%, 07/30/2051(b) | | | 5,781,812 | | | | 4,617,649 | |
Total Asset-Backed Securities
(Cost $474,219,766) | | | | 425,428,560 | |
| | | | | | | | |
| | | Principal
Amount | | | Value | |
|
U.S. Government Sponsored Agency Mortgage-Backed Securities–26.09% | |
Collateralized Mortgage Obligations–0.73% | | | | | |
Fannie Mae Interest STRIPS, | | | | | | | | |
IO,
7.00%, 06/25/2023 to 04/25/2032(j) | | $ | 718,864 | | | $ | 143,976 | |
7.50%, 10/25/2023 to 11/25/2029(j) | | | 44,877 | | | | 2,379 | |
6.50%, 04/25/2029 to 02/25/2033(i)(j) | | | 1,161,639 | | | | 190,183 | |
6.00%, 06/25/2033 to 03/25/2036(i)(j) | | | 759,497 | | | | 132,054 | |
5.50%, 09/25/2033 to 06/25/2035(i)(j) | | | 1,337,558 | | | | 231,002 | |
Fannie Mae REMICs, | | | | | | | | |
6.50%, 06/25/2023 to 10/25/2031 | | | 158,343 | | | | 161,286 | |
4.50%, 08/25/2025 | | | 12,871 | | | | 12,698 | |
5.50%, 12/25/2025 to 07/25/2046(j) | | | 2,723,273 | | | | 1,767,452 | |
7.00%, 07/25/2026 to 04/25/2033(j) | | | 486,622 | | | | 78,517 | |
4.00%, 08/25/2026 to 08/25/2047(j) | | | 1,293,704 | | | | 213,407 | |
6.00%, 11/25/2028 | | | 67,545 | | | | 68,492 | |
7.50%, 12/25/2029 | | | 439,663 | | | | 457,124 | |
4.59% (1 mo. USD LIBOR + 1.00%), 07/25/2032(d) | | | 58,047 | | | | 58,535 | |
3.99% (1 mo. USD LIBOR + 0.40%), 03/25/2033(d) | | | 15,279 | | | | 15,080 | |
3.84% (1 mo. USD LIBOR + 0.25%), 08/25/2035(d) | | | 52,432 | | | | 51,823 | |
11.05% (24.20% - (3.67 x 1 mo. USD LIBOR)), 06/25/2036(d) | | | 125,655 | | | | 134,251 | |
4.53% (1 mo. USD LIBOR + 0.94%), 06/25/2037(d) | | | 79,309 | | | | 78,907 | |
5.00%, 04/25/2040 | | | 134,695 | | | | 133,308 | |
PO,
0.00%, 09/25/2023(k) | | | 3,268 | | | | 3,211 | |
IO,
3.11% (6.70% - (1.00 x 1 mo. USD LIBOR)), 02/25/2024 to 05/25/2035(d)(j) | | | 420,236 | | | | 30,431 | |
4.56% (8.15% - (1.00 x 1 mo. USD LIBOR)), 04/25/2027(d)(j) | | | 51,229 | | | | 2,930 | |
3.00%, 11/25/2027(j) | | | 1,123,545 | | | | 53,604 | |
3.51% (7.10% - (1.00 x 1 mo. USD LIBOR)), 11/25/2030(d)(j) | | | 12,256 | | | | 789 | |
6.39% (9.80% - (1.00 x 1 mo. USD LIBOR)), 03/17/2031(d)(j) | | | 29 | | | | 1 | |
4.16% (7.75% - (1.00 x 1 mo. USD LIBOR)), 07/25/2031 to 02/25/2032(d)(j) | | | 53,243 | | | | 5,020 | |
4.41% (7.85% - (1.00 x 1 mo. USD LIBOR)), 11/18/2031(d)(j) | | | 46,732 | | | | 4,169 | |
4.31% (7.90% - (1.00 x 1 mo. USD LIBOR)), 11/25/2031(d)(j) | | | 113,398 | | | | 10,683 | |
3.66% (7.25% - (1.00 x 1 mo. USD LIBOR)), 01/25/2032(d)(j) | | | 86,360 | | | | 7,737 | |
4.36% (7.95% - (1.00 x 1 mo. USD LIBOR)), 01/25/2032 to 07/25/2032(d)(j) | | | 149,414 | | | | 11,692 | |
See accompanying Notes to Financial Statements which are an integral part of the financial statements.
| | |
| 18 | | Invesco Core Bond Fund |
| | | | | | | | |
| | | Principal
Amount | | | Value | |
Collateralized Mortgage Obligations–(continued) | |
4.51% (8.10% - (1.00 x 1 mo. USD LIBOR)), 02/25/2032 to 03/25/2032(d)(j) | | $ | 17,775 | | | $ | 1,161 | |
1.00% (8.00% - (1.00 x 1 mo. USD LIBOR)), 04/25/2032(d)(j) | | | 146,532 | | | | 3,507 | |
3.41% (7.00% - (1.00 x 1 mo. USD LIBOR)), 04/25/2032 to 09/25/2032(d)(j) | | | 378,964 | | | | 29,320 | |
4.41% (8.00% - (1.00 x 1 mo. USD LIBOR)), 04/25/2032 to 12/25/2032(d)(j) | | | 280,939 | | | | 30,648 | |
4.56% (8.00% - (1.00 x 1 mo. USD LIBOR)), 12/18/2032(d)(j) | | | 179,110 | | | | 19,053 | |
4.66% (8.10% - (1.00 x 1 mo. USD LIBOR)), 12/18/2032(d)(j) | | | 51,650 | | | | 4,412 | |
4.61% (8.20% - (1.00 x 1 mo. USD LIBOR)), 01/25/2033(d)(j) | | | 248,696 | | | | 27,355 | |
4.66% (8.25% - (1.00 x 1 mo. USD LIBOR)), 02/25/2033 to 05/25/2033(d)(j) | | | 178,182 | | | | 23,867 | |
3.96% (7.55% - (1.00 x 1 mo. USD LIBOR)), 10/25/2033(d)(j) | | | 193,204 | | | | 20,632 | |
3.16% (6.75% - (1.00 x 1 mo. USD LIBOR)), 03/25/2035(d)(j) | | | 78,906 | | | | 5,081 | |
3.01% (6.60% - (1.00 x 1 mo. USD LIBOR)), 05/25/2035(d)(j) | | | 262,529 | | | | 15,139 | |
3.50%, 08/25/2035(j) | | | 4,026,671 | | | | 510,780 | |
2.51% (6.10% - (1.00 x 1 mo. USD LIBOR)), 10/25/2035(d)(j) | | | 196,023 | | | | 14,173 | |
2.99% (6.58% - (1.00 x 1 mo. USD LIBOR)), 06/25/2036(d)(j) | | | 12,483 | | | | 1,084 | |
2.46% (6.05% - (1.00 x 1 mo. USD LIBOR)), 07/25/2038(d)(j) | | | 75,404 | | | | 1,976 | |
2.96% (6.55% - (1.00 x 1 mo. USD LIBOR)), 10/25/2041(d)(j) | | | 376,703 | | | | 24,091 | |
2.56% (6.15% - (1.00 x 1 mo. USD LIBOR)), 12/25/2042(d)(j) | | | 879,973 | | | | 80,473 | |
2.31% (5.90% - (1.00 x 1 mo. USD LIBOR)), 09/25/2047(d)(j) | | | 6,278,431 | | | | 397,771 | |
Freddie Mac Multifamily Structured Pass-Through Ctfs., | | | | | | | | |
Series KC02, Class X1, IO, 1.91%, 03/25/2024(i) | | | 65,637,690 | | | | 302,918 | |
Series KC03, Class X1, IO, 0.63%, 11/25/2024(i) | | | 40,712,820 | | | | 422,904 | |
Series K734, Class X1, IO, 0.65%, 02/25/2026(i) | | | 32,887,213 | | | | 549,430 | |
Series K735, Class X1, IO, 1.10%, 05/25/2026(i) | | | 33,882,775 | | | | 918,887 | |
Series K093, Class X1, IO, 0.95%, 05/25/2029(i) | | | 27,619,619 | | | | 1,340,797 | |
| | | | | | | | |
| | | Principal
Amount | | | Value | |
Collateralized Mortgage Obligations–(continued) | |
Freddie Mac REMICs, | | | | | | | | |
5.00%, 09/15/2023 | | $ | 22,808 | | | $ | 22,732 | |
4.46% (1 mo. USD LIBOR + 1.05%), 10/15/2023(d) | | | 25,685 | | | | 25,732 | |
6.50%, 02/15/2028 to 06/15/2032 | | | 651,249 | | | | 667,529 | |
6.00%, 04/15/2029 | | | 40,597 | | | | 41,166 | |
4.31% (1 mo. USD LIBOR + 0.90%), 07/15/2031(d) | | | 42,698 | | | | 42,906 | |
7.00%, 03/15/2032 | | | 174,607 | | | | 182,726 | |
3.50%, 05/15/2032 | | | 142,261 | | | | 135,210 | |
4.41% (1 mo. USD LIBOR + 1.00%), 06/15/2032(d) | | | 198,082 | | | | 199,429 | |
12.24% (24.75% - (3.67 x 1 mo. USD LIBOR)), 08/15/2035(d) | | | 35,197 | | | | 40,583 | |
3.81% (1 mo. USD LIBOR + 0.40%), 09/15/2035(d) | | | 92,197 | | | | 90,509 | |
IO,
4.24% (7.65% - (1.00 x 1 mo. USD LIBOR)), 07/15/2026 to 03/15/2029(d)(j) | | | 145,053 | | | | 6,915 | |
3.00%, 06/15/2027 to 05/15/2040(j) | | | 3,763,457 | | | | 186,903 | |
2.50%, 05/15/2028(j) | | | 801,863 | | | | 36,348 | |
4.29% (7.70% - (1.00 x 1 mo. USD LIBOR)), 03/15/2029(d)(j) | | | 21,938 | | | | 664 | |
4.69% (8.10% - (1.00 x 1 mo. USD LIBOR)), 09/15/2029(d)(j) | | | 7,952 | | | | 449 | |
4.34% (7.75% - (1.00 x 1 mo. USD LIBOR)), 01/15/2032(d)(j) | | | 100,962 | | | | 7,213 | |
3.64% (7.05% - (1.00 x 1 mo. USD LIBOR)), 10/15/2033(d)(j) | | | 224,233 | | | | 13,699 | |
3.29% (6.70% - (1.00 x 1 mo. USD LIBOR)), 01/15/2035(d)(j) | | | 234,454 | | | | 11,303 | |
3.34% (6.75% - (1.00 x 1 mo. USD LIBOR)), 02/15/2035(d)(j) | | | 170,089 | | | | 8,710 | |
3.31% (6.72% - (1.00 x 1 mo. USD LIBOR)), 05/15/2035(d)(j) | | | 888,760 | | | | 52,860 | |
3.24% (6.65% - (1.00 x 1 mo. USD LIBOR)), 07/15/2035(d)(j) | | | 335,843 | | | | 35,479 | |
3.59% (7.00% - (1.00 x 1 mo. USD LIBOR)), 12/15/2037(d)(j) | | | 85,114 | | | | 7,989 | |
2.59% (6.00% - (1.00 x 1 mo. USD LIBOR)), 04/15/2038(d)(j) | | | 48,685 | | | | 3,502 | |
2.66% (6.07% - (1.00 x 1 mo. USD LIBOR)), 05/15/2038(d)(j) | | | 1,146,646 | | | | 79,060 | |
2.84% (6.25% - (1.00 x 1 mo. USD LIBOR)), 12/15/2039(d)(j) | | | 311,543 | | | | 18,817 | |
2.69% (6.10% - (1.00 x 1 mo. USD LIBOR)), 01/15/2044(d)(j) | | | 974,750 | | | | 94,004 | |
4.00%, 03/15/2045(j) | | | 458,297 | | | | 40,036 | |
Freddie Mac STRIPS, | | | | | | | | |
IO,
7.00%, 04/01/2027(j) | | | 69,669 | | | | 6,747 | |
3.00%, 12/15/2027(j) | | | 1,439,060 | | | | 79,905 | |
3.27%, 12/15/2027(i) | | | 382,456 | | | | 18,344 | |
6.50%, 02/01/2028(j) | | | 7,167 | | | | 780 | |
7.50%, 12/15/2029(j) | | | 20,955 | | | | 3,228 | |
6.00%, 12/15/2032(j) | | | 66,066 | | | | 8,690 | |
PO,
0.00%, 06/01/2026(k) | | | 7,530 | | | | 7,011 | |
| | | | | | | | 10,983,378 | |
See accompanying Notes to Financial Statements which are an integral part of the financial statements.
| | |
| 19 | | Invesco Core Bond Fund |
| | | | | | | | |
| | | Principal
Amount | | | Value | |
Federal Home Loan Mortgage Corp. (FHLMC)–0.09% | |
6.00%, 07/01/2024 to 11/01/2037 | | $ | 62,179 | | | $ | 63,499 | |
9.00%, 01/01/2025 to 05/01/2025 | | | 759 | | | | 773 | |
6.50%, 07/01/2028 to 04/01/2034 | | | 73,018 | | | | 75,438 | |
7.00%, 10/01/2031 to 10/01/2037 | | | 716,213 | | | | 746,084 | |
5.50%, 09/01/2039 | | | 396,014 | | | | 405,245 | |
| | |
| | | | | | | | 1,291,039 | |
|
Federal National Mortgage Association (FNMA)–0.67% | |
6.50%, 12/01/2029 to 11/01/2031 | | | 490,973 | | | | 506,664 | |
7.50%, 01/01/2033 to 08/01/2033 | | | 520,492 | | | | 541,212 | |
7.00%, 04/01/2033 to 04/01/2034 | | | 306,622 | | | | 316,625 | |
5.50%, 02/01/2035 to 05/01/2036 | | | 386,023 | | | | 395,154 | |
4.00%, 05/01/2052 | | | 9,156,842 | | | | 8,380,010 | |
| | |
| | | | | | | | 10,139,665 | |
|
Government National Mortgage Association (GNMA)–3.97% | |
ARM,
2.63% (1 yr. U.S. Treasury Yield Curve Rate + 1.50%), 07/20/2025 to 07/20/2027(d) | | | 1,227 | | | | 1,207 | |
IO,
4.09% (7.50% - (1.00 x 1 mo. USD LIBOR)), 02/16/2032(d)(j) | | | 19,661 | | | | 5 | |
3.14% (6.55% - (1.00 x 1 mo. USD LIBOR)), 04/16/2037(d)(j) | | | 607,372 | | | | 41,445 | |
3.24% (6.65% - (1.00 x 1 mo. USD LIBOR)), 04/16/2041(d)(j) | | | 1,773,488 | | | | 99,777 | |
4.50%, 09/16/2047(j) | | | 2,727,636 | | | | 466,998 | |
2.79% (6.20% - (1.00 x 1 mo. USD LIBOR)), 10/16/2047(d)(j) | | | 2,250,365 | | | | 184,025 | |
TBA,
2.50%, 11/01/2052(l) | | | 69,445,000 | | | | 58,865,970 | |
| | |
| | | | | | | | 59,659,427 | |
|
Uniform Mortgage-Backed Securities–20.63% | |
TBA,
2.50%, 11/01/2052(l) | | | 80,000,000 | | | | 65,500,555 | |
3.00%, 11/01/2052(l) | | | 80,000,000 | | | | 68,018,750 | |
4.00%, 11/01/2052(l) | | | 16,410,000 | | | | 14,920,023 | |
4.50%, 11/01/2052(l) | | | 16,409,000 | | | | 15,396,257 | |
5.00%, 11/01/2052(l) | | | 46,000,000 | | | | 44,370,234 | |
5.50%, 11/01/2052(l) | | | 59,800,000 | | | | 58,998,452 | |
6.00%, 11/01/2052(l) | | | 43,000,000 | | | | 43,219,669 | |
| | | | | | | | 310,423,940 | |
Total U.S. Government Sponsored Agency Mortgage-Backed Securities
(Cost $403,783,846) | | | | 392,497,449 | |
| |
U.S. Treasury Securities–7.29% | | | | | |
U.S. Treasury Bonds–3.16% | | | | | |
3.38%, 08/15/2042 | | | 29,752,400 | | | | 25,675,392 | |
2.88%, 05/15/2052 | | | 28,266,200 | | | | 21,946,054 | |
| | |
| | | | | | | | 47,621,446 | |
| | | | | | | | |
| | | Principal
Amount | | | Value | |
U.S. Treasury Notes–4.13% | | | | | |
4.38%, 10/31/2024 | | $ | 27,155,000 | | | $ | 27,099,843 | |
4.25%, 10/15/2025 | | | 10,400 | | | | 10,346 | |
4.13%, 09/30/2027 | | | 0 | | | | 0 | |
4.13%, 10/31/2027 | | | 34,018,600 | | | | 33,843,192 | |
3.88%, 09/30/2029 | | | 0 | | | | 0 | |
4.00%, 10/31/2029 | | | 831,200 | | | | 823,472 | |
2.75%, 08/15/2032 | | | 343,300 | | | | 307,253 | |
| | |
| | | | | | | | 62,084,106 | |
Total U.S. Treasury Securities
(Cost $117,405,531) | | | | 109,705,552 | |
|
Agency Credit Risk Transfer Notes–0.79% | |
Fannie Mae Connecticut Avenue Securities, | | | | | | | | |
Series 2016-C02, Class 1M2, 9.59% (1 mo. USD LIBOR + 6.00%), 09/25/2028(d) | | | 1,173,089 | | | | 1,212,631 | |
Series 2022-R03, Class 1M1, 5.10% (30 Day Average SOFR + 2.10%),
03/25/2042(b)(d) | | | 4,090,313 | | | | 4,036,870 | |
Series 2022-R04, Class 1M1, 5.00% (30 Day Average SOFR + 2.00%),
03/25/2042(b)(d) | | | 2,122,119 | | | | 2,087,307 | |
Freddie Mac, | | | | | | | | |
Series 2014-DN3, Class M3, STACR® , 7.59% (1 mo. USD LIBOR + 4.00%), 08/25/2024(d) | | | 570,679 | | | | 570,961 | |
Series 2022-DNA3, Class M1A, STACR® , 5.00% (30 Day Average SOFR + 2.00%),
04/25/2042(b)(d) | | | 3,018,368 | | | | 2,960,034 | |
Series 2022-DNA6, Class M1, STACR® , 5.15% (30 Day Average SOFR + 2.15%),
09/25/2042(b)(d) | | | 999,546 | | | | 992,834 | |
Total Agency Credit Risk Transfer Notes (Cost $12,084,034) | | | | 11,860,637 | |
|
Municipal Obligations–0.51% | |
California (State of) Health Facilities Financing Authority (Social Bonds), | | | | | | | | |
Series 2022, RB, 4.19%, 06/01/2037 | | | 1,370,000 | | | | 1,157,111 | |
Series 2022, RB, 4.35%, 06/01/2041 | | | 995,000 | | | | 817,997 | |
California State University, | | | | | | | | |
Series 2021 B, Ref. RB, 2.72%, 11/01/2052 | | | 1,725,000 | | | | 1,000,174 | |
Series 2021 B, Ref. RB, 2.94%, 11/01/2052 | | | 2,585,000 | | | | 1,596,339 | |
Texas (State of) Transportation Commission (Central Texas Turnpike System), Series 2020 C, Ref. RB, 3.03%, 08/15/2041 | | | 4,965,000 | | | | 3,159,150 | |
Total Municipal Obligations
(Cost $11,640,000) | | | | 7,730,771 | |
| | |
| | | Shares | | | | |
Preferred Stocks–0.28% | |
Asset Management & Custody Banks–0.08% | |
Bank of New York Mellon Corp. (The), 4.70%, Series G,
Pfd.(c) | | | 1,173,000 | | | | 1,126,080 | |
|
Investment Banking & Brokerage–0.11% | |
Charles Schwab Corp. (The), 4.00%, Series H, Pfd.(c) | | | 2,214,000 | | | | 1,647,216 | |
See accompanying Notes to Financial Statements which are an integral part of the financial statements.
| | |
| 20 | | Invesco Core Bond Fund |
| | | | | | | | |
| | | Shares | | | Value | |
|
Other Diversified Financial Services–0.09% | |
Equitable Holdings, Inc., 4.95%, Series B, Pfd.(c) | | | 1,502,000 | | | $ | 1,400,615 | |
| |
Total Preferred Stocks (Cost $4,889,000) | | | | 4,173,911 | |
| |
|
Money Market Funds–7.92% | |
Invesco Government & Agency Portfolio, Institutional Class, 3.07%(m)(n) | | | 42,417,738 | | | | 42,417,738 | |
Invesco Liquid Assets Portfolio, Institutional Class, 3.03%(m)(n) | | | 28,197,126 | | | | 28,202,765 | |
| | | | | | | | |
| | | Shares | | | Value | |
|
Money Market Funds–(continued) | |
Invesco Treasury Portfolio, Institutional Class, 3.08%(m)(n) | | | 48,477,414 | | | $ | 48,477,414 | |
Total Money Market Funds
(Cost $119,087,974) | | | | 119,097,917 | |
| |
TOTAL INVESTMENTS IN SECURITIES-124.25%
(Cost $2,044,575,898) | | | | 1,869,521,648 | |
| |
OTHER ASSETS LESS LIABILITIES-(24.25)% | | | | (364,826,856 | ) |
| |
NET ASSETS–100.00% | | | | | | $ | 1,504,694,792 | |
| |
| | |
| Investment Abbreviations: |
| |
| ARM | | – Adjustable Rate Mortgage |
| Ctfs. | | – Certificates |
| IO | | – Interest Only |
| LIBOR | | – London Interbank Offered Rate |
| Pfd. | | – Preferred |
| PO | | – Principal Only |
| RB | | – Revenue Bonds |
| Ref. | | – Refunding |
| REIT | | – Real Estate Investment Trust |
| REMICs | | – Real Estate Mortgage Investment Conduits |
| SOFR | | – Secured Overnight Financing Rate |
| STACR® | | – Structured Agency Credit Risk |
| STRIPS | | – Separately Traded Registered Interest and Principal Security |
| TBA | | – To Be Announced |
| USD | | – U.S. Dollar |
Notes to Schedule of Investments:
| (a) | Industry and/or sector classifications used in this report are generally according to the Global Industry Classification Standard, which was developed by and is the exclusive property and a service mark of MSCI Inc. and Standard & Poor’s. |
| (b) | Security purchased or received in a transaction exempt from registration under the Securities Act of 1933, as amended (the “1933 Act”). The security may be resold pursuant to an exemption from registration under the 1933 Act, typically to qualified institutional buyers. The aggregate value of these securities at October 31, 2022 was $491,821,337, which represented 32.69% of the Fund’s Net Assets. |
| (c) | Security issued at a fixed rate for a specific period of time, after which it will convert to a variable rate. |
| (d) | Interest or dividend rate is redetermined periodically. Rate shown is the rate in effect on October 31, 2022. |
| (e) | Perpetual bond with no specified maturity date. |
| (f) | Security valued using significant unobservable inputs (Level 3). See Note 3. |
| (g) | Interest rate is redetermined periodically based on the cash flows generated by the pool of assets backing the security, less any applicable fees. The rate shown is the rate in effect on October 31, 2022. |
| (h) | Step coupon bond. The interest rate represents the coupon rate at which the bond will accrue at a specified future date. |
| (i) | Interest only security. Principal amount shown is the notional principal and does not reflect the maturity value of the security. Interest rate is redetermined periodically based on the cash flows generated by the pool of assets backing the security, less any applicable fees. The rate shown is the rate in effect on October 31, 2022. |
| (j) | Interest only security. Principal amount shown is the notional principal and does not reflect the maturity value of the security. |
| (k) | Zero coupon bond issued at a discount. |
| (l) | Security purchased on a forward commitment basis. This security is subject to dollar roll transactions. See Note 1N. |
| (m) | Affiliated issuer. The issuer and/or the Fund is a wholly-owned subsidiary of Invesco Ltd., or is affiliated by having an investment adviser that is under common control of Invesco Ltd. The table below shows the Fund’s transactions in, and earnings from, its investments in affiliates for the fiscal year ended October 31, 2022. |
| | | | | | | | | | | | | | | | | | | | | | | | | | | | |
| | | Value
October 31, 2021 | | | Purchases
at Cost | | | Proceeds
from Sales | | | Change in
Unrealized
Appreciation | | | Realized
Gain
(Loss) | | | Value
October 31, 2022 | | | Dividend Income | |
| |
Investments in Affiliated Money Market Funds: | |
| |
Invesco Government & Agency Portfolio, Institutional Class | | $ | 120,599,560 | | | $ | 188,957,598 | | | $ | (267,139,420 | ) | | $ | - | | | $ | - | | | $ | 42,417,738 | | | $ | 509,808 | |
| |
Invesco Liquid Assets Portfolio, Institutional Class | | | 84,066,037 | | | | 134,969,712 | | | | (190,813,870 | ) | | | 17,612 | | | | (36,726) | | | | 28,202,765 | | | | 344,431 | |
| |
Invesco Treasury Portfolio, Institutional Class | | | 137,828,068 | | | | 215,951,540 | | | | (305,302,194 | ) | | | - | | | | - | | | | 48,477,414 | | | | 552,964 | |
| |
Total | | $ | 342,493,665 | | | $ | 539,878,850 | | | $ | (763,255,484 | ) | | $ | 17,612 | | | $ | (36,726) | | | $ | 119,097,917 | | | $ | 1,407,203 | |
| |
| (n) | The rate shown is the 7-day SEC standardized yield as of October 31, 2022. |
See accompanying Notes to Financial Statements which are an integral part of the financial statements.
| | |
| 21 | | Invesco Core Bond Fund |
| | | | | | | | | | | | | | | | |
| Open Futures Contracts(a) | |
| |
| Long Futures Contracts | | Number of
Contracts | | Expiration Month | | Notional
Value | | | Value | | | Unrealized Appreciation (Depreciation) | |
| |
Interest Rate Risk | | | | | | | | | | | | | | | | |
| |
U.S. Treasury 2 Year Notes | | 29 | | December-2022 | | $ | 5,927,102 | | | $ | (126,064 | ) | | $ | (126,064 | ) |
| |
U.S. Treasury 5 Year Notes | | 142 | | December-2022 | | | 15,136,312 | | | | (12,598 | ) | | | (12,598 | ) |
| |
U.S. Treasury 10 Year Notes | | 680 | | December-2022 | | | 75,203,750 | | | | (3,254,193 | ) | | | (3,254,193 | ) |
| |
U.S. Treasury Long Bonds | | 227 | | December-2022 | | | 27,353,500 | | | | (2,270,844 | ) | | | (2,270,844 | ) |
| |
Subtotal-Long Futures Contracts | | | | | | | | | | | (5,663,699 | ) | | | (5,663,699 | ) |
| |
| | | | | |
Short Futures Contracts | | | | | | | | | | | | | | | | |
| |
Interest Rate Risk | | | | | | | | | | | | | | | | |
| |
U.S. Treasury 10 Year Ultra Notes | | 966 | | December-2022 | | | (112,040,906 | ) | | | 6,523,152 | | | | 6,523,152 | |
| |
U.S. Treasury Ultra Bonds | | 3 | | December-2022 | | | (382,969 | ) | | | (1,796 | ) | | | (1,796 | ) |
| |
Subtotal-Short Futures Contracts | | | | | | | | | | | 6,521,356 | | | | 6,521,356 | |
| |
Total Futures Contracts | | | | | | | | | | $ | 857,657 | | | $ | 857,657 | |
| |
| (a) | Futures contracts collateralized by $1,202,944 cash held with Bank of America Merrill Lynch, the futures commission merchant. |
See accompanying Notes to Financial Statements which are an integral part of the financial statements.
| | |
| 22 | | Invesco Core Bond Fund |
Statement of Assets and Liabilities
October 31, 2022
| | | | |
Assets: | | | | |
Investments in unaffiliated securities, at value (Cost $ 1,925,487,924) | | $ | 1,750,423,731 | |
| |
Investments in affiliated money market funds, at value
(Cost $ 119,087,974) | | | 119,097,917 | |
| |
Other investments: | | | | |
Variation margin receivable – futures contracts | | | 2,478,355 | |
| |
Deposits with brokers: | | | | |
Cash collateral – exchange-traded futures contracts | | | 1,202,944 | |
| |
Cash collateral – TBA commitments | | | 3,088,000 | |
| |
Cash | | | 13,914,797 | |
| |
Receivable for: | | | | |
Investments sold | | | 96,351,563 | |
| |
Fund shares sold | | | 15,564,493 | |
| |
Dividends | | | 372,884 | |
| |
Interest | | | 9,920,397 | |
| |
Principal paydowns | | | 1,210 | |
| |
Investment for trustee deferred compensation and retirement plans | | | 123,185 | |
| |
Other assets | | | 92,264 | |
|
| |
Total assets | | | 2,012,631,740 | |
|
| |
| |
Liabilities: | | | | |
Payable for: | | | | |
Investments purchased | | | 128,565,076 | |
| |
TBA sales commitment | | | 375,295,253 | |
| |
Dividends | | | 746,072 | |
| |
Fund shares reacquired | | | 2,379,987 | |
| |
Accrued fees to affiliates | | | 657,262 | |
| |
Accrued trustees’ and officers’ fees and benefits | | | 1,714 | |
| |
Accrued other operating expenses | | | 168,399 | |
| |
Trustee deferred compensation and retirement plans | | | 123,185 | |
|
| |
Total liabilities | | | 507,936,948 | |
|
| |
Net assets applicable to shares outstanding | | $ | 1,504,694,792 | |
|
| |
| | | | |
Net assets consist of: | | | | |
Shares of beneficial interest | | $ | 1,865,058,094 | |
| |
Distributable earnings (loss) | | | (360,363,302 | ) |
|
| |
| | $ | 1,504,694,792 | |
|
| |
| |
Net Assets: | | | | |
Class A | | $ | 566,063,913 | |
|
| |
Class C | | $ | 41,619,597 | |
|
| |
Class R | | $ | 68,228,060 | |
|
| |
Class Y | | $ | 544,604,961 | |
|
| |
Class R5 | | $ | 13,606 | |
|
| |
Class R6 | | $ | 284,164,655 | |
|
| |
|
Shares outstanding, no par value, with an unlimited number of shares authorized: | |
Class A | | | 102,821,952 | |
|
| |
Class C | | | 7,553,158 | |
|
| |
Class R | | | 12,397,398 | |
|
| |
Class Y | | | 99,541,575 | |
|
| |
Class R5 | | | 2,472 | |
|
| |
Class R6 | | | 51,654,699 | |
|
| |
Class A: | | | | |
Net asset value per share | | $ | 5.51 | |
| |
Maximum offering price per share
(Net asset value of $5.51 ÷ 95.75%) | | $ | 5.75 | |
|
| |
Class C: | | | | |
Net asset value and offering price per share | | $ | 5.51 | |
|
| |
Class R: | | | | |
Net asset value and offering price per share | | $ | 5.50 | |
|
| |
Class Y: | | | | |
Net asset value and offering price per share | | $ | 5.47 | |
|
| |
Class R5: | | | | |
Net asset value and offering price per share | | $ | 5.50 | |
|
| |
Class R6: | | | | |
Net asset value and offering price per share | | $ | 5.50 | |
|
| |
See accompanying Notes to Financial Statements which are an integral part of the financial statements.
| | |
| 23 | | Invesco Core Bond Fund |
Statement of Operations
For the year ended October 31, 2022
| | | | |
Investment income: | | | | |
Interest (net of foreign withholding taxes of $(1,105)) | | $ | 47,390,688 | |
|
| |
Dividends from affiliated money market funds | | | 1,407,203 | |
|
| |
Total investment income | | | 48,797,891 | |
|
| |
| |
Expenses: | | | | |
Advisory fees | | | 5,842,638 | |
|
| |
Administrative services fees | | | 243,953 | |
|
| |
Custodian fees | | | 18,287 | |
|
| |
Distribution fees: | | | | |
Class A | | | 1,642,689 | |
|
| |
Class C | | | 541,799 | |
|
| |
Class R | | | 386,062 | |
|
| |
Transfer agent fees – A, C, R and Y | | | 2,279,149 | |
|
| |
Transfer agent fees – R5 | | | 11 | |
|
| |
Transfer agent fees – R6 | | | 92,483 | |
|
| |
Trustees’ and officers’ fees and benefits | | | 33,287 | |
|
| |
Registration and filing fees | | | 183,806 | |
|
| |
Reports to shareholders | | | 73,025 | |
|
| |
Professional services fees | | | 92,209 | |
|
| |
Other | | | 26,525 | |
|
| |
Total expenses | | | 11,455,923 | |
|
| |
Less: Fees waived, expenses reimbursed and/or expense offset arrangement(s) | | | (1,395,660 | ) |
|
| |
Net expenses | | | 10,060,263 | |
|
| |
Net investment income | | | 38,737,628 | |
|
| |
| |
Realized and unrealized gain (loss) from: | | | | |
Net realized gain (loss) from: | | | | |
Unaffiliated investment securities | | | (165,046,819 | ) |
|
| |
Affiliated investment securities | | | (36,726 | ) |
|
| |
Foreign currencies | | | 5,821 | |
|
| |
Forward foreign currency contracts | | | 348,997 | |
|
| |
Futures contracts | | | (16,780,752 | ) |
|
| |
| | | (181,509,479 | ) |
|
| |
Change in net unrealized appreciation (depreciation) of: | | | | |
Unaffiliated investment securities | | | (181,536,928 | ) |
|
| |
Affiliated investment securities | | | 17,612 | |
|
| |
Futures contracts | | | 2,619,625 | |
|
| |
| | | (178,899,691 | ) |
|
| |
Net realized and unrealized gain (loss) | | | (360,409,170 | ) |
|
| |
Net increase (decrease) in net assets resulting from operations | | $ | (321,671,542 | ) |
|
| |
See accompanying Notes to Financial Statements which are an integral part of the financial statements.
| | |
| 24 | | Invesco Core Bond Fund |
Statement of Changes in Net Assets
For the years ended October 31, 2022 and 2021
| | | | | | | | |
| | | 2022 | | | 2021 | |
|
| |
Operations: | | | | | | | | |
Net investment income | | $ | 38,737,628 | | | $ | 25,808,194 | |
|
| |
Net realized gain (loss) | | | (181,509,479 | ) | | | 2,794,380 | |
|
| |
Change in net unrealized appreciation (depreciation) | | | (178,899,691 | ) | | | (24,947,671 | ) |
|
| |
Net increase (decrease) in net assets resulting from operations | | | (321,671,542 | ) | | | 3,654,903 | |
|
| |
| | |
Distributions to shareholders from distributable earnings: | | | | | | | | |
Class A | | | (16,307,502 | ) | | | (24,735,941 | ) |
|
| |
Class C | | | (896,446 | ) | | | (2,206,867 | ) |
|
| |
Class R | | | (1,685,982 | ) | | | (2,304,208 | ) |
|
| |
Class Y | | | (16,570,288 | ) | | | (23,138,369 | ) |
|
| |
Class R5 | | | (416 | ) | | | (601 | ) |
|
| |
Class R6 | | | (8,105,449 | ) | | | (9,852,844 | ) |
|
| |
Total distributions from distributable earnings | | | (43,566,083 | ) | | | (62,238,830 | ) |
|
| |
| | |
Share transactions–net: | | | | | | | | |
Class A | | | (52,098,582 | ) | | | 20,914,652 | |
|
| |
Class C | | | (15,137,193 | ) | | | (24,232,213 | ) |
|
| |
Class R | | | 72,409 | | | | 8,288,547 | |
|
| |
Class Y | | | (45,598,670 | ) | | | 119,908,386 | |
|
| |
Class R6 | | | 35,989,122 | | | | 56,640,636 | |
|
| |
Net increase (decrease) in net assets resulting from share transactions | | | (76,772,914 | ) | | | 181,520,008 | |
|
| |
Net increase (decrease) in net assets | | | (442,010,539 | ) | | | 122,936,081 | |
|
| |
| | |
Net assets: | | | | | | | | |
Beginning of year | | | 1,946,705,331 | | | | 1,823,769,250 | |
|
| |
End of year | | $ | 1,504,694,792 | | | $ | 1,946,705,331 | |
|
| |
See accompanying Notes to Financial Statements which are an integral part of the financial statements.
| | |
| 25 | | Invesco Core Bond Fund |
Financial Highlights
The following schedule presents financial highlights for a share of the Fund outstanding throughout the periods indicated.
| | | | | | | | | | | | | | | | | | | | | | | | | | | | | | | | | | | | | | | | | | | | | | | | | | | | | | | | |
| | | Net asset value, beginning of period | | | Net investment income(a) | | | Net gains (losses) on securities (both
realized and unrealized) | | | Total from
investment
operations | | | Dividends
from net
investment
income | | | Distributions
from net
realized
gains | | | Total
distributions | | | Net asset
value, end
of period | | | Total
return(b) | | | Net assets,
end of period
(000’s omitted) | | | Ratio of
expenses
to average net assets
with
fee waivers
and/or expenses absorbed | | | Ratio of
expenses
to average net
assets without fee waivers
and/or
expenses
absorbed(c) | | | Ratio of net
investment
income to average
net assets | | | Portfolio turnover(d)(e) | |
Class A | | | | | | | | | | | | | | | | | | | | | | | | | | | | | | | | | | | | | | | | | | | | | | | | | | | | | | | | |
Year ended 10/31/22 | | $ | 6.84 | | | $ | 0.13 | | | $ | (1.31 | ) | | $ | (1.18 | ) | | $ | (0.15 | ) | | $ | – | | | $ | (0.15 | ) | | $ | 5.51 | | | | (17.43 | )% | | $ | 566,064 | | | | 0.69 | % | | | 0.79 | % | | | 2.17 | % | | | 413 | % |
Year ended 10/31/21 | | | 7.05 | | | | 0.09 | | | | (0.08 | ) | | | 0.01 | | | | (0.10 | ) | | | (0.12 | ) | | | (0.22 | ) | | | 6.84 | | | | 0.15 | | | | 760,690 | | | | 0.72 | | | | 0.79 | | | | 1.23 | | | | 526 | |
Year ended 10/31/20 | | | 7.03 | | | | 0.14 | | | | 0.37 | | | | 0.51 | | | | (0.15 | ) | | | (0.34 | ) | | | (0.49 | ) | | | 7.05 | | | | 7.36 | (f) | | | 763,731 | | | | 0.74 | (f) | | | 0.80 | (f) | | | 1.98 | (f) | | | 397 | |
Ten months ended 10/31/19 | | | 6.57 | | | | 0.17 | | | | 0.46 | | | | 0.63 | | | | (0.17 | ) | | | – | | | | (0.17 | ) | | | 7.03 | | | | 9.73 | | | | 563,054 | | | | 0.75 | (g) | | | 0.81 | (g) | | | 2.95 | (g) | | | 86 | |
Year ended 12/31/18 | | | 6.86 | | | | 0.21 | | | | (0.29 | ) | | | (0.08 | ) | | | (0.21 | ) | | | – | | | | (0.21 | ) | | | 6.57 | | | | (1.12 | ) | | | 478,723 | | | | 0.75 | | | | 0.80 | | | | 3.18 | | | | 64 | |
Year ended 12/31/17 | | | 6.76 | | | | 0.18 | | | | 0.11 | | | | 0.29 | | | | (0.19 | ) | | | – | | | | (0.19 | ) | | | 6.86 | | | | 4.29 | | | | 561,713 | | | | 0.77 | | | | 0.87 | | | | 2.62 | | | | 86 | |
Class C | | | | | | | | | | | | | | | | | | | | | | | | | | | | | | | | | | | | | | | | | | | | | | | | | | | | | | | | |
Year ended 10/31/22 | | | 6.84 | | | | 0.09 | | | | (1.32 | ) | | | (1.23 | ) | | | (0.10 | ) | | | – | | | | (0.10 | ) | | | 5.51 | | | | (18.07 | ) | | | 41,620 | | | | 1.44 | | | | 1.54 | | | | 1.42 | | | | 413 | |
Year ended 10/31/21 | | | 7.05 | | | | 0.03 | | | | (0.07 | ) | | | (0.04 | ) | | | (0.05 | ) | | | (0.12 | ) | | | (0.17 | ) | | | 6.84 | | | | (0.64 | ) | | | 68,167 | | | | 1.48 | | | | 1.54 | | | | 0.47 | | | | 526 | |
Year ended 10/31/20 | | | 7.03 | | | | 0.08 | | | | 0.37 | | | | 0.45 | | | | (0.09 | ) | | | (0.34 | ) | | | (0.43 | ) | | | 7.05 | | | | 6.51 | | | | 94,978 | | | | 1.55 | | | | 1.56 | | | | 1.17 | | | | 397 | |
Ten months ended 10/31/19 | | | 6.58 | | | | 0.12 | | | | 0.46 | | | | 0.58 | | | | (0.13 | ) | | | – | | | | (0.13 | ) | | | 7.03 | | | | 8.85 | | | | 75,026 | | | | 1.54 | (g) | | | 1.56 | (g) | | | 2.15 | (g) | | | 86 | |
Year ended 12/31/18 | | | 6.87 | | | | 0.16 | | | | (0.29 | ) | | | (0.13 | ) | | | (0.16 | ) | | | – | | | | (0.16 | ) | | | 6.58 | | | | (1.90 | ) | | | 91,596 | | | | 1.55 | | | | 1.55 | | | | 2.38 | | | | 64 | |
Year ended 12/31/17 | | | 6.77 | | | | 0.12 | | | | 0.11 | | | | 0.23 | | | | (0.13 | ) | | | – | | | | (0.13 | ) | | | 6.87 | | | | 3.43 | | | | 109,888 | | | | 1.60 | | | | 1.63 | | | | 1.79 | | | | 86 | |
Class R | | | | | | | | | | | | | | | | | | | | | | | | | | | | | | | | | | | | | | | | | | | | | | | | | | | | | | | | |
Year ended 10/31/22 | | | 6.83 | | | | 0.12 | | | | (1.31 | ) | | | (1.19 | ) | | | (0.14 | ) | | | – | | | | (0.14 | ) | | | 5.50 | | | | (17.68 | ) | | | 68,228 | | | | 0.94 | | | | 1.04 | | | | 1.92 | | | | 413 | |
Year ended 10/31/21 | | | 7.04 | | | | 0.07 | | | | (0.08 | ) | | | (0.01 | ) | | | (0.08 | ) | | | (0.12 | ) | | | (0.20 | ) | | | 6.83 | | | | (0.14 | ) | | | 84,671 | | | | 0.98 | | | | 1.04 | | | | 0.97 | | | | 526 | |
Year ended 10/31/20 | | | 7.03 | | | | 0.12 | | | | 0.36 | | | | 0.48 | | | | (0.13 | ) | | | (0.34 | ) | | | (0.47 | ) | | | 7.04 | | | | 6.90 | | | | 78,849 | | | | 1.04 | | | | 1.06 | | | | 1.68 | | | | 397 | |
Ten months ended 10/31/19 | | | 6.57 | | | | 0.15 | | | | 0.47 | | | | 0.62 | | | | (0.16 | ) | | | – | | | | (0.16 | ) | | | 7.03 | | | | 9.47 | | | | 58,568 | | | | 1.05 | (g) | | | 1.07 | (g) | | | 2.66 | (g) | | | 86 | |
Year ended 12/31/18 | | | 6.86 | | | | 0.19 | | | | (0.29 | ) | | | (0.10 | ) | | | (0.19 | ) | | | – | | | | (0.19 | ) | | | 6.57 | | | | (1.41 | ) | | | 52,539 | | | | 1.05 | | | | 1.05 | | | | 2.88 | | | | 64 | |
Year ended 12/31/17 | | | 6.76 | | | | 0.16 | | | | 0.10 | | | | 0.26 | | | | (0.16 | ) | | | – | | | | (0.16 | ) | | | 6.86 | | | | 3.95 | | | | 61,691 | | | | 1.10 | | | | 1.12 | | | | 2.29 | | | | 86 | |
Class Y | | | | | | | | | | | | | | | | | | | | | | | | | | | | | | | | | | | | | | | | | | | | | | | | | | | | | | | | |
Year ended 10/31/22 | | | 6.79 | | | | 0.15 | | | | (1.30 | ) | | | (1.15 | ) | | | (0.17 | ) | | | – | | | | (0.17 | ) | | | 5.47 | | | | (17.21 | ) | | | 544,605 | | | | 0.44 | | | | 0.54 | | | | 2.42 | | | | 413 | |
Year ended 10/31/21 | | | 7.00 | | | | 0.10 | | | | (0.07 | ) | | | 0.03 | | | | (0.12 | ) | | | (0.12 | ) | | | (0.24 | ) | | | 6.79 | | | | 0.43 | | | | 721,456 | | | | 0.43 | | | | 0.54 | | | | 1.52 | | | | 526 | |
Year ended 10/31/20 | | | 6.99 | | | | 0.16 | | | | 0.36 | | | | 0.52 | | | | (0.17 | ) | | | (0.34 | ) | | | (0.51 | ) | | | 7.00 | | | | 7.56 | | | | 622,504 | | | | 0.44 | | | | 0.56 | | | | 2.28 | | | | 397 | |
Ten months ended 10/31/19 | | | 6.53 | | | | 0.18 | | | | 0.47 | | | | 0.65 | | | | (0.19 | ) | | | – | | | | (0.19 | ) | | | 6.99 | | | | 10.05 | | | | 528,791 | | | | 0.45 | (g) | | | 0.56 | (g) | | | 3.25 | (g) | | | 86 | |
Year ended 12/31/18 | | | 6.82 | | | | 0.23 | | | | (0.29 | ) | | | (0.06 | ) | | | (0.23 | ) | | | – | | | | (0.23 | ) | | | 6.53 | | | | (0.84 | ) | | | 413,373 | | | | 0.45 | | | | 0.55 | | | | 3.48 | | | | 64 | |
Year ended 12/31/17 | | | 6.72 | | | | 0.20 | | | | 0.11 | | | | 0.31 | | | | (0.21 | ) | | | – | | | | (0.21 | ) | | | 6.82 | | | | 4.60 | | | | 343,689 | | | | 0.48 | | | | 0.62 | | | | 2.93 | | | | 86 | |
Class R5 | | | | | | | | | | | | | | | | | | | | | | | | | | | | | | | | | | | | | | | | | | | | | | | | | | | | | | | | |
Year ended 10/31/22 | | | 6.84 | | | | 0.15 | | | | (1.32 | ) | | | (1.17 | ) | | | (0.17 | ) | | | – | | | | (0.17 | ) | | | 5.50 | | | | (17.36 | ) | | | 14 | | | | 0.44 | | | | 0.45 | | | | 2.42 | | | | 413 | |
Year ended 10/31/21 | | | 7.05 | | | | 0.11 | | | | (0.08 | ) | | | 0.03 | | | | (0.12 | ) | | | (0.12 | ) | | | (0.24 | ) | | | 6.84 | | | | 0.46 | | | | 17 | | | | 0.41 | | | | 0.43 | | | | 1.54 | | | | 526 | |
Year ended 10/31/20 | | | 7.03 | | | | 0.16 | | | | 0.37 | | | | 0.53 | | | | (0.17 | ) | | | (0.34 | ) | | | (0.51 | ) | | | 7.05 | | | | 7.71 | | | | 17 | | | | 0.43 | | | | 0.44 | | | | 2.29 | | | | 397 | |
Period ended 10/31/19(h) | | | 6.81 | | | | 0.10 | | | | 0.21 | | | | 0.31 | | | | (0.09 | ) | | | – | | | | (0.09 | ) | | | 7.03 | | | | 4.60 | | | | 19 | | | | 0.40 | (g) | | | 0.41 | (g) | | | 3.29 | (g) | | | 86 | |
Class R6 | | | | | | | | | | | | | | | | | | | | | | | | | | | | | | | | | | | | | | | | | | | | | | | | | | | | | | | | |
Year ended 10/31/22 | | | 6.83 | | | | 0.15 | | | | (1.31 | ) | | | (1.16 | ) | | | (0.17 | ) | | | – | | | | (0.17 | ) | | | 5.50 | | | | (17.22 | ) | | | 284,165 | | | | 0.40 | | | | 0.41 | | | | 2.46 | | | | 413 | |
Year ended 10/31/21 | | | 7.04 | | | | 0.11 | | | | (0.08 | ) | | | 0.03 | | | | (0.12 | ) | | | (0.12 | ) | | | (0.24 | ) | | | 6.83 | | | | 0.48 | | | | 311,703 | | | | 0.38 | | | | 0.40 | | | | 1.57 | | | | 526 | |
Year ended 10/31/20 | | | 7.02 | | | | 0.17 | | | | 0.36 | | | | 0.53 | | | | (0.17 | ) | | | (0.34 | ) | | | (0.51 | ) | | | 7.04 | | | | 7.76 | | | | 263,690 | | | | 0.38 | | | | 0.39 | | | | 2.34 | | | | 397 | |
Ten months ended 10/31/19 | | | 6.57 | | | | 0.19 | | | | 0.45 | | | | 0.64 | | | | (0.19 | ) | | | – | | | | (0.19 | ) | | | 7.02 | | | | 9.91 | | | | 968,348 | | | | 0.38 | (g) | | | 0.39 | (g) | | | 3.31 | (g) | | | 86 | |
Year ended 12/31/18 | | | 6.86 | | | | 0.23 | | | | (0.28 | ) | | | (0.05 | ) | | | (0.24 | ) | | | – | | | | (0.24 | ) | | | 6.57 | | | | (0.77 | ) | | | 902,457 | | | | 0.40 | | | | 0.41 | | | | 3.53 | | | | 64 | |
Year ended 12/31/17 | | | 6.75 | | | | 0.20 | | | | 0.12 | | | | 0.32 | | | | (0.21 | ) | | | – | | | | (0.21 | ) | | | 6.86 | | | | 4.81 | | | | 993,755 | | | | 0.42 | | | | 0.43 | | | | 2.98 | | | | 86 | |
| (a) | Calculated using average shares outstanding. |
| (b) | Includes adjustments in accordance with accounting principles generally accepted in the United States of America and as such, the net asset value for financial reporting purposes and the returns based upon those net asset values may differ from the net asset value and returns for shareholder transactions. Does not include sales charges and is not annualized for periods less than one year, if applicable. |
| (c) | Does not include indirect expenses from affiliated fund fees and expenses of 0.01%, 0.00% and 0.00% for the ten months ended October 31, 2019 and for the years ended December 31, 2018 and 2017, respectively. |
| (d) | The portfolio turnover rate excludes purchase and sale transactions of To Be Announced (TBA) mortgage-related securities of $7,090,795,832 and $7,321,457,192, $10,593,719,030 and $10,775,658,902 and $9,083,844,819 and $8,679,566,809 for ten months ended October 31, 2019 and for the years ended December 31, 2018 and 2017, respectively. |
| (e) | Portfolio turnover is calculated at the fund level and is not annualized for periods less than one year, if applicable. |
| (f) | The total return, ratio of expenses to average net assets and ratio of net investment income to average net assets reflect actual 12b-1 fees of 0.24% for the year ended October 31, 2020. |
| (h) | Commencement date after the close of business on May 24, 2019. |
See accompanying Notes to Financial Statements which are an integral part of the financial statements.
| | |
| 26 | | Invesco Core Bond Fund |
Notes to Financial Statements
October 31, 2022
NOTE 1–Significant Accounting Policies
Invesco Core Bond Fund (the “Fund”) is a series portfolio of AIM Investment Funds (Invesco Investment Funds) (the “Trust”). The Trust is organized as a Delaware statutory trust and is registered under the Investment Company Act of 1940, as amended (the “1940 Act”), as an open-end series management investment company authorized to issue an unlimited number of shares of beneficial interest. Information presented in these financial statements pertains only to the Fund. Matters affecting the Fund or each class will be voted on exclusively by the shareholders of the Fund or each class.
The Fund’s investment objective is to seek total return.
The Fund currently consists of six different classes of shares: Class A, Class C, Class R, Class Y, Class R5 and Class R6. Class Y shares are available only to certain investors. Class A shares are sold with a front-end sales charge unless certain waiver criteria are met. Under certain circumstances, load waived shares may be subject to contingent deferred sales charges (“CDSC”). Class C shares are sold with a CDSC. Class R, Class Y, Class R5 and Class R6 shares are sold at net asset value. Class C shares held for eight years after purchase are eligible for automatic conversion into Class A shares of the same Fund (the “Conversion Feature”). The automatic conversion pursuant to the Conversion Feature will generally occur at the end of the month following the eighth anniversary after a purchase of Class C shares.
The Fund is an investment company and accordingly follows the investment company accounting and reporting guidance in accordance with Financial Accounting Standards Board Accounting Standards Codification Topic 946, Financial Services – Investment Companies.
The following is a summary of the significant accounting policies followed by the Fund in the preparation of its financial statements.
| A. | Security Valuations – Securities, including restricted securities, are valued according to the following policy. |
Fixed income securities (including convertible debt securities) generally are valued on the basis of prices provided by independent pricing services. Prices provided by the pricing service may be determined without exclusive reliance on quoted prices, and may reflect appropriate factors such as institution-size trading in similar groups of securities, developments related to specific securities, dividend rate (for unlisted equities), yield (for debt obligations), quality, type of issue, coupon rate (for debt obligations), maturity (for debt obligations), individual trading characteristics and other market data. Pricing services generally value debt obligations assuming orderly transactions of institutional round lot size, but a fund may hold or transact in the same securities in smaller, odd lot sizes. Odd lots often trade at lower prices than institutional round lots, and their value may be adjusted accordingly. Debt obligations are subject to interest rate and credit risks. In addition, all debt obligations involve some risk of default with respect to interest and/or principal payments.
A security listed or traded on an exchange is generally valued at its trade price or official closing price that day as of the close of the exchange where the security is principally traded, or lacking any trades or official closing price on a particular day, the security may be valued at the closing bid price on that day. Securities traded in the over-the-counter market are valued based on prices furnished by independent pricing services or market makers. When such securities are valued using prices provided by an independent pricing service they may be considered fair valued.
Securities of investment companies that are not exchange-traded (e.g., open-end mutual funds) are valued using such company’s end-of-business-day net asset value per share.
Deposits, other obligations of U.S. and non-U.S. banks and financial institutions are valued at their daily account value.
Foreign securities’ (including foreign exchange contracts) prices are converted into U.S. dollar amounts using the applicable exchange rates as of the close of the New York Stock Exchange (“NYSE”). If market quotations are available and reliable for foreign exchange-traded equity securities, the securities will be valued at the market quotations. Invesco Advisers, Inc. (the “Adviser” or “Invesco”) may use various pricing services to obtain market quotations as well as fair value prices. Because trading hours for certain foreign securities end before the close of the NYSE, closing market quotations may become not representative of market value in the Adviser’s judgment (“unreliable”). If, between the time trading ends on a particular security and the close of the customary trading session on the NYSE, a significant event occurs that makes the closing price of the security unreliable, the Adviser may fair value the security. If the event is likely to have affected the closing price of the security, the security will be valued at fair value in good faith in accordance with Board- approved policies and related Adviser procedures (“Valuation Procedures”). Adjustments to closing prices to reflect fair value may also be based on a screening process of an independent pricing service to indicate the degree of certainty, based on historical data, that the closing price in the principal market where a foreign security trades is not the current value as of the close of the NYSE. Foreign securities’ prices meeting the degree of certainty that the price is not reflective of current value will be priced at the indication of fair value from the independent pricing service. Multiple factors may be considered by the independent pricing service in determining adjustments to reflect fair value and may include information relating to sector indices, American Depositary Receipts and domestic and foreign index futures. Foreign securities may have additional risks including exchange rate changes, potential for sharply devalued currencies and high inflation, political and economic upheaval, the relative lack of issuer information, relatively low market liquidity and the potential lack of strict financial and accounting controls and standards.
Unlisted securities will be valued using prices provided by independent pricing services or by another method that the Adviser, in its judgment, believes better reflects the security’s fair value in accordance with the Valuation Procedures.
Securities for which market prices are not provided by any of the above methods may be valued based upon quotes furnished by independent sources. The last bid price may be used to value equity securities. The mean between the last bid and asked prices may be used to value debt obligations, including corporate loans.
Securities for which market quotations are not readily available are fair valued by the Adviser in accordance with the Valuation Procedures. If a fair value price provided by a pricing service is unreliable, the Adviser will fair value the security using the Valuation Procedures. Issuer specific events, market trends, bid/asked quotes of brokers and information providers and other market data may be reviewed in the course of making a good faith determination of a security’s fair value.
The Fund may invest in securities that are subject to interest rate risk, meaning the risk that the prices will generally fall as interest rates rise and, conversely, the prices will generally rise as interest rates fall. Specific securities differ in their sensitivity to changes in interest rates depending on their individual characteristics. Changes in interest rates may result in increased market volatility, which may affect the value and/or liquidity of certain Fund investments.
Valuations change in response to many factors including the historical and prospective earnings of the issuer, the value of the issuer’s assets, general market conditions which are not specifically related to the particular issuer, such as real or perceived adverse economic conditions, changes in the general outlook for revenues or corporate earnings, changes in interest or currency rates, regional or global instability, natural or environmental disasters, widespread disease or other public health issues, war, acts of terrorism, significant governmental actions or adverse investor sentiment generally and market liquidity. Because of the inherent uncertainties of valuation, the values reflected in the financial statements may materially differ from the value received upon actual sale of those investments.
The price the Fund could receive upon the sale of any investment may differ from the Adviser’s valuation of the investment, particularly for securities that are valued using a fair valuation technique. When fair valuation techniques are applied, the Adviser uses available information, including both observable and unobservable inputs and assumptions, to determine a methodology that will result in a valuation that the Adviser believes approximates market value. Fund securities that are fair valued may be subject to greater fluctuation in their value from one day to the next than would be the case if market quotations were used. Because of the inherent uncertainties of valuation, and the degree of subjectivity in such decisions, the Fund could realize a greater or lesser than expected gain or loss upon the sale of the investment.
| B. | Securities Transactions and Investment Income – Securities transactions are accounted for on a trade date basis. Realized gains or losses on sales are computed on the basis of specific identification of the securities sold. Interest income (net of withholding tax, if any) is recorded on an accrual basis from settlement date and includes coupon interest and amortization of premium and accretion of discount on debt securities as applicable. Pay-in-kind interest income |
| | |
| 27 | | Invesco Core Bond Fund |
| | and non-cash dividend income received in the form of securities in-lieu of cash are recorded at the fair value of the securities received. Paydown gains and losses on mortgage and asset-backed securities are recorded as adjustments to interest income. Dividend income (net of withholding tax, if any) is recorded on the ex-dividend date. |
The Fund may periodically participate in litigation related to Fund investments. As such, the Fund may receive proceeds from litigation settlements. Any proceeds received are included in the Statement of Operations as realized gain (loss) for investments no longer held and as unrealized gain (loss) for investments still held.
Brokerage commissions and mark ups are considered transaction costs and are recorded as an increase to the cost basis of securities purchased and/or a reduction of proceeds on a sale of securities. Such transaction costs are included in the determination of net realized and unrealized gain (loss) from investment securities reported in the Statement of Operations and the Statement of Changes in Net Assets and the net realized and unrealized gains (losses) on securities per share in the Financial Highlights. Transaction costs are included in the calculation of the Fund’s net asset value and, accordingly, they reduce the Fund’s total returns. These transaction costs are not considered operating expenses and are not reflected in net investment income reported in the Statement of Operations and the Statement of Changes in Net Assets, or the net investment income per share and the ratios of expenses and net investment income reported in the Financial Highlights, nor are they limited by any expense limitation arrangements between the Fund and the investment adviser.
The Fund allocates income and realized and unrealized capital gains and losses to a class based on the relative net assets of each class.
| C. | Country Determination – For the purposes of making investment selection decisions and presentation in the Schedule of Investments, the investment adviser may determine the country in which an issuer is located and/or credit risk exposure based on various factors. These factors include the laws of the country under which the issuer is organized, where the issuer maintains a principal office, the country in which the issuer derives 50% or more of its total revenues, the country that has the primary market for the issuer’s securities and its “country of risk” as determined by a third party service provider, as well as other criteria. Among the other criteria that may be evaluated for making this determination are the country in which the issuer maintains 50% or more of its assets, the type of security, financial guarantees and enhancements, the nature of the collateral and the sponsor organization. Country of issuer and/or credit risk exposure has been determined to be the United States of America, unless otherwise noted. |
| D. | Distributions – Distributions from net investment income, if any, are declared daily and paid monthly. Distributions from net realized capital gain, if any, are generally declared and paid annually and recorded on the ex-dividend date. The Fund may elect to treat a portion of the proceeds from redemptions as distributions for federal income tax purposes. |
| E. | Federal Income Taxes – The Fund intends to comply with the requirements of Subchapter M of the Internal Revenue Code of 1986, as amended (the “Internal Revenue Code”), necessary to qualify as a regulated investment company and to distribute substantially all of the Fund’s taxable earnings to shareholders. As such, the Fund will not be subject to federal income taxes on otherwise taxable income (including net realized capital gain) that is distributed to shareholders. Therefore, no provision for federal income taxes is recorded in the financial statements. |
The Fund recognizes the tax benefits of uncertain tax positions only when the position is more likely than not to be sustained. Management has analyzed the Fund’s uncertain tax positions and concluded that no liability for unrecognized tax benefits should be recorded related to uncertain tax positions. Management is not aware of any tax positions for which it is reasonably possible that the total amounts of unrecognized tax benefits will change materially in the next 12 months.
The Fund files tax returns in the U.S. Federal jurisdiction and certain other jurisdictions. Generally, the Fund is subject to examinations by such taxing authorities for up to three years after the filing of the return for the tax period.
| F. | Expenses – Fees provided for under the Rule 12b-1 plan of a particular class of the Fund are charged to the operations of such class. Transfer agency fees and expenses and other shareholder recordkeeping fees and expenses attributable to Class R5 and Class R6 are allocated based on relative net assets of Class R5 and Class R6. Sub-accounting fees attributable to Class R5 are charged to the operations of the class. Transfer agency fees and expenses and other shareholder recordkeeping fees and expenses relating to all other classes are allocated among those classes based on relative net assets. All other expenses are allocated among the classes based on relative net assets. |
| G. | Accounting Estimates – The preparation of financial statements in conformity with accounting principles generally accepted in the United States of America (“GAAP”) requires management to make estimates and assumptions that affect the reported amounts of assets and liabilities at the date of the financial statements and the reported amounts of revenues and expenses during the reporting period including estimates and assumptions related to taxation. Actual results could differ from those estimates by a significant amount. In addition, the Fund monitors for material events or transactions that may occur or become known after the period-end date and before the date the financial statements are released to print. |
| H. | Indemnifications – Under the Trust’s organizational documents, each Trustee, officer, employee or other agent of the Trust is indemnified against certain liabilities that may arise out of the performance of their duties to the Fund. Additionally, in the normal course of business, the Fund enters into contracts, including the Fund’s servicing agreements, that contain a variety of indemnification clauses. The Fund’s maximum exposure under these arrangements is unknown as this would involve future claims that may be made against the Fund that have not yet occurred. The risk of material loss as a result of such indemnification claims is considered remote. |
| I. | Securities Purchased on a When-Issued and Delayed Delivery Basis – The Fund may purchase and sell interests in corporate loans and corporate debt securities and other portfolio securities on a when-issued and delayed delivery basis, with payment and delivery scheduled for a future date. No income accrues to the Fund on such interests or securities in connection with such transactions prior to the date the Fund actually takes delivery of such interests or securities. These transactions are subject to market fluctuations and are subject to the risk that the value at delivery may be more or less than the trade date purchase price. Although the Fund will generally purchase these securities with the intention of acquiring such securities, they may sell such securities prior to the settlement date. |
| J. | Foreign Currency Translations – Foreign currency is valued at the close of the NYSE based on quotations posted by banks and major currency dealers. Portfolio securities and other assets and liabilities denominated in foreign currencies are translated into U.S. dollar amounts at the date of valuation. Purchases and sales of portfolio securities (net of foreign taxes withheld on disposition) and income items denominated in foreign currencies are translated into U.S. dollar amounts on the respective dates of such transactions. The Fund does not separately account for the portion of the results of operations resulting from changes in foreign exchange rates on investments and the fluctuations arising from changes in market prices of securities held. The combined results of changes in foreign exchange rates and the fluctuation of market prices on investments (net of estimated foreign tax withholding) are included with the net realized and unrealized gain or loss from investments in the Statement of Operations. Reported net realized foreign currency gains or losses arise from (1) sales of foreign currencies, (2) currency gains or losses realized between the trade and settlement dates on securities transactions, and (3) the difference between the amounts of dividends, interest, and foreign withholding taxes recorded on the Fund’s books and the U.S. dollar equivalent of the amounts actually received or paid. Net unrealized foreign currency gains and losses arise from changes in the fair values of assets and liabilities, other than investments in securities at fiscal period end, resulting from changes in exchange rates. |
The Fund may invest in foreign securities, which may be subject to foreign taxes on income, gains on investments or currency repatriation, a portion of which may be recoverable. Foreign taxes, if any, are recorded based on the tax regulations and rates that exist in the foreign markets in which the Fund invests and are shown in the Statement of Operations.
| K. | Forward Foreign Currency Contracts – The Fund may engage in foreign currency transactions either on a spot (i.e. for prompt delivery and settlement) basis, or through forward foreign currency contracts, to manage or minimize currency or exchange rate risk. |
The Fund may also enter into forward foreign currency contracts for the purchase or sale of a security denominated in a foreign currency in order to “lock in” the U.S. dollar price of that security, or the Fund may also enter into forward foreign currency contracts that do not provide for physical exchange of the two
| | |
| 28 | | Invesco Core Bond Fund |
currencies on the settlement date, but instead are settled by a single cash payment calculated as the difference between the agreed upon exchange rate and the spot rate at settlement based upon an agreed upon notional amount (non-deliverable forwards).
A forward foreign currency contract is an obligation between two parties (“Counterparties”) to purchase or sell a specific currency for an agreed-upon price at a future date. The use of forward foreign currency contracts for hedging does not eliminate fluctuations in the price of the underlying securities the Fund owns or intends to acquire but establishes a rate of exchange in advance. Fluctuations in the value of these contracts are measured by the difference in the contract date and reporting date exchange rates and are recorded as unrealized appreciation (depreciation) until the contracts are closed. When the contracts are closed, realized gains (losses) are recorded. Realized and unrealized gains (losses) on the contracts are included in the Statement of Operations. The primary risks associated with forward foreign currency contracts include failure of the Counterparty to meet the terms of the contract and the value of the foreign currency changing unfavorably. These risks may be in excess of the amounts reflected in the Statement of Assets and Liabilities.
| L. | Futures Contracts – The Fund may enter into futures contracts to manage exposure to interest rate, equity and market price movements and/or currency risks. A futures contract is an agreement between two parties (“Counterparties”) to purchase or sell a specified underlying security, currency or commodity (or delivery of a cash settlement price, in the case of an index future) for a fixed price at a future date. The Fund currently invests only in exchange-traded futures and they are standardized as to maturity date and underlying financial instrument or asset. Initial margin deposits required upon entering into futures contracts are satisfied by the segregation of specific securities or cash as collateral at the futures commission merchant (broker). During the period the futures contracts are open, changes in the value of the contracts are recognized as unrealized gains or losses by recalculating the value of the contracts on a daily basis. Subsequent or variation margin payments are received or made depending upon whether unrealized gains or losses are incurred. These amounts are reflected as receivables or payables on the Statement of Assets and Liabilities. When the contracts are closed or expire, the Fund recognizes a realized gain or loss equal to the difference between the proceeds from, or cost of, the closing transaction and the Fund’s basis in the contract. The net realized gain (loss) and the change in unrealized gain (loss) on futures contracts held during the period is included on the Statement of Operations. The primary risks associated with futures contracts are market risk and the absence of a liquid secondary market. If the Fund were unable to liquidate a futures contract and/or enter into an offsetting closing transaction, the Fund would continue to be subject to market risk with respect to the value of the contracts and continue to be required to maintain the margin deposits on the futures contracts. Futures contracts have minimal Counterparty risk since the exchange’s clearinghouse, as Counterparty to all exchange-traded futures, guarantees the futures against default. Risks may exceed amounts recognized in the Statement of Assets and Liabilities. |
| M. | Put Options Purchased – The Fund may purchase put options including options on securities indexes, or foreign currency and/or futures contracts. By purchasing a put option, the Fund obtains the right (but not the obligation) to sell the option’s underlying instrument at a fixed strike price. In return for this right, the Fund pays an option premium. The option’s underlying instrument may be a security, securities index, or a futures contract. Put options may be used by the Fund to hedge securities it owns by locking in a minimum price at which the Fund can sell. If security prices fall, the put option could be exercised to offset all or a portion of the Fund’s resulting losses. At the same time, because the maximum the Fund has at risk is the cost of the option, purchasing put options does not eliminate the potential for the Fund to profit from an increase in the value of the securities hedged. Realized and unrealized gains and losses on put options purchased are included in the Statement of Operations as Net realized gain (loss) from and Change in net unrealized appreciation (depreciation) of Investment securities. A risk in buying an option is that the Fund pays a premium whether or not the option is exercised. In addition, there can be no assurance that a liquid secondary market will exist for any option purchased. |
| N. | Dollar Rolls and Forward Commitment Transactions – The Fund may enter into dollar roll transactions to enhance the Fund’s performance. The Fund executes its dollar roll transactions in the to be announced (“TBA”) market whereby the Fund makes a forward commitment to purchase a security and, instead of accepting delivery, the position is offset by the sale of the security with a simultaneous agreement to repurchase at a future date. |
The Fund accounts for dollar roll transactions as purchases and sales and realizes gains and losses on these transactions. These transactions increase the Fund’s portfolio turnover rate.
Dollar roll transactions involve the risk that a Counterparty to the transaction may fail to complete the transaction. If this occurs, the Fund may lose the opportunity to purchase or sell the security at the agreed upon price. Dollar roll transactions also involve the risk that the value of the securities retained by the Fund may decline below the price of the securities that the Fund has sold but is obligated to purchase under the agreement.
| O. | LIBOR Risk – The Fund may have investments in financial instruments that utilize the London Interbank Offered Rate (“LIBOR”) as the reference or benchmark rate for variable interest rate calculations. LIBOR is intended to measure the rate generally at which banks can lend and borrow from one another in the relevant currency on an unsecured basis. The UK Financial Conduct Authority (“FCA”), the regulator that oversees LIBOR, announced that the majority of LIBOR rates would cease to be published or would no longer be representative on January 1, 2022. Although the publication of most LIBOR rates ceased at the end of 2021, a selection of widely used USD LIBOR rates continues to be published until June 2023 to allow for an orderly transition away from these rates. |
There remains uncertainty and risks relating to the continuing LIBOR transition and its effects on the Fund and the instruments in which the Fund invests. There can be no assurance that the composition or characteristics of any alternative reference rates (“ARRs”) or financial instruments in which the Fund invests that utilize ARRs will be similar to or produce the same value or economic equivalence as LIBOR or that these instruments will have the same volume or liquidity. Additionally, there remains uncertainty and risks relating to certain “legacy” USD LIBOR instruments that were issued or entered into before December 31, 2021 and the process by which a replacement interest rate will be identified and implemented into these instruments when USD LIBOR is ultimately discontinued. The effects of such uncertainty and risks in “legacy” USD LIBOR instruments held by the Fund could result in losses to the Fund.
| P. | Leverage Risk – Leverage exists when the Fund can lose more than it originally invests because it purchases or sells an instrument or enters into a transaction without investing an amount equal to the full economic exposure of the instrument or transaction. |
| Q. | Collateral – To the extent the Fund has designated or segregated a security as collateral and that security is subsequently sold, it is the Fund’s practice to replace such collateral no later than the next business day. |
| R. | Other Risks – Active trading of portfolio securities may result in added expenses, a lower return and increased tax liability. |
During the period, the Fund experienced a low interest rate environment created in part by the Federal Reserve Board (FRB) and certain foreign central banks keeping the federal funds and equivalent foreign rates near historical lows. Increases in the federal funds and equivalent foreign rates may expose fixed income markets to heightened volatility and reduced liquidity for certain fixed income investments, particularly those with longer maturities. In addition, decreases in fixed income dealer market-making capacity may also potentially lead to heightened volatility and reduced liquidity in the fixed income markets. As a result, the value of the Fund’s investments and share price may decline. Changes in central bank policies could also result in higher than normal shareholder redemptions, which could potentially increase portfolio turnover and the Fund’s transaction costs.
Policy changes by the U.S. government or its regulatory agencies and political events within the U.S. and abroad may, among other things, affect investor and consumer confidence and increase volatility in the financial markets, perhaps suddenly and to a significant degree, which may adversely impact the Fund’s operations, universe of potential investment options, and return potential.
| S. | COVID-19 Risk – The COVID-19 strain of coronavirus has resulted in instances of market closures and dislocations, extreme volatility, liquidity constraints and increased trading costs. Efforts to contain its spread have resulted in travel restrictions, disruptions of healthcare systems, business operations (including business closures) and supply chains, layoffs, lower consumer demand and employee availability, and defaults and credit downgrades, among other significant economic impacts that have disrupted global economic activity across many industries. Such economic impacts may exacerbate other pre-existing political, social and economic risks locally or globally and cause general concern and uncertainty. The full economic impact and ongoing effects of COVID-19 (or other future epidemics or pandemics) at the macro-level and on individual businesses are unpredictable and may result in significant and prolonged effects on the Fund’s performance. |
| | |
| 29 | | Invesco Core Bond Fund |
NOTE 2–Advisory Fees and Other Fees Paid to Affiliates
The Trust has entered into a master investment advisory agreement with the Adviser. Under the terms of the investment advisory agreement, the Fund accrues daily and pays monthly an advisory fee to the Adviser based on the annual rate of the Fund’s average daily net assets as follows:
| | | | |
| Average Daily Net Assets | | Rate* | |
| |
Up to $500 million | | | 0.400% | |
| |
Next $500 million | | | 0.350% | |
| |
Next $4 billion | | | 0.330% | |
| |
Over $5 billion | | | 0.310% | |
| |
| * | The advisory fee paid by the Fund shall be reduced by any amounts paid by the Fund under the administrative services agreement with the Adviser. |
For the year ended October 31, 2022, the effective advisory fee rate incurred by the Fund was 0.34%.
Under the terms of a master sub-advisory agreement between the Adviser and each of Invesco Asset Management Deutschland GmbH, Invesco Asset Management Limited, Invesco Asset Management (Japan) Limited, Invesco Hong Kong Limited, Invesco Senior Secured Management, Inc. and Invesco Canada Ltd. and separate sub-advisory agreements with Invesco Capital Management LLC and Invesco Asset Management (India) Private Limited (collectively, the “Affiliated Sub-Advisers”) the Adviser, not the Fund, will pay 40% of the fees paid to the Adviser to any such Affiliated Sub-Adviser(s) that provide(s) discretionary investment management services to the Fund based on the percentage of assets allocated to such Affiliated Sub-Adviser(s). Invesco has also entered into a sub-advisory agreement with OppenheimerFunds, Inc. to provide discretionary management services to the Fund.
The Adviser has contractually agreed, through February 29, 2024, to waive advisory fees and/or reimburse expenses of all shares to the extent necessary to limit total annual fund operating expenses after fee waiver and/or expense reimbursement (excluding certain items discussed below) of Class A, Class C, Class R, Class Y, Class R5 and Class R6 shares to 0.70%, 1.45%, 0.95%, 0.45%, 0.45% and 0.45%, respectively of the Fund’s average daily net assets. In determining the Adviser’s obligation to waive advisory fees and/or reimburse expenses, the following expenses are not taken into account, and could cause the total annual fund operating expenses after fee waiver and/or reimbursement to exceed the numbers reflected above: (1) interest; (2) taxes; (3) dividend expense on short sales; (4) extraordinary or non-routine items, including litigation expenses; and (5) expenses that the Fund has incurred but did not actually pay because of an expense offset arrangement. Unless Invesco continues the fee waiver agreement, it will terminate on February 29, 2024. During its term, the fee waiver agreement cannot be terminated or amended to increase the expense limits or reduce the advisory fee waivers without approval of the Board of Trustees.
The Adviser has contractually agreed, through at least June 30, 2024, to waive the advisory fee payable by the Fund in an amount equal to 100% of the net advisory fees the Adviser receives from the affiliated money market funds on investments by the Fund of uninvested cash in such affiliated money market funds.
For the year ended October 31, 2022, the Adviser waived advisory fees of $114,867 and reimbursed class level expenses of $589,074, $49,559, $71,608, $564,238, $0 and $0 of Class A, Class C, Class R, Class Y, Class R5 and Class R6 shares, respectively.
The Trust has entered into a master administrative services agreement with Invesco pursuant to which the Fund has agreed to pay Invesco for certain administrative costs incurred in providing accounting services to the Fund. For the year ended October 31, 2022, expenses incurred under the agreement are shown in the Statement of Operations as Administrative services fees. Invesco has entered into a sub-administration agreement whereby State Street Bank and Trust Company (“SSB”) serves as fund accountant and provides certain administrative services to the Fund. Pursuant to a custody agreement with the Trust on behalf of the Fund, SSB also serves as the Fund’s custodian.
The Trust has entered into a transfer agency and service agreement with Invesco Investment Services, Inc. (“IIS”) pursuant to which the Fund has agreed to pay IIS a fee for providing transfer agency and shareholder services to the Fund and reimburse IIS for certain expenses incurred by IIS in the course of providing such services. IIS may make payments to intermediaries that provide omnibus account services, sub-accounting services and/or networking services. All fees payable by IIS to intermediaries that provide omnibus account services or sub-accounting services are charged back to the Fund, subject to certain limitations approved by the Trust’s Board of Trustees. For the year ended October 31, 2022, expenses incurred under the agreement are shown in the Statement of Operations as Transfer agent fees.
The Trust has entered into master distribution agreements with Invesco Distributors, Inc. (“IDI”) to serve as the distributor for the Class A, Class C, Class R, Class Y, Class R5 and Class R6 shares of the Fund. The Trust has adopted plans pursuant to Rule 12b-1 under the 1940 Act with respect to the Fund’s Class A, Class C and Class R shares (collectively, the “Plans”). The Fund, pursuant to the Class A Plan, reimburses IDI for its allocated share of expenses incurred for the period, up to a maximum annual rate of 0.25% of the average daily net assets of Class A shares. The Fund, pursuant to the Class C and Class R Plans, pays IDI compensation at the annual rate of 1.00% of the average daily net assets of Class C shares and 0.50% of the average daily net assets of Class R shares. The fees are accrued daily and paid monthly. Of the Plan payments, up to 0.25% of the average daily net assets of each class of shares may be paid to furnish continuing personal shareholder services to customers who purchase and own shares of such classes. Any amounts not paid as a service fee under the Plans would constitute an asset-based sales charge. Rules of the Financial Industry Regulatory Authority (“FINRA”) impose a cap on the total sales charges, including asset-based sales charges, that may be paid by any class of shares of the Fund. For the year ended October 31, 2022, expenses incurred under the Plans are shown in the Statement of Operations as Distribution fees.
Front-end sales commissions and CDSC (collectively, the “sales charges”) are not recorded as expenses of the Fund. Front-end sales commissions are deducted from proceeds from the sales of Fund shares prior to investment in Class A shares of the Fund. CDSC are deducted from redemption proceeds prior to remittance to the shareholder. During the year ended October 31, 2022, IDI advised the Fund that IDI retained $55,592 in front-end sales commissions from the sale of Class A shares and $13,208 and $2,390 from Class A and Class C shares, respectively, for CDSC imposed upon redemptions by shareholders.
Certain officers and trustees of the Trust are officers and directors of the Adviser, IIS and/or IDI.
NOTE 3–Additional Valuation Information
GAAP defines fair value as the price that would be received to sell an asset or paid to transfer a liability in an orderly transaction between market participants at the measurement date, under current market conditions. GAAP establishes a hierarchy that prioritizes the inputs to valuation methods, giving the highest priority to readily available unadjusted quoted prices in an active market for identical assets (Level 1) and the lowest priority to significant unobservable inputs (Level 3), generally when market prices are not readily available. Based on the valuation inputs, the securities or other investments are tiered into one of three levels. Changes in valuation methods may result in transfers in or out of an investment’s assigned level:
| | |
| Level 1 – | | Prices are determined using quoted prices in an active market for identical assets. |
| Level 2 – | | Prices are determined using other significant observable inputs. Observable inputs are inputs that other market participants may use in pricing a security. These may include quoted prices for similar securities, interest rates, prepayment speeds, credit risk, yield curves, loss severities, default rates, discount rates, volatilities and others. |
| Level 3 – | | Prices are determined using significant unobservable inputs. In situations where quoted prices or observable inputs are unavailable (for example, when there is little or no market activity for an investment at the end of the period), unobservable inputs may be used. Unobservable inputs reflect the Adviser’s assumptions about the factors market participants would use in determining fair value of the securities or instruments and would be based on the best available information. |
| | |
| 30 | | Invesco Core Bond Fund |
The following is a summary of the tiered valuation input levels, as of October 31, 2022. The level assigned to the securities valuations may not be an indication of the risk or liquidity associated with investing in those securities. Because of the inherent uncertainties of valuation, the values reflected in the financial statements may materially differ from the value received upon actual sale of those investments.
| | | | | | | | | | | | | | | | |
| | | Level 1 | | | Level 2 | | | Level 3 | | | Total | |
|
| |
Investments in Securities | |
|
| |
U.S. Dollar Denominated Bonds & Notes | | $ | – | | | $ | 791,569,384 | | | $ | 7,457,467 | | | $ | 799,026,851 | |
Asset-Backed Securities | | | – | | | | 419,935,560 | | | | 5,493,000 | | | | 425,428,560 | |
U.S. Government Sponsored Agency Mortgage-Backed Securities | | | – | | | | 392,497,449 | | | | – | | | | 392,497,449 | |
U.S. Treasury Securities | | | – | | | | 109,705,552 | | | | – | | | | 109,705,552 | |
Agency Credit Risk Transfer Notes | | | – | | | | 11,860,637 | | | | – | | | | 11,860,637 | |
Municipal Obligations | | | – | | | | 7,730,771 | | | | – | | | | 7,730,771 | |
Preferred Stocks | | | – | | | | 4,173,911 | | | | – | | | | 4,173,911 | |
Money Market Funds | | | 119,097,917 | | | | – | | | | – | | | | 119,097,917 | |
|
| |
Total Investments in Securities | | | 119,097,917 | | | | 1,737,473,264 | | | | 12,950,467 | | | | 1,869,521,648 | |
|
| |
|
Other Investments - Assets* | |
|
| |
Futures Contracts | | | 6,523,152 | | | | – | | | | – | | | | 6,523,152 | |
|
| |
|
Other Investments - Liabilities* | |
|
| |
Futures Contracts | | | (5,665,495 | ) | | | – | | | | – | | | | (5,665,495 | ) |
|
| |
Total Other Investments | | | 857,657 | | | | – | | | | – | | | | 857,657 | |
|
| |
Total Investments | | | $119,955,574 | | | $ | 1,737,473,264 | | | | $12,950,467 | | | $ | 1,870,379,305 | |
|
| |
| * | Unrealized appreciation (depreciation). |
NOTE 4–Derivative Investments
The Fund may enter into an International Swaps and Derivatives Association Master Agreement (“ISDA Master Agreement”) under which a fund may trade OTC derivatives. An OTC transaction entered into under an ISDA Master Agreement typically involves a collateral posting arrangement, payment netting provisions and close-out netting provisions. These netting provisions allow for reduction of credit risk through netting of contractual obligations. The enforceability of the netting provisions of the ISDA Master Agreement depends on the governing law of the ISDA Master Agreement, among other factors.
For financial reporting purposes, the Fund does not offset OTC derivative assets or liabilities that are subject to ISDA Master Agreements in the Statement of Assets and Liabilities.
Value of Derivative Investments at Period-End
The table below summarizes the value of the Fund’s derivative investments, detailed by primary risk exposure, held as of October 31, 2022:
| | | | |
| | | Value | |
| Derivative Assets | | Interest
Rate Risk | |
| |
| |
Unrealized appreciation on futures contracts –Exchange-Traded(a) | | $ | 6,523,152 | |
| |
Derivatives not subject to master netting agreements | | | (6,523,152 | ) |
| |
Total Derivative Assets subject to master netting agreements | | $ | – | |
| |
| | | | |
| | | Value | |
| Derivative Liabilities | | Interest
Rate Risk | |
| |
| |
Unrealized depreciation on futures contracts –Exchange-Traded(a) | | $ | (5,665,495 | ) |
| |
Derivatives not subject to master netting agreements | | | 5,665,495 | |
| |
Total Derivative Liabilities subject to master netting agreements | | $ | – | |
| |
| (a) | The daily variation margin receivable (payable) at period-end is recorded in the Statement of Assets and Liabilities. |
Effect of Derivative Investments for the year ended October 31, 2022
The table below summarizes the gains (losses) on derivative investments, detailed by primary risk exposure, recognized in earnings during the period:
| | | | | | | | | | | | |
| | | Location of Gain (Loss) on
Statement of Operations | |
| | | Currency
Risk | | | Interest Rate Risk | | | Total | |
Realized Gain (Loss): | | | | | | | | | | | | |
Forward foreign currency contracts | | $ | 348,997 | | | $ | - | | | $ | 348,997 | |
Futures contracts | | | - | | | | (16,780,752 | ) | | | (16,780,752 | ) |
| | | |
Options purchased(a) | | | (364,308 | ) | | | - | | | | (364,308 | ) |
| | |
| 31 | | Invesco Core Bond Fund |
| | | | | | | | | | | | |
| | | Location of Gain (Loss) on
Statement of Operations | |
| | | Currency
Risk | | | Interest
Rate Risk | | | Total | |
Change in Net Unrealized Appreciation: | | | | | | | | | | | | |
| | | |
Futures contracts | | $ | - | | | $ | 2,619,625 | | | $ | 2,619,625 | |
| | | |
Total | | $ | (15,311 | ) | | $ | (14,161,127 | ) | | $ | (14,176,438 | ) |
| (a) | Options purchased are included in the net realized gain (loss) from investment securities and the change in net unrealized appreciation (depreciation) of investment securities. |
The table below summarizes the average notional value of derivatives held during the period.
| | | | | | | | | | | | |
| | | Forward
Foreign Currency
Contracts | | | Futures
Contracts | | | Foreign
Currency
Options
Purchased | |
| | | |
Average notional value | | $ | 88,919,871 | | | $ | 332,797,313 | | | $ | 63,917,326 | |
NOTE 5–Expense Offset Arrangement(s)
The expense offset arrangement is comprised of transfer agency credits which result from balances in demand deposit accounts used by the transfer agent for clearing shareholder transactions. For the year ended October 31, 2022, the Fund received credits from this arrangement, which resulted in the reduction of the Fund’s total expenses of $6,314.
NOTE 6–Trustees’ and Officers’ Fees and Benefits
Trustees’ and Officers’ Fees and Benefits include amounts accrued by the Fund to pay remuneration to certain Trustees and Officers of the Fund. Trustees have the option to defer compensation payable by the Fund, and Trustees’ and Officers’ Fees and Benefits also include amounts accrued by the Fund to fund such deferred compensation amounts. Those Trustees who defer compensation have the option to select various Invesco Funds in which their deferral accounts shall be deemed to be invested. Finally, certain current Trustees were eligible to participate in a retirement plan that provided for benefits to be paid upon retirement to Trustees over a period of time based on the number of years of service. The Fund may have certain former Trustees who also participate in a retirement plan and receive benefits under such plan. Trustees’ and Officers’ Fees and Benefits include amounts accrued by the Fund to fund such retirement benefits. Obligations under the deferred compensation and retirement plans represent unsecured claims against the general assets of the Fund.
NOTE 7–Cash Balances
The Fund is permitted to temporarily carry a negative or overdrawn balance in its account with SSB, the custodian bank. Such balances, if any at period-end, are shown in the Statement of Assets and Liabilities under the payable caption Amount due custodian. To compensate the custodian bank for such overdrafts, the overdrawn Fund may either (1) leave funds as a compensating balance in the account so the custodian bank can be compensated by earning the additional interest; or (2) compensate by paying the custodian bank at a rate agreed upon by the custodian bank and Invesco, not to exceed the contractually agreed upon rate. The Fund may not purchase additional securities when any borrowings from banks or broker-dealers exceed 5% of the Fund’s total assets, or when any borrowings from an Invesco Fund are outstanding.
NOTE 8–Distributions to Shareholders and Tax Components of Net Assets
Tax Character of Distributions to Shareholders Paid During the Fiscal Years Ended October 31, 2022 and 2021:
| | | | | | | | |
| | | 2022 | | | 2021 | |
Ordinary income* | | $ | 43,566,083 | | | $ | 50,564,465 | |
Long-term capital gain | | | – | | | | 11,674,365 | |
Total distributions | | $ | 43,566,083 | | | $ | 62,238,830 | |
| * | Includes short-term capital gain distributions, if any. |
Tax Components of Net Assets at Period-End:
| | | | |
| | | 2022 | |
| |
Undistributed ordinary income | | $ | 5,479,549 | |
| |
Net unrealized appreciation (depreciation) – investments | | | (182,843,559 | ) |
| |
Temporary book/tax differences | | | (120,270 | ) |
| |
Capital loss carryforward | | | (182,879,022 | ) |
| |
Shares of beneficial interest | | | 1,865,058,094 | |
| |
Total net assets | | $ | 1,504,694,792 | |
The difference between book-basis and tax-basis unrealized appreciation (depreciation) is due to differences in the timing of recognition of gains and losses on investments for tax and book purposes. The Fund’s net unrealized appreciation (depreciation) difference is attributable primarily to wash sales and derivative instruments.
The temporary book/tax differences are a result of timing differences between book and tax recognition of income and/or expenses. The Fund’s temporary book/tax differences are the result of the trustee deferral of compensation and retirement plan benefits.
Capital loss carryforward is calculated and reported as of a specific date. Results of transactions and other activity after that date may affect the amount of capital loss carryforward actually available for the Fund to utilize. The ability to utilize capital loss carryforward in the future may be limited under the Internal Revenue Code and related regulations based on the results of future transactions.
| | |
| 32 | | Invesco Core Bond Fund |
The Fund has a capital loss carryforward as of October 31, 2022, as follows:
| | | | | | | | | | | | | | |
| Capital Loss Carryforward* | |
| Expiration | | | | Short-Term | | | Long-Term | | | Total | |
| | | | |
Not subject to expiration | | | | $ | 142,619,694 | | | $ | 40,259,328 | | | $ | 182,879,022 | |
| * | Capital loss carryforward is reduced for limitations, if any, to the extent required by the Internal Revenue Code and may be further limited depending upon a variety of factors, including the realization of net unrealized gains or losses as of the date of any reorganization. |
NOTE 9–Investment Transactions
The aggregate amount of investment securities (other than short-term securities, U.S. Government obligations and money market funds, if any) purchased and sold by the Fund during the year ended October 31, 2022 was $1,329,567,295 and $1,152,855,810, respectively. Cost of investments, including any derivatives, on a tax basis includes the adjustments for financial reporting purposes as of the most recently completed federal income tax reporting period-end.
| | | | |
| Unrealized Appreciation (Depreciation) of Investments on a Tax Basis | |
| |
Aggregate unrealized appreciation of investments | | $ | 8,274,663 | |
| |
Aggregate unrealized (depreciation) of investments | | | (191,118,222 | ) |
| |
Net unrealized appreciation (depreciation) of investments | | $ | (182,843,559 | ) |
Cost of investments for tax purposes is $2,053,222,864.
NOTE 10–Reclassification of Permanent Differences
Primarily as a result of differing book/tax treatment of dollar rolls, on October 31, 2022, undistributed net investment income was increased by $5,506,308 and undistributed net realized gain (loss) was decreased by $5,506,308. This reclassification had no effect on the net assets or the distributable earnings (loss) of the Fund.
NOTE 11–Share Information
| | | | | | | | | | | | | | | | |
| | | Summary of Share Activity | |
| | | Year ended
October 31, 2022(a) | | | Year ended
October 31, 2021 | |
| | | Shares | | | Amount | | | Shares | | | Amount | |
Sold: | | | | | | | | | | | | | | | | |
Class A | | | 17,838,489 | | | $ | 112,639,168 | | | | 27,406,232 | | | $ | 190,173,947 | |
Class C | | | 1,518,947 | | | | 9,458,524 | | | | 2,879,515 | | | | 20,058,954 | |
Class R | | | 2,842,778 | | | | 17,892,812 | | | | 4,484,685 | | | | 31,028,788 | |
Class Y | | | 74,333,819 | | | | 455,512,781 | | | | 64,678,895 | | | | 444,839,834 | |
| | | | |
Class R6 | | | 26,237,706 | | | | 160,963,443 | | | | 23,117,686 | | | | 159,761,711 | |
Issued as reinvestment of dividends: | | | | | | | | | | | | | | | | |
Class A | | | 2,390,857 | | | | 14,761,196 | | | | 3,282,857 | | | | 22,851,333 | |
Class C | | | 131,458 | | | | 814,804 | | | | 293,791 | | | | 2,053,420 | |
Class R | | | 271,732 | | | | 1,673,246 | | | | 329,541 | | | | 2,294,068 | |
Class Y | | | 1,923,761 | | | | 11,825,056 | | | | 2,624,583 | | | | 18,148,874 | |
| | | | |
Class R6 | | | 1,043,833 | | | | 6,429,314 | | | | 1,103,448 | | | | 7,669,664 | |
Automatic conversion of Class C shares to Class A shares: | | | | | | | | | | | | | | | | |
Class A | | | 900,361 | | | | 5,642,658 | | | | 2,779,739 | | | | 19,353,054 | |
| | | | |
Class C | | | (899,544 | ) | | | (5,642,658 | ) | | | (2,776,541 | ) | | | (19,353,054 | ) |
Reacquired: | | | | | | | | | | | | | | | | |
Class A | | | (29,586,157 | ) | | | (185,141,604 | ) | | | (30,584,046 | ) | | | (211,463,682 | ) |
Class C | | | (3,162,356 | ) | | | (19,767,863 | ) | | | (3,903,685 | ) | | | (26,991,533 | ) |
Class R | | | (3,109,203 | ) | | | (19,493,649 | ) | | | (3,619,662 | ) | | | (25,034,309 | ) |
Class Y | | | (82,922,888 | ) | | | (512,936,507 | ) | | | (49,988,861 | ) | | | (343,080,322 | ) |
| | | | |
Class R6 | | | (21,257,303 | ) | | | (131,403,635 | ) | | | (16,037,206 | ) | | | (110,790,739 | ) |
| | | | |
Net increase (decrease) in share activity | | | (11,503,710 | ) | | $ | (76,772,914 | ) | | | 26,070,971 | | | $ | 181,520,008 | |
| (a) | There are entities that are record owners of more than 5% of the outstanding shares of the Fund and in the aggregate own 29% of the outstanding shares of the Fund. IDI has an agreement with these entities to sell Fund shares. The Fund, Invesco and/or Invesco affiliates may make payments to these entities, which are considered to be related to the Fund, for providing services to the Fund, Invesco and/or Invesco affiliates including but not limited to services such as securities brokerage, distribution, third party record keeping and account servicing. The Fund has no knowledge as to whether all or any portion of the shares owned of record by these entities are also owned beneficially. |
| | |
| 33 | | Invesco Core Bond Fund |
Report of Independent Registered Public Accounting Firm
To the Board of Trustees of AIM Investment Funds (Invesco Investment Funds) and Shareholders of Invesco Core Bond Fund
Opinion on the Financial Statements
We have audited the accompanying statement of assets and liabilities, including the schedule of investments, of Invesco Core Bond Fund (one of the funds constituting AIM Investment Funds (Invesco Investment Funds), referred to hereafter as the “Fund”) as of October 31, 2022, the related statement of operations for the year ended October 31, 2022, the statement of changes in net assets for each of the two years in the period ended October 31, 2022, including the related notes, and the financial highlights for each of the periods indicated in the table below (collectively referred to as the “financial statements”). In our opinion, the financial statements present fairly, in all material respects, the financial position of the Fund as of October 31, 2022, the results of its operations for the year then ended, the changes in its net assets for each of the two years in the period ended October 31, 2022 and the financial highlights for each of the periods indicated in the table below, in conformity with accounting principles generally accepted in the United States of America.
|
| Financial Highlights |
| For each of the three years in the period ended October 31, 2022 and the ten months ended October 31, 2019 for Class A, Class C, Class R, Class Y and Class R6. For each of the three years in the period ended October 31, 2022 and the period May 24, 2019 (commencement of operations) through October 31, 2019 for Class R5. |
The financial statements of Oppenheimer Total Return Bond Fund (subsequently renamed Invesco Core Bond Fund) as of and for the year ended December 31, 2018 and the financial highlights for each of the periods ended on or prior to December 31, 2018 (not presented herein, other than the financial highlights) were audited by other auditors whose report dated February 22, 2019 expressed an unqualified opinion on those financial statements and financial highlights.
Basis for Opinion
These financial statements are the responsibility of the Fund’s management. Our responsibility is to express an opinion on the Fund’s financial statements based on our audits. We are a public accounting firm registered with the Public Company Accounting Oversight Board (United States) (PCAOB) and are required to be independent with respect to the Fund in accordance with the U.S. federal securities laws and the applicable rules and regulations of the Securities and Exchange Commission and the PCAOB.
We conducted our audits of these financial statements in accordance with the standards of the PCAOB. Those standards require that we plan and perform the audit to obtain reasonable assurance about whether the financial statements are free of material misstatement, whether due to error or fraud.
Our audits included performing procedures to assess the risks of material misstatement of the financial statements, whether due to error or fraud, and performing procedures that respond to those risks. Such procedures included examining, on a test basis, evidence regarding the amounts and disclosures in the financial statements. Our audits also included evaluating the accounting principles used and significant estimates made by management, as well as evaluating the overall presentation of the financial statements. Our procedures included confirmation of securities owned as of October 31, 2022 by correspondence with the custodian, transfer agent, and brokers; when replies were not received from brokers, we performed other auditing procedures. We believe that our audits provide a reasonable basis for our opinion.
/s/PricewaterhouseCoopers LLP
Houston, Texas
December 23, 2022
We have served as the auditor of one or more of the investment companies in the Invesco group of investment companies since at least 1995. We have not been able to determine the specific year we began serving as auditor.
| | |
| 34 | | Invesco Core Bond Fund |
Calculating your ongoing Fund expenses
Example
As a shareholder of the Fund, you incur two types of costs: (1) transaction costs, which may include sales charges (loads) on purchase payments or contingent deferred sales charges on redemptions, if any; and (2) ongoing costs, including management fees, distribution and/or service (12b-1) fees, and other Fund expenses. This example is intended to help you understand your ongoing costs (in dollars) of investing in the Fund and to compare these costs with ongoing costs of investing in other mutual funds. The example is based on an investment of $1,000 invested at the beginning of the period and held for the entire period May 1, 2022 through October 31, 2022.
Actual expenses
The table below provides information about actual account values and actual expenses. You may use the information in this table, together with the amount you invested, to estimate the expenses that you paid over the period. Simply divide your account value by $1,000 (for example, an $8,600 account value divided by $1,000 = 8.6), then multiply the result by the number in the table under the heading entitled “Actual Expenses Paid During Period” to estimate the expenses you paid on your account during this period.
Hypothetical example for comparison purposes
The table below also provides information about hypothetical account values and hypothetical expenses based on the Fund’s actual expense ratio and an assumed rate of return of 5% per year before expenses, which is not the Fund’s actual return.
The hypothetical account values and expenses may not be used to estimate the actual ending account balance or expenses you paid for the period. You may use this information to compare the ongoing costs of investing in the Fund and other funds. To do so, compare this 5% hypothetical example with the 5% hypothetical examples that appear in the shareholder reports of the other funds.
Please note that the expenses shown in the table are meant to highlight your ongoing costs only and do not reflect any transaction costs, such as sales charges (loads) on purchase payments or contingent deferred sales charges on redemptions, if any. Therefore, the hypothetical information is useful in comparing ongoing costs only, and will not help you determine the relative total costs of owning different funds. In addition, if these transaction costs were included, your costs would have been higher.
| | | | | | | | | | | | | | | | | | | | | | | | |
| | | | | | ACTUAL | | | HYPOTHETICAL (5% annual return before expenses) | | | | |
| | | Beginning Account Value
(05/01/22) | | | Ending Account Value
(10/31/22)1 | | | Expenses Paid During
Period2 | | | Ending Account Value
(10/31/22) | | | Expenses Paid During
Period2 | | | Annualized Expense Ratio | |
Class A | | | $1,000.00 | | | | $918.50 | | | | $3.34 | | | | $1,021.73 | | | | $3.52 | | | | 0.69% | |
Class C | | | 1,000.00 | | | | 913.50 | | | | 6.95 | | | | 1,017.95 | | | | 7.32 | | | | 1.44 | |
Class R | | | 1,000.00 | | | | 915.70 | | | | 4.54 | | | | 1,020.47 | | | | 4.79 | | | | 0.94 | |
Class Y | | | 1,000.00 | | | | 919.10 | | | | 2.13 | | | | 1,022.99 | | | | 2.24 | | | | 0.44 | |
Class R5 | | | 1,000.00 | | | | 918.10 | | | | 2.32 | | | | 1,022.79 | | | | 2.45 | | | | 0.48 | |
Class R6 | | | 1,000.00 | | | | 918.20 | | | | 1.98 | | | | 1,023.14 | | | | 2.09 | | | | 0.41 | |
| 1 | The actual ending account value is based on the actual total return of the Fund for the period May 1, 2022 through October 31, 2022, after actual expenses and will differ from the hypothetical ending account value which is based on the Fund’s expense ratio and a hypothetical annual return of 5% before expenses. |
| 2 | Expenses are equal to the Fund’s annualized expense ratio as indicated above multiplied by the average account value over the period, multiplied by 184/365 to reflect the most recent fiscal half year. |
| | |
| 35 | | Invesco Core Bond Fund |
Approval of Investment Advisory and Sub-Advisory Contracts
At meetings held on June 13, 2022, the Board of Trustees (the Board or the Trustees) of AIM Investment Funds (Invesco Investment Funds) as a whole, and the independent Trustees, who comprise over 75% of the Board, voting separately, approved the continuance of the Invesco Core Bond Fund’s (the Fund) Master Investment Advisory Agreement with Invesco Advisers, Inc. (Invesco Advisers and the investment advisory agreement) and the Master Intergroup Sub-Advisory Contract for Mutual Funds with Invesco Asset Management Deutschland GmbH, Invesco Asset Management Limited, Invesco Asset Management (Japan) Limited, Invesco Hong Kong Limited, Invesco Senior Secured Management, Inc. and Invesco Canada Ltd. and separate sub-advisory contracts with Invesco Capital Management LLC and Invesco Asset Management (India) Private Limited and OppenheimerFunds, Inc. (collectively, the Affiliated Sub-Advisers and the sub-advisory contracts) for another year, effective July 1, 2022. After evaluating the factors discussed below, among others, the Board approved the renewal of the Fund’s investment advisory agreement and the sub-advisory contracts and determined that the compensation payable thereunder by the Fund to Invesco Advisers and by Invesco Advisers to the Affiliated Sub-Advisers is fair and reasonable.
The Board’s Evaluation Process
The Board has established an Investments Committee, which in turn has established Sub-Committees that meet throughout the year to review the performance of funds advised by Invesco Advisers (the Invesco Funds). The Sub-Committees meet regularly with portfolio managers for their assigned Invesco Funds and other members of management to review detailed information about investment performance and portfolio attributes of these funds. The Board has established additional standing and ad hoc committees that meet regularly throughout the year to review matters within their purview. The Board took into account evaluations and reports that it received from its committees and sub-committees, as well as the information provided to the Board and its committees and sub-committees throughout the year, in considering whether to approve each Invesco Fund’s investment advisory agreement and sub-advisory contracts.
As part of the contract renewal process, the Board reviews and considers information provided in response to detailed requests for information submitted to management by the independent Trustees with assistance from legal counsel to the independent Trustees and the Senior Officer, an officer of the Invesco Funds who reports directly to the independent Trustees. The Board receives comparative investment performance and fee and expense data regarding the Invesco Funds prepared by Broadridge Financial Solutions, Inc. (Broadridge), an independent mutual fund data provider, as well as information on the composition of the peer groups provided by Broadridge and its methodology for determining peer groups. The Board also receives an independent written evaluation from the Senior Officer. The Senior Officer’s evaluation is prepared as part of his responsibility to manage the process by which the Invesco Funds’ proposed management fees are negotiated during the annual contract renewal
process to ensure they are negotiated in a manner that is at arms’ length and reasonable in accordance with certain negotiated regulatory requirements. In addition to meetings with Invesco Advisers and fund counsel throughout the year and as part of meetings convened on May 2, 2022 and June 13, 2022, the independent Trustees also discussed the continuance of the investment advisory agreement and sub-advisory contracts in separate sessions with the Senior Officer and with independent legal counsel.
The discussion below is a summary of the Senior Officer’s independent written evaluation with respect to the Fund’s investment advisory agreement and sub-advisory contracts, as well as a discussion of the material factors and related conclusions that formed the basis for the Board’s approval of the Fund’s investment advisory agreement and sub-advisory contracts. The Trustees’ review and conclusions are based on the comprehensive consideration of all information presented to them during the course of the year and in prior years and are not the result of any single determinative factor. Moreover, one Trustee may have weighed a particular piece of information or factor differently than another Trustee. The information received and considered by the Board was current as of various dates prior to the Board’s approval on June 13, 2022.
Factors and Conclusions and Summary of Independent Written Fee Evaluation
| A. | Nature, Extent and Quality of Services Provided by Invesco Advisers and the Affiliated Sub-Advisers |
The Board reviewed the nature, extent and quality of the advisory services provided to the Fund by Invesco Advisers under the Fund’s investment advisory agreement, and the credentials and experience of the officers and employees of Invesco Advisers who provide these services, including the Fund’s portfolio manager(s). The Board’s review included consideration of Invesco Advisers’ investment process and oversight, credit analysis, and research capabilities. The Board considered information regarding Invesco Advisers’ programs for and resources devoted to risk management, including management of investment, enterprise, operational, liquidity, valuation and compliance risks, and technology used to manage such risks. The Board also received and reviewed information about Invesco Advisers’ role as administrator of the Invesco Funds’ liquidity risk management program. The Board received a description of, and reports related to, Invesco Advisers’ global security program and business continuity plans and of its approach to data privacy and cybersecurity, including related testing. The Board considered how the cybersecurity and business continuity plans of Invesco Advisers and its key service providers operated in the remote and hybrid working environment resulting from the novel coronavirus (“COVID-19”) pandemic and paved the way for a hybrid working framework in a normalized environment as employees return to the office. The Board also considered non-advisory services that Invesco Advisers and its affiliates provide to the Invesco Funds, such as various back office support functions, third party oversight, internal audit, valuation, portfolio trading and legal and compliance. The Board observed that Invesco Advisers’ systems preparedness and ongoing investment enabled
Invesco Advisers to manage, operate and oversee the Invesco Funds with minimal impact or disruption through challenging environments. The Board reviewed and considered the benefits to shareholders of investing in a Fund that is part of the family of funds under the umbrella of Invesco Ltd., Invesco Advisers’ parent company, and noted Invesco Ltd.’s depth and experience in running an investment management business, as well as its commitment of financial and other resources to such business. The Board concluded that the nature, extent and quality of the services provided to the Fund by Invesco Advisers are appropriate and satisfactory.
The Board reviewed the services that may be provided by the Affiliated Sub-Advisers under the sub-advisory contracts and the credentials and experience of the officers and employees of the Affiliated Sub-Advisers who provide these services. The Board noted the Affiliated Sub-Advisers’ expertise with respect to certain asset classes and that the Affiliated Sub-Advisers have offices and personnel that are located in financial centers around the world. As a result, the Board noted that the Affiliated Sub-Advisers can provide research and investment analysis on the markets and economies of various countries in which the Fund may invest, make recommendations regarding securities and assist with security trades. The Board concluded that the sub-advisory contracts may benefit the Fund and its shareholders by permitting Invesco Advisers to use the resources and talents of the Affiliated Sub-Advisers in managing the Fund. The Board concluded that the nature, extent and quality of the services that may be provided to the Fund by the Affiliated Sub-Advisers are appropriate and satisfactory.
B. Fund Investment Performance
The Board considered Fund investment performance as a relevant factor in considering whether to approve the investment advisory agreement. The Board did not view Fund investment performance as a relevant factor in considering whether to approve the sub-advisory contracts for the Fund, as no Affiliated Sub-Adviser currently manages assets of the Fund.
The Board compared the Fund’s investment performance over multiple time periods ending December 31, 2021 to the performance of funds in the Broadridge performance universe and against the Bloomberg U.S. Aggregate Bond Index (Index). The Board noted that performance of Class A shares of the Fund was in the fourth quintile of its performance universe for the one year period and the second quintile for the three and five year periods (the first quintile being the best performing funds and the fifth quintile being the worst performing funds). The Board noted that performance of Class A shares of the Fund was reasonably comparable to the performance of the Index for the one year period and above the performance of the Index for the three and five year periods. The Board considered that the Fund was created in connection with Invesco Ltd.’s acquisition of OppenheimerFunds, Inc. and its subsidiaries (the “Transaction”) and that the Fund’s performance prior to the closing of the Transaction on May 24, 2019 is that of its predecessor fund. The Board recognized that the performance data reflects a snapshot in time as of a particular date and that selecting a different performance period could produce different results.
| | |
| 36 | | Invesco Core Bond Fund |
The Board also reviewed more recent Fund performance as well as other performance metrics, which did not change its conclusions.
| C. | Advisory and Sub-Advisory Fees and Fund Expenses |
The Board compared the Fund’s contractual management fee rate to the contractual management fee rates of funds in the Fund’s Broadridge expense group. The Board noted that the contractual management fee rate for Class A shares of the Fund was below the median contractual management fee rate of funds in its expense group. The Board noted that the term “contractual management fee” for funds in the expense group may include both advisory and certain non-portfolio management administrative services fees, but that Broadridge is not able to provide information on a fund by fund basis as to what is included. The Board also reviewed the methodology used by Broadridge in calculating expense group information, which includes using each fund’s contractual management fee schedule (including any applicable breakpoints) as reported in the most recent prospectus or statement of additional information for each fund in the expense group. The Board also considered comparative information regarding the Fund’s total expense ratio and its various components.
The Board noted that Invesco Advisers has contractually agreed to waive fees and/or limit expenses of the Fund for the term disclosed in the Fund’s registration statement in an amount necessary to limit total annual operating expenses to a specified percentage of average daily net assets for each class of the Fund.
The Board also considered the fees charged by Invesco Advisers and its affiliates to other client accounts that are similarly managed. Invesco Advisers reviewed with the Board differences in the scope of services it provides to the Invesco Funds relative to that provided by Invesco Advisers and its affiliates to certain other types of client accounts, including, among others: management of cash flows as a result of redemptions and purchases; necessary infrastructure such as officers, office space, technology, legal and distribution; oversight of service providers; costs and business risks associated with launching new funds and sponsoring and maintaining the product line; and compliance with federal and state laws and regulations. Invesco Advisers also advised the Board that many of the similarly managed client accounts have all-inclusive fee structures, which are not easily un-bundled.
The Board also considered the services that may be provided by the Affiliated Sub-Advisers pursuant to the sub-advisory contracts, as well as the fees payable by Invesco Advisers to the Affiliated Sub-Advisers pursuant to the sub-advisory contracts.
| D. | Economies of Scale and Breakpoints |
The Board considered the extent to which there may be economies of scale in the provision of advisory services to the Fund and the Invesco Funds, and the extent to which such economies of scale are shared with the Fund and the Invesco Funds. The Board considered that the Fund benefits from economies of scale through contractual breakpoints in the Fund’s advisory fee schedule, which generally operate to reduce the Fund’s expense ratio as it grows in size. The Board noted that the Fund also shares in economies of scale through Invesco Advisers’ ability to negotiate lower fee arrangements with third party service providers. The Board noted that the Fund may also benefit from economies of scale through initial
fee setting, fee waivers and expense reimbursements, as well as Invesco Advisers’ investment in its business, including investments in business infrastructure, technology and cybersecurity.
| E. | Profitability and Financial Resources |
The Board reviewed information from Invesco Advisers concerning the costs of the advisory and other services that Invesco Advisers and its affiliates provide to the Fund and the Invesco Funds and the profitability of Invesco Advisers and its affiliates in providing these services in the aggregate and on an individual Fund-by-Fund basis. The Board considered the methodology used for calculating profitability and the periodic review and enhancement of such methodology. The Board noted that Invesco Advisers continues to operate at a net profit from services Invesco Advisers and its affiliates provide to the Invesco Funds in the aggregate and to most Funds individually. The Board did not deem the level of profits realized by Invesco Advisers and its affiliates from providing such services to be excessive, given the nature, extent and quality of the services provided. The Board noted that Invesco Advisers provided information demonstrating that Invesco Advisers is financially sound and has the resources necessary to perform its obligations under the investment advisory agreement, and provided representations indicating that the Affiliated Sub-Advisers are financially sound and have the resources necessary to perform their obligations under the sub-advisory contracts.
| F. | Collateral Benefits to Invesco Advisers and its Affiliates |
The Board considered various other benefits received by Invesco Advisers and its affiliates from the relationship with the Fund, including the fees received for providing administrative, transfer agency and distribution services to the Fund. The Board received comparative information regarding fees charged for these services, including information provided by Broadridge and other independent sources. The Board reviewed the performance of Invesco Advisers and its affiliates in providing these services and the organizational structure employed to provide these services. The Board noted that these services are provided to the Fund pursuant to written contracts that are reviewed and subject to approval on an annual basis by the Board based on its determination that the services are required for the operation of the Fund.
The Board considered the benefits realized by Invesco Advisers and the Affiliated Sub-Advisers as a result of portfolio brokerage transactions executed through “soft dollar” arrangements. Invesco Advisers noted that the Fund does not execute brokerage transactions through “soft dollar” arrangements to any significant degree.
The Board considered that the Fund’s uninvested cash and cash collateral from any securities lending arrangements may be invested in registered money market funds or, with regard to securities lending cash collateral, unregistered funds that comply with Rule 2a-7 (collectively referred to as “affiliated money market funds”) advised by Invesco Advisers. The Board considered information regarding the returns of the affiliated money market funds relative to comparable overnight investments, as well as the fees paid by the affiliated money market funds to Invesco Advisers and its affiliates. In this regard, the Board noted that Invesco Advisers receives advisory fees from these affiliated money market funds
attributable to the Fund’s investments. The Board also noted that Invesco Advisers has contractually agreed to waive through varying periods an amount equal to 100% of the net advisory fee Invesco Advisers receives from the affiliated money market funds with respect to the Fund’s investment in the affiliated money market funds of uninvested cash, but not cash collateral. The Board concluded that the advisory fees payable to Invesco Advisers from the Fund’s investment of cash collateral from any securities lending arrangements in the affiliated money market funds are for services that are not duplicative of services provided by Invesco Advisers to the Fund.
The Board considered that Invesco Advisers may serve as the Fund’s affiliated securities lending agent and evaluated the benefits realized by Invesco Advisers when serving in such role, including the compensation received. The Board considered Invesco Advisers’ securities lending platform and corporate governance structure for securities lending, including Invesco Advisers’ Securities Lending Governance Committee and its related responsibilities. The Board noted that to the extent the Fund utilizes Invesco Advisers as an affiliated securities lending agent, the Fund conducts its securities lending in accordance with, and in reliance upon, no-action letters issued by the SEC staff that provide guidance on how an affiliate may act as a direct agent lender and receive compensation for those services without obtaining exemptive relief. The Board considered information provided by Invesco Advisers related to the performance of Invesco Advisers as securities lending agent, including a summary of the securities lending services provided to the Fund by Invesco Advisers and the compensation paid to Invesco Advisers for such services, as well as any revenues generated for the Fund in connection with such securities lending activity and the allocation of such revenue between the Fund and Invesco Advisers.
The Board also received information about commissions that an affiliated broker may receive for executing certain trades for the Fund. Invesco Advisers and the Affiliated Sub-Advisers advised the Board of the benefits to the Fund of executing trades through the affiliated broker and that such trades were executed in compliance with rules under the federal securities laws and consistent with best execution obligations.
| | |
| 37 | | Invesco Core Bond Fund |
Tax Information
Form 1099-DIV, Form 1042-S and other year–end tax information provide shareholders with actual calendar year amounts that should be included in their tax returns. Shareholders should consult their tax advisers.
The following distribution information is being provided as required by the Internal Revenue Code or to meet a specific state’s requirement.
The Fund designates the following amounts or, if subsequently determined to be different, the maximum amount allowable for its fiscal year ended October 31, 2022:
| | | | | | | | |
Federal and State Income Tax | | | | | | |
Qualified Dividend Income* | | | 5.86% | | | | | |
Corporate Dividends Received Deduction* | | | 5.00% | | | | | |
U.S. Treasury Obligations* | | | 12.34% | | | | | |
Qualified Business Income* | | | 0.00% | | | | | |
Business Interest Income* | | | 82.14% | | | | | |
|
| * The above percentages are based on ordinary income dividends paid to shareholders during the Fund’s fiscal year. | |
| | |
| 38 | | Invesco Core Bond Fund |
Trustees and Officers
The address of each trustee and officer is AIM Investment Funds (Invesco Investment Funds) (the “Trust”), 11 Greenway Plaza, Suite 1000, Houston, Texas 77046-1173. The trustees serve for the life of the Trust, subject to their earlier death, incapacitation, resignation, retirement or removal as more specifically provided in the Trust’s organizational documents. Each officer serves for a one year term or until their successors are elected and qualified. Column two below includes length of time served with predecessor entities, if any.
| | | | | | | | |
Name, Year of Birth and Position(s)
Held with the Trust | | Trustee
and/or
Officer
Since | | Principal Occupation(s) During Past 5 Years | | Number of
Funds in
Fund Complex
Overseen by
Trustee | | Other Directorship(s)
Held by Trustee
During Past 5 Years |
Interested Trustee | | | | | | | | |
Martin L. Flanagan1 – 1960 Trustee and Vice Chair | | 2007 | | Executive Director, Chief Executive Officer and President, Invesco Ltd. (ultimate parent of Invesco and a global investment management firm); Trustee and Vice Chair, The Invesco Funds; Vice Chair, Investment Company Institute; and Member of Executive Board, SMU Cox School of Business Formerly: Advisor to the Board, Invesco Advisers, Inc. (formerly known as Invesco Institutional (N.A.), Inc.); Chairman and Chief Executive Officer, Invesco Advisers, Inc. (registered investment adviser); Director, Chairman, Chief Executive Officer and President, Invesco Holding Company (US), Inc. (formerly IVZ Inc.) (holding company), Invesco Group Services, Inc. (service provider) and Invesco North American Holdings, Inc. (holding company); Director, Chief Executive Officer and President, Invesco Holding Company Limited (parent of Invesco and a global investment management firm); Director, Invesco Ltd.; Chairman, Investment Company Institute and President, Co-Chief Executive Officer, Co-President, Chief Operating Officer and Chief Financial Officer, Franklin Resources, Inc. (global investment management organization) | | 189 | | None |
| 1 | Mr. Flanagan is considered an interested person (within the meaning of Section 2(a)(19) of the 1940 Act) of the Trust because he is an officer of the Adviser to the Trust, and an officer and a director of Invesco Ltd., ultimate parent of the Adviser. |
| | |
| T-1 | | Invesco Core Bond Fund |
Trustees and Officers—(continued)
| | | | | | | | |
Name, Year of Birth and Position(s) Held with the Trust | | Trustee and/or Officer Since | | Principal Occupation(s) During Past 5 Years | | Number of Funds in Fund Complex Overseen by Trustee | | Other Directorship(s) Held by Trustee During Past 5 Years |
Independent Trustees | | | | | | | | |
Beth Ann Brown – 1968 Trustee (2019) and Chair (August 2022) | | 2019 | | Independent Consultant Formerly: Head of Intermediary Distribution, Managing Director, Strategic Relations, Managing Director, Head of National Accounts, Senior Vice President, National Account Manager and Senior Vice President, Key Account Manager, Columbia Management Investment Advisers LLC; Vice President, Key Account Manager, Liberty Funds Distributor, Inc.; and Trustee of certain Oppenheimer Funds | | 189 | | Director, Board of Directors of Caron Engineering Inc.; Advisor, Board of Advisors of Caron Engineering Inc.; President and Director, Acton Shapleigh Youth Conservation Corps (non-profit) Formerly: President and Director Director of Grahamtastic Connection (non-profit) |
Cynthia Hostetler – 1962 Trustee | | 2017 | | Non-Executive Director and Trustee of a number of public and private business corporations Formerly: Director, Aberdeen Investment Funds (4 portfolios); Director, Artio Global Investment LLC (mutual fund complex); Director, Edgen Group, Inc. (specialized energy and infrastructure products distributor); Director, Genesee & Wyoming, Inc. (railroads); Head of Investment Funds and Private Equity, Overseas Private Investment Corporation; President, First Manhattan Bancorporation, Inc.; and Attorney, Simpson Thacher & Bartlett LLP | | 189 | | Resideo Technologies, Inc. (smart home technology); Vulcan Materials Company (construction materials company); Trilinc Global Impact Fund; Textainer Group Holdings, (shipping container leasing company); Investment Company Institute (professional organization); and Independent Directors Council (professional organization) |
Eli Jones – 1961 Trustee | | 2016 | | Professor and Dean Emeritus, Mays Business School - Texas A&M University Formerly: Dean of Mays Business School-Texas A&M University; Professor and Dean, Walton College of Business, University of Arkansas and E.J. Ourso College of Business, Louisiana State University; and Director, Arvest Bank | | 189 | | Insperity, Inc. (formerly known as Administaff) (human resources provider); and Member of Regional Board of Directors and Board of Directors, First Financial Bancorp (regional bank) |
Elizabeth Krentzman – 1959 Trustee | | 2019 | | Formerly: Principal and Chief Regulatory Advisor for Asset Management Services and U.S. Mutual Fund Leader of Deloitte & Touche LLP; General Counsel of the Investment Company Institute (trade association); National Director of the Investment Management Regulatory Consulting Practice, Principal, Director and Senior Manager of Deloitte & Touche LLP; Assistant Director of the Division of Investment Management - Office of Disclosure and Investment Adviser Regulation of the U.S. Securities and Exchange Commission and various positions with the Division of Investment Management - Office of Regulatory Policy of the U.S. Securities and Exchange Commission; Associate at Ropes & Gray LLP; and Trustee of certain Oppenheimer Funds | | 189 | | Formerly: Member of the Cartica Funds Board of Directors (private investment fund); Trustee of the University of Florida National Board Foundation; and Member of the University of Florida Law Center Association, Inc. Board of Trustees, Audit Committee and Membership Committee |
Anthony J. LaCava, Jr. – 1956 Trustee | | 2019 | | Formerly: Director and Member of the Audit Committee, Blue Hills Bank (publicly traded financial institution) and Managing Partner, KPMG LLP | | 189 | | Blue Hills Bank; Chairman, Bentley University; Member, Business School Advisory Council; and Nominating Committee, KPMG LLP |
Prema Mathai-Davis – 1950 Trustee | | 2001 | | Retired Formerly: Co-Founder & Partner of Quantalytics Research, LLC, (a FinTech Investment Research Platform for the Self-Directed Investor); Trustee of YWCA Retirement Fund; CEO of YWCA of the USA; Board member of the NY Metropolitan Transportation Authority; Commissioner of the NYC Department of Aging; and Board member of Johns Hopkins Bioethics Institute | | 189 | | Member of Board of Positive Planet US (non-profit) and HealthCare Chaplaincy Network (non-profit) |
| | |
| T-2 | | Invesco Core Bond Fund |
Trustees and Officers—(continued)
| | | | | | | | |
Name, Year of Birth and Position(s) Held with the Trust | | Trustee and/or Officer Since | | Principal Occupation(s) During Past 5 Years | | Number of Funds in Fund Complex Overseen by Trustee | | Other Directorship(s) Held by Trustee During Past 5 Years |
Independent Trustees–(continued) | | | | |
Joel W. Motley – 1952 Trustee | | 2019 | | Director of Office of Finance, Federal Home Loan Bank System; Managing Director of Carmona Motley Inc. (privately held financial advisor); Member of the Council on Foreign Relations and its Finance and Budget Committee; Chairman Emeritus of Board of Human Rights Watch and Member of its Investment Committee; and Member of Investment Committee Board of Historic Hudson Valley (non-profit cultural organization); Member of the Board, Blue Ocean Acquisition Corp.; and Member of the Vestry and the Investment Committee of Trinity Church Wall Street. Formerly: Managing Director of Public Capital Advisors, LLC (privately held financial advisor); Managing Director of Carmona Motley Hoffman, Inc. (privately held financial advisor); Trustee of certain Oppenheimer Funds; and Director of Columbia Equity Financial Corp. (privately held financial advisor) | | 189 | | Member of Board of Trust for Mutual Understanding (non-profit promoting the arts and environment); Member of Board of Greenwall Foundation (bioethics research foundation) and its Investment Committee; Member of Board of Friends of the LRC (non- profit legal advocacy); and Board Member and Investment Committee Member of Pulitzer Center for Crisis Reporting (non-profit journalism) |
Teresa M. Ressel – 1962 Trustee | | 2017 | | Non-executive director and trustee of a number of public and private business corporations Formerly: Chief Executive Officer, UBS Securities LLC (investment banking); Chief Operating Officer, UBS AG Americas (investment banking); Sr. Management Team Olayan America, The Olayan Group (international investor/commercial/industrial); Assistant Secretary for Management & Budget and Designated Chief Financial Officer, U.S. Department of Treasury and Director, ON Semiconductor Corporation (semiconductor manufacturing) | | 189 | | None |
Robert C. Troccoli – 1949 Trustee | | 2016 | | Retired Formerly: Adjunct Professor, University of Denver - Daniels College of Business; and Managing Partner, KPMG LLP | | 189 | | None |
Daniel S. Vandivort – 1954 Trustee | | 2019 | | President, Flyway Advisory Services LLC (consulting and property management) Formerly: President and Chief Investment Officer, previously Head of Fixed Income, Weiss Peck and Greer/Robeco Investment Management; Trustee and Chair, Weiss Peck and Greer Funds Board; and various capacities at CS First Boston including Head of Fixed Income at First Boston Asset Management. | | 189 | | Formerly: Trustee and Governance Chair, Oppenheimer Funds; Treasurer, Chairman of the Audit and Finance Committee, Huntington Disease Foundation of America |
| | |
| T-3 | | Invesco Core Bond Fund |
Trustees and Officers—(continued)
| | | | | | | | |
Name, Year of Birth and Position(s) Held with the Trust | | Trustee and/or Officer Since | | Principal Occupation(s) During Past 5 Years | | Number of Funds in Fund Complex Overseen by Trustee | | Other Directorship(s) Held by Trustee During Past 5 Years |
Officers | | | | | | | | |
Sheri Morris – 1964 President and Principal Executive Officer | | 1999 | | Director, Invesco Trust Company; Head of Global Fund Services, Invesco Ltd.; President and Principal Executive Officer, The Invesco Funds; Vice President, Invesco Exchange-Traded Fund Trust, Invesco Exchange-Traded Fund Trust II, Invesco India Exchange-Traded Fund Trust, Invesco Actively Managed Exchange-Traded Fund Trust, Invesco Actively Managed Exchange-Traded Commodity Fund Trust and Invesco Exchange-Traded Self-Indexed Fund Trust; and Vice President, OppenheimerFunds, Inc. Formerly: Vice President, Treasurer and Principal Financial Officer, The Invesco Funds; Vice President, Invesco AIM Advisers, Inc., Invesco AIM Capital Management, Inc. and Invesco AIM Private Asset Management, Inc.; Assistant Vice President and Assistant Treasurer, The Invesco Funds; Vice President and Assistant Vice President, Invesco Advisers, Inc.; Assistant Vice President, Invesco AIM Capital Management, Inc. and Invesco AIM Private Asset Management, Inc.; Treasurer, Invesco Exchange-Traded Fund Trust, Invesco Exchange-Traded Fund Trust II, Invesco India Exchange-Traded Fund Trust and Invesco Actively Managed Exchange-Traded Fund Trust; and Senior Vice President, Invesco Advisers, Inc. (formerly known as Invesco Institutional (N.A.), Inc.) (registered investment adviser) | | N/A | | N/A |
Jeffrey H. Kupor – 1968 Senior Vice President, Chief Legal Officer and Secretary | | 2018 | | Head of Legal of the Americas, Invesco Ltd.; Senior Vice President and Secretary, Invesco Advisers, Inc. (formerly known as Invesco Institutional (N.A.), Inc.) (registered investment adviser); Secretary, Invesco Distributors, Inc. (formerly known as Invesco AIM Distributors, Inc.); Vice President and Secretary, Invesco Investment Services, Inc. (formerly known as Invesco AIM Investment Services, Inc.); Senior Vice President, Chief Legal Officer and Secretary, The Invesco Funds; Secretary and General Counsel, Invesco Investment Advisers LLC (formerly known as Van Kampen Asset Management); Secretary and General Counsel, Invesco Capital Markets, Inc. (formerly known as Van Kampen Funds Inc.); Chief Legal Officer, Invesco Exchange-Traded Fund Trust, Invesco Exchange-Traded Fund Trust II, Invesco India Exchange-Traded Fund Trust, Invesco Actively Managed Exchange-Traded Fund Trust, Invesco Actively Managed Exchange-Traded Commodity Fund Trust and Invesco Exchange-Traded Self-Indexed Fund Trust;; Secretary and Vice President, Harbourview Asset Management Corporation; Secretary and Vice President, OppenheimerFunds, Inc. and Invesco Managed Accounts, LLC; Secretary and Senior Vice President, OFI Global Institutional, Inc.; Secretary and Vice President, OFI SteelPath, Inc.; Secretary and Vice President, Oppenheimer Acquisition Corp.; Secretary and Vice President, Shareholder Services, Inc.; and Secretary and Vice President, Trinity Investment Management Corporation Formerly: Senior Vice President, Invesco Distributors, Inc.; Secretary and Vice President, Jemstep, Inc.; Head of Legal, Worldwide Institutional, Invesco Ltd.; Secretary and General Counsel, INVESCO Private Capital Investments, Inc.; Senior Vice President, Secretary and General Counsel, Invesco Management Group, Inc. (formerly known as Invesco AIM Management Group, Inc.); Assistant Secretary, INVESCO Asset Management (Bermuda) Ltd.; Secretary and General Counsel, Invesco Private Capital, Inc.;Assistant Secretary and General Counsel, INVESCO Realty, Inc.; Secretary and General Counsel, Invesco Senior Secured Management, Inc.; Secretary, Sovereign G./P. Holdings Inc.; Secretary, Invesco Indexing LLC; and Secretary, W.L. Ross & Co., LLC | | N/A | | N/A |
Andrew R. Schlossberg – 1974 Senior Vice President | | 2019 | | Senior Vice President, Invesco Group Services, Inc.; Head of the Americas and Senior Managing Director, Invesco Ltd.; Director and Senior Vice President, Invesco Advisers, Inc. (formerly known as Invesco Institutional (N.A.), Inc.) (registered investment adviser); Director and Chairman, Invesco Investment Services, Inc. (formerly known as Invesco AIM Investment Services, Inc.) (registered transfer agent); Senior Vice President, The Invesco Funds; and Director, Invesco Investment Advisers LLC (formerly known as Van Kampen Asset Management) Formerly: Director, President and Chairman, Invesco Insurance Agency, Inc.; Director, Invesco UK Limited; Director and Chief Executive, Invesco Asset Management Limited and Invesco Fund Managers Limited; Assistant Vice President, The Invesco Funds; Senior Vice President, Invesco Advisers, Inc. (formerly known as Invesco Institutional (N.A.), Inc.) (registered investment adviser); Director and Chief Executive, Invesco Administration Services Limited and Invesco Global Investment Funds Limited; Director, Invesco Distributors, Inc.; Head of EMEA, Invesco Ltd.; President, Invesco Actively Managed Exchange-Traded Commodity Fund Trust, Invesco Actively Managed Exchange-Traded Fund Trust, Invesco Exchange-Traded Fund Trust, Invesco Exchange-Traded Fund Trust II and Invesco India Exchange-Traded Fund Trust; and Managing Director and Principal Executive Officer, Invesco Capital Management LLC | | N/A | | N/A |
| | |
| T-4 | | Invesco Core Bond Fund |
Trustees and Officers—(continued)
| | | | | | | | |
Name, Year of Birth and Position(s) Held with the Trust | | Trustee and/or Officer Since | | Principal Occupation(s) During Past 5 Years | | Number of Funds in Fund Complex Overseen by Trustee | | Other Directorship(s) Held by Trustee During Past 5 Years |
Officers–(continued) | | | | | | |
John M. Zerr – 1962 Senior Vice President | | 2006 | | Chief Operating Officer of the Americas; Senior Vice President, Invesco Advisers, Inc. (formerly known as Invesco Institutional (N.A.), Inc.) (registered investment adviser); Senior Vice President, Invesco Distributors, Inc. (formerly known as Invesco AIM Distributors, Inc.); Director and Vice President, Invesco Investment Services, Inc. (formerly known as Invesco AIM Investment Services, Inc.) Senior Vice President, The Invesco Funds; Managing Director, Invesco Capital Management LLC; Director, Invesco Investment Advisers LLC (formerly known as Van Kampen Asset Management); Senior Vice President, Invesco Capital Markets, Inc. (formerly known as Van Kampen Funds Inc.); Manager, Invesco Indexing LLC; Manager, Invesco Specialized Products, LLC; Member, Invesco Canada Funds Advisory Board; Director, President and Chief Executive Officer, Invesco Corporate Class Inc. (corporate mutual fund company); and Director, Chairman, President and Chief Executive Officer, Invesco Canada Ltd. (formerly known as Invesco Trimark Ltd./Invesco Trimark Ltèe) (registered investment adviser and registered transfer agent); President, Invesco, Inc.; President, Invesco Global Direct Real Estate Feeder GP Ltd.; President, Invesco IP Holdings (Canada) Ltd; President, Invesco Global Direct Real Estate GP Ltd.; President, Invesco Financial Services Ltd. / Services Financiers Invesco Ltée; and Director and Chairman, Invesco Trust Company Formerly: President, Trimark Investments Ltd/Services Financiers Invesco Ltee; Director and Senior Vice President, Invesco Insurance Agency, Inc.; Director and Senior Vice President, Invesco Management Group, Inc. (formerly known as Invesco AIM Management Group, Inc.); Secretary and General Counsel, Invesco Management Group, Inc. (formerly known as Invesco AIM Management Group, Inc.); Secretary, Invesco Investment Services, Inc. (formerly known as Invesco AIM Investment Services, Inc.); Chief Legal Officer and Secretary, The Invesco Funds; Secretary and General Counsel, Invesco Investment Advisers LLC (formerly known as Van Kampen Asset Management); Secretary and General Counsel, Invesco Capital Markets, Inc. (formerly known as Van Kampen Funds Inc.); Chief Legal Officer, Invesco Exchange-Traded Fund Trust, Invesco Exchange-Traded Fund Trust II, Invesco India Exchange-Traded Fund Trust, Invesco Actively Managed Exchange-Traded Fund Trust, Invesco Actively Managed Exchange-Traded Commodity Fund Trust and Invesco Exchange-Traded Self-Indexed Fund Trust; Secretary, Invesco Indexing LLC; Director, Secretary, General Counsel and Senior Vice President, Van Kampen Exchange Corp.; Director, Vice President and Secretary, IVZ Distributors, Inc. (formerly known as INVESCO Distributors, Inc.); Director and Vice President, INVESCO Funds Group, Inc.; Director and Vice President, Van Kampen Advisors Inc.; Director, Vice President, Secretary and General Counsel, Van Kampen Investor Services Inc.;Director and Secretary, Invesco Distributors, Inc. (formerly known as Invesco AIM Distributors, Inc.); Director, Senior Vice President, General Counsel and Secretary, Invesco AIM Advisers, Inc. and Van Kampen Investments Inc.; Director, Vice President and Secretary, Fund Management Company; Director, Senior Vice President, Secretary, General Counsel and Vice President, Invesco AIM Capital Management, Inc.; and Chief Operating Officer and General Counsel, Liberty Ridge Capital, Inc. (an investment adviser) | | N/A | | N/A |
Gregory G. McGreevey – 1962 Senior Vice President | | 2012 | | Senior Managing Director, Invesco Ltd.; Director, Chairman, President, and Chief Executive Officer, Invesco Advisers, Inc. (formerly known as Invesco Institutional (N.A.), Inc.) (registered investment adviser); Director, Invesco Mortgage Capital, Inc. and Invesco Senior Secured Management, Inc.; Senior Vice President, The Invesco Funds; President, SNW Asset Management Corporation and Invesco Managed Accounts, LLC; Chairman and Director, Invesco Private Capital, Inc.; Chairman and Director, INVESCO Private Capital Investments, Inc.; Chairman and Director, INVESCO Realty, Inc.; and Senior Vice President, Invesco Group Services, Inc. Formerly: Senior Vice President, Invesco Management Group, Inc. and Invesco Advisers, Inc.; Assistant Vice President, The Invesco Funds | | N/A | | N/A |
Adrien Deberghes – 1967 Principal Financial Officer, Treasurer and Vice President | | 2020 | | Head of the Fund Office of the CFO and Fund Administration; Vice President, Invesco Advisers, Inc.; Principal Financial Officer, Treasurer and Vice President, The Invesco Funds; Vice President, Invesco Exchange-Traded Fund Trust, Invesco Exchange-Traded Fund Trust II, Invesco India Exchange-Traded Fund Trust, Invesco Actively Managed Exchange-Traded Fund Trust, Invesco Actively Managed Exchange-Traded Commodity Fund Trust and Invesco Exchange-Traded Self-Indexed Fund Trust Formerly: Senior Vice President and Treasurer, Fidelity Investments | | N/A | | N/A |
Crissie M. Wisdom – 1969 Anti-Money Laundering Compliance Officer | | 2013 | | Anti-Money Laundering and OFAC Compliance Officer for Invesco U.S. entities including: Invesco Advisers, Inc. and its affiliates, Invesco Capital Markets, Inc., Invesco Distributors, Inc., Invesco Investment Services, Inc., The Invesco Funds, Invesco Capital Management, LLC, Invesco Trust Company; and Fraud Prevention Manager for Invesco Investment Services, Inc. | | N/A | | N/A |
| | |
| T-5 | | Invesco Core Bond Fund |
Trustees and Officers—(continued)
| | | | | | | | |
Name, Year of Birth and Position(s) Held with the Trust | | Trustee and/or Officer Since | | Principal Occupation(s) During Past 5 Years | | Number of Funds in Fund Complex Overseen by Trustee | | Other Directorship(s) Held by Trustee During Past 5 Years |
Officers–(continued) | | | | | | | | |
Todd F. Kuehl – 1969 Chief Compliance Officer and Senior Vice President | | 2020 | | Chief Compliance Officer, Invesco Advisers, Inc. (registered investment adviser); and Chief Compliance Officer and Senior Vice President, The Invesco Funds Formerly: Managing Director and Chief Compliance Officer, Legg Mason (Mutual Funds); Chief Compliance Officer, Legg Mason Private Portfolio Group (registered investment adviser) | | N/A | | N/A |
James Bordewick, Jr. – 1959 Senior Vice President and Senior Officer | | 2022 | | Senior Vice President and Senior Officer, The Invesco Funds; and Chief Legal Officer, KingsCrowd, Inc. (research and analytical platform for investment in private capital markets) Formerly, Chief Operating Officer and Head of Legal and Regulatory, Netcapital (private capital investment platform); Managing Director, General Counsel of asset management and Chief Compliance Officer for asset management and private banking, Bank of America Corporation; Chief Legal Officer, Columbia Funds and BofA Funds; Senior Vice President and Associate General Counsel, MFS Investment Management; Chief Legal Officer, MFS Funds; Associate, Ropes & Gray; Associate, Gaston Snow & Ely Bartlett | | N/A | | N/A |
The Statement of Additional Information of the Trust includes additional information about the Fund’s Trustees and is available upon request, without charge, by calling 1.800.959.4246. Please refer to the Fund’s Statement of Additional Information for information on the Fund’s sub-advisers.
| | | | | | |
| Office of the Fund | | Investment Adviser | | Distributor | | Auditors |
| 11 Greenway Plaza, Suite 1000 | | Invesco Advisers, Inc. | | Invesco Distributors, Inc. | | PricewaterhouseCoopers LLP |
| Houston, TX 77046-1173 | | 1555 Peachtree Street, N.E. | | 11 Greenway Plaza, Suite 1000 | | 1000 Louisiana Street, Suite 5800 |
| | Atlanta, GA 30309 | | Houston, TX 77046-1173 | | Houston, TX 77002-5021 |
| | | |
| Counsel to the Fund | | Counsel to the Independent Trustees | | Transfer Agent | | Custodian |
| Stradley Ronon Stevens & Young, LLP | | Goodwin Procter LLP | | Invesco Investment Services, Inc. | | State Street Bank and Trust Company |
| 2005 Market Street, Suite 2600 | | 901 New York Avenue, N.W. | | 11 Greenway Plaza, Suite 1000 | | 225 Franklin Street |
| Philadelphia, PA 19103-7018 | | Washington, D.C. 20001 | | Houston, TX 77046-1173 | | Boston, MA 02110-2801 |
| | |
| T-6 | | Invesco Core Bond Fund |
(This page intentionally left blank)
(This page intentionally left blank)
(This page intentionally left blank)

Go paperless with eDelivery
Visit invesco.com/edelivery to enjoy the convenience and security of anytime electronic access to your investment documents.
With eDelivery, you can elect to have any or all of the following materials delivered straight to your inbox to download, save and print from your own computer:
| ∎ | | Fund reports and prospectuses |
Invesco mailing information
Send general correspondence to Invesco Investment Services, Inc., P.O. Box 219078, Kansas City, MO 64121-9078.
Important notice regarding delivery of security holder documents
To reduce Fund expenses, only one copy of most shareholder documents may be mailed to shareholders with multiple accounts at the same address (Householding). Mailing of your shareholder documents may be householded indefinitely unless you instruct us otherwise. If you do not want the mailing of these documents to be combined with those for other members of your household, please contact Invesco Investment Services, Inc. at 800 959 4246 or contact your financial institution. We will begin sending you individual copies for each account within 30 days after receiving your request.
Fund holdings and proxy voting information
The Fund provides a complete list of its portfolio holdings four times each year, at the end of each fiscal quarter. For the second and fourth quarters, the list appears, respectively, in the Fund’s semiannual and annual reports to shareholders. For the first and third quarters, the Fund files the list with the Securities and Exchange Commission (SEC) as an exhibit to its reports on Form N-PORT. The most recent list of portfolio holdings is available at invesco.com/completeqtrholdings. Shareholders can also look up the Fund’s Form N-PORT filings on the SEC website, sec.gov. The SEC file numbers for the Fund are shown below.
A description of the policies and procedures that the Fund uses to determine how to vote proxies relating to portfolio securities is available without charge, upon request, from our Client Services department at 800 959 4246, or at invesco.com/corporate/about-us/esg. The information is also available on the SEC website, sec.gov.
Information regarding how the Fund voted proxies related to its portfolio securities during the most recent 12-month period ended June 30 is available at invesco.com/proxysearch. This information is also available on the SEC website, sec.gov.
Invesco Advisers, Inc. is an investment adviser; it provides investment advisory services to individual and institutional clients and does not sell securities. Invesco Distributors, Inc. is the US distributor for Invesco Ltd.’s retail mutual funds, exchange-traded funds and institutional money market funds. Both are wholly owned, indirect subsidiaries of Invesco Ltd.
| | | | |
| SEC file number(s): 811-03826 and 033-19338 | | Invesco Distributors, Inc. | | O-TRB-AR-1 |

| | |
| | |
| Annual Report to Shareholders | | October 31, 2022 |
Invesco Developing Markets Fund
Nasdaq:
A: ODMAX ∎ C: ODVCX ∎ R: ODVNX ∎ Y: ODVYX ∎ R5: DVMFX ∎ R6: ODVIX
Management’s Discussion of Fund Performance
| | | | |
| |
Performance summary | |
For the fiscal year ended October 31, 2022, Class A shares of Invesco Developing Markets Fund (the Fund), at net asset value (NAV), underperformed the MSCI Emerging Markets Index. | |
Your Fund’s long-term performance appears later in this report. | |
| |
Fund vs. Indexes | |
Total returns, 10/31/21 to 10/31/22, at net asset value (NAV). Performance shown does not include applicable contingent deferred sales charges (CDSC) or front-end sales charges, which would have reduced performance. | |
Class A Shares | | | -38.24 | % |
Class C Shares | | | -38.70 | |
Class R Shares | | | -38.39 | |
Class Y Shares | | | -38.08 | |
Class R5 Shares | | | -37.94 | |
Class R6 Shares | | | -37.98 | |
MSCI Emerging Markets Index▼ | | | -31.03 | |
| |
Source(s): ▼RIMES Technologies Corp. | | | | |
Market conditions and your Fund
At the beginning of the fiscal year ended October 31, 2022, developed global equity markets were mostly positive, despite rising inflation and the emergence of Omicron, a new COVID-19 variant. Pandemic-related supply chain disruptions and labor shortages intensified at the end of 2021, resulting in broadly higher costs for companies and consumers. Emerging market equities declined due in part to COVID-19 concerns and China’s ongoing regulatory tightening in the private education and technology sectors and slowing economic growth.
Global equity markets declined in the first half of 2022 amid volatility sparked by Russia’s invasion of Ukraine, rising commodity prices, rampant global inflation and central banks shifting toward tighter monetary policy. Russia’s invasion exacerbated inflationary pressures, disrupting already strained supply chains, and increasing shortages of oil, gas and raw materials, with the price of oil rising sharply.
Inflation headwinds continued into the third quarter of 2022. The US Federal Reserve (the Fed), the European Central Bank and the Bank of England all raised interest rates. In contrast, the People’s Bank of China lowered its policy rate and the Bank of Japan kept rates the same. Emerging market equities, hampered by the strong US dollar, underperformed developed market equities.
During October 2022, developed market equities rebounded and were in positive territory. Developed market equities outperformed emerging market equities, which declined primarily driven by weakness in China as Chinese markets reacted to the reappointment of President Xi and his authority, with no signs of the country’s zero-COVID-19 policy being relaxed. Despite the rebound in October for developed market equities, at the end of the fiscal year, trailing one-year returns for developed market equities and
emerging market equities were both in negative territory.
Global markets have been enshrouded by geopolitical shock waves stemming from Russia’s invasion of Ukraine, rising inflation levels, recessionary fears, etc. Much of this has dampened sentiment toward emerging market equities. However, after two years of interconnected, unlikely and extreme events, we are encouraged by three important factors in emerging markets: valuations are cheap relative to US equities, central banks in most emerging market countries stayed ahead of inflationary pressures by raising interest rates and China seems poised for recovery from its debilitating zero-COVID-19 policy, which we believe would provide investment opportunities.
From a sector perspective, the largest contributors to the Fund’s relative performance during the fiscal year were an overweight and stock selection in consumer staples, stock selection in consumer discretionary and an underweight and stock selection in real estate. The largest detractors from relative performance were an underweight and stock selection in energy, stock selection in communication services and an overweight and stock selection in health care.
From a country perspective, the largest contributors to the Fund’s relative performance during the fiscal year were an underweight in China, an overweight in Mexico and an underweight allocation to and stock selection in South Korea. The largest detractors from the Fund’s relative performance were an overweight and stock selection in Russia, an overweight in Singapore (the Fund’s benchmark has no exposure) and an underweight position in Saudi Arabia.
The largest contributors to the Fund’s absolute performance during the fiscal year included Wal-Mart de Mexico, Vale and Lojas Renner.
Wal-Mart de Mexico (Walmex) offers an omnichannel shopping experience in Mexico’s
underpenetrated retail market. Walmex remains focused on providing a wide assortment of goods at attractive values and is currently working on expanding their Bodega banner catering to the most price-sensitive population. We believe Walmex should continue to grow market share in Mexico as expansion continues, fulfillment capabilities improve and the digital ecosystem evolves.
Vale is a Brazilian multinational company that is one of the largest global iron ore and nickel producers with expertise in mining, logistics, energy and steelmaking. In our view, there should be structural support for these base metals as Russia’s iron ore supply is interrupted from the ongoing war in Ukraine and nickel is being increasingly used in batteries to fuel modern life, and to align with the global decarbonization efforts underway.
Lojas Renner operates a fashion and lifestyle ecosystem in the fragmented Brazilian retail space. Lojas Renner designs and distributes a broad range of fashion apparel under a host of private brands that consumers have access to through digital channels and traditional stores. As the company continues to focus on digitizing the consumer experience, providing reliable delivery of goods, rewarding consumer loyalty and so on, we believe Lojas Renner should be poised to capture a larger slice of Brazilian retail sales.
The largest detractors from the Fund’s absolute performance during the fiscal year included Taiwan Semiconductor Manufacturing (TSMC), Novatek and Yandex.
TSMC is one of the world’s leading semiconductor foundries and the key enabler of the new computing revolution in the semiconductor industry, with multiple architectures, chip platforms and design teams competing to push computing and artificial intelligence innovation. Despite softening demand in the smartphone and consumer electronics segments, it is our view that TSMC has strong customer order commitment in the high performance computing applications over the next few years and has seen healthy demand in the data center and automotive segments.
Novatek, which we have held for nearly 15 years, is one of the largest independent global gas producers, and we believe it has considerable growth options in its portfolio of low cost, competitively advantaged liquefied natural gas (LNG) projects on the Yamal Peninsula. We also believe that demand for Novatek’s LNG projects is fundamentally supported by the global push to develop sources of cleaner energy. Due to ongoing market closures, lack of trading partners, low liquidity, settlement concerns and future uncertainty, Invesco priced all Russian equity holdings of the Fund to zero as of March 2, 2022.
Yandex is one of the dominant internet companies in Russia’s transforming digital landscape, holding positions in several categories including Russia’s search engine, shared mobility, food delivery, e-commerce and others. Note that Yandex runs one of the
| | |
| 2 | | Invesco Developing Markets Fund |
most profitable mobility and food delivery platforms in the world and we believe it may benefit from future industry consolidation in e-commerce. However, Yandex has been affected by the impact of sanctions on Russia following the invasion of Ukraine. For the reasons described above, this Russian equity holding of the Fund was also priced at zero as of March 2, 2022.
When we look longer term, we believe many emerging market companies are embarking on a new era - cutting back on oversized ambitions and focusing on opportunities that are profitable and cash generative. Our view is that this should lead to improved earnings and returns in these businesses as they become more rational and disciplined. We have been focused on finding investments in opportunities where the visible risks are well understood, have been deeply digested and have led to discounts in prices. We are looking out for circumstances where the risks have not yet been widely perceived. The net result is an opportunity to own undervalued, high-quality names with the potential for long-term structural growth.
We thank you for your continued investment in Invesco Developing Markets Fund.
Portfolio manager(s):
Justin Leverenz
The views and opinions expressed in management’s discussion of Fund performance are those of Invesco Advisers, Inc. and its affiliates. These views and opinions are subject to change at any time based on factors such as market and economic conditions. These views and opinions may not be relied upon as investment advice or recommendations, or as an offer for a particular security. The information is not a complete analysis of every aspect of any market, country, industry, security or the Fund. Statements of fact are from sources considered reliable, but Invesco Advisers, Inc. makes no representation or warranty as to their completeness or accuracy. Although historical performance is no guarantee of future results, these insights may help you understand our investment management philosophy.
See important Fund and, if applicable, index disclosures later in this report.
| | |
| 3 | | Invesco Developing Markets Fund |
Your Fund’s Long-Term Performance
Results of a $10,000 Investment – Oldest Share Class(es)
Fund and index data from 10/31/12
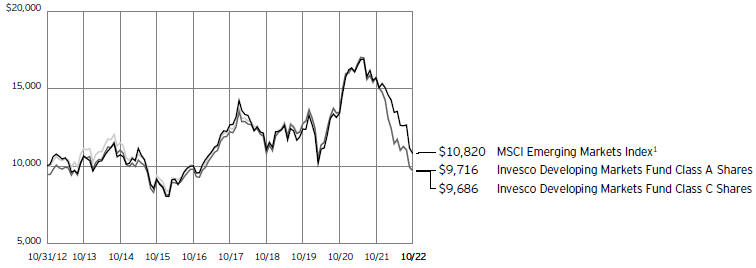
1 Source: RIMES Technologies Corp.
Past performance cannot guarantee future results.
The data shown in the chart include reinvested distributions, applicable sales charges and Fund expenses including management
fees. Index results include reinvested dividends, but they do not reflect sales charges. Performance of the peer group, if applicable, reflects fund expenses and management fees;
performance of a market index does not. Performance shown in the chart does not reflect deduction of taxes a shareholder would pay on Fund distributions or sale of Fund shares.
| | |
| 4 | | Invesco Developing Markets Fund |
| | | | |
| |
Average Annual Total Returns | |
As of 10/31/22, including maximum applicable sales charges | |
| |
Class A Shares | | | | |
Inception (11/18/96) | | | 8.67 | % |
10 Years | | | -0.29 | |
5 Years | | | -5.55 | |
1 Year | | | -41.64 | |
| |
Class C Shares | | | | |
Inception (11/18/96) | | | 8.65 | % |
10 Years | | | -0.32 | |
5 Years | | | -5.19 | |
1 Year | | | -39.28 | |
| |
Class R Shares | | | | |
Inception (3/1/01) | | | 7.69 | % |
10 Years | | | 0.02 | |
5 Years | | | -4.71 | |
1 Year | | | -38.39 | |
| |
Class Y Shares | | | | |
Inception (9/7/05) | | | 5.36 | % |
10 Years | | | 0.54 | |
5 Years | | | -4.23 | |
1 Year | | | -38.08 | |
| |
Class R5 Shares | | | | |
10 Years | | | 0.40 | % |
5 Years | | | -4.24 | |
1 Year | | | -37.94 | |
| |
Class R6 Shares | | | | |
Inception (12/29/11) | | | 2.15 | % |
10 Years | | | 0.70 | |
5 Years | | | -4.09 | |
1 Year | | | -37.98 | |
Effective May 24, 2019, Class A, Class C, Class R, Class Y and Class I shares of the Oppenheimer Developing Markets Fund, (the predecessor fund), were reorganized into Class A, Class C, Class R, Class Y and Class R6 shares, respectively, of the Invesco Oppenheimer Developing Markets Fund. The Fund was subsequently renamed the Invesco Developing Markets Fund (the Fund). Returns shown above, for periods ending on or prior to May 24, 2019, for Class A, Class C, Class R, Class Y and Class R6 shares are those for Class A, Class C, Class R, Class Y and Class I shares of the predecessor fund. Share class returns will differ from the predecessor fund because of different expenses.
Class R5 shares incepted on May 24, 2019. Performance shown on and prior to that date is that of the predecessor fund’s Class A shares at net asset value and includes the 12b-1 fees applicable to Class A shares.
The performance data quoted represent past performance and cannot guarantee future results; current performance may be lower or higher. Please visit invesco.com/performance for the most recent month-end performance. Performance figures reflect reinvested distributions, changes in net asset value and the effect of the maximum sales charge unless otherwise stated.
Performance figures do not reflect deduction of taxes a shareholder would pay on Fund distributions or sale of Fund shares. Investment return and principal value will fluctuate so that you may have a gain or loss when you sell shares.
Class A share performance reflects the maximum 5.50% sales charge, and Class C share performance reflects the applicable contingent deferred sales charge (CDSC) for the period involved. The CDSC on Class C shares is 1% for the first year after purchase. Class R, Class Y, Class R5 and Class R6 shares do not have a front-end sales charge or a CDSC; therefore, performance is at net asset value.
The performance of the Fund’s share classes will differ primarily due to different sales charge structures and class expenses.
Fund performance reflects any applicable fee waivers and/or expense reimbursements. Had the adviser not waived fees and/or reimbursed expenses currently or in the past, returns would have been lower. See current prospectus for more information.
| | |
| 5 | | Invesco Developing Markets Fund |
Supplemental Information
Invesco Developing Markets Fund’s investment objective is to seek capital appreciation.
| ∎ | Unless otherwise stated, information presented in this report is as of October 31, 2022, and is based on total net assets. |
| ∎ | Unless otherwise noted, all data is provided by Invesco. |
| ∎ | To access your Fund’s reports/prospectus, visit invesco.com/fundreports. |
About indexes used in this report
| ∎ | The MSCI Emerging Markets Index is an unmanaged index considered representative of stocks of developing countries. The index is computed using the net return, which withholds applicable taxes for nonresident investors. |
| ∎ | The Fund is not managed to track the performance of any particular index, including the index(es) described here, and consequently, the performance of the Fund may deviate significantly from the performance of the index(es). |
| ∎ | A direct investment cannot be made in an index. Unless otherwise indicated, index results include reinvested dividends, and they do not reflect sales charges. Performance of the peer group, if applicable, reflects fund expenses; performance of a market index does not. |
|
|
This report must be accompanied or preceded by a currently effective Fund prospectus, which contains more complete information, including sales charges and expenses. Investors should read it carefully before investing. |
|
| NOT FDIC INSURED | MAY LOSE VALUE | NO BANK GUARANTEE |
| | |
| 6 | | Invesco Developing Markets Fund |
Fund Information
Portfolio Composition
| | | | | |
| By sector | | | | % of total net assets | |
| |
Financials | | | | 22.62% | |
| |
Information Technology | | | | 21.18 | |
| |
Consumer Discretionary | | | | 16.62 | |
| |
Materials | | | | 9.53 | |
| |
Consumer Staples | | | | 9.20 | |
| |
Health Care | | | | 6.09 | |
| |
Communication Services | | | | 5.19 | |
| |
Industrials | | | | 4.97 | |
| |
Other Sectors, Each Less than 2% of Net Assets | | | | 1.36 | |
| |
Money Market Funds Plus Other Assets Less Liabilities | | | | 3.24 | |
Top 10 Equity Holdings*
| | | | | | | |
| | | | | | % of total net assets | |
| | |
1. | | Housing Development Finance Corp. Ltd. | | | | 8.92% | |
| | |
2. | | Taiwan Semiconductor Manufacturing Co. Ltd. | | | | 6.48 | |
| | |
3. | | Kotak Mahindra Bank Ltd. | | | | 6.37 | |
| | |
4. | | Yum China Holdings, Inc. | | | | 5.46 | |
| | |
5. | | Tata Consultancy Services Ltd. | | | | 5.24 | |
| | |
6. | | Grupo Mexico S.A.B. de C.V., Class B | | | | 4.51 | |
| | |
7. | | Pernod Ricard S.A. | | | | 4.11 | |
| | |
8. | | Samsung Electronics Co. Ltd. | | | | 3.49 | |
| | |
9. | | H World Group Ltd., ADR | | | | 3.12 | |
| | |
10. | | ZTO Express (Cayman), Inc., ADR | | | | 2.72 | |
The Fund’s holdings are subject to change, and there is no assurance that the Fund will continue to hold any particular security.
| * | Excluding money market fund holdings, if any. |
Data presented here are as of October 31, 2022.
| | |
| 7 | | Invesco Developing Markets Fund |
Consolidated Schedule of Investments
October 31, 2022
| | | | | | | | |
| | | Shares | | | Value | |
|
| |
Common Stocks & Other Equity Interests–95.60% | |
Belgium–0.40% | | | | | | | | |
Anheuser-Busch InBev S.A./N.V. | | | 1,832,252 | | | $ | 91,774,653 | |
|
| |
|
Brazil–7.98% | |
Ambev S.A. | | | 139,047,690 | | | | 430,696,552 | |
|
| |
Banco Bradesco S.A., Preference Shares | | | 109,331,729 | | | | 420,351,977 | |
|
| |
Lojas Renner S.A. | | | 41,138,483 | | | | 246,090,238 | |
|
| |
NU Holdings Ltd., Class A(a) | | | 40,742,954 | | | | 203,714,770 | |
|
| |
Vale S.A., ADR | | | 34,476,996 | | | | 446,132,328 | |
|
| |
WEG S.A. | | | 10,019,978 | | | | 78,134,685 | |
|
| |
| | | | | | | 1,825,120,550 | |
|
| |
|
Chile–0.47% | |
Antofagasta PLC | | | 6,208,369 | | | | 83,558,550 | |
|
| |
Banco Santander Chile | | | 649,718,381 | | | | 23,399,096 | |
|
| |
| | | | | | | 106,957,646 | |
|
| |
|
China–20.11% | |
BeiGene Ltd., ADR (Acquired 01/04/2021-08/04/2021;
Cost $724,027,817)(a)(b) | | | 2,235,297 | | | | 377,519,310 | |
|
| |
Brii Biosciences Ltd.(a) | | | 40,372,238 | | | | 28,764,141 | |
|
| |
H World Group Ltd. | | | 1,984,000 | | | | 5,423,890 | |
|
| |
H World Group Ltd., ADR(c)(d) | | | 26,367,347 | | | | 714,027,757 | |
|
| |
Meituan, B Shares(a)(e) | | | 24,176,100 | | | | 384,575,800 | |
|
| |
MicroTech Medical Hangzhou Co. Ltd., H Shares(a)(e) | | | 7,517,400 | | | | 5,833,093 | |
|
| |
NetEase, Inc., ADR | | | 9,063,153 | | | | 504,092,570 | |
|
| |
New Horizon Health Ltd.(a)(e) | | | 12,827,500 | | | | 28,539,988 | |
|
| |
Silergy Corp. | | | 8,562,000 | | | | 98,473,256 | |
|
| |
Sunny Optical Technology Group Co. Ltd. | | | 5,855,000 | | | | 50,791,781 | |
|
| |
Tencent Holdings Ltd. | | | 4,206,158 | | | | 110,368,590 | |
|
| |
Wuxi Biologics Cayman,
Inc.(a)(e) | | | 48,709,000 | | | | 220,359,767 | |
|
| |
Yum China Holdings, Inc.(c) | | | 30,183,310 | | | | 1,248,079,869 | |
|
| |
Zai Lab Ltd., ADR (Acquired 04/22/2021-01/21/2022;
Cost $847,529,843)(a)(b)(c) | | | 7,244,731 | | | | 161,412,607 | |
|
| |
ZTO Express (Cayman), Inc. | | | 2,473,482 | | | | 41,929,651 | |
|
| |
ZTO Express (Cayman), Inc., ADR(c) | | | 36,797,774 | | | | 621,514,403 | |
|
| |
| | | | | | | 4,601,706,473 | |
|
| |
| | |
France–5.36% | | | | | | | | |
Kering S.A. | | | 273,383 | | | | 125,137,202 | |
|
| |
L’Oreal S.A. | | | 49,577 | | | | 15,565,390 | |
|
| |
Pernod Ricard S.A. | | | 5,357,784 | | | | 940,009,407 | |
|
| |
TotalEnergies SE | | | 2,647,242 | | | | 144,672,507 | |
|
| |
| | | | | | | 1,225,384,506 | |
|
| |
|
Hong Kong–1.62% | |
AIA Group Ltd. | | | 48,992,200 | | | | 369,974,316 | |
|
| |
| | |
India–24.81% | | | | | | | | |
Delhivery Ltd.(e) | | | 4,814,900 | | | | 20,021,003 | |
|
| |
Housing Development Finance Corp. Ltd. | | | 68,477,338 | | | | 2,041,513,479 | |
|
| |
Infosys Ltd. | | | 30,849,933 | | | | 572,294,637 | |
|
| |
Kotak Mahindra Bank Ltd. | | | 63,390,950 | | | | 1,458,033,997 | |
|
| |
| | | | | | | | |
| | | Shares | | | Value | |
|
| |
India–(continued) | |
Oberoi Realty Ltd.(c) | | | 14,966,740 | | | $ | 167,067,876 | |
|
| |
Pine Labs Pvt. Ltd. (Acquired 09/09/2021;
Cost $49,999,780)(b)(f) | | | 134,098 | | | | 62,853,388 | |
|
| |
Tata Consultancy Services Ltd. | | | 31,072,921 | | | | 1,197,648,432 | |
|
| |
Zee Entertainment Enterprises Ltd.(c) | | | 49,112,015 | | | | 155,536,647 | |
|
| |
| | | | | | | 5,674,969,459 | |
|
| |
|
Indonesia–0.87% | |
PT Bank Central Asia Tbk | | | 353,549,900 | | | | 199,221,034 | |
|
| |
|
Italy–1.73% | |
Ermenegildo Zegna N.V. | | | 5,142,215 | | | | 56,358,677 | |
|
| |
PRADA S.p.A. | | | 74,536,610 | | | | 338,762,262 | |
|
| |
| | | | | | | 395,120,939 | |
|
| |
|
Japan–0.11% | |
Daiichi Sankyo Co. Ltd. | | | 790,400 | | | | 25,344,584 | |
|
| |
|
Mexico–8.50% | |
America Movil S.A.B. de C.V., Class L, ADR | | | 17,183,161 | | | | 323,215,258 | |
|
| |
Fomento Economico Mexicano S.A.B. de C.V., Series CPO | | | 1,881,075 | | | | 13,503,523 | |
|
| |
Grupo Mexico S.A.B. de C.V., Class B | | | 284,733,475 | | | | 1,032,272,019 | |
|
| |
Wal-Mart de Mexico S.A.B. de C.V., Series V | | | 149,212,434 | | | | 576,350,254 | |
|
| |
| | | | | | | 1,945,341,054 | |
|
| |
|
Peru–0.93% | |
Credicorp Ltd. | | | 1,462,117 | | | | 213,995,444 | |
|
| |
|
Philippines–1.64% | |
SM Investments Corp. | | | 26,325,832 | | | | 374,537,053 | |
|
| |
|
Russia–0.00% | |
Novatek PJSC, GDR(a)(e)(f) | | | 8,262,941 | | | | 8 | |
|
| |
Polyus PJSC, GDR(a)(e)(f) | | | 1,319,684 | | | | 1 | |
|
| |
Sberbank of Russia PJSC(a)(f) | | | 4,942,538 | | | | 5 | |
|
| |
TCS Group Holding PLC,
GDR(e)(f) | | | 2,747,795 | | | | 3 | |
|
| |
Yandex N.V., Class A(a)(c)(f) | | | 22,810,295 | | | | 23 | |
|
| |
| | | | | | | 40 | |
|
| |
|
South Africa–1.08% | |
FirstRand Ltd. | | | 70,724,711 | | | | 247,961,574 | |
|
| |
|
South Korea–8.84% | |
Coupang, Inc.(a) | | | 1,322,159 | | | | 22,833,686 | |
|
| |
LG Chem Ltd. | | | 1,408,666 | | | | 617,264,441 | |
|
| |
LG H&H Co. Ltd. | | | 101,100 | | | | 36,103,595 | |
|
| |
NAVER Corp. | | | 813,013 | | | | 96,380,019 | |
|
| |
Samsung Biologics Co. Ltd.(a)(e) | | | 737,047 | | | | 452,927,843 | |
|
| |
Samsung Electronics Co. Ltd. | | | 19,176,496 | | | | 797,425,876 | |
|
| |
| | | | | | | 2,022,935,460 | |
|
| |
|
Switzerland–2.28% | |
Cie Financiere Richemont S.A. | | | 5,260,240 | | | | 514,493,339 | |
|
| |
Cie Financiere Richemont S.A., Wts., expiring 11/22/2023(a) | | | 15,598,668 | | | | 7,633,043 | |
|
| |
| | | | | | | 522,126,382 | |
|
| |
See accompanying Notes to Consolidated Financial Statements which are an integral part of the financial statements.
| | |
| 8 | | Invesco Developing Markets Fund |
| | | | | | | | |
| | | Shares | | | Value | |
|
| |
Taiwan–8.76% | |
MediaTek, Inc. | | | 28,620,000 | | | $ | 521,436,753 | |
|
| |
Taiwan Semiconductor Manufacturing Co. Ltd. | | | 123,165,429 | | | | 1,482,185,176 | |
|
| |
| | | | | | | 2,003,621,929 | |
|
| |
|
United Kingdom–0.11% | |
AstraZeneca PLC, ADR | | | 416,351 | | | | 24,485,602 | |
|
| |
Total Common Stocks & Other Equity Interests
(Cost $21,177,712,945) | | | | 21,870,578,698 | |
|
| |
|
Preferred Stocks–1.16% | |
China–0.29% | | | | | | | | |
Abogen Therapeutics Ltd., Series C, Pfd. (Acquired 08/02/2021;
Cost $65,429,977)(b)(f) | | | 1,436,122 | | | | 65,429,977 | |
|
| |
|
India–0.87% | |
Bundl Technologies Pvt. Ltd., Series K, Pfd. (Acquired 01/00/1900; Cost $0)(b)(f) | | | 28,844 | | | | 137,270,644 | |
|
| |
Pine Labs Pvt. Ltd., Series K, Pfd. (Acquired 09/09/2021; Cost $50,000,355)(b)(f) | | | 103,185 | | | | 62,854,111 | |
|
| |
| | | | | | | 200,124,755 | |
|
| |
Total Preferred Stocks
(Cost $305,907,589) | | | | 265,554,732 | |
|
| |
| | | | | | | | |
| | | Shares | | | Value | |
|
| |
Money Market Funds–2.67% | |
Invesco Government & Agency Portfolio, Institutional Class, 3.07%(c)(g) | | | 210,074,808 | | | $ | 210,074,808 | |
|
| |
Invesco Liquid Assets Portfolio, Institutional Class, 3.03%(c)(g) | | | 160,840,446 | | | | 160,872,614 | |
|
| |
Invesco Treasury Portfolio, Institutional Class, 3.08%(c)(g) | | | 240,085,494 | | | | 240,085,494 | |
|
| |
Total Money Market Funds
(Cost $610,984,975) | | | | | | | 611,032,916 | |
|
| |
TOTAL INVESTMENTS IN
SECURITIES–99.43%
(Cost $22,094,605,509) | | | | 22,747,166,346 | |
|
| |
OTHER ASSETS LESS LIABILITIES–0.57% | | | | 129,291,678 | |
|
| |
NET ASSETS–100.00% | | | $ | 22,876,458,024 | |
|
| |
| | |
| Investment Abbreviations: |
| |
| ADR | | – American Depositary Receipt |
| CPO | | – Certificates of Ordinary Participation |
| GDR | | – Global Depositary Receipt |
| Pfd. | | – Preferred |
| Wts. | | – Warrants |
Notes to Consolidated Schedule of Investments:
| (a) | Non-income producing security. |
| (b) | Restricted security. The aggregate value of these securities at October 31, 2022 was $867,340,037, which represented 3.79% of the Fund’s Net Assets. |
| (c) | Affiliated issuer. The issuer is affiliated by having an investment adviser that is under common control of Invesco Ltd. and/or is an “affiliated person” under the Investment Company Act of 1940, as amended (the “1940 Act”), which defines “affiliated person” to include an issuer of which a fund holds 5% or more of the outstanding voting securities. For the Investments in Other Affiliates below, the Fund has not owned enough of the outstanding voting securities of the issuer to have control (as defined in the 1940 Act) of that issuer. The table below shows the Fund’s transactions in, and earnings from, its investments in affiliates for the fiscal year ended October 31, 2022. |
| | | | | | | | | | | | | | | | | | | | | | | | | | | | |
| | | Value October 31, 2021 | | | Purchases at Cost | | | Proceeds from Sales | | | Change in
Unrealized
Appreciation
(Depreciation) | | | Realized Gain (Loss) | | | Value October 31, 2022 | | | Dividend Income | |
| Investments in Affiliated Money Market Funds: | | | | | | | | | | | | | | | | | | | | | | | | | | | | |
Invesco Government & Agency Portfolio, Institutional Class | | $ | 188,299,280 | | | $ | 2,596,437,443 | | | $ | (2,574,661,915 | ) | | $ | - | | | $ | - | | | $ | 210,074,808 | | | $ | 2,596,906 | |
Invesco Liquid Assets Portfolio, Institutional Class | | | 145,359,504 | | | | 1,854,598,173 | | | | (1,839,044,224 | ) | | | 48,514 | | | | (89,353 | ) | | | 160,872,614 | | | | 1,974,376 | |
Invesco Treasury Portfolio, Institutional Class | | | 215,199,177 | | | | 2,967,357,078 | | | | (2,942,470,761 | ) | | | - | | | | - | | | | 240,085,494 | | | | 2,783,483 | |
See accompanying Notes to Consolidated Financial Statements which are an integral part of the financial statements.
| | |
| 9 | | Invesco Developing Markets Fund |
| | | | | | | | | | | | | | | | | | | | | | | | | | | | |
| | | Value October 31, 2021 | | | Purchases at Cost | | | Proceeds from Sales | | | Change in
Unrealized
Appreciation
(Depreciation) | | | Realized Gain (Loss) | | | Value October 31, 2022 | | | Dividend Income | |
| Investments in Other Affiliates: | | | | | | | | | | | | | | | | | | | | | | | | | | | | |
Alsea S.A.B. de C.V.* | | $ | 134,539,605 | | | $ | - | | | $ | (122,524,060 | ) | | $ | 24,982,311 | | | $ | (36,997,856 | ) | | $ | - | | | $ | - | |
Grab Holdings, Inc., Class H, Pfd* | | | 1,545,865,618 | | | | - | | | | (645,131,084 | ) | | | (900,734,534 | ) | | | - | | | | - | | | | - | |
H World Group Ltd., ADR | | | 1,284,440,610 | | | | 7,597,532 | | | | (65,106,251 | ) | | | (522,891,762 | ) | | | 9,987,628 | | | | 714,027,757 | | | | 5,264,101 | |
Lojas Americanas S.A., Preference Shares* | | | 130,156,093 | | | | - | | | | (248,742,693 | ) | | | 118,586,600 | | | | - | | | | - | | | | - | |
Oberoi Realty Ltd.* | | | 257,865,739 | | | | - | | | | (79,018,999 | ) | | | (45,630,325 | ) | | | 33,851,461 | | | | 167,067,876 | | | | 521,009 | |
Pagseguro Digital Ltd., Class A* | | | 463,106,781 | | | | - | | | | (146,268,570 | ) | | | 1,362,034 | | | | (318,200,245 | ) | | | - | | | | - | |
Yandex N.V., Class A | | | 1,868,397,880 | | | | 43,525,035 | | | | (42,437,347 | ) | | | (1,863,937,678 | ) | | | (5,547,867 | ) | | | 23 | | | | - | |
Yum China Holdings, Inc. | | | 1,671,168,604 | | | | 44,114,387 | | | | - | | | | (467,203,122 | ) | | | - | | | | 1,248,079,869 | | | | 14,379,310 | |
Zai Lab Ltd., ADR | | | 550,795,399 | | | | 142,890,266 | | | | - | | | | (532,273,058 | ) | | | - | | | | 161,412,607 | | | | - | |
Zee Entertainment Enterprises Ltd. | | | 691,264,774 | | | | - | | | | (420,757,383 | ) | | | (63,806,124 | ) | | | (51,164,620 | ) | | | 155,536,647 | | | | 2,864,114 | |
ZTO Express (Cayman), Inc., ADR | | | 745,433,095 | | | | 292,462,158 | | | | (30,639,721 | ) | | | (395,980,569 | ) | | | 10,239,440 | | | | 621,514,403 | | | | 6,224,754 | |
Total | | $ | 9,891,892,159 | | | $ | 7,948,982,072 | | | $ | (9,156,803,008 | ) | | $ | (4,647,477,713 | ) | | $ | (357,921,412 | ) | | $ | 3,678,672,098 | | | $ | 36,608,053 | |
| | * | At October 31, 2022, this security was no longer an affiliate of the Fund. |
| (d) | Effective June 27, 2022, the security’s name changed. |
| (e) | Security purchased or received in a transaction exempt from registration under the Securities Act of 1933, as amended (the “1933 Act”). The security may be resold pursuant to an exemption from registration under the 1933 Act, typically to qualified institutional buyers. The aggregate value of these securities at October 31, 2022 was $1,112,257,506, which represented 4.86% of the Fund’s Net Assets. |
| (f) | Security valued using significant unobservable inputs (Level 3). See Note 3. |
| (g) | The rate shown is the 7-day SEC standardized yield as of October 31, 2022. |
See accompanying Notes to Consolidated Financial Statements which are an integral part of the financial statements.
| | |
| 10 | | Invesco Developing Markets Fund |
Consolidated Statement of Assets and Liabilities
October 31, 2022
| | | | |
Assets: | | | | |
| |
Investments in unaffiliated securities, at value
(Cost $17,112,545,228) | | $ | 19,235,562,124 | |
|
| |
Investments in affiliates, at value
(Cost $4,982,060,281) | | | 3,511,604,222 | |
|
| |
Cash | | | 72,541,564 | |
|
| |
Foreign currencies, at value
(Cost $126,588,872) | | | 120,839,911 | |
|
| |
Receivable for: | | | | |
Investments sold | | | 268,959,990 | |
|
| |
Fund shares sold | | | 35,964,286 | |
|
| |
Dividends | | | 34,890,148 | |
|
| |
Investment for trustee deferred compensation and retirement plans | | | 1,185,550 | |
|
| |
Other assets | | | 176,392 | |
|
| |
Total assets | | | 23,281,724,187 | |
|
| |
| |
Liabilities: | | | | |
| |
Payable for: | | | | |
Investments purchased | | | 134,648,776 | |
|
| |
Fund shares reacquired | | | 57,356,865 | |
|
| |
Accrued foreign taxes | | | 193,211,924 | |
|
| |
Accrued fees to affiliates | | | 10,917,302 | |
|
| |
Accrued trustees’ and officers’ fees and benefits | | | 297,473 | |
|
| |
Accrued other operating expenses | | | 7,648,273 | |
|
| |
Trustee deferred compensation and retirement plans | | | 1,185,550 | |
|
| |
Total liabilities | | | 405,266,163 | |
|
| |
Net assets applicable to shares outstanding | | $ | 22,876,458,024 | |
|
| |
| |
Net assets consist of: | | | | |
| |
Shares of beneficial interest | | $ | 23,634,711,656 | |
|
| |
Distributable earnings (loss) | | | (758,253,632 | ) |
|
| |
| | $ | 22,876,458,024 | |
|
| |
| | | | |
Net Assets: | | | | |
| |
Class A | | $ | 2,394,926,155 | |
|
| |
Class C | | $ | 30,354,855 | |
|
| |
Class R | | $ | 209,735,692 | |
|
| |
Class Y | | $ | 10,871,572,857 | |
|
| |
Class R5 | | $ | 129,507 | |
|
| |
Class R6 | | $ | 9,369,738,958 | |
|
| |
|
Shares outstanding, no par value, with an unlimited number of shares authorized: | |
| |
Class A | | | 76,141,794 | |
|
| |
Class C | | | 1,070,527 | |
|
| |
Class R | | | 7,006,312 | |
|
| |
Class Y | | | 350,840,686 | |
|
| |
Class R5 | | | 4,110 | |
|
| |
Class R6 | | | 302,101,026 | |
|
| |
Class A: | | | | |
Net asset value per share | | $ | 31.45 | |
|
| |
Maximum offering price per share | | | | |
(Net asset value of $31.45 ÷ 94.50%) | | $ | 33.28 | |
|
| |
Class C: | | | | |
Net asset value and offering price per share | | $ | 28.36 | |
|
| |
Class R: | | | | |
Net asset value and offering price per share | | $ | 29.94 | |
|
| |
Class Y: | | | | |
Net asset value and offering price per share | | $ | 30.99 | |
|
| |
Class R5: | | | | |
Net asset value and offering price per share | | $ | 31.51 | |
|
| |
Class R6: | | | | |
Net asset value and offering price per share | | $ | 31.02 | |
|
| |
See accompanying Notes to Consolidated Financial Statements which are an integral part of the financial statements.
| | |
| 11 | | Invesco Developing Markets Fund |
Consolidated Statement of Operations
For the year ended October 31, 2022
| | | | |
Investment income: | | | | |
| |
Dividends (net of foreign withholding taxes of $67,395,021) | | $ | 484,607,104 | |
|
| |
Dividends from affiliates (net of foreign withholding taxes of $800,310) | | | 36,608,053 | |
|
| |
Total investment income | | | 521,215,157 | |
|
| |
| |
Expenses: | | | | |
| |
Advisory fees | | | 269,687,998 | |
|
| |
Administrative services fees | | | 5,042,400 | |
|
| |
Custodian fees | | | 10,372,068 | |
|
| |
Distribution fees: | | | | |
Class A | | | 8,196,240 | |
|
| |
Class C | | | 479,325 | |
|
| |
Class R | | | 1,430,973 | |
|
| |
Transfer agent fees – A, C, R and Y | | | 35,995,183 | |
|
| |
Transfer agent fees – R5 | | | 2,622 | |
|
| |
Transfer agent fees – R6 | | | 5,021,382 | |
|
| |
Trustees’ and officers’ fees and benefits | | | 400,728 | |
|
| |
Registration and filing fees | | | 530,766 | |
|
| |
Professional services fees | | | 2,574,319 | |
|
| |
Other | | | 90,688 | |
|
| |
Total expenses | | | 339,824,692 | |
|
| |
Less: Fees waived and/or expense offset arrangement(s) | | | (686,723 | ) |
|
| |
Net expenses | | | 339,137,969 | |
|
| |
Net investment income | | | 182,077,188 | |
|
| |
| |
Realized and unrealized gain (loss) from: | | | | |
| |
Net realized gain (loss) from: | | | | |
Unaffiliated investment securities (net of foreign taxes of $24,755,971) | | | (922,312,080 | ) |
|
| |
Affiliated investment securities | | | (357,921,412 | ) |
|
| |
Foreign currencies | | | (17,510,786 | ) |
|
| |
Forward foreign currency contracts | | | 337,044 | |
|
| |
| | | (1,297,407,234 | ) |
|
| |
Change in net unrealized appreciation (depreciation) of: | | | | |
Unaffiliated investment securities (net of foreign taxes of $163,493,564) | | | (11,537,103,949 | ) |
|
| |
Affiliated investment securities | | | (4,647,477,713 | ) |
|
| |
Foreign currencies | | | (8,797,933 | ) |
|
| |
| | | (16,193,379,595 | ) |
|
| |
Net realized and unrealized gain (loss) | | | (17,490,786,829 | ) |
|
| |
Net increase (decrease) in net assets resulting from operations | | $ | (17,308,709,641 | ) |
|
| |
See accompanying Notes to Consolidated Financial Statements which are an integral part of the financial statements.
| | |
| 12 | | Invesco Developing Markets Fund |
Consolidated Statement of Changes in Net Assets
For the years ended October 31, 2022 and 2021
| | | | | | | | |
| | | 2022 | | | 2021 | |
|
| |
Operations: | | | | | | | | |
| | |
Net investment income | | $ | 182,077,188 | | | $ | 236,913,705 | |
|
| |
Net realized gain (loss) | | | (1,297,407,234 | ) | | | 2,776,140,754 | |
|
| |
Change in net unrealized appreciation (depreciation) | | | (16,193,379,595 | ) | | | 3,726,132,780 | |
|
| |
Net increase (decrease) in net assets resulting from operations | | | (17,308,709,641 | ) | | | 6,739,187,239 | |
|
| |
| | |
Distributions to shareholders from distributable earnings: | | | | | | | | |
| | |
Class A | | | (196,709,112 | ) | | | – | |
|
| |
Class C | | | (3,347,754 | ) | | | – | |
|
| |
Class R | | | (17,064,426 | ) | | | – | |
|
| |
Class Y | | | (1,100,030,266 | ) | | | (48,200,764 | ) |
|
| |
Class R5 | | | (502,518 | ) | | | (44,458 | ) |
|
| |
Class R6 | | | (1,049,638,131 | ) | | | (70,287,598 | ) |
|
| |
Total distributions from distributable earnings | | | (2,367,292,207 | ) | | | (118,532,820 | ) |
|
| |
| | |
Share transactions–net: | | | | | | | | |
| | |
Class A | | | (257,246,966 | ) | | | (363,923,954 | ) |
|
| |
Class C | | | (13,976,453 | ) | | | (191,599,552 | ) |
|
| |
Class R | | | (12,600,336 | ) | | | (73,578,715 | ) |
|
| |
Class Y | | | (2,926,163,579 | ) | | | 1,599,558,338 | |
|
| |
Class R5 | | | (8,363,219 | ) | | | (5,511,623 | ) |
|
| |
Class R6 | | | (3,779,141,156 | ) | | | 1,765,562,602 | |
|
| |
Net increase (decrease) in net assets resulting from share transactions | | | (6,997,491,709 | ) | | | 2,730,507,096 | |
|
| |
Net increase (decrease) in net assets | | | (26,673,493,557 | ) | | | 9,351,161,515 | |
|
| |
| | |
Net assets: | | | | | | | | |
| | |
Beginning of year | | | 49,549,951,581 | | | | 40,198,790,066 | |
|
| |
End of year | | $ | 22,876,458,024 | | | $ | 49,549,951,581 | |
|
| |
See accompanying Notes to Consolidated Financial Statements which are an integral part of the financial statements.
| | |
| 13 | | Invesco Developing Markets Fund |
Consolidated Financial Highlights
The following schedule presents financial highlights for a share of the Fund outstanding throughout the periods indicated.
| | | | | | | | | | | | | | | | | | | | | | | | | | | | | | | | | | | | | | | | | | | | | | | | | | | | | | | | | | | | | | | | | | | | | | |
| | | Net asset value, beginning of period | | Net investment income (loss)(a) | | Net gains (losses) on securities (both realized and unrealized) | | Total from investment operations | | Dividends from net investment income | | Distributions from net realized gains | | Total distributions | | Net asset value, end of period | | Total return(b) | | Net assets, end of period (000’s omitted) | | Ratio of expenses to average net assets with fee waivers and/or expenses absorbed | | Ratio of expenses to average net assets without fee waivers and/or expenses absorbed(c) | | Ratio of net investment income (loss) to average net assets | | Portfolio turnover (d) |
Class A | | | | | | | | | | | | | | | | | | | | | | | | | | | | | | | | | | | | | | | | | | | | | | | | | | | | | | | | | | | | | | | | | | | | | | |
Year ended 10/31/22 | | | $ | 53.50 | | | | $ | 0.08 | | | | $ | (19.74 | ) | | | $ | (19.66 | ) | | | $ | (0.04 | ) | | | $ | (2.35 | ) | | | $ | (2.39 | ) | | | $ | 31.45 | | | | | (38.24 | )% | | | $ | 2,394,926 | | | | | 1.24 | % | | | | 1.24 | % | | | | 0.23 | % | | | | 27 | % |
Year ended 10/31/21 | | | | 45.84 | | | | | 0.11 | | | | | 7.55 | | | | | 7.66 | | | | | – | | | | | – | | | | | – | | | | | 53.50 | | | | | 16.71 | | | | | 4,467,836 | | | | | 1.20 | | | | | 1.20 | | | | | 0.20 | | | | | 38 | |
Year ended 10/31/20 | | | | 44.28 | | | | | 0.04 | | | | | 2.50 | | | | | 2.54 | | | | | (0.11 | ) | | | | (0.87 | ) | | | | (0.98 | ) | | | | 45.84 | | | | | 5.75 | | | | | 4,130,292 | | | | | 1.22 | | | | | 1.22 | | | | | 0.08 | | | | | 30 | |
Two months ended 10/31/19 | | | | 42.05 | | | | | 0.06 | | | | | 2.17 | | | | | 2.23 | | | | | – | | | | | – | | | | | – | | | | | 44.28 | | | | | 5.30 | | | | | 4,881,008 | | | | | 1.24 | (e) | | | | 1.24 | (e) | | | | 0.80 | (e) | | | | 7 | |
Year ended 08/31/19 | | | | 42.01 | | | | | 0.14 | | | | | 0.01 | | | | | 0.15 | | | | | (0.11 | ) | | | | – | | | | | (0.11 | ) | | | | 42.05 | | | | | 0.34 | | | | | 4,686,134 | | | | | 1.27 | | | | | 1.27 | | | | | 0.34 | | | | | 28 | |
Year ended 08/31/18 | | | | 41.49 | | | | | 0.06 | | | | | 0.59 | | | | | 0.65 | | | | | (0.13 | ) | | | | – | | | | | (0.13 | ) | | | | 42.01 | | | | | 1.59 | | | | | 5,277,791 | | | | | 1.29 | | | | | 1.29 | | | | | 0.13 | | | | | 36 | |
Class C | | | | | | | | | | | | | | | | | | | | | | | | | | | | | | | | | | | | | | | | | | | | | | | | | | | | | | | | | | | | | | | | | | | | | | |
Year ended 10/31/22 | | | | 48.79 | | | | | (0.19 | ) | | | | (17.89 | ) | | | | (18.08 | ) | | | | – | | | | | (2.35 | ) | | | | (2.35 | ) | | | | 28.36 | | | | | (38.70 | ) | | | | 30,355 | | | | | 1.99 | | | | | 1.99 | | | | | (0.52 | ) | | | | 27 | |
Year ended 10/31/21 | | | | 42.11 | | | | | (0.28 | ) | | | | 6.96 | | | | | 6.68 | | | | | – | | | | | – | | | | | – | | | | | 48.79 | | | | | 15.86 | | | | | 71,470 | | | | | 1.95 | | | | | 1.95 | | | | | (0.55 | ) | | | | 38 | |
Year ended 10/31/20 | | | | 40.96 | | | | | (0.27 | ) | | | | 2.29 | | | | | 2.02 | | | | | – | | | | | (0.87 | ) | | | | (0.87 | ) | | | | 42.11 | | | | | 4.93 | | | | | 225,906 | | | | | 1.97 | | | | | 1.97 | | | | | (0.67 | ) | | | | 30 | |
Two months ended 10/31/19 | | | | 38.95 | | | | | – | | | | | 2.01 | | | | | 2.01 | | | | | – | | | | | – | | | | | – | | | | | 40.96 | | | | | 5.16 | | | | | 403,027 | | | | | 2.00 | (e) | | | | 2.00 | (e) | | | | 0.03 | (e) | | | | 7 | |
Year ended 08/31/19 | | | | 39.10 | | | | | (0.16 | ) | | | | 0.01 | | | | | (0.15 | ) | | | | – | | | | | – | | | | | – | | | | | 38.95 | | | | | (0.41 | ) | | | | 493,169 | | | | | 2.02 | | | | | 2.02 | | | | | (0.42 | ) | | | | 28 | |
Year ended 08/31/18 | | | | 38.79 | | | | | (0.25 | ) | | | | 0.56 | | | | | 0.31 | | | | | – | | | | | – | | | | | – | | | | | 39.10 | | | | | 0.80 | | | | | 826,481 | | | | | 2.05 | | | | | 2.05 | | | | | (0.62 | ) | | | | 36 | |
Class R | | | | | | | | | | | | | | | | | | | | | | | | | | | | | | | | | | | | | | | | | | | | | | | | | | | | | | | | | | | | | | | | | | | | | | |
Year ended 10/31/22 | | | | 51.11 | | | | | (0.01 | ) | | | | (18.81 | ) | | | | (18.82 | ) | | | | – | | | | | (2.35 | ) | | | | (2.35 | ) | | | | 29.94 | | | | | (38.38 | ) | | | | 209,736 | | | | | 1.49 | | | | | 1.49 | | | | | (0.02 | ) | | | | 27 | |
Year ended 10/31/21 | | | | 43.91 | | | | | (0.03 | ) | | | | 7.23 | | | | | 7.20 | | | | | – | | | | | – | | | | | – | | | | | 51.11 | | | | | 16.40 | | | | | 379,043 | | | | | 1.45 | | | | | 1.45 | | | | | (0.05 | ) | | | | 38 | |
Year ended 10/31/20 | | | | 42.48 | | | | | (0.07 | ) | | | | 2.40 | | | | | 2.33 | | | | | (0.03 | ) | | | | (0.87 | ) | | | | (0.90 | ) | | | | 43.91 | | | | | 5.49 | | | | | 387,506 | | | | | 1.47 | | | | | 1.47 | | | | | (0.17 | ) | | | | 30 | |
Two months ended 10/31/19 | | | | 40.36 | | | | | 0.04 | | | | | 2.08 | | | | | 2.12 | | | | | – | | | | | – | | | | | – | | | | | 42.48 | | | | | 5.25 | | | | | 472,840 | | | | | 1.50 | (e) | | | | 1.50 | (e) | | | | 0.54 | (e) | | | | 7 | |
Year ended 08/31/19 | | | | 40.32 | | | | | 0.03 | | | | | 0.01 | | | | | 0.04 | | | | | – | | | | | – | | | | | – | | | | | 40.36 | | | | | 0.10 | | | | | 471,206 | | | | | 1.52 | | | | | 1.52 | | | | | 0.08 | | | | | 28 | |
Year ended 08/31/18 | | | | 39.84 | | | | | (0.05 | ) | | | | 0.58 | | | | | 0.53 | | | | | (0.05 | ) | | | | – | | | | | (0.05 | ) | | | | 40.32 | | | | | 1.32 | | | | | 585,385 | | | | | 1.55 | | | | | 1.55 | | | | | (0.12 | ) | | | | 36 | |
Class Y | | | | | | | | | | | | | | | | | | | | | | | | | | | | | | | | | | | | | | | | | | | | | | | | | | | | | | | | | | | | | | | | | | | | | | |
Year ended 10/31/22 | | | | 52.78 | | | | | 0.19 | | | | | (19.44 | ) | | | | (19.25 | ) | | | | (0.19 | ) | | | | (2.35 | ) | | | | (2.54 | ) | | | | 30.99 | | | | | (38.08 | ) | | | | 10,871,573 | | | | | 0.99 | | | | | 0.99 | | | | | 0.48 | | | | | 27 | |
Year ended 10/31/21 | | | | 45.21 | | | | | 0.24 | | | | | 7.45 | | | | | 7.69 | | | | | (0.12 | ) | | | | – | | | | | (0.12 | ) | | | | 52.78 | | | | | 17.01 | | | | | 23,079,615 | | | | | 0.95 | | | | | 0.95 | | | | | 0.45 | | | | | 38 | |
Year ended 10/31/20 | | | | 43.70 | | | | | 0.14 | | | | | 2.48 | | | | | 2.62 | | | | | (0.24 | ) | | | | (0.87 | ) | | | | (1.11 | ) | | | | 45.21 | | | | | 6.01 | | | | | 18,432,202 | | | | | 0.97 | | | | | 0.97 | | | | | 0.33 | | | | | 30 | |
Two months ended 10/31/19 | | | | 41.49 | | | | | 0.07 | | | | | 2.14 | | | | | 2.21 | | | | | – | | | | | – | | | | | – | | | | | 43.70 | | | | | 5.33 | | | | | 19,342,101 | | | | | 1.00 | (e) | | | | 1.00 | (e) | | | | 1.04 | (e) | | | | 7 | |
Year ended 08/31/19 | | | | 41.48 | | | | | 0.24 | | | | | 0.00 | | | | | 0.24 | | | | | (0.23 | ) | | | | – | | | | | (0.23 | ) | | | | 41.49 | | | | | 0.61 | | | | | 18,525,445 | | | | | 1.02 | | | | | 1.02 | | | | | 0.59 | | | | | 28 | |
Year ended 08/31/18 | | | | 40.98 | | | | | 0.16 | | | | | 0.59 | | | | | 0.75 | | | | | (0.25 | ) | | | | – | | | | | (0.25 | ) | | | | 41.48 | | | | | 1.82 | | | | | 17,898,340 | | | | | 1.05 | | | | | 1.05 | | | | | 0.38 | | | | | 36 | |
Class R5 | | | | | | | | | | | | | | | | | | | | | | | | | | | | | | | | | | | | | | | | | | | | | | | | | | | | | | | | | | | | | | | | | | | | | | |
Year ended 10/31/22 | | | | 53.52 | | | | | 0.26 | | | | | (19.70 | ) | | | | (19.44 | ) | | | | (0.22 | ) | | | | (2.35 | ) | | | | (2.57 | ) | | | | 31.51 | | | | | (37.93 | ) | | | | 130 | | | | | 0.89 | | | | | 0.89 | | | | | 0.58 | | | | | 27 | |
Year ended 10/31/21 | | | | 45.85 | | | | | 0.27 | | | | | 7.55 | | | | | 7.82 | | | | | (0.15 | ) | | | | – | | | | | (0.15 | ) | | | | 53.52 | | | | | 17.07 | | | | | 10,527 | | | | | 0.90 | | | | | 0.90 | | | | | 0.50 | | | | | 38 | |
Year ended 10/31/20 | | | | 44.33 | | | | | 0.17 | | | | | 2.52 | | | | | 2.69 | | | | | (0.30 | ) | | | | (0.87 | ) | | | | (1.17 | ) | | | | 45.85 | | | | | 6.10 | | | | | 13,560 | | | | | 0.89 | | | | | 0.89 | | | | | 0.41 | | | | | 30 | |
Two months ended 10/31/19 | | | | 42.08 | | | | | 0.08 | | | | | 2.17 | | | | | 2.25 | | | | | – | | | | | – | | | | | – | | | | | 44.33 | | | | | 5.35 | | | | | 6,006 | | | | | 0.88 | (e) | | | | 0.88 | (e) | | | | 1.16 | (e) | | | | 7 | |
Period ended 08/31/19(f) | | | | 41.26 | | | | | 0.09 | | | | | 0.73 | | | | | 0.82 | | | | | – | | | | | – | | | | | – | | | | | 42.08 | | | | | 1.99 | | | | | 10 | | | | | 0.87 | (e) | | | | 0.87 | (e) | | | | 0.74 | (e) | | | | 28 | |
Class R6 | | | | | | | | | | | | | | | | | | | | | | | | | | | | | | | | | | | | | | | | | | | | | | | | | | | | | | | | | | | | | | | | | | | | | | |
Year ended 10/31/22 | | | | 52.83 | | | | | 0.25 | | | | | (19.44 | ) | | | | (19.19 | ) | | | | (0.27 | ) | | | | (2.35 | ) | | | | (2.62 | ) | | | | 31.02 | | | | | (37.98 | ) | | | | 9,369,739 | | | | | 0.84 | | | | | 0.84 | | | | | 0.63 | | | | | 27 | |
Year ended 10/31/21 | | | | 45.25 | | | | | 0.32 | | | | | 7.45 | | | | | 7.77 | | | | | (0.19 | ) | | | | – | | | | | (0.19 | ) | | | | 52.83 | | | | | 17.17 | | | | | 21,541,460 | | | | | 0.81 | | | | | 0.81 | | | | | 0.59 | | | | | 38 | |
Year ended 10/31/20 | | | | 43.75 | | | | | 0.21 | | | | | 2.48 | | | | | 2.69 | | | | | (0.32 | ) | | | | (0.87 | ) | | | | (1.19 | ) | | | | 45.25 | | | | | 6.17 | | | | | 17,009,325 | | | | | 0.82 | | | | | 0.82 | | | | | 0.48 | | | | | 30 | |
Two months ended 10/31/19 | | | | 41.52 | | | | | 0.09 | | | | | 2.14 | | | | | 2.23 | | | | | – | | | | | – | | | | | – | | | | | 43.75 | | | | | 5.37 | | | | | 17,106,921 | | | | | 0.83 | (e) | | | | 0.83 | (e) | | | | 1.21 | (e) | | | | 7 | |
Year ended 08/31/19 | | | | 41.52 | | | | | 0.31 | | | | | (0.01 | ) | | | | 0.30 | | | | | (0.30 | ) | | | | – | | | | | (0.30 | ) | | | | 41.52 | | | | | 0.77 | | | | | 16,224,242 | | | | | 0.86 | | | | | 0.86 | | | | | 0.75 | | | | | 28 | |
Year ended 08/31/18 | | | | 41.01 | | | | | 0.23 | | | | | 0.59 | | | | | 0.82 | | | | | (0.31 | ) | | | | – | | | | | (0.31 | ) | | | | 41.52 | | | | | 2.00 | | | | | 13,987,540 | | | | | 0.87 | | | | | 0.87 | | | | | 0.55 | | | | | 36 | |
| (a) | Calculated using average shares outstanding. |
| (b) | Includes adjustments in accordance with accounting principles generally accepted in the United States of America and as such, the net asset value for financial reporting purposes and the returns based upon those net asset values may differ from the net asset value and returns for shareholder transactions. Does not include sales charges and is not annualized for periods less than one year, if applicable. |
| (c) | Does not include indirect expenses from affiliated fund fees and expenses of 0.00% for the two months ended October 31, 2019 and for the years ended August 31, 2019 and 2018, respectively. |
| (d) | Portfolio turnover is calculated at the fund level and is not annualized for periods less than one year, if applicable. |
| (f) | Commencement date after the close of business on May 24, 2019. |
See accompanying Notes to Consolidated Financial Statements which are an integral part of the financial statements.
| | |
| 14 | | Invesco Developing Markets Fund |
Notes to Consolidated Financial Statements
October 31, 2022
NOTE 1–Significant Accounting Policies
Invesco Developing Markets Fund(the “Fund”) is a series portfolio of AIM Investment Funds (Invesco Investment Funds) (the “Trust”). The Trust is organized as a Delaware statutory trust and is registered under the Investment Company Act of 1940, as amended (the “1940 Act”), as an open-end series management investment company authorized to issue an unlimited number of shares of beneficial interest. Information presented in these consolidated financial statements pertains only to the Fund and the OFI Global China Fund, LLC (the “Subsidiary”), a wholly-owned and controlled subsidiary by the Fund organized under the laws of Delaware. The Subsidiary may invest in companies established or operating in, or with significant exposure to, the People’s Republic of China or other developing markets countries. For operational efficiency and regulatory considerations, the Fund may gain access to such companies through an investment in the Subsidiary. The Fund may invest 10% of its total assets in the Subsidiary. Matters affecting the Fund or each class will be voted on exclusively by the shareholders of the Fund or each class.
The Fund’s investment objective is to seek capital appreciation.
The Fund currently consists of six different classes of shares: Class A, Class C, Class R, Class Y, Class R5 and Class R6. Class Y shares are available only to certain investors. Class A shares are sold with a front-end sales charge unless certain waiver criteria are met. Under certain circumstances, load waived shares may be subject to contingent deferred sales charges (“CDSC”). Class C shares are sold with a CDSC. Class R, Class Y, Class R5 and Class R6 shares are sold at net asset value. Class C shares held for eight years after purchase are eligible for automatic conversion into Class A shares of the same Fund (the “Conversion Feature”). The automatic conversion pursuant to the Conversion Feature will generally occur at the end of the month following the eighth anniversary after a purchase of Class C shares.
The Fund is an investment company and accordingly follows the investment company accounting and reporting guidance in accordance with Financial Accounting Standards Board Accounting Standards Codification Topic 946, Financial Services – Investment Companies.
The following is a summary of the significant accounting policies followed by the Fund in the preparation of its consolidated financial statements.
| A. | Security Valuations – Securities, including restricted securities, are valued according to the following policy. |
A security listed or traded on an exchange is generally valued at its trade price or official closing price that day as of the close of the exchange where the security is principally traded, or lacking any trades or official closing price on a particular day, the security may be valued at the closing bid price on that day. Securities traded in the over-the-counter market are valued based on prices furnished by independent pricing services or market makers. When such securities are valued using prices provided by an independent pricing service they may be considered fair valued. Futures contracts are valued at the daily settlement price set by an exchange on which they are principally traded. U.S. exchange-traded options are valued at the mean between the last bid and asked prices from the exchange on which they are principally traded. Non-U.S. exchange-traded options are valued at the final settlement price set by the exchange on which they trade. Options not listed on an exchange and swaps generally are valued using pricing provided from independent pricing services.
Securities of investment companies that are not exchange-traded (e.g., open-end mutual funds) are valued using such company’s end-of-business-day net asset value per share.
Deposits, other obligations of U.S. and non-U.S. banks and financial institutions are valued at their daily account value.
Fixed income securities (including convertible debt securities) generally are valued on the basis of prices provided by independent pricing services. Prices provided by the pricing service may be determined without exclusive reliance on quoted prices, and may reflect appropriate factors such as institution-size trading in similar groups of securities, developments related to specific securities, dividend rate (for unlisted equities), yield (for debt obligations), quality, type of issue, coupon rate (for debt obligations), maturity (for debt obligations), individual trading characteristics and other market data. Pricing services generally value debt obligations assuming orderly transactions of institutional round lot size, but a fund may hold or transact in the same securities in smaller, odd lot sizes. Odd lots often trade at lower prices than institutional round lots, and their value may be adjusted accordingly. Debt obligations are subject to interest rate and credit risks. In addition, all debt obligations involve some risk of default with respect to interest and/or principal payments.
Foreign securities’ (including foreign exchange contracts) prices are converted into U.S. dollar amounts using the applicable exchange rates as of the close of the New York Stock Exchange (“NYSE”). If market quotations are available and reliable for foreign exchange-traded equity securities, the securities will be valued at the market quotations. Invesco Advisers, Inc. (the “Adviser” or “Invesco”) may use various pricing services to obtain market quotations as well as fair value prices. Because trading hours for certain foreign securities end before the close of the NYSE, closing market quotations may become not representative of market value in the Adviser’s judgment (“unreliable”). If between the time trading ends on a particular security and the close of the customary trading session on the NYSE, a significant event occurs that makes the closing price of the security unreliable, the Adviser may fair value the security. If the event is likely to have affected the closing price of the security, the security will be valued at fair value in good faith in accordance with Board-approved policies and related Adviser procedures (“Valuation Procedures”). Adjustments to closing prices to reflect fair value may also be based on a screening process of an independent pricing service to indicate the degree of certainty, based on historical data, that the closing price in the principal market where a foreign security trades is not the current value as of the close of the NYSE. Foreign securities’ prices meeting the degree of certainty that the price is not reflective of current value will be priced at the indication of fair value from the independent pricing service. Multiple factors may be considered by the independent pricing service in determining adjustments to reflect fair value and may include information relating to sector indices, American Depositary Receipts and domestic and foreign index futures. Foreign securities may have additional risks including exchange rate changes, potential for sharply devalued currencies and high inflation, political and economic upheaval, the relative lack of issuer information, relatively low market liquidity and the potential lack of strict financial and accounting controls and standards.
Unlisted securities will be valued using prices provided by independent pricing services or by another method that the Adviser, in its judgment, believes better reflects the security’s fair value in accordance with the Valuation Procedures.
Securities for which market prices are not provided by any of the above methods may be valued based upon quotes furnished by independent sources. The last bid price may be used to value equity securities. The mean between the last bid and asked prices may be used to value debt obligations, including corporate loans.
Securities for which market quotations are not readily available are fair valued by the Adviser in accordance with the Valuation Procedures. If a fair value price provided by a pricing service is unreliable, the Adviser will fair value the security using the Valuation Procedures. Issuer specific events, market trends, bid/asked quotes of brokers and information providers and other market data may be reviewed in the course of making a good faith determination of a security’s fair value.
The Fund may invest in securities that are subject to interest rate risk, meaning the risk that the prices will generally fall as interest rates rise and, conversely, the prices will generally rise as interest rates fall. Specific securities differ in their sensitivity to changes in interest rates depending on their individual characteristics. Changes in interest rates may result in increased market volatility, which may affect the value and/or liquidity of certain Fund investments.
Valuations change in response to many factors including the historical and prospective earnings of the issuer, the value of the issuer’s assets, general market conditions which are not specifically related to the particular issuer, such as real or perceived adverse economic conditions, changes in the general outlook for revenues or corporate earnings, changes in interest or currency rates, regional or global instability, natural or environmental disasters, widespread disease or other public health issues, war, acts of terrorism, significant governmental actions or adverse investor sentiment generally and market liquidity. Because of the inherent uncertainties of valuation, the values reflected in the consolidated financial statements may materially differ from the value received upon actual sale of those investments.
The price the Fund could receive upon the sale of any investment may differ from the Adviser’s valuation of the investment, particularly for securities that are valued using a fair valuation technique. When fair valuation techniques are applied, the Adviser uses available information, including both observable and unobservable inputs and assumptions, to determine a methodology that will result in a valuation that the Adviser believes approximates market value. Fund
| | |
| 15 | | Invesco Developing Markets Fund |
securities that are fair valued may be subject to greater fluctuation in their value from one day to the next than would be the case if market quotations were used. Because of the inherent uncertainties of valuation, and the degree of subjectivity in such decisions, the Fund could realize a greater or lesser than expected gain or loss upon the sale of the investment.
| B. | Securities Transactions and Investment Income – Securities transactions are accounted for on a trade date basis. Realized gains or losses on sales are computed on the basis of specific identification of the securities sold. Interest income (net of withholding tax, if any) is recorded on an accrual basis from settlement date and includes coupon interest and amortization of premium and accretion of discount on debt securities as applicable. Pay-in-kind interest income and non-cash dividend income received in the form of securities in-lieu of cash are recorded at the fair value of the securities received. Dividend income (net of withholding tax, if any) is recorded on the ex-dividend date. |
The Fund may periodically participate in litigation related to Fund investments. As such, the Fund may receive proceeds from litigation settlements.Any proceeds received are included in the Consolidated Statement of Operations as realized gain (loss) for investments no longer held and as unrealized gain (loss) for investments still held.
Brokerage commissions and mark ups are considered transaction costs and are recorded as an increase to the cost basis of securities purchased and/or a reduction of proceeds on a sale of securities. Such transaction costs are included in the determination of net realized and unrealized gain (loss) from investment securities reported in the Consolidated Statement of Operations and the Consolidated Statement of Changes in Net Assets and the net realized and unrealized gains (losses) on securities per share in the Consolidated Financial Highlights. Transaction costs are included in the calculation of the Fund’s net asset value and, accordingly, they reduce the Fund’s total returns. These transaction costs are not considered operating expenses and are not reflected in net investment income reported in the Consolidated Statement of Operations and the Consolidated Statement of Changes in Net Assets, or the net investment income per share and the ratios of expenses and net investment income reported in the Consolidated Financial Highlights, nor are they limited by any expense limitation arrangements between the Fund and the investment adviser.
The Fund allocates income and realized and unrealized capital gains and losses to a class based on the relative net assets of each class.
| C. | Country Determination – For the purposes of making investment selection decisions and presentation in the Consolidated Schedule of Investments, the investment adviser may determine the country in which an issuer is located and/or credit risk exposure based on various factors. These factors include the laws of the country under which the issuer is organized, where the issuer maintains a principal office, the country in which the issuer derives 50% or more of its total revenues, the country that has the primary market for the issuer’s securities and its “country of risk” as determined by a third party service provider,as well as other criteria. Among the other criteria that may be evaluated for making this determination are the country in which the issuer maintains 50% or more of its assets, the type of security, financial guarantees and enhancements, the nature of the collateral and the sponsor organization. Country of issuer and/or credit risk exposure has been determined to be the United States of America, unless otherwise noted. |
| D. | Distributions – Distributions from net investment income and net realized capital gain, if any, are generally declared and paid annually and recorded on the ex-dividend date. The Fund may elect to treat a portion of the proceeds from redemptions as distributions for federal income tax purposes. |
| E. | Federal Income Taxes – The Fund intends to comply with the requirements of Subchapter M of the Internal Revenue Code of 1986, as amended (the “Internal Revenue Code”), necessary to qualify as a regulated investment company and to distribute substantially all of the Fund’s taxable earnings to shareholders. As such, the Fund will not be subject to federal income taxes on otherwise taxable income (including net realized capital gain) that is distributed to shareholders. Therefore, no provision for federal income taxes is recorded in the consolidated financial statements. |
The Fund recognizes the tax benefits of uncertain tax positions only when the position is more likely than not to be sustained. Management has analyzed the Fund’s uncertain tax positions and concluded that no liability for unrecognized tax benefits should be recorded related to uncertain tax positions. Management is not aware of any tax positions for which it is reasonably possible that the total amounts of unrecognized tax benefits will change materially in the next 12 months.
The Subsidiary is classified as a controlled foreign corporation under Subchapter N of the Internal Revenue Code. Therefore, the Fund is required to increase its taxable income by its share of the Subsidiary’s income. Net investment losses of the Subsidiary cannot be deducted by the Fund in the current period nor carried forward to offset taxable income in future periods.
The Fund files tax returns in the U.S. Federal jurisdiction and certain other jurisdictions. Generally the Fund is subject to examinations by such taxing authorities for up to three years after the filing of the return for the tax period.
| F. | Foreign Withholding Taxes – The Fund is subject to foreign withholding tax imposed by certain foreign countries in which the Fund may invest. Withholding taxes are incurred on certain foreign dividends and are accrued at the time the dividend is recognized based on applicable foreign tax laws. The Fund may file withholding tax refunds in certain jurisdictions to recover a portion of amounts previously withheld. The Fund will record a receivable for such tax refunds based on several factors including; an assessment of a jurisdiction’s legal obligation to pay reclaims, administrative practices and payment history. Any receivables recorded will be shown under receivables for Tax reclaims on the Consolidated Statement of Assets and Liabilities. |
As a result of recent court rulings in certain countries across the European Union, tax refunds for previously withheld taxes on dividends earned in those countries have been received. These tax refund payments are reflected as Foreign withholding tax claims in the Consolidated Statement of Operations, and any related interest is included in Interest income. The Fund may incur fees paid to third party providers that assist in the recovery of the tax reclaims. These fees are reflected on the Consolidated Statement of Operations as Professional fees, if any. In the event tax refunds received by the Fund during the fiscal year exceed the foreign withholding taxes paid by the Fund for the year, and the Fund previously passed foreign tax credits on to its shareholders, the Fund intends to enter into a closing agreement with the Internal Revenue Service in order to pay the associated liability on behalf of the Funds’ shareholders. For the year ended October 31, 2022, the Fund did not enter into any closing agreements.
| G. | Expenses – Fees provided for under the Rule 12b-1 plan of a particular class of the Fund are charged to the operations of such class. Transfer agency fees and expenses and other shareholder recordkeeping fees and expenses attributable to Class R5 and Class R6 are allocated based on relative net assets of Class R5 and Class R6. Sub-accounting fees attributable to Class R5 are charged to the operations of the class. Transfer agency fees and expenses and other shareholder recordkeeping fees and expenses relating to all other classes are allocated among those classes based on relative net assets. All other expenses are allocated among the classes based on relative net assets. |
| H. | Accounting Estimates – The financial statements are prepared on a consolidated basis in conformity with accounting principles generally accepted in the United States of America (“GAAP”), which requires management to make estimates and assumptions that affect the reported amounts of assets and liabilities at the date of the financial statements and the reported amounts of revenues and expenses during the reporting period including estimates and assumptions related to taxation. Actual results could differ from those estimates by a significant amount. The accompanying financial statements reflect the financial position of the Fund and its Subsidiary and the results of operations on a consolidated basis. All inter-company accounts and transactions have been eliminated in consolidation. |
In addition, the Fund monitors for material events or transactions that may occur or become known after the period-end date and before the date the consolidated financial statements are released to print.
| I. | Indemnifications – Under the Trust’s organizational documents, each Trustee, officer, employee or other agent of the Trust, and under the Subsidiary’s organizational documents, the directors and officers of the Subsidiary, are indemnified against certain liabilities that may arise out of the performance of their duties to the Fund and/or the Subsidiary, respectively. Additionally, in the normal course of business, the Fund enters into contracts, including the Fund’s servicing agreements, that contain a variety of indemnification clauses. The Fund’s maximum exposure under these arrangements is unknown as this would involve future claims that may be made against the Fund that have not yet occurred. The risk of material loss as a result of such indemnification claims is considered remote. |
| J. | Foreign Currency Translations – Foreign currency is valued at the close of the NYSE based on quotations posted by banks and major currency dealers. |
| | |
| 16 | | Invesco Developing Markets Fund |
Portfolio securities and other assets and liabilities denominated in foreign currencies are translated into U.S. dollar amounts at the date of valuation. Purchases and sales of portfolio securities (net of foreign taxes withheld on disposition) and income items denominated in foreign currencies are translated into U.S. dollar amounts on the respective dates of such transactions. The Fund does not separately account for the portion of the results of operations resulting from changes in foreign exchange rates on investments and the fluctuations arising from changes in market prices of securities held. The combined results of changes in foreign exchange rates and the fluctuation of market prices on investments (net of estimated foreign tax withholding) are included with the net realized and unrealized gain or loss from investments in the Consolidated Statement of Operations. Reported net realized foreign currency gains or losses arise from (1) sales of foreign currencies, (2) currency gains or losses realized between the trade and settlement dates on securities transactions, and (3) the difference between the amounts of dividends, interest, and foreign withholding taxes recorded on the Fund’s books and the U.S. dollar equivalent of the amounts actually received or paid. Net unrealized foreign currency gains and losses arise from changes in the fair values of assets and liabilities, other than investments in securities at fiscal period end, resulting from changes in exchange rates.
The Fund may invest in foreign securities, which may be subject to foreign taxes on income, gains on investments or currency repatriation, a portion of which may be recoverable. Foreign taxes, if any, are recorded based on the tax regulations and rates that exist in the foreign markets in which the Fund invests and are shown in the Consolidated Statement of Operations.
| K. | Forward Foreign Currency Contracts – The Fund may engage in foreign currency transactions either on a spot (i.e. for prompt delivery and settlement) basis, or through forward foreign currency contracts, to manage or minimize currency or exchange rate risk. |
The Fund may also enter into forward foreign currency contracts for the purchase or sale of a security denominated in a foreign currency in order to “lock in” the U.S. dollar price of that security, or the Fund may also enter into forward foreign currency contracts that do not provide for physical exchange of the two currencies on the settlement date, but instead are settled by a single cash payment calculated as the difference between the agreed upon exchange rate and the spot rate at settlement based upon an agreed upon notional amount (non-deliverable forwards).
A forward foreign currency contract is an obligation between two parties (“Counterparties”) to purchase or sell a specific currency for an agreed-upon price at a future date. The use of forward foreign currency contracts for hedging does not eliminate fluctuations in the price of the underlying securities the Fund owns or intends to acquire but establishes a rate of exchange in advance. Fluctuations in the value of these contracts are measured by the difference in the contract date and reporting date exchange rates and are recorded as unrealized appreciation (depreciation) until the contracts are closed. When the contracts are closed, realized gains (losses) are recorded. Realized and unrealized gains (losses) on the contracts are included in the Consolidated Statement of Operations. The primary risks associated with forward foreign currency contracts include failure of the Counterparty to meet the terms of the contract and the value of the foreign currency changing unfavorably. These risks may be in excess of the amounts reflected in the Consolidated Statement of Assets and Liabilities.
| L. | Other Risks – The Subsidiary is not registered under the 1940 Act. As an investor in the Subsidiary, the Fund does not have all of the protections offered to investors by the 1940 Act. However, the Subsidiary is controlled by the Fund and managed by OppenheimerFunds, Inc. The Subsidiary may invest substantially all of its assets in a limited number of issuers or a single issuer. To the extent that it does so, the Subsidiary is more subject to the risks associated with and developments affecting such issuers than a fund that invests more widely. |
The Fund’s investments in Class A Shares of Chinese companies involve certain risks and special considerations not typically associated with investments in U.S. companies, such as greater government control over the economy, political and legal uncertainty, currency fluctuations or blockage, the risk that the Chinese government may decide not to continue to support economic reform programs and the risk of nationalization or expropriation of assets. The Fund may invest directly in China A shares through Stock Connect, and will be subject to the following risks: sudden changes in quota limitations, application of trading suspensions, differences in trading days between the PRC and Stock Connect, operational risk, clearing and settlement risk and regulatory and taxation risk.
Investing in developing countries can add additional risk, such as high rates of inflation or sharply devalued currencies against the U.S. dollar.
Transaction costs are often higher and there may be delays in settlement procedures.
Certain securities issued by companies in China may be less liquid, harder to sell or more volatile than U.S. securities.
Following Russia’s invasion of Ukraine in late February 2022, various countries, including the United States, as well as NATO and the European Union, issued broad-ranging economic sanctions against Russia and Belarus. The resulting responses to the military actions (and potential further sanctions in response to continued military activity), the potential for military escalation and other corresponding events, have had, and could continue to have, severe negative effects on regional and global economic and financial markets, including increased volatility, reduced liquidity and overall uncertainty. The negative impacts may be particularly acute in certain sectors including, but not limited to, energy and financials. Russia may take additional counter measures or retaliatory actions (including cyberattacks), which could exacerbate negative consequences on global financial markets. The duration of ongoing hostilities and corresponding sanctions and related events cannot be predicted. The foregoing may result in a negative impact on Fund performance and the value of an investment in the Fund, even beyond any direct investment exposure the Fund may have to Russian issuers or the adjoining geographic regions.
| M. | COVID-19 Risk – The COVID-19 strain of coronavirus has resulted in instances of market closures and dislocations, extreme volatility, liquidity constraints and increased trading costs. Efforts to contain its spread have resulted in travel restrictions, disruptions of healthcare systems, business operations (including business closures) and supply chains, layoffs, lower consumer demand and employee availability, and defaults and credit downgrades, among other significant economic impacts that have disrupted global economic activity across many industries. Such economic impacts may exacerbate other pre-existing political, social and economic risks locally or globally and cause general concern and uncertainty. The full economic impact and ongoing effects of COVID-19 (or other future epidemics or pandemics) at the macro-level and on individual businesses are unpredictable and may result in significant and prolonged effects on the Fund’s performance. |
NOTE 2–Advisory Fees and Other Fees Paid to Affiliates
The Trust has entered into a master investment advisory agreement with the Adviser. Under the terms of the investment advisory agreement, the Fund accrues daily and pays monthly an advisory fee to the Adviser based on the annual rate of the Fund’s average daily net assets as follows:
| | | | |
| Average Daily Net Assets | | Rate* | |
|
| |
First $ 250 million | | | 1.000% | |
|
| |
Next $250 million | | | 0.950% | |
|
| |
Next $500 million | | | 0.900% | |
|
| |
Next $6 billion | | | 0.850% | |
|
| |
Next $3 billion | | | 0.800% | |
|
| |
Next $20 billion | | | 0.750% | |
|
| |
Next $15 billion | | | 0.740% | |
|
| |
Over $45 billion | | | 0.730% | |
|
| |
| * | The advisory fee paid by the Fund shall be reduced by any amounts paid by the Fund under the administrative services agreement with the Adviser. |
For the year ended October 31, 2022, the effective advisory fee rate incurred by the Fund was 0.76%.
| | |
| 17 | | Invesco Developing Markets Fund |
Under the terms of a master sub-advisory agreement between the Adviser and each of Invesco Asset Management Deutschland GmbH, Invesco Asset Management Limited, Invesco Asset Management (Japan) Limited, Invesco Hong Kong Limited, Invesco Senior Secured Management, Inc. and Invesco Canada Ltd. and separate sub-advisory agreements with Invesco Capital Management LLC and Invesco Asset Management (India) Private Limited (collectively, the “Affiliated Sub-Advisers”) the Adviser, not the Fund, will pay 40% of the fees paid to the Adviser to any such Affiliated Sub-Adviser(s) that provide(s) discretionary investment management services to the Fund based on the percentage of assets allocated to such Affiliated Sub-Adviser(s). Invesco has also entered into a sub-advisory agreement with OppenheimerFunds, Inc. to provide discretionary management services to the Fund.
The Adviser has contractually agreed, through at least June 30, 2023, to waive advisory fees and/or reimburse expenses of all shares to the extent necessary to limit total annual fund operating expenses after fee waiver and/or expense reimbursement (excluding certain items discussed below) of Class A, Class C, Class R, Class Y, Class R5 and Class R6 shares to 2.25%, 3.00%, 2.50%, 2.00%, 2.00%, and 2.00%, respectively, of the Fund’s average daily net assets (the “expense limits”). In determining the Adviser’s obligation to waive advisory fees and/or reimburse expenses, the following expenses are not taken into account, and could cause the total annual fund operating expenses after fee waiver and/or expense reimbursement to exceed the numbers reflected above: (1) interest; (2) taxes; (3) dividend expense on short sales; (4) extraordinary or non-routine items, including litigation expenses; and (5) expenses that the Fund has incurred but did not actually pay because of an expense offset arrangement. Unless Invesco continues the fee waiver agreement, it will terminate on June 30, 2023. During its term, the fee waiver agreement cannot be terminated or amended to increase the expense limits or reduce the advisory fee waiver without approval of the Board of Trustees. The Adviser did not waive fees and/or reimburse expenses during the period under these expense limits.
Further, the Adviser has contractually agreed, through at least June 30, 2024, to waive the advisory fee payable by the Fund in an amount equal to 100% of the net advisory fees the Adviser receives from the affiliated money market funds on investments by the Fund of uninvested cash in such affiliated money market funds.
For the year ended October 31, 2022, the Adviser waived advisory fees of $677,281.
The Trust has entered into a master administrative services agreement with Invesco pursuant to which the Fund has agreed to pay Invesco for certain administrative costs incurred in providing accounting services to the Fund. For the year ended October 31, 2022, expenses incurred under the agreement are shown in the Consolidated Statement of Operations as Administrative services fees. Invesco has entered into a sub-administration agreement whereby State Street Bank and Trust Company (“SSB”) serves as fund accountant and provides certain administrative services to the Fund. Pursuant to a custody agreement with the Trust on behalf of the Fund, SSB also serves as the Fund’s custodian.
The Trust has entered into a transfer agency and service agreement with Invesco Investment Services, Inc. (“IIS”) pursuant to which the Fund has agreed to pay IIS a fee for providing transfer agency and shareholder services to the Fund and reimburse IIS for certain expenses incurred by IIS in the course of providing such services. IIS may make payments to intermediaries that provide omnibus account services, sub-accounting services and/or networking services. All fees payable by IIS to intermediaries that provide omnibus account services or sub-accounting services are charged back to the Fund, subject to certain limitations approved by the Trust’s Board of Trustees. For the year ended October 31, 2022, expenses incurred under the agreement are shown in the Consolidated Statement of Operations as Transfer agent fees.
The Trust has entered into master distribution agreements with Invesco Distributors, Inc. (“IDI”) to serve as the distributor for the Class A, Class C, Class R, Class Y, Class R5 and Class R6 shares of the Fund. The Trust has adopted plans pursuant to Rule 12b-1 under the 1940 Act with respect to the Fund’s Class A, Class C and Class R shares (collectively, the “Plans”). The Fund, pursuant to the Class A Plan, reimburses IDI for its allocated share of expenses incurred for the period, up to a maximum annual rate of 0.25% of the average daily net assets of Class A shares. The Fund, pursuant to the Class C and Class R Plans, pays IDI compensation at the annual rate of 1.00% of the average daily net assets of Class C shares and 0.50% of the average daily net assets of Class R shares. The fees are accrued daily and paid monthly. Of the Plan payments, up to 0.25% of the average daily net assets of each class of shares may be paid to furnish continuing personal shareholder services to customers who purchase and own shares of such classes. Any amounts not paid as a service fee under the Plans would constitute an asset-based sales charge. Rules of the Financial Industry Regulatory Authority (“FINRA”) impose a cap on the total sales charges, including asset-based sales charges, that may be paid by any class of shares of the Fund. For the year ended October 31, 2022, expenses incurred under the Plans are shown in the Consolidated Statement of Operations as Distribution fees.
Front-end sales commissions and CDSC (collectively, the “sales charges”) are not recorded as expenses of the Fund. Front-end sales commissions are deducted from proceeds from the sales of Fund shares prior to investment in Class A shares of the Fund. CDSC are deducted from redemption proceeds prior to remittance to the shareholder. During the year ended October 31, 2022, IDI advised the Fund that IDI retained $45,004 in front-end sales commissions from the sale of Class A shares and $11,996 and $1,527 from Class A and Class C shares, respectively, for CDSC imposed upon redemptions by shareholders.
Certain officers and trustees of the Trust are officers and directors of the Adviser, IIS and/or IDI.
NOTE 3–Additional Valuation Information
GAAP defines fair value as the price that would be received to sell an asset or paid to transfer a liability in an orderly transaction between market participants at the measurement date, under current market conditions. GAAP establishes a hierarchy that prioritizes the inputs to valuation methods, giving the highest priority to readily available unadjusted quoted prices in an active market for identical assets (Level 1) and the lowest priority to significant unobservable inputs (Level 3), generally when market prices are not readily available. Based on the valuation inputs, the securities or other investments are tiered into one of three levels. Changes in valuation methods may result in transfers in or out of an investment’s assigned level:
| | |
| Level 1 - | | Prices are determined using quoted prices in an active market for identical assets. |
| Level 2 - | | Prices are determined using other significant observable inputs. Observable inputs are inputs that other market participants may use in pricing a security. These may include quoted prices for similar securities, interest rates, prepayment speeds, credit risk, yield curves, loss severities, default rates, discount rates, volatilities and others. |
| Level 3 - | | Prices are determined using significant unobservable inputs. In situations where quoted prices or observable inputs are unavailable (for example, when there is little or no market activity for an investment at the end of the period), unobservable inputs may be used. Unobservable inputs reflect the Adviser’s assumptions about the factors market participants would use in determining fair value of the securities or instruments and would be based on the best available information. |
The following is a summary of the tiered valuation input levels, as of October 31, 2022. The level assigned to the securities valuations may not be an indication of the risk or liquidity associated with investing in those securities. Because of the inherent uncertainties of valuation, the values reflected in the consolidated financial statements may materially differ from the value received upon actual sale of those investments.
| | |
| 18 | | Invesco Developing Markets Fund |
| | | | | | | | | | | | | | | | |
| | | Level 1 | | | Level 2 | | | Level 3 | | | Total | |
|
| |
Investments in Securities | | | | | | | | | | | | | | | | |
|
| |
Belgium | | $ | – | | | $ | 91,774,653 | | | $ | – | | | $ | 91,774,653 | |
|
| |
Brazil | | | 1,825,120,550 | | | | – | | | | – | | | | 1,825,120,550 | |
|
| |
Chile | | | – | | | | 106,957,646 | | | | – | | | | 106,957,646 | |
|
| |
China | | | 3,626,646,516 | | | | 975,059,957 | | | | 65,429,977 | | | | 4,667,136,450 | |
|
| |
France | | | – | | | | 1,225,384,506 | | | | – | | | | 1,225,384,506 | |
|
| |
Hong Kong | | | – | | | | 369,974,316 | | | | – | | | | 369,974,316 | |
|
| |
India | | | 20,021,003 | | | | 5,592,095,068 | | | | 262,978,143 | | | | 5,875,094,214 | |
|
| |
Indonesia | | | – | | | | 199,221,034 | | | | – | | | | 199,221,034 | |
|
| |
Italy | | | 56,358,677 | | | | 338,762,262 | | | | – | | | | 395,120,939 | |
|
| |
Japan | | | – | | | | 25,344,584 | | | | – | | | | 25,344,584 | |
|
| |
Mexico | | | 1,945,341,054 | | | | – | | | | – | | | | 1,945,341,054 | |
|
| |
Peru | | | 213,995,444 | | | | – | | | | – | | | | 213,995,444 | |
|
| |
Philippines | | | – | | | | 374,537,053 | | | | – | | | | 374,537,053 | |
|
| |
Russia | | | – | | | | – | | | | 40 | | | | 40 | |
|
| |
South Africa | | | – | | | | 247,961,574 | | | | – | | | | 247,961,574 | |
|
| |
South Korea | | | 22,833,686 | | | | 2,000,101,774 | | | | – | | | | 2,022,935,460 | |
|
| |
Switzerland | | | 522,126,382 | | | | – | | | | – | | | | 522,126,382 | |
|
| |
Taiwan | | | – | | | | 2,003,621,929 | | | | – | | | | 2,003,621,929 | |
|
| |
United Kingdom | | | 24,485,602 | | | | – | | | | – | | | | 24,485,602 | |
|
| |
Money Market Funds | | | 611,032,916 | | | | – | | | | – | | | | 611,032,916 | |
|
| |
Total Investments | | $ | 8,867,961,830 | | | $ | 13,550,796,356 | | | $ | 328,408,160 | | | $ | 22,747,166,346 | |
|
| |
A reconciliation of Level 3 investments is presented when the Fund had a significant amount of Level 3 investments at the beginning and/or end of the reporting period in relation to net assets.
The following is a reconciliation of the fair valuations using significant unobservable inputs (Level 3) during the year ended October 31, 2022:
| | | | | | | | | | | | | | | | | | | | | | | | | | | | | | | | |
| | | Value
10/31/21* | | | Purchases
at Cost | | | Proceeds
from Sales | | | Accrued
Discounts/
Premiums | | Realized Gain (Loss) | | | Change in
Unrealized
Appreciation
(Depreciation) | | | Transfers into Level 3* | | | Transfers
out of
Level 3* | | Value 10/31/22 | |
|
| |
Preferred Stocks | | $ | 274,854,376 | | | $ | 190,477,257 | | | $ | (142,000,717 | ) | | $– | | $ | – | | | $ | (57,776,184 | ) | | $ | – | | | $– | | $ | 265,554,732 | |
|
| |
| Common Stocks & Other Equity Interests | | | 49,999,780 | | | | 367,216,785 | | | | (496,793,614 | ) | | – | | | (45,836,186 | ) | | | (4,493,221,764 | ) | | | 4,681,488,427 | ** | | – | | | 62,853,428 | |
|
| |
Total | | $ | 324,854,156 | | | $ | 557,694,042 | | | $ | (638,794,331 | ) | | $– | | $ | (45,836,186 | ) | | $ | (4,550,997,948 | ) | | $ | 4,681,488,427 | | | $– | | $ | 328,408,160 | |
|
| |
| * | Prior year balances have been adjusted for a change in security classification. |
| ** | Amount includes $1,999,275,957 and $2,682,212,471 of Russian equity securities previously classified as Level 1 and Level 2 securities, respectively. |
Securities determined to be Level 3 at the end of the reporting period were valued primarily by utilizing evaluated prices from a third-party vendor pricing service. A significant change in third-party pricing information could result in a lower or higher value in Level 3 investments.
NOTE 4–Derivative Investments
The Fund may enter into an International Swaps and Derivatives Association Master Agreement (“ISDA Master Agreement”) under which a fund may trade OTC derivatives. An OTC transaction entered into under an ISDA Master Agreement typically involves a collateral posting arrangement, payment netting provisions and close-out netting provisions. These netting provisions allow for reduction of credit risk through netting of contractual obligations. The enforceability of the netting provisions of the ISDA Master Agreement depends on the governing law of the ISDA Master Agreement, among other factors.
For financial reporting purposes, the Fund does not offset OTC derivative assets or liabilities that are subject to ISDA Master Agreements in the Statement of Assets and Liabilities.
Effect of Derivative Investments for the year ended October 31, 2022
The table below summarizes the gains (losses) on derivative investments, detailed by primary risk exposure, recognized in earnings during the period:
| | | | |
| | | Location of Gain on
Consolidated Statement of Operations | |
| | | Currency Risk | |
|
| |
Realized Gain: | | | | |
Forward foreign currency contracts | | | $337,044 | |
|
| |
The table below summarizes the average notional value of derivatives held during the period.
| | |
| | | Forward
Foreign Currency
Contracts |
|
|
Average notional value | | $4,174,488 |
|
|
| | |
| 19 | | Invesco Developing Markets Fund |
NOTE 5–Expense Offset Arrangement(s)
The expense offset arrangement is comprised of transfer agency credits which result from balances in demand deposit accounts used by the transfer agent for clearing shareholder transactions. For the year ended October 31, 2022, the Fund received credits from this arrangement, which resulted in the reduction of the Fund’s total expenses of $9,442.
NOTE 6–Trustees’ and Officers’ Fees and Benefits
Trustees’ and Officers’ Fees and Benefits include amounts accrued by the Fund to pay remuneration to certain Trustees and Officers of the Fund. Trustees have the option to defer compensation payable by the Fund, and Trustees’ and Officers’ Fees and Benefits also include amounts accrued by the Fund to fund such deferred compensation amounts. Those Trustees who defer compensation have the option to select various Invesco Funds in which their deferral accounts shall be deemed to be invested. Finally, certain current Trustees were eligible to participate in a retirement plan that provided for benefits to be paid upon retirement to Trustees over a period of time based on the number of years of service. The Fund may have certain former Trustees who also participate in a retirement plan and receive benefits under such plan. Trustees’ and Officers’ Fees and Benefits include amounts accrued by the Fund to fund such retirement benefits. Obligations under the deferred compensation and retirement plans represent unsecured claims against the general assets of the Fund.
NOTE 7–Cash Balances
The Fund is permitted to temporarily carry a negative or overdrawn balance in its account with SSB, the custodian bank. Such balances, if any at period-end, are shown in the Consolidated Statement of Assets and Liabilities under the payable caption Amount due custodian. To compensate the custodian bank for such overdrafts, the overdrawn Fund may either (1) leave funds as a compensating balance in the account so the custodian bank can be compensated by earning the additional interest; or (2) compensate by paying the custodian bank at a rate agreed upon by the custodian bank and Invesco, not to exceed the contractually agreed upon rate. The Fund may not purchase additional securities when any borrowings from banks or broker-dealers exceed 5% of the Fund’s total assets, or when any borrowings from an Invesco Fund are outstanding.
NOTE 8–Distributions to Shareholders and Tax Components of Net Assets
Tax Character of Distributions to Shareholders Paid During the Fiscal Years Ended October 31, 2022 and 2021:
| | | | | | | | | | | | |
| | | 2022 | | | | | | 2021 | |
|
| |
Ordinary income* | | $ | 197,775,456 | | | | | | | $ | 118,532,820 | |
|
| |
Long-term capital gain | | | 2,169,516,751 | | | | | | | | – | |
|
| |
Total distributions | | $ | 2,367,292,207 | | | | | | | $ | 118,532,820 | |
|
| |
| * | Includes short-term capital gain distributions, if any. |
Tax Components of Net Assets at Period-End:
| | | | |
| | | 2022 | |
|
| |
Undistributed ordinary income | | $ | 176,772,150 | |
|
| |
Net unrealized appreciation – investments | | | 285,133,936 | |
|
| |
Net unrealized appreciation (depreciation) – foreign currencies | | | (7,977,732 | ) |
|
| |
Temporary book/tax differences | | | (1,410,778 | ) |
|
| |
Capital loss carryforward | | | (1,210,771,208 | ) |
|
| |
Shares of beneficial interest | | | 23,634,711,656 | |
|
| |
Total net assets | | $ | 22,876,458,024 | |
|
| |
The difference between book-basis and tax-basis unrealized appreciation (depreciation) is due to differences in the timing of recognition of gains and losses on investments for tax and book purposes. The Fund’s net unrealized appreciation (depreciation) difference is attributable primarily to bankrupt securities, passive foreign investment companies and wash sales.
The temporary book/tax differences are a result of timing differences between book and tax recognition of income and/or expenses. The Fund’s temporary book/tax differences are the result of the trustee deferral of compensation and retirement plan benefits.
Capital loss carryforward is calculated and reported as of a specific date. Results of transactions and other activity after that date may affect the amount of capital loss carryforward actually available for the Fund to utilize. The ability to utilize capital loss carryforward in the future may be limited under the Internal Revenue Code and related regulations based on the results of future transactions.
The Fund has a capital loss carryforward as of October 31, 2022, as follows:
| | | | | | | | | | |
| Capital Loss Carryforward* | |
|
| |
| Expiration | | Short-Term | | | Long-Term | | Total | |
|
| |
Not subject to expiration | | | $1,210,771,208 | | | $– | | | $1,210,771,208 | |
|
| |
| * | Capital loss carryforward is reduced for limitations, if any, to the extent required by the Internal Revenue Code and may be further limited depending upon a variety of factors, including the realization of net unrealized gains or losses as of the date of any reorganization. |
| | |
| 20 | | Invesco Developing Markets Fund |
NOTE 9–Investment Transactions
The aggregate amount of investment securities (other than short-term securities, U.S. Government obligations and money market funds, if any) purchased and sold by the Fund during the year ended October 31, 2022 was $9,362,117,771 and $18,651,514,161, respectively. Cost of investments, including any derivatives, on a tax basis includes the adjustments for financial reporting purposes as of the most recently completed federal income tax reporting period-end.
| | | | |
| Unrealized Appreciation (Depreciation) of Investments on a Tax Basis | |
|
| |
Aggregate unrealized appreciation of investments | | | $5,348,311,462 | |
|
| |
Aggregate unrealized (depreciation) of investments | | | (5,063,177,526 | ) |
|
| |
Net unrealized appreciation of investments | | | $285,133,936 | |
|
| |
Cost of investments for tax purposes is $22,462,032,410.
NOTE 10–Reclassification of Permanent Differences
Primarily as a result of differing book/tax treatment of distributions, foreign currency transactions and foreign capital gains taxes, on October 31, 2022, undistributed net investment income was decreased by $2,655,129 and undistributed net realized gain (loss) was increased by $2,655,129. This reclassification had no effect on the net assets or the distributable earnings (loss) of the Fund.
NOTE 11–Share Information
| | | | | | | | | | | | | | | | |
| | | Summary of Share Activity | |
|
| |
| | |
| | | Year ended | | | Year ended | |
| | | October 31, 2022(a) | | | October 31, 2021 | |
| | | Shares | | | Amount | | | Shares | | | Amount | |
|
| |
Sold: | | | | | | | | | | | | | | | | |
Class A | | | 15,975,399 | | | $ | 628,270,673 | | | | 10,429,350 | | | $ | 573,327,688 | |
|
| |
Class C | | | 109,960 | | | | 4,097,121 | | | | 141,844 | | | | 7,142,114 | |
|
| |
Class R | | | 921,028 | | | | 36,451,727 | | | | 672,573 | | | | 35,209,233 | |
|
| |
Class Y | | | 107,662,674 | | | | 4,291,619,180 | | | | 113,886,507 | | | | 6,147,223,252 | |
|
| |
Class R5 | | | 22,052 | | | | 953,261 | | | | 49,865 | | | | 2,754,655 | |
|
| |
Class R6 | | | 83,670,704 | | | | 3,385,134,926 | | | | 103,363,104 | | | | 5,626,041,796 | |
|
| |
| | | | |
Issued as reinvestment of dividends: | | | | | | | | | | | | | | | | |
Class A | | | 3,677,641 | | | | 174,320,239 | | | | - | | | | - | |
|
| |
Class C | | | 73,175 | | | | 3,147,985 | | | | - | | | | - | |
|
| |
Class R | | | 376,951 | | | | 17,041,970 | | | | - | | | | - | |
|
| |
Class Y | | | 20,494,817 | | | | 954,853,521 | | | | 783,038 | | | | 40,702,319 | |
|
| |
Class R5 | | | 10,620 | | | | 501,895 | | | | 843 | | | | 44,421 | |
|
| |
Class R6 | | | 17,923,230 | | | | 834,684,837 | | | | 1,073,932 | | | | 55,812,257 | |
|
| |
| | | | |
Automatic conversion of Class C shares to Class A shares: | | | | | | | | | | | | | | | | |
Class A | | | 212,455 | | | | 8,587,167 | | | | 3,298,037 | | | | 176,648,746 | |
|
| |
Class C | | | (234,663 | ) | | | (8,587,167 | ) | | | (3,596,045 | ) | | | (176,648,746 | ) |
|
| |
| | | | |
Reacquired: | | | | | | | | | | | | | | | | |
Class A | | | (27,234,377 | ) | | | (1,068,425,045 | ) | | | (20,323,402 | ) | | | (1,113,900,388 | ) |
|
| |
Class C | | | (342,845 | ) | | | (12,634,392 | ) | | | (445,316 | ) | | | (22,092,920 | ) |
|
| |
Class R | | | (1,707,185 | ) | | | (66,094,033 | ) | | | (2,082,922 | ) | | | (108,787,948 | ) |
|
| |
Class Y | | | (214,616,817 | ) | | | (8,172,636,280 | ) | | | (85,074,511 | ) | | | (4,588,367,233 | ) |
|
| |
Class R5 | | | (225,231 | ) | | | (9,818,375 | ) | | | (149,767 | ) | | | (8,310,699 | ) |
|
| |
Class R6 | | | (207,243,475 | ) | | | (7,998,960,919 | ) | | | (72,605,766 | ) | | | (3,916,291,451 | ) |
|
| |
Net increase (decrease) in share activity | | | (200,473,887 | ) | | $ | (6,997,491,709 | ) | | | 49,421,364 | | | $ | 2,730,507,096 | |
|
| |
| (a) | There are entities that are record owners of more than 5% of the outstanding shares of the Fund and in the aggregate own 33% of the outstanding shares of the Fund. IDI has an agreement with these entities to sell Fund shares. The Fund, Invesco and/or Invesco affiliates may make payments to these entities, which are considered to be related to the Fund, for providing services to the Fund, Invesco and/or Invesco affiliates including but not limited to services such as securities brokerage, distribution, third party record keeping and account servicing. The Fund has no knowledge as to whether all or any portion of the shares owned of record by these entities are also owned beneficially. |
| | |
| 21 | | Invesco Developing Markets Fund |
Report of Independent Registered Public Accounting Firm
To the Board of Trustees of AIM Investment Funds (Invesco Investment Funds) and Shareholders of Invesco Developing Markets Fund
Opinion on the Consolidated Financial Statements
We have audited the accompanying consolidated statement of assets and liabilities, including the consolidated schedule of investments, of Invesco Developing Markets Fund and its subsidiary (one of the funds constituting AIM Investment Funds (Invesco Investment Funds), referred to hereafter as the “Fund”) as of October 31, 2022, the related consolidated statement of operations for the year ended October 31, 2022, the consolidated statement of changes in net assets for each of the two years in the period ended October 31, 2022, including the related notes, and the consolidated financial highlights for each of the periods indicated in the table below (collectively referred to as the “consolidated financial statements”). In our opinion, the consolidated financial statements present fairly, in all material respects, the financial position of the Fund as of October 31, 2022, the results of its operations for the year then ended, the changes in its net assets for each of the two years in the period ended October 31, 2022 and the financial highlights for each of the periods indicated in the table below, in conformity with accounting principles generally accepted in the United States of America.
|
| |
Consolidated Financial Highlights |
| |
For each of the three years in the period ended October 31, 2022, the two months ended October 31, 2019, and the year ended August 31, 2019 for Class A, Class C, Class R, Class Y and Class R6. |
For each of the three years in the period ended October 31, 2022, the two months ended October 31, 2019, and the period May 24, 2019 (commencement of operations) through August 31, 2019 for Class R5. |
The consolidated financial statements of Oppenheimer Developing Markets Fund (subsequently renamed Invesco Developing Markets Fund) as of and for the year ended August 31, 2018 and the consolidated financial highlights for the year then ended (not presented herein, other than the consolidated financial highlights) were audited by other auditors whose report dated October 25, 2018 expressed an unqualified opinion on those consolidated financial statements and consolidated financial highlights.
Basis for Opinion
These consolidated financial statements are the responsibility of the Fund’s management. Our responsibility is to express an opinion on the Fund’s consolidated financial statements based on our audits. We are a public accounting firm registered with the Public Company Accounting Oversight Board (United States) (PCAOB) and are required to be independent with respect to the Fund in accordance with the U.S. federal securities laws and the applicable rules and regulations of the Securities and Exchange Commission and the PCAOB.
We conducted our audits of these consolidated financial statements in accordance with the standards of the PCAOB. Those standards require that we plan and perform the audit to obtain reasonable assurance about whether the consolidated financial statements are free of material misstatement, whether due to error or fraud.
Our audits included performing procedures to assess the risks of material misstatement of the consolidated financial statements, whether due to error or fraud, and performing procedures that respond to those risks. Such procedures included examining, on a test basis, evidence regarding the amounts and disclosures in the consolidated financial statements. Our audits also included evaluating the accounting principles used and significant estimates made by management, as well as evaluating the overall presentation of the consolidated financial statements. Our procedures included confirmation of securities owned as of October 31, 2022 by correspondence with the custodian, transfer agent, brokers, and portfolio company investees; when replies were not received from brokers or portfolio company investees, we performed other auditing procedures. We believe that our audits provide a reasonable basis for our opinion.
/s/PricewaterhouseCoopers LLP
Houston, Texas
December 27, 2022
We have served as the auditor of one or more of the investment companies in the Invesco group of investment companies since at least 1995. We have not been able to determine the specific year we began serving as auditor.
| | |
| 22 | | Invesco Developing Markets Fund |
Calculating your ongoing Fund expenses
Example
As a shareholder of the Fund, you incur two types of costs: (1) transaction costs, which may include sales charges (loads) on purchase payments or contingent deferred sales charges on redemptions, if any; and (2) ongoing costs, including management fees, distribution and/or service (12b-1) fees, and other Fund expenses. This example is intended to help you understand your ongoing costs (in dollars) of investing in the Fund and to compare these costs with ongoing costs of investing in other mutual funds. The example is based on an investment of $1,000 invested at the beginning of the period and held for the entire period May 1, 2022 through October 31, 2022.
Actual expenses
The table below provides information about actual account values and actual expenses. You may use the information in this table, together with the amount you invested, to estimate the expenses that you paid over the period. Simply divide your account value by $1,000 (for example, an $8,600 account value divided by $1,000 = 8.6), then multiply the result by the number in the table under the heading entitled “Actual Expenses Paid During Period” to estimate the expenses you paid on your account during this period.
Hypothetical example for comparison purposes
The table below also provides information about hypothetical account values and hypothetical expenses based on the Fund’s actual expense ratio and an assumed rate of return of 5% per year before expenses, which is not the Fund’s actual return.
The hypothetical account values and expenses may not be used to estimate the actual ending account balance or expenses you paid for the period. You may use this information to compare the ongoing costs of investing in the Fund and other funds. To do so, compare this 5% hypothetical example with the 5% hypothetical examples that appear in the shareholder reports of the other funds.
Please note that the expenses shown in the table are meant to highlight your ongoing costs only and do not reflect any transaction costs, such as sales charges (loads) on purchase payments or contingent deferred sales charges on redemptions, if any. Therefore, the hypothetical information is useful in comparing ongoing costs only, and will not help you determine the relative total costs of owning different funds. In addition, expenses shown in the table do not include the expenses of the underlying funds, which are borne indirectly by the Fund. If transaction costs and indirect expenses were included, your costs would have been higher.
| | | | | | | | | | | | |
| | | | | ACTUAL | | HYPOTHETICAL (5% annual return before expenses) | | |
| | | Beginning Account Value (05/01/22) | | Ending Account Value (10/31/22)1 | | Expenses Paid During Period2 | | Ending Account Value (10/31/22) | | Expenses Paid During Period2 | | Annualized Expense Ratio |
Class A | | $1,000.00 | | $848.40 | | $5.87 | | $1,018.85 | | $6.41 | | 1.26% |
Class C | | 1,000.00 | | 845.30 | | 9.35 | | 1,015.07 | | 10.21 | | 2.01 |
Class R | | 1,000.00 | | 847.50 | | 7.03 | | 1,017.59 | | 7.68 | | 1.51 |
Class Y | | 1,000.00 | | 849.50 | | 4.71 | | 1,020.11 | | 5.14 | | 1.01 |
Class R5 | | 1,000.00 | | 850.70 | | 4.94 | | 1,019.86 | | 5.40 | | 1.06 |
Class R6 | | 1,000.00 | | 850.30 | | 4.01 | | 1,020.87 | | 4.38 | | 0.86 |
| 1 | The actual ending account value is based on the actual total return of the Fund for the period May 1, 2022 through October 31, 2022, after actual expenses and will differ from the hypothetical ending account value which is based on the Fund’s expense ratio and a hypothetical annual return of 5% before expenses. |
| 2 | Expenses are equal to the Fund’s annualized expense ratio as indicated above multiplied by the average account value over the period, multiplied by 184/365 to reflect the most recent fiscal half year. |
| | |
| 23 | | Invesco Developing Markets Fund |
Approval of Investment Advisory and Sub-Advisory Contracts
At meetings held on June 13, 2022, the Board of Trustees (the Board or the Trustees) of AIM Investment Funds (Invesco Investment Funds) as a whole, and the independent Trustees, who comprise over 75% of the Board, voting separately, approved the continuance of the Invesco Developing Markets Fund’s (the Fund) Master Investment Advisory Agreement with Invesco Advisers, Inc. (Invesco Advisers and the investment advisory agreement) and the Master Intergroup Sub-Advisory Contract for Mutual Funds with Invesco Asset Management Deutschland GmbH, Invesco Asset Management Limited, Invesco Asset Management (Japan) Limited, Invesco Hong Kong Limited, Invesco Senior Secured Management, Inc. and Invesco Canada Ltd. and separate sub-advisory contracts with Invesco Capital Management LLC and Invesco Asset Management (India) Private Limited and OppenheimerFunds, Inc. (collectively, the Affiliated Sub-Advisers and the sub-advisory contracts) for another year, effective July 1, 2022. After evaluating the factors discussed below, among others, the Board approved the renewal of the Fund’s investment advisory agreement and the sub-advisory contracts and determined that the compensation payable thereunder by the Fund to Invesco Advisers and by Invesco Advisers to the Affiliated Sub-Advisers is fair and reasonable.
The Board’s Evaluation Process
The Board has established an Investments Committee, which in turn has established Sub-Committees that meet throughout the year to review the performance of funds advised by Invesco Advisers (the Invesco Funds). The Sub-Committees meet regularly with portfolio managers for their assigned Invesco Funds and other members of management to review detailed information about investment performance and portfolio attributes of these funds. The Board has established additional standing and ad hoc committees that meet regularly throughout the year to review matters within their purview. The Board took into account evaluations and reports that it received from its committees and sub-committees, as well as the information provided to the Board and its committees and sub-committees throughout the year, in considering whether to approve each Invesco Fund’s investment advisory agreement and sub-advisory contracts.
As part of the contract renewal process, the Board reviews and considers information provided in response to detailed requests for information submitted to management by the independent Trustees with assistance from legal counsel to the independent Trustees and the Senior Officer, an officer of the Invesco Funds who reports directly to the independent Trustees. The Board receives comparative investment performance and fee and expense data regarding the Invesco Funds prepared by Broadridge Financial Solutions, Inc. (Broadridge), an independent mutual fund data provider, as well as information on the composition of the peer groups provided by Broadridge and its methodology for determining peer groups. The Board also receives an independent written evaluation from the Senior Officer. The Senior Officer’s evaluation is prepared as part of his responsibility to manage the process by which the Invesco Funds’ proposed management fees are negotiated during the annual contract renewal
process to ensure they are negotiated in a manner that is at arms’ length and reasonable in accordance with certain negotiated regulatory requirements. In addition to meetings with Invesco Advisers and fund counsel throughout the year and as part of meetings convened on May 2, 2022 and June 13, 2022, the independent Trustees also discussed the continuance of the investment advisory agreement and sub-advisory contracts in separate sessions with the Senior Officer and with independent legal counsel. Also, as part of the contract renewal process, the independent Trustees reviewed and considered information provided in response to detailed follow-up requests for information submitted by the independent Trustees to management. The independent Trustees met and discussed those follow-up responses with legal counsel to the independent Trustees and the Senior Officer.
The discussion below is a summary of the Senior Officer’s independent written evaluation with respect to the Fund’s investment advisory agreement and sub-advisory contracts, as well as a discussion of the material factors and related conclusions that formed the basis for the Board’s approval of the Fund’s investment advisory agreement and sub-advisory contracts. The Trustees’ review and conclusions are based on the comprehensive consideration of all information presented to them during the course of the year and in prior years and are not the result of any single determinative factor. Moreover, one Trustee may have weighed a particular piece of information or factor differently than another Trustee. The information received and considered by the Board was current as of various dates prior to the Board’s approval on June 13, 2022.
Factors and Conclusions and Summary of Independent Written Fee Evaluation
| A. | Nature, Extent and Quality of Services Provided by Invesco Advisers and the Affiliated Sub-Advisers |
The Board reviewed the nature, extent and quality of the advisory services provided to the Fund by Invesco Advisers under the Fund’s investment advisory agreement, and the credentials and experience of the officers and employees of Invesco Advisers who provide these services, including the Fund’s portfolio manager(s). The Board’s review included consideration of Invesco Advisers’ investment process and oversight, credit analysis, and research capabilities. The Board considered information regarding Invesco Advisers’ programs for and resources devoted to risk management, including management of investment, enterprise, operational, liquidity, valuation and compliance risks, and technology used to manage such risks. The Board also received and reviewed information about Invesco Advisers’ role as administrator of the Invesco Funds’ liquidity risk management program. The Board received a description of, and reports related to, Invesco Advisers’ global security program and business continuity plans and of its approach to data privacy and cybersecurity, including related testing. The Board considered how the cybersecurity and business continuity plans of Invesco Advisers and its key service providers operated in the remote and hybrid working environment resulting from the novel coronavirus (“COVID-19”) pandemic and paved the way for a hybrid working framework in a normalized
environment as employees return to the office. The Board also considered non-advisory services that Invesco Advisers and its affiliates provide to the Invesco Funds, such as various back office support functions, third party oversight, internal audit, valuation, portfolio trading and legal and compliance. The Board observed that Invesco Advisers’ systems preparedness and ongoing investment enabled Invesco Advisers to manage, operate and oversee the Invesco Funds with minimal impact or disruption through challenging environments. The Board reviewed and considered the benefits to shareholders of investing in a Fund that is part of the family of funds under the umbrella of Invesco Ltd., Invesco Advisers’ parent company, and noted Invesco Ltd.’s depth and experience in running an investment management business, as well as its commitment of financial and other resources to such business. The Board concluded that the nature, extent and quality of the services provided to the Fund by Invesco Advisers are appropriate and satisfactory.
The Board reviewed the services that may be provided by the Affiliated Sub-Advisers under the sub-advisory contracts and the credentials and experience of the officers and employees of the Affiliated Sub-Advisers who provide these services. The Board noted the Affiliated Sub-Advisers’ expertise with respect to certain asset classes and that the Affiliated Sub-Advisers have offices and personnel that are located in financial centers around the world. As a result, the Board noted that the Affiliated Sub-Advisers can provide research and investment analysis on the markets and economies of various countries in which the Fund may invest, make recommendations regarding securities and assist with security trades. The Board concluded that the sub-advisory contracts may benefit the Fund and its shareholders by permitting Invesco Advisers to use the resources and talents of the Affiliated Sub-Advisers in managing the Fund. The Board concluded that the nature, extent and quality of the services that may be provided to the Fund by the Affiliated Sub-Advisers are appropriate and satisfactory.
| B. | Fund Investment Performance |
The Board considered Fund investment performance as a relevant factor in considering whether to approve the investment advisory agreement. The Board did not view Fund investment performance as a relevant factor in considering whether to approve the sub-advisory contracts for the Fund, as no Affiliated Sub-Adviser currently manages assets of the Fund.
The Board compared the Fund’s investment performance over multiple time periods ending December 31, 2021 to the performance of funds in the Broadridge performance universe and against the MSCI Emerging Markets Index (Index). The Board noted that performance of Class A shares of the Fund was in the fifth quintile of its performance universe for the one year period, the fourth quintile for the three year period and the third quintile for the five year period (the first quintile being the best performing funds and the fifth quintile being the worst performing funds). The Board noted that performance of Class A shares of the Fund was below the performance of the Index for the one and three year periods and reasonably comparable to the performance of the Index for the five year period. The
| | |
| 24 | | Invesco Developing Markets Fund |
Board considered that the Fund was created in connection with Invesco Ltd.’s acquisition of OppenheimerFunds, Inc. and its subsidiaries (the “Transaction”) and that the Fund’s performance prior to the closing of the Transaction on May 24, 2019 is that of its predecessor fund. The Board also considered that the Fund’s exposure to Chinese stocks and its growth investing bias negatively impacted performance. The Board recognized that the performance data reflects a snapshot in time as of a particular date and that selecting a different performance period could produce different results. The Board also reviewed more recent Fund performance as well as other performance metrics, which did not change its conclusions.
| C. | Advisory and Sub-Advisory Fees and Fund Expenses |
The Board compared the Fund’s contractual management fee rate to the contractual management fee rates of funds in the Fund’s Broadridge expense group. The Board noted that the contractual management fee rate for Class A shares of the Fund was below the median contractual management fee rate of funds in its expense group. The Board noted that the term “contractual management fee” for funds in the expense group may include both advisory and certain non-portfolio management administrative services fees, but that Broadridge is not able to provide information on a fund by fund basis as to what is included. The Board also reviewed the methodology used by Broadridge in calculating expense group information, which includes using each fund’s contractual management fee schedule (including any applicable breakpoints) as reported in the most recent prospectus or statement of additional information for each fund in the expense group. The Board also considered comparative information regarding the Fund’s total expense ratio and its various components.
The Board noted that Invesco Advisers has contractually agreed to waive fees and/or limit expenses of the Fund for the term disclosed in the Fund’s registration statement in an amount necessary to limit total annual operating expenses to a specified percentage of average daily net assets for each class of the Fund.
The Board also considered the fees charged by Invesco Advisers and its affiliates to other client accounts that are similarly managed. Invesco Advisers reviewed with the Board differences in the scope of services it provides to the Invesco Funds relative to that provided by Invesco Advisers and its affiliates to certain other types of client accounts, including, among others: management of cash flows as a result of redemptions and purchases; necessary infrastructure such as officers, office space, technology, legal and distribution; oversight of service providers; costs and business risks associated with launching new funds and sponsoring and maintaining the product line; and compliance with federal and state laws and regulations. Invesco Advisers also advised the Board that many of the similarly managed client accounts have all-inclusive fee structures, which are not easily un-bundled.
The Board also compared the Fund’s effective advisory fee rate (defined for this purpose as the advisory fee rate after advisory fee waivers and before other expense limitations/waivers) to the effective advisory fee rates of other similarly managed third-party mutual funds advised or sub-advised by Invesco Advisers and its affiliates, based on asset balances as of December 31, 2021.
The Board also considered the services that may be provided by the Affiliated Sub-Advisers pursuant to the sub-advisory contracts, as well as the fees payable by Invesco Advisers to the Affiliated Sub-Advisers pursuant to the sub-advisory contracts.
| D. | Economies of Scale and Breakpoints |
The Board considered the extent to which there may be economies of scale in the provision of advisory services to the Fund and the Invesco Funds, and the extent to which such economies of scale are shared with the Fund and the Invesco Funds. The Board considered that the Fund benefits from economies of scale through contractual breakpoints in the Fund’s advisory fee schedule, which generally operate to reduce the Fund’s expense ratio as it grows in size. The Board considered additional information from Invesco Advisers regarding the levels of the Fund’s breakpoints in light of current assets. The Board noted that the Fund also shares in economies of scale through Invesco Advisers’ ability to negotiate lower fee arrangements with third party service providers. The Board noted that the Fund may also benefit from economies of scale through initial fee setting, fee waivers and expense reimbursements, as well as Invesco Advisers’ investment in its business, including investments in business infrastructure, technology and cybersecurity.
| E. | Profitability and Financial Resources |
The Board reviewed information from Invesco Advisers concerning the costs of the advisory and other services that Invesco Advisers and its affiliates provide to the Fund and the Invesco Funds and the profitability of Invesco Advisers and its affiliates in providing these services in the aggregate and on an individual Fund-by-Fund basis. The Board considered the methodology used for calculating profitability and the periodic review and enhancement of such methodology. The Board noted that Invesco Advisers continues to operate at a net profit from services Invesco Advisers and its affiliates provide to the Invesco Funds in the aggregate and to most Funds individually. The Board did not deem the level of profits realized by Invesco Advisers and its affiliates from providing such services to be excessive, given the nature, extent and quality of the services provided. The Board noted that Invesco Advisers provided information demonstrating that Invesco Advisers is financially sound and has the resources necessary to perform its obligations under the investment advisory agreement, and provided representations indicating that the Affiliated Sub-Advisers are financially sound and have the resources necessary to perform their obligations under the sub-advisory contracts.
| F. | Collateral Benefits to Invesco Advisers and its Affiliates |
The Board considered various other benefits received by Invesco Advisers and its affiliates from the relationship with the Fund, including the fees received for providing administrative, transfer agency and distribution services to the Fund. The Board received comparative information regarding fees charged for these services, including information provided by Broadridge and other independent sources. The Board reviewed the performance of Invesco Advisers and its affiliates in providing these services and the organizational structure employed to provide these services. The Board noted that these services are provided to the Fund pursuant to written contracts that are reviewed and subject to approval on an annual basis by the
Board based on its determination that the services are required for the operation of the Fund.
The Board considered the benefits realized by Invesco Advisers and the Affiliated Sub-Advisers as a result of portfolio brokerage transactions executed through “soft dollar” arrangements. The Board noted that soft dollar arrangements may result in the Fund bearing costs to purchase research that may be used by Invesco Advisers or the Affiliated Sub-Advisers with other clients and may reduce Invesco Advisers’ or the Affiliated Sub-Advisers’ expenses. The Board also considered that it receives from Invesco Advisers periodic reports that include a representation to the effect that these arrangements are consistent with regulatory requirements. The Board did not deem the soft dollar arrangements to be inappropriate.
The Board considered that the Fund’s uninvested cash and cash collateral from any securities lending arrangements may be invested in registered money market funds or, with regard to securities lending cash collateral, unregistered funds that comply with Rule 2a-7 (collectively referred to as “affiliated money market funds”) advised by Invesco Advisers. The Board considered information regarding the returns of the affiliated money market funds relative to comparable overnight investments, as well as the fees paid by the affiliated money market funds to Invesco Advisers and its affiliates. In this regard, the Board noted that Invesco Advisers receives advisory fees from these affiliated money market funds attributable to the Fund’s investments. The Board also noted that Invesco Advisers has contractually agreed to waive through varying periods an amount equal to 100% of the net advisory fee Invesco Advisers receives from the affiliated money market funds with respect to the Fund’s investment in the affiliated money market funds of uninvested cash, but not cash collateral. The Board concluded that the advisory fees payable to Invesco Advisers from the Fund’s investment of cash collateral from any securities lending arrangements in the affiliated money market funds are for services that are not duplicative of services provided by Invesco Advisers to the Fund.
The Board considered that Invesco Advisers may serve as the Fund’s affiliated securities lending agent and evaluated the benefits realized by Invesco Advisers when serving in such role, including the compensation received. The Board considered Invesco Advisers’ securities lending platform and corporate governance structure for securities lending, including Invesco Advisers’ Securities Lending Governance Committee and its related responsibilities. The Board noted that to the extent the Fund utilizes Invesco Advisers as an affiliated securities lending agent, the Fund conducts its securities lending in accordance with, and in reliance upon, no-action letters issued by the SEC staff that provide guidance on how an affiliate may act as a direct agent lender and receive compensation for those services without obtaining exemptive relief. The Board considered information provided by Invesco Advisers related to the performance of Invesco Advisers as securities lending agent, including a summary of the securities lending services provided to the Fund by Invesco Advisers and the compensation paid to Invesco Advisers for such services, as well as any revenues generated for the Fund in connection with such securities lending activity and the allocation of such revenue between the Fund and Invesco Advisers.
| | |
| 25 | | Invesco Developing Markets Fund |
The Board also received information about commissions that an affiliated broker may receive for executing certain trades for the Fund. Invesco Advisers and the Affiliated Sub-Advisers advised the Board of the benefits to the Fund of executing trades through the affiliated broker and that such trades were executed in compliance with rules under the federal securities laws and consistent with best execution obligations.
| | |
| 26 | | Invesco Developing Markets Fund |
Tax Information
Form 1099-DIV, Form 1042-S and other year–end tax information provide shareholders with actual calendar year amounts that should be included in their tax returns. Shareholders should consult their tax advisers.
The following distribution information is being provided as required by the Internal Revenue Code or to meet a specific state’s requirement.
The Fund designates the following amounts or, if subsequently determined to be different, the maximum amount allowable for its fiscal year ended October 31, 2022:
| | | | | | | | | | | | |
Federal and State Income Tax | | | | | | | | | |
Long-Term Capital Gain Distributions | | | $2,169,516,751 | | | | | | | | | |
Qualified Dividend Income* | | | 100.00 | % | | | | | | | | |
Corporate Dividends Received Deduction* | | | 5.56 | % | | | | | | | | |
U.S. Treasury Obligations* | | | 0.00 | % | | | | | | | | |
Qualified Business Income* | | | 0.00 | % | | | | | | | | |
Business Interest Income* | | | 0.00 | % | | | | | | | | |
Foreign Taxes | | | $ 0.0940 | | | | per share | | | | | |
Foreign Source Income | | | $ 0.8211 | | | | per share | | | | | |
|
* The above percentages are based on ordinary income dividends paid to shareholders during the Fund’s fiscal year. | |
| | |
| 27 | | Invesco Developing Markets Fund |
Trustees and Officers
The address of each trustee and officer is AIM Investment Funds (Invesco Investment Funds) (the “Trust”), 11 Greenway Plaza, Suite 1000, Houston, Texas 77046-1173. The trustees serve for the life of the Trust, subject to their earlier death, incapacitation, resignation, retirement or removal as more specifically provided in the Trust’s organizational documents. Each officer serves for a one year term or until their successors are elected and qualified. Column two below includes length of time served with predecessor entities, if any.
| | | | | | | | |
Name, Year of Birth and Position(s) Held with the Trust | | Trustee and/or Officer Since | | Principal Occupation(s) During Past 5 Years | | Number of Funds in Fund Complex Overseen by Trustee | | Other Directorship(s) Held by Trustee During Past 5 Years |
| Interested Trustee | | | | | | | | |
Martin L. Flanagan1 – 1960 Trustee and Vice Chair | | 2007 | | Executive Director, Chief Executive Officer and President, Invesco Ltd. (ultimate parent of Invesco and a global investment management firm); Trustee and Vice Chair, The Invesco Funds; Vice Chair, Investment Company Institute; and Member of Executive Board, SMU Cox School of Business Formerly: Advisor to the Board, Invesco Advisers, Inc. (formerly known as Invesco Institutional (N.A.), Inc.); Chairman and Chief Executive Officer, Invesco Advisers, Inc. (registered investment adviser); Director, Chairman, Chief Executive Officer and President, Invesco Holding Company (US), Inc. (formerly IVZ Inc.) (holding company), Invesco Group Services, Inc. (service provider) and Invesco North American Holdings, Inc. (holding company); Director, Chief Executive Officer and President, Invesco Holding Company Limited (parent of Invesco and a global investment management firm); Director, Invesco Ltd.; Chairman, Investment Company Institute and President, Co-Chief Executive Officer, Co-President, Chief Operating Officer and Chief Financial Officer, Franklin Resources, Inc. (global investment management organization) | | 189 | | None |
| 1 | Mr. Flanagan is considered an interested person (within the meaning of Section 2(a)(19) of the 1940 Act) of the Trust because he is an officer of the Adviser to the Trust, and an officer and a director of Invesco Ltd., ultimate parent of the Adviser. |
| | |
| T-1 | | Invesco Developing Markets Fund |
Trustees and Officers–(continued)
| | | | | | | | |
Name, Year of Birth and Position(s) Held with the Trust | | Trustee and/or Officer Since | | Principal Occupation(s) During Past 5 Years | | Number of Funds in Fund Complex Overseen by Trustee | | Other Directorship(s) Held by Trustee During Past 5 Years |
| Independent Trustees | | | | | | | | |
Beth Ann Brown – 1968 Trustee (2019) and Chair (August 2022) | | 2019 | | Independent Consultant Formerly: Head of Intermediary Distribution, Managing Director, Strategic Relations, Managing Director, Head of National Accounts, Senior Vice President, National Account Manager and Senior Vice President, Key Account Manager, Columbia Management Investment Advisers LLC; Vice President, Key Account Manager, Liberty Funds Distributor, Inc.; and Trustee of certain Oppenheimer Funds | | 189 | | Director, Board of Directors of Caron Engineering Inc.; Advisor, Board of Advisors of Caron Engineering Inc.; President and Director, Acton Shapleigh Youth Conservation Corps (non-profit) Formerly: President and Director Director of Grahamtastic Connection (non-profit) |
Cynthia Hostetler – 1962 Trustee | | 2017 | | Non-Executive Director and Trustee of a number of public and private business corporations Formerly: Director, Aberdeen Investment Funds (4 portfolios); Director, Artio Global Investment LLC (mutual fund complex); Director, Edgen Group, Inc. (specialized energy and infrastructure products distributor); Director, Genesee & Wyoming, Inc. (railroads); Head of Investment Funds and Private Equity, Overseas Private Investment Corporation; President, First Manhattan Bancorporation, Inc.; and Attorney, Simpson Thacher & Bartlett LLP | | 189 | | Resideo Technologies, Inc. (smart home technology); Vulcan Materials Company (construction materials company); Trilinc Global Impact Fund; Textainer Group Holdings, (shipping container leasing company); Investment Company Institute (professional organization); and Independent Directors Council (professional organization) |
Eli Jones – 1961 Trustee | | 2016 | | Professor and Dean Emeritus, Mays Business School - Texas A&M University Formerly: Dean of Mays Business School-Texas A&M University; Professor and Dean, Walton College of Business, University of Arkansas and E.J. Ourso College of Business, Louisiana State University; and Director, Arvest Bank | | 189 | | Insperity, Inc. (formerly known as Administaff) (human resources provider); and Member of Regional Board of Directors and Board of Directors, First Financial Bancorp (regional bank) |
Elizabeth Krentzman – 1959 Trustee | | 2019 | | Formerly: Principal and Chief Regulatory Advisor for Asset Management Services and U.S. Mutual Fund Leader of Deloitte & Touche LLP; General Counsel of the Investment Company Institute (trade association); National Director of the Investment Management Regulatory Consulting Practice, Principal, Director and Senior Manager of Deloitte & Touche LLP; Assistant Director of the Division of Investment Management - Office of Disclosure and Investment Adviser Regulation of the U.S. Securities and Exchange Commission and various positions with the Division of Investment Management - Office of Regulatory Policy of the U.S. Securities and Exchange Commission; Associate at Ropes & Gray LLP; and Trustee of certain Oppenheimer Funds | | 189 | | Formerly: Member of the Cartica Funds Board of Directors (private investment fund); Trustee of the University of Florida National Board Foundation; and Member of the University of Florida Law Center Association, Inc. Board of Trustees, Audit Committee and Membership Committee |
Anthony J. LaCava, Jr. – 1956 Trustee | | 2019 | | Formerly: Director and Member of the Audit Committee, Blue Hills Bank (publicly traded financial institution) and Managing Partner, KPMG LLP | | 189 | | Blue Hills Bank; Chairman, Bentley University; Member, Business School Advisory Council; and Nominating Committee, KPMG LLP |
| Prema Mathai-Davis – 1950 Trustee | | 2001 | | Retired Formerly: Co-Founder & Partner of Quantalytics Research, LLC, (a FinTech Investment Research Platform for the Self-Directed Investor); Trustee of YWCA Retirement Fund; CEO of YWCA of the USA; Board member of the NY Metropolitan Transportation Authority; Commissioner of the NYC Department of Aging; and Board member of Johns Hopkins Bioethics Institute | | 189 | | Member of Board of Positive Planet US (non-profit) and HealthCare Chaplaincy Network (non-profit) |
| | |
| T-2 | | Invesco Developing Markets Fund |
Trustees and Officers–(continued)
| | | | | | | | |
Name, Year of Birth and Position(s) Held with the Trust | | Trustee and/or Officer Since | | Principal Occupation(s) During Past 5 Years | | Number of Funds in Fund Complex Overseen by Trustee | | Other Directorship(s) Held by Trustee During Past 5 Years |
| Independent Trustees–(continued) | | | | | | |
Joel W. Motley – 1952 Trustee | | 2019 | | Director of Office of Finance, Federal Home Loan Bank System; Managing Director of Carmona Motley Inc. (privately held financial advisor); Member of the Council on Foreign Relations and its Finance and Budget Committee; Chairman Emeritus of Board of Human Rights Watch and Member of its Investment Committee; and Member of Investment Committee Board of Historic Hudson Valley (non-profit cultural organization); Member of the Board, Blue Ocean Acquisition Corp.; and Member of the Vestry and the Investment Committee of Trinity Church Wall Street. Formerly: Managing Director of Public Capital Advisors, LLC (privately held financial advisor); Managing Director of Carmona Motley Hoffman, Inc. (privately held financial advisor); Trustee of certain Oppenheimer Funds; and Director of Columbia Equity Financial Corp. (privately held financial advisor) | | 189 | | Member of Board of Trust for Mutual Understanding (non-profit promoting the arts and environment); Member of Board of Greenwall Foundation (bioethics research foundation) and its Investment Committee; Member of Board of Friends of the LRC (non-profit legal advocacy); and Board Member and Investment Committee Member of Pulitzer Center for Crisis Reporting (non-profit journalism) |
Teresa M. Ressel – 1962 Trustee | | 2017 | | Non-executive director and trustee of a number of public and private business corporations Formerly: Chief Executive Officer, UBS Securities LLC (investment banking); Chief Operating Officer, UBS AG Americas (investment banking); Sr. Management Team Olayan America, The Olayan Group (international investor/commercial/industrial); Assistant Secretary for Management & Budget and Designated Chief Financial Officer, U.S. Department of Treasury and Director, ON Semiconductor Corporation (semiconductor manufacturing) | | 189 | | None |
Robert C. Troccoli – 1949 Trustee | | 2016 | | Retired Formerly: Adjunct Professor, University of Denver - Daniels College of Business; and Managing Partner, KPMG LLP | | 189 | | None |
Daniel S. Vandivort – 1954 Trustee | | 2019 | | President, Flyway Advisory Services LLC (consulting and property management) Formerly: President and Chief Investment Officer, previously Head of Fixed Income, Weiss Peck and Greer/Robeco Investment Management; Trustee and Chair, Weiss Peck and Greer Funds Board; and various capacities at CS First Boston including Head of Fixed Income at First Boston Asset Management. | | 189 | | Formerly: Trustee and Governance Chair, Oppenheimer Funds; Treasurer, Chairman of the Audit and Finance Committee, Huntington Disease Foundation of America |
| | |
| T-3 | | Invesco Developing Markets Fund |
Trustees and Officers–(continued)
| | | | | | | | |
Name, Year of Birth and Position(s) Held with the Trust | | Trustee and/or Officer Since | | Principal Occupation(s) During Past 5 Years | | Number of Funds in Fund Complex Overseen by Trustee | | Other Directorship(s) Held by Trustee During Past 5 Years |
| Officers | | | | | | | | |
Sheri Morris – 1964 President and Principal Executive Officer | | 1999 | | Director, Invesco Trust Company; Head of Global Fund Services, Invesco Ltd.; President and Principal Executive Officer, The Invesco Funds; Vice President, Invesco Exchange-Traded Fund Trust, Invesco Exchange-Traded Fund Trust II, Invesco India Exchange-Traded Fund Trust, Invesco Actively Managed Exchange-Traded Fund Trust, Invesco Actively Managed Exchange-Traded Commodity Fund Trust and Invesco Exchange-Traded Self-Indexed Fund Trust; and Vice President, OppenheimerFunds, Inc. Formerly: Vice President, Treasurer and Principal Financial Officer, The Invesco Funds; Vice President, Invesco AIM Advisers, Inc., Invesco AIM Capital Management, Inc. and Invesco AIM Private Asset Management, Inc.; Assistant Vice President and Assistant Treasurer, The Invesco Funds; Vice President and Assistant Vice President, Invesco Advisers, Inc.; Assistant Vice President, Invesco AIM Capital Management, Inc. and Invesco AIM Private Asset Management, Inc.; Treasurer, Invesco Exchange-Traded Fund Trust, Invesco Exchange-Traded Fund Trust II, Invesco India Exchange-Traded Fund Trust and Invesco Actively Managed Exchange-Traded Fund Trust; and Senior Vice President, Invesco Advisers, Inc. (formerly known as Invesco Institutional (N.A.), Inc.) (registered investment adviser) | | N/A | | N/A |
Jeffrey H. Kupor – 1968 Senior Vice President, Chief Legal Officer and Secretary | | 2018 | | Head of Legal of the Americas, Invesco Ltd.; Senior Vice President and Secretary, Invesco Advisers, Inc. (formerly known as Invesco Institutional (N.A.), Inc.) (registered investment adviser); Secretary, Invesco Distributors, Inc. (formerly known as Invesco AIM Distributors, Inc.); Vice President and Secretary, Invesco Investment Services, Inc. (formerly known as Invesco AIM Investment Services, Inc.); Senior Vice President, Chief Legal Officer and Secretary, The Invesco Funds; Secretary and General Counsel, Invesco Investment Advisers LLC (formerly known as Van Kampen Asset Management); Secretary and General Counsel, Invesco Capital Markets, Inc. (formerly known as Van Kampen Funds Inc.); Chief Legal Officer, Invesco Exchange-Traded Fund Trust, Invesco Exchange-Traded Fund Trust II, Invesco India Exchange-Traded Fund Trust, Invesco Actively Managed Exchange-Traded Fund Trust, Invesco Actively Managed Exchange-Traded Commodity Fund Trust and Invesco Exchange-Traded Self-Indexed Fund Trust;; Secretary and Vice President, Harbourview Asset Management Corporation; Secretary and Vice President, OppenheimerFunds, Inc. and Invesco Managed Accounts, LLC; Secretary and Senior Vice President, OFI Global Institutional, Inc.; Secretary and Vice President, OFI SteelPath, Inc.; Secretary and Vice President, Oppenheimer Acquisition Corp.; Secretary and Vice President, Shareholder Services, Inc.; and Secretary and Vice President, Trinity Investment Management Corporation Formerly: Senior Vice President, Invesco Distributors, Inc.; Secretary and Vice President, Jemstep, Inc.; Head of Legal, Worldwide Institutional, Invesco Ltd.; Secretary and General Counsel, INVESCO Private Capital Investments, Inc.; Senior Vice President, Secretary and General Counsel, Invesco Management Group, Inc. (formerly known as Invesco AIM Management Group, Inc.); Assistant Secretary, INVESCO Asset Management (Bermuda) Ltd.; Secretary and General Counsel, Invesco Private Capital, Inc.; Assistant Secretary and General Counsel, INVESCO Realty, Inc.; Secretary and General Counsel, Invesco Senior Secured Management, Inc.; Secretary, Sovereign G./P. Holdings Inc.; Secretary, Invesco Indexing LLC; and Secretary, W.L. Ross & Co., LLC | | N/A | | N/A |
Andrew R. Schlossberg – 1974 Senior Vice President | | 2019 | | Senior Vice President, Invesco Group Services, Inc.; Head of the Americas and Senior Managing Director, Invesco Ltd.; Director and Senior Vice President, Invesco Advisers, Inc. (formerly known as Invesco Institutional (N.A.), Inc.) (registered investment adviser); Director and Chairman, Invesco Investment Services, Inc. (formerly known as Invesco AIM Investment Services, Inc.) (registered transfer agent); Senior Vice President, The Invesco Funds; and Director, Invesco Investment Advisers LLC (formerly known as Van Kampen Asset Management) Formerly: Director, President and Chairman, Invesco Insurance Agency, Inc.; Director, Invesco UK Limited; Director and Chief Executive, Invesco Asset Management Limited and Invesco Fund Managers Limited; Assistant Vice President, The Invesco Funds; Senior Vice President, Invesco Advisers, Inc. (formerly known as Invesco Institutional (N.A.), Inc.) (registered investment adviser); Director and Chief Executive, Invesco Administration Services Limited and Invesco Global Investment Funds Limited; Director, Invesco Distributors, Inc.; Head of EMEA, Invesco Ltd.; President, Invesco Actively Managed Exchange-Traded Commodity Fund Trust, Invesco Actively Managed Exchange-Traded Fund Trust, Invesco Exchange-Traded Fund Trust, Invesco Exchange-Traded Fund Trust II and Invesco India Exchange-Traded Fund Trust; and Managing Director and Principal Executive Officer, Invesco Capital Management LLC | | N/A | | N/A |
| | |
| T-4 | | Invesco Developing Markets Fund |
Trustees and Officers–(continued)
| | | | | | | | |
Name, Year of Birth and Position(s) Held with the Trust | | Trustee and/or Officer Since | | Principal Occupation(s) During Past 5 Years | | Number of Funds in Fund Complex Overseen by Trustee | | Other Directorship(s) Held by Trustee During Past 5 Years |
| Officers–(continued) | | | | | | | | |
John M. Zerr – 1962 Senior Vice President | | 2006 | | Chief Operating Officer of the Americas; Senior Vice President, Invesco Advisers, Inc. (formerly known as Invesco Institutional (N.A.), Inc.) (registered investment adviser); Senior Vice President, Invesco Distributors, Inc. (formerly known as Invesco AIM Distributors, Inc.); Director and Vice President, Invesco Investment Services, Inc. (formerly known as Invesco AIM Investment Services, Inc.) Senior Vice President, The Invesco Funds; Managing Director, Invesco Capital Management LLC; Director, Invesco Investment Advisers LLC (formerly known as Van Kampen Asset Management); Senior Vice President, Invesco Capital Markets, Inc. (formerly known as Van Kampen Funds Inc.); Manager, Invesco Indexing LLC; Manager, Invesco Specialized Products, LLC; Member, Invesco Canada Funds Advisory Board; Director, President and Chief Executive Officer, Invesco Corporate Class Inc. (corporate mutual fund company); and Director, Chairman, President and Chief Executive Officer, Invesco Canada Ltd. (formerly known as Invesco Trimark Ltd./Invesco Trimark Ltèe) (registered investment adviser and registered transfer agent); President, Invesco, Inc.; President, Invesco Global Direct Real Estate Feeder GP Ltd.; President, Invesco IP Holdings (Canada) Ltd; President, Invesco Global Direct Real Estate GP Ltd.; President, Invesco Financial Services Ltd. / Services Financiers Invesco Ltée; and Director and Chairman, Invesco Trust Company Formerly: President, Trimark Investments Ltd/Services Financiers Invesco Ltee; Director and Senior Vice President, Invesco Insurance Agency, Inc.; Director and Senior Vice President, Invesco Management Group, Inc. (formerly known as Invesco AIM Management Group, Inc.); Secretary and General Counsel, Invesco Management Group, Inc. (formerly known as Invesco AIM Management Group, Inc.); Secretary, Invesco Investment Services, Inc. (formerly known as Invesco AIM Investment Services, Inc.); Chief Legal Officer and Secretary, The Invesco Funds; Secretary and General Counsel, Invesco Investment Advisers LLC (formerly known as Van Kampen Asset Management); Secretary and General Counsel, Invesco Capital Markets, Inc. (formerly known as Van Kampen Funds Inc.); Chief Legal Officer, Invesco Exchange-Traded Fund Trust, Invesco Exchange-Traded Fund Trust II, Invesco India Exchange-Traded Fund Trust, Invesco Actively Managed Exchange-Traded Fund Trust, Invesco Actively Managed Exchange-Traded Commodity Fund Trust and Invesco Exchange-Traded Self-Indexed Fund Trust; Secretary, Invesco Indexing LLC; Director, Secretary, General Counsel and Senior Vice President, Van Kampen Exchange Corp.; Director, Vice President and Secretary, IVZ Distributors, Inc. (formerly known as INVESCO Distributors, Inc.); Director and Vice President, INVESCO Funds Group, Inc.; Director and Vice President, Van Kampen Advisors Inc.; Director, Vice President, Secretary and General Counsel, Van Kampen Investor Services Inc.;Director and Secretary, Invesco Distributors, Inc. (formerly known as Invesco AIM Distributors, Inc.); Director, Senior Vice President, General Counsel and Secretary, Invesco AIM Advisers, Inc. and Van Kampen Investments Inc.; Director, Vice President and Secretary, Fund Management Company; Director, Senior Vice President, Secretary, General Counsel and Vice President, Invesco AIM Capital Management, Inc.; and Chief Operating Officer and General Counsel, Liberty Ridge Capital, Inc. (an investment adviser) | | N/A | | N/A |
Gregory G. McGreevey – 1962 Senior Vice President | | 2012 | | Senior Managing Director, Invesco Ltd.; Director, Chairman, President, and Chief Executive Officer, Invesco Advisers, Inc. (formerly known as Invesco Institutional (N.A.), Inc.) (registered investment adviser); Director, Invesco Mortgage Capital, Inc. and Invesco Senior Secured Management, Inc.; Senior Vice President, The Invesco Funds; President, SNW Asset Management Corporation and Invesco Managed Accounts, LLC; Chairman and Director, Invesco Private Capital, Inc.; Chairman and Director, INVESCO Private Capital Investments, Inc.; Chairman and Director, INVESCO Realty, Inc.; and Senior Vice President, Invesco Group Services, Inc. Formerly: Senior Vice President, Invesco Management Group, Inc. and Invesco Advisers, Inc.; Assistant Vice President, The Invesco Funds | | N/A | | N/A |
Adrien Deberghes – 1967 Principal Financial Officer, Treasurer and Vice President | | 2020 | | Head of the Fund Office of the CFO and Fund Administration; Vice President, Invesco Advisers, Inc.; Principal Financial Officer, Treasurer and Vice President, The Invesco Funds; Vice President, Invesco Exchange-Traded Fund Trust, Invesco Exchange-Traded Fund Trust II, Invesco India Exchange-Traded Fund Trust, Invesco Actively Managed Exchange-Traded Fund Trust, Invesco Actively Managed Exchange-Traded Commodity Fund Trust and Invesco Exchange-Traded Self-Indexed Fund Trust Formerly: Senior Vice President and Treasurer, Fidelity Investments | | N/A | | N/A |
Crissie M. Wisdom – 1969 Anti-Money Laundering Compliance Officer | | 2013 | | Anti-Money Laundering and OFAC Compliance Officer for Invesco U.S. entities including: Invesco Advisers, Inc. and its affiliates, Invesco Capital Markets, Inc., Invesco Distributors, Inc., Invesco Investment Services, Inc., The Invesco Funds, Invesco Capital Management, LLC, Invesco Trust Company; and Fraud Prevention Manager for Invesco Investment Services, Inc. | | N/A | | N/A |
| | |
| T-5 | | Invesco Developing Markets Fund |
Trustees and Officers–(continued)
| | | | | | | | |
Name, Year of Birth and Position(s) Held with the Trust | | Trustee and/or Officer Since | | Principal Occupation(s) During Past 5 Years | | Number of Funds in Fund Complex Overseen by Trustee | | Other Directorship(s) Held by Trustee During Past 5 Years |
| Officers–(continued) | | | | | | | | |
Todd F. Kuehl – 1969 Chief Compliance Officer and Senior Vice President | | 2020 | | Chief Compliance Officer, Invesco Advisers, Inc. (registered investment adviser); and Chief Compliance Officer and Senior Vice President, The Invesco Funds Formerly: Managing Director and Chief Compliance Officer, Legg Mason (Mutual Funds); Chief Compliance Officer, Legg Mason Private Portfolio Group (registered investment adviser) | | N/A | | N/A |
James Bordewick, Jr. – 1959 Senior Vice President and Senior Officer | | 2022 | | Senior Vice President and Senior Officer, The Invesco Funds; and Chief Legal Officer, KingsCrowd, Inc. (research and analytical platform for investment in private capital markets) Formerly, Chief Operating Officer and Head of Legal and Regulatory, Netcapital (private capital investment platform); Managing Director, General Counsel of asset management and Chief Compliance Officer for asset management and private banking, Bank of America Corporation; Chief Legal Officer, Columbia Funds and BofA Funds; Senior Vice President and Associate General Counsel, MFS Investment Management; Chief Legal Officer, MFS Funds; Associate, Ropes & Gray; Associate, Gaston Snow & Ely Bartlett | | N/A | | N/A |
The Statement of Additional Information of the Trust includes additional information about the Fund’s Trustees and is available upon request, without charge, by calling 1.800.959.4246. Please refer to the Fund’s Statement of Additional Information for information on the Fund’s sub-advisers.
| | | | | | |
| Office of the Fund | | Investment Adviser | | Distributor | | Auditors |
| 11 Greenway Plaza, Suite 1000 | | Invesco Advisers, Inc. | | Invesco Distributors, Inc. | | PricewaterhouseCoopers LLP |
| Houston, TX 77046-1173 | | 1555 Peachtree Street, N.E. | | 11 Greenway Plaza, Suite 1000 | | 1000 Louisiana Street, Suite 5800 |
| | Atlanta, GA 30309 | | Houston, TX 77046-1173 | | Houston, TX 77002-5021 |
| | | |
| Counsel to the Fund | | Counsel to the Independent Trustees | | Transfer Agent | | Custodian |
| Stradley Ronon Stevens & Young, LLP | | Goodwin Procter LLP | | Invesco Investment Services, Inc. | | State Street Bank and Trust Company |
| 2005 Market Street, Suite 2600 | | 901 New York Avenue, N.W. | | 11 Greenway Plaza, Suite 1000 | | 225 Franklin Street |
| Philadelphia, PA 19103-7018 | | Washington, D.C. 20001 | | Houston, TX 77046-1173 | | Boston, MA 02110-2801 |
| | |
| T-6 | | Invesco Developing Markets Fund |
(This page intentionally left blank)
(This page intentionally left blank)

Go paperless with eDelivery
Visit invesco.com/edelivery to enjoy the convenience and security of anytime electronic access to your investment documents.
With eDelivery, you can elect to have any or all of the following materials delivered straight to your inbox to download, save and print from your own computer:
∎ Fund reports and prospectuses
∎ Quarterly statements
∎ Daily confirmations
∎ Tax forms
Invesco mailing information
Send general correspondence to Invesco Investment Services, Inc., P.O. Box 219078, Kansas City, MO 64121-9078.
Important notice regarding delivery of security holder documents
To reduce Fund expenses, only one copy of most shareholder documents may be mailed to shareholders with multiple accounts at the same address (Householding). Mailing of your shareholder documents may be householded indefinitely unless you instruct us otherwise. If you do not want the mailing of these documents to be combined with those for other members of your household, please contact Invesco Investment Services, Inc. at 800 959 4246 or contact your financial institution. We will begin sending you individual copies for each account within 30 days after receiving your request.
Fund holdings and proxy voting information
The Fund provides a complete list of its portfolio holdings four times each year, at the end of each fiscal quarter. For the second and fourth quarters, the list appears, respectively, in the Fund’s semiannual and annual reports to shareholders. For the first and third quarters, the Fund files the list with the Securities and Exchange Commission (SEC) as an exhibit to its reports on Form N-PORT. The most recent list of portfolio holdings is available at invesco.com/completeqtrholdings. Shareholders can also look up the Fund’s Form N-PORT filings on the SEC website, sec.gov. The SEC file numbers for the Fund are shown below.
A description of the policies and procedures that the Fund uses to determine how to vote proxies relating to portfolio securities is available without charge, upon request, from our Client Services department at 800 959 4246, or at invesco.com/corporate/about-us/esg. The information is also available on the SEC website, sec.gov.
Information regarding how the Fund voted proxies related to its portfolio securities during the most recent 12-month period ended June 30 is available at invesco.com/proxysearch. This information is also available on the SEC website, sec.gov.
Invesco Advisers, Inc. is an investment adviser; it provides investment advisory services to individual and institutional clients and does not sell securities. Invesco Distributors, Inc. is the US distributor for Invesco Ltd.’s retail mutual funds, exchange-traded funds and institutional money market funds. Both are wholly owned, indirect subsidiaries of Invesco Ltd.
| | | | |
| SEC file number(s): 811-05426 and 033-19338 | | Invesco Distributors, Inc. | | O-DVM-AR-1 |

| | |
Annual Report to Shareholders | | October 31, 2022 |
Invesco Discovery Mid Cap Growth Fund
Nasdaq:
A: OEGAX ⬛ C: OEGCX ⬛ R: OEGNX ⬛ Y: OEGYX ⬛ R5: DMCFX ⬛ R6: OEGIX
Management’s Discussion of Fund Performance
| | | | |
| |
Performance summary | |
For the fiscal year ended October 31, 2022, Class A shares of Invesco Discovery Mid Cap Growth Fund (the Fund), at net asset value (NAV), underperformed the Russell Midcap Growth Index. | |
Your Fund’s long-term performance appears later in this report. | |
| |
Fund vs. Indexes | |
Total returns, 10/31/21 to 10/31/22, at net asset value (NAV). Performance shown does not include applicable contingent deferred sales charges (CDSC) or front-end sales charges, which would have reduced performance. | |
Class A Shares | | | -30.69 | % |
Class C Shares | | | -31.15 | |
Class R Shares | | | -30.85 | |
Class Y Shares | | | -30.50 | |
Class R5 Shares | | | -30.45 | |
Class R6 Shares | | | -30.43 | |
Russell Midcap Growth Indexq | | | -28.94 | |
| |
Source(s): ▼RIMES Technologies Corp. | | | | |
Market conditions and your Fund
The fiscal year began with continued volatility in equity markets in the fourth quarter of 2021 amid record inflation and the emergence of a new COVID-19 variant. Pandemic-related supply chain disruption and labor shortages intensified during the quarter, resulting in broadly higher input costs for companies and consumers alike. Additionally, the price of oil rose,1 causing higher gas prices for consumers, and the Consumer Price Index (CPI) reported for November 2021 increased 0.8%, resulting in a 6.8% increase over the prior 12 months, the highest since 1982.2 To combat inflation, the US Federal Reserve (the Fed) announced the potential for three or more interest rate increases in 2022. With solid corporate earnings and optimism about the COVID-19 Omicron variant reporting milder symptoms, stocks rallied at the 2021 year-end.
Equity markets declined in the first quarter of 2022 amid volatility sparked by Russia’s invasion of Ukraine, rising commodity prices, rampant global inflation and the Fed’s shift toward tighter monetary policy. Russia’s invasion exacerbated inflation pressures, disrupting already strained supply chains and increasing shortages of oil, gas and raw materials. The price of oil rose sharply, with crude prices reaching their highest price per barrel since 2008.1 Inflation continued to be a top concern for consumers, investors and the Fed. To combat inflation, the Fed raised the federal funds rate by one-quarter percentage point in March and the Fed indicated it would “taper” its asset purchase program quickly.3
As the war in Ukraine continued and corporate earnings in high-profile names like Netflix reported slowing growth and profits, the equity markets sold off for much of April 2022. The downward direction of the equity markets continued into second quarter of 2022 amid record inflation, rising interest rates and an
increasing likelihood of a US recession. Driven by higher food and energy prices, the CPI rose by yet another 40-year high to 8.6% for the twelve months ended May 2022.2 Oil prices peaked near $122 per barrel in early June, resulting in skyrocketing gasoline prices; the national average price reached a record high above $5 per gallon in early June.1 To tame inflation, the Fed raised the benchmark federal funds rate three more times, by 0.50% in May, by 0.75% in June and another 0.75% in July, which were the largest increases in nearly 30 years.3 US equity markets rose in July and August until Fed chairman Jerome Powell’s hawkish comments at an economic policy symposium held in Jackson Hole, which sparked a sharp selloff at month-end. The Fed reiterated that it would continue taking aggressive action to curb inflation, even though such measures could “bring pain to households and businesses,” and the Fed raised the benchmark federal funds rate by another 0.75% in September.3
After experiencing a sharp drop in September 2022, US equity markets rebounded in October with strong gains, despite mixed data on the economy and corporate earnings. Inflation data reported in October came in higher than expected, and the labor market remained strong, with payroll employment gains and a decline in the unemployment rate to a near record low of 3.5% in September.2 The initial estimate of third quarter real gross domestic product showed an increase of 2.6% (annualized) after falling in the prior two quarters, but the headline number masked a drop in demand and investment. Corporate earnings were generally in line with expectations, but many companies’ forward earnings guidance was weaker than expected.
In this environment, US stocks had negative double-digit returns for the fiscal year of -14.61%, as measured by the S&P 500 Index.4
During the fiscal year, stock selection within the health care and industrials sectors was the primary driver of the Fund’s underperformance versus the Russell Midcap Growth Index. This was partially offset by stronger stock selection within the consumer discretionary sector and our underweight allocation to the communication services sector.
The largest individual contributors to the Fund’s absolute performance during the fiscal year included Cheniere Energy, LPL Financial and Enphase Energy. Cheniere Energy is a US exporter of liquefied natural gas. Supplies from Russia to Europe fell due to the threat and then the onset of the Ukraine invasion, which raised prices on fuel used to heat homes and generate electricity. The price surge benefited Cheniere Energy. LPL Financial offers technology, brokerage and investment advisory services through business relationships with various types of financial advisors. The stock outperformed due to strong fourth quarter 2021 results and the opportunity to benefit from a higher federal funds rate. The company also has less credit risk than other companies, such as banks and we believe they are well positioned at this point in the economic cycle. Enphase Energy manufactures microinverter systems that convert direct current electricity from solar panels to alternating current for home use. Enphase Energy reported a strong quarter in the third quarter of 2022, beating expectations. Third-quarter guidance was well above expectations.
The largest individual detractors from the Fund’s absolute performance during the fiscal year included HubSpot, MongoDB and Generac. HubSpot provides a cloud-based customer relationship management platform. Their underperformance was due to its outside exposure to Europe. The European region has been its fastest growth market and represents 35% of sales. MongoDB, an open-source database software provider, reduced its growth expectations for the second half of 2022 because transactional volume slowed due to macro-related headwinds. We exited the position during the fiscal year. Generac, a backup power generator manufacturer, experienced supply chain disruptions along with higher input costs, which led management to slightly reduce near-term earnings guidance. We exited the position during the fiscal year.
Our long-term investment process remains the same. We seek dynamic companies with above-average, sustainable revenue and earnings growth that we believe are positioned to outperform. This includes leading firms in structurally attractive industries with committed management teams that have proven records of success.
We thank you for your continued investment in the Invesco Discovery Mid Cap Growth Fund.
1 Source: Bloomberg LP
2 Source: US Bureau of Labor Statistics
| | |
| 2 | | Invesco Discovery Mid Cap Growth Fund |
3 Source: US Federal Reserve
4 Source: Lipper Inc.
Portfolio manager(s):
Justin Livengood
Ronald Zibelli, Jr. - Lead
The views and opinions expressed in management’s discussion of Fund performance are those of Invesco Advisers, Inc. and its affiliates. These views and opinions are subject to change at any time based on factors such as market and economic conditions. These views and opinions may not be relied upon as investment advice or recommendations, or as an offer for a particular security. The information is not a complete analysis of every aspect of any market, country, industry, security or the Fund. Statements of fact are from sources considered reliable, but Invesco Advisers, Inc. makes no representation or warranty as to their completeness or accuracy. Although historical performance is no guarantee of future results, these insights may help you understand our investment management philosophy.
See important Fund and, if applicable, index disclosures later in this report.
| | |
| 3 | | Invesco Discovery Mid Cap Growth Fund |
Your Fund’s Long-Term Performance
Results of a $10,000 Investment – Oldest Share Class(es)
Fund and index data from 10/31/12
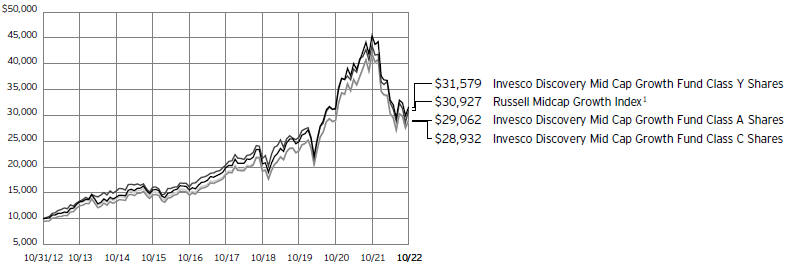
1 Source: RIMES Technologies Corp.
Past performance cannot guarantee future results.
The data shown in the chart include reinvested distributions, applicable sales charges and Fund expenses including management
fees. Index results include reinvested dividends, but they do not reflect sales charges. Performance of the peer group, if applicable, reflects fund expenses and management fees;
performance of a market index does not. Performance shown in the chart does not reflect deduction of taxes a shareholder would pay on Fund distributions or sale of Fund shares.
| | |
| 4 | | Invesco Discovery Mid Cap Growth Fund |
| | | | |
| |
Average Annual Total Returns | |
|
As of 10/31/22, including maximum applicable sales charges | |
| |
Class A Shares | | | | |
Inception (11/1/00) | | | 7.27 | % |
10 Years | | | 11.26 | |
5 Years | | | 8.18 | |
1 Year | | | -34.50 | |
| |
Class C Shares | | | | |
Inception (11/1/00) | | | 7.23 | % |
10 Years | | | 11.21 | |
5 Years | | | 8.62 | |
1 Year | | | -31.69 | |
| |
Class R Shares | | | | |
Inception (3/1/01) | | | 8.30 | % |
10 Years | | | 11.60 | |
5 Years | | | 9.14 | |
1 Year | | | -30.85 | |
| |
Class Y Shares | | | | |
Inception (11/1/00) | | | 7.99 | % |
10 Years | | | 12.19 | |
5 Years | | | 9.69 | |
1 Year | | | -30.50 | |
| |
Class R5 Shares | | | | |
10 Years | | | 12.02 | % |
5 Years | | | 9.67 | |
1 Year | | | -30.45 | |
| |
Class R6 Shares | | | | |
Inception (2/28/13) | | | 11.99 | % |
5 Years | | | 9.86 | |
1 Year | | | -30.43 | |
Effective May 24, 2019, Class A, Class C, Class R, Class Y and Class I shares of the Oppenheimer Discovery Mid Cap Growth Fund, (the predecessor fund), were reorganized into Class A, Class C, Class R, Class Y and Class R6 shares, respectively, of the Invesco Oppenheimer Discovery Mid Cap Growth Fund. Note: The Fund was subsequently renamed the Invesco Discovery Mid Cap Growth Fund (the Fund). Returns shown above, for periods ending on or prior to May 24, 2019, for Class A, Class C, Class R, Class Y and Class R6 shares are those for Class A, Class C, Class R, Class Y and Class I shares of the predecessor fund. Share class returns will differ from the predecessor fund because of different expenses.
Class R5 shares incepted on May 24, 2019. Performance shown on and prior to that date is that of the predecessor fund’s Class A shares and includes the 12b-1 fees applicable to Class A shares.
The performance data quoted represent past performance and cannot guarantee future results; current performance may be lower or higher. Please visit invesco.com/performance for the most recent month-end performance. Performance figures reflect reinvested distributions, changes in net asset value and the effect of the maximum sales charge unless otherwise stated. Performance figures do not reflect deduction
of taxes a shareholder would pay on Fund distributions or sale of Fund shares. Investment return and principal value will fluctuate so that you may have a gain or loss when you sell shares.
Class A share performance reflects the maximum 5.50% sales charge, and Class C share performance reflects the applicable contingent deferred sales charge (CDSC) for the period involved. The CDSC on Class C shares is 1% for the first year after purchase. Class R, Class Y, Class R5 and Class R6 shares do not have a front-end sales charge or a CDSC; therefore, performance is at net asset value.
The performance of the Fund’s share classes will differ primarily due to different sales charge structures and class expenses.
Fund performance reflects any applicable fee waivers and/or expense reimbursements. Had the adviser not waived fees and/or reimbursed expenses currently or in the past, returns would have been lower. See current prospectus for more information.
| | |
| 5 | | Invesco Discovery Mid Cap Growth Fund |
Supplemental Information
Invesco Discovery Mid Cap Growth Fund’s investment objective is to seek capital appreciation.
| ∎ | Unless otherwise stated, information presented in this report is as of October 31, 2022, and is based on total net assets. |
| ∎ | Unless otherwise noted, all data is provided by Invesco. |
| ∎ | To access your Fund’s reports/prospectus, visit invesco.com/fundreports. |
About indexes used in this report
| ∎ | The Russell Midcap® Growth Index is an unmanaged index considered representative of mid-cap growth stocks. The Russell Midcap Growth Index is a trademark/ service mark of the Frank Russell Co. Russell® is a trademark of the Frank Russell Co. |
| ∎ | The Fund is not managed to track the performance of any particular index, including the index(es) described here, and consequently, the performance of the Fund may deviate significantly from the performance of the index(es). |
| ∎ | A direct investment cannot be made in an index. Unless otherwise indicated, index results include reinvested dividends, and they do not reflect sales charges. Performance of the peer group, if applicable, reflects fund expenses; performance of a market index does not. |
|
|
This report must be accompanied or preceded by a currently effective Fund prospectus, which contains more complete information, including sales charges and expenses. Investors should read it carefully before investing. |
|
| NOT FDIC INSURED | MAY LOSE VALUE | NO BANK GUARANTEE |
| | |
| 6 | | Invesco Discovery Mid Cap Growth Fund |
Fund Information
Portfolio Composition
| | |
| By sector | | % of total net assets |
| |
Information Technology | | 26.98% |
| |
Health Care | | 16.62 |
| |
Industrials | | 16.45 |
| |
Consumer Discretionary | | 11.57 |
| |
Financials | | 10.02 |
| |
Energy | | 4.45 |
| |
Consumer Staples | | 3.79 |
| |
Materials | | 3.12 |
| |
Real Estate | | 2.25 |
| |
Communication Services | | 2.23 |
| |
Money Market Funds Plus Other Assets Less Liabilities | | 2.52 |
Top 10 Equity Holdings*
| | | | |
| | | | | % of total net assets |
| | |
| 1. | | Cheniere Energy, Inc. | | 2.64% |
| | |
| 2. | | Paylocity Holding Corp. | | 2.55 |
| | |
| 3. | | Waste Connections, Inc. | | 2.40 |
| | |
| 4. | | Motorola Solutions, Inc. | | 2.39 |
| | |
| 5. | | LPL Financial Holdings, Inc. | | 2.34 |
| | |
| 6. | | Arthur J. Gallagher & Co. | | 2.24 |
| | |
| 7. | | Gartner, Inc. | | 2.18 |
| | |
| 8. | | Molina Healthcare, Inc. | | 2.16 |
| | |
| 9. | | AmerisourceBergen Corp. | | 2.04 |
| | |
| 10. | | Synopsys, Inc. | | 1.87 |
The Fund’s holdings are subject to change, and there is no assurance that the Fund will continue to hold any particular security.
| * | Excluding money market fund holdings, if any. |
Data presented here are as of October 31, 2022.
| | |
| 7 | | Invesco Discovery Mid Cap Growth Fund |
Schedule of Investments(a)
October 31, 2022
| | | | | | | | |
| | | Shares | | | Value | |
|
| |
Common Stocks & Other Equity Interests–97.48% | |
Advertising–0.49% | |
Trade Desk, Inc. (The), Class A(b) | | | 513,533 | | | $ | 27,340,497 | |
|
| |
|
Aerospace & Defense–1.76% | |
Northrop Grumman Corp. | | | 178,774 | | | | 98,148,714 | |
|
| |
|
Apparel, Accessories & Luxury Goods–1.30% | |
lululemon athletica, inc.(b)(c) | | | 221,381 | | | | 72,843,204 | |
|
| |
|
Application Software–12.18% | |
Bill.com Holdings, Inc.(b) | | | 360,811 | | | | 48,117,755 | |
|
| |
Cadence Design Systems, Inc.(b) | | | 450,834 | | | | 68,251,759 | |
|
| |
HubSpot, Inc.(b)(c) | | | 80,738 | | | | 23,943,661 | |
|
| |
Manhattan Associates, Inc.(b) | | | 636,255 | | | | 77,413,146 | |
|
| |
Paycom Software, Inc.(b) | | | 128,606 | | | | 44,497,676 | |
|
| |
Paylocity Holding Corp.(b)(c) | | | 613,623 | | | | 142,231,675 | |
|
| |
Roper Technologies, Inc. | | | 219,370 | | | | 90,937,640 | |
|
| |
Synopsys, Inc.(b) | | | 356,908 | | | | 104,413,436 | |
|
| |
Tyler Technologies, Inc.(b) | | | 249,330 | | | | 80,615,869 | |
|
| |
| | | | | | | 680,422,617 | |
|
| |
|
Asset Management & Custody Banks–0.77% | |
Ameriprise Financial, Inc. | | | 138,780 | | | | 42,899,674 | |
|
| |
|
Automotive Retail–1.70% | |
O’Reilly Automotive, Inc.(b) | | | 113,183 | | | | 94,753,412 | |
|
| |
|
Biotechnology–1.86% | |
Alnylam Pharmaceuticals, Inc.(b)(c) | | | 253,343 | | | | 52,507,870 | |
|
| |
Natera, Inc.(b)(c) | | | 421,842 | | | | 19,809,700 | |
|
| |
Neurocrine Biosciences, Inc.(b) | | | 275,191 | | | | 31,679,988 | |
|
| |
| | | | | | | 103,997,558 | |
|
| |
|
Building Products–1.73% | |
Advanced Drainage Systems, Inc. | | | 328,800 | | | | 38,101,344 | |
|
| |
Carlisle Cos., Inc. | | | 244,437 | | | | 58,371,556 | |
|
| |
| | | | | | | 96,472,900 | |
|
| |
|
Communications Equipment–2.39% | |
Motorola Solutions, Inc. | | | 535,249 | | | | 133,657,028 | |
|
| |
|
Construction & Engineering–2.48% | |
Quanta Services, Inc.(c) | | | 494,791 | | | | 70,280,114 | |
|
| |
WillScot Mobile Mini Holdings
Corp.(b) | | | 1,604,220 | | | | 68,227,476 | |
|
| |
| | | | | | | 138,507,590 | |
|
| |
|
Construction Materials–0.64% | |
Vulcan Materials Co. | | | 219,210 | | | | 35,884,677 | |
|
| |
|
Data Processing & Outsourced Services–1.12% | |
ExlService Holdings, Inc.(b)(c) | | | 345,653 | | | | 62,856,998 | |
|
| |
|
Distributors–1.15% | |
Genuine Parts Co. | | | 362,736 | | | | 64,516,225 | |
|
| |
|
Electrical Components & Equipment–2.23% | |
AMETEK, Inc. | | | 519,465 | | | | 67,353,832 | |
|
| |
Hubbell, Inc. | | | 241,382 | | | | 57,323,397 | |
|
| |
| | | | | | | 124,677,229 | |
|
| |
| | | | | | | | |
| | | Shares | | | Value | |
|
| |
Environmental & Facilities Services–3.59% | |
Republic Services, Inc. | | | 502,388 | | | $ | 66,626,696 | |
|
| |
Waste Connections, Inc. | | | 1,016,611 | | | | 134,101,157 | |
|
| |
| | | | | | | 200,727,853 | |
|
| |
|
Fertilizers & Agricultural Chemicals–0.61% | |
FMC Corp. | | | 288,266 | | | | 34,274,827 | |
|
| |
|
Financial Exchanges & Data–2.92% | |
FactSet Research Systems, Inc. | | | 129,050 | | | | 54,909,485 | |
|
| |
MSCI, Inc. | | | 120,050 | | | | 56,286,643 | |
|
| |
Nasdaq, Inc. | | | 832,839 | | | | 51,835,899 | |
|
| |
| | | | | | | 163,032,027 | |
|
| |
|
Food Distributors–0.61% | |
Sysco Corp. | | | 390,692 | | | | 33,818,299 | |
|
| |
|
General Merchandise Stores–1.23% | |
Dollar General Corp. | | | 270,601 | | | | 69,016,785 | |
|
| |
|
Health Care Distributors–2.54% | |
AmerisourceBergen Corp. | | | 724,708 | | | | 113,938,592 | |
|
| |
McKesson Corp. | | | 72,486 | | | | 28,223,874 | |
|
| |
| | | | | | | 142,162,466 | |
|
| |
|
Health Care Equipment–3.10% | |
DexCom, Inc.(b) | | | 166,486 | | | | 20,108,179 | |
|
| |
IDEXX Laboratories, Inc.(b)(c) | | | 77,876 | | | | 28,010,440 | |
|
| |
Insulet Corp.(b)(c) | | | 272,511 | | | | 70,528,572 | |
|
| |
ResMed, Inc. | | | 128,657 | | | | 28,779,284 | |
|
| |
Shockwave Medical, Inc.(b) | | | 88,632 | | | | 25,982,471 | |
|
| |
| | | | | | | 173,408,946 | |
|
| |
|
Health Care Technology–0.21% | |
Doximity, Inc., Class A(b)(c) | | | 435,725 | | | | 11,533,641 | |
|
| |
|
Hotels, Resorts & Cruise Lines–1.70% | |
Hilton Worldwide Holdings, Inc. | | | 704,050 | | | | 95,229,803 | |
|
| |
|
Hypermarkets & Super Centers–1.08% | |
BJ’s Wholesale Club Holdings, Inc.(b) | | | 779,925 | | | | 60,366,195 | |
|
| |
|
Industrial Machinery–0.77% | |
Chart Industries, Inc.(b)(c) | | | 193,066 | | | | 43,030,550 | |
|
| |
|
Insurance Brokers–2.24% | |
Arthur J. Gallagher & Co. | | | 667,772 | | | | 124,926,786 | |
|
| |
|
Interactive Media & Services–0.27% | |
Pinterest, Inc., Class A(b)(c) | | | 609,096 | | | | 14,983,762 | |
|
| |
|
Investment Banking & Brokerage–2.34% | |
LPL Financial Holdings, Inc.(c) | | | 510,949 | | | | 130,624,112 | |
|
| |
|
IT Consulting & Other Services–4.47% | |
Amdocs Ltd. | | | 867,076 | | | | 74,837,329 | |
|
| |
Gartner, Inc.(b) | | | 403,913 | | | | 121,949,413 | |
|
| |
Globant S.A.(b)(c) | | | 281,878 | | | | 53,184,741 | |
|
| |
| | | | | | | 249,971,483 | |
|
| |
|
Life Sciences Tools & Services–3.66% | |
Mettler-Toledo International, Inc.(b)(c) | | | 59,017 | | | | 74,652,374 | |
|
| |
See accompanying Notes to Financial Statements which are an integral part of the financial statements.
| | |
| 8 | | Invesco Discovery Mid Cap Growth Fund |
| | | | | | | | |
| | | Shares | | | Value | |
|
| |
Life Sciences Tools & Services–(continued) | |
Repligen Corp.(b)(c) | | | 572,107 | | | $ | 104,403,806 | |
|
| |
West Pharmaceutical Services, Inc. | | | 110,569 | | | | 25,441,927 | |
|
| |
| | | | | | | 204,498,107 | |
|
| |
|
Managed Health Care–3.84% | |
Humana, Inc. | | | 167,705 | | | | 93,592,806 | |
|
| |
Molina Healthcare, Inc.(b) | | | 336,437 | | | | 120,733,782 | |
|
| |
| | | | | | | 214,326,588 | |
|
| |
|
Movies & Entertainment–1.47% | |
Liberty Media Corp.-Liberty Formula One, Class C(b)(c) | | | 688,987 | | | | 39,775,219 | |
|
| |
Live Nation Entertainment, Inc.(b) | | | 529,442 | | | | 42,148,878 | |
|
| |
| | | | | | | 81,924,097 | |
|
| |
|
Office REITs–0.53% | |
Alexandria Real Estate Equities, Inc. | | | 204,634 | | | | 29,733,320 | |
|
| |
|
Oil & Gas Exploration & Production–1.28% | |
Antero Resources Corp.(b) | | | 761,176 | | | | 27,904,712 | |
|
| |
Pioneer Natural Resources Co. | | | 169,301 | | | | 43,410,470 | |
|
| |
| | | | | | | 71,315,182 | |
|
| |
|
Oil & Gas Storage & Transportation–3.17% | |
Cheniere Energy, Inc. | | | 835,970 | | | | 147,473,468 | |
|
| |
Targa Resources Corp. | | | 437,380 | | | | 29,903,670 | |
|
| |
| | | | | | | 177,377,138 | |
|
| |
|
Packaged Foods & Meats–1.34% | |
Hershey Co. (The) | | | 314,054 | | | | 74,986,674 | |
|
| |
|
Paper Packaging–1.21% | |
Avery Dennison Corp. | | | 399,588 | | | | 67,750,145 | |
|
| |
|
Pharmaceuticals–1.41% | |
Royalty Pharma PLC, Class A(c) | | | 1,857,460 | | | | 78,607,707 | |
|
| |
|
Property & Casualty Insurance–1.01% | |
W.R. Berkley Corp. | | | 761,257 | | | | 56,622,296 | |
|
| |
|
Regional Banks–0.74% | |
East West Bancorp, Inc. | | | 577,749 | | | | 41,349,496 | |
|
| |
|
Research & Consulting Services–2.57% | |
Booz Allen Hamilton Holding
Corp.(c) | | | 518,997 | | | | 56,492,824 | |
|
| |
CoStar Group, Inc.(b) | | | 1,051,449 | | | | 86,975,861 | |
|
| |
| | | | | | | 143,468,685 | |
|
| |
|
Restaurants–1.47% | |
Chipotle Mexican Grill, Inc.(b)(c) | | | 55,005 | | | | 82,415,642 | |
|
| |
|
Semiconductor Equipment–1.25% | |
Enphase Energy, Inc.(b) | | | 226,872 | | | | 69,649,704 | |
|
| |
|
Semiconductors–2.61% | |
First Solar, Inc.(b) | | | 219,892 | | | | 32,009,678 | |
|
| |
Lattice Semiconductor Corp.(b)(c) | | | 851,628 | | | | 41,312,474 | |
|
| |
Investment Abbreviations:
REIT – Real Estate Investment Trust
| | | | | | | | |
| | | Shares | | | Value | |
|
| |
Semiconductors–(continued) | |
Monolithic Power Systems, Inc. | | | 212,970 | | | $ | 72,292,667 | |
|
| |
| | | | | | | 145,614,819 | |
|
| |
|
Soft Drinks–0.76% | |
Monster Beverage Corp.(b) | | | 453,694 | | | | 42,520,202 | |
|
| |
|
Specialized REITs–1.72% | |
Extra Space Storage, Inc. | | | 178,327 | | | | 31,642,343 | |
|
| |
SBA Communications Corp., Class A | | | 238,228 | | | | 64,297,737 | |
|
| |
| | | | | | | 95,940,080 | |
|
| |
|
Specialty Chemicals–0.66% | |
Albemarle Corp. | | | 132,812 | | | | 37,170,094 | |
|
| |
|
Specialty Stores–3.02% | |
Tractor Supply Co.(c) | | | 347,892 | | | | 76,456,225 | |
|
| |
Ulta Beauty, Inc.(b) | | | 220,399 | | | | 92,428,728 | |
|
| |
| | | | | | | 168,884,953 | |
|
| |
|
Systems Software–2.96% | |
Crowdstrike Holdings, Inc.,
Class A(b) | | | 415,340 | | | | 66,952,808 | |
|
| |
Palo Alto Networks, Inc.(b) | | | 572,762 | | | | 98,280,232 | |
|
| |
| | | | | | | 165,233,040 | |
|
| |
|
Trucking–1.32% | |
Old Dominion Freight Line, Inc.(c) | | | 269,336 | | | | 73,959,666 | |
|
| |
Total Common Stocks & Other Equity Interests
(Cost $4,923,067,296) | | | | 5,447,433,493 | |
|
| |
|
Money Market Funds–4.38% | |
Invesco Government & Agency Portfolio, Institutional
Class, 3.07%(d)(e) | | | 79,857,341 | | | | 79,857,341 | |
|
| |
Invesco Liquid Assets Portfolio, Institutional Class, 3.03%(d)(e) | | | 73,979,913 | | | | 73,994,709 | |
|
| |
Invesco Treasury Portfolio, Institutional Class, 3.08%(d)(e) | | | 91,265,533 | | | | 91,265,533 | |
|
| |
Total Money Market Funds (Cost $245,094,900) | | | | 245,117,583 | |
|
| |
TOTAL INVESTMENTS IN SECURITIES (excluding investments purchased with cash collateral from securities on loan)-101.86% (Cost $5,168,162,196) | | | | | | | 5,692,551,076 | |
|
| |
|
Investments Purchased with Cash Collateral from Securities on Loan | |
Money Market Funds–5.15% | |
Invesco Private Government Fund, 3.18%(d)(e)(f) | | | 80,573,512 | | | | 80,573,512 | |
|
| |
Invesco Private Prime Fund, 3.28%(d)(e)(f) | | | 207,131,108 | | | | 207,131,108 | |
|
| |
Total Investments Purchased with Cash Collateral from Securities on Loan (Cost $287,705,111) | | | | 287,704,620 | |
|
| |
TOTAL INVESTMENTS IN
SECURITIES–107.01%
(Cost $5,455,867,307) | | | | 5,980,255,696 | |
|
| |
OTHER ASSETS LESS LIABILITIES–(7.01)% | | | | (391,864,689 | ) |
|
| |
NET ASSETS–100.00% | | | | | | $ | 5,588,391,007 | |
|
| |
See accompanying Notes to Financial Statements which are an integral part of the financial statements.
| | |
| 9 | | Invesco Discovery Mid Cap Growth Fund |
Notes to Schedule of Investments:
| (a) | Industry and/or sector classifications used in this report are generally according to the Global Industry Classification Standard, which was developed by and is the exclusive property and a service mark of MSCI Inc. and Standard & Poor’s. |
| (b) | Non-income producing security. |
| (c) | All or a portion of this security was out on loan at October 31, 2022. |
| (d) | Affiliated issuer. The issuer and/or the Fund is a wholly-owned subsidiary of Invesco Ltd., or is affiliated by having an investment adviser that is under common control of Invesco Ltd. The table below shows the Fund’s transactions in, and earnings from, its investments in affiliates for the fiscal year ended October 31, 2022. |
| | | | | | | | | | | | | | | | | | | | | | | | | | | | |
| | | Value
October 31, 2021 | | | Purchases
at Cost | | | Proceeds
from Sales | | | Change in
Unrealized
Appreciation
(Depreciation) | | | Realized
Gain
(Loss) | | | Value
October 31, 2022 | | | Dividend Income | |
| Investments in Affiliated Money Market Funds: | | | | | | | | | | | | | | | | | | | | | | | | | | | | |
Invesco Government & Agency Portfolio, Institutional Class | | | $ 39,308,439 | | | | $ 875,877,986 | | | | $ (835,329,084) | | | | $ - | | | | $ - | | | | $ 79,857,341 | | | | $ 658,965 | |
Invesco Liquid Assets Portfolio, Institutional Class | | | 45,034,577 | | | | 625,627,133 | | | | (596,663,631 | ) | | | 22,989 | | | | (26,359 | ) | | | 73,994,709 | | | | 637,068 | |
Invesco Treasury Portfolio, Institutional Class | | | 44,923,931 | | | | 1,001,003,413 | | | | (954,661,811 | ) | | | - | | | | - | | | | 91,265,533 | | | | 718,427 | |
| Investments Purchased with Cash Collateral from Securities on Loan: | | | | | | | | | | | | | | | | | | | | | | | | | | | | |
Invesco Private Government Fund | | | 127,163,287 | | | | 1,025,918,148 | | | | (1,072,507,923 | ) | | | - | | | | - | | | | 80,573,512 | | | | 931,188 | * |
Invesco Private Prime Fund | | | 296,714,340 | | | | 2,053,389,874 | | | | (2,142,896,413 | ) | | | (494 | ) | | | (76,199 | ) | | | 207,131,108 | | | | 2,597,682 | * |
Total | | | $553,144,574 | | | | $5,581,816,554 | | | | $(5,602,058,862) | | | | $22,495 | | | | $(102,558 | ) | | | $532,822,203 | | | | $5,543,330 | |
| | * | Represents the income earned on the investment of cash collateral, which is included in securities lending income on the Statement of Operations. Does not include rebates and fees paid to lending agent or premiums received from borrowers, if any. |
| (e) | The rate shown is the 7-day SEC standardized yield as of October 31, 2022. |
| (f) | The security has been segregated to satisfy the commitment to return the cash collateral received in securities lending transactions upon the borrower’s return of the securities loaned. See Note 1I. |
See accompanying Notes to Financial Statements which are an integral part of the financial statements.
| | |
| 10 | | Invesco Discovery Mid Cap Growth Fund |
Statement of Assets and Liabilities
October 31, 2022
| | | | |
Assets: | | | | |
Investments in unaffiliated securities, at value (Cost $ 4,923,067,296)* | | $ | 5,447,433,493 | |
|
| |
Investments in affiliated money market funds, at value (Cost $ 532,800,011) | | | 532,822,203 | |
|
| |
Cash | | | 200,000 | |
|
| |
Receivable for: | | | | |
Investments sold | | | 115,601,001 | |
|
| |
Fund shares sold | | | 3,346,154 | |
|
| |
Dividends | | | 1,004,550 | |
|
| |
Investment for trustee deferred compensation and retirement plans | | | 442,092 | |
|
| |
Other assets | | | 139,614 | |
|
| |
Total assets | | | 6,100,989,107 | |
|
| |
| |
Liabilities: | | | | |
Payable for: | | | | |
Investments purchased | | | 216,231,324 | |
|
| |
Fund shares reacquired | | | 4,395,649 | |
|
| |
Collateral upon return of securities loaned | | | 287,705,111 | |
|
| |
Accrued fees to affiliates | | | 2,672,011 | |
|
| |
Accrued trustees’ and officers’ fees and benefits | | | 8,080 | |
|
| |
Accrued other operating expenses | | | 1,091,948 | |
|
| |
Trustee deferred compensation and retirement plans | | | 493,977 | |
|
| |
Total liabilities | | | 512,598,100 | |
|
| |
Net assets applicable to shares outstanding | | $ | 5,588,391,007 | |
|
| |
| |
Net assets consist of: | | | | |
Shares of beneficial interest | | $ | 5,320,859,212 | |
|
| |
Distributable earnings | | | 267,531,795 | |
|
| |
| | | $5,588,391,007 | |
|
| |
| | | | |
Net Assets: | | | | |
Class A | | $ | 3,398,898,542 | |
|
| |
Class C | | $ | 115,661,925 | |
|
| |
Class R | | $ | 124,369,662 | |
|
| |
Class Y | | $ | 668,812,166 | |
|
| |
Class R5 | | $ | 106,859,797 | |
|
| |
Class R6 | | $ | 1,173,788,915 | |
|
| |
|
Shares outstanding, no par value, with an unlimited number of shares authorized: | |
Class A | | | 158,077,643 | |
|
| |
Class C | | | 7,503,339 | |
|
| |
Class R | | | 6,460,067 | |
|
| |
Class Y | | | 26,252,240 | |
|
| |
Class R5 | | | 4,902,359 | |
|
| |
Class R6 | | | 44,966,206 | |
|
| |
Class A: | | | | |
Net asset value per share | | $ | 21.50 | |
|
| |
Maximum offering price per share | | | | |
(Net asset value of $21.50 ÷ 94.50%) | | $ | 22.75 | |
|
| |
Class C: | | | | |
Net asset value and offering price per share | | $ | 15.41 | |
|
| |
Class R: | | | | |
Net asset value and offering price per share | | $ | 19.25 | |
|
| |
Class Y: | | | | |
Net asset value and offering price per share | | $ | 25.48 | |
|
| |
Class R5: | | | | |
Net asset value and offering price per share | | $ | 21.80 | |
|
| |
Class R6: | | | | |
Net asset value and offering price per share | | $ | 26.10 | |
|
| |
| * | At October 31, 2022, securities with an aggregate value of $283,081,274 were on loan to brokers. |
See accompanying Notes to Financial Statements which are an integral part of the financial statements.
| | |
| 11 | | Invesco Discovery Mid Cap Growth Fund |
Statement of Operations
For the year ended October 31, 2022
| | | | |
Investment income: | | | | |
Dividends (net of foreign withholding taxes of $207,208) | | $ | 36,387,126 | |
|
| |
Dividends from affiliated money market funds (includes net securities lending income of $310,484) | | | 2,324,944 | |
|
| |
Total investment income | | | 38,712,070 | |
|
| |
| |
Expenses: | | | | |
Advisory fees | | | 39,217,027 | |
|
| |
Administrative services fees | | | 911,898 | |
|
| |
Custodian fees | | | 87,331 | |
|
| |
Distribution fees: | | | | |
Class A | | | 9,871,415 | |
|
| |
Class C | | | 1,451,672 | |
|
| |
Class R | | | 706,932 | |
|
| |
Transfer agent fees – A, C, R and Y | | | 7,670,614 | |
|
| |
Transfer agent fees – R5 | | | 110,702 | |
|
| |
Transfer agent fees – R6 | | | 404,738 | |
|
| |
Trustees’ and officers’ fees and benefits | | | 72,385 | |
|
| |
Registration and filing fees | | | 288,108 | |
|
| |
Reports to shareholders | | | 302,895 | |
|
| |
Professional services fees | | | 105,146 | |
|
| |
Other | | | 70,183 | |
|
| |
Total expenses | | | 61,271,046 | |
|
| |
Less: Fees waived and/or expense offset arrangement(s) | | | (180,020 | ) |
|
| |
Net expenses | | | 61,091,026 | |
|
| |
Net investment income (loss) | | | (22,378,956 | ) |
|
| |
| |
Realized and unrealized gain (loss) from: | | | | |
Net realized gain (loss) from: | | | | |
Unaffiliated investment securities | | | (233,146,203 | ) |
|
| |
Affiliated investment securities | | | (102,558 | ) |
|
| |
Foreign currencies | | | 8,837 | |
|
| |
| | | (233,239,924 | ) |
|
| |
Change in net unrealized appreciation (depreciation) of: | | | | |
Unaffiliated investment securities | | | (2,289,794,894 | ) |
|
| |
Affiliated investment securities | | | 22,495 | |
|
| |
| | | (2,289,772,399 | ) |
|
| |
Net realized and unrealized gain (loss) | | | (2,523,012,323 | ) |
|
| |
Net increase (decrease) in net assets resulting from operations | | $ | (2,545,391,279 | ) |
|
| |
See accompanying Notes to Financial Statements which are an integral part of the financial statements.
| | |
| 12 | | Invesco Discovery Mid Cap Growth Fund |
Statement of Changes in Net Assets
For the years ended October 31, 2022 and 2021
| | | | | | | | |
| | | 2022 | | | 2021 | |
|
| |
Operations: | | | | | | | | |
Net investment income (loss) | | $ | (22,378,956 | ) | | $ | (49,254,192 | ) |
|
| |
Net realized gain (loss) | | | (233,239,924 | ) | | | 1,314,390,157 | |
|
| |
Change in net unrealized appreciation (depreciation) | | | (2,289,772,399 | ) | | | 1,283,576,994 | |
|
| |
Net increase (decrease) in net assets resulting from operations | | | (2,545,391,279 | ) | | | 2,548,712,959 | |
|
| |
| | |
Distributions to shareholders from distributable earnings: | | | | | | | | |
Class A | | | (812,766,598 | ) | | | (153,166,655 | ) |
|
| |
Class C | | | (41,238,028 | ) | | | (9,752,172 | ) |
|
| |
Class R | | | (30,829,170 | ) | | | (5,423,628 | ) |
|
| |
Class Y | | | (130,957,329 | ) | | | (19,511,808 | ) |
|
| |
Class R5 | | | (23,402,647 | ) | | | (4,362,913 | ) |
|
| |
Class R6 | | | (207,455,097 | ) | | | (32,063,012 | ) |
|
| |
Total distributions from distributable earnings | | | (1,246,648,869 | ) | | | (224,280,188 | ) |
|
| |
| | |
Share transactions–net: | | | | | | | | |
Class A | | | 514,718,145 | | | | (8,259,876 | ) |
|
| |
Class C | | | 11,920,207 | | | | (47,381,579 | ) |
|
| |
Class R | | | 29,406,569 | | | | 11,738,676 | |
|
| |
Class Y | | | 127,483,890 | | | | 181,629,615 | |
|
| |
Class R5 | | | 22,515,201 | | | | 999,051 | |
|
| |
Class R6 | | | 311,123,821 | | | | 248,383,514 | |
|
| |
Net increase in net assets resulting from share transactions | | | 1,017,167,833 | | | | 387,109,401 | |
|
| |
Net increase (decrease) in net assets | | | (2,774,872,315 | ) | | | 2,711,542,172 | |
|
| |
| | |
Net assets: | | | | | | | | |
Beginning of year | | | 8,363,263,322 | | | | 5,651,721,150 | |
|
| |
End of year | | $ | 5,588,391,007 | | | $ | 8,363,263,322 | |
|
| |
See accompanying Notes to Financial Statements which are an integral part of the financial statements.
| | |
| 13 | | Invesco Discovery Mid Cap Growth Fund |
Financial Highlights
The following schedule presents financial highlights for a share of the Fund outstanding throughout the periods indicated.
| | | | | | | | | | | | | | | | | | | | | | | | | | | | | | | | | | | | | | | | | | | | | | | | | | | | | | | | | | | | |
| | | Net asset
value,
beginning
of period | | Net
investment
income
(loss)(a) | | Net gains
(losses)
on securities
(both
realized and
unrealized) | | Total from
investment
operations | | Distributions
from net
realized
gains | | Net asset
value, end
of period | | Total
return (b) | | Net assets,
end of period
(000’s omitted) | | Ratio of
expenses
to average
net assets
with fee waivers
and/or
expenses
absorbed | | Ratio of
expenses
to average net
assets without
fee waivers
and/or
expenses
absorbed(c) | | Ratio of net
investment
income
(loss)
to average
net assets | | Portfolio
turnover (d) |
Class A | | | | | | | | | | | | | | | | | | | | | | | | | | | | | | | | | | | | | | | | | | | | | | | | | | | | | | | | | | | | |
Year ended 10/31/22 | | | | $37.13 | | | | | $(0.11 | ) | | | | $ (9.79 | ) | | | | $ (9.90 | ) | | | | $(5.73 | ) | | | | $21.50 | | | | | (30.69 | )% | | | | $3,398,899 | | | | | 1.04 | % | | | | 1.04 | % | | | | (0.44 | )% | | | | 94 | % |
Year ended 10/31/21 | | | | 26.65 | | | | | (0.25 | ) | | | | 11.81 | | | | | 11.56 | | | | | (1.08 | ) | | | | 37.13 | | | | | 44.48 | | | | | 5,288,400 | | | | | 1.03 | | | | | 1.03 | | | | | (0.76 | ) | | | | 92 | |
Year ended 10/31/20 | | | | 22.17 | | | | | (0.13 | ) | | | | 5.60 | | | | | 5.47 | | | | | (0.99 | ) | | | | 26.65 | | | | | 25.60 | (e) | | | | 3,787,636 | | | | | 1.05 | (e) | | | | 1.05 | (e) | | | | (0.54 | )(e) | | | | 131 | |
Year ended 10/31/19 | | | | 20.28 | | | | | (0.08 | ) | | | | 3.75 | | | | | 3.67 | | | | | (1.78 | ) | | | | 22.17 | | | | | 20.43 | | | | | 748,190 | | | | | 1.11 | | | | | 1.11 | | | | | (0.37 | ) | | | | 84 | |
Year ended 10/31/18 | | | | 21.45 | | | | | (0.12 | ) | | | | 0.81 | | | | | 0.69 | | | | | (1.86 | ) | | | | 20.28 | | | | | 3.52 | | | | | 604,414 | | | | | 1.11 | | | | | 1.11 | | | | | (0.55 | ) | | | | 108 | |
Class C | | | | | | | | | | | | | | | | | | | | | | | | | | | | | | | | | | | | | | | | | | | | | | | | | | | | | | | | | | | | |
Year ended 10/31/22 | | | | 28.52 | | | | | (0.21 | ) | | | | (7.17 | ) | | | | (7.38 | ) | | | | (5.73 | ) | | | | 15.41 | | | | | (31.22 | )(e) | | | | 115,662 | | | | | 1.78 | (e) | | | | 1.78 | (e) | | | | (1.18 | )(e) | | | | 94 | |
Year ended 10/31/21 | | | | 20.83 | | | | | (0.36 | ) | | | | 9.13 | | | | | 8.77 | | | | | (1.08 | ) | | | | 28.52 | | | | | 43.47 | (e) | | | | 206,799 | | | | | 1.73 | (e) | | | | 1.73 | (e) | | | | (1.46 | )(e) | | | | 92 | |
Year ended 10/31/20 | | | | 17.65 | | | | | (0.24 | ) | | | | 4.41 | | | | | 4.17 | | | | | (0.99 | ) | | | | 20.83 | | | | | 24.74 | | | | | 190,420 | | | | | 1.82 | | | | | 1.82 | | | | | (1.31 | ) | | | | 131 | |
Year ended 10/31/19 | | | | 16.65 | | | | | (0.18 | ) | | | | 2.96 | | | | | 2.78 | | | | | (1.78 | ) | | | | 17.65 | | | | | 19.43 | | | | | 138,705 | | | | | 1.87 | | | | | 1.87 | | | | | (1.12 | ) | | | | 84 | |
Year ended 10/31/18 | | | | 18.06 | | | | | (0.23 | ) | | | | 0.68 | | | | | 0.45 | | | | | (1.86 | ) | | | | 16.65 | | | | | 2.79 | | | | | 153,263 | | | | | 1.86 | | | | | 1.86 | | | | | (1.30 | ) | | | | 108 | |
Class R | | | | | | | | | | | | | | | | | | | | | | | | | | | | | | | | | | | | | | | | | | | | | | | | | | | | | | | | | | | | |
Year ended 10/31/22 | | | | 33.95 | | | | | (0.15 | ) | | | | (8.82 | ) | | | | (8.97 | ) | | | | (5.73 | ) | | | | 19.25 | | | | | (30.85 | ) | | | | 124,370 | | | | | 1.29 | | | | | 1.29 | | | | | (0.69 | ) | | | | 94 | |
Year ended 10/31/21 | | | | 24.51 | | | | | (0.30 | ) | | | | 10.82 | | | | | 10.52 | | | | | (1.08 | ) | | | | 33.95 | | | | | 44.11 | | | | | 181,872 | | | | | 1.28 | | | | | 1.28 | | | | | (1.01 | ) | | | | 92 | |
Year ended 10/31/20 | | | | 20.51 | | | | | (0.18 | ) | | | | 5.17 | | | | | 4.99 | | | | | (0.99 | ) | | | | 24.51 | | | | | 25.31 | | | | | 121,009 | | | | | 1.32 | | | | | 1.32 | | | | | (0.81 | ) | | | | 131 | |
Year ended 10/31/19 | | | | 18.95 | | | | | (0.12 | ) | | | | 3.46 | | | | | 3.34 | | | | | (1.78 | ) | | | | 20.51 | | | | | 20.09 | | | | | 75,342 | | | | | 1.37 | | | | | 1.37 | | | | | (0.62 | ) | | | | 84 | |
Year ended 10/31/18 | | | | 20.21 | | | | | (0.16 | ) | | | | 0.76 | | | | | 0.60 | | | | | (1.86 | ) | | | | 18.95 | | | | | 3.27 | | | | | 63,189 | | | | | 1.36 | | | | | 1.36 | | | | | (0.80 | ) | | | | 108 | |
Class Y | | | | | | | | | | | | | | | | | | | | | | | | | | | | | | | | | | | | | | | | | | | | | | | | | | | | | | | | | | | | |
Year ended 10/31/22 | | | | 42.77 | | | | | (0.05 | ) | | | | (11.51 | ) | | | | (11.56 | ) | | | | (5.73 | ) | | | | 25.48 | | | | | (30.50 | ) | | | | 668,812 | | | | | 0.79 | | | | | 0.79 | | | | | (0.19 | ) | | | | 94 | |
Year ended 10/31/21 | | | | 30.48 | | | | | (0.19 | ) | | | | 13.56 | | | | | 13.37 | | | | | (1.08 | ) | | | | 42.77 | | | | | 44.84 | | | | | 971,407 | | | | | 0.78 | | | | | 0.78 | | | | | (0.51 | ) | | | | 92 | |
Year ended 10/31/20 | | | | 25.15 | | | | | (0.08 | ) | | | | 6.40 | | | | | 6.32 | | | | | (0.99 | ) | | | | 30.48 | | | | | 25.95 | | | | | 538,205 | | | | | 0.82 | | | | | 0.82 | | | | | (0.31 | ) | | | | 131 | |
Year ended 10/31/19 | | | | 22.71 | | | | | (0.03 | ) | | | | 4.25 | | | | | 4.22 | | | | | (1.78 | ) | | | | 25.15 | | | | | 20.68 | | | | | 253,901 | | | | | 0.87 | | | | | 0.87 | | | | | (0.13 | ) | | | | 84 | |
Year ended 10/31/18 | | | | 23.74 | | | | | (0.07 | ) | | | | 0.90 | | | | | 0.83 | | | | | (1.86 | ) | | | | 22.71 | | | | | 3.79 | | | | | 243,035 | | | | | 0.87 | | | | | 0.87 | | | | | (0.31 | ) | | | | 108 | |
Class R5 | | | | | | | | | | | | | | | | | | | | | | | | | | | | | | | | | | | | | | | | | | | | | | | | | | | | | | | | | | | | |
Year ended 10/31/22 | | | | 37.45 | | | | | (0.03 | ) | | | | (9.89 | ) | | | | (9.92 | ) | | | | (5.73 | ) | | | | 21.80 | | | | | (30.45 | ) | | | | 106,860 | | | | | 0.73 | | | | | 0.73 | | | | | (0.13 | ) | | | | 94 | |
Year ended 10/31/21 | | | | 26.80 | | | | | (0.15 | ) | | | | 11.88 | | | | | 11.73 | | | | | (1.08 | ) | | | | 37.45 | | | | | 44.88 | | | | | 155,263 | | | | | 0.72 | | | | | 0.72 | | | | | (0.45 | ) | | | | 92 | |
Year ended 10/31/20 | | | | 22.20 | | | | | (0.05 | ) | | | | 5.64 | | | | | 5.59 | | | | | (0.99 | ) | | | | 26.80 | | | | | 26.12 | | | | | 110,206 | | | | | 0.71 | | | | | 0.71 | | | | | (0.20 | ) | | | | 131 | |
Period ended 10/31/19(f) | | | | 20.60 | | | | | 0.00 | | | | | 1.60 | | | | | 1.60 | | | | | - | | | | | 22.20 | | | | | 7.77 | | | | | 11 | | | | | 0.75 | (g) | | | | 0.75 | (g) | | | | (0.01 | )(g) | | | | 84 | |
Class R6 | | | | | | | | | | | | | | | | | | | | | | | | | | | | | | | | | | | | | | | | | | | | | | | | | | | | | | | | | | | | |
Year ended 10/31/22 | | | | 43.62 | | | | | (0.02 | ) | | | | (11.77 | ) | | | | (11.79 | ) | | | | (5.73 | ) | | | | 26.10 | | | | | (30.43 | ) | | | | 1,173,789 | | | | | 0.67 | | | | | 0.67 | | | | | (0.07 | ) | | | | 94 | |
Year ended 10/31/21 | | | | 31.03 | | | | | (0.14 | ) | | | | 13.81 | | | | | 13.67 | | | | | (1.08 | ) | | | | 43.62 | | | | | 45.02 | | | | | 1,559,522 | | | | | 0.65 | | | | | 0.65 | | | | | (0.38 | ) | | | | 92 | |
Year ended 10/31/20 | | | | 25.55 | | | | | (0.04 | ) | | | | 6.51 | | | | | 6.47 | | | | | (0.99 | ) | | | | 31.03 | | | | | 26.14 | | | | | 904,245 | | | | | 0.65 | | | | | 0.65 | | | | | (0.14 | ) | | | | 131 | |
Year ended 10/31/19 | | | | 23.00 | | | | | 0.01 | | | | | 4.32 | | | | | 4.33 | | | | | (1.78 | ) | | | | 25.55 | | | | | 20.92 | | | | | 345,282 | | | | | 0.69 | | | | | 0.69 | | | | | 0.05 | | | | | 84 | |
Year ended 10/31/18 | | | | 23.98 | | | | | (0.03 | ) | | | | 0.91 | | | | | 0.88 | | | | | (1.86 | ) | | | | 23.00 | | | | | 3.97 | | | | | 199,881 | | | | | 0.70 | | | | | 0.70 | | | | | (0.14 | ) | | | | 108 | |
| (a) | Calculated using average shares outstanding. |
| (b) | Includes adjustments in accordance with accounting principles generally accepted in the United States of America and as such, the net asset value for financial reporting purposes and the returns based upon those net asset values may differ from the net asset value and returns for shareholder transactions. Does not include sales charges and is not annualized for periods less than one year, if applicable. |
| (c) | Does not include indirect expenses from affiliated fund fees and expenses of 0.00% for the years ended October 31, 2019 and 2018, respectively. |
| (d) | Portfolio turnover is calculated at the fund level and is not annualized for periods less than one year, if applicable. For the year ended October 31, 2020, the portfolio turnover calculation excludes the value of securities purchased of $2,263,197,717 in connection with the acquisition of Invesco Mid Cap Growth Fund into the Fund. |
| (e) | The total return, ratio of expenses to average net assets and ratio of net investment income (loss) to average net assets reflect actual 12b-1 fees of 0.99% and 0.95% for Class C for the years ended October 31, 2022 and October 31, 2021 and 0.23% for Class A the year ended October 31, 2020. |
| (f) | Commencement date after the close of business on May 24, 2019. |
See accompanying Notes to Financial Statements which are an integral part of the financial statements.
| | |
| 14 | | Invesco Discovery Mid Cap Growth Fund |
Notes to Financial Statements
October 31, 2022
NOTE 1–Significant Accounting Policies
Invesco Discovery Mid Cap Growth Fund (the “Fund”) is a series portfolio of AIM Investment Funds (Invesco Investment Funds) (the “Trust”). The Trust is organized as a Delaware statutory trust and is registered under the Investment Company Act of 1940, as amended (the “1940 Act”), as an open-end series management investment company authorized to issue an unlimited number of shares of beneficial interest. Information presented in these financial statements pertains only to the Fund. Matters affecting the Fund or each class will be voted on exclusively by the shareholders of the Fund or each class.
The Fund’s investment objective is to seek capital appreciation.
The Fund currently consists of six different classes of shares: Class A, Class C, Class R, Class Y, Class R5 and Class R6. Class Y shares are available only to certain investors. Class A shares are sold with a front-end sales charge unless certain waiver criteria are met. Under certain circumstances, load waived shares may be subject to contingent deferred sales charges (“CDSC”). Class C shares are sold with a CDSC. Class R, Class Y, Class R5 and Class R6 shares are sold at net asset value. Class C shares held for eight years after purchase are eligible for automatic conversion into Class A shares of the same Fund (the “Conversion Feature”). The automatic conversion pursuant to the Conversion Feature will generally occur at the end of the month following the eighth anniversary after a purchase of Class C shares.
The Fund is an investment company and accordingly follows the investment company accounting and reporting guidance in accordance with Financial Accounting Standards Board Accounting Standards Codification Topic 946, Financial Services - Investment Companies.
The following is a summary of the significant accounting policies followed by the Fund in the preparation of its financial statements.
| A. | Security Valuations – Securities, including restricted securities, are valued according to the following policy. |
A security listed or traded on an exchange is generally valued at its trade price or official closing price that day as of the close of the exchange where the security is principally traded, or lacking any trades or official closing price on a particular day, the security may be valued at the closing bid price on that day. Securities traded in the over-the-counter market are valued based on prices furnished by independent pricing services or market makers. When such securities are valued using prices provided by an independent pricing service they may be considered fair valued. Futures contracts are valued at the daily settlement price set by an exchange on which they are principally traded. U.S. exchange-traded options are valued at the mean between the last bid and asked prices from the exchange on which they are principally traded. Non-U.S. exchange-traded options are valued at the final settlement price set by the exchange on which they trade. Options not listed on an exchange and swaps generally are valued using pricing provided from independent pricing services.
Securities of investment companies that are not exchange-traded (e.g., open-end mutual funds) are valued using such company’s end-of-business-day net asset value per share.
Deposits, other obligations of U.S. and non-U.S. banks and financial institutions are valued at their daily account value.
Fixed income securities (including convertible debt securities) generally are valued on the basis of prices provided by independent pricing services. Prices provided by the pricing service may be determined without exclusive reliance on quoted prices, and may reflect appropriate factors such as institution-size trading in similar groups of securities, developments related to specific securities, dividend rate (for unlisted equities), yield (for debt obligations), quality, type of issue, coupon rate (for debt obligations), maturity (for debt obligations), individual trading characteristics and other market data. Pricing services generally value debt obligations assuming orderly transactions of institutional round lot size, but a fund may hold or transact in the same securities in smaller, odd lot sizes. Odd lots often trade at lower prices than institutional round lots, and their value may be adjusted accordingly. Debt obligations are subject to interest rate and credit risks. In addition, all debt obligations involve some risk of default with respect to interest and/or principal payments.
Foreign securities’ (including foreign exchange contracts) prices are converted into U.S. dollar amounts using the applicable exchange rates as of the close of the New York Stock Exchange (“NYSE”). If market quotations are available and reliable for foreign exchange-traded equity securities, the securities will be valued at the market quotations. Invesco Advisers, Inc. (the “Adviser” or “Invesco”) may use various pricing services to obtain market quotations as well as fair value prices. Because trading hours for certain foreign securities end before the close of the NYSE, closing market quotations may become not representative of market value in the Adviser’s judgment (“unreliable”). If, between the time trading ends on a particular security and the close of the customary trading session on the NYSE, a significant event occurs that makes the closing price of the security unreliable, the Adviser may fair value the security. If the event is likely to have affected the closing price of the security, the security will be valued at fair value in good faith in accordance with Board- approved policies and related Adviser procedures (“Valuation Procedures”). Adjustments to closing prices to reflect fair value may also be based on a screening process of an independent pricing service to indicate the degree of certainty, based on historical data, that the closing price in the principal market where a foreign security trades is not the current value as of the close of the NYSE. Foreign securities’ prices meeting the degree of certainty that the price is not reflective of current value will be priced at the indication of fair value from the independent pricing service. Multiple factors may be considered by the independent pricing service in determining adjustments to reflect fair value and may include information relating to sector indices, American Depositary Receipts and domestic and foreign index futures. Foreign securities may have additional risks including exchange rate changes, potential for sharply devalued currencies and high inflation, political and economic upheaval, the relative lack of issuer information, relatively low market liquidity and the potential lack of strict financial and accounting controls and standards.
Unlisted securities will be valued using prices provided by independent pricing services or by another method that the Adviser, in its judgment, believes better reflects the security’s fair value in accordance with the Valuation Procedures.
Securities for which market prices are not provided by any of the above methods may be valued based upon quotes furnished by independent sources. The last bid price may be used to value equity securities. The mean between the last bid and asked prices may be used to value debt obligations, including corporate loans.
Securities for which market quotations are not readily available are fair valued by the Adviser in accordance with the Valuation Procedures. If a fair value price provided by a pricing service is unreliable, the Adviser will fair value the security using the Valuation Procedures. Issuer specific events, market trends, bid/asked quotes of brokers and information providers and other market data may be reviewed in the course of making a good faith determination of a security’s fair value.
The Fund may invest in securities that are subject to interest rate risk, meaning the risk that the prices will generally fall as interest rates rise and, conversely, the prices will generally rise as interest rates fall. Specific securities differ in their sensitivity to changes in interest rates depending on their individual characteristics. Changes in interest rates may result in increased market volatility, which may affect the value and/or liquidity of certain Fund investments.
Valuations change in response to many factors including the historical and prospective earnings of the issuer, the value of the issuer’s assets, general market conditions which are not specifically related to the particular issuer, such as real or perceived adverse economic conditions, changes in the general outlook for revenues or corporate earnings, changes in interest or currency rates, regional or global instability, natural or environmental disasters, widespread disease or other public health issues, war, acts of terrorism, significant governmental actions or adverse investor sentiment generally and market liquidity. Because of the inherent uncertainties of valuation, the values reflected in the financial statements may materially differ from the value received upon actual sale of those investments.
The price the Fund could receive upon the sale of any investment may differ from the Adviser’s valuation of the investment, particularly for securities that are valued using a fair valuation technique. When fair valuation techniques are applied, the Adviser uses available information, including both observable and unobservable inputs and assumptions, to determine a methodology that will result in a valuation that the Adviser believes approximates market value. Fund securities that are fair valued may be subject to greater fluctuation in their value from one day to the next than would be the case if market quotations were used. Because of the inherent uncertainties of valuation, and the degree of subjectivity in such decisions, the Fund could realize a greater or lesser than expected gain or loss upon the sale of the investment.
| | |
| 15 | | Invesco Discovery Mid Cap Growth Fund |
| B. | Securities Transactions and Investment Income – Securities transactions are accounted for on a trade date basis. Realized gains or losses on sales are computed on the basis of specific identification of the securities sold. Interest income (net of withholding tax, if any) is recorded on an accrual basis from settlement date and includes coupon interest and amortization of premium and accretion of discount on debt securities as applicable. Dividend income (net of withholding tax, if any) is recorded on the ex-dividend date. |
The Fund may periodically participate in litigation related to Fund investments. As such, the Fund may receive proceeds from litigation settlements. Any proceeds received are included in the Statement of Operations as realized gain (loss) for investments no longer held and as unrealized gain (loss) for investments still held.
Brokerage commissions and mark ups are considered transaction costs and are recorded as an increase to the cost basis of securities purchased and/or a reduction of proceeds on a sale of securities. Such transaction costs are included in the determination of net realized and unrealized gain (loss) from investment securities reported in the Statement of Operations and the Statement of Changes in Net Assets and the net realized and unrealized gains (losses) on securities per share in the Financial Highlights. Transaction costs are included in the calculation of the Fund’s net asset value and, accordingly, they reduce the Fund’s total returns. These transaction costs are not considered operating expenses and are not reflected in net investment income reported in the Statement of Operations and the Statement of Changes in Net Assets, or the net investment income per share and the ratios of expenses and net investment income reported in the Financial Highlights, nor are they limited by any expense limitation arrangements between the Fund and the investment adviser.
The Fund allocates income and realized and unrealized capital gains and losses to a class based on the relative net assets of each class.
| C. | Country Determination – For the purposes of making investment selection decisions and presentation in the Schedule of Investments, the investment adviser may determine the country in which an issuer is located and/or credit risk exposure based on various factors. These factors include the laws of the country under which the issuer is organized, where the issuer maintains a principal office, the country in which the issuer derives 50% or more of its total revenues, the country that has the primary market for the issuer’s securities and its “country of risk” as determined by a third party service provider, as well as other criteria. Among the other criteria that may be evaluated for making this determination are the country in which the issuer maintains 50% or more of its assets, the type of security, financial guarantees and enhancements, the nature of the collateral and the sponsor organization. Country of issuer and/or credit risk exposure has been determined to be the United States of America, unless otherwise noted. |
| D. | Distributions – Distributions from net investment income and net realized capital gain, if any, are generally declared and paid annually and recorded on the ex-dividend date. The Fund may elect to treat a portion of the proceeds from redemptions as distributions for federal income tax purposes. |
| E. | Federal Income Taxes – The Fund intends to comply with the requirements of Subchapter M of the Internal Revenue Code of 1986, as amended (the “Internal Revenue Code”), necessary to qualify as a regulated investment company and to distribute substantially all of the Fund’s taxable earnings to shareholders. As such, the Fund will not be subject to federal income taxes on otherwise taxable income (including net realized capital gain) that is distributed to shareholders. Therefore, no provision for federal income taxes is recorded in the financial statements. |
The Fund recognizes the tax benefits of uncertain tax positions only when the position is more likely than not to be sustained. Management has analyzed the Fund’s uncertain tax positions and concluded that no liability for unrecognized tax benefits should be recorded related to uncertain tax positions. Management is not aware of any tax positions for which it is reasonably possible that the total amounts of unrecognized tax benefits will change materially in the next 12 months.
The Fund files tax returns in the U.S. Federal jurisdiction and certain other jurisdictions. Generally, the Fund is subject to examinations by such taxing authorities for up to three years after the filing of the return for the tax period.
| F. | Expenses – Fees provided for under the Rule 12b-1 plan of a particular class of the Fund are charged to the operations of such class. Transfer agency fees and expenses and other shareholder recordkeeping fees and expenses attributable to Class R5 and Class R6 are allocated based on relative net assets of Class R5 and Class R6. Sub-accounting fees attributable to Class R5 are charged to the operations of the class. Transfer agency fees and expenses and other shareholder recordkeeping fees and expenses relating to all other classes are allocated among those classes based on relative net assets. All other expenses are allocated among the classes based on relative net assets. |
| G. | Accounting Estimates – The preparation of financial statements in conformity with accounting principles generally accepted in the United States of America (“GAAP”) requires management to make estimates and assumptions that affect the reported amounts of assets and liabilities at the date of the financial statements and the reported amounts of revenues and expenses during the reporting period including estimates and assumptions related to taxation. Actual results could differ from those estimates by a significant amount. In addition, the Fund monitors for material events or transactions that may occur or become known after the period-end date and before the date the financial statements are released to print. |
| H. | Indemnifications – Under the Trust’s organizational documents, each Trustee, officer, employee or other agent of the Trust is indemnified against certain liabilities that may arise out of the performance of their duties to the Fund. Additionally, in the normal course of business, the Fund enters into contracts, including the Fund’s servicing agreements, that contain a variety of indemnification clauses. The Fund’s maximum exposure under these arrangements is unknown as this would involve future claims that may be made against the Fund that have not yet occurred. The risk of material loss as a result of such indemnification claims is considered remote. |
| I. | Securities Lending – The Fund may lend portfolio securities having a market value up to one-third of the Fund’s total assets. Such loans are secured by collateral equal to no less than the market value of the loaned securities determined daily by the securities lending provider. Such collateral will be cash or debt securities issued or guaranteed by the U.S. Government or any of its sponsored agencies. Cash collateral received in connection with these loans is invested in short-term money market instruments or affiliated, unregistered investment companies that comply with Rule 2a-7 under the 1940 Act and money market funds (collectively, “affiliated money market funds”) and is shown as such on the Schedule of Investments. The Fund bears the risk of loss with respect to the investment of collateral. It is the Fund’s policy to obtain additional collateral from or return excess collateral to the borrower by the end of the next business day, following the valuation date of the securities loaned. Therefore, the value of the collateral held may be temporarily less than the value of the securities on loan. When loaning securities, the Fund retains certain benefits of owning the securities, including the economic equivalent of dividends or interest generated by the security. Lending securities entails a risk of loss to the Fund if, and to the extent that, the market value of the securities loaned were to increase and the borrower did not increase the collateral accordingly, and the borrower failed to return the securities. The securities loaned are subject to termination at the option of the borrower or the Fund. Upon termination, the borrower will return to the Fund the securities loaned and the Fund will return the collateral. Upon the failure of the borrower to return the securities, collateral may be liquidated and the securities may be purchased on the open market to replace the loaned securities. The Fund could experience delays and costs in gaining access to the collateral and the securities may lose value during the delay which could result in potential losses to the Fund. Some of these losses may be indemnified by the lending agent. The Fund bears the risk of any deficiency in the amount of the collateral available for return to the borrower due to any loss on the collateral invested. Dividends received on cash collateral investments for securities lending transactions, which are net of compensation to counterparties, are included in Dividends from affiliated money market funds on the Statement of Operations. The aggregate value of securities out on loan, if any, is shown as a footnote on the Statement of Assets and Liabilities. |
The Adviser serves as an affiliated securities lending agent for the Fund. The Bank of New York Mellon also serves as a lending agent. To the extent the Fund utilizes the Adviser as an affiliated securities lending agent, the Fund conducts its securities lending in accordance with, and in reliance upon, no-action letters issued by the SEC staff that provide guidance on how an affiliate may act as a direct agent lender and receive compensation for those services in a manner consistent with the federal securities laws. For the year ended October 31, 2022, the Fund paid the Adviser $14,351 in fees for securities lending agent services. Fees paid to the Adviser for securities lending agent services are included in Dividends from affiliated money market funds on the Statement of Operations.
| J. | Foreign Currency Translations – Foreign currency is valued at the close of the NYSE based on quotations posted by banks and major currency dealers. |
| | |
| 16 | | Invesco Discovery Mid Cap Growth Fund |
| | Portfolio securities and other assets and liabilities denominated in foreign currencies are translated into U.S. dollar amounts at the date of valuation. Purchases and sales of portfolio securities (net of foreign taxes withheld on disposition) and income items denominated in foreign currencies are translated into U.S. dollar amounts on the respective dates of such transactions. The Fund does not separately account for the portion of the results of operations resulting from changes in foreign exchange rates on investments and the fluctuations arising from changes in market prices of securities held. The combined results of changes in foreign exchange rates and the fluctuation of market prices on investments (net of estimated foreign tax withholding) are included with the net realized and unrealized gain or loss from investments in the Statement of Operations. Reported net realized foreign currency gains or losses arise from (1) sales of foreign currencies, (2) currency gains or losses realized between the trade and settlement dates on securities transactions, and (3) the difference between the amounts of dividends, interest, and foreign withholding taxes recorded on the Fund’s books and the U.S. dollar equivalent of the amounts actually received or paid. Net unrealized foreign currency gains and losses arise from changes in the fair values of assets and liabilities, other than investments in securities at fiscal period end, resulting from changes in exchange rates. |
The Fund may invest in foreign securities, which may be subject to foreign taxes on income, gains on investments or currency repatriation, a portion of which may be recoverable. Foreign taxes, if any, are recorded based on the tax regulations and rates that exist in the foreign markets in which the Fund invests and are shown in the Statement of Operations.
| K. | Forward Foreign Currency Contracts – The Fund may engage in foreign currency transactions either on a spot (i.e. for prompt delivery and settlement) basis, or through forward foreign currency contracts, to manage or minimize currency or exchange rate risk. |
The Fund may also enter into forward foreign currency contracts for the purchase or sale of a security denominated in a foreign currency in order to “lock in” the U.S. dollar price of that security, or the Fund may also enter into forward foreign currency contracts that do not provide for physical exchange of the two currencies on the settlement date, but instead are settled by a single cash payment calculated as the difference between the agreed upon exchange rate and the spot rate at settlement based upon an agreed upon notional amount (non-deliverable forwards).
A forward foreign currency contract is an obligation between two parties (“Counterparties”) to purchase or sell a specific currency for an agreed-upon price at a future date. The use of forward foreign currency contracts for hedging does not eliminate fluctuations in the price of the underlying securities the Fund owns or intends to acquire but establishes a rate of exchange in advance. Fluctuations in the value of these contracts are measured by the difference in the contract date and reporting date exchange rates and are recorded as unrealized appreciation (depreciation) until the contracts are closed. When the contracts are closed, realized gains (losses) are recorded. Realized and unrealized gains (losses) on the contracts are included in the Statement of Operations. The primary risks associated with forward foreign currency contracts include failure of the Counterparty to meet the terms of the contract and the value of the foreign currency changing unfavorably. These risks may be in excess of the amounts reflected in the Statement of Assets and Liabilities.
| L. | COVID-19 Risk – The COVID-19 strain of coronavirus has resulted in instances of market closures and dislocations, extreme volatility, liquidity constraints and increased trading costs. Efforts to contain its spread have resulted in travel restrictions, disruptions of healthcare systems, business operations (including business closures) and supply chains, layoffs, lower consumer demand and employee availability, and defaults and credit downgrades, among other significant economic impacts that have disrupted global economic activity across many industries. Such economic impacts may exacerbate other pre-existing political, social and economic risks locally or globally and cause general concern and uncertainty. The full economic impact and ongoing effects of COVID-19 (or other future epidemics or pandemics) at the macro-level and on individual businesses are unpredictable and may result in significant and prolonged effects on the Fund’s performance. |
NOTE 2–Advisory Fees and Other Fees Paid to Affiliates
The Trust has entered into a master investment advisory agreement with the Adviser. Under the terms of the investment advisory agreement, the Fund accrues daily and pays monthly an advisory fee to the Adviser based on the annual rate of the Fund’s average daily net assets as follows:
| | | | |
| Average Daily Net Assets | | Rate* | |
First $ 500 million | | | 0.680 | % |
Next $500 million | | | 0.650 | % |
Next $4 billion | | | 0.620 | % |
Over $5 billion | | | 0.600 | % |
| * | The advisory fee paid by the Fund shall be reduced by any amounts paid by the Fund under the administrative services agreement with the Adviser. |
For the year ended October 31, 2022, the effective advisory fee rate incurred by the Fund was 0.61%.
Under the terms of a master sub-advisory agreement between the Adviser and each of Invesco Asset Management Deutschland GmbH, Invesco Asset Management Limited, Invesco Asset Management (Japan) Limited, Invesco Hong Kong Limited, Invesco Senior Secured Management, Inc. and Invesco Canada Ltd. and separate sub-advisory agreements with Invesco Capital Management LLC and Invesco Asset Management (India) Private Limited (collectively, the “Affiliated Sub-Advisers”) the Adviser, not the Fund, will pay 40% of the fees paid to the Adviser to any such Affiliated Sub-Adviser(s) that provide(s) discretionary investment management services to the Fund based on the percentage of assets allocated to such Affiliated Sub-Adviser(s). Invesco has also entered into a sub-advisory agreement with OppenheimerFunds, Inc. to provide discretionary management services to the Fund.
The Adviser has contractually agreed, through at least June 30, 2023, to waive advisory fees and/or reimburse expenses of all shares to the extent necessary to limit total annual fund operating expenses after fee waivers and/or reimbursements (excluding certain items discussed below) of Class A, Class C, Class R, Class Y, Class R5 and Class R6 shares to 2.00%, 2.75%, 2.25%, 1.75%, 1.75% and 1.75%, respectively, of the Fund’s average daily net assets (the “expense limits”). In determining the Adviser’s obligation to waive advisory fees and/or reimburse expenses, the following expenses are not taken into account, and could cause the total annual fund operating expenses after fee waiver and/or expense reimbursement to exceed the numbers reflected above: (1) interest; (2) taxes; (3) dividend expense on short sales; (4) extraordinary or non-routine items, including litigation expenses; and (5) expenses that the Fund has incurred but did not actually pay because of an expense offset arrangement. Unless Invesco continues the fee waiver agreement, it will terminate on June 30, 2023. During its term, the fee waiver agreement cannot be terminated or amended to increase the expense limits or reduce the advisory fee waiver without approval of the Board of Trustees. The Adviser did not waive fees and/or reimburse expenses during the period under these expense limits.
Further, the Adviser has contractually agreed, through at least June 30, 2024, to waive the advisory fee payable by the Fund in an amount equal to 100% of the net advisory fees the Adviser receives from the affiliated money market funds on investments by the Fund of uninvested cash in such affiliated money market funds.
For the year ended October 31, 2022, the Adviser waived advisory fees of $159,185.
The Trust has entered into a master administrative services agreement with Invesco pursuant to which the Fund has agreed to pay Invesco for certain administrative costs incurred in providing accounting services to the Fund. For the year ended October 31, 2022, expenses incurred under the agreement are shown in the Statement of Operations as Administrative services fees. Invesco has entered into a sub-administration agreement whereby State Street Bank and Trust Company (“SSB”) serves as fund accountant and provides certain administrative services to the Fund. Pursuant to a custody agreement with the Trust on behalf of the Fund, SSB also serves as the Fund’s custodian.
The Trust has entered into a transfer agency and service agreement with Invesco Investment Services, Inc. (“IIS”) pursuant to which the Fund has agreed to pay IIS a fee for providing transfer agency and shareholder services to the Fund and reimburse IIS for certain expenses incurred by IIS in the course of providing such services.
| | |
| 17 | | Invesco Discovery Mid Cap Growth Fund |
IIS may make payments to intermediaries that provide omnibus account services, sub-accounting services and/or networking services. All fees payable by IIS to intermediaries that provide omnibus account services or sub-accounting services are charged back to the Fund, subject to certain limitations approved by the Trust’s Board of Trustees. For the year ended October 31, 2022, expenses incurred under the agreement are shown in the Statement of Operations as Transfer agent fees.
The Trust has entered into master distribution agreements with Invesco Distributors, Inc.(“IDI”) to serve as the distributor for the Class A, Class C, Class R, Class Y, Class R5 and Class R6 shares of the Fund. The Trust has adopted plans pursuant to Rule 12b-1 under the 1940 Act with respect to the Fund’s Class A, Class C and Class R shares (collectively the “Plans”). The Fund, pursuant to the Plans, reimburses IDI for its allocated share of expenses incurred for the period, up to a maximum annual rate of 0.25% of the average daily net assets of Class A shares, up to 1.00% of the average daily net assets of Class C shares, and up to 0.50% of the average daily net assets of Class R shares. The fees are accrued daily and paid monthly. Of the Plan payments, up to 0.25% of the average daily net assets of each class of shares may be paid to furnish continuing personal shareholder services to customers who purchase and own shares of such classes. Any amounts not paid as a service fee under the Plan would constitute an asset-based sales charge. Rules of the Financial Industry Regulatory Authority (“FINRA”) impose a cap on the total sales charges, including asset-based sales charges, that may be paid by any class of shares of the Fund. For the year ended October 31, 2022, expenses incurred under the Plans are shown in the Statement of Operations as Distribution fees.
Front-end sales commissions and CDSC (collectively, the “sales charges”) are not recorded as expenses of the Fund. Front-end sales commissions are deducted from proceeds from the sales of Fund shares prior to investment in Class A shares of the Fund. CDSC are deducted from redemption proceeds prior to remittance to the shareholder. During the year ended October 31, 2022, IDI advised the Fund that IDI retained $594,371 in front-end sales commissions from the sale of Class A shares and $11,430 and $3,960 from Class A and Class C shares, respectively, for CDSC imposed upon redemptions by shareholders.
For the year ended October 31, 2022, the Fund incurred $5,217 in brokerage commissions with Invesco Capital Markets, Inc., an affiliate of the Adviser and IDI, for portfolio transactions executed on behalf of the Fund.
Certain officers and trustees of the Trust are officers and directors of the Adviser, IIS and/or IDI.
NOTE 3–Additional Valuation Information
GAAP defines fair value as the price that would be received to sell an asset or paid to transfer a liability in an orderly transaction between market participants at the measurement date, under current market conditions. GAAP establishes a hierarchy that prioritizes the inputs to valuation methods, giving the highest priority to readily available unadjusted quoted prices in an active market for identical assets (Level 1) and the lowest priority to significant unobservable inputs (Level 3), generally when market prices are not readily available. Based on the valuation inputs, the securities or other investments are tiered into one of three levels. Changes in valuation methods may result in transfers in or out of an investment’s assigned level:
| | | | |
| | | Level 1 - | | Prices are determined using quoted prices in an active market for identical assets. |
| | Level 2 - | | Prices are determined using other significant observable inputs. Observable inputs are inputs that other market participants may use in pricing a security. These may include quoted prices for similar securities, interest rates, prepayment speeds, credit risk, yield curves, loss severities, default rates, discount rates, volatilities and others. |
| | Level 3 - | | Prices are determined using significant unobservable inputs. In situations where quoted prices or observable inputs are unavailable (for example, when there is little or no market activity for an investment at the end of the period), unobservable inputs may be used. Unobservable inputs reflect the Adviser’s assumptions about the factors market participants would use in determining fair value of the securities or instruments and would be based on the best available information. |
The following is a summary of the tiered valuation input levels, as of October 31, 2022. The level assigned to the securities valuations may not be an indication of the risk or liquidity associated with investing in those securities. Because of the inherent uncertainties of valuation, the values reflected in the financial statements may materially differ from the value received upon actual sale of those investments.
| | | | | | | | | | | | | | | | |
| | | Level 1 | | | Level 2 | | | Level 3 | | | Total | |
|
| |
Investments in Securities | | | | | | | | | | | | | | | | |
|
| |
Common Stocks & Other Equity Interests | | $ | 5,447,433,493 | | | $ | – | | | | $ – | | | $ | 5,447,433,493 | |
|
| |
Money Market Funds | | | 245,117,583 | | | | 287,704,620 | | | | – | | | | 532,822,203 | |
|
| |
Total Investments | | $ | 5,692,551,076 | | | $ | 287,704,620 | | | | $ – | | | $ | 5,980,255,696 | |
|
| |
NOTE 4–Expense Offset Arrangement(s)
The expense offset arrangement is comprised of transfer agency credits which result from balances in demand deposit accounts used by the transfer agent for clearing shareholder transactions. For the year ended October 31, 2022, the Fund received credits from this arrangement, which resulted in the reduction of the Fund’s total expenses of $20,835.
NOTE 5–Trustees’ and Officers’ Fees and Benefits
Trustees’ and Officers’ Fees and Benefits include amounts accrued by the Fund to pay remuneration to certain Trustees and Officers of the Fund. Trustees have the option to defer compensation payable by the Fund, and Trustees’ and Officers’ Fees and Benefits also include amounts accrued by the Fund to fund such deferred compensation amounts. Those Trustees who defer compensation have the option to select various Invesco Funds in which their deferral accounts shall be deemed to be invested. Finally, certain current Trustees were eligible to participate in a retirement plan that provided for benefits to be paid upon retirement to Trustees over a period of time based on the number of years of service. The Fund may have certain former Trustees who also participate in a retirement plan and receive benefits under such plan. Trustees’ and Officers’ Fees and Benefits include amounts accrued by the Fund to fund such retirement benefits. Obligations under the deferred compensation and retirement plans represent unsecured claims against the general assets of the Fund.
NOTE 6–Cash Balances
The Fund is permitted to temporarily carry a negative or overdrawn balance in its account with SSB, the custodian bank. Such balances, if any at period-end, are shown in the Statement of Assets and Liabilities under the payable caption Amount due custodian. To compensate the custodian bank for such overdrafts, the overdrawn Fund may either (1) leave funds as a compensating balance in the account so the custodian bank can be compensated by earning the additional interest; or (2) compensate by paying the custodian bank at a rate agreed upon by the custodian bank and Invesco, not to exceed the contractually agreed upon rate. The Fund may not purchase additional securities when any borrowings from banks or broker-dealers exceed 5% of the Fund’s total assets, or when any borrowings from an Invesco Fund are outstanding.
| | |
| 18 | | Invesco Discovery Mid Cap Growth Fund |
NOTE 7–Distributions to Shareholders and Tax Components of Net Assets
Tax Character of Distributions to Shareholders Paid During the Fiscal Years Ended October 31, 2022 and 2021:
| | | | | | | | |
| | | 2022 | | | 2021 | |
|
| |
Ordinary income* | | $ | 162,051,056 | | | $ | – | |
|
| |
Long-term capital gain | | | 1,084,597,813 | | | | 224,280,188 | |
|
| |
Total distributions | | $ | 1,246,648,869 | | | $ | 224,280,188 | |
|
| |
| * | Includes short-term capital gain distributions, if any. |
Tax Components of Net Assets at Period-End:
| | | | |
| | | 2022 | |
|
| |
Net unrealized appreciation – investments | | $ | 488,377,527 | |
|
| |
Temporary book/tax differences | | | (377,886 | ) |
|
| |
Late-Year ordinary loss deferral | | | (14,616,180 | ) |
|
| |
Capital loss carryforward | | | (205,851,666 | ) |
|
| |
Shares of beneficial interest | | | 5,320,859,212 | |
|
| |
Total net assets | | $ | 5,588,391,007 | |
|
| |
The difference between book-basis and tax-basis unrealized appreciation (depreciation) is due to differences in the timing of recognition of gains and losses on investments for tax and book purposes. The Fund’s net unrealized appreciation (depreciation) difference is attributable primarily to wash sales and passive foreign investment companies.
The temporary book/tax differences are a result of timing differences between book and tax recognition of income and/or expenses. The Fund’s temporary book/tax differences are the result of the trustee deferral of compensation and retirement plan benefits.
Capital loss carryforward is calculated and reported as of a specific date. Results of transactions and other activity after that date may affect the amount of capital loss carryforward actually available for the Fund to utilize. The ability to utilize capital loss carryforward in the future may be limited under the Internal Revenue Code and related regulations based on the results of future transactions.
The Fund has a capital loss carryforward as of October 31, 2022, as follows:
| | | | | | | | | | |
| Capital Loss Carryforward* | |
|
| |
| Expiration | | Short-Term | | | Long-Term | | Total | |
|
| |
Not subject to expiration | | $ | 205,851,666 | | | $– | | $ | 205,851,666 | |
|
| |
| * | Capital loss carryforward is reduced for limitations, if any, to the extent required by the Internal Revenue Code and may be further limited depending upon a variety of factors, including the realization of net unrealized gains or losses as of the date of any reorganization. |
NOTE 8–Investment Transactions
The aggregate amount of investment securities (other than short-term securities, U.S. Government obligations and money market funds, if any) purchased and sold by the Fund during the year ended October 31, 2022 was $5,939,061,031 and $6,235,937,784, respectively. Cost of investments, including any derivatives, on a tax basis includes the adjustments for financial reporting purposes as of the most recently completed federal income tax reporting period-end.
| | | | |
Unrealized Appreciation (Depreciation) of Investments on a Tax Basis | |
Aggregate unrealized appreciation of investments | | | $ 714,830,191 | |
|
| |
Aggregate unrealized (depreciation) of investments | | | (226,452,664 | ) |
|
| |
Net unrealized appreciation of investments | | | $488,377,527 | |
|
| |
Cost of investments for tax purposes is $5,491,878,169.
NOTE 9–Reclassification of Permanent Differences
Primarily as a result of differing book/tax treatment of net operating losses and distributions, on October 31, 2022, undistributed net investment income (loss) was increased by $4,095,622, undistributed net realized gain (loss) was increased by $584,836 and shares of beneficial interest was decreased by $4,680,458. This reclassification had no effect on the net assets of the Fund.
NOTE 10–Share Information
| | | | | | | | | | | | | | | | |
| | | Summary of Share Activity | |
|
| |
| | | Year ended | | | Year ended | |
| | | October 31, 2022(a) | | | October 31, 2021 | |
| | | Shares | | | Amount | | | Shares | | | Amount | |
|
| |
Sold: | | | | | | | | | | | | | | | | |
Class A | | | 11,816,206 | | | $ | 295,474,702 | | | | 13,472,916 | | | $ | 431,707,965 | |
|
| |
Class C | | | 1,051,819 | | | | 19,432,387 | | | | 1,370,442 | | | | 33,869,961 | |
|
| |
Class R | | | 1,284,557 | | | | 28,768,746 | | | | 1,312,889 | | | | 38,649,773 | |
|
| |
Class Y | | | 10,913,002 | | | | 320,936,382 | | | | 9,206,296 | | | | 338,674,872 | |
|
| |
Class R5 | | | 719,838 | | | | 18,284,370 | | | | 606,551 | | | | 20,213,465 | |
|
| |
Class R6 | | | 17,960,601 | | | | 529,642,874 | | | | 13,830,173 | | | | 529,918,948 | |
|
| |
| | |
| 19 | | Invesco Discovery Mid Cap Growth Fund |
| | | | | | | | | | | | | | | | |
| | | Summary of Share Activity | |
|
| |
| | | Year ended | | | Year ended | |
| | | October 31, 2022(a) | | | October 31, 2021 | |
| | | Shares | | | Amount | | | Shares | | | Amount | |
|
| |
| | | | |
Issued as reinvestment of dividends: | | | | | | | | | | | | | | | | |
Class A | | | 26,589,469 | | | $ | 773,221,924 | | | | 5,005,084 | | | $ | 145,998,307 | |
|
| |
Class C | | | 1,909,121 | | | | 40,053,351 | | | | 420,162 | | | | 9,474,657 | |
|
| |
Class R | | | 1,179,551 | | | | 30,774,475 | | | | 202,315 | | | | 5,407,874 | |
|
| |
Class Y | | | 3,254,966 | | | | 111,905,740 | | | | 506,612 | | | | 16,981,632 | |
|
| |
Class R5 | | | 795,893 | | | | 23,399,246 | | | | 148,658 | | | | 4,361,612 | |
|
| |
Class R6 | | | 5,834,791 | | | | 205,326,299 | | | | 930,643 | | | | 31,781,458 | |
|
| |
| | | | |
Automatic conversion of Class C shares to Class A shares: | | | | | | | | | | | | | | | | |
Class A | | | 679,402 | | | | 16,377,029 | | | | 1,506,533 | | | | 47,789,753 | |
|
| |
Class C | | | (940,844 | ) | | | (16,377,029 | ) | | | (1,951,219 | ) | | | (47,789,753 | ) |
|
| |
| | | | |
Reacquired: | | | | | | | | | | | | | | | | |
Class A | | | (23,451,842 | ) | | | (570,355,510 | ) | | | (19,661,369 | ) | | | (633,755,901 | ) |
|
| |
Class C | | | (1,768,643 | ) | | | (31,188,502 | ) | | | (1,728,578 | ) | | | (42,936,444 | ) |
|
| |
Class R | | | (1,360,714 | ) | | | (30,136,652 | ) | | | (1,094,876 | ) | | | (32,318,971 | ) |
|
| |
Class Y | | | (10,629,873 | ) | | | (305,358,232 | ) | | | (4,656,085 | ) | | | (174,026,889 | ) |
|
| |
Class R5 | | | (759,081 | ) | | | (19,168,415 | ) | | | (722,088 | ) | | | (23,576,026 | ) |
|
| |
Class R6 | | | (14,579,687 | ) | | | (423,845,352 | ) | | | (8,151,870 | ) | | | (313,316,892 | ) |
|
| |
| Net increase in share activity | | | 30,498,532 | | | $ | 1,017,167,833 | | | | 10,553,189 | | | $ | 387,109,401 | |
|
| |
| (a) | There are entities that are record owners of more than 5% of the outstanding shares of the Fund and in the aggregate own 23% of the outstanding shares of the Fund. IDI has an agreement with these entities to sell Fund shares. The Fund, Invesco and/or Invesco affiliates may make payments to these entities, which are considered to be related to the Fund, for providing services to the Fund, Invesco and/or Invesco affiliates including but not limited to services such as securities brokerage, distribution, third party record keeping and account servicing. The Fund has no knowledge as to whether all or any portion of the shares owned of record by these entities are also owned beneficially. |
| | |
| 20 | | Invesco Discovery Mid Cap Growth Fund |
Report of Independent Registered Public Accounting Firm
To the Board of Trustees of AIM Investment Funds (Invesco Investment Funds) and Shareholders of Invesco Discovery Mid Cap Growth Fund
Opinion on the Financial Statements
We have audited the accompanying statement of assets and liabilities, including the schedule of investments, of Invesco Discovery Mid Cap Growth Fund (one of the funds constituting AIM Investment Funds (Invesco Investment Funds), referred to hereafter as the “Fund”) as of October 31, 2022, the related statement of operations for the year ended October 31, 2022, the statement of changes in net assets for each of the two years in the period ended October 31, 2022, including the related notes, and the financial highlights for each of the periods indicated in the table below (collectively referred to as the “financial statements”). In our opinion, the financial statements present fairly, in all material respects, the financial position of the Fund as of October 31, 2022, the results of its operations for the year then ended, the changes in its net assets for each of the two years in the period ended October 31, 2022 and the financial highlights for each of the periods indicated in the table below, in conformity with accounting principles generally accepted in the United States of America.
|
| |
| Financial Highlights |
| |
For each of the four years in the period ended October 31, 2022 for Class A, Class C, Class R, Class Y and Class R6. For each of the three years in the period ended October 31, 2022 and the period May 24, 2019 (commencement of operations) through October 31, 2019 for Class R5. |
The financial statements of Oppenheimer Discovery Mid Cap Growth Fund (subsequently renamed Invesco Discovery Mid Cap Growth Fund) as of and for the year ended October 31, 2018 and the financial highlights for the year then ended (not presented herein, other than the financial highlights) were audited by other auditors whose report dated December 21, 2018 expressed an unqualified opinion on those financial statements and financial highlights.
Basis for Opinion
These financial statements are the responsibility of the Fund’s management. Our responsibility is to express an opinion on the Fund’s financial statements based on our audits. We are a public accounting firm registered with the Public Company Accounting Oversight Board (United States) (PCAOB) and are required to be independent with respect to the Fund in accordance with the U.S. federal securities laws and the applicable rules and regulations of the Securities and Exchange Commission and the PCAOB.
We conducted our audits of these financial statements in accordance with the standards of the PCAOB. Those standards require that we plan and perform the audit to obtain reasonable assurance about whether the financial statements are free of material misstatement, whether due to error or fraud.
Our audits included performing procedures to assess the risks of material misstatement of the financial statements, whether due to error or fraud, and performing procedures that respond to those risks. Such procedures included examining, on a test basis, evidence regarding the amounts and disclosures in the financial statements. Our audits also included evaluating the accounting principles used and significant estimates made by management, as well as evaluating the overall presentation of the financial statements. Our procedures included confirmation of securities owned as of October 31, 2022 by correspondence with the custodian, transfer agent and brokers; when replies were not received from brokers, we performed other auditing procedures. We believe that our audits provide a reasonable basis for our opinion.
/s/PricewaterhouseCoopers LLP
Houston, Texas
December 23, 2022
We have served as the auditor of one or more of the investment companies in the Invesco group of investment companies since at least 1995. We have not been able to determine the specific year we began serving as auditor.
| | |
| 21 | | Invesco Discovery Mid Cap Growth Fund |
Calculating your ongoing Fund expenses
Example
As a shareholder of the Fund, you incur two types of costs: (1) transaction costs, which may include sales charges (loads) on purchase payments or contingent deferred sales charges on redemptions, if any; and (2) ongoing costs, including management fees, distribution and/or service (12b-1) fees, and other Fund expenses. This example is intended to help you understand your ongoing costs (in dollars) of investing in the Fund and to compare these costs with ongoing costs of investing in other mutual funds. The example is based on an investment of $1,000 invested at the beginning of the period and held for the entire period May 1, 2022 through October 31, 2022.
Actual expenses
The table below provides information about actual account values and actual expenses. You may use the information in this table, together with the amount you invested, to estimate the expenses that you paid over the period. Simply divide your account value by $1,000 (for example, an $8,600 account value divided by $1,000 = 8.6), then multiply the result by the number in the table under the heading entitled “Actual Expenses Paid During Period” to estimate the expenses you paid on your account during this period.
Hypothetical example for comparison purposes
The table below also provides information about hypothetical account values and hypothetical expenses based on the Fund’s actual expense ratio and an assumed rate of return of 5% per year before expenses, which is not the Fund’s actual return.
The hypothetical account values and expenses may not be used to estimate the actual ending account balance or expenses you paid for the period. You may use this information to compare the ongoing costs of investing in the Fund and other funds. To do so, compare this 5% hypothetical example with the 5% hypothetical examples that appear in the shareholder reports of the other funds.
Please note that the expenses shown in the table are meant to highlight your ongoing costs only and do not reflect any transaction costs, such as sales charges (loads) on purchase payments or contingent deferred sales charges on redemptions, if any. Therefore, the hypothetical information is useful in comparing ongoing costs only, and will not help you determine the relative total costs of owning different funds. In addition, if these transaction costs were included, your costs would have been higher.
| | | | | | | | | | | | |
| | | | | ACTUAL | | HYPOTHETICAL (5% annual return before expenses) | | |
| | | Beginning Account Value (05/01/22) | | Ending Account Value (10/31/22)1 | | Expenses Paid During Period2 | | Ending Account Value (10/31/22) | | Expenses Paid During Period2 | | Annualized Expense Ratio |
Class A | | $1,000.00 | | $956.40 | | $5.28 | | $1,019.81 | | $5.45 | | 1.07% |
Class C | | 1,000.00 | | 953.00 | | 8.91 | | 1,016.08 | | 9.20 | | 1.81 |
Class R | | 1,000.00 | | 954.90 | | 6.50 | | 1,018.55 | | 6.72 | | 1.32 |
Class Y | | 1,000.00 | | 957.50 | | 4.05 | | 1,021.07 | | 4.18 | | 0.82 |
Class R5 | | 1,000.00 | | 958.20 | | 3.55 | | 1,021.58 | | 3.67 | | 0.72 |
Class R6 | | 1,000.00 | | 958.20 | | 3.31 | | 1,021.83 | | 3.41 | | 0.67 |
| 1 | The actual ending account value is based on the actual total return of the Fund for the period May 1, 2022 through October 31, 2022, after actual expenses and will differ from the hypothetical ending account value which is based on the Fund’s expense ratio and a hypothetical annual return of 5% before expenses. |
| 2 | Expenses are equal to the Fund’s annualized expense ratio as indicated above multiplied by the average account value over the period, multiplied by 184/365 to reflect the most recent fiscal half year. |
| | |
| 22 | | Invesco Discovery Mid Cap Growth Fund |
Approval of Investment Advisory and Sub-Advisory Contracts
At meetings held on June 13, 2022, the Board of Trustees (the Board or the Trustees) of AIM Investment Funds (Invesco Investment Funds) as a whole, and the independent Trustees, who comprise over 75% of the Board, voting separately, approved the continuance of the Invesco Discovery Mid Cap Growth Fund’s (the Fund) Master Investment Advisory Agreement with Invesco Advisers, Inc. (Invesco Advisers and the investment advisory agreement) and the Master Intergroup Sub-Advisory Contract for Mutual Funds with Invesco Asset Management Deutschland GmbH, Invesco Asset Management Limited, Invesco Asset Management (Japan) Limited, Invesco Hong Kong Limited, Invesco Senior Secured Management, Inc. and Invesco Canada Ltd. and separate sub-advisory contracts with Invesco Capital Management LLC and Invesco Asset Management (India) Private Limited and OppenheimerFunds, Inc. (collectively, the Affiliated Sub-Advisers and the sub-advisory contracts) for another year, effective July 1, 2022. After evaluating the factors discussed below, among others, the Board approved the renewal of the Fund’s investment advisory agreement and the sub-advisory contracts and determined that the compensation payable thereunder by the Fund to Invesco Advisers and by Invesco Advisers to the Affiliated Sub-Advisers is fair and reasonable.
The Board’s Evaluation Process
The Board has established an Investments Committee, which in turn has established Sub-Committees that meet throughout the year to review the performance of funds advised by Invesco Advisers (the Invesco Funds). The Sub-Committees meet regularly with portfolio managers for their assigned Invesco Funds and other members of management to review detailed information about investment performance and portfolio attributes of these funds. The Board has established additional standing and ad hoc committees that meet regularly throughout the year to review matters within their purview. The Board took into account evaluations and reports that it received from its committees and sub-committees, as well as the information provided to the Board and its committees and sub-committees throughout the year, in considering whether to approve each Invesco Fund’s investment advisory agreement and sub-advisory contracts.
As part of the contract renewal process, the Board reviews and considers information provided in response to detailed requests for information submitted to management by the independent Trustees with assistance from legal counsel to the independent Trustees and the Senior Officer, an officer of the Invesco Funds who reports directly to the independent Trustees. The Board receives comparative investment performance and fee and expense data regarding the Invesco Funds prepared by Broadridge Financial Solutions, Inc. (Broadridge), an independent mutual fund data provider, as well as information on the composition of the peer groups provided by Broadridge and its methodology for determining peer groups. The Board also receives an independent written evaluation from the Senior Officer. The Senior Officer’s evaluation is prepared as part of his responsibility to manage the process by which the Invesco Funds’ proposed management fees are negotiated during the annual contract renewal
process to ensure they are negotiated in a manner that is at arms’ length and reasonable in accordance with certain negotiated regulatory requirements. In addition to meetings with Invesco Advisers and fund counsel throughout the year and as part of meetings convened on May 2, 2022 and June 13, 2022, the independent Trustees also discussed the continuance of the investment advisory agreement and sub-advisory contracts in separate sessions with the Senior Officer and with independent legal counsel. Also, as part of the contract renewal process, the independent Trustees reviewed and considered information provided in response to detailed follow-up requests for information submitted by the independent Trustees to management. The independent Trustees met and discussed those follow-up responses with legal counsel to the independent Trustees and the Senior Officer.
The discussion below is a summary of the Senior Officer’s independent written evaluation with respect to the Fund’s investment advisory agreement and sub-advisory contracts, as well as a discussion of the material factors and related conclusions that formed the basis for the Board’s approval of the Fund’s investment advisory agreement and sub-advisory contracts. The Trustees’ review and conclusions are based on the comprehensive consideration of all information presented to them during the course of the year and in prior years and are not the result of any single determinative factor. Moreover, one Trustee may have weighed a particular piece of information or factor differently than another Trustee. The information received and considered by the Board was current as of various dates prior to the Board’s approval on June 13, 2022.
Factors and Conclusions and Summary of Independent Written Fee Evaluation
| A. | Nature, Extent and Quality of Services Provided by Invesco Advisers and the Affiliated Sub-Advisers |
The Board reviewed the nature, extent and quality of the advisory services provided to the Fund by Invesco Advisers under the Fund’s investment advisory agreement, and the credentials and experience of the officers and employees of Invesco Advisers who provide these services, including the Fund’s portfolio manager(s). The Board’s review included consideration of Invesco Advisers’ investment process and oversight, credit analysis, and research capabilities. The Board considered information regarding Invesco Advisers’ programs for and resources devoted to risk management, including management of investment, enterprise, operational, liquidity, valuation and compliance risks, and technology used to manage such risks. The Board also received and reviewed information about Invesco Advisers’ role as administrator of the Invesco Funds’ liquidity risk management program. The Board received a description of, and reports related to, Invesco Advisers’ global security program and business continuity plans and of its approach to data privacy and cybersecurity, including related testing. The Board considered how the cybersecurity and business continuity plans of Invesco Advisers and its key service providers operated in the remote and hybrid working environment resulting from the novel coronavirus (“COVID-19”) pandemic and paved the way for a hybrid working framework in a normalized
environment as employees return to the office. The Board also considered non-advisory services that Invesco Advisers and its affiliates provide to the Invesco Funds, such as various back office support functions, third party oversight, internal audit, valuation, portfolio trading and legal and compliance. The Board observed that Invesco Advisers’ systems preparedness and ongoing investment enabled Invesco Advisers to manage, operate and oversee the Invesco Funds with minimal impact or disruption through challenging environments. The Board reviewed and considered the benefits to shareholders of investing in a Fund that is part of the family of funds under the umbrella of Invesco Ltd., Invesco Advisers’ parent company, and noted Invesco Ltd.’s depth and experience in running an investment management business, as well as its commitment of financial and other resources to such business. The Board concluded that the nature, extent and quality of the services provided to the Fund by Invesco Advisers are appropriate and satisfactory.
The Board reviewed the services that may be provided by the Affiliated Sub-Advisers under the sub-advisory contracts and the credentials and experience of the officers and employees of the Affiliated Sub-Advisers who provide these services. The Board noted the Affiliated Sub-Advisers’ expertise with respect to certain asset classes and that the Affiliated Sub-Advisers have offices and personnel that are located in financial centers around the world. As a result, the Board noted that the Affiliated Sub-Advisers can provide research and investment analysis on the markets and economies of various countries in which the Fund may invest, make recommendations regarding securities and assist with security trades. The Board concluded that the sub-advisory contracts may benefit the Fund and its shareholders by permitting Invesco Advisers to use the resources and talents of the Affiliated Sub-Advisers in managing the Fund. The Board concluded that the nature, extent and quality of the services that may be provided to the Fund by the Affiliated Sub-Advisers are appropriate and satisfactory.
| B. | Fund Investment Performance |
The Board considered Fund investment performance as a relevant factor in considering whether to approve the investment advisory agreement. The Board did not view Fund investment performance as a relevant factor in considering whether to approve the sub-advisory contracts for the Fund, as no Affiliated Sub-Adviser currently manages assets of the Fund.
The Board compared the Fund’s investment performance over multiple time periods ending December 31, 2021 to the performance of funds in the Broadridge performance universe and against the Russell Midcap® Growth Index (Index). The Board noted that performance of Class A shares of the Fund was in the first quintile of its performance universe for the one and three year periods and the second quintile for the five year period (the first quintile being the best performing funds and the fifth quintile being the worst performing funds). The Board noted that performance of Class A shares of the Fund was above the performance of the Index for the one, three and five year periods. The Board considered that the Fund was created in connection with Invesco Ltd.’s acquisition of OppenheimerFunds, Inc. and its
| | |
| 23 | | Invesco Discovery Mid Cap Growth Fund |
subsidiaries (the “Transaction”) and that the Fund’s performance prior to the closing of the Transaction on May 24, 2019 is that of its predecessor fund. The Board recognized that the performance data reflects a snapshot in time as of a particular date and that selecting a different performance period could produce different results. The Board also reviewed more recent Fund performance as well as other performance metrics, which did not change its conclusions.
| C. | Advisory and Sub-Advisory Fees and Fund Expenses |
The Board compared the Fund’s contractual management fee rate to the contractual management fee rates of funds in the Fund’s Broadridge expense group. The Board noted that the contractual management fee rate for Class A shares of the Fund was below the median contractual management fee rate of funds in its expense group. The Board noted that the term “contractual management fee” for funds in the expense group may include both advisory and certain non-portfolio management administrative services fees, but that Broadridge is not able to provide information on a fund by fund basis as to what is included. The Board also reviewed the methodology used by Broadridge in calculating expense group information, which includes using each fund’s contractual management fee schedule (including any applicable breakpoints) as reported in the most recent prospectus or statement of additional information for each fund in the expense group. The Board also considered comparative information regarding the Fund’s total expense ratio and its various components.
The Board noted that Invesco Advisers has contractually agreed to waive fees and/or limit expenses of the Fund for the term disclosed in the Fund’s registration statement in an amount necessary to limit total annual operating expenses to a specified percentage of average daily net assets for each class of the Fund.
The Board also considered the fees charged by Invesco Advisers and its affiliates to other client accounts that are similarly managed. Invesco Advisers reviewed with the Board differences in the scope of services it provides to the Invesco Funds relative to that provided by Invesco Advisers and its affiliates to certain other types of client accounts, including, among others: management of cash flows as a result of redemptions and purchases; necessary infrastructure such as officers, office space, technology, legal and distribution; oversight of service providers; costs and business risks associated with launching new funds and sponsoring and maintaining the product line; and compliance with federal and state laws and regulations. Invesco Advisers also advised the Board that many of the similarly managed client accounts have all-inclusive fee structures, which are not easily un-bundled.
The Board also considered the services that may be provided by the Affiliated Sub-Advisers pursuant to the sub-advisory contracts, as well as the fees payable by Invesco Advisers to the Affiliated Sub-Advisers pursuant to the sub-advisory contracts.
| D. | Economies of Scale and Breakpoints |
The Board considered the extent to which there may be economies of scale in the provision of advisory services to the Fund and the Invesco Funds, and the extent to which such economies of scale are shared with the Fund and the Invesco Funds. The Board considered that the Fund benefits from economies of scale through contractual breakpoints in the Fund’s
advisory fee schedule, which generally operate to reduce the Fund’s expense ratio as it grows in size. The Board considered information from Invesco Advisers regarding the levels of the Fund’s breakpoints in light of current assets. The Board noted that the Fund also shares in economies of scale through Invesco Advisers’ ability to negotiate lower fee arrangements with third party service providers. The Board noted that the Fund may also benefit from economies of scale through initial fee setting, fee waivers and expense reimbursements, as well as Invesco Advisers’ investment in its business, including investments in business infrastructure, technology and cybersecurity.
| E. | Profitability and Financial Resources |
The Board reviewed information from Invesco Advisers concerning the costs of the advisory and other services that Invesco Advisers and its affiliates provide to the Fund and the Invesco Funds and the profitability of Invesco Advisers and its affiliates in providing these services in the aggregate and on an individual Fund-by-Fund basis. The Board considered the methodology used for calculating profitability and the periodic review and enhancement of such methodology. The Board noted that Invesco Advisers continues to operate at a net profit from services Invesco Advisers and its affiliates provide to the Invesco Funds in the aggregate and to most Funds individually. The Board did not deem the level of profits realized by Invesco Advisers and its affiliates from providing such services to be excessive, given the nature, extent and quality of the services provided. The Board noted that Invesco Advisers provided information demonstrating that Invesco Advisers is financially sound and has the resources necessary to perform its obligations under the investment advisory agreement, and provided representations indicating that the Affiliated Sub-Advisers are financially sound and have the resources necessary to perform their obligations under the sub-advisory contracts.
| F. | Collateral Benefits to Invesco Advisers and its Affiliates |
The Board considered various other benefits received by Invesco Advisers and its affiliates from the relationship with the Fund, including the fees received for providing administrative, transfer agency and distribution services to the Fund. The Board received comparative information regarding fees charged for these services, including information provided by Broadridge and other independent sources. The Board reviewed the performance of Invesco Advisers and its affiliates in providing these services and the organizational structure employed to provide these services. The Board noted that these services are provided to the Fund pursuant to written contracts that are reviewed and subject to approval on an annual basis by the Board based on its determination that the services are required for the operation of the Fund.
The Board considered the benefits realized by Invesco Advisers and the Affiliated Sub-Advisers as a result of portfolio brokerage transactions executed through “soft dollar” arrangements. The Board noted that soft dollar arrangements may result in the Fund bearing costs to purchase research that may be used by Invesco Advisers or the Affiliated Sub-Advisers with other clients and may reduce Invesco Advisers’ or the Affiliated Sub-Advisers’ expenses. The Board also considered that it receives from Invesco Advisers periodic reports that include a representation to the effect that these arrangements are consistent with
regulatory requirements. The Board did not deem the soft dollar arrangements to be inappropriate.
The Board considered that the Fund’s uninvested cash and cash collateral from any securities lending arrangements may be invested in registered money market funds or, with regard to securities lending cash collateral, unregistered funds that comply with Rule 2a-7 (collectively referred to as “affiliated money market funds”) advised by Invesco Advisers. The Board considered information regarding the returns of the affiliated money market funds relative to comparable overnight investments, as well as the fees paid by the affiliated money market funds to Invesco Advisers and its affiliates. In this regard, the Board noted that Invesco Advisers receives advisory fees from these affiliated money market funds attributable to the Fund’s investments. The Board also noted that Invesco Advisers has contractually agreed to waive through varying periods an amount equal to 100% of the net advisory fee Invesco Advisers receives from the affiliated money market funds with respect to the Fund’s investment in the affiliated money market funds of uninvested cash, but not cash collateral. The Board concluded that the advisory fees payable to Invesco Advisers from the Fund’s investment of cash collateral from any securities lending arrangements in the affiliated money market funds are for services that are not duplicative of services provided by Invesco Advisers to the Fund.
The Board considered that Invesco Advisers may serve as the Fund’s affiliated securities lending agent and evaluated the benefits realized by Invesco Advisers when serving in such role, including the compensation received. The Board considered Invesco Advisers’ securities lending platform and corporate governance structure for securities lending, including Invesco Advisers’ Securities Lending Governance Committee and its related responsibilities. The Board noted that to the extent the Fund utilizes Invesco Advisers as an affiliated securities lending agent, the Fund conducts its securities lending in accordance with, and in reliance upon, no-action letters issued by the SEC staff that provide guidance on how an affiliate may act as a direct agent lender and receive compensation for those services without obtaining exemptive relief. The Board considered information provided by Invesco Advisers related to the performance of Invesco Advisers as securities lending agent, including a summary of the securities lending services provided to the Fund by Invesco Advisers and the compensation paid to Invesco Advisers for such services, as well as any revenues generated for the Fund in connection with such securities lending activity and the allocation of such revenue between the Fund and Invesco Advisers.
The Board also received information about commissions that an affiliated broker may receive for executing certain trades for the Fund. Invesco Advisers and the Affiliated Sub-Advisers advised the Board of the benefits to the Fund of executing trades through the affiliated broker and that such trades were executed in compliance with rules under the federal securities laws and consistent with best execution obligations.
| | |
| 24 | | Invesco Discovery Mid Cap Growth Fund |
Tax Information
Form 1099-DIV, Form 1042-S and other year-end tax information provide shareholders with actual calendar year amounts that should be included in their tax returns. Shareholders should consult their tax advisers.
The following distribution information is being provided as required by the Internal Revenue Code or to meet a specific state’s requirement.
The Fund designates the following amounts or, if subsequently determined to be different, the maximum amount allowable for its fiscal year ended October 31, 2022:
| | | | | | |
Federal and State Income Tax | | | | | |
Long-Term Capital Gain Distributions | | $ | 1,084,597,813 | | | |
Qualified Dividend Income* | | | 11.36 | % | | |
Corporate Dividends Received Deduction* | | | 10.51 | % | | |
U.S. Treasury Obligations* | | | 0.00 | % | | |
Qualified Business Income* | | | 0.00 | % | | |
Business Interest Income* | | | 0.00 | % | | |
|
* The above percentages are based on ordinary income dividends paid to shareholders during the Fund’s fiscal year. |
| | | | | | |
Non-Resident Alien Shareholders | | | | | |
Short-Term Capital Gain Distributions | | $ | 162,051,056 | | | |
| | |
| 25 | | Invesco Discovery Mid Cap Growth Fund |
Trustees and Officers
The address of each trustee and officer is AIM Investment Funds (Invesco Investment Funds) (the “Trust”), 11 Greenway Plaza, Suite 1000, Houston, Texas 77046-1173. The trustees serve for the life of the Trust, subject to their earlier death, incapacitation, resignation, retirement or removal as more specifically provided in the Trust’s organizational documents. Each officer serves for a one year term or until their successors are elected and qualified. Column two below includes length of time served with predecessor entities, if any.
| | | | | | | | |
Name, Year of Birth and Position(s) Held with the Trust | | Trustee and/or Officer Since | | Principal Occupation(s) During Past 5 Years | | Number of Funds in Fund Complex Overseen by Trustee | | Other Directorship(s) Held by Trustee During Past 5 Years |
| Interested Trustee | | | | | | | | |
Martin L. Flanagan1 – 1960 Trustee and Vice Chair | | 2007 | | Executive Director, Chief Executive Officer and President, Invesco Ltd. (ultimate parent of Invesco and a global investment management firm); Trustee and Vice Chair, The Invesco Funds; Vice Chair, Investment Company Institute; and Member of Executive Board, SMU Cox School of Business Formerly: Advisor to the Board, Invesco Advisers, Inc. (formerly known as Invesco Institutional (N.A.), Inc.); Chairman and Chief Executive Officer, Invesco Advisers, Inc. (registered investment adviser); Director, Chairman, Chief Executive Officer and President, Invesco Holding Company (US), Inc. (formerly IVZ Inc.) (holding company), Invesco Group Services, Inc. (service provider) and Invesco North American Holdings, Inc. (holding company); Director, Chief Executive Officer and President, Invesco Holding Company Limited (parent of Invesco and a global investment management firm); Director, Invesco Ltd.; Chairman, Investment Company Institute and President, Co-Chief Executive Officer, Co-President, Chief Operating Officer and Chief Financial Officer, Franklin Resources, Inc. (global investment management organization) | | 189 | | None |
| 1 | Mr. Flanagan is considered an interested person (within the meaning of Section 2(a)(19) of the 1940 Act) of the Trust because he is an officer of the Adviser to the Trust, and an officer and a director of Invesco Ltd., ultimate parent of the Adviser. |
| | |
| T-1 | | Invesco Discovery Mid Cap Growth Fund |
Trustees and Officers–(continued)
| | | | | | | | |
Name, Year of Birth and Position(s) Held with the Trust | | Trustee and/or Officer Since | | Principal Occupation(s) During Past 5 Years | | Number of Funds in Fund Complex Overseen by Trustee | | Other Directorship(s) Held by Trustee During Past 5 Years |
| Independent Trustees | | | | | | | | |
Beth Ann Brown – 1968 Trustee (2019) and Chair (August 2022) | | 2019 | | Independent Consultant Formerly: Head of Intermediary Distribution, Managing Director, Strategic Relations, Managing Director, Head of National Accounts, Senior Vice President, National Account Manager and Senior Vice President, Key Account Manager, Columbia Management Investment Advisers LLC; Vice President, Key Account Manager, Liberty Funds Distributor, Inc.; and Trustee of certain Oppenheimer Funds | | 189 | | Director, Board of Directors of Caron Engineering Inc.; Advisor, Board of Advisors of Caron Engineering Inc.; President and Director, Acton Shapleigh Youth Conservation Corps (non-profit) Formerly: President and Director Director of Grahamtastic Connection (non-profit) |
Cynthia Hostetler – 1962 Trustee | | 2017 | | Non-Executive Director and Trustee of a number of public and private business corporations Formerly: Director, Aberdeen Investment Funds (4 portfolios); Director, Artio Global Investment LLC (mutual fund complex); Director, Edgen Group, Inc. (specialized energy and infrastructure products distributor); Director, Genesee & Wyoming, Inc. (railroads); Head of Investment Funds and Private Equity, Overseas Private Investment Corporation; President, First Manhattan Bancorporation, Inc.; and Attorney, Simpson Thacher & Bartlett LLP | | 189 | | Resideo Technologies, Inc. (smart home technology); Vulcan Materials Company (construction materials company); Trilinc Global Impact Fund; Textainer Group Holdings, (shipping container leasing company); Investment Company Institute (professional organization); and Independent Directors Council (professional organization) |
Eli Jones – 1961 Trustee | | 2016 | | Professor and Dean Emeritus, Mays Business School - Texas A&M University Formerly: Dean of Mays Business School-Texas A&M University; Professor and Dean, Walton College of Business, University of Arkansas and E.J. Ourso College of Business, Louisiana State University; and Director, Arvest Bank | | 189 | | Insperity, Inc. (formerly known as Administaff) (human resources provider); and Member of Regional Board of Directors and Board of Directors, First Financial Bancorp (regional bank) |
Elizabeth Krentzman – 1959 Trustee | | 2019 | | Formerly: Principal and Chief Regulatory Advisor for Asset Management Services and U.S. Mutual Fund Leader of Deloitte & Touche LLP; General Counsel of the Investment Company Institute (trade association); National Director of the Investment Management Regulatory Consulting Practice, Principal, Director and Senior Manager of Deloitte & Touche LLP; Assistant Director of the Division of Investment Management - Office of Disclosure and Investment Adviser Regulation of the U.S. Securities and Exchange Commission and various positions with the Division of Investment Management – Office of Regulatory Policy of the U.S. Securities and Exchange Commission; Associate at Ropes & Gray LLP; and Trustee of certain Oppenheimer Funds | | 189 | | Formerly: Member of the Cartica Funds Board of Directors (private investment fund); Trustee of the University of Florida National Board Foundation; and Member of the University of Florida Law Center Association, Inc. Board of Trustees, Audit Committee and Membership Committee |
Anthony J. LaCava, Jr. – 1956 Trustee | | 2019 | | Formerly: Director and Member of the Audit Committee, Blue Hills Bank (publicly traded financial institution) and Managing Partner, KPMG LLP | | 189 | | Blue Hills Bank; Chairman, Bentley University; Member, Business School Advisory Council; and Nominating Committee, KPMG LLP |
Prema Mathai-Davis – 1950 Trustee | | 2001 | | Retired Formerly: Co-Founder & Partner of Quantalytics Research, LLC, (a FinTech Investment Research Platform for the Self-Directed Investor); Trustee of YWCA Retirement Fund; CEO of YWCA of the USA; Board member of the NY Metropolitan Transportation Authority; Commissioner of the NYC Department of Aging; and Board member of Johns Hopkins Bioethics Institute | | 189 | | Member of Board of Positive Planet US (non-profit) and HealthCare Chaplaincy Network (non-profit) |
| | |
| T-2 | | Invesco Discovery Mid Cap Growth Fund |
Trustees and Officers–(continued)
| | | | | | | | |
Name, Year of Birth and Position(s) Held with the Trust | | Trustee and/or Officer Since | | Principal Occupation(s) During Past 5 Years | | Number of Funds in Fund Complex Overseen by Trustee | | Other Directorship(s) Held by Trustee During Past 5 Years |
| Independent Trustees–(continued) | | | | |
Joel W. Motley – 1952 Trustee | | 2019 | | Director of Office of Finance, Federal Home Loan Bank System; Managing Director of Carmona Motley Inc. (privately held financial advisor); Member of the Council on Foreign Relations and its Finance and Budget Committee; Chairman Emeritus of Board of Human Rights Watch and Member of its Investment Committee; and Member of Investment Committee Board of Historic Hudson Valley (non-profit cultural organization); Member of the Board, Blue Ocean Acquisition Corp.; and Member of the Vestry and the Investment Committee of Trinity Church Wall Street. Formerly: Managing Director of Public Capital Advisors, LLC (privately held financial advisor); Managing Director of Carmona Motley Hoffman, Inc. (privately held financial advisor); Trustee of certain Oppenheimer Funds; and Director of Columbia Equity Financial Corp. (privately held financial advisor) | | 189 | | Member of Board of Trust for Mutual Understanding (non-profit promoting the arts and environment); Member of Board of Greenwall Foundation (bioethics research foundation) and its Investment Committee; Member of Board of Friends of the LRC (non-profit legal advocacy); and Board Member and Investment Committee Member of Pulitzer Center for Crisis Reporting (non-profit journalism) |
Teresa M. Ressel – 1962 Trustee | | 2017 | | Non-executive director and trustee of a number of public and private business corporations Formerly: Chief Executive Officer, UBS Securities LLC (investment banking); Chief Operating Officer, UBS AG Americas (investment banking); Sr. Management Team Olayan America, The Olayan Group (international investor/commercial/industrial); Assistant Secretary for Management & Budget and Designated Chief Financial Officer, U.S. Department of Treasury and Director, ON Semiconductor Corporation (semiconductor manufacturing) | | 189 | | None |
Robert C. Troccoli – 1949 Trustee | | 2016 | | Retired Formerly: Adjunct Professor, University of Denver – Daniels College of Business; and Managing Partner, KPMG LLP | | 189 | | None |
Daniel S. Vandivort – 1954 Trustee | | 2019 | | President, Flyway Advisory Services LLC (consulting and property management) Formerly: President and Chief Investment Officer, previously Head of Fixed Income, Weiss Peck and Greer/Robeco Investment Management; Trustee and Chair, Weiss Peck and Greer Funds Board; and various capacities at CS First Boston including Head of Fixed Income at First Boston Asset Management. | | 189 | | Formerly: Trustee and Governance Chair, Oppenheimer Funds; Treasurer, Chairman of the Audit and Finance Committee, Huntington Disease Foundation of America |
| | |
| T-3 | | Invesco Discovery Mid Cap Growth Fund |
Trustees and Officers–(continued)
| | | | | | | | |
Name, Year of Birth and Position(s) Held with the Trust | | Trustee and/or Officer Since | | Principal Occupation(s) During Past 5 Years | | Number of Funds in Fund Complex Overseen by Trustee | | Other Directorship(s) Held by Trustee During Past 5 Years |
| Officers | | | | | | | | |
Sheri Morris – 1964 President and Principal Executive Officer | | 1999 | | Director, Invesco Trust Company; Head of Global Fund Services, Invesco Ltd.; President and Principal Executive Officer, The Invesco Funds; Vice President, Invesco Exchange-Traded Fund Trust, Invesco Exchange-Traded Fund Trust II, Invesco India Exchange-Traded Fund Trust, Invesco Actively Managed Exchange-Traded Fund Trust, Invesco Actively Managed Exchange-Traded Commodity Fund Trust and Invesco Exchange-Traded Self-Indexed Fund Trust; and Vice President, OppenheimerFunds, Inc. Formerly: Vice President, Treasurer and Principal Financial Officer, The Invesco Funds; Vice President, Invesco AIM Advisers, Inc., Invesco AIM Capital Management, Inc. and Invesco AIM Private Asset Management, Inc.; Assistant Vice President and Assistant Treasurer, The Invesco Funds; Vice President and Assistant Vice President, Invesco Advisers, Inc.; Assistant Vice President, Invesco AIM Capital Management, Inc. and Invesco AIM Private Asset Management, Inc.; Treasurer, Invesco Exchange-Traded Fund Trust, Invesco Exchange-Traded Fund Trust II, Invesco India Exchange-Traded Fund Trust and Invesco Actively Managed Exchange-Traded Fund Trust; and Senior Vice President, Invesco Advisers, Inc. (formerly known as Invesco Institutional (N.A.), Inc.) (registered investment adviser) | | N/A | | N/A |
Jeffrey H. Kupor – 1968 Senior Vice President, Chief Legal Officer and Secretary | | 2018 | | Head of Legal of the Americas, Invesco Ltd.; Senior Vice President and Secretary, Invesco Advisers, Inc. (formerly known as Invesco Institutional (N.A.), Inc.) (registered investment adviser); Secretary, Invesco Distributors, Inc. (formerly known as Invesco AIM Distributors, Inc.); Vice President and Secretary, Invesco Investment Services, Inc. (formerly known as Invesco AIM Investment Services, Inc.); Senior Vice President, Chief Legal Officer and Secretary, The Invesco Funds; Secretary and General Counsel, Invesco Investment Advisers LLC (formerly known as Van Kampen Asset Management); Secretary and General Counsel, Invesco Capital Markets, Inc. (formerly known as Van Kampen Funds Inc.); Chief Legal Officer, Invesco Exchange-Traded Fund Trust, Invesco Exchange-Traded Fund Trust II, Invesco India Exchange-Traded Fund Trust, Invesco Actively Managed Exchange-Traded Fund Trust, Invesco Actively Managed Exchange-Traded Commodity Fund Trust and Invesco Exchange-Traded Self-Indexed Fund Trust;; Secretary and Vice President, Harbourview Asset Management Corporation; Secretary and Vice President, OppenheimerFunds, Inc. and Invesco Managed Accounts, LLC; Secretary and Senior Vice President, OFI Global Institutional, Inc.; Secretary and Vice President, OFI SteelPath, Inc.; Secretary and Vice President, Oppenheimer Acquisition Corp.; Secretary and Vice President, Shareholder Services, Inc.; and Secretary and Vice President, Trinity Investment Management Corporation Formerly: Senior Vice President, Invesco Distributors, Inc.; Secretary and Vice President, Jemstep, Inc.; Head of Legal, Worldwide Institutional, Invesco Ltd.; Secretary and General Counsel, INVESCO Private Capital Investments, Inc.; Senior Vice President, Secretary and General Counsel, Invesco Management Group, Inc. (formerly known as Invesco AIM Management Group, Inc.); Assistant Secretary, INVESCO Asset Management (Bermuda) Ltd.; Secretary and General Counsel, Invesco Private Capital, Inc.; Assistant Secretary and General Counsel, INVESCO Realty, Inc.; Secretary and General Counsel, Invesco Senior Secured Management, Inc.; Secretary, Sovereign G./P. Holdings Inc.; Secretary, Invesco Indexing LLC; and Secretary, W.L. Ross & Co., LLC | | N/A | | N/A |
Andrew R. Schlossberg – 1974 Senior Vice President | | 2019 | | Senior Vice President, Invesco Group Services, Inc.; Head of the Americas and Senior Managing Director, Invesco Ltd.; Director and Senior Vice President, Invesco Advisers, Inc. (formerly known as Invesco Institutional (N.A.), Inc.) (registered investment adviser); Director and Chairman, Invesco Investment Services, Inc. (formerly known as Invesco AIM Investment Services, Inc.) (registered transfer agent); Senior Vice President, The Invesco Funds; and Director, Invesco Investment Advisers LLC (formerly known as Van Kampen Asset Management) Formerly: Director, President and Chairman, Invesco Insurance Agency, Inc.; Director, Invesco UK Limited; Director and Chief Executive, Invesco Asset Management Limited and Invesco Fund Managers Limited; Assistant Vice President, The Invesco Funds; Senior Vice President, Invesco Advisers, Inc. (formerly known as Invesco Institutional (N.A.), Inc.) (registered investment adviser); Director and Chief Executive, Invesco Administration Services Limited and Invesco Global Investment Funds Limited; Director, Invesco Distributors, Inc.; Head of EMEA, Invesco Ltd.; President, Invesco Actively Managed Exchange-Traded Commodity Fund Trust, Invesco Actively Managed Exchange-Traded Fund Trust, Invesco Exchange-Traded Fund Trust, Invesco Exchange-Traded Fund Trust II and Invesco India Exchange-Traded Fund Trust; and Managing Director and Principal Executive Officer, Invesco Capital Management LLC | | N/A | | N/A |
| | |
| T-4 | | Invesco Discovery Mid Cap Growth Fund |
Trustees and Officers–(continued)
| | | | | | | | |
Name, Year of Birth and Position(s) Held with the Trust | | Trustee and/or Officer Since | | Principal Occupation(s) During Past 5 Years | | Number of Funds in Fund Complex Overseen by Trustee | | Other Directorship(s) Held by Trustee During Past 5 Years |
| Officers–(continued) | | | | | | | | |
John M. Zerr – 1962 Senior Vice President | | 2006 | | Chief Operating Officer of the Americas; Senior Vice President, Invesco Advisers, Inc. (formerly known as Invesco Institutional (N.A.), Inc.) (registered investment adviser); Senior Vice President, Invesco Distributors, Inc. (formerly known as Invesco AIM Distributors, Inc.); Director and Vice President, Invesco Investment Services, Inc. (formerly known as Invesco AIM Investment Services, Inc.) Senior Vice President, The Invesco Funds; Managing Director, Invesco Capital Management LLC; Director, Invesco Investment Advisers LLC (formerly known as Van Kampen Asset Management); Senior Vice President, Invesco Capital Markets, Inc. (formerly known as Van Kampen Funds Inc.); Manager, Invesco Indexing LLC; Manager, Invesco Specialized Products, LLC; Member, Invesco Canada Funds Advisory Board; Director, President and Chief Executive Officer, Invesco Corporate Class Inc. (corporate mutual fund company); and Director, Chairman, President and Chief Executive Officer, Invesco Canada Ltd. (formerly known as Invesco Trimark Ltd./Invesco Trimark Ltèe) (registered investment adviser and registered transfer agent); President, Invesco, Inc.; President, Invesco Global Direct Real Estate Feeder GP Ltd.; President, Invesco IP Holdings (Canada) Ltd; President, Invesco Global Direct Real Estate GP Ltd.; President, Invesco Financial Services Ltd. / Services Financiers Invesco Ltée; and Director and Chairman, Invesco Trust Company Formerly: President, Trimark Investments Ltd/Services Financiers Invesco Ltee; Director and Senior Vice President, Invesco Insurance Agency, Inc.; Director and Senior Vice President, Invesco Management Group, Inc. (formerly known as Invesco AIM Management Group, Inc.); Secretary and General Counsel, Invesco Management Group, Inc. (formerly known as Invesco AIM Management Group, Inc.); Secretary, Invesco Investment Services, Inc. (formerly known as Invesco AIM Investment Services, Inc.); Chief Legal Officer and Secretary, The Invesco Funds; Secretary and General Counsel, Invesco Investment Advisers LLC (formerly known as Van Kampen Asset Management); Secretary and General Counsel, Invesco Capital Markets, Inc. (formerly known as Van Kampen Funds Inc.); Chief Legal Officer, Invesco Exchange-Traded Fund Trust, Invesco Exchange-Traded Fund Trust II, Invesco India Exchange-Traded Fund Trust, Invesco Actively Managed Exchange-Traded Fund Trust, Invesco Actively Managed Exchange-Traded Commodity Fund Trust and Invesco Exchange-Traded Self-Indexed Fund Trust; Secretary, Invesco Indexing LLC; Director, Secretary, General Counsel and Senior Vice President, Van Kampen Exchange Corp.; Director, Vice President and Secretary, IVZ Distributors, Inc. (formerly known as INVESCO Distributors, Inc.); Director and Vice President, INVESCO Funds Group, Inc.; Director and Vice President, Van Kampen Advisors Inc.; Director, Vice President, Secretary and General Counsel, Van Kampen Investor Services Inc.; Director and Secretary, Invesco Distributors, Inc. (formerly known as Invesco AIM Distributors, Inc.); Director, Senior Vice President, General Counsel and Secretary, Invesco AIM Advisers, Inc. and Van Kampen Investments Inc.; Director, Vice President and Secretary, Fund Management Company; Director, Senior Vice President, Secretary, General Counsel and Vice President, Invesco AIM Capital Management, Inc.; and Chief Operating Officer and General Counsel, Liberty Ridge Capital, Inc. (an investment adviser) | | N/A | | N/A |
Gregory G. McGreevey – 1962 Senior Vice President | | 2012 | | Senior Managing Director, Invesco Ltd.; Director, Chairman, President, and Chief Executive Officer, Invesco Advisers, Inc. (formerly known as Invesco Institutional (N.A.), Inc.) (registered investment adviser); Director, Invesco Mortgage Capital, Inc. and Invesco Senior Secured Management, Inc.; Senior Vice President, The Invesco Funds; President, SNW Asset Management Corporation and Invesco Managed Accounts, LLC; Chairman and Director, Invesco Private Capital, Inc.; Chairman and Director, INVESCO Private Capital Investments, Inc.; Chairman and Director, INVESCO Realty, Inc.; and Senior Vice President, Invesco Group Services, Inc. Formerly: Senior Vice President, Invesco Management Group, Inc. and Invesco Advisers, Inc.; Assistant Vice President, The Invesco Funds | | N/A | | N/A |
Adrien Deberghes – 1967 Principal Financial Officer, Treasurer and Vice President | | 2020 | | Head of the Fund Office of the CFO and Fund Administration; Vice President, Invesco Advisers, Inc.; Principal Financial Officer, Treasurer and Vice President, The Invesco Funds; Vice President, Invesco Exchange-Traded Fund Trust, Invesco Exchange-Traded Fund Trust II, Invesco India Exchange-Traded Fund Trust, Invesco Actively Managed Exchange-Traded Fund Trust, Invesco Actively Managed Exchange-Traded Commodity Fund Trust and Invesco Exchange-Traded Self-Indexed Fund Trust Formerly: Senior Vice President and Treasurer, Fidelity Investments | | N/A | | N/A |
Crissie M. Wisdom – 1969 Anti-Money Laundering Compliance Officer | | 2013 | | Anti-Money Laundering and OFAC Compliance Officer for Invesco U.S. entities including: Invesco Advisers, Inc. and its affiliates, Invesco Capital Markets, Inc., Invesco Distributors, Inc., Invesco Investment Services, Inc., The Invesco Funds, Invesco Capital Management, LLC, Invesco Trust Company; and Fraud Prevention Manager for Invesco Investment Services, Inc. | | N/A | | N/A |
| | |
| T-5 | | Invesco Discovery Mid Cap Growth Fund |
Trustees and Officers–(continued)
| | | | | | | | |
Name, Year of Birth and Position(s) Held with the Trust | | Trustee and/or Officer Since | | Principal Occupation(s) During Past 5 Years | | Number of Funds in Fund Complex Overseen by Trustee | | Other Directorship(s) Held by Trustee During Past 5 Years |
| Officers–(continued) | | | | | | | | |
Todd F. Kuehl – 1969 Chief Compliance Officer and Senior Vice President | | 2020 | | Chief Compliance Officer, Invesco Advisers, Inc. (registered investment adviser); and Chief Compliance Officer and Senior Vice President, The Invesco Funds Formerly: Managing Director and Chief Compliance Officer, Legg Mason (Mutual Funds); Chief Compliance Officer, Legg Mason Private Portfolio Group (registered investment adviser) | | N/A | | N/A |
James Bordewick, Jr. – 1959 Senior Vice President and Senior Officer | | 2022 | | Senior Vice President and Senior Officer, The Invesco Funds; and Chief Legal Officer, KingsCrowd, Inc. (research and analytical platform for investment in private capital markets) Formerly, Chief Operating Officer and Head of Legal and Regulatory, Netcapital (private capital investment platform); Managing Director, General Counsel of asset management and Chief Compliance Officer for asset management and private banking, Bank of America Corporation; Chief Legal Officer, Columbia Funds and BofA Funds; Senior Vice President and Associate General Counsel, MFS Investment Management; Chief Legal Officer, MFS Funds; Associate, Ropes & Gray; Associate, Gaston Snow & Ely Bartlett | | N/A | | N/A |
The Statement of Additional Information of the Trust includes additional information about the Fund’s Trustees and is available upon request, without charge, by calling 1.800.959.4246. Please refer to the Fund’s Statement of Additional Information for information on the Fund’s sub-advisers.
| | | | | | |
| Office of the Fund | | Investment Adviser | | Distributor | | Auditors |
| 11 Greenway Plaza, Suite 1000 | | Invesco Advisers, Inc. | | Invesco Distributors, Inc. | | PricewaterhouseCoopers LLP |
| Houston, TX 77046-1173 | | 1555 Peachtree Street, N.E. | | 11 Greenway Plaza, Suite 1000 | | 1000 Louisiana Street, Suite 5800 |
| | Atlanta, GA 30309 | | Houston, TX 77046-1173 | | Houston, TX 77002-5021 |
| | | |
| Counsel to the Fund | | Counsel to the Independent Trustees | | Transfer Agent | | Custodian |
| Stradley Ronon Stevens & Young, LLP | | Goodwin Procter LLP | | Invesco Investment Services, Inc. | | State Street Bank and Trust Company |
| 2005 Market Street, Suite 2600 | | 901 New York Avenue, N.W. | | 11 Greenway Plaza, Suite 1000 | | 225 Franklin Street |
| Philadelphia, PA 19103-7018 | | Washington, D.C. 20001 | | Houston, TX 77046-1173 | | Boston, MA 02110-2801 |
| | |
| T-6 | | Invesco Discovery Mid Cap Growth Fund |

Go paperless with eDelivery
Visit invesco.com/edelivery to enjoy the convenience and security of anytime electronic access to your investment documents.
With eDelivery, you can elect to have any or all of the following materials delivered straight to your inbox to download, save and print from your own computer:
∎ Fund reports and prospectuses
∎ Quarterly statements
∎ Daily confirmations
∎ Tax forms
Invesco mailing information
Send general correspondence to Invesco Investment Services, Inc., P.O. Box 219078, Kansas City, MO 64121-9078.
Important notice regarding delivery of security holder documents
To reduce Fund expenses, only one copy of most shareholder documents may be mailed to shareholders with multiple accounts at the same address (Householding). Mailing of your shareholder documents may be householded indefinitely unless you instruct us otherwise. If you do not want the mailing of these documents to be combined with those for other members of your household, please contact Invesco Investment Services, Inc. at 800 959 4246 or contact your financial institution. We will begin sending you individual copies for each account within 30 days after receiving your request.
Fund holdings and proxy voting information
The Fund provides a complete list of its portfolio holdings four times each year, at the end of each fiscal quarter. For the second and fourth quarters, the list appears, respectively, in the Fund’s semiannual and annual reports to shareholders. For the first and third quarters, the Fund files the list with the Securities and Exchange Commission (SEC) as an exhibit to its reports on Form N-PORT. The most recent list of portfolio holdings is available at invesco.com/completeqtrholdings. Shareholders can also look up the Fund’s Form N-PORT filings on the SEC website, sec.gov. The SEC file numbers for the Fund are shown below.
A description of the policies and procedures that the Fund uses to determine how to vote proxies relating to portfolio securities is available without charge, upon request, from our Client Services department at 800 959 4246, or at invesco.com/ corporate/about-us/esg. The information is also available on the SEC website, sec.gov.
Information regarding how the Fund voted proxies related to its portfolio securities during the most recent 12-month period ended June 30 is available at invesco.com/proxysearch. This information is also available on the SEC website, sec.gov.
Invesco Advisers, Inc. is an investment adviser; it provides investment advisory services to individual and institutional clients and does not sell securities. Invesco Distributors, Inc. is the US distributor for Invesco Ltd.’s retail mutual funds, exchange-traded funds and institutional money market funds. Both are wholly owned, indirect subsidiaries of Invesco Ltd.

| | | | |
| SEC file number(s): 811-05426 and 033-19338 | | Invesco Distributors, Inc. | | O-DMCG-AR-1 |

| | |
| | |
| Annual Report to Shareholders | | October 31, 2022 |
Invesco EQV Emerging Markets All Cap Fund
Nasdaq:
A: GTDDX ∎ C: GTDCX ∎ Y: GTDYX ∎ R5: GTDIX ∎ R6: GTDFX
Management’s Discussion of Fund Performance
| | | | |
| |
Performance summary | |
For the fiscal year ended October 31, 2022, Class A shares of Invesco EQV Emerging Markets All Cap Fund (the Fund), at net asset value (NAV), outperformed the MSCI Emerging Markets Index, the Fund’s broad market/style-specific benchmark. | |
Your Fund’s long-term performance appears later in this report. | |
| |
Fund vs. Indexes | |
Total returns, 10/31/21 to 10/31/22, at net asset value (NAV). Performance shown does not include applicable contingent deferred sales charges (CDSC) or front-end sales charges, which would have reduced performance. | |
Class A Shares | | | -30.89 | % |
Class C Shares | | | -31.40 | |
Class Y Shares | | | -30.71 | |
Class R5 Shares | | | -30.68 | |
Class R6 Shares | | | -30.60 | |
MSCI Emerging Markets Index▼ (Broad Market/Style-Specific Index) | | | -31.03 | |
Source(s): ▼RIMES Technologies Corp. | | | | |
Market conditions and your Fund
At the beginning of the fiscal year ended October 31, 2022, developed global equity markets were mostly positive, despite rising inflation and the emergence of Omicron, a new COVID-19 variant. Pandemic-related supply chain disruptions and labor shortages intensified at the end of 2021, resulting in broadly higher costs for companies and consumers. Emerging market equities declined due in part to COVID-19 concerns and China’s ongoing regulatory tightening in the private education and technology sectors and slowing economic growth.
Global equity markets declined in the first half of 2022 amid volatility sparked by Russia’s invasion of Ukraine, rising commodity prices, rampant global inflation and central banks shifting toward tighter monetary policy. Russia’s invasion exacerbated inflationary pressures, disrupting already strained supply chains, and increasing shortages of oil, gas and raw materials, with the price of oil rising sharply.
Inflation headwinds continued into the third quarter of 2022. The US Federal Reserve (the Fed), the European Central Bank and the Bank of England all raised interest rates. In contrast, the People’s Bank of China lowered its policy rate and the Bank of Japan kept rates the same. Emerging market equities, hampered by the strong US dollar, underperformed developed market equities.
During October 2022, developed market equities rebounded and were in positive territory. Developed market equities outperformed emerging market equities, which declined primarily driven by weakness in China as Chinese markets reacted to the reappointment of President Xi and his authority, with no signs of the country’s zero-COVID-19 policy being relaxed. Despite the rebound in October for developed market equities, at the end of the fiscal year, trailing one-year returns for developed market equities and
emerging market equities were both in negative territory.
Regardless of the macroeconomic environment, we remain focused on our bottom-up investment approach of identifying attractive companies that fit our earnings, quality and valuation (EQV) process.
The Fund outperformed its broad market/style-specific benchmark, the MSCI Emerging Markets Index, for the fiscal year. On the positive side, strong stock selection in the consumer discretionary sector was the largest contributor to the Fund’s relative performance. Within the sector, Brazil-based Arcos Dorados, the owner of the McDonald’s (not a Fund holding) franchise in Latin America and the Caribbean, was a key contributor to both absolute and relative results. The Fund’s holdings in the real estate sector outperformed those of the benchmark sector, adding to relative return. Brazil-based shopping centers company Multiplan Empreendimentos Imobiliarios and United Arab Emirates-based real estate developer Emaar Properties had strong positive returns during the fiscal year, contributing favorably to the Fund’s relative performance as well. Security selection and an overweight in the industrials sector also contributed to the Fund’s relative return. Mexico-based airport operator Grupo Aero-portuario del Centro Norte was a notable contributor within the industrials sector. On a geographic basis, stock selection in Mexico, Brazil and China contributed to the Fund’s relative performance. Overweights in Mexico and Brazil and an underweight in China were beneficial as well.
Conversely, security selection and an underweight in the financials sector was the largest detractor from relative Fund performance. Within the sector, SberBank of Russia was the most notable detractor. Due to market closures, lack of trading partners, low liquidity, settlement concerns and future uncertainty, Invesco has been employing fair value pricing for Russian equities held in its funds and the valuation of this security was
marked to zero on March 2, 2022. This impact was factored into the Fund’s NAV. Fund holdings in the communication services sector underperformed those of the benchmark sector, detracting from relative return. Russia-based internet company Yandex was a key detractor within communication services during the fiscal year. Similar to SberBank, the valuation of Yandex was marked to zero in March. Stock selection and an underweight in the energy sector also detracted from the Fund’s relative results. Not owning select benchmark index names, including Petroleo Brasileiro, negatively affected the Fund’s relative results. Geographically, security selection and an overweight in Russia detracted from relative Fund performance. Due to Russia’s invasion of Ukraine during the fiscal year, all Russian stocks were negatively impacted. An underweight in India and no exposure to Saudi Arabia also had a negative impact on the Fund’s relative performance.
During the fiscal year, we continued to look for opportunities to improve the growth potential and quality of the Fund’s portfolio by adding companies based on our EQV characteristics for each company. We added several new holdings, including Taiwan-based information technology (IT) company MediaTek, a fabless semiconductor company, China-based consumer staples company Chongqing Fuling Zhacai and China-based industrials company AirTAC International, a manufacturer and supplier of pneumatic control equipment. We sold several holdings, including China-based consumer discretionary company Alibaba Group Holding, IT company Sunny Optical Technology and consumer staples company China Feihe.
As always, we remain focused on a bottom-up investment approach of identifying attractive companies that fit our EQV-focused investment process. We continue to look for high-quality growth companies that exhibit the following characteristics: strong organic revenue growth; high returns on capital; pricing power; strong balance sheets; cash generation; effective capital allocation and reasonable valuations. In addition, we continue to favor companies that are resilient in weak economic environments. Our balanced EQV-focused approach aligns with our goal of delivering attractive risk-adjusted returns over the long term.
We thank you for your continued investment in Invesco EQV Emerging Markets All Cap Fund.
Portfolio manager(s):
Brent Bates
Steve Cao - Lead
Borge Endresen - Lead
Mark Jason
The views and opinions expressed in management’s discussion of Fund performance are those of Invesco Advisers, Inc. and its affiliates. These views
| | |
| 2 | | Invesco EQV Emerging Markets All Cap Fund |
and opinions are subject to change at any time based on factors such as market and economic conditions. These views and opinions may not be relied upon as investment advice or recommendations, or as an offer for a particular security. The information is not a complete analysis of every aspect of any market, country, industry, security or the Fund. Statements of fact are from sources considered reliable, but Invesco Advisers, Inc. makes no representation or warranty as to their completeness or accuracy. Although historical performance is no guarantee of future results, these insights may help you understand our investment management philosophy.
See important Fund and, if applicable, index disclosures later in this report.
| | |
| 3 | | Invesco EQV Emerging Markets All Cap Fund |
Your Fund’s Long-Term Performance
Results of a $10,000 Investment – Oldest Share Class(es)
Fund and index data from 10/31/12
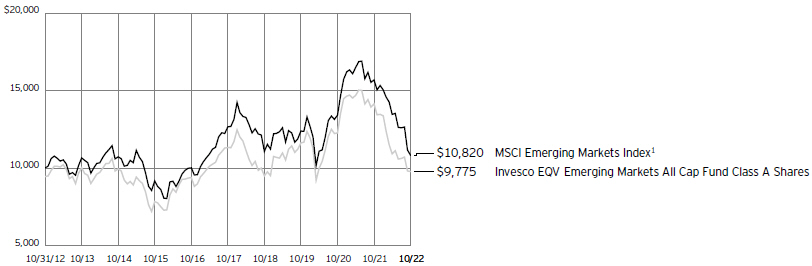
1 Source: RIMES Technologies Corp.
Past performance cannot guarantee future results.
The data shown in the chart include reinvested distributions, applicable sales charges and Fund expenses including management
fees. Index results include reinvested dividends, but they do not reflect sales charges. Performance of the peer group, if applicable, reflects fund expenses and management fees;
performance of a market index does not. Performance shown in the chart does not reflect deduction of taxes a shareholder would pay on Fund distributions or sale of Fund shares.
| | |
| 4 | | Invesco EQV Emerging Markets All Cap Fund |
| | | | |
| |
Average Annual Total Returns | |
As of 10/31/22, including maximum applicable sales charges | |
| |
Class A Shares | | | | |
Inception (1/11/94) | | | 4.00 | % |
10 Years | | | -0.23 | |
5 Years | | | -3.99 | |
1 Year | | | -34.68 | |
| |
Class C Shares | | | | |
Inception (3/1/99) | | | 7.14 | % |
10 Years | | | -0.26 | |
5 Years | | | -3.62 | |
1 Year | | | -32.06 | |
| |
Class Y Shares | | | | |
Inception (10/3/08) | | | 4.55 | % |
10 Years | | | 0.59 | |
5 Years | | | -2.66 | |
1 Year | | | -30.71 | |
| |
Class R5 Shares | | | | |
Inception (10/25/05) | | | 5.62 | % |
10 Years | | | 0.69 | |
5 Years | | | -2.58 | |
1 Year | | | -30.68 | |
| |
Class R6 Shares | | | | |
Inception (9/24/12) | | | 0.77 | % |
10 Years | | | 0.75 | |
5 Years | | | -2.51 | |
1 Year | | | -30.60 | |
The performance data quoted represent past performance and cannot guarantee future results; current performance may be lower or higher. Please visit invesco.com/performance for the most recent month-end performance. Performance figures reflect reinvested distributions, changes in net asset value and the effect of the maximum sales charge unless otherwise stated. Performance figures do not reflect deduction of taxes a shareholder would pay on Fund distributions or sale of Fund shares. Investment return and principal value will fluctuate so that you may have a gain or loss when you sell shares.
Class A share performance reflects the maximum 5.50% sales charge, and Class C share performance reflects the applicable contingent deferred sales charge (CDSC) for the period involved. The CDSC on Class C shares is 1% for the first year after purchase. Class Y, Class R5 and Class R6 shares do not have a front-end sales charge or a CDSC; therefore, performance is at net asset value.
The performance of the Fund’s share classes will differ primarily due to different sales charge structures and class expenses.
Fund performance reflects any applicable fee waivers and/or expense reimbursements. Had the adviser not waived fees and/or reimbursed expenses currently or in the past, returns would have been lower. See current prospectus for more information.
| | |
| 5 | | Invesco EQV Emerging Markets All Cap Fund |
Supplemental Information
Invesco Emerging Markets All Cap Fund’s investment objective is long-term growth of capital.
| ∎ | Unless otherwise stated, information presented in this report is as of October 31, 2022, and is based on total net assets. |
| ∎ | Unless otherwise noted, all data is provided by Invesco. |
| ∎ | To access your Fund’s reports/prospectus, visit invesco.com/fundreports. |
About indexes used in this report
| ∎ | The MSCI Emerging Markets Index is an unmanaged index considered representative of stocks of developing countries. The index is computed using the net return, which withholds applicable taxes for nonresident investors. |
| ∎ | The Fund is not managed to track the performance of any particular index, including the index(es) described here, and consequently, the performance of the Fund may deviate significantly from the performance of the index(es). |
| ∎ | A direct investment cannot be made in an index. Unless otherwise indicated, index results include reinvested dividends, and they do not reflect sales charges. Performance of the peer group, if applicable, reflects fund expenses; performance of a market index does not. |
|
|
This report must be accompanied or preceded by a currently effective Fund prospectus, which contains more complete information, including sales charges and expenses. Investors should read it carefully before investing. |
|
| NOT FDIC INSURED | MAY LOSE VALUE | NO BANK GUARANTEE |
| | |
| 6 | | Invesco EQV Emerging Markets All Cap Fund |
Fund Information
Portfolio Composition
| | |
| By sector | | % of total net assets |
| |
Consumer Discretionary | | 18.91% |
| |
Financials | | 17.82 |
| |
Consumer Staples | | 17.53 |
| |
Information Technology | | 12.01 |
| |
Industrials | | 9.03 |
| |
Health Care | | 7.50 |
| |
Real Estate | | 7.15 |
| |
Communication Services | | 5.23 |
| |
Money Market Funds Plus Other Assets Less Liabilities | | 4.82 |
Top 10 Equity Holdings*
| | | | |
| | | | | % of total net assets |
| | |
1. | | Yum China Holdings, Inc. | | 5.20% |
| | |
| 2. | | Arcos Dorados Holdings, Inc., Class A | | 4.67 |
| | |
| 3. | | HDFC Bank Ltd., ADR | | 4.34 |
| | |
| 4. | | Grupo Aeroportuario del Centro Norte S.A.B. de C.V. | | 3.98 |
| | |
| 5. | | Multiplan Empreendimentos Imobiliarios S.A. | | 3.66 |
| | |
| 6. | | Gedeon Richter PLC | | 3.52 |
| | |
| 7. | | Taiwan Semiconductor Manufacturing Co. Ltd. | | 3.33 |
| | |
| 8. | | Samsung Electronics Co. Ltd. | | 3.15 |
| | |
| 9. | | BDO Unibank, Inc. | | 3.08 |
| | |
| 10. | | JD.com, Inc., ADR | | 3.00 |
The Fund’s holdings are subject to change, and there is no assurance that the Fund will continue to hold any particular security.
* Excluding money market fund holdings, if any.
Data presented here are as of October 31, 2022.
| | |
| 7 | | Invesco EQV Emerging Markets All Cap Fund |
Schedule of Investments
October 31, 2022
| | | | | | | | |
| | | Shares | | | Value | |
|
| |
Common Stocks & Other Equity Interests–95.18% | |
Brazil–15.66% | | | | | | | | |
Ambev S.A., ADR | | | 7,405,469 | | | $ | 22,512,626 | |
|
| |
Arcos Dorados Holdings, Inc., Class A(a) | | | 9,723,960 | | | | 73,318,658 | |
|
| |
B3 S.A. - Brasil, Bolsa, Balcao | | | 6,129,960 | | | | 17,848,146 | |
|
| |
Multiplan Empreendimentos Imobiliarios S.A. | | | 11,259,329 | | | | 57,457,344 | |
|
| |
Raia Drogasil S.A. | | | 5,920,900 | | | | 30,157,561 | |
|
| |
Rede D’Or Sao Luiz S.A.(b) | | | 3,274,900 | | | | 20,395,612 | |
|
| |
TOTVS S.A. | | | 3,772,700 | | | | 24,218,901 | |
|
| |
| | | | | | | 245,908,848 | |
|
| |
| | |
China–23.25% | | | | | | | | |
Airtac International Group | | | 936,000 | | | | 21,499,107 | |
|
| |
China Mengniu Dairy Co. Ltd. | | | 8,812,000 | | | | 28,244,797 | |
|
| |
China Resources Beer Holdings Co. Ltd. | | | 5,904,000 | | | | 27,836,720 | |
|
| |
Chongqing Fuling Zhacai Group Co. Ltd., A Shares | | | 5,703,059 | | | | 17,596,054 | |
|
| |
Fuyao Glass Industry Group Co. Ltd., H Shares(b) | | | 6,369,200 | | | | 22,801,282 | |
|
| |
JD.com, Inc., ADR(c) | | | 1,262,867 | | | | 47,092,310 | |
|
| |
Prosus N.V. | | | 222,367 | | | | 9,677,972 | |
|
| |
Tencent Holdings Ltd. | | | 954,300 | | | | 25,040,606 | |
|
| |
Tongcheng Travel Holdings
Ltd.(b)(d) | | | 28,577,600 | | | | 44,347,172 | |
|
| |
Wuliangye Yibin Co. Ltd., A Shares | | | 2,140,260 | | | | 39,181,938 | |
|
| |
Yum China Holdings, Inc.(c) | | | 1,975,192 | | | | 81,674,189 | |
|
| |
| | | | | | | 364,992,147 | |
|
| |
| | |
Egypt–1.53% | | | | | | | | |
Eastern Co. S.A.E. | | | 14,250,488 | | | | 7,008,823 | |
|
| |
Egyptian Financial Group-Hermes Holding Co.(d) | | | 30,747,602 | | | | 17,043,138 | |
|
| |
| | | | | | | 24,051,961 | |
|
| |
| | |
France–2.17% | | | | | | | | |
Bollore SE | | | 6,808,819 | | | | 34,051,443 | |
|
| |
| | |
Hungary–3.52% | | | | | | | | |
Gedeon Richter PLC | | | 2,790,740 | | | | 55,184,097 | |
|
| |
| | |
India–5.90% | | | | | | | | |
Emami Ltd. | | | 4,289,538 | | | | 24,552,150 | |
|
| |
HDFC Bank Ltd., ADR | | | 1,092,650 | | | | 68,083,021 | |
|
| |
| | | | | | | 92,635,171 | |
|
| |
| | |
Indonesia–6.83% | | | | | | | | |
PT Bank Central Asia Tbk | | | 74,917,000 | | | | 42,214,811 | |
|
| |
PT Kalbe Farma Tbk | | | 319,828,200 | | | | 42,048,683 | |
|
| |
PT Telkom Indonesia (Persero) Tbk | | | 81,558,500 | | | | 23,001,263 | |
|
| |
| | | | | | | 107,264,757 | |
|
| |
| | |
Macau–0.50% | | | | | | | | |
Galaxy Entertainment Group Ltd. | | | 1,726,000 | | | | 7,864,780 | |
|
| |
| | |
Mexico–13.55% | | | | | | | | |
Bolsa Mexicana de Valores S.A.B. de C.V. | | | 20,133,720 | | | | 36,664,040 | |
|
| |
GMexico Transportes S.A.B. de C.V. | | | 18,885,130 | | | | 35,133,795 | |
|
| |
Grupo Aeroportuario del Centro Norte S.A.B. de C.V. | | | 7,831,898 | | | | 62,392,711 | |
|
| |
| | | | | | | | |
| | | Shares | | | Value | |
|
| |
Mexico–(continued) | | | | | | | | |
Grupo Aeroportuario del Pacifico S.A.B. de C.V., Class B | | | 898,238 | | | $ | 13,913,554 | |
|
| |
Kimberly-Clark de Mexico S.A.B. de C.V., Class A(c) | | | 21,447,492 | | | | 33,838,823 | |
|
| |
Wal-Mart de Mexico S.A.B. de C.V., Series V | | | 7,952,134 | | | | 30,716,036 | |
|
| |
| | | | | | | 212,658,959 | |
|
| |
| | |
Nigeria–1.29% | | | | | | | | |
Zenith Bank PLC | | | 447,469,084 | | | | 20,304,792 | |
|
| |
| | |
Philippines–5.38% | | | | | | | | |
BDO Unibank, Inc. | | | 21,884,310 | | | | 48,368,951 | |
|
| |
SM Investments Corp. | | | 613,590 | | | | 8,729,532 | |
|
| |
SM Prime Holdings, Inc. | | | 50,105,400 | | | | 27,382,559 | |
|
| |
| | | | | | | 84,481,042 | |
|
| |
| | |
Russia–0.00% | | | | | | | | |
Detsky Mir PJSC(e) | | | 6,640,610 | | | | 7 | |
|
| |
Moscow Exchange MICEX-RTS PJSC(d)(e) | | | 11,806,000 | | | | 12 | |
|
| |
Ozon Holdings PLC, ADR(d)(e) | | | 783,546 | | | | 1 | |
|
| |
Sberbank of Russia PJSC(d)(e) | | | 11,900,044 | | | | 12 | |
|
| |
Sberbank of Russia PJSC, Preference Shares(d)(e) | | | 15,636,015 | | | | 15 | |
|
| |
Yandex N.V., Class A(d)(e) | | | 1,617,426 | | | | 1 | |
|
| |
| | | | | | | 48 | |
|
| |
| | |
South Africa–0.65% | | | | | | | | |
Naspers Ltd., Class N | | | 98,890 | | | | 10,239,751 | |
|
| |
| | |
South Korea–4.31% | | | | | | | | |
Douzone Bizon Co. Ltd. | | | 335,094 | | | | 7,151,939 | |
|
| |
LEENO Industrial, Inc. | | | 116,138 | | | | 11,116,635 | |
|
| |
Samsung Electronics Co. Ltd. | | | 1,188,962 | | | | 49,441,205 | |
|
| |
| | | | | | | 67,709,779 | |
|
| |
| | |
Taiwan–6.16% | | | | | | | | |
ASPEED Technology, Inc. | | | 155,000 | | | | 8,013,766 | |
|
| |
MediaTek, Inc. | | | 1,187,000 | | | | 21,626,325 | |
|
| |
Taiwan Semiconductor Manufacturing Co. Ltd. | | | 4,348,000 | | | | 52,324,270 | |
|
| |
Visual Photonics Epitaxy Co. Ltd. | | | 8,216,000 | | | | 14,672,389 | |
|
| |
| | | | | | | 96,636,750 | |
|
| |
| | |
Turkey–1.87% | | | | | | | | |
Haci Omer Sabanci Holding A.S. | | | 16,256,131 | | | | 29,294,665 | |
|
| |
| | |
United Arab Emirates–1.75% | | | | | | | | |
Emaar Properties PJSC | | | 16,658,100 | | | | 27,505,720 | |
|
| |
| | |
Vietnam–0.86% | | | | | | | | |
Vietnam Dairy Products JSC | | | 4,290,448 | | | | 13,536,670 | |
|
| |
Total Common Stocks & Other Equity Interests
(Cost $1,577,685,662) | | | | 1,494,321,380 | |
|
| |
| | |
Money Market Funds–4.05% | | | | | | | | |
Invesco Government & Agency Portfolio, Institutional Class, 3.07%(a)(f) | | | 24,452,871 | | | | 24,452,871 | |
|
| |
Invesco Liquid Assets Portfolio, Institutional Class, 3.03%(a)(f) | | | 11,274,693 | | | | 11,276,948 | |
|
| |
See accompanying Notes to Financial Statements which are an integral part of the financial statements.
| | |
| 8 | | Invesco EQV Emerging Markets All Cap Fund |
| | | | | | | | |
| | | Shares | | | Value | |
|
| |
Money Market Funds–(continued) | |
Invesco Treasury Portfolio, Institutional Class, 3.08%(a)(f) | | | 27,946,138 | | | $ | 27,946,138 | |
|
| |
Total Money Market Funds (Cost $63,672,571) | | | | | | | 63,675,957 | |
|
| |
TOTAL INVESTMENTS IN SECURITIES
(excluding Investments purchased with cash collateral from securities on loan)–99.23%
(Cost $1,641,358,233) | | | | 1,557,997,337 | |
|
| |
|
Investments Purchased with Cash Collateral from Securities on Loan | |
Money Market Funds–3.27% | | | | | | | | |
Invesco Private Government Fund, 3.18%(a)(f)(g) | | | 14,372,862 | | | | 14,372,862 | |
|
| |
| | | | | | | | |
| | | Shares | | | Value | |
|
| |
Money Market Funds–(continued) | | | | | |
Invesco Private Prime Fund, 3.28%(a)(f)(g) | | | 36,948,524 | | | $ | 36,948,524 | |
|
| |
Total Investments Purchased with Cash Collateral from Securities on Loan
(Cost $51,318,188) | | | | 51,321,386 | |
|
| |
TOTAL INVESTMENTS IN SECURITIES–102.50%
(Cost $1,692,676,421) | | | | | | | 1,609,318,723 | |
|
| |
OTHER ASSETS LESS LIABILITIES–(2.50)% | | | | (39,252,113 | ) |
|
| |
NET ASSETS–100.00% | | | | | | $ | 1,570,066,610 | |
|
| |
Investment Abbreviations:
ADR – American Depositary Receipt
Notes to Schedule of Investments:
| (a) | Affiliated issuer. The issuer is affiliated by having an investment adviser that is under common control of Invesco Ltd. and/or is an “affiliated person” under the Investment Company Act of 1940, as amended (the “1940 Act”), which defines “affiliated person” to include an issuer of which a fund holds 5% or more of the outstanding voting securities. For the Investments in Other Affiliates below, the Fund has not owned enough of the outstanding voting securities of the issuer to have control (as defined in the 1940 Act) of that issuer. The table below shows the Fund’s transactions in, and earnings from, its investments in affiliates for the fiscal year ended October 31, 2022. |
| | | | | | | | | | | | | | | | | | | | | | | | | | | | |
| | | Value October 31, 2021 | | | Purchases at Cost | | | Proceeds from Sales | | | Change in Unrealized Appreciation | | | Realized Gain (Loss) | | | Value October 31, 2022 | | | Dividend
Income | |
| Investments in Affiliated Money Market Funds: | | | | | | | | | | | | | | | | | | | | | | | | | | | | |
Invesco Government & Agency Portfolio, Institutional Class | | $ | 51,451,993 | | | $ | 154,140,232 | | | $ | (181,139,354 | ) | | $ | - | | | $ | - | | | $ | 24,452,871 | | | $ | 288,581 | |
Invesco Liquid Assets Portfolio, Institutional Class | | | 30,570,539 | | | | 110,100,165 | | | | (129,385,252 | ) | | | 1,032 | | | | (9,536) | | | | 11,276,948 | | | | 147,126 | |
Invesco Treasury Portfolio, Institutional Class | | | 58,802,278 | | | | 176,160,264 | | | | (207,016,404 | ) | | | - | | | | - | | | | 27,946,138 | | | | 306,619 | |
| Investments Purchased with Cash Collateral from Securities on Loan: | | | | | | | | | | | | | | | | | | | | | | | | | | | | |
Invesco Private Government Fund | | | 312,596 | | | | 111,126,543 | | | | (97,066,277 | ) | | | - | | | | - | | | | 14,372,862 | | | | 57,903* | |
Invesco Private Prime Fund | | | 729,392 | | | | 261,332,962 | | | | (225,125,854 | ) | | | 3,198 | | | | 8,826 | | | | 36,948,524 | | | | 159,519* | |
| Investments in Other Affiliates: | | | | | | | | | | | | | | | | | | | | | | | | | | | | |
Arcos Dorados Holdings, Inc., Class A | | | 52,893,628 | | | | - | | | | (10,929,198 | ) | | | 34,274,952 | | | | (2,920,724) | | | | 73,318,658 | | | | 1,247,976 | |
Total | | $ | 194,760,426 | | | $ | 812,860,166 | | | $ | (850,662,339 | ) | | $ | 34,279,182 | | | $ | (2,921,434) | | | $ | 188,316,001 | | | $ | 2,207,724 | |
| | * | Represents the income earned on the investment of cash collateral, which is included in securities lending income on the Statement of Operations. Does not include rebates and fees paid to lending agent or premiums received from borrowers, if any. |
| (b) | Security purchased or received in a transaction exempt from registration under the Securities Act of 1933, as amended (the “1933 Act”). The security may be resold pursuant to an exemption from registration under the 1933 Act, typically to qualified institutional buyers. The aggregate value of these securities at October 31, 2022 was $87,544,066, which represented 5.58% of the Fund’s Net Assets. |
| (c) | All or a portion of this security was out on loan at October 31, 2022. |
| (d) | Non-income producing security. |
| (e) | Security valued using significant unobservable inputs (Level 3). See Note 3. |
| (f) | The rate shown is the 7-day SEC standardized yield as of October 31, 2022. |
| (g) | The security has been segregated to satisfy the commitment to return the cash collateral received in securities lending transactions upon the borrower’s return of the securities loaned. See Note 1I. |
See accompanying Notes to Financial Statements which are an integral part of the financial statements.
| | |
| 9 | | Invesco EQV Emerging Markets All Cap Fund |
Statement of Assets and Liabilities
October 31, 2022
| | | | |
Assets: | | | | |
| |
Investments in unaffiliated securities, at value (Cost $1,520,548,364)* | | $ | 1,421,002,722 | |
|
| |
Investments in affiliates, at value (Cost $172,128,057) | | | 188,316,001 | |
|
| |
Foreign currencies, at value (Cost $3,965,464) | | | 3,771,322 | |
|
| |
Receivable for: | | | | |
Investments sold | | | 9,803,584 | |
|
| |
Fund shares sold | | | 891,086 | |
|
| |
Dividends | | | 1,388,001 | |
|
| |
Investment for trustee deferred compensation and retirement plans | | | 250,090 | |
|
| |
Other assets | | | 79,241 | |
|
| |
Total assets | | | 1,625,502,047 | |
|
| |
| |
Liabilities: | | | | |
| |
Payable for: | | | | |
Fund shares reacquired | | | 2,463,558 | |
|
| |
Collateral upon return of securities loaned | | | 51,318,188 | |
|
| |
Accrued fees to affiliates | | | 716,053 | |
|
| |
Accrued trustees’ and officers’ fees and benefits | | | 2,560 | |
|
| |
Accrued other operating expenses | | | 655,009 | |
|
| |
Trustee deferred compensation and retirement plans | | | 280,069 | |
|
| |
Total liabilities | | | 55,435,437 | |
|
| |
Net assets applicable to shares outstanding | | $ | 1,570,066,610 | |
|
| |
| |
Net assets consist of: | | | | |
| |
Shares of beneficial interest | | $ | 1,660,818,022 | |
|
| |
Distributable earnings (loss) | | | (90,751,412 | ) |
|
| |
| | $ | 1,570,066,610 | |
|
| |
| | | | |
Net Assets: | | | | |
| |
Class A | | $ | 388,330,340 | |
|
| |
Class C | | $ | 7,695,646 | |
|
| |
Class Y | | $ | 591,206,164 | |
|
| |
Class R5 | | $ | 135,693,087 | |
|
| |
Class R6 | | $ | 447,141,373 | |
|
| |
|
Shares outstanding, no par value, with an unlimited number of shares authorized: | |
| |
Class A | | | 13,991,721 | |
|
| |
Class C | | | 284,875 | |
|
| |
Class Y | | | 21,277,961 | |
|
| |
Class R5 | | | 4,897,868 | |
|
| |
Class R6 | | | 16,143,546 | |
|
| |
Class A: | | | | |
Net asset value per share | | $ | 27.75 | |
|
| |
Maximum offering price per share
(Net asset value of $27.75 ÷ 94.50%) | | $ | 29.37 | |
|
| |
Class C: | | | | |
Net asset value and offering price per share | | $ | 27.01 | |
|
| |
Class Y: | | | | |
Net asset value and offering price per share | | $ | 27.78 | |
|
| |
Class R5: | | | | |
Net asset value and offering price per share | | $ | 27.70 | |
|
| |
Class R6: | | | | |
Net asset value and offering price per share | | $ | 27.70 | |
|
| |
| * | At October 31, 2022, securities with an aggregate value of $49,415,297 were on loan to brokers. |
See accompanying Notes to Financial Statements which are an integral part of the financial statements.
| | |
| 10 | | Invesco EQV Emerging Markets All Cap Fund |
Statement of Operations
For the year ended October 31, 2022
| | | | |
Investment income: | | | | |
Dividends (net of foreign withholding taxes of $5,167,842) | | $ | 48,017,978 | |
|
| |
Dividends from affiliates (includes net securities lending income of $15,004) | | | 2,005,306 | |
|
| |
Total investment income | | | 50,023,284 | |
|
| |
| |
Expenses: | | | | |
Advisory fees | | | 17,980,677 | |
|
| |
Administrative services fees | | | 289,355 | |
|
| |
Custodian fees | | | 935,033 | |
|
| |
Distribution fees: | | | | |
Class A | | | 1,181,479 | |
|
| |
Class C | | | 111,612 | |
|
| |
Transfer agent fees – A, C and Y | | | 2,095,525 | |
|
| |
Transfer agent fees – R5 | | | 172,317 | |
|
| |
Transfer agent fees – R6 | | | 192,235 | |
|
| |
Trustees’ and officers’ fees and benefits | | | 36,477 | |
|
| |
Registration and filing fees | | | 135,069 | |
|
| |
Reports to shareholders | | | 245,812 | |
|
| |
Professional services fees | | | 97,670 | |
|
| |
Other | | | 13,693 | |
|
| |
Total expenses | | | 23,486,954 | |
|
| |
Less: Fees waived and/or expense offset arrangement(s) | | | (94,004 | ) |
|
| |
Net expenses | | | 23,392,950 | |
|
| |
Net investment income | | | 26,630,334 | |
|
| |
| |
Realized and unrealized gain (loss) from: | | | | |
Net realized gain (loss) from: | | | | |
Unaffiliated investment securities | | | (26,874,936 | ) |
|
| |
Affiliated investment securities | | | (2,921,434 | ) |
|
| |
Foreign currencies | | | (172,212 | ) |
|
| |
| | | (29,968,582 | ) |
|
| |
Change in net unrealized appreciation (depreciation) of: | | | | |
Unaffiliated investment securities (net of foreign taxes of $116,485) | | | (791,507,049 | ) |
|
| |
Affiliated investment securities | | | 34,279,182 | |
|
| |
Foreign currencies | | | (132,860 | ) |
|
| |
| | | (757,360,727 | ) |
|
| |
Net realized and unrealized gain (loss) | | | (787,329,309 | ) |
|
| |
Net increase (decrease) in net assets resulting from operations | | $ | (760,698,975 | ) |
|
| |
See accompanying Notes to Financial Statements which are an integral part of the financial statements.
| | |
| 11 | | Invesco EQV Emerging Markets All Cap Fund |
Statement of Changes in Net Assets
For the years ended October 31, 2022 and 2021
| | | | | | | | |
| | | 2022 | | | 2021 | |
|
| |
Operations: | | | | | | | | |
| | |
Net investment income | | $ | 26,630,334 | | | $ | 22,112,473 | |
|
| |
Net realized gain (loss) | | | (29,968,582 | ) | | | 97,241,994 | |
|
| |
Change in net unrealized appreciation (depreciation) | | | (757,360,727 | ) | | | 227,576,870 | |
|
| |
Net increase (decrease) in net assets resulting from operations | | | (760,698,975 | ) | | | 346,931,337 | |
|
| |
| | |
Distributions to shareholders from distributable earnings: | | | | | | | | |
| | |
Class A | | | (23,821,085 | ) | | | (30,719,071 | ) |
|
| |
Class C | | | (557,095 | ) | | | (797,143 | ) |
|
| |
Class Y | | | (45,068,032 | ) | | | (59,858,079 | ) |
|
| |
Class R5 | | | (9,177,465 | ) | | | (11,073,849 | ) |
|
| |
Class R6 | | | (33,332,046 | ) | | | (30,036,166 | ) |
|
| |
Total distributions from distributable earnings | | | (111,955,723 | ) | | | (132,484,308 | ) |
|
| |
| | |
Share transactions–net: | | | | | | | | |
| | |
Class A | | | (936,473 | ) | | | (15,190,495 | ) |
|
| |
Class C | | | (3,028,262 | ) | | | (2,792,302 | ) |
|
| |
Class Y | | | (132,804,152 | ) | | | (53,469,564 | ) |
|
| |
Class R5 | | | (6,196,426 | ) | | | 15,141,754 | |
|
| |
Class R6 | | | (40,373,264 | ) | | | 203,423,460 | |
|
| |
Net increase (decrease) in net assets resulting from share transactions | | | (183,338,577 | ) | | | 147,112,853 | |
|
| |
Net increase (decrease) in net assets | | | (1,055,993,275 | ) | | | 361,559,882 | |
|
| |
| | |
Net assets: | | | | | | | | |
| | |
Beginning of year | | | 2,626,059,885 | | | | 2,264,500,003 | |
|
| |
End of year | | $ | 1,570,066,610 | | | $ | 2,626,059,885 | |
|
| |
See accompanying Notes to Financial Statements which are an integral part of the financial statements.
| | |
| 12 | | Invesco EQV Emerging Markets All Cap Fund |
Financial Highlights
The following schedule presents financial highlights for a share of the Fund outstanding throughout the periods indicated.
| | | | | | | | | | | | | | | | | | | | | | | | | | | | | | | | | | | | | | | | | | | | | | | | | | | | | | | | |
| | | Net asset value, beginning of period | | Net investment income (loss)(a) | | Net gains (losses) on securities (both realized and unrealized) | | Total from investment operations | | Dividends from net investment income | | Distributions from net realized gains | | Total distributions | | Net asset value, end of period | | Total return (b) | | Net assets, end of period (000’s omitted) | | Ratio of expenses to average net assets with fee waivers and/or expenses absorbed | | Ratio of expenses to average net assets without fee waivers and/or expenses absorbed | | Ratio of net investment income (loss) to average net assets | | Portfolio turnover (c) |
Class A | | | | | | | | | | | | | | | | | | | | | | | | | | | | | | | | | | | | | | | | | | | | | | | | | | | | | | | | |
Year ended 10/31/22 | | | $41.94 | | | | $0.36 | | | | $(12.84 | ) | | | $(12.48 | ) | | | $(0.21 | ) | | | $(1.50 | ) | | | $(1.71 | ) | | | $27.75 | | | | (30.89 | )% | | | $ 388,330 | | | | 1.39 | % | | | 1.39 | % | | | 1.06 | % | | | 17 | % |
Year ended 10/31/21 | | | 38.27 | | | | 0.26 | | | | 5.58 | | | | 5.84 | | | | (0.40 | ) | | | (1.77 | ) | | | (2.17 | ) | | | 41.94 | | | | 15.22 | | | | 591,114 | | | | 1.31 | | | | 1.31 | | | | 0.61 | | | | 19 | |
Year ended 10/31/20 | | | 36.81 | | | | 0.27 | | | | 1.76 | | | | 2.03 | | | | (0.57 | ) | | | – | | | | (0.57 | ) | | | 38.27 | | | | 5.54 | | | | 552,262 | | | | 1.37 | | | | 1.38 | | | | 0.76 | | | | 33 | |
Year ended 10/31/19 | | | 30.54 | | | | 0.55 | | | | 6.18 | | | | 6.73 | | | | (0.46 | ) | | | – | | | | (0.46 | ) | | | 36.81 | | | | 22.39 | | | | 583,346 | | | | 1.37 | | | | 1.38 | | | | 1.62 | | | | 7 | |
Year ended 10/31/18 | | | 36.66 | | | | 0.44 | | | | (6.29 | ) | | | (5.85 | ) | | | (0.27 | ) | | | – | | | | (0.27 | ) | | | 30.54 | | | | (16.09 | ) | | | 544,574 | | | | 1.39 | | | | 1.40 | | | | 1.23 | | | | 20 | |
Class C | | | | | | | | | | | | | | | | | | | | | | | | | | | | | | | | | | | | | | | | | | | | | | | | | | | | | | | | |
Year ended 10/31/22 | | | 40.94 | | | | 0.11 | | | | (12.54 | ) | | | (12.43 | ) | | | – | | | | (1.50 | ) | | | (1.50 | ) | | | 27.01 | | | | (31.40 | ) | | | 7,696 | | | | 2.14 | | | | 2.14 | | | | 0.31 | | | | 17 | |
Year ended 10/31/21 | | | 37.38 | | | | (0.06 | ) | | | 5.45 | | | | 5.39 | | | | (0.06 | ) | | | (1.77 | ) | | | (1.83 | ) | | | 40.94 | | | | 14.35 | | | | 15,632 | | | | 2.06 | | | | 2.06 | | | | (0.14 | ) | | | 19 | |
Year ended 10/31/20 | | | 35.83 | | | | 0.00 | | | | 1.71 | | | | 1.71 | | | | (0.16 | ) | | | – | | | | (0.16 | ) | | | 37.38 | | | | 4.78 | | | | 16,812 | | | | 2.12 | | | | 2.13 | | | | 0.01 | | | | 33 | |
Year ended 10/31/19 | | | 29.64 | | | | 0.28 | | | | 6.05 | | | | 6.33 | | | | (0.14 | ) | | | – | | | | (0.14 | ) | | | 35.83 | | | | 21.48 | | | | 22,941 | | | | 2.12 | | | | 2.13 | | | | 0.87 | | | | 7 | |
Year ended 10/31/18 | | | 35.59 | | | | 0.17 | | | | (6.12 | ) | | | (5.95 | ) | | | (0.00 | ) | | | – | | | | (0.00 | ) | | | 29.64 | | | | (16.71 | ) | | | 55,823 | | | | 2.14 | | | | 2.15 | | | | 0.48 | | | | 20 | |
Class Y | | | | | | | | | | | | | | | | | | | | | | | | | | | | | | | | | | | | | | | | | | | | | | | | | | | | | | | | |
Year ended 10/31/22 | | | 42.00 | | | | 0.44 | | | | (12.84 | ) | | | (12.40 | ) | | | (0.32 | ) | | | (1.50 | ) | | | (1.82 | ) | | | 27.78 | | | | (30.71 | ) | | | 591,206 | | | | 1.14 | | | | 1.14 | | | | 1.31 | | | | 17 | |
Year ended 10/31/21 | | | 38.32 | | | | 0.37 | | | | 5.58 | | | | 5.95 | | | | (0.50 | ) | | | (1.77 | ) | | | (2.27 | ) | | | 42.00 | | | | 15.50 | | | | 1,062,846 | | | | 1.06 | | | | 1.06 | | | | 0.86 | | | | 19 | |
Year ended 10/31/20 | | | 36.85 | | | | 0.36 | | | | 1.78 | | | | 2.14 | | | | (0.67 | ) | | | – | | | | (0.67 | ) | | | 38.32 | | | | 5.82 | | | | 1,015,412 | | | | 1.12 | | | | 1.13 | | | | 1.01 | | | | 33 | |
Year ended 10/31/19 | | | 30.60 | | | | 0.63 | | | | 6.18 | | | | 6.81 | | | | (0.56 | ) | | | – | | | | (0.56 | ) | | | 36.85 | | | | 22.69 | | | | 968,060 | | | | 1.12 | | | | 1.13 | | | | 1.87 | | | | 7 | |
Year ended 10/31/18 | | | 36.74 | | | | 0.53 | | | | (6.31 | ) | | | (5.78 | ) | | | (0.36 | ) | | | – | | | | (0.36 | ) | | | 30.60 | | | | (15.89 | ) | | | 986,550 | | | | 1.14 | | | | 1.15 | | | | 1.48 | | | | 20 | |
Class R5 | | | | | | | | | | | | | | | | | | | | | | | | | | | | | | | | | | | | | | | | | | | | | | | | | | | | | | | | |
Year ended 10/31/22 | | | 41.88 | | | | 0.46 | | | | (12.80 | ) | | | (12.34 | ) | | | (0.34 | ) | | | (1.50 | ) | | | (1.84 | ) | | | 27.70 | | | | (30.68 | ) | | | 135,693 | | | | 1.07 | | | | 1.07 | | | | 1.38 | | | | 17 | |
Year ended 10/31/21 | | | 38.22 | | | | 0.39 | | | | 5.57 | | | | 5.96 | | | | (0.53 | ) | | | (1.77 | ) | | | (2.30 | ) | | | 41.88 | | | | 15.56 | | | | 215,122 | | | | 1.02 | | | | 1.02 | | | | 0.90 | | | | 19 | |
Year ended 10/31/20 | | | 36.76 | | | | 0.39 | | | | 1.77 | | | | 2.16 | | | | (0.70 | ) | | | – | | | | (0.70 | ) | | | 38.22 | | | | 5.90 | | | | 182,631 | | | | 1.05 | | | | 1.06 | | | | 1.08 | | | | 33 | |
Year ended 10/31/19 | | | 30.55 | | | | 0.66 | | | | 6.16 | | | | 6.82 | | | | (0.61 | ) | | | – | | | | (0.61 | ) | | | 36.76 | | | | 22.79 | | | | 250,287 | | | | 1.03 | | | | 1.04 | | | | 1.96 | | | | 7 | |
Year ended 10/31/18 | | | 36.68 | | | | 0.56 | | | | (6.29 | ) | | | (5.73 | ) | | | (0.40 | ) | | | – | | | | (0.40 | ) | | | 30.55 | | | | (15.80 | ) | | | 287,511 | | | | 1.04 | | | | 1.05 | | | | 1.58 | | | | 20 | |
Class R6 | | | | | | | | | | | | | | | | | | | | | | | | | | | | | | | | | | | | | | | | | | | | | | | | | | | | | | | | |
Year ended 10/31/22 | | | 41.89 | | | | 0.48 | | | | (12.79 | ) | | | (12.31 | ) | | | (0.38 | ) | | | (1.50 | ) | | | (1.88 | ) | | | 27.70 | | | | (30.60 | ) | | | 447,141 | | | | 1.00 | | | | 1.00 | | | | 1.45 | | | | 17 | |
Year ended 10/31/21 | | | 38.22 | | | | 0.42 | | | | 5.58 | | | | 6.00 | | | | (0.56 | ) | | | (1.77 | ) | | | (2.33 | ) | | | 41.89 | | | | 15.67 | | | | 741,346 | | | | 0.93 | | | | 0.93 | | | | 0.99 | | | | 19 | |
Year ended 10/31/20 | | | 36.76 | | | | 0.42 | | | | 1.76 | | | | 2.18 | | | | (0.72 | ) | | | – | | | | (0.72 | ) | | | 38.22 | | | | 5.96 | | | | 497,383 | | | | 0.96 | | | | 0.97 | | | | 1.17 | | | | 33 | |
Year ended 10/31/19 | | | 30.55 | | | | 0.68 | | | | 6.16 | | | | 6.84 | | | | (0.63 | ) | | | – | | | | (0.63 | ) | | | 36.76 | | | | 22.88 | | | | 383,400 | | | | 0.97 | | | | 0.98 | | | | 2.02 | | | | 7 | |
Year ended 10/31/18 | | | 36.67 | | | | 0.57 | | | | (6.27 | ) | | | (5.70 | ) | | | (0.42 | ) | | | – | | | | (0.42 | ) | | | 30.55 | | | | (15.74 | ) | | | 365,000 | | | | 0.99 | | | | 1.00 | | | | 1.63 | | | | 20 | |
| (a) | Calculated using average shares outstanding. |
| (b) | Includes adjustments in accordance with accounting principles generally accepted in the United States of America and as such, the net asset value for financial reporting purposes and the returns based upon those net asset values may differ from the net asset value and returns for shareholder transactions. Does not include sales charges and is not annualized for periods less than one year, if applicable. |
| (c) | Portfolio turnover is calculated at the fund level and is not annualized for periods less than one year, if applicable. |
See accompanying Notes to Financial Statements which are an integral part of the financial statements.
| | |
| 13 | | Invesco EQV Emerging Markets All Cap Fund |
Notes to Financial Statements
October 31, 2022
NOTE 1–Significant Accounting Policies
Invesco EQV Emerging Markets All Cap Fund (the “Fund”) is a series portfolio of AIM Investment Funds (Invesco Investment Funds) (the “Trust”). The Trust is organized as a Delaware statutory trust and is registered under the Investment Company Act of 1940, as amended (the “1940 Act”), as an open-end series management investment company authorized to issue an unlimited number of shares of beneficial interest. Information presented in these financial statements pertains only to the Fund. Matters affecting the Fund or each class will be voted on exclusively by the shareholders of the Fund or each class.
The Fund’s investment objective is long-term growth of capital.
The Fund currently consists of five different classes of shares: Class A, Class C, Class Y, Class R5 and Class R6. Class Y shares are available only to certain investors. Class A shares are sold with a front-end sales charge unless certain waiver criteria are met. Under certain circumstances, load waived shares may be subject to contingent deferred sales charges (“CDSC”). Class C shares are sold with a CDSC. Class Y, Class R5 and Class R6 shares are sold at net asset value. Class C shares held for eight years after purchase are eligible for automatic conversion into Class A shares of the same Fund (the “Conversion Feature”). The automatic conversion pursuant to the Conversion Feature will generally occur at the end of the month following the eighth anniversary after a purchase of Class C shares.
The Fund is an investment company and accordingly follows the investment company accounting and reporting guidance in accordance with Financial Accounting Standards Board Accounting Standards Codification Topic 946, Financial Services - Investment Companies.
The following is a summary of the significant accounting policies followed by the Fund in the preparation of its financial statements.
| A. | Security Valuations – Securities, including restricted securities, are valued according to the following policy. |
A security listed or traded on an exchange is generally valued at its trade price or official closing price that day as of the close of the exchange where the security is principally traded, or lacking any trades or official closing price on a particular day, the security may be valued at the closing bid price on that day. Securities traded in the over-the-counter market are valued based on prices furnished by independent pricing services or market makers. When such securities are valued using prices provided by an independent pricing service they may be considered fair valued. Futures contracts are valued at the daily settlement price set by an exchange on which they are principally traded. U.S. exchange-traded options are valued at the mean between the last bid and asked prices from the exchange on which they are principally traded. Non-U.S. exchange-traded options are valued at the final settlement price set by the exchange on which they trade. Options not listed on an exchange and swaps generally are valued using pricing provided from independent pricing services.
Securities of investment companies that are not exchange-traded (e.g., open-end mutual funds) are valued using such company’s end-of-business-day net asset value per share.
Deposits, other obligations of U.S. and non-U.S. banks and financial institutions are valued at their daily account value.
Fixed income securities (including convertible debt securities) generally are valued on the basis of prices provided by independent pricing services. Prices provided by the pricing service may be determined without exclusive reliance on quoted prices, and may reflect appropriate factors such as institution-size trading in similar groups of securities, developments related to specific securities, dividend rate (for unlisted equities), yield (for debt obligations), quality, type of issue, coupon rate (for debt obligations), maturity (for debt obligations), individual trading characteristics and other market data. Pricing services generally value debt obligations assuming orderly transactions of institutional round lot size, but a fund may hold or transact in the same securities in smaller, odd lot sizes. Odd lots often trade at lower prices than institutional round lots, and their value may be adjusted accordingly. Debt obligations are subject to interest rate and credit risks. In addition, all debt obligations involve some risk of default with respect to interest and/or principal payments.
Foreign securities’ (including foreign exchange contracts) prices are converted into U.S. dollar amounts using the applicable exchange rates as of the close of the New York Stock Exchange (“NYSE”). If market quotations are available and reliable for foreign exchange-traded equity securities, the securities will be valued at the market quotations. Invesco Advisers, Inc. (the “Adviser” or “Invesco”) may use various pricing services to obtain market quotations as well as fair value prices. Because trading hours for certain foreign securities end before the close of the NYSE, closing market quotations may become not representative of market value in the Adviser’s judgment (“unreliable”). If, between the time trading ends on a particular security and the close of the customary trading session on the NYSE, a significant event occurs that makes the closing price of the security unreliable, the Adviser may fair value the security. If the event is likely to have affected the closing price of the security, the security will be valued at fair value in good faith in accordance with Board- approved policies and related Adviser procedures (“Valuation Procedures”). Adjustments to closing prices to reflect fair value may also be based on a screening process of an independent pricing service to indicate the degree of certainty, based on historical data, that the closing price in the principal market where a foreign security trades is not the current value as of the close of the NYSE. Foreign securities’ prices meeting the degree of certainty that the price is not reflective of current value will be priced at the indication of fair value from the independent pricing service. Multiple factors may be considered by the independent pricing service in determining adjustments to reflect fair value and may include information relating to sector indices, American Depositary Receipts and domestic and foreign index futures. Foreign securities may have additional risks including exchange rate changes, potential for sharply devalued currencies and high inflation, political and economic upheaval, the relative lack of issuer information, relatively low market liquidity and the potential lack of strict financial and accounting controls and standards.
Unlisted securities will be valued using prices provided by independent pricing services or by another method that the Adviser, in its judgment, believes better reflects the security’s fair value in accordance with the Valuation Procedures.
Securities for which market prices are not provided by any of the above methods may be valued based upon quotes furnished by independent sources. The last bid price may be used to value equity securities. The mean between the last bid and asked prices may be used to value debt obligations, including corporate loans.
Securities for which market quotations are not readily available are fair valued by the Adviser in accordance with the Valuation Procedures. If a fair value price provided by a pricing service is unreliable, the Adviser will fair value the security using the Valuation Procedures. Issuer specific events, market trends, bid/asked quotes of brokers and information providers and other market data may be reviewed in the course of making a good faith determination of a security’s fair value.
The Fund may invest in securities that are subject to interest rate risk, meaning the risk that the prices will generally fall as interest rates rise and, conversely, the prices will generally rise as interest rates fall. Specific securities differ in their sensitivity to changes in interest rates depending on their individual characteristics. Changes in interest rates may result in increased market volatility, which may affect the value and/or liquidity of certain Fund investments.
Valuations change in response to many factors including the historical and prospective earnings of the issuer, the value of the issuer’s assets, general market conditions which are not specifically related to the particular issuer, such as real or perceived adverse economic conditions, changes in the general outlook for revenues or corporate earnings, changes in interest or currency rates, regional or global instability, natural or environmental disasters, widespread disease or other public health issues, war, acts of terrorism, significant governmental actions or adverse investor sentiment generally and market liquidity. Because of the inherent uncertainties of valuation, the values reflected in the financial statements may materially differ from the value received upon actual sale of those investments.
The price the Fund could receive upon the sale of any investment may differ from the Adviser’s valuation of the investment, particularly for securities that are valued using a fair valuation technique. When fair valuation techniques are applied, the Adviser uses available information, including both observable and unobservable inputs and assumptions, to determine a methodology that will result in a valuation that the Adviser believes approximates market value. Fund securities that are fair valued may be subject to greater fluctuation in their value from one day to the next than would be the case if market quotations were used. Because of the inherent uncertainties of valuation, and the degree of subjectivity in such decisions, the Fund could realize a greater or lesser than expected gain or loss upon the sale of the investment.
| | |
| 14 | | Invesco EQV Emerging Markets All Cap Fund |
| B. | Securities Transactions and Investment Income – Securities transactions are accounted for on a trade date basis. Realized gains or losses on sales are computed on the basis of specific identification of the securities sold. Interest income (net of withholding tax, if any) is recorded on an accrual basis from settlement date and includes coupon interest and amortization of premium and accretion of discount on debt securities as applicable. Dividend income (net of withholding tax, if any) is recorded on the ex-dividend date. |
The Fund may periodically participate in litigation related to Fund investments. As such, the Fund may receive proceeds from litigation settlements. Any proceeds received are included in the Statement of Operations as realized gain (loss) for investments no longer held and as unrealized gain (loss) for investments still held.
Brokerage commissions and mark ups are considered transaction costs and are recorded as an increase to the cost basis of securities purchased and/or a reduction of proceeds on a sale of securities. Such transaction costs are included in the determination of net realized and unrealized gain (loss) from investment securities reported in the Statement of Operations and the Statement of Changes in Net Assets and the net realized and unrealized gains (losses) on securities per share in the Financial Highlights. Transaction costs are included in the calculation of the Fund’s net asset value and, accordingly, they reduce the Fund’s total returns. These transaction costs are not considered operating expenses and are not reflected in net investment income reported in the Statement of Operations and the Statement of Changes in Net Assets, or the net investment income per share and the ratios of expenses and net investment income reported in the Financial Highlights, nor are they limited by any expense limitation arrangements between the Fund and the investment adviser.
The Fund allocates income and realized and unrealized capital gains and losses to a class based on the relative net assets of each class.
| C. | Country Determination – For the purposes of making investment selection decisions and presentation in the Schedule of Investments, the investment adviser may determine the country in which an issuer is located and/or credit risk exposure based on various factors. These factors include the laws of the country under which the issuer is organized, where the issuer maintains a principal office, the country in which the issuer derives 50% or more of its total revenues, the country that has the primary market for the issuer’s securities and its “country of risk” as determined by a third party service provider, as well as other criteria. Among the other criteria that may be evaluated for making this determination are the country in which the issuer maintains 50% or more of its assets, the type of security, financial guarantees and enhancements, the nature of the collateral and the sponsor organization. Country of issuer and/or credit risk exposure has been determined to be the United States of America, unless otherwise noted. |
| D. | Distributions – Distributions from net investment income and net realized capital gain, if any, are generally declared and paid annually and recorded on the ex-dividend date. The Fund may elect to treat a portion of the proceeds from redemptions as distributions for federal income tax purposes. |
| E. | Federal Income Taxes – The Fund intends to comply with the requirements of Subchapter M of the Internal Revenue Code of 1986, as amended (the “Internal Revenue Code”), necessary to qualify as a regulated investment company and to distribute substantially all of the Fund’s taxable earnings to shareholders. As such, the Fund will not be subject to federal income taxes on otherwise taxable income (including net realized capital gain) that is distributed to shareholders. Therefore, no provision for federal income taxes is recorded in the financial statements. |
The Fund recognizes the tax benefits of uncertain tax positions only when the position is more likely than not to be sustained. Management has analyzed the Fund’s uncertain tax positions and concluded that no liability for unrecognized tax benefits should be recorded related to uncertain tax positions. Management is not aware of any tax positions for which it is reasonably possible that the total amounts of unrecognized tax benefits will change materially in the next 12 months.
The Fund files tax returns in the U.S. Federal jurisdiction and certain other jurisdictions. Generally, the Fund is subject to examinations by such taxing authorities for up to three years after the filing of the return for the tax period.
| F. | Expenses – Fees provided for under the Rule 12b-1 plan of a particular class of the Fund are charged to the operations of such class. Transfer agency fees and expenses and other shareholder recordkeeping fees and expenses attributable to Class R5 and Class R6 are allocated based on relative net assets of Class R5 and Class R6. Sub-accounting fees attributable to Class R5 are charged to the operations of the class. Transfer agency fees and expenses and other shareholder recordkeeping fees and expenses relating to all other classes are allocated among those classes based on relative net assets. All other expenses are allocated among the classes based on relative net assets. |
| G. | Accounting Estimates – The preparation of financial statements in conformity with accounting principles generally accepted in the United States of America (“GAAP”) requires management to make estimates and assumptions that affect the reported amounts of assets and liabilities at the date of the financial statements and the reported amounts of revenues and expenses during the reporting period including estimates and assumptions related to taxation. Actual results could differ from those estimates by a significant amount. In addition, the Fund monitors for material events or transactions that may occur or become known after the period-end date and before the date the financial statements are released to print. |
| H. | Indemnifications – Under the Trust’s organizational documents, each Trustee, officer, employee or other agent of the Trust is indemnified against certain liabilities that may arise out of the performance of their duties to the Fund. Additionally, in the normal course of business, the Fund enters into contracts, including the Fund’s servicing agreements, that contain a variety of indemnification clauses. The Fund’s maximum exposure under these arrangements is unknown as this would involve future claims that may be made against the Fund that have not yet occurred. The risk of material loss as a result of such indemnification claims is considered remote. |
| I. | Securities Lending – The Fund may lend portfolio securities having a market value up to one-third of the Fund’s total assets. Such loans are secured by collateral equal to no less than the market value of the loaned securities determined daily by the securities lending provider. Such collateral will be cash or debt securities issued or guaranteed by the U.S. Government or any of its sponsored agencies. Cash collateral received in connection with these loans is invested in short-term money market instruments or affiliated, unregistered investment companies that comply with Rule 2a-7 under the 1940 Act and money market funds (collectively, “affiliated money market funds”) and is shown as such on the Schedule of Investments. The Fund bears the risk of loss with respect to the investment of collateral. It is the Fund’s policy to obtain additional collateral from or return excess collateral to the borrower by the end of the next business day, following the valuation date of the securities loaned. Therefore, the value of the collateral held may be temporarily less than the value of the securities on loan. |
When loaning securities, the Fund retains certain benefits of owning the securities, including the economic equivalent of dividends or interest generated by the security. Lending securities entails a risk of loss to the Fund if, and to the extent that, the market value of the securities loaned were to increase and the borrower did not increase the collateral accordingly, and the borrower failed to return the securities. The securities loaned are subject to termination at the option of the borrower or the Fund. Upon termination, the borrower will return to the Fund the securities loaned and the Fund will return the collateral. Upon the failure of the borrower to return the securities, collateral may be liquidated and the securities may be purchased on the open market to replace the loaned securities. The Fund could experience delays and costs in gaining access to the collateral and the securities may lose value during the delay which could result in potential losses to the Fund. Some of these losses may be indemnified by the lending agent. The Fund bears the risk of any deficiency in the amount of the collateral available for return to the borrower due to any loss on the collateral invested. Dividends received on cash collateral investments for securities lending transactions, which are net of compensation to counterparties, are included in Dividends from affiliates on the Statement of Operations. The aggregate value of securities out on loan, if any, is shown as a footnote on the Statement of Assets and Liabilities.
The Adviser serves as an affiliated securities lending agent for the Fund. The Bank of New York Mellon also serves as a lending agent. To the extent the Fund utilizes the Adviser as an affiliated securities lending agent, the Fund conducts its securities lending in accordance with, and in reliance upon, no-action letters issued by the SEC staff that provide guidance on how an affiliate may act as a direct agent lender and receive compensation for those services in a manner consistent with the federal securities laws. For the year ended October 31, 2022, the Fund paid the Adviser $845 in fees for securities lending agent services. Fees paid to the Adviser for securities lending agent services are included in Dividends from affiliates on the Statement of Operations.
| J. | Foreign Currency Translations – Foreign currency is valued at the close of the NYSE based on quotations posted by banks and major currency dealers. Portfolio securities and other assets and liabilities denominated in foreign currencies are translated into U.S. dollar amounts at the date of valuation. Purchases |
| | |
| 15 | | Invesco EQV Emerging Markets All Cap Fund |
and sales of portfolio securities (net of foreign taxes withheld on disposition) and income items denominated in foreign currencies are translated into U.S. dollar amounts on the respective dates of such transactions. The Fund does not separately account for the portion of the results of operations resulting from changes in foreign exchange rates on investments and the fluctuations arising from changes in market prices of securities held. The combined results of changes in foreign exchange rates and the fluctuation of market prices on investments (net of estimated foreign tax withholding) are included with the net realized and unrealized gain or loss from investments in the Statement of Operations. Reported net realized foreign currency gains or losses arise from (1) sales of foreign currencies, (2) currency gains or losses realized between the trade and settlement dates on securities transactions, and (3) the difference between the amounts of dividends, interest, and foreign withholding taxes recorded on the Fund’s books and the U.S. dollar equivalent of the amounts actually received or paid. Net unrealized foreign currency gains and losses arise from changes in the fair values of assets and liabilities, other than investments in securities at fiscal period end, resulting from changes in exchange rates.
The Fund may invest in foreign securities, which may be subject to foreign taxes on income, gains on investments or currency repatriation, a portion of which may be recoverable. Foreign taxes, if any, are recorded based on the tax regulations and rates that exist in the foreign markets in which the Fund invests and are shown in the Statement of Operations.
| K. | Forward Foreign Currency Contracts – The Fund may engage in foreign currency transactions either on a spot (i.e. for prompt delivery and settlement) basis, or through forward foreign currency contracts, to manage or minimize currency or exchange rate risk. |
The Fund may also enter into forward foreign currency contracts for the purchase or sale of a security denominated in a foreign currency in order to “lock in” the U.S. dollar price of that security, or the Fund may also enter into forward foreign currency contracts that do not provide for physical exchange of the two currencies on the settlement date, but instead are settled by a single cash payment calculated as the difference between the agreed upon exchange rate and the spot rate at settlement based upon an agreed upon notional amount (non-deliverable forwards).
A forward foreign currency contract is an obligation between two parties (“Counterparties”) to purchase or sell a specific currency for an agreed-upon price at a future date. The use of forward foreign currency contracts for hedging does not eliminate fluctuations in the price of the underlying securities the Fund owns or intends to acquire but establishes a rate of exchange in advance. Fluctuations in the value of these contracts are measured by the difference in the contract date and reporting date exchange rates and are recorded as unrealized appreciation (depreciation) until the contracts are closed. When the contracts are closed, realized gains (losses) are recorded. Realized and unrealized gains (losses) on the contracts are included in the Statement of Operations. The primary risks associated with forward foreign currency contracts include failure of the Counterparty to meet the terms of the contract and the value of the foreign currency changing unfavorably. These risks may be in excess of the amounts reflected in the Statement of Assets and Liabilities.
| L. | COVID-19 Risk – The COVID-19 strain of coronavirus has resulted in instances of market closures and dislocations, extreme volatility, liquidity constraints and increased trading costs. Efforts to contain its spread have resulted in travel restrictions, disruptions of healthcare systems, business operations (including business closures) and supply chains, layoffs, lower consumer demand and employee availability, and defaults and credit downgrades, among other significant economic impacts that have disrupted global economic activity across many industries. Such economic impacts may exacerbate other pre-existing political, social and economic risks locally or globally and cause general concern and uncertainty. The full economic impact and ongoing effects of COVID-19 (or other future epidemics or pandemics) at the macro-level and on individual businesses are unpredictable and may result in significant and prolonged effects on the Fund’s performance. |
NOTE 2–Advisory Fees and Other Fees Paid to Affiliates
The Trust has entered into a master investment advisory agreement with the Adviser. Under the terms of the investment advisory agreement, the Fund accrues daily and pays monthly an advisory fee to the Adviser based on the annual rate of the Fund’s average daily net assets as follows:
| | | | |
| Average Daily Net Assets | | Rate | |
|
| |
First $ 250 million | | | 0.935% | |
|
| |
Next $250 million | | | 0.910% | |
|
| |
Next $500 million | | | 0.885% | |
|
| |
Next $1.5 billion | | | 0.860% | |
|
| |
Next $2.5 billion | | | 0.835% | |
|
| |
Next $2.5 billion | | | 0.810% | |
|
| |
Next $2.5 billion | | | 0.785% | |
|
| |
Over $10 billion | | | 0.760% | |
|
| |
For the year ended October 31, 2022, the effective advisory fee rate incurred by the Fund was 0.88%.
Under the terms of a master sub-advisory agreement between the Adviser and each of Invesco Asset Management Deutschland GmbH, Invesco Asset Management Limited, Invesco Asset Management (Japan) Limited, Invesco Hong Kong Limited, Invesco Senior Secured Management, Inc. and Invesco Canada Ltd. and separate sub-advisory agreements with Invesco Capital Management LLC and Invesco Asset Management (India) Private Limited (collectively, the “Affiliated Sub-Advisers”) the Adviser, not the Fund, will pay 40% of the fees paid to the Adviser to any such Affiliated Sub-Adviser(s) that provide(s) discretionary investment management services to the Fund based on the percentage of assets allocated to such Affiliated Sub-Adviser(s).
The Adviser has contractually agreed, through at least June 30, 2023, to waive advisory fees and/or reimburse expenses of all shares to the extent necessary to limit total annual fund operating expenses after fee waivers and/or reimbursements (excluding certain items discussed below) of Class A, Class C, Class Y, Class R5 and Class R6 shares to 2.25%, 3.00%, 2.00%, 2.00% and 2.00%, respectively, of the Fund’s average daily net assets (the “expense limits”). In determining the Adviser’s obligation to waive advisory fees and/or reimburse expenses, the following expenses are not taken into account, and could cause the total annual fund operating expenses after fee waiver and/or expense reimbursement to exceed the numbers reflected above: (1) interest; (2) taxes; (3) dividend expense on short sales; (4) extraordinary or non-routine items, including litigation expenses; and (5) expenses that the Fund has incurred but did not actually pay because of an expense offset arrangement. Unless Invesco continues the fee waiver agreement, it will terminate on June 30, 2023. During its term, the fee waiver agreement cannot be terminated or amended to increase the expense limits or reduce the advisory fee waiver without approval of the Board of Trustees. The Adviser did not waive fees and/or reimburse expenses during the period under these expense limits.
Further, the Adviser has contractually agreed, through at least June 30, 2024, to waive the advisory fee payable by the Fund in an amount equal to 100% of the net advisory fees the Adviser receives from the affiliated money market funds on investments by the Fund of uninvested cash (excluding investments of cash collateral from securities lending) in such affiliated money market funds.
For the year ended October 31, 2022, the Adviser waived advisory fees of $91,377.
The Trust has entered into a master administrative services agreement with Invesco pursuant to which the Fund has agreed to pay Invesco for certain administrative costs incurred in providing accounting services to the Fund. For the year ended October 31, 2022, expenses incurred under the agreement are shown in the Statement of Operations as Administrative services fees. Invesco has entered into a sub-administration agreement whereby State Street Bank and Trust Company (“SSB”) serves as fund accountant and provides certain administrative services to the Fund. Pursuant to a custody agreement with the Trust on behalf of the Fund, SSB also serves as the Fund’s custodian.
| | |
| 16 | | Invesco EQV Emerging Markets All Cap Fund |
The Trust has entered into a transfer agency and service agreement with Invesco Investment Services, Inc. (“IIS”) pursuant to which the Fund has agreed to pay IIS a fee for providing transfer agency and shareholder services to the Fund and reimburse IIS for certain expenses incurred by IIS in the course of providing such services. IIS may make payments to intermediaries that provide omnibus account services, sub-accounting services and/or networking services. All fees payable by IIS to intermediaries that provide omnibus account services or sub-accounting services are charged back to the Fund, subject to certain limitations approved by the Trust’s Board of Trustees. For the year ended October 31, 2022, expenses incurred under the agreement are shown in the Statement of Operations as Transfer agent fees.
The Trust has entered into master distribution agreements with Invesco Distributors, Inc. (“IDI”) to serve as the distributor for the Class A, Class C, Class R, Class Y, Class R5 and Class R6 shares of the Fund. The Trust has adopted plans pursuant to Rule 12b-1 under the 1940 Act with respect to the Fund’s Class A, Class C and Class R shares (collectively, the “Plans”). The Fund, pursuant to the Plans, pays IDI compensation at the annual rate of 0.25% of the Fund’s average daily net assets of Class A shares, 1.00% of the average daily net assets of Class C shares and 0.50% of the average daily net assets of Class R shares. The fees are accrued daily and paid monthly. Of the Plan payments, up to 0.25% of the average daily net assets of each class of shares may be paid to furnish continuing personal shareholder services to customers who purchase and own shares of such classes. Any amounts not paid as a service fee under the Plans would constitute an asset-based sales charge. Rules of the Financial Industry Regulatory Authority (“FINRA”) impose a cap on the total sales charges, including asset-based sales charges, that may be paid by any class of shares of the Fund. For the year ended October 31, 2022, expenses incurred under the Plans are shown in the Consolidated Statement of Operations as Distribution fees.
Front-end sales commissions and CDSC (collectively, the “sales charges”) are not recorded as expenses of the Fund. Front-end sales commissions are deducted from proceeds from the sales of Fund shares prior to investment in Class A shares of the Fund. CDSC are deducted from redemption proceeds prior to remittance to the shareholder. During the year ended October 31, 2022, IDI advised the Fund that IDI retained $32,822 in front-end sales commissions from the sale of Class A shares and $3,747 and $2,039 from Class A and Class C shares, respectively, for CDSC imposed upon redemptions by shareholders.
For the year ended October 31, 2022, the Fund incurred $2,495 in brokerage commissions with Invesco Capital Markets, Inc., an affiliate of the Adviser and IDI, for portfolio transactions executed on behalf of the Fund.
Certain officers and trustees of the Trust are officers and directors of the Adviser, IIS and/or IDI.
NOTE 3–Additional Valuation Information
GAAP defines fair value as the price that would be received to sell an asset or paid to transfer a liability in an orderly transaction between market participants at the measurement date, under current market conditions. GAAP establishes a hierarchy that prioritizes the inputs to valuation methods, giving the highest priority to readily available unadjusted quoted prices in an active market for identical assets (Level 1) and the lowest priority to significant unobservable inputs (Level 3), generally when market prices are not readily available. Based on the valuation inputs, the securities or other investments are tiered into one of three levels. Changes in valuation methods may result in transfers in or out of an investment’s assigned level:
| | |
| Level 1 - | | Prices are determined using quoted prices in an active market for identical assets. |
| Level 2 - | | Prices are determined using other significant observable inputs. Observable inputs are inputs that other market participants may use in pricing a security. These may include quoted prices for similar securities, interest rates, prepayment speeds, credit risk, yield curves, loss severities, default rates, discount rates, volatilities and others. |
| Level 3 - | | Prices are determined using significant unobservable inputs. In situations where quoted prices or observable inputs are unavailable (for example, when there is little or no market activity for an investment at the end of the period), unobservable inputs may be used. Unobservable inputs reflect the Adviser’s assumptions about the factors market participants would use in determining fair value of the securities or instruments and would be based on the best available information. |
The following is a summary of the tiered valuation input levels, as of October 31, 2022. The level assigned to the securities valuations may not be an indication of the risk or liquidity associated with investing in those securities. Because of the inherent uncertainties of valuation, the values reflected in the financial statements may materially differ from the value received upon actual sale of those investments.
| | | | | | | | | | | | | | | | |
| | | Level 1 | | | Level 2 | | | Level 3 | | | Total | |
|
| |
Investments in Securities | | | | | | | | | | | | | | | | |
|
| |
Brazil | | $ | 245,908,848 | | | $ | – | | | | $ – | | | $ | 245,908,848 | |
|
| |
China | | | 138,444,471 | | | | 226,547,676 | | | | – | | | | 364,992,147 | |
|
| |
Egypt | | | 24,051,961 | | | | – | | | | – | | | | 24,051,961 | |
|
| |
France | | | – | | | | 34,051,443 | | | | – | | | | 34,051,443 | |
|
| |
Hungary | | | – | | | | 55,184,097 | | | | – | | | | 55,184,097 | |
|
| |
India | | | 68,083,021 | | | | 24,552,150 | | | | – | | | | 92,635,171 | |
|
| |
Indonesia | | | – | | | | 107,264,757 | | | | – | | | | 107,264,757 | |
|
| |
Macau | | | – | | | | 7,864,780 | | | | – | | | | 7,864,780 | |
|
| |
Mexico | | | 212,658,959 | | | | – | | | | – | | | | 212,658,959 | |
|
| |
Nigeria | | | – | | | | 20,304,792 | | | | – | | | | 20,304,792 | |
|
| |
Philippines | | | – | | | | 84,481,042 | | | | – | | | | 84,481,042 | |
|
| |
Russia | | | – | | | | – | | | | 48 | | | | 48 | |
|
| |
South Africa | | | – | | | | 10,239,751 | | | | – | | | | 10,239,751 | |
|
| |
South Korea | | | – | | | | 67,709,779 | | | | – | | | | 67,709,779 | |
|
| |
Taiwan | | | – | | | | 96,636,750 | | | | – | | | | 96,636,750 | |
|
| |
Turkey | | | – | | | | 29,294,665 | | | | – | | | | 29,294,665 | |
|
| |
United Arab Emirates | | | – | | | | 27,505,720 | | | | – | | | | 27,505,720 | |
|
| |
Vietnam | | | – | | | | 13,536,670 | | | | – | | | | 13,536,670 | |
|
| |
Money Market Funds | | | 63,675,957 | | | | 51,321,386 | | | | – | | | | 114,997,343 | |
|
| |
Total Investments | | $ | 752,823,217 | | | $ | 856,495,458 | | | | $48 | | | $ | 1,609,318,723 | |
|
| |
NOTE 4–Expense Offset Arrangement(s)
The expense offset arrangement is comprised of transfer agency credits which result from balances in demand deposit accounts used by the transfer agent for clearing shareholder transactions. For the year ended October 31, 2022, the Fund received credits from this arrangement, which resulted in the reduction of the Fund’s total expenses of $2,627.
| | |
| 17 | | Invesco EQV Emerging Markets All Cap Fund |
NOTE 5–Trustees’ and Officers’ Fees and Benefits
Trustees’ and Officers’ Fees and Benefits include amounts accrued by the Fund to pay remuneration to certain Trustees and Officers of the Fund. Trustees have the option to defer compensation payable by the Fund, and Trustees’ and Officers’ Fees and Benefits also include amounts accrued by the Fund to fund such deferred compensation amounts. Those Trustees who defer compensation have the option to select various Invesco Funds in which their deferral accounts shall be deemed to be invested. Finally, certain current Trustees were eligible to participate in a retirement plan that provided for benefits to be paid upon retirement to Trustees over a period of time based on the number of years of service. The Fund may have certain former Trustees who also participate in a retirement plan and receive benefits under such plan. Trustees’ and Officers’ Fees and Benefits include amounts accrued by the Fund to fund such retirement benefits. Obligations under the deferred compensation and retirement plans represent unsecured claims against the general assets of the Fund.
NOTE 6–Cash Balances
The Fund is permitted to temporarily carry a negative or overdrawn balance in its account with SSB, the custodian bank. Such balances, if any at period-end, are shown in the Statement of Assets and Liabilities under the payable caption Amount due custodian. To compensate the custodian bank for such overdrafts, the overdrawn Fund may either (1) leave funds as a compensating balance in the account so the custodian bank can be compensated by earning the additional interest; or (2) compensate by paying the custodian bank at a rate agreed upon by the custodian bank and Invesco, not to exceed the contractually agreed upon rate. The Fund may not purchase additional securities when any borrowings from banks or broker-dealers exceed 5% of the Fund’s total assets, or when any borrowings from an Invesco Fund are outstanding.
NOTE 7–Distributions to Shareholders and Tax Components of Net Assets
Tax Character of Distributions to Shareholders Paid During the Fiscal Years Ended October 31, 2022 and 2021:
| | | | | | | | | | | | |
| | | 2022 | | | | | | 2021 | |
|
| |
Ordinary income* | | $ | 19,389,385 | | | | | | | $ | 72,422,446 | |
|
| |
Long-term capital gain | | | 92,566,338 | | | | | | | | 60,061,862 | |
|
| |
Total distributions | | $ | 111,955,723 | | | | | | | $ | 132,484,308 | |
|
| |
| * | Includes short-term capital gain distributions, if any. |
Tax Components of Net Assets at Period-End:
| | | | |
| | | 2022 | |
|
| |
Undistributed ordinary income | | $ | 24,376,875 | |
|
| |
Net unrealized appreciation (depreciation) – investments | | | (95,198,761 | ) |
|
| |
Net unrealized appreciation (depreciation) – foreign currencies | | | (184,272 | ) |
|
| |
Temporary book/tax differences | | | (209,765 | ) |
|
| |
Capital loss carryforward | | | (19,535,489 | ) |
|
| |
Shares of beneficial interest | | | 1,660,818,022 | |
|
| |
Total net assets | | $ | 1,570,066,610 | |
|
| |
The difference between book-basis and tax-basis unrealized appreciation (depreciation) is due to differences in the timing of recognition of gains and losses on investments for tax and book purposes. The Fund’s net unrealized appreciation (depreciation) difference is attributable primarily to wash sales.
The temporary book/tax differences are a result of timing differences between book and tax recognition of income and/or expenses. The Fund’s temporary book/tax differences are the result of the trustee deferral of compensation and retirement plan benefits.
Capital loss carryforward is calculated and reported as of a specific date. Results of transactions and other activity after that date may affect the amount of capital loss carryforward actually available for the Fund to utilize. The ability to utilize capital loss carryforward in the future may be limited under the Internal Revenue Code and related regulations based on the results of future transactions.
The Fund has a capital loss carryforward as of October 31, 2022, as follows:
| | | | | | | | | | | | | | | | | | | | |
Capital Loss Carryforward* | |
| Expiration | | Short-Term | | | | | | Long-Term | | | | | | Total | |
|
| |
Not subject to expiration | | $ | 19,535,489 | | | | | | | $ | – | | | | | | | $ | 19,535,489 | |
|
| |
| * | Capital loss carryforward is reduced for limitations, if any, to the extent required by the Internal Revenue Code and may be further limited depending upon a variety of factors, including the realization of net unrealized gains or losses as of the date of any reorganization. |
NOTE 8–Investment Transactions
The aggregate amount of investment securities (other than short-term securities, U.S. Government obligations and money market funds, if any) purchased and sold by the Fund during the year ended October 31, 2022 was $317,630,768 and $518,349,265, respectively. Cost of investments, including any derivatives, on a tax basis includes the adjustments for financial reporting purposes as of the most recently completed federal income tax reporting period-end.
| | | | |
| Unrealized Appreciation (Depreciation) of Investments on a Tax Basis | | | |
|
| |
Aggregate unrealized appreciation of investments | | $ | 264,551,557 | |
|
| |
Aggregate unrealized (depreciation) of investments | | | (359,750,318 | ) |
|
| |
Net unrealized appreciation (depreciation) of investments | | $ | (95,198,761 | ) |
|
| |
Cost of investments for tax purposes is $1,704,517,484.
| | |
| 18 | | Invesco EQV Emerging Markets All Cap Fund |
NOTE 9–Reclassification of Permanent Differences
Primarily as a result of differing book/tax treatment of foreign currency transactions and distributions, on October 31, 2022, undistributed net investment income was decreased by $256,482 and undistributed net realized gain (loss) was increased by $256,482. This reclassification had no effect on the net assets or the distributable earnings (loss) of the Fund.
NOTE 10–Share Information
| | | | | | | | | | | | | | | | |
| | | Summary of Share Activity | |
|
| |
| | | Year ended | | | Year ended | |
| | | October 31, 2022(a) | | | October 31, 2021 | |
| | | Shares | | | Amount | | | Shares | | | Amount | |
|
| |
Sold: | | | | | | | | | | | | | | | | |
Class A | | | 1,785,231 | | | $ | 59,015,273 | | | | 1,889,937 | | | $ | 81,886,430 | |
|
| |
Class C | | | 47,250 | | | | 1,591,114 | | | | 76,205 | | | | 3,255,333 | |
|
| |
Class Y | | | 6,322,632 | | | | 211,228,639 | | | | 5,667,031 | | | | 244,849,914 | |
|
| |
Class R5 | | | 973,625 | | | | 32,575,583 | | | | 1,141,051 | | | | 49,259,888 | |
|
| |
Class R6 | | | 4,346,031 | | | | 145,692,469 | | | | 6,685,446 | | | | 290,901,817 | |
|
| |
| | | | |
Issued as reinvestment of dividends: | | | | | | | | | | | | | | | | |
Class A | | | 549,442 | | | | 20,944,720 | | | | 627,884 | | | | 26,484,157 | |
|
| |
Class C | | | 13,287 | | | | 496,154 | | | | 17,346 | | | | 718,977 | |
|
| |
Class Y | | | 709,975 | | | | 27,028,746 | | | | 842,214 | | | | 35,499,330 | |
|
| |
Class R5 | | | 238,575 | | | | 9,051,542 | | | | 255,130 | | | | 10,718,029 | |
|
| |
Class R6 | | | 811,404 | | | | 30,760,326 | | | | 637,164 | | | | 26,754,520 | |
|
| |
| | | | |
Automatic conversion of Class C shares to Class A shares: | | | | | | | | | | | | | | | | |
Class A | | | 47,349 | | | | 1,514,612 | | | | 91,667 | | | | 3,898,704 | |
|
| |
Class C | | | (48,496 | ) | | | (1,514,612 | ) | | | (93,490 | ) | | | (3,898,704 | ) |
|
| |
| | | | |
Reacquired: | | | | | | | | | | | | | | | | |
Class A | | | (2,483,704 | ) | | | (82,411,078 | ) | | | (2,945,340 | ) | | | (127,459,786 | ) |
|
| |
Class C | | | (108,967 | ) | | | (3,600,918 | ) | | | (68,030 | ) | | | (2,867,908 | ) |
|
| |
Class Y | | | (11,058,099 | ) | | | (371,061,537 | ) | | | (7,704,418 | ) | | | (333,818,808 | ) |
|
| |
Class R5 | | | (1,450,932 | ) | | | (47,823,551 | ) | | | (1,038,107 | ) | | | (44,836,163 | ) |
|
| |
Class R6 | | | (6,711,309 | ) | | | (216,826,059 | ) | | | (2,638,022 | ) | | | (114,232,877 | ) |
|
| |
Net increase (decrease) in share activity | | | (6,016,706 | ) | | $ | (183,338,577 | ) | | | 3,443,668 | | | $ | 147,112,853 | |
|
| |
| (a) | There are entities that are record owners of more than 5% of the outstanding shares of the Fund and in the aggregate own 48% of the outstanding shares of the Fund. IDI has an agreement with these entities to sell Fund shares. The Fund, Invesco and/or Invesco affiliates may make payments to these entities, which are considered to be related to the Fund, for providing services to the Fund, Invesco and/or Invesco affiliates including but not limited to services such as securities brokerage, distribution, third party record keeping and account servicing. The Fund has no knowledge as to whether all or any portion of the shares owned of record by these entities are also owned beneficially. |
In addition, 7% of the outstanding shares of the Fund are owned by the Adviser or an affiliate of the Adviser.
| | |
| 19 | | Invesco EQV Emerging Markets All Cap Fund |
Report of Independent Registered Public Accounting Firm
To the Board of Trustees of AIM Investment Funds (Invesco Investment Funds) and Shareholders of Invesco EQV Emerging Markets All Cap Fund
Opinion on the Financial Statements
We have audited the accompanying statement of assets and liabilities, including the schedule of investments, of Invesco EQV Emerging Markets All Cap Fund (one of the funds constituting AIM Investment Funds (Invesco Investment Funds), referred to hereafter as the “Fund”) as of October 31, 2022, the related statement of operations for the year ended October 31, 2022, the statement of changes in net assets for each of the two years in the period ended October 31, 2022, including the related notes, and the financial highlights for each of the five years in the period ended October 31, 2022 (collectively referred to as the “financial statements”). In our opinion, the financial statements present fairly, in all material respects, the financial position of the Fund as of October 31, 2022, the results of its operations for the year then ended, the changes in its net assets for each of the two years in the period ended October 31, 2022 and the financial highlights for each of the five years in the period ended October 31, 2022 in conformity with accounting principles generally accepted in the United States of America.
Basis for Opinion
These financial statements are the responsibility of the Fund’s management. Our responsibility is to express an opinion on the Fund’s financial statements based on our audits. We are a public accounting firm registered with the Public Company Accounting Oversight Board (United States) (PCAOB) and are required to be independent with respect to the Fund in accordance with the U.S. federal securities laws and the applicable rules and regulations of the Securities and Exchange Commission and the PCAOB.
We conducted our audits of these financial statements in accordance with the standards of the PCAOB. Those standards require that we plan and perform the audit to obtain reasonable assurance about whether the financial statements are free of material misstatement, whether due to error or fraud.
Our audits included performing procedures to assess the risks of material misstatement of the financial statements, whether due to error or fraud, and performing procedures that respond to those risks. Such procedures included examining, on a test basis, evidence regarding the amounts and disclosures in the financial statements. Our audits also included evaluating the accounting principles used and significant estimates made by management, as well as evaluating the overall presentation of the financial statements. Our procedures included confirmation of securities owned as of October 31, 2022 by correspondence with the custodian, transfer agent and brokers; when replies were not received from brokers, we performed other auditing procedures. We believe that our audits provide a reasonable basis for our opinion.
/s/PricewaterhouseCoopers LLP
Houston, Texas
December 23, 2022
We have served as the auditor of one or more of the investment companies in the Invesco group of investment companies since at least 1995. We have not been able to determine the specific year we began serving as auditor.
| | |
| 20 | | Invesco EQV Emerging Markets All Cap Fund |
Calculating your ongoing Fund expenses
Example
As a shareholder of the Fund, you incur two types of costs: (1) transaction costs, which may include sales charges (loads) on purchase payments or contingent deferred sales charges on redemptions, if any; and (2) ongoing costs, including management fees, distribution and/or service (12b-1) fees, and other Fund expenses. This example is intended to help you understand your ongoing costs (in dollars) of investing in the Fund and to compare these costs with ongoing costs of investing in other mutual funds. The example is based on an investment of $1,000 invested at the beginning of the period and held for the entire period May 1, 2022 through October 31, 2022.
Actual expenses
The table below provides information about actual account values and actual expenses. You may use the information in this table, together with the amount you invested, to estimate the expenses that you paid over the period. Simply divide your account value by $1,000 (for example, an $8,600 account value divided by $1,000 = 8.6), then multiply the result by the number in the table under the heading entitled “Actual Expenses Paid During Period” to estimate the expenses you paid on your account during this period.
Hypothetical example for comparison purposes
The table below also provides information about hypothetical account values and hypothetical expenses based on the Fund’s actual expense ratio and an assumed rate of return of 5% per year before expenses, which is not the Fund’s actual return.
The hypothetical account values and expenses may not be used to estimate the actual ending account balance or expenses you paid for the period. You may use this information to compare the ongoing costs of investing in the Fund and other funds. To do so, compare this 5% hypothetical example with the 5% hypothetical examples that appear in the shareholder reports of the other funds.
Please note that the expenses shown in the table are meant to highlight your ongoing costs only and do not reflect any transaction costs, such as sales charges (loads) on purchase payments or contingent deferred sales charges on redemptions, if any. Therefore, the hypothetical information is useful in comparing ongoing costs only, and will not help you determine the relative total costs of owning different funds. In addition, if these transaction costs were included, your costs would have been higher.
| | | | | | | | | | | | |
| | | | | ACTUAL | | HYPOTHETICAL (5% annual return before expenses) | | |
| | Beginning
Account Value
(05/01/22) | | Ending
Account Value
(10/31/22)1 | | Expenses
Paid During
Period2 | | Ending
Account Value
(10/31/22) | | Expenses
Paid During
Period2 | | Annualized
Expense Ratio |
| | | | | | | |
Class A | | $1,000.00 | | $895.40 | | $ 6.69 | | $1,018.15 | | $ 7.12 | | 1.40% |
Class C | | 1,000.00 | | 892.00 | | 10.25 | | 1,014.37 | | 10.92 | | 2.15 |
Class Y | | 1,000.00 | | 896.40 | | 5.50 | | 1,019.41 | | 5.85 | | 1.15 |
Class R5 | | 1,000.00 | | 896.70 | | 5.16 | | 1,019.76 | | 5.50 | | 1.08 |
Class R6 | | 1,000.00 | | 897.30 | | 4.83 | | 1,020.11 | | 5.14 | | 1.01 |
| 1 | The actual ending account value is based on the actual total return of the Fund for the period May 1, 2022 through October 31, 2022, after actual expenses and will differ from the hypothetical ending account value which is based on the Fund’s expense ratio and a hypothetical annual return of 5% before expenses. |
| 2 | Expenses are equal to the Fund’s annualized expense ratio as indicated above multiplied by the average account value over the period, multiplied by 184/365 to reflect the most recent fiscal half year. |
| | |
| 21 | | Invesco EQV Emerging Markets All Cap Fund |
Approval of Investment Advisory and Sub-Advisory Contracts
At meetings held on June 13, 2022, the Board of Trustees (the Board or the Trustees) of AIM Investment Funds (Invesco Investment Funds) as a whole, and the independent Trustees, who comprise over 75% of the Board, voting separately, approved the continuance of the Invesco EQV Emerging Markets All Cap Fund’s (formerly, Invesco Emerging Markets All Cap Fund) (the Fund) Master Investment Advisory Agreement with Invesco Advisers, Inc. (Invesco Advisers and the investment advisory agreement) and the Master Intergroup Sub-Advisory Contract for Mutual Funds with Invesco Asset Management Deutschland GmbH, Invesco Asset Management Limited, Invesco Asset Management (Japan) Limited, Invesco Hong Kong Limited, Invesco Senior Secured Management, Inc. and Invesco Canada Ltd. and separate sub-advisory contracts with Invesco Capital Management LLC and Invesco Asset Management (India) Private Limited (collectively, the Affiliated Sub-Advisers and the sub-advisory contracts) for another year, effective July 1, 2022. After evaluating the factors discussed below, among others, the Board approved the renewal of the Fund’s investment advisory agreement and the sub-advisory contracts and determined that the compensation payable thereunder by the Fund to Invesco Advisers and by Invesco Advisers to the Affiliated Sub-Advisers is fair and reasonable.
The Board’s Evaluation Process
The Board has established an Investments Committee, which in turn has established Sub-Committees that meet throughout the year to review the performance of funds advised by Invesco Advisers (the Invesco Funds). The Sub-Committees meet regularly with portfolio managers for their assigned Invesco Funds and other members of management to review detailed information about investment performance and portfolio attributes of these funds. The Board has established additional standing and ad hoc committees that meet regularly throughout the year to review matters within their purview. The Board took into account evaluations and reports that it received from its committees and sub-committees, as well as the information provided to the Board and its committees and sub-committees throughout the year, in considering whether to approve each Invesco Fund’s investment advisory agreement and sub-advisory contracts.
As part of the contract renewal process, the Board reviews and considers information provided in response to detailed requests for information submitted to management by the independent Trustees with assistance from legal counsel to the independent Trustees and the Senior Officer, an officer of the Invesco Funds who reports directly to the independent Trustees. The Board receives comparative investment performance and fee and expense data regarding the Invesco Funds prepared by Broadridge Financial Solutions, Inc. (Broadridge), an independent mutual fund data provider, as well as information on the composition of the peer groups provided by Broadridge and its methodology for determining peer groups. The Board also receives an independent written evaluation from the Senior Officer. The Senior Officer’s evaluation is prepared as part of his responsibility to manage the process by which the Invesco Funds’ proposed management fees
are negotiated during the annual contract renewal process to ensure they are negotiated in a manner that is at arms’ length and reasonable in accordance with certain negotiated regulatory requirements. In addition to meetings with Invesco Advisers and fund counsel throughout the year and as part of meetings convened on May 2, 2022 and June 13, 2022, the independent Trustees also discussed the continuance of the investment advisory agreement and sub-advisory contracts in separate sessions with the Senior Officer and with independent legal counsel.
The discussion below is a summary of the Senior Officer’s independent written evaluation with respect to the Fund’s investment advisory agreement and sub-advisory contracts, as well as a discussion of the material factors and related conclusions that formed the basis for the Board’s approval of the Fund’s investment advisory agreement and sub-advisory contracts. The Trustees’ review and conclusions are based on the comprehensive consideration of all information presented to them during the course of the year and in prior years and are not the result of any single determinative factor. Moreover, one Trustee may have weighed a particular piece of information or factor differently than another Trustee. The information received and considered by the Board was current as of various dates prior to the Board’s approval on June 13, 2022.
Factors and Conclusions and Summary of Independent Written Fee Evaluation
| A. | Nature, Extent and Quality of Services Provided by Invesco Advisers and the Affiliated Sub-Advisers |
The Board reviewed the nature, extent and quality of the advisory services provided to the Fund by Invesco Advisers under the Fund’s investment advisory agreement, and the credentials and experience of the officers and employees of Invesco Advisers who provide these services, including the Fund’s portfolio manager(s). The Board’s review included consideration of Invesco Advisers’ investment process and oversight, credit analysis, and research capabilities. The Board considered information regarding Invesco Advisers’ programs for and resources devoted to risk management, including management of investment, enterprise, operational, liquidity, valuation and compliance risks, and technology used to manage such risks. The Board also received and reviewed information about Invesco Advisers’ role as administrator of the Invesco Funds’ liquidity risk management program. The Board received a description of, and reports related to, Invesco Advisers’ global security program and business continuity plans and of its approach to data privacy and cybersecurity, including related testing. The Board considered how the cybersecurity and business continuity plans of Invesco Advisers and its key service providers operated in the remote and hybrid working environment resulting from the novel coronavirus (“COVID-19”) pandemic and paved the way for a hybrid working framework in a normalized environment as employees return to the office. The Board also considered non-advisory services that Invesco Advisers and its affiliates provide to the Invesco Funds, such as various back office support functions, third party oversight, internal audit, valuation, portfolio trading and legal and compliance. The Board observed that Invesco Advisers’ systems
preparedness and ongoing investment enabled Invesco Advisers to manage, operate and oversee the Invesco Funds with minimal impact or disruption through challenging environments. The Board reviewed and considered the benefits to shareholders of investing in a Fund that is part of the family of funds under the umbrella of Invesco Ltd., Invesco Advisers’ parent company, and noted Invesco Ltd.’s depth and experience in running an investment management business, as well as its commitment of financial and other resources to such business. The Board concluded that the nature, extent and quality of the services provided to the Fund by Invesco Advisers are appropriate and satisfactory.
The Board reviewed the services that may be provided by the Affiliated Sub-Advisers under the sub-advisory contracts and the credentials and experience of the officers and employees of the Affiliated Sub-Advisers who provide these services. The Board noted the Affiliated Sub-Advisers’ expertise with respect to certain asset classes and that the Affiliated Sub-Advisers have offices and personnel that are located in financial centers around the world. As a result, the Board noted that the Affiliated Sub-Advisers can provide research and investment analysis on the markets and economies of various countries in which the Fund may invest, make recommendations regarding securities and assist with security trades. The Board concluded that the sub-advisory contracts may benefit the Fund and its shareholders by permitting Invesco Advisers to use the resources and talents of the Affiliated Sub-Advisers in managing the Fund. The Board concluded that the nature, extent and quality of the services that may be provided to the Fund by the Affiliated Sub-Advisers are appropriate and satisfactory.
| B. | Fund Investment Performance |
The Board considered Fund investment performance as a relevant factor in considering whether to approve the investment advisory agreement. The Board did not view Fund investment performance as a relevant factor in considering whether to approve the sub-advisory contracts for the Fund, as no Affiliated Sub-Adviser currently manages assets of the Fund.
The Board compared the Fund’s investment performance over multiple time periods ending December 31, 2021 to the performance of funds in the Broadridge performance universe and against the MSCI Emerging Markets Index (Index). The Board noted that performance of Class A shares of the Fund was in the fifth quintile of its performance universe for the one year period, the third quintile for the three year period and the fourth quintile for the five year period (the first quintile being the best performing funds and the fifth quintile being the worst performing funds). The Board noted that performance of Class A shares of the Fund was below the performance of the Index for the one and five year periods and above the performance of the Index for the three year period. The Board noted that the Fund’s stock selection in and underweight exposure to certain sectors and geographic regions, as well as the Fund’s cash position in a rising equity market, detracted from Fund performance. The Board recognized that the performance data reflects a snapshot in time as of a particular date and that selecting a different performance period could
| | |
| 22 | | Invesco EQV Emerging Markets All Cap Fund |
produce different results. The Board also reviewed more recent Fund performance as well as other performance metrics, which did not change its conclusions.
| C. | Advisory and Sub-Advisory Fees and Fund Expenses |
The Board compared the Fund’s contractual management fee rate to the contractual management fee rates of funds in the Fund’s Broadridge expense group. The Board noted that the contractual management fee rate for Class A shares of the Fund was below the median contractual management fee rate of funds in its expense group. The Board noted that the term “contractual management fee” for funds in the expense group may include both advisory and certain non-portfolio management administrative services fees, but that Broadridge is not able to provide information on a fund by fund basis as to what is included. The Board also reviewed the methodology used by Broadridge in calculating expense group information, which includes using each fund’s contractual management fee schedule (including any applicable breakpoints) as reported in the most recent prospectus or statement of additional information for each fund in the expense group. The Board also considered comparative information regarding the Fund’s total expense ratio and its various components.
The Board noted that Invesco Advisers has contractually agreed to waive fees and/or limit expenses of the Fund for the term disclosed in the Fund’s registration statement in an amount necessary to limit total annual operating expenses to a specified percentage of average daily net assets for each class of the Fund.
The Board noted that Invesco Advisers and the Affiliated Sub-Advisers do not manage other similarly managed mutual funds or client accounts.
The Board also considered the services that may be provided by the Affiliated Sub-Advisers pursuant to the sub-advisory contracts, as well as the fees payable by Invesco Advisers to the Affiliated Sub-Advisers pursuant to the sub-advisory contracts.
| D. | Economies of Scale and Breakpoints |
The Board considered the extent to which there may be economies of scale in the provision of advisory services to the Fund and the Invesco Funds, and the extent to which such economies of scale are shared with the Fund and the Invesco Funds. The Board considered that the Fund benefits from economies of scale through contractual breakpoints in the Fund’s advisory fee schedule, which generally operate to reduce the Fund’s expense ratio as it grows in size. The Board noted that the Fund also shares in economies of scale through Invesco Advisers’ ability to negotiate lower fee arrangements with third party service providers. The Board noted that the Fund may also benefit from economies of scale through initial fee setting, fee waivers and expense reimbursements, as well as Invesco Advisers’ investment in its business, including investments in business infrastructure, technology and cybersecurity.
| E. | Profitability and Financial Resources |
The Board reviewed information from Invesco Advisers concerning the costs of the advisory and other services that Invesco Advisers and its affiliates provide to the Fund and the Invesco Funds and the profitability of Invesco Advisers and its affiliates in providing these services in the aggregate and on an individual Fund-by-Fund basis. The Board considered the methodology used for calculating profitability and
the periodic review and enhancement of such methodology. The Board noted that Invesco Advisers continues to operate at a net profit from services Invesco Advisers and its affiliates provide to the Invesco Funds in the aggregate and to most Funds individually. The Board did not deem the level of profits realized by Invesco Advisers and its affiliates from providing such services to be excessive, given the nature, extent and quality of the services provided. The Board noted that Invesco Advisers provided information demonstrating that Invesco Advisers is financially sound and has the resources necessary to perform its obligations under the investment advisory agreement, and provided representations indicating that the Affiliated Sub-Advisers are financially sound and have the resources necessary to perform their obligations under the sub-advisory contracts.
| F. | Collateral Benefits to Invesco Advisers and its Affiliates |
The Board considered various other benefits received by Invesco Advisers and its affiliates from the relationship with the Fund, including the fees received for providing administrative, transfer agency and distribution services to the Fund. The Board received comparative information regarding fees charged for these services, including information provided by Broadridge and other independent sources. The Board reviewed the performance of Invesco Advisers and its affiliates in providing these services and the organizational structure employed to provide these services. The Board noted that these services are provided to the Fund pursuant to written contracts that are reviewed and subject to approval on an annual basis by the Board based on its determination that the services are required for the operation of the Fund.
The Board considered the benefits realized by Invesco Advisers and the Affiliated Sub-Advisers as a result of portfolio brokerage transactions executed through “soft dollar” arrangements. The Board noted that soft dollar arrangements may result in the Fund bearing costs to purchase research that may be used by Invesco Advisers or the Affiliated Sub-Advisers with other clients and may reduce Invesco Advisers’ or the Affiliated Sub-Advisers’ expenses. The Board also considered that it receives from Invesco Advisers periodic reports that include a representation to the effect that these arrangements are consistent with regulatory requirements. The Board did not deem the soft dollar arrangements to be inappropriate.
The Board considered that the Fund’s uninvested cash and cash collateral from any securities lending arrangements may be invested in registered money market funds or, with regard to securities lending cash collateral, unregistered funds that comply with Rule 2a-7 (collectively referred to as “affiliated money market funds”) advised by Invesco Advisers. The Board considered information regarding the returns of the affiliated money market funds relative to comparable overnight investments, as well as the fees paid by the affiliated money market funds to Invesco Advisers and its affiliates. In this regard, the Board noted that Invesco Advisers receives advisory fees from these affiliated money market funds attributable to the Fund’s investments. The Board also noted that Invesco Advisers has contractually agreed to waive through varying periods an amount equal to 100% of the net advisory fee Invesco Advisers receives from the affiliated money market funds with respect to the Fund’s investment in the affiliated money market funds of uninvested cash, but
not cash collateral. The Board concluded that the advisory fees payable to Invesco Advisers from the Fund’s investment of cash collateral from any securities lending arrangements in the affiliated money market funds are for services that are not duplicative of services provided by Invesco Advisers to the Fund.
The Board considered that Invesco Advisers may serve as the Fund’s affiliated securities lending agent and evaluated the benefits realized by Invesco Advisers when serving in such role, including the compensation received. The Board considered Invesco Advisers’ securities lending platform and corporate governance structure for securities lending, including Invesco Advisers’ Securities Lending Governance Committee and its related responsibilities. The Board noted that to the extent the Fund utilizes Invesco Advisers as an affiliated securities lending agent, the Fund conducts its securities lending in accordance with, and in reliance upon, no-action letters issued by the SEC staff that provide guidance on how an affiliate may act as a direct agent lender and receive compensation for those services without obtaining exemptive relief. The Board considered information provided by Invesco Advisers related to the performance of Invesco Advisers as securities lending agent, including a summary of the securities lending services provided to the Fund by Invesco Advisers and the compensation paid to Invesco Advisers for such services, as well as any revenues generated for the Fund in connection with such securities lending activity and the allocation of such revenue between the Fund and Invesco Advisers.
The Board also received information about commissions that an affiliated broker may receive for executing certain trades for the Fund. Invesco Advisers and the Affiliated Sub-Advisers advised the Board of the benefits to the Fund of executing trades through the affiliated broker and that such trades were executed in compliance with rules under the federal securities laws and consistent with best execution obligations.
| | |
| 23 | | Invesco EQV Emerging Markets All Cap Fund |
Tax Information
Form 1099-DIV, Form 1042-S and other year–end tax information provide shareholders with actual calendar year amounts that should be included in their tax returns. Shareholders should consult their tax advisers.
The following distribution information is being provided as required by the Internal Revenue Code or to meet a specific state’s requirement.
The Fund designates the following amounts or, if subsequently determined to be different, the maximum amount allowable for its fiscal year ended October 31, 2022:
| | | | | | | | |
| | | Federal and State Income Tax | | | | | |
| | Long-Term Capital Gain Distributions | | $ | 92,566,338 | | | |
| | Qualified Dividend Income* | | | 100.00 | % | | |
| | Corporate Dividends Received Deduction* | | | 3.03 | % | | |
| | U.S. Treasury Obligations* | | | 0.05 | % | | |
| | Qualified Business Income* | | | 0.00 | % | | |
| | Business Interest Income* | | | 0.00 | % | | |
| | Foreign Taxes | | $ | 0.0911 | | | per share |
| | Foreign Source Income | | $ | 0.9348 | | | per share |
| | * | The above percentages are based on ordinary income dividends paid to shareholders during the Fund’s fiscal year. |
| | |
| 24 | | Invesco EQV Emerging Markets All Cap Fund |
Trustees and Officers
The address of each trustee and officer is AIM Investment Funds (Invesco Investment Funds) (the “Trust”), 11 Greenway Plaza, Suite 1000, Houston, Texas 77046-1173. The trustees serve for the life of the Trust, subject to their earlier death, incapacitation, resignation, retirement or removal as more specifically provided in the Trust’s organizational documents. Each officer serves for a one year term or until their successors are elected and qualified. Column two below includes length of time served with predecessor entities, if any.
| | | | | | | | |
Name, Year of Birth and Position(s) Held with the Trust | | Trustee and/or Officer Since | | Principal Occupation(s) During Past 5 Years | | Number of Funds in Fund Complex Overseen by Trustee | | Other Directorship(s) Held by Trustee During Past 5 Years |
| Interested Trustee | | | | | | | | |
| Martin L. Flanagan1 – 1960 Trustee and Vice Chair | | 2007 | | Executive Director, Chief Executive Officer and President, Invesco Ltd. (ultimate parent of Invesco and a global investment management firm); Trustee and Vice Chair, The Invesco Funds; Vice Chair, Investment Company Institute; and Member of Executive Board, SMU Cox School of Business Formerly: Advisor to the Board, Invesco Advisers, Inc. (formerly known as Invesco Institutional (N.A.), Inc.); Chairman and Chief Executive Officer, Invesco Advisers, Inc. (registered investment adviser); Director, Chairman, Chief Executive Officer and President, Invesco Holding Company (US), Inc. (formerly IVZ Inc.) (holding company), Invesco Group Services, Inc. (service provider) and Invesco North American Holdings, Inc. (holding company); Director, Chief Executive Officer and President, Invesco Holding Company Limited (parent of Invesco and a global investment management firm); Director, Invesco Ltd.; Chairman, Investment Company Institute and President, Co-Chief Executive Officer, Co-President, Chief Operating Officer and Chief Financial Officer, Franklin Resources, Inc. (global investment management organization) | | 189 | | None |
| 1 | Mr. Flanagan is considered an interested person (within the meaning of Section 2(a)(19) of the 1940 Act) of the Trust because he is an officer of the Adviser to the Trust, and an officer and a director of Invesco Ltd., ultimate parent of the Adviser. |
| | |
| T-1 | | Invesco EQV Emerging Markets All Cap Fund |
Trustees and Officers–(continued)
| | | | | | | | |
Name, Year of Birth and Position(s) Held with the Trust | | Trustee and/or Officer Since | | Principal Occupation(s) During Past 5 Years | | Number of Funds in Fund Complex Overseen by Trustee | | Other Directorship(s) Held by Trustee During Past 5 Years |
| Independent Trustees | | | | | | | | |
Beth Ann Brown – 1968 Trustee (2019) and Chair (August 2022) | | 2019 | | Independent Consultant Formerly: Head of Intermediary Distribution, Managing Director, Strategic Relations, Managing Director, Head of National Accounts, Senior Vice President, National Account Manager and Senior Vice President, Key Account Manager, Columbia Management Investment Advisers LLC; Vice President, Key Account Manager, Liberty Funds Distributor, Inc.; and Trustee of certain Oppenheimer Funds | | 189 | | Director, Board of Directors of Caron Engineering Inc.; Advisor, Board of Advisors of Caron Engineering Inc.; President and Director, Acton Shapleigh Youth Conservation Corps (non-profit) Formerly: President and Director Director of Grahamtastic Connection (non-profit) |
Cynthia Hostetler – 1962 Trustee | | 2017 | | Non-Executive Director and Trustee of a number of public and private business corporations Formerly: Director, Aberdeen Investment Funds (4 portfolios); Director, Artio Global Investment LLC (mutual fund complex); Director, Edgen Group, Inc. (specialized energy and infrastructure products distributor); Director, Genesee & Wyoming, Inc. (railroads); Head of Investment Funds and Private Equity, Overseas Private Investment Corporation; President, First Manhattan Bancorporation, Inc.; and Attorney, Simpson Thacher & Bartlett LLP | | 189 | | Resideo Technologies, Inc. (smart home technology); Vulcan Materials Company (construction materials company); Trilinc Global Impact Fund; Textainer Group Holdings, (shipping container leasing company); Investment Company Institute (professional organization); and Independent Directors Council (professional organization) |
Eli Jones – 1961 Trustee | | 2016 | | Professor and Dean Emeritus, Mays Business School - Texas A&M University Formerly: Dean of Mays Business School-Texas A&M University; Professor and Dean, Walton College of Business, University of Arkansas and E.J. Ourso College of Business, Louisiana State University; and Director, Arvest Bank | | 189 | | Insperity, Inc. (formerly known as Administaff) (human resources provider); and Member of Regional Board of Directors and Board of Directors, First Financial Bancorp (regional bank) |
Elizabeth Krentzman – 1959 Trustee | | 2019 | | Formerly: Principal and Chief Regulatory Advisor for Asset Management Services and U.S. Mutual Fund Leader of Deloitte & Touche LLP; General Counsel of the Investment Company Institute (trade association); National Director of the Investment Management Regulatory Consulting Practice, Principal, Director and Senior Manager of Deloitte & Touche LLP; Assistant Director of the Division of Investment Management - Office of Disclosure and Investment Adviser Regulation of the U.S. Securities and Exchange Commission and various positions with the Division of Investment Management - Office of Regulatory Policy of the U.S. Securities and Exchange Commission; Associate at Ropes & Gray LLP; and Trustee of certain Oppenheimer Funds | | 189 | | Formerly: Member of the Cartica Funds Board of Directors (private investment fund); Trustee of the University of Florida National Board Foundation; and Member of the University of Florida Law Center Association, Inc. Board of Trustees, Audit Committee and Membership Committee |
Anthony J. LaCava, Jr. – 1956 Trustee | | 2019 | | Formerly: Director and Member of the Audit Committee, Blue Hills Bank (publicly traded financial institution) and Managing Partner, KPMG LLP | | 189 | | Blue Hills Bank; Chairman, Bentley University; Member, Business School Advisory Council; and Nominating Committee, KPMG LLP |
Prema Mathai-Davis – 1950 Trustee | | 2001 | | Retired Formerly: Co-Founder & Partner of Quantalytics Research, LLC, (a FinTech Investment Research Platform for the Self-Directed Investor); Trustee of YWCA Retirement Fund; CEO of YWCA of the USA; Board member of the NY Metropolitan Transportation Authority; Commissioner of the NYC Department of Aging; and Board member of Johns Hopkins Bioethics Institute | | 189 | | Member of Board of Positive Planet US (non-profit) and HealthCare Chaplaincy Network (non-profit) |
| | |
| T-2 | | Invesco EQV Emerging Markets All Cap Fund |
Trustees and Officers–(continued)
| | | | | | | | |
Name, Year of Birth and Position(s) Held with the Trust | | Trustee and/or Officer Since | | Principal Occupation(s) During Past 5 Years | | Number of Funds in Fund Complex Overseen by Trustee | | Other Directorship(s) Held by Trustee During Past 5 Years |
| Independent Trustees–(continued) | | | | | | |
Joel W. Motley – 1952 Trustee | | 2019 | | Director of Office of Finance, Federal Home Loan Bank System; Managing Director of Carmona Motley Inc. (privately held financial advisor); Member of the Council on Foreign Relations and its Finance and Budget Committee; Chairman Emeritus of Board of Human Rights Watch and Member of its Investment Committee; and Member of Investment Committee Board of Historic Hudson Valley (non-profit cultural organization); Member of the Board, Blue Ocean Acquisition Corp.; and Member of the Vestry and the Investment Committee of Trinity Church Wall Street. Formerly: Managing Director of Public Capital Advisors, LLC (privately held financial advisor); Managing Director of Carmona Motley Hoffman, Inc. (privately held financial advisor); Trustee of certain Oppenheimer Funds; and Director of Columbia Equity Financial Corp. (privately held financial advisor) | | 189 | | Member of Board of Trust for Mutual Understanding (non-profit promoting the arts and environment); Member of Board of Greenwall Foundation (bioethics research foundation) and its Investment Committee; Member of Board of Friends of the LRC (non- profit legal advocacy); and Board Member and Investment Committee Member of Pulitzer Center for Crisis Reporting (non-profit journalism) |
Teresa M. Ressel – 1962 Trustee | | 2017 | | Non-executive director and trustee of a number of public and private business corporations Formerly: Chief Executive Officer, UBS Securities LLC (investment banking); Chief Operating Officer, UBS AG Americas (investment banking); Sr. Management Team Olayan America, The Olayan Group (international investor/commercial/industrial); Assistant Secretary for Management & Budget and Designated Chief Financial Officer, U.S. Department of Treasury and Director, ON Semiconductor Corporation (semiconductor manufacturing) | | 189 | | None |
Robert C. Troccoli – 1949 Trustee | | 2016 | | Retired Formerly: Adjunct Professor, University of Denver - Daniels College of Business; and Managing Partner, KPMG LLP | | 189 | | None |
Daniel S. Vandivort – 1954 Trustee | | 2019 | | President, Flyway Advisory Services LLC (consulting and property management) Formerly: President and Chief Investment Officer, previously Head of Fixed Income, Weiss Peck and Greer/Robeco Investment Management; Trustee and Chair, Weiss Peck and Greer Funds Board; and various capacities at CS First Boston including Head of Fixed Income at First Boston Asset Management. | | 189 | | Formerly: Trustee and Governance Chair, Oppenheimer Funds; Treasurer, Chairman of the Audit and Finance Committee, Huntington Disease Foundation of America |
| | |
| T-3 | | Invesco EQV Emerging Markets All Cap Fund |
Trustees and Officers–(continued)
| | | | | | | | |
Name, Year of Birth and Position(s) Held with the Trust | | Trustee and/or Officer Since | | Principal Occupation(s) During Past 5 Years | | Number of Funds in Fund Complex Overseen by Trustee | | Other Directorship(s) Held by Trustee During Past 5 Years |
| Officers | | | | | | | | |
Sheri Morris – 1964 President and Principal Executive Officer | | 1999 | | Director, Invesco Trust Company; Head of Global Fund Services, Invesco Ltd.; President and Principal Executive Officer, The Invesco Funds; Vice President, Invesco Exchange-Traded Fund Trust, Invesco Exchange-Traded Fund Trust II, Invesco India Exchange-Traded Fund Trust, Invesco Actively Managed Exchange-Traded Fund Trust, Invesco Actively Managed Exchange-Traded Commodity Fund Trust and Invesco Exchange-Traded Self-Indexed Fund Trust; and Vice President, OppenheimerFunds, Inc. Formerly: Vice President, Treasurer and Principal Financial Officer, The Invesco Funds; Vice President, Invesco AIM Advisers, Inc., Invesco AIM Capital Management, Inc. and Invesco AIM Private Asset Management, Inc.; Assistant Vice President and Assistant Treasurer, The Invesco Funds; Vice President and Assistant Vice President, Invesco Advisers, Inc.; Assistant Vice President, Invesco AIM Capital Management, Inc. and Invesco AIM Private Asset Management, Inc.; Treasurer, Invesco Exchange-Traded Fund Trust, Invesco Exchange-Traded Fund Trust II, Invesco India Exchange-Traded Fund Trust and Invesco Actively Managed Exchange-Traded Fund Trust; and Senior Vice President, Invesco Advisers, Inc. (formerly known as Invesco Institutional (N.A.), Inc.) (registered investment adviser) | | N/A | | N/A |
Jeffrey H. Kupor – 1968 Senior Vice President, Chief Legal Officer and Secretary | | 2018 | | Head of Legal of the Americas, Invesco Ltd.; Senior Vice President and Secretary, Invesco Advisers, Inc. (formerly known as Invesco Institutional (N.A.), Inc.) (registered investment adviser); Secretary, Invesco Distributors, Inc. (formerly known as Invesco AIM Distributors, Inc.); Vice President and Secretary, Invesco Investment Services, Inc. (formerly known as Invesco AIM Investment Services, Inc.); Senior Vice President, Chief Legal Officer and Secretary, The Invesco Funds; Secretary and General Counsel, Invesco Investment Advisers LLC (formerly known as Van Kampen Asset Management); Secretary and General Counsel, Invesco Capital Markets, Inc. (formerly known as Van Kampen Funds Inc.); Chief Legal Officer, Invesco Exchange-Traded Fund Trust, Invesco Exchange-Traded Fund Trust II, Invesco India Exchange-Traded Fund Trust, Invesco Actively Managed Exchange-Traded Fund Trust, Invesco Actively Managed Exchange-Traded Commodity Fund Trust and Invesco Exchange-Traded Self-Indexed Fund Trust;; Secretary and Vice President, Harbourview Asset Management Corporation; Secretary and Vice President, OppenheimerFunds, Inc. and Invesco Managed Accounts, LLC; Secretary and Senior Vice President, OFI Global Institutional, Inc.; Secretary and Vice President, OFI SteelPath, Inc.; Secretary and Vice President, Oppenheimer Acquisition Corp.; Secretary and Vice President, Shareholder Services, Inc.; and Secretary and Vice President, Trinity Investment Management Corporation Formerly: Senior Vice President, Invesco Distributors, Inc.; Secretary and Vice President, Jemstep, Inc.; Head of Legal, Worldwide Institutional, Invesco Ltd.; Secretary and General Counsel, INVESCO Private Capital Investments, Inc.; Senior Vice President, Secretary and General Counsel, Invesco Management Group, Inc. (formerly known as Invesco AIM Management Group, Inc.); Assistant Secretary, INVESCO Asset Management (Bermuda) Ltd.; Secretary and General Counsel, Invesco Private Capital, Inc.; Assistant Secretary and General Counsel, INVESCO Realty, Inc.; Secretary and General Counsel, Invesco Senior Secured Management, Inc.; Secretary, Sovereign G./P. Holdings Inc.; Secretary, Invesco Indexing LLC; and Secretary, W.L. Ross & Co., LLC | | N/A | | N/A |
Andrew R. Schlossberg – 1974 Senior Vice President | | 2019 | | Senior Vice President, Invesco Group Services, Inc.; Head of the Americas and Senior Managing Director, Invesco Ltd.; Director and Senior Vice President, Invesco Advisers, Inc. (formerly known as Invesco Institutional (N.A.), Inc.) (registered investment adviser); Director and Chairman, Invesco Investment Services, Inc. (formerly known as Invesco AIM Investment Services, Inc.) (registered transfer agent); Senior Vice President, The Invesco Funds; and Director, Invesco Investment Advisers LLC (formerly known as Van Kampen Asset Management) Formerly: Director, President and Chairman, Invesco Insurance Agency, Inc.; Director, Invesco UK Limited; Director and Chief Executive, Invesco Asset Management Limited and Invesco Fund Managers Limited; Assistant Vice President, The Invesco Funds; Senior Vice President, Invesco Advisers, Inc. (formerly known as Invesco Institutional (N.A.), Inc.) (registered investment adviser); Director and Chief Executive, Invesco Administration Services Limited and Invesco Global Investment Funds Limited; Director, Invesco Distributors, Inc.; Head of EMEA, Invesco Ltd.; President, Invesco Actively Managed Exchange-Traded Commodity Fund Trust, Invesco Actively Managed Exchange-Traded Fund Trust, Invesco Exchange-Traded Fund Trust, Invesco Exchange-Traded Fund Trust II and Invesco India Exchange-Traded Fund Trust; and Managing Director and Principal Executive Officer, Invesco Capital Management LLC | | N/A | | N/A |
| | |
| T-4 | | Invesco EQV Emerging Markets All Cap Fund |
Trustees and Officers–(continued)
| | | | | | | | |
Name, Year of Birth and Position(s) Held with the Trust | | Trustee and/or Officer Since | | Principal Occupation(s) During Past 5 Years | | Number of Funds in Fund Complex Overseen by Trustee | | Other Directorship(s) Held by Trustee During Past 5 Years |
| Officers–(continued) | | | | | | | | |
John M. Zerr – 1962 Senior Vice President | | 2006 | | Chief Operating Officer of the Americas; Senior Vice President, Invesco Advisers, Inc. (formerly known as Invesco Institutional (N.A.), Inc.) (registered investment adviser); Senior Vice President, Invesco Distributors, Inc. (formerly known as Invesco AIM Distributors, Inc.); Director and Vice President, Invesco Investment Services, Inc. (formerly known as Invesco AIM Investment Services, Inc.) Senior Vice President, The Invesco Funds; Managing Director, Invesco Capital Management LLC; Director, Invesco Investment Advisers LLC (formerly known as Van Kampen Asset Management); Senior Vice President, Invesco Capital Markets, Inc. (formerly known as Van Kampen Funds Inc.); Manager, Invesco Indexing LLC; Manager, Invesco Specialized Products, LLC; Member, Invesco Canada Funds Advisory Board; Director, President and Chief Executive Officer, Invesco Corporate Class Inc. (corporate mutual fund company); and Director, Chairman, President and Chief Executive Officer, Invesco Canada Ltd. (formerly known as Invesco Trimark Ltd./Invesco Trimark Ltèe) (registered investment adviser and registered transfer agent); President, Invesco, Inc.; President, Invesco Global Direct Real Estate Feeder GP Ltd.; President, Invesco IP Holdings (Canada) Ltd; President, Invesco Global Direct Real Estate GP Ltd.; President, Invesco Financial Services Ltd. / Services Financiers Invesco Ltée; and Director and Chairman, Invesco Trust Company Formerly: President, Trimark Investments Ltd/Services Financiers Invesco Ltee; Director and Senior Vice President, Invesco Insurance Agency, Inc.; Director and Senior Vice President, Invesco Management Group, Inc. (formerly known as Invesco AIM Management Group, Inc.); Secretary and General Counsel, Invesco Management Group, Inc. (formerly known as Invesco AIM Management Group, Inc.); Secretary, Invesco Investment Services, Inc. (formerly known as Invesco AIM Investment Services, Inc.); Chief Legal Officer and Secretary, The Invesco Funds; Secretary and General Counsel, Invesco Investment Advisers LLC (formerly known as Van Kampen Asset Management); Secretary and General Counsel, Invesco Capital Markets, Inc. (formerly known as Van Kampen Funds Inc.); Chief Legal Officer, Invesco Exchange-Traded Fund Trust, Invesco Exchange-Traded Fund Trust II, Invesco India Exchange-Traded Fund Trust, Invesco Actively Managed Exchange-Traded Fund Trust, Invesco Actively Managed Exchange-Traded Commodity Fund Trust and Invesco Exchange-Traded Self-Indexed Fund Trust; Secretary, Invesco Indexing LLC; Director, Secretary, General Counsel and Senior Vice President, Van Kampen Exchange Corp.; Director, Vice President and Secretary, IVZ Distributors, Inc. (formerly known as INVESCO Distributors, Inc.); Director and Vice President, INVESCO Funds Group, Inc.; Director and Vice President, Van Kampen Advisors Inc.; Director, Vice President, Secretary and General Counsel, Van Kampen Investor Services Inc.;Director and Secretary, Invesco Distributors, Inc. (formerly known as Invesco AIM Distributors, Inc.); Director, Senior Vice President, General Counsel and Secretary, Invesco AIM Advisers, Inc. and Van Kampen Investments Inc.; Director, Vice President and Secretary, Fund Management Company; Director, Senior Vice President, Secretary, General Counsel and Vice President, Invesco AIM Capital Management, Inc.; and Chief Operating Officer and General Counsel, Liberty Ridge Capital, Inc. (an investment adviser) | | N/A | | N/A |
Gregory G. McGreevey – 1962 Senior Vice President | | 2012 | | Senior Managing Director, Invesco Ltd.; Director, Chairman, President, and Chief Executive Officer, Invesco Advisers, Inc. (formerly known as Invesco Institutional (N.A.), Inc.) (registered investment adviser); Director, Invesco Mortgage Capital, Inc. and Invesco Senior Secured Management, Inc.; Senior Vice President, The Invesco Funds; President, SNW Asset Management Corporation and Invesco Managed Accounts, LLC; Chairman and Director, Invesco Private Capital, Inc.; Chairman and Director, INVESCO Private Capital Investments, Inc.; Chairman and Director, INVESCO Realty, Inc.; and Senior Vice President, Invesco Group Services, Inc. Formerly: Senior Vice President, Invesco Management Group, Inc. and Invesco Advisers, Inc.; Assistant Vice President, The Invesco Funds | | N/A | | N/A |
Adrien Deberghes – 1967 Principal Financial Officer, Treasurer and Vice President | | 2020 | | Head of the Fund Office of the CFO and Fund Administration; Vice President, Invesco Advisers, Inc.; Principal Financial Officer, Treasurer and Vice President, The Invesco Funds; Vice President, Invesco Exchange-Traded Fund Trust, Invesco Exchange-Traded Fund Trust II, Invesco India Exchange-Traded Fund Trust, Invesco Actively Managed Exchange-Traded Fund Trust, Invesco Actively Managed Exchange-Traded Commodity Fund Trust and Invesco Exchange-Traded Self-Indexed Fund Trust Formerly: Senior Vice President and Treasurer, Fidelity Investments | | N/A | | N/A |
Crissie M. Wisdom – 1969 Anti-Money Laundering Compliance Officer | | 2013 | | Anti-Money Laundering and OFAC Compliance Officer for Invesco U.S. entities including: Invesco Advisers, Inc. and its affiliates, Invesco Capital Markets, Inc., Invesco Distributors, Inc., Invesco Investment Services, Inc., The Invesco Funds, Invesco Capital Management, LLC, Invesco Trust Company; and Fraud Prevention Manager for Invesco Investment Services, Inc. | | N/A | | N/A |
| | |
| T-5 | | Invesco EQV Emerging Markets All Cap Fund |
Trustees and Officers–(continued)
| | | | | | | | |
Name, Year of Birth and Position(s) Held with the Trust | | Trustee and/or Officer Since | | Principal Occupation(s) During Past 5 Years | | Number of Funds in Fund Complex Overseen by Trustee | | Other Directorship(s) Held by Trustee During Past 5 Years |
| Officers–(continued) | | | | | | | | |
Todd F. Kuehl – 1969 Chief Compliance Officer and Senior Vice President | | 2020 | | Chief Compliance Officer, Invesco Advisers, Inc. (registered investment adviser); and Chief Compliance Officer and Senior Vice President, The Invesco Funds Formerly: Managing Director and Chief Compliance Officer, Legg Mason (Mutual Funds); Chief Compliance Officer, Legg Mason Private Portfolio Group (registered investment adviser) | | N/A | | N/A |
James Bordewick, Jr. – 1959 Senior Vice President and Senior Officer | | 2022 | | Senior Vice President and Senior Officer, The Invesco Funds; and Chief Legal Officer, KingsCrowd, Inc. (research and analytical platform for investment in private capital markets) Formerly, Chief Operating Officer and Head of Legal and Regulatory, Netcapital (private capital investment platform); Managing Director, General Counsel of asset management and Chief Compliance Officer for asset management and private banking, Bank of America Corporation; Chief Legal Officer, Columbia Funds and BofA Funds; Senior Vice President and Associate General Counsel, MFS Investment Management; Chief Legal Officer, MFS Funds; Associate, Ropes & Gray; Associate, Gaston Snow & Ely Bartlett | | N/A | | N/A |
The Statement of Additional Information of the Trust includes additional information about the Fund’s Trustees and is available upon request, without charge, by calling 1.800.959.4246. Please refer to the Fund’s Statement of Additional Information for information on the Fund’s sub-advisers.
| | | | | | |
| Office of the Fund | | Investment Adviser | | Distributor | | Auditors |
| 11 Greenway Plaza, Suite 1000 | | Invesco Advisers, Inc. | | Invesco Distributors, Inc. | | PricewaterhouseCoopers LLP |
| Houston, TX 77046-1173 | | 1555 Peachtree Street, N.E. | | 11 Greenway Plaza, Suite 1000 | | 1000 Louisiana Street, Suite 5800 |
| | Atlanta, GA 30309 | | Houston, TX 77046-1173 | | Houston, TX 77002-5021 |
| | | |
| Counsel to the Fund | | Counsel to the Independent Trustees | | Transfer Agent | | Custodian |
| Stradley Ronon Stevens & Young, LLP | | Goodwin Procter LLP | | Invesco Investment Services, Inc. | | State Street Bank and Trust Company |
| 2005 Market Street, Suite 2600 | | 901 New York Avenue, N.W. | | 11 Greenway Plaza, Suite 1000 | | 225 Franklin Street |
| Philadelphia, PA 19103-7018 | | Washington, D.C. 20001 | | Houston, TX 77046-1173 | | Boston, MA 02110-2801 |
| | |
| T-6 | | Invesco EQV Emerging Markets All Cap Fund |
(This page intentionally left blank)

Go paperless with eDelivery
Visit invesco.com/edelivery to enjoy the convenience and security of anytime electronic access to your investment documents.
With eDelivery, you can elect to have any or all of the following materials delivered straight to your inbox to download, save and print from your own computer:
∎ Fund reports and prospectuses
∎ Quarterly statements
∎ Daily confirmations
∎ Tax forms
Invesco mailing information
Send general correspondence to Invesco Investment Services, Inc., P.O. Box 219078, Kansas City, MO 64121-9078.
Important notice regarding delivery of security holder documents
To reduce Fund expenses, only one copy of most shareholder documents may be mailed to shareholders with multiple accounts at the same address (Householding). Mailing of your shareholder documents may be householded indefinitely unless you instruct us otherwise. If you do not want the mailing of these documents to be combined with those for other members of your household, please contact Invesco Investment Services, Inc. at 800 959 4246 or contact your financial institution. We will begin sending you individual copies for each account within 30 days after receiving your request.
Fund holdings and proxy voting information
The Fund provides a complete list of its portfolio holdings four times each year, at the end of each fiscal quarter. For the second and fourth quarters, the list appears, respectively, in the Fund’s semiannual and annual reports to shareholders. For the first and third quarters, the Fund files the list with the Securities and Exchange Commission (SEC) as an exhibit to its reports on Form N-PORT. The most recent list of portfolio holdings is available at invesco.com/completeqtrholdings. Shareholders can also look up the Fund’s Form N-PORT filings on the SEC website, sec.gov. The SEC file numbers for the Fund are shown below.
A description of the policies and procedures that the Fund uses to determine how to vote proxies relating to portfolio securities is available without charge, upon request, from our Client Services department at 800 959 4246, or at invesco.com/corporate/about-us/esg. The information is also available on the SEC website, sec.gov.
Information regarding how the Fund voted proxies related to its portfolio securities during the most recent 12-month period ended June 30 is available at invesco.com/proxysearch. This information is also available on the SEC website, sec.gov.
Invesco Advisers, Inc. is an investment adviser; it provides investment advisory services to individual and institutional clients and does not sell securities. Invesco Distributors, Inc. is the US distributor for Invesco Ltd.’s retail mutual funds, exchange-traded funds and institutional money market funds. Both are wholly owned, indirect subsidiaries of Invesco Ltd.
| | | | |
| SEC file number(s): 811-05426 and 033-19338 | | Invesco Distributors, Inc. | | DVM-AR-1 |

| | |
| | |
| Annual Report to Shareholders | | October 31, 2022 |
Invesco Emerging Markets Innovators Fund
Nasdaq:
A: EMIAX ∎ C: EMVCX ∎ R: EMIRX ∎ Y: EMIYX ∎ R5: EMIMX ∎ R6: EMVIX
Management’s Discussion of Fund Performance
| | | | |
| |
Performance summary | |
For the fiscal year ended October 31, 2022, Class A shares of Invesco Emerging Markets Innovators Fund (the Fund), at net asset value (NAV), underperformed the MSCI Emerging Markets Index. | |
Your Fund’s long-term performance appears later in this report. | |
| |
Fund vs. Indexes | |
Total returns, 10/31/21 to 10/31/22, at net asset value (NAV). Performance shown does not include applicable contingent deferred sales charges (CDSC) or front-end sales charges, which would have reduced performance. | |
Class A Shares | | | -39.85 | % |
Class C Shares | | | -40.30 | |
Class R Shares | | | -40.01 | |
Class Y Shares | | | -39.68 | |
Class R5 Shares | | | -39.73 | |
Class R6 Shares | | | -39.77 | |
MSCI Emerging Markets Index▼ | | | -31.03 | |
| |
Source(s): ▼RIMES Technologies Corp. | | | | |
Market conditions and your Fund
At the beginning of the fiscal year ended October 31, 2022, developed global equity markets were mostly positive, despite rising inflation and the emergence of Omicron, a new COVID-19 variant. Pandemic-related supply chain disruptions and labor shortages intensified at the end of 2021, resulting in broadly higher costs for companies and consumers. Emerging market equities declined due in part to COVID-19 concerns and China’s ongoing regulatory tightening in the private education and technology sectors and slowing economic growth.
Global equity markets declined in the first half of 2022 amid volatility sparked by Russia’s invasion of Ukraine, rising commodity prices, rampant global inflation and central banks shifting toward tighter monetary policy. Russia’s invasion exacerbated inflationary pressures, disrupting already strained supply chains, and increasing shortages of oil, gas and raw materials, with the price of oil rising sharply.
Inflation headwinds continued into the third quarter of 2022. The US Federal Reserve (the Fed), the European Central Bank and the Bank of England all raised interest rates. In contrast, the People’s Bank of China lowered its policy rate and the Bank of Japan kept rates the same. Emerging market equities, hampered by the strong US dollar, underperformed developed market equities.
During October 2022, developed market equities rebounded and were in positive territory. Developed market equities outperformed emerging market equities, which declined primarily driven by weakness in China as Chinese markets reacted to the reappointment of President Xi and his authority, with no signs of the country’s zero-COVID-19 policy being relaxed. Despite the rebound in October for developed market equities, at the end of the fiscal year, trailing one-year returns for developed market equities and
emerging market equities were both in negative territory.
Global markets have been enshrouded by geopolitical shock waves stemming from Russia’s invasion of Ukraine, rising inflation levels, recessionary fears, etc. Much of this has dampened sentiment toward emerging market equities. However, after two years of interconnected, unlikely and extreme events, we are encouraged by three important factors in emerging markets: valuations are cheap relative to US equities, central banks in most emerging market countries stayed ahead of inflationary pressures by raising interest rates and China seems poised for recovery from its debilitating zero-COVID-19 policy, which we believe would provide investment opportunities.
From a sector perspective, the largest contributors to the Fund’s relative performance during the fiscal year were stock selection in consumer discretionary, an overweight and stock selection in consumer staples and stock selection in real estate. The largest detractors from the Fund’s relative performance were an underweight and stock selection in financials, stock selection and an overweight in health care and stock selection in information technology.
From a country perspective, the largest contributors to the Fund’s relative performance during the fiscal year were an overweight in Mexico, an underweight allocation to and stock selection in South Korea and an overweight in Turkey. The largest detractors from the Fund’s relative performance were an overweight and stock selection in Russia, stock selection in China and an overweight in India.
The largest contributors to the Fund’s absolute performance during the fiscal year included Arezzo Industria e Comercio (Arezzo), BIM Birlesik Magazalar (BIM) and Coca-Cola FEMSA.
Arezzo is a Brazilian retailer that provides its consumers an omnichannel approach to
shopping for women, men and children’s apparel. We believe, Arezzo’s growth profile should be supported by further consolidation in Brazil’s fragmented retail market and ongoing investments in digital platforms. Our observations of improving macro data in Brazil, including receding inflation and higher gross domestic product growth estimates, should bolster discretionary spending.
BIM operates the largest supermarket chain in Turkey offering consumers access to a large assortment of high-quality products at affordable prices. BIM’s private label products make up a large portion of store offerings providing BIM with price setting power, while digitalization initiatives have expanded their pool of customers.
Coca-Cola FEMSA, a subsidiary of Fomento Economico Mexicano (FEMSA), retails and distributes a diversified portfolio of beverages inclusive of traditional Coca-Cola products, sports drinks and bottled water. In our view, a focus on product innovation and streamlining product fulfillment should allow for the further expansion of Coca-Cola FEMSA’s products throughout Latin/South America.
The largest detractors from the Fund’s absolute performance during the fiscal year included Yandex, Silergy and WuXi Biologics.
Yandex is one of the dominant internet companies in Russia’s transforming digital landscape, holding positions in several categories including Russia’s search engine, shared mobility, food delivery, e-commerce and others. Note that Yandex runs one of the most profitable mobility and food delivery platforms in the world and we believe it may benefit from future industry consolidation in e-commerce. However, Yandex has been affected by the impact of sanctions on Russia following the invasion of Ukraine. Due to ongoing market closures, lack of trading partners, low liquidity, settlement concerns and future uncertainty, Invesco priced all Russian equity holdings of the Fund to zero as of March 2, 2022.
Silergy is the largest fabless producer in Taiwan and a global leader in PMIC (power management integrated circuits), a growing business as more IoT (Internet of Things) devices come to market and demand expands. Silergy has diversified its business into higher margin product mixes. Softening demand in the consumer electronics segment has had a negative impact on the industry.
WuXi Biologics (WuXi) leveraged its unique technology and drug production know-how to become the largest contract development and manufacturing organization (CDMO) in China. WuXi collaborates with clients from conception through commercial manufacturing delivering end-to-end solutions and support.
When we look longer term, we believe many emerging market companies are embarking on a new era - cutting back on oversized ambitions and focusing on opportunities that are profitable and cash generative. In our
| | |
| 2 | | Invesco Emerging Markets Innovators Fund |
view, this should lead to improved earnings and returns in these businesses as they become more rational and disciplined. We have been focused on finding investments in opportunities where the visible risks are well understood, have been deeply digested and have led to discounts in prices. We are looking out for circumstances where the risks have not yet been widely perceived. The net result is an opportunity to own undervalued, high-quality names with the potential for long-term structural growth.
We thank you for your continued investment in Invesco Emerging Markets Innovators Fund.
Portfolio manager(s):
Justin Leverenz
The views and opinions expressed in management’s discussion of Fund performance are those of Invesco Advisers, Inc. and its affiliates. These views and opinions are subject to change at any time based on factors such as market and economic conditions. These views and opinions may not be relied upon as investment advice or recommendations, or as an offer for a particular security. The information is not a complete analysis of every aspect of any market, country, industry, security or the Fund. Statements of fact are from sources considered reliable, but Invesco Advisers, Inc. makes no representation or warranty as to their completeness or accuracy. Although historical performance is no guarantee of future results, these insights may help you understand our investment management philosophy.
See important Fund and, if applicable, index disclosures later in this report.
| | |
| 3 | | Invesco Emerging Markets Innovators Fund |
Your Fund’s Long-Term Performance
Results of a $10,000 Investment – Oldest Share Class(es)
Fund and index data from 6/30/14
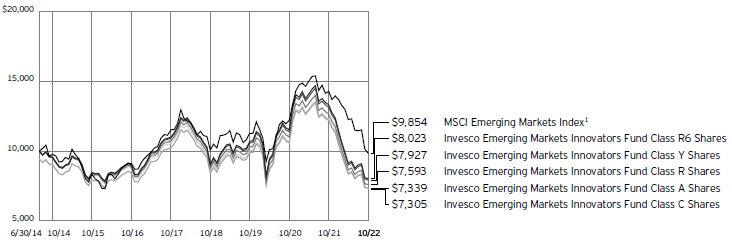
1 Source: RIMES Technologies Corp.
Past performance cannot guarantee future results.
The data shown in the chart include reinvested distributions, applicable sales charges and Fund expenses including management
fees. Index results include reinvested dividends, but they do not reflect sales charges. Performance of the peer group, if applicable, reflects fund expenses and management fees;
performance of a market index does not. Performance shown in the chart does not reflect deduction of taxes a shareholder would pay on Fund distributions or sale of Fund shares.
| | |
| 4 | | Invesco Emerging Markets Innovators Fund |
| | | | |
| |
Average Annual Total Returns | |
As of 10/31/22, including maximum applicable sales charges | |
Class A Shares | | | | |
Inception (6/30/14) | | | -3.64 | % |
5 Years | | | -7.50 | |
1 Year | | | -43.17 | |
Class C Shares | | | | |
Inception (6/30/14) | | | -3.70 | % |
5 Years | | | -7.18 | |
1 Year | | | -40.82 | |
Class R Shares | | | | |
Inception (6/30/14) | | | -3.25 | % |
5 Years | | | -6.71 | |
1 Year | | | -40.01 | |
Class Y Shares | | | | |
Inception (6/30/14) | | | -2.75 | % |
5 Years | | | -6.23 | |
1 Year | | | -39.68 | |
Class R5 Shares | | | | |
Inception | | | -2.87 | % |
5 Years | | | -6.25 | |
1 Year | | | -39.73 | |
Class R6 Shares | | | | |
Inception (6/30/14) | | | -2.61 | % |
5 Years | | | -6.13 | |
1 Year | | | -39.77 | |
Effective May 24, 2019, Class A, Class C, Class R, Class Y and Class I shares of the Oppenheimer Emerging Markets Innovators Fund, (the predecessor fund), were reorganized into Class A, Class C, Class R, Class Y, and Class R6 shares, respectively, of the Invesco Oppenheimer Emerging Markets Innovators Fund. The Fund was subsequently renamed the Invesco Emerging Markets Innovators Fund (the Fund). Returns shown above, for periods ending on or prior to May 24, 2019, for Class A, Class C, Class R, Class Y and Class R6 shares are those for Class A, Class C, Class R, Class Y and Class I shares of the predecessor fund. Share class returns will differ from the predecessor fund because of different expenses.
Class R5 shares incepted on May 24, 2019. Performance shown on and prior to that date is that of the predecessor fund’s Class A shares at net asset value and includes the 12b-1 fees applicable to Class A shares.
The performance data quoted represent past performance and cannot guarantee future results; current performance may be lower or higher. Please visit invesco.com/performance for the most recent month-end performance. Performance figures reflect reinvested distributions, changes in net asset value and the effect of the maximum sales charge unless otherwise stated. Performance figures do not reflect deduction of taxes a shareholder would pay on Fund distributions or sale of Fund shares. Investment return and principal value will
fluctuate so that you may have a gain or loss when you sell shares.
Class A share performance reflects the maximum 5.50% sales charge, and Class C share performance reflects the applicable contingent deferred sales charge (CDSC) for the period involved. The CDSC on Class C shares is 1% for the first year after purchase. Class R, Class Y, Class R5 and Class R6 shares do not have a front-end sales charge or a CDSC; therefore, performance is at net asset value.
The performance of the Fund’s share classes will differ primarily due to different sales charge structures and class expenses.
Fund performance reflects any applicable fee waivers and/or expense reimbursements. Had the adviser not waived fees and/or reimbursed expenses currently or in the past, returns would have been lower. See current prospectus for more information.
| | |
| 5 | | Invesco Emerging Markets Innovators Fund |
Supplemental Information
Invesco Emerging Markets Innovators Fund’s investment objective is to seek capital appreciation.
| ∎ | Unless otherwise stated, information presented in this report is as of October 31, 2022, and is based on total net assets. |
| ∎ | Unless otherwise noted, all data is provided by Invesco. |
| ∎ | To access your Fund’s reports/prospectus, visit invesco.com/fundreports. |
About indexes used in this report
| ∎ | The MSCI Emerging Markets Index is an unmanaged index considered representative of stocks of developing countries. The index is computed using the net return, which withholds applicable taxes for nonresident investors. |
| ∎ | The Fund is not managed to track the performance of any particular index, including the index(es) described here, and consequently, the performance of the Fund may deviate significantly from the performance of the index(es). |
| ∎ | A direct investment cannot be made in an index. Unless otherwise indicated, index results include reinvested dividends, and they do not reflect sales charges. Performance of the peer group, if applicable, reflects fund expenses; performance of a market index does not. |
|
|
This report must be accompanied or preceded by a currently effective Fund prospectus, which contains more complete information, including sales charges and expenses. Investors should read it carefully before investing. |
|
| NOT FDIC INSURED | MAY LOSE VALUE | NO BANK GUARANTEE |
| | |
| 6 | | Invesco Emerging Markets Innovators Fund |
Fund Information
Portfolio Composition
| | |
| By sector | | % of total net assets |
| |
Consumer Discretionary | | 27.37% |
| |
Consumer Staples | | 14.31 |
| |
Industrials | | 12.21 |
| |
Health Care | | 11.38 |
| |
Information Technology | | 8.38 |
| |
Financials | | 8.11 |
| |
Real Estate | | 7.37 |
| |
Materials | | 6.84 |
| |
Communication Services | | 1.00 |
| |
Money Market Funds Plus Other Assets Less Liabilities | | 3.03 |
Top 10 Equity Holdings*
| | | | |
| | | | | % of total net assets |
| | |
1. | | Le Travenues Technology Ltd. | | 6.49% |
| | |
2. | | Samsung Biologics Co. Ltd. | | 5.13 |
| | |
3. | | Yum China Holdings, Inc. | | 5.08 |
| | |
4. | | Arezzo Industria e Comercio S.A. | | 4.90 |
| | |
5. | | H World Group Ltd., ADR | | 4.59 |
| | |
6. | | LG Chem Ltd. | | 3.32 |
| | |
7. | | Voltronic Power Technology Corp. | | 2.94 |
| | |
8. | | Coca-Cola FEMSA S.A.B. de C.V., ADR | | 2.93 |
| | |
9. | | Wal-Mart de Mexico S.A.B. de C.V., Series V | | 2.76 |
| | |
10. | | Oberoi Realty Ltd. | | 2.73 |
The Fund’s holdings are subject to change, and there is no assurance that the Fund will continue to hold any particular security.
* Excluding money market fund holdings, if any.
Data presented here are as of October 31, 2022.
| | |
| 7 | | Invesco Emerging Markets Innovators Fund |
Schedule of Investments
October 31, 2022
| | | | | | | | |
| | | Shares | | | Value | |
|
| |
Common Stocks & Other Equity Interests–96.97% | |
Brazil–10.07% | | | | | | | | |
Arezzo Industria e Comercio S.A. | | | 310,000 | | | $ | 6,271,416 | |
|
| |
Lojas Renner S.A. | | | 341,910 | | | | 2,045,304 | |
|
| |
NU Holdings Ltd., Class A(a) | | | 192,905 | | | | 964,525 | |
|
| |
Pagseguro Digital Ltd., Class A(a) | | | 158,558 | | | | 2,169,074 | |
|
| |
WEG S.A. | | | 182,900 | | | | 1,426,234 | |
|
| |
| | | | | | | 12,876,553 | |
|
| |
| | |
Chile–2.81% | | | | | | | | |
Banco Santander Chile | | | 49,887,193 | | | | 1,796,648 | |
|
| |
Parque Arauco S.A. | | | 2,125,488 | | | | 1,799,204 | |
|
| |
| | | | | | | 3,595,852 | |
|
| |
| | |
China–24.94% | | | | | | | | |
BeiGene Ltd. (Acquired 01/12/2021; Cost $1,613,033)(a)(b) | | | 67,600 | | | | 867,990 | |
|
| |
BeiGene Ltd., ADR (Acquired
08/11/2020-06/16/2022;
Cost $2,004,939)(a)(b) | | | 10,774 | | | | 1,819,622 | |
|
| |
Brii Biosciences Ltd.(a) | | | 1,126,500 | | | | 802,601 | |
|
| |
H World Group Ltd., ADR | | | 216,874 | | | | 5,872,948 | |
|
| |
New Horizon Health Ltd.(a)(c) | | | 462,500 | | | | 1,029,019 | |
|
| |
Silergy Corp. | | | 252,000 | | | | 2,898,302 | |
|
| |
SITC International Holdings Co. Ltd. | | | 725,000 | | | | 1,188,738 | |
|
| |
Sunny Optical Technology Group Co. Ltd. | | | 240,900 | | | | 2,089,793 | |
|
| |
Tencent Music Entertainment Group, ADR(a) | | | 353,742 | | | | 1,277,008 | |
|
| |
Wuxi Biologics Cayman, Inc.(a)(c) | | | 513,000 | | | | 2,320,815 | |
|
| |
Yum China Holdings, Inc. | | | 156,979 | | | | 6,491,082 | |
|
| |
Zai Lab Ltd., ADR (Acquired
10/13/2021-01/07/2022;
Cost $4,606,156)(a)(b) | | | 52,088 | | | | 1,160,521 | |
|
| |
Zhongsheng Group Holdings Ltd. | | | 370,789 | | | | 1,408,169 | |
|
| |
ZTO Express (Cayman), Inc., ADR | | | 158,185 | | | | 2,671,745 | |
|
| |
| | | | | | | 31,898,353 | |
|
| |
| | |
India–17.49% | | | | | | | | |
Asian Paints Ltd. | | | 4,121 | | | | 154,955 | |
|
| |
Godrej Properties Ltd.(a) | | | 100,830 | | | | 1,536,942 | |
|
| |
Havells India Ltd. | | | 189,989 | | | | 2,794,161 | |
|
| |
HDFC Life Insurance Co. Ltd.(c) | | | 136,798 | | | | 892,586 | |
|
| |
ICICI Lombard General Insurance Co. Ltd.(c) | | | 95,324 | | | | 1,346,660 | |
|
| |
ICICI Prudential Life Insurance Co. Ltd.(c) | | | 289,650 | | | | 1,774,630 | |
|
| |
Le Travenues Technology Ltd.(d) | | | 7,200,800 | | | | 8,303,809 | |
|
| |
Marico Ltd. | | | 80,956 | | | | 513,313 | |
|
| |
Oberoi Realty Ltd. | | | 312,627 | | | | 3,489,733 | |
|
| |
Voltas Ltd. | | | 147,941 | | | | 1,564,911 | |
|
| |
| | | | | | | 22,371,700 | |
|
| |
| | |
Indonesia–5.64% | | | | | | | | |
PT Ace Hardware Indonesia Tbk | | | 46,685,600 | | | | 1,691,053 | |
|
| |
PT Bank Rakyat Indonesia (Persero) Tbk | | | 6,316,029 | | | | 1,879,562 | |
|
| |
PT Semen Indonesia (Persero) Tbk | | | 3,759,600 | | | | 1,913,764 | |
|
| |
PT Unilever Indonesia Tbk | | | 5,803,100 | | | | 1,726,455 | |
|
| |
| | | | | | | 7,210,834 | |
|
| |
| | | | | | | | |
| | | Shares | | | Value | |
|
| |
Mexico–12.60% | | | | | | | | |
Alsea S.A.B. de C.V. | | | 924,684 | | | $ | 1,773,015 | |
|
| |
Coca-Cola FEMSA S.A.B. de C.V., ADR | | | 59,665 | | | | 3,746,365 | |
|
| |
Fomento Economico Mexicano S.A.B. de C.V., Series CPO | | | 339,900 | | | | 2,440,013 | |
|
| |
Grupo Aeroportuario del Sureste S.A.B. de C.V., Class B | | | 93,795 | | | | 2,195,162 | |
|
| |
Grupo Mexico S.A.B. de C.V., Class B | | | 671,800 | | | | 2,435,542 | |
|
| |
Wal-Mart de Mexico S.A.B. de C.V., Series V | | | 912,500 | | | | 3,524,637 | |
|
| |
| | | | | | | 16,114,734 | |
|
| |
| | |
Peru–2.61% | | | | | | | | |
Credicorp Ltd. | | | 11,786 | | | | 1,724,999 | |
|
| |
InRetail Peru Corp.(c) | | | 46,827 | | | | 1,615,531 | |
|
| |
| | | | | | | 3,340,530 | |
|
| |
| | |
Philippines–2.09% | | | | | | | | |
San Miguel Food and Beverage, Inc. | | | 111,850 | | | | 70,774 | |
|
| |
SM Prime Holdings, Inc. | | | 4,750,800 | | | | 2,596,308 | |
|
| |
| | | | | | | 2,667,082 | |
|
| |
| | |
Russia–0.00% | | | | | | | | |
Fix Price Group Ltd., GDR(c)(d) | | | 148,043 | | | | 0 | |
|
| |
Polyus PJSC, GDR(c)(d) | | | 82,477 | | | | 0 | |
|
| |
TCS Group Holding PLC, GDR(c)(d) | | | 72,043 | | | | 0 | |
|
| |
Yandex N.V., Class A(a)(d) | | | 220,435 | | | | 0 | |
|
| |
| | | | | | | 0 | |
|
| |
| | |
South Korea–10.28% | | | | | | | | |
Coupang, Inc.(a) | | | 67,028 | | | | 1,157,574 | |
|
| |
LG Chem Ltd. | | | 9,687 | | | | 4,244,754 | |
|
| |
LG H&H Co. Ltd. | | | 3,324 | | | | 1,187,026 | |
|
| |
Samsung Biologics Co. Ltd.(a)(c) | | | 10,675 | | | | 6,559,968 | |
|
| |
| | | | | | | 13,149,322 | |
|
| |
| | |
Taiwan–4.80% | | | | | | | | |
MediaTek, Inc. | | | 131,000 | | | | 2,386,730 | |
|
| |
Voltronic Power Technology Corp. | | | 92,919 | | | | 3,758,831 | |
|
| |
| | | | | | | 6,145,561 | |
|
| |
| | |
Turkey–2.72% | | | | | | | | |
BIM Birlesik Magazalar A.S. | | | 481,875 | | | | 3,479,544 | |
|
| |
| | |
United States–0.92% | | | | | | | | |
Globant S.A.(a) | | | 6,255 | | | | 1,180,193 | |
|
| |
Total Common Stocks & Other Equity Interests
(Cost $134,199,709) | | | | | | | 124,030,258 | |
|
| |
| | |
Money Market Funds–1.21% | | | | | | | | |
Invesco Government & Agency Portfolio, Institutional Class,
3.07%(e)(f) | | | 540,907 | | | | 540,907 | |
|
| |
Invesco Liquid Assets Portfolio, Institutional Class, 3.03%(e)(f) | | | 386,333 | | | | 386,410 | |
|
| |
Invesco Treasury Portfolio, Institutional Class, 3.08%(e)(f) | | | 618,180 | | | | 618,180 | |
|
| |
Total Money Market Funds (Cost $1,545,459) | | | | 1,545,497 | |
|
| |
TOTAL INVESTMENTS IN SECURITIES–98.18%
(Cost $135,745,168) | | | | 125,575,755 | |
|
| |
OTHER ASSETS LESS LIABILITIES–1.82% | | | | 2,328,590 | |
|
| |
NET ASSETS–100.00% | | | | | | $ | 127,904,345 | |
|
| |
See accompanying Notes to Financial Statements which are an integral part of the financial statements.
| | |
| 8 | | Invesco Emerging Markets Innovators Fund |
| | |
| Investment Abbreviations: |
| |
| ADR | | – American Depositary Receipt |
| CPO | | – Certificates of Ordinary Participation |
| GDR | | – Global Depositary Receipt |
Notes to Schedule of Investments:
| (a) | Non-income producing security. |
| (b) | Restricted security. The aggregate value of these securities at October 31, 2022 was $3,848,133, which represented 3.01% of the Fund’s Net Assets. |
| (c) | Security purchased or received in a transaction exempt from registration under the Securities Act of 1933, as amended (the “1933 Act”). The security may be resold pursuant to an exemption from registration under the 1933 Act, typically to qualified institutional buyers. The aggregate value of these securities at October 31, 2022 was $15,539,209, which represented 12.15% of the Fund’s Net Assets. |
| (d) | Security valued using significant unobservable inputs (Level 3). See Note 3. |
| (e) | Affiliated issuer. The issuer and/or the Fund is a wholly-owned subsidiary of Invesco Ltd., or is affiliated by having an investment adviser that is under common control of Invesco Ltd. The table below shows the Fund’s transactions in, and earnings from, its investments in affiliates for the fiscal year ended October 31, 2022. |
| | | | | | | | | | | | | | | | | | | | | | | | | | | | |
| | | Value
October 31, 2021 | | | Purchases at Cost | | | Proceeds from Sales | | | Change in
Unrealized
Appreciation | | | Realized Gain (Loss) | | | Value
October 31, 2022 | | | Dividend Income | |
| Investments in Affiliated Money Market Funds: | | | | | | | | | | | | | | | | | | | | | | | | | | | | |
Invesco Government & Agency Portfolio, Institutional Class | | $ | 5,168,377 | | | $ | 30,834,034 | | | $ | (35,461,504 | ) | | | $ - | | | $ | - | | | $ | 540,907 | | | $ | 8,368 | |
Invesco Liquid Assets Portfolio, Institutional Class | | | 3,651,667 | | | | 22,024,310 | | | | (25,289,109 | ) | | | 38 | | | | (496) | | | | 386,410 | | | | 7,006 | |
Invesco Treasury Portfolio, Institutional Class | | | 5,906,716 | | | | 35,238,897 | | | | (40,527,433 | ) | | | - | | | | - | | | | 618,180 | | | | 10,387 | |
Total | | $ | 14,726,760 | | | $ | 88,097,241 | | | $ | (101,278,046 | ) | | | $38 | | | $ | (496) | | | $ | 1,545,497 | | | $ | 25,761 | |
| (f) | The rate shown is the 7-day SEC standardized yield as of October 31, 2022. |
See accompanying Notes to Financial Statements which are an integral part of the financial statements.
| | |
| 9 | | Invesco Emerging Markets Innovators Fund |
Statement of Assets and Liabilities
October 31, 2022
| | | | |
Assets: | | | | |
Investments in unaffiliated securities, at value
(Cost $134,199,709) | | $ | 124,030,258 | |
|
| |
Investments in affiliated money market funds, at value
(Cost $1,545,459) | | | 1,545,497 | |
|
| |
Cash | | | 300,000 | |
|
| |
Foreign currencies, at value (Cost $3,016,982) | | | 2,799,974 | |
|
| |
Receivable for: | | | | |
Fund shares sold | | | 165,386 | |
|
| |
Dividends | | | 168,434 | |
|
| |
Investment for trustee deferred compensation and retirement plans | | | 18,602 | |
|
| |
Other assets | | | 44,274 | |
|
| |
Total assets | | | 129,072,425 | |
|
| |
| |
Liabilities: | | | | |
Payable for: | | | | |
Fund shares reacquired | | | 556,042 | |
|
| |
Accrued foreign taxes | | | 339,662 | |
|
| |
Accrued fees to affiliates | | | 67,299 | |
|
| |
Accrued trustees’ and officers’ fees and benefits | | | 1,177 | |
|
| |
Accrued other operating expenses | | | 185,298 | |
|
| |
Trustee deferred compensation and retirement plans | | | 18,602 | |
|
| |
Total liabilities | | | 1,168,080 | |
|
| |
Net assets applicable to shares outstanding | | $ | 127,904,345 | |
|
| |
| |
Net assets consist of: | | | | |
Shares of beneficial interest | | $ | 179,528,926 | |
|
| |
Distributable earnings (loss) | | | (51,624,581 | ) |
|
| |
| | $ | 127,904,345 | |
|
| |
| | | | |
Net Assets: | | | | |
Class A | | $ | 37,385,816 | |
|
| |
Class C | | $ | 9,061,536 | |
|
| |
Class R | | $ | 5,210,830 | |
|
| |
Class Y | | $ | 49,073,539 | |
|
| |
Class R5 | | $ | 7,041 | |
|
| |
Class R6 | | $ | 27,165,583 | |
|
| |
|
Shares outstanding, no par value, with an unlimited number of shares authorized: | |
Class A | | | 5,642,431 | |
|
| |
Class C | | | 1,466,303 | |
|
| |
Class R | | | 804,274 | |
|
| |
Class Y | | | 7,253,456 | |
|
| |
Class R5 | | | 1,049 | |
|
| |
Class R6 | | | 3,963,161 | |
|
| |
Class A: | | | | |
Net asset value per share | | $ | 6.63 | |
|
| |
Maximum offering price per share
(Net asset value of $6.63 ÷ 94.50%) | | $ | 7.02 | |
|
| |
Class C: | | | | |
Net asset value and offering price per share | | $ | 6.18 | |
|
| |
Class R: | | | | |
Net asset value and offering price per share | | $ | 6.48 | |
|
| |
Class Y: | | | | |
Net asset value and offering price per share | | $ | 6.77 | |
|
| |
Class R5: | | | | |
Net asset value and offering price per share | | $ | 6.71 | |
|
| |
Class R6: | | | | |
Net asset value and offering price per share | | $ | 6.85 | |
|
| |
See accompanying Notes to Financial Statements which are an integral part of the financial statements.
| | |
| 10 | | Invesco Emerging Markets Innovators Fund |
Statement of Operations
For the year ended October 31, 2022
| | | | |
Investment income: | | | | |
Dividends (net of foreign withholding taxes of $383,293) | | $ | 3,600,819 | |
|
| |
Dividends from affiliated money market funds | | | 25,761 | |
|
| |
Total investment income | | | 3,626,580 | |
|
| |
| |
Expenses: | | | | |
Advisory fees | | | 2,760,975 | |
|
| |
Administrative services fees | | | 33,884 | |
|
| |
Custodian fees | | | 187,484 | |
|
| |
Distribution fees: | | | | |
Class A | | | 149,064 | |
|
| |
Class C | | | 132,313 | |
|
| |
Class R | | | 31,723 | |
|
| |
Transfer agent fees – A, C, R and Y | | | 292,537 | |
|
| |
Transfer agent fees – R5 | | | 4 | |
|
| |
Transfer agent fees – R6 | | | 19,125 | |
|
| |
Trustees’ and officers’ fees and benefits | | | 21,657 | |
|
| |
Registration and filing fees | | | 83,249 | |
|
| |
Professional services fees | | | 108,488 | |
|
| |
Other | | | (29,517 | ) |
|
| |
Total expenses | | | 3,790,986 | |
|
| |
Less: Fees waived, expenses reimbursed and/or expense offset arrangement(s) | | | (439,323 | ) |
|
| |
Net expenses | | | 3,351,663 | |
|
| |
Net investment income | | | 274,917 | |
|
| |
| |
Realized and unrealized gain (loss) from: | | | | |
Net realized gain (loss) from: | | | | |
Unaffiliated investment securities (net of foreign taxes of $976,548) | | | (40,255,337 | ) |
|
| |
Affiliated investment securities | | | (496 | ) |
|
| |
Foreign currencies | | | (194,708 | ) |
|
| |
Forward foreign currency contracts | | | (12,698 | ) |
|
| |
| | | (40,463,239 | ) |
|
| |
Change in net unrealized appreciation (depreciation) of: | | | | |
Unaffiliated investment securities (net of foreign taxes of $1,518,898) | | | (96,132,262 | ) |
|
| |
Affiliated investment securities | | | 38 | |
|
| |
Foreign currencies | | | (181,530 | ) |
|
| |
| | | (96,313,754 | ) |
|
| |
Net realized and unrealized gain (loss) | | | (136,776,993 | ) |
|
| |
Net increase (decrease) in net assets resulting from operations | | $ | (136,502,076 | ) |
|
| |
See accompanying Notes to Financial Statements which are an integral part of the financial statements.
| | |
| 11 | | Invesco Emerging Markets Innovators Fund |
Statement of Changes in Net Assets
For the years ended October 31, 2022 and 2021
| | | | | | | | |
| | | 2022 | | | 2021 | |
|
| |
Operations: | | | | | | | | |
Net investment income (loss) | | $ | 274,917 | | | $ | (2,429,104 | ) |
|
| |
Net realized gain (loss) | | | (40,463,239 | ) | | | 45,142,513 | |
|
| |
Change in net unrealized appreciation (depreciation) | | | (96,313,754 | ) | | | 22,177,647 | |
|
| |
Net increase (decrease) in net assets resulting from operations | | | (136,502,076 | ) | | | 64,891,056 | |
|
| |
| | |
Distributions to shareholders from distributable earnings: | | | | | | | | |
Class A | | | (9,157,227 | ) | | | (2,484,125 | ) |
|
| |
Class C | | | (2,188,956 | ) | | | (750,908 | ) |
|
| |
Class R | | | (881,257 | ) | | | (272,278 | ) |
|
| |
Class Y | | | (19,805,340 | ) | | | (6,588,853 | ) |
|
| |
Class R5 | | | (1,397 | ) | | | (419 | ) |
|
| |
Class R6 | | | (9,542,026 | ) | | | (4,744,973 | ) |
|
| |
Total distributions from distributable earnings | | | (41,576,203 | ) | | | (14,841,556 | ) |
|
| |
| | |
Share transactions–net: | | | | | | | | |
Class A | | | (56,547,378 | ) | | | 59,012,767 | |
|
| |
Class C | | | (1,366,014 | ) | | | (2,753,965 | ) |
|
| |
Class R | | | 1,301,649 | | | | (521,215 | ) |
|
| |
Class Y | | | (60,903,339 | ) | | | (11,476,814 | ) |
|
| |
Class R6 | | | (26,675,537 | ) | | | (60,850,966 | ) |
|
| |
Net increase (decrease) in net assets resulting from share transactions | | | (144,190,619 | ) | | | (16,590,193 | ) |
|
| |
Net increase (decrease) in net assets | | | (322,268,898 | ) | | | 33,459,307 | |
|
| |
| | |
Net assets: | | | | | | | | |
Beginning of year | | | 450,173,243 | | | | 416,713,936 | |
|
| |
End of year | | $ | 127,904,345 | | | $ | 450,173,243 | |
|
| |
See accompanying Notes to Financial Statements which are an integral part of the financial statements.
| | |
| 12 | | Invesco Emerging Markets Innovators Fund |
Financial Highlights
The following schedule presents financial highlights for a share of the Fund outstanding throughout the periods indicated.
| | | | | | | | | | | | | | | | | | | | | | | | | | | | | | | | | | | | | | | | | | | | | | | | | | | | | | | | | | | | | | | | | | | | | | |
| | | Net asset value, beginning of period | | Net
investment
income (loss)(a) | | Net gains (losses) on securities (both realized and unrealized) | | Total from investment operations | | Dividends from net investment
income | | Distributions from net realized
gains | | Total
distributions | | Net asset value, end of period | | Total return(b) | | Net assets, end of period (000’s omitted) | | Ratio of expenses to average net assets with fee waivers
and/or expenses absorbed | | Ratio of expenses to average net assets without fee waivers
and/or expenses
absorbed(c) | | Ratio of net investment income (loss) to average net assets | | Portfolio turnover (d) |
Class A | | | | | | | | | | | | | | | | | | | | | | | | | | | | | | | | | | | | | | | | | | | | | | | | | | | | | | | | | | | | | | | | | | | | | | |
Year ended 10/31/22 | | | $ | 12.47 | | | | $ | (0.00 | ) | | | $ | (4.51 | ) | | | $ | (4.51 | ) | | | | $ - | | | | $ | (1.33 | ) | | | $ | (1.33 | ) | | | $ | 6.63 | | | | | (39.85 | )%(e) | | | $ | 37,386 | | | | | 1.48 | %(e) | | | | 1.69 | %(e) | | | | 0.01 | %(e) | | | | 17 | % |
Year ended 10/31/21 | | | | 11.17 | | | | | (0.08 | ) | | | | 1.78 | | | | | 1.70 | | | | | - | | | | | (0.40 | ) | | | | (0.40 | ) | | | | 12.47 | | | | | 15.15 | (e) | | | | 136,638 | | | | | 1.58 | (e) | | | | 1.64 | (e) | | | | (0.65 | )(e) | | | | 50 | |
Year ended 10/31/20 | | | | 10.41 | | | | | (0.06 | ) | | | | 0.82 | | | | | 0.76 | | | | | - | | | | | - | | | | | - | | | | | 11.17 | | | | | 7.30 | (e) | | | | 70,918 | | | | | 1.68 | (e) | | | | 1.68 | (e) | | | | (0.62 | )(e) | | | | 67 | |
Two months ended 10/31/19 | | | | 9.85 | | | | | (0.01 | ) | | | | 0.57 | | | | | 0.56 | | | | | - | | | | | - | | | | | - | | | | | 10.41 | | | | | 5.69 | | | | | 83,842 | | | | | 1.68 | (f) | | | | 1.68 | (f) | | | | (0.63 | )(f) | | | | 20 | |
Year ended 08/31/19 | | | | 10.38 | | | | | (0.02 | ) | | | | (0.51 | ) | | | | (0.53 | ) | | | | - | | | | | - | | | | | - | | | | | 9.85 | | | | | (5.11 | ) | | | | 80,454 | | | | | 1.71 | | | | | 1.71 | | | | | (0.25 | ) | | | | 36 | |
Year ended 08/31/18 | | | | 10.67 | | | | | (0.02 | ) | | | | (0.25 | ) | | | | (0.27 | ) | | | | (0.02 | ) | | | | - | | | | | (0.02 | ) | | | | 10.38 | | | | | (2.52 | ) | | | | 97,641 | | | | | 1.70 | | | | | 1.70 | | | | | (0.18 | ) | | | | 24 | |
Class C | | | | | | | | | | | | | | | | | | | | | | | | | | | | | | | | | | | | | | | | | | | | | | | | | | | | | | | | | | | | | | | | | | | | | | |
Year ended 10/31/22 | | | | 11.81 | | | | | (0.06 | ) | | | | (4.24 | ) | | | | (4.30 | ) | | | | - | | | | | (1.33 | ) | | | | (1.33 | ) | | | | 6.18 | | | | | (40.35 | ) | | | | 9,062 | | | | | 2.24 | | | | | 2.45 | | | | | (0.75 | ) | | | | 17 | |
Year ended 10/31/21 | | | | 10.67 | | | | | (0.18 | ) | | | | 1.72 | | | | | 1.54 | | | | | - | | | | | (0.40 | ) | | | | (0.40 | ) | | | | 11.81 | | | | | 14.34 | | | | | 19,858 | | | | | 2.35 | | | | | 2.40 | | | | | (1.42 | ) | | | | 50 | |
Year ended 10/31/20 | | | | 10.02 | | | | | (0.14 | ) | | | | 0.79 | | | | | 0.65 | | | | | - | | | | | - | | | | | - | | | | | 10.67 | | | | | 6.49 | | | | | 20,337 | | | | | 2.44 | | | | | 2.44 | | | | | (1.38 | ) | | | | 67 | |
Two months ended 10/31/19 | | | | 9.49 | | | | | (0.02 | ) | | | | 0.55 | | | | | 0.53 | | | | | - | | | | | - | | | | | - | | | | | 10.02 | | | | | 5.58 | | | | | 26,427 | | | | | 2.44 | (f) | | | | 2.44 | (f) | | | | (1.40 | )(f) | | | | 20 | |
Year ended 08/31/19 | | | | 10.09 | | | | | (0.09 | ) | | | | (0.51 | ) | | | | (0.60 | ) | | | | - | | | | | - | | | | | - | | | | | 9.49 | | | | | (5.95 | ) | | | | 26,661 | | | | | 2.45 | | | | | 2.45 | | | | | (1.01 | ) | | | | 36 | |
Year ended 08/31/18 | | | | 10.42 | | | | | (0.10 | ) | | | | (0.23 | ) | | | | (0.33 | ) | | | | - | | | | | - | | | | | - | | | | | 10.09 | | | | | (3.17 | ) | | | | 38,156 | | | | | 2.46 | | | | | 2.46 | | | | | (0.94 | ) | | | | 24 | |
Class R | | | | | | | | | | | | | | | | | | | | | | | | | | | | | | | | | | | | | | | | | | | | | | | | | | | | | | | | | | | | | | | | | | | | | | |
Year ended 10/31/22 | | | | 12.25 | | | | | (0.02 | ) | | | | (4.42 | ) | | | | (4.44 | ) | | | | - | | | | | (1.33 | ) | | | | (1.33 | ) | | | | 6.48 | | | | | (40.01 | ) | | | | 5,211 | | | | | 1.74 | | | | | 1.95 | | | | | (0.25 | ) | | | | 17 | |
Year ended 10/31/21 | | | | 11.01 | | | | | (0.12 | ) | | | | 1.76 | | | | | 1.64 | | | | | - | | | | | (0.40 | ) | | | | (0.40 | ) | | | | 12.25 | | | | | 14.82 | | | | | 8,126 | | | | | 1.85 | | | | | 1.90 | | | | | (0.92 | ) | | | | 50 | |
Year ended 10/31/20 | | | | 10.28 | | | | | (0.09 | ) | | | | 0.82 | | | | | 0.73 | | | | | - | | | | | - | | | | | - | | | | | 11.01 | | | | | 7.10 | | | | | 7,741 | | | | | 1.94 | | | | | 1.94 | | | | | (0.88 | ) | | | | 67 | |
Two months ended 10/31/19 | | | | 9.73 | | | | | (0.01 | ) | | | | 0.56 | | | | | 0.55 | | | | | - | | | | | - | | | | | - | | | | | 10.28 | | | | | 5.65 | | | | | 8,012 | | | | | 1.94 | (f) | | | | 1.94 | (f) | | | | (0.90 | )(f) | | | | 20 | |
Year ended 08/31/19 | | | | 10.29 | | | | | (0.05 | ) | | | | (0.51 | ) | | | | (0.56 | ) | | | | - | | | | | - | | | | | - | | | | | 9.73 | | | | | (5.44 | ) | | | | 7,516 | | | | | 1.95 | | | | | 1.95 | | | | | (0.51 | ) | | | | 36 | |
Year ended 08/31/18 | | | | 10.59 | | | | | (0.05 | ) | | | | (0.24 | ) | | | | (0.29 | ) | | | | (0.01 | ) | | | | - | | | | | (0.01 | ) | | | | 10.29 | | | | | (2.77 | ) | | | | 6,884 | | | | | 1.97 | | | | | 1.97 | | | | | (0.45 | ) | | | | 24 | |
Class Y | | | | | | | | | | | | | | | | | | | | | | | | | | | | | | | | | | | | | | | | | | | | | | | | | | | | | | | | | | | | | | | | | | | | | | |
Year ended 10/31/22 | | | | 12.67 | | | | | 0.02 | | | | | (4.59 | ) | | | | (4.57 | ) | | | | - | | | | | (1.33 | ) | | | | (1.33 | ) | | | | 6.77 | | | | | (39.68 | ) | | | | 49,074 | | | | | 1.24 | | | | | 1.45 | | | | | 0.25 | | | | | 17 | |
Year ended 10/31/21 | | | | 11.32 | | | | | (0.06 | ) | | | | 1.81 | | | | | 1.75 | | | | | - | | | | | (0.40 | ) | | | | (0.40 | ) | | | | 12.67 | | | | | 15.40 | | | | | 193,558 | | | | | 1.35 | | | | | 1.40 | | | | | (0.42 | ) | | | | 50 | |
Year ended 10/31/20 | | | | 10.52 | | | | | (0.04 | ) | | | | 0.84 | | | | | 0.80 | | | | | - | | | | | - | | | | | - | | | | | 11.32 | | | | | 7.60 | | | | | 183,438 | | | | | 1.44 | | | | | 1.44 | | | | | (0.38 | ) | | | | 67 | |
Two months ended 10/31/19 | | | | 9.95 | | | | | (0.01 | ) | | | | 0.58 | | | | | 0.57 | | | | | - | | | | | - | | | | | - | | | | | 10.52 | | | | | 5.73 | | | | | 216,384 | | | | | 1.44 | (f) | | | | 1.44 | (f) | | | | (0.40 | )(f) | | | | 20 | |
Year ended 08/31/19 | | | | 10.47 | | | | | (0.00 | ) | | | | (0.52 | ) | | | | (0.52 | ) | | | | - | | | | | - | | | | | - | | | | | 9.95 | | | | | (4.97 | ) | | | | 212,530 | | | | | 1.46 | | | | | 1.46 | | | | | (0.00 | ) | | | | 36 | |
Year ended 08/31/18 | | | | 10.75 | | | | | 0.01 | | | | | (0.25 | ) | | | | (0.24 | ) | | | | (0.04 | ) | | | | - | | | | | (0.04 | ) | | | | 10.47 | | | | | (2.23 | ) | | | | 281,465 | | | | | 1.46 | | | | | 1.46 | | | | | 0.06 | | | | | 24 | |
Class R5 | | | | | | | | | | | | | | | | | | | | | | | | | | | | | | | | | | | | | | | | | | | | | | | | | | | | | | | | | | | | | | | | | | | | | | |
Year ended 10/31/22 | | | | 12.58 | | | | | 0.02 | | | | | (4.56 | ) | | | | (4.54 | ) | | | | - | | | | | (1.33 | ) | | | | (1.33 | ) | | | | 6.71 | | | | | (39.73 | ) | | | | 7 | | | | | 1.25 | | | | | 1.34 | | | | | 0.24 | | | | | 17 | |
Year ended 10/31/21 | | | | 11.23 | | | | | (0.04 | ) | | | | 1.79 | | | | | 1.75 | | | | | - | | | | | (0.40 | ) | | | | (0.40 | ) | | | | 12.58 | | | | | 15.52 | | | | | 13 | | | | | 1.26 | | | | | 1.26 | | | | | (0.33 | ) | | | | 50 | |
Year ended 10/31/20 | | | | 10.42 | | | | | (0.02 | ) | | | | 0.83 | | | | | 0.81 | | | | | - | | | | | - | | | | | - | | | | | 11.23 | | | | | 7.77 | | | | | 12 | | | | | 1.27 | | | | | 1.27 | | | | | (0.21 | ) | | | | 67 | |
Two months ended 10/31/19 | | | | 9.86 | | | | | (0.00 | ) | | | | 0.56 | | | | | 0.56 | | | | | - | | | | | - | | | | | - | | | | | 10.42 | | | | | 5.68 | | | | | 11 | | | | | 1.31 | (f) | | | | 1.31 | (f) | | | | (0.26 | )(f) | | | | 20 | |
Period ended 08/31/19(g) | | | | 9.53 | | | | | 0.00 | | | | | 0.33 | | | | | 0.33 | | | | | - | | | | | - | | | | | - | | | | | 9.86 | | | | | 3.46 | | | | | 10 | | | | | 1.28 | (f) | | | | 1.28 | (f) | | | | 0.15 | (f) | | | | 36 | |
Class R6 | | | | | | | | | | | | | | | | | | | | | | | | | | | | | | | | | | | | | | | | | | | | | | | | | | | | | | | | | | | | | | | | | | | | | | |
Year ended 10/31/22 | | | | 12.82 | | | | | 0.02 | | | | | (4.66 | ) | | | | (4.64 | ) | | | | - | | | | | (1.33 | ) | | | | (1.33 | ) | | | | 6.85 | | | | | (39.77 | ) | | | | 27,166 | | | | | 1.25 | | | | | 1.34 | | | | | 0.24 | | | | | 17 | |
Year ended 10/31/21 | | | | 11.44 | | | | | (0.04 | ) | | | | 1.82 | | | | | 1.78 | | | | | - | | | | | (0.40 | ) | | | | (0.40 | ) | | | | 12.82 | | | | | 15.50 | | | | | 91,980 | | | | | 1.25 | | | | | 1.26 | | | | | (0.32 | ) | | | | 50 | |
Year ended 10/31/20 | | | | 10.61 | | | | | (0.02 | ) | | | | 0.85 | | | | | 0.83 | | | | | - | | | | | - | | | | | - | | | | | 11.44 | | | | | 7.82 | | | | | 134,269 | | | | | 1.25 | | | | | 1.26 | | | | | (0.19 | ) | | | | 67 | |
Two months ended 10/31/19 | | | | 10.04 | | | | | (0.00 | ) | | | | 0.57 | | | | | 0.57 | | | | | - | | | | | - | | | | | - | | | | | 10.61 | | | | | 5.68 | | | | | 292,944 | | | | | 1.27 | (f) | | | | 1.27 | (f) | | | | (0.22 | )(f) | | | | 20 | |
Year ended 08/31/19 | | | | 10.54 | | | | | 0.02 | | | | | (0.52 | ) | | | | (0.50 | ) | | | | - | | | | | - | | | | | - | | | | | 10.04 | | | | | (4.74 | ) | | | | 278,033 | | | | | 1.27 | | | | | 1.27 | | | | | 0.18 | | | | | 36 | |
Year ended 08/31/18 | | | | 10.82 | | | | | 0.03 | | | | | (0.25 | ) | | | | (0.22 | ) | | | | (0.06 | ) | | | | - | | | | | (0.06 | ) | | | | 10.54 | | | | | (2.06 | ) | | | | 105,736 | | | | | 1.29 | | | | | 1.29 | | | | | 0.26 | | | | | 24 | |
| (a) | Calculated using average shares outstanding. |
| (b) | Includes adjustments in accordance with accounting principles generally accepted in the United States of America and as such, the net asset value for financial reporting purposes and the returns based upon those net asset values may differ from the net asset value and returns for shareholder transactions. Does not include sales charges and is not annualized for periods less than one year, if applicable. |
| (c) | Does not include indirect expenses from affiliated fund fees and expenses of 0.01% for the two months ended October 31, 2019 and the years ended August 31, 2019 and 2018, respectively. |
| (d) | Portfolio turnover is calculated at the fund level and is not annualized for periods less than one year, if applicable. |
| (e) | The total return, ratio of expenses to average net assets and ratio of net investment income (loss) to average net assets reflect actual 12b-1 fees of 0.24% for the years ended October 31, 2022, 2021 and 2020. |
| (g) | Commencement date after the close of business on May 24, 2019. |
See accompanying Notes to Financial Statements which are an integral part of the financial statements.
| | |
| 13 | | Invesco Emerging Markets Innovators Fund |
Notes to Financial Statements
October 31, 2022
NOTE 1–Significant Accounting Policies
Invesco Emerging Markets Innovators Fund (the “Fund”) is a series portfolio of AIM Investment Funds (Invesco Investment Funds) (the “Trust”). The Trust is organized as a Delaware statutory trust and is registered under the Investment Company Act of 1940, as amended (the “1940 Act”), as an open-end series management investment company authorized to issue an unlimited number of shares of beneficial interest. Information presented in these financial statements pertains only to the Fund. Matters affecting the Fund or each class will be voted on exclusively by the shareholders of the Fund or each class.
The Fund’s investment objective is to seek capital appreciation.
The Fund currently consists of six different classes of shares: Class A, Class C, Class R, Class Y, Class R5 and Class R6. Class Y shares are available only to certain investors. Class A shares are sold with a front-end sales charge unless certain waiver criteria are met. Under certain circumstances, load waived shares may be subject to contingent deferred sales charges (“CDSC”). Class C shares are sold with a CDSC. Class R, Class Y, Class R5 and Class R6 shares are sold at net asset value. Class C shares held for eight years after purchase are eligible for automatic conversion into Class A shares of the same Fund (the “Conversion Feature”). The automatic conversion pursuant to the Conversion Feature will generally occur at the end of the month following the eighth anniversary after a purchase of Class C shares.
The Fund is an investment company and accordingly follows the investment company accounting and reporting guidance in accordance with Financial Accounting Standards Board Accounting Standards Codification Topic 946, Financial Services – Investment Companies.
The following is a summary of the significant accounting policies followed by the Fund in the preparation of its financial statements.
| A. | Security Valuations – Securities, including restricted securities, are valued according to the following policy. |
A security listed or traded on an exchange is generally valued at its trade price or official closing price that day as of the close of the exchange where the security is principally traded, or lacking any trades or official closing price on a particular day, the security may be valued at the closing bid price on that day. Securities traded in the over-the-counter market are valued based on prices furnished by independent pricing services or market makers. When such securities are valued using prices provided by an independent pricing service they may be considered fair valued. Futures contracts are valued at the daily settlement price set by an exchange on which they are principally traded. U.S. exchange-traded options are valued at the mean between the last bid and asked prices from the exchange on which they are principally traded. Non-U.S. exchange-traded options are valued at the final settlement price set by the exchange on which they trade. Options not listed on an exchange and swaps generally are valued using pricing provided from independent pricing services.
Securities of investment companies that are not exchange-traded (e.g., open-end mutual funds) are valued using such company’s end-of-business-day net asset value per share.
Deposits, other obligations of U.S. and non-U.S. banks and financial institutions are valued at their daily account value.
Fixed income securities (including convertible debt securities) generally are valued on the basis of prices provided by independent pricing services. Prices provided by the pricing service may be determined without exclusive reliance on quoted prices, and may reflect appropriate factors such as institution-size trading in similar groups of securities, developments related to specific securities, dividend rate (for unlisted equities), yield (for debt obligations), quality, type of issue, coupon rate (for debt obligations), maturity (for debt obligations), individual trading characteristics and other market data. Pricing services generally value debt obligations assuming orderly transactions of institutional round lot size, but a fund may hold or transact in the same securities in smaller, odd lot sizes. Odd lots often trade at lower prices than institutional round lots, and their value may be adjusted accordingly. Debt obligations are subject to interest rate and credit risks. In addition, all debt obligations involve some risk of default with respect to interest and/or principal payments.
Foreign securities’ (including foreign exchange contracts) prices are converted into U.S. dollar amounts using the applicable exchange rates as of the close of the New York Stock Exchange (“NYSE”). If market quotations are available and reliable for foreign exchange-traded equity securities, the securities will be valued at the market quotations. Invesco Advisers, Inc. (the “Adviser” or “Invesco”) may use various pricing services to obtain market quotations as well as fair value prices. Because trading hours for certain foreign securities end before the close of the NYSE, closing market quotations may become not representative of market value in the Adviser’s judgment (“unreliable”). If, between the time trading ends on a particular security and the close of the customary trading session on the NYSE, a significant event occurs that makes the closing price of the security unreliable, the Adviser may fair value the security. If the event is likely to have affected the closing price of the security, the security will be valued at fair value in good faith in accordance with Board- approved policies and related Adviser procedures (“Valuation Procedures”). Adjustments to closing prices to reflect fair value may also be based on a screening process of an independent pricing service to indicate the degree of certainty, based on historical data, that the closing price in the principal market where a foreign security trades is not the current value as of the close of the NYSE. Foreign securities’ prices meeting the degree of certainty that the price is not reflective of current value will be priced at the indication of fair value from the independent pricing service. Multiple factors may be considered by the independent pricing service in determining adjustments to reflect fair value and may include information relating to sector indices, American Depositary Receipts and domestic and foreign index futures. Foreign securities may have additional risks including exchange rate changes, potential for sharply devalued currencies and high inflation, political and economic upheaval, the relative lack of issuer information, relatively low market liquidity and the potential lack of strict financial and accounting controls and standards.
Unlisted securities will be valued using prices provided by independent pricing services or by another method that the Adviser, in its judgment, believes better reflects the security’s fair value in accordance with the Valuation Procedures.
Securities for which market prices are not provided by any of the above methods may be valued based upon quotes furnished by independent sources. The last bid price may be used to value equity securities. The mean between the last bid and asked prices may be used to value debt obligations, including corporate loans.
Securities for which market quotations are not readily available are fair valued by the Adviser in accordance with the Valuation Procedures. If a fair value price provided by a pricing service is unreliable, the Adviser will fair value the security using the Valuation Procedures. Issuer specific events, market trends, bid/asked quotes of brokers and information providers and other market data may be reviewed in the course of making a good faith determination of a security’s fair value.
The Fund may invest in securities that are subject to interest rate risk, meaning the risk that the prices will generally fall as interest rates rise and, conversely, the prices will generally rise as interest rates fall. Specific securities differ in their sensitivity to changes in interest rates depending on their individual characteristics. Changes in interest rates may result in increased market volatility, which may affect the value and/or liquidity of certain Fund investments.
Valuations change in response to many factors including the historical and prospective earnings of the issuer, the value of the issuer’s assets, general market conditions which are not specifically related to the particular issuer, such as real or perceived adverse economic conditions, changes in the general outlook for revenues or corporate earnings, changes in interest or currency rates, regional or global instability, natural or environmental disasters, widespread disease or other public health issues, war, acts of terrorism, significant governmental actions or adverse investor sentiment generally and market liquidity. Because of the inherent uncertainties of valuation, the values reflected in the financial statements may materially differ from the value received upon actual sale of those investments.
The price the Fund could receive upon the sale of any investment may differ from the Adviser’s valuation of the investment, particularly for securities that are valued using a fair valuation technique. When fair valuation techniques are applied, the Adviser uses available information, including both observable and unobservable inputs and assumptions, to determine a methodology that will result in a valuation that the Adviser believes approximates market value. Fund securities that are fair valued may be subject to greater fluctuation in their value from one day to the next than would be the case if market quotations were used. Because of the inherent uncertainties of valuation, and the degree of subjectivity in such decisions, the Fund could realize a greater or lesser than expected gain or loss upon the sale of the investment.
| | |
| 14 | | Invesco Emerging Markets Innovators Fund |
| B. | Securities Transactions and Investment Income – Securities transactions are accounted for on a trade date basis. Realized gains or losses on sales are computed on the basis of specific identification of the securities sold. Interest income (net of withholding tax, if any) is recorded on an accrual basis from settlement date and includes coupon interest and amortization of premium and accretion of discount on debt securities as applicable. Dividend income (net of withholding tax, if any) is recorded on the ex-dividend date. |
The Fund may periodically participate in litigation related to Fund investments. As such, the Fund may receive proceeds from litigation settlements. Any proceeds received are included in the Statement of Operations as realized gain (loss) for investments no longer held and as unrealized gain (loss) for investments still held.
Brokerage commissions and mark ups are considered transaction costs and are recorded as an increase to the cost basis of securities purchased and/or a reduction of proceeds on a sale of securities. Such transaction costs are included in the determination of net realized and unrealized gain (loss) from investment securities reported in the Statement of Operations and the Statement of Changes in Net Assets and the net realized and unrealized gains (losses) on securities per share in the Financial Highlights. Transaction costs are included in the calculation of the Fund’s net asset value and, accordingly, they reduce the Fund’s total returns. These transaction costs are not considered operating expenses and are not reflected in net investment income reported in the Statement of Operations and the Statement of Changes in Net Assets, or the net investment income per share and the ratios of expenses and net investment income reported in the Financial Highlights, nor are they limited by any expense limitation arrangements between the Fund and the investment adviser.
The Fund allocates income and realized and unrealized capital gains and losses to a class based on the relative net assets of each class.
| C. | Country Determination – For the purposes of making investment selection decisions and presentation in the Schedule of Investments, the investment adviser may determine the country in which an issuer is located and/or credit risk exposure based on various factors. These factors include the laws of the country under which the issuer is organized, where the issuer maintains a principal office, the country in which the issuer derives 50% or more of its total revenues, the country that has the primary market for the issuer’s securities and its “country of risk” as determined by a third party service provider, as well as other criteria. Among the other criteria that may be evaluated for making this determination are the country in which the issuer maintains 50% or more of its assets, the type of security, financial guarantees and enhancements, the nature of the collateral and the sponsor organization. Country of issuer and/or credit risk exposure has been determined to be the United States of America, unless otherwise noted. |
| D. | Distributions – Distributions from net investment income and net realized capital gain, if any, are generally declared and paid annually and recorded on the ex-dividend date. The Fund may elect to treat a portion of the proceeds from redemptions as distributions for federal income tax purposes. |
| E. | Federal Income Taxes – The Fund intends to comply with the requirements of Subchapter M of the Internal Revenue Code of 1986, as amended (the “Internal Revenue Code”), necessary to qualify as a regulated investment company and to distribute substantially all of the Fund’s taxable earnings to shareholders. As such, the Fund will not be subject to federal income taxes on otherwise taxable income (including net realized capital gain) that is distributed to shareholders. Therefore, no provision for federal income taxes is recorded in the financial statements. |
The Fund recognizes the tax benefits of uncertain tax positions only when the position is more likely than not to be sustained. Management has analyzed the Fund’s uncertain tax positions and concluded that no liability for unrecognized tax benefits should be recorded related to uncertain tax positions. Management is not aware of any tax positions for which it is reasonably possible that the total amounts of unrecognized tax benefits will change materially in the next 12 months.
The Fund files tax returns in the U.S. Federal jurisdiction and certain other jurisdictions. Generally, the Fund is subject to examinations by such taxing authorities for up to three years after the filing of the return for the tax period.
| F. | Expenses – Fees provided for under the Rule 12b-1 plan of a particular class of the Fund are charged to the operations of such class. Transfer agency fees and expenses and other shareholder recordkeeping fees and expenses attributable to Class R5 and Class R6 are allocated based on relative net assets of Class R5 and Class R6. Sub-accounting fees attributable to Class R5 are charged to the operations of the class. Transfer agency fees and expenses and other shareholder recordkeeping fees and expenses relating to all other classes are allocated among those classes based on relative net assets. All other expenses are allocated among the classes based on relative net assets. |
| G. | Accounting Estimates – The preparation of financial statements in conformity with accounting principles generally accepted in the United States of America (“GAAP”) requires management to make estimates and assumptions that affect the reported amounts of assets and liabilities at the date of the financial statements and the reported amounts of revenues and expenses during the reporting period including estimates and assumptions related to taxation. Actual results could differ from those estimates by a significant amount. In addition, the Fund monitors for material events or transactions that may occur or become known after the period-end date and before the date the financial statements are released to print. |
| H. | Indemnifications – Under the Trust’s organizational documents, each Trustee, officer, employee or other agent of the Trust is indemnified against certain liabilities that may arise out of the performance of their duties to the Fund. Additionally, in the normal course of business, the Fund enters into contracts, including the Fund’s servicing agreements, that contain a variety of indemnification clauses. The Fund’s maximum exposure under these arrangements is unknown as this would involve future claims that may be made against the Fund that have not yet occurred. The risk of material loss as a result of such indemnification claims is considered remote. |
| I. | Foreign Currency Translations – Foreign currency is valued at the close of the NYSE based on quotations posted by banks and major currency dealers. Portfolio securities and other assets and liabilities denominated in foreign currencies are translated into U.S. dollar amounts at the date of valuation. Purchases and sales of portfolio securities (net of foreign taxes withheld on disposition) and income items denominated in foreign currencies are translated into U.S. dollar amounts on the respective dates of such transactions. The Fund does not separately account for the portion of the results of operations resulting from changes in foreign exchange rates on investments and the fluctuations arising from changes in market prices of securities held. The combined results of changes in foreign exchange rates and the fluctuation of market prices on investments (net of estimated foreign tax withholding) are included with the net realized and unrealized gain or loss from investments in the Statement of Operations. Reported net realized foreign currency gains or losses arise from (1) sales of foreign currencies, (2) currency gains or losses realized between the trade and settlement dates on securities transactions, and (3) the difference between the amounts of dividends, interest, and foreign withholding taxes recorded on the Fund’s books and the U.S. dollar equivalent of the amounts actually received or paid. Net unrealized foreign currency gains and losses arise from changes in the fair values of assets and liabilities, other than investments in securities at fiscal period end, resulting from changes in exchange rates. |
The Fund may invest in foreign securities, which may be subject to foreign taxes on income, gains on investments or currency repatriation, a portion of which may be recoverable. Foreign taxes, if any, are recorded based on the tax regulations and rates that exist in the foreign markets in which the Fund invests and are shown in the Statement of Operations.
| J. | Forward Foreign Currency Contracts – The Fund may engage in foreign currency transactions either on a spot (i.e. for prompt delivery and settlement) basis, or through forward foreign currency contracts, to manage or minimize currency or exchange rate risk. |
The Fund may also enter into forward foreign currency contracts for the purchase or sale of a security denominated in a foreign currency in order to “lock in” the U.S. dollar price of that security, or the Fund may also enter into forward foreign currency contracts that do not provide for physical exchange of the two currencies on the settlement date, but instead are settled by a single cash payment calculated as the difference between the agreed upon exchange rate and the spot rate at settlement based upon an agreed upon notional amount (non-deliverable forwards).
A forward foreign currency contract is an obligation between two parties (“Counterparties”) to purchase or sell a specific currency for an agreed-upon price at a future date. The use of forward foreign currency contracts for hedging does not eliminate fluctuations in the price of the underlying securities the Fund owns or intends to acquire but establishes a rate of exchange in advance. Fluctuations in the value of these contracts are measured by the difference in the contract date and reporting date exchange rates and are recorded as unrealized appreciation (depreciation) until the contracts are closed. When the contracts are closed,
| | |
| 15 | | Invesco Emerging Markets Innovators Fund |
| | realized gains (losses) are recorded. Realized and unrealized gains (losses) on the contracts are included in the Statement of Operations. The primary risks associated with forward foreign currency contracts include failure of the Counterparty to meet the terms of the contract and the value of the foreign currency changing unfavorably. These risks may be in excess of the amounts reflected in the Statement of Assets and Liabilities. |
| K. | Other Risks – Emerging markets (also referred to as developing markets) are generally subject to greater market volatility, political, social and economic instability, uncertainty regarding the existence of trading markets and more governmental limitations on foreign investment than more developed markets. In addition, companies operating in emerging markets may be subject to lower trading volume and greater price fluctuations than companies in more developed markets. Securities law in many emerging market countries is relatively new and unsettled. Therefore, laws regarding foreign investment in emerging market securities, securities regulation, title to securities, and shareholder rights may change quickly and unpredictably. In addition, the enforcement of systems of taxation at federal, regional and local levels in emerging market countries may be inconsistent, and subject to sudden change. Other risks of investing in emerging markets securities may include additional transaction costs, delays in settlement procedures, and lack of timely information. |
Following Russia’s invasion of Ukraine in late February 2022, various countries, including the United States, as well as NATO and the European Union, issued broad-ranging economic sanctions against Russia and Belarus. The resulting responses to the military actions (and potential further sanctions in response to continued military activity), the potential for military escalation and other corresponding events, have had, and could continue to have, severe negative effects on regional and global economic and financial markets, including increased volatility, reduced liquidity and overall uncertainty. The negative impacts may be particularly acute in certain sectors including, but not limited to, energy and financials. Russia may take additional counter measures or retaliatory actions (including cyberattacks), which could exacerbate negative consequences on global financial markets. The duration of ongoing hostilities and corresponding sanctions and related events cannot be predicted. The foregoing may result in a negative impact on Fund performance and the value of an investment in the Fund, even beyond any direct investment exposure the Fund may have to Russian issuers or the adjoining geographic regions.
| L. | COVID-19 Risk – The COVID-19 strain of coronavirus has resulted in instances of market closures and dislocations, extreme volatility, liquidity constraints and increased trading costs. Efforts to contain its spread have resulted in travel restrictions, disruptions of healthcare systems, business operations (including business closures) and supply chains, layoffs, lower consumer demand and employee availability, and defaults and credit downgrades, among other significant economic impacts that have disrupted global economic activity across many industries. Such economic impacts may exacerbate other pre-existing political, social and economic risks locally or globally and cause general concern and uncertainty. The full economic impact and ongoing effects of COVID-19 (or other future epidemics or pandemics) at the macro-level and on individual businesses are unpredictable and may result in significant and prolonged effects on the Fund’s performance. |
NOTE 2–Advisory Fees and Other Fees Paid to Affiliates
The Trust has entered into a master investment advisory agreement with the Adviser. Under the terms of the investment advisory agreement, the Fund accrues daily and pays monthly an advisory fee to the Adviser based on the annual rate of the Fund’s average daily net assets as follows:
| | | | |
| Average Daily Net Assets | | Rate* | |
|
| |
First $ 500 million | | | 1.150% | |
|
| |
Next $500 million | | | 1.100% | |
|
| |
Next $4 billion | | | 1.050% | |
|
| |
Over $5 billion | | | 1.000% | |
|
| |
| * | The advisory fee paid by the Fund shall be reduced by any amounts paid by the Fund under the administrative services agreement with the Adviser. |
For the year ended October 31, 2022, the effective advisory fee rate incurred by the Fund was 1.14%.
Under the terms of a master sub-advisory agreement between the Adviser and each of Invesco Asset Management Deutschland GmbH, Invesco Asset Management Limited, Invesco Asset Management (Japan) Limited, Invesco Hong Kong Limited, Invesco Senior Secured Management, Inc. and Invesco Canada Ltd. and separate sub-advisory agreements with Invesco Capital Management LLC and Invesco Asset Management (India) Private Limited (collectively, the “Affiliated Sub-Advisers”) the Adviser, not the Fund, will pay 40% of the fees paid to the Adviser to any such Affiliated Sub-Adviser(s) that provide(s) discretionary investment management services to the Fund based on the percentage of assets allocated to such Affiliated Sub-Adviser(s). Invesco has also entered into a sub-advisory agreement with OppenheimerFunds, Inc. to provide discretionary management services to the Fund.
The Adviser has contractually agreed, through at least February 29, 2024, to waive advisory fees and/or reimburse expenses of all shares to the extent necessary to limit total annual fund operating expenses after fee waiver and/or expense reimbursement (excluding certain items discussed below) of Class A, Class C, Class R, Class Y, Class R5 and Class R6 shares to 1.50%, 2.25%, 1.75%, 1.25%, 1.25%, and 1.25%, respectively, of the Fund’s average daily net assets (the “expense limits”). In determining the Adviser’s obligation to waive advisory fees and/or reimburse expenses, the following expenses are not taken into account, and could cause the total annual fund operating expenses after fee waiver and/or expense reimbursement to exceed the numbers reflected above: (1) interest; (2) taxes; (3) dividend expense on short sales; (4) extraordinary or non-routine items, including litigation expenses; and (5) expenses that the Fund has incurred but did not actually pay because of an expense offset arrangement. Unless Invesco continues the fee waiver agreement, it will terminate on February 29, 2024. During its term, the fee waiver agreement cannot be terminated or amended to increase the expense limits or reduce the advisory fee waiver without approval of the Board of Trustees.
Further, the Adviser has contractually agreed, through at least June 30, 2024, to waive the advisory fee payable by the Fund in an amount equal to 100% of the net advisory fees the Adviser receives from the affiliated money market funds on investments by the Fund of uninvested cash in such affiliated money market funds.
For the year ended October 31, 2022, the Adviser waived advisory fees of $3,169 and reimbursed class level expenses of $122,134, $27,270, $13,106, $225,137, $9 and $46,896 of Class A, Class C, Class R, Class Y, Class R5 and Class R6 shares, respectively.
The Trust has entered into a master administrative services agreement with Invesco pursuant to which the Fund has agreed to pay Invesco for certain administrative costs incurred in providing accounting services to the Fund. For the year ended October 31, 2022, expenses incurred under the agreement are shown in the Statement of Operations as Administrative services fees. Invesco has entered into a sub-administration agreement whereby State Street Bank and Trust Company (“SSB”) serves as fund accountant and provides certain administrative services to the Fund. Pursuant to a custody agreement with the Trust on behalf of the Fund, SSB also serves as the Fund’s custodian.
The Trust has entered into a transfer agency and service agreement with Invesco Investment Services, Inc. (“IIS”) pursuant to which the Fund has agreed to pay IIS a fee for providing transfer agency and shareholder services to the Fund and reimburse IIS for certain expenses incurred by IIS in the course of providing such services. IIS may make payments to intermediaries that provide omnibus account services, sub-accounting services and/or networking services. All fees payable by IIS to intermediaries that provide omnibus account services or sub-accounting services are charged back to the Fund, subject to certain limitations approved by the Trust’s Board of Trustees. For the year ended October 31, 2022, expenses incurred under the agreement are shown in the Statement of Operations as Transfer agent fees.
The Trust has entered into master distribution agreements with Invesco Distributors, Inc. (“IDI”) to serve as the distributor for the Class A, Class C, Class R, Class Y, Class R5 and Class R6 shares of the Fund. The Trust has adopted plans pursuant to Rule 12b-1 under the 1940 Act with respect to the Fund’s Class A, Class C and Class R shares (collectively, the “Plans”). The Fund, pursuant to the Class A Plan, reimburses IDI for its allocated share of expenses incurred for the period, up to a maximum annual rate of 0.25% of the average daily net assets of Class A shares. The Fund, pursuant to the Class C and Class R Plans, pays IDI compensation at the annual rate of 1.00% of the average daily net assets of Class C shares and 0.50% of the average daily net assets of Class R shares. The fees are accrued daily and paid
| | |
| 16 | | Invesco Emerging Markets Innovators Fund |
monthly. Of the Plan payments, up to 0.25% of the average daily net assets of each class of shares may be paid to furnish continuing personal shareholder services to customers who purchase and own shares of such classes. Any amounts not paid as a service fee under the Plans would constitute an asset-based sales charge. Rules of the Financial Industry Regulatory Authority (“FINRA”) impose a cap on the total sales charges, including asset-based sales charges, that may be paid by any class of shares of the Fund. For the year ended October 31, 2022, expenses incurred under the Plans are shown in the Statement of Operations as Distribution fees.
Front-end sales commissions and CDSC (collectively, the “sales charges”) are not recorded as expenses of the Fund. Front-end sales commissions are deducted from proceeds from the sales of Fund shares prior to investment in Class A shares of the Fund. CDSC are deducted from redemption proceeds prior to remittance to the shareholder. During the year ended October 31, 2022, IDI advised the Fund that IDI retained $18,053 in front-end sales commissions from the sale of Class A shares and $895 and $2,689 from Class A and Class C shares, respectively, for CDSC imposed upon redemptions by shareholders.
For the year ended October 31, 2022, the Fund incurred $2,177 in brokerage commissions with Invesco Capital Markets, Inc., an affiliate of the Adviser and IDI, for portfolio transactions executed on behalf of the Fund.
Certain officers and trustees of the Trust are officers and directors of the Adviser, IIS and/or IDI.
NOTE 3–Additional Valuation Information
GAAP defines fair value as the price that would be received to sell an asset or paid to transfer a liability in an orderly transaction between market participants at the measurement date, under current market conditions. GAAP establishes a hierarchy that prioritizes the inputs to valuation methods, giving the highest priority to readily available unadjusted quoted prices in an active market for identical assets (Level 1) and the lowest priority to significant unobservable inputs (Level 3), generally when market prices are not readily available. Based on the valuation inputs, the securities or other investments are tiered into one of three levels. Changes in valuation methods may result in transfers in or out of an investment’s assigned level:
| | |
| Level 1 - | | Prices are determined using quoted prices in an active market for identical assets. |
| Level 2 - | | Prices are determined using other significant observable inputs. Observable inputs are inputs that other market participants may use in pricing a security. These may include quoted prices for similar securities, interest rates, prepayment speeds, credit risk, yield curves, loss severities, default rates, discount rates, volatilities and others. |
| Level 3 - | | Prices are determined using significant unobservable inputs. In situations where quoted prices or observable inputs are unavailable (for example, when there is little or no market activity for an investment at the end of the period), unobservable inputs may be used. Unobservable inputs reflect the Adviser’s assumptions about the factors market participants would use in determining fair value of the securities or instruments and would be based on the best available information. |
The following is a summary of the tiered valuation input levels, as of October 31, 2022. The level assigned to the securities valuations may not be an indication of the risk or liquidity associated with investing in those securities. Because of the inherent uncertainties of valuation, the values reflected in the financial statements may materially differ from the value received upon actual sale of those investments.
| | | | | | | | | | | | | | | | |
| | | Level 1 | | | Level 2 | | | Level 3 | | | Total | |
|
| |
Investments in Securities | | | | | | | | | | | | | | | | |
|
| |
Brazil | | $ | 12,876,553 | | | $ | – | | | $ | – | | | $ | 12,876,553 | |
|
| |
Chile | | | – | | | | 3,595,852 | | | | – | | | | 3,595,852 | |
|
| |
China | | | 19,292,926 | | | | 12,605,427 | | | | – | | | | 31,898,353 | |
|
| |
India | | | – | | | | 14,067,891 | | | | 8,303,809 | | | | 22,371,700 | |
|
| |
Indonesia | | | – | | | | 7,210,834 | | | | – | | | | 7,210,834 | |
|
| |
Mexico | | | 16,114,734 | | | | – | | | | – | | | | 16,114,734 | |
|
| |
Peru | | | 3,340,530 | | | | – | | | | – | | | | 3,340,530 | |
|
| |
Philippines | | | – | | | | 2,667,082 | | | | – | | | | 2,667,082 | |
|
| |
Russia | | | – | | | | – | | | | 0 | | | | 0 | |
|
| |
South Korea | | | 1,157,574 | | | | 11,991,748 | | | | – | | | | 13,149,322 | |
|
| |
Taiwan | | | – | | | | 6,145,561 | | | | – | | | | 6,145,561 | |
|
| |
Turkey | | | – | | | | 3,479,544 | | | | – | | | | 3,479,544 | |
|
| |
United States | | | 1,180,193 | | | | – | | | | – | | | | 1,180,193 | |
|
| |
Money Market Funds | | | 1,545,497 | | | | – | | | | – | | | | 1,545,497 | |
|
| |
Total Investments | | $ | 55,508,007 | | | $ | 61,763,939 | | | $ | 8,303,809 | | | $ | 125,575,755 | |
|
| |
A reconciliation of Level 3 investments is presented when the Fund had a significant amount of Level 3 investments at the beginning and/or end of the reporting period in relation to net assets.
The following is a reconciliation of the fair valuations using significant unobservable inputs (Level 3) during the year ended October 31, 2022:
| | | | | | | | | | | | | | | | | | | | | | | | | | | | | | | | |
| | | Value
10/31/21* | | | Purchases
at Cost | | | Proceeds
from Sales | | | Accrued
Discounts/
Premiums | | Realized
Gain | | | Change in
Unrealized
Appreciation
(Depreciation) | | | Transfers
into Level 3* | | | Transfers
out of
Level 3* | | Value
10/31/22 | |
|
| |
Common Stocks & Other Equity Interests | | $ | – | | | $ | 9,964,902 | | | $ | (8,706,860 | ) | | $– | | $ | 2,544,427 | | | $ | (40,659,992 | ) | | $ | 45,161,332 | ** | | $– | | $ | 8,303,809 | |
|
| |
Preferred Stocks | | | 9,169,499 | | | | – | | | | (9,169,499 | ) | | – | | | – | | | | – | | | | – | | | – | | | – | |
|
| |
Total | | $ | 9,169,499 | | | $ | 9,964,902 | | | $ | (17,876,359 | ) | | $– | | $ | 2,544,427 | | | $ | (40,659,992 | ) | | $ | 45,161,332 | | | $– | | $ | 8,303,809 | |
|
| |
| * | Prior year balances have been adjusted for a change in security classification. |
| ** | Amount includes $37,157,402 and $8,003,930 of Russian equity securities previously classified as Level 1 and Level 2 securities, respectively. |
| | |
| 17 | | Invesco Emerging Markets Innovators Fund |
The following table summarizes the valuation techniques and significant unobservable inputs used in determining fair value measurements for those investments classified as level 3 at period end:
| | | | | | | | | | | | |
| | | Fair Value at 10/31/22 | | | Valuation Technique | | Unobservable
Inputs | | Range of
Unobservable
Inputs | | Unobservable
Input Used |
|
|
Le Travenues Technology Ltd. | | | $8,303,809 | | | Cost price adjusted by exchange rate | | Cost price | | N/A | | $509.36 (a) |
| | | | | | Stock split ratio | | Stock split ratio | | N/A | | 400 for 1 |
|
|
| (a) | The Fund fair values certain private placement securities at the original purchase price or “cost”. The Adviser periodically reviews the financial statements and monitors such investments for additional market information or the occurrence of a significant event, which would warrant a re-evaluation of the security’s fair valuation. |
NOTE 4–Derivative Investments
The Fund may enter into an International Swaps and Derivatives Association Master Agreement (“ISDA Master Agreement”) under which a fund may trade OTC derivatives. An OTC transaction entered into under an ISDA Master Agreement typically involves a collateral posting arrangement, payment netting provisions and close-out netting provisions. These netting provisions allow for reduction of credit risk through netting of contractual obligations. The enforceability of the netting provisions of the ISDA Master Agreement depends on the governing law of the ISDA Master Agreement, among other factors.
For financial reporting purposes, the Fund does not offset OTC derivative assets or liabilities that are subject to ISDA Master Agreements in the Statement of Assets and Liabilities.
Effect of Derivative Investments for the year ended October 31, 2022
The table below summarizes the gains (losses) on derivative investments, detailed by primary risk exposure, recognized in earnings during the period:
| | | | |
| | | Location of Gain (Loss) on
Statement of Operations | |
| | | Currency Risk | |
|
| |
Realized Gain (Loss): | | | | |
Forward foreign currency contracts | | | $(12,698) | |
|
| |
The table below summarizes the average notional value of derivatives held during the period.
| | |
| | | Forward
Foreign Currency
Contracts |
|
|
Average notional value | | $1,640,067 |
|
|
NOTE 5–Expense Offset Arrangement(s)
The expense offset arrangement is comprised of transfer agency credits which result from balances in demand deposit accounts used by the transfer agent for clearing shareholder transactions. For the year ended October 31, 2022, the Fund received credits from this arrangement, which resulted in the reduction of the Fund’s total expenses of $1,602.
NOTE 6–Trustees’ and Officers’ Fees and Benefits
Trustees’ and Officers’ Fees and Benefits include amounts accrued by the Fund to pay remuneration to certain Trustees and Officers of the Fund. Trustees have the option to defer compensation payable by the Fund, and Trustees’ and Officers’ Fees and Benefits also include amounts accrued by the Fund to fund such deferred compensation amounts. Those Trustees who defer compensation have the option to select various Invesco Funds in which their deferral accounts shall be deemed to be invested. Finally, certain current Trustees were eligible to participate in a retirement plan that provided for benefits to be paid upon retirement to Trustees over a period of time based on the number of years of service. The Fund may have certain former Trustees who also participate in a retirement plan and receive benefits under such plan. Trustees’ and Officers’ Fees and Benefits include amounts accrued by the Fund to fund such retirement benefits. Obligations under the deferred compensation and retirement plans represent unsecured claims against the general assets of the Fund.
NOTE 7–Cash Balances
The Fund is permitted to temporarily carry a negative or overdrawn balance in its account with SSB, the custodian bank. Such balances, if any at period-end, are shown in the Statement of Assets and Liabilities under the payable caption Amount due custodian. To compensate the custodian bank for such overdrafts, the overdrawn Fund may either (1) leave funds as a compensating balance in the account so the custodian bank can be compensated by earning the additional interest; or (2) compensate by paying the custodian bank at a rate agreed upon by the custodian bank and Invesco, not to exceed the contractually agreed upon rate. The Fund may not purchase additional securities when any borrowings from banks or broker-dealers exceed 5% of the Fund’s total assets, or when any borrowings from an Invesco Fund are outstanding.
NOTE 8–Distributions to Shareholders and Tax Components of Net Assets
Tax Character of Distributions to Shareholders Paid During the Fiscal Years Ended October 31, 2022 and 2021:
| | | | | | | | |
| | | 2022 | | | 2021 | |
|
| |
Long-term capital gain | | $ | 41,576,203 | | | $ | 14,841,556 | |
|
| |
| | |
| 18 | | Invesco Emerging Markets Innovators Fund |
Tax Components of Net Assets at Period-End:
| | | | |
| | | 2022 | |
|
| |
Net unrealized appreciation (depreciation) – investments | | $ | (15,306,002 | ) |
|
| |
Net unrealized appreciation (depreciation) – foreign currencies | | | (225,447 | ) |
|
| |
Temporary book/tax differences | | | (16,695 | ) |
|
| |
Late-Year ordinary loss deferral | | | (597,233 | ) |
|
| |
Capital loss carryforward | | | (35,479,204 | ) |
|
| |
Shares of beneficial interest | | | 179,528,926 | |
|
| |
Total net assets | | $ | 127,904,345 | |
|
| |
The difference between book-basis and tax-basis unrealized appreciation (depreciation) is due to differences in the timing of recognition of gains and losses on investments for tax and book purposes. The Fund’s net unrealized appreciation (depreciation) difference is attributable primarily to wash sales.
The temporary book/tax differences are a result of timing differences between book and tax recognition of income and/or expenses. The Fund’s temporary book/tax differences are the result of the trustee deferral of compensation and retirement plan benefits.
Capital loss carryforward is calculated and reported as of a specific date. Results of transactions and other activity after that date may affect the amount of capital loss carryforward actually available for the Fund to utilize. The ability to utilize capital loss carryforward in the future may be limited under the Internal Revenue Code and related regulations based on the results of future transactions.
The Fund has a capital loss carryforward as of October 31, 2022, as follows:
| | | | | | | | | | | | | | | | | | | | |
| Capital Loss Carryforward* | |
|
| |
| Expiration | | Short-Term | | | | | | Long-Term | | | | | | Total | |
|
| |
Not subject to expiration | | $ | 28,798,165 | | | | | | | $ | 6,681,039 | | | | | | | $ | 35,479,204 | |
|
| |
| * | Capital loss carryforward is reduced for limitations, if any, to the extent required by the Internal Revenue Code and may be further limited depending upon a variety of factors, including the realization of net unrealized gains or losses as of the date of any reorganization. |
NOTE 9–Investment Transactions
The aggregate amount of investment securities (other than short-term securities, U.S. Government obligations and money market funds, if any) purchased and sold by the Fund during the year ended October 31, 2022 was $40,201,907 and $214,856,540, respectively. Cost of investments, including any derivatives, on a tax basis includes the adjustments for financial reporting purposes as of the most recently completed federal income tax reporting period-end.
| | | | |
| Unrealized Appreciation (Depreciation) of Investments on a Tax Basis | |
|
| |
Aggregate unrealized appreciation of investments | | $ | 28,940,101 | |
|
| |
Aggregate unrealized (depreciation) of investments | | | (44,246,103 | ) |
|
| |
Net unrealized appreciation (depreciation) of investments | | $ | (15,306,002 | ) |
|
| |
Cost of investments for tax purposes is $140,881,757.
NOTE 10–Reclassification of Permanent Differences
Primarily as a result of differing book/tax treatment of foreign capital gains taxes and net operating losses, on October 31, 2022, undistributed net investment income was increased by $1,213,817, undistributed net realized gain (loss) was increased by $1,235,530 and shares of beneficial interest was decreased by $2,449,347. This reclassification had no effect on the net assets of the Fund.
NOTE 11–Share Information
| | | | | | | | | | | | | | | | |
| | | Summary of Share Activity | |
|
| |
| | | Year ended
October 31, 2022(a) | | | Year ended
October 31, 2021 | |
| | | Shares | | | Amount | | | Shares | | | Amount | |
|
| |
Sold: | | | | | | | | | | | | | | | | |
Class A | | | 1,042,462 | | | $ | 8,912,777 | | | | 6,255,457 | | | $ | 80,659,716 | |
|
| |
Class C | | | 174,172 | | | | 1,434,037 | | | | 321,067 | | | | 4,060,781 | |
|
| |
Class R | | | 213,127 | | | | 1,750,743 | | | | 133,649 | | | | 1,731,723 | |
|
| |
Class Y | | | 4,199,740 | | | | 35,825,100 | | | | 2,609,368 | | | | 34,702,024 | |
|
| |
Class R6 | | | 3,012,596 | | | | 26,026,269 | | | | 1,363,252 | | | | 18,353,203 | |
|
| |
| | | | |
Issued as reinvestment of dividends: | | | | | | | | | | | | | | | | |
Class A | | | 859,837 | | | | 8,710,145 | | | | 183,162 | | | | 2,322,499 | |
|
| |
Class C | | | 218,352 | | | | 2,076,530 | | | | 58,673 | | | | 709,352 | |
|
| |
Class R | | | 88,466 | | | | 878,468 | | | | 21,782 | | | | 272,050 | |
|
| |
Class Y | | | 1,416,769 | | | | 14,635,222 | | | | 447,254 | | | | 5,751,687 | |
|
| |
Class R6 | | | 296,991 | | | | 3,106,522 | | | | 243,443 | | | | 3,167,195 | |
|
| |
| | | | |
Automatic conversion of Class C shares to Class A shares: | | | | | | | | | | | | | | | | |
Class A | | | 72,182 | | | | 589,410 | | | | 188,539 | | | | 2,464,557 | |
|
| |
Class C | | | (77,112 | ) | | | (589,410 | ) | | | (198,024 | ) | | | (2,464,557 | ) |
|
| |
| | |
| 19 | | Invesco Emerging Markets Innovators Fund |
| | | | | | | | | | | | | | | | |
| | | Summary of Share Activity | |
|
| |
| | | Year ended
October 31, 2022(a) | | | Year ended
October 31, 2021 | |
| | | Shares | | | Amount | | | Shares | | | Amount | |
|
| |
| | | | |
Reacquired: | | | | | | | | | | | | | | | | |
Class A | | | (7,291,835 | ) | | $ | (74,759,710 | ) | | | (2,018,986 | ) | | $ | (26,434,005 | ) |
|
| |
Class C | | | (531,237 | ) | | | (4,287,171 | ) | | | (405,511 | ) | | | (5,059,541 | ) |
|
| |
Class R | | | (160,666 | ) | | | (1,327,562 | ) | | | (195,301 | ) | | | (2,524,988 | ) |
|
| |
Class Y | | | (13,636,919 | ) | | | (111,363,661 | ) | | | (3,990,225 | ) | | | (51,930,525 | ) |
|
| |
Class R6 | | | (6,519,957 | ) | | | (55,808,328 | ) | | | (6,171,816 | ) | | | (82,371,364 | ) |
|
| |
Net increase (decrease) in share activity | | | (16,623,032 | ) | | $ | (144,190,619 | ) | | | (1,154,217 | ) | | $ | (16,590,193 | ) |
|
| |
| (a) | There are entities that are record owners of more than 5% of the outstanding shares of the Fund and in the aggregate own 55% of the outstanding shares of the Fund. IDI has an agreement with these entities to sell Fund shares. The Fund, Invesco and/or Invesco affiliates may make payments to these entities, which are considered to be related to the Fund, for providing services to the Fund, Invesco and/or Invesco affiliates including but not limited to services such as securities brokerage, distribution, third party record keeping and account servicing. The Fund has no knowledge as to whether all or any portion of the shares owned of record by these entities are also owned beneficially. |
| | |
| 20 | | Invesco Emerging Markets Innovators Fund |
Report of Independent Registered Public Accounting Firm
To the Board of Trustees of AIM Investment Funds (Invesco Investment Funds) and Shareholders of Invesco Emerging Markets Innovators Fund
Opinion on the Financial Statements
We have audited the accompanying statement of assets and liabilities, including the schedule of investments, of Invesco Emerging Markets Innovators Fund (one of the funds constituting AIM Investment Funds (Invesco Investment Funds), referred to hereafter as the “Fund”) as of October 31, 2022, the related statement of operations for the year ended October 31, 2022, the statement of changes in net assets for each of the two years in the period ended October 31, 2022, including the related notes, and the financial highlights for each of the periods indicated in the table below (collectively referred to as the “financial statements”). In our opinion, the financial statements present fairly, in all material respects, the financial position of the Fund as of October 31, 2022, the results of its operations for the year then ended, the changes in its net assets for each of the two years in the period ended October 31, 2022 and the financial highlights for each of the periods indicated in the table below, in conformity with accounting principles generally accepted in the United States of America.
|
| Financial Highlights |
For each of the three years in the period ended October 31, 2022, the two months ended October 31, 2019, and the year ended August 31, 2019 for Class A, Class C, Class R, Class Y and Class R6. For each of the three years in the period ended October 31, 2022, the two months ended October 31, 2019, and the period May 24, 2019 (commencement of operations) through August 31, 2019 for Class R5. |
The financial statements of Oppenheimer Emerging Markets Innovators Fund (subsequently renamed Invesco Emerging Markets Innovators Fund) as of and for the year ended August 31, 2018 and the financial highlights for the year then ended (not presented herein, other than the financial highlights) were audited by other auditors whose report dated October 25, 2018 expressed an unqualified opinion on those financial statements and financial highlights.
Basis for Opinion
These financial statements are the responsibility of the Fund’s management. Our responsibility is to express an opinion on the Fund’s financial statements based on our audits. We are a public accounting firm registered with the Public Company Accounting Oversight Board (United States) (PCAOB) and are required to be independent with respect to the Fund in accordance with the U.S. federal securities laws and the applicable rules and regulations of the Securities and Exchange Commission and the PCAOB.
We conducted our audits of these financial statements in accordance with the standards of the PCAOB. Those standards require that we plan and perform the audit to obtain reasonable assurance about whether the financial statements are free of material misstatement, whether due to error or fraud.
Our audits included performing procedures to assess the risks of material misstatement of the financial statements, whether due to error or fraud, and performing procedures that respond to those risks. Such procedures included examining, on a test basis, evidence regarding the amounts and disclosures in the financial statements. Our audits also included evaluating the accounting principles used and significant estimates made by management, as well as evaluating the overall presentation of the financial statements. Our procedures included confirmation of securities owned as of October 31, 2022 by correspondence with the custodian and transfer agent. We believe that our audits provide a reasonable basis for our opinion.
/s/PricewaterhouseCoopers LLP
Houston, Texas
December 23, 2022
We have served as the auditor of one or more of the investment companies in the Invesco group of investment companies since at least 1995. We have not been able to determine the specific year we began serving as auditor.
| | |
| 21 | | Invesco Emerging Markets Innovators Fund |
Calculating your ongoing Fund expenses
Example
As a shareholder of the Fund, you incur two types of costs: (1) transaction costs, which may include sales charges (loads) on purchase payments or contingent deferred sales charges on redemptions, if any; and (2) ongoing costs, including management fees, distribution and/or service (12b-1) fees, and other Fund expenses. This example is intended to help you understand your ongoing costs (in dollars) of investing in the Fund and to compare these costs with ongoing costs of investing in other mutual funds. The example is based on an investment of $1,000 invested at the beginning of the period and held for the entire period May 1, 2022 through October 31, 2022.
Actual expenses
The table below provides information about actual account values and actual expenses. You may use the information in this table, together with the amount you invested, to estimate the expenses that you paid over the period. Simply divide your account value by $1,000 (for example, an $8,600 account value divided by $1,000 = 8.6), then multiply the result by the number in the table under the heading entitled “Actual Expenses Paid During Period” to estimate the expenses you paid on your account during this period.
Hypothetical example for comparison purposes
The table below also provides information about hypothetical account values and hypothetical expenses based on the Fund’s actual expense ratio and an assumed rate of return of 5% per year before expenses, which is not the Fund’s actual return.
The hypothetical account values and expenses may not be used to estimate the actual ending account balance or expenses you paid for the period. You may use this information to compare the ongoing costs of investing in the Fund and other funds. To do so, compare this 5% hypothetical example with the 5% hypothetical examples that appear in the shareholder reports of the other funds.
Please note that the expenses shown in the table are meant to highlight your ongoing costs only and do not reflect any transaction costs, such as sales charges (loads) on purchase payments or contingent deferred sales charges on redemptions, if any. Therefore, the hypothetical information is useful in comparing ongoing costs only, and will not help you determine the relative total costs of owning different funds. In addition, if these transaction costs were included, your costs would have been higher.
| | | | | | | | | | | | |
| | | | | ACTUAL | | HYPOTHETICAL (5% annual return before expenses) | | |
| | Beginning
Account Value
(05/01/22) | | Ending
Account Value
(10/31/22)1 | | Expenses
Paid During
Period2 | | Ending
Account Value
(10/31/22) | | Expenses
Paid During
Period2 | | Annualized
Expense Ratio |
Class A | | $1,000.00 | | $878.10 | | $6.96 | | $1,017.80 | | $7.48 | | 1.47% |
Class C | | 1,000.00 | | 875.40 | | 10.54 | | 1,013.96 | | 11.32 | | 2.23 |
Class R | | 1,000.00 | | 876.90 | | 8.18 | | 1,016.48 | | 8.79 | | 1.73 |
Class Y | | 1,000.00 | | 880.40 | | 5.83 | | 1,019.00 | | 6.26 | | 1.23 |
Class R5 | | 1,000.00 | | 879.40 | | 6.02 | | 1,018.80 | | 6.46 | | 1.27 |
Class R6 | | 1,000.00 | | 878.20 | | 6.01 | | 1,018.80 | | 6.46 | | 1.27 |
| 1 | The actual ending account value is based on the actual total return of the Fund for the period May 1, 2022 through October 31, 2022, after actual expenses and will differ from the hypothetical ending account value which is based on the Fund’s expense ratio and a hypothetical annual return of 5% before expenses. |
| 2 | Expenses are equal to the Fund’s annualized expense ratio as indicated above multiplied by the average account value over the period, multiplied by 184/365 to reflect the most recent fiscal half year. |
| | |
| 22 | | Invesco Emerging Markets Innovators Fund |
Approval of Investment Advisory and Sub-Advisory Contracts
At meetings held on June 13, 2022, the Board of Trustees (the Board or the Trustees) of AIM Investment Funds (Invesco Investment Funds) as a whole, and the independent Trustees, who comprise over 75% of the Board, voting separately, approved the continuance of the Invesco Emerging Markets Innovators Fund’s (the Fund) Master Investment Advisory Agreement with Invesco Advisers, Inc. (Invesco Advisers and the investment advisory agreement) and the Master Intergroup Sub-Advisory Contract for Mutual Funds with Invesco Asset Management Deutschland GmbH, Invesco Asset Management Limited, Invesco Asset Management (Japan) Limited, Invesco Hong Kong Limited, Invesco Senior Secured Management, Inc. and Invesco Canada Ltd. and separate sub-advisory contracts with Invesco Capital Management LLC and Invesco Asset Management (India) Private Limited and OppenheimerFunds, Inc. (collectively, the Affiliated Sub-Advisers and the sub-advisory contracts) for another year, effective July 1, 2022. After evaluating the factors discussed below, among others, the Board approved the renewal of the Fund’s investment advisory agreement and the sub-advisory contracts and determined that the compensation payable thereunder by the Fund to Invesco Advisers and by Invesco Advisers to the Affiliated Sub-Advisers is fair and reasonable.
The Board’s Evaluation Process
The Board has established an Investments Committee, which in turn has established Sub-Committees that meet throughout the year to review the performance of funds advised by Invesco Advisers (the Invesco Funds). The Sub-Committees meet regularly with portfolio managers for their assigned Invesco Funds and other members of management to review detailed information about investment performance and portfolio attributes of these funds. The Board has established additional standing and ad hoc committees that meet regularly throughout the year to review matters within their purview. The Board took into account evaluations and reports that it received from its committees and sub-committees, as well as the information provided to the Board and its committees and sub-committees throughout the year, in considering whether to approve each Invesco Fund’s investment advisory agreement and sub-advisory contracts.
As part of the contract renewal process, the Board reviews and considers information provided in response to detailed requests for information submitted to management by the independent Trustees with assistance from legal counsel to the independent Trustees and the Senior Officer, an officer of the Invesco Funds who reports directly to the independent Trustees. The Board receives comparative investment performance and fee and expense data regarding the Invesco Funds prepared by Broadridge Financial Solutions, Inc. (Broadridge), an independent mutual fund data provider, as well as information on the composition of the peer groups provided by Broadridge and its methodology for determining peer groups. The Board also receives an independent written evaluation from the Senior Officer. The Senior Officer’s evaluation is prepared as part of his responsibility to manage the process by which the Invesco Funds’ proposed management fees
are negotiated during the annual contract renewal process to ensure they are negotiated in a manner that is at arms’ length and reasonable in accordance with certain negotiated regulatory requirements. In addition to meetings with Invesco Advisers and fund counsel throughout the year and as part of meetings convened on May 2, 2022 and June 13, 2022, the independent Trustees also discussed the continuance of the investment advisory agreement and sub-advisory contracts in separate sessions with the Senior Officer and with independent legal counsel. Also, as part of the contract renewal process, the independent Trustees reviewed and considered information provided in response to detailed follow-up requests for information submitted by the independent Trustees to management. The independent Trustees met and discussed those follow-up responses with legal counsel to the independent Trustees and the Senior Officer.
The discussion below is a summary of the Senior Officer’s independent written evaluation with respect to the Fund’s investment advisory agreement and sub-advisory contracts, as well as a discussion of the material factors and related conclusions that formed the basis for the Board’s approval of the Fund’s investment advisory agreement and sub-advisory contracts. The Trustees’ review and conclusions are based on the comprehensive consideration of all information presented to them during the course of the year and in prior years and are not the result of any single determinative factor. Moreover, one Trustee may have weighed a particular piece of information or factor differently than another Trustee. The information received and considered by the Board was current as of various dates prior to the Board’s approval on June 13, 2022.
Factors and Conclusions and Summary of Independent Written Fee Evaluation
| A. | Nature, Extent and Quality of Services Provided by Invesco Advisers and the Affiliated Sub-Advisers |
The Board reviewed the nature, extent and quality of the advisory services provided to the Fund by Invesco Advisers under the Fund’s investment advisory agreement, and the credentials and experience of the officers and employees of Invesco Advisers who provide these services, including the Fund’s portfolio manager(s). The Board’s review included consideration of Invesco Advisers’ investment process and oversight, credit analysis, and research capabilities. The Board considered information regarding Invesco Advisers’ programs for and resources devoted to risk management, including management of investment, enterprise, operational, liquidity, valuation and compliance risks, and technology used to manage such risks. The Board also received and reviewed information about Invesco Advisers’ role as administrator of the Invesco Funds’ liquidity risk management program. The Board received a description of, and reports related to, Invesco Advisers’ global security program and business continuity plans and of its approach to data privacy and cybersecurity, including related testing. The Board considered how the cybersecurity and business continuity plans of Invesco Advisers and its key service providers operated in the remote and hybrid working environment resulting from the novel coronavirus (“COVID-19”) pandemic and paved the
way for a hybrid working framework in a normalized environment as employees return to the office. The Board also considered non-advisory services that Invesco Advisers and its affiliates provide to the Invesco Funds, such as various back office support functions, third party oversight, internal audit, valuation, portfolio trading and legal and compliance. The Board observed that Invesco Advisers’ systems preparedness and ongoing investment enabled Invesco Advisers to manage, operate and oversee the Invesco Funds with minimal impact or disruption through challenging environments. The Board reviewed and considered the benefits to shareholders of investing in a Fund that is part of the family of funds under the umbrella of Invesco Ltd., Invesco Advisers’ parent company, and noted Invesco Ltd.’s depth and experience in running an investment management business, as well as its commitment of financial and other resources to such business. The Board concluded that the nature, extent and quality of the services provided to the Fund by Invesco Advisers are appropriate and satisfactory.
The Board reviewed the services that may be provided by the Affiliated Sub-Advisers under the sub-advisory contracts and the credentials and experience of the officers and employees of the Affiliated Sub-Advisers who provide these services. The Board noted the Affiliated Sub-Advisers’ expertise with respect to certain asset classes and that the Affiliated Sub-Advisers have offices and personnel that are located in financial centers around the world. As a result, the Board noted that the Affiliated Sub-Advisers can provide research and investment analysis on the markets and economies of various countries in which the Fund may invest, make recommendations regarding securities and assist with security trades. The Board concluded that the sub-advisory contracts may benefit the Fund and its shareholders by permitting Invesco Advisers to use the resources and talents of the Affiliated Sub-Advisers in managing the Fund. The Board concluded that the nature, extent and quality of the services that may be provided to the Fund by the Affiliated Sub-Advisers are appropriate and satisfactory.
| B. | Fund Investment Performance |
The Board considered Fund investment performance as a relevant factor in considering whether to approve the investment advisory agreement. The Board did not view Fund investment performance as a relevant factor in considering whether to approve the sub-advisory contracts for the Fund, as no Affiliated Sub-Adviser currently manages assets of the Fund.
The Board compared the Fund’s investment performance over multiple time periods ending December 31, 2021 to the performance of funds in the Broadridge performance universe and against the MSCI Emerging Markets Index (Index). The Board noted that performance of Class A shares of the Fund was in the fifth quintile of its performance universe for the one and five year periods and the fourth quintile for the three year period (the first quintile being the best performing funds and the fifth quintile being the worst performing funds). The Board noted that performance of Class A shares of the Fund was below the performance of the Index for the one, three and five year periods. The Board considered that the Fund was created in connection with Invesco Ltd.’s
| | |
| 23 | | Invesco Emerging Markets Innovators Fund |
acquisition of OppenheimerFunds, Inc. and its subsidiaries (the “Transaction”) and that the Fund’s performance prior to the closing of the Transaction on May 24, 2019 is that of its predecessor fund. The Board noted that stock selection in and underweight or overweight exposure to certain sectors and geographic regions, as well as certain factor exposures, detracted from Fund performance. The Board recognized that the performance data reflects a snapshot in time as of a particular date and that selecting a different performance period could produce different results. The Board also reviewed more recent Fund performance as well as other performance metrics, which did not change its conclusions.
| C. | Advisory and Sub-Advisory Fees and Fund Expenses |
The Board compared the Fund’s contractual management fee rate to the contractual management fee rates of funds in the Fund’s Broadridge expense group. The Board noted that the contractual management fee rate for Class A shares of the Fund was above the median contractual management fee rate of funds in its expense group. The Board noted that the term “contractual management fee” for funds in the expense group may include both advisory and certain non-portfolio management administrative services fees, but that Broadridge is not able to provide information on a fund by fund basis as to what is included. The Board also reviewed the methodology used by Broadridge in calculating expense group information, which includes using each fund’s contractual management fee schedule (including any applicable breakpoints) as reported in the most recent prospectus or statement of additional information for each fund in the expense group. As previously noted, the independent Trustees reviewed and considered information provided in response to detailed follow-up requests for information submitted by the independent Trustees to management, including with respect to management’s philosophy regarding breakpoints in the Fund’s contractual management fee schedule. The independent Trustees met and discussed those follow-up responses with legal counsel to the independent Trustees and the Senior Officer, and subsequently with representatives of management. The Board also considered comparative information regarding the Fund’s total expense ratio and its various components. The Board noted that the Fund’s actual and contractual management fees and total expense ratio were in the fifth quintile of its expense group, requested and considered additional information from management regarding the appropriateness of the management fees and total expense ratio, and discussed with management reasons for such relative actual and contractual management fees and total expenses.
The Board noted that Invesco Advisers has contractually agreed to waive fees and/or limit expenses of the Fund for the term disclosed in the Fund’s registration statement in an amount necessary to limit total annual operating expenses to a specified percentage of average daily net assets for each class of the Fund.
The Board also considered the fees charged by Invesco Advisers and its affiliates to other client accounts that are similarly managed. Invesco Advisers reviewed with the Board differences in the scope of services it provides to the Invesco Funds relative to that provided by Invesco Advisers and its affiliates to certain other types of client accounts,
including, among others: management of cash flows as a result of redemptions and purchases; necessary infrastructure such as officers, office space, technology, legal and distribution; oversight of service providers; costs and business risks associated with launching new funds and sponsoring and maintaining the product line; and compliance with federal and state laws and regulations. Invesco Advisers also advised the Board that many of the similarly managed client accounts have all-inclusive fee structures, which are not easily un-bundled.
The Board also considered the services that may be provided by the Affiliated Sub-Advisers pursuant to the sub-advisory contracts, as well as the fees payable by Invesco Advisers to the Affiliated Sub-Advisers pursuant to the sub-advisory contracts.
| D. | Economies of Scale and Breakpoints |
The Board considered the extent to which there may be economies of scale in the provision of advisory services to the Fund and the Invesco Funds, and the extent to which such economies of scale are shared with the Fund and the Invesco Funds. The Board considered that the Fund may benefit from economies of scale through contractual breakpoints in the Fund’s advisory fee schedule, which generally operate to reduce the Fund’s expense ratio as it grows in size. The Board noted that the Fund also shares in economies of scale through Invesco Advisers’ ability to negotiate lower fee arrangements with third party service providers. The Board noted that the Fund may also benefit from economies of scale through initial fee setting, fee waivers and expense reimbursements, as well as Invesco Advisers’ investment in its business, including investments in business infrastructure, technology and cybersecurity.
| E. | Profitability and Financial Resources |
The Board reviewed information from Invesco Advisers concerning the costs of the advisory and other services that Invesco Advisers and its affiliates provide to the Fund and the Invesco Funds and the profitability of Invesco Advisers and its affiliates in providing these services in the aggregate and on an individual Fund-by-Fund basis. The Board considered the methodology used for calculating profitability and the periodic review and enhancement of such methodology. The Board noted that Invesco Advisers continues to operate at a net profit from services Invesco Advisers and its affiliates provide to the Invesco Funds in the aggregate and to most Funds individually. The Board did not deem the level of profits realized by Invesco Advisers and its affiliates from providing such services to be excessive, given the nature, extent and quality of the services provided. The Board noted that Invesco Advisers provided information demonstrating that Invesco Advisers is financially sound and has the resources necessary to perform its obligations under the investment advisory agreement, and provided representations indicating that the Affiliated Sub-Advisers are financially sound and have the resources necessary to perform their obligations under the sub-advisory contracts.
| F. | Collateral Benefits to Invesco Advisers and its Affiliates |
The Board considered various other benefits received by Invesco Advisers and its affiliates from the relationship with the Fund, including the fees received for providing administrative, transfer agency and distribution services to the Fund. The Board received comparative information regarding fees charged for these services, including
information provided by Broadridge and other independent sources. The Board reviewed the performance of Invesco Advisers and its affiliates in providing these services and the organizational structure employed to provide these services. The Board noted that these services are provided to the Fund pursuant to written contracts that are reviewed and subject to approval on an annual basis by the Board based on its determination that the services are required for the operation of the Fund.
The Board considered the benefits realized by Invesco Advisers and the Affiliated Sub-Advisers as a result of portfolio brokerage transactions executed through “soft dollar” arrangements. The Board noted that soft dollar arrangements may result in the Fund bearing costs to purchase research that may be used by Invesco Advisers or the Affiliated Sub-Advisers with other clients and may reduce Invesco Advisers’ or the Affiliated Sub-Advisers’ expenses. The Board also considered that it receives from Invesco Advisers periodic reports that include a representation to the effect that these arrangements are consistent with regulatory requirements. The Board did not deem the soft dollar arrangements to be inappropriate.
The Board considered that the Fund’s uninvested cash and cash collateral from any securities lending arrangements may be invested in registered money market funds or, with regard to securities lending cash collateral, unregistered funds that comply with Rule 2a-7 (collectively referred to as “affiliated money market funds”) advised by Invesco Advisers. The Board considered information regarding the returns of the affiliated money market funds relative to comparable overnight investments, as well as the fees paid by the affiliated money market funds to Invesco Advisers and its affiliates. In this regard, the Board noted that Invesco Advisers receives advisory fees from these affiliated money market funds attributable to the Fund’s investments. The Board also noted that Invesco Advisers has contractually agreed to waive through varying periods an amount equal to 100% of the net advisory fee Invesco Advisers receives from the affiliated money market funds with respect to the Fund’s investment in the affiliated money market funds of uninvested cash, but not cash collateral. The Board concluded that the advisory fees payable to Invesco Advisers from the Fund’s investment of cash collateral from any securities lending arrangements in the affiliated money market funds are for services that are not duplicative of services provided by Invesco Advisers to the Fund.
The Board considered that Invesco Advisers may serve as the Fund’s affiliated securities lending agent and evaluated the benefits realized by Invesco Advisers when serving in such role, including the compensation received. The Board considered Invesco Advisers’ securities lending platform and corporate governance structure for securities lending, including Invesco Advisers’ Securities Lending Governance Committee and its related responsibilities. The Board noted that to the extent the Fund utilizes Invesco Advisers as an affiliated securities lending agent, the Fund conducts its securities lending in accordance with, and in reliance upon, no-action letters issued by the SEC staff that provide guidance on how an affiliate may act as a direct agent lender and receive compensation for those services without obtaining exemptive relief. The Board considered information provided by Invesco Advisers related to the performance of Invesco Advisers as securities lending agent, including a
| | |
| 24 | | Invesco Emerging Markets Innovators Fund |
summary of the securities lending services provided to the Fund by Invesco Advisers and the compensation paid to Invesco Advisers for such services, as well as any revenues generated for the Fund in connection with such securities lending activity and the allocation of such revenue between the Fund and Invesco Advisers.
The Board also received information about commissions that an affiliated broker may receive for executing certain trades for the Fund. Invesco Advisers and the Affiliated Sub-Advisers advised the Board of the benefits to the Fund of executing trades through the affiliated broker and that such trades were executed in compliance with rules under the federal securities laws and consistent with best execution obligations.
| | |
| 25 | | Invesco Emerging Markets Innovators Fund |
Tax Information
Form 1099-DIV, Form 1042-S and other year–end tax information provide shareholders with actual calendar year amounts that should be included in their tax returns. Shareholders should consult their tax advisers.
The following distribution information is being provided as required by the Internal Revenue Code or to meet a specific state’s requirement.
The Fund designates the following amounts or, if subsequently determined to be different, the maximum amount allowable for its fiscal year ended October 31, 2022:
| | | | | | | | |
Federal and State Income Tax | | | | | | |
Long-Term Capital Gain Distributions | | | $41,576,203 | | | | | |
Qualified Dividend Income* | | | 0.00 | % | | | | |
Corporate Dividends Received Deduction* | | | 0.00 | % | | | | |
U.S. Treasury Obligations* | | | 0.00 | % | | | | |
Qualified Business Income* | | | 0.00 | % | | | | |
| Business Interest Income* | | | 0.00 | % | | | | |
|
| * The above percentages are based on ordinary income dividends paid to shareholders during the Fund’s fiscal year. | |
| | |
| 26 | | Invesco Emerging Markets Innovators Fund |
Trustees and Officers
| | | | | | | | |
Name, Year of Birth and Position(s) Held with the Trust | | Trustee and/or Officer Since | | Principal Occupation(s) During Past 5 Years | | Number of Funds in Fund Complex Overseen by Trustee | | Other Directorship(s) Held by Trustee During Past 5 Years |
| Interested Trustee | | | | | | | | |
Martin L. Flanagan1 - 1960 Trustee and Vice Chair | | 2007 | | Executive Director, Chief Executive Officer and President, Invesco Ltd. (ultimate parent of Invesco and a global investment management firm); Trustee and Vice Chair, The Invesco Funds; Vice Chair, Investment Company Institute; and Member of Executive Board, SMU Cox School of Business Formerly: Advisor to the Board, Invesco Advisers, Inc. (formerly known as Invesco Institutional (N.A.), Inc.); Chairman and Chief Executive Officer, Invesco Advisers, Inc. (registered investment adviser); Director, Chairman, Chief Executive Officer and President, Invesco Holding Company (US), Inc. (formerly IVZ Inc.) (holding company), Invesco Group Services, Inc. (service provider) and Invesco North American Holdings, Inc. (holding company); Director, Chief Executive Officer and President, Invesco Holding Company Limited (parent of Invesco and a global investment management firm); Director, Invesco Ltd.; Chairman, Investment Company Institute and President, Co-Chief Executive Officer, Co-President, Chief Operating Officer and Chief Financial Officer, Franklin Resources, Inc. (global investment management organization) | | 189 | | None |
| 1 | Mr. Flanagan is considered an interested person (within the meaning of Section 2(a)(19) of the 1940 Act) of the Trust because he is an officer of the Adviser to the Trust, and an officer and a director of Invesco Ltd., ultimate parent of the Adviser. |
| | |
| T-1 | | Invesco Emerging Markets Innovators Fund |
Trustees and Officers–(continued)
| | | | | | | | |
Name, Year of Birth and Position(s) Held with the Trust | | Trustee and/or Officer Since | | Principal Occupation(s) During Past 5 Years | | Number of Funds in Fund Complex Overseen by Trustee | | Other Directorship(s) Held by Trustee During Past 5 Years |
| Independent Trustees | | | | | | | | |
Beth Ann Brown - 1968 Trustee (2019) and Chair (August 2022) | | 2019 | | Independent Consultant Formerly: Head of Intermediary Distribution, Managing Director, Strategic Relations, Managing Director, Head of National Accounts, Senior Vice President, National Account Manager and Senior Vice President, Key Account Manager, Columbia Management Investment Advisers LLC; Vice President, Key Account Manager, Liberty Funds Distributor, Inc.; and Trustee of certain Oppenheimer Funds | | 189 | | Director, Board of Directors of Caron Engineering Inc.; Advisor, Board of Advisors of Caron Engineering Inc.; President and Director, Acton Shapleigh Youth Conservation Corps (non-profit) Formerly: President and Director Director of Grahamtastic Connection (non-profit) |
Cynthia Hostetler -1962 Trustee | | 2017 | | Non-Executive Director and Trustee of a number of public and private business corporations Formerly: Director, Aberdeen Investment Funds (4 portfolios); Director, Artio Global Investment LLC (mutual fund complex); Director, Edgen Group, Inc. (specialized energy and infrastructure products distributor); Director, Genesee & Wyoming, Inc. (railroads); Head of Investment Funds and Private Equity, Overseas Private Investment Corporation; President, First Manhattan Bancorporation, Inc.; and Attorney, Simpson Thacher & Bartlett LLP | | 189 | | Resideo Technologies, Inc. (smart home technology); Vulcan Materials Company (construction materials company); Trilinc Global Impact Fund; Textainer Group Holdings, (shipping container leasing company); Investment Company Institute (professional organization); and Independent Directors Council (professional organization) |
Eli Jones - 1961 Trustee | | 2016 | | Professor and Dean Emeritus, Mays Business School - Texas A&M University Formerly: Dean of Mays Business School-Texas A&M University; Professor and Dean, Walton College of Business, University of Arkansas and E.J. Ourso College of Business, Louisiana State University; and Director, Arvest Bank | | 189 | | Insperity, Inc. (formerly known as Administaff) (human resources provider); and Member of Regional Board of Directors and Board of Directors, First Financial Bancorp (regional bank) |
Elizabeth Krentzman - 1959 Trustee | | 2019 | | Formerly: Principal and Chief Regulatory Advisor for Asset Management Services and U.S. Mutual Fund Leader of Deloitte & Touche LLP; General Counsel of the Investment Company Institute (trade association); National Director of the Investment Management Regulatory Consulting Practice, Principal, Director and Senior Manager of Deloitte & Touche LLP; Assistant Director of the Division of Investment Management - Office of Disclosure and Investment Adviser Regulation of the U.S. Securities and Exchange Commission and various positions with the Division of Investment Management – Office of Regulatory Policy of the U.S. Securities and Exchange Commission; Associate at Ropes & Gray LLP; and Trustee of certain Oppenheimer Funds | | 189 | | Formerly: Member of the Cartica Funds Board of Directors (private investment fund); Trustee of the University of Florida National Board Foundation; and Member of the University of Florida Law Center Association, Inc. Board of Trustees, Audit Committee and Membership Committee |
Anthony J. LaCava, Jr. - 1956 Trustee | | 2019 | | Formerly: Director and Member of the Audit Committee, Blue Hills Bank (publicly traded financial institution) and Managing Partner, KPMG LLP | | 189 | | Blue Hills Bank; Chairman, Bentley University; Member, Business School Advisory Council; and Nominating Committee, KPMG LLP |
Prema Mathai-Davis - 1950 Trustee | | 2001 | | Retired Formerly: Co-Founder & Partner of Quantalytics Research, LLC, (a FinTech Investment Research Platform for the Self-Directed Investor); Trustee of YWCA Retirement Fund; CEO of YWCA of the USA; Board member of the NY Metropolitan Transportation Authority; Commissioner of the NYC Department of Aging; and Board member of Johns Hopkins Bioethics Institute | | 189 | | Member of Board of Positive Planet US (non-profit) and HealthCare Chaplaincy Network (non-profit) |
| | |
| T-2 | | Invesco Emerging Markets Innovators Fund |
Trustees and Officers–(continued)
| | | | | | | | |
Name, Year of Birth and Position(s) Held with the Trust | | Trustee and/or Officer Since | | Principal Occupation(s) During Past 5 Years | | Number of Funds in Fund Complex Overseen by Trustee | | Other Directorship(s) Held by Trustee During Past 5 Years |
| Independent Trustees–(continued) | | | | |
Joel W. Motley - 1952 Trustee | | 2019 | | Director of Office of Finance, Federal Home Loan Bank System; Managing Director of Carmona Motley Inc. (privately held financial advisor); Member of the Council on Foreign Relations and its Finance and Budget Committee; Chairman Emeritus of Board of Human Rights Watch and Member of its Investment Committee; and Member of Investment Committee Board of Historic Hudson Valley (non-profit cultural organization); Member of the Board, Blue Ocean Acquisition Corp.; and Member of the Vestry and the Investment Committee of Trinity Church Wall Street. Formerly: Managing Director of Public Capital Advisors, LLC (privately held financial advisor); Managing Director of Carmona Motley Hoffman, Inc. (privately held financial advisor); Trustee of certain Oppenheimer Funds; and Director of Columbia Equity Financial Corp. (privately held financial advisor) | | 189 | | Member of Board of Trust for Mutual Understanding (non-profit promoting the arts and environment); Member of Board of Greenwall Foundation (bioethics research foundation) and its Investment Committee; Member of Board of Friends of the LRC (non-profit legal advocacy); and Board Member and Investment Committee Member of Pulitzer Center for Crisis Reporting (non-profit journalism) |
Teresa M. Ressel - 1962 Trustee | | 2017 | | Non-executive director and trustee of a number of public and private business corporations Formerly: Chief Executive Officer, UBS Securities LLC (investment banking); Chief Operating Officer, UBS AG Americas (investment banking); Sr. Management Team Olayan America, The Olayan Group (international investor/commercial/industrial); Assistant Secretary for Management & Budget and Designated Chief Financial Officer, U.S. Department of Treasury and Director, ON Semiconductor Corporation (semiconductor manufacturing) | | 189 | | None |
Robert C. Troccoli - 1949 Trustee | | 2016 | | Retired Formerly: Adjunct Professor, University of Denver – Daniels College of Business; and Managing Partner, KPMG LLP | | 189 | | None |
Daniel S. Vandivort - 1954 Trustee | | 2019 | | President, Flyway Advisory Services LLC (consulting and property management) Formerly: President and Chief Investment Officer, previously Head of Fixed Income, Weiss Peck and Greer/Robeco Investment Management; Trustee and Chair, Weiss Peck and Greer Funds Board; and various capacities at CS First Boston including Head of Fixed Income at First Boston Asset Management. | | 189 | | Formerly: Trustee and Governance Chair, Oppenheimer Funds; Treasurer, Chairman of the Audit and Finance Committee, Huntington Disease Foundation of America |
| | |
| T-3 | | Invesco Emerging Markets Innovators Fund |
Trustees and Officers–(continued)
| | | | | | | | |
Name, Year of Birth and Position(s) Held with the Trust | | Trustee and/or Officer Since | | Principal Occupation(s) During Past 5 Years | | Number of Funds in Fund Complex Overseen by Trustee | | Other Directorship(s) Held by Trustee During Past 5 Years |
| Officers | | | | | | | | |
Sheri Morris - 1964 President and Principal Executive Officer | | 1999 | | Director, Invesco Trust Company; Head of Global Fund Services, Invesco Ltd.; President and Principal Executive Officer, The Invesco Funds; Vice President, Invesco Exchange-Traded Fund Trust, Invesco Exchange-Traded Fund Trust II, Invesco India Exchange-Traded Fund Trust, Invesco Actively Managed Exchange-Traded Fund Trust, Invesco Actively Managed Exchange-Traded Commodity Fund Trust and Invesco Exchange-Traded Self-Indexed Fund Trust; and Vice President, OppenheimerFunds, Inc. Formerly: Vice President, Treasurer and Principal Financial Officer, The Invesco Funds; Vice President, Invesco AIM Advisers, Inc., Invesco AIM Capital Management, Inc. and Invesco AIM Private Asset Management, Inc.; Assistant Vice President and Assistant Treasurer, The Invesco Funds; Vice President and Assistant Vice President, Invesco Advisers, Inc.; Assistant Vice President, Invesco AIM Capital Management, Inc. and Invesco AIM Private Asset Management, Inc.; Treasurer, Invesco Exchange-Traded Fund Trust, Invesco Exchange-Traded Fund Trust II, Invesco India Exchange-Traded Fund Trust and Invesco Actively Managed Exchange-Traded Fund Trust; and Senior Vice President, Invesco Advisers, Inc. (formerly known as Invesco Institutional (N.A.), Inc.) (registered investment adviser) | | N/A | | N/A |
Jeffrey H. Kupor - 1968 Senior Vice President, Chief Legal Officer and Secretary | | 2018 | | Head of Legal of the Americas, Invesco Ltd.; Senior Vice President and Secretary, Invesco Advisers, Inc. (formerly known as Invesco Institutional (N.A.), Inc.) (registered investment adviser); Secretary, Invesco Distributors, Inc. (formerly known as Invesco AIM Distributors, Inc.); Vice President and Secretary, Invesco Investment Services, Inc. (formerly known as Invesco AIM Investment Services, Inc.); Senior Vice President, Chief Legal Officer and Secretary, The Invesco Funds; Secretary and General Counsel, Invesco Investment Advisers LLC (formerly known as Van Kampen Asset Management); Secretary and General Counsel, Invesco Capital Markets, Inc. (formerly known as Van Kampen Funds Inc.); Chief Legal Officer, Invesco Exchange-Traded Fund Trust, Invesco Exchange-Traded Fund Trust II, Invesco India Exchange-Traded Fund Trust, Invesco Actively Managed Exchange-Traded Fund Trust, Invesco Actively Managed Exchange-Traded Commodity Fund Trust and Invesco Exchange-Traded Self-Indexed Fund Trust;; Secretary and Vice President, Harbourview Asset Management Corporation; Secretary and Vice President, OppenheimerFunds, Inc. and Invesco Managed Accounts, LLC; Secretary and Senior Vice President, OFI Global Institutional, Inc.; Secretary and Vice President, OFI SteelPath, Inc.; Secretary and Vice President, Oppenheimer Acquisition Corp.; Secretary and Vice President, Shareholder Services, Inc.; and Secretary and Vice President, Trinity Investment Management Corporation Formerly: Senior Vice President, Invesco Distributors, Inc.; Secretary and Vice President, Jemstep, Inc.; Head of Legal, Worldwide Institutional, Invesco Ltd.; Secretary and General Counsel, INVESCO Private Capital Investments, Inc.; Senior Vice President, Secretary and General Counsel, Invesco Management Group, Inc. (formerly known as Invesco AIM Management Group, Inc.); Assistant Secretary, INVESCO Asset Management (Bermuda) Ltd.; Secretary and General Counsel, Invesco Private Capital, Inc.; Assistant Secretary and General Counsel, INVESCO Realty, Inc.; Secretary and General Counsel, Invesco Senior Secured Management, Inc.; Secretary, Sovereign G./P. Holdings Inc.; Secretary, Invesco Indexing LLC; and Secretary, W.L. Ross & Co., LLC | | N/A | | N/A |
Andrew R. Schlossberg - 1974 Senior Vice President | | 2019 | | Senior Vice President, Invesco Group Services, Inc.; Head of the Americas and Senior Managing Director, Invesco Ltd.; Director and Senior Vice President, Invesco Advisers, Inc. (formerly known as Invesco Institutional (N.A.), Inc.) (registered investment adviser); Director and Chairman, Invesco Investment Services, Inc. (formerly known as Invesco AIM Investment Services, Inc.) (registered transfer agent); Senior Vice President, The Invesco Funds; and Director, Invesco Investment Advisers LLC (formerly known as Van Kampen Asset Management) Formerly: Director, President and Chairman, Invesco Insurance Agency, Inc.; Director, Invesco UK Limited; Director and Chief Executive, Invesco Asset Management Limited and Invesco Fund Managers Limited; Assistant Vice President, The Invesco Funds; Senior Vice President, Invesco Advisers, Inc. (formerly known as Invesco Institutional (N.A.), Inc.) (registered investment adviser); Director and Chief Executive, Invesco Administration Services Limited and Invesco Global Investment Funds Limited; Director, Invesco Distributors, Inc.; Head of EMEA, Invesco Ltd.; President, Invesco Actively Managed Exchange-Traded Commodity Fund Trust, Invesco Actively Managed Exchange-Traded Fund Trust, Invesco Exchange-Traded Fund Trust, Invesco Exchange-Traded Fund Trust II and Invesco India Exchange-Traded Fund Trust; and Managing Director and Principal Executive Officer, Invesco Capital Management LLC | | N/A | | N/A |
| | |
| T-4 | | Invesco Emerging Markets Innovators Fund |
Trustees and Officers–(continued)
| | | | | | | | |
Name, Year of Birth and Position(s) Held with the Trust | | Trustee and/or Officer Since | | Principal Occupation(s) During Past 5 Years | | Number of Funds in Fund Complex Overseen by Trustee | | Other Directorship(s) Held by Trustee During Past 5 Years |
| Officers–(continued) | | | | | | | | |
John M. Zerr - 1962 Senior Vice President | | 2006 | | Chief Operating Officer of the Americas; Senior Vice President, Invesco Advisers, Inc. (formerly known as Invesco Institutional (N.A.), Inc.) (registered investment adviser); Senior Vice President, Invesco Distributors, Inc. (formerly known as Invesco AIM Distributors, Inc.); Director and Vice President, Invesco Investment Services, Inc. (formerly known as Invesco AIM Investment Services, Inc.) Senior Vice President, The Invesco Funds; Managing Director, Invesco Capital Management LLC; Director, Invesco Investment Advisers LLC (formerly known as Van Kampen Asset Management); Senior Vice President, Invesco Capital Markets, Inc. (formerly known as Van Kampen Funds Inc.); Manager, Invesco Indexing LLC; Manager, Invesco Specialized Products, LLC; Member, Invesco Canada Funds Advisory Board; Director, President and Chief Executive Officer, Invesco Corporate Class Inc. (corporate mutual fund company); and Director, Chairman, President and Chief Executive Officer, Invesco Canada Ltd. (formerly known as Invesco Trimark Ltd./Invesco Trimark Ltèe) (registered investment adviser and registered transfer agent); President, Invesco, Inc.; President, Invesco Global Direct Real Estate Feeder GP Ltd.; President, Invesco IP Holdings (Canada) Ltd; President, Invesco Global Direct Real Estate GP Ltd.; President, Invesco Financial Services Ltd. / Services Financiers Invesco Ltée; and Director and Chairman, Invesco Trust Company Formerly: President, Trimark Investments Ltd/Services Financiers Invesco Ltee; Director and Senior Vice President, Invesco Insurance Agency, Inc.; Director and Senior Vice President, Invesco Management Group, Inc. (formerly known as Invesco AIM Management Group, Inc.); Secretary and General Counsel, Invesco Management Group, Inc. (formerly known as Invesco AIM Management Group, Inc.); Secretary, Invesco Investment Services, Inc. (formerly known as Invesco AIM Investment Services, Inc.); Chief Legal Officer and Secretary, The Invesco Funds; Secretary and General Counsel, Invesco Investment Advisers LLC (formerly known as Van Kampen Asset Management); Secretary and General Counsel, Invesco Capital Markets, Inc. (formerly known as Van Kampen Funds Inc.); Chief Legal Officer, Invesco Exchange-Traded Fund Trust, Invesco Exchange-Traded Fund Trust II, Invesco India Exchange-Traded Fund Trust, Invesco Actively Managed Exchange-Traded Fund Trust, Invesco Actively Managed Exchange-Traded Commodity Fund Trust and Invesco Exchange-Traded Self-Indexed Fund Trust; Secretary, Invesco Indexing LLC; Director, Secretary, General Counsel and Senior Vice President, Van Kampen Exchange Corp.; Director, Vice President and Secretary, IVZ Distributors, Inc. (formerly known as INVESCO Distributors, Inc.); Director and Vice President, INVESCO Funds Group, Inc.; Director and Vice President, Van Kampen Advisors Inc.; Director, Vice President, Secretary and General Counsel, Van Kampen Investor Services Inc.; Director and Secretary, Invesco Distributors, Inc. (formerly known as Invesco AIM Distributors, Inc.); Director, Senior Vice President, General Counsel and Secretary, Invesco AIM Advisers, Inc. and Van Kampen Investments Inc.; Director, Vice President and Secretary, Fund Management Company; Director, Senior Vice President, Secretary, General Counsel and Vice President, Invesco AIM Capital Management, Inc.; and Chief Operating Officer and General Counsel, Liberty Ridge Capital, Inc. (an investment adviser) | | N/A | | N/A |
Gregory G. McGreevey - 1962 Senior Vice President | | 2012 | | Senior Managing Director, Invesco Ltd.; Director, Chairman, President, and Chief Executive Officer, Invesco Advisers, Inc. (formerly known as Invesco Institutional (N.A.), Inc.) (registered investment adviser); Director, Invesco Mortgage Capital, Inc. and Invesco Senior Secured Management, Inc.; Senior Vice President, The Invesco Funds; President, SNW Asset Management Corporation and Invesco Managed Accounts, LLC; Chairman and Director, Invesco Private Capital, Inc.; Chairman and Director, INVESCO Private Capital Investments, Inc.; Chairman and Director, INVESCO Realty, Inc.; and Senior Vice President, Invesco Group Services, Inc. Formerly: Senior Vice President, Invesco Management Group, Inc. and Invesco Advisers, Inc.; Assistant Vice President, The Invesco Funds | | N/A | | N/A |
Adrien Deberghes - 1967 Principal Financial Officer, Treasurer and Vice President | | 2020 | | Head of the Fund Office of the CFO and Fund Administration; Vice President, Invesco Advisers, Inc.; Principal Financial Officer, Treasurer and Vice President, The Invesco Funds; Vice President, Invesco Exchange-Traded Fund Trust, Invesco Exchange-Traded Fund Trust II, Invesco India Exchange-Traded Fund Trust, Invesco Actively Managed Exchange-Traded Fund Trust, Invesco Actively Managed Exchange-Traded Commodity Fund Trust and Invesco Exchange-Traded Self-Indexed Fund Trust Formerly: Senior Vice President and Treasurer, Fidelity Investments | | N/A | | N/A |
Crissie M. Wisdom - 1969 Anti-Money Laundering Compliance Officer | | 2013 | | Anti-Money Laundering and OFAC Compliance Officer for Invesco U.S. entities including: Invesco Advisers, Inc. and its affiliates, Invesco Capital Markets, Inc., Invesco Distributors, Inc., Invesco Investment Services, Inc., The Invesco Funds, Invesco Capital Management, LLC, Invesco Trust Company; and Fraud Prevention Manager for Invesco Investment Services, Inc. | | N/A | | N/A |
| | |
| T-5 | | Invesco Emerging Markets Innovators Fund |
Trustees and Officers–(continued)
| | | | | | | | |
Name, Year of Birth and Position(s) Held with the Trust | | Trustee and/or Officer Since | | Principal Occupation(s) During Past 5 Years | | Number of Funds in Fund Complex Overseen by Trustee | | Other Directorship(s) Held by Trustee During Past 5 Years |
| Officers–(continued) | | | | | | | | |
Todd F. Kuehl - 1969 Chief Compliance Officer and Senior Vice President | | 2020 | | Chief Compliance Officer, Invesco Advisers, Inc. (registered investment adviser); and Chief Compliance Officer and Senior Vice President, The Invesco Funds Formerly: Managing Director and Chief Compliance Officer, Legg Mason (Mutual Funds); Chief Compliance Officer, Legg Mason Private Portfolio Group (registered investment adviser) | | N/A | | N/A |
James Bordewick, Jr. - 1959 Senior Vice President and Senior Officer | | 2022 | | Senior Vice President and Senior Officer, The Invesco Funds; and Chief Legal Officer, KingsCrowd, Inc. (research and analytical platform for investment in private capital markets) Formerly, Chief Operating Officer and Head of Legal and Regulatory, Netcapital (private capital investment platform); Managing Director, General Counsel of asset management and Chief Compliance Officer for asset management and private banking, Bank of America Corporation; Chief Legal Officer, Columbia Funds and BofA Funds; Senior Vice President and Associate General Counsel, MFS Investment Management; Chief Legal Officer, MFS Funds; Associate, Ropes & Gray; Associate, Gaston Snow & Ely Bartlett | | N/A | | N/A |
The Statement of Additional Information of the Trust includes additional information about the Fund’s Trustees and is available upon request, without charge, by calling 1.800.959.4246. Please refer to the Fund’s Statement of Additional Information for information on the Fund’s sub-advisers.
Office of the Fund
11 Greenway Plaza, Suite 1000
Houston, TX 77046-1173
Counsel to the Fund
Stradley Ronon Stevens & Young, LLP
2005 Market Street, Suite 2600
Philadelphia, PA 19103-7018
Investment Adviser
Invesco Advisers, Inc.
1555 Peachtree Street, N.E.
Atlanta, GA 30309
Counsel to the Independent Trustees
Goodwin Procter LLP
901 New York Avenue, N.W.
Washington, D.C. 20001
Distributor
Invesco Distributors, Inc.
11 Greenway Plaza, Suite 1000
Houston, TX 77046-1173
Transfer Agent
Invesco Investment Services, Inc.
11 Greenway Plaza, Suite 1000
Houston, TX 77046-1173
Auditors
PricewaterhouseCoopers LLP
1000 Louisiana Street, Suite 5800
Houston, TX 77002-5021
Custodian
State Street Bank and Trust Company
225 Franklin Street
Boston, MA 02110-2801
| | |
| T-6 | | Invesco Emerging Markets Innovators Fund |
(This page intentionally left blank)
(This page intentionally left blank)
(This page intentionally left blank)

Go paperless with eDelivery
Visit invesco.com/edelivery to enjoy the convenience and security of anytime electronic access to your investment documents.
With eDelivery, you can elect to have any or all of the following materials delivered straight to your inbox to download, save and print from your own computer:
∎ Fund reports and prospectuses
∎ Quarterly statements
∎ Daily confirmations
∎ Tax forms
Invesco mailing information
Send general correspondence to Invesco Investment Services, Inc., P.O. Box 219078, Kansas City, MO 64121-9078.
Important notice regarding delivery of security holder documents
To reduce Fund expenses, only one copy of most shareholder documents may be mailed to shareholders with multiple accounts at the same address (Householding). Mailing of your shareholder documents may be householded indefinitely unless you instruct us otherwise. If you do not want the mailing of these documents to be combined with those for other members of your household, please contact Invesco Investment Services, Inc. at 800 959 4246 or contact your financial institution. We will begin sending you individual copies for each account within 30 days after receiving your request.
Fund holdings and proxy voting information
The Fund provides a complete list of its portfolio holdings four times each year, at the end of each fiscal quarter. For the second and fourth quarters, the list appears, respectively, in the Fund’s semiannual and annual reports to shareholders. For the first and third quarters, the Fund files the list with the Securities and Exchange Commission (SEC) as an exhibit to its reports on Form N-PORT. The most recent list of portfolio holdings is available at invesco.com/completeqtrholdings. Shareholders can also look up the Fund’s Form N-PORT filings on the SEC website, sec.gov. The SEC file numbers for the Fund are shown below.
A description of the policies and procedures that the Fund uses to determine how to vote proxies relating to portfolio securities is available without charge, upon request, from our Client Services department at 800 959 4246, or at invesco.com/corporate/about-us/esg. The information is also available on the SEC website, sec.gov.
Information regarding how the Fund voted proxies related to its portfolio securities during the most recent 12-month period ended June 30 is available at invesco.com/proxysearch. This information is also available on the SEC website, sec.gov.
Invesco Advisers, Inc. is an investment adviser; it provides investment advisory services to individual and institutional clients and does not sell securities. Invesco Distributors, Inc. is the US distributor for Invesco Ltd.’s retail mutual funds, exchange-traded funds and institutional money market funds. Both are wholly owned, indirect subsidiaries of Invesco Ltd.
| | | | |
| SEC file number(s): 811-05426 and 033-19338 | | Invesco Distributors, Inc. | | O-EMI-AR-1 |

| | |
| | |
| Annual Report to Shareholders | | October 31, 2022 |
Invesco Emerging Markets Local Debt Fund
Nasdaq:
A: OEMAX ∎ C: OEMCX ∎ R: OEMNX ∎ Y: OEMYX ∎ R5: EMLDX ∎ R6: OEMIX
Management’s Discussion of Fund Performance
| | | | |
| |
Performance summary | |
For the fiscal year ended October 31, 2022, Class A shares of Invesco Emerging Markets Local Debt Fund (the Fund), at net asset value (NAV), outperformed the JP Morgan Government Bond Index - Emerging Markets (GBI-EM) Global Diversified Index. | |
Your Fund’s long-term performance appears later in this report. | |
| |
Fund vs. Indexes | |
Total returns, 10/31/21 to 10/31/22, at net asset value (NAV). Performance shown does not include applicable contingent deferred sales charges (CDSC) or front-end sales charges, which would have reduced performance. | |
Class A Shares | | | -16.80 | % |
Class C Shares | | | -17.45 | |
Class R Shares | | | -17.02 | |
Class Y Shares | | | -16.59 | |
Class R5 Shares | | | -16.47 | |
Class R6 Shares | | | -16.47 | |
JP Morgan Government Bond Index - Emerging Markets (GBI-EM) Global Diversified Index▼ | | | -20.27 | |
Source(s): ▼RIMES Technologies Corp. | | | | |
Market conditions and your Fund
During the fiscal year ended October 31, 2022, global fixed-income markets remained volatile due to a series of shocks to financial markets from the Russia-Ukraine war, high commodity prices, high inflation, rapid monetary policy tightening, recession fears and slowing growth in China. Throughout the year, inflation data continued to surprise on the upside, leading both developed market (DM) and emerging market (EM) central banks to hike interest rates aggressively, prompting negative returns across fixed-income markets. In particular, the US Federal Reserve (the Fed) raised policy rates (which have a global impact) during the fiscal year at a pace and scale not seen in the past two decades. This prompted the US dollar to rise considerably over the fiscal year and generated uncertainty on the degree to which EM central banks would need to continue hiking despite getting an earlier start last year.
Towards the end of 2021, concerns about inflation were already heightened, although the Fed left policy rates unchanged in the quarter. They indicated accommodative policies were coming to an end and announced the reduction of their monthly bond purchase program. In the first quarter of 2022, conflict and uncertainty drove sharp moves across risk assets following Russia’s invasion of Ukraine. As commodity prices spiked, this exacerbated existing inflationary pressures and forced several central banks to adopt a more hawkish stance. Global monetary policy divergence persisted, as most EMs (aside from China) seemed closer to the end of their interest rate hiking cycles, while various developed markets were in different stages. Elevated inflation and a tight labor market led the Fed to officially commence its rate hiking cycle, and the Bank of England raised rates twice after their initial increase in December,
while China signaled a potential increase in its monetary policy accommodation. The US dollar ended the quarter 2.3% higher.1
In the second quarter of 2022, capital markets were preoccupied with surging inflation that prompted the Fed and subsequently the European Central Bank and Reserve Bank of Australia, to shift toward tighter monetary policy. EM central banks across Latin America and Central Europe followed suit, alongside elevated food and energy prices. Toward the end of June, market focus shifted from inflation fears and the prospect of increasingly aggressive interest rate hikes to recession fears and the anticipation of lower rates. Though US and European economies were already decelerating, growth in Asia remained relatively resilient, supported by post-COVID-19 reopenings, despite some drag from lingering lockdowns in China, which is typically the region’s main driver. The US dollar rose considerably in April, fell slightly in May and then rose again in June, ending the quarter almost 6.5% higher.1
The third quarter of 2022 began with a relief rally in July as markets anticipated slowing inflation and possible rate cuts by the Fed in 2023. This narrative quickly reversed course in August and September on the back of continued geopolitical uncertainty, rising concerns of a global economic slowdown and persistent elevated inflation. As a result, central banks continued their aggressive rate hiking cycles, with the Fed hiking 1.5%, the European Central Bank hiking 1.25% and the Bank of England hiking 1%. In EMs, central banks in Asia, Central and Eastern Europe and Latin America all raised their interest rates, though it seemed like central banks such as Brazil and Hungary might be reaching the end of their hiking cycles. While global growth indicators continued to slow, European concerns about an energy crisis heading into winter lingered and China’s lackluster
re-opening dynamics remained intact, central banks continued to prioritize bringing down inflation over supporting growth. These conditions contributed to the US dollar’s rapid rise, increasing slightly in July and reaching 20-year highs in August and September, ending the quarter almost 7.1% higher.1
Over the fiscal year, underweight positioning in Russia, Egypt and Romania contributed the most to the Fund’s relative performance compared to the JP Morgan Government Bond Index – Emerging Markets (GBI-EM) Global Diversified Index, while positioning in Indonesia, Peru and Poland detracted the most. Specific positive contributors to relative Fund performance included positioning in the Turkish Lira, Egyptian Pound and Brazilian Real. Conversely, interest rate positioning in Colombia and Turkey and positioning in the South African Rand detracted from relative Fund performance.
While the absolute return of the asset class year-to-date has experienced a large decline over the past fiscal year, the EM local asset class has done well on a relative basis, outperforming EM hard currency and some US duration-based strategies. We have seen considerable volatility this fiscal year from the rapid repricing of inflation expectations and the path of US interest rates (which have a global impact), yet we anticipate the value created from an income and total return perspective in EMs is meaningful. A year ago, EM monetary policy rates averaged around 3.25%, while today, the average policy rate is over 6.75%,1 though there is divergence across regions. We believe the conditions are aligning for EMs to potentially outperform over the next two to three years.
After hiking considerably in 2021, EM central banks may be approaching their interest rate peaks (having started their hiking cycles ahead of developed markets), and we expect the growth picture for EMs to remain stronger than that of the US and Europe, where a growth revival could take some time. While uncertainty on the path of US interest rates has prevented markets from unlocking the value we see in EMs so far, we believe the path of US interest rates should soon become clearer and inflation expectations in EMs should become more anchored. With average EM inflation already lower than US inflation, this makes the real-rate differential compelling. Additionally, with the US dollar recently reaching 40-year highs and the Fed getting closer to the end of its hiking cycle, we may be seeing signs of stability and reversal. A decline in the US dollar could serve as a tailwind for EMs.
Overall, we believe individual country dynamics will drive performance going forward and we expect the dispersion in returns between countries will be larger than in the past, which argues for an actively managed approach such as ours. We believe this is a fertile landscape to extract performance alpha in the asset class, particularly as the Fed’s
| | |
| 2 | | Invesco Emerging Markets Local Debt Fund |
monetary policy trajectory becomes more visible, and we remain focused on capitalizing on it.
Please note that we implemented our strategy using derivative instruments, including futures, forwards, swaps and options. Therefore, a portion of the performance of the strategy, both positive and negative, can be attributed to these instruments. Derivatives can be a cost-effective way to gain or hedge exposure to certain risks. However, derivatives may amplify traditional investment risks through the creation of leverage and may be less liquid than traditional securities.
Part of the Fund’s strategy to manage credit and currency risk in the portfolio during the fiscal year entailed purchasing and selling credit and currency derivatives. We sought to manage credit market risk by purchasing and selling protection through credit default swaps at various points throughout the fiscal year. The currency management was carried out via currency forwards and options on an as-needed basis and we believe this strategy was effective in managing the currency positioning within the Fund.
We wish to remind you that the Fund is subject to interest rate risk, meaning when interest rates rise, the value of fixed-income securities tends to fall. The risk may be greater in the current market environment. The degree to which the value of fixed-income securities may decline due to rising interest rates may vary depending on the speed and magnitude of the increase in interest rates, as well as individual security characteristics such as price, maturity, duration and coupon, and market forces such as supply and demand for similar securities. We are monitoring interest rates and the market, economic and geopolitical factors that may impact the direction, speed and magnitude of changes to interest rates across the maturity spectrum, including the potential impact of monetary policy changes by the Fed and certain foreign central banks. If interest rates rise or fall faster than expected, markets may experience increased volatility, which may affect the value and/or liquidity of certain investments held by the Fund.
Thank you for investing in Invesco Emerging Markets Local Debt Fund.
Portfolio manager(s):
Hemant Baijal
Wim Vandenhoeck
The views and opinions expressed in management’s discussion of Fund performance are those of Invesco Advisers, Inc. and its affiliates. These views and opinions are subject to change at any time based on factors such as market and economic conditions. These views and opinions may not be relied upon as investment advice or recommendations, or as an offer for a particular security. The information is not a complete analysis of every aspect of any market, country, industry, security or the Fund. Statements of fact are from sources considered reliable, but Invesco Advisers, Inc. makes no representation or warranty as to their
completeness or accuracy. Although historical performance is no guarantee of future results, these insights may help you understand our investment management philosophy.
See important Fund and, if applicable, index disclosures later in this report.
| | |
| 3 | | Invesco Emerging Markets Local Debt Fund |
Your Fund’s Long-Term Performance
Results of a $10,000 Investment – Oldest Share Class(es)
Fund and index data from 10/31/12
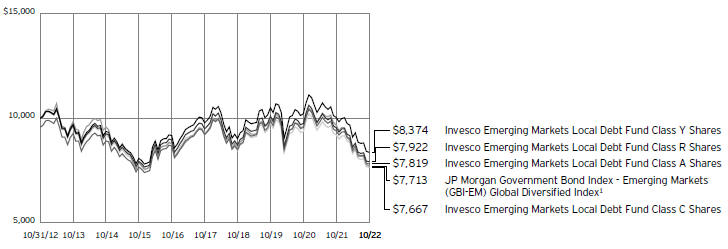
1 Source: RIMES Technologies Corp.
Past performance cannot guarantee future results.
The data shown in the chart include reinvested distributions, applicable sales charges and Fund expenses including management
fees. Index results include reinvested dividends, but they do not reflect sales charges. Performance of the peer group, if applicable, reflects fund expenses and management fees;
performance of a market index does not. Performance shown in the chart does not reflect deduction of taxes a shareholder would pay on Fund distributions or sale of Fund shares.
| | |
| 4 | | Invesco Emerging Markets Local Debt Fund |
| | | | |
| |
Average Annual Total Returns | |
As of 10/31/22, including maximum applicable sales charges | |
| |
Class A Shares | | | | |
Inception (6/30/10) | | | -0.43 | % |
10 Years | | | -2.43 | |
5 Years | | | -4.07 | |
1 Year | | | -20.29 | |
| |
Class C Shares | | | | |
Inception (6/30/10) | | | -0.58 | % |
10 Years | | | -2.62 | |
5 Years | | | -4.04 | |
1 Year | | | -18.24 | |
| |
Class R Shares | | | | |
Inception (6/30/10) | | | -0.37 | % |
10 Years | | | -2.30 | |
5 Years | | | -3.56 | |
1 Year | | | -17.02 | |
| |
Class Y Shares | | | | |
Inception (6/30/10) | | | 0.17 | % |
10 Years | | | -1.76 | |
5 Years | | | -3.06 | |
1 Year | | | -16.59 | |
| |
Class R5 Shares | | | | |
10 Years | | | -1.91 | % |
5 Years | | | -3.05 | |
1 Year | | | -16.47 | |
| |
Class R6 Shares | | | | |
Inception (9/28/12) | | | -1.53 | % |
10 Years | | | -1.66 | |
5 Years | | | -2.91 | |
1 Year | | | -16.47 | |
Effective May 24, 2019, Class A, Class C, Class R, Class Y and Class I shares of the Oppenheimer Emerging Markets Local Debt Fund, (the predecessor fund), were reorganized into Class A, Class C, Class R, Class Y and Class R6 shares, respectively, of the Invesco Oppenheimer Emerging Markets Local Debt Fund. Note: The Fund was subsequently renamed the Invesco Emerging Markets Local Debt Fund (the Fund). Returns shown above, for periods ending on or prior to May 24, 2019, for Class A, Class C, Class R, Class Y and Class R6 shares are those for Class A, Class C, Class R, Class Y and Class I shares of the predecessor fund. Share class returns will differ from the predecessor fund because of different expenses.
Class R5 shares incepted on May 24, 2019. Performance shown on and prior to that date is that of the predecessor fund’s Class A shares and includes the 12b-1 fees applicable to Class A shares.
The performance data quoted represent past performance and cannot guarantee future results; current performance may be lower or higher. Please visit invesco.com/ performance for the most recent month-end performance. Performance figures reflect reinvested distributions, changes in net asset value and the effect of the maximum sales charge unless otherwise stated.
Performance figures do not reflect deduction of taxes a shareholder would pay on Fund distributions or sale of Fund shares. Investment return and principal value will fluctuate so that you may have a gain or loss when you sell shares.
Class A share performance reflects the maximum 4.25% sales charge, and Class C share performance reflects the applicable contingent deferred sales charge (CDSC) for the period involved. The CDSC on Class C shares is 1% for the first year after purchase. Class R, Class Y, Class R5 and Class R6 shares do not have a front-end sales charge or a CDSC; therefore, performance is at net asset value.
The performance of the Fund’s share classes will differ primarily due to different sales charge structures and class expenses.
Fund performance reflects any applicable fee waivers and/or expense reimbursements. Had the adviser not waived fees and/or reimbursed expenses currently or in the past, returns would have been lower. See current prospectus for more information.
| | |
| 5 | | Invesco Emerging Markets Local Debt Fund |
Supplemental Information
Invesco Emerging Markets Local Debt Fund’s investment objective is to seek total return.
| ∎ | Unless otherwise stated, information presented in this report is as of October 31, 2022, and is based on total net assets. |
| ∎ | Unless otherwise noted, all data is provided by Invesco. |
| ∎ | To access your Fund’s reports/prospectus, visit invesco.com/fundreports. |
About indexes used in this report
| ∎ | The JP Morgan Government Bond Index - Emerging Markets (GBI-EM) Global Diversified Index is a comprehensive global local emerging markets index comprising liquid, fixed-rate, domestic currency government bonds. |
| ∎ | The Fund is not managed to track the performance of any particular index, including the index(es) described here, and consequently, the performance of the Fund may deviate significantly from the performance of the index(es). |
| ∎ | A direct investment cannot be made in an index. Unless otherwise indicated, index results include reinvested dividends, and they do not reflect sales charges. Performance of the peer group, if applicable, reflects fund expenses; performance of a market index does not. |
|
|
This report must be accompanied or preceded by a currently effective Fund prospectus, which contains more complete information, including sales charges and expenses. Investors should read it carefully before investing. |
|
| NOT FDIC INSURED | MAY LOSE VALUE | NO BANK GUARANTEE |
| | |
| 6 | | Invesco Emerging Markets Local Debt Fund |
Fund Information
Portfolio Composition
| | | | | |
| By sector | | % of total net assets |
| |
Sovereign Debt | | | | 71.28 | % |
| |
Financials | | | | 2.02 | |
| |
Other Sectors, Each Less than 2% of Net Assets | | | | 4.08 | |
| |
Money Market Funds Plus Other Assets Less Liabilities | | | | 22.62 | |
Top Five Debt Issuers*
| | | | | | | |
| | | | | % of total net assets |
| | |
| 1. | | Republic of South Africa Government Bond | | | | 12.31 | % |
| | |
| 2. | | Malaysia Government Bond | | | | 9.90 | |
| | |
| 3. | | Thailand Government Bond | | | | 7.58 | |
| | |
| 4. | | Colombian TES | | | | 7.38 | |
| | |
| 5. | | Indonesia Treasury Bond | | | | 7.00 | |
The Fund’s holdings are subject to change, and there is no assurance that the Fund will continue to hold any particular security.
| * | Excluding money market fund holdings, if any. |
Data presented here are as of October 31, 2022.
| | |
| 7 | | Invesco Emerging Markets Local Debt Fund |
Schedule of Investments
October 31, 2022
| | | | | | | | |
| | | | | Principal Amount | | | Value |
Non-U.S. Dollar Denominated Bonds & Notes–75.84%(a) |
Brazil–3.57% | | | | | | | | |
| | | |
Brazil Notas do Tesouro Nacional, 10.00%, 01/01/2027 | | BRL | | | 15,000,000 | | | $ 2,761,467 |
| | | |
Chile–2.93% | | | | | | | | |
| | | |
Bonos de la Tesoreria de la Republica, 0.00%, 03/01/2025 | | CLP | | | 1,211,012,250 | | | 1,178,981 |
| | | |
Bonos de la Tesoreria de la Republica en pesos, 2.30%, 10/01/2028(b) | | CLP | | | 1,300,000,000 | | | 1,088,078 |
| | | |
| | | | | | | | | 2,267,059 |
| | | |
China–3.71% | | | | | | | | |
| | | |
China Development Bank, Series 2110, 3.41%, 06/07/2031 | | CNY | | | 6,000,000 | | | 854,116 |
| | | |
China Government Bond, 3.72%, 04/12/2051 | | CNY | | | 4,000,000 | | | 606,998 |
| | | |
Export-Import Bank of China (The), Series 2105, 3.22%, 05/14/2026 | | CNY | | | 10,000,000 | | | 1,407,173 |
| | | |
| | | | | | | | | 2,868,287 |
| | | |
Colombia–8.68% | | | | | | | | |
Colombian TES, | | | | | | | | |
| | | |
Series B, 5.75%, 11/03/2027 | | COP | | | 24,100,000,000 | | | 3,542,708 |
| | | |
Series B, 7.25%, 10/18/2034 | | COP | | | 3,500,000,000 | | | 443,834 |
| | | |
Series B, 9.25%, 05/28/2042 | | COP | | | 2,000,000,000 | | | 280,588 |
| | | |
Series B, 7.25%, 10/26/2050 | | COP | | | 13,300,000,000 | | | 1,445,157 |
| | | |
PA Autopista Rio Magdalena, 6.05%, 06/15/2036(b) | | COP | | | 6,500,000,000 | | | 1,010,624 |
| | | |
| | | | | | | | | 6,722,911 |
| | | |
Czech Republic–4.49% | | | | | | | | |
Czech Republic Government Bond, | | | | | | | | |
| | | |
Series 100, 0.25%, 02/10/2027 | | CZK | | | 20,000,000 | | | 635,578 |
| | | |
Series 105, 2.75%, 07/23/2029 | | CZK | | | 20,000,000 | | | 668,379 |
| | | |
Series 125, 1.50%, 04/24/2040 | | CZK | | | 2,000,000 | | | 44,031 |
| | | |
Series 148, 6.00%, 02/26/2026 | | CZK | | | 20,000,000 | | | 805,071 |
| | | |
Series 49, 4.20%, 12/04/2036(b) | | CZK | | | 14,000,000 | | | 481,589 |
| | | |
Series 78, 2.50%, 08/25/2028(b) | | CZK | | | 25,000,000 | | | 842,973 |
| | | |
| | | | | | | | | 3,477,621 |
| | | |
India–3.11% | | | | | | | | |
| | | |
India Government Bond, 7.27%, 04/08/2026 | | INR | | | 200,000,000 | | | 2,411,486 |
| | | | | | | | |
| | | | | Principal Amount | | | Value |
Indonesia–7.00% | | | | | | | | |
Indonesia Treasury Bond, | | | | | | | | |
| | | |
Series FR91, 6.38%, 04/15/2032 | | IDR | | | 15,000,000,000 | | | $ 889,623 |
| | | |
Series FR92, 7.13%, 06/15/2042 | | IDR | | | 19,000,000,000 | | | 1,160,276 |
| | | |
Series FR95, 6.38%, 08/15/2028 | | IDR | | | 30,000,000,000 | | | 1,835,237 |
| | | |
Series FR96, 7.00%, 02/15/2033 | | IDR | | | 25,000,000,000 | | | 1,533,467 |
| | | |
| | | | | | | | | 5,418,603 |
| | | |
Malaysia–9.90% | | | | | | | | |
Malaysia Government Bond, | | | | | | | | |
| | | |
Series 0122, 3.58%, 07/15/2032 | | MYR | | | 5,000,000 | | | 992,942 |
| | | |
Series 0519, 3.76%, 05/22/2040 | | MYR | | | 6,500,000 | | | 1,188,235 |
| | | |
Series 115, 3.96%, 09/15/2025 | | MYR | | | 8,000,000 | | | 1,695,177 |
| | | |
Series 120, 4.07%, 06/15/2050 | | MYR | | | 5,000,000 | | | 915,968 |
| | | |
Series 513, 3.73%, 06/15/2028 | | MYR | | | 14,000,000 | | | 2,869,350 |
| | | |
| | | | | | | | | 7,661,672 |
| | | |
Mexico–3.85% | | | | | | | | |
| | | |
Mexican Bonos, Series M, 7.75%, 05/29/2031 | | MXN | | | 65,000,000 | | | 2,891,023 |
| | | |
Red de Carreteras de Occidente S.A.B. de C.V., 9.00%, 06/10/2028(b) | | MXN | | | 1,840,000 | | | 92,583 |
| | | |
| | | | | | | | | 2,983,606 |
| | | |
Peru–2.02% | | | | | | | | |
Peru Government Bond, | | | | | | | | |
| | | |
5.94%, 02/12/2029 | | PEN | | | 2,000,000 | | | 450,787 |
| | | |
6.15%, 08/12/2032 | | PEN | | | 4,350,000 | | | 931,321 |
| | | |
5.35%, 08/12/2040 | | PEN | | | 1,000,000 | | | 178,021 |
| | | |
| | | | | | | | | 1,560,129 |
| | | |
Poland–4.03% | | | | | | | | |
Republic of Poland Government Bond, | | | | | | |
| | | |
Series 0727, 2.50%, 07/25/2027 | | PLN | | | 6,000,000 | | | 970,235 |
| | | |
Series 1029, 2.75%, 10/25/2029 | | PLN | | | 9,000,000 | | | 1,347,908 |
| | | |
Series 432, 1.75%, 04/25/2032 | | PLN | | | 6,600,000 | | | 800,928 |
| | | |
| | | | | | | | | 3,119,071 |
| | | |
Romania–0.62% | | | | | | | | |
| | | |
Romania Government Bond, Series 15, 4.75%, 10/11/2034 | | RON | | | 3,500,000 | | | 481,205 |
| | | |
South Africa–13.08% | | | | | | | | |
| | | |
Eskom Holdings SOC Ltd., Series ES23, 10.00%, 01/25/2023 | | ZAR | | | 11,000,000 | | | 598,749 |
See accompanying Notes to Financial Statements which are an integral part of the financial statements.
| | |
| 8 | | Invesco Emerging Markets Local Debt Fund |
| | | | | | | | |
| | | | | Principal Amount | | | Value |
South Africa–(continued) | | | |
Republic of South Africa Government Bond, | | | | | | | | |
| | | |
Series 2030, 8.00%, 01/31/2030 | | ZAR | | | 65,000,000 | | | $ 3,038,789 |
| | | |
Series 2037, 8.50%, 01/31/2037 | | ZAR | | | 65,000,000 | | | 2,724,913 |
| | | |
Series 2040, 9.00%, 01/31/2040 | | ZAR | | | 45,000,000 | | | 1,929,962 |
| | | |
Series R186, 10.50%, 12/21/2026 | | ZAR | | | 20,000,000 | | | 1,142,674 |
| | | |
Series R209, 6.25%, 03/31/2036 | | ZAR | | | 20,000,000 | | | 690,793 |
| | | |
| | | | | | | | | 10,125,880 |
| | | |
Supranational– 0.06% | | | | | | | | |
| | | |
International Finance Corp., 0.00%, 02/15/2029(b)(c) | | TRY | | | 7,300,000 | | | 47,206 |
| | | |
Thailand–7.58% | | | | | | | | |
Thailand Government Bond, | | | | | | | | |
| | | |
1.00%, 06/17/2027 | | THB | | | 60,000,000 | | | 1,464,697 |
| | | |
2.88%, 12/17/2028 | | THB | | | 40,000,000 | | | 1,052,193 |
| | | |
3.78%, 06/25/2032 | | THB | | | 50,000,000 | | | 1,374,703 |
| | | |
1.59%, 12/17/2035 | | THB | | | 95,000,000 | | | 1,973,604 |
| | | |
| | | | | | | | | 5,865,197 |
| | | |
Uruguay–1.21% | | | | | | | | |
| | | |
Uruguay Government International Bond, 4.38%, 12/15/2028 | | UYU | | | 36,305,307 | | | 938,515 |
| |
Total Non-U.S. Dollar Denominated Bonds & Notes
(Cost $72,186,094) | | | 58,709,915 |
| | |
| Investment Abbreviations: |
| |
| BRL | | - Brazilian Real |
| CLP | | - Chile Peso |
| CNY | | - Chinese Yuan Renminbi |
| COP | | - Colombia Peso |
| CZK | | - Czech Koruna |
| IDR | | - Indonesian Rupiah |
| INR | | - Indian Rupee |
| MXN | | - Mexican Peso |
| MYR | | - Malaysian Ringgit |
| PEN | | - Peruvian Sol |
| PLN | | - Polish Zloty |
| RON | | - Romania New Leu |
| THB | | - Thai Baht |
| TRY | | - Turkish Lira |
| UYU | | - Uruguay Peso |
| ZAR | | - South African Rand |
| | | | | | |
| | | Principal Amount | | Value | |
U.S. Dollar Denominated Bonds & Notes–0.75% | |
Egypt–0.61% | | | | | | |
| | |
Egypt Government International Bond, 5.75%, 05/29/2024(b) | | $ 500,000 | | $ | 473,523 | |
| | |
United States–0.14% | | | | | | |
| | |
United States International Development Finance Corp., Series 4, 3.13%, 04/15/2028 | | 120,000 | | | 111,011 | |
| |
Total U.S. Dollar Denominated Bonds & Notes
(Cost $617,223) | | | 584,534 | |
| | |
| | | Shares | | | |
Money Market Funds–19.26% | |
| | |
Invesco Government & Agency Portfolio, Institutional Class, 3.07%(d)(e) | | 5,217,146 | | | 5,217,146 | |
| | |
Invesco Liquid Assets Portfolio, Institutional Class, 3.03%(d)(e) | | 3,726,465 | | | 3,727,211 | |
| | |
Invesco Treasury Portfolio, Institutional Class, 3.08%(d)(e) | | 5,962,453 | | | 5,962,453 | |
| |
Total Money Market Funds (Cost $14,906,495) | | | 14,906,810 | |
| | |
Options Purchased–0.79% | | | | | | |
| | |
(Cost $573,389)(f) | | | | | 613,745 | |
| |
TOTAL INVESTMENTS IN SECURITIES–96.64%
(Cost $88,283,201) | | | 74,815,004 | |
| |
OTHER ASSETS LESS LIABILITIES–3.36% | | | 2,598,012 | |
| | |
NET ASSETS–100.00% | | | | $ | 77,413,016 | |
See accompanying Notes to Financial Statements which are an integral part of the financial statements.
| | |
| 9 | | Invesco Emerging Markets Local Debt Fund |
Notes to Schedule of Investments:
| (a) | Foreign denominated security. Principal amount is denominated in the currency indicated. |
| (b) | Security purchased or received in a transaction exempt from registration under the Securities Act of 1933, as amended (the “1933 Act”). The security may be resold pursuant to an exemption from registration under the 1933 Act, typically to qualified institutional buyers. The aggregate value of these securities at October 31, 2022 was $4,036,576, which represented 5.21% of the Fund’s Net Assets. |
| (c) | Zero coupon bond issued at a discount. |
| (d) | Affiliated issuer. The issuer and/or the Fund is a wholly-owned subsidiary of Invesco Ltd., or is affiliated by having an investment adviser that is under common control of Invesco Ltd. The table below shows the Fund’s transactions in, and earnings from, its investments in affiliates for the fiscal year ended October 31, 2022. |
| | | | | | | | | | | | | | | | | | | | | | | | | | | | |
| | | Value
October 31, 2021 | | | Purchases at Cost | | | Proceeds from Sales | | | Change in Unrealized Appreciation | | | Realized Gain (Loss) | | | Value
October 31, 2022 | | | Dividend Income | |
| Investments in Affiliated Money Market Funds: | | | | | | | | | | | | | | | | | | | | | | | | | | | | |
Invesco Government & Agency Portfolio, Institutional Class | | | $ 5,607,012 | | | $ | 49,194,457 | | | $ | (49,584,323 | ) | | | $ - | | | $ | - | | | | $ 5,217,146 | | | | $12,526 | |
Invesco Liquid Assets Portfolio, Institutional Class | | | 4,280,399 | | | | 35,138,898 | | | | (35,691,960 | ) | | | 402 | | | | (528) | | | | 3,727,211 | | | | 11,240 | |
Invesco Treasury Portfolio, Institutional Class | | | 6,408,013 | | | | 56,222,237 | | | | (56,667,797 | ) | | | - | | | | - | | | | 5,962,453 | | | | 16,584 | |
Total | | | $16,295,424 | | | $ | 140,555,592 | | | $ | (141,944,080 | ) | | | $402 | | | $ | (528) | | | | $14,906,810 | | | | $40,350 | |
| (e) | The rate shown is the 7-day SEC standardized yield as of October 31, 2022. |
| (f) | The table below details options purchased. |
| | | | | | | | | | | | | | | | | | | | | | |
| Open Over-The-Counter Foreign Currency Options Purchased |
| Description | | Type of
Contract | | Counterparty | | Expiration
Date | | | Exercise Price | | | Notional Value | | | Value |
| | | | | | | | |
Currency Risk | | | | | | | | | | | | | | | | | | | | | | |
| | | | | | | | |
USD versus CNH | | Call | | J.P. Morgan Chase Bank, N.A. | | | 12/28/2022 | | | CNH | | | 7.38 | | | USD | | | 4,050,000 | | | $ 48,900 |
| | | | | | | | |
USD versus CNH | | Call | | Morgan Stanley and Co. International PLC | | | 01/19/2023 | | | CNH | | | 7.25 | | | USD | | | 3,750,000 | | | 78,630 |
| | | |
Subtotal – Foreign Currency Call Options Purchased | | | | | | | | | 127,530 |
| | | | | | | | |
Currency Risk | | | | | | | | | | | | | | | | | | | | | | |
| | | | | | | | |
EUR versus HUF | | Put | | J.P. Morgan Chase Bank, N.A. | | | 12/12/2022 | | | HUF | | | 430.00 | | | EUR | | | 3,000,000 | | | 134,508 |
| | | | | | | | |
USD versus BRL | | Put | | Goldman Sachs International | | | 01/26/2023 | | | BRL | | | 5.05 | | | USD | | | 4,000,000 | | | 84,504 |
| | | | | | | | |
USD versus CLP | | Put | | Morgan Stanley and Co. International PLC | | | 11/09/2022 | | | CLP | | | 772.00 | | | USD | | | 4,500,000 | | | 4 |
| | | | | | | | |
USD versus MXN | | Put | | Bank of America, N.A. | | | 01/03/2023 | | | MXN | | | 19.95 | | | USD | | | 2,800,000 | | | 45,987 |
| | | | | | | | |
USD versus MXN | | Put | | J.P. Morgan Chase Bank, N.A. | | | 12/07/2022 | | | MXN | | | 20.00 | | | USD | | | 4,100,000 | | | 63,829 |
| | | | | | | | |
USD versus THB | | Put | | Standard Chartered Bank PLC | | | 12/14/2022 | | | THB | | | 35.85 | | | USD | | | 4,500,000 | | | 4,707 |
| | | | | | | | |
USD versus ZAR | | Put | | J.P. Morgan Chase Bank, N.A. | | | 02/21/2023 | | | ZAR | | | 16.15 | | | USD | | | 3,500,000 | | | 7,182 |
| | | |
Subtotal – Foreign Currency Put Options Purchased | | | | | | | | | 340,721 |
| | | |
Total Foreign Currency Options Purchased | | | | | | | | | $468,251 |
| | | | | | | | | | | | | | | | | | | | | | | | |
| | | | | Open Over-The-Counter Interest Rate Swaptions Purchased | | | | | | |
| Description | | Type of
Contract | | Counterparty | | Exercise
Rate | | | Pay/ Receive Exercise Rate | | Floating Rate
Index | | Payment Frequency | | Expiration Date | | | Notional Value | | | Value |
| | | | | | | | |
Interest Rate Risk | | | | | | | | | | | | | | | | | | | | | | |
| | | | | | | | | |
2 Year Interest Rate Swap | | Put | | J.P. Morgan Chase Bank, N.A. | | | 7.71% | | | Pay | | 6 Month WIBOR | | Semi-Annually | | | 12/09/2022 | | | | PLN 65,800,000 | | | $145,494 |
See accompanying Notes to Financial Statements which are an integral part of the financial statements.
| | |
| 10 | | Invesco Emerging Markets Local Debt Fund |
| | | | | | | | | | | | | | | | | | | | | | | | |
| Open Over-The-Counter Foreign Currency Options Written | |
|
| |
| Description | | Type of Contract | | Counterparty | | Expiration
Date | | | Exercise Price | | | Notional Value | | | Value | |
|
| |
Currency Risk | | | | | | | | | | | | | | | | | | | | | | | | |
|
| |
USD versus BRL | | Call | | Goldman Sachs International | | | 03/24/2023 | | | BRL | | | 6.05 | | | USD | | | 2,000,000 | | | $ | (27,518 | ) |
|
| |
USD versus CLP | | Call | | Morgan Stanley and Co. International PLC | | | 12/15/2022 | | | CLP | | | 1,017.00 | | | USD | | | 3,000,000 | | | | (37,281 | ) |
|
| |
USD versus CLP | | Call | | Morgan Stanley and Co. International PLC | | | 02/10/2023 | | | CLP | | | 948.00 | | | USD | | | 3,000,000 | | | | (158,025 | ) |
|
| |
USD versus CNH | | Call | | J.P. Morgan Chase Bank, N.A. | | | 12/28/2022 | | | CNH | | | 7.65 | | | USD | | | 4,050,000 | | | | (16,042 | ) |
|
| |
USD versus CNH | | Call | | Morgan Stanley and Co. International PLC | | | 01/19/2023 | | | CNH | | | 7.45 | | | USD | | | 3,750,000 | | | | (39,116 | ) |
|
| |
USD versus MXN | | Call | | Bank of America, N.A. | | | 12/15/2022 | | | MXN | | | 21.02 | | | USD | | | 3,000,000 | | | | (12,471 | ) |
|
| |
USD versus MXN | | Call | | J.P. Morgan Chase Bank, N.A. | | | 12/07/2022 | | | MXN | | | 21.30 | | | USD | | | 4,100,000 | | | | (9,377 | ) |
|
| |
USD versus THB | | Call | | Standard Chartered Bank PLC | | | 12/14/2022 | | | THB | | | 37.60 | | | USD | | | 4,500,000 | | | | (84,515 | ) |
|
| |
Subtotal – Foreign Currency Call Options Written | | | | | | | | | | (384,345 | ) |
|
| |
Currency Risk | | | | | | | | | | | | | | | | | | | | | | | | |
|
| |
EUR versus HUF | | Put | | J.P. Morgan Chase Bank, N.A. | | | 12/12/2022 | | | HUF | | | 415.00 | | | EUR | | | 4,500,000 | | | | (91,633 | ) |
|
| |
USD versus CLP | | Put | | Morgan Stanley and Co. International PLC | | | 12/15/2022 | | | CLP | | | 891.00 | | | USD | | | 3,000,000 | | | | (23,811 | ) |
|
| |
USD versus MXN | | Put | | Bank of America, N.A. | | | 12/15/2022 | | | MXN | | | 19.56 | | | USD | | | 3,000,000 | | | | (18,003 | ) |
|
| |
USD versus MXN | | Put | | Bank of America, N.A. | | | 01/03/2023 | | | MXN | | | 19.40 | | | USD | | | 5,600,000 | | | | (31,030 | ) |
|
| |
USD versus MXN | | Put | | J.P. Morgan Chase Bank, N.A. | | | 12/07/2022 | | | MXN | | | 19.20 | | | USD | | | 4,100,000 | | | | (6,572 | ) |
|
| |
USD versus THB | | Put | | Standard Chartered Bank PLC | | | 12/14/2022 | | | THB | | | 34.75 | | | USD | | | 4,500,000 | | | | (900 | ) |
|
| |
USD versus ZAR | | Put | | J.P. Morgan Chase Bank, N.A. | | | 02/21/2023 | | | ZAR | | | 15.55 | | | USD | | | 4,665,000 | | | | (3,951 | ) |
|
| |
Subtotal – Foreign Currency Put Options Written | | | | | | | | | | (175,900 | ) |
|
| |
Total – Foreign Currency Options Written | | | | | | | | | $ | (560,245 | ) |
|
| |
| | | | | | | | | | | | | | | | | | | | | | | | | | |
| Open Over-The-Counter Interest Rate Swaptions Written | |
|
| |
| Description | | Type of
Contract | | Counterparty | | Exercise
Rate | | | Floating
Rate
Index | | Pay/
Receive
Exercise
Rate | | Payment
Frequency | | Expiration
Date | | | Notional Value | | | Value | |
|
| |
Interest Rate Risk | | | | | | | | | | | | | | | | | | | | | | | | |
|
| |
2 Year Interest Rate Swap | | Put | | J.P. Morgan Chase Bank, N.A. | | | 8.21% | | | 6 Month WIBOR | | Pay | | Semi-Annually | | | 12/09/2022 | | | | PLN 65,800,000 | | | $ | (75,399 | ) |
|
| |
| | | | | | | | | | | | | | | | | | | | | | |
| Open Forward Foreign Currency Contracts | |
|
| |
| | | | | | | | | | | | | | | | | Unrealized | |
| Settlement | | | | Contract to | | | Appreciation | |
| Date | | Counterparty | | | | | Deliver | | | | | | Receive | | | (Depreciation) | |
|
| |
| Currency Risk | | | | | | | | | | | | | | | | | | | | | | |
|
| |
| 11/03/2022 | | Bank of America, N.A. | | | USD | | | | 1,646,377 | | | | BRL | | | | 8,655,003 | | | | $ 29,163 | |
|
| |
| 12/21/2022 | | Bank of America, N.A. | | | COP | | | | 25,024,462,000 | | | | USD | | | | 5,602,479 | | | | 578,577 | |
|
| |
| 12/21/2022 | | Bank of America, N.A. | | | GBP | | | | 15,000 | | | | USD | | | | 17,405 | | | | 174 | |
|
| |
| 12/21/2022 | | Bank of America, N.A. | | | IDR | | | | 561,960,000 | | | | USD | | | | 36,571 | | | | 665 | |
|
| |
| 12/21/2022 | | Bank of America, N.A. | | | USD | | | | 218,088 | | | | CLP | | | | 207,530,000 | | | | 73 | |
|
| |
| 12/21/2022 | | Bank of America, N.A. | | | USD | | | | 2,520,000 | | | | MXN | | | | 51,236,640 | | | | 43,933 | |
|
| |
| 12/21/2022 | | Barclays Bank PLC | | | USD | | | | 113,340 | | | | CLP | | | | 108,260,000 | | | | 466 | |
|
| |
| 12/21/2022 | | BNP Paribas S.A. | | | CZK | | | | 1,730,000 | | | | USD | | | | 70,633 | | | | 1,005 | |
|
| |
| 11/03/2022 | | Citibank, N.A. | | | USD | | | | 1,454,387 | | | | BRL | | | | 7,719,887 | | | | 40,122 | |
|
| |
| 12/21/2022 | | Citibank, N.A. | | | IDR | | | | 2,333,400,000 | | | | USD | | | | 152,639 | | | | 3,548 | |
|
| |
| 12/21/2022 | | Citibank, N.A. | | | THB | | | | 24,180,000 | | | | USD | | | | 646,472 | | | | 8,365 | |
|
| |
| 12/21/2022 | | Deutsche Bank AG | | | USD | | | | 813,195 | | | | GBP | | | | 725,000 | | | | 19,656 | |
|
| |
| 12/21/2022 | | Deutsche Bank AG | | | USD | | | | 1,696,839 | | | | INR | | | | 141,440,000 | | | | 1,781 | |
|
| |
| 12/21/2022 | | Deutsche Bank AG | | | ZAR | | | | 40,618,690 | | | | USD | | | | 2,316,556 | | | | 113,614 | |
|
| |
| 12/21/2022 | | Goldman Sachs International | | | COP | | | | 801,690,000 | | | | USD | | | | 163,854 | | | | 2,906 | |
|
| |
See accompanying Notes to Financial Statements which are an integral part of the financial statements.
| | |
| 11 | | Invesco Emerging Markets Local Debt Fund |
| | | | | | | | | | | | | | | | | | | | | | |
| Open Forward Foreign Currency Contracts–(continued) | |
|
| |
| | | | | | | | | | | | | | | | | Unrealized | |
| Settlement | | | | Contract to | | | Appreciation | |
| Date | | Counterparty | | | | | Deliver | | | | | | Receive | | | (Depreciation) | |
|
| |
| 11/03/2022 | | J.P. Morgan Chase Bank, N.A. | | | USD | | | | 171,581 | | | | BRL | | | | 935,116 | | | | $ 9,449 | |
|
| |
| 12/02/2022 | | J.P. Morgan Chase Bank, N.A. | | | USD | | | | 6,500,876 | | | | BRL | | | | 34,872,000 | | | | 208,341 | |
|
| |
| 12/21/2022 | | J.P. Morgan Chase Bank, N.A. | | | CLP | | | | 1,221,261,000 | | | | USD | | | | 1,354,699 | | | | 70,880 | |
|
| |
| 12/21/2022 | | J.P. Morgan Chase Bank, N.A. | | | CNY | | | | 5,820,000 | | | | USD | | | | 808,227 | | | | 7,209 | |
|
| |
| 12/21/2022 | | J.P. Morgan Chase Bank, N.A. | | | EUR | | | | 160,000 | | | | USD | | | | 159,559 | | | | 793 | |
|
| |
| 12/21/2022 | | J.P. Morgan Chase Bank, N.A. | | | INR | | | | 343,500,250 | | | | USD | | | | 4,237,371 | | | | 112,114 | |
|
| |
| 12/21/2022 | | J.P. Morgan Chase Bank, N.A. | | | KRW | | | | 54,650,000 | | | | USD | | | | 39,685 | | | | 1,361 | |
|
| |
| 12/21/2022 | | J.P. Morgan Chase Bank, N.A. | | | MYR | | | | 3,819,100 | | | | USD | | | | 851,791 | | | | 43,784 | |
|
| |
| 12/21/2022 | | J.P. Morgan Chase Bank, N.A. | | | USD | | | | 6,378,637 | | | | MXN | | | | 128,742,000 | | | | 63,741 | |
|
| |
| 02/23/2023 | | J.P. Morgan Chase Bank, N.A. | | | ZAR | | | | 4,058,450 | | | | USD | | | | 235,000 | | | | 15,850 | |
|
| |
| 02/27/2023 | | J.P. Morgan Chase Bank, N.A. | | | CNY | | | | 12,283,743 | | | | USD | | | | 1,733,691 | | | | 41,820 | |
|
| |
| 03/15/2023 | | J.P. Morgan Chase Bank, N.A. | | | CNY | | | | 22,165,000 | | | | USD | | | | 3,300,693 | | | | 245,281 | |
|
| |
| 11/14/2022 | | Morgan Stanley and Co. International PLC | | | CLP | | | | 977,944,500 | | | | USD | | | | 1,170,000 | | | | 135,100 | |
|
| |
| 12/21/2022 | | Morgan Stanley and Co. International PLC | | | EUR | | | | 365,153 | | | | USD | | | | 368,144 | | | | 5,806 | |
|
| |
| 12/21/2022 | | Morgan Stanley and Co. International PLC | | | IDR | | | | 1,181,360,000 | | | | USD | | | | 76,118 | | | | 636 | |
|
| |
| 12/21/2022 | | Morgan Stanley and Co. International PLC | | | PEN | | | | 22,415,000 | | | | USD | | | | 5,719,571 | | | | 124,477 | |
|
| |
| 12/21/2022 | | Morgan Stanley and Co. International PLC | | | USD | | | | 284,617 | | | | CZK | | | | 7,150,000 | | | | 3,152 | |
|
| |
| 12/21/2022 | | Morgan Stanley and Co. International PLC | | | USD | | | | 409,474 | | | | EUR | | | | 420,000 | | | | 7,288 | |
|
| |
| 12/21/2022 | | Morgan Stanley and Co. International PLC | | | USD | | | | 179,923 | | | | HUF | | | | 77,040,000 | | | | 3,475 | |
|
| |
| 12/21/2022 | | Morgan Stanley and Co. International PLC | | | ZAR | | | | 13,654,850 | | | | USD | | | | 749,228 | | | | 8,662 | |
|
| |
| 02/14/2023 | | Morgan Stanley and Co. International PLC | | | CLP | | | | 483,930,000 | | | | USD | | | | 570,000 | | | | 66,277 | |
|
| |
| 04/13/2023 | | Morgan Stanley and Co. International PLC | | | CNY | | | | 7,412,080 | | | | USD | | | | 1,040,000 | | | | 16,693 | |
|
| |
| 12/21/2022 | | Royal Bank of Canada | | | CNY | | | | 740,000 | | | | USD | | | | 102,488 | | | | 640 | |
|
| |
| 12/02/2022 | | Standard Chartered Bank PLC | | | USD | | | | 80,107 | | | | BRL | | | | 430,000 | | | | 2,623 | |
|
| |
| 12/16/2022 | | Standard Chartered Bank PLC | | | THB | | | | 76,503,000 | | | | USD | | | | 2,100,000 | | | | 82,187 | |
|
| |
| 12/21/2022 | | Standard Chartered Bank PLC | | | MYR | | | | 350,000 | | | | USD | | | | 75,529 | | | | 1,479 | |
|
| |
| 12/21/2022 | | Standard Chartered Bank PLC | | | THB | | | | 4,160,000 | | | | USD | | | | 113,119 | | | | 3,337 | |
|
| |
| 03/15/2023 | | Standard Chartered Bank PLC | | | CNY | | | | 7,300,000 | | | | USD | | | | 1,077,984 | | | | 71,689 | |
|
| |
| 12/21/2022 | | UBS AG | | | HUF | | | | 23,140,000 | | | | USD | | | | 57,467 | | | | 2,380 | |
|
| |
Subtotal–Appreciation | | | | | | | | | | | | | | | | | | | 2,200,572 | |
|
| |
| | | | | | |
| Currency Risk | | | | | | | | | | | | | | | | | | | | | | |
|
| |
| 11/03/2022 | | Bank of America, N.A. | | | BRL | | | | 8,655,003 | | | | USD | | | | 1,590,262 | | | | (85,278 | ) |
|
| |
| 12/21/2022 | | Bank of America, N.A. | | | MXN | | | | 24,826,375 | | | | USD | | | | 1,225,184 | | | | (17,153 | ) |
|
| |
| 12/21/2022 | | Bank of America, N.A. | | | USD | | | | 806,000 | | | | ZAR | | | | 14,411,862 | | | | (24,377 | ) |
|
| |
| 12/21/2022 | | Barclays Bank PLC | | | THB | | | | 5,100,000 | | | | USD | | | | 133,976 | | | | (612 | ) |
|
| |
| 11/03/2022 | | Citibank, N.A. | | | BRL | | | | 7,719,887 | | | | USD | | | | 1,468,497 | | | | (26,012 | ) |
|
| |
| 12/02/2022 | | Citibank, N.A. | | | BRL | | | | 7,719,887 | | | | USD | | | | 1,445,225 | | | | (40,046 | ) |
|
| |
| 12/21/2022 | | Citibank, N.A. | | | EUR | | | | 340,000 | | | | USD | | | | 334,369 | | | | (3,009 | ) |
|
| |
| 12/21/2022 | | Citibank, N.A. | | | PLN | | | | 3,920,000 | | | | USD | | | | 803,292 | | | | (10,926 | ) |
|
| |
| 12/21/2022 | | Citibank, N.A. | | | USD | | | | 2,175,919 | | | | CNY | | | | 15,142,001 | | | | (91,894 | ) |
|
| |
| 12/21/2022 | | Citibank, N.A. | | | USD | | | | 795,115 | | | | COP | | | | 3,857,700,000 | | | | (20,645 | ) |
|
| |
| 12/21/2022 | | Deutsche Bank AG | | | USD | | | | 80,351 | | | | EUR | | | | 80,000 | | | | (968 | ) |
|
| |
| 12/21/2022 | | Deutsche Bank AG | | | USD | | | | 2,326,376 | | | | IDR | | | | 34,790,956,782 | | | | (103,432 | ) |
|
| |
| 12/21/2022 | | Deutsche Bank AG | | | USD | | | | 2,506,099 | | | | PLN | | | | 12,036,290 | | | | (6,057 | ) |
|
| |
| 12/21/2022 | | Deutsche Bank AG | | | USD | | | | 1,068,725 | | | | RON | | | | 5,295,000 | | | | (7,789 | ) |
|
| |
| 12/02/2022 | | Goldman Sachs International | | | BRL | | | | 4,060,000 | | | | USD | | | | 769,222 | | | | (11,904 | ) |
|
| |
| 12/21/2022 | | Goldman Sachs International | | | MXN | | | | 18,120,000 | | | | USD | | | | 896,185 | | | | (10,558 | ) |
|
| |
| 12/21/2022 | | Goldman Sachs International | | | THB | | | | 13,410,000 | | | | USD | | | | 353,817 | | | | (72 | ) |
|
| |
| 12/21/2022 | | Goldman Sachs International | | | USD | | | | 99,782 | | | | THB | | | | 3,750,000 | | | | (820 | ) |
|
| |
| 11/03/2022 | | J.P. Morgan Chase Bank, N.A. | | | BRL | | | | 935,116 | | | | USD | | | | 177,880 | | | | (3,151 | ) |
|
| |
See accompanying Notes to Financial Statements which are an integral part of the financial statements.
| | |
| 12 | | Invesco Emerging Markets Local Debt Fund |
| | | | | | | | | | | | | | | | | | | | | | |
| Open Forward Foreign Currency Contracts–(continued) | |
|
| |
| | | | | | | | | | | | | | | | | Unrealized | |
| Settlement | | | | Contract to | | | Appreciation | |
| Date | | Counterparty | | | | | Deliver | | | | | | Receive | | | (Depreciation) | |
|
| |
| 12/21/2022 | | J.P. Morgan Chase Bank, N.A. | | | CZK | | | | 1,310,000 | | | | USD | | | | 52,546 | | | | $ (178 | ) |
|
| |
| 12/21/2022 | | J.P. Morgan Chase Bank, N.A. | | | MXN | | | | 11,440,000 | | | | USD | | | | 564,530 | | | | (7,939 | ) |
|
| |
| 12/21/2022 | | J.P. Morgan Chase Bank, N.A. | | | THB | | | | 4,970,000 | | | | USD | | | | 130,164 | | | | (993 | ) |
|
| |
| 12/21/2022 | | J.P. Morgan Chase Bank, N.A. | | | USD | | | | 2,474,341 | | | | CNY | | | | 17,440,000 | | | | (74,038 | ) |
|
| |
| 12/21/2022 | | J.P. Morgan Chase Bank, N.A. | | | USD | | | | 37,556 | | | | CZK | | | | 930,000 | | | | (126 | ) |
|
| |
| 12/21/2022 | | J.P. Morgan Chase Bank, N.A. | | | USD | | | | 2,816,157 | | | | HUF | | | | 1,146,316,831 | | | | (87,286 | ) |
|
| |
| 02/14/2023 | | J.P. Morgan Chase Bank, N.A. | | | CLP | | | | 1,103,560,000 | | | | USD | | | | 1,024,576 | | | | (124,122 | ) |
|
| |
| 02/27/2023 | | J.P. Morgan Chase Bank, N.A. | | | USD | | | | 882,691 | | | | CNY | | | | 5,962,110 | | | | (61,514 | ) |
|
| |
| 03/15/2023 | | J.P. Morgan Chase Bank, N.A. | | | USD | | | | 4,187,741 | | | | CNY | | | | 27,590,000 | | | | (384,500 | ) |
|
| |
| 12/21/2022 | | Morgan Stanley and Co. International PLC | | | CLP | | | | 724,470,000 | | | | USD | | | | 735,104 | | | | (26,476 | ) |
|
| |
| 12/21/2022 | | Morgan Stanley and Co. International PLC | | | CZK | | | | 1,390,000 | | | | USD | | | | 55,045 | | | | (899 | ) |
|
| |
| 12/21/2022 | | Morgan Stanley and Co. International PLC | | | GBP | | | | 710,000 | | | | USD | | | | 807,668 | | | | (7,952 | ) |
|
| |
| 12/21/2022 | | Morgan Stanley and Co. International PLC | | | IDR | | | | 579,220,000 | | | | USD | | | | 36,972 | | | | (37 | ) |
|
| |
| 12/21/2022 | | Morgan Stanley and Co. International PLC | | | MXN | | | | 7,958,583 | | | | USD | | | | 391,490 | | | | (6,765 | ) |
|
| |
| 12/21/2022 | | Morgan Stanley and Co. International PLC | | | PLN | | | | 6,020,000 | | | | USD | | | | 1,237,374 | | | | (13,032 | ) |
|
| |
| 12/21/2022 | | Morgan Stanley and Co. International PLC | | | TRY | | | | 800,000 | | | | USD | | | | 40,135 | | | | (1,228 | ) |
|
| |
| 12/21/2022 | | Morgan Stanley and Co. International PLC | | | USD | | | | 114,913 | | | | CNY | | | | 830,000 | | | | (679 | ) |
|
| |
| 12/21/2022 | | Morgan Stanley and Co. International PLC | | | USD | | | | 736,970 | | | | CZK | | | | 18,299,700 | | | | (454 | ) |
|
| |
| 12/21/2022 | | Morgan Stanley and Co. International PLC | | | USD | | | | 90,421 | | | | HUF | | | | 37,564,999 | | | | (996 | ) |
|
| |
| 12/21/2022 | | Morgan Stanley and Co. International PLC | | | USD | | | | 5,339,117 | | | | PEN | | | | 20,924,000 | | | | (116,197 | ) |
|
| |
| 12/21/2022 | | Morgan Stanley and Co. International PLC | | | USD | | | | 3,062,357 | | | | THB | | | | 110,979,810 | | | | (133,613 | ) |
|
| |
| 12/21/2022 | | Morgan Stanley and Co. International PLC | | | USD | | | | 55,112 | | | | ZAR | | | | 1,000,000 | | | | (878 | ) |
|
| |
| 02/14/2023 | | Morgan Stanley and Co. International PLC | | | CLP | | | | 137,780,000 | | | | USD | | | | 129,797 | | | | (13,618 | ) |
|
| |
| 04/13/2023 | | Morgan Stanley and Co. International PLC | | | USD | | | | 440,000 | | | | CNY | | | | 2,944,480 | | | | (33,487 | ) |
|
| |
| 12/21/2022 | | Standard Chartered Bank PLC | | | HUF | | | | 170,562,000 | | | | USD | | | | 376,609 | | | | (29,424 | ) |
|
| |
| 12/21/2022 | | Standard Chartered Bank PLC | | | USD | | | | 909,228 | | | | CLP | | | | 854,137,500 | | | | (11,337 | ) |
|
| |
| 12/21/2022 | | Standard Chartered Bank PLC | | | USD | | | | 507,387 | | | | CNY | | | | 3,639,600 | | | | (6,461 | ) |
|
| |
| 12/21/2022 | | Standard Chartered Bank PLC | | | USD | | | | 223,415 | | | | PEN | | | | 895,000 | | | | (10 | ) |
|
| |
| 12/21/2022 | | Standard Chartered Bank PLC | | | USD | | | | 1,074,773 | | | | THB | | | | 39,600,000 | | | | (29,734 | ) |
|
| |
| 03/15/2023 | | Standard Chartered Bank PLC | | | USD | | | | 286,807 | | | | CNY | | | | 1,875,000 | | | | (28,341 | ) |
|
| |
| 12/21/2022 | | UBS AG | | | THB | | | | 7,450,000 | | | | USD | | | | 196,212 | | | | (393 | ) |
|
| |
| 12/21/2022 | | UBS AG | | | USD | | | | 1,121,478 | | | | PLN | | | | 5,335,000 | | | | (13,352 | ) |
|
| |
Subtotal–Depreciation | | | | | | | | | | | | | | | | (1,680,762 | ) |
|
| |
Total Forward Foreign Currency Contracts | | | | | | | | | | | | | | | | $ 519,810 | |
|
| |
| | | | | | | | | | | | | | | | | | | | | | | | | | | | | | | | | | | | | | |
| | | | | Open Centrally Cleared Interest Rate Swap Agreements(a) | | | | | | | |
Pay/
Receive
Floating
Rate | | Floating Rate Index | | Payment
Frequency | | | (Pay)/
Receive
Fixed
Rate | | | Payment
Frequency | | | Maturity
Date | | | Notional Value | | | Upfront
Payments
Paid
(Received) | | | Value | | | Unrealized
Appreciation
(Depreciation) | |
Interest Rate Risk | | | | | | | | | | | | | | | | | | | | | | | | | | | | | | | | | | | | |
Pay | | 3 Month CNRR007 | | | Quarterly | | | | 2.36 | % | | | Quarterly | | | | 04/12/2027 | | | | CNY | | | | 15,000,000 | | | | $– | | | | $ 812 | | | | $ 812 | |
Pay | | 3 Month CNRR007 | | | Quarterly | | | | 2.44 | | | | Quarterly | | | | 04/27/2027 | | | | CNY | | | | 5,000,000 | | | | – | | | | 2,428 | | | | 2,428 | |
Pay | | 3 Month CNRR007 | | | Quarterly | | | | 2.51 | | | | Quarterly | | | | 07/18/2027 | | | | CNY | | | | 5,000,000 | | | | – | | | | 4,319 | | | | 4,319 | |
Pay | | 28 Day MXN TIIE | | | 28 Days | | | | 9.36 | | | | 28 Days | | | | 06/03/2027 | | | | MXN | | | | 58,700,000 | | | | – | | | | 4,431 | | | | 4,431 | |
Receive | | BZDIOVRA | | | At Maturity | | | | (12.84 | ) | | | At Maturity | | | | 01/02/2024 | | | | BRL | | | | 23,193,620 | | | | – | | | | 5,561 | | | | 5,561 | |
Pay | | BZDIOVRA | | | At Maturity | | | | 11.72 | | | | At Maturity | | | | 01/02/2026 | | | | BRL | | | | 8,286,342 | | | | – | | | | 10,077 | | | | 10,077 | |
Pay | | BZDIOVRA | | | At Maturity | | | | 11.74 | | | | At Maturity | | | | 01/02/2025 | | | | BRL | | | | 29,824,026 | | | | – | | | | 10,151 | | | | 10,151 | |
Receive | | TTHORON | | | Quarterly | | | | (2.48 | ) | | | Quarterly | | | | 09/05/2027 | | | | THB | | | | 40,000,000 | | | | – | | | | 11,400 | | | | 11,400 | |
Receive | | 6 Month THBFIX | | | Semi-Annually | | | | (1.71 | ) | | | Semi-Annually | | | | 04/18/2025 | | | | THB | | | | 81,000,000 | | | | – | | | | 12,478 | | | | 12,478 | |
Receive | | 3 Month COOVIBR | | | Quarterly | | | | (11.25 | ) | | | Quarterly | | | | 10/31/2024 | | | | COP | | | | 25,000,000,000 | | | | – | | | | 33,186 | | | | 33,186 | |
See accompanying Notes to Financial Statements which are an integral part of the financial statements.
| | |
| 13 | | Invesco Emerging Markets Local Debt Fund |
| | | | | | | | | | | | | | | | | | | | | | | | | | | | | | | | | | |
| Open Centrally Cleared Interest Rate Swap Agreements(a)–(continued) | |
Pay/
Receive
Floating
Rate | | Floating Rate Index | | Payment
Frequency | | (Pay)/
Receive
Fixed
Rate | | | Payment
Frequency | | | Maturity
Date | | | Notional Value | | | Upfront
Payments
Paid
(Received) | | Value | | | Unrealized Appreciation (Depreciation) | |
| | | | | | | | | | |
Receive | | 3 Month JIBAR | | Quarterly | | | (7.98)% | | | | Quarterly | | | | 03/07/2032 | | | | ZAR | | | | 10,700,000 | | | $– | | | $ 55,671 | | | | $ 55,671 | |
| | | | | | | | | | |
Receive | | 3 Month JIBAR | | Quarterly | | | (7.95) | | | | Quarterly | | | | 03/07/2032 | | | | ZAR | | | | 11,000,000 | | | – | | | 58,382 | | | | 58,382 | |
| | | | | | | | | | |
Receive | | 3 Month COOVIBR | | Quarterly | | | (8.37) | | | | Quarterly | | | | 03/25/2027 | | | | COP | | | | 3,000,000,000 | | | – | | | 58,401 | | | | 58,401 | |
| | | | | | | | | | |
Receive | | 3 Month COOVIBR | | Quarterly | | | (9.05) | | | | Quarterly | | | | 08/10/2027 | | | | COP | | | | 4,545,500,000 | | | – | | | 67,498 | | | | 67,498 | |
| | | | | | | | | | |
Receive | | 3 Month COOVIBR | | Quarterly | | | (8.59) | | | | Quarterly | | | | 05/31/2032 | | | | COP | | | | 3,215,000,000 | | | – | | | 89,439 | | | | 89,439 | |
| | | | | | | | | | |
Receive | | 3 Month COOVIBR | | Quarterly | | | (8.96) | | | | Quarterly | | | | 05/23/2032 | | | | COP | | | | 4,400,000,000 | | | – | | | 102,079 | | | | 102,079 | |
Receive | | 3 Month COOVIBR | | Quarterly | | | (8.62) | | | | Quarterly | | | | 06/02/2024 | | | | COP | | | | 13,300,000,000 | | | – | | | 119,794 | | | | 119,794 | |
Subtotal – Appreciation | | | | | | | | | | | | | | | | | | | | | | – | | | 646,107 | | | | 646,107 | |
|
Interest Rate Risk | |
| | | | | | | | | | |
Pay | | 6 Month BUBOR | | Semi-Annually | | | 4.67 | | | | Annually | | | | 01/07/2032 | | | | HUF | | | | 270,000,000 | | | – | | | (214,299 | ) | | | (214,299 | ) |
| | | | | | | | | | |
Pay | | 6 Month BUBOR | | Semi-Annually | | | 12.89 | | | | Annually | | | | 08/08/2024 | | | | HUF | | | | 1,300,000,000 | | | – | | | (107,708 | ) | | | (107,708 | ) |
| | | | | | | | | | |
Pay | | 6 Month BUBOR | | Semi-Annually | | | 9.78 | | | | Annually | | | | 08/04/2027 | | | | HUF | | | | 475,000,000 | | | – | | | (98,495 | ) | | | (98,495 | ) |
| | | | | | | | | | |
Pay | | 6 Month BUBOR | | Semi-Annually | | | 9.61 | | | | Annually | | | | 07/27/2027 | | | | HUF | | | | 389,700,000 | | | – | | | (86,451 | ) | | | (86,451 | ) |
| | | | | | | | | | |
Pay | | 6 Month WIBOR | | Semi-Annually | | | 6.75 | | | | Annually | | | | 09/21/2024 | | | | PLN | | | | 15,600,000 | | | – | | | (75,718 | ) | | | (75,718 | ) |
| | | | | | | | | | |
Receive | | FBIL Overnight MIBOR | | Semi-Annually | | | (6.97) | | | | Semi-Annually | | | | 05/25/2027 | | | | INR | | | | 125,000,000 | | | – | | | (13,579 | ) | | | (13,579 | ) |
| | | | | | | | | | |
Receive | | 28 Day MXN TIIE | | 28 Days | | | (9.66) | | | | 28 Days | | | | 12/17/2025 | | | | MXN | | | | 70,000,000 | | | – | | | (13,547 | ) | | | (13,547 | ) |
| | | | | | | | | | |
Receive | | TTHORON | | Quarterly | | | (2.75) | | | | Quarterly | | | | 12/21/2025 | | | | THB | | | | 105,000,000 | | | – | | | (13,460 | ) | | | (13,460 | ) |
| | | | | | | | | | |
Pay | | BZDIOVRA | | At Maturity | | | 11.30 | | | | At Maturity | | | | 01/02/2026 | | | | BRL | | | | 8,667,090 | | | – | | | (8,967 | ) | | | (8,967 | ) |
| | | | | | | | | | |
Pay | | BZDIOVRA | | At Maturity | | | 11.27 | | | | At Maturity | | | | 01/02/2029 | | | | BRL | | | | 4,325,237 | | | – | | | (8,264 | ) | | | (8,264 | ) |
| | | | | | | | | | |
Receive | | BZDIOVRA | | At Maturity | | | (13.08) | | | | At Maturity | | | | 01/02/2024 | | | | BRL | | | | 21,290,463 | | | – | | | (4,708 | ) | | | (4,708 | ) |
| | | | | | | | | | |
Pay | | 6 Month WIBOR | | Semi-Annually | | | 7.45 | | | | Annually | | | | 05/25/2027 | | | | PLN | | | | 5,200,000 | | | – | | | (4,513 | ) | | | (4,513 | ) |
| | | | | | | | | | |
Pay | | BZDIOVRA | | At Maturity | | | 11.44 | | | | At Maturity | | | | 01/02/2026 | | | | BRL | | | | 8,592,101 | | | – | | | (3,545 | ) | | | (3,545 | ) |
| | | | | | | | | | |
Pay | | 28 Day MXN TIIE | | 28 Days | | | 9.27 | | | | 28 Days | | | | 10/14/2032 | | | | MXN | | | | 51,800,000 | | | – | | | (2,516 | ) | | | (2,516 | ) |
| | | | | | | | | | |
Receive | | BZDIOVRA | | At Maturity | | | (13.00) | | | | At Maturity | | | | 01/02/2024 | | | | BRL | | | | 22,346,786 | | | – | | | (1,438 | ) | | | (1,438 | ) |
Pay | | 3 Month CNRR007 | | Quarterly | | | 2.34 | | | | Quarterly | | | | 08/26/2027 | | | | CNY | | | | 6,000,000 | | | – | | | (1,263 | ) | | | (1,263 | ) |
Subtotal – Depreciation | | | | | | | | | | | | | | | | | | | | | | – | | | (658,471 | ) | | | (658,471 | ) |
| | | | | | |
Total Centrally Cleared Interest Rate Swap Agreements | | | | | | | | | | | | | | | $– | | | $ (12,364 | ) | | | $ (12,364 | ) |
| (a) | Centrally cleared swap agreements collateralized by $705,709 cash held with Counterparties. |
| | | | | | | | | | | | | | | | | | | | | | | | | | | | | | | | |
| Open Over-The-Counter Interest Rate Swap Agreements | |
| Counterparty | | Pay/
Receive Floating
Rate | | | Floating Rate Index | | Payment
Frequency | | (Pay)/
Received
Fixed
Rate | | Payment
Frequency | | | Maturity
Date | | | Notional Value | | | Upfront
Payments
Paid
(Received) | | Value | | | Unrealized
Appreciation | |
|
Interest Rate Risk | |
| | | | | | | | | | |
Standard Chartered Bank PLC | | | Receive | | | 3 Month MYR KLIBOR | | Quarterly | | (2.85)% | | | Quarterly | | | | 03/23/2024 | | | MYR | 8,000,000 | | | $– | | | $20,866 | | | | $20,866 | |
Standard Chartered Bank PLC | | | Receive | | | 3 Month MYR KLIBOR | | Quarterly | | (2.97) | | | Quarterly | | | | 04/11/2024 | | | MYR | 30,300,000 | | | – | | | 72,471 | | | | 72,471 | |
Total Over-The-Counter Interest Rate Swap Agreements | | | | | | | | | | | $– | | | $93,337 | | | | $93,337 | |
See accompanying Notes to Financial Statements which are an integral part of the financial statements.
| | |
| 14 | | Invesco Emerging Markets Local Debt Fund |
| | |
| Abbreviations: |
| |
| BRL | | –Brazilian Real |
| BUBOR | | –Budapest Interbank Offered Rate |
| BZDIOVRA | | –Brazil Ceptip DI Interbank Deposit Rate |
| CLP | | –Chile Peso |
| CNH | | –Chinese Renminbi |
| CNRR007 | | –China 7-Day Reverse Repo Rate |
| CNY | | –Chinese Yuan Renminbi |
| COOVIBR | | –Colombia IBR Overnight Nominal Interbank Reference Rate |
| COP | | –Colombia Peso |
| CZK | | –Czech Koruna |
| EUR | | –Euro |
| FBIL | | –Financial Benchmarks India Private Ltd. |
| GBP | | –British Pound Sterling |
| HUF | | –Hungarian Forint |
| IDR | | –Indonesian Rupiah |
| INR | | –Indian Rupee |
| JIBAR | | –Johannesburg Interbank Average Rate |
| KLIBOR | | –Kuala Lumpur Interbank Offered Rate |
| KRW | | –South Korean Won |
| MIBOR | | –Mumbai Interbank Offered Rate |
| MXN | | –Mexican Peso |
| MYR | | –Malaysian Ringgit |
| PEN | | –Peruvian Sol |
| PLN | | –Polish Zloty |
| RON | | –Romania New Leu |
| THB | | –Thai Baht |
| THBFIX | | –Thai Baht Interest Rate Fixing |
| TIIE | | –Interbank Equilibrium Interest Rate |
| TRY | | –Turkish Lira |
| TTHORON | | –Thai Overnight Repurchase Rate |
| USD | | –U.S. Dollar |
| WIBOR | | –Warsaw Interbank Offered Rate |
| ZAR | | –South African Rand |
See accompanying Notes to Financial Statements which are an integral part of the financial statements.
| | |
| 15 | | Invesco Emerging Markets Local Debt Fund |
Statement of Assets and Liabilities
October 31, 2022
| | | | |
Assets: | | | | |
Investments in unaffiliated securities, at value
(Cost $73,376,706) | | $ | 59,908,194 | |
|
| |
Investments in affiliated money market funds, at value
(Cost $14,906,495) | | | 14,906,810 | |
|
| |
Other investments: | | | | |
Swaps receivable –OTC | | | 814 | |
|
| |
Unrealized appreciation on swap agreements –OTC | | | 93,337 | |
|
| |
Unrealized appreciation on forward foreign currency contracts outstanding | | | 2,200,572 | |
|
| |
Deposits with brokers: | | | | |
Cash collateral – centrally cleared swap agreements | | | 705,709 | |
|
| |
Cash | | | 487,436 | |
|
| |
Foreign currencies, at value (Cost $538,968) | | | 341,193 | |
|
| |
Receivable for: | | | | |
Fund shares sold | | | 23,479 | |
|
| |
Dividends | | | 7,015 | |
|
| |
Interest | | | 1,360,368 | |
|
| |
Cash segregated as collateral | | | 233,834 | |
|
| |
Investment for trustee deferred compensation and retirement plans | | | 23,531 | |
|
| |
Other assets | | | 44,300 | |
|
| |
Total assets | | | 80,336,592 | |
|
| |
| |
Liabilities: | | | | |
Other investments: | | | | |
Options written, at value (premiums received $543,666) | | | 635,644 | |
|
| |
Variation margin payable – centrally cleared swap agreements | | | 36,660 | |
|
| |
Unrealized depreciation on forward foreign currency contracts outstanding | | | 1,680,762 | |
|
| |
Payable for: | | | | |
Dividends | | | 80,874 | |
|
| |
Fund shares reacquired | | | 319,771 | |
|
| |
Accrued fees to affiliates | | | 48,795 | |
|
| |
Accrued trustees’ and officers’ fees and benefits | | | 911 | |
|
| |
Accrued other operating expenses | | | 96,628 | |
|
| |
Trustee deferred compensation and retirement plans | | | 23,531 | |
|
| |
Total liabilities | | | 2,923,576 | |
|
| |
Net assets applicable to shares outstanding | | $ | 77,413,016 | |
|
| |
| | | | |
Net assets consist of: | | | | |
Shares of beneficial interest | | $ | 103,045,754 | |
|
| |
Distributable earnings (loss) | | | (25,632,738 | ) |
|
| |
| | $ | 77,413,016 | |
|
| |
| |
Net Assets: | | | | |
Class A | | $ | 20,621,304 | |
|
| |
Class C | | $ | 4,472,946 | |
|
| |
Class R | | $ | 1,472,295 | |
|
| |
Class Y | | $ | 48,253,461 | |
|
| |
Class R5 | | $ | 7,375 | |
|
| |
Class R6 | | $ | 2,585,635 | |
|
| |
|
Shares outstanding, no par value, with an unlimited number of shares authorized: | |
Class A | | | 4,219,629 | |
|
| |
Class C | | | 914,922 | |
|
| |
Class R | | | 301,182 | |
|
| |
Class Y | | | 9,865,861 | |
|
| |
Class R5 | | | 1,508 | |
|
| |
Class R6 | | | 529,000 | |
|
| |
Class A: | | | | |
Net asset value per share | | $ | 4.89 | |
|
| |
Maximum offering price per share
(Net asset value of $4.89 ÷ 95.75%) | | $ | 5.11 | |
|
| |
Class C: | | | | |
Net asset value and offering price per share | | $ | 4.89 | |
|
| |
Class R: | | | | |
Net asset value and offering price per share | | $ | 4.89 | |
|
| |
Class Y: | | | | |
Net asset value and offering price per share | | $ | 4.89 | |
|
| |
Class R5: | | | | |
Net asset value and offering price per share | | $ | 4.89 | |
|
| |
Class R6: | | | | |
Net asset value and offering price per share | | $ | 4.89 | |
|
| |
See accompanying Notes to Financial Statements which are an integral part of the financial statements.
| | |
| 16 | | Invesco Emerging Markets Local Debt Fund |
Statement of Operations
For the year ended October 31, 2022
| | | | |
Investment income: | | | | |
Interest (net of foreign withholding taxes of $139,961) | | $ | 6,388,071 | |
|
| |
Dividends from affiliated money market funds | | | 40,350 | |
|
| |
Total investment income | | | 6,428,421 | |
|
| |
| |
Expenses: | | | | |
Advisory fees | | | 745,319 | |
|
| |
Administrative services fees | | | 15,402 | |
|
| |
Custodian fees | | | 98,542 | |
|
| |
Distribution fees: | | | | |
Class A | | | 67,157 | |
|
| |
Class C | | | 58,393 | |
|
| |
Class R | | | 8,390 | |
|
| |
Interest, facilities and maintenance fees | | | 94,096 | |
|
| |
Transfer agent fees – A, C, R and Y | | | 190,475 | |
|
| |
Transfer agent fees – R5 | | | 2 | |
|
| |
Transfer agent fees – R6 | | | 822 | |
|
| |
Trustees’ and officers’ fees and benefits | | | 20,009 | |
|
| |
Registration and filing fees | | | 82,792 | |
|
| |
Professional services fees | | | 60,858 | |
|
| |
Other | | | 1,637 | |
|
| |
Total expenses | | | 1,443,894 | |
|
| |
Less: Fees waived and/or expense offset arrangement(s) | | | (5,103 | ) |
|
| |
Net expenses | | | 1,438,791 | |
|
| |
Net investment income | | | 4,989,630 | |
|
| |
| |
Realized and unrealized gain (loss) from: | | | | |
Net realized gain (loss) from: | | | | |
Unaffiliated investment securities (net of foreign taxes of $95,286) | | | (15,700,811 | ) |
|
| |
Affiliated investment securities | | | (528 | ) |
|
| |
Foreign currencies | | | (341,879 | ) |
|
| |
Forward foreign currency contracts | | | (1,850,616 | ) |
|
| |
Futures contracts | | | 210,259 | |
|
| |
Option contracts written | | | 293,266 | |
|
| |
Swap agreements | | | (1,438,428 | ) |
|
| |
| | | (18,828,737 | ) |
|
| |
Change in net unrealized appreciation (depreciation) of: | | | | |
Unaffiliated investment securities (net of foreign taxes of $115,147) | | | (5,437,762 | ) |
|
| |
Affiliated investment securities | | | 402 | |
|
| |
Foreign currencies | | | (164,043 | ) |
|
| |
Forward foreign currency contracts | | | 728,514 | |
|
| |
Futures contracts | | | (146,184 | ) |
|
| |
Option contracts written | | | (116,179 | ) |
|
| |
Swap agreements | | | 530,522 | |
|
| |
| | | (4,604,730 | ) |
|
| |
Net realized and unrealized gain (loss) | | | (23,433,467 | ) |
|
| |
Net increase (decrease) in net assets resulting from operations | | $ | (18,443,837 | ) |
|
| |
See accompanying Notes to Financial Statements which are an integral part of the financial statements.
| | |
| 17 | | Invesco Emerging Markets Local Debt Fund |
Statement of Changes in Net Assets
For the years ended October 31, 2022 and 2021
| | | | | | | | |
| | | 2022 | | | 2021 | |
|
| |
Operations: | �� | | | | | | | |
Net investment income | | $ | 4,989,630 | | | $ | 6,985,788 | |
|
| |
Net realized gain (loss) | | | (18,828,737 | ) | | | (5,383,132 | ) |
|
| |
Change in net unrealized appreciation (depreciation) | | | (4,604,730 | ) | | | (5,029,120 | ) |
|
| |
Net increase (decrease) in net assets resulting from operations | | | (18,443,837 | ) | | | (3,426,464 | ) |
|
| |
| | |
Distributions to shareholders from distributable earnings: | | | | | | | | |
Class A | | | – | | | | (361,670 | ) |
|
| |
Class C | | | – | | | | (68,120 | ) |
|
| |
Class R | | | – | | | | (17,389 | ) |
|
| |
Class Y | | | – | | | | (971,109 | ) |
|
| |
Class R5 | | | – | | | | (98 | ) |
|
| |
Class R6 | | | – | | | | (50,888 | ) |
|
| |
Total distributions from distributable earnings | | | – | | | | (1,469,274 | ) |
|
| |
| | |
Return of capital: | | | | | | | | |
Class A | | | (1,308,109 | ) | | | (1,144,032 | ) |
|
| |
Class C | | | (232,461 | ) | | | (215,475 | ) |
|
| |
Class R | | | (75,996 | ) | | | (55,004 | ) |
|
| |
Class Y | | | (3,505,240 | ) | | | (3,071,809 | ) |
|
| |
Class R5 | | | (437 | ) | | | (312 | ) |
|
| |
Class R6 | | | (172,749 | ) | | | (160,969 | ) |
|
| |
Total return of capital | | | (5,294,992 | ) | | | (4,647,601 | ) |
|
| |
Total distributions | | | (5,294,992 | ) | | | (6,116,875 | ) |
|
| |
| | |
Share transactions–net: | | | | | | | | |
Class A | | | (10,038,507 | ) | | | 2,610,087 | |
|
| |
Class C | | | (1,780,116 | ) | | | (3,566,572 | ) |
|
| |
Class R | | | 200 | | | | (239,522 | ) |
|
| |
Class Y | | | (29,344,167 | ) | | | 6,805,786 | |
|
| |
Class R6 | | | (1,047,904 | ) | | | 526,466 | |
|
| |
Net increase (decrease) in net assets resulting from share transactions | | | (42,210,494 | ) | | | 6,136,245 | |
|
| |
Net increase (decrease) in net assets | | | (65,949,323 | ) | | | (3,407,094 | ) |
|
| |
| | |
Net assets: | | | | | | | | |
Beginning of year | | | 143,362,339 | | | | 146,769,433 | |
|
| |
End of year | | $ | 77,413,016 | | | $ | 143,362,339 | |
|
| |
See accompanying Notes to Financial Statements which are an integral part of the financial statements.
| | |
| 18 | | Invesco Emerging Markets Local Debt Fund |
Financial Highlights
The following schedule presents financial highlights for a share of the Fund outstanding throughout the periods indicated.
| | | | | | | | | | | | | | | | | | | | | | | | | | | | | | | | | | | | | | | | | | | | | | | | | | | | | | | | | | | | | | | | | | | | | | |
| | | Net asset
value,
beginning
of period | | Net
investment
income(a) | | Net gains
(losses)
on securities
(both
realized and
unrealized) | | Total from
investment
operations | | Dividends
from net
investment
income | | Return of
capital | | Total
distributions | | Net asset
value, end
of period | | Total
return(b) | | Net assets,
end of period (000’s omitted) | | Ratio of
expenses
to average
net assets
with fee waivers
and/or
expenses
absorbed | | Ratio of
expenses
to average net
assets without
fee waivers
and/or
expenses
absorbed(c) | | Ratio of net
investment
income to average
net assets | | Portfolio
turnover (d) |
Class A | | | | | | | | | | | | | | | | | | | | | | | | | | | | | | | | | | | | | | | | | | | | | | | | | | | | | | | | | | | | | | | | | | | | | | |
Year ended 10/31/22 | | | | $6.17 | | | | | $0.25 | | | | | $(1.26 | ) | | | | $(1.01 | ) | | | | $ – | | | | | $(0.27 | ) | | | | $(0.27 | ) | | | | $4.89 | | | | | (16.80 | )%(e) | | | | $ 20,621 | | | | | 1.45 | %(e)(f) | | | | 1.45 | %(e)(f) | | | | 4.47 | %(e)(f) | | | | 137 | % |
Year ended 10/31/21 | | | | 6.53 | | | | | 0.29 | | | | | (0.40 | ) | | | | (0.11 | ) | | | | (0.06 | ) | | | | (0.19 | ) | | | | (0.25 | ) | | | | 6.17 | | | | | (1.81 | ) | | | | 36,826 | | | | | 1.23 | | | | | 1.35 | | | | | 4.38 | | | | | 107 | |
Year ended 10/31/20 | | | | 6.99 | | | | | 0.24 | | | | | (0.45 | ) | | | | (0.21 | ) | | | | (0.07 | ) | | | | (0.18 | ) | | | | (0.25 | ) | | | | 6.53 | | | | | (3.01 | )(e) | | | | 36,680 | | | | | 1.15 | (e) | | | | 1.28 | (e) | | | | 3.57 | (e) | | | | 50 | |
Five months ended 10/31/19 | | | | 6.68 | | | | | 0.16 | | | | | 0.30 | | | | | 0.46 | | | | | (0.09 | ) | | | | (0.06 | ) | | | | (0.15 | ) | | | | 6.99 | | | | | 6.99 | | | | | 48,921 | | | | | 1.15 | (g) | | | | 1.32 | (g) | | | | 5.66 | (g) | | | | 21 | |
Year ended 05/31/19 | | | | 7.02 | | | | | 0.39 | | | | | (0.34 | ) | | | | 0.05 | | | | | (0.18 | ) | | | | (0.21 | ) | | | | (0.39 | ) | | | | 6.68 | | | | | 0.85 | | | | | 44,188 | | | | | 1.16 | | | | | 1.27 | | | | | 5.82 | | | | | 67 | |
Year ended 05/31/18 | | | | 7.38 | | | | | 0.42 | | | | | (0.36 | ) | | | | 0.06 | | | | | (0.40 | ) | | | | (0.02 | ) | | | | (0.42 | ) | | | | 7.02 | | | | | 0.62 | | | | | 55,015 | | | | | 1.15 | | | | | 1.29 | | | | | 5.60 | | | | | 48 | |
Class C | | | | | | | | | | | | | | | | | | | | | | | | | | | | | | | | | | | | | | | | | | | | | | | | | | | | | | | | | | | | | | | | | | | | | | |
Year ended 10/31/22 | | | | 6.17 | | | | | 0.21 | | | | | (1.27 | ) | | | | (1.06 | ) | | | | – | | | | | (0.22 | ) | | | | (0.22 | ) | | | | 4.89 | | | | | (17.45 | ) | | | | 4,473 | | | | | 2.21 | (f) | | | | 2.21 | (f) | | | | 3.71 | (f) | | | | 137 | |
Year ended 10/31/21 | | | | 6.53 | | | | | 0.24 | | | | | (0.40 | ) | | | | (0.16 | ) | | | | (0.05 | ) | | | | (0.15 | ) | | | | (0.20 | ) | | | | 6.17 | | | | | (2.62 | ) | | | | 7,568 | | | | | 2.02 | | | | | 2.10 | | | | | 3.59 | | | | | 107 | |
Year ended 10/31/20 | | | | 6.99 | | | | | 0.18 | | | | | (0.45 | ) | | | | (0.27 | ) | | | | (0.05 | ) | | | | (0.14 | ) | | | | (0.19 | ) | | | | 6.53 | | | | | (3.83 | ) | | | | 11,457 | | | | | 2.00 | | | | | 2.04 | | | | | 2.72 | | | | | 50 | |
Five months ended 10/31/19 | | | | 6.68 | | | | | 0.14 | | | | | 0.30 | | | | | 0.44 | | | | | (0.08 | ) | | | | (0.05 | ) | | | | (0.13 | ) | | | | 6.99 | | | | | 6.61 | | | | | 15,332 | | | | | 2.00 | (g) | | | | 2.08 | (g) | | | | 4.81 | (g) | | | | 21 | |
Year ended 05/31/19 | | | | 7.02 | | | | | 0.33 | | | | | (0.34 | ) | | | | (0.01 | ) | | | | (0.15 | ) | | | | (0.18 | ) | | | | (0.33 | ) | | | | 6.68 | | | | | (0.14 | ) | | | | 16,488 | | | | | 2.01 | | | | | 2.04 | | | | | 4.97 | | | | | 67 | |
Year ended 05/31/18 | | | | 7.38 | | | | | 0.36 | | | | | (0.36 | ) | | | | – | | | | | (0.34 | ) | | | | (0.02 | ) | | | | (0.36 | ) | | | | 7.02 | | | | | (0.09 | ) | | | | 19,932 | | | | | 2.00 | | | | | 2.05 | | | | | 4.75 | | | | | 48 | |
Class R | | | | | | | | | | | | | | | | | | | | | | | | | | | | | | | | | | | | | | | | | | | | | | | | | | | | | | | | | | | | | | | | | | | | | | |
Year ended 10/31/22 | | | | 6.17 | | | | | 0.23 | | | | | (1.26 | ) | | | | (1.03 | ) | | | | – | | | | | (0.25 | ) | | | | (0.25 | ) | | | | 4.89 | | | | | (17.02 | ) | | | | 1,472 | | | | | 1.71 | (f) | | | | 1.71 | (f) | | | | 4.21 | (f) | | | | 137 | |
Year ended 10/31/21 | | | | 6.53 | | | | | 0.27 | | | | | (0.40 | ) | | | | (0.13 | ) | | | | (0.05 | ) | | | | (0.18 | ) | | | | (0.23 | ) | | | | 6.17 | | | | | (2.12 | ) | | | | 1,854 | | | | | 1.53 | | | | | 1.60 | | | | | 4.08 | | | | | 107 | |
Year ended 10/31/20 | | | | 6.99 | | | | | 0.21 | | | | | (0.45 | ) | | | | (0.24 | ) | | | | (0.06 | ) | | | | (0.16 | ) | | | | (0.22 | ) | | | | 6.53 | | | | | (3.35 | ) | | | | 2,195 | | | | | 1.50 | | | | | 1.54 | | | | | 3.22 | | | | | 50 | |
Five months ended 10/31/19 | | | | 6.68 | | | | | 0.15 | | | | | 0.30 | | | | | 0.45 | | | | | (0.09 | ) | | | | (0.05 | ) | | | | (0.14 | ) | | | | 6.99 | | | | | 6.84 | | | | | 2,588 | | | | | 1.50 | (g) | | | | 1.58 | (g) | | | | 5.31 | (g) | | | | 21 | |
Year ended 05/31/19 | | | | 7.02 | | | | | 0.36 | | | | | (0.34 | ) | | | | 0.02 | | | | | (0.17 | ) | | | | (0.19 | ) | | | | (0.36 | ) | | | | 6.68 | | | | | 0.50 | | | | | 2,603 | | | | | 1.51 | | | | | 1.54 | | | | | 5.47 | | | | | 67 | |
Year ended 05/31/18 | | | | 7.38 | | | | | 0.39 | | | | | (0.36 | ) | | | | 0.03 | | | | | (0.37 | ) | | | | (0.02 | ) | | | | (0.39 | ) | | | | 7.02 | | | | | 0.27 | | | | | 2,935 | | | | | 1.50 | | | | | 1.55 | | | | | 5.25 | | | | | 48 | |
Class Y | | | | | | | | | | | | | | | | | | | | | | | | | | | | | | | | | | | | | | | | | | | | | | | | | | | | | | | | | | | | | | | | | | | | | | |
Year ended 10/31/22 | | | | 6.17 | | | | | 0.27 | | | | | (1.27 | ) | | | | (1.00 | ) | | | | – | | | | | (0.28 | ) | | | | (0.28 | ) | | | | 4.89 | | | | | (16.59 | ) | | | | 48,253 | | | | | 1.21 | (f) | | | | 1.21 | (f) | | | | 4.71 | (f) | | | | 137 | |
Year ended 10/31/21 | | | | 6.54 | | | | | 0.31 | | | | | (0.41 | ) | | | | (0.10 | ) | | | | (0.07 | ) | | | | (0.20 | ) | | | | (0.27 | ) | | | | 6.17 | | | | | (1.75 | ) | | | | 92,706 | | | | | 1.01 | | | | | 1.10 | | | | | 4.60 | | | | | 107 | |
Year ended 10/31/20 | | | | 7.00 | | | | | 0.25 | | | | | (0.45 | ) | | | | (0.20 | ) | | | | (0.07 | ) | | | | (0.19 | ) | | | | (0.26 | ) | | | | 6.54 | | | | | (2.80 | ) | | | | 92,205 | | | | | 0.95 | | | | | 1.04 | | | | | 3.77 | | | | | 50 | |
Five months ended 10/31/19 | | | | 6.68 | | | | | 0.17 | | | | | 0.31 | | | | | 0.48 | | | | | (0.10 | ) | | | | (0.06 | ) | | | | (0.16 | ) | | | | 7.00 | | | | | 7.24 | | | | | 162,754 | | | | | 0.95 | (g) | | | | 1.08 | (g) | | | | 5.86 | (g) | | | | 21 | |
Year ended 05/31/19 | | | | 7.03 | | | | | 0.40 | | | | | (0.35 | ) | | | | 0.05 | | | | | (0.19 | ) | | | | (0.21 | ) | | | | (0.40 | ) | | | | 6.68 | | | | | 0.91 | | | | | 143,684 | | | | | 0.96 | | | | | 1.03 | | | | | 6.02 | | | | | 67 | |
Year ended 05/31/18 | | | | 7.38 | | | | | 0.44 | | | | | (0.35 | ) | | | | 0.09 | | | | | (0.41 | ) | | | | (0.03 | ) | | | | (0.44 | ) | | | | 7.03 | | | | | 0.96 | | | | | 162,875 | | | | | 0.95 | | | | | 1.04 | | | | | 5.80 | | | | | 48 | |
Class R5 | | | | | | | | | | | | | | | | | | | | | | | | | | | | | | | | | | | | | | | | | | | | | | | | | | | | | | | | | | | | | | | | | | | | | | |
Year ended 10/31/22 | | | | 6.17 | | | | | 0.27 | | | | | (1.26 | ) | | | | (0.99 | ) | | | | – | | | | | (0.29 | ) | | | | (0.29 | ) | | | | 4.89 | | | | | (16.47 | ) | | | | 7 | | | | | 1.05 | (f) | | | | 1.05 | (f) | | | | 4.87 | (f) | | | | 137 | |
Year ended 10/31/21 | | | | 6.53 | | | | | 0.31 | | | | | (0.40 | ) | | | | (0.09 | ) | | | | (0.06 | ) | | | | (0.21 | ) | | | | (0.27 | ) | | | | 6.17 | | | | | (1.54 | ) | | | | 9 | | | | | 0.94 | | | | | 0.99 | | | | | 4.67 | | | | | 107 | |
Year ended 10/31/20 | | | | 6.99 | | | | | 0.25 | | | | | (0.45 | ) | | | | (0.20 | ) | | | | (0.07 | ) | | | | (0.19 | ) | | | | (0.26 | ) | | | | 6.53 | | | | | (2.74 | ) | | | | 10 | | | | | 0.90 | | | | | 0.93 | | | | | 3.82 | | | | | 50 | |
Five months ended 10/31/19 | | | | 6.67 | | | | | 0.17 | | | | | 0.31 | | | | | 0.48 | | | | | (0.10 | ) | | | | (0.06 | ) | | | | (0.16 | ) | | | | 6.99 | | | | | 7.27 | | | | | 11 | | | | | 0.90 | (g) | | | | 1.00 | (g) | | | | 5.91 | (g) | | | | 21 | |
Period ended 05/31/19(h) | | | | 6.63 | | | | | 0.00 | (i) | | | | 0.04 | | | | | 0.04 | | | | | (0.00 | )(i) | | | | (0.00 | )(i) | | | | (0.00 | )(i) | | | | 6.67 | | | | | 0.64 | | | | | 10 | | | | | 0.85 | (g) | | | | 0.85 | (g) | | | | 6.13 | (g) | | | | 67 | |
Class R6 | | | | | | | | | | | | | | | | | | | | | | | | | | | | | | | | | | | | | | | | | | | | | | | | | | | | | | | | | | | | | | | | | | | | | | |
Year ended 10/31/22 | | | | 6.17 | | | | | 0.27 | | | | | (1.26 | ) | | | | (0.99 | ) | | | | – | | | | | (0.29 | ) | | | | (0.29 | ) | | | | 4.89 | | | | | (16.47 | ) | | | | 2,586 | | | | | 1.05 | (f) | | | | 1.05 | (f) | | | | 4.87 | (f) | | | | 137 | |
Year ended 10/31/21 | | | | 6.53 | | | | | 0.31 | | | | | (0.40 | ) | | | | (0.09 | ) | | | | (0.06 | ) | | | | (0.21 | ) | | | | (0.27 | ) | | | | 6.17 | | | | | (1.50 | ) | | | | 4,399 | | | | | 0.91 | | | | | 0.99 | | | | | 4.70 | | | | | 107 | |
Year ended 10/31/20 | | | | 6.99 | | | | | 0.26 | | | | | (0.45 | ) | | | | (0.19 | ) | | | | (0.07 | ) | | | | (0.20 | ) | | | | (0.27 | ) | | | | 6.53 | | | | | (2.72 | ) | | | | 4,222 | | | | | 0.85 | | | | | 0.93 | | | | | 3.87 | | | | | 50 | |
Five months ended 10/31/19 | | | | 6.67 | | | | | 0.17 | | | | | 0.31 | | | | | 0.48 | | | | | (0.10 | ) | | | | (0.06 | ) | | | | (0.16 | ) | | | | 6.99 | | | | | 7.29 | | | | | 22,887 | | | | | 0.85 | (g) | | | | 0.95 | (g) | | | | 5.96 | (g) | | | | 21 | |
Year ended 05/31/19 | | | | 7.02 | | | | | 0.41 | | | | | (0.35 | ) | | | | 0.06 | | | | | (0.19 | ) | | | | (0.22 | ) | | | | (0.41 | ) | | | | 6.67 | | | | | 1.01 | | | | | 8,604 | | | | | 0.86 | | | | | 0.91 | | | | | 6.12 | | | | | 67 | |
Year ended 05/31/18 | | | | 7.37 | | | | | 0.44 | | | | | (0.35 | ) | | | | 0.09 | | | | | (0.41 | ) | | | | (0.03 | ) | | | | (0.44 | ) | | | | 7.02 | | | | | 1.05 | | | | | 7,601 | | | | | 0.85 | | | | | 0.87 | | | | | 5.90 | | | | | 48 | |
| (a) | Calculated using average shares outstanding. |
| (b) | Includes adjustments in accordance with accounting principles generally accepted in the United States of America and as such, the net asset value for financial reporting purposes and the returns based upon those net asset values may differ from the net asset value and returns for shareholder transactions. Does not include sales charges and is not annualized for periods less than one year, if applicable. |
| (c) | Does not include indirect expenses from affiliated fund fees and expenses of 0.00% for the five months ended October 31, 2019 and the years ended May 31, 2019 and 2018. |
| (d) | Portfolio turnover is calculated at the fund level and is not annualized for periods less than one year, if applicable. |
| (e) | The total return, ratio of expenses to average net assets and ratio of net investment income to average net assets reflect actual 12b-1 fees of 0.24% for the years ended October 31, 2022 and 2020. |
| (f) | Ratios include interest, facilities and maintenance fees of 0.09% for the year ended October 31, 2022. |
| (h) | For the period from after the close of business on May 24, 2019 (inception of offering) to May 31, 2019. |
| (i) | Amount represents less than 0.005%. |
See accompanying Notes to Financial Statements which are an integral part of the financial statements.
| | |
| 19 | | Invesco Emerging Markets Local Debt Fund |
Notes to Financial Statements
October 31, 2022
NOTE 1–Significant Accounting Policies
Invesco Emerging Markets Local Debt Fund (the “Fund”) is a series portfolio of AIM Investment Funds (Invesco Investment Funds) (the “Trust”). The Trust is organized as a Delaware statutory trust and is registered under the Investment Company Act of 1940, as amended (the “1940 Act”), as an open-end series management investment company authorized to issue an unlimited number of shares of beneficial interest. Information presented in these financial statements pertains only to the Fund. Matters affecting the Fund or each class will be voted on exclusively by the shareholders of the Fund or each class.
The Fund’s investment objective is to seek total return.
The Fund currently consists of six different classes of shares: Class A, Class C, Class R, Class Y, Class R5 and Class R6. Class Y shares are available only to certain investors. Class A shares are sold with a front-end sales charge unless certain waiver criteria are met. Under certain circumstances, load waived shares may be subject to contingent deferred sales charges (“CDSC”). Class C shares are sold with a CDSC. Class R, Class Y, Class R5 and Class R6 shares are sold at net asset value. Class C shares held for eight years after purchase are eligible for automatic conversion into Class A shares of the same Fund (the “Conversion Feature”). The automatic conversion pursuant to the Conversion Feature will generally occur at the end of the month following the eighth anniversary after a purchase of Class C shares.
The Fund is an investment company and accordingly follows the investment company accounting and reporting guidance in accordance with Financial Accounting Standards Board Accounting Standards Codification Topic 946, Financial Services – Investment Companies.
The following is a summary of the significant accounting policies followed by the Fund in the preparation of its financial statements.
| A. | Security Valuations - Securities, including restricted securities, are valued according to the following policy. |
Fixed income securities (including convertible debt securities) generally are valued on the basis of prices provided by independent pricing services. Prices provided by the pricing service may be determined without exclusive reliance on quoted prices, and may reflect appropriate factors such as institution-size trading in similar groups of securities, developments related to specific securities, dividend rate (for unlisted equities), yield (for debt obligations), quality, type of issue, coupon rate (for debt obligations), maturity (for debt obligations), individual trading characteristics and other market data. Pricing services generally value debt obligations assuming orderly transactions of institutional round lot size, but a fund may hold or transact in the same securities in smaller, odd lot sizes. Odd lots often trade at lower prices than institutional round lots, and their value may be adjusted accordingly. Debt obligations are subject to interest rate and credit risks. In addition, all debt obligations involve some risk of default with respect to interest and/or principal payments.
A security listed or traded on an exchange is generally valued at its trade price or official closing price that day as of the close of the exchange where the security is principally traded, or lacking any trades or official closing price on a particular day, the security may be valued at the closing bid price on that day. Securities traded in the over-the-counter market are valued based on prices furnished by independent pricing services or market makers. When such securities are valued using prices provided by an independent pricing service they may be considered fair valued. Futures contracts are valued at the daily settlement price set by an exchange on which they are principally traded. U.S. exchange-traded options are valued at the mean between the last bid and asked prices from the exchange on which they are principally traded. Non-U.S. exchange-traded options are valued at the final settlement price set by the exchange on which they trade. Options not listed on an exchange and swaps generally are valued using pricing provided from independent pricing services.
Securities of investment companies that are not exchange-traded (e.g., open-end mutual funds) are valued using such company’s end-of-business-day net asset value per share.
Deposits, other obligations of U.S. and non-U.S. banks and financial institutions are valued at their daily account value.
Swap agreements are fair valued using an evaluated quote, if available, provided by an independent pricing service. Evaluated quotes provided by the pricing service are valued based on a model which may include end-of-day net present values, spreads, ratings, industry, company performance and returns of referenced assets. Centrally cleared swap agreements are valued at the daily settlement price determined by the relevant exchange or clearinghouse.
Foreign securities’ (including foreign exchange contracts) prices are converted into U.S. dollar amounts using the applicable exchange rates as of the close of the New York Stock Exchange (“NYSE”). If market quotations are available and reliable for foreign exchange-traded equity securities, the securities will be valued at the market quotations. Invesco Advisers, Inc. (the “Adviser” or “Invesco”) may use various pricing services to obtain market quotations as well as fair value prices. Because trading hours for certain foreign securities end before the close of the NYSE, closing market quotations may become not representative of market value in the Adviser’s judgment (“unreliable”). If, between the time trading ends on a particular security and the close of the customary trading session on the NYSE, a significant event occurs that makes the closing price of the security unreliable, the Adviser may fair value the security. If the event is likely to have affected the closing price of the security, the security will be valued at fair value in good faith in accordance with Board- approved policies and related Adviser procedures (“Valuation Procedures”). Adjustments to closing prices to reflect fair value may also be based on a screening process of an independent pricing service to indicate the degree of certainty, based on historical data, that the closing price in the principal market where a foreign security trades is not the current value as of the close of the NYSE. Foreign securities’ prices meeting the degree of certainty that the price is not reflective of current value will be priced at the indication of fair value from the independent pricing service. Multiple factors may be considered by the independent pricing service in determining adjustments to reflect fair value and may include information relating to sector indices, American Depositary Receipts and domestic and foreign index futures. Foreign securities may have additional risks including exchange rate changes, potential for sharply devalued currencies and high inflation, political and economic upheaval, the relative lack of issuer information, relatively low market liquidity and the potential lack of strict financial and accounting controls and standards.
Unlisted securities will be valued using prices provided by independent pricing services or by another method that the Adviser, in its judgment, believes better reflects the security’s fair value in accordance with the Valuation Procedures.
Securities for which market prices are not provided by any of the above methods may be valued based upon quotes furnished by independent sources. The last bid price may be used to value equity securities. The mean between the last bid and asked prices may be used to value debt obligations, including corporate loans.
Securities for which market quotations are not readily available are fair valued by the Adviser in accordance with the Valuation Procedures. If a fair value price provided by a pricing service is unreliable, the Adviser will fair value the security using the Valuation Procedures. Issuer specific events, market trends, bid/asked quotes of brokers and information providers and other market data may be reviewed in the course of making a good faith determination of a security’s fair value.
The Fund may invest in securities that are subject to interest rate risk, meaning the risk that the prices will generally fall as interest rates rise and, conversely, the prices will generally rise as interest rates fall. Specific securities differ in their sensitivity to changes in interest rates depending on their individual characteristics. Changes in interest rates may result in increased market volatility, which may affect the value and/or liquidity of certain Fund investments.
Valuations change in response to many factors including the historical and prospective earnings of the issuer, the value of the issuer’s assets, general market conditions which are not specifically related to the particular issuer, such as real or perceived adverse economic conditions, changes in the general outlook for revenues or corporate earnings, changes in interest or currency rates, regional or global instability, natural or environmental disasters, widespread disease or other public health issues, war, acts of terrorism, significant governmental actions or adverse investor sentiment generally and market liquidity. Because of the inherent uncertainties of valuation, the values reflected in the financial statements may materially differ from the value received upon actual sale of those investments.
The price the Fund could receive upon the sale of any investment may differ from the Adviser’s valuation of the investment, particularly for securities that are valued using a fair valuation technique. When fair valuation techniques are applied, the Adviser uses available information, including both observable and unobservable inputs and assumptions, to determine a methodology that will result in a valuation that the Adviser believes approximates market value. Fund
| | |
| 20 | | Invesco Emerging Markets Local Debt Fund |
securities that are fair valued may be subject to greater fluctuation in their value from one day to the next than would be the case if market quotations were used. Because of the inherent uncertainties of valuation, and the degree of subjectivity in such decisions, the Fund could realize a greater or lesser than expected gain or loss upon the sale of the investment.
| B. | Securities Transactions and Investment Income – Securities transactions are accounted for on a trade date basis. Realized gains or losses on sales are computed on the basis of specific identification of the securities sold. Interest income (net of withholding tax, if any) is recorded on an accrual basis from settlement date and includes coupon interest and amortization of premium and accretion of discount on debt securities as applicable. Dividend income (net of withholding tax, if any) is recorded on the ex-dividend date. |
The Fund may periodically participate in litigation related to Fund investments. As such, the Fund may receive proceeds from litigation settlements.Any proceeds received are included in the Statement of Operations as realized gain (loss) for investments no longer held and as unrealized gain (loss) for investments still held.
Brokerage commissions and mark ups are considered transaction costs and are recorded as an increase to the cost basis of securities purchased and/or a reduction of proceeds on a sale of securities. Such transaction costs are included in the determination of net realized and unrealized gain (loss) from investment securities reported in the Statement of Operations and the Statement of Changes in Net Assets and the net realized and unrealized gains (losses) on securities per share in the Financial Highlights. Transaction costs are included in the calculation of the Fund’s net asset value and, accordingly, they reduce the Fund’s total returns. These transaction costs are not considered operating expenses and are not reflected in net investment income reported in the Statement of Operations and the Statement of Changes in Net Assets, or the net investment income per share and the ratios of expenses and net investment income reported in the Financial Highlights, nor are they limited by any expense limitation arrangements between the Fund and the investment adviser.
The Fund allocates income and realized and unrealized capital gains and losses to a class based on the relative net assets of each class.
| C. | Country Determination – For the purposes of making investment selection decisions and presentation in the Schedule of Investments, the investment adviser may determine the country in which an issuer is located and/or credit risk exposure based on various factors. These factors include the laws of the country under which the issuer is organized, where the issuer maintains a principal office, the country in which the issuer derives 50% or more of its total revenues, the country that has the primary market for the issuer’s securities and its “country of risk” as determined by a third party service provider, as well as other criteria. Among the other criteria that may be evaluated for making this determination are the country in which the issuer maintains 50% or more of its assets, the type of security, financial guarantees and enhancements, the nature of the collateral and the sponsor organization. Country of issuer and/or credit risk exposure has been determined to be the United States of America, unless otherwise noted. |
| D. | Distributions – Distributions from net investment income, if any, are declared daily and paid monthly. Distributions from net realized capital gain, if any, are generally declared and paid annually and recorded on the ex-dividend date. The Fund may elect to treat a portion of the proceeds from redemptions as distributions for federal income tax purposes. |
| E. | Federal Income Taxes –The Fund intends to comply with the requirements of Subchapter M of the Internal Revenue Code of 1986, as amended (the “Internal Revenue Code”), necessary to qualify as a regulated investment company and to distribute substantially all of the Fund’s taxable earnings to shareholders. As such, the Fund will not be subject to federal income taxes on otherwise taxable income (including net realized capital gain) that is distributed to shareholders. Therefore, no provision for federal income taxes is recorded in the financial statements. |
The Fund recognizes the tax benefits of uncertain tax positions only when the position is more likely than not to be sustained. Management has analyzed the Fund’s uncertain tax positions and concluded that no liability for unrecognized tax benefits should be recorded related to uncertain tax positions. Management is not aware of any tax positions for which it is reasonably possible that the total amounts of unrecognized tax benefits will change materially in the next 12 months.
The Fund files tax returns in the U.S. Federal jurisdiction and certain other jurisdictions. Generally, the Fund is subject to examinations by such taxing authorities for up to three years after the filing of the return for the tax period.
| F. | Expenses – Fees provided for under the Rule 12b-1 plan of a particular class of the Fund are charged to the operations of such class. Transfer agency fees and expenses and other shareholder recordkeeping fees and expenses attributable to Class R5 and Class R6 are allocated based on relative net assets of Class R5 and Class R6. Sub-accounting fees attributable to Class R5 are charged to the operations of the class. Transfer agency fees and expenses and other shareholder recordkeeping fees and expenses relating to all other classes are allocated among those classes based on relative net assets. All other expenses are allocated among the classes based on relative net assets. |
| G. | Interest, Facilities and Maintenance Fees – Interest, Facilities and Maintenance Fees include interest and related borrowing costs such as commitment fees, administrative expenses, negative or overdrawn balances on margin accounts, and other expenses associated with establishing and maintaining a line of credit. |
| H. | Accounting Estimates – The preparation of financial statements in conformity with accounting principles generally accepted in the United States of America (“GAAP”) requires management to make estimates and assumptions that affect the reported amounts of assets and liabilities at the date of the financial statements and the reported amounts of revenues and expenses during the reporting period including estimates and assumptions related to taxation. Actual results could differ from those estimates by a significant amount. In addition, the Fund monitors for material events or transactions that may occur or become known after the period-end date and before the date the financial statements are released to print. |
| I. | Indemnifications – Under the Trust’s organizational documents, each Trustee, officer, employee or other agent of the Trust is indemnified against certain liabilities that may arise out of the performance of their duties to the Fund. Additionally, in the normal course of business, the Fund enters into contracts, including the Fund’s servicing agreements, that contain a variety of indemnification clauses. The Fund’s maximum exposure under these arrangements is unknown as this would involve future claims that may be made against the Fund that have not yet occurred. The risk of material loss as a result of such indemnification claims is considered remote. |
| J. | Foreign Currency Translations – Foreign currency is valued at the close of the NYSE based on quotations posted by banks and major currency dealers. Portfolio securities and other assets and liabilities denominated in foreign currencies are translated into U.S. dollar amounts at the date of valuation. Purchases and sales of portfolio securities (net of foreign taxes withheld on disposition) and income items denominated in foreign currencies are translated into U.S. dollar amounts on the respective dates of such transactions. The Fund does not separately account for the portion of the results of operations resulting from changes in foreign exchange rates on investments and the fluctuations arising from changes in market prices of securities held. The combined results of changes in foreign exchange rates and the fluctuation of market prices on investments (net of estimated foreign tax withholding) are included with the net realized and unrealized gain or loss from investments in the Statement of Operations. Reported net realized foreign currency gains or losses arise from (1) sales of foreign currencies, (2) currency gains or losses realized between the trade and settlement dates on securities transactions, and (3) the difference between the amounts of dividends, interest, and foreign withholding taxes recorded on the Fund’s books and the U.S. dollar equivalent of the amounts actually received or paid. Net unrealized foreign currency gains and losses arise from changes in the fair values of assets and liabilities, other than investments in securities at fiscal period end, resulting from changes in exchange rates. |
The Fund may invest in foreign securities, which may be subject to foreign taxes on income, gains on investments or currency repatriation, a portion of which may be recoverable. Foreign taxes, if any, are recorded based on the tax regulations and rates that exist in the foreign markets in which the Fund invests and are shown in the Statement of Operations.
| | |
| 21 | | Invesco Emerging Markets Local Debt Fund |
| K. | Forward Foreign Currency Contracts – The Fund may engage in foreign currency transactions either on a spot (i.e. for prompt delivery and settlement) basis, or through forward foreign currency contracts, to manage or minimize currency or exchange rate risk. |
The Fund may also enter into forward foreign currency contracts for the purchase or sale of a security denominated in a foreign currency in order to “lock in” the U.S. dollar price of that security, or the Fund may also enter into forward foreign currency contracts that do not provide for physical exchange of the two currencies on the settlement date, but instead are settled by a single cash payment calculated as the difference between the agreed upon exchange rate and the spot rate at settlement based upon an agreed upon notional amount (non-deliverable forwards).
A forward foreign currency contract is an obligation between two parties (“Counterparties”) to purchase or sell a specific currency for an agreed-upon price at a future date. The use of forward foreign currency contracts for hedging does not eliminate fluctuations in the price of the underlying securities the Fund owns or intends to acquire but establishes a rate of exchange in advance. Fluctuations in the value of these contracts are measured by the difference in the contract date and reporting date exchange rates and are recorded as unrealized appreciation (depreciation) until the contracts are closed. When the contracts are closed, realized gains (losses) are recorded. Realized and unrealized gains (losses) on the contracts are included in the Statement of Operations. The primary risks associated with forward foreign currency contracts include failure of the Counterparty to meet the terms of the contract and the value of the foreign currency changing unfavorably. These risks may be in excess of the amounts reflected in the Statement of Assets and Liabilities.
| L. | Call Options Purchased and Written – The Fund may write covered call options and/or buy call options. A covered call option gives the purchaser of such option the right to buy, and the writer the obligation to sell, the underlying security or foreign currency at the stated exercise price during the option period. |
Options written by the Fund normally will have expiration dates between three and nine months from the date written. The exercise price of a call option may be below, equal to, or above the current market value of the underlying security at the time the option is written.
Additionally, the Fund may enter into an option on a swap agreement, also called a “swaption”. A swaption is an option that gives the buyer the right, but not the obligation, to enter into a swap on a future date in exchange for paying a market-based premium. A receiver swaption gives the owner the right to receive the total return of a specified asset, reference rate or index. Swaptions also include options that allow an existing swap to be terminated or extended by one of the Counterparties.
When the Fund writes a covered call option, an amount equal to the premium received by the Fund is recorded as an asset and an equivalent liability in the Statement of Assets and Liabilities. The amount of the liability is subsequently “marked-to-market” to reflect the current market value of the option written. If a written covered call option expires on the stipulated expiration date, or if the Fund enters into a closing purchase transaction, the Fund realizes a gain (or a loss if the closing purchase transaction exceeds the premium received when the option was written) without regard to any unrealized gain or loss on the underlying security, and the liability related to such option is extinguished. If a written covered call option is exercised, the Fund realizes a gain or a loss from the sale of the underlying security and the proceeds of the sale are increased by the premium originally received. Realized and unrealized gains and losses on call options written are included in the Statement of Operations as Net realized gain (loss) from and Change in net unrealized appreciation (depreciation) of Option contracts written. A risk in writing a covered call option is that the Fund gives up the opportunity for profit if the market price of the security increases and the option is exercised.
When the Fund buys a call option, an amount equal to the premium paid by the Fund is recorded as an investment on the Statement of Assets and Liabilities. The amount of the investment is subsequently “marked-to-market” to reflect the current value of the option purchased. Realized and unrealized gains and losses on call options purchased are included in the Statement of Operations as Net realized gain (loss) from and Change in net unrealized appreciation (depreciation) of Investment securities. A risk in buying an option is that the Fund pays a premium whether or not the option is exercised. In addition, there can be no assurance that a liquid secondary market will exist for any option purchased.
| M. | Put Options Purchased and Written – The Fund may purchase and write put options including options on securities indexes, or foreign currency and/or futures contracts. By purchasing a put option, the Fund obtains the right (but not the obligation) to sell the option’s underlying instrument at a fixed strike price. In return for this right, the Fund pays an option premium. The option’s underlying instrument may be a security, securities index, or a futures contract. |
Additionally, the Fund may enter into an option on a swap agreement, also called a “swaption”. A swaption is an option that gives the buyer the right, but not the obligation, to enter into a swap on a future date in exchange for paying a market-based premium. A receiver swaption gives the owner the right to receive the total return of a specified asset, reference rate or index. Swaptions also include options that allow an existing swap to be terminated or extended by one of the Counterparties.
Put options may be used by the Fund to hedge securities it owns by locking in a minimum price at which the Fund can sell. If security prices fall, the put option could be exercised to offset all or a portion of the Fund’s resulting losses. At the same time, because the maximum the Fund has at risk is the cost of the option, purchasing put options does not eliminate the potential for the Fund to profit from an increase in the value of the underlying portfolio securities. The Fund may write put options to earn additional income in the form of option premiums if it expects the price of the underlying instrument to remain stable or rise during the option period so that the option will not be exercised. The risk in this strategy is that the price of the underlying securities may decline by an amount greater than the premium received. Put options written are reported as a liability in the Statement of Assets and Liabilities. Realized and unrealized gains and losses on put options purchased and put options written are included in the Statement of Operations as Net realized gain (loss) from and Change in net unrealized appreciation (depreciation) of Investment securities and Option contracts written, respectively. A risk in buying an option is that the Fund pays a premium whether or not the option is exercised. In addition, there can be no assurance that a liquid secondary market will exist for any option purchased.
| N. | Swap Agreements – The Fund may enter into various swap transactions, including interest rate, total return, index, currency and credit default swap contracts (“CDS”) for investment purposes or to manage interest rate, currency or credit risk. Such transactions are agreements between Counterparties. A swap agreement may be negotiated bilaterally and traded over-the-counter (“OTC”) between two parties (“uncleared/ OTC”) or, in some instances, must be transacted through a future commission merchant (“FCM”) and cleared through a clearinghouse that serves as a central Counterparty (“centrally cleared swap”). These agreements may contain among other conditions, events of default and termination events, and various covenants and representations such as provisions that require the Fund to maintain a pre-determined level of net assets, and/ or provide limits regarding the decline of the Fund’s net asset value (“NAV”) per share over specific periods of time. If the Fund were to trigger such provisions and have open derivative positions at that time, the Counterparty may be able to terminate such agreement and request immediate payment in an amount equal to the net liability positions, if any. |
Interest rate, total return, index, and currency swap agreements are two-party contracts entered into primarily to exchange the returns (or differentials in rates of returns) earned or realized on particular predetermined investments or instruments. The gross returns to be exchanged or “swapped” between the parties are calculated with respect to a notional amount, i.e., the return on or increase in value of a particular dollar amount invested at a particular interest rate or return of an underlying asset, in a particular foreign currency, or in a “basket” of securities representing a particular index.
In a centrally cleared swap, the Fund’s ultimate Counterparty is a central clearinghouse. The Fund initially will enter into centrally cleared swaps through an executing broker. When a fund enters into a centrally cleared swap, it must deliver to the central Counterparty (via the FCM) an amount referred to as “initial margin.” Initial margin requirements are determined by the central Counterparty, but an FCM may require additional initial margin above the amount required by the central Counterparty. Initial margin deposits required upon entering into centrally cleared swaps are satisfied by cash or securities as collateral at the FCM. Securities deposited as initial margin are designated on the Schedule of Investments and cash deposited is recorded on the Statement of Assets and Liabilities. During the term of a cleared swap agreement, a “variation margin” amount may be required to be paid by the Fund or may be received by the Fund, based on the daily change in price of the underlying reference instrument subject to the swap agreement and is recorded as a receivable or payable for variation margin in the Statement of Assets and Liabilities until the centrally cleared swap is terminated at which time a realized gain or loss is recorded.
A CDS is an agreement between Counterparties to exchange the credit risk of an issuer. A buyer of a CDS is said to buy protection by paying a fixed payment over the life of the agreement and in some situations an upfront payment to the seller of the CDS. If a defined credit event occurs (such as payment default or
| | |
| 22 | | Invesco Emerging Markets Local Debt Fund |
bankruptcy), the Fund as a protection buyer would cease paying its fixed payment, the Fund would deliver eligible bonds issued by the reference entity to the seller, and the seller would pay the full notional value, or the “par value”, of the referenced obligation to the Fund. A seller of a CDS is said to sell protection and thus would receive a fixed payment over the life of the agreement and an upfront payment, if applicable. If a credit event occurs, the Fund as a protection seller would cease to receive the fixed payment stream, the Fund would pay the buyer “par value” or the full notional value of the referenced obligation, and the Fund would receive the eligible bonds issued by the reference entity. In turn, these bonds may be sold in order to realize a recovery value. Alternatively, the seller of the CDS and its Counterparty may agree to net the notional amount and the market value of the bonds and make a cash payment equal to the difference to the buyer of protection. If no credit event occurs, the Fund receives the fixed payment over the life of the agreement. As the seller, the Fund would effectively add leverage to its portfolio because, in addition to its total net assets, the Fund would be subject to investment exposure on the notional amount of the CDS. In connection with these agreements, cash and securities may be identified as collateral in accordance with the terms of the respective swap agreements to provide assets of value and recourse in the event of default under the swap agreement or bankruptcy/insolvency of a party to the swap agreement. If a Counterparty becomes bankrupt or otherwise fails to perform its obligations due to financial difficulties, the Fund may experience significant delays in obtaining any recovery in a bankruptcy or other reorganization proceeding. The Fund may obtain only limited recovery or may obtain no recovery in such circumstances. The Fund’s maximum risk of loss from Counterparty risk, either as the protection seller or as the protection buyer, is the value of the contract. The risk may be mitigated by having a master netting arrangement between the Fund and the Counterparty and by the designation of collateral by the Counterparty to cover the Fund’s exposure to the Counterparty.
Implied credit spreads represent the current level at which protection could be bought or sold given the terms of the existing CDS contract and serve as an indicator of the current status of the payment/performance risk of the CDS. An implied spread that has widened or increased since entry into the initial contract may indicate a deteriorating credit profile and increased risk of default for the reference entity. A declining or narrowing spread may indicate an improving credit profile or decreased risk of default for the reference entity. Alternatively, credit spreads may increase or decrease reflecting the general tolerance for risk in the credit markets.
An interest rate swap is an agreement between Counterparties pursuant to which the parties exchange a floating rate payment for a fixed rate payment based on a specified notional amount.
Changes in the value of centrally cleared and OTC swap agreements are recognized as unrealized gains (losses) in the Statement of Operations by “marking to market” on a daily basis to reflect the value of the swap agreement at the end of each trading day. Payments received or paid at the beginning of the agreement are reflected as such on the Statement of Assets and Liabilities and may be referred to as upfront payments. The Fund accrues for the fixed payment stream and amortizes upfront payments, if any, on swap agreements on a daily basis with the net amount, recorded as a component of realized gain (loss) on the Statement of Operations. A liquidation payment received or made at the termination of a swap agreement is recorded as realized gain (loss) on the Statement of Operations. Cash held as collateral is recorded as deposits with brokers on the Statement of Assets and Liabilities. Entering into these agreements involves, to varying degrees, lack of liquidity and elements of credit, market, and Counterparty risk in excess of amounts recognized on the Statement of Assets and Liabilities. Such risks involve the possibility that a swap is difficult to sell or liquidate; the Counterparty does not honor its obligations under the agreement and unfavorable interest rates and market fluctuations. It is possible that developments in the swaps market, including potential government regulation, could adversely affect the Fund’s ability to terminate existing swap agreements or to realize amounts to be received under such agreements. Additionally, an International Swaps and Derivatives Association Master Agreement (“ISDA Master Agreement”) includes credit related contingent features which allow Counterparties to OTC derivatives to terminate derivative contracts prior to maturity in the event that, for example, the Fund’s net assets decline by a stated percentage or the Fund fails to meet the terms of its ISDA Master Agreement, which would cause the Fund to accelerate payment of any net liability owed to the Counterparty. A short position in a security poses more risk than holding the same security long. As there is no limit on how much the price of the security can increase, the Fund’s exposure is unlimited.
Notional amounts of each individual credit default swap agreement outstanding as of October 31, 2022, if any, for which the Fund is the seller of protection are disclosed in the open swap agreements table. These potential amounts would be partially offset by any recovery values of the respective referenced obligations, upfront payments received upon entering into the agreement, or net amounts received from the settlement of buy protection credit default swap agreements entered into by the Fund for the same referenced entity or entities.
| O. | LIBOR Risk – The Fund may have investments in financial instruments that utilize the London Interbank Offered Rate (“LIBOR”) as the reference or benchmark rate for variable interest rate calculations. LIBOR is intended to measure the rate generally at which banks can lend and borrow from one another in the relevant currency on an unsecured basis. The UK Financial Conduct Authority (“FCA”), the regulator that oversees LIBOR, announced that the majority of LIBOR rates would cease to be published or would no longer be representative on January 1, 2022. Although the publication of most LIBOR rates ceased at the end of 2021, a selection of widely used USD LIBOR rates continues to be published until June 2023 to allow for an orderly transition away from these rates. |
There remains uncertainty and risks relating to the continuing LIBOR transition and its effects on the Fund and the instruments in which the Fund invests. There can be no assurance that the composition or characteristics of any alternative reference rates (“ARRs”) or financial instruments in which the Fund invests that utilize ARRs will be similar to or produce the same value or economic equivalence as LIBOR or that these instruments will have the same volume or liquidity. Additionally, there remains uncertainty and risks relating to certain “legacy” USD LIBOR instruments that were issued or entered into before December 31, 2021 and the process by which a replacement interest rate will be identified and implemented into these instruments when USD LIBOR is ultimately discontinued. The effects of such uncertainty and risks in “legacy” USD LIBOR instruments held by the Fund could result in losses to the Fund.
| P. | Leverage Risk – Leverage exists when the Fund can lose more than it originally invests because it purchases or sells an instrument or enters into a transaction without investing an amount equal to the full economic exposure of the instrument or transaction. |
| Q. | Collateral –To the extent the Fund has designated or segregated a security as collateral and that security is subsequently sold, it is the Fund’s practice to replace such collateral no later than the next business day. |
| R. | Other Risks – The Fund is non-diversified and may invest in securities of fewer issuers than if it were diversified. Thus, the value of the Fund’s shares may vary more widely and the Fund may be subject to greater market and credit risk than if the Fund invested more broadly. |
Active trading of portfolio securities may result in added expenses, a lower return and increased tax liability.
Emerging markets (also referred to as developing markets) are generally subject to greater market volatility, political, social and economic instability, uncertainty regarding the existence of trading markets and more governmental limitations on foreign investment than more developed markets. In addition, companies operating in emerging markets may be subject to lower trading volume and greater price fluctuations than companies in more developed markets. Securities law in many emerging market countries is relatively new and unsettled. Therefore, laws regarding foreign investment in emerging market securities, securities regulation, title to securities, and shareholder rights may change quickly and unpredictably. In addition, the enforcement of systems of taxation at federal, regional and local levels in emerging market countries may be inconsistent, and subject to sudden change. Other risks of investing in emerging markets securities may include additional transaction costs, delays in settlement procedures, and lack of timely information.
Following Russia’s invasion of Ukraine in late February 2022, various countries, including the United States, as well as NATO and the European Union, issued broad-ranging economic sanctions against Russia and Belarus. The resulting responses to the military actions (and potential further sanctions in response to continued military activity), the potential for military escalation and other corresponding events, have had, and could continue to have, severe negative effects on regional and global economic and financial markets, including increased volatility, reduced liquidity and overall uncertainty. The negative impacts may be particularly acute in certain sectors including, but not limited to, energy and financials. Russia may take additional counter measures or retaliatory actions (including cyberattacks), which could exacerbate negative consequences on global financial markets. The duration of ongoing hostilities and corresponding
| | |
| 23 | | Invesco Emerging Markets Local Debt Fund |
sanctions and related events cannot be predicted. The foregoing may result in a negative impact on Fund performance and the value of an investment in the Fund, even beyond any direct investment exposure the Fund may have to Russian issuers or the adjoining geographic regions.
| S. | COVID-19 Risk – The COVID-19 strain of coronavirus has resulted in instances of market closures and dislocations, extreme volatility, liquidity constraints and increased trading costs. Efforts to contain its spread have resulted in travel restrictions, disruptions of healthcare systems, business operations (including business closures) and supply chains, layoffs, lower consumer demand and employee availability, and defaults and credit downgrades, among other significant economic impacts that have disrupted global economic activity across many industries. Such economic impacts may exacerbate other pre-existing political, social and economic risks locally or globally and cause general concern and uncertainty. The full economic impact and ongoing effects of COVID-19 (or other future epidemics or pandemics) at the macro-level and on individual businesses are unpredictable and may result in significant and prolonged effects on the Fund’s performance. |
NOTE 2–Advisory Fees and Other Fees Paid to Affiliates
The Trust has entered into a master investment advisory agreement with the Adviser. Under the terms of the investment advisory agreement, the Fund accrues daily and pays monthly an advisory fee to the Adviser based on the annual rate of the Fund’s average daily net assets as follows:
| | | | |
| Average Daily Net Assets | | Rate* | |
|
| |
First $ 500 million | | | 0.700% | |
|
| |
Next $500 million | | | 0.650% | |
|
| |
Next $4 billion | | | 0.600% | |
|
| |
Over $5 billion | | | 0.580% | |
|
| |
| * | The advisory fee paid by the Fund shall be reduced by any amounts paid by the Fund under the administrative services agreement with the Adviser. |
For the year ended October 31, 2022, the effective advisory fee rate incurred by the Fund was 0.70%.
Under the terms of a master sub-advisory agreement between the Adviser and each of Invesco Asset Management Deutschland GmbH, Invesco Asset Management Limited, Invesco Asset Management (Japan) Limited, Invesco Hong Kong Limited, Invesco Senior Secured Management, Inc. and Invesco Canada Ltd. and separate sub-advisory agreements with Invesco Capital Management LLC and Invesco Asset Management (India) Private Limited (collectively, the “Affiliated Sub-Advisers”) the Adviser, not the Fund, will pay 40% of the fees paid to the Adviser to any such Affiliated Sub-Adviser(s) that provide(s) discretionary investment management services to the Fund based on the percentage of assets allocated to such Affiliated Sub-Adviser(s). Invesco has also entered into a sub-advisory agreement with OppenheimerFunds, Inc. to provide discretionary management services to the Fund.
The Adviser has contractually agreed, through February 28, 2023, to waive advisory fees and/or reimburse expenses of all shares to the extent necessary to limit total annual fund operating expenses after fee waiver and/or expense reimbursement (excluding certain items discussed below) of Class A, Class C, Class R, Class Y, Class R5 and Class R6 shares to 1.50%, 2.25%, 1.75%, 1.25%, 1.25%, and 1.25%, respectively, of the Fund’s average daily net assets (the “expense limits”). Effective March 1, 2023 through at least February 29, 2024, the Adviser has contractually agreed to waive advisory fees and/or reimburse expenses of all shares to the extent necessary to limit total annual fund operating expenses after fee waiver and/or expense reimbursement (excluding certain items discussed below) of Class A, Class C, Class R, Class Y, Class R5 and Class R6 shares to 1.20%, 1.95%, 1.45%, 0.95%, 0.95%, and 0.95%, respectively, of the Fund’s average daily net assets. In determining the Adviser’s obligation to waive advisory fees and/or reimburse expenses, the following expenses are not taken into account, and could cause total annual fund operating expenses after fee waivers and/or expense reimbursement to exceed the numbers reflected above: (1) interest, facilities and maintenance fees; (2) taxes; (3) dividend expenses on short sales; (4) extraordinary or non-routine items, including litigation expenses; and (5) expenses that the Fund has incurred but did not actually pay because of an expense offset arrangement. Unless Invesco continues the fee waiver agreement, it will terminate February 29, 2024. During its term, the fee waiver agreement cannot be terminated or amended to increase the expense limits or reduce the advisory fee waiver without approval of the Board of Trustees.
Further, the Adviser has contractually agreed, through at least June 30, 2024, to waive the advisory fee payable by the Fund in an amount equal to 100% of the net advisory fees the Adviser receives from the affiliated money market funds on investments by the Fund of uninvested cash in such affiliated money market funds.
For the year ended October 31, 2022, the Adviser waived advisory fees of $4,485.
The Trust has entered into a master administrative services agreement with Invesco pursuant to which the Fund has agreed to pay Invesco for certain administrative costs incurred in providing accounting services to the Fund. For the year ended October 31, 2022, expenses incurred under the agreement are shown in the Statement of Operations as Administrative services fees. Invesco has entered into a sub-administration agreement whereby State Street Bank and Trust Company (“SSB”) serves as fund accountant and provides certain administrative services to the Fund. Pursuant to a custody agreement with the Trust on behalf of the Fund, SSB also serves as the Fund’s custodian.
The Trust has entered into a transfer agency and service agreement with Invesco Investment Services, Inc. (“IIS”) pursuant to which the Fund has agreed to pay IIS a fee for providing transfer agency and shareholder services to the Fund and reimburse IIS for certain expenses incurred by IIS in the course of providing such services. IIS may make payments to intermediaries that provide omnibus account services, sub-accounting services and/or networking services. All fees payable by IIS to intermediaries that provide omnibus account services or sub-accounting services are charged back to the Fund, subject to certain limitations approved by the Trust’s Board of Trustees. For the year ended October 31, 2022, expenses incurred under the agreement are shown in the Statement of Operations as Transfer agent fees.
The Trust has entered into master distribution agreements with Invesco Distributors, Inc. (“IDI”) to serve as the distributor for the Class A, Class C, Class R, Class Y, Class R5 and Class R6 shares of the Fund. The Trust has adopted plans pursuant to Rule 12b-1 under the 1940 Act with respect to the Fund’s Class A, Class C and Class R shares (collectively, the “Plans”). The Fund, pursuant to the Class A Plan, reimburses IDI for its allocated share of expenses incurred for the period, up to a maximum annual rate of 0.25% of the average daily net assets of Class A shares. The Fund, pursuant to the Class C and Class R Plans, pays IDI compensation at the annual rate of 1.00% of the average daily net assets of Class C shares and 0.50% of the average daily net assets of Class R shares. The fees are accrued daily and paid monthly. Of the Plan payments, up to 0.25% of the average daily net assets of each class of shares may be paid to furnish continuing personal shareholder services to customers who purchase and own shares of such classes. Any amounts not paid as a service fee under the Plans would constitute an asset-based sales charge. Rules of the Financial Industry Regulatory Authority (“FINRA”) impose a cap on the total sales charges, including asset-based sales charges, that may be paid by any class of shares of the Fund. For the year ended October 31, 2022, expenses incurred under the Plans are shown in the Statement of Operations as Distribution fees.
Front-end sales commissions and CDSC (collectively, the “sales charges”) are not recorded as expenses of the Fund. Front-end sales commissions are deducted from proceeds from the sales of Fund shares prior to investment in Class A shares of the Fund. CDSC are deducted from redemption proceeds prior to remittance to the shareholder. During the year ended October 31, 2022, IDI advised the Fund that IDI retained $2,258 in front-end sales commissions from the sale of Class A shares and $0 and $325 from Class A and Class C shares, respectively, for CDSC imposed upon redemptions by shareholders.
Certain officers and trustees of the Trust are officers and directors of the Adviser, IIS and/or IDI.
| | |
| 24 | | Invesco Emerging Markets Local Debt Fund |
NOTE 3–Additional Valuation Information
GAAP defines fair value as the price that would be received to sell an asset or paid to transfer a liability in an orderly transaction between market participants at the measurement date, under current market conditions. GAAP establishes a hierarchy that prioritizes the inputs to valuation methods, giving the highest priority to readily available unadjusted quoted prices in an active market for identical assets (Level 1) and the lowest priority to significant unobservable inputs (Level 3), generally when market prices are not readily available. Based on the valuation inputs, the securities or other investments are tiered into one of three levels. Changes in valuation methods may result in transfers in or out of an investment’s assigned level:
| | |
| Level 1 - | | Prices are determined using quoted prices in an active market for identical assets. |
| Level 2 - | | Prices are determined using other significant observable inputs. Observable inputs are inputs that other market participants may use in pricing a security. These may include quoted prices for similar securities, interest rates, prepayment speeds, credit risk, yield curves, loss severities, default rates, discount rates, volatilities and others. |
| Level 3 - | | Prices are determined using significant unobservable inputs. In situations where quoted prices or observable inputs are unavailable (for example, when there is little or no market activity for an investment at the end of the period), unobservable inputs may be used. Unobservable inputs reflect the Adviser’s assumptions about the factors market participants would use in determining fair value of the securities or instruments and would be based on the best available information. |
The following is a summary of the tiered valuation input levels, as of October 31, 2022. The level assigned to the securities valuations may not be an indication of the risk or liquidity associated with investing in those securities. Because of the inherent uncertainties of valuation, the values reflected in the financial statements may materially differ from the value received upon actual sale of those investments.
| | | | | | | | | | | | | | | | |
| | | Level 1 | | | Level 2 | | | Level 3 | | | Total | |
|
| |
Investments in Securities | | | | | | | | | | | | | | | | |
|
| |
Non-U.S. Dollar Denominated Bonds & Notes | | $ | – | | | $ | 58,709,915 | | | | $– | | | $ | 58,709,915 | |
|
| |
U.S. Dollar Denominated Bonds & Notes | | | – | | | | 584,534 | | | | – | | | | 584,534 | |
|
| |
Money Market Funds | | | 14,906,810 | | | | – | | | | – | | | | 14,906,810 | |
|
| |
Options Purchased | | | – | | | | 613,745 | | | | – | | | | 613,745 | |
|
| |
Total Investments in Securities | | | 14,906,810 | | | | 59,908,194 | | | | – | | | | 74,815,004 | |
|
| |
| | | | | | | | | | | | | | | | |
Other Investments - Assets* | | | | | | | | | | | | | | | | |
|
| |
Forward Foreign Currency Contracts | | | – | | | | 2,200,572 | | | | – | | | | 2,200,572 | |
|
| |
Swap Agreements | | | – | | | | 739,444 | | | | – | | | | 739,444 | |
|
| |
| | | – | | | | 2,940,016 | | | | – | | | | 2,940,016 | |
|
| |
| | | | | | | | | | | | | | | | |
Other Investments - Liabilities* | | | | | | | | | | | | | | | | |
|
| |
Forward Foreign Currency Contracts | | | – | | | | (1,680,762 | ) | | | – | | | | (1,680,762 | ) |
|
| |
Options Written | | | – | | | | (635,644 | ) | | | – | | | | (635,644 | ) |
|
| |
Swap Agreements | | | – | | | | (658,471 | ) | | | – | | | | (658,471 | ) |
|
| |
| | | – | | | | (2,974,877 | ) | | | – | | | | (2,974,877 | ) |
|
| |
Total Other Investments | | | – | | | | (34,861 | ) | | | – | | | | (34,861 | ) |
|
| |
Total Investments | | $ | 14,906,810 | | | $ | 59,873,333 | | | | $– | | | $ | 74,780,143 | |
|
| |
| * | Forward foreign currency contracts and swap agreements are valued at unrealized appreciation (depreciation). Options written are shown at value. |
NOTE 4–Derivative Investments
The Fund may enter into an International Swaps and Derivatives Association Master Agreement (“ISDA Master Agreement”) under which a fund may trade OTC derivatives. An OTC transaction entered into under an ISDA Master Agreement typically involves a collateral posting arrangement, payment netting provisions and close-out netting provisions. These netting provisions allow for reduction of credit risk through netting of contractual obligations. The enforceability of the netting provisions of the ISDA Master Agreement depends on the governing law of the ISDA Master Agreement, among other factors.
For financial reporting purposes, the Fund does not offset OTC derivative assets or liabilities that are subject to ISDA Master Agreements in the Statement of Assets and Liabilities.
Value of Derivative Investments at Period-End
The table below summarizes the value of the Fund’s derivative investments, detailed by primary risk exposure, held as of October 31, 2022:
| | | | | | | | | | | | | | | | | | |
| | | Value |
| Derivative Assets | | Currency Risk | | | | | | Interest Rate Risk | | | | | | Total |
|
|
Unrealized appreciation on swap agreements – Centrally Cleared(a) | | $ | – | | | | | | | $ | 646,107 | | | | | | | $ 646,107 |
|
|
Unrealized appreciation on forward foreign currency contracts outstanding | | | 2,200,572 | | | | | | | | – | | | | | | | 2,200,572 |
|
|
Unrealized appreciation on swap agreements – OTC | | | – | | | | | | | | 93,337 | | | | | | | 93,337 |
|
|
Options purchased, at value – OTC(b) | | | 468,251 | | | | | | | | 145,494 | | | | | | | 613,745 |
|
|
Total Derivative Assets | | | 2,668,823 | | | | | | | | 884,938 | | | | | | | 3,553,761 |
|
|
Derivatives not subject to master netting agreements | | | – | | | | | | | | (646,107 | ) | | | | | | (646,107) |
|
|
Total Derivative Assets subject to master netting agreements | | $ | 2,668,823 | | | | | | | $ | 238,831 | | | | | | | $ 2,907,654 |
|
|
| | |
| 25 | | Invesco Emerging Markets Local Debt Fund |
| | | | | | | | | | | | | | | | | | | | |
| | | Value | |
| Derivative Liabilities | | Currency Risk | | | | | | Interest Rate Risk | | | | | | Total | |
|
| |
Unrealized depreciation on swap agreements – Centrally Cleared(a) | | | $ – | | | | | | | $ | (658,471 | ) | | | | | | | $ (658,471 | ) |
|
| |
Unrealized depreciation on forward foreign currency contracts outstanding | | | (1,680,762 | ) | | | | | | | – | | | | | | | | (1,680,762 | ) |
|
| |
Options written, at value – OTC | | | (560,245 | ) | | | | | | | (75,399 | ) | | | | | | | (635,644 | ) |
|
| |
Total Derivative Liabilities | | | (2,241,007 | ) | | | | | | | (733,870 | ) | | | | | | | (2,974,877 | ) |
|
| |
Derivatives not subject to master netting agreements | | | – | | | | | | | | 658,471 | | | | | | | | 658,471 | |
|
| |
Total Derivative Liabilities subject to master netting agreements | | | $(2,241,007 | ) | | | | | | $ | (75,399 | ) | | | | | | | $(2,316,406 | ) |
|
| |
| (a) | The daily variation margin receivable (payable) at period-end is recorded in the Statement of Assets and Liabilities. |
| (b) | Options purchased, at value as reported in the Schedule of Investments. |
Offsetting Assets and Liabilities
The table below reflects the Fund’s exposure to Counterparties subject to either an ISDA Master Agreement or other agreement for OTC derivative transactions as of October 31, 2022.
| | | | | | | | | | | | | | | | | | | | | | | | | | | | | | | | | | | | | | | | | | |
| | | Financial Derivative Assets | | | | | | Financial Derivative Liabilities | | | | | | Collateral
(Received)/Pledged | | | | |
| Counterparty | | Forward
Foreign
Currency
Contracts | | | Options Purchased | | | Swap Agreements | | | Total
Assets | | | Forward
Foreign
Currency
Contracts | | | Options
Written | | | Total
Liabilities | | | Net Value of Derivatives | | | Non-Cash | | Cash | | | Net
Amount | |
|
| |
Bank of America, N.A. | | | $ 652,585 | | | | $ 45,987 | | | | $ – | | | | $ 698,572 | | | | $ (126,808 | ) | | | $ (61,504 | ) | | | $ (188,312 | ) | | | $ 510,260 | | | $– | | | $(528,263 | ) | | | $(18,003 | ) |
|
| |
Barclays Bank PLC | | | 466 | | | | – | | | | – | | | | 466 | | | | (612 | ) | | | – | | | | (612 | ) | | | (146 | ) | | – | | | – | | | | (146 | ) |
|
| |
BNP Paribas S.A. | | | 1,005 | | | | – | | | | – | | | | 1,005 | | | | – | | | | – | | | | – | | | | 1,005 | | | – | | | – | | | | 1,005 | |
|
| |
Citibank, N.A. | | | 52,035 | | | | – | | | | – | | | | 52,035 | | | | (192,532 | ) | | | – | | | | (192,532 | ) | | | (140,497 | ) | | – | | | – | | | | (140,497 | ) |
|
| |
Deutsche Bank AG | | | 135,051 | | | | – | | | | – | | | | 135,051 | | | | (118,246 | ) | | | – | | | | (118,246 | ) | | | 16,805 | | | – | | | – | | | | 16,805 | |
|
| |
Goldman Sachs International | | | 2,906 | | | | 84,504 | | | | – | | | | 87,410 | | | | (23,354 | ) | | | (27,518 | ) | | | (50,872 | ) | | | 36,538 | | | – | | | – | | | | 36,538 | |
|
| |
J.P. Morgan Chase Bank, N.A. | | | 820,623 | | | | 399,913 | | | | – | | | | 1,220,536 | | | | (743,847 | ) | | | (202,974 | ) | | | (946,821 | ) | | | 273,715 | | | – | | | – | | | | 273,715 | |
|
| |
Morgan Stanley and Co. International PLC | | | 371,566 | | | | 78,634 | | | | – | | | | 450,200 | | | | (356,311 | ) | | | (258,233 | ) | | | (614,544 | ) | | | (164,344 | ) | | – | | | – | | | | (164,344 | ) |
|
| |
Royal Bank of Canada | | | 640 | | | | – | | | | – | | | | 640 | | | | – | | | | – | | | | – | | | | 640 | | | – | | | – | | | | 640 | |
|
| |
Standard Chartered Bank PLC | | | 161,315 | | | | 4,707 | | | | 94,151 | | | | 260,173 | | | | (105,307 | ) | | | (85,415 | ) | | | (190,722 | ) | | | 69,451 | | | – | | | – | | | | 69,451 | |
|
| |
UBS AG | | | 2,380 | | | | – | | | | – | | | | 2,380 | | | | (13,745 | ) | | | – | | | | (13,745 | ) | | | (11,365 | ) | | – | | | – | | | | (11,365 | ) |
|
| |
Total | | | $2,200,572 | | | | $613,745 | | | | $94,151 | | | | $2,908,468 | | | | $(1,680,762 | ) | | | $(635,644 | ) | | | $(2,316,406 | ) | | | $ 592,062 | | | $– | | | $(528,263 | ) | | | $ 63,799 | |
|
| |
Effect of Derivative Investments for the year ended October 31, 2022
The table below summarizes the gains (losses) on derivative investments, detailed by primary risk exposure, recognized in earnings during the period:
| | | | | | | | | | | | | | | | | | | | |
| | | Location of Gain (Loss) on Statement of Operations | |
| | | Currency
Risk | | | | | | Interest Rate Risk | | | | | | Total | |
|
| |
Realized Gain (Loss): | | | | | | | | | | | | | | | | | | | | |
Forward foreign currency contracts | | $ | (1,850,616 | ) | | | | | | $ | - | | | | | | | $ | (1,850,616 | ) |
|
| |
Futures contracts | | | - | | | | | | | | 210,259 | | | | | | | | 210,259 | |
|
| |
Options purchased(a) | | | (293,459 | ) | | | | | | | - | | | | | | | | (293,459 | ) |
|
| |
Options written | | | 293,266 | | | | | | | | - | | | | | | | | 293,266 | |
|
| |
Swap agreements | | | - | | | | | | | | (1,438,428 | ) | | | | | | | (1,438,428 | ) |
|
| |
Change in Net Unrealized Appreciation (Depreciation): | | | | | | | | | | | | | | | | | | | | |
Forward foreign currency contracts | | | 728,514 | | | | | | | | - | | | | | | | | 728,514 | |
|
| |
Futures contracts | | | - | | | | | | | | (146,184 | ) | | | | | | | (146,184 | ) |
|
| |
Options purchased(a) | | | 59,781 | | | | | | | | 42,375 | | | | | | | | 102,156 | |
|
| |
Options written | | | (95,373 | ) | | | | | | | (20,806 | ) | | | | | | | (116,179 | ) |
|
| |
Swap agreements | | | - | | | | | | | | 530,522 | | | | | | | | 530,522 | |
|
| |
Total | | $ | (1,157,887 | ) | | | | | | $ | (822,262 | ) | | | | | | $ | (1,980,149 | ) |
|
| |
| (a) | Options purchased are included in the net realized gain (loss) from investment securities and the change in net unrealized appreciation (depreciation) of investment securities. |
| | |
| 26 | | Invesco Emerging Markets Local Debt Fund |
The table below summarizes the average notional value of derivatives held during the period.
| | | | | | | | | | | | | | | | | | | | | | | | | | | | |
| | | | | | | | | | | | Foreign | | | | | | Foreign | | | | |
| | | Forward | | | | | | | | | Currency | | | | | | Currency | | | | |
| | | Foreign Currency | | | Futures | | | Swaptions | | | Options | | | Swaptions | | | Options | | | Swap | |
| | | Contracts | | | Contracts | | | Purchased | | | Purchased | | | Written | | | Written | | | Agreements | |
|
| |
Average notional value | | | $199,490,733 | | | $ | 3,345,356 | | | $ | 13,986,356 | | | $ | 41,610,291 | | | $ | 13,986,356 | | | $ | 53,957,692 | | | $ | 91,808,685 | |
|
| |
NOTE 5–Expense Offset Arrangement(s)
The expense offset arrangement is comprised of transfer agency credits which result from balances in demand deposit accounts used by the transfer agent for clearing shareholder transactions. For the year ended October 31, 2022, the Fund received credits from this arrangement, which resulted in the reduction of the Fund’s total expenses of $618.
NOTE 6–Trustees’ and Officers’ Fees and Benefits
Trustees’ and Officers’ Fees and Benefits include amounts accrued by the Fund to pay remuneration to certain Trustees and Officers of the Fund. Trustees have the option to defer compensation payable by the Fund, and Trustees’ and Officers’ Fees and Benefits also include amounts accrued by the Fund to fund such deferred compensation amounts. Those Trustees who defer compensation have the option to select various Invesco Funds in which their deferral accounts shall be deemed to be invested. Finally, certain current Trustees were eligible to participate in a retirement plan that provided for benefits to be paid upon retirement to Trustees over a period of time based on the number of years of service. The Fund may have certain former Trustees who also participate in a retirement plan and receive benefits under such plan. Trustees’ and Officers’ Fees and Benefits include amounts accrued by the Fund to fund such retirement benefits. Obligations under the deferred compensation and retirement plans represent unsecured claims against the general assets of the Fund.
NOTE 7–Cash Balances
The Fund is permitted to temporarily carry a negative or overdrawn balance in its account with State Street Bank and Trust Company, the custodian bank. Such balances, if any at period-end, are shown in the Statement of Assets and Liabilities under the payable caption Amount due custodian. To compensate the custodian bank for such overdrafts, the overdrawn Fund may either (1) leave funds as a compensating balance in the account so the custodian bank can be compensated by earning the additional interest; or (2) compensate by paying the custodian bank at a rate agreed upon by the custodian bank and Invesco, not to exceed the contractually agreed upon rate.
NOTE 8–Distributions to Shareholders and Tax Components of Net Assets
Tax Character of Distributions to Shareholders Paid During the Fiscal Years Ended October 31, 2022 and 2021:
| | | | | | | | | | | | |
| | | 2022 | | | | | | 2021 | |
|
| |
Ordinary income* | | | $ – | | | | | | | $ | 1,469,274 | |
|
| |
Return of capital | | | 5,294,992 | | | | | | | | 4,647,601 | |
|
| |
Total distributions | | | $5,294,992 | | | | | | | $ | 6,116,875 | |
|
| |
| * | Includes short-term capital gain distributions, if any. |
Tax Components of Net Assets at Period-End:
| | | | |
| | | 2022 | |
|
| |
Net unrealized appreciation (depreciation) – investments | | $ | (14,166,706 | ) |
|
| |
Net unrealized appreciation (depreciation) – foreign currencies | | | (317,001 | ) |
|
| |
Temporary book/tax differences | | | (21,846 | ) |
|
| |
Capital loss carryforward | | | (11,127,185 | ) |
|
| |
Shares of beneficial interest | | | 103,045,754 | |
|
| |
Total net assets | | $ | 77,413,016 | |
|
| |
The difference between book-basis and tax-basis unrealized appreciation (depreciation) is due to differences in the timing of recognition of gains and losses on investments for tax and book purposes. The Fund’s net unrealized appreciation (depreciation) difference is attributable primarily to wash sales and straddles.
The temporary book/tax differences are a result of timing differences between book and tax recognition of income and/or expenses. The Fund’s temporary book/tax differences are the result of the trustee deferral of compensation and retirement plan benefits.
Capital loss carryforward is calculated and reported as of a specific date. Results of transactions and other activity after that date may affect the amount of capital loss carryforward actually available for the Fund to utilize. The ability to utilize capital loss carryforward in the future may be limited under the Internal Revenue Code and related regulations based on the results of future transactions.
The Fund has a capital loss carryforward as of October 31, 2022, as follows:
| | | | | | | | | | | | |
Capital Loss Carryforward* | |
| Expiration | | Short-Term | | | Long-Term | | | Total | |
|
| |
Not subject to expiration | | $ | 6,335,769 | | | $ | 4,791,416 | | | $ | 11,127,185 | |
|
| |
| * | Capital loss carryforward is reduced for limitations, if any, to the extent required by the Internal Revenue Code and may be further limited depending upon a variety of factors, including the realization of net unrealized gains or losses as of the date of any reorganization. |
| | |
| 27 | | Invesco Emerging Markets Local Debt Fund |
NOTE 9–Investment Transactions
The aggregate amount of investment securities (other than short-term securities, U.S. Government obligations and money market funds, if any) purchased and sold by the Fund during the year ended October 31, 2022 was $129,278,211 and $174,477,358, respectively. Cost of investments, including any derivatives, on a tax basis includes the adjustments for financial reporting purposes as of the most recently completed federal income tax reporting period-end.
| | | | |
Unrealized Appreciation (Depreciation) of Investments on a Tax Basis | |
Aggregate unrealized appreciation of investments | | | $ 3,668,601 | |
|
| |
Aggregate unrealized (depreciation) of investments | | | (17,835,307 | ) |
|
| |
Net unrealized appreciation (depreciation) of investments | | | $(14,166,706 | ) |
|
| |
Cost of investments for tax purposes is $89,087,565.
NOTE 10–Reclassification of Permanent Differences
Primarily as a result of differing book/tax treatment of foreign currency transactions, net operating losses and return of capital distributions, on October 31, 2022, undistributed net investment income was increased by $251,992, undistributed net realized gain (loss) was increased by $11,803,718 and shares of beneficial interest was decreased by $12,055,710. This reclassification had no effect on the net assets of the Fund.
NOTE 11–Share Information
| | | | | | | | | | | | | | | | |
| | | Summary of Share Activity | |
|
| |
| | |
| | | Year ended | | | Year ended | |
| | | October 31, 2022(a) | | | October 31, 2021 | |
| | | Shares | | | Amount | | | Shares | | | Amount | |
|
| |
Sold: | | | | | | | | | | | | | | | | |
Class A | | | 462,981 | | | | $ 2,654,156 | | | | 1,783,731 | | | | $ 12,076,112 | |
|
| |
Class C | | | 105,233 | | | | 602,616 | | | | 152,961 | | | | 1,031,334 | |
|
| |
Class R | | | 49,259 | | | | 273,219 | | | | 55,562 | | | | 372,110 | |
|
| |
Class Y | | | 6,135,961 | | | | 35,757,530 | | | | 7,673,682 | | | | 51,393,420 | |
|
| |
Class R6 | | | 265,007 | | | | 1,525,372 | | | | 420,643 | | | | 2,835,417 | |
|
| |
| | | | |
Issued as reinvestment of dividends: | | | | | | | | | | | | | | | | |
Class A | | | 164,172 | | | | 905,430 | | | | 157,004 | | | | 1,035,690 | |
|
| |
Class C | | | 32,739 | | | | 180,693 | | | | 31,849 | | | | 210,341 | |
|
| |
Class R | | | 13,643 | | | | 74,941 | | | | 10,726 | | | | 70,771 | |
|
| |
Class Y | | | 453,036 | | | | 2,503,232 | | | | 370,079 | | | | 2,437,961 | |
|
| |
Class R6 | | | 24,154 | | | | 134,005 | | | | 26,376 | | | | 173,769 | |
|
| |
| | | | |
Automatic conversion of Class C shares to Class A shares: | | | | | | | | | | | | | | | | |
Class A | | | 69,125 | | | | 394,522 | | | | 315,777 | | | | 2,184,475 | |
|
| |
Class C | | | (69,109 | ) | | | (394,522 | ) | | | (315,777 | ) | | | (2,184,475 | ) |
|
| |
| | | | |
Reacquired: | | | | | | | | | | | | | | | | |
Class A | | | (2,444,400 | ) | | | (13,992,615 | ) | | | (1,904,261 | ) | | | (12,686,190 | ) |
|
| |
Class C | | | (380,496 | ) | | | (2,168,903 | ) | | | (395,830 | ) | | | (2,623,772 | ) |
|
| |
Class R | | | (62,179 | ) | | | (347,960 | ) | | | (101,868 | ) | | | (682,403 | ) |
|
| |
Class Y | | | (11,736,637 | ) | | | (67,604,929 | ) | | | (7,136,449 | ) | | | (47,025,595 | ) |
|
| |
Class R6 | | | (472,971 | ) | | | (2,707,281 | ) | | | (380,547 | ) | | | (2,482,720 | ) |
|
| |
Net increase (decrease) in share activity | | | (7,390,482 | ) | | | $(42,210,494) | | | | 763,658 | | | | $ 6,136,245 | |
|
| |
| (a) | There are entities that are record owners of more than 5% of the outstanding shares of the Fund and in the aggregate own 59% of the outstanding shares of the Fund. IDI has an agreement with these entities to sell Fund shares. The Fund, Invesco and/or Invesco affiliates may make payments to these entities, which are considered to be related to the Fund, for providing services to the Fund, Invesco and/or Invesco affiliates including but not limited to services such as securities brokerage, distribution, third party record keeping and account servicing. The Fund has no knowledge as to whether all or any portion of the shares owned of record by these entities are also owned beneficially. |
| | |
| 28 | | Invesco Emerging Markets Local Debt Fund |
Report of Independent Registered Public Accounting Firm
To the Board of Trustees of AIM Investment Funds (Invesco Investment Funds) and Shareholders of Invesco Emerging Markets Local Debt Fund
Opinion on the Financial Statements
We have audited the accompanying statement of assets and liabilities, including the schedule of investments, of Invesco Emerging Markets Local Debt Fund (one of the funds constituting AIM Investment Funds (Invesco Investment Funds), referred to hereafter as the “Fund”) as of October 31, 2022, the related statement of operations for the year ended October 31, 2022, the statement of changes in net assets for each of the two years in the period ended October 31, 2022, including the related notes, and the financial highlights for each of the periods indicated in the table below (collectively referred to as the “financial statements”). In our opinion, the financial statements present fairly, in all material respects, the financial position of the Fund as of October 31, 2022, the results of its operations for the year then ended, the changes in its net assets for each of the two years in the period ended October 31, 2022 and the financial highlights for each of the periods indicated in the table below, in conformity with accounting principles generally accepted in the United States of America.
|
| |
Financial Highlights |
| |
For each of the three years in the period ended October 31, 2022, the five months ended October 31, 2019, and the year ended May 31, 2019 for Class A, Class C, Class R, Class Y and Class R6. |
For each of the three years in the period ended October 31, 2022, the five months ended October 31, 2019, and the period May 24, 2019 (commencement of operations) through May 31, 2019 for Class R5. |
The financial statements of Oppenheimer Emerging Markets Local Debt Fund (subsequently renamed Invesco Emerging Markets Local Debt Fund) as of and for the year ended May 31, 2018 and the financial highlights for the year then ended (not presented herein, other than the financial highlights) were audited by other auditors whose report dated July 25, 2018 expressed an unqualified opinion on those financial statements and financial highlights.
Basis for Opinion
These financial statements are the responsibility of the Fund’s management. Our responsibility is to express an opinion on the Fund’s financial statements based on our audits. We are a public accounting firm registered with the Public Company Accounting Oversight Board (United States) (PCAOB) and are required to be independent with respect to the Fund in accordance with the U.S. federal securities laws and the applicable rules and regulations of the Securities and Exchange Commission and the PCAOB.
We conducted our audits of these financial statements in accordance with the standards of the PCAOB. Those standards require that we plan and perform the audit to obtain reasonable assurance about whether the financial statements are free of material misstatement, whether due to error or fraud.
Our audits included performing procedures to assess the risks of material misstatement of the financial statements, whether due to error or fraud, and performing procedures that respond to those risks. Such procedures included examining, on a test basis, evidence regarding the amounts and disclosures in the financial statements. Our audits also included evaluating the accounting principles used and significant estimates made by management, as well as evaluating the overall presentation of the financial statements. Our procedures included confirmation of securities owned as of October 31, 2022 by correspondence with the custodian, transfer agent and brokers; when replies were not received from brokers, we performed other auditing procedures. We believe that our audits provide a reasonable basis for our opinion.
/s/PricewaterhouseCoopers LLP
Houston, Texas
December 23, 2022
We have served as the auditor of one or more of the investment companies in the Invesco group of investment companies since at least 1995. We have not been able to determine the specific year we began serving as auditor.
| | |
| 29 | | Invesco Emerging Markets Local Debt Fund |
Calculating your ongoing Fund expenses
Example
As a shareholder of the Fund, you incur two types of costs: (1) transaction costs, which may include sales charges (loads) on purchase payments or contingent deferred sales charges on redemptions, if any; and (2) ongoing costs, including management fees, distribution and/or service (12b-1) fees, and other Fund expenses. This example is intended to help you understand your ongoing costs (in dollars) of investing in the Fund and to compare these costs with ongoing costs of investing in other mutual funds. The example is based on an investment of $1,000 invested at the beginning of the period and held for the entire period May 1, 2022 through October 31, 2022.
Actual expenses
The table below provides information about actual account values and actual expenses. You may use the information in this table, together with the amount you invested, to estimate the expenses that you paid over the period. Simply divide your account value by $1,000 (for example, an $8,600 account value divided by $1,000 = 8.6), then multiply the result by the number in the table under the heading entitled “Actual Expenses Paid During Period” to estimate the expenses you paid on your account during this period.
Hypothetical example for comparison purposes
The table below also provides information about hypothetical account values and hypothetical expenses based on the Fund’s actual expense ratio and an assumed rate of return of 5% per year before expenses, which is not the Fund’s actual return.
The hypothetical account values and expenses may not be used to estimate the actual ending account balance or expenses you paid for the period. You may use this information to compare the ongoing costs of investing in the Fund and other funds. To do so, compare this 5% hypothetical example with the 5% hypothetical examples that appear in the shareholder reports of the other funds.
Please note that the expenses shown in the table are meant to highlight your ongoing costs only and do not reflect any transaction costs, such as sales charges (loads) on purchase payments or contingent deferred sales charges on redemptions, if any. Therefore, the hypothetical information is useful in comparing ongoing costs only, and will not help you determine the relative total costs of owning different funds. In addition, if these transaction costs were included, your costs would have been higher.
| | | | | | | | | | | | |
| | | | | ACTUAL | | HYPOTHETICAL (5% annual return before expenses) | | |
| | | Beginning
Account Value
(05/01/22) | | Ending
Account Value
(10/31/22)1 | | Expenses
Paid During
Period2, 3 | | Ending
Account Value
(10/31/22) | | Expenses
Paid During
Period2, 4 | | Annualized
Expense Ratio2 |
Class A | | $1,000.00 | | $920.80 | | $8.33 | | $1,016.53 | | $8.74 | | 1.72% |
Class C | | 1,000.00 | | 915.50 | | 11.97 | | 1,012.70 | | 12.58 | | 2.48 |
Class R | | 1,000.00 | | 917.90 | | 9.57 | | 1,015.22 | | 10.06 | | 1.98 |
Class Y | | 1,000.00 | | 920.30 | | 7.16 | | 1,017.74 | | 7.53 | | 1.48 |
Class R5 | | 1,000.00 | | 921.00 | | 6.05 | | 1,018.90 | | 6.36 | | 1.25 |
Class R6 | | 1,000.00 | | 922.70 | | 6.20 | | 1,018.75 | | 6.51 | | 1.28 |
| 1 | The actual ending account value is based on the actual total return of the Fund for the period May 1, 2022 through October 31, 2022, after actual expenses and will differ from the hypothetical ending account value which is based on the Fund’s expense ratio and a hypothetical annual return of 5% before expenses. |
| 2 | Expenses are equal to the Fund’s annualized expense ratio as indicated above multiplied by the average account value over the period, multiplied by 181/365 to reflect the most recent fiscal half year. Effective March 1 2023, the Adviser has contractually agreed to waive advisory fees and/or reimburse expenses to the extent necessary to limit total annual fund operating expenses of Class A, Class C, Class R, Class Y, Class R5 and Class R6 shares to 1.20%, 1.95%, 1.45%, 0.95%, 0.95% and 0.95% of average daily net assets, respectively. The annualized expense ratios restated as if these agreements had been in effect throughout the entire most recent fiscal half year are 1.20%, 1.95%, 1.45%, 0.95%, 0.95% and 0.95% for of Class A, Class C, Class R, Class Y, Class R5 and Class R6 shares, respectively. |
| 3 | The actual expenses paid restated as if the changes discussed above had been in effect throughout the entire most recent half year are $5.81, $9.41, $7.01, $4.60, $4.60 and $4.60 for of Class A, Class C, Class R, Class Y, Class R5 and Class R6 shares, respectively. |
| 4 | The hypothetical expenses paid restated as if the changes discussed above had been in effect throughout the entire most recent half year are $6.11, $9.91, $7.38, $4.84, $4.84 and $4.84 for of Class A, Class C, Class R, Class Y, Class R5 and Class R6 shares, respectively. |
| | |
| 30 | | Invesco Emerging Markets Local Debt Fund |
Approval of Investment Advisory and Sub-Advisory Contracts
At meetings held on June 13, 2022, the Board of Trustees (the Board or the Trustees) of AIM Investment Funds (Invesco Investment Funds) as a whole, and the independent Trustees, who comprise over 75% of the Board, voting separately, approved the continuance of the Invesco Emerging Markets Local Debt Fund’s (the Fund) Master Investment Advisory Agreement with Invesco Advisers, Inc. (Invesco Advisers and the investment advisory agreement) and the Master Intergroup Sub-Advisory Contract for Mutual Funds with Invesco Asset Management Deutschland GmbH, Invesco Asset Management Limited, Invesco Asset Management (Japan) Limited, Invesco Hong Kong Limited, Invesco Senior Secured Management, Inc. and Invesco Canada Ltd. and separate sub-advisory contracts with Invesco Capital Management LLC and Invesco Asset Management (India) Private Limited and OppenheimerFunds, Inc. (collectively, the Affiliated Sub-Advisers and the sub-advisory contracts) for another year, effective July 1, 2022. After evaluating the factors discussed below, among others, the Board approved the renewal of the Fund’s investment advisory agreement and the sub-advisory contracts and determined that the compensation payable thereunder by the Fund to Invesco Advisers and by Invesco Advisers to the Affiliated Sub-Advisers is fair and reasonable.
The Board’s Evaluation Process
The Board has established an Investments Committee, which in turn has established Sub-Committees that meet throughout the year to review the performance of funds advised by Invesco Advisers (the Invesco Funds). The Sub-Committees meet regularly with portfolio managers for their assigned Invesco Funds and other members of management to review detailed information about investment performance and portfolio attributes of these funds. The Board has established additional standing and ad hoc committees that meet regularly throughout the year to review matters within their purview. The Board took into account evaluations and reports that it received from its committees and sub-committees, as well as the information provided to the Board and its committees and sub-committees throughout the year, in considering whether to approve each Invesco Fund’s investment advisory agreement and sub-advisory contracts.
As part of the contract renewal process, the Board reviews and considers information provided in response to detailed requests for information submitted to management by the independent Trustees with assistance from legal counsel to the independent Trustees and the Senior Officer, an officer of the Invesco Funds who reports directly to the independent Trustees. The Board receives comparative investment performance and fee and expense data regarding the Invesco Funds prepared by Broadridge Financial Solutions, Inc. (Broadridge), an independent mutual fund data provider, as well as information on the composition of the peer groups provided by Broadridge and its methodology for determining peer groups. The Board also receives an independent written evaluation from the Senior Officer. The Senior Officer’s evaluation is prepared as part of his responsibility to manage the process by which the Invesco Funds’ proposed management fees
are negotiated during the annual contract renewal process to ensure they are negotiated in a manner that is at arms’ length and reasonable in accordance with certain negotiated regulatory requirements. In addition to meetings with Invesco Advisers and fund counsel throughout the year and as part of meetings convened on May 2, 2022 and June 13, 2022, the independent Trustees also discussed the continuance of the investment advisory agreement and sub-advisory contracts in separate sessions with the Senior Officer and with independent legal counsel. Also, as part of the contract renewal process, the independent Trustees reviewed and considered information provided in response to detailed follow-up requests for information submitted by the independent Trustees to management. The independent Trustees met and discussed those follow-up responses with legal counsel to the independent Trustees and the Senior Officer.
The discussion below is a summary of the Senior Officer’s independent written evaluation with respect to the Fund’s investment advisory agreement and sub-advisory contracts, as well as a discussion of the material factors and related conclusions that formed the basis for the Board’s approval of the Fund’s investment advisory agreement and sub-advisory contracts. The Trustees’ review and conclusions are based on the comprehensive consideration of all information presented to them during the course of the year and in prior years and are not the result of any single determinative factor. Moreover, one Trustee may have weighed a particular piece of information or factor differently than another Trustee. The information received and considered by the Board was current as of various dates prior to the Board’s approval on June 13, 2022.
Factors and Conclusions and Summary of Independent Written Fee Evaluation
| A. | Nature, Extent and Quality of Services Provided by Invesco Advisers and the Affiliated Sub-Advisers |
The Board reviewed the nature, extent and quality of the advisory services provided to the Fund by Invesco Advisers under the Fund’s investment advisory agreement, and the credentials and experience of the officers and employees of Invesco Advisers who provide these services, including the Fund’s portfolio manager(s). The Board’s review included consideration of Invesco Advisers’ investment process and oversight, credit analysis, and research capabilities. The Board considered information regarding Invesco Advisers’ programs for and resources devoted to risk management, including management of investment, enterprise, operational, liquidity, valuation and compliance risks, and technology used to manage such risks. The Board also received and reviewed information about Invesco Advisers’ role as administrator of the Invesco Funds’ liquidity risk management program. The Board received a description of, and reports related to, Invesco Advisers’ global security program and business continuity plans and of its approach to data privacy and cybersecurity, including related testing. The Board considered how the cybersecurity and business continuity plans of Invesco Advisers and its key service providers operated in the remote and hybrid working environment resulting from the novel coronavirus (“COVID-19”) pandemic and paved the
way for a hybrid working framework in a normalized environment as employees return to the office. The Board also considered non-advisory services that Invesco Advisers and its affiliates provide to the Invesco Funds, such as various back office support functions, third party oversight, internal audit, valuation, portfolio trading and legal and compliance. The Board observed that Invesco Advisers’ systems preparedness and ongoing investment enabled Invesco Advisers to manage, operate and oversee the Invesco Funds with minimal impact or disruption through challenging environments. The Board reviewed and considered the benefits to shareholders of investing in a Fund that is part of the family of funds under the umbrella of Invesco Ltd., Invesco Advisers’ parent company, and noted Invesco Ltd.’s depth and experience in running an investment management business, as well as its commitment of financial and other resources to such business. The Board concluded that the nature, extent and quality of the services provided to the Fund by Invesco Advisers are appropriate and satisfactory.
The Board reviewed the services that may be provided by the Affiliated Sub-Advisers under the sub-advisory contracts and the credentials and experience of the officers and employees of the Affiliated Sub-Advisers who provide these services. The Board noted the Affiliated Sub-Advisers’ expertise with respect to certain asset classes and that the Affiliated Sub-Advisers have offices and personnel that are located in financial centers around the world. As a result, the Board noted that the Affiliated Sub-Advisers can provide research and investment analysis on the markets and economies of various countries in which the Fund may invest, make recommendations regarding securities and assist with security trades. The Board concluded that the sub-advisory contracts may benefit the Fund and its shareholders by permitting Invesco Advisers to use the resources and talents of the Affiliated Sub-Advisers in managing the Fund. The Board concluded that the nature, extent and quality of the services that may be provided to the Fund by the Affiliated Sub-Advisers are appropriate and satisfactory.
| B. | Fund Investment Performance |
The Board considered Fund investment performance as a relevant factor in considering whether to approve the investment advisory agreement. The Board did not view Fund investment performance as a relevant factor in considering whether to approve the sub-advisory contracts for the Fund, as no Affiliated Sub-Adviser currently manages assets of the Fund.
The Board compared the Fund’s investment performance over multiple time periods ending December 31, 2021 to the performance of funds in the Broadridge performance universe and against the JP Morgan Government Bond Index-Emerging Markets (GBI-EM) Global Diversified Index (Index). The Board noted that performance of Class A shares of the Fund was in the fifth quintile of its performance universe for the one year period, the fourth quintile for the three year period and the third quintile for the five year period (the first quintile being the best performing funds and the fifth quintile being the worst performing funds). The Board noted that performance of Class A shares of the Fund was below the performance of the Index for the one , three and
| | |
| 31 | | Invesco Emerging Markets Local Debt Fund |
five year periods. The Board considered that the Fund was created in connection with Invesco Ltd.’s acquisition of OppenheimerFunds, Inc. and its subsidiaries (the “Transaction”) and that the Fund’s performance prior to the closing of the Transaction on May 24, 2019 is that of its predecessor fund. The Board considered that the Fund’s exposure to, and interest rate positioning in, certain emerging market countries and currencies detracted from performance. The Board recognized that the performance data reflects a snapshot in time as of a particular date and that selecting a different performance period could produce different results. The Board also reviewed more recent Fund performance as well as other performance metrics, which did not change its conclusions.
| C. | Advisory and Sub-Advisory Fees and Fund Expenses |
The Board compared the Fund’s contractual management fee rate to the contractual management fee rates of funds in the Fund’s Broadridge expense group. The Board noted that the contractual management fee rate for Class A shares of the Fund was below the median contractual management fee rate of funds in its expense group. The Board noted that the term “contractual management fee” for funds in the expense group may include both advisory and certain non-portfolio management administrative services fees, but that Broadridge is not able to provide information on a fund by fund basis as to what is included. The Board also reviewed the methodology used by Broadridge in calculating expense group information, which includes using each fund’s contractual management fee schedule (including any applicable breakpoints) as reported in the most recent prospectus or statement of additional information for each fund in the expense group. The Board also considered comparative information regarding the Fund’s total expense ratio and its various components. The Board noted that the Fund’s actual management fees and total expense ratio were in the fifth quintile of its expense group, requested and considered additional information from management regarding the appropriateness of the management fees and total expense ratio, and discussed with management reasons for such relative actual management fees and total expenses. As previously noted, the independent Trustees reviewed and considered information provided in response to detailed follow-up requests for information submitted by the independent Trustees to management, including with respect to management’s philosophy regarding breakpoints in the Fund’s contractual management fee schedule. The independent Trustees met and discussed those follow-up responses with legal counsel to the independent Trustees and the Senior Officer, and subsequently with representatives of management.
The Board noted that Invesco Advisers has contractually agreed to waive fees and/or limit expenses of the Fund for the term disclosed in the Fund’s registration statement in an amount necessary to limit total annual operating expenses to a specified percentage of average daily net assets for each class of the Fund.
The Board also considered the fees charged by Invesco Advisers and its affiliates to other client accounts that are similarly managed. Invesco Advisers reviewed with the Board differences in the scope of services it provides to the Invesco Funds relative to that provided by Invesco Advisers and its affiliates to certain other types of client accounts,
including, among others: management of cash flows as a result of redemptions and purchases; necessary infrastructure such as officers, office space, technology, legal and distribution; oversight of service providers; costs and business risks associated with launching new funds and sponsoring and maintaining the product line; and compliance with federal and state laws and regulations. Invesco Advisers also advised the Board that many of the similarly managed client accounts have all-inclusive fee structures, which are not easily un-bundled.
The Board also considered the services that may be provided by the Affiliated Sub-Advisers pursuant to the sub-advisory contracts, as well as the fees payable by Invesco Advisers to the Affiliated Sub-Advisers pursuant to the sub-advisory contracts.
| D. | Economies of Scale and Breakpoints |
The Board considered the extent to which there may be economies of scale in the provision of advisory services to the Fund and the Invesco Funds, and the extent to which such economies of scale are shared with the Fund and the Invesco Funds. The Board considered that the Fund may benefit from economies of scale through contractual breakpoints in the Fund’s advisory fee schedule, which generally operate to reduce the Fund’s expense ratio as it grows in size. The Board noted that the Fund also shares in economies of scale through Invesco Advisers’ ability to negotiate lower fee arrangements with third party service providers. The Board noted that the Fund may also benefit from economies of scale through initial fee setting, fee waivers and expense reimbursements, as well as Invesco Advisers’ investment in its business, including investments in business infrastructure, technology and cybersecurity.
| E. | Profitability and Financial Resources |
The Board reviewed information from Invesco Advisers concerning the costs of the advisory and other services that Invesco Advisers and its affiliates provide to the Fund and the Invesco Funds and the profitability of Invesco Advisers and its affiliates in providing these services in the aggregate and on an individual Fund-by-Fund basis. The Board considered the methodology used for calculating profitability and the periodic review and enhancement of such methodology. The Board noted that Invesco Advisers continues to operate at a net profit from services Invesco Advisers and its affiliates provide to the Invesco Funds in the aggregate and to most Funds individually. The Board did not deem the level of profits realized by Invesco Advisers and its affiliates from providing such services to be excessive, given the nature, extent and quality of the services provided. The Board noted that Invesco Advisers provided information demonstrating that Invesco Advisers is financially sound and has the resources necessary to perform its obligations under the investment advisory agreement, and provided representations indicating that the Affiliated Sub-Advisers are financially sound and have the resources necessary to perform their obligations under the sub-advisory contracts.
| F. | Collateral Benefits to Invesco Advisers and its Affiliates |
The Board considered various other benefits received by Invesco Advisers and its affiliates from the relationship with the Fund, including the fees received for providing administrative, transfer agency and distribution services to the Fund. The Board received comparative information regarding fees charged for these services, including
information provided by Broadridge and other independent sources. The Board reviewed the performance of Invesco Advisers and its affiliates in providing these services and the organizational structure employed to provide these services. The Board noted that these services are provided to the Fund pursuant to written contracts that are reviewed and subject to approval on an annual basis by the Board based on its determination that the services are required for the operation of the Fund.
The Board considered the benefits realized by Invesco Advisers and the Affiliated Sub-Advisers as a result of portfolio brokerage transactions executed through “soft dollar” arrangements. Invesco Advisers noted that the Fund does not execute brokerage transactions through “soft dollar” arrangements to any significant degree.
The Board considered that the Fund’s uninvested cash and cash collateral from any securities lending arrangements may be invested in registered money market funds or, with regard to securities lending cash collateral, unregistered funds that comply with Rule 2a-7 (collectively referred to as “affiliated money market funds”) advised by Invesco Advisers. The Board considered information regarding the returns of the affiliated money market funds relative to comparable overnight investments, as well as the fees paid by the affiliated money market funds to Invesco Advisers and its affiliates. In this regard, the Board noted that Invesco Advisers receives advisory fees from these affiliated money market funds attributable to the Fund’s investments. The Board also noted that Invesco Advisers has contractually agreed to waive through varying periods an amount equal to 100% of the net advisory fee Invesco Advisers receives from the affiliated money market funds with respect to the Fund’s investment in the affiliated money market funds of uninvested cash, but not cash collateral. The Board concluded that the advisory fees payable to Invesco Advisers from the Fund’s investment of cash collateral from any securities lending arrangements in the affiliated money market funds are for services that are not duplicative of services provided by Invesco Advisers to the Fund.
The Board considered that Invesco Advisers may serve as the Fund’s affiliated securities lending agent and evaluated the benefits realized by Invesco Advisers when serving in such role, including the compensation received. The Board considered Invesco Advisers’ securities lending platform and corporate governance structure for securities lending, including Invesco Advisers’ Securities Lending Governance Committee and its related responsibilities. The Board noted that to the extent the Fund utilizes Invesco Advisers as an affiliated securities lending agent, the Fund conducts its securities lending in accordance with, and in reliance upon, no-action letters issued by the SEC staff that provide guidance on how an affiliate may act as a direct agent lender and receive compensation for those services without obtaining exemptive relief. The Board considered information provided by Invesco Advisers related to the performance of Invesco Advisers as securities lending agent, including a summary of the securities lending services provided to the Fund by Invesco Advisers and the compensation paid to Invesco Advisers for such services, as well as any revenues generated for the Fund in connection with such securities lending activity and the allocation of such revenue between the Fund and Invesco Advisers.
| | |
| 32 | | Invesco Emerging Markets Local Debt Fund |
The Board also received information about commissions that an affiliated broker may receive for executing certain trades for the Fund. Invesco Advisers and the Affiliated Sub-Advisers advised the Board of the benefits to the Fund of executing trades through the affiliated broker and that such trades were executed in compliance with rules under the federal securities laws and consistent with best execution obligations.
| | |
| 33 | | Invesco Emerging Markets Local Debt Fund |
Tax Information
Form 1099-DIV, Form 1042-S and other year-end tax information provide shareholders with actual calendar year amounts that should be included in their tax returns. Shareholders should consult their tax advisers.
The following distribution information is being provided as required by the Internal Revenue Code or to meet a specific state’s requirement.
The Fund designates the following amounts or, if subsequently determined to be different, the maximum amount allowable for its fiscal year ended October 31, 2022:
| | | | | | | | |
Federal and State Income Tax | | | | | | |
Qualified Dividend Income* | | | 0.00 | % | | | | |
Corporate Dividends Received Deduction* | | | 0.00 | % | | | | |
U.S. Treasury Obligations* | | | 0.00 | % | | | | |
Qualified Business Income* | | | 0.00 | % | | | | |
Business Interest Income* | | | 0.00 | % | | | | |
|
| * The above percentages are based on ordinary income dividends paid to shareholders during the Fund’s fiscal year. | |
| | |
| 34 | | Invesco Emerging Markets Local Debt Fund |
Trustees and Officers
The address of each trustee and officer is AIM Investment Funds (Invesco Investment Funds) (the “Trust”), 11 Greenway Plaza, Suite 1000, Houston, Texas 77046-1173. The trustees serve for the life of the Trust, subject to their earlier death, incapacitation, resignation, retirement or removal as more specifically provided in the Trust’s organizational documents. Each officer serves for a one year term or until their successors are elected and qualified. Column two below includes length of time served with predecessor entities, if any.
| | | | | | | | |
Name, Year of Birth and Position(s) Held with the Trust | | Trustee and/or Officer Since | | Principal Occupation(s) During Past 5 Years | | Number of Funds in Fund Complex Overseen by
Trustee | | Other Directorship(s) Held by Trustee During Past 5 Years |
| Interested Trustee | | | | | | | | |
Martin L. Flanagan1 – 1960 Trustee and Vice Chair | | 2007 | | Executive Director, Chief Executive Officer and President, Invesco Ltd. (ultimate parent of Invesco and a global investment management firm); Trustee and Vice Chair, The Invesco Funds; Vice Chair, Investment Company Institute; and Member of Executive Board, SMU Cox School of Business Formerly: Advisor to the Board, Invesco Advisers, Inc. (formerly known as Invesco Institutional (N.A.), Inc.); Chairman and Chief Executive Officer, Invesco Advisers, Inc. (registered investment adviser); Director, Chairman, Chief Executive Officer and President, Invesco Holding Company (US), Inc. (formerly IVZ Inc.) (holding company), Invesco Group Services, Inc. (service provider) and Invesco North American Holdings, Inc. (holding company); Director, Chief Executive Officer and President, Invesco Holding Company Limited (parent of Invesco and a global investment management firm); Director, Invesco Ltd.; Chairman, Investment Company Institute and President, Co-Chief Executive Officer, Co-President, Chief Operating Officer and Chief Financial Officer, Franklin Resources, Inc. (global investment management organization) | | 189 | | None |
| 1 | Mr. Flanagan is considered an interested person (within the meaning of Section 2(a)(19) of the 1940 Act) of the Trust because he is an officer of the Adviser to the Trust, and an officer and a director of Invesco Ltd., ultimate parent of the Adviser. |
| | |
| T-1 | | Invesco Emerging Markets Local Debt Fund |
Trustees and Officers–(continued)
| | | | | | | | |
Name, Year of Birth and Position(s) Held with the Trust | | Trustee and/or Officer Since | | Principal Occupation(s) During Past 5 Years | | Number of Funds in Fund Complex
Overseen by
Trustee | | Other Directorship(s) Held by Trustee During Past 5 Years |
| Independent Trustees | | | | | | | | |
Beth Ann Brown – 1968 Trustee (2019) and Chair (August 2022) | | 2019 | | Independent Consultant Formerly: Head of Intermediary Distribution, Managing Director, Strategic Relations, Managing Director, Head of National Accounts, Senior Vice President, National Account Manager and Senior Vice President, Key Account Manager, Columbia Management Investment Advisers LLC; Vice President, Key Account Manager, Liberty Funds Distributor, Inc.; and Trustee of certain Oppenheimer Funds | | 189 | | Director, Board of Directors of Caron Engineering Inc.; Advisor, Board of Advisors of Caron Engineering Inc.; President and Director, Acton Shapleigh Youth Conservation Corps (non-profit) Formerly: President and Director Director of Grahamtastic Connection (non-profit) |
Cynthia Hostetler – 1962 Trustee | | 2017 | | Non-Executive Director and Trustee of a number of public and private business corporations Formerly: Director, Aberdeen Investment Funds (4 portfolios); Director, Artio Global Investment LLC (mutual fund complex); Director, Edgen Group, Inc. (specialized energy and infrastructure products distributor); Director, Genesee & Wyoming, Inc. (railroads); Head of Investment Funds and Private Equity, Overseas Private Investment Corporation; President, First Manhattan Bancorporation, Inc.; and Attorney, Simpson Thacher & Bartlett LLP | | 189 | | Resideo Technologies, Inc. (smart home technology); Vulcan Materials Company (construction materials company); Trilinc Global Impact Fund; Textainer Group Holdings, (shipping container leasing company); Investment Company Institute (professional organization); and Independent Directors Council (professional organization) |
Eli Jones - 1961 Trustee | | 2016 | | Professor and Dean Emeritus, Mays Business School - Texas A&M University Formerly: Dean of Mays Business School-Texas A&M University; Professor and Dean, Walton College of Business, University of Arkansas and E.J. Ourso College of Business, Louisiana State University; and Director, Arvest Bank | | 189 | | Insperity, Inc. (formerly known as Administaff) (human resources provider); and Member of Regional Board of Directors and Board of Directors, First Financial Bancorp (regional bank) |
Elizabeth Krentzman - 1959 Trustee | | 2019 | | Formerly: Principal and Chief Regulatory Advisor for Asset Management Services and U.S. Mutual Fund Leader of Deloitte & Touche LLP; General Counsel of the Investment Company Institute (trade association); National Director of the Investment Management Regulatory Consulting Practice, Principal, Director and Senior Manager of Deloitte & Touche LLP; Assistant Director of the Division of Investment Management - Office of Disclosure and Investment Adviser Regulation of the U.S. Securities and Exchange Commission and various positions with the Division of Investment Management - Office of Regulatory Policy of the U.S. Securities and Exchange Commission; Associate at Ropes & Gray LLP; and Trustee of certain Oppenheimer Funds | | 189 | | Formerly: Member of the Cartica Funds Board of Directors (private investment fund); Trustee of the University of Florida National Board Foundation; and Member of the University of Florida Law Center Association, Inc. Board of Trustees, Audit Committee and Membership Committee |
Anthony J. LaCava, Jr. - 1956 Trustee | | 2019 | | Formerly: Director and Member of the Audit Committee, Blue Hills Bank (publicly traded financial institution) and Managing Partner, KPMG LLP | | 189 | | Blue Hills Bank; Chairman, Bentley University; Member, Business School Advisory Council; and Nominating Committee, KPMG LLP |
Prema Mathai-Davis - 1950 Trustee | | 2001 | | Retired Formerly: Co-Founder & Partner of Quantalytics Research, LLC, (a FinTech Investment Research Platform for the Self-Directed Investor); Trustee of YWCA Retirement Fund; CEO of YWCA of the USA; Board member of the NY Metropolitan Transportation Authority; Commissioner of the NYC Department of Aging; and Board member of Johns Hopkins Bioethics Institute | | 189 | | Member of Board of Positive Planet US (non-profit) and HealthCare Chaplaincy Network (non-profit) |
| | |
| T-2 | | Invesco Emerging Markets Local Debt Fund |
Trustees and Officers–(continued)
| | | | | | | | |
Name, Year of Birth and Position(s) Held with the Trust | | Trustee and/or Officer Since | | Principal Occupation(s) During Past 5 Years | | Number of Funds in Fund Complex
Overseen by
Trustee | | Other Directorship(s) Held by Trustee During Past 5 Years |
| Independent Trustees–(continued) | | | | |
Joel W. Motley - 1952 Trustee | | 2019 | | Director of Office of Finance, Federal Home Loan Bank System; Managing Director of Carmona Motley Inc. (privately held financial advisor); Member of the Council on Foreign Relations and its Finance and Budget Committee; Chairman Emeritus of Board of Human Rights Watch and Member of its Investment Committee; and Member of Investment Committee Board of Historic Hudson Valley (non-profit cultural organization); Member of the Board, Blue Ocean Acquisition Corp.; and Member of the Vestry and the Investment Committee of Trinity Church Wall Street. Formerly: Managing Director of Public Capital Advisors, LLC (privately held financial advisor); Managing Director of Carmona Motley Hoffman, Inc. (privately held financial advisor); Trustee of certain Oppenheimer Funds; and Director of Columbia Equity Financial Corp. (privately held financial advisor) | | 189 | | Member of Board of Trust for Mutual Understanding (non-profit promoting the arts and environment); Member of Board of Greenwall Foundation (bioethics research foundation) and its Investment Committee; Member of Board of Friends of the LRC (non-profit legal advocacy); and Board Member and Investment Committee Member of Pulitzer Center for Crisis Reporting (non-profit journalism) |
Teresa M. Ressel - 1962 Trustee | | 2017 | | Non-executive director and trustee of a number of public and private business corporations Formerly: Chief Executive Officer, UBS Securities LLC (investment banking); Chief Operating Officer, UBS AG Americas (investment banking); Sr. Management Team Olayan America, The Olayan Group (international investor/commercial/industrial); Assistant Secretary for Management & Budget and Designated Chief Financial Officer, U.S. Department of Treasury and Director, ON Semiconductor Corporation (semiconductor manufacturing) | | 189 | | None |
Robert C. Troccoli - 1949 Trustee | | 2016 | | Retired Formerly: Adjunct Professor, University of Denver – Daniels College of Business; and Managing Partner, KPMG LLP | | 189 | | None |
Daniel S. Vandivort -1954 Trustee | | 2019 | | President, Flyway Advisory Services LLC (consulting and property management) Formerly: President and Chief Investment Officer, previously Head of Fixed Income, Weiss Peck and Greer/Robeco Investment Management; Trustee and Chair, Weiss Peck and Greer Funds Board; and various capacities at CS First Boston including Head of Fixed Income at First Boston Asset Management. | | 189 | | Formerly: Trustee and Governance Chair, Oppenheimer Funds; Treasurer, Chairman of the Audit and Finance Committee, Huntington Disease Foundation of America |
| | |
| T-3 | | Invesco Emerging Markets Local Debt Fund |
Trustees and Officers–(continued)
| | | | | | | | |
Name, Year of Birth and Position(s) Held with the Trust | | Trustee and/or Officer Since | | Principal Occupation(s) During Past 5 Years | | Number of Funds in Fund Complex
Overseen by
Trustee | | Other Directorship(s) Held by Trustee During Past 5 Years |
| Officers | | | | |
Sheri Morris - 1964 President and Principal Executive Officer | | 1999 | | Director, Invesco Trust Company; Head of Global Fund Services, Invesco Ltd.; President and Principal Executive Officer, The Invesco Funds; Vice President, Invesco Exchange-Traded Fund Trust, Invesco Exchange-Traded Fund Trust II, Invesco India Exchange-Traded Fund Trust, Invesco Actively Managed Exchange-Traded Fund Trust, Invesco Actively Managed Exchange-Traded Commodity Fund Trust and Invesco Exchange-Traded Self-Indexed Fund Trust; and Vice President, OppenheimerFunds, Inc. Formerly: Vice President, Treasurer and Principal Financial Officer, The Invesco Funds; Vice President, Invesco AIM Advisers, Inc., Invesco AIM Capital Management, Inc. and Invesco AIM Private Asset Management, Inc.; Assistant Vice President and Assistant Treasurer, The Invesco Funds; Vice President and Assistant Vice President, Invesco Advisers, Inc.; Assistant Vice President, Invesco AIM Capital Management, Inc. and Invesco AIM Private Asset Management, Inc.; Treasurer, Invesco Exchange-Traded Fund Trust, Invesco Exchange-Traded Fund Trust II, Invesco India Exchange-Traded Fund Trust and Invesco Actively Managed Exchange-Traded Fund Trust; and Senior Vice President, Invesco Advisers, Inc. (formerly known as Invesco Institutional (N.A.), Inc.) (registered investment adviser) | | N/A | | N/A |
Jeffrey H. Kupor - 1968 Senior Vice President, Chief Legal Officer and Secretary | | 2018 | | Head of Legal of the Americas, Invesco Ltd.; Senior Vice President and Secretary, Invesco Advisers, Inc. (formerly known as Invesco Institutional (N.A.), Inc.) (registered investment adviser); Secretary, Invesco Distributors, Inc. (formerly known as Invesco AIM Distributors, Inc.); Vice President and Secretary, Invesco Investment Services, Inc. (formerly known as Invesco AIM Investment Services, Inc.); Senior Vice President, Chief Legal Officer and Secretary, The Invesco Funds; Secretary and General Counsel, Invesco Investment Advisers LLC (formerly known as Van Kampen Asset Management); Secretary and General Counsel, Invesco Capital Markets, Inc. (formerly known as Van Kampen Funds Inc.); Chief Legal Officer, Invesco Exchange-Traded Fund Trust, Invesco Exchange-Traded Fund Trust II, Invesco India Exchange-Traded Fund Trust, Invesco Actively Managed Exchange-Traded Fund Trust, Invesco Actively Managed Exchange-Traded Commodity Fund Trust and Invesco Exchange-Traded Self-Indexed Fund Trust;; Secretary and Vice President, Harbourview Asset Management Corporation; Secretary and Vice President, OppenheimerFunds, Inc. and Invesco Managed Accounts, LLC; Secretary and Senior Vice President, OFI Global Institutional, Inc.; Secretary and Vice President, OFI SteelPath, Inc.; Secretary and Vice President, Oppenheimer Acquisition Corp.; Secretary and Vice President, Shareholder Services, Inc.; and Secretary and Vice President, Trinity Investment Management Corporation Formerly: Senior Vice President, Invesco Distributors, Inc.; Secretary and Vice President, Jemstep, Inc.; Head of Legal, Worldwide Institutional, Invesco Ltd.; Secretary and General Counsel, INVESCO Private Capital Investments, Inc.; Senior Vice President, Secretary and General Counsel, Invesco Management Group, Inc. (formerly known as Invesco AIM Management Group, Inc.); Assistant Secretary, INVESCO Asset Management (Bermuda) Ltd.; Secretary and General Counsel, Invesco Private Capital, Inc.;Assistant Secretary and General Counsel, INVESCO Realty, Inc.; Secretary and General Counsel, Invesco Senior Secured Management, Inc.; Secretary, Sovereign G./P. Holdings Inc.; Secretary, Invesco Indexing LLC; and Secretary, W.L. Ross & Co., LLC | | N/A | | N/A |
Andrew R. Schlossberg - 1974 Senior Vice President | | 2019 | | Senior Vice President, Invesco Group Services, Inc.; Head of the Americas and Senior Managing Director, Invesco Ltd.; Director and Senior Vice President, Invesco Advisers, Inc. (formerly known as Invesco Institutional (N.A.), Inc.) (registered investment adviser); Director and Chairman, Invesco Investment Services, Inc. (formerly known as Invesco AIM Investment Services, Inc.) (registered transfer agent); Senior Vice President, The Invesco Funds; and Director, Invesco Investment Advisers LLC (formerly known as Van Kampen Asset Management) Formerly: Director, President and Chairman, Invesco Insurance Agency, Inc.; Director, Invesco UK Limited; Director and Chief Executive, Invesco Asset Management Limited and Invesco Fund Managers Limited; Assistant Vice President, The Invesco Funds; Senior Vice President, Invesco Advisers, Inc. (formerly known as Invesco Institutional (N.A.), Inc.) (registered investment adviser); Director and Chief Executive, Invesco Administration Services Limited and Invesco Global Investment Funds Limited; Director, Invesco Distributors, Inc.; Head of EMEA, Invesco Ltd.; President, Invesco Actively Managed Exchange-Traded Commodity Fund Trust, Invesco Actively Managed Exchange-Traded Fund Trust, Invesco Exchange-Traded Fund Trust, Invesco Exchange-Traded Fund Trust II and Invesco India Exchange-Traded Fund Trust; and Managing Director and Principal Executive Officer, Invesco Capital Management LLC | | N/A | | N/A |
| | |
| T-4 | | Invesco Emerging Markets Local Debt Fund |
Trustees and Officers–(continued)
| | | | | | | | |
Name, Year of Birth and Position(s) Held with the Trust | | Trustee and/or Officer Since | | Principal Occupation(s) During Past 5 Years | | Number of Funds in Fund Complex
Overseen by
Trustee | | Other Directorship(s) Held by Trustee During Past 5 Years |
| Officers–(continued) | | | | |
John M. Zerr – 1962 Senior Vice President | | 2006 | | Chief Operating Officer of the Americas; Senior Vice President, Invesco Advisers, Inc. (formerly known as Invesco Institutional (N.A.), Inc.) (registered investment adviser); Senior Vice President, Invesco Distributors, Inc. (formerly known as Invesco AIM Distributors, Inc.); Director and Vice President, Invesco Investment Services, Inc. (formerly known as Invesco AIM Investment Services, Inc.) Senior Vice President, The Invesco Funds; Managing Director, Invesco Capital Management LLC; Director, Invesco Investment Advisers LLC (formerly known as Van Kampen Asset Management); Senior Vice President, Invesco Capital Markets, Inc. (formerly known as Van Kampen Funds Inc.); Manager, Invesco Indexing LLC; Manager, Invesco Specialized Products, LLC; Member, Invesco Canada Funds Advisory Board; Director, President and Chief Executive Officer, Invesco Corporate Class Inc. (corporate mutual fund company); and Director, Chairman, President and Chief Executive Officer, Invesco Canada Ltd. (formerly known as Invesco Trimark Ltd./Invesco Trimark Ltèe) (registered investment adviser and registered transfer agent); President, Invesco, Inc.; President, Invesco Global Direct Real Estate Feeder GP Ltd.; President, Invesco IP Holdings (Canada) Ltd; President, Invesco Global Direct Real Estate GP Ltd.; President, Invesco Financial Services Ltd. / Services Financiers Invesco Ltée; and Director and Chairman, Invesco Trust Company Formerly: President, Trimark Investments Ltd/Services Financiers Invesco Ltee; Director and Senior Vice President, Invesco Insurance Agency, Inc.; Director and Senior Vice President, Invesco Management Group, Inc. (formerly known as Invesco AIM Management Group, Inc.); Secretary and General Counsel, Invesco Management Group, Inc. (formerly known as Invesco AIM Management Group, Inc.); Secretary, Invesco Investment Services, Inc. (formerly known as Invesco AIM Investment Services, Inc.); Chief Legal Officer and Secretary, The Invesco Funds; Secretary and General Counsel, Invesco Investment Advisers LLC (formerly known as Van Kampen Asset Management); Secretary and General Counsel, Invesco Capital Markets, Inc. (formerly known as Van Kampen Funds Inc.); Chief Legal Officer, Invesco Exchange-Traded Fund Trust, Invesco Exchange-Traded Fund Trust II, Invesco India Exchange-Traded Fund Trust, Invesco Actively Managed Exchange-Traded Fund Trust, Invesco Actively Managed Exchange-Traded Commodity Fund Trust and Invesco Exchange-Traded Self-Indexed Fund Trust; Secretary, Invesco Indexing LLC; Director, Secretary, General Counsel and Senior Vice President, Van Kampen Exchange Corp.; Director, Vice President and Secretary, IVZ Distributors, Inc. (formerly known as INVESCO Distributors, Inc.); Director and Vice President, INVESCO Funds Group, Inc.; Director and Vice President, Van Kampen Advisors Inc.; Director, Vice President, Secretary and General Counsel, Van Kampen Investor Services Inc.;Director and Secretary, Invesco Distributors, Inc. (formerly known as Invesco AIM Distributors, Inc.); Director, Senior Vice President, General Counsel and Secretary, Invesco AIM Advisers, Inc. and Van Kampen Investments Inc.; Director, Vice President and Secretary, Fund Management Company; Director, Senior Vice President, Secretary, General Counsel and Vice President, Invesco AIM Capital Management, Inc.; and Chief Operating Officer and General Counsel, Liberty Ridge Capital, Inc. (an investment adviser) | | N/A | | N/A |
Gregory G. McGreevey - 1962 Senior Vice President | | 2012 | | Senior Managing Director, Invesco Ltd.; Director, Chairman, President, and Chief Executive Officer, Invesco Advisers, Inc. (formerly known as Invesco Institutional (N.A.), Inc.) (registered investment adviser); Director, Invesco Mortgage Capital, Inc. and Invesco Senior Secured Management, Inc.; Senior Vice President, The Invesco Funds; President, SNW Asset Management Corporation and Invesco Managed Accounts, LLC; Chairman and Director, Invesco Private Capital, Inc.; Chairman and Director, INVESCO Private Capital Investments, Inc.; Chairman and Director, INVESCO Realty, Inc.; and Senior Vice President, Invesco Group Services, Inc. Formerly: Senior Vice President, Invesco Management Group, Inc. and Invesco Advisers, Inc.; Assistant Vice President, The Invesco Funds | | N/A | | N/A |
Adrien Deberghes - 1967 Principal Financial Officer, Treasurer and Vice President | | 2020 | | Head of the Fund Office of the CFO and Fund Administration; Vice President, Invesco Advisers, Inc.; Principal Financial Officer, Treasurer and Vice President, The Invesco Funds; Vice President, Invesco Exchange-Traded Fund Trust, Invesco Exchange-Traded Fund Trust II, Invesco India Exchange-Traded Fund Trust, Invesco Actively Managed Exchange-Traded Fund Trust, Invesco Actively Managed Exchange-Traded Commodity Fund Trust and Invesco Exchange-Traded Self-Indexed Fund Trust Formerly: Senior Vice President and Treasurer, Fidelity Investments | | N/A | | N/A |
Crissie M. Wisdom - 1969 Anti-Money Laundering Compliance Officer | | 2013 | | Anti-Money Laundering and OFAC Compliance Officer for Invesco U.S. entities including: Invesco Advisers, Inc. and its affiliates, Invesco Capital Markets, Inc., Invesco Distributors, Inc., Invesco Investment Services, Inc., The Invesco Funds, Invesco Capital Management, LLC, Invesco Trust Company; and Fraud Prevention Manager for Invesco Investment Services, Inc. | | N/A | | N/A |
| | |
| T-5 | | Invesco Emerging Markets Local Debt Fund |
Trustees and Officers–(continued)
| | | | | | | | |
Name, Year of Birth and Position(s) Held with the Trust | | Trustee and/or Officer Since | | Principal Occupation(s) During Past 5 Years | | Number of Funds in Fund Complex
Overseen by
Trustee | | Other Directorship(s) Held by Trustee During Past 5 Years |
| Officers–(continued) | | | | | | |
Todd F. Kuehl - 1969 Chief Compliance Officer and Senior Vice President | | 2020 | | Chief Compliance Officer, Invesco Advisers, Inc. (registered investment adviser); and Chief Compliance Officer and Senior Vice President, The Invesco Funds Formerly: Managing Director and Chief Compliance Officer, Legg Mason (Mutual Funds); Chief Compliance Officer, Legg Mason Private Portfolio Group (registered investment adviser) | | N/A | | N/A |
James Bordewick, Jr. - 1959 Senior Vice President and Senior Officer | | 2022 | | Senior Vice President and Senior Officer, The Invesco Funds; and Chief Legal Officer, KingsCrowd, Inc. (research and analytical platform for investment in private capital markets) Formerly, Chief Operating Officer and Head of Legal and Regulatory, Netcapital (private capital investment platform); Managing Director, General Counsel of asset management and Chief Compliance Officer for asset management and private banking, Bank of America Corporation; Chief Legal Officer, Columbia Funds and BofA Funds; Senior Vice President and Associate General Counsel, MFS Investment Management; Chief Legal Officer, MFS Funds; Associate, Ropes & Gray; Associate, Gaston Snow & Ely Bartlett | | N/A | | N/A |
The Statement of Additional Information of the Trust includes additional information about the Fund’s Trustees and is available upon request, without charge, by calling 1.800.959.4246. Please refer to the Fund’s Statement of Additional Information for information on the Fund’s sub-advisers.
| | | | | | |
| Office of the Fund | | Investment Adviser | | Distributor | | Auditors |
| 11 Greenway Plaza, Suite 1000 | | Invesco Advisers, Inc. | | Invesco Distributors, Inc. | | PricewaterhouseCoopers LLP |
| Houston, TX 77046-1173 | | 1555 Peachtree Street, N.E. | | 11 Greenway Plaza, Suite 1000 | | 1000 Louisiana Street, Suite 5800 |
| | Atlanta, GA 30309 | | Houston, TX 77046-1173 | | Houston, TX 77002-5021 |
| | | |
| Counsel to the Fund | | Counsel to the Independent Trustees | | Transfer Agent | | Custodian |
| Stradley Ronon Stevens & Young, LLP | | Goodwin Procter LLP | | Invesco Investment Services, Inc. | | State Street Bank and Trust Company |
| 2005 Market Street, Suite 2600 | | 901 New York Avenue, N.W. | | 11 Greenway Plaza, Suite 1000 | | 225 Franklin Street |
| Philadelphia, PA 19103-7018 | | Washington, D.C. 20001 | | Houston, TX 77046-1173 | | Boston, MA 02110-2801 |
| | |
| T-6 | | Invesco Emerging Markets Local Debt Fund |
(This page intentionally left blank)
(This page intentionally left blank)
(This page intentionally left blank)

Go paperless with eDelivery
Visit invesco.com/edelivery to enjoy the convenience and security of anytime electronic access to your investment documents.
With eDelivery, you can elect to have any or all of the following materials delivered straight to your inbox to download, save and print from your own computer:
∎ Fund reports and prospectuses
∎ Quarterly statements
∎ Daily confirmations
∎ Tax forms
Invesco mailing information
Send general correspondence to Invesco Investment Services, Inc., P.O. Box 219078, Kansas City, MO 64121-9078.
Important notice regarding delivery of security holder documents
To reduce Fund expenses, only one copy of most shareholder documents may be mailed to shareholders with multiple accounts at the same address (Householding). Mailing of your shareholder documents may be householded indefinitely unless you instruct us otherwise. If you do not want the mailing of these documents to be combined with those for other members of your household, please contact Invesco Investment Services, Inc. at 800 959 4246 or contact your financial institution. We will begin sending you individual copies for each account within 30 days after receiving your request.
Fund holdings and proxy voting information
The Fund provides a complete list of its portfolio holdings four times each year, at the end of each fiscal quarter. For the second and fourth quarters, the list appears, respectively, in the Fund’s semiannual and annual reports to shareholders. For the first and third quarters, the Fund files the list with the Securities and Exchange Commission (SEC) as an exhibit to its reports on Form N-PORT. The most recent list of portfolio holdings is available at invesco.com/completeqtrholdings. Shareholders can also look up the Fund’s Form N-PORT filings on the SEC website, sec.gov. The SEC file numbers for the Fund are shown below.
A description of the policies and procedures that the Fund uses to determine how to vote proxies relating to portfolio securities is available without charge, upon request, from our Client Services department at 800 959 4246, or at invesco.com/corporate/about-us/esg. The information is also available on the SEC website, sec.gov.
Information regarding how the Fund voted proxies related to its portfolio securities during the most recent 12-month period ended June 30 is available at invesco.com/proxysearch. This information is also available on the SEC website, sec.gov.
Invesco Advisers, Inc. is an investment adviser; it provides investment advisory services to individual and institutional clients and does not sell securities. Invesco Distributors, Inc. is the US distributor for Invesco Ltd.’s retail mutual funds, exchange-traded funds and institutional money market funds. Both are wholly owned, indirect subsidiaries of Invesco Ltd.

| | | | |
| SEC file number(s): 811-05426 and 033-19338 | | Invesco Distributors, Inc. | | O-EMLD-AR-1 |

| | |
| | |
| Annual Report to Shareholders | | October 31, 2022 |
Invesco Emerging Markets Select Equity Fund
Nasdaq:
A: IEMAX ∎ C: IEMCX ∎ R: IEMRX ∎ Y: IEMYX ∎ R5: IEMIX ∎ R6: EMEFX
Management’s Discussion of Fund Performance
| | | | |
| |
Performance summary | |
For the fiscal year ended October 31, 2022, Class A shares of Invesco Emerging Markets Select Equity Fund (the Fund), at net asset value (NAV), underperformed the MSCI Emerging Markets Index, the Fund’s style-specific benchmark. | |
Your Fund’s long-term performance appears later in this report. | |
| |
Fund vs. Indexes | |
Total returns, 10/31/21 to 10/31/22, at net asset value (NAV). Performance shown does not include applicable contingent deferred sales charges (CDSC) or front-end sales charges, which would have reduced performance. | |
Class A Shares | | | -38.99 | % |
Class C Shares | | | -39.43 | |
Class R Shares | | | -39.15 | |
Class Y Shares | | | -38.83 | |
Class R5 Shares | | | -38.83 | |
Class R6 Shares | | | -38.93 | |
MSCI EAFE Index▼ (Broad Market Index) | | | -23.00 | |
MSCI Emerging Markets Index▼ (Style-Specific Index) | | | -31.03 | |
Lipper Emerging Market Funds Index∎ (Peer Group Index) | | | -32.51 | |
| |
Source(s): ▼RIMES Technologies Corp.; ∎Lipper Inc. | | | | |
Market conditions and your Fund
At the beginning of the fiscal year ended October 31, 2022, developed global equity markets were mostly positive, despite rising inflation and the emergence of Omicron, a new COVID-19 variant. Pandemic-related supply chain disruptions and labor shortages intensified at the end of 2021, resulting in broadly higher costs for companies and consumers. Emerging market equities declined due in part to COVID-19 concerns and China’s ongoing regulatory tightening in the private education and technology sectors and slowing economic growth.
Global equity markets declined in the first half of 2022 amid volatility sparked by Russia’s invasion of Ukraine, rising commodity prices, rampant global inflation and central banks shifting toward tighter monetary policy. Russia’s invasion exacerbated inflationary pressures, disrupting already strained supply chains, and increasing shortages of oil, gas and raw materials, with the price of oil rising sharply.
Inflation headwinds continued into the third quarter of 2022. The US Federal Reserve (the Fed), the European Central Bank and the Bank of England all raised interest rates. In contrast, the People’s Bank of China lowered its policy rate and the Bank of Japan kept rates the same. Emerging market equities, hampered by the strong US dollar, underperformed developed market equities.
During October 2022, developed market equities rebounded and were in positive territory. Developed market equities outperformed emerging market equities, which declined primarily driven by weakness in China as Chinese markets reacted to the reappointment of President Xi and his authority, with no signs of the country’s zero-COVID-19 policy being relaxed. Despite the rebound in October for developed market equities, at the
end of the fiscal year, trailing one-year returns for developed market equities and emerging market equities were both in negative territory.
Before we discuss the Fund’s results during the fiscal year, it is helpful to briefly explain how we manage the Fund for shareholders. We seek to maintain a long-term perspective, with stock selection in the portfolio being bottom-up and fundamentally driven. We invest in high-conviction businesses with preferred quality characteristics, including a focus on a company’s growth potential and sustainable competitive advantages. We strive to develop a proprietary view of a business through in-depth, fundamental research that includes careful financial statement analysis. We then seek to purchase businesses whose stock prices are below what we have calculated to be the true value of the company based on an estimate of its future free cash flows.
During the fiscal year, security selection within the consumer discretionary and information technology sectors were beneficial to the Fund’s performance relative to the Fund’s style-specific benchmark. From a country perspective, an overweighting to Brazil and Mexico, two of the stronger performing countries within emerging markets, contributed to the Fund’s relative performance, as did positive security selection in China. The top individual contributors to the Fund’s absolute performance over the fiscal year included Arcos Dorados, a leading McDonald’s franchisee based in Latin America and Itau Unibanco, the largest private bank in Brazil.
Conversely, the Fund’s security selection in the communication services and financials sectors hurt the Fund’s performance relative to the style-specific benchmark over the fiscal year. From a country perspective, the Fund’s security selection in India and Taiwan detracted from relative performance, as did two
holdings that the Fund held in Russia. The top individual detractors from the Fund’s absolute performance included China Isotope & Radiation, a Chinese diagnostic and therapeutic radiopharmaceuticals company and Tencent, a Chinese internet and technology company.
During the fiscal year, the Fund acquired new holdings, which included Pinduoduo,
Yum China, Inner Mongolia Yili Industrial and Itau Unibanco. Generally, we sell Fund holdings when they reach full valuation; if new, relatively more attractive investment opportunities exist; or if new information changes our thesis on the future of a business. As such, we sold Alibaba, Ping An Insurance, China National Building Material and Vipshop Holdings.
At the close of the fiscal year, relative to the style-specific benchmark, the Fund’s largest overweight positions were in the consumer discretionary and consumer staples sectors. Conversely, the Fund’s largest underweight positions were in the information technology and financial sectors. The Fund ended the fiscal year with its largest overweight exposures to China and Brazil while having the largest underweight exposures to Taiwan and South Korea.
Please note, the Fund’s country and sector allocations are the result of our bottom-up, fundamental stock selection process, and are not based on the characteristics of the Fund’s style-specific index.
As always, we thank you for your investment in Invesco Emerging Markets Select Equity Fund and for sharing our long-term investment perspective.
Portfolio manager(s):
Justin Leverenz
The views and opinions expressed in management’s discussion of Fund performance are those of Invesco Advisers, Inc. and its affiliates. These views and opinions are subject to change at any time based on factors such as market and economic conditions. These views and opinions may not be relied upon as investment advice or recommendations, or as an offer for a particular security. The information is not a complete analysis of every aspect of any market, country, industry, security or the Fund. Statements of fact are from sources considered reliable, but Invesco Advisers, Inc. makes no representation or warranty as to their completeness or accuracy. Although historical performance is no guarantee of future results, these insights may help you understand our investment management philosophy.
See important Fund and, if applicable, index disclosures later in this report.
| | |
| 2 | | Invesco Emerging Markets Select Equity Fund |
Your Fund’s Long-Term Performance
Results of a $10,000 Investment – Oldest Share Class(es)
Fund and index data from 10/31/12
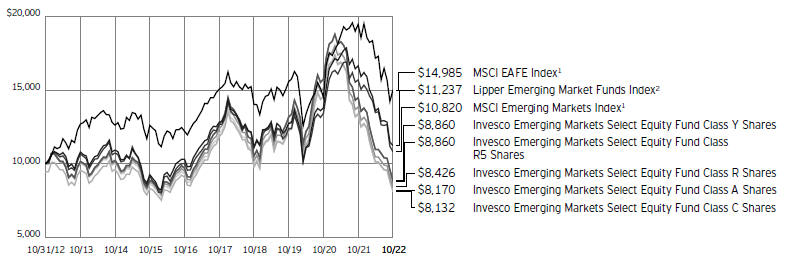
1 Source: RIMES Technologies Corp.
2 Source: Lipper Inc.
Past performance cannot guarantee future results.
The data shown in the chart include reinvested distributions, applicable sales charges and Fund expenses including management
fees. Index results include reinvested dividends, but they do not reflect sales charges. Performance of the peer group, if applicable, reflects fund expenses and management fees;
performance of a market index does not. Performance shown in the chart does not reflect deduction of taxes a shareholder would pay on Fund distributions or sale of Fund shares.
| | |
| 3 | | Invesco Emerging Markets Select Equity Fund |
| | | | |
| |
Average Annual Total Returns | |
As of 10/31/22, including maximum applicable sales charges | |
| |
Class A Shares | | | | |
Inception (5/31/11) | | | -3.97 | % |
10 Years | | | -2.00 | |
5 Years | | | -8.19 | |
1 Year | | | -42.33 | |
| |
Class C Shares | | | | |
Inception (5/31/11) | | | -4.00 | % |
10 Years | | | -2.05 | |
5 Years | | | -7.84 | |
1 Year | | | -40.02 | |
| |
Class R Shares | | | | |
Inception (5/31/11) | | | -3.75 | % |
10 Years | | | -1.70 | |
5 Years | | | -7.39 | |
1 Year | | | -39.15 | |
| |
Class Y Shares | | | | |
Inception (5/31/11) | | | -3.27 | % |
10 Years | | | -1.20 | |
5 Years | | | -6.93 | |
1 Year | | | -38.83 | |
| |
Class R5 Shares | | | | |
Inception (5/31/11) | | | -3.27 | % |
10 Years | | | -1.20 | |
5 Years | | | -6.93 | |
1 Year | | | -38.83 | |
| |
Class R6 Shares | | | | |
Inception (9/24/12) | | | -1.51 | % |
10 Years | | | -1.23 | |
5 Years | | | -6.94 | |
1 Year | | | -38.93 | |
The performance data quoted represent past performance and cannot guarantee future results; current performance may be lower or higher. Please visit invesco.com/performance for the most recent month-end performance. Performance figures reflect reinvested distributions, changes in net asset value and the effect of the maximum sales charge unless otherwise stated. Performance figures do not reflect deduction of taxes a shareholder would pay on Fund distributions or sale of Fund shares. Investment return and principal value will fluctuate so that you may have a gain or loss when you sell shares.
Class A share performance reflects the maximum 5.50% sales charge, and Class C share performance reflects the applicable contingent deferred sales charge (CDSC) for the period involved. The CDSC on Class C shares is 1% for the first year after purchase. Class R, Class Y, Class R5 and Class R6 shares do not have a front-end sales charge or a CDSC; therefore, performance is at net asset value.
The performance of the Fund’s share classes will differ primarily due to different sales charge structures and class expenses.
Fund performance reflects any applicable fee waivers and/or expense reimbursements. Had the adviser not waived fees
and/or reimbursed expenses currently or in the past, returns would have been lower. See current prospectus for more information.
| | |
| 4 | | Invesco Emerging Markets Select Equity Fund |
Supplemental Information
Invesco Emerging Markets Select Equity Fund’s investment objective is long-term growth of capital.
| ∎ | Unless otherwise stated, information presented in this report is as of October 31, 2022, and is based on total net assets. |
| ∎ | Unless otherwise noted, all data is provided by Invesco. |
| ∎ | To access your Fund’s reports/prospectus, visit invesco.com/fundreports. |
About indexes used in this report
| ∎ | The MSCI EAFE® Index is an unmanaged index considered representative of stocks of Europe, Australasia and the Far East. The index is computed using the net return, which withholds applicable taxes for non-resident investors. |
| ∎ | The MSCI Emerging Markets IndexSM is an unmanaged index considered representative of stocks of developing countries. The index is computed using the net return, which withholds applicable taxes for non-resident investors. |
| ∎ | The Lipper Emerging Market Funds Index is an unmanaged index considered representative of emerging market funds tracked by Lipper. |
| ∎ | The Fund is not managed to track the performance of any particular index, including the index(es) described here, and consequently, the performance of the Fund may deviate significantly from the performance of the index(es). |
| ∎ | A direct investment cannot be made in an index. Unless otherwise indicated, index results include reinvested dividends, and they do not reflect sales charges. Performance of the peer group, if applicable, reflects fund expenses; performance of a market index does not. |
|
|
This report must be accompanied or preceded by a currently effective Fund prospectus, which contains more complete information, including sales charges and expenses. Investors should read it carefully before investing. |
|
| NOT FDIC INSURED | MAY LOSE VALUE | NO BANK GUARANTEE |
| | |
| 5 | | Invesco Emerging Markets Select Equity Fund |
Fund Information
Portfolio Composition
| | | | | |
| By sector | | % of total net assets |
| |
Consumer Discretionary | | | | 32.16 | % |
| |
Consumer Staples | | | | 15.85 | |
| |
Financials | | | | 14.88 | |
| |
Information Technology | | | | 9.82 | |
| |
Health Care | | | | 8.52 | |
| |
Industrials | | | | 8.22 | |
| |
Real Estate | | | | 2.97 | |
| |
Communication Services | | | | 2.80 | |
| |
Materials | | | | 2.28 | |
| |
Money Market Funds Plus Other Assets Less Liabilities | | | | 2.50 | |
Top 10 Equity Holdings*
| | | | | | | |
| | | | | % of total net assets |
| | |
1. | | Gree Electric Appliances, Inc. of Zhuhai, A Shares | | | | 5.42 | % |
| | |
2. | | China Isotope & Radiation Corp. | | | | 4.99 | |
| | |
3. | | Housing Development Finance Corp. Ltd. | | | | 4.82 | |
| | |
4. | | Pinduoduo, Inc., ADR | | | | 4.44 | |
| | |
5. | | Samsung Electronics Co. Ltd., Preference Shares | | | | 4.32 | |
| | |
6. | | Kweichow Moutai Co. Ltd., A Shares | | | | 4.12 | |
| | |
7. | | Yum China Holdings, Inc. | | | | 3.90 | |
| | |
8. | | PT Bank Rakyat Indonesia (Persero) Tbk | | | | 3.69 | |
| | |
9. | | Inner Mongolia Yili Industrial Group Co. Ltd., A Shares | | | | 3.28 | |
| | |
10. | | KE Holdings, Inc., ADR | | | | 2.97 | |
The Fund’s holdings are subject to change, and there is no assurance that the Fund will continue to hold any particular security.
| * | Excluding money market fund holdings, if any. |
Data presented here are as of October 31, 2022.
| | |
| 6 | | Invesco Emerging Markets Select Equity Fund |
Schedule of Investments
October 31, 2022
| | | | | | | | |
| | | Shares | | | Value | |
|
| |
Common Stocks & Other Equity Interests–97.50% | |
Brazil��18.54% | | | | | | | | |
Afya Ltd., Class A(a)(b) | | | 70,000 | | | $ | 1,031,800 | |
|
| |
Ambev S.A. | | | 350,000 | | | | 1,084,116 | |
|
| |
Arcos Dorados Holdings, Inc., Class A | | | 122,000 | | | | 919,880 | |
|
| |
Grupo SBF S.A. | | | 160,001 | | | | 586,665 | |
|
| |
Hypera S.A. | | | 80,000 | | | | 786,913 | |
|
| |
Itau Unibanco Holding S.A., Preference Shares | | | 186,000 | | | | 1,094,647 | |
|
| |
MercadoLibre, Inc.(a) | | | 1,000 | | | | 901,620 | |
|
| |
Raia Drogasil S.A. | | | 115,000 | | | | 585,742 | |
|
| |
| | | | | | | 6,991,383 | |
|
| |
| | |
Chile–0.72% | | | | | | | | |
Banco de Chile | | | 3,000,000 | | | | 271,053 | |
|
| |
| | |
China–40.17% | | | | | | | | |
Beijing Airdoc Technology Co. Ltd.(a)(c) | | | 107,600 | | | | 141,433 | |
|
| |
China Isotope & Radiation Corp. | | | 1,218,800 | | | | 1,879,576 | |
|
| |
East Money Information Co. Ltd., A Shares | | | 486,000 | | | | 1,037,763 | |
|
| |
Gree Electric Appliances, Inc. of Zhuhai, A Shares | | | 520,003 | | | | 2,043,116 | |
|
| |
Haitian International Holdings Ltd. | | | 278,000 | | | | 555,892 | |
|
| |
Helens International Holdings Co.
Ltd.(a) | | | 460,000 | | | | 442,614 | |
|
| |
Inner Mongolia Yili Industrial Group Co. Ltd., A Shares | | | 358,000 | | | | 1,237,652 | |
|
| |
KE Holdings, Inc., ADR(a)(b) | | | 110,000 | | | | 1,119,800 | |
|
| |
Kweichow Moutai Co. Ltd., A Shares | | | 8,400 | | | | 1,555,052 | |
|
| |
Medlive Technology Co. Ltd.(c) | | | 467,500 | | | | 403,993 | |
|
| |
Pinduoduo, Inc., ADR(a) | | | 30,500 | | | | 1,672,315 | |
|
| |
Shenzhou International Group Holdings Ltd. | | | 106,500 | | | | 735,060 | |
|
| |
Tencent Holdings Ltd. | | | 22,000 | | | | 577,275 | |
|
| |
Virscend Education Co. Ltd.(c) | | | 16,000,000 | | | | 277,485 | |
|
| |
Yum China Holdings, Inc. | | | 35,600 | | | | 1,472,060 | |
|
| |
| | | | | | | 15,151,086 | |
|
| |
| | |
India–13.12% | | | | | | | | |
Computer Age Management Services Ltd. | | | 32,000 | | | | 984,794 | |
|
| |
FSN E-Commerce Ventures Ltd.(a) | | | 48,500 | | | | 676,131 | |
|
| |
Housing Development Finance Corp. Ltd. | | | 61,000 | | | | 1,818,592 | |
|
| |
Varun Beverages Ltd. | | | 43,800 | | | | 554,555 | |
|
| |
Zomato Ltd.(a) | | | 1,200,000 | | | | 912,688 | |
|
| |
| | | | | | | 4,946,760 | |
|
| |
| | |
Indonesia–5.97% | | | | | | | | |
PT Avia Avian Tbk | | | 17,077,700 | | | | 859,528 | |
|
| |
PT Bank Rakyat Indonesia (Persero) Tbk | | | 4,680,000 | | | | 1,392,703 | |
|
| |
| | | | | | | 2,252,231 | |
|
| |
| | |
Malaysia–1.74% | | | | | | | | |
CTOS Digital Bhd. | | | 2,200,000 | | | | 655,736 | |
|
| |
| | |
Mexico–3.42% | | | | | | | | |
Arca Continental S.A.B. de C.V. | | | 43,058 | | | | 352,692 | |
|
| |
| | | | | | | | |
| | | Shares | | | Value | |
|
| |
Mexico–(continued) | | | | | | | | |
Grupo Aeroportuario del Sureste S.A.B. de C.V., Class B | | | 39,999 | | | $ | 936,129 | |
|
| |
| | | | | | | 1,288,821 | |
|
| |
| | |
Poland–3.80% | | | | | | | | |
CD Projekt S.A.(b) | | | 18,000 | | | | 478,608 | |
|
| |
InPost S.A.(a) | | | 150,000 | | | | 956,787 | |
|
| |
| | | | | | | 1,435,395 | |
|
| |
| | |
Russia–0.00% | | | | | | | | |
Sberbank of Russia PJSC(a)(d) | | | 532,000 | | | | 0 | |
|
| |
Yandex N.V., Class A(a)(d) | | | 26,000 | | | | 0 | |
|
| |
| | | | | | | 0 | |
|
| |
| | |
South Korea–5.51% | | | | | | | | |
Coupang, Inc.(a)(b) | | | 26,000 | | | | 449,020 | |
|
| |
Samsung Electronics Co. Ltd., Preference Shares | | | 43,600 | | | | 1,628,144 | |
|
| |
| | | | | | | 2,077,164 | |
|
| |
| | |
Taiwan–2.89% | | | | | | | | |
King Slide Works Co. Ltd. | | | 9,000 | | | | 117,045 | |
|
| |
Taiwan Semiconductor Manufacturing Co. Ltd. | | | 81,000 | | | | 974,762 | |
|
| |
| | | | | | | 1,091,807 | |
|
| |
| | |
Thailand–1.62% | | | | | | | | |
Thai Beverage PCL | | | 1,500,000 | | | | 609,584 | |
|
| |
Total Common Stocks & Other Equity Interests
(Cost $50,780,880) | | | | 36,771,020 | |
|
| |
| | |
Money Market Funds–2.67% | | | | | | | | |
Invesco Government & Agency Portfolio, Institutional Class,
3.07%(e)(f) | | | 354,701 | | | | 354,701 | |
|
| |
Invesco Liquid Assets Portfolio, Institutional Class, 3.03%(e)(f) | | | 248,510 | | | | 248,560 | |
|
| |
Invesco Treasury Portfolio, Institutional Class, 3.08%(e)(f) | | | 405,372 | | | | 405,372 | |
|
| |
Total Money Market Funds (Cost $1,008,610) | | | | 1,008,633 | |
|
| |
TOTAL INVESTMENTS IN SECURITIES (excluding Investments purchased with cash collateral from securities on loan)-100.17%
(Cost $51,789,490) | | | | | | | 37,779,653 | |
|
| |
|
Investments Purchased with Cash Collateral from Securities on Loan | |
Money Market Funds–3.66% | | | | | | | | |
Invesco Private Government Fund, 3.18%(e)(f)(g) | | | 386,334 | | | | 386,334 | |
|
| |
Invesco Private Prime Fund,
3.28%(e)(f)(g) | | | 993,173 | | | | 993,173 | |
|
| |
Total Investments Purchased with Cash Collateral from Securities on Loan
(Cost $1,379,499) | | | | 1,379,507 | |
|
| |
TOTAL INVESTMENTS IN SECURITIES–103.83%
(Cost $53,168,989) | | | | 39,159,160 | |
|
| |
OTHER ASSETS LESS LIABILITIES–(3.83)% | | | | (1,444,028 | ) |
|
| |
NET ASSETS–100.00% | | | | | | $ | 37,715,132 | |
|
| |
See accompanying Notes to Financial Statements which are an integral part of the financial statements.
| | |
| 7 | | Invesco Emerging Markets Select Equity Fund |
Investment Abbreviations:
ADR – American Depositary Receipt
Notes to Schedule of Investments:
| (a) | Non-income producing security. |
| (b) | All or a portion of this security was out on loan at October 31, 2022. |
| (c) | Security purchased or received in a transaction exempt from registration under the Securities Act of 1933, as amended (the “1933 Act”). The security may be resold pursuant to an exemption from registration under the 1933 Act, typically to qualified institutional buyers. The aggregate value of these securities at October 31, 2022 was $822,911, which represented 2.18% of the Fund’s Net Assets. |
| (d) | Security valued using significant unobservable inputs (Level 3). See Note 3. |
| (e) | Affiliated issuer. The issuer and/or the Fund is a wholly-owned subsidiary of Invesco Ltd., or is affiliated by having an investment adviser that is under common control of Invesco Ltd. The table below shows the Fund’s transactions in, and earnings from, its investments in affiliates for the fiscal year ended October 31, 2022. |
| | | | | | | | | | | | | | | | | | | | | | | | | | | | |
| | | | | | | | | Change in | | Realized | | | | |
| | | Value | | Purchases | | Proceeds | | Unrealized | | Gain | | Value | | |
| | | October 31, 2021 | | at Cost | | from Sales | | Appreciation | | (Loss) | | October 31, 2022 | | Dividend Income |
| Investments in Affiliated Money Market Funds: | | | | | | | | | | | | | | | | | | | | | | | | | | | | |
Invesco Government & Agency Portfolio, Institutional Class | | $ | 2,026,877 | | | $ | 7,931,351 | | | $ | (9,603,527 | ) | | $ | - | | | $ | - | | | $ | 354,701 | | | | $ 1,828 | |
Invesco Liquid Assets Portfolio, Institutional Class | | | 1,411,912 | | | | 5,665,250 | | | | (6,828,642 | ) | | | 61 | | | | (21 | ) | | | 248,560 | | | | 1,812 | |
Invesco Treasury Portfolio, Institutional Class | | | 2,316,431 | | | | 9,064,401 | | | | (10,975,460 | ) | | | - | | | | - | | | | 405,372 | | | | 2,750 | |
| Investments Purchased with Cash Collateral from Securities on Loan: | | | | | | | | | | | | | | | | | | | | | | | | | | | | |
Invesco Private Government Fund | | | - | | | | 7,613,664 | | | | (7,227,330 | ) | | | - | | | | - | | | | 386,334 | | | | 4,650 | * |
Invesco Private Prime Fund | | | - | | | | 17,936,222 | | | | (16,943,196 | ) | | | 8 | | | | 139 | | | | 993,173 | | | | 12,578 | * |
Total | | $ | 5,755,220 | | | $ | 48,210,888 | | | $ | (51,578,155 | ) | | $ | 69 | | | $ | 118 | | | $ | 2,388,140 | | | | $23,618 | |
| | * | Represents the income earned on the investment of cash collateral, which is included in securities lending income on the Statement of Operations. Does not include rebates and fees paid to lending agent or premiums received from borrowers, if any. |
| (f) | The rate shown is the 7-day SEC standardized yield as of October 31, 2022. |
| (g) | The security has been segregated to satisfy the commitment to return the cash collateral received in securities lending transactions upon the borrower’s return of the securities loaned. See Note 1I. |
See accompanying Notes to Financial Statements which are an integral part of the financial statements.
| | |
| 8 | | Invesco Emerging Markets Select Equity Fund |
Statement of Assets and Liabilities
October 31, 2022
| | | | |
Assets: | | | | |
Investments in unaffiliated securities, at value
(Cost $50,780,880)* | | $ | 36,771,020 | |
|
| |
Investments in affiliated money market funds, at value (Cost $2,388,109) | | | 2,388,140 | |
|
| |
Foreign currencies, at value (Cost $25,511) | | | 21,105 | |
|
| |
Receivable for: | | | | |
Investments sold | | | 76,814 | |
|
| |
Fund shares sold | | | 37,996 | |
|
| |
Dividends | | | 16,549 | |
|
| |
Investment for trustee deferred compensation and retirement plans | | | 17,620 | |
|
| |
Other assets | | | 38,462 | |
|
| |
Total assets | | | 39,367,706 | |
|
| |
| |
Liabilities: | | | | |
Payable for: | | | | |
Investments purchased | | | 115,694 | |
|
| |
Fund shares reacquired | | | 35,354 | |
|
| |
Accrued foreign taxes | | | 3,174 | |
|
| |
Collateral upon return of securities loaned | | | 1,379,499 | |
|
| |
Accrued fees to affiliates | | | 29,710 | |
|
| |
Accrued trustees’ and officers’ fees and benefits | | | 852 | |
|
| |
Accrued other operating expenses | | | 69,321 | |
|
| |
Trustee deferred compensation and retirement plans | | | 18,970 | |
|
| |
Total liabilities | | | 1,652,574 | |
|
| |
Net assets applicable to shares outstanding | | $ | 37,715,132 | |
|
| |
| |
Net assets consist of: | | | | |
Shares of beneficial interest | | $ | 64,244,192 | |
|
| |
Distributable earnings (loss) | | | (26,529,060 | ) |
|
| |
| | $ | 37,715,132 | |
|
| |
| | | | |
Net Assets: | | | | |
Class A | | $ | 19,148,304 | |
|
| |
Class C | | $ | 2,730,809 | |
|
| |
Class R | | $ | 2,793,546 | |
|
| |
Class Y | | $ | 10,950,764 | |
|
| |
Class R5 | | $ | 1,359,381 | |
|
| |
Class R6 | | $ | 732,328 | |
|
| |
|
Shares outstanding, no par value, with an unlimited number of shares authorized: | |
Class A | | | 3,367,608 | |
|
| |
Class C | | | 503,963 | |
|
| |
Class R | | | 498,161 | |
|
| |
Class Y | | | 1,915,246 | |
|
| |
Class R5 | | | 237,713 | |
|
| |
Class R6 | | | 128,148 | |
|
| |
Class A: | | | | |
Net asset value per share | | $ | 5.69 | |
|
| |
Maximum offering price per share
(Net asset value of $5.69 ÷ 94.50%) | | $ | 6.02 | |
|
| |
Class C: | | | | |
Net asset value and offering price per share | | $ | 5.42 | |
|
| |
Class R: | | | | |
Net asset value and offering price per share | | $ | 5.61 | |
|
| |
Class Y: | | | | |
Net asset value and offering price per share | | $ | 5.72 | |
|
| |
Class R5: | | | | |
Net asset value and offering price per share | | $ | 5.72 | |
|
| |
Class R6: | | | | |
Net asset value and offering price per share | | $ | 5.71 | |
|
| |
| * | At October 31, 2022, securities with an aggregate value of $1,330,587 were on loan to brokers. |
See accompanying Notes to Financial Statements which are an integral part of the financial statements.
| | |
| 9 | | Invesco Emerging Markets Select Equity Fund |
Statement of Operations
For the year ended October 31, 2022
| | | | |
Investment income: | | | | |
| |
Dividends (net of foreign withholding taxes of $144,032) | | $ | 1,285,687 | |
|
| |
Dividends from affiliated money market funds (includes net securities lending income of $1,038) | | | 7,428 | |
|
| |
Total investment income | | | 1,293,115 | |
|
| |
| |
Expenses: | | | | |
| |
Advisory fees | | | 533,849 | |
|
| |
Administrative services fees | | | 7,257 | |
|
| |
Custodian fees | | | 37,588 | |
|
| |
Distribution fees: | | | | |
Class A | | | 74,057 | |
|
| |
Class C | | | 39,944 | |
|
| |
Class R | | | 17,857 | |
|
| |
Transfer agent fees – A, C, R and Y | | | 127,693 | |
|
| |
Transfer agent fees – R5 | | | 530 | |
|
| |
Transfer agent fees – R6 | | | 335 | |
|
| |
Trustees’ and officers’ fees and benefits | | | 19,501 | |
|
| |
Registration and filing fees | | | 79,290 | |
|
| |
Reports to shareholders | | | 15,690 | |
|
| |
Professional services fees | | | 57,165 | |
|
| |
Other | | | 12,458 | |
|
| |
Total expenses | | | 1,023,214 | |
|
| |
Less: Fees waived, expenses reimbursed and/or expense offset arrangement(s) | | | (275,392 | ) |
|
| |
Net expenses | | | 747,822 | |
|
| |
Net investment income | | | 545,293 | |
|
| |
| |
Realized and unrealized gain (loss) from: | | | | |
Net realized gain (loss) from: | | | | |
Unaffiliated investment securities (net of foreign taxes of $19,139) | | | (12,000,934 | ) |
|
| |
Affiliated investment securities | | | 118 | |
|
| |
Foreign currencies | | | (109,041 | ) |
|
| |
Forward foreign currency contracts | | | (2,773 | ) |
|
| |
| | | (12,112,630 | ) |
|
| |
Change in net unrealized appreciation (depreciation) of: | | | | |
Unaffiliated investment securities (net of foreign taxes of $129,744) | | | (16,021,885 | ) |
|
| |
Affiliated investment securities | | | 69 | |
|
| |
Foreign currencies | | | (1,416 | ) |
|
| |
| | | (16,023,232 | ) |
|
| |
Net realized and unrealized gain (loss) | | | (28,135,862 | ) |
|
| |
Net increase (decrease) in net assets resulting from operations | | $ | (27,590,569 | ) |
|
| |
See accompanying Notes to Financial Statements which are an integral part of the financial statements.
| | |
| 10 | | Invesco Emerging Markets Select Equity Fund |
Statement of Changes in Net Assets
For the years ended October 31, 2022 and 2021
| | | | | | | | |
| | | 2022 | | | 2021 | |
|
| |
Operations: | | | | | | | | |
Net investment income | | $ | 545,293 | | | $ | 917,718 | |
|
| |
Net realized gain (loss) | | | (12,112,630 | ) | | | 5,548,469 | |
|
| |
Change in net unrealized appreciation (depreciation) | | | (16,023,232 | ) | | | (15,956,937 | ) |
|
| |
Net increase (decrease) in net assets resulting from operations | | | (27,590,569 | ) | | | (9,490,750 | ) |
|
| |
| | |
Distributions to shareholders from distributable earnings: | | | | | | | | |
Class A | | | (1,347,566 | ) | | | (232,728 | ) |
|
| |
Class C | | | (149,032 | ) | | | (30,624 | ) |
|
| |
Class R | | | (137,567 | ) | | | (18,143 | ) |
|
| |
Class Y | | | (818,543 | ) | | | (196,967 | ) |
|
| |
Class R5 | | | (80,790 | ) | | | (14,105 | ) |
|
| |
Class R6 | | | (57,289 | ) | | | (7,257 | ) |
|
| |
Total distributions from distributable earnings | | | (2,590,787 | ) | | | (499,824 | ) |
|
| |
| | |
Share transactions–net: | | | | | | | | |
Class A | | | (5,657,746 | ) | | | 6,168,552 | |
|
| |
Class C | | | (764,650 | ) | | | (684,996 | ) |
|
| |
Class R | | | 379,273 | | | | 1,340,633 | |
|
| |
Class Y | | | (10,476,582 | ) | | | (984,967 | ) |
|
| |
Class R5 | | | 80,442 | | | | (1,742 | ) |
|
| |
Class R6 | | | (165,209 | ) | | | 546,920 | |
|
| |
Net increase (decrease) in net assets resulting from share transactions | | | (16,604,472 | ) | | | 6,384,400 | |
|
| |
Net increase (decrease) in net assets | | | (46,785,828 | ) | | | (3,606,174 | ) |
|
| |
| | |
Net assets: | | | | | | | | |
Beginning of year | | | 84,500,960 | | | | 88,107,134 | |
|
| |
End of year | | $ | 37,715,132 | | | $ | 84,500,960 | |
|
| |
See accompanying Notes to Financial Statements which are an integral part of the financial statements.
| | |
| 11 | | Invesco Emerging Markets Select Equity Fund |
Financial Highlights
The following schedule presents financial highlights for a share of the Fund outstanding throughout the periods indicated.
| | | | | | | | | | | | | | | | | | | | | | | | | | | | | | | | | | | | | | | | | | | | | | | | | | | | | | | | | | | | | | | | | | | | | | |
| | | Net asset
value,
beginning
of period | | Net
investment
income
(loss)(a) | | Net gains
(losses) on securities
(both
realized and
unrealized) | | Total from
investment
operations | | Dividends
from net
investment
income | | Distributions
from net
realized
gains | | Total
distributions | | Net asset
value, end
of period | | Total
return (b) | | Net assets,
end of period
(000’s omitted) | | Ratio of
expenses
to average net assets
with fee waivers
and/or
expenses
absorbed | | Ratio of
expenses
to average net
assets without
fee waivers
and/or
expenses
absorbed | | Ratio of net
investment
income
(loss)
to average
net assets | | Portfolio
turnover (c) |
Class A | | | | | | | | | | | | | | | | | | | | | | | | | | | | | | | | | | | | | | | | | | | | | | | | | | | | | | | | | | | | | | | | | | | | | | |
Year ended 10/31/22 | | | $ | 9.68 | | | | $ | 0.07 | | | | $ | (3.73 | ) | | | $ | (3.66 | ) | | | $ | (0.07 | ) | | | $ | (0.26 | ) | | | $ | (0.33 | ) | | | $ | 5.69 | | | | | (38.99 | )% | | | $ | 19,148 | | | | | 1.33 | % | | | | 1.83 | % | | | | 0.93 | % | | | | 70 | % |
Year ended 10/31/21 | | | | 10.58 | | | | | 0.10 | | | | | (0.94 | ) | | | | (0.84 | ) | | | | (0.06 | ) | | | | – | | | | | (0.06 | ) | | | | 9.68 | | | | | (8.07 | ) | | | | 40,389 | | | | | 1.33 | | | | | 1.67 | | | | | 0.84 | | | | | 47 | |
Year ended 10/31/20 | | | | 9.10 | | | | | 0.04 | | | | | 1.67 | | | | | 1.71 | | | | | (0.23 | ) | | | | – | | | | | (0.23 | ) | | | | 10.58 | | | | | 19.11 | | | | | 39,446 | | | | | 1.33 | | | | | 1.72 | | | | | 0.45 | | | | | 42 | |
Year ended 10/31/19 | | | | 7.67 | | | | | 0.23 | (d) | | | | 1.60 | | | | | 1.83 | | | | | (0.03 | ) | | | | (0.37 | ) | | | | (0.40 | ) | | | | 9.10 | | | | | 25.14 | | | | | 34,665 | | | | | 1.33 | | | | | 1.89 | | | | | 2.81 | (d) | | | | 45 | |
Year ended 10/31/18 | | | | 9.30 | | | | | 0.07 | | | | | (1.69 | ) | | | | (1.62 | ) | | | | (0.01 | ) | | | | – | | | | | (0.01 | ) | | | | 7.67 | | | | | (17.45 | ) | | | | 27,580 | | | | | 1.33 | | | | | 2.03 | | | | | 0.73 | | | | | 104 | |
Class C | | | | | | | | | | | | | | | | | | | | | | | | | | | | | | | | | | | | | | | | | | | | | | | | | | | | | | | | | | | | | | | | | | | | | | |
Year ended 10/31/22 | | | | 9.23 | | | | | 0.01 | | | | | (3.56 | ) | | | | (3.55 | ) | | | | – | | | | | (0.26 | ) | | | | (0.26 | ) | | | | 5.42 | | | | | (39.43 | ) | | | | 2,731 | | | | | 2.08 | | | | | 2.58 | | | | | 0.18 | | | | | 70 | |
Year ended 10/31/21 | | | | 10.16 | | | | | 0.01 | | | | | (0.90 | ) | | | | (0.89 | ) | | | | (0.04 | ) | | | | – | | | | | (0.04 | ) | | | | 9.23 | | | | | (8.81 | ) | | | | 5,605 | | | | | 2.08 | | | | | 2.42 | | | | | 0.09 | | | | | 47 | |
Year ended 10/31/20 | | | | 8.74 | | | | | (0.03 | ) | | | | 1.60 | | | | | 1.57 | | | | | (0.15 | ) | | | | – | | | | | (0.15 | ) | | | | 10.16 | | | | | 18.17 | | | | | 6,882 | | | | | 2.08 | | | | | 2.47 | | | | | (0.30 | ) | | | | 42 | |
Year ended 10/31/19 | | | | 7.41 | | | | | 0.16 | (d) | | | | 1.54 | | | | | 1.70 | | | | | – | | | | | (0.37 | ) | | | | (0.37 | ) | | | | 8.74 | | | | | 24.09 | | | | | 6,550 | | | | | 2.08 | | | | | 2.64 | | | | | 2.06 | (d) | | | | 45 | |
Year ended 10/31/18 | | | | 9.04 | | | | | (0.00 | ) | | | | (1.63 | ) | | | | (1.63 | ) | | | | – | | | | | – | | | | | – | | | | | 7.41 | | | | | (18.03 | ) | | | | 7,296 | | | | | 2.08 | | | | | 2.78 | | | | | (0.02 | ) | | | | 104 | |
Class R | | | | | | | | | | | | | | | | | | | | | | | | | | | | | | | | | | | | | | | | | | | | | | | | | | | | | | | | | | | | | | | | | | | | | | |
Year ended 10/31/22 | | | | 9.55 | | | | | 0.05 | | | | | (3.68 | ) | | | | (3.63 | ) | | | | (0.05 | ) | | | | (0.26 | ) | | | | (0.31 | ) | | | | 5.61 | | | | | (39.15 | ) | | | | 2,794 | | | | | 1.58 | | | | | 2.08 | | | | | 0.68 | | | | | 70 | |
Year ended 10/31/21 | | | | 10.46 | | | | | 0.07 | | | | | (0.93 | ) | | | | (0.86 | ) | | | | (0.05 | ) | | | | – | | | | | (0.05 | ) | | | | 9.55 | | | | | (8.30 | ) | | | | 4,292 | | | | | 1.58 | | | | | 1.92 | | | | | 0.59 | | | | | 47 | |
Year ended 10/31/20 | | | | 8.99 | | | | | 0.02 | | | | | 1.65 | | | | | 1.67 | | | | | (0.20 | ) | | | | – | | | | | (0.20 | ) | | | | 10.46 | | | | | 18.90 | | | | | 3,514 | | | | | 1.58 | | | | | 1.97 | | | | | 0.20 | | | | | 42 | |
Year ended 10/31/19 | | | | 7.59 | | | | | 0.21 | (d) | | | | 1.57 | | | | | 1.78 | | | | | (0.01 | ) | | | | (0.37 | ) | | | | (0.38 | ) | | | | 8.99 | | | | | 24.62 | | | | | 2,795 | | | | | 1.58 | | | | | 2.14 | | | | | 2.56 | (d) | | | | 45 | |
Year ended 10/31/18 | | | | 9.21 | | | | | 0.05 | | | | | (1.67 | ) | | | | (1.62 | ) | | | | – | | | | | – | | | | | – | | | | | 7.59 | | | | | (17.59 | ) | | | | 2,077 | | | | | 1.58 | | | | | 2.28 | | | | | 0.48 | | | | | 104 | |
Class Y | | | | | | | | | | | | | | | | | | | | | | | | | | | | | | | | | | | | | | | | | | | | | | | | | | | | | | | | | | | | | | | | | | | | | | |
Year ended 10/31/22 | | | | 9.73 | | | | | 0.09 | | | | | (3.75 | ) | | | | (3.66 | ) | | | | (0.09 | ) | | | | (0.26 | ) | | | | (0.35 | ) | | | | 5.72 | | | | | (38.83 | ) | | | | 10,951 | | | | | 1.08 | | | | | 1.58 | | | | | 1.18 | | | | | 70 | |
Year ended 10/31/21 | | | | 10.62 | | | | | 0.13 | | | | | (0.96 | ) | | | | (0.83 | ) | | | | (0.06 | ) | | | | – | | | | | (0.06 | ) | | | | 9.73 | | | | | (7.91 | ) | | | | 30,487 | | | | | 1.08 | | | | | 1.42 | | | | | 1.09 | | | | | 47 | |
Year ended 10/31/20 | | | | 9.13 | | | | | 0.07 | | | | | 1.67 | | | | | 1.74 | | | | | (0.25 | ) | | | | – | | | | | (0.25 | ) | | | | 10.62 | | | | | 19.48 | | | | | 34,678 | | | | | 1.08 | | | | | 1.47 | | | | | 0.70 | | | | | 42 | |
Year ended 10/31/19 | | | | 7.71 | | | | | 0.26 | (d) | | | | 1.59 | | | | | 1.85 | | | | | (0.06 | ) | | | | (0.37 | ) | | | | (0.43 | ) | | | | 9.13 | | | | | 25.27 | | | | | 23,550 | | | | | 1.08 | | | | | 1.64 | | | | | 3.06 | (d) | | | | 45 | |
Year ended 10/31/18 | | | | 9.33 | | | | | 0.09 | | | | | (1.69 | ) | | | | (1.60 | ) | | | | (0.02 | ) | | | | – | | | | | (0.02 | ) | | | | 7.71 | | | | | (17.17 | ) | | | | 16,697 | | | | | 1.08 | | | | | 1.78 | | | | | 0.98 | | | | | 104 | |
Class R5 | | | | | | | | | | | | | | | | | | | | | | | | | | | | | | | | | | | | | | | | | | | | | | | | | | | | | | | | | | | | | | | | | | | | | | |
Year ended 10/31/22 | | | | 9.73 | | | | | 0.09 | | | | | (3.75 | ) | | | | (3.66 | ) | | | | (0.09 | ) | | | | (0.26 | ) | | | | (0.35 | ) | | | | 5.72 | | | | | (38.83 | ) | | | | 1,359 | | | | | 1.08 | | | | | 1.37 | | | | | 1.18 | | | | | 70 | |
Year ended 10/31/21 | | | | 10.62 | | | | | 0.13 | | | | | (0.96 | ) | | | | (0.83 | ) | | | | (0.06 | ) | | | | – | | | | | (0.06 | ) | | | | 9.73 | | | | | (7.91 | ) | | | | 2,224 | | | | | 1.08 | | | | | 1.25 | | | | | 1.09 | | | | | 47 | |
Year ended 10/31/20 | | | | 9.13 | | | | | 0.07 | | | | | 1.67 | | | | | 1.74 | | | | | (0.25 | ) | | | | – | | | | | (0.25 | ) | | | | 10.62 | | | | | 19.48 | | | | | 2,428 | | | | | 1.08 | | | | | 1.26 | | | | | 0.70 | | | | | 42 | |
Year ended 10/31/19 | | | | 7.71 | | | | | 0.26 | (d) | | | | 1.59 | | | | | 1.85 | | | | | (0.06 | ) | | | | (0.37 | ) | | | | (0.43 | ) | | | | 9.13 | | | | | 25.27 | | | | | 2,033 | | | | | 1.08 | | | | | 1.39 | | | | | 3.06 | (d) | | | | 45 | |
Year ended 10/31/18 | | | | 9.33 | | | | | 0.09 | | | | | (1.69 | ) | | | | (1.60 | ) | | | | (0.02 | ) | | | | – | | | | | (0.02 | ) | | | | 7.71 | | | | | (17.16 | ) | | | | 1,623 | | | | | 1.08 | | | | | 1.55 | | | | | 0.98 | | | | | 104 | |
Class R6 | | | | | | | | | | | | | | | | | | | | | | | | | | | | | | | | | | | | | | | | | | | | | | | | | | | | | | | | | | | | | | | | | | | | | | |
Year ended 10/31/22 | | | | 9.73 | | | | | 0.09 | | | | | (3.76 | ) | | | | (3.67 | ) | | | | (0.09 | ) | | | | (0.26 | ) | | | | (0.35 | ) | | | | 5.71 | | | | | (38.93 | ) | | | | 732 | | | | | 1.08 | | | | | 1.37 | | | | | 1.18 | | | | | 70 | |
Year ended 10/31/21 | | | | 10.61 | | | | | 0.13 | | | | | (0.95 | ) | | | | (0.82 | ) | | | | (0.06 | ) | | | | – | | | | | (0.06 | ) | | | | 9.73 | | | | | (7.82 | ) | | | | 1,505 | | | | | 1.08 | | | | | 1.25 | | | | | 1.09 | | | | | 47 | |
Year ended 10/31/20 | | | | 9.12 | | | | | 0.07 | | | | | 1.67 | | | | | 1.74 | | | | | (0.25 | ) | | | | – | | | | | (0.25 | ) | | | | 10.61 | | | | | 19.50 | | | | | 1,161 | | | | | 1.08 | | | | | 1.26 | | | | | 0.70 | | | | | 42 | |
Year ended 10/31/19 | | | | 7.70 | | | | | 0.26 | (d) | | | | 1.59 | | | | | 1.85 | | | | | (0.06 | ) | | | | (0.37 | ) | | | | (0.43 | ) | | | | 9.12 | | | | | 25.31 | | | | | 629 | | | | | 1.08 | | | | | 1.39 | | | | | 3.06 | (d) | | | | 45 | |
Year ended 10/31/18 | | | | 9.32 | | | | | 0.09 | | | | | (1.69 | ) | | | | (1.60 | ) | | | | (0.02 | ) | | | | – | | | | | (0.02 | ) | | | | 7.70 | | | | | (17.18 | ) | | | | 227 | | | | | 1.08 | | | | | 1.55 | | | | | 0.98 | | | | | 104 | |
| (a) | Calculated using average shares outstanding. |
| (b) | Includes adjustments in accordance with accounting principles generally accepted in the United States of America and as such, the net asset value for financial reporting purposes and the returns based upon those net asset values may differ from the net asset value and returns for shareholder transactions. Does not include sales charges and is not annualized for periods less than one year, if applicable. |
| (c) | Portfolio turnover is calculated at the fund level and is not annualized for periods less than one year, if applicable. |
| (d) | Net investment income (loss) per share and the ratio of net investment income (loss) to average net assets includes significant dividends received during the year ended October 31, 2019. Net investment income (loss) per share and the ratio of net investment income (loss) to average net assets excluding the significant dividends are $0.07 and 0.95%, $0.00 and 0.20%, $0.05 and 0.70%, $0.10 and 1.20%, $0.10 and 1.20% and $0.10 and 1.20% for Class A, Class C, Class R, Class Y, Class R5 and Class R6 shares, respectively. |
See accompanying Notes to Financial Statements which are an integral part of the financial statements.
| | |
| 12 | | Invesco Emerging Markets Select Equity Fund |
Notes to Financial Statements
October 31, 2022
NOTE 1–Significant Accounting Policies
Invesco Emerging Markets Select Equity Fund (the “Fund”) is a series portfolio of AIM Investment Funds (Invesco Investment Funds) (the “Trust”). The Trust is organized as a Delaware statutory trust and is registered under the Investment Company Act of 1940, as amended (the “1940 Act”), as an open-end series management investment company authorized to issue an unlimited number of shares of beneficial interest. The Fund is classified as non-diversified. Information presented in these financial statements pertains only to the Fund. Matters affecting the Fund or each class will be voted on exclusively by the shareholders of the Fund or each class.
The Fund’s investment objective is long-term growth of capital.
The Fund currently consists of six different classes of shares: Class A, Class C, Class R, Class Y, Class R5 and Class R6. Class Y shares are available only to certain investors. Class A shares are sold with a front-end sales charge unless certain waiver criteria are met. Under certain circumstances, load waived shares may be subject to contingent deferred sales charges (“CDSC”). Class C shares are sold with a CDSC. Class R, Class Y, Class R5 and Class R6 shares are sold at net asset value. Class C shares held for eight years after purchase are eligible for automatic conversion into Class A shares of the same Fund (the “Conversion Feature”). The automatic conversion pursuant to the Conversion Feature will generally occur at the end of the month following the eighth anniversary after a purchase of Class C shares.
The Fund is an investment company and accordingly follows the investment company accounting and reporting guidance in accordance with Financial Accounting Standards Board Accounting Standards Codification Topic 946, Financial Services – Investment Companies.
The following is a summary of the significant accounting policies followed by the Fund in the preparation of its financial statements.
| A. | Security Valuations – Securities, including restricted securities, are valued according to the following policy. |
A security listed or traded on an exchange is generally valued at its trade price or official closing price that day as of the close of the exchange where the security is principally traded, or lacking any trades or official closing price on a particular day, the security may be valued at the closing bid price on that day. Securities traded in the over-the-counter market are valued based on prices furnished by independent pricing services or market makers. When such securities are valued using prices provided by an independent pricing service they may be considered fair valued. Futures contracts are valued at the daily settlement price set by an exchange on which they are principally traded. U.S. exchange-traded options are valued at the mean between the last bid and asked prices from the exchange on which they are principally traded. Non-U.S. exchange-traded options are valued at the final settlement price set by the exchange on which they trade. Options not listed on an exchange and swaps generally are valued using pricing provided from independent pricing services.
Securities of investment companies that are not exchange-traded (e.g., open-end mutual funds) are valued using such company’s end-of-business-day net asset value per share.
Deposits, other obligations of U.S. and non-U.S. banks and financial institutions are valued at their daily account value.
Fixed income securities (including convertible debt securities) generally are valued on the basis of prices provided by independent pricing services. Prices provided by the pricing service may be determined without exclusive reliance on quoted prices, and may reflect appropriate factors such as institution-size trading in similar groups of securities, developments related to specific securities, dividend rate (for unlisted equities), yield (for debt obligations), quality, type of issue, coupon rate (for debt obligations), maturity (for debt obligations), individual trading characteristics and other market data. Pricing services generally value debt obligations assuming orderly transactions of institutional round lot size, but a fund may hold or transact in the same securities in smaller, odd lot sizes. Odd lots often trade at lower prices than institutional round lots, and their value may be adjusted accordingly. Debt obligations are subject to interest rate and credit risks. In addition, all debt obligations involve some risk of default with respect to interest and/or principal payments.
Foreign securities’ (including foreign exchange contracts) prices are converted into U.S. dollar amounts using the applicable exchange rates as of the close of the New York Stock Exchange (“NYSE”). If market quotations are available and reliable for foreign exchange-traded equity securities, the securities will be valued at the market quotations. Invesco Advisers, Inc. (the “Adviser” or “Invesco”) may use various pricing services to obtain market quotations as well as fair value prices. Because trading hours for certain foreign securities end before the close of the NYSE, closing market quotations may become not representative of market value in the Adviser’s judgment (“unreliable”). If, between the time trading ends on a particular security and the close of the customary trading session on the NYSE, a significant event occurs that makes the closing price of the security unreliable, the Adviser may fair value the security. If the event is likely to have affected the closing price of the security, the security will be valued at fair value in good faith in accordance with Board-approved policies and related Adviser procedures (“Valuation Procedures”). Adjustments to closing prices to reflect fair value may also be based on a screening process of an independent pricing service to indicate the degree of certainty, based on historical data, that the closing price in the principal market where a foreign security trades is not the current value as of the close of the NYSE. Foreign securities’ prices meeting the degree of certainty that the price is not reflective of current value will be priced at the indication of fair value from the independent pricing service. Multiple factors may be considered by the independent pricing service in determining adjustments to reflect fair value and may include information relating to sector indices, American Depositary Receipts and domestic and foreign index futures. Foreign securities may have additional risks including exchange rate changes, potential for sharply devalued currencies and high inflation, political and economic upheaval, the relative lack of issuer information, relatively low market liquidity and the potential lack of strict financial and accounting controls and standards.
Unlisted securities will be valued using prices provided by independent pricing services or by another method that the Adviser, in its judgment, believes better reflects the security’s fair value in accordance with the Valuation Procedures.
Securities for which market prices are not provided by any of the above methods may be valued based upon quotes furnished by independent sources. The last bid price may be used to value equity securities. The mean between the last bid and asked prices may be used to value debt obligations, including corporate loans.
Securities for which market quotations are not readily available are fair valued by the Adviser in accordance with the Valuation Procedures. If a fair value price provided by a pricing service is unreliable, the Adviser will fair value the security using the Valuation Procedures. Issuer specific events, market trends, bid/asked quotes of brokers and information providers and other market data may be reviewed in the course of making a good faith determination of a security’s fair value.
The Fund may invest in securities that are subject to interest rate risk, meaning the risk that the prices will generally fall as interest rates rise and, conversely, the prices will generally rise as interest rates fall. Specific securities differ in their sensitivity to changes in interest rates depending on their individual characteristics. Changes in interest rates may result in increased market volatility, which may affect the value and/or liquidity of certain Fund investments.
Valuations change in response to many factors including the historical and prospective earnings of the issuer, the value of the issuer’s assets, general market conditions which are not specifically related to the particular issuer, such as real or perceived adverse economic conditions, changes in the general outlook for revenues or corporate earnings, changes in interest or currency rates, regional or global instability, natural or environmental disasters, widespread disease or other public health issues, war, acts of terrorism, significant governmental actions or adverse investor sentiment generally and market liquidity. Because of the inherent uncertainties of valuation, the values reflected in the financial statements may materially differ from the value received upon actual sale of those investments.
The price the Fund could receive upon the sale of any investment may differ from the Adviser’s valuation of the investment, particularly for securities that are valued using a fair valuation technique. When fair valuation techniques are applied, the Adviser uses available information, including both observable and unobservable inputs and assumptions, to determine a methodology that will result in a valuation that the Adviser believes approximates market value. Fund securities that are fair valued may be subject to greater fluctuation in their value from one day to the next than would be the case if market quotations were used. Because of the inherent uncertainties of valuation, and the degree of subjectivity in such decisions, the Fund could realize a greater or lesser than expected gain or loss upon the sale of the investment.
| | |
| 13 | | Invesco Emerging Markets Select Equity Fund |
| B. | Securities Transactions and Investment Income – Securities transactions are accounted for on a trade date basis. Realized gains or losses on sales are computed on the basis of specific identification of the securities sold. Interest income (net of withholding tax, if any) is recorded on an accrual basis from settlement date and includes coupon interest and amortization of premium and accretion of discount on debt securities as applicable. Dividend income (net of withholding tax, if any) is recorded on the ex-dividend date. |
The Fund may periodically participate in litigation related to Fund investments. As such, the Fund may receive proceeds from litigation settlements. Any proceeds received are included in the Statement of Operations as realized gain (loss) for investments no longer held and as unrealized gain (loss) for investments still held.
Brokerage commissions and mark ups are considered transaction costs and are recorded as an increase to the cost basis of securities purchased and/or a reduction of proceeds on a sale of securities. Such transaction costs are included in the determination of net realized and unrealized gain (loss) from investment securities reported in the Statement of Operations and the Statement of Changes in Net Assets and the net realized and unrealized gains (losses) on securities per share in the Financial Highlights. Transaction costs are included in the calculation of the Fund’s net asset value and, accordingly, they reduce the Fund’s total returns. These transaction costs are not considered operating expenses and are not reflected in net investment income reported in the Statement of Operations and the Statement of Changes in Net Assets, or the net investment income per share and the ratios of expenses and net investment income reported in the Financial Highlights, nor are they limited by any expense limitation arrangements between the Fund and the investment adviser.
The Fund allocates income and realized and unrealized capital gains and losses to a class based on the relative net assets of each class.
| C. | Country Determination – For the purposes of making investment selection decisions and presentation in the Schedule of Investments, the investment adviser may determine the country in which an issuer is located and/or credit risk exposure based on various factors. These factors include the laws of the country under which the issuer is organized, where the issuer maintains a principal office, the country in which the issuer derives 50% or more of its total revenues, the country that has the primary market for the issuer’s securities and its “country of risk” as determined by a third party service provider, as well as other criteria. Among the other criteria that may be evaluated for making this determination are the country in which the issuer maintains 50% or more of its assets, the type of security, financial guarantees and enhancements, the nature of the collateral and the sponsor organization. Country of issuer and/or credit risk exposure has been determined to be the United States of America, unless otherwise noted. |
| D. | Distributions – Distributions from net investment income and net realized capital gain, if any, are generally declared and paid annually and recorded on the ex-dividend date. The Fund may elect to treat a portion of the proceeds from redemptions as distributions for federal income tax purposes. |
| E. | Federal Income Taxes – The Fund intends to comply with the requirements of Subchapter M of the Internal Revenue Code of 1986, as amended (the “Internal Revenue Code”), necessary to qualify as a regulated investment company and to distribute substantially all of the Fund’s taxable earnings to shareholders. As such, the Fund will not be subject to federal income taxes on otherwise taxable income (including net realized capital gain) that is distributed to shareholders. Therefore, no provision for federal income taxes is recorded in the financial statements. |
The Fund recognizes the tax benefits of uncertain tax positions only when the position is more likely than not to be sustained. Management has analyzed the Fund’s uncertain tax positions and concluded that no liability for unrecognized tax benefits should be recorded related to uncertain tax positions. Management is not aware of any tax positions for which it is reasonably possible that the total amounts of unrecognized tax benefits will change materially in the next 12 months.
The Fund files tax returns in the U.S. Federal jurisdiction and certain other jurisdictions. Generally, the Fund is subject to examinations by such taxing authorities for up to three years after the filing of the return for the tax period.
| F. | Expenses – Fees provided for under the Rule 12b-1 plan of a particular class of the Fund are charged to the operations of such class. Transfer agency fees and expenses and other shareholder recordkeeping fees and expenses attributable to Class R5 and Class R6 are allocated based on relative net assets of Class R5 and Class R6. Sub-accounting fees attributable to Class R5 are charged to the operations of the class. Transfer agency fees and expenses and other shareholder recordkeeping fees and expenses relating to all other classes are allocated among those classes based on relative net assets. All other expenses are allocated among the classes based on relative net assets. |
| G. | Accounting Estimates – The preparation of financial statements in conformity with accounting principles generally accepted in the United States of America (“GAAP”) requires management to make estimates and assumptions that affect the reported amounts of assets and liabilities at the date of the financial statements and the reported amounts of revenues and expenses during the reporting period including estimates and assumptions related to taxation. Actual results could differ from those estimates by a significant amount. In addition, the Fund monitors for material events or transactions that may occur or become known after the period-end date and before the date the financial statements are released to print. |
| H. | Indemnifications – Under the Trust’s organizational documents, each Trustee, officer, employee or other agent of the Trust is indemnified against certain liabilities that may arise out of the performance of their duties to the Fund. Additionally, in the normal course of business, the Fund enters into contracts, including the Fund’s servicing agreements, that contain a variety of indemnification clauses. The Fund’s maximum exposure under these arrangements is unknown as this would involve future claims that may be made against the Fund that have not yet occurred. The risk of material loss as a result of such indemnification claims is considered remote. |
| I. | Securities Lending – The Fund may lend portfolio securities having a market value up to one-third of the Fund’s total assets. Such loans are secured by collateral equal to no less than the market value of the loaned securities determined daily by the securities lending provider. Such collateral will be cash or debt securities issued or guaranteed by the U.S. Government or any of its sponsored agencies. Cash collateral received in connection with these loans is invested in short-term money market instruments or affiliated, unregistered investment companies that comply with Rule 2a-7 under the 1940 Act and money market funds (collectively, “affiliated money market funds”) and is shown as such on the Schedule of Investments. The Fund bears the risk of loss with respect to the investment of collateral. It is the Fund’s policy to obtain additional collateral from or return excess collateral to the borrower by the end of the next business day, following the valuation date of the securities loaned. Therefore, the value of the collateral held may be temporarily less than the value of the securities on loan. When loaning securities, the Fund retains certain benefits of owning the securities, including the economic equivalent of dividends or interest generated by the security. Lending securities entails a risk of loss to the Fund if, and to the extent that, the market value of the securities loaned were to increase and the borrower did not increase the collateral accordingly, and the borrower failed to return the securities. The securities loaned are subject to termination at the option of the borrower or the Fund. Upon termination, the borrower will return to the Fund the securities loaned and the Fund will return the collateral. Upon the failure of the borrower to return the securities, collateral may be liquidated and the securities may be purchased on the open market to replace the loaned securities. The Fund could experience delays and costs in gaining access to the collateral and the securities may lose value during the delay which could result in potential losses to the Fund. Some of these losses may be indemnified by the lending agent. The Fund bears the risk of any deficiency in the amount of the collateral available for return to the borrower due to any loss on the collateral invested. Dividends received on cash collateral investments for securities lending transactions, which are net of compensation to counterparties, are included in Dividends from affiliated money market funds on the Statement of Operations. The aggregate value of securities out on loan, if any, is shown as a footnote on the Statement of Assets and Liabilities. |
The Adviser serves as an affiliated securities lending agent for the Fund. The Bank of New York Mellon also serves as a lending agent. To the extent the Fund utilizes the Adviser as an affiliated securities lending agent, the Fund conducts its securities lending in accordance with, and in reliance upon, no-action letters issued by the SEC staff that provide guidance on how an affiliate may act as a direct agent lender and receive compensation for those services in a manner consistent with the federal securities laws. For the year ended October 31, 2022, fees paid to the Adviser were less than $500. Fees paid to the Adviser for securities lending agent services are included in Dividends from affiliated money market funds on the Statement of Operations.
| J. | Foreign Currency Translations – Foreign currency is valued at the close of the NYSE based on quotations posted by banks and major currency dealers. Portfolio securities and other assets and liabilities denominated in foreign currencies are translated into U.S. dollar amounts at the date of valuation. Purchases |
| | |
| 14 | | Invesco Emerging Markets Select Equity Fund |
| | and sales of portfolio securities (net of foreign taxes withheld on disposition) and income items denominated in foreign currencies are translated into U.S. dollar amounts on the respective dates of such transactions. The Fund does not separately account for the portion of the results of operations resulting from changes in foreign exchange rates on investments and the fluctuations arising from changes in market prices of securities held. The combined results of changes in foreign exchange rates and the fluctuation of market prices on investments (net of estimated foreign tax withholding) are included with the net realized and unrealized gain or loss from investments in the Statement of Operations. Reported net realized foreign currency gains or losses arise from (1) sales of foreign currencies, (2) currency gains or losses realized between the trade and settlement dates on securities transactions, and (3) the difference between the amounts of dividends, interest, and foreign withholding taxes recorded on the Fund’s books and the U.S. dollar equivalent of the amounts actually received or paid. Net unrealized foreign currency gains and losses arise from changes in the fair values of assets and liabilities, other than investments in securities at fiscal period end, resulting from changes in exchange rates. |
The Fund may invest in foreign securities, which may be subject to foreign taxes on income, gains on investments or currency repatriation, a portion of which may be recoverable. Foreign taxes, if any, are recorded based on the tax regulations and rates that exist in the foreign markets in which the Fund invests and are shown in the Statement of Operations.
| K. | Forward Foreign Currency Contracts – The Fund may engage in foreign currency transactions either on a spot (i.e. for prompt delivery and settlement) basis, or through forward foreign currency contracts, to manage or minimize currency or exchange rate risk. |
The Fund may also enter into forward foreign currency contracts for the purchase or sale of a security denominated in a foreign currency in order to “lock in” the U.S. dollar price of that security, or the Fund may also enter into forward foreign currency contracts that do not provide for physical exchange of the two currencies on the settlement date, but instead are settled by a single cash payment calculated as the difference between the agreed upon exchange rate and the spot rate at settlement based upon an agreed upon notional amount (non-deliverable forwards).
A forward foreign currency contract is an obligation between two parties (“Counterparties”) to purchase or sell a specific currency for an agreed-upon price at a future date. The use of forward foreign currency contracts for hedging does not eliminate fluctuations in the price of the underlying securities the Fund owns or intends to acquire but establishes a rate of exchange in advance. Fluctuations in the value of these contracts are measured by the difference in the contract date and reporting date exchange rates and are recorded as unrealized appreciation (depreciation) until the contracts are closed. When the contracts are closed, realized gains (losses) are recorded. Realized and unrealized gains (losses) on the contracts are included in the Statement of Operations. The primary risks associated with forward foreign currency contracts include failure of the Counterparty to meet the terms of the contract and the value of the foreign currency changing unfavorably. These risks may be in excess of the amounts reflected in the Statement of Assets and Liabilities.
| L. | Other Risks – The Fund is non-diversified and may invest in securities of fewer issuers than if it were diversified. Thus, the value of the Fund’s shares may vary more widely and the Fund may be subject to greater market and credit risk than if the Fund invested more broadly. |
Emerging markets (also referred to as developing markets) are generally subject to greater market volatility, political, social and economic instability, uncertainty regarding the existence of trading markets and more governmental limitations on foreign investment than more developed markets. In addition, companies operating in emerging markets may be subject to lower trading volume and greater price fluctuations than companies in more developed markets. Securities law in many emerging market countries is relatively new and unsettled. Therefore, laws regarding foreign investment in emerging market securities, securities regulation, title to securities, and shareholder rights may change quickly and unpredictably. In addition, the enforcement of systems of taxation at federal, regional and local levels in emerging market countries may be inconsistent, and subject to sudden change. Other risks of investing in emerging markets securities may include additional transaction costs, delays in settlement procedures, and lack of timely information.
| M. | COVID-19 Risk – The COVID-19 strain of coronavirus has resulted in instances of market closures and dislocations, extreme volatility, liquidity constraints and increased trading costs. Efforts to contain its spread have resulted in travel restrictions, disruptions of healthcare systems, business operations (including business closures) and supply chains, layoffs, lower consumer demand and employee availability, and defaults and credit downgrades, among other significant economic impacts that have disrupted global economic activity across many industries. Such economic impacts may exacerbate other pre-existing political, social and economic risks locally or globally and cause general concern and uncertainty. The full economic impact and ongoing effects of COVID-19 (or other future epidemics or pandemics) at the macro-level and on individual businesses are unpredictable and may result in significant and prolonged effects on the Fund’s performance. |
NOTE 2–Advisory Fees and Other Fees Paid to Affiliates
The Trust has entered into a master investment advisory agreement with the Adviser. Under the terms of the investment advisory agreement, the Fund accrues daily and pays monthly an advisory fee to the Adviser based on the annual rate of the Fund’s average daily net assets as follows:
| | | | |
| Average Daily Net Assets | | Rate | |
|
| |
First $250 million | | | 0.935% | |
|
| |
Next $250 million | | | 0.910% | |
|
| |
Next $500 million | | | 0.885% | |
|
| |
Next $1.5 billion | | | 0.860% | |
|
| |
Next $2.5 billion | | | 0.835% | |
|
| |
Next $2.5 billion | | | 0.810% | |
|
| |
Next $2.5 billion | | | 0.785% | |
|
| |
Over $10 billion | | | 0.760% | |
|
| |
For the year ended October 31, 2022, the effective advisory fee rate incurred by the Fund was 0.93%.
Under the terms of a master sub-advisory agreement between the Adviser and each of Invesco Asset Management Deutschland GmbH, Invesco Asset Management Limited, Invesco Asset Management (Japan) Limited, Invesco Hong Kong Limited, Invesco Senior Secured Management, Inc. and Invesco Canada Ltd. and separate sub-advisory agreements with Invesco Capital Management LLC and Invesco Asset Management (India) Private Limited (collectively, the “Affiliated Sub-Advisers”) the Adviser, not the Fund, will pay 40% of the fees paid to the Adviser to any such Affiliated Sub-Adviser(s) that provide(s) discretionary investment management services to the Fund based on the percentage of assets allocated to such Affiliated Sub-Adviser(s).
The Adviser has contractually agreed, through at least February 29, 2024, to waive advisory fees and/or reimburse expenses to the extent necessary to limit total annual fund operating expenses after fee waiver and/or expense reimbursement (excluding certain items discussed below) of Class A, Class C, Class R, Class Y, Class R5 and Class R6 shares to 1.33%, 2.08%, 1.58%, 1.08%, 1.08% and 1.08%, respectively, of the Fund’s average daily net assets (the “expense limits”). In determining the Adviser’s obligation to waive advisory fees and/or reimburse expenses, the following expenses are not taken into account, and could cause the total annual fund operating expenses after fee waiver and/or expense reimbursement to exceed the numbers reflected above: (1) interest; (2) taxes; (3) dividend expense on short sales; (4) extraordinary or non-routine items, including litigation expenses; and (5) expenses that the Fund has incurred but did not actually pay because of an expense offset arrangement. Unless Invesco continues the fee waiver agreement, it will terminate on February 29, 2024. During its term, the fee waiver agreement cannot be terminated or amended to increase the expense limits or reduce the advisory fee waiver without approval of the Board of Trustees.
| | |
| 15 | | Invesco Emerging Markets Select Equity Fund |
Further, the Adviser has contractually agreed, through at least June 30, 2024, to waive the advisory fee payable by the Fund in an amount equal to 100% of the net advisory fees the Adviser receives from the affiliated money market funds on investments by the Fund of uninvested cash in such affiliated money market funds.
For the year ended October 31, 2022, the Adviser waived advisory fees of $675 and reimbursed class level expenses of $145,252, $19,594, $17,538, $83,327, $5,109 and $3,223 of Class A, Class C, Class R, Class Y, Class R5 and Class R6 shares, respectively.
The Trust has entered into a master administrative services agreement with Invesco pursuant to which the Fund has agreed to pay Invesco for certain administrative costs incurred in providing accounting services to the Fund. For the year ended October 31, 2022, expenses incurred under the agreement are shown in the Statement of Operations as Administrative services fees. Invesco has entered into a sub-administration agreement whereby State Street Bank and Trust Company (“SSB”) serves as fund accountant and provides certain administrative services to the Fund. Pursuant to a custody agreement with the Trust on behalf of the Fund, SSB also serves as the Fund’s custodian.
The Trust has entered into a transfer agency and service agreement with Invesco Investment Services, Inc. (“IIS”) pursuant to which the Fund has agreed to pay IIS a fee for providing transfer agency and shareholder services to the Fund and reimburse IIS for certain expenses incurred by IIS in the course of providing such services. IIS may make payments to intermediaries that provide omnibus account services, sub-accounting services and/or networking services. All fees payable by IIS to intermediaries that provide omnibus account services or sub-accounting services are charged back to the Fund, subject to certain limitations approved by the Trust’s Board of Trustees. For the year ended October 31, 2022, expenses incurred under the agreement are shown in the Statement of Operations as Transfer agent fees.
The Trust has entered into master distribution agreements with Invesco Distributors, Inc. (“IDI”) to serve as the distributor for the Class A, Class C, Class R, Class Y, Class R5 and Class R6 shares of the Fund. The Trust has adopted plans pursuant to Rule 12b-1 under the 1940 Act with respect to the Fund’s Class A, Class C and Class R shares (collectively, the “Plans”). The Fund, pursuant to the Plans, pays IDI compensation at the annual rate of 0.25% of the Fund’s average daily net assets of Class A shares, 1.00% of the average daily net assets of Class C shares and 0.50% of the average daily net assets of Class R shares. The fees are accrued daily and paid monthly. Of the Plan payments, up to 0.25% of the average daily net assets of each class of shares may be paid to furnish continuing personal shareholder services to customers who purchase and own shares of such classes. Any amounts not paid as a service fee under the Plans would constitute an asset-based sales charge. Rules of the Financial Industry Regulatory Authority (“FINRA”) impose a cap on the total sales charges, including asset-based sales charges, that may be paid by any class of shares of the Fund. For the year ended October 31, 2022, expenses incurred under the Plans are shown in the Statement of Operations as Distribution fees.
Front-end sales commissions and CDSC (collectively, the “sales charges”) are not recorded as expenses of the Fund. Front-end sales commissions are deducted from proceeds from the sales of Fund shares prior to investment in Class A shares of the Fund. CDSC are deducted from redemption proceeds prior to remittance to the shareholder. During the year ended October 31, 2022, IDI advised the Fund that IDI retained $6,927 in front-end sales commissions from the sale of Class A shares and $1,170 and $352 from Class A and Class C shares, respectively, for CDSC imposed upon redemptions by shareholders.
For the year ended October 31, 2022, the Fund incurred $174 in brokerage commissions with Invesco Capital Markets, Inc., an affiliate of the Adviser and IDI, for portfolio transactions executed on behalf of the Fund.
Certain officers and trustees of the Trust are officers and directors of the Adviser, IIS and/or IDI.
NOTE 3–Additional Valuation Information
GAAP defines fair value as the price that would be received to sell an asset or paid to transfer a liability in an orderly transaction between market participants at the measurement date, under current market conditions. GAAP establishes a hierarchy that prioritizes the inputs to valuation methods, giving the highest priority to readily available unadjusted quoted prices in an active market for identical assets (Level 1) and the lowest priority to significant unobservable inputs (Level 3), generally when market prices are not readily available. Based on the valuation inputs, the securities or other investments are tiered into one of three levels. Changes in valuation methods may result in transfers in or out of an investment’s assigned level:
| | |
| Level 1 - | | Prices are determined using quoted prices in an active market for identical assets. |
| Level 2 - | | Prices are determined using other significant observable inputs. Observable inputs are inputs that other market participants may use in pricing a security. These may include quoted prices for similar securities, interest rates, prepayment speeds, credit risk, yield curves, loss severities, default rates, discount rates, volatilities and others. |
| Level 3 - | | Prices are determined using significant unobservable inputs. In situations where quoted prices or observable inputs are unavailable (for example, when there is little or no market activity for an investment at the end of the period), unobservable inputs may be used. Unobservable inputs reflect the Adviser’s assumptions about the factors market participants would use in determining fair value of the securities or instruments and would be based on the best available information. |
The following is a summary of the tiered valuation input levels, as of October 31, 2022. The level assigned to the securities valuations may not be an indication of the risk or liquidity associated with investing in those securities. Because of the inherent uncertainties of valuation, the values reflected in the financial statements may materially differ from the value received upon actual sale of those investments.
| | | | | | | | | | | | | | | | |
| | | Level 1 | | | Level 2 | | | Level 3 | | | Total | |
|
| |
Investments in Securities | | | | | | | | | | | | | | | | |
|
| |
Brazil | | $ | 6,991,383 | | | $ | – | | | | $– | | | $ | 6,991,383 | |
|
| |
Chile | | | – | | | | 271,053 | | | | – | | | | 271,053 | |
|
| |
China | | | 4,264,175 | | | | 10,886,911 | | | | – | | | | 15,151,086 | |
|
| |
India | | | – | | | | 4,946,760 | | | | – | | | | 4,946,760 | |
|
| |
Indonesia | | | – | | | | 2,252,231 | | | | – | | | | 2,252,231 | |
|
| |
Malaysia | | | – | | | | 655,736 | | | | – | | | | 655,736 | |
|
| |
Mexico | | | 1,288,821 | | | | – | | | | – | | | | 1,288,821 | |
|
| |
Poland | | | – | | | | 1,435,395 | | | | – | | | | 1,435,395 | |
|
| |
Russia | | | – | | | | – | | | | 0 | | | | 0 | |
|
| |
South Korea | | | 449,020 | | | | 1,628,144 | | | | – | | | | 2,077,164 | |
|
| |
Taiwan | | | – | | | | 1,091,807 | | | | – | | | | 1,091,807 | |
|
| |
Thailand | | | – | | | | 609,584 | | | | – | | | | 609,584 | |
|
| |
Money Market Funds | | | 1,008,633 | | | | 1,379,507 | | | | – | | | | 2,388,140 | |
|
| |
Total Investments | | $ | 14,002,032 | | | $ | 25,157,128 | | | | $0 | | | $ | 39,159,160 | |
|
| |
NOTE 4–Derivative Investments
The Trust may enter into an International Swaps and Derivatives Association Master Agreement (“ISDA Master Agreement”) under which a trust may trade OTC derivatives. An OTC transaction entered into under an ISDA Master Agreement typically involves a collateral posting arrangement, payment netting provisions and
| | |
| 16 | | Invesco Emerging Markets Select Equity Fund |
close-out netting provisions. These netting provisions allow for reduction of credit risk through netting of contractual obligations. The enforceability of the netting provisions of the ISDA Master Agreement depends on the governing law of the ISDA Master Agreement, among other factors.
For financial reporting purposes, the Trust does not offset OTC derivative assets or liabilities that are subject to ISDA Master Agreements in the Statement of Assets and Liabilities.
The table below summarizes the gains (losses) on derivative investments, detailed by primary risk exposure, recognized in earnings during the period:
| | | | |
| | | Location of Gain (Loss) on | |
| | | Statement of Operations | |
| | | Currency | |
| | | Risk | |
|
| |
Realized Gain (Loss): | | | | |
Forward foreign currency contracts | | | $(2,773) | |
|
| |
The table below summarizes the average notional value of forward foreign currency contracts held during the period.
| | |
| | | Forward |
| | | Foreign Currency |
| | | Contracts |
|
|
Average notional value | | $451,596 |
|
|
NOTE 5–Expense Offset Arrangement(s)
The expense offset arrangement is comprised of transfer agency credits which result from balances in demand deposit accounts used by the transfer agent for clearing shareholder transactions. For the year ended October 31, 2022, the Fund received credits from this arrangement, which resulted in the reduction of the Fund’s total expenses of $674.
NOTE 6–Trustees’ and Officers’ Fees and Benefits
Trustees’ and Officers’ Fees and Benefits include amounts accrued by the Fund to pay remuneration to certain Trustees and Officers of the Fund. Trustees have the option to defer compensation payable by the Fund, and Trustees’ and Officers’ Fees and Benefits also include amounts accrued by the Fund to fund such deferred compensation amounts. Those Trustees who defer compensation have the option to select various Invesco Funds in which their deferral accounts shall be deemed to be invested. Finally, certain current Trustees were eligible to participate in a retirement plan that provided for benefits to be paid upon retirement to Trustees over a period of time based on the number of years of service. The Fund may have certain former Trustees who also participate in a retirement plan and receive benefits under such plan. Trustees’ and Officers’ Fees and Benefits include amounts accrued by the Fund to fund such retirement benefits. Obligations under the deferred compensation and retirement plans represent unsecured claims against the general assets of the Fund.
NOTE 7–Cash Balances
The Fund is permitted to temporarily carry a negative or overdrawn balance in its account with SSB, the custodian bank. Such balances, if any at period-end, are shown in the Statement of Assets and Liabilities under the payable caption Amount due custodian. To compensate the custodian bank for such overdrafts, the overdrawn Fund may either (1) leave funds as a compensating balance in the account so the custodian bank can be compensated by earning the additional interest; or (2) compensate by paying the custodian bank at a rate agreed upon by the custodian bank and Invesco, not to exceed the contractually agreed upon rate. The Fund may not purchase additional securities when any borrowings from banks or broker-dealers exceed 5% of the Fund’s total assets, or when any borrowings from an Invesco Fund are outstanding.
NOTE 8–Distributions to Shareholders and Tax Components of Net Assets
Tax Character of Distributions to Shareholders Paid During the Fiscal Years Ended October 31, 2022 and 2021:
| | | | | | | | | | | | |
| | | 2022 | | | | | | 2021 | |
|
| |
Ordinary income* | | $ | 558,194 | | | | | | | $ | 499,824 | |
|
| |
Long-term capital gain | | | 2,032,593 | | | | | | | | – | |
|
| |
Total distributions | | $ | 2,590,787 | | | | | | | $ | 499,824 | |
|
| |
| * | Includes short-term capital gain distributions, if any. |
Tax Components of Net Assets at Period-End:
| | | | |
| | | 2022 | |
|
| |
Undistributed ordinary income | | $ | 377,110 | |
|
| |
Net unrealized appreciation (depreciation) – investments | | | (15,374,163 | ) |
|
| |
Net unrealized appreciation (depreciation) – foreign currencies | | | (4,876 | ) |
|
| |
Temporary book/tax differences | | | (16,486 | ) |
|
| |
Capital loss carryforward | | | (11,510,645 | ) |
|
| |
Shares of beneficial interest | | | 64,244,192 | |
|
| |
Total net assets | | $ | 37,715,132 | |
|
| |
The difference between book-basis and tax-basis unrealized appreciation (depreciation) is due to differences in the timing of recognition of gains and losses on investments for tax and book purposes. The Fund’s net unrealized appreciation (depreciation) difference is attributable primarily to wash sales.
The temporary book/tax differences are a result of timing differences between book and tax recognition of income and/or expenses. The Fund’s temporary book/tax differences are the result of the trustee deferral of compensation and retirement plan benefits.
| | |
| 17 | | Invesco Emerging Markets Select Equity Fund |
Capital loss carryforward is calculated and reported as of a specific date. Results of transactions and other activity after that date may affect the amount of capital loss carryforward actually available for the Fund to utilize. The ability to utilize capital loss carryforward in the future may be limited under the Internal Revenue Code and related regulations based on the results of future transactions.
The Fund has a capital loss carryforward as of October 31, 2022, as follows:
| | | | | | | | | | | | |
Capital Loss Carryforward* | |
| Expiration | | Short-Term | | | Long-Term | | | Total | |
|
| |
Not subject to expiration | | | $7,059,795 | | | | $4,450,850 | | | | $11,510,645 | |
|
| |
| * | Capital loss carryforward is reduced for limitations, if any, to the extent required by the Internal Revenue Code and may be further limited depending upon a variety of factors, including the realization of net unrealized gains or losses as of the date of any reorganization. |
NOTE 9–Investment Transactions
The aggregate amount of investment securities (other than short-term securities, U.S. Government obligations and money market funds, if any) purchased and sold by the Fund during the year ended October 31, 2022 was $39,203,025 and $52,459,768, respectively. Cost of investments, including any derivatives, on a tax basis includes the adjustments for financial reporting purposes as of the most recently completed federal income tax reporting period-end.
| | | | |
Unrealized Appreciation (Depreciation) of Investments on a Tax Basis | |
Aggregate unrealized appreciation of investments | | $ | 4,149,684 | |
|
| |
Aggregate unrealized (depreciation) of investments | | | (19,523,847 | ) |
|
| |
Net unrealized appreciation (depreciation) of investments | | $ | (15,374,163 | ) |
|
| |
Cost of investments for tax purposes is $54,533,323.
NOTE 10–Reclassification of Permanent Differences
Primarily as a result of differing book/tax treatment of foreign currency transactions, foreign capital gains taxes and distributions, on October 31, 2022, undistributed net investment income was decreased by $148,609 and undistributed net realized gain (loss) was increased by $148,609. This reclassification had no effect on the net assets or the distributable earnings (loss) of the Fund.
NOTE 11–Share Information
| | | | | | | | | | | | | | | | |
| | | Summary of Share Activity | |
|
| |
| | |
| | | Year ended | | | Year ended | |
| | | October 31, 2022(a) | | | October 31, 2021 | |
| | | Shares | | | Amount | | | Shares | | | Amount | |
|
| |
Sold: | | | | | | | | | | | | | | | | |
Class A | | | 427,982 | | | $ | 3,270,667 | | | | 1,596,968 | | | $ | 19,214,515 | |
|
| |
Class C | | | 93,567 | | | | 691,359 | | | | 194,700 | | | | 2,223,840 | |
|
| |
Class R | | | 154,824 | | | | 1,144,146 | | | | 211,427 | | | | 2,434,522 | |
|
| |
Class Y | | | 890,254 | | | | 6,920,762 | | | | 1,822,655 | | | | 21,297,060 | |
|
| |
Class R5 | | | - | | | | - | | | | 817 | | | | 9,738 | |
|
| |
Class R6 | | | 45,928 | | | | 356,071 | | | | 75,337 | | | | 896,201 | |
|
| |
| | | | |
Issued as reinvestment of dividends: | | | | | | | | | | | | | | | | |
Class A | | | 144,164 | | | | 1,251,341 | | | | 17,922 | | | | 215,778 | |
|
| |
Class C | | | 16,831 | | | | 140,207 | | | | 2,462 | | | | 28,493 | |
|
| |
Class R | | | 15,857 | | | | 136,054 | | | | 1,517 | | | | 18,069 | |
|
| |
Class Y | | | 76,547 | | | | 666,722 | | | | 15,856 | | | | 191,539 | |
|
| |
Class R5 | | | 9,235 | | | | 80,442 | | | | 1,156 | | | | 13,965 | |
|
| |
Class R6 | | | 6,386 | | | | 55,620 | | | | 595 | | | | 7,179 | |
|
| |
| | | | |
Automatic conversion of Class C shares to Class A shares: | | | | | | | | | | | | | | | | |
Class A | | | 36,333 | | | | 267,811 | | | | 101,965 | | | | 1,203,141 | |
|
| |
Class C | | | (38,011 | ) | | | (267,811 | ) | | | (106,303 | ) | | | (1,203,141 | ) |
|
| |
| | |
| 18 | | Invesco Emerging Markets Select Equity Fund |
| | | | | | | | | | | | | | | | |
| | | Summary of Share Activity | |
|
| |
| | |
| | | Year ended | | | Year ended | |
| | | October 31, 2022(a) | | | October 31, 2021 | |
| | | Shares | | | Amount | | | Shares | | | Amount | |
|
| |
| | | | |
Reacquired: | | | | | | | | | | | | | | | | |
Class A | | | (1,414,424 | ) | | $ | (10,447,565 | ) | | | (1,271,382 | ) | | $ | (14,464,882 | ) |
|
| |
Class C | | | (175,368 | ) | | | (1,328,405 | ) | | | (161,042 | ) | | | (1,734,188 | ) |
|
| |
Class R | | | (121,960 | ) | | | (900,927 | ) | | | (99,313 | ) | | | (1,111,958 | ) |
|
| |
Class Y | | | (2,183,906 | ) | | | (18,064,066 | ) | | | (1,971,810 | ) | | | (22,473,566 | ) |
|
| |
Class R5 | | | - | | | | - | | | | (2,109 | ) | | | (25,445 | ) |
|
| |
Class R6 | | | (78,928 | ) | | | (576,900 | ) | | | (30,570 | ) | | | (356,460 | ) |
|
| |
Net increase (decrease) in share activity | | | (2,094,689 | ) | | $ | (16,604,472 | ) | | | 400,848 | | | $ | 6,384,400 | |
|
| |
| (a) | There are entities that are record owners of more than 5% of the outstanding shares of the Fund and in the aggregate own 31% of the outstanding shares of the Fund. IDI has an agreement with these entities to sell Fund shares. The Fund, Invesco and/or Invesco affiliates may make payments to these entities, which are considered to be related to the Fund, for providing services to the Fund, Invesco and/or Invesco affiliates including but not limited to services such as securities brokerage, distribution, third party record keeping and account servicing. The Fund has no knowledge as to whether all or any portion of the shares owned of record by these entities are also owned beneficially. |
In addition, 4% of the outstanding shares of the Fund are owned by the Adviser or an affiliate of the Adviser.
| | |
| 19 | | Invesco Emerging Markets Select Equity Fund |
Report of Independent Registered Public Accounting Firm
To the Board of Trustees of AIM Investment Funds (Invesco Investment Funds) and Shareholders of Invesco Emerging Markets Select Equity Fund
Opinion on the Financial Statements
We have audited the accompanying statement of assets and liabilities, including the schedule of investments, of Invesco Emerging Markets Select Equity Fund (one of the funds constituting AIM Investment Funds (Invesco Investment Funds), referred to hereafter as the “Fund”) as of October 31, 2022, the related statement of operations for the year ended October 31, 2022, the statement of changes in net assets for each of the two years in the period ended October 31, 2022, including the related notes, and the financial highlights for each of the five years in the period ended October 31, 2022 (collectively referred to as the “financial statements”). In our opinion, the financial statements present fairly, in all material respects, the financial position of the Fund as of October 31, 2022, the results of its operations for the year then ended, the changes in its net assets for each of the two years in the period ended October 31, 2022 and the financial highlights for each of the five years in the period ended October 31, 2022 in conformity with accounting principles generally accepted in the United States of America.
Basis for Opinion
These financial statements are the responsibility of the Fund’s management. Our responsibility is to express an opinion on the Fund’s financial statements based on our audits. We are a public accounting firm registered with the Public Company Accounting Oversight Board (United States) (PCAOB) and are required to be independent with respect to the Fund in accordance with the U.S. federal securities laws and the applicable rules and regulations of the Securities and Exchange Commission and the PCAOB.
We conducted our audits of these financial statements in accordance with the standards of the PCAOB. Those standards require that we plan and perform the audit to obtain reasonable assurance about whether the financial statements are free of material misstatement, whether due to error or fraud.
Our audits included performing procedures to assess the risks of material misstatement of the financial statements, whether due to error or fraud, and performing procedures that respond to those risks. Such procedures included examining, on a test basis, evidence regarding the amounts and disclosures in the financial statements. Our audits also included evaluating the accounting principles used and significant estimates made by management, as well as evaluating the overall presentation of the financial statements. Our procedures included confirmation of securities owned as of October 31, 2022 by correspondence with the custodian, transfer agent and brokers; when replies were not received from brokers, we performed other auditing procedures. We believe that our audits provide a reasonable basis for our opinion.
|
| /s/PricewaterhouseCoopers LLP |
|
| Houston, Texas |
| December 23, 2022 |
We have served as the auditor of one or more of the investment companies in the Invesco group of investment companies since at least 1995. We have not been able to determine the specific year we began serving as auditor.
| | |
| 20 | | Invesco Emerging Markets Select Equity Fund |
Calculating your ongoing Fund expenses
Example
As a shareholder of the Fund, you incur two types of costs: (1) transaction costs, which may include sales charges (loads) on purchase payments or contingent deferred sales charges on redemptions, if any; and (2) ongoing costs, including management fees, distribution and/or service (12b-1) fees, and other Fund expenses. This example is intended to help you understand your ongoing costs (in dollars) of investing in the Fund and to compare these costs with ongoing costs of investing in other mutual funds. The example is based on an investment of $1,000 invested at the beginning of the period and held for the entire period May 1, 2022 through October 31, 2022.
Actual expenses
The table below provides information about actual account values and actual expenses. You may use the information in this table, together with the amount you invested, to estimate the expenses that you paid over the period. Simply divide your account value by $1,000 (for example, an $8,600 account value divided by $1,000 = 8.6), then multiply the result by the number in the table under the heading entitled “Actual Expenses Paid During Period” to estimate the expenses you paid on your account during this period.
Hypothetical example for comparison purposes
The table below also provides information about hypothetical account values and hypothetical expenses based on the Fund’s actual expense ratio and an assumed rate of return of 5% per year before expenses, which is not the Fund’s actual return.
The hypothetical account values and expenses may not be used to estimate the actual ending account balance or expenses you paid for the period. You may use this information to compare the ongoing costs of investing in the Fund and other funds. To do so, compare this 5% hypothetical example with the 5% hypothetical examples that appear in the shareholder reports of the other funds.
Please note that the expenses shown in the table are meant to highlight your ongoing costs only and do not reflect any transaction costs, such as sales charges (loads) on purchase payments or contingent deferred sales charges on redemptions, if any. Therefore, the hypothetical information is useful in comparing ongoing costs only, and will not help you determine the relative total costs of owning different funds. In addition, if these transaction costs were included, your costs would have been higher.
| | | | | | | | | | | | |
| | | | | ACTUAL | | HYPOTHETICAL (5% annual return before expenses) | | |
| | | Beginning Account Value (05/01/22) | | Ending
Account Value
(10/31/22)1 | | Expenses
Paid During Period2 | | Ending Account Value (10/31/22) | | Expenses Paid During
Period2 | | Annualized Expense Ratio |
Class A | | $1,000.00 | | $807.10 | | $6.06 | | $1,018.50 | | $6.77 | | 1.33% |
Class C | | 1,000.00 | | 804.20 | | 9.46 | | 1,014.72 | | 10.56 | | 2.08 |
Class R | | 1,000.00 | | 806.00 | | 7.19 | | 1,017.24 | | 8.03 | | 1.58 |
Class Y | | 1,000.00 | | 807.90 | | 4.92 | | 1,019.76 | | 5.50 | | 1.08 |
Class R5 | | 1,000.00 | | 807.90 | | 4.92 | | 1,019.76 | | 5.50 | | 1.08 |
Class R6 | | 1,000.00 | | 807.60 | | 4.92 | | 1,019.76 | | 5.50 | | 1.08 |
| 1 | The actual ending account value is based on the actual total return of the Fund for the period May 1, 2022 through October 31, 2022, after actual expenses and will differ from the hypothetical ending account value which is based on the Fund’s expense ratio and a hypothetical annual return of 5% before expenses. |
| 2 | Expenses are equal to the Fund’s annualized expense ratio as indicated above multiplied by the average account value over the period, multiplied by 184/365 to reflect the most recent fiscal half year. |
| | |
| 21 | | Invesco Emerging Markets Select Equity Fund |
Approval of Investment Advisory and Sub-Advisory Contracts
At meetings held on June 13, 2022, the Board of Trustees (the Board or the Trustees) of AIM Investment Funds (Invesco Investment Funds) as a whole, and the independent Trustees, who comprise over 75% of the Board, voting separately, approved the continuance of the Invesco Emerging Markets Select Equity Fund’s (the Fund) Master Investment Advisory Agreement with Invesco Advisers, Inc. (Invesco Advisers and the investment advisory agreement) and the Master Intergroup Sub-Advisory Contract for Mutual Funds with Invesco Asset Management Deutschland GmbH, Invesco Asset Management Limited, Invesco Asset Management (Japan) Limited, Invesco Hong Kong Limited, Invesco Senior Secured Management, Inc. and Invesco Canada Ltd. and separate sub-advisory contracts with Invesco Capital Management LLC and Invesco Asset Management (India) Private Limited (collectively, the Affiliated Sub-Advisers and the sub-advisory contracts) for another year, effective July 1, 2022. After evaluating the factors discussed below, among others, the Board approved the renewal of the Fund’s investment advisory agreement and the sub-advisory contracts and determined that the compensation payable thereunder by the Fund to Invesco Advisers and by Invesco Advisers to the Affiliated Sub-Advisers is fair and reasonable.
The Board’s Evaluation Process
The Board has established an Investments Committee, which in turn has established Sub-Committees that meet throughout the year to review the performance of funds advised by Invesco Advisers (the Invesco Funds). The Sub-Committees meet regularly with portfolio managers for their assigned Invesco Funds and other members of management to review detailed information about investment performance and portfolio attributes of these funds. The Board has established additional standing and ad hoc committees that meet regularly throughout the year to review matters within their purview. The Board took into account evaluations and reports that it received from its committees and sub-committees, as well as the information provided to the Board and its committees and sub-committees throughout the year, in considering whether to approve each Invesco Fund’s investment advisory agreement and sub-advisory contracts.
As part of the contract renewal process, the Board reviews and considers information provided in response to detailed requests for information submitted to management by the independent Trustees with assistance from legal counsel to the independent Trustees and the Senior Officer, an officer of the Invesco Funds who reports directly to the independent Trustees. The Board receives comparative investment performance and fee and expense data regarding the Invesco Funds prepared by Broadridge Financial Solutions, Inc. (Broadridge), an independent mutual fund data provider, as well as information on the composition of the peer groups provided by Broadridge and its methodology for determining peer groups. The Board also receives an independent written evaluation from the Senior Officer. The Senior Officer’s evaluation is prepared as part of his responsibility to manage the process by which the Invesco Funds’ proposed management fees are negotiated during the annual contract renewal
process to ensure they are negotiated in a manner that is at arms’ length and reasonable in accordance with certain negotiated regulatory requirements. In addition to meetings with Invesco Advisers and fund counsel throughout the year and as part of meetings convened on May 2, 2022 and June 13, 2022, the independent Trustees also discussed the continuance of the investment advisory agreement and sub-advisory contracts in separate sessions with the Senior Officer and with independent legal counsel.
The discussion below is a summary of the Senior Officer’s independent written evaluation with respect to the Fund’s investment advisory agreement and sub-advisory contracts, as well as a discussion of the material factors and related conclusions that formed the basis for the Board’s approval of the Fund’s investment advisory agreement and sub-advisory contracts. The Trustees’ review and conclusions are based on the comprehensive consideration of all information presented to them during the course of the year and in prior years and are not the result of any single determinative factor. Moreover, one Trustee may have weighed a particular piece of information or factor differently than another Trustee. The information received and considered by the Board was current as of various dates prior to the Board’s approval on June 13, 2022.
Factors and Conclusions and Summary of Independent Written Fee Evaluation
| A. | Nature, Extent and Quality of Services Provided by Invesco Advisers and the Affiliated Sub-Advisers |
The Board reviewed the nature, extent and quality of the advisory services provided to the Fund by Invesco Advisers under the Fund’s investment advisory agreement, and the credentials and experience of the officers and employees of Invesco Advisers who provide these services, including the Fund’s portfolio manager(s). The Board’s review included consideration of Invesco Advisers’ investment process and oversight, credit analysis, and research capabilities. The Board considered information regarding Invesco Advisers’ programs for and resources devoted to risk management, including management of investment, enterprise, operational, liquidity, valuation and compliance risks, and technology used to manage such risks. The Board also received and reviewed information about Invesco Advisers’ role as administrator of the Invesco Funds’ liquidity risk management program. The Board received a description of, and reports related to, Invesco Advisers’ global security program and business continuity plans and of its approach to data privacy and cybersecurity, including related testing. The Board considered how the cybersecurity and business continuity plans of Invesco Advisers and its key service providers operated in the remote and hybrid working environment resulting from the novel coronavirus (“COVID-19”) pandemic and paved the way for a hybrid working framework in a normalized environment as employees return to the office. The Board also considered non-advisory services that Invesco Advisers and its affiliates provide to the Invesco Funds, such as various back office support functions, third party oversight, internal audit, valuation, portfolio trading and legal and compliance. The Board observed that Invesco Advisers’ systems preparedness and ongoing investment enabled
Invesco Advisers to manage, operate and oversee the Invesco Funds with minimal impact or disruption through challenging environments. The Board reviewed and considered the benefits to shareholders of investing in a Fund that is part of the family of funds under the umbrella of Invesco Ltd., Invesco Advisers’ parent company, and noted Invesco Ltd.’s depth and experience in running an investment management business, as well as its commitment of financial and other resources to such business. The Board concluded that the nature, extent and quality of the services provided to the Fund by Invesco Advisers are appropriate and satisfactory.
The Board reviewed the services that may be provided by the Affiliated Sub-Advisers under the sub-advisory contracts and the credentials and experience of the officers and employees of the Affiliated Sub-Advisers who provide these services. The Board noted the Affiliated Sub-Advisers’ expertise with respect to certain asset classes and that the Affiliated Sub-Advisers have offices and personnel that are located in financial centers around the world. As a result, the Board noted that the Affiliated Sub-Advisers can provide research and investment analysis on the markets and economies of various countries in which the Fund may invest, make recommendations regarding securities and assist with security trades. The Board concluded that the sub-advisory contracts may benefit the Fund and its shareholders by permitting Invesco Advisers to use the resources and talents of the Affiliated Sub-Advisers in managing the Fund. The Board concluded that the nature, extent and quality of the services that may be provided to the Fund by the Affiliated Sub-Advisers are appropriate and satisfactory.
| B. | Fund Investment Performance |
The Board considered Fund investment performance as a relevant factor in considering whether to approve the investment advisory agreement as well as the sub-advisory contracts for the Fund, as Invesco Hong Kong Limited currently manages assets of the Fund.
The Board compared the Fund’s investment performance over multiple time periods ending December 31, 2021 to the performance of funds in the Broadridge performance universe and against the MSCI Emerging Markets Index (Index). The Board noted that performance of Class A shares of the Fund was in the fifth quintile of its performance universe for the one and three year periods and the fourth quintile for the five year period (the first quintile being the best performing funds and the fifth quintile being the worst performing funds). The Board noted that performance of Class A shares of the Fund was below the performance of the Index for the one, three and five year periods. The Board noted that the Fund’s stock selection in certain sectors, as well as the Fund’s holdings in China, detracted from Fund performance. The Board recognized that the performance data reflects a snapshot in time as of a particular date and that selecting a different performance period could produce different results. The Board also reviewed more recent Fund performance as well as other performance metrics, which did not change its conclusions.
| | |
| 22 | | Invesco Emerging Markets Select Equity Fund |
| C. | Advisory and Sub-Advisory Fees and Fund Expenses |
The Board compared the Fund’s contractual management fee rate to the contractual management fee rates of funds in the Fund’s Broadridge expense group. The Board noted that the contractual management fee rate for Class A shares of the Fund was below the median contractual management fee rate of funds in its expense group. The Board noted that the term “contractual management fee” for funds in the expense group may include both advisory and certain non-portfolio management administrative services fees, but that Broadridge is not able to provide information on a fund by fund basis as to what is included. The Board also reviewed the methodology used by Broadridge in calculating expense group information, which includes using each fund’s contractual management fee schedule (including any applicable breakpoints) as reported in the most recent prospectus or statement of additional information for each fund in the expense group. The Board also considered comparative information regarding the Fund’s total expense ratio and its various components.
The Board noted that Invesco Advisers has contractually agreed to waive fees and/or limit expenses of the Fund for the term disclosed in the Fund’s registration statement in an amount necessary to limit total annual operating expenses to a specified percentage of average daily net assets for each class of the Fund.
The Board also considered the fees charged by Invesco Advisers and its affiliates to other client accounts that are similarly managed. Invesco Advisers reviewed with the Board differences in the scope of services it provides to the Invesco Funds relative to that provided by Invesco Advisers and its affiliates to certain other types of client accounts, including, among others: management of cash flows as a result of redemptions and purchases; necessary infrastructure such as officers, office space, technology, legal and distribution; oversight of service providers; costs and business risks associated with launching new funds and sponsoring and maintaining the product line; and compliance with federal and state laws and regulations. Invesco Advisers also advised the Board that many of the similarly managed client accounts have all-inclusive fee structures, which are not easily un-bundled.
The Board also considered the services that may be provided by the Affiliated Sub-Advisers pursuant to the sub-advisory contracts, as well as the fees payable by Invesco Advisers to the Affiliated Sub-Advisers pursuant to the sub-advisory contracts. The Board noted that Invesco Advisers retains overall responsibility for, and provides services to, sub-advised Invesco Funds, including oversight of the Affiliated Sub-Advisers as well as the additional services described herein other than day-to-day portfolio management.
| D. | Economies of Scale and Breakpoints |
The Board considered the extent to which there may be economies of scale in the provision of advisory services to the Fund and the Invesco Funds, and the extent to which such economies of scale are shared with the Fund and the Invesco Funds. The Board considered that the Fund may benefit from economies of scale through contractual breakpoints in the Fund’s advisory fee schedule, which generally operate to reduce the Fund’s expense ratio as it grows in size. The Board noted that the Fund also shares in economies of scale through Invesco
Advisers’ ability to negotiate lower fee arrangements with third party service providers. The Board noted that the Fund may also benefit from economies of scale through initial fee setting, fee waivers and expense reimbursements, as well as Invesco Advisers’ investment in its business, including investments in business infrastructure, technology and cybersecurity.
| E. | Profitability and Financial Resources |
The Board reviewed information from Invesco Advisers concerning the costs of the advisory and other services that Invesco Advisers and its affiliates provide to the Fund and the Invesco Funds and the profitability of Invesco Advisers and its affiliates in providing these services in the aggregate and on an individual Fund-by-Fund basis. The Board considered the methodology used for calculating profitability and the periodic review and enhancement of such methodology. The Board noted that Invesco Advisers continues to operate at a net profit from services Invesco Advisers and its affiliates provide to the Invesco Funds in the aggregate and to most Funds individually. The Board did not deem the level of profits realized by Invesco Advisers and its affiliates from providing such services to be excessive, given the nature, extent and quality of the services provided. The Board noted that Invesco Advisers provided information demonstrating that Invesco Advisers is financially sound and has the resources necessary to perform its obligations under the investment advisory agreement, and provided representations indicating that the Affiliated Sub-Advisers are financially sound and have the resources necessary to perform their obligations under the sub-advisory contracts.
| F. | Collateral Benefits to Invesco Advisers and its Affiliates |
The Board considered various other benefits received by Invesco Advisers and its affiliates from the relationship with the Fund, including the fees received for providing administrative, transfer agency and distribution services to the Fund. The Board received comparative information regarding fees charged for these services, including information provided by Broadridge and other independent sources. The Board reviewed the performance of Invesco Advisers and its affiliates in providing these services and the organizational structure employed to provide these services. The Board noted that these services are provided to the Fund pursuant to written contracts that are reviewed and subject to approval on an annual basis by the Board based on its determination that the services are required for the operation of the Fund.
The Board considered the benefits realized by Invesco Advisers and the Affiliated Sub-Advisers as a result of portfolio brokerage transactions executed through “soft dollar” arrangements. The Board noted that soft dollar arrangements may result in the Fund bearing costs to purchase research that may be used by Invesco Advisers or the Affiliated Sub-Advisers with other clients and may reduce Invesco Advisers’ or the Affiliated Sub-Advisers’ expenses. The Board also considered that it receives from Invesco Advisers periodic reports that include a representation to the effect that these arrangements are consistent with regulatory requirements. The Board did not deem the soft dollar arrangements to be inappropriate.
The Board considered that the Fund’s uninvested cash and cash collateral from any securities lending arrangements may be invested in registered money market funds or, with regard to securities lending
cash collateral, unregistered funds that comply with Rule 2a-7 (collectively referred to as “affiliated money market funds”) advised by Invesco Advisers. The Board considered information regarding the returns of the affiliated money market funds relative to comparable overnight investments, as well as the fees paid by the affiliated money market funds to Invesco Advisers and its affiliates. In this regard, the Board noted that Invesco Advisers receives advisory fees from these affiliated money market funds attributable to the Fund’s investments. The Board also noted that Invesco Advisers has contractually agreed to waive through varying periods an amount equal to 100% of the net advisory fee Invesco Advisers receives from the affiliated money market funds with respect to the Fund’s investment in the affiliated money market funds of uninvested cash, but not cash collateral. The Board concluded that the advisory fees payable to Invesco Advisers from the Fund’s investment of cash collateral from any securities lending arrangements in the affiliated money market funds are for services that are not duplicative of services provided by Invesco Advisers to the Fund.
The Board considered that Invesco Advisers may serve as the Fund’s affiliated securities lending agent and evaluated the benefits realized by Invesco Advisers when serving in such role, including the compensation received. The Board considered Invesco Advisers’ securities lending platform and corporate governance structure for securities lending, including Invesco Advisers’ Securities Lending Governance Committee and its related responsibilities. The Board noted that to the extent the Fund utilizes Invesco Advisers as an affiliated securities lending agent, the Fund conducts its securities lending in accordance with, and in reliance upon, no-action letters issued by the SEC staff that provide guidance on how an affiliate may act as a direct agent lender and receive compensation for those services without obtaining exemptive relief. The Board considered information provided by Invesco Advisers related to the performance of Invesco Advisers as securities lending agent, including a summary of the securities lending services provided to the Fund by Invesco Advisers and the compensation paid to Invesco Advisers for such services, as well as any revenues generated for the Fund in connection with such securities lending activity and the allocation of such revenue between the Fund and Invesco Advisers.
The Board also received information about commissions that an affiliated broker may receive for executing certain trades for the Fund. Invesco Advisers and the Affiliated Sub-Advisers advised the Board of the benefits to the Fund of executing trades through the affiliated broker and that such trades were executed in compliance with rules under the federal securities laws and consistent with best execution obligations.
| | |
| 23 | | Invesco Emerging Markets Select Equity Fund |
Tax Information
Form 1099-DIV, Form 1042-S and other year–end tax information provide shareholders with actual calendar year amounts that should be included in their tax returns. Shareholders should consult their tax advisers.
The following distribution information is being provided as required by the Internal Revenue Code or to meet a specific state’s requirement.
The Fund designates the following amounts or, if subsequently determined to be different, the maximum amount allowable for its fiscal year ended October 31, 2022:
| | | | | | | | |
Federal and State Income Tax | | | | | | |
Long-Term Capital Gain Distributions | | $ | 2,032,592 | | | | | |
Qualified Dividend Income* | | | 100.00 | % | | | | |
Corporate Dividends Received Deduction* | | | 0.00 | % | | | | |
U.S. Treasury Obligations* | | | 0.00 | % | | | | |
Qualified Business Income* | | | 0.00 | % | | | | |
Business Interest Income* | | | 0.00 | % | | | | |
| | * | The above percentages are based on ordinary income dividends paid to shareholders during the Fund’s fiscal year. |
| | |
| 24 | | Invesco Emerging Markets Select Equity Fund |
Trustees and Officers
The address of each trustee and officer is AIM Investment Funds (Invesco Investment Funds) (the “Trust”), 11 Greenway Plaza, Suite 1000, Houston, Texas 77046-1173. The trustees serve for the life of the Trust, subject to their earlier death, incapacitation, resignation, retirement or removal as more specifically provided in the Trust’s organizational documents. Each officer serves for a one year term or until their successors are elected and qualified. Column two below includes length of time served with predecessor entities, if any.
| | | | | | | | |
Name, Year of Birth and
Position(s) Held with the Trust | | Trustee and/or Officer Since | | Principal Occupation(s) During Past 5 Years | | Number of
Funds in Fund Complex
Overseen by
Trustee | | Other Directorship(s) Held by Trustee
During Past 5 Years |
| Interested Trustee | | | | | | | | |
Martin L. Flanagan1 – 1960 Trustee and Vice Chair | | 2007 | | Executive Director, Chief Executive Officer and President, Invesco Ltd. (ultimate parent of Invesco and a global investment management firm); Trustee and Vice Chair, The Invesco Funds; Vice Chair, Investment Company Institute; and Member of Executive Board, SMU Cox School of Business Formerly: Advisor to the Board, Invesco Advisers, Inc. (formerly known as Invesco Institutional (N.A.), Inc.); Chairman and Chief Executive Officer, Invesco Advisers, Inc. (registered investment adviser); Director, Chairman, Chief Executive Officer and President, Invesco Holding Company (US), Inc. (formerly IVZ Inc.) (holding company), Invesco Group Services, Inc. (service provider) and Invesco North American Holdings, Inc. (holding company); Director, Chief Executive Officer and President, Invesco Holding Company Limited (parent of Invesco and a global investment management firm); Director, Invesco Ltd.; Chairman, Investment Company Institute and President, Co-Chief Executive Officer, Co-President, Chief Operating Officer and Chief Financial Officer, Franklin Resources, Inc. (global investment management organization) | | 189 | | None |
| 1 | Mr. Flanagan is considered an interested person (within the meaning of Section 2(a)(19) of the 1940 Act) of the Trust because he is an officer of the Adviser to the Trust, and an officer and a director of Invesco Ltd., ultimate parent of the Adviser. |
| | |
| T-1 | | Invesco Emerging Markets Select Equity Fund |
Trustees and Officers–(continued)
| | | | | | | | |
Name, Year of Birth and
Position(s) Held with the Trust | | Trustee and/or
Officer Since | | Principal Occupation(s) During Past 5 Years | | Number of
Funds in Fund Complex
Overseen by
Trustee | | Other Directorship(s) Held by Trustee
During Past 5 Years |
| Independent Trustees | | | | | | | | |
Beth Ann Brown – 1968 Trustee (2019) and Chair (August 2022) | | 2019 | | Independent Consultant Formerly: Head of Intermediary Distribution, Managing Director, Strategic Relations, Managing Director, Head of National Accounts, Senior Vice President, National Account Manager and Senior Vice President, Key Account Manager, Columbia Management Investment Advisers LLC; Vice President, Key Account Manager, Liberty Funds Distributor, Inc.; and Trustee of certain Oppenheimer Funds | | 189 | | Director, Board of Directors of Caron Engineering Inc.; Advisor, Board of Advisors of Caron Engineering Inc.; President and Director, Acton Shapleigh Youth Conservation Corps (non-profit) Formerly: President and Director Director of Grahamtastic Connection (non-profit) |
Cynthia Hostetler – 1962 Trustee | | 2017 | | Non-Executive Director and Trustee of a number of public and private business corporations Formerly: Director, Aberdeen Investment Funds (4 portfolios); Director, Artio Global Investment LLC (mutual fund complex); Director, Edgen Group, Inc. (specialized energy and infrastructure products distributor); Director, Genesee & Wyoming, Inc. (railroads); Head of Investment Funds and Private Equity, Overseas Private Investment Corporation; President, First Manhattan Bancorporation, Inc.; and Attorney, Simpson Thacher & Bartlett LLP | | 189 | | Resideo Technologies, Inc. (smart home technology); Vulcan Materials Company (construction materials company); Trilinc Global Impact Fund; Textainer Group Holdings, (shipping container leasing company); Investment Company Institute (professional organization); and Independent Directors Council (professional organization) |
Eli Jones – 1961 Trustee | | 2016 | | Professor and Dean Emeritus, Mays Business School - Texas A&M University Formerly: Dean of Mays Business School-Texas A&M University; Professor and Dean, Walton College of Business, University of Arkansas and E.J. Ourso College of Business, Louisiana State University; and Director, Arvest Bank | | 189 | | Insperity, Inc. (formerly known as Administaff) (human resources provider); and Member of Regional Board of Directors and Board of Directors, First Financial Bancorp (regional bank) |
Elizabeth Krentzman – 1959 Trustee | | 2019 | | Formerly: Principal and Chief Regulatory Advisor for Asset Management Services and U.S. Mutual Fund Leader of Deloitte & Touche LLP; General Counsel of the Investment Company Institute (trade association); National Director of the Investment Management Regulatory Consulting Practice, Principal, Director and Senior Manager of Deloitte & Touche LLP; Assistant Director of the Division of Investment Management - Office of Disclosure and Investment Adviser Regulation of the U.S. Securities and Exchange Commission and various positions with the Division of Investment Management – Office of Regulatory Policy of the U.S. Securities and Exchange Commission; Associate at Ropes & Gray LLP; and Trustee of certain Oppenheimer Funds | | 189 | | Formerly: Member of the Cartica Funds Board of Directors (private investment fund); Trustee of the University of Florida National Board Foundation; and Member of the University of Florida Law Center Association, Inc. Board of Trustees, Audit Committee and Membership Committee |
Anthony J. LaCava, Jr. – 1956 Trustee | | 2019 | | Formerly: Director and Member of the Audit Committee, Blue Hills Bank (publicly traded financial institution) and Managing Partner, KPMG LLP | | 189 | | Blue Hills Bank; Chairman, Bentley University; Member, Business School Advisory Council; and Nominating Committee, KPMG LLP |
Prema Mathai-Davis – 1950 Trustee | | 2001 | | Retired Formerly: Co-Founder & Partner of Quantalytics Research, LLC, (a FinTech Investment Research Platform for the Self-Directed Investor); Trustee of YWCA Retirement Fund; CEO of YWCA of the USA; Board member of the NY Metropolitan Transportation Authority; Commissioner of the NYC Department of Aging; and Board member of Johns Hopkins Bioethics Institute | | 189 | | Member of Board of Positive Planet US (non-profit) and HealthCare Chaplaincy Network (non-profit) |
| | |
| T-2 | | Invesco Emerging Markets Select Equity Fund |
Trustees and Officers–(continued)
| | | | | | | | |
Name, Year of Birth and
Position(s) Held with the Trust | | Trustee and/or
Officer Since | | Principal Occupation(s) During Past 5 Years | | Number of
Funds in Fund Complex
Overseen by
Trustee | | Other Directorship(s) Held by Trustee
During Past 5 Years |
| Independent Trustees–(continued) | | | | | | |
Joel W. Motley – 1952 Trustee | | 2019 | | Director of Office of Finance, Federal Home Loan Bank System; Managing Director of Carmona Motley Inc. (privately held financial advisor); Member of the Council on Foreign Relations and its Finance and Budget Committee; Chairman Emeritus of Board of Human Rights Watch and Member of its Investment Committee; and Member of Investment Committee Board of Historic Hudson Valley (non-profit cultural organization); Member of the Board, Blue Ocean Acquisition Corp.; and Member of the Vestry and the Investment Committee of Trinity Church Wall Street. Formerly: Managing Director of Public Capital Advisors, LLC (privately held financial advisor); Managing Director of Carmona Motley Hoffman, Inc. (privately held financial advisor); Trustee of certain Oppenheimer Funds; and Director of Columbia Equity Financial Corp. (privately held financial advisor) | | 189 | | Member of Board of Trust for Mutual Understanding (non-profit promoting the arts and environment); Member of Board of Greenwall Foundation (bioethics research foundation) and its Investment Committee; Member of Board of Friends of the LRC (non-profit legal advocacy); and Board Member and Investment Committee Member of Pulitzer Center for Crisis Reporting (non-profit journalism) |
Teresa M. Ressel – 1962 Trustee | | 2017 | | Non-executive director and trustee of a number of public and private business corporations Formerly: Chief Executive Officer, UBS Securities LLC (investment banking); Chief Operating Officer, UBS AG Americas (investment banking); Sr. Management Team Olayan America, The Olayan Group (international investor/commercial/industrial); Assistant Secretary for Management & Budget and Designated Chief Financial Officer, U.S. Department of Treasury and Director, ON Semiconductor Corporation (semiconductor manufacturing) | | 189 | | None |
Robert C. Troccoli – 1949 Trustee | | 2016 | | Retired Formerly: Adjunct Professor, University of Denver – Daniels College of Business; and Managing Partner, KPMG LLP | | 189 | | None |
Daniel S. Vandivort – 1954 Trustee | | 2019 | | President, Flyway Advisory Services LLC (consulting and property management) Formerly: President and Chief Investment Officer, previously Head of Fixed Income, Weiss Peck and Greer/Robeco Investment Management; Trustee and Chair, Weiss Peck and Greer Funds Board; and various capacities at CS First Boston including Head of Fixed Income at First Boston Asset Management. | | 189 | | Formerly: Trustee and Governance Chair, Oppenheimer Funds; Treasurer, Chairman of the Audit and Finance Committee, Huntington Disease Foundation of America |
| | |
| T-3 | | Invesco Emerging Markets Select Equity Fund |
Trustees and Officers–(continued)
| | | | | | | | |
Name, Year of Birth and
Position(s) Held with the Trust | | Trustee and/or
Officer Since | | Principal Occupation(s) During Past 5 Years | | Number of
Funds in Fund Complex
Overseen by
Trustee | | Other Directorship(s) Held by Trustee
During Past 5 Years |
| Officers | | | | | | | | |
| Sheri Morris – 1964 President and Principal Executive Officer | | 1999 | | Director, Invesco Trust Company; Head of Global Fund Services, Invesco Ltd.; President and Principal Executive Officer, The Invesco Funds; Vice President, Invesco Exchange-Traded Fund Trust, Invesco Exchange-Traded Fund Trust II, Invesco India Exchange-Traded Fund Trust, Invesco Actively Managed Exchange-Traded Fund Trust, Invesco Actively Managed Exchange-Traded Commodity Fund Trust and Invesco Exchange-Traded Self-Indexed Fund Trust; and Vice President, OppenheimerFunds, Inc. Formerly: Vice President, Treasurer and Principal Financial Officer, The Invesco Funds; Vice President, Invesco AIM Advisers, Inc., Invesco AIM Capital Management, Inc. and Invesco AIM Private Asset Management, Inc.; Assistant Vice President and Assistant Treasurer, The Invesco Funds; Vice President and Assistant Vice President, Invesco Advisers, Inc.; Assistant Vice President, Invesco AIM Capital Management, Inc. and Invesco AIM Private Asset Management, Inc.; Treasurer, Invesco Exchange-Traded Fund Trust, Invesco Exchange-Traded Fund Trust II, Invesco India Exchange-Traded Fund Trust and Invesco Actively Managed Exchange-Traded Fund Trust; and Senior Vice President, Invesco Advisers, Inc. (formerly known as Invesco Institutional (N.A.), Inc.) (registered investment adviser) | | N/A | | N/A |
Jeffrey H. Kupor – 1968 Senior Vice President, Chief Legal Officer and Secretary | | 2018 | | Head of Legal of the Americas, Invesco Ltd.; Senior Vice President and Secretary, Invesco Advisers, Inc. (formerly known as Invesco Institutional (N.A.), Inc.) (registered investment adviser); Secretary, Invesco Distributors, Inc. (formerly known as Invesco AIM Distributors, Inc.); Vice President and Secretary, Invesco Investment Services, Inc. (formerly known as Invesco AIM Investment Services, Inc.); Senior Vice President, Chief Legal Officer and Secretary, The Invesco Funds; Secretary and General Counsel, Invesco Investment Advisers LLC (formerly known as Van Kampen Asset Management); Secretary and General Counsel, Invesco Capital Markets, Inc. (formerly known as Van Kampen Funds Inc.); Chief Legal Officer, Invesco Exchange-Traded Fund Trust, Invesco Exchange-Traded Fund Trust II, Invesco India Exchange-Traded Fund Trust, Invesco Actively Managed Exchange-Traded Fund Trust, Invesco Actively Managed Exchange-Traded Commodity Fund Trust and Invesco Exchange-Traded Self-Indexed Fund Trust;; Secretary and Vice President, Harbourview Asset Management Corporation; Secretary and Vice President, OppenheimerFunds, Inc. and Invesco Managed Accounts, LLC; Secretary and Senior Vice President, OFI Global Institutional, Inc.; Secretary and Vice President, OFI SteelPath, Inc.; Secretary and Vice President, Oppenheimer Acquisition Corp.; Secretary and Vice President, Shareholder Services, Inc.; and Secretary and Vice President, Trinity Investment Management Corporation Formerly: Senior Vice President, Invesco Distributors, Inc.; Secretary and Vice President, Jemstep, Inc.; Head of Legal, Worldwide Institutional, Invesco Ltd.; Secretary and General Counsel, INVESCO Private Capital Investments, Inc.; Senior Vice President, Secretary and General Counsel, Invesco Management Group, Inc. (formerly known as Invesco AIM Management Group, Inc.); Assistant Secretary, INVESCO Asset Management (Bermuda) Ltd.; Secretary and General Counsel, Invesco Private Capital, Inc.; Assistant Secretary and General Counsel, INVESCO Realty, Inc.; Secretary and General Counsel, Invesco Senior Secured Management, Inc.; Secretary, Sovereign G./P. Holdings Inc.; Secretary, Invesco Indexing LLC; and Secretary, W.L. Ross & Co., LLC | | N/A | | N/A |
| Andrew R. Schlossberg – 1974 Senior Vice President | | 2019 | | Senior Vice President, Invesco Group Services, Inc.; Head of the Americas and Senior Managing Director, Invesco Ltd.; Director and Senior Vice President, Invesco Advisers, Inc. (formerly known as Invesco Institutional (N.A.), Inc.) (registered investment adviser); Director and Chairman, Invesco Investment Services, Inc. (formerly known as Invesco AIM Investment Services, Inc.) (registered transfer agent); Senior Vice President, The Invesco Funds; and Director, Invesco Investment Advisers LLC (formerly known as Van Kampen Asset Management) Formerly: Director, President and Chairman, Invesco Insurance Agency, Inc.; Director, Invesco UK Limited; Director and Chief Executive, Invesco Asset Management Limited and Invesco Fund Managers Limited; Assistant Vice President, The Invesco Funds; Senior Vice President, Invesco Advisers, Inc. (formerly known as Invesco Institutional (N.A.), Inc.) (registered investment adviser); Director and Chief Executive, Invesco Administration Services Limited and Invesco Global Investment Funds Limited; Director, Invesco Distributors, Inc.; Head of EMEA, Invesco Ltd.; President, Invesco Actively Managed Exchange-Traded Commodity Fund Trust, Invesco Actively Managed Exchange-Traded Fund Trust, Invesco Exchange-Traded Fund Trust, Invesco Exchange-Traded Fund Trust II and Invesco India Exchange-Traded Fund Trust; and Managing Director and Principal Executive Officer, Invesco Capital Management LLC | | N/A | | N/A |
| | |
| T-4 | | Invesco Emerging Markets Select Equity Fund |
Trustees and Officers–(continued)
| | | | | | | | |
Name, Year of Birth and
Position(s) Held with the Trust | | Trustee and/or
Officer Since | | Principal Occupation(s) During Past 5 Years | | Number of
Funds in Fund Complex
Overseen by
Trustee | | Other Directorship(s) Held by Trustee
During Past 5 Years |
| Officers–(continued) | | | | | | | | |
John M. Zerr – 1962 Senior Vice President | | 2006 | | Chief Operating Officer of the Americas; Senior Vice President, Invesco Advisers, Inc. (formerly known as Invesco Institutional (N.A.), Inc.) (registered investment adviser); Senior Vice President, Invesco Distributors, Inc. (formerly known as Invesco AIM Distributors, Inc.); Director and Vice President, Invesco Investment Services, Inc. (formerly known as Invesco AIM Investment Services, Inc.) Senior Vice President, The Invesco Funds; Managing Director, Invesco Capital Management LLC; Director, Invesco Investment Advisers LLC (formerly known as Van Kampen Asset Management); Senior Vice President, Invesco Capital Markets, Inc. (formerly known as Van Kampen Funds Inc.); Manager, Invesco Indexing LLC; Manager, Invesco Specialized Products, LLC; Member, Invesco Canada Funds Advisory Board; Director, President and Chief Executive Officer, Invesco Corporate Class Inc. (corporate mutual fund company); and Director, Chairman, President and Chief Executive Officer, Invesco Canada Ltd. (formerly known as Invesco Trimark Ltd./Invesco Trimark Ltèe) (registered investment adviser and registered transfer agent); President, Invesco, Inc.; President, Invesco Global Direct Real Estate Feeder GP Ltd.; President, Invesco IP Holdings (Canada) Ltd; President, Invesco Global Direct Real Estate GP Ltd.; President, Invesco Financial Services Ltd. / Services Financiers Invesco Ltée; and Director and Chairman, Invesco Trust Company Formerly: President, Trimark Investments Ltd/Services Financiers Invesco Ltee; Director and Senior Vice President, Invesco Insurance Agency, Inc.; Director and Senior Vice President, Invesco Management Group, Inc. (formerly known as Invesco AIM Management Group, Inc.); Secretary and General Counsel, Invesco Management Group, Inc. (formerly known as Invesco AIM Management Group, Inc.); Secretary, Invesco Investment Services, Inc. (formerly known as Invesco AIM Investment Services, Inc.); Chief Legal Officer and Secretary, The Invesco Funds; Secretary and General Counsel, Invesco Investment Advisers LLC (formerly known as Van Kampen Asset Management); Secretary and General Counsel, Invesco Capital Markets, Inc. (formerly known as Van Kampen Funds Inc.); Chief Legal Officer, Invesco Exchange-Traded Fund Trust, Invesco Exchange-Traded Fund Trust II, Invesco India Exchange-Traded Fund Trust, Invesco Actively Managed Exchange-Traded Fund Trust, Invesco Actively Managed Exchange-Traded Commodity Fund Trust and Invesco Exchange-Traded Self-Indexed Fund Trust; Secretary, Invesco Indexing LLC; Director, Secretary, General Counsel and Senior Vice President, Van Kampen Exchange Corp.; Director, Vice President and Secretary, IVZ Distributors, Inc. (formerly known as INVESCO Distributors, Inc.); Director and Vice President, INVESCO Funds Group, Inc.; Director and Vice President, Van Kampen Advisors Inc.; Director, Vice President, Secretary and General Counsel, Van Kampen Investor Services Inc.; Director and Secretary, Invesco Distributors, Inc. (formerly known as Invesco AIM Distributors, Inc.); Director, Senior Vice President, General Counsel and Secretary, Invesco AIM Advisers, Inc. and Van Kampen Investments Inc.; Director, Vice President and Secretary, Fund Management Company; Director, Senior Vice President, Secretary, General Counsel and Vice President, Invesco AIM Capital Management, Inc.; and Chief Operating Officer and General Counsel, Liberty Ridge Capital, Inc. (an investment adviser) | | N/A | | N/A |
Gregory G. McGreevey – 1962 Senior Vice President | | 2012 | | Senior Managing Director, Invesco Ltd.; Director, Chairman, President, and Chief Executive Officer, Invesco Advisers, Inc. (formerly known as Invesco Institutional (N.A.), Inc.) (registered investment adviser); Director, Invesco Mortgage Capital, Inc. and Invesco Senior Secured Management, Inc.; Senior Vice President, The Invesco Funds; President, SNW Asset Management Corporation and Invesco Managed Accounts, LLC; Chairman and Director, Invesco Private Capital, Inc.; Chairman and Director, INVESCO Private Capital Investments, Inc.; Chairman and Director, INVESCO Realty, Inc.; and Senior Vice President, Invesco Group Services, Inc. Formerly: Senior Vice President, Invesco Management Group, Inc. and Invesco Advisers, Inc.; Assistant Vice President, The Invesco Funds | | N/A | | N/A |
Adrien Deberghes – 1967 Principal Financial Officer, Treasurer and Vice President | | 2020 | | Head of the Fund Office of the CFO and Fund Administration; Vice President, Invesco Advisers, Inc.; Principal Financial Officer, Treasurer and Vice President, The Invesco Funds; Vice President, Invesco Exchange-Traded Fund Trust, Invesco Exchange-Traded Fund Trust II, Invesco India Exchange-Traded Fund Trust, Invesco Actively Managed Exchange-Traded Fund Trust, Invesco Actively Managed Exchange-Traded Commodity Fund Trust and Invesco Exchange-Traded Self-Indexed Fund Trust Formerly: Senior Vice President and Treasurer, Fidelity Investments | | N/A | | N/A |
Crissie M. Wisdom – 1969 Anti-Money Laundering Compliance Officer | | 2013 | | Anti-Money Laundering and OFAC Compliance Officer for Invesco U.S. entities including: Invesco Advisers, Inc. and its affiliates, Invesco Capital Markets, Inc., Invesco Distributors, Inc., Invesco Investment Services, Inc., The Invesco Funds, Invesco Capital Management, LLC, Invesco Trust Company; and Fraud Prevention Manager for Invesco Investment Services, Inc. | | N/A | | N/A |
| | |
| T-5 | | Invesco Emerging Markets Select Equity Fund |
Trustees and Officers–(continued)
| | | | | | | | |
Name, Year of Birth and
Position(s) Held with the Trust | | Trustee and/or
Officer Since | | Principal Occupation(s) During Past 5 Years | | Number of
Funds in Fund Complex
Overseen by
Trustee | | Other Directorship(s) Held by Trustee During Past 5 Years |
| Officers–(continued) | | | | | | | | |
Todd F. Kuehl – 1969 Chief Compliance Officer and Senior Vice President | | 2020 | | Chief Compliance Officer, Invesco Advisers, Inc. (registered investment adviser); and Chief Compliance Officer and Senior Vice President, The Invesco Funds Formerly: Managing Director and Chief Compliance Officer, Legg Mason (Mutual Funds); Chief Compliance Officer, Legg Mason Private Portfolio Group (registered investment adviser) | | N/A | | N/A |
James Bordewick, Jr. – 1959 Senior Vice President and Senior Officer | | 2022 | | Senior Vice President and Senior Officer, The Invesco Funds; and Chief Legal Officer, KingsCrowd, Inc. (research and analytical platform for investment in private capital markets) Formerly, Chief Operating Officer and Head of Legal and Regulatory, Netcapital (private capital investment platform); Managing Director, General Counsel of asset management and Chief Compliance Officer for asset management and private banking, Bank of America Corporation; Chief Legal Officer, Columbia Funds and BofA Funds; Senior Vice President and Associate General Counsel, MFS Investment Management; Chief Legal Officer, MFS Funds; Associate, Ropes & Gray; Associate, Gaston Snow & Ely Bartlett | | N/A | | N/A |
The Statement of Additional Information of the Trust includes additional information about the Fund’s Trustees and is available upon request, without charge, by calling 1.800.959.4246. Please refer to the Fund’s Statement of Additional Information for information on the Fund’s sub-advisers.
| | | | | | |
| Office of the Fund | | Investment Adviser | | Distributor | | Auditors |
11 Greenway Plaza, Suite 1000 Houston, TX 77046-1173 | | Invesco Advisers, Inc. 1555 Peachtree Street, N.E. Atlanta, GA 30309 | | Invesco Distributors, Inc. 11 Greenway Plaza, Suite 1000 Houston, TX 77046-1173 | | PricewaterhouseCoopers LLP 1000 Louisiana Street, Suite 5800 Houston, TX 77002-5021 |
| | | |
| Counsel to the Fund | | Counsel to the Independent Trustees | | Transfer Agent | | Custodian |
| Stradley Ronon Stevens & Young, LLP 2005 Market Street, Suite 2600 Philadelphia, PA 19103-7018 | | Goodwin Procter LLP 901 New York Avenue, N.W. Washington, D.C. 20001 | | Invesco Investment Services, Inc. 11 Greenway Plaza, Suite 1000 Houston, TX 77046-1173 | | State Street Bank and Trust Company 225 Franklin Street Boston, MA 02110-2801 |
| | |
| T-6 | | Invesco Emerging Markets Select Equity Fund |
(This page intentionally left blank)

Go paperless with eDelivery
Visit invesco.com/edelivery to enjoy the convenience and security of anytime electronic access to your investment documents.
With eDelivery, you can elect to have any or all of the following materials delivered straight to your inbox to download, save and print from your own computer:
∎ Fund reports and prospectuses
∎ Quarterly statements
∎ Daily confirmations
∎ Tax forms
Invesco mailing information
Send general correspondence to Invesco Investment Services, Inc., P.O. Box 219078, Kansas City, MO 64121-9078.
Important notice regarding delivery of security holder documents
To reduce Fund expenses, only one copy of most shareholder documents may be mailed to shareholders with multiple accounts at the same address (Householding). Mailing of your shareholder documents may be householded indefinitely unless you instruct us otherwise. If you do not want the mailing of these documents to be combined with those for other members of your household, please contact Invesco Investment Services, Inc. at 800 959 4246 or contact your financial institution. We will begin sending you individual copies for each account within 30 days after receiving your request.
Fund holdings and proxy voting information
The Fund provides a complete list of its portfolio holdings four times each year, at the end of each fiscal quarter. For the second and fourth quarters, the list appears, respectively, in the Fund’s semiannual and annual reports to shareholders. For the first and third quarters, the Fund files the list with the Securities and Exchange Commission (SEC) as an exhibit to its reports on Form N-PORT. The most recent list of portfolio holdings is available at invesco.com/completeqtrholdings. Shareholders can also look up the Fund’s Form N-PORT filings on the SEC website, sec.gov. The SEC file numbers for the Fund are shown below.
A description of the policies and procedures that the Fund uses to determine how to vote proxies relating to portfolio securities is available without charge, upon request, from our Client Services department at 800 959 4246, or at invesco.com/corporate/about-us/esg. The information is also available on the SEC website, sec.gov.
Information regarding how the Fund voted proxies related to its portfolio securities during the most recent 12-month period ended June 30 is available at invesco.com/proxysearch. This information is also available on the SEC website, sec.gov.
Invesco Advisers, Inc. is an investment adviser; it provides investment advisory services to individual and institutional clients and does not sell securities. Invesco Distributors, Inc. is the US distributor for Invesco Ltd.’s retail mutual funds, exchange-traded funds and institutional money market funds. Both are wholly owned, indirect subsidiaries of Invesco Ltd.

| | | | |
| SEC file number(s): 811-05426 and 033-19338 | | Invesco Distributors, Inc. | | EME-AR-1 |
| | |

| | |
| |
| Annual Report to Shareholders | | October 31, 2022 |
Invesco Fundamental Alternatives Fund
Nasdaq:
A: QVOPX ∎ C: QOPCX ∎ R: QOPNX ∎ Y: QOPYX ∎ R5: FDATX ∎ R6: QOPIX
Management’s Discussion of Fund Performance
| | | | |
| |
Performance summary | |
For the fiscal year ended October 31, 2022, Class A shares of Invesco Fundamental Alternatives Fund (the Fund), at net asset value (NAV), underperformed the HFRX Global Hedge Fund Index. | |
Your Fund’s long-term performance appears later in this report. | |
|
| |
Fund vs. Indexes | |
Total returns, 10/31/21 to 10/31/22, at net asset value (NAV). Performance shown does not include applicable contingent deferred sales charges (CDSC) or front-end sales charges, which would have reduced performance. | |
| |
Class A Shares | | | -6.60 | % |
Class C Shares | | | -7.28 | |
Class R Shares | | | -6.87 | |
Class Y Shares | | | -6.38 | |
Class R5 Shares | | | -6.25 | |
Class R6 Shares | | | -6.21 | |
HFRX Global Hedge Fund Index▼ | | | -5.28 | |
Source(s): ▼Bloomberg LP | | | | |
Market conditions and your Fund
At the beginning of the fiscal year ended October 31, 2022, developed global equity markets were mostly positive, despite rising inflation and the emergence of Omicron, a new COVID-19 variant. Pandemic-related supply chain disruptions and labor shortages intensified at the end of 2021, resulting in broadly higher costs for companies and consumers. Emerging market equities declined due in part to COVID-19 concerns and China’s ongoing regulatory tightening in the private education and technology sectors and slowing economic growth.
Global equity markets declined in the first half of 2022 amid volatility sparked by Russia’s invasion of Ukraine, rising commodity prices, rampant global inflation and central banks shifting toward tighter monetary policy. Russia’s invasion exacerbated inflationary pressures, disrupting already strained supply chains, and increasing shortages of oil, gas and raw materials, with the price of oil rising sharply.
Inflation headwinds continued into the third quarter of 2022. The US Federal Reserve (the Fed), the European Central Bank and the Bank of England all raised interest rates. In contrast, the People’s Bank of China lowered its policy rate and the Bank of Japan kept rates the same. Emerging market equities, hampered by the strong US dollar, underperformed developed market equities.
During October 2022, developed market equities rebounded and were in positive territory. Developed market equities outperformed emerging market equities, which declined primarily driven by weakness in China as Chinese markets reacted to the reappointment of President Xi and his authority, with no signs of the country’s zero-COVID-19 policy being relaxed. Despite the rebound in October for developed market equities, at the end of the fiscal year, trailing one-year returns for developed market equities and
emerging market equities were both in negative territory.
For the fiscal year ended October 31, 2022, the Fund’s Class A shares (without sales charge) generated a total return of -6.60%. The Fund underperformed the HFRX Global Hedge Fund Index, which returned -5.28% during the fiscal year. The Fund invests across three distinct alternative investment strategies including equity, credit and macro. All three strategies generated positive returns during the fiscal year.
The Fund’s equity sleeve follows its systematic defensive multi-factor approach, which combines a focus on low volatility with other factor exposures, particularly Quality, Momentum and Value.
The strategy simultaneously targets to provide downside protection and benefits from the extra return potential of equity factors.
The resulting portfolio will hold a diversified mix of stocks that are deemed attractive from a factor and/or risk perspective. We believe this may decrease the impact of stock-specific effects on the portfolio and hence increase the portion of risk and return that is explained by our intended factors – Quality, Momentum and Value, as well as Low Volatility.
For the fiscal year ended October 31, 2022, the Fund’s equity strategy outperformed the S&P 500 Index mainly due to its inherently defensive low volatility positioning, which had a strong positive contribution in a declining market. In addition, our intended factors combined to also add to performance. Within our factors, Value led the way as investors rewarded companies trading at attractive valuations through mid-June before pulling back abruptly. By the beginning of October, sentiment reversed again with Value regaining its upward trend. Momentum added to returns as well, particularly toward the end of the fiscal year. Quality, however, detracted modestly overall.
US interest rate moves and inflation risk significantly affected fixed-income valuations
during the fourth quarter of 2021. The two-year Treasury yield rose moderately from 0.27% to 0.73%, while the 10-year Treasury increased slightly from 1.48% to 1.52% during the quarter.1 The yield curve, as measured by the yield differential between two-and 10-year Treasuries, flattened during the quarter.
The onset of the Russia-Ukraine war in the first quarter further exacerbated inflationary pressures while also exerting downward pressure on economic growth through a surge in commodity/energy prices. These forces, combined with tightening financial conditions, were negative for credit asset classes, as evidenced by the two-year Treasury yield rising significantly from 0.78% to 2.28%, while the 10-year Treasury increased slightly from 1.63% to 2.32%,1 during the first quarter.
In the second quarter of 2022, the macro backdrop of tightening financial conditions and slowing economic growth continued to apply pressure on fixed-income markets. Inflation, as measured by the Consumer Price Index, increased further to 9.1% and fixed-income markets experienced significant negative performance as all bond sectors felt the impact of rising interest rates with negative performance ranging from -0.9% (Bloomberg Asset-Backed Securities) to -9.8% (Bloomberg US Corporate High Yield).3 The Fed continued its rapid tightening of monetary policy in an effort to combat inflation via higher interest rates while simultaneously engineering a soft landing to not push the economy into a recession. The Fed aggressively raised its key Fed funds rate during the fiscal year, including a 0.50% hike in May and three 0.75% hikes each of June, July and November, the largest hikes since 1994 to a target Fed funds rate of 3.75-4.00%, the highest since 2008.3 In their November 2022 meeting, the Fed signaled their hawkish policies would continue, though a slowing of the pace of rate increases was likely. While rates remained elevated across all maturities on the yield curve, the two-year Treasury rates increased from 2.92% to 4.51% during the fiscal year, while 10-year Treasury rates increased from 2.98% to 4.10%.1 At the end of the fiscal year, the yield curve remained inverted, which historically has been an indicator of a potential recession.
The Fund’s credit sleeve utilizes a systematic, quantitative, factor-based approach to investing.
Over the fiscal year, duration was the largest detractor from the Fund’s performance as interest rates rose sharply over the fiscal year, followed by carry and value, while low volatility bonds were the sole contributor to the Fund’s performance. The rise of interest rates during the fiscal year had a negative impact on performance, but overall, bonds with attractive factor characteristics positively impacted the Fund’s absolute performance, counterweighing the negative impact of interest rates.
| | |
| 2 | | Invesco Fundamental Alternatives Fund |
The Fund’s macro sleeve attempts to take advantage of short-term market trends by investing both long- and short-term across liquid global equity, government bond and commodity markets based on each asset’s likelihood to outperform cash over the next 30-day period. Within the macro sleeve, bonds were the top contributor to the Fund’s performance while equities and commodities detracted from the Fund’s performance. Bonds delivered gains due to timely underweight exposures in the UK and the US. Exposure to equities produced negative results as there was no persistent performance month-to-month, which made getting on the right side of the trend a challenge. Exposure to commodities produced modest losses as strong early fiscal year commodity performance became volatile later in the fiscal year and ran counter to our positioning in energy and agriculture.
The Fund is managed as three separate strategies; therefore, the detractors from the Fund’s performance are included in the discussion of the individual sleeves that collectively make up the Fund.
The Fund continues to focus on selecting securities that we believe offer attractive risk-adjusted returns and can deliver effective diversification combined with low volatility, good downside risk mitigation and low sensitivity to traditional market factors over the long-term.
Please note that the macro strategy is principally implemented with derivative instruments that include futures, forward foreign currency contracts, commodity-linked notes, credit default swaps and total return swaps. Therefore, all or most of the performance of the macro strategy, both positive and negative, can be attributed to these instruments. Derivatives can be a cost-effective way to gain exposure to asset classes. However, derivatives may amplify traditional investment risks through the creation of leverage and may be less liquid than traditional securities
We thank you for your continued investment in the Invesco Fundamental Alternatives Fund.
| 1 | Source: US Department of the Treasury |
| 3 | Source: Federal Reserve of Economic Data |
Portfolio manager(s):
Chris Devine
Tarun Gupta
Scott Hixon
Jay Raol
Scott Wolle
The views and opinions expressed in management’s discussion of Fund performance are those of Invesco Advisers, Inc. and its affiliates. These views and opinions are subject to change at any time based on factors such as market and economic conditions. These views and opinions may not be relied upon as investment advice or recommendations, or as an offer for a particular security. The information is not a complete analysis of every aspect of any market, country, industry, security or
the Fund. Statements of fact are from sources considered reliable, but Invesco Advisers, Inc. makes no representation or warranty as to their completeness or accuracy. Although historical performance is no guarantee of future results, these insights may help you understand our investment management philosophy.
See important Fund and, if applicable, index disclosures later in this report.
| | |
| 3 | | Invesco Fundamental Alternatives Fund |
Your Fund’s Long-Term Performance
Results of a $10,000 Investment – Oldest Share Class(es)
Fund and index data from 10/31/12
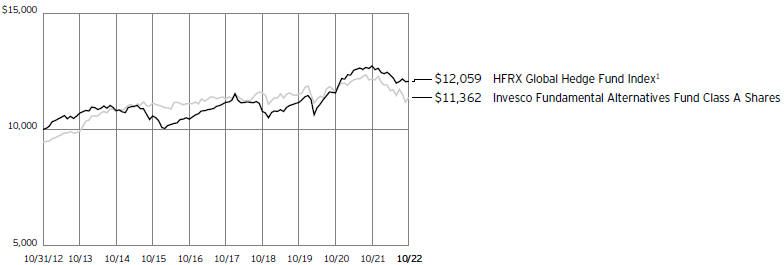
Past performance cannot guarantee future results.
The data shown in the chart include reinvested distributions, applicable sales charges and Fund expenses including management
fees. Index results include reinvested dividends, but they do not reflect sales charges. Performance of the peer group, if applicable, reflects fund expenses and management fees;
performance of a market index does not. Performance shown in the chart does not reflect deduction of taxes a shareholder would pay on Fund distributions or sale of Fund shares.
| | |
| 4 | | Invesco Fundamental Alternatives Fund |
| | | | |
Average Annual Total Returns | |
As of 10/31/22, including maximum applicable sales charges | |
| |
Class A Shares | | | | |
Inception (1/3/89) | | | 6.66 | % |
10 Years | | | 1.29 | |
5 Years | | | -1.02 | |
1 Year | | | -11.75 | |
| |
Class C Shares | | | | |
Inception (9/1/93) | | | 5.05 | % |
10 Years | | | 1.24 | |
5 Years | | | -0.65 | |
1 Year | | | -8.19 | |
| |
Class R Shares | | | | |
Inception (3/1/01) | | | 1.80 | % |
10 Years | | | 1.59 | |
5 Years | | | -0.16 | |
1 Year | | | -6.87 | |
| |
Class Y Shares | | | | |
Inception (12/16/96) | | | 3.82 | % |
10 Years | | | 2.10 | |
5 Years | | | 0.34 | |
1 Year | | | -6.38 | |
| |
Class R5 Shares | | | | |
10 Years | | | 2.00 | % |
5 Years | | | 0.38 | |
1 Year | | | -6.25 | |
| |
Class R6 Shares | | | | |
Inception (2/28/13) | | | 2.16 | % |
5 Years | | | 0.53 | |
1 Year | | | -6.21 | |
Effective May 24, 2019, Class A, Class C, Class R, Class Y and Class I shares of the Oppenheimer Fundamental Alternatives Fund (the predecessor fund), were reorganized into Class A, Class C, Class R, Class Y and Class R6 shares, respectively, of the Invesco Oppenheimer Fundamental Alternatives Fund. Note: The Fund was subsequently renamed the Invesco Fundamental Alternatives Fund (the Fund). Returns shown above, for periods ending on or prior to May 24, 2019, for Class A, Class C, Class R, Class Y and Class R6 shares are those for Class A, Class C, Class R, Class Y and Class I shares of the predecessor fund. Share class returns will differ from the predecessor fund because of different expenses.
Class R5 shares incepted on May 24, 2019. Performance shown on and prior to that date is that of the predecessor fund’s Class A shares and includes the 12b-1 fees applicable to Class A shares.
The performance data quoted represent past performance and cannot guarantee future results; current performance may be lower or higher. Please visit invesco.com/ performance for the most recent month-end performance. Performance figures reflect reinvested distributions, changes in net asset value and the effect of the maximum sales charge unless otherwise stated. Performance figures do not reflect
deduction of taxes a shareholder would pay on Fund distributions or sale of Fund shares. Investment return and principal value will fluctuate so that you may have a gain or loss when you sell shares.
Class A share performance reflects the maximum 5.50% sales charge, and Class C share performance reflects the applicable contingent deferred sales charge (CDSC) for the period involved. The CDSC on Class C shares is 1% for the first year after purchase. Class R, Class Y, Class R5 and Class R6 shares do not have a front-end sales charge or a CDSC; therefore, performance is at net asset value.
The performance of the Fund’s share classes will differ primarily due to different sales charge structures and class expenses.
Fund performance reflects any applicable fee waivers and/or expense reimbursements. Had the adviser not waived fees and/or reimbursed expenses currently or in the past, returns would have been lower. See current prospectus for more information.
| | |
| 5 | | Invesco Fundamental Alternatives Fund |
Supplemental Information
Invesco Fundamental Alternatives Fund’s investment objective is to seek total return.
| ∎ | | Unless otherwise stated, information presented in this report is as of October 31, 2022, and is based on total net assets. |
| ∎ | | Unless otherwise noted, all data is provided by Invesco. |
| ∎ | | To access your Fund’s reports/prospectus, visit invesco.com/fundreports. |
About indexes used in this report
| ∎ | | The HFRX Global Hedge Fund Index is designed to be representative of the overall composition of the hedge fund universe. |
| ∎ | | The Fund is not managed to track the performance of any particular index, including the index(es) described here, and consequently, the performance of the Fund may deviate significantly from the performance of the index(es). |
| ∎ | | A direct investment cannot be made in an index. Unless otherwise indicated, index results include reinvested dividends, and they do not reflect sales charges. Performance of the peer group, if applicable, reflects fund expenses; performance of a market index does not. |
| | |
This report must be accompanied or preceded by a currently effective Fund prospectus, which contains more complete information, including sales charges and expenses. Investors should read it carefully before investing. | | |
| | | |
| NOT FDIC INSURED | MAY LOSE VALUE | NO BANK GUARANTEE | | |
| | |
| 6 | | Invesco Fundamental Alternatives Fund |
Fund Information
Volatility Contribution*
| | | | |
Strategy | | Annualized Volatility Contribution | | Volatility Contribution as % of Investment Strategy |
Credit | | 0.42% | | 11.08% |
Equity | | 3.14 | | 82.85 |
Macro | | 0.23 | | 6.07 |
Total | | 3.79% | | 100.00% |
The Fund’s holdings are subject to change, and there is no assurance that the Fund will continue to hold any particular security.
* Excluding money market fund holdings, if any.
Data presented here are as of October 31, 2022.
| | |
| 7 | | Invesco Fundamental Alternatives Fund |
Consolidated Schedule of Investments(a)
October 31, 2022
| | | | | | |
| | | Shares | | Value |
Common Stocks & Other Equity Interests–37.43% |
Advertising–0.14% |
Catalina Marketing Corp. | | | 1,362 | | | $ 460 |
Interpublic Group of Cos., Inc. (The) | | | 9,527 | | | 283,809 |
Omnicom Group, Inc. | | | 3,331 | | | 242,330 |
| | | | 526,599 |
|
Aerospace & Defense–0.10% |
Raytheon Technologies Corp. | | | 4,176 | | | 395,968 |
| |
Agricultural & Farm Machinery–0.06% | | | |
Deere & Co. | | | 612 | | | 242,242 |
| | |
Agricultural Products–0.07% | | | | | | |
Archer-Daniels-Midland Co. | | | 2,940 | | | 285,121 |
| | |
Air Freight & Logistics–0.31% | | | | | | |
C.H. Robinson Worldwide, Inc. | | | 2,776 | | | 271,271 |
Expeditors International of Washington, Inc.(b) | | | 4,339 | | | 424,571 |
United Parcel Service, Inc., Class B | | | 3,012 | | | 505,323 |
| | | | 1,201,165 |
|
Alternative Carriers–0.07% |
Liberty Global PLC, Class C (United Kingdom)(c) | | | 9,783 | | | 172,768 |
Lumen Technologies, Inc. | | | 13,183 | | | 97,027 |
| | | | 269,795 |
|
Application Software–0.54% |
Adobe, Inc.(c) | | | 1,627 | | | 518,199 |
Blackbaud, Inc.(c) | | | 2,864 | | | 156,661 |
Cadence Design Systems, Inc.(c) | | | 2,034 | | | 307,927 |
Dropbox, Inc., Class A(c) | | | 5,458 | | | 118,712 |
Fusion Connect, Inc.(c)(d) | | | 1 | | | 0 |
Fusion Connect, Inc., Wts., expiring 01/14/2040(c)(d) | | | 6,073 | | | 61 |
Intuit, Inc. | | | 655 | | | 280,012 |
Manhattan Associates, Inc.(c) | | | 1,014 | | | 123,373 |
salesforce.com, inc.(b)(c) | | | 2,178 | | | 354,121 |
Synopsys, Inc.(c) | | | 491 | | | 143,642 |
Tyler Technologies, Inc.(c) | | | 247 | | | 79,863 |
| | | | 2,082,571 |
|
Asset Management & Custody Banks–0.16% |
Ameriprise Financial, Inc. | | | 835 | | | 258,115 |
Blackstone, Inc., Class A | | | 1,902 | | | 173,348 |
Federated Hermes, Inc., Class B | | | 5,165 | | | 179,484 |
| | | | 610,947 |
|
Auto Parts & Equipment–0.02% |
Gentex Corp. | | | 3,426 | | | 90,755 |
| | |
Automobile Manufacturers–0.51% | | | | | | |
Ford Motor Co. | | | 20,451 | | | 273,430 |
General Motors Co. | | | 6,025 | | | 236,481 |
Tesla, Inc.(c) | | | 6,443 | | | 1,466,040 |
| | | | 1,975,951 |
| | | | | | |
| | | Shares | | Value |
Automotive Retail–0.29% | | | | | | |
AutoNation, Inc.(c) | | | 1,850 | | | $ 196,673 |
AutoZone, Inc.(c) | | | 178 | | | 450,853 |
Murphy USA, Inc. | | | 494 | | | 155,368 |
O’Reilly Automotive, Inc.(c) | | | 365 | | | 305,567 |
| | | | 1,108,461 |
|
Biotechnology–2.19% |
AbbVie, Inc. | | | 8,782 | | | 1,285,685 |
Amgen, Inc. | | | 4,160 | | | 1,124,656 |
Biogen, Inc.(c) | | | 2,457 | | | 696,412 |
BioMarin Pharmaceutical, Inc.(c) | | | 7,048 | | | 610,568 |
Gilead Sciences, Inc. | | | 14,465 | | | 1,134,924 |
Incyte Corp.(c) | | | 3,314 | | | 246,363 |
Ionis Pharmaceuticals, Inc.(b)(c) | | | 9,775 | | | 432,055 |
Moderna, Inc.(c) | | | 936 | | | 140,709 |
Regeneron Pharmaceuticals, Inc.(c) | | | 1,394 | | | 1,043,757 |
Seagen, Inc.(c) | | | 666 | | | 84,689 |
United Therapeutics Corp.(c) | | | 3,101 | | | 714,873 |
Vertex Pharmaceuticals, Inc.(b)(c) | | | 2,989 | | | 932,568 |
| | | | 8,447,259 |
|
Broadcasting–0.14% |
Fox Corp., Class A | | | 2,958 | | | 85,397 |
Nexstar Media Group, Inc., Class A(b) | | | 2,682 | | | 459,427 |
| | | | 544,824 |
|
Building Products–0.34% |
A.O. Smith Corp. | | | 2,328 | | | 127,528 |
Builders FirstSource, Inc.(b)(c) | | | 4,640 | | | 286,102 |
Carrier Global Corp. | | | 2,397 | | | 95,305 |
Lennox International, Inc. | | | 585 | | | 136,639 |
Masco Corp. | | | 3,042 | | | 140,753 |
Owens Corning | | | 2,267 | | | 194,078 |
Trane Technologies PLC | | | 1,282 | | | 204,646 |
UFP Industries, Inc. | | | 1,841 | | | 131,134 |
| | | | 1,316,185 |
|
Cable & Satellite–0.39% |
Charter Communications, Inc.,
Class A(c) | | | 1,067 | | | 392,251 |
Comcast Corp., Class A | | | 23,031 | | | 731,004 |
Liberty Broadband Corp.,
Class C(c) | | | 1,022 | | | 86,287 |
Sirius XM Holdings, Inc.(b) | | | 49,181 | | | 297,053 |
| | | | 1,506,595 |
|
Casinos & Gaming–0.02% |
Boyd Gaming Corp. | | | 1,411 | | | 81,499 |
| | |
Commodity Chemicals–0.18% | | | | | | |
Dow, Inc. | | | 7,519 | | | 351,438 |
LyondellBasell Industries N.V., Class A | | | 2,547 | | | 194,718 |
Olin Corp. | | | 2,997 | | | 158,691 |
| | | | 704,847 |
|
Communications Equipment–0.47% |
Cisco Systems, Inc. | | | 25,403 | | | 1,154,058 |
Juniper Networks, Inc. | | | 4,521 | | | 138,343 |
Motorola Solutions, Inc. | | | 842 | | | 210,256 |
See accompanying Notes to Consolidated Financial Statements which are an integral part of the financial statements.
| | |
| 8 | | Invesco Fundamental Alternatives Fund |
| | | | | | |
| | | Shares | | Value |
Communications Equipment–(continued) |
Ubiquiti, Inc. | | | 865 | | | $ 299,939 |
| | | | | | | 1,802,596 |
|
Construction & Engineering–0.20% |
AECOM | | | 2,748 | | | 206,869 |
EMCOR Group, Inc. | | | 2,939 | | | 414,693 |
Quanta Services, Inc. | | | 970 | | | 137,779 |
| | | | | | | 759,341 |
|
Construction Machinery & Heavy Trucks–0.20% |
Allison Transmission Holdings, Inc. | | | 3,525 | | | 148,931 |
Caterpillar, Inc. | | | 1,117 | | | 241,786 |
Terex Corp. | | | 5,461 | | | 221,389 |
Wabtec Corp. | | | 1,747 | | | 162,960 |
| | | | | | | 775,066 |
| | |
Consumer Finance–0.39% | | | | | | |
Ally Financial, Inc. | | | 11,974 | | | 330,003 |
American Express Co. | | | 1,173 | | | 174,132 |
Capital One Financial Corp. | | | 2,956 | | | 313,395 |
Discover Financial Services | | | 3,123 | | | 326,229 |
SLM Corp. | | | 8,068 | | | 133,848 |
Synchrony Financial | | | 6,025 | | | 214,249 |
| | | | | | | 1,491,856 |
| | |
Copper–0.03% | | | | | | |
Freeport-McMoRan, Inc. | | | 3,460 | | | 109,647 |
|
Data Processing & Outsourced Services–1.77% |
Automatic Data Processing, Inc. | | | 5,154 | | | 1,245,722 |
Broadridge Financial Solutions, Inc. | | | 2,023 | | | 303,571 |
Fidelity National Information Services, Inc. | | | 1,451 | | | 120,418 |
Fiserv, Inc.(b)(c) | | | 3,465 | | | 355,994 |
Jack Henry & Associates, Inc. | | | 3,378 | | | 672,425 |
Mastercard, Inc., Class A | | | 2,320 | | | 761,378 |
Maximus, Inc. | | | 2,864 | | | 176,623 |
Paychex, Inc. | | | 9,576 | | | 1,132,936 |
PayPal Holdings, Inc.(c) | | | 2,051 | | | 171,423 |
SS&C Technologies Holdings, Inc. | | | 3,882 | | | 199,612 |
Visa, Inc., Class A(b) | | | 6,635 | | | 1,374,507 |
Western Union Co. (The)(b) | | | 24,325 | | | 328,631 |
| | | | | | | 6,843,240 |
| | |
Distillers & Vintners–0.06% | | | | | | |
Constellation Brands, Inc., Class A | | | 935 | | | 231,020 |
| | |
Distributors–0.15% | | | | | | |
Genuine Parts Co. | | | 1,671 | | | 297,204 |
LKQ Corp. | | | 4,797 | | | 266,905 |
| | | | | | | 564,109 |
| | |
Diversified Banks–0.47% | | | | | | |
Bank of America Corp. | | | 9,758 | | | 351,678 |
Citigroup, Inc. | | | 6,606 | | | 302,951 |
JPMorgan Chase & Co. | | | 3,039 | | | 382,549 |
U.S. Bancorp | | | 5,906 | | | 250,710 |
Wells Fargo & Co. | | | 11,345 | | | 521,757 |
| | | | | | | 1,809,645 |
|
Diversified Support Services–0.06% |
Cintas Corp. | | | 566 | | | 241,993 |
| | | | | | |
| | | Shares | | Value |
Drug Retail–0.03% | | | | | | |
Walgreens Boots Alliance, Inc. | | | 3,433 | | | $ 125,305 |
| | |
Electric Utilities–1.25% | | | | | | |
American Electric Power Co., Inc. | | | 8,411 | | | 739,495 |
Constellation Energy Corp. | | | 2,466 | | | 233,136 |
Duke Energy Corp. | | | 9,187 | | | 856,045 |
Edison International | | | 2,804 | | | 168,352 |
Eversource Energy | | | 1,963 | | | 149,738 |
Exelon Corp. | | | 8,800 | | | 339,592 |
NextEra Energy, Inc. | | | 6,979 | | | 540,872 |
NRG Energy, Inc. | | | 3,496 | | | 155,222 |
Pinnacle West Capital Corp. | | | 3,981 | | | 267,563 |
PPL Corp. | | | 11,693 | | | 309,748 |
Southern Co. (The) | | | 10,857 | | | 710,916 |
Xcel Energy, Inc. | | | 5,505 | | | 358,431 |
| | | | | | | 4,829,110 |
|
Electrical Components & Equipment–0.03% |
Eaton Corp. PLC | | | 739 | | | 110,902 |
|
Electronic Equipment & Instruments–0.07% |
Keysight Technologies, Inc.(c) | | | 1,488 | | | 259,135 |
|
Environmental & Facilities Services–0.34% |
Republic Services, Inc. | | | 7,084 | | | 939,480 |
Waste Connections, Inc. | | | 1,582 | | | 208,682 |
Waste Management, Inc. | | | 1,073 | | | 169,931 |
| | | | | | | 1,318,093 |
|
Fertilizers & Agricultural Chemicals–0.15% |
CF Industries Holdings, Inc. | | | 2,180 | | | 231,647 |
Corteva, Inc. | | | 3,154 | | | 206,082 |
Mosaic Co. (The) | | | 2,336 | | | 125,560 |
| | | | | | | 563,289 |
|
Financial Exchanges & Data–0.29% |
CME Group, Inc., Class A | | | 1,890 | | | 327,537 |
FactSet Research Systems, Inc. | | | 562 | | | 239,125 |
Intercontinental Exchange, Inc. | | | 1,422 | | | 135,901 |
S&P Global, Inc. | | | 1,339 | | | 430,154 |
| | | | | | | 1,132,717 |
| | |
Food Retail–0.32% | | | | | | |
Casey’s General Stores, Inc. | | | 1,476 | | | 343,480 |
Kroger Co. (The) | | | 18,698 | | | 884,228 |
| | | | | | | 1,227,708 |
| | |
Forest Products–0.06% | | | | | | |
Louisiana-Pacific Corp.(b) | | | 4,288 | | | 242,915 |
| | |
Gas Utilities–0.17% | | | | | | |
Atmos Energy Corp. | | | 4,892 | | | 521,242 |
ONE Gas, Inc. | | | 1,970 | | | 152,636 |
| | | | | | | 673,878 |
|
General Merchandise Stores–0.20% |
Dollar General Corp. | | | 2,060 | | | 525,403 |
Target Corp. | | | 1,517 | | | 249,167 |
| | | | | | | 774,570 |
| | |
Gold–0.12% | | | | | | |
Newmont Corp. | | | 10,769 | | | 455,744 |
See accompanying Notes to Consolidated Financial Statements which are an integral part of the financial statements.
| | |
| 9 | | Invesco Fundamental Alternatives Fund |
| | | | | | |
| | | Shares | | Value |
Health Care Distributors–0.29% | | | | | | |
AmerisourceBergen Corp. | | | 1,729 | | | $ 271,834 |
Cardinal Health, Inc. | | | 1,661 | | | 126,070 |
McKesson Corp.(b) | | | 1,871 | | | 728,511 |
| | | | | | | 1,126,415 |
| | |
Health Care Equipment–0.52% | | | | | | |
Abbott Laboratories | | | 8,689 | | | 859,690 |
Becton, Dickinson and Co. | | | 2,685 | | | 633,579 |
Hologic, Inc.(c) | | | 3,549 | | | 240,622 |
Medtronic PLC | | | 3,061 | | | 267,348 |
| | | | | | | 2,001,239 |
| | |
Health Care Facilities–0.13% | | | | | | |
Acadia Healthcare Co., Inc.(c) | | | 1,697 | | | 137,966 |
HCA Healthcare, Inc. | | | 1,612 | | | 350,562 |
| | | | | | | 488,528 |
| | |
Health Care Services–0.45% | | | | | | |
Cigna Corp. | | | 2,125 | | | 686,502 |
CVS Health Corp. | | | 5,815 | | | 550,681 |
DaVita, Inc.(c) | | | 878 | | | 64,103 |
Laboratory Corp. of America Holdings | | | 1,163 | | | 258,023 |
Quest Diagnostics, Inc. | | | 1,312 | | | 188,469 |
| | | | | | | 1,747,778 |
| | |
Home Improvement Retail–0.16% | | | | | | |
Home Depot, Inc. (The) | | | 1,439 | | | 426,131 |
Lowe’s Cos., Inc. | | | 921 | | | 179,549 |
| | | | | | | 605,680 |
| | |
Homebuilding–0.06% | | | | | | |
Lennar Corp., Class A | | | 1,134 | | | 91,514 |
Taylor Morrison Home Corp.,
Class A(c) | | | 5,860 | | | 154,352 |
| | | | | | | 245,866 |
| | |
Homefurnishing Retail–0.02% | | | | | | |
Williams-Sonoma, Inc. | | | 596 | | | 73,803 |
| | |
Hotel & Resort REITs–0.06% | | | | | | |
Host Hotels & Resorts, Inc. | | | 11,438 | | | 215,949 |
|
Hotels, Resorts & Cruise Lines–0.11% |
Booking Holdings, Inc.(c) | | | 103 | | | 192,557 |
Marriott International, Inc., Class A | | | 583 | | | 93,344 |
Wyndham Hotels & Resorts, Inc. | | | 1,897 | | | 144,039 |
| | | | | | | 429,940 |
| | |
Household Products–0.91% | | | | | | |
Church & Dwight Co., Inc. | | | 6,332 | | | 469,391 |
Clorox Co. (The) | | | 582 | | | 84,995 |
Colgate-Palmolive Co. | | | 8,828 | | | 651,860 |
Kimberly-Clark Corp. | | | 3,640 | | | 453,035 |
Procter & Gamble Co. (The) | | | 13,930 | | | 1,875,953 |
| | | | | | | 3,535,234 |
|
Human Resource & Employment Services–0.14% |
ManpowerGroup, Inc. | | | 2,386 | | | 186,919 |
Robert Half International, Inc. | | | 3,238 | | | 247,577 |
TriNet Group, Inc.(c) | | | 1,770 | | | 115,015 |
| | | | | | | 549,511 |
| | | | | | |
| | | Shares | | Value |
Hypermarkets & Super Centers–0.42% |
Costco Wholesale Corp. | | | 1,893 | | | $ 949,339 |
Walmart, Inc. | | | 4,850 | | | 690,301 |
| | | | | | | 1,639,640 |
|
Independent Power Producers & Energy Traders–0.05% |
AES Corp. (The) | | | 7,278 | | | 190,393 |
| | |
Industrial Conglomerates–0.06% | | | | | | |
3M Co. | | | 1,016 | | | 127,803 |
General Electric Co. | | | 1,282 | | | 99,752 |
| | | | | | | 227,555 |
| | |
Industrial REITs–0.15% | | | | | | |
EastGroup Properties, Inc. | | | 1,192 | | | 186,774 |
Prologis, Inc. | | | 3,458 | | | 382,974 |
| | | | | | | 569,748 |
| | |
Insurance Brokers–0.13% | | | | | | |
Aon PLC, Class A | | | 813 | | | 228,851 |
Marsh & McLennan Cos., Inc. | | | 1,683 | | | 271,788 |
| | | | | | | 500,639 |
| | |
Integrated Oil & Gas–0.64% | | | | | | |
Chevron Corp. | | | 7,284 | | | 1,317,676 |
Exxon Mobil Corp. | | | 8,926 | | | 989,090 |
Occidental Petroleum Corp. | | | 2,059 | | | 149,483 |
| | | | | | | 2,456,249 |
|
Integrated Telecommunication Services–0.34% |
AT&T, Inc. | | | 38,117 | | | 694,873 |
Verizon Communications, Inc. | | | 16,338 | | | 610,551 |
| | | | | | | 1,305,424 |
|
Interactive Home Entertainment–0.30% |
Activision Blizzard, Inc. | | | 3,304 | | | 240,531 |
Electronic Arts, Inc. | | | 6,284 | | | 791,533 |
Take-Two Interactive Software, Inc.(c) | | | 1,185 | | | 140,399 |
| | | | | | | 1,172,463 |
|
Interactive Media & Services–1.02% |
Alphabet, Inc., Class A(c) | | | 25,274 | | | 2,388,646 |
Alphabet, Inc., Class C(c) | | | 9,839 | | | 931,360 |
Meta Platforms, Inc., Class A(c) | | | 6,621 | | | 616,812 |
| | | | | | | 3,936,818 |
|
Internet & Direct Marketing Retail–0.79% |
Amazon.com, Inc.(c) | | | 22,860 | | | 2,341,778 |
eBay, Inc. | | | 10,297 | | | 410,233 |
Etsy, Inc.(c) | | | 1,556 | | | 146,124 |
MercadoLibre, Inc. (Brazil)(c) | | | 156 | | | 140,653 |
| | | | | | | 3,038,788 |
|
Internet Services & Infrastructure–0.23% |
Akamai Technologies, Inc.(c) | | | 3,314 | | | 292,725 |
VeriSign, Inc.(c) | | | 3,058 | | | 613,007 |
| | | | | | | 905,732 |
|
Investment Banking & Brokerage–0.16% |
Charles Schwab Corp. (The) | | | 4,116 | | | 327,922 |
Goldman Sachs Group, Inc. (The) | | | 370 | | | 127,469 |
See accompanying Notes to Consolidated Financial Statements which are an integral part of the financial statements.
| | |
| 10 | | Invesco Fundamental Alternatives Fund |
| | | | | | |
| | | Shares | | Value |
Investment Banking & Brokerage–(continued) |
Morgan Stanley | | | 1,986 | | | $ 163,189 |
| | | | 618,580 |
|
IT Consulting & Other Services–1.01% |
Accenture PLC, Class A | | | 4,661 | | | 1,323,258 |
Amdocs Ltd. | | | 7,397 | | | 638,435 |
Cognizant Technology Solutions Corp., Class A | | | 9,434 | | | 587,266 |
Gartner, Inc.(c) | | | 1,992 | | | 601,425 |
International Business Machines Corp. | | | 5,518 | | | 763,084 |
| | | | 3,913,468 |
|
Life & Health Insurance–0.34% |
Aflac, Inc. | | | 3,519 | | | 229,122 |
Brighthouse Financial, Inc.(c) | | | 3,302 | | | 188,445 |
MetLife, Inc. | | | 1,756 | | | 128,557 |
Principal Financial Group, Inc. | | | 2,688 | | | 236,893 |
Unum Group | | | 11,294 | | | 514,894 |
| | | | 1,297,911 |
|
Life Sciences Tools & Services–0.71% |
Agilent Technologies, Inc. | | | 2,075 | | | 287,076 |
Danaher Corp. | | | 3,666 | | | 922,622 |
IQVIA Holdings, Inc.(c) | | | 744 | | | 155,995 |
Mettler-Toledo International, Inc.(c) | | | 161 | | | 203,654 |
PerkinElmer, Inc. | | | 711 | | | 94,975 |
Thermo Fisher Scientific, Inc.(b) | | | 1,196 | | | 614,708 |
Waters Corp.(c) | | | 1,278 | | | 382,339 |
West Pharmaceutical Services, Inc. | | | 317 | | | 72,942 |
| | | | 2,734,311 |
|
Managed Health Care–0.64% |
Centene Corp.(c) | | | 2,934 | | | 249,771 |
Elevance Health, Inc. | | | 966 | | | 528,180 |
Humana, Inc. | | | 275 | | | 153,472 |
Molina Healthcare, Inc.(c) | | | 805 | | | 288,882 |
UnitedHealth Group, Inc. | | | 2,265 | | | 1,257,415 |
| | | | 2,477,720 |
|
Marine–0.00% |
Harvey Gulf International Marine LLC(d) | | | 731 | | | 16,448 |
| | |
Movies & Entertainment–0.31% | | | | | | |
Liberty Media Corp.-Liberty Formula One, Class C(b)(c) | | | 5,217 | | | 301,177 |
Netflix, Inc.(c) | | | 787 | | | 229,710 |
Walt Disney Co. (The)(c) | | | 1,574 | | | 167,694 |
Warner Bros Discovery, Inc.(c) | | | 9,221 | | | 119,873 |
World Wrestling Entertainment, Inc., Class A(b) | | | 4,950 | | | 390,505 |
| | | | 1,208,959 |
|
Multi-Sector Holdings–0.59% |
Berkshire Hathaway, Inc., Class B(c) | | | 7,738 | | | 2,283,406 |
| | |
Multi-Utilities–0.75% | | | | | | |
Ameren Corp. | | | 3,281 | | | 267,467 |
CMS Energy Corp. | | | 3,699 | | | 211,028 |
Consolidated Edison, Inc. | | | 9,187 | | | 808,089 |
Dominion Energy, Inc. | | | 9,783 | | | 684,517 |
DTE Energy Co. | | | 2,702 | | | 302,921 |
| | | | | | |
| | | Shares | | Value |
Multi-Utilities–(continued) | | | | | | |
Public Service Enterprise Group, Inc. | | | 2,804 | | | $ 157,220 |
Sempra Energy | | | 1,312 | | | 198,033 |
WEC Energy Group, Inc. | | | 2,923 | | | 266,958 |
| | | | 2,896,233 |
|
Oil & Gas Equipment & Services–0.06% |
Halliburton Co. | | | 6,597 | | | 240,263 |
|
Oil & Gas Exploration & Production–0.27% |
ConocoPhillips | | | 4,339 | | | 547,105 |
Devon Energy Corp. | | | 3,088 | | | 238,857 |
EOG Resources, Inc. | | | 637 | | | 86,963 |
Marathon Oil Corp. | | | 5,842 | | | 177,889 |
Sabine Oil & Gas Holdings, Inc.(c)(d) | | | 115 | | | 78 |
| | | | 1,050,892 |
|
Oil & Gas Refining & Marketing–0.26% |
Marathon Petroleum Corp. | | | 5,105 | | | 580,030 |
Valero Energy Corp. | | | 3,422 | | | 429,632 |
| | | | 1,009,662 |
|
Oil & Gas Storage & Transportation–0.29% |
Kinder Morgan, Inc. | | | 31,455 | | | 569,965 |
Southcross Energy Partners L.P.(d) | | | 17,192 | | | 129 |
Targa Resources Corp. | | | 4,538 | | | 310,263 |
Williams Cos., Inc. (The) | | | 7,696 | | | 251,890 |
| | | | 1,132,247 |
|
Packaged Foods & Meats–1.30% |
Campbell Soup Co. | | | 12,245 | | | 647,883 |
Flowers Foods, Inc. | | | 7,278 | | | 208,951 |
General Mills, Inc. | | | 9,350 | | | 762,773 |
Hershey Co. (The)(b) | | | 4,986 | | | 1,190,507 |
Hormel Foods Corp. | | | 2,977 | | | 138,282 |
JM Smucker Co. (The) | | | 900 | | | 135,594 |
Kellogg Co. | | | 6,526 | | | 501,327 |
Kraft Heinz Co. (The) | | | 9,150 | | | 352,001 |
Mondelez International, Inc., Class A | | | 11,036 | | | 678,493 |
Tyson Foods, Inc., Class A | | | 6,202 | | | 423,907 |
| | | | 5,039,718 |
|
Personal Products–0.03% |
Coty, Inc., Class A(c) | | | 19,907 | | | 133,576 |
| | |
Pharmaceuticals–1.91% | | | | | | |
Bristol-Myers Squibb Co. | | | 15,099 | | | 1,169,720 |
Eli Lilly and Co.(b) | | | 3,166 | | | 1,146,377 |
Johnson & Johnson | | | 9,273 | | | 1,613,224 |
Merck & Co., Inc. | | | 14,777 | | | 1,495,432 |
Pfizer, Inc. | | | 31,828 | | | 1,481,593 |
Royalty Pharma PLC, Class A | | | 3,422 | | | 144,819 |
Viatris, Inc. | | | 17,522 | | | 177,498 |
Zoetis, Inc. | | | 909 | | | 137,059 |
| | | | 7,365,722 |
|
Property & Casualty Insurance–0.49% |
American Financial Group, Inc. | | | 2,930 | | | 425,172 |
Chubb Ltd. | | | 1,697 | | | 364,668 |
Fidelity National Financial, Inc. | | | 4,967 | | | 195,601 |
Old Republic International Corp.(b) | | | 16,790 | | | 389,696 |
Progressive Corp. (The) | | | 2,759 | | | 354,256 |
See accompanying Notes to Consolidated Financial Statements which are an integral part of the financial statements.
| | |
| 11 | | Invesco Fundamental Alternatives Fund |
| | | | | | |
| | | Shares | | Value |
Property & Casualty Insurance–(continued) |
W.R. Berkley Corp. | | | 2,376 | | | $ 176,727 |
| | | | 1,906,120 |
|
Publishing–0.13% |
John Wiley & Sons, Inc., Class A | | | 3,042 | | | 128,342 |
New York Times Co. (The), Class A | | | 12,288 | | | 355,860 |
| | | | 484,202 |
|
Railroads–0.23% |
CSX Corp. | | | 6,264 | | | 182,032 |
Union Pacific Corp. | | | 3,519 | | | 693,736 |
| | | | 875,768 |
|
Real Estate Services–0.04% |
CBRE Group, Inc., Class A(c) | | | 1,910 | | | 135,495 |
| | |
Regional Banks–0.25% | | | | | | |
Fifth Third Bancorp | | | 6,979 | | | 249,080 |
Regions Financial Corp. | | | 10,439 | | | 229,136 |
Synovus Financial Corp. | | | 4,236 | | | 168,805 |
Wintrust Financial Corp. | | | 3,331 | | | 311,848 |
| | | | 958,869 |
|
Research & Consulting Services–0.17% |
Booz Allen Hamilton Holding Corp. | | | 4,735 | | | 515,405 |
Verisk Analytics, Inc. | | | 826 | | | 151,017 |
| | | | 666,422 |
|
Residential REITs–0.11% |
Essex Property Trust, Inc. | | | 986 | | | 219,129 |
Mid-America Apartment Communities, Inc. | | | 1,431 | | | 225,311 |
| | | | 444,440 |
|
Restaurants–0.59% |
Chipotle Mexican Grill, Inc.(c) | | | 76 | | | 113,873 |
Domino’s Pizza, Inc. | | | 963 | | | 319,947 |
McDonald’s Corp. | | | 5,011 | | | 1,366,300 |
Starbucks Corp. | | | 1,846 | | | 159,845 |
Yum! Brands, Inc. | | | 2,864 | | | 338,668 |
| | | | 2,298,633 |
|
Retail REITs–0.04% |
Regency Centers Corp. | | | 2,533 | | | 153,272 |
|
Semiconductor Equipment–0.26% |
Amkor Technology, Inc. | | | 7,641 | | | 158,856 |
Applied Materials, Inc. | | | 5,263 | | | 464,670 |
KLA Corp. | | | 811 | | | 256,641 |
Lam Research Corp. | | | 298 | | | 120,625 |
| | | | 1,000,792 |
|
Semiconductors–0.98% |
Advanced Micro Devices, Inc.(c) | | | 2,947 | | | 176,997 |
Broadcom, Inc. | | | 1,564 | | | 735,268 |
Intel Corp. | | | 8,798 | | | 250,127 |
Microchip Technology, Inc.(b) | | | 4,536 | | | 280,053 |
Micron Technology, Inc. | | | 1,790 | | | 96,839 |
NVIDIA Corp. | | | 4,272 | | | 576,592 |
NXP Semiconductors N.V. (China) | | | 924 | | | 134,978 |
ON Semiconductor Corp.(b)(c) | | | 4,978 | | | 305,798 |
QUALCOMM, Inc. | | | 3,460 | | | 407,103 |
| | | | | | |
| | | Shares | | Value |
Semiconductors–(continued) | | | | | | |
Texas Instruments, Inc. | | | 5,101 | | | $ 819,374 |
| | | | 3,783,129 |
|
Soft Drinks–0.70% |
Coca-Cola Co. (The) | | | 18,908 | | | 1,131,644 |
Keurig Dr Pepper, Inc. | | | 8,233 | | | 319,770 |
PepsiCo, Inc. | | | 6,907 | | | 1,254,173 |
| | | | 2,705,587 |
|
Specialized Consumer Services–0.05% |
Service Corp. International | | | 3,423 | | | 207,468 |
| | |
Specialized REITs–0.49% | | | | | | |
EPR Properties | | | 4,246 | | | 163,896 |
Extra Space Storage, Inc. | | | 3,328 | | | 590,520 |
Life Storage, Inc. | | | 1,330 | | | 147,111 |
Public Storage(b) | | | 1,604 | | | 496,839 |
SBA Communications Corp., Class A | | | 476 | | | 128,473 |
Weyerhaeuser Co. | | | 11,600 | | | 358,788 |
| | | | 1,885,627 |
|
Specialty Chemicals–0.20% |
Celanese Corp. | | | 895 | | | 86,027 |
DuPont de Nemours, Inc. | | | 4,187 | | | 239,497 |
Eastman Chemical Co. | | | 2,148 | | | 164,988 |
Sherwin-Williams Co. (The) | | | 1,262 | | | 283,988 |
| | | | 774,500 |
|
Specialty Stores–0.04% |
Ulta Beauty, Inc.(c) | | | 360 | | | 150,973 |
| | |
Systems Software–1.82% | | | | | | |
CommVault Systems, Inc.(c) | | | 2,068 | | | 125,920 |
Dolby Laboratories, Inc., Class A | | | 6,294 | | | 420,691 |
Fortinet, Inc.(c) | | | 4,023 | | | 229,955 |
Microsoft Corp. | | | 21,314 | | | 4,947,619 |
Oracle Corp. | | | 10,829 | | | 845,420 |
Palo Alto Networks, Inc.(c) | | | 537 | | | 92,144 |
Qualys, Inc.(c) | | | 1,177 | | | 167,793 |
Teradata Corp.(c) | | | 6,175 | | | 195,068 |
| | | | 7,024,610 |
|
Technology Distributors–0.04% |
Arrow Electronics, Inc.(c) | | | 1,544 | | | 156,345 |
|
Technology Hardware, Storage & Peripherals–1.77% |
Apple, Inc. | | | 40,427 | | | 6,199,076 |
Hewlett Packard Enterprise Co. | | | 10,707 | | | 152,789 |
HP, Inc. | | | 12,345 | | | 340,969 |
Pure Storage, Inc., Class A(b)(c) | | | 5,147 | | | 158,836 |
| | | | 6,851,670 |
|
Textiles–0.00% |
Sungard Availability Services Capital, Inc.(d) | | | 225 | | | 29 |
|
Thrifts & Mortgage Finance–0.08% |
Essent Group Ltd. | | | 7,649 | | | 302,747 |
| | |
Tobacco–0.38% | | | | | | |
Altria Group, Inc. | | | 12,982 | | | 600,677 |
Philip Morris International, Inc. | | | 9,287 | | | 853,011 |
| | | | 1,453,688 |
See accompanying Notes to Consolidated Financial Statements which are an integral part of the financial statements.
| | |
| 12 | | Invesco Fundamental Alternatives Fund |
| | | | | | |
| | | Shares | | Value |
Trading Companies & Distributors–0.13% |
United Rentals, Inc.(c) | | | 680 | | | $ 214,683 |
Univar Solutions, Inc.(c) | | | 6,777 | | | 172,678 |
Watsco, Inc. | | | 376 | | | 101,881 |
| | | | | | | 489,242 |
| |
Trucking–0.43% | | | |
Knight-Swift Transportation Holdings, Inc.(b) | | | 12,822 | | | 615,841 |
Landstar System, Inc. | | | 2,804 | | | 438,041 |
Old Dominion Freight Line, Inc. | | | 457 | | | 125,492 |
Ryder System, Inc. | | | 2,804 | | | 225,750 |
Werner Enterprises, Inc. | | | 6,898 | | | 270,401 |
| | | | | | | 1,675,525 |
| |
Water Utilities–0.04% | | | |
American Water Works Co., Inc. | | | 1,195 | | | 173,681 |
Total Common Stocks & Other Equity Interests (Cost $118,981,497) | | | 144,674,005 |
| | |
| | | Principal
Amount | | |
U.S. Treasury Securities–13.80% | | | |
U.S. Treasury Bills–0.13% | | | | | | |
1.45% - 2.67%, 11/17/2022(e) | | $ | 494,000 | | | 493,671 |
U.S. Treasury Notes–13.67% | | | | | | |
0.13%, 12/15/2023 | | | 25,200,000 | | | 23,978,390 |
1.13%, 01/15/2025 | | | 10,000,000 | | | 9,298,047 |
0.38%, 12/31/2025 | | | 8,500,000 | | | 7,499,258 |
2.63%, 05/31/2027 | | | 12,950,000 | | | 12,072,840 |
| | | | | | | 52,848,535 |
Total U.S. Treasury Securities
(Cost $56,535,791) | | | 53,342,206 |
|
U.S. Dollar Denominated Bonds & Notes–7.48% |
Aerospace & Defense–0.14% |
Boeing Co. (The), | | | | | | |
2.75%, 02/01/2026 | | | 177,000 | | | 159,758 |
2.25%, 06/15/2026 | | | 200,000 | | | 175,205 |
General Dynamics Corp., 3.25%, 04/01/2025 | | | 200,000 | | | 192,261 |
| | | | | | | 527,224 |
| |
Agricultural & Farm Machinery–0.08% | | | |
Deere & Co., 2.75%, 04/15/2025 | | | 310,000 | | | 295,138 |
|
Airlines–0.14% |
Delta Air Lines Pass-Through Trust, Series 2019-1, Class AA, 3.20%, 04/25/2024 | | | 400,000 | | | 383,799 |
Southwest Airlines Co., 3.45%, 11/16/2027 | | | 165,000 | | | 148,229 |
| | | | | | | 532,028 |
| |
Apparel Retail–0.02% | | | |
Ross Stores, Inc., 0.88%, 04/15/2026 | | | 100,000 | | | 86,079 |
|
Apparel, Accessories & Luxury Goods–0.02% |
Tapestry, Inc., 4.13%, 07/15/2027 | | | 65,000 | | | 58,854 |
| | |
Application Software–0.08% | | | | | | |
Adobe, Inc., 3.25%, 02/01/2025 | | | 300,000 | | | 290,258 |
| | | | | | |
| | | Principal
Amount | | Value |
Asset Management & Custody Banks–0.24% |
FS KKR Capital Corp., 4.63%, 07/15/2024 | | $ | 242,000 | | | $ 232,460 |
Golub Capital BDC, Inc., 3.38%, 04/15/2024 | | | 200,000 | | | 190,427 |
Legg Mason, Inc., 4.75%, 03/15/2026 | | | 90,000 | | | 88,512 |
Main Street Capital Corp., 5.20%, 05/01/2024 | | | 200,000 | | | 195,148 |
Owl Rock Capital Corp., 5.25%, 04/15/2024 | | | 223,000 | | | 218,814 |
| | | | | | | 925,361 |
| |
Auto Parts & Equipment–0.05% | | | |
American Honda Finance Corp., 2.35%, 01/08/2027 | | | 225,000 | | | 200,188 |
|
Automobile Manufacturers–0.20% |
General Motors Co., | | | | | | |
6.13%, 10/01/2025 | | | 75,000 | | | 74,736 |
4.20%, 10/01/2027 | | | 80,000 | | | 73,083 |
General Motors Financial Co., Inc., | | | | | | |
2.75%, 06/20/2025 | | | 300,000 | | | 276,211 |
5.25%, 03/01/2026 | | | 50,000 | | | 48,489 |
Toyota Motor Credit Corp., | | | | | | |
3.20%, 01/11/2027 | | | 130,000 | | | 120,335 |
1.15%, 08/13/2027 | | | 200,000 | | | 166,258 |
| | | | | | | 759,112 |
| |
Broadcasting–0.04% | | | |
Discovery Communications LLC, 3.80%, 03/13/2024 | | | 150,000 | | | 145,759 |
| | |
Cable & Satellite–0.04% | | | | | | |
Charter Communications Operating LLC/Charter Communications Operating Capital Corp., 4.91%, 07/23/2025 | | | 150,000 | | | 145,717 |
|
Computer & Electronics Retail–0.04% |
Dell International LLC/EMC Corp., 6.02%, 06/15/2026 | | | 170,000 | | | 169,825 |
|
Construction Machinery & Heavy Trucks–0.08% |
Caterpillar Financial Services Corp., 1.10%, 09/14/2027 | | | 175,000 | | | 146,015 |
Wabtec Corp., 3.45%, 11/15/2026 | | | 200,000 | | | 180,085 |
| | | | | | | 326,100 |
| |
Consumer Finance–0.06% | | | |
American Express Co., 3.30%, 05/03/2027 | | | 170,000 | | | 154,106 |
Synchrony Financial, 3.95%, 12/01/2027 | | | 100,000 | | | 86,076 |
| | | | | | �� | 240,182 |
| |
Copper–0.02% | | | |
Freeport-McMoRan, Inc., 5.00%, 09/01/2027 | | | 100,000 | | | 95,403 |
|
Data Processing & Outsourced Services–0.13% |
Automatic Data Processing, Inc., 3.38%, 09/15/2025(b) | | | 305,000 | | | 293,814 |
Global Payments, Inc., 2.15%, 01/15/2027 | | | 145,000 | | | 123,875 |
See accompanying Notes to Consolidated Financial Statements which are an integral part of the financial statements.
| | |
| 13 | | Invesco Fundamental Alternatives Fund |
| | | | | | |
| | | Principal
Amount | | Value |
Data Processing & Outsourced Services–(continued) |
Western Union Co. (The), 1.35%, 03/15/2026 | | $ | 100,000 | | | $ 85,679 |
| | | | | | | 503,368 |
| |
Distillers & Vintners–0.04% | | | |
Constellation Brands, Inc., 3.70%, 12/06/2026 | | | 175,000 | | | 163,385 |
| | |
Diversified Banks–2.19% | | | | | | |
Banco Santander S.A. (Spain), | | | | | | |
2.75%, 05/28/2025 | | | 400,000 | | | 363,058 |
4.25%, 04/11/2027 | | | 200,000 | | | 180,708 |
Bank of America Corp., | | | | | | |
4.45%, 03/03/2026 | | | 269,000 | | | 258,237 |
3.50%, 04/19/2026 | | | 185,000 | | | 172,871 |
1.32%, 06/19/2026(f) | | | 195,000 | | | 172,283 |
1.20%, 10/24/2026(f) | | | 205,000 | | | 178,040 |
1.73%, 07/22/2027(f) | | | 180,000 | | | 154,039 |
Series L, 4.18%, 11/25/2027 | | | 210,000 | | | 192,533 |
Barclays PLC (United Kingdom), 4.38%, 09/11/2024 | | | 494,000 | | | 469,620 |
Canadian Imperial Bank of Commerce (Canada), 2.25%, 01/28/2025(b) | | | 402,000 | | | 374,627 |
Citigroup, Inc., | | | | | | |
3.11%, 04/08/2026(f) | | | 297,000 | | | 277,390 |
1.12%, 01/28/2027(f) | | | 185,000 | | | 157,415 |
1.46%, 06/09/2027(f) | | | 210,000 | | | 178,020 |
4.45%, 09/29/2027 | | | 100,000 | | | 92,904 |
HSBC Holdings PLC (United Kingdom), | | | | | | |
1.59%, 05/24/2027(f) | | | 200,000 | | | 164,471 |
2.25%, 11/22/2027(f) | | | 375,000 | | | 308,563 |
JPMorgan Chase & Co., | | | | | | |
2.30%, 10/15/2025(f) | | | 425,000 | | | 396,588 |
2.01%, 03/13/2026(f) | | | 200,000 | | | 182,466 |
2.08%, 04/22/2026(f) | | | 200,000 | | | 182,171 |
4.25%, 10/01/2027 | | | 100,000 | | | 94,005 |
3.63%, 12/01/2027 | | | 165,000 | | | 149,205 |
Lloyds Banking Group PLC (United Kingdom), | | | | | | |
3.90%, 03/12/2024 | | | 278,000 | | | 270,826 |
4.45%, 05/08/2025 | | | 305,000 | | | 292,507 |
Mitsubishi UFJ Financial Group, Inc. (Japan), | | | | | | |
0.96%, 10/11/2025(f) | | | 311,000 | | | 282,858 |
3.68%, 02/22/2027 | | | 165,000 | | | 151,544 |
3.29%, 07/25/2027 | | | 75,000 | | | 67,234 |
NatWest Group PLC (United Kingdom), 5.13%, 05/28/2024 | | | 554,000 | | | 540,251 |
PNC Bank N.A., 4.20%, 11/01/2025 | | | 380,000 | | | 366,672 |
Royal Bank of Canada (Canada), 4.65%, 01/27/2026 | | | 180,000 | | | 173,850 |
Sumitomo Mitsui Financial Group, Inc. (Japan), | | | | | | |
2.35%, 01/15/2025(b) | | | 397,000 | | | 369,752 |
2.63%, 07/14/2026 | | | 100,000 | | | 89,661 |
3.45%, 01/11/2027 | | | 60,000 | | | 54,757 |
U.S. Bancorp, 1.45%, 05/12/2025 | | | 148,000 | | | 135,323 |
Wells Fargo & Co., | | | | | | |
2.19%, 04/30/2026(f) | | | 190,000 | | | 173,002 |
4.30%, 07/22/2027 | | | 175,000 | | | 163,812 |
| | | | | | |
| | | Principal
Amount | | Value |
Diversified Banks–(continued) | | | | | | |
Westpac Banking Corp. (Australia), | | | | | | |
3.30%, 02/26/2024(b) | | $ | 502,000 | | | $ 492,655 |
3.35%, 03/08/2027 | | | 165,000 | | | 152,827 |
| | | | | | | 8,476,745 |
|
Diversified Capital Markets–0.15% |
Deutsche Bank AG (Germany), | | | | | | |
3.70%, 05/30/2024 | | | 298,000 | | | 285,280 |
3.70%, 05/30/2024 | | | 303,000 | | | 292,777 |
| | | | | | | 578,057 |
| | |
Diversified REITs–0.08% | | | | | | |
GLP Capital L.P./GLP Financing II, Inc., 3.35%, 09/01/2024 | | | 327,000 | | | 306,722 |
| | |
Drug Retail–0.02% | | | | | | |
Walgreens Boots Alliance, Inc., 3.45%, 06/01/2026 | | | 100,000 | | | 93,698 |
| | |
Electric Utilities–0.12% | | | | | | |
Berkshire Hathaway Energy Co., 3.50%, 02/01/2025 | | | 190,000 | | | 184,134 |
Edison International, 5.75%, 06/15/2027 | | | 125,000 | | | 122,004 |
Pacific Gas and Electric Co., | | | | | | |
2.10%, 08/01/2027 | | | 75,000 | | | 61,725 |
3.30%, 12/01/2027 | | | 125,000 | | | 106,110 |
| | | | | | | 473,973 |
|
Electrical Components & Equipment–0.02% |
Emerson Electric Co., 1.80%, 10/15/2027 | | | 100,000 | | | 85,723 |
|
Electronic Equipment & Instruments–0.02% |
Vontier Corp., 1.80%, 04/01/2026 | | | 100,000 | | | 83,000 |
|
Electronic Manufacturing Services–0.02% |
Tyco Electronics Group S.A. (Switzerland), 3.13%, 08/15/2027 | | | 100,000 | | | 91,064 |
|
Financial Exchanges & Data–0.06% |
Cboe Global Markets, Inc., 3.65%, 01/12/2027 | | | 80,000 | | | 74,957 |
Intercontinental Exchange, Inc., 3.10%, 09/15/2027 | | | 100,000 | | | 90,750 |
S&P Global, Inc., 2.45%, 03/01/2027(g) | | | 85,000 | | | 76,223 |
| | | | | | | 241,930 |
| | |
Health Care Facilities–0.21% | | | | | | |
CommonSpirit Health, 1.55%, 10/01/2025 | | | 96,000 | | | 85,393 |
HCA, Inc., 5.00%, 03/15/2024 | | | 555,000 | | | 550,375 |
Universal Health Services, Inc., 1.65%, 09/01/2026(g) | | | 200,000 | | | 167,766 |
| | | | | | | 803,534 |
| | |
Health Care REITs–0.04% | | | | | | |
Omega Healthcare Investors, Inc., 5.25%, 01/15/2026 | | | 179,000 | | | 171,655 |
| | |
Health Care Services–0.07% | | | | | | |
Sutter Health, Series 20A, 1.32%, 08/15/2025 | | | 299,000 | | | 268,091 |
See accompanying Notes to Consolidated Financial Statements which are an integral part of the financial statements.
| | |
| 14 | | Invesco Fundamental Alternatives Fund |
| | | | | | |
| | | Principal
Amount | | Value |
Home Improvement Retail–0.04% | | | |
Home Depot, Inc. (The), 2.50%, 04/15/2027 | | $ | 160,000 | | | $ 144,683 |
|
Homebuilding–0.02% |
Lennar Corp., 4.75%, 11/29/2027 | | | 80,000 | | | 74,052 |
|
Hotel & Resort REITs–0.04% |
Host Hotels & Resorts L.P., Series F, 4.50%, 02/01/2026 | | | 150,000 | | | 140,135 |
|
Hotels, Resorts & Cruise Lines–0.03% |
Hyatt Hotels Corp., 4.85%, 03/15/2026 | | | 133,000 | | | 127,515 |
|
Independent Power Producers & Energy Traders–0.15% |
Enel Generacion Chile S.A. (Chile), 4.25%, 04/15/2024 | | | 600,000 | | | 588,654 |
|
Industrial Machinery–0.03% |
Stanley Black & Decker, Inc., 3.40%, 03/01/2026 | | | 125,000 | | | 117,594 |
|
Insurance Brokers–0.04% |
Willis North America, Inc., 4.65%, 06/15/2027 | | | 165,000 | | | 155,377 |
|
Integrated Oil & Gas–0.12% |
BP Capital Markets America, Inc., 3.54%, 04/06/2027 | | | 165,000 | | | 153,628 |
Chevron USA, Inc., 1.02%, 08/12/2027 | | | 185,000 | | | 155,600 |
Exxon Mobil Corp., 3.29%, 03/19/2027 | | | 150,000 | | | 140,993 |
| | | | | | | 450,221 |
|
Interactive Media & Services–0.14% |
Weibo Corp. (China), 3.50%, 07/05/2024 | | | 585,000 | | | 552,195 |
|
Internet & Direct Marketing Retail–0.09% |
Amazon.com, Inc., 3.30%, 04/13/2027(b) | | | 350,000 | | | 328,765 |
|
Internet Services & Infrastructure–0.05% |
VeriSign, Inc., 5.25%, 04/01/2025 | | | 200,000 | | | 198,201 |
|
Investment Banking & Brokerage–0.31% |
Goldman Sachs Group, Inc. (The), | | | | | | |
3.85%, 01/26/2027 | | | 165,000 | | | 153,067 |
1.54%, 09/10/2027(f) | | | 150,000 | | | 125,977 |
1.95%, 10/21/2027(f) | | | 100,000 | | | 85,029 |
Morgan Stanley, | | | | | | |
2.72%, 07/22/2025(f) | | | 150,000 | | | 141,639 |
3.63%, 01/20/2027 | | | 175,000 | | | 161,376 |
1.59%, 05/04/2027(f) | | | 200,000 | | | 171,271 |
1.51%, 07/20/2027(f) | | | 200,000 | | | 169,707 |
Nomura Holdings, Inc. (Japan), 1.65%, 07/14/2026 | | | 200,000 | | | 170,069 |
| | | | | | | 1,178,135 |
|
IT Consulting & Other Services–0.14% |
International Business Machines Corp., | | | | | | |
3.45%, 02/19/2026 | | | 200,000 | | | 189,812 |
3.30%, 05/15/2026 | | | 100,000 | | | 93,660 |
1.70%, 05/15/2027 | | | 100,000 | | | 85,955 |
| | | | | | |
| | | Principal
Amount | | Value |
IT Consulting & Other Services–(continued) |
Kyndryl Holdings, Inc., 2.05%, 10/15/2026 | | $ | 225,000 | | | $ 176,121 |
| | | | | | | 545,548 |
|
Life & Health Insurance–0.06% |
Principal Financial Group, Inc., 3.40%, 05/15/2025 | | | 239,000 | | | 228,572 |
| | |
Multi-line Insurance–0.04% | | | | | | |
Boardwalk Pipelines L.P., 5.95%, 06/01/2026 | | | 140,000 | | | 140,324 |
| | |
Multi-Utilities–0.04% | | | | | | |
Public Service Enterprise Group, Inc., 2.88%, 06/15/2024 | | | 150,000 | | | 144,240 |
| | |
Office REITs–0.04% | | | | | | |
Office Properties Income Trust, 2.65%, 06/15/2026 | | | 199,000 | | | 145,228 |
|
Oil & Gas Equipment & Services–0.02% |
Baker Hughes Holdings LLC/Baker Hughes Co-Obligor, Inc., 3.34%, 12/15/2027 | | | 100,000 | | | 89,681 |
|
Oil & Gas Refining & Marketing–0.04% |
HF Sinclair Corp., 5.88%, 04/01/2026 | | | 140,000 | | | 136,275 |
|
Oil & Gas Storage & Transportation–0.15% |
Cheniere Corpus Christi Holdings LLC, 5.13%, 06/30/2027 | | | 160,000 | | | 156,227 |
Energy Transfer L.P., | | | | | | |
3.90%, 05/15/2024 | | | 381,000 | | | 370,304 |
4.40%, 03/15/2027 | | | 65,000 | | | 60,362 |
| | | | | | | 586,893 |
|
Other Diversified Financial Services–0.04% |
Corebridge Financial, Inc., 3.65%, 04/05/2027(g) | | | 170,000 | | | 154,082 |
| | |
Packaged Foods & Meats–0.07% | | | | | | |
Conagra Brands, Inc., 1.38%, 11/01/2027 | | | 130,000 | | | 105,102 |
Tyson Foods, Inc., 4.00%, 03/01/2026 | | | 190,000 | | | 181,873 |
| | | | | | | 286,975 |
| | |
Paper Packaging–0.02% | | | | | | |
Berry Global, Inc., 1.57%, 01/15/2026 | | | 100,000 | | | 86,744 |
| | |
Pharmaceuticals–0.37% | | | | | | |
Bristol-Myers Squibb Co., 0.75%, 11/13/2025 | | | 400,000 | | | 353,576 |
Merck & Co., Inc., 2.75%, 02/10/2025 | | | 184,000 | | | 175,883 |
Perrigo Finance Unlimited Co., 3.90%, 12/15/2024 | | | 435,000 | | | 415,353 |
Royalty Pharma PLC, 1.20%, 09/02/2025 | | | 275,000 | | | 242,725 |
Utah Acquisition Sub, Inc., 3.95%, 06/15/2026 | | | 200,000 | | | 182,314 |
Viatris, Inc., 2.30%, 06/22/2027 | | | 75,000 | | | 61,395 |
| | | | | | | 1,431,246 |
See accompanying Notes to Consolidated Financial Statements which are an integral part of the financial statements.
| | |
| 15 | | Invesco Fundamental Alternatives Fund |
| | | | | | |
| | | Principal
Amount | | Value |
Railroads–0.04% | | | | | | |
Union Pacific Corp., 3.15%, 03/01/2024 | | $ | 150,000 | | | $ 146,579 |
| | |
Regional Banks–0.11% | | | | | | |
Santander Holdings USA, Inc., 4.40%, 07/13/2027 | | | 100,000 | | | 90,450 |
Truist Financial Corp., 4.00%, 05/01/2025 | | | 350,000 | | | 339,290 |
| | | | | | | 429,740 |
| | |
Residential REITs–0.02% | | | | | | |
Spirit Realty L.P., 4.45%, 09/15/2026 | | | 90,000 | | | 83,999 |
| | |
Retail REITs–0.07% | | | | | | |
Realty Income Corp., 4.88%, 06/01/2026 | | | 185,000 | | | 180,027 |
Simon Property Group L.P., 3.30%, 01/15/2026 | | | 95,000 | | | 88,652 |
| | | | | | | 268,679 |
| | |
Semiconductor Equipment–0.10% | | | | | | |
NXP B.V./NXP Funding LLC/NXP USA, Inc. (China), 2.70%, 05/01/2025 | | | 415,000 | | | 384,277 |
| | |
Semiconductors–0.05% | | | | | | |
Broadcom Corp./Broadcom Cayman Finance Ltd., 3.88%, 01/15/2027 | | | 100,000 | | | 91,985 |
Micron Technology, Inc., 4.19%, 02/15/2027 | | | 100,000 | | | 92,866 |
| | | | | | | 184,851 |
| | |
Specialized REITs–0.13% | | | | | | |
American Tower Corp., | | | | | | |
1.30%, 09/15/2025 | | | 200,000 | | | 176,307 |
3.65%, 03/15/2027 | | | 135,000 | | | 122,206 |
3.55%, 07/15/2027 | | | 135,000 | | | 120,747 |
EPR Properties, 4.75%, 12/15/2026 | | | 100,000 | | | 86,200 |
| | | | | | | 505,460 |
| | |
Specialty Chemicals–0.02% | | | | | | |
PPG Industries, Inc., 1.20%, 03/15/2026 | | | 100,000 | | | 86,690 |
| | |
Steel–0.05% | | | | | | |
ArcelorMittal S.A. (Luxembourg), 4.55%, 03/11/2026 | | | 200,000 | | | 190,758 |
| | |
Technology Distributors–0.02% | | | | | | |
Avnet, Inc., 4.63%, 04/15/2026 | | | 90,000 | | | 85,422 |
|
Technology Hardware, Storage & Peripherals–0.13% |
Apple, Inc., | | | | | | |
3.25%, 02/23/2026 | | | 185,000 | | | 176,546 |
3.20%, 05/11/2027 | | | 175,000 | | | 164,017 |
HP, Inc., 1.45%, 06/17/2026 | | | 206,000 | | | 176,123 |
| | | | | | | 516,686 |
| | |
Tobacco–0.10% | | | | | | |
Altria Group, Inc., 4.40%, 02/14/2026 | | | 200,000 | | | 192,057 |
| | | | | | | | | | |
| | | Principal Amount | | Value |
Tobacco–(continued) | | | | | | | | | | |
B.A.T Capital Corp. (United Kingdom), 3.22%, 09/06/2026 | | | $ | | | | 200,000 | | | $ 177,912 |
| | | | | | | | | | | 369,969 |
| | | |
Trucking–0.04% | | | | | | | | | | |
Ryder System, Inc., 3.65%, 03/18/2024 | | | | | | | 150,000 | | | 146,510 |
| | | |
Water Utilities–0.09% | | | | | | | | | | |
American Water Capital Corp., 3.85%, 03/01/2024 | | | | | | | 340,000 | | | 334,024 |
Total U.S. Dollar Denominated Bonds & Notes (Cost $31,743,948) | | | | | | | 28,903,152 |
|
Non-U.S. Dollar Denominated Bonds & Notes–3.36%(h) |
Aerospace & Defense–0.10% | | | | | | | |
Thales S.A. (France), 0.75%, 01/23/2025(g) | | | EUR | | | | 400,000 | | | 371,822 |
| | |
Agricultural Products–0.02% | | | | | | | |
Archer-Daniels-Midland Co., 1.00%, 09/12/2025 | | | EUR | | | | 100,000 | | | 93,121 |
| |
Apparel, Accessories & Luxury Goods–0.02% | | | |
PVH Corp., 3.13%, 12/15/2027(g) | | | EUR | | | | 100,000 | | | 84,655 |
| | |
Auto Parts & Equipment–0.02% | | | | | | | |
Magna International, Inc. (Canada), 1.50%, 09/25/2027 | | | EUR | | | | 100,000 | | | 87,985 |
| | |
Automobile Manufacturers–0.16% | | | | | | | |
BMW Finance N.V. (Germany), 1.00%, 01/21/2025(g) | | | EUR | | | | 100,000 | | | 95,292 |
Mercedes-Benz International Finance B.V. (Germany), 2.00%, 08/22/2026(g) | | | EUR | | | | 70,000 | | | 66,680 |
Nissan Motor Co. Ltd. (Japan), 2.65%, 03/17/2026(g) | | | EUR | | | | 100,000 | | | 90,058 |
RCI Banque S.A. (France), 1.75%, 04/10/2026(g) | | | EUR | | | | 50,000 | | | 45,243 |
Volkswagen Financial Services AG (Germany), | | | | | | | | | | |
0.13%, 02/12/2027(g) | | | EUR | | | | 150,000 | | | 125,658 |
2.25%, 10/01/2027(g) | | | EUR | | | | 100,000 | | | 91,022 |
Volkswagen Leasing GmbH (Germany), | | | | | | | | | | |
1.50%, 06/19/2026(g) | | | EUR | | | | 35,000 | | | 31,959 |
0.38%, 07/20/2026(g) | | | EUR | | | | 75,000 | | | 65,159 |
| | | | | | | | | | | 611,071 |
| | | |
Brewers–0.06% | | | | | | | | | | |
Anheuser-Busch InBev S.A./N.V. (Belgium), 2.88%, 09/25/2024(g) | | | EUR | | | | 242,000 | | | 238,967 |
| | | |
Broadcasting–0.09% | | | | | | | | | | |
ITV PLC (United Kingdom), 1.38%, 09/26/2026(g) | | | EUR | | | | 200,000 | | | 171,542 |
TDF Infrastructure S.A.S.U. (France), 2.50%, 04/07/2026(g) | | | EUR | | | | 200,000 | | | 176,700 |
| | | | | | | | | | | 348,242 |
| | | |
Cable & Satellite–0.05% | | | | | | | | | | |
SES S.A. (Luxembourg), 1.63%, 03/22/2026(g) | | | EUR | | | | 200,000 | | | 178,364 |
See accompanying Notes to Consolidated Financial Statements which are an integral part of the financial statements.
| | |
| 16 | | Invesco Fundamental Alternatives Fund |
| | | | | | | | | | |
| | | Principal Amount | | Value |
Construction & Engineering–0.07% |
Autoroutes du Sud de la France S.A. (France), 2.95%, 01/17/2024(g) | | | EUR | | | | 100,000 | | | $ 98,853 |
ISS Global A/S (Denmark), 0.88%, 06/18/2026(g) | | | EUR | | | | 100,000 | | | 87,281 |
Worley US Finance Sub Ltd. (Australia), 0.88%, 06/09/2026(g) | | | EUR | | | | 100,000 | | | 86,502 |
| | | | | | | | | | | 272,636 |
|
Construction Machinery & Heavy Trucks–0.03% |
Metso Outotec OYJ (Finland), 1.13%, 06/13/2024(g) | | | EUR | | | | 100,000 | | | 94,354 |
|
Construction Materials–0.02% |
HeidelbergCement Finance (Luxembourg) S.A. (Germany), 1.63%, 04/07/2026(g) | | | EUR | | | | 70,000 | | | 64,433 |
|
Consumer Finance–0.08% |
Santander Consumer Finance S.A. (Spain), 1.00%, 02/27/2024(g) | | | EUR | | | | 300,000 | | | 287,348 |
|
Data Processing & Outsourced Services–0.03% |
Euronet Worldwide, Inc., 1.38%, 05/22/2026 | | | EUR | | | | 110,000 | | | 94,024 |
|
Diversified Banks–1.07% |
Banco Bilbao Vizcaya Argentaria S.A. (Spain), 0.38%, 10/02/2024(g) | | | EUR | | | | 500,000 | | | 466,910 |
Banco Santander S.A. (Spain), | | | | | | | | | | |
3.13%, 01/19/2027(g) | | | EUR | | | | 100,000 | | | 93,032 |
0.50%, 02/04/2027(g) | | | EUR | | | | 100,000 | | | 84,196 |
Bankinter S.A. (Spain), 0.88%, 07/08/2026(g) | | | EUR | | | | 100,000 | | | 86,579 |
Banque Federative du Credit Mutuel S.A. (France), | | | | | | | | | | |
1.25%, 01/14/2025(g) | | | EUR | | | | 100,000 | | | 93,951 |
2.13%, 09/12/2026(g) | | | EUR | | | | 100,000 | | | 91,440 |
0.63%, 11/19/2027(g) | | | EUR | | | | 100,000 | | | 82,487 |
Belfius Bank S.A. (Belgium), 0.01%, 10/15/2025(g) | | | EUR | | | | 300,000 | | | 268,657 |
BNP Paribas S.A. (France), | | | | | | | | | | |
1.50%, 11/17/2025(g) | | | EUR | | | | 100,000 | | | 92,178 |
2.88%, 10/01/2026(g) | | | EUR | | | | 200,000 | | | 187,387 |
0.25%, 04/13/2027(f)(g) | | | EUR | | | | 100,000 | | | 85,571 |
BPCE S.A. (France), | | | | | | | | | | |
0.88%, 01/31/2024(g) | | | EUR | | | | 100,000 | | | 95,703 |
0.63%, 09/26/2024(g) | | | EUR | | | | 500,000 | | | 465,693 |
Cooperatieve Rabobank U.A. (Netherlands), 0.63%, 02/27/2024(g) | | | EUR | | | | 100,000 | | | 95,607 |
Credit Agricole S.A. (France), | | | | | | | | | | |
1.00%, 09/16/2024(g) | | | EUR | | | | 100,000 | | | 95,290 |
1.38%, 03/13/2025(g) | | | EUR | | | | 300,000 | | | 281,997 |
0.38%, 10/21/2025(g) | | | EUR | | | | 100,000 | | | 90,453 |
de Volksbank N.V. (Netherlands), 0.01%, 09/16/2024(g) | | | EUR | | | | 200,000 | | | 185,957 |
ING Groep N.V. (Netherlands), 1.13%, 02/14/2025(g) | | | EUR | | | | 100,000 | | | 93,940 |
KBC Group N.V. (Belgium), 1.13%, 01/25/2024(g) | | | EUR | | | | 100,000 | | | 95,922 |
Mediobanca Banca di Credito Finanziario S.p.A. (Italy), 0.88%, 01/15/2026(g) | | | EUR | | | | 100,000 | | | 88,865 |
| | | | | | | | | | |
| | | Principal Amount | | Value |
Diversified Banks–(continued) |
National Australia Bank Ltd. (Australia), 1.25%, 05/18/2026(g) | | | EUR | | | | 100,000 | | | $ 92,481 |
Nordea Bank Abp (Finland), 1.13%, 02/12/2025(g) | | | EUR | | | | 100,000 | | | 94,790 |
OP Corporate Bank PLC (Finland), 0.38%, 02/26/2024(g) | | | EUR | | | | 121,000 | | | 115,167 |
Skandinaviska Enskilda Banken AB (Sweden), 0.75%, 08/09/2027(g) | | | EUR | | | | 300,000 | | | 255,171 |
Standard Chartered PLC (United Kingdom), 0.90%,
07/02/2027(f)(g) | | | EUR | | | | 100,000 | | | 86,327 |
Swedbank AB (Sweden), 0.30%, 05/20/2027(f)(g) | | | EUR | | | | 200,000 | | | 172,135 |
Volkswagen Bank GmbH (Germany), 2.50%, 07/31/2026(g) | | | EUR | | | | 100,000 | | | 93,246 |
| | | | | | | | | | | 4,131,132 |
|
Diversified Capital Markets–0.07% |
Deutsche Bank AG (Germany), | | | | | | | | | | |
2.63%, 02/12/2026(g) | | | EUR | | | | 100,000 | | | 91,192 |
0.75%, 02/17/2027(f)(g) | | | EUR | | | | 100,000 | | | 84,144 |
Macquarie Group Ltd. (Australia), 0.63%, 02/03/2027(g) | | | EUR | | | | 100,000 | | | 84,190 |
| | | | | | | | | | | 259,526 |
|
Diversified Chemicals–0.07% |
BASF SE (Germany), | | | | | | | | | | |
2.50%, 01/22/2024(g) | | | EUR | | | | 80,000 | | | 78,832 |
0.25%, 06/05/2027(g) | | | EUR | | | | 200,000 | | | 172,156 |
| | | | | | | | | | | 250,988 |
|
Diversified Support Services–0.05% |
APRR S.A. (France), 1.50%, 01/15/2024(g) | | | EUR | | | | 200,000 | | | 193,831 |
| | | |
Electric Utilities–0.11% | | | | | | | | | | |
AusNet Services Holdings Pty. Ltd. (Australia), 1.50%, 02/26/2027(g) | | | EUR | | | | 200,000 | | | 178,340 |
EDP Finance B.V. (Portugal), 1.50%, 11/22/2027(g) | | | EUR | | | | 100,000 | | | 89,067 |
Elenia Verkko OYJ (Finland), 0.38%, 02/06/2027(g) | | | EUR | | | | 200,000 | | | 167,835 |
| | | | | | | | | | | 435,242 |
| | | |
Food Retail–0.02% | | | | | | | | | | |
ELO SACA (France), 2.88%, 01/29/2026(g) | | | EUR | | | | 100,000 | | | 92,187 |
| | | |
Gas Utilities–0.05% | | | | | | | | | | |
2i Rete Gas S.p.A. (Italy), 1.75%, 08/28/2026(g) | | | EUR | | | | 115,000 | | | 102,552 |
APA Infrastructure Ltd. (Australia), 2.00%, 03/22/2027(g) | | | EUR | | | | 100,000 | | | 88,905 |
| | | | | | | | | | | 191,457 |
|
Health Care Equipment–0.05% |
Becton, Dickinson and Co., 1.90%, 12/15/2026 | | | EUR | | | | 100,000 | | | 92,405 |
Zimmer Biomet Holdings, Inc., 2.43%, 12/13/2026 | | | EUR | | | | 100,000 | | | 92,450 |
| | | | | | | | | | | 184,855 |
See accompanying Notes to Consolidated Financial Statements which are an integral part of the financial statements.
| | |
| 17 | | Invesco Fundamental Alternatives Fund |
| | | | | | | | | | |
| | | Principal Amount | | Value |
Health Care Services–0.01% | | | | | | | | | | |
Fresenius Medical Care AG & Co. KGaA (Germany), 0.63%, 11/30/2026(g) | | | EUR | | | | 50,000 | | | $ 43,139 |
| |
Health Care Supplies–0.03% | | | |
EssilorLuxottica S.A. (France), 2.38%, 04/09/2024(g) | | | EUR | | | | 100,000 | | | 98,382 |
| |
Hotels, Resorts & Cruise Lines–0.02% | | | |
InterContinental Hotels Group PLC (United Kingdom), 2.13%, 05/15/2027(g) | | | EUR | | | | 100,000 | | | 88,229 |
| |
Household Appliances–0.02% | | | |
Whirlpool Finance Luxembourg S.a.r.l., 1.10%, 11/09/2027 | | | EUR | | | | 100,000 | | | 84,924 |
| |
Household Products–0.01% | | | |
Procter & Gamble Co. (The), 4.88%, 05/11/2027 | | | EUR | | | | 50,000 | | | 53,327 |
| |
Integrated Oil & Gas–0.10% | | | |
Eni S.p.A. (Italy), 1.00%, 03/14/2025(g) | | | EUR | | | | 179,000 | | | 168,116 |
Shell International Finance B.V. (Netherlands), 0.38%, 02/15/2025(g) | | | EUR | | | | 222,000 | | | 206,737 |
| | | | | | | | | | | 374,853 |
| |
Integrated Telecommunication Services–0.02% | | | |
Vantage Towers AG (Germany), 0.38%, 03/31/2027(g) | | | EUR | | | | 100,000 | | | 83,250 |
| |
IT Consulting & Other Services–0.09% | | | |
DXC Technology Co., 1.75%, 01/15/2026 | | | EUR | | | | 100,000 | | | 91,622 |
International Business Machines Corp., 1.25%, 01/29/2027 | | | EUR | | | | 300,000 | | | 272,032 |
| | | | | | | | | | | 363,654 |
| |
Life & Health Insurance–0.07% | | | |
Ethias S.A. (Belgium), 5.00%, 01/14/2026(g) | | | EUR | | | | 100,000 | | | 95,028 |
New York Life Global Funding, 0.25%, 01/23/2027(g) | | | EUR | | | | 200,000 | | | 171,614 |
| | | | | | | | | | | 266,642 |
| |
Multi-line Insurance–0.04% | | | |
Cloverie PLC for Zurich Insurance Co. Ltd. (Switzerland), 1.75%, 09/16/2024(g) | | | EUR | | | | 150,000 | | | 143,432 |
| |
Multi-Sector Holdings–0.07% | | | |
Berkshire Hathaway, Inc., 1.13%, 03/16/2027 | | | EUR | | | | 200,000 | | | 177,392 |
Groupe Bruxelles Lambert N.V. (Belgium), 1.88%, 06/19/2025(g) | | | EUR | | | | 100,000 | | | 94,787 |
| | | | | | | | | | | 272,179 |
| |
Office REITs–0.11% | | | |
Globalworth Real Estate Investments Ltd. (Poland), 2.95%, 07/29/2026(g) | | | EUR | | | | 100,000 | | | 76,694 |
Inmobiliaria Colonial SOCIMI S.A. (Spain), 1.63%, 11/28/2025(g) | | | EUR | | | | 400,000 | | | 363,619 |
| | | | | | | | | | | 440,313 |
| | | | | | | | | | |
| | | Principal Amount | | Value |
Other Diversified Financial Services–0.14% |
Clearstream Banking AG (Germany), 0.01%, 12/01/2025(g) | | | EUR | | | | 200,000 | | | $ 180,279 |
JAB Holdings B.V. (Austria), 1.75%, 06/25/2026(g) | | | EUR | | | | 100,000 | | | 90,263 |
LeasePlan Corp. N.V. (Netherlands), 3.50%, 04/09/2025(g) | | | EUR | | | | 294,000 | | | 282,320 |
| | | | | | | | | | | 552,862 |
| |
Packaged Foods & Meats–0.02% | | | |
JDE Peet’s N.V. (Netherlands), 0.01%, 01/16/2026(g) | | | EUR | | | | 100,000 | | | 86,496 |
| |
Paper Products–0.03% | | | |
Smurfit Kappa Acquisitions ULC (Ireland), 2.88%, 01/15/2026(g) | | | EUR | | | | 100,000 | | | 95,084 |
| |
Pharmaceuticals–0.12% | | | |
Bayer AG (Germany), 0.38%, 07/06/2024(g) | | | EUR | | | | 400,000 | | | 377,632 |
Novartis Finance S.A. (Switzerland), 1.63%, 11/09/2026(g) | | | EUR | | | | 100,000 | | | 93,690 |
| | | | | | | | | | | 471,322 |
| |
Precious Metals & Minerals–0.02% | | | |
Anglo American Capital PLC (South Africa), 1.63%, 03/11/2026(g) | | | EUR | | | | 100,000 | | | 91,173 |
| |
Real Estate Operating Companies–0.04% | | | |
CPI Property Group S.A. (Czech Republic), 2.75%, 05/12/2026(g) | | | EUR | | | | 100,000 | | | 76,094 |
Samhallsbyggnadsbolaget i Norden AB (Sweden), 1.13%, 09/04/2026(g) | | | EUR | | | | 100,000 | | | 72,382 |
| | | | | | | | | | | 148,476 |
| |
Renewable Electricity–0.02% | | | |
Southern Power Co., 1.85%, 06/20/2026 | | | EUR | | | | 100,000 | | | 92,512 |
| |
Restaurants–0.04% | | | |
Sodexo S.A. (France), 0.75%, 04/27/2025(g) | | | EUR | | | | 170,000 | | | 157,283 |
| |
Specialized REITs–0.02% | | | |
American Tower Corp., 1.95%, 05/22/2026 | | | EUR | | | | 100,000 | | | 91,667 |
| |
Thrifts & Mortgage Finance–0.06% | | | |
Aareal Bank AG (Germany), 0.50%, 04/07/2027(g) | | | EUR | | | | 300,000 | | | 234,429 |
| |
Tobacco–0.02% | | | |
Imperial Brands Finance PLC (United Kingdom), 3.38%, 02/26/2026(g) | | | EUR | | | | 100,000 | | | 92,670 |
Total Non-U.S. Dollar Denominated Bonds & Notes
(Cost $16,712,434) | | | 12,992,538 |
|
Variable Rate Senior Loan Interests–0.01%(i)(j) |
Advertising–0.01% | | | | | | | | | | |
Checkout Holding Corp., Term Loan, 10.62%, 02/15/2023 | | | $ | | | | 72,995 | | | 60,525 |
PIK Term Loan, 9.50% PIK Rate, 3.37% Cash Rate, 08/15/2023(k) | | | | | | | 6,658 | | | 1,999 |
| | | | | | | | | | | 62,524 |
See accompanying Notes to Consolidated Financial Statements which are an integral part of the financial statements.
| | |
| 18 | | Invesco Fundamental Alternatives Fund |
| | | | | | |
| | | Principal
Amount | | Value |
Integrated Oil & Gas–0.00% | | | | | | |
Lealand Finance Co. B.V., PIK Term Loan, 2.67% PIK Rate, 3.37% Cash Rate, 06/30/2025(k) | | $ | 782 | | | $ 418 |
Total Variable Rate Senior Loan Interests
(Cost $78,580) | | | 62,942 |
| | |
| | | Shares | | | |
| | |
Preferred Stocks–0.00% | | | | | | |
Oil & Gas Storage & Transportation–0.00% |
Southcross Energy Partners L.P., Series A, Pfd.
(Cost $68,449)(d) | | | 68,466 | | | 3,766 |
|
Money Market Funds–24.95% |
Invesco Treasury Portfolio, Institutional Class, 3.08%(l)(m) (Cost $96,450,226) | | | 96,450,226 | | | 96,450,226 |
TOTAL INVESTMENTS IN SECURITIES
(excluding investments purchased with cash collateral from securities on loan)-87.03%
(Cost $320,570,925) | | | 336,428,835 |
| | | | | | |
| | | Shares | | Value |
Investments Purchased with Cash Collateral from Securities on Loan |
Money Market Funds–3.47% | | | | | | |
Invesco Private Government Fund,
3.18%(l)(m)(n) | | | 3,757,237 | | | $ 3,757,237 |
Invesco Private Prime Fund,
3.28%(l)(m)(n) | | | 9,659,107 | | | 9,659,107 |
Total Investments Purchased with Cash Collateral from Securities on Loan (Cost $13,415,871) | | | 13,416,344 |
TOTAL INVESTMENTS IN SECURITIES–90.50%
(Cost $333,986,796) | | | 349,845,179 |
OTHER ASSETS LESS LIABILITIES–9.50% | | | 36,707,517 |
NET ASSETS–100.00% | | | | | | $386,552,696 |
Investment Abbreviations:
| | |
EUR Pfd. PIK REIT Wts. | | - Euro - Preferred - Pay-in-Kind - Real Estate Investment Trust - Warrants |
Notes to Consolidated Schedule of Investments:
| (a) | Industry and/or sector classifications used in this report are generally according to the Global Industry Classification Standard, which was developed by and is the exclusive property and a service mark of MSCI Inc. and Standard & Poor’s. |
| (b) | All or a portion of this security was out on loan at October 31, 2022. |
| (c) | Non-income producing security. |
| (d) | Security valued using significant unobservable inputs (Level 3). See Note 3. |
| (e) | Security traded on a discount basis. The interest rate shown represents the discount rate at the time of purchase by the Fund. |
| (f) | Security issued at a fixed rate for a specific period of time, after which it will convert to a variable rate. |
| (g) | Security purchased or received in a transaction exempt from registration under the Securities Act of 1933, as amended (the “1933 Act”). The security may be resold pursuant to an exemption from registration under the 1933 Act, typically to qualified institutional buyers. The aggregate value of these securities at October 31, 2022 was $12,067,148, which represented 3.12% of the Fund’s Net Assets. |
| (h) | Foreign denominated security. Principal amount is denominated in the currency indicated. |
| (i) | Variable rate senior loan interests often require prepayments from excess cash flow or permit the borrower to repay at its election. The degree to which borrowers repay, whether as a contractual requirement or at their election, cannot be predicted with any accuracy. As a result, the actual remaining maturity may be substantially less than the stated maturities shown. However, it is anticipated that the variable rate senior loan interests will have an expected average life of three to five years. |
| (j) | Variable rate senior loan interests are, at present, not readily marketable, not registered under the 1933 Act and may be subject to contractual and legal restrictions on sale. Variable rate senior loan interests in the Fund’s portfolio generally have variable rates which adjust to a base, such as the London Interbank Offered Rate (“LIBOR”), on set dates, typically every 30 days, but not greater than one year, and/or have interest rates that float at margin above a widely recognized base lending rate such as the Prime Rate of a designated U.S. bank. |
| (k) | All or a portion of this security is Pay-in-Kind. Pay-in-Kind securities pay interest income in the form of securities. |
| (l) | Affiliated issuer. The issuer and/or the Fund is a wholly-owned subsidiary of Invesco Ltd., or is affiliated by having an investment adviser that is under common control of Invesco Ltd. The table below shows the Fund’s transactions in, and earnings from, its investments in affiliates for the fiscal year ended October 31, 2022. |
| | | | | | | | | | | | | | | | | | | | | | | | | | | | | | | | | | | |
| | | Value
October 31, 2021 | | Purchases
at Cost | | Proceeds
from Sales | | Change in
Unrealized
Appreciation | | Realized
Gain
(Loss) | | Value
October 31, 2022 | | Dividend Income |
| Investments in Affiliated Money Market Funds: | | | | | | | | | | | | | | | | | | | | | | | | | | | | | | | | | | | |
| Invesco Treasury Portfolio, Institutional Class | | | $ | 31,020,428 | | | | $ | 251,297,988 | | | | $ | (185,868,190 | ) | | | | $ - | | | | | $ - | | | | $ | 96,450,226 | | | | $ | 836,765 | |
See accompanying Notes to Consolidated Financial Statements which are an integral part of the financial statements.
| | |
| 19 | | Invesco Fundamental Alternatives Fund |
| | | | | | | | | | | | | | | | | | | | | | | | | | | | | | | | | | | |
| | | Value
October 31, 2021 | | Purchases
at Cost | | Proceeds
from Sales | | Change in
Unrealized
Appreciation | | Realized
Gain
(Loss) | | Value
October 31, 2022 | | Dividend Income |
| Investments Purchased with Cash Collateral from Securities on Loan: | | | | | | | | | | | | | | | | | | | | | | | | | | | | | | | | | | | |
| Invesco Private Government Fund | | | $ | 756,501 | | | | $ | 76,893,733 | | | | $ | (73,892,997 | ) | | | | $ - | | | | | $ - | | | | $ | 3,757,237 | | | | $ | 31,108 | * |
| Invesco Private Prime Fund | | | | 1,765,170 | | | | | 134,702,787 | | | | | (126,806,188 | ) | | | | 473 | | | | | (3,135) | | | | | 9,659,107 | | | | | 83,298 | * |
| Total | | | $ | 33,542,099 | | | | $ | 462,894,508 | | | | $ | (386,567,375 | ) | | | | $473 | | | | | $(3,135) | | | | $ | 109,866,570 | | | | $ | 951,171 | |
| | * | Represents the income earned on the investment of cash collateral, which is included in securities lending income on the Consolidated Statement of Operations. Does not include rebates and fees paid to lending agent or premiums received from borrowers, if any. |
| (m) | The rate shown is the 7-day SEC standardized yield as of October 31, 2022. |
| (n) | The security has been segregated to satisfy the commitment to return the cash collateral received in securities lending transactions upon the borrower’s return of the securities loaned. See Note 1K. |
| | | | | | | | | | | | | | | | | | | | |
| Open Futures Contracts(a) | |
| |
| Long Futures Contracts | | Number of
Contracts | | Expiration
Month | | | Notional
Value | | | Value | | | Unrealized
Appreciation
(Depreciation) | |
| |
Commodity Risk | | | | | | | | | | | | | | | | | | | | |
| |
Gasoline Reformulated Blendstock Oxygenate Blending | | | 13 | | | | November-2022 | | | $ | 1,379,032 | | | $ | 27,437 | | | $ | 27,437 | |
| |
Low Sulphur Gas Oil | | | 23 | | | | December-2022 | | | | 2,345,425 | | | | 161,342 | | | | 161,342 | |
| |
Natural Gas | | | 15 | | | | November-2022 | | | | 953,250 | | | | (209,899 | ) | | | (209,899 | ) |
| |
Subtotal | | | | | | | | | | | | | | | (21,120 | ) | | | (21,120 | ) |
| |
Interest Rate Risk | | | | | | | | | | | | | | | | | | | | |
| |
Australia 10 Year Bonds | | | 218 | | | | December-2022 | | | | 16,521,516 | | | | (213,376 | ) | | | (213,376 | ) |
| |
Canada 10 Year Bonds | | | 165 | | | | December-2022 | | | | 14,900,686 | | | | (227,565 | ) | | | (227,565 | ) |
| |
Euro-Bund | | | 58 | | | | December-2022 | | | | 7,935,171 | | | | (395,850 | ) | | | (395,850 | ) |
| |
Japan 10 Year Bonds | | | 5 | | | | December-2022 | | | | 5,002,522 | | | | 5,845 | | | | 5,845 | |
| |
Long Gilt | | | 89 | | | | December-2022 | | | | 10,423,914 | | | | (554,271 | ) | | | (554,271 | ) |
| |
U.S. Treasury 2 Year Notes | | | 36 | | | | December-2022 | | | | 7,357,781 | | | | (102,790 | ) | | | (102,790 | ) |
| |
U.S. Treasury 5 Year Notes | | | 92 | | | | December-2022 | | | | 9,806,625 | | | | (375,667 | ) | | | (375,667 | ) |
| |
U.S. Treasury Long Bonds | | | 29 | | | | December-2022 | | | | 3,494,500 | | | | (360,809 | ) | | | (360,809 | ) |
| |
Subtotal | | | | | | | | | | | | | | | (2,224,483 | ) | | | (2,224,483 | ) |
| |
Subtotal–Long Futures Contracts | | | | | | | | | | | | | | | (2,245,603 | ) | | | (2,245,603 | ) |
| |
| | | | | |
Short Futures Contracts | | | | | | | | | | | | | | | | | | | | |
| |
Commodity Risk | | | | | | | | | | | | | | | | | | | | |
| |
Coffee ’C’ | | | 2 | | | | March-2023 | | | | (130,538 | ) | | | 24,585 | | | | 24,585 | |
| |
Corn | | | 5 | | | | December-2022 | | | | (172,875 | ) | | | (3,189 | ) | | | (3,189 | ) |
| |
Cotton No. 2 | | | 9 | | | | December-2022 | | | | (324,000 | ) | | | 48,862 | | | | 48,862 | |
| |
Gold 100 oz. | | | 41 | | | | December-2022 | | | | (6,726,870 | ) | | | 550,478 | | | | 550,478 | |
| |
LME Aluminum | | | 68 | | | | December-2022 | | | | (3,784,200 | ) | | | 392,345 | | | | 392,345 | |
| |
Silver | | | 33 | | | | December-2022 | | | | (3,154,635 | ) | | | 146,677 | | | | 146,677 | |
| |
Soybean | | | 6 | | | | July-2023 | | | | (431,475 | ) | | | (11,045 | ) | | | (11,045 | ) |
| |
Soybean Oil | | | 8 | | | | December-2022 | | | | (351,408 | ) | | | (46,931 | ) | | | (46,931 | ) |
| |
Sugar No. 11 | | | 7 | | | | February-2023 | | | | (140,885 | ) | | | (4,339 | ) | | | (4,339 | ) |
| |
Wheat | | | 3 | | | | December-2022 | | | | (132,337 | ) | | | 5,567 | | | | 5,567 | |
| |
Subtotal | | | | | | | | | | | | | | | 1,103,010 | | | | 1,103,010 | |
| |
Equity Risk | | | | | | | | | | | | | | | | | | | | |
| |
E-Mini Russell 2000 Index | | | 41 | | | | December-2022 | | | | (3,798,650 | ) | | | (294,818 | ) | | | (294,818 | ) |
| |
E-Mini S&P 500 Index | | | 362 | | | | December-2022 | | | | (70,282,300 | ) | | | 1,889,850 | | | | 1,889,850 | |
| |
EURO STOXX 50 Index | | | 85 | | | | December-2022 | | | | (3,039,164 | ) | | | (172,057 | ) | | | (172,057 | ) |
| |
MSCI Emerging Markets Index | | | 24 | | | | December-2022 | | | | (1,024,320 | ) | | | 37,495 | | | | 37,495 | |
| |
Tokyo Stock Price Index | | | 14 | | | | December-2022 | | | | (1,813,376 | ) | | | (34,426 | ) | | | (34,426 | ) |
| |
Subtotal | | | | | | | | | | | | | | | 1,426,044 | | | | 1,426,044 | |
| |
See accompanying Notes to Consolidated Financial Statements which are an integral part of the financial statements.
| | |
| 20 | | Invesco Fundamental Alternatives Fund |
| | | | | | | | | | | | | | | | | | | | |
| Open Futures Contracts(a)–(continued) | |
| |
| Short Futures Contracts | | Number of
Contracts | | Expiration
Month | | | Notional
Value | | | Value | | | Unrealized
Appreciation
(Depreciation) | |
| |
Interest Rate Risk | | | | | | | | | | | | | | | | | | | | |
| |
Euro-Bobl | | | 55 | | | | December-2022 | | | $ | (6,504,511 | ) | | $ | 176,000 | | | $ | 176,000 | |
| |
Euro-Schatz | | | 38 | | | | December-2022 | | | | (4,015,782 | ) | | | 32,733 | | | | 32,733 | |
| |
Subtotal | | | | | | | | | | | | | | | 208,733 | | | | 208,733 | |
| |
Subtotal–Short Futures Contracts | | | | | | | | | | | | | | | 2,737,787 | | | | 2,737,787 | |
| |
Total Futures Contracts | | | | | | | | | | | | | | $ | 492,184 | | | $ | 492,184 | |
| |
| (a) | Futures contracts collateralized by $7,692,808 cash held with Merrill Lynch International, the futures commission merchant. |
| | | | | | | | | | | | | | | | | | | | | | |
| Open Forward Foreign Currency Contracts | |
Settlement Date | | | | Contract to | | | Unrealized Appreciation (Depreciation) | |
| | Counterparty | | Deliver | | | Receive | |
| Currency Risk | | | | | | | | | | | | | | | | | | | | | | |
| 11/17/2022 | | Bank of America, N.A. | | | EUR | | | | 192,000 | | | | USD | | | | 191,255 | | | $ | 1,312 | |
| 11/17/2022 | | Bank of America, N.A. | | | USD | | | | 175,851 | | | | EUR | | | | 181,000 | | | | 3,209 | |
| 11/17/2022 | | J.P. Morgan Chase Bank, N.A. | | | USD | | | | 93,349 | | | | EUR | | | | 96,000 | | | | 1,624 | |
| 11/17/2022 | | Morgan Stanley and Co. International PLC | | | EUR | | | | 13,060,000 | | | | USD | | | | 13,548,871 | | | | 628,760 | |
Subtotal–Appreciation | | | | | | | | | | | | | | | | 634,905 | |
| | | | | | |
| Currency Risk | | | | | | | | | | | | | | | | | | | | | | |
| 11/17/2022 | | Bank of America, N.A. | | | EUR | | | | 141,500 | | | | USD | | | | 138,291 | | | | (1,694 | ) |
| 11/17/2022 | | Bank of America, N.A. | | | USD | | | | 208,900 | | | | EUR | | | | 209,000 | | | | (2,138 | ) |
| 11/17/2022 | | BNP Paribas S.A. | | | USD | | | | 15,060 | | | | EUR | | | | 15,000 | | | | (221 | ) |
| 11/17/2022 | | Deutsche Bank AG | | | USD | | | | 129,903 | | | | EUR | | | | 130,000 | | | | (1,295 | ) |
| 11/17/2022 | | Goldman Sachs International | | | USD | | | | 167,747 | | | | EUR | | | | 166,000 | | | | (3,525 | ) |
| 11/17/2022 | | Morgan Stanley and Co. International PLC | | | EUR | | | | 698,493 | | | | USD | | | | 682,000 | | | | (9,011 | ) |
Subtotal–Depreciation | | | | | | | | | | | | | | | | (17,884 | ) |
Total Forward Foreign Currency Contracts | | | | | | | | | | | $ | 617,021 | |
| | | | | | | | | | | | | | | | | | | | | | | | | | | | | | | | | | | | |
| Open Centrally Cleared Credit Default Swap Agreements(a) | |
| Reference Entity | | Buy/Sell
Protection | | | (Pay)/
Receive
Fixed
Rate | | | Payment
Frequency | | | Maturity Date | | | Implied
Credit
Spread(b) | | | Notional Value | | | Upfront
Payments Paid
(Received) | | | Value | | | Unrealized
Appreciation | |
Credit Risk | | | | | | | | | | | | | | | | | | | | | | | | | | | | | | | | | | | | |
Markit CDX North America High Yield Index, Series 38, Version 1 | | | Sell | | | | 5.00% | | | | Quarterly | | | | 06/20/2027 | | | | 4.793% | | | | USD 5,064,840 | | | | $(53,070) | | | | $43,954 | | | | $97,024 | |
| (a) | Centrally cleared swap agreements collateralized by $488,381 cash held with Citigroup Global Markets, Inc. |
| (b) | Implied credit spreads represent the current level, as of October 31, 2022, at which protection could be bought or sold given the terms of the existing credit default swap agreement and serve as an indicator of the current status of the payment/performance risk of the credit default swap agreement. An implied credit spread that has widened or increased since entry into the initial agreement may indicate a deteriorating credit profile and increased risk of default for the reference entity. A declining or narrowing spread may indicate an improving credit profile or decreased risk of default for the reference entity. Alternatively, credit spreads may increase or decrease reflecting the general tolerance for risk in the credit markets generally. |
See accompanying Notes to Consolidated Financial Statements which are an integral part of the financial statements.
| | |
| 21 | | Invesco Fundamental Alternatives Fund |
| | | | | | | | | | | | | | | | | | | | | | | | | | | | | | | | | | | | | | | | |
| Open Over-The-Counter Total Return Swap Agreements(a) | |
| Counterparty | | Pay/ Receive | | Reference Entity(b) | | Fixed Rate | | | Payment Frequency | | | Number of Contracts | | | Maturity Date | | | Notional Value | | | Upfront Payments Paid (Received) | | Value | | | Unrealized Appreciation (Depreciation) | |
Commodity Risk | | | | | | | | | | | | | | | | | | | | | | | | | | | | | | | | | | | | | | |
Canadian Imperial Bank of Commerce | | Pay | | CIBC LME Copper Standard Roll Excess Return Index | | | 0.06 | % | | | Monthly | | | | 5,490 | | | | March–2023 | | | | USD | | | | 2,390,734 | | | | $– | | | | $36,831 | | | | $36,831 | |
Merrill Lynch International | | Pay | | Merrill Lynch Soybean Meal Index | | | 0.05 | | | | Monthly | | | | 560 | | | | October–2023 | | | | USD | | | | 464,639 | | | | – | | | | 0 | | | | 0 | |
Royal Bank of Canada | | Receive | | RBC Enhanced Crude Oil 01 Excess Return Index | | | 0.30 | | | | Monthly | | | | 3,430 | | | | August–2023 | | | | USD | | | | 1,172,658 | | | | – | | | | 0 | | | | 0 | |
Subtotal – Appreciation | | | | | | | | | | | | | | | | | | | | | | | | | | | – | | | | 36,831 | | | | 36,831 | |
Commodity Risk | | | | | | | | | | | | | | | | | | | | | | | | | | | | | | | | | | | | |
BNP Paribas S.A. | | Receive | | BNP Paribas Commodity Daily Dynamic Curve CO Index | | | 0.25 | | | | Monthly | | | | 1,870 | | | | August–2023 | | | | USD | | | | 1,121,214 | | | | – | | | | (19,434 | ) | | | (19,434 | ) |
UBS AG | | Receive | | UBS Modified Roll Select Heating Oil Strategy | | | 0.30 | | | | Monthly | | | | 15,900 | | | | December–2022 | | | | USD | | | | 2,116,616 | | | | – | | | | (17,420 | ) | | | (17,420 | ) |
Subtotal – Depreciation | | | | | | | | | | | | | | | | | | | | | | | | | | | – | | | | (36,854 | ) | | | (36,854 | ) |
Total – Total Return Swap Agreements | | | | | | | | | | | | | | | | | | | | | | | | $– | | | | $ (23 | ) | | | $ (23 | ) |
| (a) | The Fund receives or pays payments based on any positive or negative return on the Reference Entity, respectively. |
| (b) | The Reference Entity Components table below includes additional information regarding the underlying components of certain reference entities that are not publicly available. |
| | | | |
Reference Entity Components |
| Reference Entity | | Underlying Components | | Percentage |
Canadian Imperial Bank of Commerce LME Copper Standard Roll Excess Return Index | | |
| | |
| | Long Futures Contracts | | |
| | |
| | Copper | | 100.00% |
| | |
| |
Merrill Lynch Soybean Meal Index | | |
| | |
| | Long Futures Contracts | | |
| | |
| | Soybean Meal | | 100.00% |
| | |
| |
RBC Enhanced Crude Oil 01 Excess Return Index | | |
| | |
| | Long Futures Contracts | | |
| | |
| | Crude Oil | | 100.00% |
| | |
| |
BNP Paribas Commodity Daily Dynamic Curve CO Index | | |
| | |
| | Long Futures Contracts | | |
| | |
| | Brent Crude | | 100.00% |
| | |
| |
UBS Modified Roll Select Heating Oil Strategy | | |
| | |
| | Long Futures Contracts | | |
| | |
| | Heating Oil | | 100.00% |
| | |
Abbreviations:
EUR –Euro
USD –U.S. Dollar
See accompanying Notes to Consolidated Financial Statements which are an integral part of the financial statements.
| | |
| 22 | | Invesco Fundamental Alternatives Fund |
Consolidated Statement of Assets and Liabilities
October 31, 2022
| | |
Assets: | | |
Investments in unaffiliated securities, at value
(Cost $224,120,699)* | | $239,978,609 |
Investments in affiliated money market funds, at value (Cost $109,866,097) | | 109,866,570 |
Other investments: | | |
Variation margin receivable – non-LME futures contracts | | 1,996,696 |
Unrealized appreciation on LME futures contracts | | 392,345 |
Swaps receivable – OTC | | 103,428 |
Unrealized appreciation on swap agreements – OTC | | 36,831 |
Unrealized appreciation on forward foreign currency contracts outstanding | | 634,905 |
Deposits with brokers: | | |
Cash collateral – exchange-traded futures contracts | | 7,692,808 |
Cash collateral – centrally cleared swap agreements | | 488,381 |
Cash | | 38,383,087 |
Foreign currencies, at value (Cost $74,625) | | 75,994 |
Receivable for: | | |
Investments sold | | 294,262 |
Fund shares sold | | 61,979 |
Dividends | | 656,923 |
Interest | | 615,304 |
Investment for trustee deferred compensation and retirement plans | | 98,457 |
Other assets | | 43,875 |
Total assets | | 401,420,454 |
| |
Liabilities: | | |
Other investments: | | |
Variation margin payable – centrally cleared swap agreements | | 366,644 |
Unrealized depreciation on forward foreign currency contracts outstanding | | 17,884 |
Swaps payable – OTC | | 22,056 |
Unrealized depreciation on swap agreements–OTC | | 36,854 |
Payable for: | | |
Investments purchased | | 101,148 |
Fund shares reacquired | | 394,976 |
Collateral upon return of securities loaned | | 13,415,871 |
Accrued fees to affiliates | | 229,390 |
Accrued trustees’ and officers’ fees and benefits | | 988 |
Accrued other operating expenses | | 135,774 |
Trustee deferred compensation and retirement plans | | 146,173 |
Total liabilities | | 14,867,758 |
Net assets applicable to shares outstanding | | $386,552,696 |
| | | | |
Net assets consist of: | | | | |
Shares of beneficial interest | | $ | 362,129,534 | |
| |
Distributable earnings | | | 24,423,162 | |
| |
| | $ | 386,552,696 | |
| |
| |
Net Assets: | | | | |
Class A | | $ | 304,850,273 | |
| |
Class C | | $ | 13,915,773 | |
| |
Class R | | $ | 10,727,874 | |
| |
Class Y | | $ | 53,389,269 | |
| |
Class R5 | | $ | 9,410 | |
| |
Class R6 | | $ | 3,660,097 | |
| |
|
Shares outstanding, no par value, with an unlimited number of shares authorized: | |
Class A | | | 12,318,504 | |
| |
Class C | | | 639,946 | |
| |
Class R | | | 455,070 | |
| |
Class Y | | | 2,104,204 | |
| |
Class R5 | | | 380 | |
| |
Class R6 | | | 143,487 | |
| |
Class A: | | | | |
Net asset value per share | | $ | 24.75 | |
| |
Maximum offering price per share
(Net asset value of $24.75 ÷ 94.50%) | | $ | 26.19 | |
| |
Class C: | | | | |
Net asset value and offering price per share | | $ | 21.75 | |
| |
Class R: | | | | |
Net asset value and offering price per share | | $ | 23.57 | |
| |
Class Y: | | | | |
Net asset value and offering price per share | | $ | 25.37 | |
| |
Class R5: | | | | |
Net asset value and offering price per share | | $ | 24.76 | |
| |
Class R6: | | | | |
Net asset value and offering price per share | | $ | 25.51 | |
| |
| * | At October 31, 2022, securities with an aggregate value of $13,016,184 were on loan to brokers. |
See accompanying Notes to Consolidated Financial Statements which are an integral part of the financial statements.
| | |
| 23 | | Invesco Fundamental Alternatives Fund |
Consolidated Statement of Operations
For the year ended October 31, 2022
| | | | |
Investment income: | | | | |
Interest (net of foreign withholding taxes of $643) | | $ | 1,143,337 | |
| |
Dividends (net of foreign withholding taxes of $70,058) | | | 3,021,983 | |
| |
Dividends from affiliated money market funds (includes net securities lending income of $13,366) | | | 850,131 | |
| |
Other income | | | 12,381 | |
| |
Total investment income | | | 5,027,832 | |
| |
| |
Expenses: | | | | |
Advisory fees | | | 3,705,291 | |
| |
Administrative services fees | | | 63,366 | |
| |
Custodian fees | | | 56,446 | |
| |
Distribution fees: | | | | |
Class A | | | 830,571 | |
| |
Class C | | | 166,778 | |
| |
Class R | | | 58,134 | |
| |
Interest, facilities and maintenance fees | | | 1 | |
| |
Transfer agent fees – A, C, R and Y | | | 813,815 | |
| |
Transfer agent fees – R5 | | | 4 | |
| |
Transfer agent fees – R6 | | | 2,067 | |
| |
Trustees’ and officers’ fees and benefits | | | 29,560 | |
| |
Registration and filing fees | | | 80,987 | |
| |
Reports to shareholders | | | (70,211 | ) |
| |
Professional services fees | | | 82,552 | |
| |
Other | | | 41,640 | |
| |
Total expenses | | | 5,861,001 | |
| |
Less: Fees waived and/or expense offset arrangement(s) | | | (69,042 | ) |
| |
Net expenses | | | 5,791,959 | |
| |
Net investment income (loss) | | | (764,127 | ) |
| |
| |
Realized and unrealized gain (loss) from: | | | | |
Net realized gain (loss) from: | | | | |
Unaffiliated investment securities | | | 31,981,993 | |
| |
Affiliated investment securities | | | (3,135 | ) |
| |
Foreign currencies | | | (52,428 | ) |
| |
Forward foreign currency contracts | | | 2,301,705 | |
| |
Futures contracts | | | (14,261,124 | ) |
| |
Swap agreements | | | (887,694 | ) |
| |
| | | 19,079,317 | |
| |
Change in net unrealized appreciation (depreciation) of: | | | | |
Unaffiliated investment securities | | | (56,061,193 | ) |
| |
Affiliated investment securities | | | 473 | |
| |
Foreign currencies | | | (29,015 | ) |
| |
Forward foreign currency contracts | | | 347,663 | |
| |
Futures contracts | | | 7,193,219 | |
| |
Swap agreements | | | 21,648 | |
| |
| | | (48,527,205 | ) |
| |
Net realized and unrealized gain (loss) | | | (29,447,888 | ) |
| |
Net increase (decrease) in net assets resulting from operations | | $ | (30,212,015 | ) |
| |
See accompanying Notes to Consolidated Financial Statements which are an integral part of the financial statements.
| | |
| 24 | | Invesco Fundamental Alternatives Fund |
Consolidated Statement of Changes in Net Assets
For the years ended October 31, 2022 and 2021
| | | | | | | | |
| | | 2022 | | | 2021 | |
| |
Operations: | | | | | | | | |
Net investment income (loss) | | $ | (764,127 | ) | | $ | (1,306,329 | ) |
| |
Net realized gain | | | 19,079,317 | | | | 18,893,465 | |
| |
Change in net unrealized appreciation (depreciation) | | | (48,527,205 | ) | | | 19,228,818 | |
| |
Net increase (decrease) in net assets resulting from operations | | | (30,212,015 | ) | | | 36,815,954 | |
| |
| | |
Distributions to shareholders from distributable earnings: | | | | | | | | |
Class A | | | (10,053,694 | ) | | | (7,340,076 | ) |
| |
Class C | | | (437,899 | ) | | | (334,195 | ) |
| |
Class R | | | (337,935 | ) | | | (235,934 | ) |
| |
Class Y | | | (3,063,993 | ) | | | (3,334,842 | ) |
| |
Class R5 | | | (334 | ) | | | (239 | ) |
| |
Class R6 | | | (200,601 | ) | | | (4,349,596 | ) |
| |
Total distributions from distributable earnings | | | (14,094,456 | ) | | | (15,594,882 | ) |
| |
| | |
Share transactions–net: | | | | | | | | |
Class A | | | (25,043,386 | ) | | | (35,215,742 | ) |
| |
Class C | | | (3,772,748 | ) | | | (8,816,984 | ) |
| |
Class R | | | (864,204 | ) | | | (1,493,496 | ) |
| |
Class Y | | | (42,113,326 | ) | | | (65,671,575 | ) |
| |
Class R5 | | | 100 | | | | – | |
| |
Class R6 | | | (2,569,837 | ) | | | (213,443,598 | ) |
| |
Net increase (decrease) in net assets resulting from share transactions | | | (74,363,401 | ) | | | (324,641,395 | ) |
| |
Net increase (decrease) in net assets | | | (118,669,872 | ) | | | (303,420,323 | ) |
| |
| | |
Net assets: | | | | | | | | |
Beginning of year | | | 505,222,568 | | | | 808,642,891 | |
| |
End of year | | $ | 386,552,696 | | | $ | 505,222,568 | |
| |
See accompanying Notes to Consolidated Financial Statements which are an integral part of the financial statements.
| | |
| 25 | | Invesco Fundamental Alternatives Fund |
Consolidated Financial Highlights
The following schedule presents financial highlights for a share of the Fund outstanding throughout the periods indicated.
| | | | | | | | | | | | | | | | | | | | | | | | | | | | | | | | | | | | | | | | | | | | | | | | | | | | | | | | | | | | | | | | | |
| | | Net asset value, beginning of period | | Net investment income (loss)(a) | | Net gains (losses) on securities (both realized and unrealized) | | Total from investment operations | | Dividends from net investment income | | Net asset value, end of period | | Total return (b) | | Net assets, end of period (000’s omitted) | | Ratio of expenses to average net assets with fee waivers and/or expenses absorbed | | Ratio of expenses to average net assets without fee waivers and/or expenses absorbed(c) | | Supplemental ratio of expenses to average net assets with fee waivers (excluding interest, facilities and maintenance fees) | | Ratio of net investment income (loss) to average net assets | | Portfolio turnover (d) |
Class A | | | | | | | | | | | | | | | | | | | | | | | | | | | | | | | | | | | | | | | | | | | | | | | | | | | | | | | | | | | | | | | | | |
Year ended 10/31/22 | | | | $27.26 | | | | | $(0.05 | ) | | | | $(1.69 | ) | | | | $(1.74 | ) | | | | $(0.77 | ) | | | | $24.75 | | | | | (6.60 | )% | | | | $304,850 | | | | | 1.33 | % | | | | 1.34 | % | | | | 1.33 | % | | | | (0.20 | )% | | | | 29 | % |
Year ended 10/31/21 | | | | 26.50 | | | | | (0.08 | ) | | | | 1.35 | | | | | 1.27 | | | | | (0.51 | ) | | | | 27.26 | | | | | 4.84 | | | | | 362,634 | | | | | 1.32 | | | | | 1.38 | | | | | 1.32 | | | | | (0.27 | ) | | | | 74 | |
Year ended 10/31/20 | | | | 26.83 | | | | | 0.28 | | | | | (0.07 | ) | | | | 0.21 | | | | | (0.54 | ) | | | | 26.50 | | | | | 0.77 | | | | | 386,680 | | | | | 1.56 | | | | | 1.61 | | | | | 1.52 | | | | | 1.07 | | | | | 223 | |
Year ended 10/31/19 | | | | 27.42 | | | | | 0.69 | | | | | (0.82 | ) | | | | (0.13 | ) | | | | (0.46 | ) | | | | 26.83 | | | | | (0.45 | ) | | | | 441,060 | | | | | 1.64 | | | | | 1.71 | | | | | 1.38 | | | | | 2.59 | | | | | 289 | |
Year ended 10/31/18 | | | | 27.21 | | | | | 0.45 | | | | | 0.19 | | | | | 0.64 | | | | | (0.43 | ) | | | | 27.42 | | | | | 2.34 | | | | | 477,683 | | | | | 1.96 | | | | | 1.99 | | | | | 1.35 | | | | | 1.67 | | | | | 155 | |
Class C | | | | | | | | | | | | | | | | | | | | | | | | | | | | | | | | | | | | | | | | | | | | | | | | | | | | | | | | | | | | | | | | | |
Year ended 10/31/22 | | | | 24.02 | | | | | (0.21 | ) | | | | (1.50 | ) | | | | (1.71 | ) | | | | (0.56 | ) | | | | 21.75 | | | | | (7.32 | ) | | | | 13,916 | | | | | 2.08 | | | | | 2.09 | | | | | 2.08 | | | | | (0.95 | ) | | | | 29 | |
Year ended 10/31/21 | | | | 23.36 | | | | | (0.25 | ) | | | | 1.21 | | | | | 0.96 | | | | | (0.30 | ) | | | | 24.02 | | | | | 4.11 | | | | | 19,401 | | | | | 2.08 | | | | | 2.13 | | | | | 2.08 | | | | | (1.03 | ) | | | | 74 | |
Year ended 10/31/20 | | | | 23.60 | | | | | 0.07 | | | | | (0.07 | ) | | | | 0.00 | | | | | (0.24 | ) | | | | 23.36 | | | | | 0.00 | | | | | 27,495 | | | | | 2.33 | | | | | 2.35 | | | | | 2.28 | | | | | 0.30 | | | | | 223 | |
Year ended 10/31/19 | | | | 24.17 | | | | | 0.43 | | | | | (0.74 | ) | | | | (0.31 | ) | | | | (0.26 | ) | | | | 23.60 | | | | | (1.25 | ) | | | | 38,860 | | | | | 2.42 | | | | | 2.47 | | | | | 2.14 | | | | | 1.81 | | | | | 289 | |
Year ended 10/31/18 | | | | 24.03 | | | | | 0.22 | | | | | 0.16 | | | | | 0.38 | | | | | (0.24 | ) | | | | 24.17 | | | | | 1.59 | | | | | 89,319 | | | | | 2.72 | | | | | 2.75 | | | | | 2.11 | | | | | 0.90 | | | | | 155 | |
Class R | | | | | | | | | | | | | | | | | | | | | | | | | | | | | | | | | | | | | | | | | | | | | | | | | | | | | | | | | | | | | | | | | |
Year ended 10/31/22 | | | | 26.00 | | | | | (0.11 | ) | | | | (1.62 | ) | | | | (1.73 | ) | | | | (0.70 | ) | | | | 23.57 | | | | | (6.87 | ) | | | | 10,728 | | | | | 1.58 | | | | | 1.59 | | | | | 1.58 | | | | | (0.45 | ) | | | | 29 | |
Year ended 10/31/21 | | | | 25.29 | | | | | (0.14 | ) | | | | 1.29 | | | | | 1.15 | | | | | (0.44 | ) | | | | 26.00 | | | | | 4.58 | | | | | 12,755 | | | | | 1.58 | | | | | 1.63 | | | | | 1.58 | | | | | (0.53 | ) | | | | 74 | |
Year ended 10/31/20 | | | | 25.60 | | | | | 0.21 | | | | | (0.07 | ) | | | | 0.14 | | | | | (0.45 | ) | | | | 25.29 | | | | | 0.51 | | | | | 13,867 | | | | | 1.82 | | | | | 1.86 | | | | | 1.78 | | | | | 0.81 | | | | | 223 | |
Year ended 10/31/19 | | | | 26.18 | | | | | 0.59 | | | | | (0.78 | ) | | | | (0.19 | ) | | | | (0.39 | ) | | | | 25.60 | | | | | (0.70 | ) | | | | 16,296 | | | | | 1.91 | | | | | 1.97 | | | | | 1.64 | | | | | 2.33 | | | | | 289 | |
Year ended 10/31/18 | | | | 26.02 | | | | | 0.36 | | | | | 0.17 | | | | | 0.53 | | | | | (0.37 | ) | | | | 26.18 | | | | | 2.07 | | | | | 19,426 | | | | | 2.23 | | | | | 2.26 | | | | | 1.62 | | | | | 1.40 | | | | | 155 | |
Class Y | | | | | | | | | | | | | | | | | | | | | | | | | | | | | | | | | | | | | | | | | | | | | | | | | | | | | | | | | | | | | | | | | |
Year ended 10/31/22 | | | | 27.94 | | | | | 0.02 | | | | | (1.75 | ) | | | | (1.73 | ) | | | | (0.84 | ) | | | | 25.37 | | | | | (6.41 | ) | | | | 53,389 | | | | | 1.08 | | | | | 1.09 | | | | | 1.08 | | | | | 0.05 | | | | | 29 | |
Year ended 10/31/21 | | | | 27.14 | | | | | (0.01 | ) | | | | 1.39 | | | | | 1.38 | | | | | (0.58 | ) | | | | 27.94 | | | | | 5.14 | | | | | 103,680 | | | | | 1.07 | | | | | 1.13 | | | | | 1.07 | | | | | (0.02 | ) | | | | 74 | |
Year ended 10/31/20 | | | | 27.47 | | | | | 0.36 | | | | | (0.08 | ) | | | | 0.28 | | | | | (0.61 | ) | | | | 27.14 | | | | | 1.00 | | | | | 165,217 | | | | | 1.31 | | | | | 1.35 | | | | | 1.27 | | | | | 1.32 | | | | | 223 | |
Year ended 10/31/19 | | | | 28.07 | | | | | 0.77 | | | | | (0.84 | ) | | | | (0.07 | ) | | | | (0.53 | ) | | | | 27.47 | | | | | (0.22 | ) | | | | 266,741 | | | | | 1.41 | | | | | 1.47 | | | | | 1.14 | | | | | 2.82 | | | | | 289 | |
Year ended 10/31/18 | | | | 27.86 | | | | | 0.52 | | | | | 0.19 | | | | | 0.71 | | | | | (0.50 | ) | | | | 28.07 | | | | | 2.59 | | | | | 352,559 | | | | | 1.73 | | | | | 1.76 | | | | | 1.12 | | | | | 1.90 | | | | | 155 | |
Class R5 | | | | | | | | | | | | | | | | | | | | | | | | | | | | | | | | | | | | | | | | | | | | | | | | | | | | | | | | | | | | | | | | | |
Year ended 10/31/22 | | | | 27.29 | | | | | 0.05 | | | | | (1.69 | ) | | | | (1.64 | ) | | | | (0.89 | ) | | | | 24.76 | | | | | (6.25 | ) | | | | 9 | | | | | 0.93 | | | | | 0.94 | | | | | 0.93 | | | | | 0.20 | | | | | 29 | |
Year ended 10/31/21 | | | | 26.55 | | | | | 0.03 | | | | | 1.35 | | | | | 1.38 | | | | | (0.64 | ) | | | | 27.29 | | | | | 5.24 | | | | | 10 | | | | | 0.91 | | | | | 0.92 | | | | | 0.91 | | | | | 0.14 | | | | | 74 | |
Year ended 10/31/20 | | | | 26.87 | | | | | 0.39 | | | | | (0.05 | ) | | | | 0.34 | | | | | (0.66 | ) | | | | 26.55 | | | | | 1.23 | | | | | 10 | | | | | 1.14 | | | | | 1.15 | | | | | 1.10 | | | | | 1.49 | | | | | 223 | |
Period ended 10/31/19(e) | | | | 26.56 | | | | | 0.35 | | | | | (0.04 | ) | | | | 0.31 | | | | | – | | | | | 26.87 | | | | | 1.17 | | | | | 10 | | | | | 1.25 | (f) | | | | 1.35 | (f) | | | | 1.02 | (f) | | | | 2.97 | (f) | | | | 289 | |
Class R6 | | | | | | | | | | | | | | | | | | | | | | | | | | | | | | | | | | | | | | | | | | | | | | | | | | | | | | | | | | | | | | | | | |
Year ended 10/31/22 | | | | 28.09 | | | | | 0.06 | | | | | (1.75 | ) | | | | (1.69 | ) | | | | (0.89 | ) | | | | 25.51 | | | | | (6.25 | ) | | | | 3,660 | | | | | 0.93 | | | | | 0.94 | | | | | 0.93 | | | | | 0.20 | | | | | 29 | |
Year ended 10/31/21 | | | | 27.27 | | | | | 0.04 | | | | | 1.42 | | | | | 1.46 | | | | | (0.64 | ) | | | | 28.09 | | | | | 5.40 | | | | | 6,743 | | | | | 0.90 | | | | | 0.92 | | | | | 0.90 | | | | | 0.15 | | | | | 74 | |
Year ended 10/31/20 | | | | 27.60 | | | | | 0.41 | | | | | (0.08 | ) | | | | 0.33 | | | | | (0.66 | ) | | | | 27.27 | | | | | 1.19 | | | | | 215,374 | | | | | 1.12 | | | | | 1.14 | | | | | 1.08 | | | | | 1.51 | | | | | 223 | |
Year ended 10/31/19 | | | | 28.21 | | | | | 0.82 | | | | | (0.86 | ) | | | | (0.04 | ) | | | | (0.57 | ) | | | | 27.60 | | | | | (0.08 | ) | | | | 175,917 | | | | | 1.23 | | | | | 1.29 | | | | | 0.96 | | | | | 3.00 | | | | | 289 | |
Year ended 10/31/18 | | | | 28.00 | | | | | 0.57 | | | | | 0.19 | | | | | 0.76 | | | | | (0.55 | ) | | | | 28.21 | | | | | 2.77 | | | | | 211,904 | | | | | 1.58 | | | | | 1.61 | | | | | 0.97 | | | | | 2.05 | | | | | 155 | |
| (a) | Calculated using average shares outstanding. |
| (b) | Includes adjustments in accordance with accounting principles generally accepted in the United States of America and as such, the net asset value for financial reporting purposes and the returns based upon those net asset values may differ from the net asset value and returns for shareholder transactions. Does not include sales charges and is not annualized for periods less than one year, if applicable. |
| (c) | Does not include indirect expenses from affiliated fund fees and expenses of 0.02%, 0.01% and 0.00% for the years ended October 31, 2020, 2019 and 2018, respectively. |
| (d) | Portfolio turnover is calculated at the fund level and is not annualized for periods less than one year, if applicable. |
| (e) | Commencement date after the close of business on May 24, 2019. |
See accompanying Notes to Consolidated Financial Statements which are an integral part of the financial statements.
| | |
| 26 | | Invesco Fundamental Alternatives Fund |
Notes to Consolidated Financial Statements
October 31, 2022
NOTE 1–Significant Accounting Policies
Invesco Fundamental Alternatives Fund (the “Fund”) is a series portfolio of AIM Investment Funds (Invesco Investment Funds) (the “Trust”). The Trust is organized as a Delaware statutory trust and is registered under the Investment Company Act of 1940, as amended (the “1940 Act”), as an open-end series management investment company authorized to issue an unlimited number of shares of beneficial interest. Information presented in these consolidated financial statements pertains only to the Fund and the Invesco Fundamental Alternatives Fund (Cayman) Ltd. (the “Subsidiary”), a wholly-owned subsidiary of the Fund organized under the laws of the Cayman Islands. Matters affecting the Fund or each class will be voted on exclusively by the shareholders of the Fund or each class.
The Fund will seek to gain exposure to commodity-linked derivatives primarily through investments in the Subsidiary. The Subsidiary was organized by the Fund to invest in commodity-linked derivatives (including commodity futures, financial futures, options and swap contracts), and certain fixed-income securities and other investments that may serve as margin or collateral for its derivatives positions. The Fund may invest up to 25% of its total assets in the Subsidiary.
The Fund’s investment objective is to seek total return.
The Fund currently consists of six different classes of shares: Class A, Class C, Class R, Class Y, Class R5 and Class R6. Class Y shares are available only to certain investors. Class A shares are sold with a front-end sales charge unless certain waiver criteria are met. Under certain circumstances, load waived shares may be subject to contingent deferred sales charges (“CDSC”). Class C shares are sold with a CDSC. Class R, Class Y, Class R5 and Class R6 shares are sold at net asset value. Class C shares held for eight years after purchase are eligible for automatic conversion into Class A shares of the same Fund (the “Conversion Feature”). The automatic conversion pursuant to the Conversion Feature will generally occur at the end of the month following the eighth anniversary after a purchase of Class C shares.
The Fund is an investment company and accordingly follows the investment company accounting and reporting guidance in accordance with Financial Accounting Standards Board Accounting Standards Codification Topic 946, Financial Services - Investment Companies.
The following is a summary of the significant accounting policies followed by the Fund in the preparation of its consolidated financial statements.
| A. | Security Valuations – Securities, including restricted securities, are valued according to the following policy. |
Fixed income securities (including convertible debt securities) generally are valued on the basis of prices provided by independent pricing services. Prices provided by the pricing service may be determined without exclusive reliance on quoted prices, and may reflect appropriate factors such as institution-size trading in similar groups of securities, developments related to specific securities, dividend rate (for unlisted equities), yield (for debt obligations), quality, type of issue, coupon rate (for debt obligations), maturity (for debt obligations), individual trading characteristics and other market data. Pricing services generally value debt obligations assuming orderly transactions of institutional round lot size, but a fund may hold or transact in the same securities in smaller, odd lot sizes. Odd lots often trade at lower prices than institutional round lots, and their value may be adjusted accordingly. Debt obligations are subject to interest rate and credit risks. In addition, all debt obligations involve some risk of default with respect to interest and/or principal payments.
A security listed or traded on an exchange is generally valued at its trade price or official closing price that day as of the close of the exchange where the security is principally traded, or lacking any trades or official closing price on a particular day, the security may be valued at the closing bid price on that day. Securities traded in the over-the-counter market are valued based on prices furnished by independent pricing services or market makers. When such securities are valued using prices provided by an independent pricing service they may be considered fair valued. Futures contracts are valued at the daily settlement price set by an exchange on which they are principally traded. U.S. exchange-traded options are valued at the mean between the last bid and asked prices from the exchange on which they are principally traded. Non-U.S. exchange-traded options are valued at the final settlement price set by the exchange on which they trade. Options not listed on an exchange and swaps generally are valued using pricing provided from independent pricing services.
Securities of investment companies that are not exchange-traded (e.g., open-end mutual funds) are valued using such company’s end-of-business-day net asset value per share.
Deposits, other obligations of U.S. and non-U.S. banks and financial institutions are valued at their daily account value.
Swap agreements are fair valued using an evaluated quote, if available, provided by an independent pricing service. Evaluated quotes provided by the pricing service are valued based on a model which may include end-of-day net present values, spreads, ratings, industry, company performance and returns of referenced assets. Centrally cleared swap agreements are valued at the daily settlement price determined by the relevant exchange or clearinghouse.
Foreign securities’ (including foreign exchange contracts) prices are converted into U.S. dollar amounts using the applicable exchange rates as of the close of the New York Stock Exchange (“NYSE”). If market quotations are available and reliable for foreign exchange-traded equity securities, the securities will be valued at the market quotations. Invesco Advisers, Inc. (the “Adviser” or “Invesco”) may use various pricing services to obtain market quotations as well as fair value prices. Because trading hours for certain foreign securities end before the close of the NYSE, closing market quotations may become not representative of market value in the Adviser’s judgment (“unreliable”). If, between the time trading ends on a particular security and the close of the customary trading session on the NYSE, a significant event occurs that makes the closing price of the security unreliable, the Adviser may fair value the security. If the event is likely to have affected the closing price of the security, the security will be valued at fair value in good faith in accordance with Board- approved policies and related Adviser procedures (“Valuation Procedures”). Adjustments to closing prices to reflect fair value may also be based on a screening process of an independent pricing service to indicate the degree of certainty, based on historical data, that the closing price in the principal market where a foreign security trades is not the current value as of the close of the NYSE. Foreign securities’ prices meeting the degree of certainty that the price is not reflective of current value will be priced at the indication of fair value from the independent pricing service. Multiple factors may be considered by the independent pricing service in determining adjustments to reflect fair value and may include information relating to sector indices, American Depositary Receipts and domestic and foreign index futures. Foreign securities may have additional risks including exchange rate changes, potential for sharply devalued currencies and high inflation, political and economic upheaval, the relative lack of issuer information, relatively low market liquidity and the potential lack of strict financial and accounting controls and standards.
Unlisted securities will be valued using prices provided by independent pricing services or by another method that the Adviser, in its judgment, believes better reflects the security’s fair value in accordance with the Valuation Procedures.
Securities for which market prices are not provided by any of the above methods may be valued based upon quotes furnished by independent sources. The last bid price may be used to value equity securities. The mean between the last bid and asked prices may be used to value debt obligations, including corporate loans.
Securities for which market quotations are not readily available are fair valued by the Adviser in accordance with the Valuation Procedures. If a fair value price provided by a pricing service is unreliable, the Adviser will fair value the security using the Valuation Procedures. Issuer specific events, market trends, bid/asked quotes of brokers and information providers and other market data may be reviewed in the course of making a good faith determination of a security’s fair value.
The Fund may invest in securities that are subject to interest rate risk, meaning the risk that the prices will generally fall as interest rates rise and, conversely, the prices will generally rise as interest rates fall. Specific securities differ in their sensitivity to changes in interest rates depending on their individual characteristics. Changes in interest rates may result in increased market volatility, which may affect the value and/or liquidity of certain Fund investments.
Valuations change in response to many factors including the historical and prospective earnings of the issuer, the value of the issuer’s assets, general market conditions which are not specifically related to the particular issuer, such as real or perceived adverse economic conditions, changes in the general outlook for revenues or corporate earnings, changes in interest or currency rates, regional or global instability, natural or environmental disasters, widespread disease or
| | |
| 27 | | Invesco Fundamental Alternatives Fund |
other public health issues, war, acts of terrorism, significant governmental actions or adverse investor sentiment generally and market liquidity. Because of the inherent uncertainties of valuation, the values reflected in the financial statements may materially differ from the value received upon actual sale of those investments.
The price the Fund could receive upon the sale of any investment may differ from the Adviser’s valuation of the investment, particularly for securities that are valued using a fair valuation technique. When fair valuation techniques are applied, the Adviser uses available information, including both observable and unobservable inputs and assumptions, to determine a methodology that will result in a valuation that the Adviser believes approximates market value. Fund securities that are fair valued may be subject to greater fluctuation in their value from one day to the next than would be the case if market quotations were used. Because of the inherent uncertainties of valuation, and the degree of subjectivity in such decisions, the Fund could realize a greater or lesser than expected gain or loss upon the sale of the investment.
| B. | Securities Transactions and Investment Income – Securities transactions are accounted for on a trade date basis. Realized gains or losses on sales are computed on the basis of specific identification of the securities sold. Interest income (net of withholding tax, if any) is recorded on an accrual basis from settlement date and includes coupon interest and amortization of premium and accretion of discount on debt securities as applicable. Pay-in-kind interest income and non-cash dividend income received in the form of securities in-lieu of cash are recorded at the fair value of the securities received. Paydown gains and losses on mortgage and asset-backed securities are recorded as adjustments to interest income. Dividend income (net of withholding tax, if any) is recorded on the ex-dividend date. |
The Fund may periodically participate in litigation related to Fund investments. As such, the Fund may receive proceeds from litigation settlements. Any proceeds received are included in the Consolidated Statement of Operations as realized gain (loss) for investments no longer held and as unrealized gain (loss) for investments still held.
Brokerage commissions and mark ups are considered transaction costs and are recorded as an increase to the cost basis of securities purchased and/or a reduction of proceeds on a sale of securities. Such transaction costs are included in the determination of net realized and unrealized gain (loss) from investment securities reported in the Consolidated Statement of Operations and the Consolidated Statement of Changes in Net Assets and the net realized and unrealized gains (losses) on securities per share in the Consolidated Financial Highlights. Transaction costs are included in the calculation of the Fund’s net asset value and, accordingly, they reduce the Fund’s total returns. These transaction costs are not considered operating expenses and are not reflected in net investment income reported in the Consolidated Statement of Operations and the Consolidated Statement of Changes in Net Assets, or the net investment income per share and the ratios of expenses and net investment income reported in the Consolidated Financial Highlights, nor are they limited by any expense limitation arrangements between the Fund and the investment adviser.
The Fund allocates income and realized and unrealized capital gains and losses to a class based on the relative net assets of each class.
| C. | Country Determination – For the purposes of making investment selection decisions and presentation in the Consolidated Schedule of Investments, the investment adviser may determine the country in which an issuer is located and/or credit risk exposure based on various factors. These factors include the laws of the country under which the issuer is organized, where the issuer maintains a principal office, the country in which the issuer derives 50% or more of its total revenues, the country that has the primary market for the issuer’s securities and its “country of risk” as determined by a third party service provider, as well as other criteria. Among the other criteria that may be evaluated for making this determination are the country in which the issuer maintains 50% or more of its assets, the type of security, financial guarantees and enhancements, the nature of the collateral and the sponsor organization. Country of issuer and/or credit risk exposure has been determined to be the United States of America, unless otherwise noted. |
| D. | Distributions – Distributions from net investment income and net realized capital gain, if any, are generally declared and paid annually and recorded on the ex-dividend date. The Fund may elect to treat a portion of the proceeds from redemptions as distributions for federal income tax purposes. |
| E. | Federal Income Taxes – The Fund intends to comply with the requirements of Subchapter M of the Internal Revenue Code of 1986, as amended (the “Internal Revenue Code”), necessary to qualify as a regulated investment company and to distribute substantially all of the Fund’s taxable earnings to shareholders. As such, the Fund will not be subject to federal income taxes on otherwise taxable income (including net realized capital gain) that is distributed to shareholders. Therefore, no provision for federal income taxes is recorded in the consolidated financial statements. |
The Fund recognizes the tax benefits of uncertain tax positions only when the position is more likely than not to be sustained. Management has analyzed the Fund’s uncertain tax positions and concluded that no liability for unrecognized tax benefits should be recorded related to uncertain tax positions. Management is not aware of any tax positions for which it is reasonably possible that the total amounts of unrecognized tax benefits will change materially in the next 12 months.
The Subsidiary is classified as a controlled foreign corporation under Subchapter N of the Internal Revenue Code. Therefore, the Fund is required to increase its taxable income by its share of the Subsidiary’s income. Net investment losses of the Subsidiary cannot be deducted by the Fund in the current period nor carried forward to offset taxable income in future periods.
The Fund files tax returns in the U.S. Federal jurisdiction and certain other jurisdictions. Generally the Fund is subject to examinations by such taxing authorities for up to three years after the filing of the return for the tax period.
| F. | Expenses – Fees provided for under the Rule 12b-1 plan of a particular class of the Fund are charged to the operations of such class. Transfer agency fees and expenses and other shareholder recordkeeping fees and expenses attributable to Class R5 and Class R6 are allocated based on relative net assets of Class R5 and Class R6. Sub-accounting fees attributable to Class R5 are charged to the operations of the class. Transfer agency fees and expenses and other shareholder recordkeeping fees and expenses relating to all other classes are allocated among those classes based on relative net assets. All other expenses are allocated among the classes based on relative net assets. |
| G. | Accounting Estimates – The financial statements are prepared on a consolidated basis in conformity with accounting principles generally accepted in the United States of America (“GAAP”), which requires management to make estimates and assumptions that affect the reported amounts of assets and liabilities at the date of the financial statements and the reported amounts of revenues and expenses during the reporting period including estimates and assumptions related to taxation. Actual results could differ from those estimates by a significant amount. The accompanying financial statements reflect the financial position of the Fund and its Subsidiary and the results of operations on a consolidated basis. All inter-company accounts and transactions have been eliminated in consolidation. |
In addition, the Fund monitors for material events or transactions that may occur or become known after the period-end date and before the date the consolidated financial statements are released to print.
| H. | Indemnifications – Under the Trust’s organizational documents, each Trustee, officer, employee or other agent of the Trust, and under the Subsidiary’s organizational documents, the directors and officers of the Subsidiary, are indemnified against certain liabilities that may arise out of the performance of their duties to the Fund and/or the Subsidiary, respectively. Additionally, in the normal course of business, the Fund enters into contracts, including the Fund’s servicing agreements, that contain a variety of indemnification clauses. The Fund’s maximum exposure under these arrangements is unknown as this would involve future claims that may be made against the Fund that have not yet occurred. The risk of material loss as a result of such indemnification claims is considered remote. |
| I. | Securities Purchased on a When-Issued and Delayed Delivery Basis – The Fund may purchase and sell interests in corporate loans and corporate debt securities and other portfolio securities on a when-issued and delayed delivery basis, with payment and delivery scheduled for a future date. No income accrues to the Fund on such interests or securities in connection with such transactions prior to the date the Fund actually takes delivery of such interests or securities. These transactions are subject to market fluctuations and are subject to the risk that the value at delivery may be more or less than the trade date purchase price. Although the Fund will generally purchase these securities with the intention of acquiring such securities, they may sell such securities prior to the settlement date. |
| | |
| 28 | | Invesco Fundamental Alternatives Fund |
| J. | Structured Securities – The Fund may invest in structured securities. Structured securities are a type of derivative security whose value is determined by reference to changes in the value of underlying securities, currencies, interest rates, commodities, indices or other financial indicators (“reference instruments”). Most structured securities are fixed-income securities that have maturities of three years or less. Structured securities may be positively or negatively indexed (i.e., their principal value or interest rates may increase or decrease if the underlying reference instrument appreciates) and may have return characteristics similar to direct investments in the underlying reference instrument. |
Structured securities may entail a greater degree of market risk than other types of debt securities because the investor bears the risk of the reference instruments. In addition to the credit risk of structured securities and the normal risks of price changes in response to changes in interest rates, the principal amount of structured notes or indexed securities may decrease as a result of changes in the value of the underlying reference instruments. Changes in the daily value of structured securities are recorded as unrealized gains (losses) in the Consolidated Statement of Operations. When the structured securities mature or are sold, the Fund recognizes a realized gain (loss) on the Consolidated Statement of Operations.
| K. | Securities Lending – The Fund may lend portfolio securities having a market value up to one-third of the Fund’s total assets. Such loans are secured by collateral equal to no less than the market value of the loaned securities determined daily by the securities lending provider. Such collateral will be cash or debt securities issued or guaranteed by the U.S. Government or any of its sponsored agencies. Cash collateral received in connection with these loans is invested in short-term money market instruments or affiliated, unregistered investment companies that comply with Rule 2a-7 under the 1940 Act and money market funds (collectively, “affiliated money market funds”) and is shown as such on the Consolidated Schedule of Investments. The Fund bears the risk of loss with respect to the investment of collateral. It is the Fund’s policy to obtain additional collateral from or return excess collateral to the borrower by the end of the next business day, following the valuation date of the securities loaned. Therefore, the value of the collateral held may be temporarily less than the value of the securities on loan. When loaning securities, the Fund retains certain benefits of owning the securities, including the economic equivalent of dividends or interest generated by the security. Lending securities entails a risk of loss to the Fund if, and to the extent that, the market value of the securities loaned were to increase and the borrower did not increase the collateral accordingly, and the borrower failed to return the securities. The securities loaned are subject to termination at the option of the borrower or the Fund. Upon termination, the borrower will return to the Fund the securities loaned and the Fund will return the collateral. Upon the failure of the borrower to return the securities, collateral may be liquidated and the securities may be purchased on the open market to replace the loaned securities. The Fund could experience delays and costs in gaining access to the collateral and the securities may lose value during the delay which could result in potential losses to the Fund. Some of these losses may be indemnified by the lending agent. The Fund bears the risk of any deficiency in the amount of the collateral available for return to the borrower due to any loss on the collateral invested. Dividends received on cash collateral investments for securities lending transactions, which are net of compensation to counterparties, are included in Dividends from affiliated money market funds on the Consolidated Statement of Operations. The aggregate value of securities out on loan, if any, is shown as a footnote on the Consolidated Statement of Assets and Liabilities. |
The Adviser serves as an affiliated securities lending agent for the Fund. The Bank of New York Mellon also serves as a lending agent. To the extent the Fund utilizes the Adviser as an affiliated securities lending agent, the Fund conducts its securities lending in accordance with, and in reliance upon, no-action letters issued by the SEC staff that provide guidance on how an affiliate may act as a direct agent lender and receive compensation for those services in a manner consistent with the federal securities laws. For the year ended October 31, 2022, the Fund paid the Adviser $1,078 in fees for securities lending agent services. Fees paid to the Adviser for securities lending agent services are included in Dividends from affiliated money market funds on the Consolidated Statement of Operations.
| L. | Securities Sold Short – The Fund may enter into short sales of securities which it concurrently holds (against the box) or for which it holds no corresponding position (naked). Securities sold short represent a liability of the Fund to acquire specific securities at prevailing market prices at a future date in order to satisfy the obligation to deliver the securities sold. The liability is recorded on the books of the Fund at the market value of the common stock determined each day in accordance with the procedures for security valuations. The Fund will incur a loss if the price of the security increases between the date of the short sale and the date on which the Fund replaces the borrowed security. The Fund realizes a gain if the price of the security declines between those dates. |
The Fund is required to segregate cash or securities as collateral in margin accounts at a level that is equal to the obligation to the broker who delivered such securities to the buyer on behalf of the Fund. The Short stock rebate, if any, presented in the Consolidated Statement of Operations represents the net income earned on short sale proceeds held on deposit with the broker and margin interest earned or incurred on short sale transactions. Margin interest is the income earned (or expense incurred) as a result of the market value of securities sold short being less than (or greater than) the proceeds received from the short sales.
| M. | Foreign Currency Translations – Foreign currency is valued at the close of the NYSE based on quotations posted by banks and major currency dealers. Portfolio securities and other assets and liabilities denominated in foreign currencies are translated into U.S. dollar amounts at the date of valuation. Purchases and sales of portfolio securities (net of foreign taxes withheld on disposition) and income items denominated in foreign currencies are translated into U.S. dollar amounts on the respective dates of such transactions. The Fund does not separately account for the portion of the results of operations resulting from changes in foreign exchange rates on investments and the fluctuations arising from changes in market prices of securities held. The combined results of changes in foreign exchange rates and the fluctuation of market prices on investments (net of estimated foreign tax withholding) are included with the net realized and unrealized gain or loss from investments in the Consolidated Statement of Operations. Reported net realized foreign currency gains or losses arise from (1) sales of foreign currencies, (2) currency gains or losses realized between the trade and settlement dates on securities transactions, and (3) the difference between the amounts of dividends, interest, and foreign withholding taxes recorded on the Fund’s books and the U.S. dollar equivalent of the amounts actually received or paid. Net unrealized foreign currency gains and losses arise from changes in the fair values of assets and liabilities, other than investments in securities at fiscal period end, resulting from changes in exchange rates. |
The Fund may invest in foreign securities, which may be subject to foreign taxes on income, gains on investments or currency repatriation, a portion of which may be recoverable. Foreign taxes, if any, are recorded based on the tax regulations and rates that exist in the foreign markets in which the Fund invests and are shown in the Consolidated Statement of Operations.
| N. | Forward Foreign Currency Contracts – The Fund may engage in foreign currency transactions either on a spot (i.e. for prompt delivery and settlement) basis, or through forward foreign currency contracts, to manage or minimize currency or exchange rate risk. |
The Fund may also enter into forward foreign currency contracts for the purchase or sale of a security denominated in a foreign currency in order to “lock in” the U.S. dollar price of that security, or the Fund may also enter into forward foreign currency contracts that do not provide for physical exchange of the two currencies on the settlement date, but instead are settled by a single cash payment calculated as the difference between the agreed upon exchange rate and the spot rate at settlement based upon an agreed upon notional amount (non-deliverable forwards).
A forward foreign currency contract is an obligation between two parties (“Counterparties”) to purchase or sell a specific currency for an agreed-upon price at a future date. The use of forward foreign currency contracts for hedging does not eliminate fluctuations in the price of the underlying securities the Fund owns or intends to acquire but establishes a rate of exchange in advance. Fluctuations in the value of these contracts are measured by the difference in the contract date and reporting date exchange rates and are recorded as unrealized appreciation (depreciation) until the contracts are closed. When the contracts are closed, realized gains (losses) are recorded. Realized and unrealized gains (losses) on the contracts are included in the Consolidated Statement of Operations. The primary risks associated with forward foreign currency contracts include failure of the Counterparty to meet the terms of the contract and the value of the foreign currency changing unfavorably. These risks may be in excess of the amounts reflected in the Consolidated Statement of Assets and Liabilities.
| O. | Futures Contracts – The Fund may enter into futures contracts to equitize the Fund’s cash holdings or to manage exposure to interest rate, equity, commodity and market price movements and/or currency risks. A futures contract is an agreement between Counterparties to purchase or sell a specified underlying security, currency or commodity (or delivery of a cash settlement price, in the case of an index future) for a fixed price at a future date. The Fund |
| | |
| 29 | | Invesco Fundamental Alternatives Fund |
| | currently invests only in exchange-traded futures and they are standardized as to maturity date and underlying financial instrument or asset. Initial margin deposits required upon entering into futures contracts are satisfied by the segregation of specific securities or cash as collateral at the futures commission merchant (broker). During the period the futures contracts are open, changes in the value of the contracts are recognized as unrealized gains or losses by recalculating the value of the contracts on a daily basis. Subsequent or variation margin payments are received or made depending upon whether unrealized gains or losses are incurred. These amounts are reflected as receivables or payables on the Consolidated Statement of Assets and Liabilities. When the contracts are closed or expire, the Fund recognizes a realized gain or loss equal to the difference between the proceeds from, or cost of, the closing transaction and the Fund’s basis in the contract. The net realized gain (loss) and the change in unrealized gain (loss) on futures contracts held during the period is included on the Consolidated Statement of Operations. The primary risks associated with futures contracts are market risk and the absence of a liquid secondary market. If the Fund were unable to liquidate a futures contract and/or enter into an offsetting closing transaction, the Fund would continue to be subject to market risk with respect to the value of the contracts and continue to be required to maintain the margin deposits on the futures contracts. Futures contracts have minimal Counterparty risk since the exchange’s clearinghouse, as Counterparty to all exchange-traded futures, guarantees the futures against default. Risks may exceed amounts recognized in the Consolidated Statement of Assets and Liabilities. |
| P. | Swap Agreements – The Fund may enter into various swap transactions, including interest rate, total return, volatility, variance, index, currency and credit default swap contracts (“CDS”) for investment purposes or to manage interest rate, equity, currency, commodity or credit risk. Such transactions are agreements between Counterparties. A swap agreement may be negotiated bilaterally and traded over-the-counter (“OTC”) between two parties (“uncleared/OTC”) or, in some instances, must be transacted through a future commission merchant (“FCM”) and cleared through a clearinghouse that serves as a central Counterparty (“centrally cleared swap”). These agreements may contain among other conditions, events of default and termination events, and various covenants and representations such as provisions that require the Fund to maintain a pre-determined level of net assets, and/or provide limits regarding the decline of the Fund’s net asset value (“NAV”) per share over specific periods of time. If the Fund were to trigger such provisions and have open derivative positions at that time, the Counterparty may be able to terminate such agreement and request immediate payment in an amount equal to the net liability positions, if any. |
Interest rate, total return, volatility, variance, index and currency swap agreements are two-party contracts entered into primarily to exchange the returns (or differentials in rates of returns) earned or realized on particular predetermined investments or instruments. The gross returns to be exchanged or “swapped” between the parties are calculated with respect to a notional amount, i.e., the return on or increase in value of a particular dollar amount invested at a particular interest rate or return of an underlying asset, in a particular foreign currency, or in a “basket” of securities representing a particular index.
Inflation swap agreements are contracts in which one party agrees to pay the cumulative percentage increase in a price index, such as the Consumer Price Index, over the term of the swap, and the other party pays a compounded fixed rate.
In a centrally cleared swap, the Fund’s ultimate Counterparty is a central clearinghouse. The Fund will initially enter into centrally cleared swaps through an executing broker. When a fund enters into a centrally cleared swap, it must deliver to the central Counterparty (via the FCM) an amount referred to as “initial margin.” Initial margin requirements are determined by the central Counterparty, but an FCM may require additional initial margin above the amount required by the central Counterparty. Initial margin deposits required upon entering into centrally cleared swaps are satisfied by cash or securities as collateral at the FCM. Securities deposited as initial margin are designated on the Consolidated Schedule of Investments and cash deposited is recorded on the Consolidated Statement of Assets and Liabilities. During the term of a cleared swap agreement, a “variation margin” amount may be required to be paid by the Fund or may be received by the Fund, based on the daily change in price of the underlying reference instrument subject to the swap agreement and is recorded as a receivable or payable for variation margin in the Consolidated Statement of Assets and Liabilities until the centrally cleared swap is terminated, at which time a realized gain or loss is recorded.
A CDS is an agreement between Counterparties to exchange the credit risk of an issuer. A buyer of a CDS is said to buy protection by paying a fixed payment over the life of the agreement and in some situations an upfront payment to the seller of the CDS. If a defined credit event occurs (such as payment default or bankruptcy), the Fund as a protection buyer would cease paying its fixed payment, the Fund would deliver eligible bonds issued by the reference entity to the seller, and the seller would pay the full notional value, or the “par value”, of the referenced obligation to the Fund. A seller of a CDS is said to sell protection and thus would receive a fixed payment over the life of the agreement and an upfront payment, if applicable. If a credit event occurs, the Fund as a protection seller would cease to receive the fixed payment stream, the Fund would pay the buyer “par value” or the full notional value of the referenced obligation, and the Fund would receive the eligible bonds issued by the reference entity. In turn, these bonds may be sold in order to realize a recovery value. Alternatively, the seller of the CDS and its Counterparty may agree to net the notional amount and the market value of the bonds and make a cash payment equal to the difference to the buyer of protection. If no credit event occurs, the Fund receives the fixed payment over the life of the agreement. As the seller, the Fund would effectively add leverage to its portfolio because, in addition to its total net assets, the Fund would be subject to investment exposure on the notional amount of the CDS. In connection with these agreements, cash and securities may be identified as collateral in accordance with the terms of the respective swap agreements to provide assets of value and recourse in the event of default under the swap agreement or bankruptcy/insolvency of a party to the swap agreement. If a Counterparty becomes bankrupt or otherwise fails to perform its obligations due to financial difficulties, the Fund may experience significant delays in obtaining any recovery in a bankruptcy or other reorganization proceeding. The Fund may obtain only limited recovery or may obtain no recovery in such circumstances. The Fund’s maximum risk of loss from Counterparty risk, either as the protection seller or as the protection buyer, is the value of the contract. The risk may be mitigated by having a master netting arrangement between the Fund and the Counterparty and by the designation of collateral by the Counterparty to cover the Fund’s exposure to the Counterparty.
Implied credit spreads represent the current level at which protection could be bought or sold given the terms of the existing CDS contract and serve as an indicator of the current status of the payment/performance risk of the CDS. An implied spread that has widened or increased since entry into the initial contract may indicate a deteriorating credit profile and increased risk of default for the reference entity. A declining or narrowing spread may indicate an improving credit profile or decreased risk of default for the reference entity. Alternatively, credit spreads may increase or decrease reflecting the general tolerance for risk in the credit markets.
A volatility swap involves an exchange between the Fund and a Counterparty of periodic payments based on the measured volatility of an underlying security, currency, commodity, interest rate, index or other reference asset over a specified time frame. Depending on the structure of the swap, either the Fund’s or the Counterparty’s payment obligation will typically be based on the realized volatility of the reference asset as measured by changes in its price or level over a specified time period, while the other party’s payment obligation will be based on a specified rate representing expected volatility for the reference asset at the time the swap is executed, or the measured volatility of a different reference asset over a specified time period. The Fund will typically make or lose money on a volatility swap depending on the magnitude of the reference asset’s volatility, or size of the movements in its price, over a specified time period, rather than general increases or decreases in the price of the reference asset. Volatility swaps are often used to speculate on future volatility levels, to trade the spread between realized and expected volatility, or to decrease the volatility exposure of other investments held by the Fund. Variance swaps are similar to volatility swaps, except payments are based on the difference between the implied and measured volatility mathematically squared.
An interest rate swap is an agreement between Counterparties pursuant to which the parties exchange a floating rate payment for a fixed rate payment based on a specified notional amount.
Changes in the value of centrally cleared and OTC swap agreements are recognized as unrealized gains (losses) in the Consolidated Statement of Operations by “marking to market” on a daily basis to reflect the value of the swap agreement at the end of each trading day. Payments received or paid at the beginning of the agreement are reflected as such on the Consolidated Statement of Assets and Liabilities and may be referred to as upfront payments. The Fund accrues for the fixed payment stream and amortizes upfront payments, if any, on swap agreements on a daily basis with the net amount, recorded as a component of realized gain
| | |
| 30 | | Invesco Fundamental Alternatives Fund |
(loss) on the Consolidated Statement of Operations. A liquidation payment received or made at the termination of a swap agreement is recorded as realized gain (loss) on the Consolidated Statement of Operations. Cash held as collateral is recorded as deposits with brokers on the Consolidated Statement of Assets and Liabilities. Entering into these agreements involves, to varying degrees, lack of liquidity and elements of credit, market, and Counterparty risk in excess of amounts recognized on the Consolidated Statement of Assets and Liabilities. Such risks involve the possibility that a swap is difficult to sell or liquidate, the Counterparty does not honor its obligations under the agreement and unfavorable interest rates and market fluctuations. It is possible that developments in the swaps market, including potential government regulation, could adversely affect the Fund’s ability to terminate existing swap agreements or to realize amounts to be received under such agreements. Additionally, an International Swaps and Derivatives Association Master Agreement (“ISDA Master Agreement”) includes credit related contingent features which allow Counterparties to OTC derivatives to terminate derivative contracts prior to maturity in the event that, for example, the Fund’s net assets decline by a stated percentage or the Fund fails to meet the terms of its ISDA master agreements, which would cause the Fund to accelerate payment of any net liability owed to the Counterparty. A short position in a security poses more risk than holding the same security long. As there is no limit on how much the price of the security can increase, the Fund’s exposure is unlimited.
Notional amounts of each individual credit default swap agreement outstanding as of October 31, 2022, if any, for which the Fund is the seller of protection are disclosed in the open swap agreements table. These potential amounts would be partially offset by any recovery values of the respective referenced obligations, upfront payments received upon entering into the agreement, or net amounts received from the settlement of buy protection credit default swap agreements entered into by the Fund for the same referenced entity or entities.
| Q. | Bank Loan Risk – Although the resale, or secondary market for floating rate loans has grown substantially over the past decade, both in overall size and number of market participants, there is no organized exchange or board of trade on which floating rate loans are traded. Instead, the secondary market for floating rate loans is a private, unregulated interdealer or interbank resale market. Such a market may therefore be subject to irregular trading activity, wide bid/ask spreads, and extended trade settlement periods, which may impair the Fund’s ability to sell bank loans within its desired time frame or at an acceptable price and its ability to accurately value existing and prospective investments. Extended trade settlement periods may result in cash not being immediately available to the Fund. As a result, the Fund may have to sell other investments or engage in borrowing transactions to raise cash to meet its obligations. Similar to other asset classes, bank loan funds may be exposed to counterparty credit risk, or the risk than an entity with which the Fund has unsettled or open transactions may fail to or be unable to perform on its commitments. The Fund seeks to manage counterparty credit risk by entering into transactions only with counterparties that it believes have the financial resources to honor their obligations and by monitoring the financial stability of those counterparties. |
| R. | Leverage Risk – Leverage exists when the Fund can lose more than it originally invests because it purchases or sells an instrument or enters into a transaction without investing an amount equal to the full economic exposure of the instrument or transaction. |
| S. | Collateral – To the extent the Fund has designated or segregated a security as collateral and that security is subsequently sold, it is the Fund’s practice to replace such collateral no later than the next business day. |
| T. | Other Risks – During the period, the Fund experienced a low interest rate environment created in part by the Federal Reserve Board (FRB) and certain foreign central banks keeping the federal funds and equivalent foreign rates near historical lows. Increases in the federal funds and equivalent foreign rates may expose fixed income markets to heightened volatility and reduced liquidity for certain fixed income investments, particularly those with longer maturities. In addition, decreases in fixed income dealer market-making capacity may also potentially lead to heightened volatility and reduced liquidity in the fixed income markets. As a result, the value of the Fund’s investments and share price may decline. Changes in central bank policies could also result in higher than normal shareholder redemptions, which could potentially increase portfolio turnover and the Fund’s transaction costs. |
Policy changes by the U.S. government or its regulatory agencies and political events within the U.S. and abroad may, among other things, affect investor and consumer confidence and increase volatility in the financial markets, perhaps suddenly and to a significant degree, which may adversely impact the Fund’s operations, universe of potential investment options, and return potential.
| U. | COVID-19 Risk – The COVID-19 strain of coronavirus has resulted in instances of market closures and dislocations, extreme volatility, liquidity constraints and increased trading costs. Efforts to contain its spread have resulted in travel restrictions, disruptions of healthcare systems, business operations (including business closures) and supply chains, layoffs, lower consumer demand and employee availability, and defaults and credit downgrades, among other significant economic impacts that have disrupted global economic activity across many industries. Such economic impacts may exacerbate other pre-existing political, social and economic risks locally or globally and cause general concern and uncertainty. The full economic impact and ongoing effects of COVID-19 (or other future epidemics or pandemics) at the macro-level and on individual businesses are unpredictable and may result in significant and prolonged effects on the Fund’s performance. |
NOTE 2–Advisory Fees and Other Fees Paid to Affiliates
The Trust has entered into a master investment advisory agreement with the Adviser. Under the terms of the investment advisory agreement, the Fund accrues daily and pays monthly an advisory fee to the Adviser based on the annual rate of the Fund’s average daily net assets as follows:
| | | | |
| Average Daily Net Assets | | Rate* | |
First $1.0 billion | | | 0.850 | % |
Next $500 million | | | 0.800 | % |
Next $500 million | | | 0.750 | % |
Next $500 million | | | 0.700 | % |
Next $500 million | | | 0.650 | % |
Next $500 million | | | 0.600 | % |
Next $500 million | | | 0.550 | % |
Over $4 billion | | | 0.500 | % |
| * | The advisory fee paid by the Fund shall be reduced by any amounts paid by the Fund under the administrative services agreement with the Adviser. |
For the year ended October 31, 2022, the effective advisory fee rate incurred by the Fund was 0.84%.
The Subsidiary has entered into a separate contract with the Adviser whereby the Adviser provides investment advisory and other services to the Subsidiary. In consideration of these services, the Subsidiary pays an advisory fee to the Adviser based on the annual rate of the Subsidiary’s average daily net assets as set forth in the table above.
Under the terms of a master sub-advisory agreement between the Adviser and each of Invesco Asset Management Deutschland GmbH, Invesco Asset Management Limited, Invesco Asset Management (Japan) Limited, Invesco Hong Kong Limited, Invesco Senior Secured Management, Inc. and Invesco Canada Ltd. and separate sub-advisory agreements with Invesco Capital Management LLC and Invesco Asset Management (India) Private Limited (collectively, the “Affiliated Sub-Advisers”) the Adviser, not the Fund, will pay 40% of the fees paid to the Adviser to any such Affiliated Sub-Adviser(s) that provide(s) discretionary investment management services to the Fund based on the percentage of assets allocated to such Affiliated Sub-Adviser(s). Invesco has also entered into a sub-advisory agreement with OppenheimerFunds, Inc. to provide discretionary management services to the Fund.
| | |
| 31 | | Invesco Fundamental Alternatives Fund |
The Adviser has contractually agreed, through at least June 30, 2023, to waive advisory fees and/or reimburse expenses to the extent necessary to limit total annual fund operating expenses after fee waiver and/or expense reimbursement (excluding certain items discussed below) of Class A, Class C, Class R, Class Y, Class R5 and Class R6 shares to 2.00%, 2.75%, 2.25%, 1.75%, 1.75% and 1.75%, respectively, of the Fund’s average daily net assets (the “expense limits”). In determining the Adviser’s obligation to waive advisory fees and/or reimburse expenses, the following expenses are not taken into account, and could cause total annual fund operating expenses after fee waiver and/or expense reimbursement to exceed the numbers reflected above: (1) interest, facilities and maintenance fees; (2) taxes; (3) dividend expense on short sales; (4) extraordinary or non-routine items, including litigation expenses; and (5) expenses that the Fund has incurred but did not actually pay because of an expense offset arrangement. Acquired Fund Fees and Expenses are not operating expenses of a Fund directly, but are fees and expenses, including management fees, of the investment companies in which a Fund invests. As a result, the total annual fund operating expenses after expense reimbursement may exceed the expense limits above. Unless Invesco continues the fee waiver agreement, it will terminate on June 30, 2023. During its term, the fee waiver agreement cannot be terminated or amended to increase the expense limits or reduce the advisory fee waiver without approval of the Board of Trustees. The Adviser did not waive fees and/or reimburse expenses during the period under these expense limits.
Further, the Adviser has contractually agreed, through at least June 30, 2024, to waive the advisory fee payable by the Fund in an amount equal to 100% of the net advisory fees the Adviser receives from the affiliated money market funds on investments by the Fund of uninvested cash (excluding investments of cash collateral from securities lending) in such affiliated money market funds.
For the year ended October 31, 2022, the Adviser waived advisory fees of $63,620.
The Trust has entered into a master administrative services agreement with Invesco pursuant to which the Fund has agreed to pay Invesco for certain administrative costs incurred in providing accounting services to the Fund. For the year ended October 31, 2022, expenses incurred under the agreement are shown in the Consolidated Statement of Operations as Administrative services fees. Invesco has entered into a sub-administration agreement whereby State Street Bank and Trust Company (“SSB”) serves as fund accountant and provides certain administrative services to the Fund. Pursuant to a custody agreement with the Trust on behalf of the Fund, SSB also serves as the Fund’s custodian.
The Trust has entered into a transfer agency and service agreement with Invesco Investment Services, Inc. (“IIS”) pursuant to which the Fund has agreed to pay IIS a fee for providing transfer agency and shareholder services to the Fund and reimburse IIS for certain expenses incurred by IIS in the course of providing such services. IIS may make payments to intermediaries that provide omnibus account services, sub-accounting services and/or networking services. All fees payable by IIS to intermediaries that provide omnibus account services or sub-accounting services are charged back to the Fund, subject to certain limitations approved by the Trust’s Board of Trustees. For the year ended October 31, 2022, expenses incurred under the agreement are shown in the Consolidated Statement of Operations as Transfer agent fees.
The Trust has entered into master distribution agreements with Invesco Distributors, Inc. (“IDI”) to serve as the distributor for the Class A, Class C, Class R, Class Y, Class R5 and Class R6 shares of the Fund. The Trust has adopted plans pursuant to Rule 12b-1 under the 1940 Act with respect to the Fund’s Class A, Class C and Class R shares (collectively, the “Plans”). The Fund, pursuant to the Plans, pays IDI compensation at the annual rate of 0.25% of the Fund’s average daily net assets of Class A shares, 1.00% of the average daily net assets of Class C shares and 0.50% of the average daily net assets of Class R shares. The fees are accrued daily and paid monthly. Of the Plan payments, up to 0.25% of the average daily net assets of each class of shares may be paid to furnish continuing personal shareholder services to customers who purchase and own shares of such classes. Any amounts not paid as a service fee under the Plans would constitute an asset-based sales charge. Rules of the Financial Industry Regulatory Authority (“FINRA”) impose a cap on the total sales charges, including asset-based sales charges, that may be paid by any class of shares of the Fund. For the year ended October 31, 2022, expenses incurred under the Plans are shown in the Consolidated Statement of Operations as Distribution fees.
Front-end sales commissions and CDSC (collectively, the “sales charges”) are not recorded as expenses of the Fund. Front-end sales commissions are deducted from proceeds from the sales of Fund shares prior to investment in Class A shares of the Fund. CDSC are deducted from redemption proceeds prior to remittance to the shareholder. During the year ended October 31, 2022, IDI advised the Fund that IDI retained $24,776 in front-end sales commissions from the sale of Class A shares and $90 and $149 from Class A and Class C shares, respectively, for CDSC imposed upon redemptions by shareholders.
Certain officers and trustees of the Trust are officers and directors of the Adviser, IIS and/or IDI.
NOTE 3–Additional Valuation Information
GAAP defines fair value as the price that would be received to sell an asset or paid to transfer a liability in an orderly transaction between market participants at the measurement date, under current market conditions. GAAP establishes a hierarchy that prioritizes the inputs to valuation methods, giving the highest priority to readily available unadjusted quoted prices in an active market for identical assets (Level 1) and the lowest priority to significant unobservable inputs (Level 3), generally when market prices are not readily available. Based on the valuation inputs, the securities or other investments are tiered into one of three levels. Changes in valuation methods may result in transfers in or out of an investment’s assigned level:
| | |
| Level 1 - | | Prices are determined using quoted prices in an active market for identical assets. |
| Level 2 - | | Prices are determined using other significant observable inputs. Observable inputs are inputs that other market participants may use in pricing a security. These may include quoted prices for similar securities, interest rates, prepayment speeds, credit risk, yield curves, loss severities, default rates, discount rates, volatilities and others. |
| Level 3 - | | Prices are determined using significant unobservable inputs. In situations where quoted prices or observable inputs are unavailable (for example, when there is little or no market activity for an investment at the end of the period), unobservable inputs may be used. Unobservable inputs reflect the Adviser’s assumptions about the factors market participants would use in determining fair value of the securities or instruments and would be based on the best available information. |
The following is a summary of the tiered valuation input levels, as of October 31, 2022. The level assigned to the securities valuations may not be an indication of the risk or liquidity associated with investing in those securities. Because of the inherent uncertainties of valuation, the values reflected in the consolidated financial statements may materially differ from the value received upon actual sale of those investments.
| | | | | | | | | | | | | | | | |
| | | Level 1 | | | Level 2 | | | Level 3 | | | Total | |
| |
Investments in Securities | | | | | | | | | | | | | | | | |
| |
Common Stocks & Other Equity Interests | | $ | 144,656,800 | | | $ | 460 | | | $ | 16,745 | | | $ | 144,674,005 | |
| |
U.S. Treasury Securities | | | – | | | | 53,342,206 | | | | – | | | | 53,342,206 | |
| |
U.S. Dollar Denominated Bonds & Notes | | | – | | | | 28,903,152 | | | | – | | | | 28,903,152 | |
| |
Non-U.S. Dollar Denominated Bonds & Notes | | | – | | | | 12,992,538 | | | | – | | | | 12,992,538 | |
| |
Variable Rate Senior Loan Interests | | | – | | | | 62,942 | | | | – | | | | 62,942 | |
| |
Preferred Stocks | | | – | | | | – | | | | 3,766 | | | | 3,766 | |
| |
Money Market Funds | | | 96,450,226 | | | | 13,416,344 | | | | – | | | | 109,866,570 | |
| |
Total Investments in Securities | | | 241,107,026 | | | | 108,717,642 | | | | 20,511 | | | | 349,845,179 | |
| |
| | |
| 32 | | Invesco Fundamental Alternatives Fund |
| | | | | | | | | | | | | | | | |
| | | Level 1 | | | Level 2 | | | Level 3 | | | Total | |
| |
| | | | |
Other Investments - Assets* | | | | | | | | | | | | | | | | |
| |
Futures Contracts | | $ | 3,499,216 | | | $ | – | | | $ | – | | | $ | 3,499,216 | |
| |
Forward Foreign Currency Contracts | | | – | | | | 634,905 | | | | – | | | | 634,905 | |
| |
Swap Agreements | | | – | | | | 133,855 | | | | – | | �� | | 133,855 | |
| |
| | | 3,499,216 | | | | 768,760 | | | | – | | | | 4,267,976 | |
| |
| | | | |
Other Investments - Liabilities* | | | | | | | | | | | | | | | | |
| |
Futures Contracts | | | (3,007,032 | ) | | | – | | | | – | | | | (3,007,032 | ) |
| |
Forward Foreign Currency Contracts | | | – | | | | (17,884 | ) | | | – | | | | (17,884 | ) |
| |
Swap Agreements | | | – | | | | (36,854 | ) | | | – | | | | (36,854 | ) |
| |
| | | (3,007,032 | ) | | | (54,738 | ) | | | – | | | | (3,061,770 | ) |
| |
Total Other Investments | | | 492,184 | | | | 714,022 | | | | – | | | | 1,206,206 | |
| |
Total Investments | | $ | 241,599,210 | | | $ | 109,431,664 | | | $ | 20,511 | | | $ | 351,051,385 | |
| |
| * | Forward foreign currency contracts, futures contracts and swap agreements are valued at unrealized appreciation (depreciation). |
NOTE 4–Derivative Investments
The Fund may enter into an ISDA Master Agreement under which a fund may trade OTC derivatives. An OTC transaction entered into under an ISDA Master Agreement typically involves a collateral posting arrangement, payment netting provisions and close-out netting provisions. These netting provisions allow for reduction of credit risk through netting of contractual obligations. The enforceability of the netting provisions of the ISDA Master Agreement depends on the governing law of the ISDA Master Agreement, among other factors.
For financial reporting purposes, the Fund does not offset OTC derivative assets or liabilities that are subject to ISDA Master Agreements in the Consolidated Statement of Assets and Liabilities.
Value of Derivative Investments at Period-End
The table below summarizes the value of the Fund’s derivative investments, detailed by primary risk exposure, held as of October 31, 2022:
| | | | | | | | | | | | | | | | | | | | | | | | |
| | | Value | |
| | | | |
| Derivative Assets | | Commodity Risk | | | Credit Risk | | | Currency Risk | | | Equity Risk | | | Interest Rate Risk | | | Total | |
| |
Unrealized appreciation on futures contracts –Exchange-Traded(a) | | $ | 1,357,293 | | | $ | – | | | $ | – | | | $ | 1,927,345 | | | $ | 214,578 | | | $ | 3,499,216 | |
| |
Unrealized appreciation on swap agreements – Centrally Cleared(a) | | | – | | | | 97,024 | | | | – | | | | – | | | | – | | | | 97,024 | |
| |
Unrealized appreciation on forward foreign currency contracts outstanding | | | – | | | | – | | | | 634,905 | | | | – | | | | – | | | | 634,905 | |
| |
Unrealized appreciation on swap agreements – OTC | | | 36,831 | | | | – | | | | – | | | | – | | | | – | | | | 36,831 | |
| |
Total Derivative Assets | | | 1,394,124 | | | | 97,024 | | | | 634,905 | | | | 1,927,345 | | | | 214,578 | | | | 4,267,976 | |
| |
Derivatives not subject to master netting agreements | | | (1,357,293 | ) | | | (97,024 | ) | | | – | | | | (1,927,345 | ) | | | (214,578 | ) | | | (3,596,240 | ) |
| |
Total Derivative Assets subject to master netting agreements | | $ | 36,831 | | | $ | – | | | $ | 634,905 | | | $ | – | | | $ | – | | | $ | 671,736 | |
| |
| | |
| | | | | | Value | |
| | | | | | | | |
| Derivative Liabilities | | | | | Commodity
Risk | | | Currency
Risk | | | Equity Risk | | | Interest
Rate Risk | | | Total | |
| |
Unrealized depreciation on futures contracts – Exchange-Traded(a) | | | $ | (275,403 | ) | | $ | – | | | $ | (501,301 | ) | | $ | (2,230,328 | ) | | $ | (3,007,032 | ) |
| |
Unrealized depreciation on forward foreign currency contracts outstanding | | | | – | | | | (17,884 | ) | | | – | | | | – | | | | (17,884 | ) |
| |
Unrealized depreciation on swap agreements – OTC | | | | (36,854 | ) | | | – | | | | – | | | | – | | | | (36,854 | ) |
| |
Total Derivative Liabilities | | | | (312,257 | ) | | | (17,884 | ) | | | (501,301 | ) | | | (2,230,328 | ) | | | (3,061,770 | ) |
| |
Derivatives not subject to master netting agreements | | | | 275,403 | | | | – | | | | 501,301 | | | | 2,230,328 | | | | 3,007,032 | |
| |
Total Derivative Liabilities subject to master netting agreements | | | $ | (36,854 | ) | | $ | (17,884 | ) | | $ | – | | | $ | – | | | $ | (54,738 | ) |
| |
| (a) | The daily variation margin receivable (payable) at period-end is recorded in the Consolidated Statement of Assets and Liabilities. |
| | |
| 33 | | Invesco Fundamental Alternatives Fund |
Offsetting Assets and Liabilities
The table below reflects the Fund’s exposure to Counterparties subject to either an ISDA Master Agreement or other agreement for OTC derivative transactions as of October 31, 2022.
| | | | | | | | | | | | | | | | | | | | | | | | | | | | | | | | | | | | | | | | |
| Financial Derivative Assets | | | Financial Derivative Liabilities | | | | | | | | | | | Collateral
(Received)/Pledged | | |
| | | | | | | | | | | | | | | | | |
| | | | | | | | | | |
Counterparty | | Forward Foreign Currency Contracts | | | Swap Agreements | | | Total Assets | | | Forward Foreign Currency Contracts | | Swap Agreements | | | Total Liabilities | | | Net Value of Derivatives | | | Non-Cash | | Cash | | Net Amount(a) |
| |
Fund | | | | | | | | | | | | | | | | | | | | | | | | | | | | | | | | | | | | | | | | |
Bank of America, N.A. | | | $ 4,521 | | | | $ - | | | | $ 4,521 | | | | $ (3,832 | ) | | | $ - | | | | $(3,832 | ) | | | $ 689 | | | | $- | | | | $- | | | | $ 689 | |
| |
BNP Paribas S.A. | | | - | | | | - | | | | - | | | | (221 | ) | | | - | | | | (221 | ) | | | (221 | ) | | | - | | | | - | | | | (221 | ) |
| |
Deutsche Bank AG | | | - | | | | - | | | | - | | | | (1,295 | ) | | | - | | | | (1,295 | ) | | | (1,295 | ) | | | - | | | | - | | | | (1,295 | ) |
| |
Goldman Sachs International | | | - | | | | - | | | | - | | | | (3,525 | ) | | | - | | | | (3,525 | ) | | | (3,525 | ) | | | - | | | | - | | | | (3,525 | ) |
| |
J.P. Morgan Chase Bank, N.A. | | | 1,624 | | | | - | | | | 1,624 | | | | - | | | | - | | | | - | | | | 1,624 | | | | - | | | | - | | | | 1,624 | |
| |
Morgan Stanley and Co. International PLC | | | 628,760 | | | | - | | | | 628,760 | | | | (9,011 | ) | | | - | | | | (9,011 | ) | | | 619,749 | | | | - | | | | - | | | | 619,749 | |
| |
Subtotal - Fund | | | 634,905 | | | | - | | | | 634,905 | | | | (17,884 | ) | | | - | | | | (17,884 | ) | | | 617,021 | | | | - | | | | - | | | | 617,021 | |
| |
Subsidiary | | | | | | | | | | | | | | | | | | | | | | | | | | | | | | | | | | | | | | | | |
BNP Paribas S.A. | | | - | | | | - | | | | - | | | | - | | | | (19,599 | ) | | | (19,599 | ) | | | (19,599 | ) | | | - | | | | - | | | | (19,599 | ) |
| |
Canadian Imperial Bank of Commerce | | | - | | | | 36,831 | | | | 36,831 | | | | - | | | | (81 | ) | | | (81 | ) | | | 36,750 | | | | - | | | | - | | | | 36,750 | |
| |
Merrill Lynch International | | | - | | | | - | | | | - | | | | - | | | | (21,186 | ) | | | (21,186 | ) | | | (21,186 | ) | | | - | | | | - | | | | (21,186 | ) |
| |
Royal Bank of Canada | | | - | | | | 103,428 | | | | 103,428 | | | | - | | | | (281 | ) | | | (281 | ) | | | 103,147 | | | | - | | | | - | | | | 103,147 | |
| |
UBS AG | | | - | | | | - | | | | - | | | | - | | | | (17,763 | ) | | | (17,763 | ) | | | (17,763 | ) | | | - | | | | - | | | | (17,763 | ) |
| |
Subtotal - Subsidiary | | | - | | | | 140,259 | | | | 140,259 | | | | - | | | | (58,910 | ) | | | (58,910 | ) | | | 81,349 | | | | - | | | | - | | | | 81,349 | |
| |
Total | | | $634,905 | | | | $140,259 | | | | $775,164 | | | | $(17,884 | ) | | | $(58,910 | ) | | | $(76,794 | ) | | | $698,370 | | | | $- | | | | $- | | | | $698,370 | |
| |
| (a) | The Fund and the Subsidiary are recognized as separate legal entities and as such are subject to separate netting arrangements with the Counterparty. |
Effect of Derivative Investments for the year ended October 31, 2022
The table below summarizes the gains (losses) on derivative investments, detailed by primary risk exposure, recognized in earnings during the period:
| | | | | | | | | | | | | | | | | | | | | | | | |
| | | Location of Gain (Loss) on Consolidated Statement of Operations | |
| | | | |
| | | Commodity Risk | | | Credit Risk | | | Currency Risk | | | Equity Risk | | | Interest Rate Risk | | | Total | |
| |
Realized Gain (Loss): | | | | | | | | | | | | | | | | | | | | | | | | |
Forward foreign currency contracts | | $ | - | | | $ | - | | | $ | 2,301,705 | | | $ | - | | | $ | - | | | $ | 2,301,705 | |
| |
Futures contracts | | | (1,974,547 | ) | | | - | | | | - | | | | (570,680 | ) | | | (11,715,897 | ) | | | (14,261,124 | ) |
| |
Swap agreements | | | (609,216 | ) | | | (278,478 | ) | | | - | | | | - | | | | - | | | | (887,694 | ) |
| |
| Change in Net Unrealized Appreciation (Depreciation): | | | | | | | | | | | | | | | | | | | | | | | | |
Forward foreign currency contracts | | | - | | | | - | | | | 347,663 | | | | - | | | | - | | | | 347,663 | |
| |
Futures contracts | | | 1,269,712 | | | | - | | | | - | | | | 4,758,923 | | | | 1,164,584 | | | | 7,193,219 | |
| |
Swap agreements | | | (8,650 | ) | | | 30,298 | | | | - | | | | - | | | | - | | | | 21,648 | |
| |
Total | | $ | (1,322,701 | ) | | $ | (248,180 | ) | | $ | 2,649,368 | | | $ | 4,188,243 | | | $ | (10,551,313 | ) | | $ | (5,284,583 | ) |
| |
The table below summarizes the average notional value of derivatives held during the period.
| | | | | | |
| | | Forward
Foreign Currency
Contracts | | Futures
Contracts | | Swap
Agreements |
|
Average notional value | | $15,914,111 | | $219,145,999 | | $13,899,204 |
|
NOTE 5–Expense Offset Arrangement(s)
The expense offset arrangement is comprised of transfer agency credits which result from balances in demand deposit accounts used by the transfer agent for clearing shareholder transactions. For the year ended October 31, 2022, the Fund received credits from this arrangement, which resulted in the reduction of the Fund’s total expenses of $5,422.
| | |
| 34 | | Invesco Fundamental Alternatives Fund |
NOTE 6–Trustees’ and Officers’ Fees and Benefits
Trustees’ and Officers’ Fees and Benefits include amounts accrued by the Fund to pay remuneration to certain Trustees and Officers of the Fund. Trustees have the option to defer compensation payable by the Fund, and Trustees’ and Officers’ Fees and Benefits also include amounts accrued by the Fund to fund such deferred compensation amounts. Those Trustees who defer compensation have the option to select various Invesco Funds in which their deferral accounts shall be deemed to be invested. Finally, certain current Trustees were eligible to participate in a retirement plan that provided for benefits to be paid upon retirement to Trustees over a period of time based on the number of years of service. The Fund may have certain former Trustees who also participate in a retirement plan and receive benefits under such plan. Trustees’ and Officers’ Fees and Benefits include amounts accrued by the Fund to fund such retirement benefits. Obligations under the deferred compensation and retirement plans represent unsecured claims against the general assets of the Fund.
NOTE 7–Cash Balances
The Fund is permitted to temporarily carry a negative or overdrawn balance in its account with SSB, the custodian bank. Such balances, if any at period-end, are shown in the Consolidated Statement of Assets and Liabilities under the payable caption Amount due custodian. To compensate the custodian bank for such overdrafts, the overdrawn Fund may either (1) leave funds as a compensating balance in the account so the custodian bank can be compensated by earning the additional interest; or (2) compensate by paying the custodian bank at a rate agreed upon by the custodian bank and Invesco, not to exceed the contractually agreed upon rate. The Fund may not purchase additional securities when any borrowings from banks or broker-dealers exceed 5% of the Fund’s total assets, or when any borrowings from an Invesco Fund are outstanding.
NOTE 8–Distributions to Shareholders and Tax Components of Net Assets
Tax Character of Distributions to Shareholders Paid During the Fiscal Years Ended October 31, 2022 and 2021:
| | | | | | | | |
| | | 2022 | | | 2021 | |
| |
Ordinary income* | | $ | 14,046,440 | | | $ | 15,594,882 | |
| |
Long-term capital gain | | | 48,016 | | | | – | |
| |
Total distributions | | $ | 14,094,456 | | | $ | 15,594,882 | |
| |
| * | Includes short-term capital gain distributions, if any. |
Tax Components of Net Assets at Period-End:
| | | | |
| | | 2022 | |
| |
Undistributed long-term capital gain | | $ | 9,315,006 | |
| |
Net unrealized appreciation – investments | | | 15,238,737 | |
| |
Net unrealized appreciation – foreign currencies | | | 13,529 | |
| |
Temporary book/tax differences | | | (144,110 | ) |
| |
Shares of beneficial interest | | | 362,129,534 | |
| |
Total net assets | | $ | 386,552,696 | |
| |
The difference between book-basis and tax-basis unrealized appreciation (depreciation) is due to differences in the timing of recognition of gains and losses on investments for tax and book purposes. The Fund’s net unrealized appreciation (depreciation) difference is attributable primarily to wash sales, derivative instruments and subsidiary differences.
The temporary book/tax differences are a result of timing differences between book and tax recognition of income and/or expenses. The Fund’s temporary book/tax differences are the result of the trustee deferral of compensation and retirement plan benefits.
Capital loss carryforward is calculated and reported as of a specific date. Results of transactions and other activity after that date may affect the amount of capital loss carryforward actually available for the Fund to utilize. The ability to utilize capital loss carryforward in the future may be limited under the Internal Revenue Code and related regulations based on the results of future transactions.
The Fund does not have a capital loss carryforward as of October 31, 2022.
NOTE 9–Investment Transactions
The aggregate amount of investment securities (other than short-term securities, U.S. Government obligations and money market funds, if any) purchased and sold by the Fund during the year ended October 31, 2022 was $79,732,032 and $207,061,973, respectively. Cost of investments, including any derivatives, on a tax basis includes the adjustments for financial reporting purposes as of the most recently completed federal income tax reporting period-end.
| | | | | | | | |
| Unrealized Appreciation (Depreciation) of Investments on a Tax Basis | |
| |
Aggregate unrealized appreciation of investments | | | $ | 36,640,557 | |
| |
Aggregate unrealized (depreciation) of investments | | | | (21,401,820 | ) |
| |
Net unrealized appreciation of investments | | | | | | $ | 15,238,737 | |
| |
Cost of investments for tax purposes is $335,812,648.
NOTE 10–Reclassification of Permanent Differences
Primarily as a result of differing book/tax treatment of foreign currency transactions, net operating losses and income from the Subsidiary, on October 31, 2022, undistributed net investment income (loss) was increased by $874,443, undistributed net realized gain was increased by $7,843,489 and shares of beneficial interest was decreased by $8,717,932. This reclassification had no effect on the net assets of the Fund.
| | |
| 35 | | Invesco Fundamental Alternatives Fund |
NOTE 11–Share Information
| | | | | | | | | | | | | | | | |
| | | Summary of Share Activity | |
| |
| | | Year ended | | | Year ended | |
| | | October 31, 2022(a) | | | October 31, 2021 | |
| | | Shares | | | Amount | | | Shares | | | Amount | |
| |
Sold: | | | | | | | | | | | | | | | | |
Class A | | | 395,352 | | | $ | 10,205,406 | | | | 492,343 | | | $ | 13,353,888 | |
| |
Class C | | | 60,433 | | | | 1,373,972 | | | | 89,686 | | | | 2,150,042 | |
| |
Class R | | | 61,564 | | | | 1,522,679 | | | | 54,892 | | | | 1,423,375 | |
| |
Class Y | | | 295,017 | | | | 7,871,209 | | | | 885,300 | | | | 24,573,086 | |
| |
Class R5 | | | 3 | | | | 100 | | | | - | | | | - | |
| |
Class R6 | | | 34,256 | | | | 914,617 | | | | 436,879 | | | | 12,158,047 | |
| |
| | | | |
Issued as reinvestment of dividends: | | | | | | | | | | | | | | | | |
Class A | | | 354,615 | | | | 9,471,770 | | | | 259,426 | | | | 6,918,884 | |
| |
Class C | | | 17,796 | | | | 420,343 | | | | 13,520 | | | | 319,754 | |
| |
Class R | | | 13,155 | | | | 335,466 | | | | 9,161 | | | | 233,503 | |
| |
Class Y | | | 92,274 | | | | 2,520,915 | | | | 107,546 | | | | 2,932,788 | |
| |
Class R6 | | | 5,510 | | | | 151,127 | | | | 158,454 | | | | 4,333,714 | |
| |
| | | | |
Automatic conversion of Class C shares to Class A shares: | | | | | | | | | | | | | | | | |
Class A | | | 91,844 | | | | 2,343,122 | | | | 210,260 | | | | 5,670,904 | |
| |
Class C | | | (104,243 | ) | | | (2,343,122 | ) | | | (237,496 | ) | | | (5,670,904 | ) |
| |
| | | | |
Reacquired: | | | | | | | | | | | | | | | | |
Class A | | | (1,823,686 | ) | | | (47,063,684 | ) | | | (2,254,468 | ) | | | (61,159,418 | ) |
| |
Class C | | | (141,872 | ) | | | (3,223,941 | ) | | | (234,670 | ) | | | (5,615,876 | ) |
| |
Class R | | | (110,177 | ) | | | (2,722,349 | ) | | | (121,876 | ) | | | (3,150,374 | ) |
| |
Class Y | | | (1,994,015 | ) | | | (52,505,450 | ) | | | (3,368,547 | ) | | | (93,177,449 | ) |
| |
Class R6 | | | (136,328 | ) | | | (3,635,581 | ) | | | (8,252,546 | ) | | | (229,935,359 | ) |
| |
Net increase (decrease) in share activity | | | (2,888,502 | ) | | $ | (74,363,401 | ) | | | (11,752,136 | ) | | $ | (324,641,395 | ) |
| |
| (a) | There are entities that are record owners of more than 5% of the outstanding shares of the Fund and in the aggregate own 10% of the outstanding shares of the Fund. IDI has an agreement with these entities to sell Fund shares. The Fund, Invesco and/or Invesco affiliates may make payments to these entities, which are considered to be related to the Fund, for providing services to the Fund, Invesco and/or Invesco affiliates including but not limited to services such as securities brokerage, distribution, third party record keeping and account servicing. The Fund has no knowledge as to whether all or any portion of the shares owned of record by these entities are also owned beneficially. |
| | |
| 36 | | Invesco Fundamental Alternatives Fund |
Report of Independent Registered Public Accounting Firm
To the Board of Trustees of AIM Investment Funds (Invesco Investment Funds) and Shareholders of Invesco Fundamental Alternatives Fund
Opinion on the Consolidated Financial Statements
We have audited the accompanying consolidated statement of assets and liabilities, including the consolidated schedule of investments, of Invesco Fundamental Alternatives Fund and its subsidiary (one of the funds constituting AIM Investment Funds (Invesco Investment Funds), referred to hereafter as the “Fund”) as of October 31, 2022, the related consolidated statement of operations for the year ended October 31, 2022, the consolidated statement of changes in net assets for each of the two years in the period ended October 31, 2022, including the related notes, and the consolidated financial highlights for each of the periods indicated in the table below (collectively referred to as the “consolidated financial statements”). In our opinion, the consolidated financial statements present fairly, in all material respects, the financial position of the Fund as of October 31, 2022, the results of its operations for the year then ended, the changes in its net assets for each of the two years in the period ended October 31, 2022 and the financial highlights for each of the periods indicated in the table below, in conformity with accounting principles generally accepted in the United States of America.
|
| Consolidated Financial Highlights |
For each of the four years in the period ended October 31, 2022 for Class A, Class C, Class R, Class Y and Class R6. For each of the three years in the period ended October 31, 2022 and the period May 24, 2019 (commencement of operations) through October 31, 2019 for Class R5. |
The consolidated financial statements of Oppenheimer Fundamental Alternatives Fund (subsequently renamed Invesco Fundamental Alternatives Fund) as of and for the year ended October 31, 2018 and the consolidated financial highlights for the year then ended (not presented herein, other than the consolidated financial highlights) were audited by other auditors whose report dated December 21, 2018 expressed an unqualified opinion on those consolidated financial statements and consolidated financial highlights.
Basis for Opinion
These consolidated financial statements are the responsibility of the Fund’s management. Our responsibility is to express an opinion on the Fund’s consolidated financial statements based on our audits. We are a public accounting firm registered with the Public Company Accounting Oversight Board (United States) (PCAOB) and are required to be independent with respect to the Fund in accordance with the U.S. federal securities laws and the applicable rules and regulations of the Securities and Exchange Commission and the PCAOB.
We conducted our audits of these consolidated financial statements in accordance with the standards of the PCAOB. Those standards require that we plan and perform the audit to obtain reasonable assurance about whether the consolidated financial statements are free of material misstatement, whether due to error or fraud.
Our audits included performing procedures to assess the risks of material misstatement of the consolidated financial statements, whether due to error or fraud, and performing procedures that respond to those risks. Such procedures included examining, on a test basis, evidence regarding the amounts and disclosures in the consolidated financial statements. Our audits also included evaluating the accounting principles used and significant estimates made by management, as well as evaluating the overall presentation of the consolidated financial statements. Our procedures included confirmation of securities owned as of October 31, 2022 by correspondence with the custodian, transfer agent, brokers and agent banks; when replies were not received from brokers or agent banks, we performed other auditing procedures. We believe that our audits provide a reasonable basis for our opinion.
|
| /s/PricewaterhouseCoopers LLP |
|
| Houston, Texas |
| December 23, 2022 |
We have served as the auditor of one or more of the investment companies in the Invesco group of investment companies since at least 1995. We have not been able to determine the specific year we began serving as auditor.
| | |
| 37 | | Invesco Fundamental Alternatives Fund |
Calculating your ongoing Fund expenses
Example
As a shareholder of the Fund, you incur two types of costs: (1) transaction costs, which may include sales charges (loads) on purchase payments or contingent deferred sales charges on redemptions, if any; and (2) ongoing costs, including management fees, distribution and/or service (12b-1) fees, and other Fund expenses. This example is intended to help you understand your ongoing costs (in dollars) of investing in the Fund and to compare these costs with ongoing costs of investing in other mutual funds. The example is based on an investment of $1,000 invested at the beginning of the period and held for the entire period May 1, 2022 through October 31, 2022.
Actual expenses
The table below provides information about actual account values and actual expenses. You may use the information in this table, together with the amount you invested, to estimate the expenses that you paid over the period. Simply divide your account value by $1,000 (for example, an $8,600 account value divided by $1,000 = 8.6), then multiply the result by the number in the table under the heading entitled “Actual Expenses Paid During Period” to estimate the expenses you paid on your account during this period.
Hypothetical example for comparison purposes
The table below also provides information about hypothetical account values and hypothetical expenses based on the Fund’s actual expense ratio and an assumed rate of return of 5% per year before expenses, which is not the Fund’s actual return.
The hypothetical account values and expenses may not be used to estimate the actual ending account balance or expenses you paid for the period. You may use this information to compare the ongoing costs of investing in the Fund and other funds. To do so, compare this 5% hypothetical example with the 5% hypothetical examples that appear in the shareholder reports of the other funds.
Please note that the expenses shown in the table are meant to highlight your ongoing costs only and do not reflect any transaction costs, such as sales charges (loads) on purchase payments or contingent deferred sales charges on redemptions, if any. Therefore, the hypothetical information is useful in comparing ongoing costs only, and will not help you determine the relative total costs of owning different funds. In addition, if these transaction costs were included, your costs would have been higher.
| | | | | | | | | | | | |
| | | | | ACTUAL | | HYPOTHETICAL (5% annual return before
expenses) | | |
| | Beginning Account Value (05/01/22) | | Ending Account Value (10/31/22)1 | | Expenses Paid During Period2 | | Ending Account Value (10/31/22) | | Expenses Paid During Period2 | | Annualized Expense Ratio |
| | | | | | | |
Class A | | $1,000.00 | | $974.40 | | $6.72 | | $1,018.40 | | $6.87 | | 1.35% |
Class C | | 1,000.00 | | 971.00 | | 10.43 | | 1,014.62 | | 10.66 | | 2.10 |
Class R | | 1,000.00 | | 973.20 | | 7.96 | | 1,017.14 | | 8.13 | | 1.60 |
Class Y | | 1,000.00 | | 975.40 | | 5.48 | | 1,019.66 | | 5.60 | | 1.10 |
Class R5 | | 1,000.00 | | 976.30 | | 4.63 | | 1,020.52 | | 4.74 | | 0.93 |
Class R6 | | 1,000.00 | | 976.70 | | 4.68 | | 1,020.47 | | 4.79 | | 0.94 |
| 1 | The actual ending account value is based on the actual total return of the Fund for the period May 1, 2022 through October 31, 2022, after actual expenses and will differ from the hypothetical ending account value which is based on the Fund’s expense ratio and a hypothetical annual return of 5% before expenses. |
| 2 | Expenses are equal to the Fund’s annualized expense ratio as indicated above multiplied by the average account value over the period, multiplied by 184/365 to reflect the most recent fiscal half year. |
| | |
| 38 | | Invesco Fundamental Alternatives Fund |
Approval of Investment Advisory and Sub-Advisory Contracts
At meetings held on June 13, 2022, the Board of Trustees (the Board or the Trustees) of AIM Investment Funds (Invesco Investment Funds) as a whole, and the independent Trustees, who comprise over 75% of the Board, voting separately, approved the continuance of the Invesco Fundamental Alternatives Fund’s (the Fund) Master Investment Advisory Agreement with Invesco Advisers, Inc. (Invesco Advisers and the investment advisory agreement) and the Master Intergroup Sub-Advisory Contract for Mutual Funds with Invesco Asset Management Deutschland GmbH, Invesco Asset Management Limited, Invesco Asset Management (Japan) Limited, Invesco Hong Kong Limited, Invesco Senior Secured Management, Inc. and Invesco Canada Ltd. and separate sub-advisory contracts with Invesco Capital Management LLC, Invesco Asset Management (India) Private Limited and OppenheimerFunds, Inc. (collectively, the Affiliated Sub-Advisers and the sub-advisory contracts) for another year, effective July 1, 2022. After evaluating the factors discussed below, among others, the Board approved the renewal of the Fund’s investment advisory agreement and the sub-advisory contracts and determined that the compensation payable thereunder by the Fund to Invesco Advisers and by Invesco Advisers to the Affiliated Sub-Advisers is fair and reasonable.
The Board’s Evaluation Process
The Board has established an Investments Committee, which in turn has established Sub-Committees that meet throughout the year to review the performance of funds advised by Invesco Advisers (the Invesco Funds). The Sub-Committees meet regularly with portfolio managers for their assigned Invesco Funds and other members of management to review detailed information about investment performance and portfolio attributes of these funds. The Board has established additional standing and ad hoc committees that meet regularly throughout the year to review matters within their purview. The Board took into account evaluations and reports that it received from its committees and sub-committees, as well as the information provided to the Board and its committees and sub-committees throughout the year, in considering whether to approve each Invesco Fund’s investment advisory agreement and sub-advisory contracts.
As part of the contract renewal process, the Board reviews and considers information provided in response to detailed requests for information submitted to management by the independent Trustees with assistance from legal counsel to the independent Trustees and the Senior Officer, an officer of the Invesco Funds who reports directly to the independent Trustees. The Board receives comparative investment performance and fee and expense data regarding the Invesco Funds prepared by Broadridge Financial Solutions, Inc. (Broadridge), an independent mutual fund data provider, as well as information on the composition of the peer groups provided by Broadridge and its methodology for determining peer groups. The Board also receives an independent written evaluation from the Senior Officer. The Senior Officer’s evaluation is prepared as part of his responsibility to manage the process by which the Invesco Funds’ proposed management fees are negotiated during the annual contract renewal
process to ensure they are negotiated in a manner that is at arms’ length and reasonable in accordance with certain negotiated regulatory requirements. In addition to meetings with Invesco Advisers and fund counsel throughout the year and as part of meetings convened on May 2, 2022 and June 13, 2022, the independent Trustees also discussed the continuance of the investment advisory agreement and sub-advisory contracts in separate sessions with the Senior Officer and with independent legal counsel. etailed follow-up requests for information submitted by the independent Trustees to management.
The discussion below is a summary of the Senior Officer’s independent written evaluation with respect to the Fund’s investment advisory agreement and sub-advisory contracts, as well as a discussion of the material factors and related conclusions that formed the basis for the Board’s approval of the Fund’s investment advisory agreement and sub-advisory contracts. The Trustees’ review and conclusions are based on the comprehensive consideration of all information presented to them during the course of the year and in prior years and are not the result of any single determinative factor. Moreover, one Trustee may have weighed a particular piece of information or factor differently than another Trustee. The information received and considered by the Board was current as of various dates prior to the Board’s approval on June 13, 2022.
Factors and Conclusions and Summary of Independent Written Fee Evaluation
| A. | Nature, Extent and Quality of Services Provided by Invesco Advisers and the Affiliated Sub-Advisers |
The Board reviewed the nature, extent and quality of the advisory services provided to the Fund by Invesco Advisers under the Fund’s investment advisory agreement, and the credentials and experience of the officers and employees of Invesco Advisers who provide these services, including the Fund’s portfolio manager(s). The Board’s review included consideration of Invesco Advisers’ investment process and oversight, credit analysis, and research capabilities. The Board considered information regarding Invesco Advisers’ programs for and resources devoted to risk management, including management of investment, enterprise, operational, liquidity, valuation and compliance risks, and technology used to manage such risks. The Board also received and reviewed information about Invesco Advisers’ role as administrator of the Invesco Funds’ liquidity risk management program. The Board received a description of, and reports related to, Invesco Advisers’ global security program and business continuity plans and of its approach to data privacy and cybersecurity, including related testing. The Board considered how the cybersecurity and business continuity plans of Invesco Advisers and its key service providers operated in the remote and hybrid working environment resulting from the novel coronavirus (“COVID-19”) pandemic and paved the way for a hybrid working framework in a normalized environment as employees return to the office. The Board also considered non-advisory services that Invesco Advisers and its affiliates provide to the Invesco Funds, such as various back office support functions, third party oversight, internal audit, valuation, portfolio trading and legal and compliance.
The Board observed that Invesco Advisers’ systems preparedness and ongoing investment enabled Invesco Advisers to manage, operate and oversee the Invesco Funds with minimal impact or disruption through challenging environments. The Board reviewed and considered the benefits to shareholders of investing in a Fund that is part of the family of funds under the umbrella of Invesco Ltd., Invesco Advisers’ parent company, and noted Invesco Ltd.’s depth and experience in running an investment management business, as well as its commitment of financial and other resources to such business. The Board concluded that the nature, extent and quality of the services provided to the Fund by Invesco Advisers are appropriate and satisfactory.
The Board reviewed the services that may be provided by the Affiliated Sub-Advisers under the sub-advisory contracts and the credentials and experience of the officers and employees of the Affiliated Sub-Advisers who provide these services. The Board noted the Affiliated Sub-Advisers’ expertise with respect to certain asset classes and that the Affiliated Sub-Advisers have offices and personnel that are located in financial centers around the world. As a result, the Board noted that the Affiliated Sub-Advisers can provide research and investment analysis on the markets and economies of various countries in which the Fund may invest, make recommendations regarding securities and assist with security trades. The Board concluded that the sub-advisory contracts may benefit the Fund and its shareholders by permitting Invesco Advisers to use the resources and talents of the Affiliated Sub-Advisers in managing the Fund. The Board concluded that the nature, extent and quality of the services that may be provided to the Fund by the Affiliated Sub-Advisers are appropriate and satisfactory.
| B. | Fund Investment Performance |
The Board considered Fund investment performance as a relevant factor in considering whether to approve the investment advisory agreement. The Board did not view Fund investment performance as a relevant factor in considering whether to approve the sub-advisory contracts for the Fund, as no Affiliated Sub-Adviser currently manages assets of the Fund.
The Board compared the Fund’s investment performance over multiple time periods ending December 31, 2021 to the performance of funds in the Broadridge performance universe and against the HFRX Global Hedge Fund Index (Index). The Board noted that performance of Class A shares of the Fund was in the fourth quintile of its performance universe for the one year period and the fifth quintile for the three and five year periods (the first quintile being the best performing funds and the fifth quintile being the worst performing funds). The Board noted that performance of Class A shares of the Fund was below the performance of the Index for the one, three and five year periods. The Board acknowledged limitations regarding the Broadridge data, in particular that differences may exist between a Fund’s investment objective, principal investment strategies and/or investment restrictions and those of the funds in its performance universe and noted specifically the varying characteristics of the Fund’s peer group constituents. The Board considered that the Fund was created in connection with Invesco Ltd.’s acquisition
| | |
| 39 | | Invesco Fundamental Alternatives Fund |
of OppenheimerFunds, Inc. and its subsidiaries (the “Transaction”) and that the Fund’s performance prior to the closing of the Transaction on May 24, 2019 is that of its predecessor fund. The Board noted that certain factor exposures and emerging market equity exposure detracted from Fund performance. The Board also considered that the Fund underwent portfolio management and corresponding investment strategy changes in 2020. The Board recognized that the performance data reflects a snapshot in time as of a particular date and that selecting a different performance period could produce different results. The Board also reviewed more recent Fund performance as well as other performance metrics, which did not change its conclusions.
| C. | Advisory and Sub-Advisory Fees and Fund Expenses |
The Board compared the Fund’s contractual management fee rate to the contractual management fee rates of funds in the Fund’s Broadridge expense group. The Board noted that the contractual management fee rate for Class A shares of the Fund was below the median contractual management fee rate of funds in its expense group. The Board noted that the term “contractual management fee” for funds in the expense group may include both advisory and certain non-portfolio management administrative services fees, but that Broadridge is not able to provide information on a fund by fund basis as to what is included. The Board also reviewed the methodology used by Broadridge in calculating expense group information, which includes using each fund’s contractual management fee schedule (including any applicable breakpoints) as reported in the most recent prospectus or statement of additional information for each fund in the expense group. The Board also considered comparative information regarding the Fund’s total expense ratio and its various components.
The Board noted that Invesco Advisers has contractually agreed to waive fees and/or limit expenses of the Fund for the term disclosed in the Fund’s registration statement in an amount necessary to limit total annual operating expenses to a specified percentage of average daily net assets for each class of the Fund.
The Board noted that Invesco Advisers and the Affiliated Sub-Advisers do not manage other similarly managed mutual funds or client accounts.
The Board also considered the services that may be provided by the Affiliated Sub-Advisers pursuant to the sub-advisory contracts, as well as the fees payable by Invesco Advisers to the Affiliated Sub-Advisers pursuant to the sub-advisory contracts.
| D. | Economies of Scale and Breakpoints |
The Board considered the extent to which there may be economies of scale in the provision of advisory services to the Fund and the Invesco Funds, and the extent to which such economies of scale are shared with the Fund and the Invesco Funds. The Board considered that the Fund may benefit from economies of scale through contractual breakpoints in the Fund’s advisory fee schedule, which generally operate to reduce the Fund’s expense ratio as it grows in size. The Board noted that the Fund also shares in economies of scale through Invesco Advisers’ ability to negotiate lower fee arrangements with third party service providers. The Board noted that the Fund may also benefit from economies of scale through initial fee setting, fee waivers and expense reimbursements, as well as Invesco Advisers’ investment in its business, including investments in
business infrastructure, technology and cybersecurity.
| E. | Profitability and Financial Resources |
The Board reviewed information from Invesco Advisers concerning the costs of the advisory and other services that Invesco Advisers and its affiliates provide to the Fund and the Invesco Funds and the profitability of Invesco Advisers and its affiliates in providing these services in the aggregate and on an individual Fund-by-Fund basis. The Board considered the methodology used for calculating profitability and the periodic review and enhancement of such methodology. The Board noted that Invesco Advisers continues to operate at a net profit from services Invesco Advisers and its affiliates provide to the Invesco Funds in the aggregate and to most Funds individually. The Board did not deem the level of profits realized by Invesco Advisers and its affiliates from providing such services to be excessive, given the nature, extent and quality of the services provided. The Board noted that Invesco Advisers provided information demonstrating that Invesco Advisers is financially sound and has the resources necessary to perform its obligations under the investment advisory agreement, and provided representations indicating that the Affiliated Sub-Advisers are financially sound and have the resources necessary to perform their obligations under the sub-advisory contracts.
| F. | Collateral Benefits to Invesco Advisers and its Affiliates |
The Board considered various other benefits received by Invesco Advisers and its affiliates from the relationship with the Fund, including the fees received for providing administrative, transfer agency and distribution services to the Fund. The Board received comparative information regarding fees charged for these services, including information provided by Broadridge and other independent sources. The Board reviewed the performance of Invesco Advisers and its affiliates in providing these services and the organizational structure employed to provide these services. The Board noted that these services are provided to the Fund pursuant to written contracts that are reviewed and subject to approval on an annual basis by the Board based on its determination that the services are required for the operation of the Fund.
The Board considered the benefits realized by Invesco Advisers and the Affiliated Sub-Advisers as a result of portfolio brokerage transactions executed through “soft dollar” arrangements. The Board noted that soft dollar arrangements may result in the Fund bearing costs to purchase research that may be used by Invesco Advisers or the Affiliated Sub-Advisers with other clients and may reduce Invesco Advisers’ or the Affiliated Sub-Advisers’ expenses. The Board also considered that it receives from Invesco Advisers periodic reports that include a representation to the effect that these arrangements are consistent with regulatory requirements. The Board did not deem the soft dollar arrangements to be inappropriate.
The Board considered that the Fund’s uninvested cash and cash collateral from any securities lending arrangements may be invested in registered money market funds or, with regard to securities lending cash collateral, unregistered funds that comply with Rule 2a-7 (collectively referred to as “affiliated money market funds”) advised by Invesco Advisers. The Board considered information regarding the returns of the affiliated money market funds relative to comparable overnight investments, as well as the
fees paid by the affiliated money market funds to Invesco Advisers and its affiliates. In this regard, the Board noted that Invesco Advisers receives advisory fees from these affiliated money market funds attributable to the Fund’s investments. The Board also noted that Invesco Advisers has contractually agreed to waive through varying periods an amount equal to 100% of the net advisory fee Invesco Advisers receives from the affiliated money market funds with respect to the Fund’s investment in the affiliated money market funds of uninvested cash, but not cash collateral. The Board concluded that the advisory fees payable to Invesco Advisers from the Fund’s investment of cash collateral from any securities lending arrangements in the affiliated money market funds are for services that are not duplicative of services provided by Invesco Advisers to the Fund.
The Board considered that Invesco Advisers may serve as the Fund’s affiliated securities lending agent and evaluated the benefits realized by Invesco Advisers when serving in such role, including the compensation received. The Board considered Invesco Advisers’ securities lending platform and corporate governance structure for securities lending, including Invesco Advisers’ Securities Lending Governance Committee and its related responsibilities. The Board noted that to the extent the Fund utilizes Invesco Advisers as an affiliated securities lending agent, the Fund conducts its securities lending in accordance with, and in reliance upon, no-action letters issued by the SEC staff that provide guidance on how an affiliate may act as a direct agent lender and receive compensation for those services without obtaining exemptive relief. The Board considered information provided by Invesco Advisers related to the performance of Invesco Advisers as securities lending agent, including a summary of the securities lending services provided to the Fund by Invesco Advisers and the compensation paid to Invesco Advisers for such services, as well as any revenues generated for the Fund in connection with such securities lending activity and the allocation of such revenue between the Fund and Invesco Advisers.
The Board also received information about commissions that an affiliated broker may receive for executing certain trades for the Fund. Invesco Advisers and the Affiliated Sub-Advisers advised the Board of the benefits to the Fund of executing trades through the affiliated broker and that such trades were executed in compliance with rules under the federal securities laws and consistent with best execution obligations.
| | |
| 40 | | Invesco Fundamental Alternatives Fund |
Tax Information
Form 1099-DIV, Form 1042-S and other year-end tax information provide shareholders with actual calendar year amounts that should be included in their tax returns. Shareholders should consult their tax advisers.
The following distribution information is being provided as required by the Internal Revenue Code or to meet a specific state’s requirement.
The Fund designates the following amounts or, if subsequently determined to be different, the maximum amount allowable for its fiscal year ended October 31, 2022:
| | | | | | | | |
| | | Federal and State Income Tax | | | | | |
| | Long-Term Capital Gain Distributions | | $ | 48,016 | | | |
| | Qualified Dividend Income* | | | 36.48 | % | | |
| | Corporate Dividends Received Deduction* | | | 35.50 | % | | |
| | U.S. Treasury Obligations* | | | 0.80 | % | | |
| | Qualified Business Income* | | | 0.00 | % | | |
| | Business Interest Income* | | | 3.65 | % | | |
| | * | The above percentages are based on ordinary income dividends paid to shareholders during the Fund’s fiscal year. |
| | |
| 41 | | Invesco Fundamental Alternatives Fund |
Trustees and Officers
The address of each trustee and officer is AIM Investment Funds (Invesco Investment Funds) (the “Trust”), 11 Greenway Plaza, Suite 1000, Houston, Texas 77046-1173. The trustees serve for the life of the Trust, subject to their earlier death, incapacitation, resignation, retirement or removal as more specifically provided in the Trust’s organizational documents. Each officer serves for a one year term or until their successors are elected and qualified. Column two below includes length of time served with predecessor entities, if any.
| | | | | | | | |
Name, Year of Birth and Position(s) Held with the Trust | | Trustee and/or Officer Since | | Principal Occupation(s) During Past 5 Years | | Number of Funds in Fund Complex Overseen by Trustee | | Other Directorship(s) Held by Trustee During Past 5 Years |
| Interested Trustee | | | | | | | | |
Martin L. Flanagan1 – 1960 Trustee and Vice Chair | | 2007 | | Executive Director, Chief Executive Officer and President, Invesco Ltd. (ultimate parent of Invesco and a global investment management firm); Trustee and Vice Chair, The Invesco Funds; Vice Chair, Investment Company Institute; and Member of Executive Board, SMU Cox School of Business Formerly: Advisor to the Board, Invesco Advisers, Inc. (formerly known as Invesco Institutional (N.A.), Inc.); Chairman and Chief Executive Officer, Invesco Advisers, Inc. (registered investment adviser); Director, Chairman, Chief Executive Officer and President, Invesco Holding Company (US), Inc. (formerly IVZ Inc.) (holding company), Invesco Group Services, Inc. (service provider) and Invesco North American Holdings, Inc. (holding company); Director, Chief Executive Officer and President, Invesco Holding Company Limited (parent of Invesco and a global investment management firm); Director, Invesco Ltd.; Chairman, Investment Company Institute and President, Co-Chief Executive Officer, Co-President, Chief Operating Officer and Chief Financial Officer, Franklin Resources, Inc. (global investment management organization) | | 189 | | None |
| 1 | Mr. Flanagan is considered an interested person (within the meaning of Section 2(a)(19) of the 1940 Act) of the Trust because he is an officer of the Adviser to the Trust, and an officer and a director of Invesco Ltd., ultimate parent of the Adviser. |
| | |
| T-1 | | Invesco Fundamental Alternatives Fund |
Trustees and Officers–(continued)
| | | | | | | | |
Name, Year of Birth and Position(s) Held with the Trust | | Trustee and/or Officer Since | | Principal Occupation(s) During Past 5 Years | | Number of Funds in Fund Complex Overseen by Trustee | | Other Directorship(s) Held by Trustee During Past 5 Years |
Independent Trustees | | | | | | | | |
Beth Ann Brown – 1968 Trustee (2019) and Chair (August 2022) | | 2019 | | Independent Consultant Formerly: Head of Intermediary Distribution, Managing Director, Strategic Relations, Managing Director, Head of National Accounts, Senior Vice President, National Account Manager and Senior Vice President, Key Account Manager, Columbia Management Investment Advisers LLC; Vice President, Key Account Manager, Liberty Funds Distributor, Inc.; and Trustee of certain Oppenheimer Funds | | 189 | | Director, Board of Directors of Caron Engineering Inc.; Advisor, Board of Advisors of Caron Engineering Inc.; President and Director, Acton Shapleigh Youth Conservation Corps (non-profit) Formerly: President and Director Director of Grahamtastic Connection (non-profit) |
Cynthia Hostetler – 1962 Trustee | | 2017 | | Non-Executive Director and Trustee of a number of public and private business corporations Formerly: Director, Aberdeen Investment Funds (4 portfolios); Director, Artio Global Investment LLC (mutual fund complex); Director, Edgen Group, Inc. (specialized energy and infrastructure products distributor); Director, Genesee & Wyoming, Inc. (railroads); Head of Investment Funds and Private Equity, Overseas Private Investment Corporation; President, First Manhattan Bancorporation, Inc.; and Attorney, Simpson Thacher & Bartlett LLP | | 189 | | Resideo Technologies, Inc. (smart home technology); Vulcan Materials Company (construction materials company); Trilinc Global Impact Fund; Textainer Group Holdings, (shipping container leasing company); Investment Company Institute (professional organization); and Independent Directors Council (professional organization) |
Eli Jones – 1961 Trustee | | 2016 | | Professor and Dean Emeritus, Mays Business School - Texas A&M University Formerly: Dean of Mays Business School-Texas A&M University; Professor and Dean, Walton College of Business, University of Arkansas and E.J. Ourso College of Business, Louisiana State University; and Director, Arvest Bank | | 189 | | Insperity, Inc. (formerly known as Administaff) (human resources provider); and Member of Regional Board of Directors and Board of Directors, First Financial Bancorp (regional bank) |
Elizabeth Krentzman – 1959 Trustee | | 2019 | | Formerly: Principal and Chief Regulatory Advisor for Asset Management Services and U.S. Mutual Fund Leader of Deloitte & Touche LLP; General Counsel of the Investment Company Institute (trade association); National Director of the Investment Management Regulatory Consulting Practice, Principal, Director and Senior Manager of Deloitte & Touche LLP; Assistant Director of the Division of Investment Management - Office of Disclosure and Investment Adviser Regulation of the U.S. Securities and Exchange Commission and various positions with the Division of Investment Management – Office of Regulatory Policy of the U.S. Securities and Exchange Commission; Associate at Ropes & Gray LLP; and Trustee of certain Oppenheimer Funds | | 189 | | Formerly: Member of the Cartica Funds Board of Directors (private investment fund); Trustee of the University of Florida National Board Foundation; and Member of the University of Florida Law Center Association, Inc. Board of Trustees, Audit Committee and Membership Committee |
Anthony J. LaCava, Jr. – 1956 Trustee | | 2019 | | Formerly: Director and Member of the Audit Committee, Blue Hills Bank (publicly traded financial institution) and Managing Partner, KPMG LLP | | 189 | | Blue Hills Bank; Chairman, Bentley University; Member, Business School Advisory Council; and Nominating Committee, KPMG LLP |
Prema Mathai-Davis – 1950 Trustee | | 2001 | | Retired Formerly: Co-Founder & Partner of Quantalytics Research, LLC, (a FinTech Investment Research Platform for the Self-Directed Investor); Trustee of YWCA Retirement Fund; CEO of YWCA of the USA; Board member of the NY Metropolitan Transportation Authority; Commissioner of the NYC Department of Aging; and Board member of Johns Hopkins Bioethics Institute | | 189 | | Member of Board of Positive Planet US (non-profit) and HealthCare Chaplaincy Network (non-profit) |
| | |
| T-2 | | Invesco Fundamental Alternatives Fund |
Trustees and Officers–(continued)
| | | | | | | | |
Name, Year of Birth and Position(s) Held with the Trust | | Trustee and/or Officer Since | | Principal Occupation(s) During Past 5 Years | | Number of Funds in Fund Complex Overseen by Trustee | | Other Directorship(s) Held by Trustee During Past 5 Years |
Independent Trustees–(continued) | | | | |
Joel W. Motley – 1952 Trustee | | 2019 | | Director of Office of Finance, Federal Home Loan Bank System; Managing Director of Carmona Motley Inc. (privately held financial advisor); Member of the Council on Foreign Relations and its Finance and Budget Committee; Chairman Emeritus of Board of Human Rights Watch and Member of its Investment Committee; and Member of Investment Committee Board of Historic Hudson Valley (non-profit cultural organization); Member of the Board, Blue Ocean Acquisition Corp.; and Member of the Vestry and the Investment Committee of Trinity Church Wall Street. Formerly: Managing Director of Public Capital Advisors, LLC (privately held financial advisor); Managing Director of Carmona Motley Hoffman, Inc. (privately held financial advisor); Trustee of certain Oppenheimer Funds; and Director of Columbia Equity Financial Corp. (privately held financial advisor) | | 189 | | Member of Board of Trust for Mutual Understanding (non-profit promoting the arts and environment); Member of Board of Greenwall Foundation (bioethics research foundation) and its Investment Committee; Member of Board of Friends of the LRC (non-profit legal advocacy); and Board Member and Investment Committee Member of Pulitzer Center for Crisis Reporting (non-profit journalism) |
Teresa M. Ressel – 1962 Trustee | | 2017 | | Non-executive director and trustee of a number of public and private business corporations Formerly: Chief Executive Officer, UBS Securities LLC (investment banking); Chief Operating Officer, UBS AG Americas (investment banking); Sr. Management Team Olayan America, The Olayan Group (international investor/commercial/industrial); Assistant Secretary for Management & Budget and Designated Chief Financial Officer, U.S. Department of Treasury and Director, ON Semiconductor Corporation (semiconductor manufacturing) | | 189 | | None |
Robert C. Troccoli – 1949 Trustee | | 2016 | | Retired Formerly: Adjunct Professor, University of Denver – Daniels College of Business; and Managing Partner, KPMG LLP | | 189 | | None |
Daniel S. Vandivort –1954 Trustee | | 2019 | | President, Flyway Advisory Services LLC (consulting and property management) Formerly: President and Chief Investment Officer, previously Head of Fixed Income, Weiss Peck and Greer/Robeco Investment Management; Trustee and Chair, Weiss Peck and Greer Funds Board; and various capacities at CS First Boston including Head of Fixed Income at First Boston Asset Management. | | 189 | | Formerly: Trustee and Governance Chair, Oppenheimer Funds; Treasurer, Chairman of the Audit and Finance Committee, Huntington Disease Foundation of America |
| | |
| T-3 | | Invesco Fundamental Alternatives Fund |
Trustees and Officers–(continued)
| | | | | | | | |
Name, Year of Birth and Position(s) Held with the Trust | | Trustee and/or Officer Since | | Principal Occupation(s) During Past 5 Years | | Number of Funds in Fund Complex Overseen by Trustee | | Other Directorship(s) Held by Trustee During Past 5 Years |
Officers | | | | | | | | |
Sheri Morris – 1964 President and Principal Executive Officer | | 1999 | | Director, Invesco Trust Company; Head of Global Fund Services, Invesco Ltd.; President and Principal Executive Officer, The Invesco Funds; Vice President, Invesco Exchange-Traded Fund Trust, Invesco Exchange-Traded Fund Trust II, Invesco India Exchange-Traded Fund Trust, Invesco Actively Managed Exchange-Traded Fund Trust, Invesco Actively Managed Exchange-Traded Commodity Fund Trust and Invesco Exchange-Traded Self-Indexed Fund Trust; and Vice President, OppenheimerFunds, Inc. Formerly: Vice President, Treasurer and Principal Financial Officer, The Invesco Funds; Vice President, Invesco AIM Advisers, Inc., Invesco AIM Capital Management, Inc. and Invesco AIM Private Asset Management, Inc.; Assistant Vice President and Assistant Treasurer, The Invesco Funds; Vice President and Assistant Vice President, Invesco Advisers, Inc.; Assistant Vice President, Invesco AIM Capital Management, Inc. and Invesco AIM Private Asset Management, Inc.; Treasurer, Invesco Exchange-Traded Fund Trust, Invesco Exchange-Traded Fund Trust II, Invesco India Exchange-Traded Fund Trust and Invesco Actively Managed Exchange-Traded Fund Trust; and Senior Vice President, Invesco Advisers, Inc. (formerly known as Invesco Institutional (N.A.), Inc.) (registered investment adviser) | | N/A | | N/A |
Jeffrey H. Kupor – 1968 Senior Vice President, Chief Legal Officer and Secretary | | 2018 | | Head of Legal of the Americas, Invesco Ltd.; Senior Vice President and Secretary, Invesco Advisers, Inc. (formerly known as Invesco Institutional (N.A.), Inc.) (registered investment adviser); Secretary, Invesco Distributors, Inc. (formerly known as Invesco AIM Distributors, Inc.); Vice President and Secretary, Invesco Investment Services, Inc. (formerly known as Invesco AIM Investment Services, Inc.); Senior Vice President, Chief Legal Officer and Secretary, The Invesco Funds; Secretary and General Counsel, Invesco Investment Advisers LLC (formerly known as Van Kampen Asset Management); Secretary and General Counsel, Invesco Capital Markets, Inc. (formerly known as Van Kampen Funds Inc.); Chief Legal Officer, Invesco Exchange-Traded Fund Trust, Invesco Exchange-Traded Fund Trust II, Invesco India Exchange-Traded Fund Trust, Invesco Actively Managed Exchange-Traded Fund Trust, Invesco Actively Managed Exchange-Traded Commodity Fund Trust and Invesco Exchange-Traded Self-Indexed Fund Trust;; Secretary and Vice President, Harbourview Asset Management Corporation; Secretary and Vice President, OppenheimerFunds, Inc. and Invesco Managed Accounts, LLC; Secretary and Senior Vice President, OFI Global Institutional, Inc.; Secretary and Vice President, OFI SteelPath, Inc.; Secretary and Vice President, Oppenheimer Acquisition Corp.; Secretary and Vice President, Shareholder Services, Inc.; and Secretary and Vice President, Trinity Investment Management Corporation Formerly: Senior Vice President, Invesco Distributors, Inc.; Secretary and Vice President, Jemstep, Inc.; Head of Legal, Worldwide Institutional, Invesco Ltd.; Secretary and General Counsel, INVESCO Private Capital Investments, Inc.; Senior Vice President, Secretary and General Counsel, Invesco Management Group, Inc. (formerly known as Invesco AIM Management Group, Inc.); Assistant Secretary, INVESCO Asset Management (Bermuda) Ltd.; Secretary and General Counsel, Invesco Private Capital, Inc.;Assistant Secretary and General Counsel, INVESCO Realty, Inc.; Secretary and General Counsel, Invesco Senior Secured Management, Inc.; Secretary, Sovereign G./P. Holdings Inc.; Secretary, Invesco Indexing LLC; and Secretary, W.L. Ross & Co., LLC | | N/A | | N/A |
Andrew R. Schlossberg – 1974 Senior Vice President | | 2019 | | Senior Vice President, Invesco Group Services, Inc.; Head of the Americas and Senior Managing Director, Invesco Ltd.; Director and Senior Vice President, Invesco Advisers, Inc. (formerly known as Invesco Institutional (N.A.), Inc.) (registered investment adviser); Director and Chairman, Invesco Investment Services, Inc. (formerly known as Invesco AIM Investment Services, Inc.) (registered transfer agent); Senior Vice President, The Invesco Funds; and Director, Invesco Investment Advisers LLC (formerly known as Van Kampen Asset Management) Formerly: Director, President and Chairman, Invesco Insurance Agency, Inc.; Director, Invesco UK Limited; Director and Chief Executive, Invesco Asset Management Limited and Invesco Fund Managers Limited; Assistant Vice President, The Invesco Funds; Senior Vice President, Invesco Advisers, Inc. (formerly known as Invesco Institutional (N.A.), Inc.) (registered investment adviser); Director and Chief Executive, Invesco Administration Services Limited and Invesco Global Investment Funds Limited; Director, Invesco Distributors, Inc.; Head of EMEA, Invesco Ltd.; President, Invesco Actively Managed Exchange-Traded Commodity Fund Trust, Invesco Actively Managed Exchange-Traded Fund Trust, Invesco Exchange-Traded Fund Trust, Invesco Exchange-Traded Fund Trust II and Invesco India Exchange-Traded Fund Trust; and Managing Director and Principal Executive Officer, Invesco Capital Management LLC | | N/A | | N/A |
| | |
| T-4 | | Invesco Fundamental Alternatives Fund |
Trustees and Officers–(continued)
| | | | | | | | |
Name, Year of Birth and Position(s) Held with the Trust | | Trustee and/or Officer Since | | Principal Occupation(s) During Past 5 Years | | Number of Funds in Fund Complex Overseen by Trustee | | Other Directorship(s) Held by Trustee During Past 5 Years |
Officers–(continued) | | | | | | | | |
John M. Zerr – 1962 Senior Vice President | | 2006 | | Chief Operating Officer of the Americas; Senior Vice President, Invesco Advisers, Inc. (formerly known as Invesco Institutional (N.A.), Inc.) (registered investment adviser); Senior Vice President, Invesco Distributors, Inc. (formerly known as Invesco AIM Distributors, Inc.); Director and Vice President, Invesco Investment Services, Inc. (formerly known as Invesco AIM Investment Services, Inc.) Senior Vice President, The Invesco Funds; Managing Director, Invesco Capital Management LLC; Director, Invesco Investment Advisers LLC (formerly known as Van Kampen Asset Management); Senior Vice President, Invesco Capital Markets, Inc. (formerly known as Van Kampen Funds Inc.); Manager, Invesco Indexing LLC; Manager, Invesco Specialized Products, LLC; Member, Invesco Canada Funds Advisory Board; Director, President and Chief Executive Officer, Invesco Corporate Class Inc. (corporate mutual fund company); and Director, Chairman, President and Chief Executive Officer, Invesco Canada Ltd. (formerly known as Invesco Trimark Ltd./Invesco Trimark Ltèe) (registered investment adviser and registered transfer agent); President, Invesco, Inc.; President, Invesco Global Direct Real Estate Feeder GP Ltd.; President, Invesco IP Holdings (Canada) Ltd; President, Invesco Global Direct Real Estate GP Ltd.; President, Invesco Financial Services Ltd. / Services Financiers Invesco Ltée; and Director and Chairman, Invesco Trust Company Formerly: President, Trimark Investments Ltd/Services Financiers Invesco Ltee; Director and Senior Vice President, Invesco Insurance Agency, Inc.; Director and Senior Vice President, Invesco Management Group, Inc. (formerly known as Invesco AIM Management Group, Inc.); Secretary and General Counsel, Invesco Management Group, Inc. (formerly known as Invesco AIM Management Group, Inc.); Secretary, Invesco Investment Services, Inc. (formerly known as Invesco AIM Investment Services, Inc.); Chief Legal Officer and Secretary, The Invesco Funds; Secretary and General Counsel, Invesco Investment Advisers LLC (formerly known as Van Kampen Asset Management); Secretary and General Counsel, Invesco Capital Markets, Inc. (formerly known as Van Kampen Funds Inc.); Chief Legal Officer, Invesco Exchange-Traded Fund Trust, Invesco Exchange-Traded Fund Trust II, Invesco India Exchange-Traded Fund Trust, Invesco Actively Managed Exchange-Traded Fund Trust, Invesco Actively Managed Exchange-Traded Commodity Fund Trust and Invesco Exchange-Traded Self-Indexed Fund Trust; Secretary, Invesco Indexing LLC; Director, Secretary, General Counsel and Senior Vice President, Van Kampen Exchange Corp.; Director, Vice President and Secretary, IVZ Distributors, Inc. (formerly known as INVESCO Distributors, Inc.); Director and Vice President, INVESCO Funds Group, Inc.; Director and Vice President, Van Kampen Advisors Inc.; Director, Vice President, Secretary and General Counsel, Van Kampen Investor Services Inc.;Director and Secretary, Invesco Distributors, Inc. (formerly known as Invesco AIM Distributors, Inc.); Director, Senior Vice President, General Counsel and Secretary, Invesco AIM Advisers, Inc. and Van Kampen Investments Inc.; Director, Vice President and Secretary, Fund Management Company; Director, Senior Vice President, Secretary, General Counsel and Vice President, Invesco AIM Capital Management, Inc.; and Chief Operating Officer and General Counsel, Liberty Ridge Capital, Inc. (an investment adviser) | | N/A | | N/A |
Gregory G. McGreevey – 1962 Senior Vice President | | 2012 | | Senior Managing Director, Invesco Ltd.; Director, Chairman, President, and Chief Executive Officer, Invesco Advisers, Inc. (formerly known as Invesco Institutional (N.A.), Inc.) (registered investment adviser); Director, Invesco Mortgage Capital, Inc. and Invesco Senior Secured Management, Inc.; Senior Vice President, The Invesco Funds; President, SNW Asset Management Corporation and Invesco Managed Accounts, LLC; Chairman and Director, Invesco Private Capital, Inc.; Chairman and Director, INVESCO Private Capital Investments, Inc.; Chairman and Director, INVESCO Realty, Inc.; and Senior Vice President, Invesco Group Services, Inc. Formerly: Senior Vice President, Invesco Management Group, Inc. and Invesco Advisers, Inc.; Assistant Vice President, The Invesco Funds | | N/A | | N/A |
Adrien Deberghes – 1967 Principal Financial Officer, Treasurer and Vice President | | 2020 | | Head of the Fund Office of the CFO and Fund Administration; Vice President, Invesco Advisers, Inc.; Principal Financial Officer, Treasurer and Vice President, The Invesco Funds; Vice President, Invesco Exchange-Traded Fund Trust, Invesco Exchange-Traded Fund Trust II, Invesco India Exchange-Traded Fund Trust, Invesco Actively Managed Exchange-Traded Fund Trust, Invesco Actively Managed Exchange-Traded Commodity Fund Trust and Invesco Exchange-Traded Self-Indexed Fund Trust Formerly: Senior Vice President and Treasurer, Fidelity Investments | | N/A | | N/A |
Crissie M. Wisdom – 1969 Anti-Money Laundering Compliance Officer | | 2013 | | Anti-Money Laundering and OFAC Compliance Officer for Invesco U.S. entities including: Invesco Advisers, Inc. and its affiliates, Invesco Capital Markets, Inc., Invesco Distributors, Inc., Invesco Investment Services, Inc., The Invesco Funds, Invesco Capital Management, LLC, Invesco Trust Company; and Fraud Prevention Manager for Invesco Investment Services, Inc. | | N/A | | N/A |
| | |
| T-5 | | Invesco Fundamental Alternatives Fund |
Trustees and Officers–(continued)
| | | | | | | | |
Name, Year of Birth and Position(s) Held with the Trust | | Trustee and/or Officer Since | | Principal Occupation(s) During Past 5 Years | | Number of Funds in Fund Complex Overseen by Trustee | | Other Directorship(s) Held by Trustee During Past 5 Years |
Officers–(continued) | | | | | | | | |
Todd F. Kuehl – 1969 Chief Compliance Officer and Senior Vice President | | 2020 | | Chief Compliance Officer, Invesco Advisers, Inc. (registered investment adviser); and Chief Compliance Officer and Senior Vice President, The Invesco Funds Formerly: Managing Director and Chief Compliance Officer, Legg Mason (Mutual Funds); Chief Compliance Officer, Legg Mason Private Portfolio Group (registered investment adviser) | | N/A | | N/A |
James Bordewick, Jr. – 1959 Senior Vice President and Senior Officer | | 2022 | | Senior Vice President and Senior Officer, The Invesco Funds; and Chief Legal Officer, KingsCrowd, Inc. (research and analytical platform for investment in private capital markets) Formerly, Chief Operating Officer and Head of Legal and Regulatory, Netcapital (private capital investment platform); Managing Director, General Counsel of asset management and Chief Compliance Officer for asset management and private banking, Bank of America Corporation; Chief Legal Officer, Columbia Funds and BofA Funds; Senior Vice President and Associate General Counsel, MFS Investment Management; Chief Legal Officer, MFS Funds; Associate, Ropes & Gray; Associate, Gaston Snow & Ely Bartlett | | N/A | | N/A |
The Statement of Additional Information of the Trust includes additional information about the Fund’s Trustees and is available upon request, without charge, by calling 1.800.959.4246. Please refer to the Fund’s Statement of Additional Information for information on the Fund’s sub-advisers.
Office of the Fund
11 Greenway Plaza, Suite 1000
Houston, TX 77046-1173
Counsel to the Fund
Stradley Ronon Stevens & Young, LLP
2005 Market Street, Suite 2600
Philadelphia, PA 19103-7018
Investment Adviser
Invesco Advisers, Inc.
1555 Peachtree Street, N.E.
Atlanta, GA 30309
Counsel to the Independent Trustees
Goodwin Procter LLP
901 New York Avenue, N.W.
Washington, D.C. 20001
Distributor
Invesco Distributors, Inc.
11 Greenway Plaza, Suite 1000
Houston, TX 77046-1173
Transfer Agent
Invesco Investment Services, Inc.
11 Greenway Plaza, Suite 1000
Houston, TX 77046-1173
Auditors
PricewaterhouseCoopers LLP
1000 Louisiana Street, Suite 5800
Houston, TX 77002-5021
Custodian
State Street Bank and Trust Company
225 Franklin Street
Boston, MA 02110-2801
| | |
| T-6 | | Invesco Fundamental Alternatives Fund |

Go paperless with eDelivery
Visit invesco.com/edelivery to enjoy the convenience and security of anytime electronic access to your investment documents.
With eDelivery, you can elect to have any or all of the following materials delivered straight to your inbox to download, save and print from your own computer:
| ∎ | | Fund reports and prospectuses |
Invesco mailing information
Send general correspondence to Invesco Investment Services, Inc., P.O. Box 219078, Kansas City, MO 64121-9078.
Important notice regarding delivery of security holder documents
To reduce Fund expenses, only one copy of most shareholder documents may be mailed to shareholders with multiple accounts at the same address (Householding). Mailing of your shareholder documents may be householded indefinitely unless you instruct us otherwise. If you do not want the mailing of these documents to be combined with those for other members of your household, please contact Invesco Investment Services, Inc. at 800 959 4246 or contact your financial institution. We will begin sending you individual copies for each account within 30 days after receiving your request.
Fund holdings and proxy voting information
The Fund provides a complete list of its portfolio holdings four times each year, at the end of each fiscal quarter. For the second and fourth quarters, the list appears, respectively, in the Fund’s semiannual and annual reports to shareholders. For the first and third quarters, the Fund files the list with the Securities and Exchange Commission (SEC) as an exhibit to its reports on Form N-PORT. The most recent list of portfolio holdings is available at invesco.com/completeqtrholdings. Shareholders can also look up the Fund’s Form N-PORT filings on the SEC website, sec.gov. The SEC file numbers for the Fund are shown below.
A description of the policies and procedures that the Fund uses to determine how to vote proxies relating to portfolio securities is available without charge, upon request, from our Client Services department at 800 959 4246, or at invesco.com/ corporate/about-us/esg. The information is also available on the SEC website, sec.gov.
Information regarding how the Fund voted proxies related to its portfolio securities during the most recent 12-month period ended June 30 is available at invesco.com/proxysearch. This information is also available on the SEC website, sec.gov.
Invesco Advisers, Inc. is an investment adviser; it provides investment advisory services to individual and institutional clients and does not sell securities. Invesco Distributors, Inc. is the US distributor for Invesco Ltd.’s retail mutual funds, exchange-traded funds and institutional money market funds. Both are wholly owned, indirect subsidiaries of Invesco Ltd.
| | | | |
| SEC file number(s): 811-05426 and 033-19338 | | Invesco Distributors, Inc. | | O-FALT-AR-1 |

| | |
|
| Annual Report to Shareholders | | October 31, 2022 |
Invesco Global Allocation Fund
Nasdaq:
A: QVGIX ∎ C: QGRCX ∎ R: QGRNX ∎ Y: QGRYX ∎ R5: GLALX ∎ R6: QGRIX
Management’s Discussion of Fund Performance
| | | | |
| |
Performance summary For the fiscal year ended October 31, 2022, Class A shares of Invesco Global Allocation Fund (the Fund), at net asset value (NAV), underperformed the Custom Invesco Global Allocation Index. Your Fund’s long-term performance appears later in this report. | |
| |
Fund vs. Indexes Total returns, 10/31/21 to 10/31/22, at net asset value (NAV). Performance shown does not include applicable contingent deferred sales charges (CDSC) or front-end sales charges, which would have reduced performance. | |
Class A Shares | | | -19.30% | |
Class C Shares | | | -19.89 | |
Class R Shares | | | -19.47 | |
Class Y Shares | | | -19.08 | |
Class R5 Shares | | | -18.98 | |
Class R6 Shares | | | -19.01 | |
Custom Invesco Global Allocation Indexq | | | -16.57 | |
MSCI All Country World Index∎ | | | -19.96 | |
Bloomberg Global Aggregate USD Hedged Index∎ | | | -12.12 | |
Source(s): qInvesco, RIMES Technologies Corp.; ∎RIMES Technologies Corp. | |
Market conditions and your Fund
At the beginning of the fiscal year ended October 31, 2022, developed global equity markets were mostly positive, despite rising inflation and the emergence of Omicron, a new COVID-19 variant. Pandemic-related supply chain disruptions and labor shortages intensified at the end of 2021, resulting in broadly higher costs for companies and consumers. Emerging market equities declined due in part to COVID-19 concerns and China’s ongoing regulatory tightening in the private education and technology sectors and slowing economic growth.
Global equity markets declined in the first half of 2022 amid volatility sparked by Russia’s invasion of Ukraine, rising commodity prices, rampant global inflation and central banks shifting toward tighter monetary policy. Russia’s invasion exacerbated inflationary pressures, disrupting already strained supply chains, and increasing shortages of oil, gas and raw materials, with the price of oil rising sharply.
Inflation headwinds continued into the third quarter of 2022. The US Federal Reserve (the Fed), the European Central Bank and the Bank of England all raised interest rates. In contrast, the People’s Bank of China lowered its policy rate and the Bank of Japan kept rates the same. Emerging market equities, hampered by the strong US dollar, underper-formed developed market equities.
During October 2022, developed market equities rebounded and were in positive territory. Developed market equities outperformed emerging market equities, which declined primarily driven by weakness in China as Chinese markets reacted to the reappointment of President Xi and his authority, with no signs of the country’s zero-COVID-19 policy being relaxed. Despite the rebound in October for developed market equities, at the
end of the fiscal year, trailing one-year returns for developed market equities and emerging market equities were both in negative territory.
During the fiscal year, the Fund underperformed the Custom Invesco Global Allocation Index. Relative to the index, the Fund received positive contributions from top-down factor rotation and detractions from top-down asset allocation and bottom-up managers’ security selection.
From a top-down asset allocation perspective, the Fund was largely positioned in a ‘neutral’ or ‘risk-off’ stance compared to the Custom Invesco Global Allocation Index for most of the fiscal year. This tactical positioning allowed for positive relative contributions from equities, commodities, foreign exchange and cash. Within equities, top-down factor rotation into defensive factors helped the portfolio during periods of heightened market volatility. The Fund’s relative detractors were experienced in the fixed-income space and particularly within US treasuries. The diversification benefits of fixed-income as a ballast to riskier equities were not achieved for much of the past fiscal year due to monetary tightening and other economic conditions.
From a bottom-up managers’ security selection perspective, after controlling for style bias, all underlying Fund strategies detracted from performance relative to the Custom Invesco Global Allocation Index during the fiscal year. In particular, emerging market equity exposures suffered the largest losses after writing-off sanctioned Russian equities. Global and international equity strategies were also the primary detractors from relative Fund performance. No bottom-up manager strategies contributed positively to relative Fund performance.
Thank you for your investment in Invesco Global Allocation Fund as we continue to
2 Invesco Global Allocation Fund
dynamically navigate changing macroeconomic and market conditions.
Portfolio manager(s):
Alessio de Longis
Duy Nguyen
The views and opinions expressed in management’s discussion of Fund performance are those of Invesco Advisers, Inc. and its affiliates. These views and opinions are subject to change at any time based on factors such as market and economic conditions. These views and opinions may not be relied upon as investment advice or recommendations, or as an offer for a particular security. The information is not a complete analysis of every aspect of any market, country, industry, security or the Fund. Statements of fact are from sources considered reliable, but Invesco Advisers, Inc. makes no representation or warranty as to their completeness or accuracy. Although historical performance is no guarantee of future results, these insights may help you understand our investment management philosophy.
See important Fund and, if applicable, index disclosures later in this report.
Your Fund’s Long-Term Performance
Results of a $10,000 Investment – Oldest Share Class(es)
Fund and index data from 10/31/12
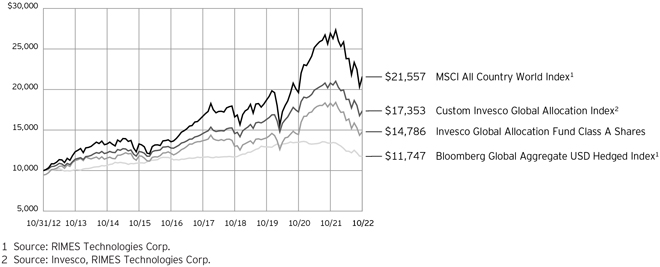
1 Source: RIMES Technologies Corp.
2 Source: Invesco, RIMES Technologies Corp.
Past performance cannot guarantee future results.
The data shown in the chart include reinvested distributions, applicable sales charges and Fund expenses including management
fees. Index results include reinvested dividends, but they do not reflect sales charges. Performance of the peer group, if applicable, reflects fund expenses and management fees;
performance of a market index does not. Performance shown in the chart does not reflect deduction of taxes a shareholder would pay on Fund distributions or sale of Fund shares.
3 Invesco Global Allocation Fund
| | | | |
| Average Annual Total Returns | |
|
As of 10/31/22, including maximum applicable sales charges | |
| |
Class A Shares | | | | |
Inception (11/1/91) | | | 6.78 | % |
10 Years | | | 3.99 | |
5 Years | | | 0.43 | |
1 Year | | | -23.72 | |
| |
Class C Shares | | | | |
Inception (9/1/93) | | | 6.54 | % |
10 Years | | | 3.95 | |
5 Years | | | 0.80 | |
1 Year | | | -20.59 | |
| |
Class R Shares | | | | |
Inception (3/1/01) | | | 2.95 | % |
10 Years | | | 4.32 | |
5 Years | | | 1.31 | |
1 Year | | | -19.47 | |
| |
Class Y Shares | | | | |
Inception (5/1/00) | | | 3.99 | % |
10 Years | | | 4.86 | |
5 Years | | | 1.82 | |
1 Year | | | -19.08 | |
| |
Class R5 Shares | | | | |
10 Years | | | 4.73 | % |
5 Years | | | 1.86 | |
1 Year | | | -18.98 | |
| |
Class R6 Shares | | | | |
Inception (2/28/12) | | | 4.60 | % |
10 Years | | | 5.03 | |
5 Years | | | 1.97 | |
1 Year | | | -19.01 | |
Effective May 24, 2019, Class A, Class C, Class R, Class Y and Class I shares of the Oppenheimer Global Allocation Fund, (the predecessor fund), were reorganized into Class A, Class C, Class R, Class Y and Class R6 shares, respectively, of the Invesco Oppenheimer Global Allocation Fund. Note: The Fund was subsequently renamed the Invesco Global Allocation Fund (the Fund). Returns shown above, for periods ending on or prior to May 24, 2019, for Class A, Class C, Class R, Class Y and Class R6 shares are those for Class A, Class C, Class R, Class Y and Class I shares of the predecessor fund. Share class returns will differ from the predecessor fund because of different expenses.
Class R5 shares incepted on May 24, 2019. Performance shown on and prior to that date is that of the predecessor fund’s Class A shares and includes the 12b-1 fees applicable to Class A shares.
The performance data quoted represent past performance and cannot guarantee future results; current performance may be lower or higher. Please visit invesco.com/ performance for the most recent monthend performance. Performance figures reflect reinvested distributions, changes in net asset value and the effect of the maximum sales charge unless otherwise stated. Performance figures do not reflect deduction
of taxes a shareholder would pay on Fund distributions or sale of Fund shares. Investment return and principal value will fluctuate so that you may have a gain or loss when you sell shares.
Class A share performance reflects the maximum 5.50% sales charge, and Class C share performance reflects the applicable contingent deferred sales charge (CDSC) for the period involved. The CDSC on Class C shares is 1% for the first year after purchase. Class R, Class Y, Class R5 and Class R6 shares do not have a front-end sales charge or a CDSC; therefore, performance is at net asset value.
The performance of the Fund’s share classes will differ primarily due to different sales charge structures and class expenses.
Fund performance reflects any applicable fee waivers and/or expense reimbursements. Had the adviser not waived fees and/or reimbursed expenses currently or in the past, returns would have been lower. See current prospectus for more information.
4 Invesco Global Allocation Fund
Supplemental Information
Invesco Global Allocation Fund’s investment objective is to seek total return.
∎ Unless otherwise stated, information presented in this report is as of October 31, 2022, and is based on total net assets.
∎ Unless otherwise noted, all data is provided by Invesco.
∎ To access your Fund’s reports/prospectus, visit invesco.com/fundreports.
About indexes used in this report
| ∎ | The MSCI All Country World Index is an unmanaged index considered representative of large- and mid-cap stocks across developed and emerging markets. The index is computed using the net return, which withholds applicable taxes for nonresident investors. |
| ∎ | The Custom Invesco Global Allocation Index is composed of 60% MSCI All Country World Index/40% Bloomberg Global Aggregate USD Hedged Index. |
| ∎ | The Bloomberg Global Aggregate USD Hedged Index tracks fixed-income performance of regions around the world while hedging the currency back to the US dollar. |
| ∎ | The Fund is not managed to track the performance of any particular index, including the index(es) described here, and consequently, the performance of the Fund may deviate significantly from the performance of the index(es). |
| ∎ | A direct investment cannot be made in an index. Unless otherwise indicated, index results include reinvested dividends, and they do not reflect sales charges. Performance of the peer group, if applicable, reflects fund expenses; performance of a market index does not. |
| | |
This report must be accompanied or preceded by a currently effective Fund prospectus, which contains more complete information, including sales charges and expenses. Investors should read it carefully before investing. | | |
| | |
| | |
| NOT FDIC INSURED | MAY LOSE VALUE | NO BANK GUARANTEE | | |
5 Invesco Global Allocation Fund
Fund Information
| | | | |
Portfolio Composition |
| |
| By security type | | % of total net assets |
| |
Exchange-Traded Funds | | 50.00% |
|
| |
Common Stocks & Other Equity Interests | | 25.97 |
|
| |
U.S. Treasury Securities | | 20.51 |
|
| |
Security Types Each Less Than 1% of Portfolio | | 0.27 |
|
Money Market Funds Plus Other Assets Less Liabilities | | 3.25 |
|
Top 10 Equity Holdings* |
| |
| | | % of total net assets |
| 1. | | Invesco Russell 1000 Dynamic Multifactor ETF | | 20.13% |
|
| 2. | | Invesco BulletShares 2023 Corporate Bond ETF | | 13.27 |
|
| 3. | | Invesco International Developed Dynamic Multifactor ETF | | 8.88 |
|
| 4. | | Invesco Russell 2000 Dynamic Multifactor ETF | | 5.53 |
|
| 5. | | Invesco High Yield Bond Factor ETF | | 2.20 |
|
| 6. | | Alphabet, Inc., Class A | | 0.60 |
|
| 7. | | LVMH Moet Hennessy Louis Vuitton SE | | 0.55 |
|
| 8. | | Novo Nordisk A/S, Class B | | 0.55 |
|
| 9. | | Housing Development Finance Corp. Ltd. | | 0.51 |
|
| 10. | | Airbus SE | | 0.45 |
The Fund’s holdings are subject to change, and there is no assurance that the Fund will continue to hold any particular security. * Excluding money market fund holdings, if any. Datapresented here are as of October 31, 2022. |
6 Invesco Global Allocation Fund
Consolidated Schedule of Investments(a)
October 31, 2022
| | | | | | | | |
| | | Shares | | | Value | |
| |
Exchange-Traded Funds–50.00% | |
Invesco BulletShares 2023 Corporate Bond ETF(b)(c) | | | 6,549,500 | | | $ | 136,622,570 | |
| |
Invesco High Yield Bond Factor ETF(b) | | | 1,076,000 | | | | 22,644,420 | |
| |
Invesco International Developed Dynamic Multifactor ETF(b) | | | 4,910,000 | | | | 91,450,714 | |
| |
Invesco Russell 1000 Dynamic Multifactor ETF(b) | | | 4,826,160 | | | | 207,235,310 | |
| |
Invesco Russell 2000 Dynamic Multifactor ETF(b)(c) | | | 1,607,300 | | | | 56,866,274 | |
| |
Total Exchange-Traded Funds
(Cost $476,039,949) | | | | 514,819,288 | |
| |
|
Common Stocks & Other Equity Interests–25.97% | |
Advertising–0.02% | |
Trade Desk, Inc. (The), Class A(d) | | | 4,643 | | | | 247,193 | |
| |
|
Aerospace & Defense–0.61% | |
Airbus SE (France) | | | 42,892 | | | | 4,644,878 | |
| |
BAE Systems PLC (United Kingdom) | | | 59,717 | | | | 557,729 | |
| |
CAE, Inc. (Canada)(d) | | | 14,689 | | | | 280,335 | |
| |
Northrop Grumman Corp. | | | 1,436 | | | | 788,378 | |
| |
| | | | | | | 6,271,320 | |
| |
|
Air Freight & Logistics–0.35% | |
DSV A/S (Denmark) | | | 1,026 | | | | 138,684 | |
| |
United Parcel Service, Inc., Class B | | | 9,402 | | | | 1,577,374 | |
| |
ZTO Express (Cayman), Inc. (China) | | | 5,979 | | | | 101,354 | |
| |
ZTO Express (Cayman), Inc., ADR (China)(c) | | | 103,814 | | | | 1,753,418 | |
| |
| | | | | | | 3,570,830 | |
| |
|
Apparel Retail–0.06% | |
Lojas Renner S.A. (Brazil) | | | 99,495 | | | | 595,179 | |
| |
|
Apparel, Accessories & Luxury Goods–1.30% | |
Brunello Cucinelli S.p.A. (Italy) | | | 5,334 | | | | 309,339 | |
| |
Cie Financiere Richemont S.A. (Switzerland) | | | 14,835 | | | | 1,450,981 | |
| |
Cie Financiere Richemont S.A., Wts., expiring 11/22/2023 (Switzerland)(d) | | | 50,652 | | | | 24,786 | |
| |
Hermes International (France) | | | 1,616 | | | | 2,092,884 | |
| |
Kering S.A. (France) | | | 4,983 | | | | 2,280,898 | |
| |
lululemon athletica, inc.(d) | | | 2,069 | | | | 680,784 | |
| |
LVMH Moet Hennessy Louis Vuitton SE (France) | | | 9,033 | | | | 5,698,702 | |
| |
PRADA S.p.A. (Italy) | | | 185,000 | | | | 840,808 | |
| |
| | | | | | | 13,379,182 | |
| |
|
Application Software–1.27% | |
Adobe, Inc.(d) | | | 5,286 | | | | 1,683,591 | |
| |
Bill.com Holdings, Inc.(d) | | | 2,886 | | | | 384,877 | |
| |
Cadence Design Systems, Inc.(d) | | | 4,225 | | | | 639,623 | |
| |
Dassault Systemes SE (France) | | | 23,239 | | | | 778,050 | |
| |
Datadog, Inc., Class A(d) | | | 1,518 | | | | 122,214 | |
| |
HubSpot, Inc.(d) | | | 734 | | | | 217,675 | |
| |
Intuit, Inc. | | | 7,315 | | | | 3,127,163 | |
| |
Manhattan Associates, Inc.(d) | | | 4,829 | | | | 587,544 | |
| |
| | | | | | |
| | | Shares | | | Value |
|
Application Software–(continued) |
Paycom Software, Inc.(d) | | | 1,195 | | | $ 413,470 |
|
Paylocity Holding Corp.(d) | | | 4,420 | | | 1,024,512 |
|
Qualtrics International, Inc., Class A(d) | | | 13,759 | | | 164,695 |
|
Roper Technologies, Inc. | | | 1,828 | | | 757,779 |
|
SAP SE (Germany) | | | 11,764 | | | 1,135,808 |
|
Splunk, Inc.(d) | | | 3,067 | | | 254,898 |
|
Synopsys, Inc.(d) | | | 3,211 | | | 939,378 |
|
Tyler Technologies, Inc.(d) | | | 1,928 | | | 623,380 |
|
Xero Ltd. (New Zealand)(d) | | | 4,218 | | | 209,402 |
|
| | | | | | 13,064,059 |
|
|
Asset Management & Custody Banks–0.03% |
Ameriprise Financial, Inc. | | | 1,104 | | | 341,268 |
|
|
Automobile Manufacturers–0.09% |
Dr. Ing. h.c. F. Porsche AG, Preference Shares (Germany)(d) | | | 6,096 | | | 623,522 |
|
Suzuki Motor Corp. (Japan) | | | 8,600 | | | 290,167 |
|
| | | | | | 913,689 |
|
|
Automotive Retail–0.08% |
O’Reilly Automotive, Inc.(d) | | | 944 | | | 790,288 |
|
| | |
Biotechnology–0.34% | | | | | | |
Alnylam Pharmaceuticals, Inc.(d) | | | 2,309 | | | 478,563 |
|
Ascendis Pharma A/S, ADR (Denmark)(d) | | | 2,779 | | | 319,585 |
|
BeiGene Ltd., ADR (China)(c)(d) | | | 5,400 | | | 912,006 |
|
Brii Biosciences Ltd. (China)(d) | | | 55,000 | | | 39,186 |
|
CSL Ltd. (Australia) | | | 4,902 | | | 878,491 |
|
Natera, Inc.(d) | | | 3,839 | | | 180,280 |
|
Neurocrine Biosciences, Inc.(d) | | | 2,573 | | | 296,204 |
|
Zai Lab Ltd., ADR (China)(d) | | | 17,501 | | | 389,922 |
|
| | | | | | 3,494,237 |
|
|
Brewers–0.37% |
Ambev S.A. (Brazil) | | | 345,002 | | | 1,068,635 |
|
Anheuser-Busch InBev S.A./N.V. (Belgium) | | | 5,273 | | | 264,116 |
|
Asahi Group Holdings Ltd. (Japan) | | | 37,800 | | | 1,058,080 |
|
Carlsberg A/S, Class B (Denmark) | | | 12,293 | | | 1,447,457 |
|
| | | | | | 3,838,288 |
|
|
Broadcasting–0.04% |
Zee Entertainment Enterprises Ltd. (India) | | | 132,763 | | | 420,457 |
|
|
Building Products–0.25% |
Advanced Drainage Systems, Inc.(c) | | | 2,996 | | | 347,177 |
|
Assa Abloy AB, Class B (Sweden) | | | 44,147 | | | 890,767 |
|
Carlisle Cos., Inc. | | | 2,040 | | | 487,152 |
|
Daikin Industries Ltd. (Japan) | | | 5,900 | | | 887,375 |
|
| | | | | | 2,612,471 |
|
|
Cable & Satellite–0.02% |
Charter Communications, Inc., Class A(d) | | | 434 | | | 159,547 |
|
See accompanying Notes to Consolidated Financial Statements which are an integral part of the financial statements.
7 Invesco Global Allocation Fund
| | | | | | |
| | | Shares | | | Value |
Casinos & Gaming–0.38% | | | |
Entain PLC (United Kingdom) | | | 90,129 | | | $ 1,304,471 |
|
Flutter Entertainment PLC (Ireland)(d) | | | 15,342 | | | 2,035,124 |
|
Las Vegas Sands Corp.(c)(d) | | | 15,545 | | | 590,865 |
|
| | | | | | 3,930,460 |
|
| |
Commodity Chemicals–0.20% | | | |
LG Chem Ltd. (South Korea) | | | 4,709 | | | 2,063,440 |
|
| |
Communications Equipment–0.10% | | | |
Motorola Solutions, Inc. | | | 4,163 | | | 1,039,543 |
|
| |
Construction & Engineering–0.28% | | | |
Quanta Services, Inc. | | | 4,901 | | | 696,138 |
|
Vinci S.A. (France) | | | 17,198 | | | 1,580,457 |
|
WillScot Mobile Mini Holdings
Corp.(d) | | | 13,050 | | | 555,016 |
|
| | | | | | 2,831,611 |
|
|
Construction Machinery & Heavy Trucks–0.11% |
Epiroc AB, Class A (Sweden) | | | 77,167 | | | 1,179,899 |
|
| |
Construction Materials–0.13% | | | |
James Hardie Industries PLC, CDI (Australia) | | | 45,970 | | | 1,009,912 |
|
Vulcan Materials Co. | | | 1,739 | | | 284,674 |
|
| | | | | | 1,294,586 |
|
| |
Consumer Electronics–0.01% | | | |
Sony Group Corp. (Japan) | | | 1,700 | | | 115,112 |
|
| | |
Copper–0.02% | | | | | | |
Antofagasta PLC (Chile) | | | 16,700 | | | 224,766 |
|
|
Data Processing & Outsourced Services–0.66% |
Adyen N.V. (Netherlands)(d)(e) | | | 671 | | | 961,219 |
|
Amadeus IT Group S.A. (Spain)(d) | | | 28,794 | | | 1,498,898 |
|
Edenred (France) | | | 29,486 | | | 1,513,017 |
|
ExlService Holdings, Inc.(d) | | | 3,239 | | | 589,012 |
|
Fidelity National Information Services, Inc. | | | 3,436 | | | 285,154 |
|
StoneCo Ltd., Class A (Brazil)(d) | | | 13,153 | | | 138,107 |
|
Visa, Inc., Class A(c) | | | 5,778 | | | 1,196,970 |
|
Worldline S.A. (France)(d)(e) | | | 15,043 | | | 657,912 |
|
| | | | | | 6,840,289 |
|
| | |
Department Stores–0.07% | | | | | | |
Next PLC (United Kingdom) | | | 12,659 | | | 715,018 |
|
| |
Distillers & Vintners–0.43% | | | |
Davide Campari-Milano N.V. (Italy) | | | 104,774 | | | 942,296 |
|
Diageo PLC (United Kingdom) | | | 7,313 | | | 301,486 |
|
Pernod Ricard S.A. (France) | | | 18,386 | | | 3,225,777 |
|
| | | | | | 4,469,559 |
|
| | |
Distributors–0.06% | | | | | | |
Genuine Parts Co. | | | 3,289 | | | 584,982 |
|
| |
Diversified Banks–1.23% | | | |
Banco Bradesco S.A., Preference Shares (Brazil) | | | 271,832 | | | 1,045,123 |
|
Banco Santander Chile (Chile) | | | 1,576,486 | | | 56,776 |
|
CaixaBank S.A. (Spain) | | | 158,227 | | | 524,301 |
|
Credicorp Ltd. (Peru) | | | 4,268 | | | 624,665 |
|
ICICI Bank Ltd., ADR (India) | | | 59,203 | | | 1,304,834 |
|
| | | | | | |
| | | Shares | | | Value |
Diversified Banks–(continued) | | | |
ING Groep N.V. (Netherlands) | | | 115,161 | | | $ 1,131,144 |
|
Kotak Mahindra Bank Ltd. (India) | | | 168,458 | | | 3,874,646 |
|
Lloyds Banking Group PLC (United Kingdom) | | | 2,027,602 | | | 975,879 |
|
NU Holdings Ltd., Class A (Brazil)(d) | | | 107,536 | | | 537,680 |
|
PT Bank Central Asia Tbk (Indonesia) | | | 980,700 | | | 552,612 |
|
Sberbank of Russia PJSC (Russia)(d)(f) | | | 11,951 | | | 0 |
|
Societe Generale S.A. (France) | | | 88,246 | | | 2,022,761 |
|
TCS Group Holding PLC, GDR (Russia)(d)(e)(f) | | | 6,603 | | | 0 |
|
| | | | | | 12,650,421 |
|
| |
Diversified Metals & Mining–0.45% | | | |
Anglo American PLC (South Africa) | | | 14,824 | | | 443,449 |
|
Eramet S.A. (France) | | | 3,508 | | | 229,699 |
|
Grupo Mexico S.A.B. de C.V., Class B (Mexico) | | | 690,507 | | | 2,503,363 |
|
Korea Zinc Co. Ltd. (South Korea) | | | 1,879 | | | 842,453 |
|
Teck Resources Ltd., Class B (Canada) | | | 18,564 | | | 565,088 |
|
| | | | | | 4,584,052 |
|
| |
Diversified Real Estate Activities–0.24% | | | |
DLF Ltd. (India) | | | 467,649 | | | 2,175,819 |
|
Mitsui Fudosan Co. Ltd. (Japan) | | | 14,000 | | | 268,165 |
|
| | | | | | 2,443,984 |
|
| |
Electrical Components & Equipment–0.20% | | | |
AMETEK, Inc. | | | 4,767 | | | 618,089 |
|
Hubbell, Inc. | | | 2,191 | | | 520,319 |
|
Nidec Corp. (Japan) | | | 13,400 | | | 738,906 |
|
WEG S.A. (Brazil) | | | 26,136 | | | 203,805 |
|
| | | | | | 2,081,119 |
|
| |
Electronic Components–0.24% | | | |
Murata Manufacturing Co. Ltd. (Japan) | | | 29,800 | | | 1,461,882 |
|
Omron Corp. (Japan) | | | 3,800 | | | 176,623 |
|
Sunny Optical Technology Group Co. Ltd. (China) | | | 14,800 | | | 128,389 |
|
TDK Corp. (Japan) | | | 24,100 | | | 750,320 |
|
| | | | | | 2,517,214 |
|
| |
Electronic Equipment & Instruments–0.28% | | | |
Keyence Corp. (Japan) | | | 6,900 | | | 2,600,452 |
|
Yokogawa Electric Corp. (Japan) | | | 16,200 | | | 271,194 |
|
| | | | | | 2,871,646 |
|
| |
Environmental & Facilities Services–0.37% | | | |
Rentokil Initial PLC (United Kingdom) | | | 360,814 | | | 2,250,814 |
|
Republic Services, Inc. | | | 4,158 | | | 551,434 |
|
Waste Connections, Inc. | | | 7,706 | | | 1,016,499 |
|
| | | | | | 3,818,747 |
|
| |
Fertilizers & Agricultural Chemicals–0.12% | | | |
FMC Corp. | | | 2,563 | | | 304,741 |
|
Nutrien Ltd. (Canada) | | | 11,197 | | | 946,146 |
|
| | | | | | 1,250,887 |
|
| |
Financial Exchanges & Data–0.60% | | | |
FactSet Research Systems, Inc. | | | 1,078 | | | 458,678 |
|
London Stock Exchange Group PLC (United Kingdom) | | | 21,073 | | | 1,827,198 |
|
See accompanying Notes to Consolidated Financial Statements which are an integral part of the financial statements.
8 Invesco Global Allocation Fund
| | | | | | | | |
| | | Shares | | | Value | |
| |
Financial Exchanges & Data–(continued) | | | | | |
MSCI, Inc. | | | 994 | | | $ | 466,047 | |
| |
Nasdaq, Inc. | | | 7,636 | | | | 475,265 | |
| |
S&P Global, Inc. | | | 9,067 | | | | 2,912,774 | |
| |
| | | | | | | 6,139,962 | |
| |
Food Distributors–0.03% | | | | | | | | |
Sysco Corp. | | | 3,531 | | | | 305,643 | |
| |
| | |
Food Retail–0.29% | | | | | | | | |
Alimentation Couche-Tard, Inc. (Canada) | | | 34,755 | | | | 1,556,175 | |
| |
Kobe Bussan Co. Ltd. (Japan) | | | 21,700 | | | | 470,853 | |
| |
Ocado Group PLC (United Kingdom)(d) | | | 24,498 | | | | 132,548 | |
| |
Seven & i Holdings Co. Ltd. (Japan) | | | 21,000 | | | | 783,939 | |
| |
| | | | | | | 2,943,515 | |
| |
| | |
Footwear–0.04% | | | | | | | | |
Puma SE (Germany) | | | 10,012 | | | | 443,366 | |
| |
| |
General Merchandise Stores–0.30% | | | | | |
Dollar General Corp. | | | 2,529 | | | | 645,021 | |
| |
Dollarama, Inc. (Canada) | | | 40,831 | | | | 2,426,153 | |
| |
| | | | | | | 3,071,174 | |
| |
| | |
Gold–0.15% | | | | | | | | |
Agnico Eagle Mines Ltd. (Canada) | | | 4,386 | | | | 192,808 | |
| |
Franco-Nevada Corp. (Canada) | | | 3,672 | | | | 453,786 | |
| |
Northern Star Resources Ltd. (Australia) | | | 50,386 | | | | 279,872 | |
| |
Polyus PJSC, GDR (Russia)(d)(e)(f) | | | 3,188 | | | | 0 | |
| |
Wheaton Precious Metals Corp. (Brazil) | | | 20,078 | | | | 656,350 | |
| |
| | | | | | | 1,582,816 | |
| |
| | |
Health Care Distributors–0.12% | | | | | | | | |
AmerisourceBergen Corp. | | | 5,886 | | | | 925,397 | |
| |
McKesson Corp. | | | 678 | | | | 263,993 | |
| |
| | | | | | | 1,189,390 | |
| |
| | |
Health Care Equipment–0.54% | | | | | | | | |
Boston Scientific Corp.(d) | | | 3,943 | | | | 169,983 | |
| |
DexCom, Inc.(d) | | | 1,552 | | | | 187,450 | |
| |
IDEXX Laboratories, Inc.(d) | | | 1,158 | | | | 416,509 | |
| |
Insulet Corp.(c)(d) | | | 1,997 | | | | 516,844 | |
| |
Intuitive Surgical, Inc.(d) | | | 1,872 | | | | 461,392 | |
| |
Medtronic PLC | | | 14,347 | | | | 1,253,067 | |
| |
MicroTech Medical Hangzhou Co. Ltd., H Shares (China)(d)(e) | | | 14,600 | | | | 11,329 | |
| |
Omnicell, Inc.(d) | | | 2,163 | | | | 167,243 | |
| |
ResMed, Inc.(c) | | | 6,802 | | | | 1,521,539 | |
| |
Shockwave Medical, Inc.(d) | | | 806 | | | | 236,279 | |
| |
Siemens Healthineers AG (Germany)(e) | | | 12,694 | | | | 584,385 | |
| |
| | | | | | | 5,526,020 | |
| |
| | |
Health Care Services–0.06% | | | | | | | | |
Dr Lal PathLabs Ltd. (India)(e) | | | 16,789 | | | | 519,452 | |
| |
New Horizon Health Ltd. (China)(d)(e) | | | 31,000 | | | | 68,972 | |
| |
| | | | | | | 588,424 | |
| |
| | |
Health Care Supplies–0.28% | | | | | | | | |
Alcon, Inc. (Switzerland) | | | 10,434 | | | | 633,135 | |
| |
ConvaTec Group PLC (United Kingdom)(e) | | | 148,524 | | | | 371,186 | |
| |
| | | | | | | | |
| | | Shares | | | Value | |
| |
Health Care Supplies–(continued) | | | | | |
EssilorLuxottica S.A. (France) | | | 4,310 | | | $ | 682,707 | |
| |
Hoya Corp. (Japan) | | | 13,000 | | | | 1,212,082 | |
| |
| | | | | | | 2,899,110 | |
| |
| | |
Health Care Technology–0.01% | | | | | | | | |
Doximity, Inc., Class A(d) | | | 3,509 | | | | 92,883 | |
| |
| | |
Homebuilding–0.16% | | | | | | | | |
Sekisui House Ltd. (Japan) | | | 97,900 | | | | 1,626,898 | |
| |
| |
Hotels, Resorts & Cruise Lines–0.35% | | | | | |
H World Group Ltd. (China) | | | 4,900 | | | | 13,396 | |
| |
H World Group Ltd., ADR (China) | | | 65,130 | | | | 1,763,720 | |
| |
Hilton Worldwide Holdings, Inc. | | | 4,743 | | | | 641,538 | |
| |
Marriott International, Inc., Class A | | | 2,272 | | | | 363,770 | |
| |
Trainline PLC (United Kingdom)(d)(e) | | | 206,946 | | | | 789,582 | |
| |
| | | | | | | 3,572,006 | |
| |
| |
Human Resource & Employment Services–0.11% | | | | | |
Benefit One, Inc. (Japan) | | | 15,000 | | | | 208,024 | |
| |
Recruit Holdings Co. Ltd. (Japan) | | | 28,900 | | | | 887,007 | |
| |
| | | | | | | 1,095,031 | |
| |
| |
Hypermarkets & Super Centers–0.21% | | | | | |
BJ’s Wholesale Club Holdings, Inc.(d) | | | 7,046 | | | | 545,361 | |
| |
Wal-Mart de Mexico S.A.B. de C.V., Series V (Mexico) | | | 426,168 | | | | 1,646,123 | |
| |
| | | | | | | 2,191,484 | |
| |
| | |
Industrial Conglomerates–0.18% | | | | | | | | |
Hitachi Ltd. (Japan) | | | 17,300 | | | | 783,645 | |
| |
Siemens AG (Germany) | | | 1,836 | | | | 200,709 | |
| |
SM Investments Corp. (Philippines) | | | 63,594 | | | | 904,750 | |
| |
| | | | | | | 1,889,104 | |
| |
| | |
Industrial Gases–0.14% | | | | | | | | |
Air Liquide S.A. (France) | | | 11,137 | | | | 1,454,701 | |
| |
| | |
Industrial Machinery–0.42% | | | | | | | | |
Aalberts N.V. (Netherlands) | | | 10,004 | | | | 347,243 | |
| |
Atlas Copco AB, Class A (Sweden) | | | 184,116 | | | | 1,965,689 | |
| |
Chart Industries, Inc.(d) | | | 1,769 | | | | 394,275 | |
| |
MISUMI Group, Inc. (Japan) | | | 28,500 | | | | 606,108 | |
| |
Sandvik AB (Sweden) | | | 25,755 | | | | 402,611 | |
| |
SMC Corp. (Japan) | | | 700 | | | | 281,777 | |
| |
VAT Group AG (Switzerland)(e) | | | 1,348 | | | | 307,379 | |
| |
| | | | | | | 4,305,082 | |
| |
| | |
Insurance Brokers–0.09% | | | | | | | | |
Arthur J. Gallagher & Co. | | | 5,163 | | | | 965,894 | |
| |
| | |
Integrated Oil & Gas–0.40% | | | | | | | | |
BP PLC (United Kingdom) | | | 234,609 | | | | 1,301,551 | |
| |
Novatek PJSC, GDR (Russia)(d)(e)(f) | | | 19,962 | | | | 0 | |
| |
Repsol S.A. (Spain) | | | 88,057 | | | | 1,198,060 | |
| |
Shell PLC, ADR (Netherlands)(c) | | | 22,526 | | | | 1,253,121 | |
| |
TotalEnergies SE (France) | | | 7,192 | | | | 393,045 | |
| |
| | | | | | | 4,145,777 | |
| |
| |
Integrated Telecommunication Services–0.11% | | | | | |
Spark New Zealand Ltd. (New Zealand) | | | 392,039 | | | | 1,165,945 | |
| |
See accompanying Notes to Consolidated Financial Statements which are an integral part of the financial statements.
9 Invesco Global Allocation Fund
| | | | | | | | |
| | | Shares | | | Value | |
| |
Interactive Home Entertainment–0.16% | |
Konami Group Corp. (Japan) | | | 3,500 | | | $ | 153,755 | |
| |
NetEase, Inc., ADR (China) | | | 26,181 | | | | 1,456,187 | |
| |
| | | | | | | 1,609,942 | |
| |
|
Interactive Media & Services–0.86% | |
Alphabet, Inc., Class A(d) | | | 65,273 | | | | 6,168,951 | |
| |
Meta Platforms, Inc., Class A(d) | | | 14,147 | | | | 1,317,935 | |
| |
NAVER Corp. (South Korea) | | | 2,326 | | | | 275,740 | |
| |
Pinterest, Inc., Class A(d) | | | 5,630 | | | | 138,498 | |
| |
Rightmove PLC (United Kingdom) | | | 99,911 | | | | 562,848 | |
| |
Tencent Holdings Ltd. (China) | | | 16,417 | | | | 430,778 | |
| |
Yandex N.V., Class A (Russia)(d)(f) | | | 54,808 | | | | 0 | |
| |
| | | | | | | 8,894,750 | |
| |
|
Internet & Direct Marketing Retail–0.39% | |
Alibaba Group Holding Ltd. (China)(d) | | | 14,700 | | | | 117,034 | |
| |
Amazon.com, Inc.(d) | | | 5,040 | | | | 516,298 | |
| |
Coupang, Inc. (South Korea)(d) | | | 3,578 | | | | 61,792 | |
| |
Farfetch Ltd., Class A (United Kingdom)(d) | | | 25,200 | | | | 213,696 | |
| |
JD.com, Inc., ADR (China)(c) | | | 47,153 | | | | 1,758,335 | |
| |
Meituan, B Shares (China)(d)(e) | | | 81,600 | | | | 1,298,033 | |
| |
| | | | | | | 3,965,188 | |
| |
|
Investment Banking & Brokerage–0.12% | |
LPL Financial Holdings, Inc.(c) | | | 4,649 | | | | 1,188,517 | |
| |
|
IT Consulting & Other Services–0.82% | |
Amdocs Ltd. | | | 7,917 | | | | 683,316 | |
| |
Capgemini SE (France) | | | 4,381 | | | | 718,800 | |
| |
EPAM Systems, Inc.(d) | | | 3,500 | | | | 1,225,000 | |
| |
Gartner, Inc.(d) | | | 3,099 | | | | 935,650 | |
| |
Globant S.A.(d) | | | 2,215 | | | | 417,926 | |
| |
Infosys Ltd. (India) | | | 83,314 | | | | 1,545,551 | |
| |
Tata Consultancy Services Ltd. (India) | | | 75,066 | | | | 2,893,281 | |
| |
| | | | | | | 8,419,524 | |
| |
|
Leisure Products–0.14% | |
Bandai Namco Holdings, Inc. (Japan) | | | 10,700 | | | | 707,798 | |
| |
Shimano, Inc. (Japan) | | | 4,800 | | | | 744,309 | |
| |
| | | | | | | 1,452,107 | |
| |
|
Life & Health Insurance–0.14% | |
AIA Group Ltd. (Hong Kong) | | | 138,200 | | | | 1,043,645 | |
| |
Legal & General Group PLC (United Kingdom) | | | 162,173 | | | | 432,593 | |
| |
| | | | | | | 1,476,238 | |
| |
|
Life Sciences Tools & Services–0.87% | |
Agilent Technologies, Inc. | | | 7,816 | | | | 1,081,344 | |
| |
Avantor, Inc.(d) | | | 24,833 | | | | 500,882 | |
| |
Charles River Laboratories International, Inc.(d) | | | 1,103 | | | | 234,112 | |
| |
Danaher Corp. | | | 1,258 | | | | 316,601 | |
| |
Illumina, Inc.(c)(d) | | | 2,122 | | | | 485,556 | |
| |
IQVIA Holdings, Inc.(d) | | | 2,899 | | | | 607,833 | |
| |
Lonza Group AG (Switzerland) | | | 1,703 | | | | 875,493 | |
| |
Mettler-Toledo International, Inc.(d) | | | 435 | | | | 550,244 | |
| |
Repligen Corp.(d) | | | 4,304 | | | | 785,437 | |
| |
Samsung Biologics Co. Ltd. (South Korea)(d)(e) | | | 1,970 | | | | 1,210,598 | |
| |
| | | | | | | | |
| | | Shares | | | Value | |
| |
Life Sciences Tools & Services–(continued) | |
Sartorius Stedim Biotech (France) | | | 2,469 | | | $ | 783,375 | |
| |
Tecan Group AG, Class R (Switzerland) | | | 2,080 | | | | 764,889 | |
| |
West Pharmaceutical Services, Inc. | | | 833 | | | | 191,673 | |
| |
Wuxi Biologics Cayman, Inc. (China)(d)(e) | | | 128,300 | | | | 580,430 | |
| |
| | | | 8,968,467 | |
| |
|
Managed Health Care–0.17% | |
Humana, Inc. | | | 1,529 | | | | 853,304 | |
| |
Molina Healthcare, Inc.(d) | | | 2,625 | | | | 942,008 | |
| |
| | | | | | | 1,795,312 | |
| |
|
Movies & Entertainment–0.24% | |
CTS Eventim AG & Co. KGaA
(Germany)(d) | | | 16,198 | | | | 773,825 | |
| |
Liberty Media Corp.-Liberty Formula One, Class C(d) | | | 6,303 | | | | 363,872 | |
| |
Live Nation Entertainment, Inc.(d) | | | 3,924 | | | | 312,390 | |
| |
Universal Music Group N.V. (Netherlands) | | | 45,498 | | | | 891,566 | |
| |
Walt Disney Co. (The)(d) | | | 1,175 | | | | 125,185 | |
| |
| | | | | | | 2,466,838 | |
| |
|
Multi-line Insurance–0.01% | |
Allianz SE (Germany) | | | 683 | | | | 122,980 | |
| |
|
Multi-Utilities–0.06% | |
Veolia Environnement S.A. (France) | | | 26,872 | | | | 599,150 | |
| |
|
Office REITs–0.02% | |
Alexandria Real Estate Equities, Inc. | | | 1,500 | | | | 217,950 | |
| |
|
Oil & Gas Exploration & Production–0.34% | |
Antero Resources Corp.(d) | | | 6,455 | | | | 236,640 | |
| |
Inpex Corp. (Japan) | | | 167,700 | | | | 1,713,130 | |
| |
Pioneer Natural Resources Co. | | | 1,565 | | | | 401,282 | |
| |
Santos Ltd. (Australia) | | | 133,809 | | | | 661,150 | |
| |
Var Energi ASA (Norway) | | | 140,317 | | | | 475,709 | |
| |
| | | | | | | 3,487,911 | |
| |
|
Oil & Gas Refining & Marketing–0.24% | |
Reliance Industries Ltd. (India) | | | 59,236 | | | | 1,822,921 | |
| |
S-Oil Corp. (South Korea) | | | 10,159 | | | | 616,328 | |
| |
| | | | | | | 2,439,249 | |
| |
|
Oil & Gas Storage & Transportation–0.27% | |
Cheniere Energy, Inc. | | | 6,157 | | | | 1,086,156 | |
| |
Enbridge, Inc. (Canada) | | | 35,941 | | | | 1,399,902 | |
| |
Targa Resources Corp. | | | 3,864 | | | | 264,182 | |
| |
| | | | | | | 2,750,240 | |
| |
|
Other Diversified Financial Services–0.57% | |
FirstRand Ltd. (South Africa) | | | 170,855 | | | | 599,020 | |
| |
Housing Development Finance Corp. Ltd. (India) | | | 176,365 | | | | 5,257,966 | |
| |
Jackson Financial, Inc., Class A | | | 1 | | | | 38 | |
| |
| | | | 5,857,024 | |
| |
|
Packaged Foods & Meats–0.09% | |
Barry Callebaut AG (Switzerland) | | | 124 | | | | 234,409 | |
| |
Hershey Co. (The)(c) | | | 2,763 | | | | 659,721 | |
| |
| | | | | | | 894,130 | |
| |
See accompanying Notes to Consolidated Financial Statements which are an integral part of the financial statements.
10 Invesco Global Allocation Fund
| | | | | | | | |
| | | Shares | | | Value | |
| |
Paper Packaging–0.05% | |
Avery Dennison Corp. | | | 3,016 | | | $ | 511,363 | |
| |
|
Personal Products–0.22% | |
LG H&H Co. Ltd. (South Korea) | | | 267 | | | | 95,348 | |
| |
L’Oreal S.A. (France) | | | 3,412 | | | | 1,071,245 | |
| |
Unilever PLC (United Kingdom) | | | 24,103 | | | | 1,096,370 | |
| |
| | | | | | | 2,262,963 | |
| |
|
Pharmaceuticals–0.69% | |
AstraZeneca PLC, ADR (United Kingdom) | | | 1,125 | | | | 66,161 | |
| |
Bayer AG (Germany) | | | 5,079 | | | | 267,191 | |
| |
Daiichi Sankyo Co. Ltd. (Japan) | | | 2,200 | | | | 70,544 | |
| |
Novo Nordisk A/S, Class B (Denmark) | | | 51,697 | | | | 5,618,185 | |
| |
Phathom Pharmaceuticals, Inc.(d) | | | 7,752 | | | | 82,171 | |
| |
Roche Holding AG | | | 1,252 | | | | 416,104 | |
| |
Royalty Pharma PLC, Class A | | | 14,090 | | | | 596,289 | |
| |
| | | | | | | 7,116,645 | |
| |
|
Property & Casualty Insurance–0.05% | |
W.R. Berkley Corp. | | | 6,275 | | | | 466,735 | |
| |
|
Real Estate Development–0.04% | |
Oberoi Realty Ltd. (India) | | | 40,749 | | | | 454,865 | |
| |
|
Regional Banks–0.03% | |
East West Bancorp, Inc. | | | 4,757 | | | | 340,458 | |
| |
|
Research & Consulting Services–0.28% | |
Booz Allen Hamilton Holding Corp. | | | 4,727 | | | | 514,534 | |
| |
CoStar Group, Inc.(d) | | | 9,550 | | | | 789,976 | |
| |
Dun & Bradstreet Holdings, Inc. | | | 6,840 | | | | 87,894 | |
| |
Equifax, Inc.(c) | | | 6,263 | | | | 1,061,829 | |
| |
Nihon M&A Center Holdings, Inc. (Japan) | | | 40,000 | | | | 452,292 | |
| |
| | | | | | | 2,906,525 | |
| |
|
Restaurants–0.49% | |
Chipotle Mexican Grill, Inc.(d) | | | 508 | | | | 761,152 | |
| |
Compass Group PLC (United Kingdom) | | | 62,483 | | | | 1,315,953 | |
| |
Yum China Holdings, Inc. (China) | | | 72,916 | | | | 3,015,076 | |
| |
| | | | | | | 5,092,181 | |
| |
|
Semiconductor Equipment–0.30% | |
ASML Holding N.V. (Netherlands) | | | 3,407 | | | | 1,606,120 | |
| |
Disco Corp. (Japan) | | | 2,200 | | | | 526,458 | |
| |
Enphase Energy, Inc.(d) | | | 1,737 | | | | 533,259 | |
| |
Lam Research Corp. | | | 143 | | | | 57,884 | |
| |
Tokyo Electron Ltd. (Japan) | | | 1,500 | | | | 396,695 | |
| |
| | | | | | | 3,120,416 | |
| |
|
Semiconductors–1.21% | |
Analog Devices, Inc. | | | 18,110 | | | | 2,582,848 | |
| |
First Solar, Inc.(d) | | | 2,057 | | | | 299,437 | |
| |
Infineon Technologies AG (Germany) | | | 34,941 | | | | 850,706 | |
| |
Lattice Semiconductor Corp.(d) | | | 6,911 | | | | 335,253 | |
| |
Marvell Technology, Inc. | | | 16,792 | | | | 666,307 | |
| |
MediaTek, Inc. (Taiwan) | | | 74,000 | | | | 1,348,229 | |
| |
Monolithic Power Systems, Inc. | | | 1,683 | | | | 571,294 | |
| |
NVIDIA Corp. | | | 1,781 | | | | 240,382 | |
| |
QUALCOMM, Inc. | | | 1,835 | | | | 215,906 | |
| |
| | | | | | | | |
| | | Shares | | | Value | |
| |
Semiconductors–(continued) | |
Renesas Electronics Corp. (Japan)(d) | | | 51,400 | | | $ | 430,445 | |
| |
Silergy Corp. (China) | | | 24,000 | | | | 276,029 | |
| |
STMicroelectronics N.V., New York Shares (Singapore) | | | 16,160 | | | | 502,899 | |
| |
Taiwan Semiconductor Manufacturing Co. Ltd. (Taiwan) | | | 342,000 | | | | 4,115,662 | |
| |
| | | | | | | 12,435,397 | |
| |
|
Soft Drinks–0.13% | |
Britvic PLC (United Kingdom) | | | 64,601 | | | | 538,766 | |
| |
Coca-Cola Europacific Partners PLC (United Kingdom) | | | 6,746 | | | | 317,399 | |
| |
Fomento Economico Mexicano S.A.B. de C.V., Series CPO (Mexico) | | | 5,416 | | | | 38,879 | |
| |
Monster Beverage Corp.(d) | | | 4,223 | | | | 395,780 | |
| |
| | | | | | | 1,290,824 | |
| |
|
Specialized REITs–0.08% | |
Extra Space Storage, Inc. | | | 1,395 | | | | 247,529 | |
| |
SBA Communications Corp., Class A | | | 2,228 | | | | 601,337 | |
| |
| | | | | | | 848,866 | |
| |
|
Specialty Chemicals–0.23% | |
Akzo Nobel N.V. (Netherlands) | | | 9,012 | | | | 555,529 | |
| |
Albemarle Corp. | | | 985 | | | | 275,672 | |
| |
Croda International PLC (United Kingdom) | | | 3,725 | | | | 288,523 | |
| |
Ecolab, Inc. | | | 1,231 | | | | 193,353 | |
| |
Sika AG (Switzerland) | | | 4,636 | | | | 1,043,686 | |
| |
| | | | | | | 2,356,763 | |
| |
|
Specialty Stores–0.13% | |
Tractor Supply Co. | | | 2,647 | | | | 581,731 | |
| |
Ulta Beauty, Inc.(d) | | | 1,769 | | | | 741,866 | |
| |
| | | | | | | 1,323,597 | |
| |
|
Steel–0.13% | |
Vale S.A., ADR (Brazil) | | | 101,459 | | | | 1,312,879 | |
| |
|
Systems Software–0.24% | |
Crowdstrike Holdings, Inc., Class A(d) | | | 3,378 | | | | 544,534 | |
| |
Microsoft Corp. | | | 3,393 | | | | 787,617 | |
| |
Oracle Corp. | | | 4,900 | | | | 261,368 | |
| |
Palo Alto Networks, Inc.(c)(d) | | | 5,205 | | | | 893,126 | |
| |
| | | | | | | 2,486,645 | |
| |
|
Technology Hardware, Storage & Peripherals–0.26% | |
FUJIFILM Holdings Corp. (Japan) | | | 13,900 | | | | 635,496 | |
Samsung Electronics Co. Ltd. (South Korea) | | | 50,160 | | | | 2,085,829 | |
| |
| | | | | | | 2,721,325 | |
| |
|
Tobacco–0.42% | |
Philip Morris International, Inc. | | | 13,510 | | | | 1,240,894 | |
| |
Swedish Match AB (Sweden) | | | 304,635 | | | | 3,134,309 | |
| |
| | | | | | | 4,375,203 | |
| |
|
Trading Companies & Distributors–0.32% | |
Ashtead Group PLC (United Kingdom) | | | 14,874 | | | | 774,055 | |
| |
Ferguson PLC | | | 7,569 | | | | 824,726 | |
| |
Marubeni Corp. (Japan) | | | 135,000 | | | | 1,182,175 | |
| |
See accompanying Notes to Consolidated Financial Statements which are an integral part of the financial statements.
11 Invesco Global Allocation Fund
| | | | | | | | |
| | |
Shares | | |
Value | |
| |
Trading Companies & Distributors–(continued) | |
RS GROUP PLC (United Kingdom) | | | 45,896 | | | $ | 504,039 | |
| |
| | | | | | | 3,284,995 | |
| |
|
Trucking–0.05% | |
Old Dominion Freight Line, Inc. | | | 1,976 | | | | 542,610 | |
| |
|
Wireless Telecommunication Services–0.11% | |
America Movil S.A.B. de C.V., Class L, ADR (Mexico) | | | 45,476 | | | | 855,404 | |
| |
Vodafone Group PLC (United Kingdom) | | | 201,036 | | | | 234,278 | |
| |
| | | | | | | 1,089,682 | |
| |
Total Common Stocks & Other Equity Interests (Cost $289,250,137) | | | | 267,346,022 | |
| |
| | |
| | | Principal | | | | |
| | | Amount | | | | |
U.S. Treasury Securities–20.51% | | | | | |
U.S. Treasury Bonds–8.94% | | | | | |
5.00%, 05/15/2037 | | $ | 25,200,000 | | | | 27,402,539 | |
| |
3.25%, 05/15/2042 | | | 24,520,000 | | | | 20,738,556 | |
| |
2.00%, 08/15/2051 | | | 69,595,000 | | | | 43,869,317 | |
| |
| | | | | | | 92,010,412 | |
| |
| |
U.S. Treasury Notes–11.57% | | | | | |
1.88%, 02/15/2032(g) | | | 143,200,000 | | | | 119,102,125 | |
| |
Total U.S. Treasury Securities
(Cost $260,666,489) | | | | | | | 211,112,537 | |
| |
| | |
| | | Shares | | | | |
Preferred Stocks–0.14% | | | | | | | | |
Diversified Banks–0.04% | |
Socium Re Ltd., Series 2019-1, Pfd.(f) | | | 264,345 | | | | 458,404 | |
| |
Diversified Support Services–0.10% | | | | | |
Harambee Re Ltd., Pfd.(f) | | | 223 | | | | 20,955 | |
| |
Kinesis Re I Ltd., Series 2019-1, Pfd.(f) | | | 116,394 | | | | 133,199 | |
| |
Lion Rock Re Ltd., Series S, Pfd.(b)(f) | | | 375 | | | | 23,596 | |
| |
Mt. Logan Re Ltd., Pfd.(f) | | | 1,737 | | | | 728,668 | |
| |
Thopas Re Ltd., Pfd.(f) | | | 73 | | | | 20,374 | |
| |
Turing Re Ltd., Series 2019-1, Pfd.(e)(f) | | | 13,286 | | | | 35,789 | |
| |
Viribus Re Ltd., Pfd.(f) | | | 399,749 | | | | 25,248 | |
| |
| | | | | | | 987,829 | |
| |
Total Preferred Stocks (Cost $4,971,286) | | | | 1,446,233 | |
| |
| | |
| | | Principal | | | | |
| | | Amount | | | | |
Event-Linked Bonds–0.13% | | | | | |
Diversified Support Services–0.00% | | | | | |
Alturas RE Segregated Account (Multinational), Catastrophe Linked Notes, 0.00%, 12/31/2022(e)(f)(h) | | $ | 15,000 | | | | 0 | |
| |
Investment Abbreviations:
| | |
| ADR | | - American Depositary Receipt |
| CDI | | - CREST Depository Interest |
| CPO | | - Certificates of Ordinary Participation |
| ETF | | - Exchange-Traded Fund |
| GDR | | - Global Depositary Receipt |
| Pfd. | | - Preferred |
| REIT | | - Real Estate Investment Trust |
| Wts. | | - Warrants |
| | | | | | | | |
| | | Principal
Amount | | | Value | |
| |
Other Diversified Financial Services–0.13% | |
Eden RE II Ltd. (Multinational), Class A, Catastrophe Linked Notes, 0.00%,
03/22/2023(e)(f)(h) | | $ | 10,800 | | | $ | 119,681 | |
| |
Limestone Re Ltd. (Multinational), Class A, Catastrophe Linked Notes, 0.00%, 12/31/2023(e)(f)(h) | | | 15,621 | | | | 18,838 | |
| |
Sector Re V Ltd. (Multinational), Series 2019-1, Class A, Catastrophe Linked Notes, 0.00%, 03/01/2024(e)(f)(h) | | | 1,800,000 | | | | 1,219,543 | |
| |
| | | | | | | 1,358,062 | |
| |
Total Event-Linked Bonds
(Cost $1,859,240) | | | | 1,358,062 | |
| |
| | |
| | | Shares | | | | |
Money Market Funds–1.46% | | | | | |
Invesco Government & Agency Portfolio, Institutional Class, 3.07%(b)(i) | | | 5,265,568 | | | | 5,265,568 | |
| |
Invesco Liquid Assets Portfolio, Institutional Class, 3.03%(b)(i) | | | 3,770,870 | | | | 3,771,624 | |
| |
Invesco Treasury Portfolio, Institutional Class, 3.08%(b)(i) | | | 6,017,793 | | | | 6,017,793 | |
| |
Total Money Market Funds
(Cost $15,054,889) | | | | 15,054,985 | |
| |
TOTAL INVESTMENTS IN SECURITIES
(excluding investments purchased with cash collateral from securities on loan)-98.21%
(Cost $1,047,841,990) | | | | 1,011,137,127 | |
| |
|
Investments Purchased with Cash Collateral from Securities on Loan | |
Money Market Funds–1.40% | |
Invesco Private Government Fund, 3.18%(b)(i)(j) | | | 4,044,769 | | | | 4,044,769 | |
| |
Invesco Private Prime Fund,
3.28%(b)(i)(j) | | | 10,398,787 | | | | 10,398,787 | |
| |
Total Investments Purchased with Cash Collateral from Securities on Loan
(Cost $14,442,984) | | | | 14,443,556 | |
| |
TOTAL INVESTMENTS IN SECURITIES–99.61%
(Cost $1,062,284,974) | | | | 1,025,580,683 | |
| |
OTHER ASSETS LESS LIABILITIES–0.39% | | | | 4,055,463 | |
| |
NET ASSETS–100.00% | | | | | | $ | 1,029,636,146 | |
| |
.
See accompanying Notes to Consolidated Financial Statements which are an integral part of the financial statements.
12 Invesco Global Allocation Fund
Notes to Consolidated Schedule of Investments:
| (a) | Industry and/or sector classifications used in this report are generally according to the Global Industry Classification Standard, which was developed by and is the exclusive property and a service mark of MSCI Inc. and Standard & Poor’s. |
| (b) | Affiliated issuer. The issuer is affiliated by having an investment adviser that is under common control of Invesco Ltd. and/or is an “affiliated person” under the Investment Company Act of 1940, as amended (the “1940 Act”), which defines “affiliated person” to include an issuer of which a fund holds 5% or more of the outstanding voting securities. For the Investments in Other Affiliates below, the Fund has not owned enough of the outstanding voting securities of the issuer to have control (as defined in the 1940 Act) of that issuer. The table below shows the Fund’s transactions in, and earnings from, its investments in affiliates for the fiscal year ended October 31, 2022. |
| | | | | | | | | | | | | | | | | | | | | | | | | | |
| | | Value
October 31, 2021 | | | Purchases at Cost | | | Proceeds from Sales | | | Change in
Unrealized
Appreciation
(Depreciation) | | | Realized Gain (Loss) | | | Value
October 31, 2022 | | | Dividend Income |
|
Invesco BulletShares 2023 Corporate Bond ETF | | $ | - | | | $ | 155,287,000 | | | $ | (18,358,004) | | | $ | (261,980) | | | $ | (44,446) | | | | $136,622,570 | | | $ 215,396 |
|
Invesco Emerging Markets Sovereign Debt ETF | | | 52,397,015 | | | | 23,859,764 | | | | (70,685,259) | | | | 83,845 | | | | (5,655,365) | | | | - | | | 621,032 |
|
Invesco Fundamental High Yield® Corporate Bond ETF | | | 39,260,258 | | | | - | | | | (39,320,675) | | | | (1,394,214) | | | | 1,454,631 | | | | - | | | - |
|
Invesco High Yield Bond Factor ETF | | | 27,448,760 | | | | - | | | | - | | | | (4,804,340) | | | | - | | | | 22,644,420 | | | 1,432,005 |
|
Invesco International Developed Dynamic Multifactor ETF | | | 130,625,149 | | | | - | | | | - | | | | (39,174,435) | | | | - | | | | 91,450,714 | | | 5,345,026 |
|
Invesco Russell 1000 Dynamic Multifactor ETF | | | 236,240,532 | | | | - | | | | - | | | | (29,005,222) | | | | - | | | | 207,235,310 | | | 2,699,030 |
|
Invesco Russell 2000 Dynamic Multifactor ETF | | | 44,940,397 | | | | 18,790,278 | | | | - | | | | (6,864,401) | | | | - | | | | 56,866,274 | | | 600,583 |
|
Invesco Senior Loan ETF | | | 68,560,608 | | | | - | | | | (65,424,511) | | | | 42,708 | | | | (3,178,805) | | | | - | | | 1,261,819 |
|
| Investments in Affiliated Money Market Funds: | | | | | | | | | | | | | | | | | | | | | | | | | | |
|
Invesco Government & Agency Portfolio, Institutional Class | | | 6,228,330 | | | | 235,516,829 | | | | (236,479,591) | | | | - | | | | - | | | | 5,265,568 | | | 336,875 |
|
Invesco Liquid Assets Portfolio, Institutional Class | | | 4,146,169 | | | | 168,226,307 | | | | (168,610,649) | | | | 117 | | | | 9,680 | | | | 3,771,624 | | | 242,884 |
|
Invesco Treasury Portfolio, Institutional Class | | | 7,118,091 | | | | 269,162,090 | | | | (270,262,388) | | | | - | | | | - | | | | 6,017,793 | | | 375,115 |
|
| Investments Purchased with Cash Collateral from Securities on Loan: | | | | | | | | | | | | | | | | | | | | | | | | | | |
|
Invesco Private Government Fund | | | - | | | | 84,215,771 | | | | (80,171,002) | | | | - | | | | - | | | | 4,044,769 | | | 24,583* |
|
Invesco Private Prime Fund | | | - | | | | 156,923,659 | | | | (146,524,325) | | | | 572 | | | | (1,119) | | | | 10,398,787 | | | 62,865* |
|
| Investments in Other Affiliates: | | | | | | | | | | | | | | | | | | | | | | | | | | |
|
Lion Rock Re Ltd.,
Series S, Pfd. | | | 53,327 | | | | - | | | | - | | | | (29,731) | | | | - | | | | 23,596 | | | - |
|
Total | | $ | 617,018,636 | | | $ | 1,111,981,698 | | | $ | (1,095,836,404) | | | $ | (81,407,081) | | | $ | (7,415,424) | | | $ | 544,341,425 | | | $13,217,213 |
|
| | * | Represents the income earned on the investment of cash collateral, which is included in securities lending income on the Consolidated Statement of Operations. Does not include rebates and fees paid to lending agent or premiums received from borrowers, if any. |
| (c) | All or a portion of this security was out on loan at October 31, 2022. |
| (d) | Non-income producing security. |
| (e) | Security purchased or received in a transaction exempt from registration under the Securities Act of 1933, as amended (the “1933 Act”). The security may be resold pursuant to an exemption from registration under the 1933 Act, typically to qualified institutional buyers. The aggregate value of these securities at October 31, 2022 was $8,754,328, which represented less than 1% of the Fund’s Net Assets. |
| (f) | Security valued using significant unobservable inputs (Level 3). See Note 3. |
| (g) | All or a portion of the value was pledged as collateral to cover margin requirements for open futures contracts. See Note 1N. |
| (h) | Zero coupon bond issued at a discount. |
| (i) | The rate shown is the 7-day SEC standardized yield as of October 31, 2022. |
| (j) | The security has been segregated to satisfy the commitment to return the cash collateral received in securities lending transactions upon the borrower’s return of the securities loaned. See Note 1K. |
See accompanying Notes to Consolidated Financial Statements which are an integral part of the financial statements.
13 Invesco Global Allocation Fund
| | | | | | | | | | | | | | | | | | |
| Open Futures Contracts | |
| |
| Long Futures Contracts | | Number of
Contracts | | | Expiration Month | | Notional
Value | | | Value | | | Unrealized Appreciation (Depreciation) | |
| |
Equity Risk | | | | | | | | | | | | | | | | | | |
| |
E-Mini S&P 500 Index | | | 817 | | | December-2022 | | $ | 158,620,550 | | | $ | (7,853,838 | ) | | $ | (7,853,838 | ) |
| |
S&P/TSX 60 Index | | | 14 | | | December-2022 | | | 2,420,288 | | | | 122,260 | | | | 122,260 | |
| |
SPI 200 Index | | | 21 | | | December-2022 | | | 2,302,356 | | | | 124,890 | | | | 124,890 | |
| |
Subtotal–Long Futures Contracts | | | | (7,606,688 | ) | | | (7,606,688 | ) |
| |
| | | | | |
Short Futures Contracts | | | | | | | | | | | | | | | | | | |
| |
Equity Risk | |
| |
E-Mini Russell 2000 Index | | | 613 | | | December-2022 | | | (56,794,450 | ) | | | 666,896 | | | | 666,896 | |
| |
MSCI Emerging Markets Index | | | 1,240 | | | December-2022 | | | (52,923,200 | ) | | | 6,307,504 | | | | 6,307,504 | |
| |
Nikkei 225 Index | | | 50 | | | December-2022 | | | (9,263,929 | ) | | | (20,329 | ) | | | (20,329 | ) |
| |
EURO STOXX 600 Index | | | 2,859 | | | December-2022 | | | (58,203,362 | ) | | | 2,066,500 | | | | 2,066,500 | |
| |
Subtotal–Short Futures Contracts | | | | | | | | | | | | | 9,020,571 | | | | 9,020,571 | |
| |
Total Futures Contracts | | | $ | 1,413,883 | | | $ | 1,413,883 | |
| |
| | | | | | | | | | | | | | | | | | |
Open Forward Foreign Currency Contracts | |
| |
| Settlement | | | | Contract to | | | Unrealized
Appreciation | |
| Date | | Counterparty | | Deliver | | | Receive | | | (Depreciation) | |
| |
| Currency Risk | | | | | | | | | | | | | | | | | | |
| |
| 12/21/2022 | | Bank of America, N.A. | | AUD | | | 25,735,000 | | | USD | | | 17,395,851 | | | $ | 908,271 | |
| |
| 12/21/2022 | | Bank of America, N.A. | | INR | | | 180,000,000 | | | USD | | | 2,250,385 | | | | 88,681 | |
| |
| 12/21/2022 | | Bank of America, N.A. | | JPY | | | 763,710,000 | | | USD | | | 5,347,117 | | | | 178,961 | |
| |
| 12/21/2022 | | Bank of America, N.A. | | NZD | | | 28,765,000 | | | USD | | | 17,429,464 | | | | 692,951 | |
| |
| 12/21/2022 | | Citibank, N.A. | | CAD | | | 12,275,000 | | | USD | | | 9,339,523 | | | | 324,188 | |
| |
| 12/21/2022 | | Citibank, N.A. | | CNY | | | 43,600,000 | | | USD | | | 6,265,358 | | | | 264,601 | |
| |
| 12/21/2022 | | Citibank, N.A. | | HKD | | | 9,495,000 | | | USD | | | 1,211,727 | | | | 1,342 | |
| |
| 12/21/2022 | | Citibank, N.A. | | TWD | | | 269,865,000 | | | USD | | | 8,798,846 | | | | 427,329 | |
| |
| 12/21/2022 | | Deutsche Bank AG | | CAD | | | 3,500,000 | | | USD | | | 2,697,075 | | | | 126,511 | |
| |
| 12/21/2022 | | Deutsche Bank AG | | EUR | | | 13,825,000 | | | USD | | | 14,103,343 | | | | 384,946 | |
| |
| 12/21/2022 | | Deutsche Bank AG | | SGD | | | 1,960,000 | | | USD | | | 1,405,951 | | | | 20,972 | |
| |
| 12/21/2022 | | Deutsche Bank AG | | USD | | | 1,926,421 | | | GBP | | | 1,700,000 | | | | 26,470 | |
| |
| 12/02/2022 | | Goldman Sachs International | | USD | | | 17,004,717 | | | BRL | | | 88,683,000 | | | | 57,496 | |
| |
| 12/21/2022 | | Goldman Sachs International | | TWD | | | 370,100,000 | | | USD | | | 11,758,310 | | | | 277,390 | |
| |
| 12/21/2022 | | J.P. Morgan Chase Bank, N.A. | | AUD | | | 2,660,000 | | | USD | | | 1,835,824 | | | | 131,648 | |
| |
| 12/21/2022 | | J.P. Morgan Chase Bank, N.A. | | CLP | | | 513,000,000 | | | USD | | | 569,052 | | | | 29,773 | |
| |
| 12/21/2022 | | J.P. Morgan Chase Bank, N.A. | | CZK | | | 380,000,000 | | | USD | | | 15,591,208 | | | | 297,193 | |
| |
| 12/21/2022 | | J.P. Morgan Chase Bank, N.A. | | INR | | | 503,690,000 | | | USD | | | 6,264,957 | | | | 215,907 | |
| |
| 12/21/2022 | | J.P. Morgan Chase Bank, N.A. | | JPY | | | 3,127,920,000 | | | USD | | | 21,990,924 | | | | 823,756 | |
| |
| 12/21/2022 | | J.P. Morgan Chase Bank, N.A. | | KRW | | | 23,568,700,000 | | | USD | | | 17,114,858 | | | | 587,177 | |
| |
| 12/21/2022 | | J.P. Morgan Chase Bank, N.A. | | SEK | | | 21,460,000 | | | USD | | | 2,058,466 | | | | 106,765 | |
| |
| 12/21/2022 | | J.P. Morgan Chase Bank, N.A. | | ZAR | | | 258,110,000 | | | USD | | | 15,021,238 | | | | 1,022,722 | |
| |
| 12/21/2022 | | Morgan Stanley and Co. International PLC | | CHF | | | 22,730,000 | | | USD | | | 23,563,510 | | | | 727,841 | |
| |
| 12/21/2022 | | Morgan Stanley and Co. International PLC | | CNY | | | 23,850,000 | | | USD | | | 3,456,552 | | | | 174,028 | |
| |
| 12/21/2022 | | Morgan Stanley and Co. International PLC | | DKK | | | 77,295,000 | | | USD | | | 10,478,031 | | | | 174,501 | |
| |
| 12/21/2022 | | Morgan Stanley and Co. International PLC | | EUR | | | 14,635,000 | | | USD | | | 14,740,079 | | | | 217,928 | |
| |
| 12/21/2022 | | Morgan Stanley and Co. International PLC | | GBP | | | 3,040,000 | | | USD | | | 3,563,350 | | | | 71,121 | |
| |
| 12/21/2022 | | Morgan Stanley and Co. International PLC | | JPY | | | 1,350,000,000 | | | USD | | | 9,573,158 | | | | 437,477 | |
| |
| 12/21/2022 | | Morgan Stanley and Co. International PLC | | PHP | | | 919,790,000 | | | USD | | | 15,968,022 | | | | 196,588 | |
| |
| 12/21/2022 | | Morgan Stanley and Co. International PLC | | THB | | | 524,440,000 | | | USD | | | 14,471,303 | | | | 631,396 | |
| |
See accompanying Notes to Consolidated Financial Statements which are an integral part of the financial statements.
14 Invesco Global Allocation Fund
| | | | | | | | | | | | | | | | | | | | | | |
Open Forward Foreign Currency Contracts–(continued) | |
| Settlement | | | | Contract to | | | Unrealized
Appreciation | |
| Date | | Counterparty | | Deliver | | | Receive | | | (Depreciation) | |
| |
12/21/2022 | | UBS AG | | | USD | | | | 1,107,674 | | | | MXN | | | | 22,490,000 | | | $ | 17,748 | |
| |
Subtotal–Appreciation | | | | 9,643,678 | |
| |
| | | | | |
Currency Risk | | | | | | | | | | | | | | | | | | | | |
| |
12/21/2022 | | Bank of America, N.A. | | | USD | | | | 15,214,286 | | | | COP | | | | 67,947,000,000 | | | | (1,573,270 | ) |
| |
12/21/2022 | | Bank of America, N.A. | | | USD | | | | 16,783,110 | | | | SGD | | | | 23,575,000 | | | | (124,493 | ) |
| |
12/21/2022 | | Barclays Bank PLC | | | USD | | | | 2,622,628 | | | | JPY | | | | 381,855,000 | | | | (38,550 | ) |
| |
12/02/2022 | | Citibank, N.A. | | | BRL | | | | 4,410,000 | | | | USD | | | | 848,204 | | | | (260 | ) |
| |
12/21/2022 | | Citibank, N.A. | | | USD | | | | 4,260,943 | | | | INR | | | | 350,270,000 | | | | (54,386 | ) |
| |
12/21/2022 | | Citibank, N.A. | | | USD | | | | 2,579,068 | | | | KRW | | | | 3,650,000,000 | | | | (19,485 | ) |
| |
12/21/2022 | | Citibank, N.A. | | | USD | | | | 1,085,324 | | | | THB | | | | 39,090,000 | | | | (53,744 | ) |
| |
12/21/2022 | | Deutsche Bank AG | | | USD | | | | 219,569 | | | | GBP | | | | 190,000 | | | | (1,305 | ) |
| |
12/21/2022 | | Deutsche Bank AG | | | USD | | | | 1,322,768 | | | | IDR | | | | 19,782,000,000 | | | | (58,811 | ) |
| |
12/21/2022 | | Deutsche Bank AG | | | USD | | | | 15,932,373 | | | | PLN | | | | 76,520,000 | | | | (38,505 | ) |
| |
12/21/2022 | | Deutsche Bank AG | | | USD | | | | 1,824,373 | | | | ZAR | | | | 32,040,000 | | | | (86,693 | ) |
| |
12/21/2022 | | Goldman Sachs International | | | USD | | | | 14,849,474 | | | | IDR | | | | 220,820,000,000 | | | | (740,331 | ) |
| |
12/21/2022 | | Goldman Sachs International | | | USD | | | | 13,887,776 | | | | TWD | | | | 426,170,000 | | | | (667,501 | ) |
| |
12/21/2022 | | J.P. Morgan Chase Bank, N.A. | | | USD | | | | 15,751,382 | | | | HUF | | | | 6,411,600,000 | | | | (488,212 | ) |
| |
12/21/2022 | | J.P. Morgan Chase Bank, N.A. | | | USD | | | | 11,312,089 | | | | JPY | | | | 1,622,000,000 | | | | (335,739 | ) |
| |
12/21/2022 | | J.P. Morgan Chase Bank, N.A. | | | USD | | | | 14,242,753 | | | | NOK | | | | 142,430,000 | | | | (519,059 | ) |
| |
12/21/2022 | | J.P. Morgan Chase Bank, N.A. | | | USD | | | | 15,021,790 | | | | ZAR | | | | 268,800,000 | | | | (443,505 | ) |
| |
12/21/2022 | | Morgan Stanley and Co. International PLC | | | MXN | | | | 81,295,000 | | | | USD | | | | 3,977,932 | | | | (90,152 | ) |
| |
12/21/2022 | | Morgan Stanley and Co. International PLC | | | USD | | | | 9,089,081 | | | | CNY | | | | 64,080,000 | | | | (269,620 | ) |
12/21/2022 | | Morgan Stanley and Co. International PLC | | | USD | | | | 15,699,328 | | | | CZK | | | | 389,830,000 | | | | (9,680 | ) |
| |
12/21/2022 | | Morgan Stanley and Co. International PLC | | | USD | | | | 525,437 | | | | MYR | | | | 2,360,000 | | | | (26,131 | ) |
| |
12/21/2022 | | Morgan Stanley and Co. International PLC | | | USD | | | | 413,371 | | | | PEN | | | | 1,620,000 | | | | (8,996 | ) |
| |
12/21/2022 | | Morgan Stanley and Co. International PLC | | | USD | | | | 9,538,042 | | | | SEK | | | | 101,425,000 | | | | (313,841 | ) |
| |
Subtotal–Depreciation | | | | | | | | (5,962,269 | ) |
| |
Total Forward Foreign Currency Contracts | | | $ | 3,681,409 | |
| |
| | | | | | | | | | | | | | | | | | | | | | | | | | | | | | | | | | | | | | |
| Open Over-The-Counter Total Return Swap Agreements(a)(b) | |
| Counterparty | | Pay/
Receive | | | Reference Entity | | Floating
Rate
Index | | | Payment
Frequency | | | Number of Contracts | | | Maturity Date | | | Notional Value | | | Upfront
Payments
Paid
(Received) | | | Value | | | Unrealized
Appreciation
(Depreciation) | |
| |
Equity Risk | | | | | | | | | | | | | | | | | | | | | | | | | | | | | | | | | | | | | | |
| |
Goldman Sachs International | | | Pay | | | MSCI ACWI ex USA Growth Net Total Return Index | |
| SOFR +
0.27% |
| | | Quarterly | | | | 743,000 | | | | May–2023 | | | | USD 174,396,960 | | | | $- | | | $ | 11,345,610 | | | $
|
11,345,610 |
|
| |
Equity Risk | | | | | | | | | | | | | | | | | | | | | | | | | | | | | | | | | | | | | | |
| |
Goldman Sachs International | | | Receive | | | MSCI ACWI Daily Total Return Net ex USA | |
| SOFR +
0.01% |
| | | Quarterly | | | | 718,000 | | | | May–2023 | | | | USD 171,245,154 | | | | - | | | | (8,819,913 | ) | | | (8,819,913 | ) |
| |
J.P. Morgan Chase Bank, N.A. | | | Pay | | | Russell Midcap Growth Total Return Index | |
| SOFR +
0.22% |
| | | Monthly | | | | 11,200 | | | | September–2023 | | | | USD 43,673,090 | | | | - | | | | (2,597,843 | ) | | | (2,597,843 | ) |
| |
Subtotal – Depreciation | | | | | | | | | | | | | | | | | | | | | | | - | | | | (11,417,756 | ) | | | (11,417,756 | ) |
| |
Total – Total Return Swap Agreements | | | | | | | | | | | | | | | | | | | | | | | $- | | | $ | (72,146 | ) | | $ | (72,146 | ) |
| |
| (a) | Open Over-The-Counter Total Return Swap Agreements are collateralized by cash held with the swap Counterparties in the amount of $2,923,000. |
| (b) | The Fund receives or pays payments based on any positive or negative return on the Reference Entity, respectively. |
See accompanying Notes to Consolidated Financial Statements which are an integral part of the financial statements.
15 Invesco Global Allocation Fund
Abbreviations:
| CNY | –Chinese Yuan Renminbi |
| GBP | –British Pound Sterling |
| SOFR | –Secured Overnight Financing Rate |
See accompanying Notes to Consolidated Financial Statements which are an integral part of the financial statements.
16 Invesco Global Allocation Fund
Consolidated Statement of Assets and Liabilities
October 31, 2022
| | | | |
Assets: | | | | |
Investments in unaffiliated securities, at value (Cost $556,709,652)* | | $ | 481,239,258 | |
| |
Investments in affiliates, at value
(Cost $505,575,322) | | | 544,341,425 | |
| |
Other investments: | | | | |
Variation margin receivable – futures contracts | | | 3,680,705 | |
| |
Swaps receivable – OTC | | | 673,608 | |
| |
Unrealized appreciation on swap agreements – OTC | | | 11,345,610 | |
| |
Unrealized appreciation on forward foreign currency contracts outstanding | | | 9,643,678 | |
| |
Deposits with brokers: | | | | |
Cash collateral – OTC Derivatives | | | 2,923,000 | |
| |
Cash | | | 7,128,081 | |
| |
Foreign currencies, at value (Cost $801,353) | | | 800,153 | |
| |
Receivable for: | | | | |
Investments sold | | | 20,551,735 | |
| |
Fund shares sold | | | 204,914 | |
| |
Dividends | | | 668,424 | |
| |
Interest | | | 1,817,275 | |
| |
Investment for trustee deferred compensation and retirement plans | | | 213,035 | |
| |
Other assets | | | 57,872 | |
| |
Total assets | | | 1,085,288,773 | |
| |
| |
Liabilities: | | | | |
Other investments: | | | | |
Unrealized depreciation on forward foreign currency contracts outstanding | | | 5,962,269 | |
| |
Swaps payable – OTC | | | 736,021 | |
| |
Unrealized depreciation on swap agreements–OTC | | | 11,417,756 | |
| |
Payable for: | | | | |
Investments purchased | | | 20,690,578 | |
| |
Fund shares reacquired | | | 831,813 | |
| |
Accrued foreign taxes | | | 432,542 | |
| |
Collateral upon return of securities loaned | | | 14,442,984 | |
| |
Accrued fees to affiliates | | | 556,994 | |
| |
Accrued trustees’ and officers’ fees and benefits | | | 1,373 | |
| |
Accrued other operating expenses | | | 215,329 | |
| |
Trustee deferred compensation and retirement plans | | | 364,968 | |
| |
Total liabilities | | | 55,652,627 | |
| |
Net assets applicable to shares outstanding | | $ | 1,029,636,146 | |
| |
| | | | |
Net assets consist of: | | | | |
Shares of beneficial interest | | $ | 1,056,153,239 | |
| |
Distributable earnings (loss) | | | (26,517,093 | ) |
| |
| | $ | 1,029,636,146 | |
| |
| |
Net Assets: | | | | |
Class A | | $ | 862,662,744 | |
| |
Class C | | $ | 49,614,873 | |
| |
Class R | | $ | 31,033,663 | |
| |
Class Y | | $ | 49,840,985 | |
| |
Class R5 | | $ | 11,243 | |
| |
Class R6 | | $ | 36,472,638 | |
| |
|
Shares outstanding, no par value, with an unlimited number of shares authorized: | |
| |
Class A | | | 51,378,424 | |
| |
Class C | | | 3,189,370 | |
| |
Class R | | | 1,907,772 | |
| |
Class Y | | | 2,954,973 | |
| |
Class R5 | | | 663 | |
| |
Class R6 | | | 2,153,884 | |
| |
Class A: | | | | |
Net asset value per share | | $ | 16.79 | |
| |
Maximum offering price per share
(Net asset value of $16.79 ÷ 94.50%) | | $ | 17.77 | |
| |
Class C: | | | | |
Net asset value and offering price per share | | $ | 15.56 | |
| |
Class R: | | | | |
Net asset value and offering price per share | | $ | 16.27 | |
| |
Class Y: | | | | |
Net asset value and offering price per share | | $ | 16.87 | |
| |
Class R5: | | | | |
Net asset value and offering price per share | | $ | 16.96 | |
| |
Class R6: | | | | |
Net asset value and offering price per share | | $ | 16.93 | |
| |
| * | At October 31, 2022, securities with an aggregate value of $14,079,551 were on loan to brokers. |
See accompanying Notes to Consolidated Financial Statements which are an integral part of the financial statements.
17 Invesco Global Allocation Fund
Consolidated Statement of Operations
For the year ended October 31, 2022
| | | | |
Investment income: | | | | |
| |
Interest (net of foreign withholding taxes of $1,884) | | $ | 8,835,843 | |
| |
Dividends (net of foreign withholding taxes of $507,664) | | | 7,787,962 | |
| |
Dividends from affiliates (includes net securities lending income of $557,270) | | | 13,687,035 | |
| |
Total investment income | | | 30,310,840 | |
| |
| |
Expenses: | | | | |
Advisory fees | | | 9,397,590 | |
| |
Administrative services fees | | | 172,222 | |
| |
Custodian fees | | | 217,300 | |
| |
Distribution fees: | | | | |
Class A | | | 2,523,213 | |
| |
Class C | | | 607,677 | |
| |
Class R | | | 177,091 | |
| |
Transfer agent fees – A, C, R and Y | | | 1,700,726 | |
| |
Transfer agent fees – R5 | | | 4 | |
| |
Transfer agent fees – R6 | | | 12,238 | |
| |
Trustees’ and officers’ fees and benefits | | | 51,389 | |
| |
Registration and filing fees | | | 105,178 | |
| |
Professional services fees | | | 190,320 | |
| |
Other | | | 1,106 | |
| |
Total expenses | | | 15,156,054 | |
| |
Less: Fees waived and/or expense offset arrangement(s) | | | (932,090 | ) |
| |
Net expenses | | | 14,223,964 | |
| |
Net investment income | | | 16,086,876 | |
| |
| |
Realized and unrealized gain (loss) from: | | | | |
Net realized gain (loss) from: | | | | |
Unaffiliated investment securities (net of foreign taxes of $42,390) | | | (51,855,858 | ) |
| |
Affiliated investment securities | | | (7,415,424 | ) |
| |
Foreign currencies | | | (153,651 | ) |
| |
Forward foreign currency contracts | | | 16,955,160 | |
| |
Futures contracts | | | 366,745 | |
| |
Swap agreements | | | 41,637,849 | |
| |
| | | (465,179 | ) |
| |
| |
Change in net unrealized appreciation (depreciation) of: | | | | |
Unaffiliated investment securities (net of foreign taxes of $383,682) | | | (191,702,629 | ) |
| |
Affiliated investment securities | | | (81,407,081 | ) |
| |
Foreign currencies | | | 4,374,585 | |
| |
Forward foreign currency contracts | | | 1,324,932 | |
| |
Futures contracts | | | (3,572,551 | ) |
| |
Swap agreements | | | (294,995 | ) |
| |
| | | (271,277,739 | ) |
| |
Net realized and unrealized gain (loss) | | | (271,742,918 | ) |
| |
Net increase (decrease) in net assets resulting from operations | | $ | (255,656,042 | ) |
| |
See accompanying Notes to Consolidated Financial Statements which are an integral part of the financial statements.
18 Invesco Global Allocation Fund
Consolidated Statement of Changes in Net Assets
For the years ended October 31, 2022 and 2021
| | | | | | |
| | | 2022 | | | 2021 |
|
Operations: | | | | | | |
Net investment income | | $ | 16,086,876 | | | $ 13,422,337 |
|
Net realized gain (loss) | | | (465,179 | ) | | 152,067,058 |
|
Change in net unrealized appreciation (depreciation) | | | (271,277,739 | ) | | 152,171,952 |
|
Net increase (decrease) in net assets resulting from operations | | | (255,656,042 | ) | | 317,661,347 |
|
| | |
Distributions to shareholders from distributable earnings: | | | | | | |
Class A | | | (146,614,587 | ) | | – |
|
Class C | | | (9,123,275 | ) | | – |
|
Class R | | | (5,093,988 | ) | | – |
|
Class Y | | | (9,300,035 | ) | | – |
|
Class R5 | | | (2,002 | ) | | – |
|
Class R6 | | | (5,849,031 | ) | | – |
|
Total distributions from distributable earnings | | | (175,982,918 | ) | | – |
|
| | |
Share transactions–net: | | | | | | |
Class A | | | 49,715,808 | | | (89,744,878) |
|
Class C | | | (471,104 | ) | | (23,564,887) |
|
Class R | | | 3,926,613 | | | (3,015,738) |
|
Class Y | | | (719,309 | ) | | (9,811,398) |
|
Class R5 | | | 484 | | | 1,492 |
|
Class R6 | | | 5,423,105 | | | (853,213) |
|
Net increase (decrease) in net assets resulting from share transactions | | | 57,875,597 | | | (126,988,622) |
|
Net increase (decrease) in net assets | | | (373,763,363 | ) | | 190,672,725 |
|
| | |
Net assets: | | | | | | |
Beginning of year | | | 1,403,399,509 | | | 1,212,726,784 |
|
End of year | | $ | 1,029,636,146 | | | $1,403,399,509 |
|
See accompanying Notes to Consolidated Financial Statements which are an integral part of the financial statements.
19 Invesco Global Allocation Fund
Consolidated Financial Highlights
The following schedule presents financial highlights for a share of the Fund outstanding throughout the periods indicated.
| | | | | | | | | | | | | | | | | | | | | | | | | | | | | | | | | | | | | | | | | | | | | | | | | | | | | | | | |
| | | Net asset
value,
beginning
of period | | | Net investment income(a) | | | Net gains
(losses)
on securities
(both
realized and
unrealized) | | | Total from
investment operations | | | Dividends
from net
investment
income | | | Distributions
from net
realized
gains | | | Total
distributions | | | Net asset
value, end
of period | | | Total
return (b) | | | Net assets, end of period (000’s omitted) | | | Ratio of
expenses to average net assets
with fee waivers
and/or
expenses
absorbed(c) | | | Ratio of
expenses
to average net
assets without
fee waivers
and/or
expenses
absorbed(c) | | | Ratio of net
investment
income to average
net assets | | | Portfolio
turnover (d) | |
Class A | | | | | | | | | | | | | | | | | | | | | | | | | | | | | | | | | | | | | | | | | | | | | | | | | | | | | | | | |
Year ended 10/31/22 | | | $23.79 | | | | $0.26 | | | | $(4.25 | ) | | | $(3.99 | ) | | | $(0.47 | ) | | | $(2.54 | ) | | | $(3.01 | ) | | | $16.79 | | | | (19.06 | )% | | | $ 862,663 | | | | 1.15 | % | | | 1.23 | % | | | 1.36 | % | | | 151 | % |
Year ended 10/31/21 | | | 18.75 | | | | 0.22 | | | | 4.82 | | | | 5.04 | | | | - | | | | - | | | | - | | | | 23.79 | | | | 26.88 | | | | 1,173,186 | | | | 1.15 | | | | 1.25 | | | | 1.01 | | | | 51 | |
Year ended 10/31/20 | | | 18.21 | | | | 0.15 | | | | 0.39 | | | | 0.54 | | | | - | | | | - | | | | - | | | | 18.75 | | | | 2.97 | | | | 999,336 | | | | 1.20 | | | | 1.32 | | | | 0.85 | | | | 82 | |
Year ended 10/31/19 | | | 18.48 | | | | 0.13 | | | | 1.16 | | | | 1.29 | | | | (0.39 | ) | | | (1.17 | ) | | | (1.56 | ) | | | 18.21 | | | | 8.05 | | | | 1,093,027 | | | | 1.21 | | | | 1.31 | | | | 0.75 | | | | 52 | |
Year ended 10/31/18 | | | 19.48 | | | | 0.21 | | | | (1.21 | ) | | | (1.00 | ) | | | (0.00 | ) | | | - | | | | (0.00 | ) | | | 18.48 | | | | (5.12 | ) | | | 1,050,082 | | | | 1.25 | | | | 1.32 | | | | 1.06 | | | | 151 | |
Class C | | | | | | | | | | | | | | | | | | | | | | | | | | | | | | | | | | | | | | | | | | | | | | | | | | | | | | | | |
Year ended 10/31/22 | | | 22.23 | | | | 0.11 | | | | (3.95 | ) | | | (3.84 | ) | | | (0.29 | ) | | | (2.54 | ) | | | (2.83 | ) | | | 15.56 | | | | (19.63 | ) | | | 49,615 | | | | 1.90 | | | | 1.98 | | | | 0.61 | | | | 151 | |
Year ended 10/31/21 | | | 17.66 | | | | 0.05 | | | | 4.52 | | | | 4.57 | | | | - | | | | - | | | | - | | | | 22.23 | | | | 25.88 | | | | 72,605 | | | | 1.90 | | | | 2.00 | | | | 0.26 | | | | 51 | |
Year ended 10/31/20 | | | 17.28 | | | | 0.02 | | | | 0.36 | | | | 0.38 | | | | - | | | | - | | | | - | | | | 17.66 | | | | 2.20 | | | | 77,710 | | | | 1.95 | | | | 2.07 | | | | 0.10 | | | | 82 | |
Year ended 10/31/19 | | | 17.59 | | | | 0.00 | | | | 1.10 | | | | 1.10 | | | | (0.24 | ) | | | (1.17 | ) | | | (1.41 | ) | | | 17.28 | | | | 7.22 | | | | 92,142 | | | | 1.96 | | | | 2.06 | | | | 0.00 | | | | 52 | |
Year ended 10/31/18 | | | 18.67 | | | | 0.06 | | | | (1.14 | ) | | | (1.08 | ) | | | - | | | | - | | | | - | | | | 17.59 | | | | (5.84 | ) | | | 209,903 | | | | 2.01 | | | | 2.08 | | | | 0.31 | | | | 151 | |
Class R | | | | | | | | | | | | | | | | | | | | | | | | | | | | | | | | | | | | | | | | | | | | | | | | | | | | | | | | |
Year ended 10/31/22 | | | 23.13 | | | | 0.20 | | | | (4.11 | ) | | | (3.91 | ) | | | (0.41 | ) | | | (2.54 | ) | | | (2.95 | ) | | | 16.27 | | | | (19.22 | ) | | | 31,034 | | | | 1.40 | | | | 1.48 | | | | 1.11 | | | | 151 | |
Year ended 10/31/21 | | | 18.28 | | | | 0.16 | | | | 4.69 | | | | 4.85 | | | | - | | | | - | | | | - | | | | 23.13 | | | | 26.53 | | | | 39,793 | | | | 1.40 | | | | 1.50 | | | | 0.76 | | | | 51 | |
Year ended 10/31/20 | | | 17.79 | | | | 0.11 | | | | 0.38 | | | | 0.49 | | | | - | | | | - | | | | - | | | | 18.28 | | | | 2.75 | | | | 34,012 | | | | 1.45 | | | | 1.57 | | | | 0.60 | | | | 82 | |
Year ended 10/31/19 | | | 18.10 | | | | 0.09 | | | | 1.11 | | | | 1.20 | | | | (0.34 | ) | | | (1.17 | ) | | | (1.51 | ) | | | 17.79 | | | | 7.68 | | | | 38,552 | | | | 1.46 | | | | 1.56 | | | | 0.50 | | | | 52 | |
Year ended 10/31/18 | | | 19.12 | | | | 0.16 | | | | (1.18 | ) | | | (1.02 | ) | | | - | | | | - | | | | - | | | | 18.10 | | | | 5.34 | | | | 39,909 | | | | 1.50 | | | | 1.57 | | | | 0.82 | | | | 151 | |
Class Y | | | | | | | | | | | | | | | | | | | | | | | | | | | | | | | | | | | | | | | | | | | | | | | | | | | | | | | | |
Year ended 10/31/22 | | | 23.89 | | | | 0.31 | | | | (4.26 | ) | | | (3.95 | ) | | | (0.53 | ) | | | (2.54 | ) | | | (3.07 | ) | | | 16.87 | | | | (18.84 | ) | | | 49,841 | | | | 0.90 | | | | 0.98 | | | | 1.61 | | | | 151 | |
Year ended 10/31/21 | | | 18.78 | | | | 0.28 | | | | 4.83 | | | | 5.11 | | | | - | | | | - | | | | - | | | | 23.89 | | | | 27.21 | | | | 72,519 | | | | 0.90 | | | | 1.00 | | | | 1.26 | | | | 51 | |
Year ended 10/31/20 | | | 18.21 | | | | 0.20 | | | | 0.38 | | | | 0.58 | | | | (0.01 | ) | | | - | | | | (0.01 | ) | | | 18.78 | | | | 3.27 | | | | 65,397 | | | | 0.95 | | | | 1.07 | | | | 1.10 | | | | 82 | |
Year ended 10/31/19 | | | 18.49 | | | | 0.18 | | | | 1.14 | | | | 1.32 | | | | (0.43 | ) | | | (1.17 | ) | | | (1.60 | ) | | | 18.21 | | | | 8.27 | | | | 74,260 | | | | 0.96 | | | | 1.06 | | | | 0.99 | | | | 52 | |
Year ended 10/31/18 | | | 19.47 | | | | 0.26 | | | | (1.21 | ) | | | (0.95 | ) | | | (0.03 | ) | | | - | | | | (0.03 | ) | | | 18.49 | | | | (4.88 | ) | | | 114,493 | | | | 1.01 | | | | 1.08 | | | | 1.31 | | | | 151 | |
Class R5 | | | | | | | | | | | | | | | | | | | | | | | | | | | | | | | | | | | | | | | | | | | | | | | | | | | | | | | | |
Year ended 10/31/22 | | | 24.02 | | | | 0.33 | | | | (4.29 | ) | | | (3.96 | ) | | | (0.56 | ) | | | (2.54 | ) | | | (3.10 | ) | | | 16.96 | | | | (18.77 | ) | | | 11 | | | | 0.78 | | | | 0.86 | | | | 1.73 | | | | 151 | |
Year ended 10/31/21 | | | 18.85 | | | | 0.32 | | | | 4.85 | | | | 5.17 | | | | - | | | | - | | | | - | | | | 24.02 | | | | 27.43 | | | | 15 | | | | 0.76 | | | | 0.86 | | | | 1.40 | | | | 51 | |
Year ended 10/31/20 | | | 18.24 | | | | 0.24 | | | | 0.39 | | | | 0.63 | | | | (0.02 | ) | | | - | | | | (0.02 | ) | | | 18.85 | | | | 3.45 | | | | 11 | | | | 0.76 | | | | 0.87 | | | | 1.29 | | | | 82 | |
Period ended 10/31/19(e) | | | 17.36 | | | | 0.09 | | | | 0.79 | | | | 0.88 | | | | - | | | | - | | | | - | | | | 18.24 | | | | 5.07 | | | | 11 | | | | 0.85 | (f) | | | 0.93 | (f) | | | 1.11 | (f) | | | 52 | |
Class R6 | | | | | | | | | | | | | | | | | | | | | | | | | | | | | | | | | | | | | | | | | | | | | | | | | | | | | | | | |
Year ended 10/31/22 | | | 23.98 | | | | 0.33 | | | | (4.28 | ) | | | (3.95 | ) | | | (0.56 | ) | | | (2.54 | ) | | | (3.10 | ) | | | 16.93 | | | | (18.77 | ) | | | 36,473 | | | | 0.78 | | | | 0.86 | | | | 1.73 | | | | 151 | |
Year ended 10/31/21 | | | 18.83 | | | | 0.31 | | | | 4.84 | | | | 5.15 | | | | - | | | | - | | | | - | | | | 23.98 | | | | 27.35 | | | | 45,281 | | | | 0.76 | | | | 0.86 | | | | 1.40 | | | | 51 | |
Year ended 10/31/20 | | | 18.22 | | | | 0.24 | | | | 0.39 | | | | 0.63 | | | | (0.02 | ) | | | - | | | | (0.02 | ) | | | 18.83 | | | | 3.46 | | | | 36,260 | | | | 0.76 | | | | 0.87 | | | | 1.29 | | | | 82 | |
Year ended 10/31/19 | | | 18.51 | | | | 0.21 | | | | 1.14 | | | | 1.35 | | | | (0.47 | ) | | | (1.17 | ) | | | (1.64 | ) | | | 18.22 | | | | 8.48 | | | | 37,741 | | | | 0.79 | | | | 0.88 | | | | 1.17 | | | | 52 | |
Year ended 10/31/18 | | | 19.48 | | | | 0.29 | | | | (1.21 | ) | | | (0.92 | ) | | | (0.05 | ) | | | - | | | | (0.05 | ) | | | 18.51 | | | | (4.75 | ) | | | 33,300 | | | | 0.84 | | | | 0.91 | | | | 1.48 | | | | 151 | |
| (a) | Calculated using average shares outstanding. |
| (b) | Includes adjustments in accordance with accounting principles generally accepted in the United States of America and as such, the net asset value for financial reporting purposes and the returns based upon those net asset values may differ from the net asset value and returns for shareholder transactions. Does not include sales charges and is not annualized for periods less than one year, if applicable. |
| (c) | Does not include estimated acquired fund fees from underlying funds of 0.15%,0.17%, 0.14%, 0.08% and 0.02% for the years ended October 31, 2022, 2021, 2020, 2019 and 2018, respectively. |
| (d) | Portfolio turnover is calculated at the fund level and is not annualized for periods less than one year, if applicable. |
| (e) | Commencement date after the close of business on May 24, 2019. |
See accompanying Notes to Consolidated Financial Statements which are an integral part of the financial statements.
20 Invesco Global Allocation Fund
Notes to Consolidated Financial Statements
October 31, 2022
NOTE 1–Significant Accounting Policies
Invesco Global Allocation Fund (the “Fund”) is a series portfolio of AIM Investment Funds (Invesco Investment Funds) (the “Trust”). The Trust is organized as a Delaware statutory trust and is registered under the Investment Company Act of 1940, as amended (the “1940 Act”), as an open-end series management investment company authorized to issue an unlimited number of shares of beneficial interest. Information presented in these consolidated financial statements pertains only to the Fund and the Invesco Global Allocation Fund (Cayman) Ltd. (the “Subsidiary”), a wholly-owned and controlled subsidiary by the Fund organized under the laws of the Cayman Islands. Matters affecting the Fund or each class will be voted on exclusively by the shareholders of the Fund or each class.
The Fund will seek to gain exposure to commodity-linked derivatives primarily through investments in the Subsidiary. The Subsidiary was organized by the Fund to invest in commodity-linked derivatives (including commodity futures, financial futures, options and swap contracts), and certain fixed-income securities and other investments that may serve as margin or collateral for its derivatives positions. The Fund may invest up to 25% of its total assets in the Subsidiary.
The Fund’s investment objective is to seek total return.
The Fund currently consists of six different classes of shares: Class A, Class C, Class R, Class Y, Class R5 and Class R6. Class Y shares are available only to certain investors. Class A shares are sold with a front-end sales charge unless certain waiver criteria are met. Under certain circumstances, load waived shares may be subject to contingent deferred sales charges (“CDSC”). Class C shares are sold with a CDSC. Class R, Class Y, Class R5 and Class R6 shares are sold at net asset value. Class C shares held for eight years after purchase are eligible for automatic conversion into Class A shares of the same Fund (the “Conversion Feature”). The automatic conversion pursuant to the Conversion Feature will generally occur at the end of the month following the eighth anniversary after a purchase of Class C shares.
The Fund is an investment company and accordingly follows the investment company accounting and reporting guidance in accordance with Financial Accounting Standards Board Accounting Standards Codification Topic 946, Financial Services – Investment Companies.
The following is a summary of the significant accounting policies followed by the Fund in the preparation of its consolidated financial statements.
| A. | Security Valuations – Securities, including restricted securities, are valued according to the following policy. |
Fixed income securities (including convertible debt securities) generally are valued on the basis of prices provided by independent pricing services. Prices provided by the pricing service may be determined without exclusive reliance on quoted prices, and may reflect appropriate factors such as institution-size trading in similar groups of securities, developments related to specific securities, dividend rate (for unlisted equities), yield (for debt obligations), quality, type of issue, coupon rate (for debt obligations), maturity (for debt obligations), individual trading characteristics and other market data. Pricing services generally value debt obligations assuming orderly transactions of institutional round lot size, but a fund may hold or transact in the same securities in smaller, odd lot sizes. Odd lots often trade at lower prices than institutional round lots, and their value may be adjusted accordingly. Debt obligations are subject to interest rate and credit risks. In addition, all debt obligations involve some risk of default with respect to interest and/or principal payments.
A security listed or traded on an exchange is generally valued at its trade price or official closing price that day as of the close of the exchange where the security is principally traded, or lacking any trades or official closing price on a particular day, the security may be valued at the closing bid price on that day. Securities traded in the over-the-counter market are valued based on prices furnished by independent pricing services or market makers. When such securities are valued using prices provided by an independent pricing service they may be considered fair valued. Futures contracts are valued at the daily settlement price set by an exchange on which they are principally traded. U.S. exchange-traded options are valued at the mean between the last bid and asked prices from the exchange on which they are principally traded. Non-U.S. exchange-traded options are valued at the final settlement price set by the exchange on which they trade. Options not listed on an exchange and swaps generally are valued using pricing provided from independent pricing services.
Securities of investment companies that are not exchange-traded (e.g., open-end mutual funds) are valued using such company’s end-of-business-day net asset value per share.
Deposits, other obligations of U.S. and non-U.S. banks and financial institutions are valued at their daily account value.
Swap agreements are fair valued using an evaluated quote, if available, provided by an independent pricing service. Evaluated quotes provided by the pricing service are valued based on a model which may include end-of-day net present values, spreads, ratings, industry, company performance and returns of referenced assets. Centrally cleared swap agreements are valued at the daily settlement price determined by the relevant exchange or clearinghouse.
Foreign securities’ (including foreign exchange contracts) prices are converted into U.S. dollar amounts using the applicable exchange rates as of the close of the New York Stock Exchange (“NYSE”). If market quotations are available and reliable for foreign exchange-traded equity securities, the securities will be valued at the market quotations. Invesco Advisers, Inc. (the “Adviser” or “Invesco”) may use various pricing services to obtain market quotations as well as fair value prices. Because trading hours for certain foreign securities end before the close of the NYSE, closing market quotations may become not representative of market value in the Adviser’s judgment (“unreliable”). If between the time trading ends on a particular security and the close of the customary trading session on the NYSE, a significant event occurs that makes the closing price of the security unreliable, the Adviser may fair value the security. If the event is likely to have affected the closing price of the security, the security will be valued at fair value in good faith in accordance with Board-approved policies and related Adviser procedures (“Valuation Procedures”). Adjustments to closing prices to reflect fair value may also be based on a screening process of an independent pricing service to indicate the degree of certainty, based on historical data, that the closing price in the principal market where a foreign security trades is not the current value as of the close of the NYSE. Foreign securities’ prices meeting the degree of certainty that the price is not reflective of current value will be priced at the indication of fair value from the independent pricing service. Multiple factors may be considered by the independent pricing service in determining adjustments to reflect fair value and may include information relating to sector indices, American Depositary Receipts and domestic and foreign index futures. Foreign securities may have additional risks including exchange rate changes, potential for sharply devalued currencies and high inflation, political and economic upheaval, the relative lack of issuer information, relatively low market liquidity and the potential lack of strict financial and accounting controls and standards.
Unlisted securities will be valued using prices provided by independent pricing services or by another method that the Adviser, in its judgment, believes better reflects the security’s fair value in accordance with the Valuation Procedures.
Securities for which market prices are not provided by any of the above methods may be valued based upon quotes furnished by independent sources. The last bid price may be used to value equity securities. The mean between the last bid and asked prices may be used to value debt obligations, including corporate loans.
Securities for which market quotations are not readily available are fair valued by the Adviser in accordance with the Valuation Procedures. If a fair value price provided by a pricing service is unreliable, the Adviser will fair value the security using the Valuation Procedures. Issuer specific events, market trends, bid/asked quotes of brokers and information providers and other market data may be reviewed in the course of making a good faith determination of a security’s fair value.
The Fund may invest in securities that are subject to interest rate risk, meaning the risk that the prices will generally fall as interest rates rise and, conversely, the prices will generally rise as interest rates fall. Specific securities differ in their sensitivity to changes in interest rates depending on their individual characteristics. Changes in interest rates may result in increased market volatility, which may affect the value and/or liquidity of certain Fund investments.
Valuations change in response to many factors including the historical and prospective earnings of the issuer, the value of the issuer’s assets, general market conditions which are not specifically related to the particular issuer, such as real or perceived adverse economic conditions, changes in the general outlook for revenues or corporate earnings, changes in interest or currency rates, regional or global instability, natural or environmental disasters, widespread disease or other public health issues, war, acts of terrorism, significant governmental actions or adverse investor sentiment generally and market liquidity. Because of the
21 Invesco Global Allocation Fund
inherent uncertainties of valuation, the values reflected in the consolidated financial statements may materially differ from the value received upon actual sale of those investments.
The price the Fund could receive upon the sale of any investment may differ from the Adviser’s valuation of the investment, particularly for securities that are valued using a fair valuation technique. When fair valuation techniques are applied, the Adviser uses available information, including both observable and unobservable inputs and assumptions, to determine a methodology that will result in a valuation that the Adviser believes approximates market value. Fund securities that are fair valued may be subject to greater fluctuation in their value from one day to the next than would be the case if market quotations were used. Because of the inherent uncertainties of valuation, and the degree of subjectivity in such decisions, the Fund could realize a greater or lesser than expected gain or loss upon the sale of the investment.
| B. | Securities Transactions and Investment Income – Securities transactions are accounted for on a trade date basis. Realized gains or losses on sales are computed on the basis of specific identification of the securities sold. Interest income (net of withholding tax, if any) is recorded on an accrual basis from settlement date and includes coupon interest and amortization of premium and accretion of discount on debt securities as applicable. Pay-in-kind interest income and non-cash dividend income received in the form of securities in-lieu of cash are recorded at the fair value of the securities received. Dividend income (net of withholding tax, if any) is recorded on the ex-dividend date. |
The Fund may periodically participate in litigation related to Fund investments. As such, the Fund may receive proceeds from litigation settlements.Any proceeds received are included in the Consolidated Statement of Operations as realized gain (loss) for investments no longer held and as unrealized gain (loss) for investments still held.
Brokerage commissions and mark ups are considered transaction costs and are recorded as an increase to the cost basis of securities purchased and/or a reduction of proceeds on a sale of securities. Such transaction costs are included in the determination of net realized and unrealized gain (loss) from investment securities reported in the Consolidated Statement of Operations and the Consolidated Statement of Changes in Net Assets and the net realized and unrealized gains (losses) on securities per share in the Consolidated Financial Highlights. Transaction costs are included in the calculation of the Fund’s net asset value and, accordingly, they reduce the Fund’s total returns. These transaction costs are not considered operating expenses and are not reflected in net investment income reported in the Consolidated Statement of Operations and the Consolidated Statement of Changes in Net Assets, or the net investment income per share and the ratios of expenses and net investment income reported in the Consolidated Financial Highlights, nor are they limited by any expense limitation arrangements between the Fund and the investment adviser.
The Fund allocates income and realized and unrealized capital gains and losses to a class based on the relative net assets of each class.
| C. | Country Determination – For the purposes of making investment selection decisions and presentation in the Consolidated Schedule of Investments, the investment adviser may determine the country in which an issuer is located and/or credit risk exposure based on various factors. These factors include the laws of the country under which the issuer is organized, where the issuer maintains a principal office, the country in which the issuer derives 50% or more of its total revenues, the country that has the primary market for the issuer’s securities and its “country of risk” as determined by a third party service provider,as well as other criteria. Among the other criteria that may be evaluated for making this determination are the country in which the issuer maintains 50% or more of its assets, the type of security, financial guarantees and enhancements, the nature of the collateral and the sponsor organization. Country of issuer and/or credit risk exposure has been determined to be the United States of America, unless otherwise noted. |
| D. | Distributions – Distributions from net investment income and net realized capital gain, if any, are generally declared and paid annually and recorded on the ex-dividend date. The Fund may elect to treat a portion of the proceeds from redemptions as distributions for federal income tax purposes. |
| E. | Federal Income Taxes – The Fund intends to comply with the requirements of Subchapter M of the Internal Revenue Code of 1986, as amended (the “Internal Revenue Code”), necessary to qualify as a regulated investment company and to distribute substantially all of the Fund’s taxable earnings to shareholders. As such, the Fund will not be subject to federal income taxes on otherwise taxable income (including net realized capital gain) that is distributed to shareholders. Therefore, no provision for federal income taxes is recorded in the consolidated financial statements. |
The Fund recognizes the tax benefits of uncertain tax positions only when the position is more likely than not to be sustained. Management has analyzed the Fund’s uncertain tax positions and concluded that no liability for unrecognized tax benefits should be recorded related to uncertain tax positions. Management is not aware of any tax positions for which it is reasonably possible that the total amounts of unrecognized tax benefits will change materially in the next 12 months.
The Subsidiary is classified as a controlled foreign corporation under Subchapter N of the Internal Revenue Code. Therefore, the Fund is required to increase its taxable income by its share of the Subsidiary’s income. Net investment losses of the Subsidiary cannot be deducted by the Fund in the current period nor carried forward to offset taxable income in future periods.
The Fund files tax returns in the U.S. Federal jurisdiction and certain other jurisdictions. Generally the Fund is subject to examinations by such taxing authorities for up to three years after the filing of the return for the tax period.
| F. | Foreign Withholding Taxes – The Fund is subject to foreign withholding tax imposed by certain foreign countries in which the Fund may invest. Withholding taxes are incurred on certain foreign dividends and are accrued at the time the dividend is recognized based on applicable foreign tax laws. The Fund may file withholding tax refunds in certain jurisdictions to recover a portion of amounts previously withheld. The Fund will record a receivable for such tax refunds based on several factors including; an assessment of a jurisdiction’s legal obligation to pay reclaims, administrative practices and payment history. Any receivables recorded will be shown under receivables for Tax reclaims on the Consolidated Statement of Assets and Liabilities. |
As a result of recent court rulings in certain countries across the European Union, tax refunds for previously withheld taxes on dividends earned in those countries have been received. These tax refund payments are reflected as Foreign withholding tax claims in the Consolidated Statement of Operations, and any related interest is included in Interest income. The Fund may incur fees paid to third party providers that assist in the recovery of the tax reclaims. These fees are reflected on the Consolidated Statement of Operations as Professional fees, if any. In the event tax refunds received by the Fund during the fiscal year exceed the foreign withholding taxes paid by the Fund for the year, and the Fund previously passed foreign tax credits on to its shareholders, the Fund intends to enter into a closing agreement with the Internal Revenue Service in order to pay the associated liability on behalf of the Funds’ shareholders. For the year ended October 31, 2022, the Fund did not enter into any closing agreements.
| G. | Expenses – Fees provided for under the Rule 12b-1 plan of a particular class of the Fund are charged to the operations of such class. Transfer agency fees and expenses and other shareholder recordkeeping fees and expenses attributable to Class R5 and Class R6 are allocated based on relative net assets of Class R5 and Class R6. Sub-accounting fees attributable to Class R5 are charged to the operations of the class. Transfer agency fees and expenses and other shareholder recordkeeping fees and expenses relating to all other classes are allocated among those classes based on relative net assets. All other expenses are allocated among the classes based on relative net assets. |
| H. | Accounting Estimates – The financial statements are prepared on a consolidated basis in conformity with accounting principles generally accepted in the United States of America (“GAAP”), which requires management to make estimates and assumptions that affect the reported amounts of assets and liabilities at the date of the financial statements and the reported amounts of revenues and expenses during the reporting period including estimates and assumptions related to taxation. Actual results could differ from those estimates by a significant amount. The accompanying financial statements reflect the financial position of the Fund and its Subsidiary and the results of operations on a consolidated basis. All inter-company accounts and transactions have been eliminated in consolidation. |
In addition, the Fund monitors for material events or transactions that may occur or become known after the period-end date and before the date the consolidated financial statements are released to print.
| I. | Indemnifications – Under the Trust’s organizational documents, each Trustee, officer, employee or other agent of the Trust, and under the Subsidiary’s organizational documents, the directors and officers of the Subsidiary, are indemnified against certain liabilities that may arise out of the performance of their |
22 Invesco Global Allocation Fund
duties to the Fund and/or the Subsidiary, respectively. Additionally, in the normal course of business, the Fund enters into contracts, including the Fund’s servicing agreements, that contain a variety of indemnification clauses. The Fund’s maximum exposure under these arrangements is unknown as this would involve future claims that may be made against the Fund that have not yet occurred. The risk of material loss as a result of such indemnification claims is considered remote.
| J. | Securities Purchased on a When-Issued and Delayed Delivery Basis – The Fund may purchase and sell interests in corporate loans and corporate debt securities and other portfolio securities on a when-issued and delayed delivery basis, with payment and delivery scheduled for a future date. No income accrues to the Fund on such interests or securities in connection with such transactions prior to the date the Fund actually takes delivery of such interests or securities. These transactions are subject to market fluctuations and are subject to the risk that the value at delivery may be more or less than the trade date purchase price. Although the Fund will generally purchase these securities with the intention of acquiring such securities, they may sell such securities prior to the settlement date. |
| K. | Securities Lending – The Fund may lend portfolio securities having a market value up to one-third of the Fund’s total assets. Such loans are secured by collateral equal to no less than the market value of the loaned securities determined daily by the securities lending provider. Such collateral will be cash or debt securities issued or guaranteed by the U.S. Government or any of its sponsored agencies. Cash collateral received in connection with these loans is invested in short-term money market instruments or affiliated, unregistered investment companies that comply with Rule 2a-7 under the 1940 Act and money market funds (collectively, “affiliated money market funds”) and is shown as such on the Consolidated Schedule of Investments. The Fund bears the risk of loss with respect to the investment of collateral. It is the Fund’s policy to obtain additional collateral from or return excess collateral to the borrower by the end of the next business day, following the valuation date of the securities loaned. Therefore, the value of the collateral held may be temporarily less than the value of the securities on loan. When loaning securities, the Fund retains certain benefits of owning the securities, including the economic equivalent of dividends or interest generated by the security. Lending securities entails a risk of loss to the Fund if, and to the extent that, the market value of the securities loaned were to increase and the borrower did not increase the collateral accordingly, and the borrower failed to return the securities. The securities loaned are subject to termination at the option of the borrower or the Fund. Upon termination, the borrower will return to the Fund the securities loaned and the Fund will return the collateral. Upon the failure of the borrower to return the securities, collateral may be liquidated and the securities may be purchased on the open market to replace the loaned securities. The Fund could experience delays and costs in gaining access to the collateral and the securities may lose value during the delay which could result in potential losses to the Fund. Some of these losses may be indemnified by the lending agent. The Fund bears the risk of any deficiency in the amount of the collateral available for return to the borrower due to any loss on the collateral invested. Dividends received on cash collateral investments for securities lending transactions, which are net of compensation to counterparties, are included in Dividends from affiliates on the Consolidated Statement of Operations. The aggregate value of securities out on loan, if any, is shown as a footnote on the Consolidated Statement of Assets and Liabilities. |
The Adviser serves as an affiliated securities lending agent for the Fund. The Bank of New York Mellon also serves as a lending agent. To the extent the Fund utilizes the Adviser as an affiliated securities lending agent, the Fund conducts its securities lending in accordance with, and in reliance upon, no-action letters issued by the SEC staff that provide guidance on how an affiliate may act as a direct agent lender and receive compensation for those services in a manner consistent with the federal securities laws. For the year ended October 31, 2022, the Fund paid the Adviser $61,741 in fees for securities lending agent services. Fees paid to the Adviser for securities lending agent services are included in Dividends from affiliates on the Consolidated Statement of Operations.
| L. | Foreign Currency Translations – Foreign currency is valued at the close of the NYSE based on quotations posted by banks and major currency dealers. Portfolio securities and other assets and liabilities denominated in foreign currencies are translated into U.S. dollar amounts at the date of valuation. Purchases and sales of portfolio securities (net of foreign taxes withheld on disposition) and income items denominated in foreign currencies are translated into U.S. dollar amounts on the respective dates of such transactions. The Fund does not separately account for the portion of the results of operations resulting from changes in foreign exchange rates on investments and the fluctuations arising from changes in market prices of securities held. The combined results of changes in foreign exchange rates and the fluctuation of market prices on investments (net of estimated foreign tax withholding) are included with the net realized and unrealized gain or loss from investments in the Consolidated Statement of Operations. Reported net realized foreign currency gains or losses arise from (1) sales of foreign currencies, (2) currency gains or losses realized between the trade and settlement dates on securities transactions, and (3) the difference between the amounts of dividends, interest, and foreign withholding taxes recorded on the Fund’s books and the U.S. dollar equivalent of the amounts actually received or paid. Net unrealized foreign currency gains and losses arise from changes in the fair values of assets and liabilities, other than investments in securities at fiscal period end, resulting from changes in exchange rates. |
The Fund may invest in foreign securities, which may be subject to foreign taxes on income, gains on investments or currency repatriation, a portion of which may be recoverable. Foreign taxes, if any, are recorded based on the tax regulations and rates that exist in the foreign markets in which the Fund invests and are shown in the Consolidated Statement of Operations.
| M. | Forward Foreign Currency Contracts – The Fund may engage in foreign currency transactions either on a spot (i.e. for prompt delivery and settlement) basis, or through forward foreign currency contracts, to manage or minimize currency or exchange rate risk. |
The Fund may also enter into forward foreign currency contracts for the purchase or sale of a security denominated in a foreign currency in order to “lock in” the U.S. dollar price of that security, or the Fund may also enter into forward foreign currency contracts that do not provide for physical exchange of the two currencies on the settlement date, but instead are settled by a single cash payment calculated as the difference between the agreed upon exchange rate and the spot rate at settlement based upon an agreed upon notional amount (non-deliverable forwards).
A forward foreign currency contract is an obligation between two parties (“Counterparties”) to purchase or sell a specific currency for an agreed-upon price at a future date. The use of forward foreign currency contracts for hedging does not eliminate fluctuations in the price of the underlying securities the Fund owns or intends to acquire but establishes a rate of exchange in advance. Fluctuations in the value of these contracts are measured by the difference in the contract date and reporting date exchange rates and are recorded as unrealized appreciation (depreciation) until the contracts are closed. When the contracts are closed, realized gains (losses) are recorded. Realized and unrealized gains (losses) on the contracts are included in the Consolidated Statement of Operations. The primary risks associated with forward foreign currency contracts include failure of the Counterparty to meet the terms of the contract and the value of the foreign currency changing unfavorably. These risks may be in excess of the amounts reflected in the Consolidated Statement of Assets and Liabilities.
| N. | Futures Contracts – The Fund may enter into futures contracts to equitize the Fund’s cash holdings or to manage exposure to interest rate, equity, commodity and market price movements and/or currency risks. A futures contract is an agreement between Counterparties to purchase or sell a specified underlying security, currency or commodity (or delivery of a cash settlement price, in the case of an index future) for a fixed price at a future date. The Fund currently invests only in exchange-traded futures and they are standardized as to maturity date and underlying financial instrument or asset. Initial margin deposits required upon entering into futures contracts are satisfied by the segregation of specific securities or cash as collateral at the futures commission merchant (broker). During the period the futures contracts are open, changes in the value of the contracts are recognized as unrealized gains or losses by recalculating the value of the contracts on a daily basis. Subsequent or variation margin payments are received or made depending upon whether unrealized gains or losses are incurred. These amounts are reflected as receivables or payables on the Consolidated Statement of Assets and Liabilities. When the contracts are closed or expire, the Fund recognizes a realized gain or loss equal to the difference between the proceeds from, or cost of, the closing transaction and the Fund’s basis in the contract. The net realized gain (loss) and the change in unrealized gain (loss) on futures contracts held during the period is included on the Consolidated Statement of Operations. The primary risks associated with futures contracts are market risk and the absence of a liquid secondary market. If the Fund were unable to liquidate a futures contract and/or enter into an offsetting closing transaction, the Fund would continue to be subject to market risk with respect to the value of the contracts and continue to be required to maintain the margin deposits on the futures contracts. Futures contracts have minimal |
23 Invesco Global Allocation Fund
Counterparty risk since the exchange’s clearinghouse, as Counterparty to all exchange-traded futures, guarantees the futures against default. Risks may exceed amounts recognized in the Consolidated Statement of Assets and Liabilities.
| O. | Swap Agreements – The Fund may enter into various swap transactions, including interest rate, total return, index, currency and credit default swap contracts (“CDS”) for investment purposes or to manage interest rate, currency, commodity or credit risk. Such transactions are agreements between Counterparties. A swap agreement may be negotiated bilaterally and traded over-the-counter (“OTC”) between two parties (“uncleared/OTC”) or, in some instances, must be transacted through a future commission merchant (“FCM”) and cleared through a clearinghouse that serves as a central Counterparty (“centrally cleared swap”). These agreements may contain among other conditions, events of default and termination events, and various covenants and representations such as provisions that require the Fund to maintain a pre-determined level of net assets, and/or provide limits regarding the decline of the Fund’s net asset value (“NAV”) per share over specific periods of time. If the Fund were to trigger such provisions and have open derivative positions at that time, the Counterparty may be able to terminate such agreement and request immediate payment in an amount equal to the net liability positions, if any. |
Interest rate, total return, index, and currency swap agreements are two-party contracts entered into primarily to exchange the returns (or differentials in rates of returns) earned or realized on particular predetermined investments or instruments. The gross returns to be exchanged or “swapped” between the parties are calculated with respect to a notional amount, i.e., the return on or increase in value of a particular dollar amount invested at a particular interest rate or return of an underlying asset, in a particular foreign currency, or in a “basket” of securities representing a particular index.
In a centrally cleared swap, the Fund’s ultimate Counterparty is a central clearinghouse. The Fund initially will enter into centrally cleared swaps through an executing broker. When a fund enters into a centrally cleared swap, it must deliver to the central Counterparty (via the FCM) an amount referred to as “initial margin.” Initial margin requirements are determined by the central Counterparty, but an FCM may require additional initial margin above the amount required by the central Counterparty. Initial margin deposits required upon entering into centrally cleared swaps are satisfied by cash or securities as collateral at the FCM. Securities deposited as initial margin are designated on the Consolidated Schedule of Investments and cash deposited is recorded on the Consolidated Statement of Assets and Liabilities. During the term of a cleared swap agreement, a “variation margin” amount may be required to be paid by the Fund or may be received by the Fund, based on the daily change in price of the underlying reference instrument subject to the swap agreement and is recorded as a receivable or payable for variation margin in the Consolidated Statement of Assets and Liabilities until the centrally cleared swap is terminated at which time a realized gain or loss is recorded.
A CDS is an agreement between Counterparties to exchange the credit risk of an issuer. A buyer of a CDS is said to buy protection by paying a fixed payment over the life of the agreement and in some situations an upfront payment to the seller of the CDS. If a defined credit event occurs (such as payment default or bankruptcy), the Fund as a protection buyer would cease paying its fixed payment, the Fund would deliver eligible bonds issued by the reference entity to the seller, and the seller would pay the full notional value, or the “par value”, of the referenced obligation to the Fund. A seller of a CDS is said to sell protection and thus would receive a fixed payment over the life of the agreement and an upfront payment, if applicable. If a credit event occurs, the Fund as a protection seller would cease to receive the fixed payment stream, the Fund would pay the buyer “par value” or the full notional value of the referenced obligation, and the Fund would receive the eligible bonds issued by the reference entity. In turn, these bonds may be sold in order to realize a recovery value. Alternatively, the seller of the CDS and its Counterparty may agree to net the notional amount and the market value of the bonds and make a cash payment equal to the difference to the buyer of protection. If no credit event occurs, the Fund receives the fixed payment over the life of the agreement. As the seller, the Fund would effectively add leverage to its portfolio because, in addition to its total net assets, the Fund would be subject to investment exposure on the notional amount of the CDS. In connection with these agreements, cash and securities may be identified as collateral in accordance with the terms of the respective swap agreements to provide assets of value and recourse in the event of default under the swap agreement or bankruptcy/insolvency of a party to the swap agreement. If a Counterparty becomes bankrupt or otherwise fails to perform its obligations due to financial difficulties, the Fund may experience significant delays in obtaining any recovery in a bankruptcy or other reorganization proceeding. The Fund may obtain only limited recovery or may obtain no recovery in such circumstances. The Fund’s maximum risk of loss from Counterparty risk, either as the protection seller or as the protection buyer, is the value of the contract. The risk may be mitigated by having a master netting arrangement between the Fund and the Counterparty and by the designation of collateral by the Counterparty to cover the Fund’s exposure to the Counterparty.
Implied credit spreads represent the current level at which protection could be bought or sold given the terms of the existing CDS contract and serve as an indicator of the current status of the payment/performance risk of the CDS. An implied spread that has widened or increased since entry into the initial contract may indicate a deteriorating credit profile and increased risk of default for the reference entity. A declining or narrowing spread may indicate an improving credit profile or decreased risk of default for the reference entity. Alternatively, credit spreads may increase or decrease reflecting the general tolerance for risk in the credit markets.
An interest rate swap is an agreement between Counterparties pursuant to which the parties exchange a floating rate payment for a fixed rate payment based on a specified notional amount.
A total return swap is an agreement in which one party makes payments based on a set rate, either fixed or variable, while the other party makes payments based on the return of an underlying asset, which includes both the income generated and capital gains, if any. The unrealized appreciation (depreciation) on total return swaps includes dividends on the underlying securities and financing rate payable from the Counterparty. At the maturity date, a net cash flow is exchanged where the total return is equivalent to the return of the underlying reference less a financing rate, if any. As a receiver, the Fund would receive payments based on any positive total return and would owe payments in the event of a negative total return. As the payer, the Fund would owe payments on any net positive total return, and would receive payment in the event of a negative total return.
Changes in the value of centrally cleared and OTC swap agreements are recognized as unrealized gains (losses) in the Consolidated Statement of Operations by “marking to market” on a daily basis to reflect the value of the swap agreement at the end of each trading day. Payments received or paid at the beginning of the agreement are reflected as such on the Consolidated Statement of Assets and Liabilities and may be referred to as upfront payments. The Fund accrues for the fixed payment stream and amortizes upfront payments, if any, on swap agreements on a daily basis with the net amount, recorded as a component of realized gain (loss) on the Consolidated Statement of Operations. A liquidation payment received or made at the termination of a swap agreement is recorded as realized gain (loss) on the Consolidated Statement of Operations. Cash held as collateral is recorded as deposits with brokers on the Consolidated Statement of Assets and Liabilities. Entering into these agreements involves, to varying degrees, lack of liquidity and elements of credit, market, and Counterparty risk in excess of amounts recognized on the Consolidated Statement of Assets and Liabilities. Such risks involve the possibility that a swap is difficult to sell or liquidate; the Counterparty does not honor its obligations under the agreement and unfavorable interest rates and market fluctuations. It is possible that developments in the swaps market, including potential government regulation, could adversely affect the Fund’s ability to terminate existing swap agreements or to realize amounts to be received under such agreements. Additionally, an International Swaps and Derivatives Association Master Agreement (“ISDA Master Agreement”) includes credit related contingent features which allow Counterparties to OTC derivatives to terminate derivative contracts prior to maturity in the event that, for example, the Fund’s net assets decline by a stated percentage or the Fund fails to meet the terms of its ISDA master agreements, which would cause the Fund to accelerate payment of any net liability owed to the Counterparty. A short position in a security poses more risk than holding the same security long. As there is no limit on how much the price of the security can increase, the Fund’s exposure is unlimited.
Notional amounts of each individual credit default swap agreement outstanding as of October 31, 2022, if any, for which the Fund is the seller of protection are disclosed in the open swap agreements table. These potential amounts would be partially offset by any recovery values of the respective referenced obligations, upfront payments received upon entering into the agreement, or net amounts received from the settlement of buy protection credit default swap agreements entered into by the Fund for the same referenced entity or entities.
24 Invesco Global Allocation Fund
| P. | Leverage Risk – Leverage exists when the Fund can lose more than it originally invests because it purchases or sells an instrument or enters into a transaction without investing an amount equal to the full economic exposure of the instrument or transaction. |
| Q. | Collateral – To the extent the Fund has designated or segregated a security as collateral and that security is subsequently sold, it is the Fund’s practice to replace such collateral no later than the next business day. |
| R. | Other Risks – During the period, the Fund experienced a low interest rate environment created in part by the Federal Reserve Board (FRB) and certain foreign central banks keeping the federal funds and equivalent foreign rates near historical lows. Increases in the federal funds and equivalent foreign rates may expose fixed income markets to heightened volatility and reduced liquidity for certain fixed income investments, particularly those with longer maturities. In addition, decreases in fixed income dealer market-making capacity may also potentially lead to heightened volatility and reduced liquidity in the fixed income markets. As a result, the value of the Fund’s investments and share price may decline. Changes in central bank policies could also result in higher than normal shareholder redemptions, which could potentially increase portfolio turnover and the Fund’s transaction costs. |
Policy changes by the U.S. government or its regulatory agencies and political events within the U.S. and abroad may, among other things, affect investor and consumer confidence and increase volatility in the financial markets, perhaps suddenly and to a significant degree, which may adversely impact the Fund’s operations, universe of potential investment options, and return potential.
Emerging markets (also referred to as developing markets) are generally subject to greater market volatility, political, social and economic instability, uncertainty regarding the existence of trading markets and more governmental limitations on foreign investment than more developed markets. In addition, companies operating in emerging markets may be subject to lower trading volume and greater price fluctuations than companies in more developed markets. Securities law in many emerging market countries is relatively new and unsettled. Therefore, laws regarding foreign investment in emerging market securities, securities regulation, title to securities, and shareholder rights may change quickly and unpredictably. In addition, the enforcement of systems of taxation at federal, regional and local levels in emerging market countries may be inconsistent, and subject to sudden change. Other risks of investing in emerging markets securities may include additional transaction costs, delays in settlement procedures, and lack of timely information.
Active trading of portfolio securities may result in added expenses, a lower return and increased tax liability.
| S. | COVID-19 Risk - The COVID-19 strain of coronavirus has resulted in instances of market closures and dislocations, extreme volatility, liquidity constraints and increased trading costs. Efforts to contain its spread have resulted in travel restrictions, disruptions of healthcare systems, business operations (including business closures) and supply chains, layoffs, lower consumer demand and employee availability, and defaults and credit downgrades, among other significant economic impacts that have disrupted global economic activity across many industries. Such economic impacts may exacerbate other pre-existing political, social and economic risks locally or globally and cause general concern and uncertainty. The full economic impact and ongoing effects of COVID-19 (or other future epidemics or pandemics) at the macro-level and on individual businesses are unpredictable and may result in significant and prolonged effects on the Fund’s performance. |
NOTE 2–Advisory Fees and Other Fees Paid to Affiliates
The Trust has entered into a master investment advisory agreement with the Adviser. Under the terms of the investment advisory agreement, the Fund accrues daily and pays monthly an advisory fee to the Adviser less the amount paid by the Subsidiary to the Adviser based on the annual rate of the Fund’s average daily net assets as follows:
| | | | |
| Average Daily Net Assets | | Rate* | |
| |
Up to $1.0 billion | | | 0.800% | |
| |
Next $2 billion | | | 0.760% | |
| |
Next $1 billion | | | 0.710% | |
| |
Next $1 billion | | | 0.660% | |
| |
Next $1 billion | | | 0.600% | |
| |
Next $1 billion | | | 0.550% | |
| �� |
Next $2 billion | | | 0.500% | |
| |
Over $9 billion | | | 0.480% | |
| |
| * | The advisory fee paid by the Fund shall be reduced by any amounts paid by the Fund under the administrative services agreement with the Adviser. |
For the year ended October 31, 2022, the effective advisory fee rate incurred by the Fund was 0.78%.
The Subsidiary has entered into a separate contract with the Adviser whereby the Adviser provides investment advisory and other services to the Subsidiary. In consideration of these services, the Subsidiary pays an advisory fee to the Adviser based on the annual rate of the Subsidiary’s average daily net assets as set forth in the table above.
Under the terms of a master sub-advisory agreement between the Adviser and each of Invesco Asset Management Deutschland GmbH, Invesco Asset Management Limited, Invesco Asset Management (Japan) Limited, Invesco Hong Kong Limited, Invesco Senior Secured Management, Inc. and Invesco Canada Ltd. and separate sub-advisory agreements with Invesco Capital Management LLC and Invesco Asset Management (India) Private Limited (collectively, the “Affiliated Sub-Advisers”) the Adviser, not the Fund, will pay 40% of the fees paid to the Adviser to any such Affiliated Sub-Adviser(s) that provide(s) discretionary investment management services to the Fund based on the percentage of assets allocated to such Affiliated Sub-Adviser(s). Invesco has also entered into a sub-advisory agreement with OppenheimerFunds, Inc. to provide discretionary management services to the Fund.
The Adviser has contractually agreed, through at least June 30, 2023, to waive advisory fees and/or reimburse expenses of all shares to the extent necessary to limit total annual fund operating expenses after fee waiver and/or expense reimbursement (excluding certain items discussed below) of Class A, Class C, Class R, Class Y, Class R5 and Class R6 shares to 2.25%, 3.00%, 2.50%, 2.00%, 2.00%, and 2.00%, respectively, of the Fund’s average daily net assets (the “expense limits”). In determining the Adviser’s obligation to waive advisory fees and/or reimburse expenses, the following expenses are not taken into account, and could cause the total annual fund operating expenses after fee waiver and/or expense reimbursement to exceed the numbers reflected above: (1) interest; (2) taxes; (3) dividend expense on short sales; (4) extraordinary or non-routine items, including litigation expenses; and (5) expenses that the Fund has incurred but did not actually pay because of an expense offset arrangement. Acquired Fund Fees and Expenses are not operating expenses of the Fund directly, but are fees and expenses, including management fees of the investment companies in which the Fund invests. As a result, the total annual fund operating expenses after expense reimbursement may exceed the expense limits above. Unless Invesco continues the fee waiver agreement, it will terminate on June 30, 2023. During its term, the fee waiver agreement cannot be terminated or amended to increase the expense limits or reduce the advisory fee waiver without approval of the Board of Trustees. The Adviser did not waive fees and/or reimburse expenses during the period under these expense limits.
Further, the Adviser has contractually agreed, through at least June 30, 2024, to waive the advisory fee payable by the Fund in an amount equal to 100% of the net advisory fees the Adviser receives from the affiliated money market funds on investments by the Fund of uninvested cash (excluding investments of cash collateral from securities lending) in such affiliated money market funds.
For the year ended October 31, 2022, the Adviser waived advisory fees of $920,724.
25 Invesco Global Allocation Fund
The Trust has entered into a master administrative services agreement with Invesco pursuant to which the Fund has agreed to pay Invesco for certain administrative costs incurred in providing accounting services to the Fund. For the year ended October 31, 2022, expenses incurred under the agreement are shown in the Consolidated Statement of Operations as Administrative services fees. Invesco has entered into a sub-administration agreement whereby State Street Bank and Trust Company (“SSB”) serves as fund accountant and provides certain administrative services to the Fund. Pursuant to a custody agreement with the Trust on behalf of the Fund, SSB also serves as the Fund’s custodian.
The Trust has entered into a transfer agency and service agreement with Invesco Investment Services, Inc. (“IIS”) pursuant to which the Fund has agreed to pay IIS a fee for providing transfer agency and shareholder services to the Fund and reimburse IIS for certain expenses incurred by IIS in the course of providing such services. IIS may make payments to intermediaries that provide omnibus account services, sub-accounting services and/or networking services. All fees payable by IIS to intermediaries that provide omnibus account services or sub-accounting services are charged back to the Fund, subject to certain limitations approved by the Trust’s Board of Trustees. For the year ended October 31, 2022, expenses incurred under the agreement are shown in the Consolidated Statement of Operations as Transfer agent fees.
The Trust has entered into master distribution agreements with Invesco Distributors, Inc. (“IDI”) to serve as the distributor for the Class A, Class C, Class R, Class Y, Class R5 and Class R6 shares of the Fund. The Trust has adopted plans pursuant to Rule 12b-1 under the 1940 Act with respect to the Fund’s Class A, Class C and Class R shares (collectively, the “Plans”). The Fund, pursuant to the Plans, pays IDI compensation at the annual rate of 0.25% of the Fund’s average daily net assets of Class A shares, 1.00% of the average daily net assets of Class C shares and 0.50% of the average daily net assets of Class R shares. The fees are accrued daily and paid monthly. Of the Plan payments, up to 0.25% of the average daily net assets of each class of shares may be paid to furnish continuing personal shareholder services to customers who purchase and own shares of such classes. Any amounts not paid as a service fee under the Plans would constitute an asset-based sales charge. Rules of the Financial Industry Regulatory Authority (“FINRA”) impose a cap on the total sales charges, including asset-based sales charges, that may be paid by any class of shares of the Fund. For the year ended October 31, 2022, expenses incurred under the Plans are shown in the Consolidated Statement of Operations as Distribution fees.
Front-end sales commissions and CDSC (collectively, the “sales charges”) are not recorded as expenses of the Fund. Front-end sales commissions are deducted from proceeds from the sales of Fund shares prior to investment in Class A shares of the Fund. CDSC are deducted from redemption proceeds prior to remittance to the shareholder. During the year ended October 31, 2022, IDI advised the Fund that IDI retained $75,148 in front-end sales commissions from the sale of Class A shares and $1,012 and $2,194 from Class A and Class C shares, respectively, for CDSC imposed upon redemptions by shareholders.
Certain officers and trustees of the Trust are officers and directors of the Adviser, IIS and/or IDI.
NOTE 3–Additional Valuation Information
GAAP defines fair value as the price that would be received to sell an asset or paid to transfer a liability in an orderly transaction between market participants at the measurement date, under current market conditions. GAAP establishes a hierarchy that prioritizes the inputs to valuation methods, giving the highest priority to readily available unadjusted quoted prices in an active market for identical assets (Level 1) and the lowest priority to significant unobservable inputs (Level 3), generally when market prices are not readily available. Based on the valuation inputs, the securities or other investments are tiered into one of three levels. Changes in valuation methods may result in transfers in or out of an investment’s assigned level:
| | | | |
| Level 1 - | | Prices are determined using quoted prices in an active market for identical assets. |
| Level 2 - | | Prices are determined using other significant observable inputs. Observable inputs are inputs that other market participants may use in pricing a security. These may include quoted prices for similar securities, interest rates, prepayment speeds, credit risk, yield curves, loss severities, default rates, discount rates, volatilities and others. |
| Level 3 - | | Prices are determined using significant unobservable inputs. In situations where quoted prices or observable inputs are unavailable (for example, when there is little or no market activity for an investment at the end of the period), unobservable inputs may be used. Unobservable inputs reflect the Adviser’s assumptions about the factors market participants would use in determining fair value of the securities or instruments and would be based on the best available information. |
The following is a summary of the tiered valuation input levels, as of October 31, 2022. The level assigned to the securities valuations may not be an indication of the risk or liquidity associated with investing in those securities. Because of the inherent uncertainties of valuation, the values reflected in the consolidated financial statements may materially differ from the value received upon actual sale of those investments.
| | | | | | | | | | | | | | | | |
| | | Level 1 | | | Level 2 | | | Level 3 | | | Total | |
| |
Investments in Securities | | | | | | | | | | | | | | | | |
| |
Exchange-Traded Funds | | $ | 514,819,288 | | | $ | – | | | $ | – | | | $ | 514,819,288 | |
| |
Common Stocks & Other Equity Interests | | | 131,877,663 | | | | 135,468,359 | | | | 0 | | | | 267,346,022 | |
| |
U.S. Treasury Securities | | | – | | | | 211,112,537 | | | | – | | | | 211,112,537 | |
| |
Preferred Stocks | | | – | | | | – | | | | 1,446,233 | | | | 1,446,233 | |
| |
Event-Linked Bonds | | | – | | | | – | | | | 1,358,062 | | | | 1,358,062 | |
| |
Money Market Funds | | | 15,054,985 | | | | 14,443,556 | | | | – | | | | 29,498,541 | |
| |
Total Investments in Securities | | | 661,751,936 | | | | 361,024,452 | | | | 2,804,295 | | | | 1,025,580,683 | |
| |
| | | | |
Other Investments - Assets* | | | | | | | | | | | | | | | | |
| |
| | | | |
Futures Contracts | | | 9,288,050 | | | | – | | | | – | | | | 9,288,050 | |
| |
Forward Foreign Currency Contracts | | | – | | | | 9,643,678 | | | | – | | | | 9,643,678 | |
| |
Swap Agreements | | | – | | | | 11,345,610 | | | | – | | | | 11,345,610 | |
| |
| | | 9,288,050 | | | | 20,989,288 | | | | – | | | | 30,277,338 | |
| |
| | | | | | | | | | | | | |
26 Invesco Global Allocation Fund
| | | | | | | | | | | | | | | | |
| | | Level 1 | | | Level 2 | | | Level 3 | | | Total | |
| |
Other Investments - Liabilities* | | | | | | | | | | | | | | | | |
| |
Futures Contracts | | $ | (7,874,167 | ) | | $ | – | | | $ | – | | | $ | (7,874,167 | ) |
| |
Forward Foreign Currency Contracts | | | – | | | | (5,962,269 | ) | | | – | | | | (5,962,269 | ) |
| |
Swap Agreements | | | – | | | | (11,417,756 | ) | | | – | | | | (11,417,756 | ) |
| |
| | | (7,874,167 | ) | | | (17,380,025 | ) | | | – | | | | (25,254,192 | ) |
| |
Total Other Investments | | | 1,413,883 | | | | 3,609,263 | | | | – | | | | 5,023,146 | |
| |
Total Investments | | $ | 663,165,819 | | | $ | 364,633,715 | | | $ | 2,804,295 | | | $ | 1,030,603,829 | |
| |
| * | Forward foreign currency contracts, futures contracts and swap agreements are valued at unrealized appreciation (depreciation). |
NOTE 4–Derivative Investments
The Fund may enter into an ISDA Master Agreement under which a fund may trade OTC derivatives. An OTC transaction entered into under an ISDA Master Agreement typically involves a collateral posting arrangement, payment netting provisions and close-out netting provisions. These netting provisions allow for reduction of credit risk through netting of contractual obligations. The enforceability of the netting provisions of the ISDA Master Agreement depends on the governing law of the ISDA Master Agreement, among other factors.
For financial reporting purposes, the Fund does not offset OTC derivative assets or liabilities that are subject to ISDA Master Agreements in the Consolidated Statement of Assets and Liabilities.
Value of Derivative Investments at Period-End
The table below summarizes the value of the Fund’s derivative investments, detailed by primary risk exposure, held as of October 31, 2022:
| | | | | | | | | | |
| | | Value | |
| | | | |
| Derivative Assets | | Currency
Risk | | | Equity
Risk | | Total | |
| |
Unrealized appreciation on futures contracts–Exchange-Traded(a) | | $ | – | | | $ 9,288,050 | | $ | 9,288,050 | |
| |
Unrealized appreciation on forward foreign currency contracts outstanding | | | 9,643,678 | | | – | | | 9,643,678 | |
| |
Unrealized appreciation on swap agreements – OTC | | | – | | | 11,345,610 | | | 11,345,610 | |
| |
Total Derivative Assets | | | 9,643,678 | | | 20,633,660 | | | 30,277,338 | |
| |
Derivatives not subject to master netting agreements | | | – | | | (9,288,050) | | | (9,288,050 | ) |
| |
Total Derivative Assets subject to master netting agreements | | $ | 9,643,678 | | | $ 11,345,610 | | $ | 20,989,288 | |
| |
| |
| | | Value | |
| | | | |
| Derivative Liabilities | | Currency
Risk | | | Equity
Risk | | Total | |
| |
Unrealized depreciation on futures contracts –Exchange-Traded(a) | | $ | – | | | $ (7,874,167) | | $ | (7,874,167 | ) |
| |
Unrealized depreciation on forward foreign currency contracts outstanding | | | (5,962,269 | ) | | – | | | (5,962,269 | ) |
| |
Unrealized depreciation on swap agreements – OTC | | | – | | | (11,417,756) | | | (11,417,756 | ) |
| |
Total Derivative Liabilities | | | (5,962,269 | ) | | (19,291,923) | | | (25,254,192 | ) |
| |
Derivatives not subject to master netting agreements | | | – | | | 7,874,167 | | | 7,874,167 | |
| |
Total Derivative Liabilities subject to master netting agreements | | $ | (5,962,269 | ) | | $(11,417,756) | | $ | (17,380,025 | ) |
| |
| (a) | The daily variation margin receivable (payable) at period-end is recorded in the Consolidated Statement of Assets and Liabilities. |
27 Invesco Global Allocation Fund
Offsetting Assets and Liabilities
The table below reflects the Fund’s exposure to Counterparties subject to either an ISDA Master Agreement or other agreement for OTC derivative transactions as of October 31, 2022.
| | | | | | | | | | | | | | | | | | | | | | | | | | | | | | | | | | | | | | | | |
| | | Financial Derivative Assets | | | Financial Derivative Liabilities | | | | | | Collateral
(Received)/Pledged | | | | |
| Counterparty | | Forward
Foreign
Currency
Contracts | | | Swap
Agreements | | | Total
Assets | | | Forward
Foreign
Currency
Contracts | | | Swap
Agreements | | | Total
Liabilities | | | Net Value of
Derivatives | | | Non-Cash | | | Cash | | | Net
Amount | |
| |
Bank of America, N.A. | | $ | 1,868,864 | | | $ | – | | | $ | 1,868,864 | | | $ | (1,697,763 | ) | | $ | – | | | $ | (1,697,763 | ) | | $ | 171,101 | | | $ | – | | | $ | (171,101 | ) | | $ | – | |
| |
Barclays Bank PLC | | | – | | | | – | | | | – | | | | (38,550 | ) | | | – | | | | (38,550 | ) | | | (38,550 | ) | | | – | | | | – | | | | (38,550 | ) |
| |
Citibank, N.A. | | | 1,017,460 | | | | – | | | | 1,017,460 | | | | (127,875 | ) | | | – | | | | (127,875 | ) | | | 889,585 | | | | – | | | | (820,000 | ) | | | 69,585 | |
| |
Deutsche Bank AG | | | 558,899 | | | | – | | | | 558,899 | | | | (185,314 | ) | | | – | | | | (185,314 | ) | | | 373,585 | | | | (259,820 | ) | | | – | | | | 113,765 | |
| |
Goldman Sachs International | | | 334,886 | | | | 12,019,218 | | | | 12,354,104 | | | | (1,407,832 | ) | | | (9,555,934 | ) | | | (10,963,766 | ) | | | 1,390,338 | | | | – | | | | (1,390,338 | ) | | | – | |
| |
J.P. Morgan Chase Bank, N.A. | | | 3,214,941 | | | | – | | | | 3,214,941 | | | | (1,786,515 | ) | | | (2,597,843 | ) | | | (4,384,358 | ) | | | (1,169,417 | ) | | | – | | | | 1,169,417 | | | | – | |
| |
Morgan Stanley and Co. International PLC | | | 2,630,880 | | | | – | | | | 2,630,880 | | | | (718,420 | ) | | | – | | | | (718,420 | ) | | | 1,912,460 | | | | – | | | | – | | | | 1,912,460 | |
| |
UBS AG | | | 17,748 | | | | – | | | | 17,748 | | | | – | | | | – | | | | – | | | | 17,748 | | | | – | | | | – | | | | 17,748 | |
| |
Total | | $ | 9,643,678 | | | $ | 12,019,218 | | | $ | 21,662,896 | | | $ | (5,962,269 | ) | | $ | (12,153,777 | ) | | $ | (18,116,046 | ) | | $ | 3,546,850 | | | $ | (259,820 | ) | | $ | (1,212,022 | ) | | $ | 2,075,008 | |
| |
Effect of Derivative Investments for the year ended October 31, 2022
The table below summarizes the gains (losses) on derivative investments, detailed by primary risk exposure, recognized in earnings during the period:
| | | | | | | | | | | | | | | | | | | | |
| | | Location of Gain (Loss) on
Consolidated Statement of Operations | |
| | | Commodity
Risk | | | Currency
Risk | | | Equity Risk | | | Interest
Rate Risk | | | Total | |
| |
Realized Gain (Loss): | | | | | | | | | | | | | | | | | | | | |
Forward foreign currency contracts | | $ | – | | | $ | 16,955,160 | | | $ | – | | | $ | – | | | $ | 16,955,160 | |
| |
Futures contracts | | | 7,963,192 | | | | – | | | | (3,069,825 | ) | | | (4,526,622 | ) | | | 366,745 | |
| |
Swap agreements | | | – | | | | – | | | | 41,637,849 | | | | – | | | | 41,637,849 | |
| |
Change in Net Unrealized Appreciation (Depreciation): | | | | | | | | | | | | | | | | | | | | |
Forward foreign currency contracts | | | – | | | | 1,324,932 | | | | – | | | | – | | | | 1,324,932 | |
| |
Futures contracts | | | – | | | | – | | | | (3,572,551 | ) | | | – | | | | (3,572,551 | ) |
| |
Swap agreements | | | – | | | | – | | | | (294,995 | ) | | | – | | | | (294,995 | ) |
| |
Total | | $ | 7,963,192 | | | $ | 18,280,092 | | | $ | 34,700,478 | | | $ | (4,526,622 | ) | | $ | 56,417,140 | |
| |
The table below summarizes the average notional value of derivatives held during the period.
| | | | | | | | | | | | |
| | | Forward
Foreign Currency
Contracts | | | Futures
Contracts | | | Swap
Agreements | |
| |
Average notional value | | | $686,391,357 | | | $ | 448,442,561 | | | $ | 474,189,081 | |
| |
NOTE 5–Expense Offset Arrangement(s)
The expense offset arrangement is comprised of transfer agency credits which result from balances in demand deposit accounts used by the transfer agent for clearing shareholder transactions. For the year ended October 31, 2022, the Fund received credits from this arrangement, which resulted in the reduction of the Fund’s total expenses of $11,366.
NOTE 6–Trustees’ and Officers’ Fees and Benefits
Trustees’ and Officers’ Fees and Benefits include amounts accrued by the Fund to pay remuneration to certain Trustees and Officers of the Fund. Trustees have the option to defer compensation payable by the Fund, and Trustees’ and Officers’ Fees and Benefits also include amounts accrued by the Fund to fund such deferred compensation amounts. Those Trustees who defer compensation have the option to select various Invesco Funds in which their deferral accounts shall be deemed to be invested. Obligations under the deferred compensation plan represent unsecured claims against the general assets of the Fund.
NOTE 7–Cash Balances
The Fund is permitted to temporarily carry a negative or overdrawn balance in its account with SSB, the custodian bank. Such balances, if any at period-end, are shown in the Consolidated Statement of Assets and Liabilities under the payable caption Amount due custodian. To compensate the custodian bank for such overdrafts, the overdrawn Fund may either (1) leave funds as a compensating balance in the account so the custodian bank can be compensated by earning the additional interest; or (2) compensate by paying the custodian bank at a rate agreed upon by the custodian bank and Invesco, not to exceed the contractually agreed upon rate. The Fund
28 Invesco Global Allocation Fund
may not purchase additional securities when any borrowings from banks or broker-dealers exceed 5% of the Fund’s total assets, or when any borrowings from an Invesco Fund are outstanding.
NOTE 8–Distributions to Shareholders and Tax Components of Net Assets
Tax Character of Distributions to Shareholders Paid During the Fiscal Years Ended October 31, 2022 and 2021:
| | | | | | | | |
| | | 2022 | | | 2021 | |
| |
Ordinary income* | | $ | 42,824,477 | | | $ | – | |
| |
Long-term capital gain | | | 133,158,441 | | | | – | |
| |
Total distributions | | $ | 175,982,918 | | | $ | – | |
| |
| * | Includes short-term capital gain distributions, if any. |
Tax Components of Net Assets at Period-End:
| | | | | | | | |
| | | | | | 2022 | |
| |
Undistributed ordinary income | | | | | | $ | 57,048,508 | |
| |
Net unrealized appreciation (depreciation) – investments | | | | | | | (39,793,875 | ) |
| |
Net unrealized appreciation – foreign currencies | | | | | | | 4,682,907 | |
| |
Temporary book/tax differences | | | | | | | (362,472 | ) |
| |
Capital loss carryforward | | | | | | | (48,092,161 | ) |
| |
Shares of beneficial interest | | | | | | | 1,056,153,239 | |
| |
Total net assets | | | | | | $ | 1,029,636,146 | |
| |
The difference between book-basis and tax-basis unrealized appreciation (depreciation) is due to differences in the timing of recognition of gains and losses on investments for tax and book purposes. The Fund’s net unrealized appreciation (depreciation) difference is attributable primarily to wash sales, derivative instruments and partnerships .
The temporary book/tax differences are a result of timing differences between book and tax recognition of income and/or expenses. The Fund’s temporary book/tax differences are the result of the trustee deferral of compensation and retirement plan benefits.
Capital loss carryforward is calculated and reported as of a specific date. Results of transactions and other activity after that date may affect the amount of capital loss carryforward actually available for the Fund to utilize. The ability to utilize capital loss carryforward in the future may be limited under the Internal Revenue Code and related regulations based on the results of future transactions.
The Fund has a capital loss carryforward as of October 31, 2022, as follows:
| | | | | | | | | | |
Capital Loss Carryforward* |
|
| Expiration | | | | | Short-Term | | Long-Term | | Total |
|
Not subject to expiration | | | | | | $48,092,160 | | $1 | | $48,092,161 |
|
| * | Capital loss carryforward is reduced for limitations, if any, to the extent required by the Internal Revenue Code and may be further limited depending upon a variety of factors, including the realization of net unrealized gains or losses as of the date of any reorganization. |
NOTE 9–Investment Transactions
The aggregate amount of investment securities (other than short-term securities, U.S. Government obligations and money market funds, if any) purchased and sold by the Fund during the year ended October 31, 2022 was $699,094,172 and $789,579,183, respectively. Cost of investments, including any derivatives, on a tax basis includes the adjustments for financial reporting purposes as of the most recently completed federal income tax reporting period-end.
| | | | |
| Unrealized Appreciation (Depreciation) of Investments on a Tax Basis | | | |
| |
Aggregate unrealized appreciation of investments | | $ | 136,761,624 | |
| |
Aggregate unrealized (depreciation) of investments | | | (176,555,499 | ) |
| |
Net unrealized appreciation (depreciation) of investments | | $ | (39,793,875 | ) |
| |
Cost of investments for tax purposes is $1,070,397,704.
NOTE 10–Reclassification of Permanent Differences
Primarily as a result of differing book/tax treatment of partnerships, income from the Subsidiary and derivative instruments , on October 31, 2022, undistributed net investment income was increased by $43,946,223, undistributed net realized gain (loss) was decreased by $46,626,227 and shares of beneficial interest was increased by $2,680,004. This reclassification had no effect on the net assets of the Fund.
29 Invesco Global Allocation Fund
NOTE 11–Share Information
| | | | | | | | | | | | | | | | |
| | | | | | Summary of Share Activity | | | | |
| |
| | | Year ended
October 31, 2022(a) | | | Year ended
October 31, 2021 | |
| | | Shares | | | Amount | | | Shares | | | Amount | |
| |
Sold: | | | | | | | | | | | | | | | | |
Class A | | | 1,861,609 | | | $ | 35,693,983 | | | | 2,179,768 | | | $ | 49,521,742 | |
| |
Class C | | | 361,281 | | | | 6,556,324 | | | | 459,086 | | | | 9,717,253 | |
| |
Class R | | | 245,339 | | | | 4,601,243 | | | | 239,230 | | | | 5,261,967 | |
| |
Class Y | | | 445,783 | | | | 8,682,723 | | | | 819,850 | | | | 18,382,390 | |
| |
Class R5 | | | 69 | | | | 1,288 | | | | 65 | | | | 1,512 | |
| |
Class R6 | | | 299,431 | | | | 5,529,328 | | | | 310,992 | | | | 7,083,716 | |
| |
| | | | |
Issued as reinvestment of dividends: | | | | | | | | | | | | | | | | |
Class A | | | 6,786,388 | | | | 139,326,608 | | | | - | | | | - | |
| |
Class C | | | 466,344 | | | | 8,926,958 | | | | - | | | | - | |
| |
Class R | | | 253,570 | | | | 5,052,342 | | | | - | | | | - | |
| |
Class Y | | | 361,963 | | | | 7,459,544 | | | | - | | | | - | |
| |
Class R5 | | | 10 | | | | 217 | | | | - | | | | - | |
| |
Class R6 | | | 277,815 | | | | 5,733,961 | | | | - | | | | - | |
| |
| | | | |
Automatic conversion of Class C shares to Class A shares: | | | | | | | | | | | | | | | | |
Class A | | | 268,532 | | | | 5,035,795 | | | | 723,752 | | | | 15,875,139 | |
| |
Class C | | | (288,672 | ) | | | (5,035,795 | ) | | | (770,334 | ) | | | (15,875,139 | ) |
| |
| | | | |
Reacquired: | | | | | | | | | | | | | | | | |
Class A | | | (6,855,559 | ) | | | (130,340,578 | ) | | | (6,883,565 | ) | | | (155,141,759 | ) |
| |
Class C | | | (615,204 | ) | | | (10,918,591 | ) | | | (824,490 | ) | | | (17,407,001 | ) |
| |
Class R | | | (311,209 | ) | | | (5,726,972 | ) | | | (379,687 | ) | | | (8,277,705 | ) |
| |
Class Y | | | (888,313 | ) | | | (16,861,576 | ) | | | (1,266,104 | ) | | | (28,193,788 | ) |
| |
Class R5 | | | (56 | ) | | | (1,021 | ) | | | (1 | ) | | | (20 | ) |
| |
Class R6 | | | (311,642 | ) | | | (5,840,184 | ) | | | (348,675 | ) | | | (7,936,929 | ) |
| |
Net increase (decrease) in share activity | | | 2,357,479 | | | $ | 57,875,597 | | | | (5,740,113 | ) | | $ | (126,988,622 | ) |
| |
| (a) | There are entities that are record owners of more than 5% of the outstanding shares of the Fund and in the aggregate own 12% of the outstanding shares of the Fund. IDI has an agreement with these entities to sell Fund shares. The Fund, Invesco and/or Invesco affiliates may make payments to these entities, which are considered to be related to the Fund, for providing services to the Fund, Invesco and/or Invesco affiliates including but not limited to services such as securities brokerage, distribution, third party record keeping and account servicing. The Fund has no knowledge as to whether all or any portion of the shares owned of record by these entities are also owned beneficially. |
30 Invesco Global Allocation Fund
Report of Independent Registered Public Accounting Firm
To the Board of Trustees of AIM Investment Funds (Invesco Investment Funds) and Shareholders of Invesco Global Allocation Fund
Opinion on the Consolidated Financial Statements
We have audited the accompanying consolidated statement of assets and liabilities, including the consolidated schedule of investments, of Invesco Global Allocation Fund and its subsidiary (one of the funds constituting AIM Investment Funds (Invesco Investment Funds), referred to hereafter as the “Fund”) as of October 31, 2022, the related consolidated statement of operations for the year ended October 31, 2022, the consolidated statement of changes in net assets for each of the two years in the period ended October 31, 2022, including the related notes, and the consolidated financial highlights for each of the periods indicated in the table below (collectively referred to as the “consolidated financial statements”). In our opinion, the consolidated financial statements present fairly, in all material respects, the financial position of the Fund as of October 31, 2022, the results of its operations for the year then ended, the changes in its net assets for each of the two years in the period ended October 31, 2022 and the financial highlights for each of the periods indicated in the table below, in conformity with accounting principles generally accepted in the United States of America.
|
| |
| Consolidated Financial Highlights |
| |
For each of the four years in the period ended October 31, 2022 for Class A, Class C, Class R, Class Y and Class R6. For each of the three years in the period ended October 31, 2022 and the period May 24, 2019 (commencement of operations) through October 31, 2019 for Class R5. |
The consolidated financial statements of Oppenheimer Global Allocation Fund (subsequently renamed Invesco Global Allocation Fund) as of and for the year ended October 31, 2018 and the consolidated financial highlights for the year then ended (not presented herein, other than the consolidated financial highlights) were audited by other auditors whose report dated December 21, 2018 expressed an unqualified opinion on those consolidated financial statements and consolidated financial highlights.
Basis for Opinion
These consolidated financial statements are the responsibility of the Fund’s management. Our responsibility is to express an opinion on the Fund’s consolidated financial statements based on our audits. We are a public accounting firm registered with the Public Company Accounting Oversight Board (United States) (PCAOB) and are required to be independent with respect to the Fund in accordance with the U.S. federal securities laws and the applicable rules and regulations of the Securities and Exchange Commission and the PCAOB.
We conducted our audits of these consolidated financial statements in accordance with the standards of the PCAOB. Those standards require that we plan and perform the audit to obtain reasonable assurance about whether the consolidated financial statements are free of material misstatement, whether due to error or fraud.
Our audits included performing procedures to assess the risks of material misstatement of the consolidated financial statements, whether due to error or fraud, and performing procedures that respond to those risks. Such procedures included examining, on a test basis, evidence regarding the amounts and disclosures in the consolidated financial statements. Our audits also included evaluating the accounting principles used and significant estimates made by management, as well as evaluating the overall presentation of the consolidated financial statements. Our procedures included confirmation of securities owned as of October 31, 2022 by correspondence with the custodian, transfer agent, brokers and insurance companies; when replies were not received from brokers or insurance companies, we performed other auditing procedures. We believe that our audits provide a reasonable basis for our opinion.
/s/PricewaterhouseCoopers LLP
Houston, Texas
December 23, 2022
We have served as the auditor of one or more of the investment companies in the Invesco group of investment companies since at least 1995. We have not been able to determine the specific year we began serving as auditor.
31 Invesco Global Allocation Fund
Calculating your ongoing Fund expenses
Example
As a shareholder of the Fund, you incur two types of costs: (1) transaction costs, which may include sales charges (loads) on purchase payments or contingent deferred sales charges on redemptions, if any; and (2) ongoing costs, including management fees, distribution and/or service (12b-1) fees, and other Fund expenses. This example is intended to help you understand your ongoing costs (in dollars) of investing in the Fund and to compare these costs with ongoing costs of investing in other mutual funds. The example is based on an investment of $1,000 invested at the beginning of the period and held for the entire period May 1, 2022 through October 31, 2022.
Actual expenses
The table below provides information about actual account values and actual expenses. You may use the information in this table, together with the amount you invested, to estimate the expenses that you paid over the period. Simply divide your account value by $1,000 (for example, an $8,600 account value divided by $1,000 = 8.6), then multiply the result by the number in the table under the heading entitled “Actual Expenses Paid During Period” to estimate the expenses you paid on your account during this period.
Hypothetical example for comparison purposes
The table below also provides information about hypothetical account values and hypothetical expenses based on the Fund’s actual expense ratio and an assumed rate of return of 5% per year before expenses, which is not the Fund’s actual return.
The hypothetical account values and expenses may not be used to estimate the actual ending account balance or expenses you paid for the period. You may use this information to compare the ongoing costs of investing in the Fund and other funds. To do so, compare this 5% hypothetical example with the 5% hypothetical examples that appear in the shareholder reports of the other funds.
Please note that the expenses shown in the table are meant to highlight your ongoing costs only and do not reflect any transaction costs, such as sales charges (loads) on purchase payments or contingent deferred sales charges on redemptions, if any. Therefore, the hypothetical information is useful in comparing ongoing costs only, and will not help you determine the relative total costs of owning different funds. In addition, if these transaction costs were included, your costs would have been higher.
| | | | | | | | | | | | |
| | | Beginning
Account Value
(05/01/22) | | ACTUAL | | HYPOTHETICAL
(5% annual return before
expenses) | | Annualized
Expense
Ratio |
| | | Ending
Account Value
(10/31/22)1 | | Expenses
Paid During
Period2 | | Ending
Account Value
(10/31/22) | | Expenses
Paid During
Period2 |
Class A | | $1,000.00 | | $914.40 | | $5.65 | | $1,019.31 | | $5.96 | | 1.17% |
Class C | | 1,000.00 | | 910.90 | | 9.25 | | 1,015.53 | | 9.75 | | 1.92 |
Class R | | 1,000.00 | | 912.90 | | 6.85 | | 1,018.05 | | 7.22 | | 1.42 |
Class Y | | 1,000.00 | | 915.30 | | 4.44 | | 1,020.57 | | 4.69 | | 0.92 |
Class R5 | | 1,000.00 | | 916.20 | | 3.77 | | 1,021.27 | | 3.97 | | 0.78 |
Class R6 | | 1,000.00 | | 916.10 | | 3.77 | | 1,021.27 | | 3.97 | | 0.78 |
| 1 | The actual ending account value is based on the actual total return of the Fund for the period May 1, 2022 through October 31, 2022, after actual expenses and will differ from the hypothetical ending account value which is based on the Fund’s expense ratio and a hypothetical annual return of 5% before expenses. |
| 2 | Expenses are equal to the Fund’s annualized expense ratio as indicated above multiplied by the average account value over the period, multiplied by 184/365 to reflect the most recent fiscal half year. |
32 Invesco Global Allocation Fund
Approval of Investment Advisory and Sub-Advisory Contracts
At meetings held on June 13, 2022, the Board of Trustees (the Board or the Trustees) of AIM Investment Funds (Invesco Investment Funds) as a whole, and the independent Trustees, who comprise over 75% of the Board, voting separately, approved the continuance of the Invesco Global Allocation Fund’s (the Fund) Master Investment Advisory Agreement with Invesco Advisers, Inc. (Invesco Advisers and the investment advisory agreement) and the Master Intergroup Sub-Advisory Contract for Mutual Funds with Invesco Asset Management Deutschland GmbH, Invesco Asset Management Limited, Invesco Asset Management (Japan) Limited, Invesco Hong Kong Limited, Invesco Senior Secured Management, Inc. and Invesco Canada Ltd. and separate sub-advisory contracts with Invesco Capital Management LLC, Invesco Asset Management (India) Private Limited and OppenheimerFunds, Inc. (collectively, the Affiliated Sub-Advisers and the sub-advisory contracts) for another year, effective July 1, 2022. After evaluating the factors discussed below, among others, the Board approved the renewal of the Fund’s investment advisory agreement and the sub-advisory contracts and determined that the compensation payable thereunder by the Fund to Invesco Advisers and by Invesco Advisers to the Affiliated Sub-Advisers is fair and reasonable.
The Board’s Evaluation Process
The Board has established an Investments Committee, which in turn has established Sub-Committees that meet throughout the year to review the performance of funds advised by Invesco Advisers (the Invesco Funds). The Sub-Committees meet regularly with portfolio managers for their assigned Invesco Funds and other members of management to review detailed information about investment performance and portfolio attributes of these funds. The Board has established additional standing and ad hoc committees that meet regularly throughout the year to review matters within their purview. The Board took into account evaluations and reports that it received from its committees and sub-committees, as well as the information provided to the Board and its committees and sub-committees throughout the year, in considering whether to approve each Invesco Fund’s investment advisory agreement and sub-advisory contracts.
As part of the contract renewal process, the Board reviews and considers information provided in response to detailed requests for information submitted to management by the independent Trustees with assistance from legal counsel to the independent Trustees and the Senior Officer, an officer of the Invesco Funds who reports directly to the independent Trustees. The Board receives comparative investment performance and fee and expense data regarding the Invesco Funds prepared by Broadridge Financial Solutions, Inc. (Broadridge), an independent mutual fund data provider, as well as information on the composition of the peer groups provided by Broadridge and its methodology for determining peer groups. The Board also receives an independent written evaluation from the Senior Officer. The Senior Officer’s evaluation is prepared as part of his responsibility to manage the process by which the Invesco Funds’ proposed management fees are negotiated during the annual contract renewal
process to ensure they are negotiated in a manner that is at arms’ length and reasonable in accordance with certain negotiated regulatory requirements. In addition to meetings with Invesco Advisers and fund counsel throughout the year and as part of meetings convened on May 2, 2022 and June 13, 2022, the independent Trustees also discussed the continuance of the investment advisory agreement and sub-advisory contracts in separate sessions with the Senior Officer and with independent legal counsel.
The discussion below is a summary of the Senior Officer’s independent written evaluation with respect to the Fund’s investment advisory agreement and sub-advisory contracts, as well as a discussion of the material factors and related conclusions that formed the basis for the Board’s approval of the Fund’s investment advisory agreement and sub-advisory contracts. The Trustees’ review and conclusions are based on the comprehensive consideration of all information presented to them during the course of the year and in prior years and are not the result of any single determinative factor. Moreover, one Trustee may have weighed a particular piece of information or factor differently than another Trustee. The information received and considered by the Board was current as of various dates prior to the Board’s approval on June 13, 2022.
Factors and Conclusions and Summary of Independent Written Fee Evaluation
| A. | Nature, Extent and Quality of Services Provided by Invesco Advisers and the Affiliated Sub-Advisers |
The Board reviewed the nature, extent and quality of the advisory services provided to the Fund by Invesco Advisers under the Fund’s investment advisory agreement, and the credentials and experience of the officers and employees of Invesco Advisers who provide these services, including the Fund’s portfolio manager(s). The Board’s review included consideration of Invesco Advisers’ investment process and oversight, credit analysis, and research capabilities. The Board considered information regarding Invesco Advisers’ programs for and resources devoted to risk management, including management of investment, enterprise, operational, liquidity, valuation and compliance risks, and technology used to manage such risks. The Board also received and reviewed information about Invesco Advisers’ role as administrator of the Invesco Funds’ liquidity risk management program. The Board received a description of, and reports related to, Invesco Advisers’ global security program and business continuity plans and of its approach to data privacy and cybersecurity, including related testing. The Board considered how the cybersecurity and business continuity plans of Invesco Advisers and its key service providers operated in the remote and hybrid working environment resulting from the novel coronavirus (“COVID-19”) pandemic and paved the way for a hybrid working framework in a normalized environment as employees return to the office. The Board also considered non-advisory services that Invesco Advisers and its affiliates provide to the Invesco Funds, such as various back office support functions, third party oversight, internal audit, valuation, portfolio trading and legal and compliance. The Board observed that Invesco Advisers’ systems preparedness and ongoing investment enabled
Invesco Advisers to manage, operate and oversee the Invesco Funds with minimal impact or disruption through challenging environments. The Board reviewed and considered the benefits to shareholders of investing in a Fund that is part of the family of funds under the umbrella of Invesco Ltd., Invesco Advisers’ parent company, and noted Invesco Ltd.’s depth and experience in running an investment management business, as well as its commitment of financial and other resources to such business. The Board concluded that the nature, extent and quality of the services provided to the Fund by Invesco Advisers are appropriate and satisfactory.
The Board reviewed the services that may be provided by the Affiliated Sub-Advisers under the sub-advisory contracts and the credentials and experience of the officers and employees of the Affiliated Sub-Advisers who provide these services. The Board noted the Affiliated Sub-Advisers’ expertise with respect to certain asset classes and that the Affiliated Sub-Advisers have offices and personnel that are located in financial centers around the world. As a result, the Board noted that the Affiliated Sub-Advisers can provide research and investment analysis on the markets and economies of various countries in which the Fund may invest, make recommendations regarding securities and assist with security trades. The Board concluded that the sub-advisory contracts may benefit the Fund and its shareholders by permitting Invesco Advisers to use the resources and talents of the Affiliated Sub-Advisers in managing the Fund. The Board concluded that the nature, extent and quality of the services that may be provided to the Fund by the Affiliated Sub-Advisers are appropriate and satisfactory.
| B. | Fund Investment Performance |
The Board considered Fund investment performance as a relevant factor in considering whether to approve the investment advisory agreement. The Board did not view Fund investment performance as a relevant factor in considering whether to approve the sub-advisory contracts for the Fund, as no Affiliated Sub-Adviser currently manages assets of the Fund.
The Board compared the Fund’s investment performance over multiple time periods ending December 31, 2021 to the performance of funds in the Broadridge performance universe and against the Custom Invesco Global Allocation Index (Index). The Board noted that performance of Class A shares of the Fund was in the second quintile of its performance universe for the one and five year periods and the first quintile for the three year period (the first quintile being the best performing funds and the fifth quintile being the worst performing funds). The Board noted that performance of Class A shares of the Fund was reasonably comparable to the performance of the Index for the one and three year periods and below the performance of the Index for the five year period. The Board considered that the Fund was created in connection with Invesco Ltd.’s acquisition of OppenheimerFunds, Inc. and its subsidiaries (the “Transaction”) and that the Fund’s performance prior to the closing of the Transaction on May 24, 2019 is that of its predecessor fund. The Board recognized that the performance data reflects a snapshot in time as of a particular date and that selecting a different performance period could
33 Invesco Global Allocation Fund
produce different results. The Board also reviewed more recent Fund performance as well as other performance metrics, which did not change its conclusions.
| C. | Advisory and Sub-Advisory Fees and Fund Expenses |
The Board compared the Fund’s contractual management fee rate to the contractual management fee rates of funds in the Fund’s Broadridge expense group. The Board noted that the contractual management fee rate for Class A shares of the Fund was above the median contractual management fee rate of funds in its expense group. The Board noted that the term “contractual management fee” for funds in the expense group may include both advisory and certain non-portfolio management administrative services fees, but that Broadridge is not able to provide information on a fund by fund basis as to what is included. The Board also reviewed the methodology used by Broadridge in calculating expense group information, which includes using each fund’s contractual management fee schedule (including any applicable breakpoints) as reported in the most recent prospectus or statement of additional information for each fund in the expense group. The Board also considered comparative information regarding the Fund’s total expense ratio and its various components.
The Board noted that Invesco Advisers has contractually agreed to waive fees and/or limit expenses of the Fund for the term disclosed in the Fund’s registration statement in an amount necessary to limit total annual operating expenses to a specified percentage of average daily net assets for each class of the Fund.
The Board noted that Invesco Advisers and the Affiliated Sub-Advisers do not manage other similarly managed mutual funds or client accounts.
The Board also considered the services that may be provided by the Affiliated Sub-Advisers pursuant to the sub-advisory contracts, as well as the fees payable by Invesco Advisers to the Affiliated Sub-Advisers pursuant to the sub-advisory contracts.
| D. | Economies of Scale and Breakpoints |
The Board considered the extent to which there may be economies of scale in the provision of advisory services to the Fund and the Invesco Funds, and the extent to which such economies of scale are shared with the Fund and the Invesco Funds. The Board considered that the Fund benefits from economies of scale through contractual breakpoints in the Fund’s advisory fee schedule, which generally operate to reduce the Fund’s expense ratio as it grows in size. The Board noted that the Fund also shares in economies of scale through Invesco Advisers’ ability to negotiate lower fee arrangements with third party service providers. The Board noted that the Fund may also benefit from economies of scale through initial fee setting, fee waivers and expense reimbursements, as well as Invesco Advisers’ investment in its business, including investments in business infrastructure, technology and cybersecurity.
| E. | Profitability and Financial Resources |
The Board reviewed information from Invesco Advisers concerning the costs of the advisory and other services that Invesco Advisers and its affiliates provide to the Fund and the Invesco Funds and the profitability of Invesco Advisers and its affiliates in providing these services in the aggregate and on an individual Fund-by-Fund basis. The Board considered the methodology used for calculating profitability and
the periodic review and enhancement of such methodology. The Board noted that Invesco Advisers continues to operate at a net profit from services Invesco Advisers and its affiliates provide to the Invesco Funds in the aggregate and to most Funds individually. The Board did not deem the level of profits realized by Invesco Advisers and its affiliates from providing such services to be excessive, given the nature, extent and quality of the services provided. The Board noted that Invesco Advisers provided information demonstrating that Invesco Advisers is financially sound and has the resources necessary to perform its obligations under the investment advisory agreement, and provided representations indicating that the Affiliated Sub-Advisers are financially sound and have the resources necessary to perform their obligations under the sub-advisory contracts.
| F. | Collateral Benefits to Invesco Advisers and its Affiliates |
The Board considered various other benefits received by Invesco Advisers and its affiliates from the relationship with the Fund, including the fees received for providing administrative, transfer agency and distribution services to the Fund. The Board received comparative information regarding fees charged for these services, including information provided by Broadridge and other independent sources. The Board reviewed the performance of Invesco Advisers and its affiliates in providing these services and the organizational structure employed to provide these services. The Board noted that these services are provided to the Fund pursuant to written contracts that are reviewed and subject to approval on an annual basis by the Board based on its determination that the services are required for the operation of the Fund.
The Board considered the benefits realized by Invesco Advisers and the Affiliated Sub-Advisers as a result of portfolio brokerage transactions executed through “soft dollar” arrangements. The Board noted that soft dollar arrangements may result in the Fund bearing costs to purchase research that may be used by Invesco Advisers or the Affiliated Sub-Advisers with other clients and may reduce Invesco Advisers’ or the Affiliated Sub-Advisers’ expenses. The Board also considered that it receives from Invesco Advisers periodic reports that include a representation to the effect that these arrangements are consistent with regulatory requirements. The Board did not deem the soft dollar arrangements to be inappropriate.
The Board considered that the Fund’s uninvested cash and cash collateral from any securities lending arrangements may be invested in registered money market funds or, with regard to securities lending cash collateral, unregistered funds that comply with Rule 2a-7 (collectively referred to as “affiliated money market funds”) advised by Invesco Advisers. The Board considered information regarding the returns of the affiliated money market funds relative to comparable overnight investments, as well as the fees paid by the affiliated money market funds to Invesco Advisers and its affiliates. In this regard, the Board noted that Invesco Advisers receives advisory fees from these affiliated money market funds attributable to the Fund’s investments. The Board also noted that Invesco Advisers has contractually agreed to waive through varying periods an amount equal to 100% of the net advisory fee Invesco Advisers receives from the affiliated money market funds with respect to the Fund’s investment in the affiliated money market funds of uninvested cash, but
not cash collateral. The Board concluded that the advisory fees payable to Invesco Advisers from the Fund’s investment of cash collateral from any securities lending arrangements in the affiliated money market funds are for services that are not duplicative of services provided by Invesco Advisers to the Fund.
The Board considered that Invesco Advisers may serve as the Fund’s affiliated securities lending agent and evaluated the benefits realized by Invesco Advisers when serving in such role, including the compensation received. The Board considered Invesco Advisers’ securities lending platform and corporate governance structure for securities lending, including Invesco Advisers’ Securities Lending Governance Committee and its related responsibilities. The Board noted that to the extent the Fund utilizes Invesco Advisers as an affiliated securities lending agent, the Fund conducts its securities lending in accordance with, and in reliance upon, no-action letters issued by the SEC staff that provide guidance on how an affiliate may act as a direct agent lender and receive compensation for those services without obtaining exemptive relief. The Board considered information provided by Invesco Advisers related to the performance of Invesco Advisers as securities lending agent, including a summary of the securities lending services provided to the Fund by Invesco Advisers and the compensation paid to Invesco Advisers for such services, as well as any revenues generated for the Fund in connection with such securities lending activity and the allocation of such revenue between the Fund and Invesco Advisers.
The Board also received information about commissions that an affiliated broker may receive for executing certain trades for the Fund. Invesco Advisers and the Affiliated Sub-Advisers advised the Board of the benefits to the Fund of executing trades through the affiliated broker and that such trades were executed in compliance with rules under the federal securities laws and consistent with best execution obligations.
34 Invesco Global Allocation Fund
Tax Information
Form 1099-DIV, Form 1042-S and other year-end tax information provide shareholders with actual calendar year amounts that should be included in their tax returns. Shareholders should consult their tax advisers.
The following distribution information is being provided as required by the Internal Revenue Code or to meet a specific state’s requirement.
The Fund designates the following amounts or, if subsequently determined to be different, the maximum amount allowable for its fiscal year ended October 31, 2022:
| | | | | | |
| | | | | | |
| Federal and State Income Tax | | | |
Long-Term Capital Gain Distributions | | | $133,158,441 | |
Qualified Dividend Income* | | | 16.11 | % |
Corporate Dividends Received Deduction* | | | 5.40 | % |
U.S. Treasury Obligations* | | | 0.05 | % |
Qualified Business Income* | | | 0.00 | % |
Business Interest Income* | | | 0.00 | % | | |
|
* The above percentages are based on ordinary income dividends paid to shareholders during the Fund’s fiscal year. |
| | |
| Non-Resident Alien Shareholders | | | | | |
Short-Term Capital Gain Distributions | | | $15,874,846 | |
35 Invesco Global Allocation Fund
Trustees and Officers
The address of each trustee and officer is AIM Investment Funds (Invesco Investment Funds) (the “Trust”), 11 Greenway Plaza, Suite 1000, Houston, Texas 77046-1173. The trustees serve for the life of the Trust, subject to their earlier death, incapacitation, resignation, retirement or removal as more specifically provided in the Trust’s organizational documents. Each officer serves for a one year term or until their successors are elected and qualified. Column two below includes length of time served with predecessor entities, if any.
| | | | | | | | |
Name, Year of Birth and
Position(s) Held with the Trust | | Trustee and/or Officer
Since | | Principal Occupation(s) During Past 5 Years | | Number of Funds in Fund Complex Overseen by Trustee | | Other Directorship(s) Held by Trustee During Past 5 Years |
| Interested Trustee | | | | | | | | |
| | | | | |
| Martin L. Flanagan1 – 1960 Trustee and Vice Chair | | 2007 | | Executive Director, Chief Executive Officer and President, Invesco Ltd. (ultimate parent of Invesco and a global investment management firm); Trustee and Vice Chair, The Invesco Funds; Vice Chair, Investment Company Institute; and Member of Executive Board, SMU Cox School of Business Formerly: Advisor to the Board, Invesco Advisers, Inc. (formerly known as Invesco Institutional (N.A.), Inc.); Chairman and Chief Executive Officer, Invesco Advisers, Inc. (registered investment adviser); Director, Chairman, Chief Executive Officer and President, Invesco Holding Company (US), Inc. (formerly IVZ Inc.) (holding company), Invesco Group Services, Inc. (service provider) and Invesco North American Holdings, Inc. (holding company); Director, Chief Executive Officer and President, Invesco Holding Company Limited (parent of Invesco and a global investment management firm); Director, Invesco Ltd.; Chairman, Investment Company Institute and President, Co-Chief Executive Officer, Co-President, Chief Operating Officer and Chief Financial Officer, Franklin Resources, Inc. (global investment management organization) | | 189 | | None |
| 1 | Mr. Flanagan is considered an interested person (within the meaning of Section 2(a)(19) of the 1940 Act) of the Trust because he is an officer of the Adviser to the Trust, and an officer and a director of Invesco Ltd., ultimate parent of the Adviser. |
T-1 Invesco Global Allocation Fund
Trustees and Officers–(continued)
| | | | | | | | | | |
Name, Year of Birth and
Position(s) Held with the Trust | | Trustee and/or Officer Since | | Principal Occupation(s) During Past 5 Years | | Number of Funds in Fund Complex Overseen by Trustee | | | Other Directorship(s) Held by Trustee During Past 5 Years |
| Independent Trustees | | | | | | | | | | |
| | | | | |
| Beth Ann Brown – 1968 Trustee (2019) and Chair (August 2022) | | 2019 | | Independent Consultant Formerly: Head of Intermediary Distribution, Managing Director, Strategic Relations, Managing Director, Head of National Accounts, Senior Vice President, National Account Manager and Senior Vice President, Key Account Manager, Columbia Management Investment Advisers LLC; Vice President, Key Account Manager, Liberty Funds Distributor, Inc.; and Trustee of certain Oppenheimer Funds | | | 189 | | | Director, Board of Directors of Caron Engineering Inc.; Advisor, Board of Advisors of Caron Engineering Inc.; President and Director, Acton Shapleigh Youth Conservation Corps (non-profit) Formerly: President and Director Director of Grahamtastic Connection (non-profit) |
| | | | | |
Cynthia Hostetler – 1962 Trustee | | 2017 | | Non-Executive Director and Trustee of a number of public and private business corporations Formerly: Director, Aberdeen Investment Funds (4 portfolios); Director, Artio Global Investment LLC (mutual fund complex); Director, Edgen Group, Inc. (specialized energy and infrastructure products distributor); Director, Genesee & Wyoming, Inc. (railroads); Head of Investment Funds and Private Equity, Overseas Private Investment Corporation; President, First Manhattan Bancorporation, Inc.; and Attorney, Simpson Thacher & Bartlett LLP | | | 189 | | | Resideo Technologies, Inc. (smart home technology); Vulcan Materials Company (construction materials company); Trilinc Global Impact Fund; Textainer Group Holdings, (shipping container leasing company); Investment Company Institute (professional organization); and Independent Directors Council (professional organization) |
| | | | | |
Eli Jones – 1961 Trustee | | 2016 | | Professor and Dean Emeritus, Mays Business School - Texas A&M University Formerly: Dean of Mays Business School-Texas A&M University; Professor and Dean, Walton College of Business, University of Arkansas and E.J. Ourso College of Business, Louisiana State University; and Director, Arvest Bank | | | 189 | | | Insperity, Inc. (formerly known as Administaff) (human resources provider); and Member of Regional Board of Directors and Board of Directors, First Financial Bancorp (regional bank) |
| | | | | |
Elizabeth Krentzman – 1959 Trustee | | 2019 | | Formerly: Principal and Chief Regulatory Advisor for Asset Management Services and U.S. Mutual Fund Leader of Deloitte & Touche LLP; General Counsel of the Investment Company Institute (trade association); National Director of the Investment Management Regulatory Consulting Practice, Principal, Director and Senior Manager of Deloitte & Touche LLP; Assistant Director of the Division of Investment Management -Office of Disclosure and Investment Adviser Regulation of the U.S. Securities and Exchange Commission and various positions with the Division of Investment Management – Office of Regulatory Policy of the U.S. Securities and Exchange Commission; Associate at Ropes & Gray LLP; and Trustee of certain Oppenheimer Funds | | | 189 | | | Formerly: Member of the Cartica Funds Board of Directors (private investment fund); Trustee of the University of Florida National Board Foundation; and Member of the University of Florida Law Center Association, Inc. Board of Trustees, Audit Committee and Membership Committee |
| | | | | |
Anthony J. LaCava, Jr. – 1956 Trustee | | 2019 | | Formerly: Director and Member of the Audit Committee, Blue Hills Bank (publicly traded financial institution) and Managing Partner, KPMG LLP | | | 189 | | | Blue Hills Bank; Chairman, Bentley University; Member, Business School Advisory Council; and Nominating Committee, KPMG LLP |
| | | | | |
Prema Mathai-Davis – 1950 Trustee | | 2001 | | Retired Formerly: Co-Founder & Partner of Quantalytics Research, LLC, (a FinTech Investment Research Platform for the Self-Directed Investor); Trustee of YWCA Retirement Fund; CEO of YWCA of the USA; Board member of the NY Metropolitan Transportation Authority; Commissioner of the NYC Department of Aging; and Board member of Johns Hopkins Bioethics Institute | | | 189 | | | Member of Board of Positive Planet US (non-profit) and HealthCare Chaplaincy Network (non-profit) |
T-2 Invesco Global Allocation Fund
Trustees and Officers–(continued)
| | | | | | | | |
Name, Year of Birth and Position(s) Held with the Trust | | Trustee and/or Officer Since | | Principal Occupation(s) During Past 5 Years | | Number of
Funds in
Fund Complex
Overseen by Trustee | | Other Directorship(s) Held by Trustee During Past 5 Years |
| Independent Trustees–(continued) | | | | | | |
| | | | | |
| Joel W. Motley – 1952 Trustee | | 2019 | | Director of Office of Finance, Federal Home Loan Bank System; Managing Director of Carmona Motley Inc. (privately held financial advisor); Member of the Council on Foreign Relations and its Finance and Budget Committee; Chairman Emeritus of Board of Human Rights Watch and Member of its Investment Committee; and Member of Investment Committee Board of Historic Hudson Valley (non-profit cultural organization); Member of the Board, Blue Ocean Acquisition Corp.; and Member of the Vestry and the Investment Committee of Trinity Church Wall Street. Formerly: Managing Director of Public Capital Advisors, LLC (privately held financial advisor); Managing Director of Carmona Motley Hoffman, Inc. (privately held financial advisor); Trustee of certain Oppenheimer Funds; and Director of Columbia Equity Financial Corp. (privately held financial advisor) | | 189 | | Member of Board of Trust for Mutual Understanding (non-profit promoting the arts and environment); Member of Board of Greenwall Foundation (bioethics research foundation) and its Investment Committee; Member of Board of Friends of the LRC (non- profit legal advocacy); and Board Member and Investment Committee Member of Pulitzer Center for Crisis Reporting (non-profit journalism) |
| | | | | |
| Teresa M. Ressel – 1962 Trustee | | 2017 | | Non-executive director and trustee of a number of public and private business corporations Formerly: Chief Executive Officer, UBS Securities LLC (investment banking); Chief Operating Officer, UBS AG Americas (investment banking); Sr. Management Team Olayan America, The Olayan Group (international investor/commercial/industrial); Assistant Secretary for Management & Budget and Designated Chief Financial Officer, U.S. Department of Treasury and Director, ON Semiconductor Corporation (semiconductor manufacturing) | | 189 | | None |
| | | | | |
| Robert C. Troccoli – 1949 Trustee | | 2016 | | Retired Formerly: Adjunct Professor, University of Denver – Daniels College of Business; and Managing Partner, KPMG LLP | | 189 | | None |
| | | | | |
| Daniel S. Vandivort –1954 Trustee | | 2019 | | President, Flyway Advisory Services LLC (consulting and property management) Formerly: President and Chief Investment Officer, previously Head of Fixed Income, Weiss Peck and Greer/Robeco Investment Management; Trustee and Chair, Weiss Peck and Greer Funds Board; and various capacities at CS First Boston including Head of Fixed Income at First Boston Asset Management. | | 189 | | Formerly: Trustee and Governance Chair, Oppenheimer Funds; Treasurer, Chairman of the Audit and Finance Committee, Huntington Disease Foundation of America |
T-3 Invesco Global Allocation Fund
Trustees and Officers–(continued)
| | | | | | | | |
Name, Year of Birth and Position(s) Held with the Trust | | Trustee and/or Officer Since | | Principal Occupation(s) During Past 5 Years | | Number of Funds in Fund Complex Overseen by Trustee | | Other Directorship(s) Held by Trustee During Past 5 Years |
| Officers | | | | | | | | |
| | | | | |
| Sheri Morris – 1964 President and Principal Executive Officer | | 1999 | | Director, Invesco Trust Company; Head of Global Fund Services, Invesco Ltd.; President and Principal Executive Officer, The Invesco Funds; Vice President, Invesco Exchange-Traded Fund Trust, Invesco Exchange-Traded Fund Trust II, Invesco India Exchange-Traded Fund Trust, Invesco Actively Managed Exchange-Traded Fund Trust, Invesco Actively Managed Exchange-Traded Commodity Fund Trust and Invesco Exchange-Traded Self-Indexed Fund Trust; and Vice President, OppenheimerFunds, Inc. Formerly: Vice President, Treasurer and Principal Financial Officer, The Invesco Funds; Vice President, Invesco AIM Advisers, Inc., Invesco AIM Capital Management, Inc. and Invesco AIM Private Asset Management, Inc.; Assistant Vice President and Assistant Treasurer, The Invesco Funds; Vice President and Assistant Vice President, Invesco Advisers, Inc.; Assistant Vice President, Invesco AIM Capital Management, Inc. and Invesco AIM Private Asset Management, Inc.; Treasurer, Invesco Exchange-Traded Fund Trust, Invesco Exchange-Traded Fund Trust II, Invesco India Exchange-Traded Fund Trust and Invesco Actively Managed Exchange-Traded Fund Trust; and Senior Vice President, Invesco Advisers, Inc. (formerly known as Invesco Institutional (N.A.), Inc.) (registered investment adviser) | | N/A | | N/A |
| | | | | |
| Jeffrey H. Kupor – 1968 Senior Vice President, Chief Legal Officer and Secretary | | 2018 | | Head of Legal of the Americas, Invesco Ltd.; Senior Vice President and Secretary, Invesco Advisers, Inc. (formerly known as Invesco Institutional (N.A.), Inc.) (registered investment adviser); Secretary, Invesco Distributors, Inc. (formerly known as Invesco AIM Distributors, Inc.); Vice President and Secretary, Invesco Investment Services, Inc. (formerly known as Invesco AIM Investment Services, Inc.); Senior Vice President, Chief Legal Officer and Secretary, The Invesco Funds; Secretary and General Counsel, Invesco Investment Advisers LLC (formerly known as Van Kampen Asset Management); Secretary and General Counsel, Invesco Capital Markets, Inc. (formerly known as Van Kampen Funds Inc.); Chief Legal Officer, Invesco Exchange-Traded Fund Trust, Invesco Exchange-Traded Fund Trust II, Invesco India Exchange-Traded Fund Trust, Invesco Actively Managed Exchange-Traded Fund Trust, Invesco Actively Managed Exchange-Traded Commodity Fund Trust and Invesco Exchange-Traded Self-Indexed Fund Trust;; Secretary and Vice President, Harbourview Asset Management Corporation; Secretary and Vice President, OppenheimerFunds, Inc. and Invesco Managed Accounts, LLC; Secretary and Senior Vice President, OFI Global Institutional, Inc.; Secretary and Vice President, OFI SteelPath, Inc.; Secretary and Vice President, Oppenheimer Acquisition Corp.; Secretary and Vice President, Shareholder Services, Inc.; and Secretary and Vice President, Trinity Investment Management Corporation Formerly: Senior Vice President, Invesco Distributors, Inc.; Secretary and Vice President, Jemstep, Inc.; Head of Legal, Worldwide Institutional, Invesco Ltd.; Secretary and General Counsel, INVESCO Private Capital Investments, Inc.; Senior Vice President, Secretary and General Counsel, Invesco Management Group, Inc. (formerly known as Invesco AIM Management Group, Inc.); Assistant Secretary, INVESCO Asset Management (Bermuda) Ltd.; Secretary and General Counsel, Invesco Private Capital, Inc.;Assistant Secretary and General Counsel, INVESCO Realty, Inc.; Secretary and General Counsel, Invesco Senior Secured Management, Inc.; Secretary, Sovereign G./P. Holdings Inc.; Secretary, Invesco Indexing LLC; and Secretary, W.L. Ross & Co., LLC | | N/A | | N/A |
| | | | | |
Andrew R. Schlossberg – 1974 Senior Vice President | | 2019 | | Senior Vice President, Invesco Group Services, Inc.; Head of the Americas and Senior Managing Director, Invesco Ltd.; Director and Senior Vice President, Invesco Advisers, Inc. (formerly known as Invesco Institutional (N.A.), Inc.) (registered investment adviser); Director and Chairman, Invesco Investment Services, Inc. (formerly known as Invesco AIM Investment Services, Inc.) (registered transfer agent); Senior Vice President, The Invesco Funds; and Director, Invesco Investment Advisers LLC (formerly known as Van Kampen Asset Management) Formerly: Director, President and Chairman, Invesco Insurance Agency, Inc.; Director, Invesco UK Limited; Director and Chief Executive, Invesco Asset Management Limited and Invesco Fund Managers Limited; Assistant Vice President, The Invesco Funds; Senior Vice President, Invesco Advisers, Inc. (formerly known as Invesco Institutional (N.A.), Inc.) (registered investment adviser); Director and Chief Executive, Invesco Administration Services Limited and Invesco Global Investment Funds Limited; Director, Invesco Distributors, Inc.; Head of EMEA, Invesco Ltd.; President, Invesco Actively Managed Exchange-Traded Commodity Fund Trust, Invesco Actively Managed Exchange-Traded Fund Trust, Invesco Exchange-Traded Fund Trust, Invesco Exchange-Traded Fund Trust II and Invesco India Exchange-Traded Fund Trust; and Managing Director and Principal Executive Officer, Invesco Capital Management LLC | | N/A | | N/A |
T-4 Invesco Global Allocation Fund
Trustees and Officers–(continued)
| | | | | | | | |
Name, Year of Birth and Position(s) Held with the Trust | | Trustee and/or Officer Since | | Principal Occupation(s) During Past 5 Years | | Number of Funds in Fund Complex Overseen by Trustee | | Other Directorship(s) Held by Trustee During Past 5 Years |
| Officers–(continued) | | | | | | | | |
| | | | | |
John M. Zerr – 1962 Senior Vice President | | 2006 | | Chief Operating Officer of the Americas; Senior Vice President, Invesco Advisers, Inc. (formerly known as Invesco Institutional (N.A.), Inc.) (registered investment adviser); Senior Vice President, Invesco Distributors, Inc. (formerly known as Invesco AIM Distributors, Inc.); Director and Vice President, Invesco Investment Services, Inc. (formerly known as Invesco AIM Investment Services, Inc.) Senior Vice President, The Invesco Funds; Managing Director, Invesco Capital Management LLC; Director, Invesco Investment Advisers LLC (formerly known as Van Kampen Asset Management); Senior Vice President, Invesco Capital Markets, Inc. (formerly known as Van Kampen Funds Inc.); Manager, Invesco Indexing LLC; Manager, Invesco Specialized Products, LLC; Member, Invesco Canada Funds Advisory Board; Director, President and Chief Executive Officer, Invesco Corporate Class Inc. (corporate mutual fund company); and Director, Chairman, President and Chief Executive Officer, Invesco Canada Ltd. (formerly known as Invesco Trimark Ltd./Invesco Trimark Ltèe) (registered investment adviser and registered transfer agent); President, Invesco, Inc.; President, Invesco Global Direct Real Estate Feeder GP Ltd.; President, Invesco IP Holdings (Canada) Ltd; President, Invesco Global Direct Real Estate GP Ltd.; President, Invesco Financial Services Ltd. / Services Financiers Invesco Ltée; and Director and Chairman, Invesco Trust Company Formerly: President, Trimark Investments Ltd/Services Financiers Invesco Ltee; Director and Senior Vice President, Invesco Insurance Agency, Inc.; Director and Senior Vice President, Invesco Management Group, Inc. (formerly known as Invesco AIM Management Group, Inc.); Secretary and General Counsel, Invesco Management Group, Inc. (formerly known as Invesco AIM Management Group, Inc.); Secretary, Invesco Investment Services, Inc. (formerly known as Invesco AIM Investment Services, Inc.); Chief Legal Officer and Secretary, The Invesco Funds; Secretary and General Counsel, Invesco Investment Advisers LLC (formerly known as Van Kampen Asset Management); Secretary and General Counsel, Invesco Capital Markets, Inc. (formerly known as Van Kampen Funds Inc.); Chief Legal Officer, Invesco Exchange-Traded Fund Trust, Invesco Exchange-Traded Fund Trust II, Invesco India Exchange-Traded Fund Trust, Invesco Actively Managed Exchange-Traded Fund Trust, Invesco Actively Managed Exchange-Traded Commodity Fund Trust and Invesco Exchange-Traded Self-Indexed Fund Trust; Secretary, Invesco Indexing LLC; Director, Secretary, General Counsel and Senior Vice President, Van Kampen Exchange Corp.; Director, Vice President and Secretary, IVZ Distributors, Inc. (formerly known as INVESCO Distributors, Inc.); Director and Vice President, INVESCO Funds Group, Inc.; Director and Vice President, Van Kampen Advisors Inc.; Director, Vice President, Secretary and General Counsel, Van Kampen Investor Services Inc.;Director and Secretary, Invesco Distributors, Inc. (formerly known as Invesco AIM Distributors, Inc.); Director, Senior Vice President, General Counsel and Secretary, Invesco AIM Advisers, Inc. and Van Kampen Investments Inc.; Director, Vice President and Secretary, Fund Management Company; Director, Senior Vice President, Secretary, General Counsel and Vice President, Invesco AIM Capital Management, Inc.; and Chief Operating Officer and General Counsel, Liberty Ridge Capital, Inc. (an investment adviser) | | N/A | | N/A |
| | | | | |
Gregory G. McGreevey – 1962 Senior Vice President | | 2012 | | Senior Managing Director, Invesco Ltd.; Director, Chairman, President, and Chief Executive Officer, Invesco Advisers, Inc. (formerly known as Invesco Institutional (N.A.), Inc.) (registered investment adviser); Director, Invesco Mortgage Capital, Inc. and Invesco Senior Secured Management, Inc.; Senior Vice President, The Invesco Funds; President, SNW Asset Management Corporation and Invesco Managed Accounts, LLC; Chairman and Director, Invesco Private Capital, Inc.; Chairman and Director, INVESCO Private Capital Investments, Inc.; Chairman and Director, INVESCO Realty, Inc.; and Senior Vice President, Invesco Group Services, Inc. Formerly: Senior Vice President, Invesco Management Group, Inc. and Invesco Advisers, Inc.; Assistant Vice President, The Invesco Funds | | N/A | | N/A |
| | | | | |
| Adrien Deberghes – 1967 Principal Financial Officer, Treasurer and Vice President | | 2020 | | Head of the Fund Office of the CFO and Fund Administration; Vice President, Invesco Advisers, Inc.; Principal Financial Officer, Treasurer and Vice President, The Invesco Funds; Vice President, Invesco Exchange-Traded Fund Trust, Invesco Exchange-Traded Fund Trust II, Invesco India Exchange-Traded Fund Trust, Invesco Actively Managed Exchange-Traded Fund Trust, Invesco Actively Managed Exchange-Traded Commodity Fund Trust and Invesco Exchange-Traded Self-Indexed Fund Trust Formerly: Senior Vice President and Treasurer, Fidelity Investments | | N/A | | N/A |
| | | | | |
| Crissie M. Wisdom – 1969 Anti-Money Laundering Compliance Officer | | 2013 | | Anti-Money Laundering and OFAC Compliance Officer for Invesco U.S. entities including: Invesco Advisers, Inc. and its affiliates, Invesco Capital Markets, Inc., Invesco Distributors, Inc., Invesco Investment Services, Inc., The Invesco Funds, Invesco Capital Management, LLC, Invesco Trust Company; and Fraud Prevention Manager for Invesco Investment Services, Inc. | | N/A | | N/A |
T-5 Invesco Global Allocation Fund
Trustees and Officers–(continued)
| | | | | | | | |
Name, Year of Birth and Position(s) Held with the Trust | | Trustee and/or Officer Since | | Principal Occupation(s) During Past 5 Years | | Number of Funds in Fund Complex Overseen by Trustee | | Other Directorship(s) Held by Trustee During Past 5 Years |
| Officers–(continued) | | | | | | | | |
| | | | | |
Todd F. Kuehl – 1969 Chief Compliance Officer and Senior Vice President | | 2020 | | Chief Compliance Officer, Invesco Advisers, Inc. (registered investment adviser); and Chief Compliance Officer and Senior Vice President, The Invesco Funds Formerly: Managing Director and Chief Compliance Officer, Legg Mason (Mutual Funds); Chief Compliance Officer, Legg Mason Private Portfolio Group (registered investment adviser) | | N/A | | N/A |
| | | | | |
James Bordewick, Jr. – 1959 Senior Vice President and Senior Officer | | 2022 | | Senior Vice President and Senior Officer, The Invesco Funds; and Chief Legal Officer, KingsCrowd, Inc. (research and analytical platform for investment in private capital markets) Formerly, Chief Operating Officer and Head of Legal and Regulatory, Netcapital (private capital investment platform); Managing Director, General Counsel of asset management and Chief Compliance Officer for asset management and private banking, Bank of America Corporation; Chief Legal Officer, Columbia Funds and BofA Funds; Senior Vice President and Associate General Counsel, MFS Investment Management; Chief Legal Officer, MFS Funds; Associate, Ropes & Gray; Associate, Gaston Snow & Ely Bartlett | | N/A | | N/A |
The Statement of Additional Information of the Trust includes additional information about the Fund’s Trustees and is available upon request, without charge, by calling 1.800.959.4246. Please refer to the Fund’s Statement of Additional Information for information on the Fund’s sub-advisers.
| | | | | | |
| Office of the Fund | | Investment Adviser | | Distributor | | Auditors |
11 Greenway Plaza, Suite 1000 Houston, TX 77046-1173 | | Invesco Advisers, Inc. 1555 Peachtree Street, N.E. Atlanta, GA 30309 | | Invesco Distributors, Inc. 11 Greenway Plaza, Suite 1000 Houston, TX 77046-1173 | | PricewaterhouseCoopers LLP 1000 Louisiana Street, Suite 5800 Houston, TX 77002-5021 |
| | | |
| Counsel to the Fund | | Counsel to the Independent Trustees | | Transfer Agent | | Custodian |
Stradley Ronon Stevens & Young, LLP 2005 Market Street, Suite 2600 Philadelphia, PA 19103-7018 | | Goodwin Procter LLP 901 New York Avenue, N.W. Washington, D.C. 20001 | | Invesco Investment Services, Inc. 11 Greenway Plaza, Suite 1000 Houston, TX 77046-1173 | | State Street Bank and Trust Company 225 Franklin Street Boston, MA 02110-2801 |
T-6 �� Invesco Global Allocation Fund
(This page intentionally left blank)
(This page intentionally left blank)

Go paperless with eDelivery
Visit invesco.com/edelivery to enjoy the convenience and security of anytime electronic access to your investment documents.
With eDelivery, you can elect to have any or all of the following materials delivered straight to your inbox to download, save and print from your own computer:
∎ Fund reports and prospectuses
∎ Quarterly statements
∎ Daily confirmations
∎ Tax forms
Invesco mailing information
Send general correspondence to Invesco Investment Services, Inc., P.O. Box 219078, Kansas City, MO 64121-9078.
Important notice regarding delivery of security holder documents
To reduce Fund expenses, only one copy of most shareholder documents may be mailed to shareholders with multiple accounts at the same address (Householding). Mailing of your shareholder documents may be householded indefinitely unless you instruct us otherwise. If you do not want the mailing of these documents to be combined with those for other members of your household, please contact Invesco Investment Services, Inc. at 800 959 4246 or contact your financial institution. We will begin sending you individual copies for each account within 30 days after receiving your request.
Fund holdings and proxy voting information
The Fund provides a complete list of its portfolio holdings four times each year, at the end of each fiscal quarter. For the second and fourth quarters, the list appears, respectively, in the Fund’s semiannual and annual reports to shareholders. For the first and third quarters, the Fund files the list with the Securities and Exchange Commission (SEC) as an exhibit to its reports on Form N-PORT. The most recent list of portfolio holdings is available at invesco.com/completeqtrholdings. Shareholders can also look up the Fund’s Form N-PORT filings on the SEC website, sec.gov. The SEC file numbers for the Fund are shown below.
A description of the policies and procedures that the Fund uses to determine how to vote proxies relating to portfolio securities is available without charge, upon request, from our Client Services department at 800 959 4246, or at invesco.com/ corporate/about-us/esg. The information is also available on the SEC website, sec.gov.
Information regarding how the Fund voted proxies related to its portfolio securities during the most recent 12-month period ended June 30 is available at invesco.com/proxysearch. This information is also available on the SEC website, sec.gov.
Invesco Advisers, Inc. is an investment adviser; it provides investment advisory services to individual and institutional clients and does not sell securities. Invesco Distributors, Inc. is the US distributor for Invesco Ltd.’s retail mutual funds, exchange-traded funds and institutional money market funds. Both are wholly owned, indirect subsidiaries of Invesco Ltd.

| | | | |
| SEC file number(s): 811-05426 and 033-19338 | | Invesco Distributors, Inc. | | O-GLAL-AR-1 |

| | |
| | |
| Annual Report to Shareholders | | October 31, 2022 |
Invesco Global Infrastructure Fund
Nasdaq:
A: GIZAX ∎ C: GIZCX ∎ R: GIZRX ∎ Y: GIZYX ∎ R5: GIZFX ∎ R6: GIZSX
Management’s Discussion of Fund Performance
| | | | |
| |
Performance summary | |
For the fiscal year ended October 31, 2022, Class A shares of Invesco Global Infrastructure Fund (the Fund), at net asset value (NAV), underperformed the Dow Jones Brookfield Global Infrastructure Index, the Fund’s style-specific benchmark. | |
Your Fund’s long-term performance appears later in this report. | |
| |
Fund vs. Indexes | |
Total returns, 10/31/21 to 10/31/22, at net asset value (NAV). Performance shown does not include applicable contingent deferred sales charges (CDSC) or front-end sales charges, which would have reduced performance. | |
Class A Shares | | | -10.74 | % |
Class C Shares | | | -11.38 | |
Class R Shares | | | -10.99 | |
Class Y Shares | | | -10.44 | |
Class R5 Shares | | | -10.50 | |
Class R6 Shares | | | -10.43 | |
MSCI World Index▼ (Broad Market Index) | | | -18.48 | |
Dow Jones Brookfield Global Infrastructure Index▼ (Style-Specific Index) | | | -8.10 | |
Lipper Global Infrastructure Funds Classification Average∎ (Peer Group) | | | -10.90 | |
| |
Source(s): ▼RIMES Technologies Corp.; ∎Lipper Inc. | | | | |
Market conditions and your Fund
At the beginning of the fiscal year, which ended October 31, 2022, developed global equity markets were mostly positive despite rising inflation and the emergence of Omicron, a new COVID-19 variant. Pandemic-related supply chain disruptions and labor shortages intensified at the end of 2021, resulting in broadly higher costs for companies and consumers. Global equity markets declined in the first quarter of 2022 amid volatility sparked by Russia’s invasion of Ukraine, rising commodity prices, rampant global inflation and central banks shifting toward tighter monetary policy. Russia’s invasion exacerbated inflationary pressures, disrupting already strained supply chains and increasing shortages of oil, gas and raw materials, with the price of oil rising sharply.
In the second quarter of 2022, global equity markets continued declining as record inflation, rising interest rates and recession fears led to generally weaker consumer sentiment around the globe. In Europe, the reduction of gas supplies from Russia due to the war in Ukraine drove prices higher, with mounting fear of gas shortages and rationing. On the other hand, China was an outlier and posted a positive return for the quarter due to the easing of COVID-19 lockdowns. After a rebound in July 2022, global equity markets declined again at the end of the fiscal year, as global economic uncertainty continued with central banks trying to bring inflation under control.
Global infrastructure stocks posted a negative absolute performance over the fiscal year but outperformed broad global market equities over the fiscal year. The Fund, however, underperformed the Dow Jones Brookfield Global Infrastructure Index, its style-specific benchmark, on a gross performance basis. Security selection in the towers and gas
distribution sectors were the main detractors to relative performance while the major positive drivers of relative performance came from security selection within the midstream services and electric utilities sectors.
Cellnex, a tower company with sites throughout Europe was a top individual detractor from the Fund’s relative performance. The company enjoys a very defensive cash flow stream with excellent growth prospects, but rising interest rates eroded the spread between its returns on acquisitions versus its cost of capital which adversely affected the valuation. In gas distribution, the primary detractor from the Fund’s relative performance was Towngas Smart Energy. The position was driven by its relative valuation to other utilities in the region, with accelerating growth prospects from its foray into commercial-scale solar energy in China. Unfortunately, management could not hit its guidance due to operating margins deteriorating in its core gas utility business due to lower gas volume demand and natural gas prices spiking.
Top individual relative contributors to Fund performance for the fiscal year included several midstream services and gas distribution companies, such as Targa Resources, Cheniere Energy and CenterPoint Energy. These companies benefited from a positive shift in the supply and demand dynamics for natural gas. Elsewhere, PG&E an electric utility company, which had recently emerged from bankruptcy and traded at a deep discount to other electric utilities proved to be a top performer. In addition, the company successfully sold some non-core assets, which helped boost the earnings growth profile.
At the close of the fiscal year, relative to the style-specific benchmark, the Fund held overweight positions in sectors such as midstream services, gas distributions and towers in an effort to balance attractive relative valuations in cyclicals with a moderating economic
outlook. The Fund held underweight positions in the water, airports and electric utilities sectors, where valuations we believe may be relatively unattractive and regulatory structures could impact the ability to participate in the market rebound.
We remain focused on investing in companies with sound balance sheets and strategic infrastructure assets that provide a relatively more stable underlying earnings stream, offering above-average earnings growth characteristics.
We thank you for your investment in Invesco Global Infrastructure Fund.
Portfolio manager(s):
Mark Blackburn
James Cowen
Grant Jackson
Darin Turner - Lead
Ping-Ying Wang
The views and opinions expressed in management’s discussion of Fund performance are those of Invesco Advisers, Inc. and its affiliates. These views and opinions are subject to change at any time based on factors such as market and economic conditions. These views and opinions may not be relied upon as investment advice or recommendations, or as an offer for a particular security. The information is not a complete analysis of every aspect of any market, country, industry, security or the Fund. Statements of fact are from sources considered reliable, but Invesco Advisers, Inc. makes no representation or warranty as to their completeness or accuracy. Although historical performance is no guarantee of future results, these insights may help you understand our investment management philosophy.
See important Fund and, if applicable, index disclosures later in this report.
| | |
| 2 | | Invesco Global Infrastructure Fund |
Your Fund’s Long-Term Performance
Results of a $10,000 Investment – Oldest Share Class(es)
Fund and index data from 5/2/14
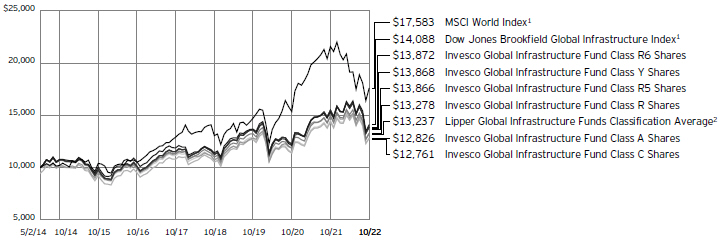
1 Source: RIMES Technologies Corp.
2 Source: Lipper Inc.
Past performance cannot guarantee future results.
The data shown in the chart include reinvested distributions, applicable sales charges and Fund expenses including management
fees. Index results include reinvested dividends, but they do not reflect sales charges. Performance of the peer group, if applicable, reflects fund expenses and management fees;
performance of a market index does not. Performance shown in the chart does not reflect deduction of taxes a shareholder would pay on Fund distributions or sale of Fund shares.
| | |
| 3 | | Invesco Global Infrastructure Fund |
| | | | |
| |
Average Annual Total Returns | |
As of 10/31/22, including maximum applicable sales charges | |
| |
Class A Shares | | | | |
Inception (5/2/14) | | | 2.97 | % |
5 Years | | | 2.30 | |
1 Year | | | -15.66 | |
| |
Class C Shares | | | | |
Inception (5/2/14) | | | 2.91 | % |
5 Years | | | 2.69 | |
1 Year | | | -12.26 | |
| |
Class R Shares | | | | |
Inception (5/2/14) | | | 3.39 | % |
5 Years | | | 3.21 | |
1 Year | | | -10.99 | |
| |
Class Y Shares | | | | |
Inception (5/2/14) | | | 3.92 | % |
5 Years | | | 3.75 | |
1 Year | | | -10.44 | |
| |
Class R5 Shares | | | | |
Inception (5/2/14) | | | 3.92 | % |
5 Years | | | 3.75 | |
1 Year | | | -10.50 | |
Class R6 Shares | | | | |
Inception (5/2/14) | | | 3.93 | % |
5 Years | | | 3.76 | |
1 Year | | | -10.43 | |
The performance data quoted represent past performance and cannot guarantee future results; current performance may be lower or higher. Please visit invesco.com/performance for the most recent month-end performance. Performance figures reflect reinvested distributions, changes in net asset value and the effect of the maximum sales charge unless otherwise stated. Performance figures do not reflect deduction of taxes a shareholder would pay on Fund distributions or sale of Fund shares. Investment return and principal value will fluctuate so that you may have a gain or loss when you sell shares.
Class A share performance reflects the maximum 5.50% sales charge, and Class C share performance reflects the applicable contingent deferred sales charge (CDSC) for the period involved. The CDSC on Class C shares is 1% for the first year after purchase. Class R, Class Y, Class R5 and Class R6 shares do not have a front-end sales charge or a CDSC; therefore, performance is at net asset value.
The performance of the Fund’s share classes will differ primarily due to different sales charge structures and class expenses.
Fund performance reflects any applicable fee waivers and/or expense reimbursements. Had the adviser not waived fees and/or reimbursed expenses currently or in the past, returns would have been lower. See current prospectus for more information.
| | |
| 4 | | Invesco Global Infrastructure Fund |
Supplemental Information
Invesco Global Infrastructure Fund’s investment objective is total return through growth of capital and current income.
| ∎ | Unless otherwise stated, information presented in this report is as of October 31, 2022, and is based on total net assets. |
| ∎ | Unless otherwise noted, all data is provided by Invesco. |
| ∎ | To access your Fund’s reports/prospectus, visit invesco.com/fundreports. |
About indexes used in this report
| ∎ | The MSCI World IndexSM is an unmanaged index considered representative of stocks of developed countries. The index is computed using the net return, which withholds applicable taxes for non-resident investors. |
| ∎ | The Dow Jones Brookfield Global Infrastructure Index is designed to measure the stock performance of infrastructure companies domiciled globally and covers all sectors of the infrastructure market. The index is computed using the net return, which withholds applicable taxes for non-resident investors. |
| ∎ | The Lipper Global Infrastructure Funds Classification Average represents an average of all the funds in the Lipper Global Infrastructure Funds classification. |
| ∎ | The Fund is not managed to track the performance of any particular index, including the index(es) described here, and consequently, the performance of the Fund may deviate significantly from the performance of the index(es). |
| ∎ | A direct investment cannot be made in an index. Unless otherwise indicated, index results include reinvested dividends, and they do not reflect sales charges. Performance of the peer group, if applicable, reflects fund expenses; performance of a market index does not. |
|
|
This report must be accompanied or preceded by a currently effective Fund prospectus, which contains more complete information, including sales charges and expenses. Investors should read it carefully before investing. |
|
| NOT FDIC INSURED | MAY LOSE VALUE | NO BANK GUARANTEE |
| | |
| 5 | | Invesco Global Infrastructure Fund |
Fund Information
Portfolio Composition
| | | | | |
| By infrastructure sector, based on Net Assets | | |
| |
Midstream | | | | 28.82 | % |
| |
Gas Utilities | | | | 26.08 | |
| |
Towers | | | | 18.62 | |
| |
Electric Utilities | | | | 8.58 | |
| |
Diversified | | | | 6.58 | |
| |
Tolls | | | | 4.18 | |
| |
Airports | | | | 2.96 | |
| |
Water Utilities | | | | 2.48 | |
| |
Satellites | | | | 0.88 | |
| |
Money Market Funds Plus Other Assets Less Liabilities | | | | 0.82 | |
Top 10 Equity Holdings*
| | | | |
| | | | | % of total net assets |
| | |
1. | | American Tower Corp. | | 9.03% |
| | |
2. | | Enbridge, Inc. | | 6.77 |
| | |
3. | | Vinci S.A. | | 6.58 |
| | |
4. | | TC Energy Corp. | | 6.23 |
| | |
5. | | Williams Cos., Inc. (The) | | 4.73 |
| | |
6. | | Cheniere Energy, Inc. | | 4.65 |
| | |
7. | | SBA Communications Corp., Class A | | 4.59 |
| | |
8. | | Transurban Group | | 4.18 |
| | |
9. | | Kinder Morgan, Inc. | | 4.01 |
| | |
10. | | Sempra Energy | | 3.87 |
The Fund’s holdings are subject to change, and there is no assurance that the Fund will continue to hold any particular security.
| * | Excluding money market fund holdings, if any. |
Data presented here are as of October 31, 2022.
| | |
| 6 | | Invesco Global Infrastructure Fund |
Schedule of Investments
October 31, 2022
| | | | | | | | |
| | | Shares | | | Value | |
|
| |
Common Stocks & Other Equity Interests–99.18% | |
Australia–5.58% | |
APA Group | | | 235,378 | | | $ | 1,578,295 | |
|
| |
Transurban Group | | | 556,249 | | | | 4,707,382 | |
|
| |
| | | | | | | 6,285,677 | |
|
| |
|
Canada–15.65% | |
Enbridge, Inc. | | | 195,615 | | | | 7,621,569 | |
|
| |
Hydro One Ltd.(a) | | | 119,362 | | | | 2,992,921 | |
|
| |
TC Energy Corp. | | | 159,717 | | | | 7,015,426 | |
|
| |
| | | | | | | 17,629,916 | |
|
| |
|
China–2.52% | |
China Gas Holdings Ltd. | | | 337,800 | | | | 299,612 | |
|
| |
China Resources Gas Group Ltd. | | | 239,300 | | | | 612,940 | |
|
| |
China Water Affairs Group Ltd. | | | 184,000 | | | | 130,351 | |
|
| |
ENN Energy Holdings Ltd. | | | 85,500 | | | | 848,118 | |
|
| |
Guangdong Investment Ltd. | | | 1,498,000 | | | | 945,684 | |
|
| |
| | | | | | | 2,836,705 | |
|
| |
|
France–6.58% | |
Vinci S.A. | | | 80,687 | | | | 7,414,951 | |
|
| |
|
Hong Kong–0.30% | |
Hong Kong & China Gas Co. Ltd. (The) | | | 440,000 | | | | 339,291 | |
|
| |
|
Italy–1.98% | |
Infrastrutture Wireless Italiane
S.p.A.(a) | | | 100,935 | | | | 891,684 | |
|
| |
Italgas S.p.A. | | | 259,819 | | | | 1,340,362 | |
|
| |
| | | | | | | 2,232,046 | |
|
| |
| | |
Japan–2.62% | | | | | | | | |
Japan Airport Terminal Co. Ltd.(b) | | | 10,600 | | | | 453,426 | |
|
| |
Toho Gas Co. Ltd. | | | 72,200 | | | | 1,343,442 | |
|
| |
Tokyo Gas Co. Ltd. | | | 65,100 | | | | 1,157,885 | |
|
| |
| | | | | | | 2,954,753 | |
|
| |
| | |
Luxembourg–0.88% | | | | | | | | |
SES S.A., FDR | | | 140,250 | | | | 993,993 | |
|
| |
|
Mexico–1.42% | |
Grupo Aeroportuario del Sureste S.A.B. de C.V., ADR(c) | | | 6,835 | | | | 1,595,426 | |
|
| |
|
Nigeria–0.52% | |
IHS Holding Ltd.(b) | | | 98,387 | | | | 587,370 | |
|
| |
|
Spain–3.68% | |
Cellnex Telecom S.A.(a) | | | 89,577 | | | | 2,927,255 | |
|
| |
Iberdrola S.A. | | | 120,291 | | | | 1,221,942 | |
|
| |
| | | | | | | 4,149,197 | |
|
| |
| | |
Switzerland–1.14% | | | | | | | | |
Flughafen Zurich AG(b) | | | 8,285 | | | | 1,286,626 | |
|
| |
|
United Kingdom–4.70% | |
National Grid PLC | | | 241,160 | | | | 2,623,980 | |
|
| |
Investment Abbreviations:
ADR - American Depositary Receipt
FDR - Fiduciary Depositary Receipt
| | | | | | | | |
| | | Shares | | | Value | |
|
| |
United Kingdom–(continued) | |
Pennon Group PLC | | | 29,855 | | | $ | 286,834 | |
|
| |
SSE PLC | | | 133,691 | | | | 2,386,675 | |
|
| |
| | | | | | | 5,297,489 | |
|
| |
|
United States–51.61% | |
American Tower Corp. | | | 49,088 | | | | 10,170,543 | |
|
| |
American Water Works Co., Inc. | | | 9,875 | | | | 1,435,233 | |
|
| |
Atmos Energy Corp. | | | 7,841 | | | | 835,459 | |
|
| |
CenterPoint Energy, Inc. | | | 29,134 | | | | 833,524 | |
|
| |
Cheniere Energy, Inc. | | | 29,676 | | | | 5,235,143 | |
|
| |
Crown Castle, Inc. | | | 9,220 | | | | 1,228,657 | |
|
| |
Edison International | | | 26,150 | | | | 1,570,046 | |
|
| |
Kinder Morgan, Inc. | | | 249,444 | | | | 4,519,925 | |
|
| |
NextEra Energy, Inc. | | | 19,399 | | | | 1,503,422 | |
|
| |
NiSource, Inc. | | | 147,333 | | | | 3,784,985 | |
|
| |
ONE Gas, Inc. | | | 44,543 | | | | 3,451,192 | |
|
| |
PG&E Corp.(b)(c) | | | 148,269 | | | | 2,213,656 | |
|
| |
PPL Corp. | | | 141,512 | | | | 3,748,653 | |
|
| |
SBA Communications Corp., Class A | | | 19,143 | | | | 5,166,696 | |
|
| |
Sempra Energy | | | 28,922 | | | | 4,365,487 | |
|
| |
Targa Resources Corp. | | | 40,204 | | | | 2,748,747 | |
|
| |
Williams Cos., Inc. (The) | | | 162,784 | | | | 5,327,920 | |
|
| |
| | | | | | | 58,139,288 | |
|
| |
Total Common Stocks & Other Equity Interests
(Cost $110,714,117) | | | | 111,742,728 | |
|
| |
|
Money Market Funds–0.49% | |
Invesco Government & Agency Portfolio, Institutional Class,
3.07%(d)(e) | | | 193,359 | | | | 193,359 | |
|
| |
Invesco Liquid Assets Portfolio, Institutional Class, 3.03%(d)(e) | | | 138,137 | | | | 138,164 | |
|
| |
Invesco Treasury Portfolio, Institutional Class, 3.08%(d)(e) | | | 220,982 | | | | 220,982 | |
|
| |
Total Money Market Funds (Cost $552,463) | | | | 552,505 | |
|
| |
TOTAL INVESTMENTS IN SECURITIES
(excluding Investments purchased with cash collateral from securities on loan)–99.67% (Cost $111,266,580) | | | | 112,295,233 | |
|
| |
|
Investments Purchased with Cash Collateral from Securities on Loan | |
Money Market Funds–2.44% | |
Invesco Private Government Fund, 3.18%(d)(e)(f) | | | 770,155 | | | | 770,155 | |
|
| |
Invesco Private Prime Fund,
3.28%(d)(e)(f) | | | 1,980,320 | | | | 1,980,320 | |
|
| |
Total Investments Purchased with Cash Collateral from Securities on Loan
(Cost $2,750,474) | | | | 2,750,475 | |
|
| |
TOTAL INVESTMENTS IN SECURITIES–102.11%
(Cost $114,017,054) | | | | 115,045,708 | |
|
| |
OTHER ASSETS LESS LIABILITIES–(2.11)% | | | | (2,381,702 | ) |
|
| |
NET ASSETS–100.00% | | | | | | $ | 112,664,006 | |
|
| |
See accompanying Notes to Financial Statements which are an integral part of the financial statements.
| | |
| 7 | | Invesco Global Infrastructure Fund |
Notes to Schedule of Investments:
| (a) | Security purchased or received in a transaction exempt from registration under the Securities Act of 1933, as amended (the “1933 Act”). The security may be resold pursuant to an exemption from registration under the 1933 Act, typically to qualified institutional buyers. The aggregate value of these securities at October 31, 2022 was $6,811,860, which represented 6.05% of the Fund’s Net Assets. |
| (b) | Non-income producing security. |
| (c) | All or a portion of this security was out on loan at October 31, 2022. |
| (d) | Affiliated issuer. The issuer and/or the Fund is a wholly-owned subsidiary of Invesco Ltd., or is affiliated by having an investment adviser that is under common control of Invesco Ltd. The table below shows the Fund’s transactions in, and earnings from, its investments in affiliates for the fiscal year ended October 31, 2022. |
| | | | | | | | | | | | | | | | | | | | | | | | | | | | |
| | | Value
October 31, 2021 | | Purchases
at Cost | | Proceeds
from Sales | | Change in
Unrealized
Appreciation | | Realized
Gain
(Loss) | | Value
October 31, 2022 | | Dividend Income |
| Investments in Affiliated Money Market Funds: | | | | | | | | | | | | | | | | | | | | | | | | | | | | |
Invesco Government & Agency Portfolio, Institutional Class | | | $ 465,295 | | | | $14,043,741 | | | | $(14,315,677 | ) | | | $ - | | | | $ - | | | | $ 193,359 | | | | $ 5,035 | |
Invesco Liquid Assets Portfolio, Institutional Class | | | 315,112 | | | | 10,031,243 | | | | (10,208,256 | ) | | | 33 | | | | 32 | | | | 138,164 | | | | 4,411 | |
Invesco Treasury Portfolio, Institutional Class | | | 531,766 | | | | 16,049,990 | | | | (16,360,774 | ) | | | - | | | | - | | | | 220,982 | | | | 6,845 | |
| Investments Purchased with Cash Collateral from Securities on Loan: | | | | | | | | | | | | | | | | | | | | | | | | | | | | |
Invesco Private Government Fund | | | - | | | | 5,095,901 | | | | (4,325,746 | ) | | | - | | | | - | | | | 770,155 | | | | 8,056 | * |
Invesco Private Prime Fund | | | - | | | | 12,472,328 | | | | (10,491,593 | ) | | | 1 | | | | (416 | ) | | | 1,980,320 | | | | 22,074 | * |
Total | | | $1,312,173 | | | | $57,693,203 | | | | $(55,702,046 | ) | | | $34 | | | | $(384 | ) | | | $3,302,980 | | | | $46,421 | |
| | * | Represents the income earned on the investment of cash collateral, which is included in securities lending income on the Statement of Operations. Does not include rebates and fees paid to lending agent or premiums received from borrowers, if any. |
| (e) | The rate shown is the 7-day SEC standardized yield as of October 31, 2022. |
| (f) | The security has been segregated to satisfy the commitment to return the cash collateral received in securities lending transactions upon the borrower’s return of the securities loaned. See Note 1K. |
See accompanying Notes to Financial Statements which are an integral part of the financial statements.
| | |
| 8 | | Invesco Global Infrastructure Fund |
Statement of Assets and Liabilities
October 31, 2022
| | | | |
Assets: | | | | |
| |
Investments in unaffiliated securities, at value
(Cost $110,714,117)* | | | $111,742,728 | |
|
| |
Investments in affiliated money market funds, at value (Cost $3,302,937) | | | 3,302,980 | |
|
| |
Foreign currencies, at value (Cost $913,261) | | | 912,816 | |
|
| |
Receivable for: | | | | |
Investments sold | | | 3,258,110 | |
|
| |
Fund shares sold | | | 41,988 | |
|
| |
Dividends | | | 141,794 | |
|
| |
Investment for trustee deferred compensation and retirement plans | | | 19,749 | |
|
| |
Other assets | | | 40,870 | |
|
| |
Total assets | | | 119,461,035 | |
|
| |
| |
Liabilities: | | | | |
Payable for: | | | | |
Investments purchased | | | 3,780,286 | |
|
| |
Fund shares reacquired | | | 149,928 | |
|
| |
Collateral upon return of securities loaned | | | 2,750,474 | |
|
| |
Accrued fees to affiliates | | | 37,247 | |
|
| |
Accrued trustees’ and officers’ fees and benefits | | | 795 | |
|
| |
Accrued other operating expenses | | | 58,550 | |
|
| |
Trustee deferred compensation and retirement plans | | | 19,749 | |
|
| |
Total liabilities | | | 6,797,029 | |
|
| |
Net assets applicable to shares outstanding | | | $112,664,006 | |
|
| |
| |
Net assets consist of: | | | | |
Shares of beneficial interest | | | $115,184,692 | |
|
| |
Distributable earnings (loss) | | | (2,520,686 | ) |
|
| |
| | | $112,664,006 | |
|
| |
| | | | |
Net Assets: | | | | |
| |
Class A | | $ | 22,736,559 | |
|
| |
Class C | | $ | 3,186,808 | |
|
| |
Class R | | $ | 5,267,143 | |
|
| |
Class Y | | $ | 26,747,269 | |
|
| |
Class R5 | | $ | 124,783 | |
|
| |
Class R6 | | $ | 54,601,444 | |
|
| |
|
Shares outstanding, no par value, with an unlimited number of shares authorized: | |
| |
Class A | | | 2,043,771 | |
|
| |
Class C | | | 286,990 | |
|
| |
Class R | | | 473,914 | |
|
| |
Class Y | | | 2,403,840 | |
|
| |
Class R5 | | | 11,201 | |
|
| |
Class R6 | | | 4,903,514 | |
|
| |
Class A: | | | | |
Net asset value per share | | $ | 11.12 | |
|
| |
Maximum offering price per share
(Net asset value of $11.12 ÷ 94.50%) | | $ | 11.77 | |
|
| |
Class C: | | | | |
Net asset value and offering price per share | | $ | 11.10 | |
|
| |
Class R: | | | | |
Net asset value and offering price per share | | $ | 11.11 | |
|
| |
Class Y: | | | | |
Net asset value and offering price per share | | $ | 11.13 | |
|
| |
Class R5: | | | | |
Net asset value and offering price per share | | $ | 11.14 | |
|
| |
Class R6: | | | | |
Net asset value and offering price per share | | $ | 11.14 | |
|
| |
| * | At October 31, 2022, securities with an aggregate value of $2,635,013 were on loan to brokers. |
See accompanying Notes to Financial Statements which are an integral part of the financial statements.
| | |
| 9 | | Invesco Global Infrastructure Fund |
Statement of Operations
For the year ended October 31, 2022
| | | | |
Investment income: | | | | |
| |
Dividends (net of foreign withholding taxes of $224,719) | | $ | 3,732,129 | |
|
| |
Dividends from affiliated money market funds (includes net securities lending income of $4,982) | | | 21,273 | |
|
| |
Total investment income | | | 3,753,402 | |
|
| |
| |
Expenses: | | | | |
| |
Advisory fees | | | 1,029,256 | |
|
| |
Administrative services fees | | | 17,818 | |
|
| |
Custodian fees | | | 14,167 | |
|
| |
Distribution fees: | | | | |
Class A | | | 55,889 | |
|
| |
Class C | | | 34,075 | |
|
| |
Class R | | | 27,858 | |
|
| |
Transfer agent fees – A, C, R and Y | | | 115,706 | |
|
| |
Transfer agent fees – R5 | | | 130 | |
|
| |
Transfer agent fees – R6 | | | 20,457 | |
|
| |
Trustees’ and officers’ fees and benefits | | | 19,889 | |
|
| |
Registration and filing fees | | | 79,253 | |
|
| |
Reports to shareholders | | | 10,588 | |
|
| |
Professional services fees | | | 69,458 | |
|
| |
Other | | | 17,041 | |
|
| |
Total expenses | | | 1,511,585 | |
|
| |
Less: Fees waived, expenses reimbursed and/or expense offset arrangement(s) | | | (169,382 | ) |
|
| |
Net expenses | | | 1,342,203 | |
|
| |
Net investment income | | | 2,411,199 | |
|
| |
| |
Realized and unrealized gain (loss) from: | | | | |
| |
Net realized gain (loss) from: | | | | |
Unaffiliated investment securities | | | 1,599,716 | |
|
| |
Affiliated investment securities | | | (384 | ) |
|
| |
Foreign currencies | | | (28,415 | ) |
|
| |
| | | 1,570,917 | |
|
| |
Change in net unrealized appreciation (depreciation) of: | | | | |
Unaffiliated investment securities | | | (17,456,123 | ) |
|
| |
Affiliated investment securities | | | 34 | |
|
| |
Foreign currencies | | | (2,350 | ) |
|
| |
| | | (17,458,439 | ) |
|
| |
Net realized and unrealized gain (loss) | | | (15,887,522 | ) |
|
| |
Net increase (decrease) in net assets resulting from operations | | $ | (13,476,323 | ) |
|
| |
See accompanying Notes to Financial Statements which are an integral part of the financial statements.
| | |
| 10 | | Invesco Global Infrastructure Fund |
Statement of Changes in Net Assets
For the years ended October 31, 2022 and 2021
| | | | | | | | |
| | | 2022 | | | 2021 | |
|
| |
Operations: | | | | | | | | |
| | |
Net investment income | | $ | 2,411,199 | | | $ | 1,898,175 | |
|
| |
Net realized gain | | | 1,570,917 | | | | 6,242,767 | |
|
| |
Change in net unrealized appreciation (depreciation) | | | (17,458,439 | ) | | | 14,706,466 | |
|
| |
Net increase (decrease) in net assets resulting from operations | | | (13,476,323 | ) | | | 22,847,408 | |
|
| |
| | |
Distributions to shareholders from distributable earnings: | | | | | | | | |
| | |
Class A | | | (425,602 | ) | | | (262,127 | ) |
|
| |
Class C | | | (38,107 | ) | | | (23,024 | ) |
|
| |
Class R | | | (90,182 | ) | | | (58,212 | ) |
|
| |
Class Y | | | (598,947 | ) | | | (292,833 | ) |
|
| |
Class R5 | | | (2,384 | ) | | | (352 | ) |
|
| |
Class R6 | | | (1,341,029 | ) | | | (1,216,300 | ) |
|
| |
Total distributions from distributable earnings | | | (2,496,251 | ) | | | (1,852,848 | ) |
|
| |
| | |
Share transactions–net: | | | | | | | | |
| | |
Class A | | | 5,208,346 | | | | 5,390,841 | |
|
| |
Class C | | | 486,101 | | | | 517,509 | |
|
| |
Class R | | | 757,000 | | | | 1,077,445 | |
|
| |
Class Y | | | 8,939,989 | | | | 6,592,094 | |
|
| |
Class R5 | | | 107,632 | | | | 24,765 | |
|
| |
Class R6 | | | (5,267,234 | ) | | | 6,199,734 | |
|
| |
Net increase in net assets resulting from share transactions | | | 10,231,834 | | | | 19,802,388 | |
|
| |
Net increase (decrease) in net assets | | | (5,740,740 | ) | | | 40,796,948 | |
|
| |
| | |
Net assets: | | | | | | | | |
| | |
Beginning of year | | | 118,404,746 | | | | 77,607,798 | |
|
| |
End of year | | $ | 112,664,006 | | | $ | 118,404,746 | |
|
| |
See accompanying Notes to Financial Statements which are an integral part of the financial statements.
| | |
| 11 | | Invesco Global Infrastructure Fund |
Financial Highlights
The following schedule presents financial highlights for a share of the Fund outstanding throughout the periods indicated.
| | | | | | | | | | | | | | | | | | | | | | | | | | | | | | | | | | | | | | | | | | | | | | | | | | | | | | | | | | | | | | | | | | | | | | | | | | | |
| | | Net asset value, beginning of period | | Net investment income(a) | | Net gains (losses) on securities (both realized and unrealized) | | Total from investment operations | | Dividends from net investment income | | Distributions from net realized gains | | Return of
capital | | Total distributions | | Net asset value, end of period | | Total return (b) | | Net assets, end of period (000’s omitted) | | Ratio of expenses to average net assets with fee waivers and/or expenses absorbed | | Ratio of expenses to average net assets without fee waivers and/or expenses absorbed | | Ratio of net investment income to average net assets | | Portfolio turnover (c) |
Class A | | | | | | | | | | | | | | | | | | | | | | | | | | | | | | | | | | | | | | | | | | | | | | | | | | | | | | | | | | | | | | | | | | | | | | | | | | | |
Year ended 10/31/22 | | | | $12.70 | | | | | $0.22 | | | | | $(1.57 | ) | | | | $(1.35 | ) | | | | $(0.23 | ) | | | $ | – | | | | $ | – | | | | | $(0.23 | ) | | | | $11.12 | | | | | (10.74 | )% | | | | $22,737 | | | | | 1.25 | % | | | | 1.47 | % | | | | 1.81 | % | | | | 127 | % |
Year ended 10/31/21 | | | | 10.23 | | | | | 0.20 | (d) | | | | 2.46 | | | | | 2.66 | | | | | (0.19 | ) | | | | – | | | | | – | | | | | (0.19 | ) | | | | 12.70 | | | | | 26.22 | | | | | 20,774 | | | | | 1.29 | | | | | 1.62 | | | | | 1.65 | (d) | | | | 103 | |
Year ended 10/31/20 | | | | 11.88 | | | | | 0.19 | | | | | (1.38 | ) | | | | (1.19 | ) | | | | (0.20 | ) | | | | (0.26 | ) | | | | – | | | | | (0.46 | ) | | | | 10.23 | | | | | (10.28 | ) | | | | 12,198 | | | | | 1.28 | | | | | 1.58 | | | | | 1.77 | | | | | 244 | |
Year ended 10/31/19 | | | | 10.01 | | | | | 0.19 | | | | | 1.85 | | | | | 2.04 | | | | | (0.17 | ) | | | | – | | | | | – | | | | | (0.17 | ) | | | | 11.88 | | | | | 20.55 | | | | | 8,918 | | | | | 1.28 | | | | | 2.35 | | | | | 1.77 | | | | | 106 | |
Year ended 10/31/18 | | | | 10.74 | | | | | 0.18 | | | | | (0.45 | ) | | | | (0.27 | ) | | | | (0.19 | ) | | | | (0.25 | ) | | | | (0.02 | ) | | | | (0.46 | ) | | | | 10.01 | | | | | (2.65 | ) | | | | 8,098 | | | | | 1.28 | | | | | 2.56 | | | | | 1.76 | | | | | 114 | |
Class C | | | | | | | | | | | | | | | | | | | | | | | | | | | | | | | | | | | | | | | | | | | | | | | | | | | | | | | | | | | | | | | | | | | | | | | | | | | |
Year ended 10/31/22 | | | | 12.67 | | | | | 0.13 | | | | | (1.56 | ) | | | | (1.43 | ) | | | | (0.14 | ) | | | | – | | | | | – | | | | | (0.14 | ) | | | | 11.10 | | | | | (11.38 | ) | | | | 3,187 | | | | | 2.00 | | | | | 2.22 | | | | | 1.06 | | | | | 127 | |
Year ended 10/31/21 | | | | 10.21 | | | | | 0.11 | (d) | | | | 2.46 | | | | | 2.57 | | | | | (0.11 | ) | | | | – | | | | | – | | | | | (0.11 | ) | | | | 12.67 | | | | | 25.23 | | | | | 3,178 | | | | | 2.04 | | | | | 2.37 | | | | | 0.90 | (d) | | | | 103 | |
Year ended 10/31/20 | | | | 11.85 | | | | | 0.11 | | | | | (1.37 | ) | | | | (1.26 | ) | | | | (0.12 | ) | | | | (0.26 | ) | | | | – | | | | | (0.38 | ) | | | | 10.21 | | | | | (10.94 | ) | | | | 2,130 | | | | | 2.03 | | | | | 2.33 | | | | | 1.02 | | | | | 244 | |
Year ended 10/31/19 | | | | 9.99 | | | | | 0.11 | | | | | 1.84 | | | | | 1.95 | | | | | (0.09 | ) | | | | – | | | | | – | | | | | (0.09 | ) | | | | 11.85 | | | | | 19.60 | | | | | 1,191 | | | | | 2.03 | | | | | 3.10 | | | | | 1.02 | | | | | 106 | |
Year ended 10/31/18 | | | | 10.72 | | | | | 0.10 | | | | | (0.44 | ) | | | | (0.34 | ) | | | | (0.13 | ) | | | | (0.25 | ) | | | | (0.01 | ) | | | | (0.39 | ) | | | | 9.99 | | | | | (3.39 | ) | | | | 1,579 | | | | | 2.03 | | | | | 3.31 | | | | | 1.01 | | | | | 114 | |
Class R | | | | | | | | | | | | | | | | | | | | | | | | | | | | | | | | | | | | | | | | | | | | | | | | | | | | | | | | | | | | | | | | | | | | | | | | | | | |
Year ended 10/31/22 | | | | 12.69 | | | | | 0.19 | | | | | (1.57 | ) | | | | (1.38 | ) | | | | (0.20 | ) | | | | – | | | | | – | | | | | (0.20 | ) | | | | 11.11 | | | | | (10.99 | ) | | | | 5,267 | | | | | 1.50 | | | | | 1.72 | | | | | 1.56 | | | | | 127 | |
Year ended 10/31/21 | | | | 10.22 | | | | | 0.17 | (d) | | | | 2.47 | | | | | 2.64 | | | | | (0.17 | ) | | | | – | | | | | – | | | | | (0.17 | ) | | | | 12.69 | | | | | 25.93 | | | | | 5,241 | | | | | 1.54 | | | | | 1.87 | | | | | 1.40 | (d) | | | | 103 | |
Year ended 10/31/20 | | | | 11.87 | | | | | 0.16 | | | | | (1.37 | ) | | | | (1.21 | ) | | | | (0.18 | ) | | | | (0.26 | ) | | | | – | | | | | (0.44 | ) | | | | 10.22 | | | | | (10.53 | ) | | | | 3,326 | | | | | 1.53 | | | | | 1.83 | | | | | 1.52 | | | | | 244 | |
Year ended 10/31/19 | | | | 10.01 | | | | | 0.17 | | | | | 1.84 | | | | | 2.01 | | | | | (0.15 | ) | | | | – | | | | | – | | | | | (0.15 | ) | | | | 11.87 | | | | | 20.15 | | | | | 495 | | | | | 1.53 | | | | | 2.60 | | | | | 1.52 | | | | | 106 | |
Year ended 10/31/18 | | | | 10.73 | | | | | 0.16 | | | | | (0.44 | ) | | | | (0.28 | ) | | | | (0.18 | ) | | | | (0.25 | ) | | | | (0.01 | ) | | | | (0.44 | ) | | | | 10.01 | | | | | (2.80 | ) | | | | 351 | | | | | 1.53 | | | | | 2.81 | | | | | 1.51 | | | | | 114 | |
Class Y | | | | | | | | | | | | | | | | | | | | | | | | | | | | | | | | | | | | | | | | | | | | | | | | | | | | | | | | | | | | | | | | | | | | | | | | | | | |
Year ended 10/31/22 | | | | 12.70 | | | | | 0.26 | | | | | (1.56 | ) | | | | (1.30 | ) | | | | (0.27 | ) | | | | – | | | | | – | | | | | (0.27 | ) | | | | 11.13 | | | | | (10.44 | ) | | | | 26,747 | | | | | 1.00 | | | | | 1.22 | | | | | 2.06 | | | | | 127 | |
Year ended 10/31/21 | | | | 10.23 | | | | | 0.23 | (d) | | | | 2.46 | | | | | 2.69 | | | | | (0.22 | ) | | | | – | | | | | – | | | | | (0.22 | ) | | | | 12.70 | | | | | 26.53 | | | | | 21,558 | | | | | 1.04 | | | | | 1.37 | | | | | 1.90 | (d) | | | | 103 | |
Year ended 10/31/20 | | | | 11.89 | | | | | 0.22 | | | | | (1.39 | ) | | | | (1.17 | ) | | | | (0.23 | ) | | | | (0.26 | ) | | | | – | | | | | (0.49 | ) | | | | 10.23 | | | | | (10.11 | ) | | | | 11,910 | | | | | 1.03 | | | | | 1.33 | | | | | 2.02 | | | | | 244 | |
Year ended 10/31/19 | | | | 10.02 | | | | | 0.22 | | | | | 1.85 | | | | | 2.07 | | | | | (0.20 | ) | | | | – | | | | | – | | | | | (0.20 | ) | | | | 11.89 | | | | | 20.82 | | | | | 11,108 | | | | | 1.03 | | | | | 2.10 | | | | | 2.02 | | | | | 106 | |
Year ended 10/31/18 | | | | 10.74 | | | | | 0.21 | | | | | (0.44 | ) | | | | (0.23 | ) | | | | (0.22 | ) | | | | (0.25 | ) | | | | (0.02 | ) | | | | (0.49 | ) | | | | 10.02 | | | | | (2.31 | ) | | | | 9,775 | | | | | 1.03 | | | | | 2.31 | | | | | 2.01 | | | | | 114 | |
Class R5 | | | | | | | | | | | | | | | | | | | | | | | | | | | | | | | | | | | | | | | | | | | | | | | | | | | | | | | | | | | | | | | | | | | | | | | | | | | |
Year ended 10/31/22 | | | | 12.72 | | | | | 0.26 | | | | | (1.57 | ) | | | | (1.31 | ) | | | | (0.27 | ) | | | | – | | | | | – | | | | | (0.27 | ) | | | | 11.14 | | | | | (10.50 | ) | | | | 125 | | | | | 1.00 | | | | | 1.13 | | | | | 2.06 | | | | | 127 | |
Year ended 10/31/21 | | | | 10.24 | | | | | 0.23 | (d) | | | | 2.47 | | | | | 2.70 | | | | | (0.22 | ) | | | | – | | | | | – | | | | | (0.22 | ) | | | | 12.72 | | | | | 26.61 | | | | | 37 | | | | | 1.02 | | | | | 1.14 | | | | | 1.92 | (d) | | | | 103 | |
Year ended 10/31/20 | | | | 11.89 | | | | | 0.22 | | | | | (1.39 | ) | | | | (1.17 | ) | | | | (0.22 | ) | | | | (0.26 | ) | | | | – | | | | | (0.48 | ) | | | | 10.24 | | | | | (10.11 | ) | | | | 10 | | | | | 1.03 | | | | | 1.15 | | | | | 2.02 | | | | | 244 | |
Year ended 10/31/19 | | | | 10.02 | | | | | 0.22 | | | | | 1.85 | | | | | 2.07 | | | | | (0.20 | ) | | | | – | | | | | – | | | | | (0.20 | ) | | | | 11.89 | | | | | 20.82 | | | | | 12 | | | | | 1.03 | | | | | 2.00 | | | | | 2.02 | | | | | 106 | |
Year ended 10/31/18 | | | | 10.74 | | | | | 0.21 | | | | | (0.44 | ) | | | | (0.23 | ) | | | | (0.22 | ) | | | | (0.25 | ) | | | | (0.02 | ) | | | | (0.49 | ) | | | | 10.02 | | | | | (2.31 | ) | | | | 10 | | | | | 1.03 | | | | | 2.19 | | | | | 2.01 | | | | | 114 | |
Class R6 | | | | | | | | | | | | | | | | | | | | | | | | | | | | | | | | | | | | | | | | | | | | | | | | | | | | | | | | | | | | | | | | | | | | | | | | | | | |
Year ended 10/31/22 | | | | 12.71 | | | | | 0.26 | | | | | (1.56 | ) | | | | (1.30 | ) | | | | (0.27 | ) | | | | – | | | | | – | | | | | (0.27 | ) | | | | 11.14 | | | | | (10.43 | ) | | | | 54,601 | | | | | 1.00 | | | | | 1.06 | | | | | 2.06 | | | | | 127 | |
Year ended 10/31/21 | | | | 10.24 | | | | | 0.23 | (d) | | | | 2.47 | | | | | 2.70 | | | | | (0.23 | ) | | | | – | | | | | – | | | | | (0.23 | ) | | | | 12.71 | | | | | 26.53 | | | | | 67,617 | | | | | 1.02 | | | | | 1.14 | | | | | 1.92 | (d) | | | | 103 | |
Year ended 10/31/20 | | | | 11.89 | | | | | 0.22 | | | | | (1.39 | ) | | | | (1.17 | ) | | | | (0.22 | ) | | | | (0.26 | ) | | | | – | | | | | (0.48 | ) | | | | 10.24 | | | | | (10.10 | ) | | | | 48,033 | | | | | 1.00 | | | | | 1.15 | | | | | 2.05 | | | | | 244 | |
Year ended 10/31/19 | | | | 10.02 | | | | | 0.22 | | | | | 1.85 | | | | | 2.07 | | | | | (0.20 | ) | | | | – | | | | | – | | | | | (0.20 | ) | | | | 11.89 | | | | | 20.82 | | | | | 12 | | | | | 1.03 | | | | | 2.00 | | | | | 2.02 | | | | | 106 | |
Year ended 10/31/18 | | | | 10.74 | | | | | 0.21 | | | | | (0.44 | ) | | | | (0.23 | ) | | | | (0.22 | ) | | | | (0.25 | ) | | | | (0.02 | ) | | | | (0.49 | ) | | | | 10.02 | | | | | (2.31 | ) | | | | 229 | | | | | 1.03 | | | | | 2.19 | | | | | 2.01 | | | | | 114 | |
| (a) | Calculated using average shares outstanding. |
| (b) | Includes adjustments in accordance with accounting principles generally accepted in the United States of America and as such, the net asset value for financial reporting purposes and the returns based upon those net asset values may differ from the net asset value and returns for shareholder transactions. Does not include sales charges and is not annualized for periods less than one year, if applicable. |
| (c) | Portfolio turnover is calculated at the fund level and is not annualized for periods less than one year, if applicable. For the year ended October 31, 2020, the portfolio turnover calculation excludes the value of securities purchased of $109,495,771 and sold of $26,558,548 in the effort to realign the Fund’s portfolio holdings after the reorganization of Invesco Oppenheimer Global Infrastructure Fund into the Fund. |
| (d) | Net investment income per share and the ratio of net investment income to average net assets includes significant dividends received during the period. Net investment income per share and the ratio of net investment income to average net assets excluding the significant dividends for the year ended October 31, 2021 are $0.16 and 1.31%, $0.07 and 0.56%, $0.13 and 1.06%, $0.19 and 1.56%, $0.19 and 1.58% and $0.19 and 1.58% for Class A, Class C, Class R, Class Y, Class R5 and Class R6 shares, respectively. |
See accompanying Notes to Financial Statements which are an integral part of the financial statements.
| | |
| 12 | | Invesco Global Infrastructure Fund |
Notes to Financial Statements
October 31, 2022
NOTE 1–Significant Accounting Policies
Invesco Global Infrastructure Fund (the “Fund”) is a series portfolio of AIM Investment Funds (Invesco Investment Funds) (the “Trust”). The Trust is organized as a Delaware statutory trust and is registered under the Investment Company Act of 1940, as amended (the “1940 Act”), as an open-end series management investment company authorized to issue an unlimited number of shares of beneficial interest. Information presented in these financial statements pertains only to the Fund. Matters affecting the Fund or each class will be voted on exclusively by the shareholders of the Fund or each class.
The Fund’s investment objective is total return through growth of capital and current income.
The Fund currently consists of six different classes of shares: Class A, Class C, Class R, Class Y, Class R5 and Class R6. Class Y shares are available only to certain investors. Class A shares are sold with a front-end sales charge unless certain waiver criteria are met. Under certain circumstances, load waived shares may be subject to contingent deferred sales charges (“CDSC”). Class C shares are sold with a CDSC. Class R, Class Y, Class R5 and Class R6 shares are sold at net asset value. Class C shares held for eight years after purchase are eligible for automatic conversion into Class A shares of the same Fund (the “Conversion Feature”). The automatic conversion pursuant to the Conversion Feature will generally occur at the end of the month following the eighth anniversary after a purchase of Class C shares.
The Fund is an investment company and accordingly follows the investment company accounting and reporting guidance in accordance with Financial Accounting Standards Board Accounting Standards Codification Topic 946, Financial Services – Investment Companies.
The following is a summary of the significant accounting policies followed by the Fund in the preparation of its financial statements.
| A. | Security Valuations – Securities, including restricted securities, are valued according to the following policy. |
A security listed or traded on an exchange is generally valued at its trade price or official closing price that day as of the close of the exchange where the security is principally traded, or lacking any trades or official closing price on a particular day, the security may be valued at the closing bid price on that day. Securities traded in the over-the-counter market are valued based on prices furnished by independent pricing services or market makers. When such securities are valued using prices provided by an independent pricing service they may be considered fair valued. Futures contracts are valued at the daily settlement price set by an exchange on which they are principally traded. U.S. exchange-traded options are valued at the mean between the last bid and asked prices from the exchange on which they are principally traded. Non-U.S. exchange-traded options are valued at the final settlement price set by the exchange on which they trade. Options not listed on an exchange and swaps generally are valued using pricing provided from independent pricing services.
Securities of investment companies that are not exchange-traded (e.g., open-end mutual funds) are valued using such company’s end-of-business-day net asset value per share.
Deposits, other obligations of U.S. and non-U.S. banks and financial institutions are valued at their daily account value.
Fixed income securities (including convertible debt securities) generally are valued on the basis of prices provided by independent pricing services. Prices provided by the pricing service may be determined without exclusive reliance on quoted prices, and may reflect appropriate factors such as institution-size trading in similar groups of securities, developments related to specific securities, dividend rate (for unlisted equities), yield (for debt obligations), quality, type of issue, coupon rate (for debt obligations), maturity (for debt obligations), individual trading characteristics and other market data. Pricing services generally value debt obligations assuming orderly transactions of institutional round lot size, but a fund may hold or transact in the same securities in smaller, odd lot sizes. Odd lots often trade at lower prices than institutional round lots, and their value may be adjusted accordingly. Debt obligations are subject to interest rate and credit risks. In addition, all debt obligations involve some risk of default with respect to interest and/or principal payments.
Foreign securities’ (including foreign exchange contracts) prices are converted into U.S. dollar amounts using the applicable exchange rates as of the close of the New York Stock Exchange (“NYSE”). If market quotations are available and reliable for foreign exchange-traded equity securities, the securities will be valued at the market quotations. Invesco Advisers, Inc. (the “Adviser” or “Invesco”) may use various pricing services to obtain market quotations as well as fair value prices. Because trading hours for certain foreign securities end before the close of the NYSE, closing market quotations may become not representative of market value in the Adviser’s judgment (“unreliable”). If, between the time trading ends on a particular security and the close of the customary trading session on the NYSE, a significant event occurs that makes the closing price of the security unreliable, the Adviser may fair value the security. If the event is likely to have affected the closing price of the security, the security will be valued at fair value in good faith in accordance with Board- approved policies and related Adviser procedures (“Valuation Procedures”). Adjustments to closing prices to reflect fair value may also be based on a screening process of an independent pricing service to indicate the degree of certainty, based on historical data, that the closing price in the principal market where a foreign security trades is not the current value as of the close of the NYSE. Foreign securities’ prices meeting the degree of certainty that the price is not reflective of current value will be priced at the indication of fair value from the independent pricing service. Multiple factors may be considered by the independent pricing service in determining adjustments to reflect fair value and may include information relating to sector indices, American Depositary Receipts and domestic and foreign index futures. Foreign securities may have additional risks including exchange rate changes, potential for sharply devalued currencies and high inflation, political and economic upheaval, the relative lack of issuer information, relatively low market liquidity and the potential lack of strict financial and accounting controls and standards.
Unlisted securities will be valued using prices provided by independent pricing services or by another method that the Adviser, in its judgment, believes better reflects the security’s fair value in accordance with the Valuation Procedures.
Securities for which market prices are not provided by any of the above methods may be valued based upon quotes furnished by independent sources. The last bid price may be used to value equity securities. The mean between the last bid and asked prices may be used to value debt obligations, including corporate loans.
Securities for which market quotations are not readily available are fair valued by the Adviser in accordance with the Valuation Procedures. If a fair value price provided by a pricing service is unreliable, the Adviser will fair value the security using the Valuation Procedures. Issuer specific events, market trends, bid/asked quotes of brokers and information providers and other market data may be reviewed in the course of making a good faith determination of a security’s fair value.
The Fund may invest in securities that are subject to interest rate risk, meaning the risk that the prices will generally fall as interest rates rise and, conversely, the prices will generally rise as interest rates fall. Specific securities differ in their sensitivity to changes in interest rates depending on their individual characteristics. Changes in interest rates may result in increased market volatility, which may affect the value and/or liquidity of certain Fund investments.
Valuations change in response to many factors including the historical and prospective earnings of the issuer, the value of the issuer’s assets, general market conditions which are not specifically related to the particular issuer, such as real or perceived adverse economic conditions, changes in the general outlook for revenues or corporate earnings, changes in interest or currency rates, regional or global instability, natural or environmental disasters, widespread disease or other public health issues, war, acts of terrorism, significant governmental actions or adverse investor sentiment generally and market liquidity. Because of the inherent uncertainties of valuation, the values reflected in the financial statements may materially differ from the value received upon actual sale of those investments.
The price the Fund could receive upon the sale of any investment may differ from the Adviser’s valuation of the investment, particularly for securities that are valued using a fair valuation technique. When fair valuation techniques are applied, the Adviser uses available information, including both observable and unobservable inputs and assumptions, to determine a methodology that will result in a valuation that the Adviser believes approximates market value. Fund securities that are fair valued may be subject to greater fluctuation in their value from one day to the next than would be the case if market quotations were used. Because of the inherent uncertainties of valuation, and the degree of subjectivity in such decisions, the Fund could realize a greater or lesser than expected gain or loss upon the sale of the investment.
| | |
| 13 | | Invesco Global Infrastructure Fund |
| B. | Securities Transactions and Investment Income – Securities transactions are accounted for on a trade date basis. Realized gains or losses on sales are computed on the basis of specific identification of the securities sold. Interest income (net of withholding tax, if any) is recorded on an accrual basis from settlement date and includes coupon interest and amortization of premium and accretion of discount on debt securities as applicable. Dividend income (net of withholding tax, if any) is recorded on the ex-dividend date. |
The Fund may periodically participate in litigation related to Fund investments. As such, the Fund may receive proceeds from litigation settlements. Any proceeds received are included in the Statement of Operations as realized gain (loss) for investments no longer held and as unrealized gain (loss) for investments still held.
Brokerage commissions and mark ups are considered transaction costs and are recorded as an increase to the cost basis of securities purchased and/or a reduction of proceeds on a sale of securities. Such transaction costs are included in the determination of net realized and unrealized gain (loss) from investment securities reported in the Statement of Operations and the Statement of Changes in Net Assets and the net realized and unrealized gains (losses) on securities per share in the Financial Highlights. Transaction costs are included in the calculation of the Fund’s net asset value and, accordingly, they reduce the Fund’s total returns. These transaction costs are not considered operating expenses and are not reflected in net investment income reported in the Statement of Operations and the Statement of Changes in Net Assets, or the net investment income per share and the ratios of expenses and net investment income reported in the Financial Highlights, nor are they limited by any expense limitation arrangements between the Fund and the investment adviser.
The Fund allocates income and realized and unrealized capital gains and losses to a class based on the relative net assets of each class.
| C. | Country Determination – For the purposes of making investment selection decisions and presentation in the Schedule of Investments, the investment adviser may determine the country in which an issuer is located and/or credit risk exposure based on various factors. These factors include the laws of the country under which the issuer is organized, where the issuer maintains a principal office, the country in which the issuer derives 50% or more of its total revenues, the country that has the primary market for the issuer’s securities and its “country of risk” as determined by a third party service provider, as well as other criteria. Among the other criteria that may be evaluated for making this determination are the country in which the issuer maintains 50% or more of its assets, the type of security, financial guarantees and enhancements, the nature of the collateral and the sponsor organization. Country of issuer and/or credit risk exposure has been determined to be the United States of America, unless otherwise noted. |
| D. | Distributions – Distributions from net investment income, if any, are declared and paid quarterly and are recorded on the ex-dividend date. Distributions from net realized capital gain, if any, are generally declared and paid annually and recorded on the ex-dividend date. The Fund may elect to treat a portion of the proceeds from redemptions as distributions for federal income tax purposes. |
| E. | Master Limited Partnerships – The Fund invests in Master Limited Partnerships (“MLPs”). MLPs are publicly traded partnerships and limited liability companies taxed as partnerships under the Internal Revenue Code of 1986, as amended (the “Internal Revenue Code”). The Fund invests in MLPs engaged in, among other things, the transportation, storage, processing, refining, marketing, exploration, production and mining of minerals and natural resources. The Fund is a partner in each MLP; accordingly, the Fund is required to take into account the Fund’s allocable share of income, gains, losses, deductions, expenses, and tax credits recognized by each MLP. |
MLP’s may be less liquid and subject to more abrupt or erratic price movements than conventional publicly traded securities.
| F. | Return of Capital – Distributions received from the Fund’s investments in MLPs generally are comprised of income and return of capital. The Fund records investment income and return of capital based on estimates made at the time such distributions are received. The return of capital portion of the distribution is a reduction to investment income that results in an equivalent reduction in the cost basis of the associated investments and increases net realized gains (losses) and change in unrealized appreciation (depreciation). Such estimates are based on historical information available from each MLP and other industry sources. These estimates will subsequently be revised and may materially differ primarily based on information received from the MLPs after their tax reporting periods are concluded. |
| G. | Federal Income Taxes – The Fund intends to comply with the requirements of Subchapter M of the Internal Revenue Code of 1986, as amended (the “Internal Revenue Code”), necessary to qualify as a regulated investment company and to distribute substantially all of the Fund’s taxable earnings to shareholders. As such, the Fund will not be subject to federal income taxes on otherwise taxable income (including net realized capital gain) that is distributed to shareholders. Therefore, no provision for federal income taxes is recorded in the financial statements. |
The Fund recognizes the tax benefits of uncertain tax positions only when the position is more likely than not to be sustained. Management has analyzed the Fund’s uncertain tax positions and concluded that no liability for unrecognized tax benefits should be recorded related to uncertain tax positions. Management is not aware of any tax positions for which it is reasonably possible that the total amounts of unrecognized tax benefits will change materially in the next 12 months.
The Fund files tax returns in the U.S. Federal jurisdiction and certain other jurisdictions. Generally, the Fund is subject to examinations by such taxing authorities for up to three years after the filing of the return for the tax period.
| H. | Expenses – Fees provided for under the Rule 12b-1 plan of a particular class of the Fund are charged to the operations of such class. Transfer agency fees and expenses and other shareholder recordkeeping fees and expenses attributable to Class R5 and Class R6 are allocated based on relative net assets of Class R5 and Class R6. Sub-accounting fees attributable to Class R5 are charged to the operations of the class. Transfer agency fees and expenses and other shareholder recordkeeping fees and expenses relating to all other classes are allocated among those classes based on relative net assets. All other expenses are allocated among the classes based on relative net assets. |
| I. | Accounting Estimates – The preparation of financial statements in conformity with accounting principles generally accepted in the United States of America (“GAAP”) requires management to make estimates and assumptions that affect the reported amounts of assets and liabilities at the date of the financial statements and the reported amounts of revenues and expenses during the reporting period including estimates and assumptions related to taxation. Actual results could differ from those estimates by a significant amount. In addition, the Fund monitors for material events or transactions that may occur or become known after the period-end date and before the date the financial statements are released to print. |
| J. | Indemnifications – Under the Trust’s organizational documents, each Trustee, officer, employee or other agent of the Trust is indemnified against certain liabilities that may arise out of the performance of their duties to the Fund. Additionally, in the normal course of business, the Fund enters into contracts, including the Fund’s servicing agreements, that contain a variety of indemnification clauses. The Fund’s maximum exposure under these arrangements is unknown as this would involve future claims that may be made against the Fund that have not yet occurred. The risk of material loss as a result of such indemnification claims is considered remote. |
| K. | Securities Lending – The Fund may lend portfolio securities having a market value up to one-third of the Fund’s total assets. Such loans are secured by collateral equal to no less than the market value of the loaned securities determined daily by the securities lending provider. Such collateral will be cash or debt securities issued or guaranteed by the U.S. Government or any of its sponsored agencies. Cash collateral received in connection with these loans is invested in short-term money market instruments or affiliated, unregistered investment companies that comply with Rule 2a-7 under the 1940 Act and money market funds (collectively, “affiliated money market funds”) and is shown as such on the Schedule of Investments. The Fund bears the risk of loss with respect to the investment of collateral. It is the Fund’s policy to obtain additional collateral from or return excess collateral to the borrower by the end of the next business day, following the valuation date of the securities loaned. Therefore, the value of the collateral held may be temporarily less than the value of the securities on loan. When loaning securities, the Fund retains certain benefits of owning the securities, including the economic equivalent of dividends or interest generated by the security. Lending securities entails a risk of loss to the Fund if, and to the extent that, the market value of the securities loaned were to increase and the borrower did not increase the collateral accordingly, and the borrower failed to return the securities. The securities loaned are subject to termination at the option of the borrower or the Fund. Upon termination, the borrower will return to the Fund the securities loaned and the Fund will return the collateral. Upon the failure of the |
| | |
| 14 | | Invesco Global Infrastructure Fund |
| | borrower to return the securities, collateral may be liquidated and the securities may be purchased on the open market to replace the loaned securities. The Fund could experience delays and costs in gaining access to the collateral and the securities may lose value during the delay which could result in potential losses to the Fund. Some of these losses may be indemnified by the lending agent. The Fund bears the risk of any deficiency in the amount of the collateral available for return to the borrower due to any loss on the collateral invested. Dividends received on cash collateral investments for securities lending transactions, which are net of compensation to counterparties, are included in Dividends from affiliated money market funds on the Statement of Operations. The aggregate value of securities out on loan, if any, is shown as a footnote on the Statement of Assets and Liabilities. |
The Adviser serves as an affiliated securities lending agent for the Fund. The Bank of New York Mellon also serves as a lending agent. To the extent the Fund utilizes the Adviser as an affiliated securities lending agent, the Fund conducts its securities lending in accordance with, and in reliance upon, no-action letters issued by the SEC staff that provide guidance on how an affiliate may act as a direct agent lender and receive compensation for those services in a manner consistent with the federal securities laws. For the year ended October 31, 2022, fees paid to the Adviser were less than $500. Fees paid to the Adviser for securities lending agent services are included in Dividends from affiliated money market funds on the Statement of Operations.
| L. | Foreign Currency Translations – Foreign currency is valued at the close of the NYSE based on quotations posted by banks and major currency dealers. Portfolio securities and other assets and liabilities denominated in foreign currencies are translated into U.S. dollar amounts at the date of valuation. Purchases and sales of portfolio securities (net of foreign taxes withheld on disposition) and income items denominated in foreign currencies are translated into U.S. dollar amounts on the respective dates of such transactions. The Fund does not separately account for the portion of the results of operations resulting from changes in foreign exchange rates on investments and the fluctuations arising from changes in market prices of securities held. The combined results of changes in foreign exchange rates and the fluctuation of market prices on investments (net of estimated foreign tax withholding) are included with the net realized and unrealized gain or loss from investments in the Statement of Operations. Reported net realized foreign currency gains or losses arise from (1) sales of foreign currencies, (2) currency gains or losses realized between the trade and settlement dates on securities transactions, and (3) the difference between the amounts of dividends, interest, and foreign withholding taxes recorded on the Fund’s books and the U.S. dollar equivalent of the amounts actually received or paid. Net unrealized foreign currency gains and losses arise from changes in the fair values of assets and liabilities, other than investments in securities at fiscal period end, resulting from changes in exchange rates. |
The Fund may invest in foreign securities, which may be subject to foreign taxes on income, gains on investments or currency repatriation, a portion of which may be recoverable. Foreign taxes, if any, are recorded based on the tax regulations and rates that exist in the foreign markets in which the Fund invests and are shown in the Statement of Operations.
| M. | Forward Foreign Currency Contracts – The Fund may engage in foreign currency transactions either on a spot (i.e. for prompt delivery and settlement) basis, or through forward foreign currency contracts, to manage or minimize currency or exchange rate risk. |
The Fund may also enter into forward foreign currency contracts for the purchase or sale of a security denominated in a foreign currency in order to “lock in” the U.S. dollar price of that security, or the Fund may also enter into forward foreign currency contracts that do not provide for physical exchange of the two currencies on the settlement date, but instead are settled by a single cash payment calculated as the difference between the agreed upon exchange rate and the spot rate at settlement based upon an agreed upon notional amount (non-deliverable forwards).
A forward foreign currency contract is an obligation between two parties (“Counterparties”) to purchase or sell a specific currency for an agreed-upon price at a future date. The use of forward foreign currency contracts for hedging does not eliminate fluctuations in the price of the underlying securities the Fund owns or intends to acquire but establishes a rate of exchange in advance. Fluctuations in the value of these contracts are measured by the difference in the contract date and reporting date exchange rates and are recorded as unrealized appreciation (depreciation) until the contracts are closed. When the contracts are closed, realized gains (losses) are recorded. Realized and unrealized gains (losses) on the contracts are included in the Statement of Operations. The primary risks associated with forward foreign currency contracts include failure of the Counterparty to meet the terms of the contract and the value of the foreign currency changing unfavorably. These risks may be in excess of the amounts reflected in the Statement of Assets and Liabilities.
| N. | Other Risks – The Fund is non-diversified and may invest in securities of fewer issuers than if it were diversified. Thus, the value of the Fund’s shares may vary more widely and the Fund may be subject to greater market and credit risk than if the Fund invested more broadly. |
Active trading of portfolio securities may result in added expenses, a lower return and increased tax liability.
| O. | COVID-19 Risk – The COVID-19 strain of coronavirus has resulted in instances of market closures and dislocations, extreme volatility, liquidity constraints and increased trading costs. Efforts to contain its spread have resulted in travel restrictions, disruptions of healthcare systems, business operations (including business closures) and supply chains, layoffs, lower consumer demand and employee availability, and defaults and credit downgrades, among other significant economic impacts that have disrupted global economic activity across many industries. Such economic impacts may exacerbate other pre-existing political, social and economic risks locally or globally and cause general concern and uncertainty. The full economic impact and ongoing effects of COVID-19 (or other future epidemics or pandemics) at the macro-level and on individual businesses are unpredictable and may result in significant and prolonged effects on the Fund’s performance. |
NOTE 2–Advisory Fees and Other Fees Paid to Affiliates
The Trust has entered into a master investment advisory agreement with the Adviser. Under the terms of the investment advisory agreement, the Fund accrues daily and pays monthly an advisory fee to the Adviser based on the annual rate of the Fund’s average daily net assets as follows:
| | | | |
| Average Daily Net Assets | | Rate | |
|
| |
First $1 billion | | | 0.8400% | |
|
| |
Next $ 1 billion | | | 0.8000% | |
|
| |
Next $ 3 billion | | | 0.7800% | |
|
| |
Over $5 billion | | | 0.7325% | |
|
| |
For the year ended October 31, 2022, the effective advisory fee rate incurred by the Fund was 0.84%.
Under the terms of a master sub-advisory agreement between the Adviser and each of Invesco Asset Management Deutschland GmbH, Invesco Asset Management Limited, Invesco Asset Management (Japan) Limited, Invesco Hong Kong Limited, Invesco Senior Secured Management, Inc. and Invesco Canada Ltd. and separate sub-advisory agreements with Invesco Capital Management LLC and Invesco Asset Management (India) Private Limited (collectively, the “Affiliated Sub-Advisers”) the Adviser, not the Fund, will pay 40% of the fees paid to the Adviser to any such Affiliated Sub-Adviser(s) that provide(s) discretionary investment management services to the Fund based on the percentage of assets allocated to such Affiliated Sub-Adviser(s).
The Adviser has contractually agreed, through at least February 29, 2024, to waive advisory fees and/or reimburse expenses of all shares to the extent necessary to limit total annual fund operating expenses after fee waiver and/or expense reimbursement (excluding certain items discussed below) of Class A, Class C, Class R, Class Y, Class R5 and Class R6 to 1.25%, 2.00%, 1.50%, 1.00%, 1.00% and 1.00%, respectively of the Fund’s average daily net assets (the “expense limits”). In determining the Adviser’s obligation to waive advisory fees and/or reimburse expenses, the following expenses are not taken into account, and could cause the total annual fund operating expenses after fee waiver and/or expense reimbursement to exceed the numbers reflected above: (1) interest; (2) taxes; (3) dividend expense on short sales; (4) extraordinary or non-routine items, including litigation expenses; and (5) expenses that the Fund has incurred but did not actually pay because of an
| | |
| 15 | | Invesco Global Infrastructure Fund |
expense offset arrangement. Unless Invesco continues the fee waiver agreement, it will terminate on February 29, 2024. During its term, the fee waiver agreement cannot be terminated or amended to increase the expense limits or reduce the advisory fee waivers without approval of the Board of Trustees.
Further, the Adviser has contractually agreed, through at least June 30, 2024, to waive the advisory fee payable by the Fund in an amount equal to 100% of the net advisory fees the Adviser receives from the affiliated money market funds on investments by the Fund of uninvested cash (excluding investments of cash collateral from securities lending) in such affiliated money market funds.
For the year ended October 31, 2022, the Adviser waived advisory fees of $32,423 and reimbursed class level expenses of $43,816, $6,620, $10,807, $54,463, $130 and $20,456 of Class A, Class C, Class R, Class Y, Class R5 and Class R6 shares, respectively.
The Trust has entered into a master administrative services agreement with Invesco pursuant to which the Fund has agreed to pay Invesco for certain administrative costs incurred in providing accounting services to the Fund. For the year ended October 31, 2022, expenses incurred under the agreement are shown in the Statement of Operations as Administrative services fees. Invesco has entered into a sub-administration agreement whereby State Street Bank and Trust Company (“SSB”) serves as fund accountant and provides certain administrative services to the Fund. Pursuant to a custody agreement with the Trust on behalf of the Fund, SSB also serves as the Fund’s custodian.
The Trust has entered into a transfer agency and service agreement with Invesco Investment Services, Inc. (“IIS”) pursuant to which the Fund has agreed to pay IIS a fee for providing transfer agency and shareholder services to the Fund and reimburse IIS for certain expenses incurred by IIS in the course of providing such services. IIS may make payments to intermediaries that provide omnibus account services, sub-accounting services and/or networking services. All fees payable by IIS to intermediaries that provide omnibus account services or sub-accounting services are charged back to the Fund, subject to certain limitations approved by the Trust’s Board of Trustees. For the year ended October 31, 2022, expenses incurred under the agreement are shown in the Statement of Operations as Transfer agent fees.
The Trust has entered into master distribution agreements with Invesco Distributors, Inc. (“IDI”) to serve as the distributor for the Class A, Class C, Class R, Class Y, Class R5 and Class R6 shares of the Fund. The Trust has adopted plans pursuant to Rule 12b-1 under the 1940 Act with respect to the Fund’s Class A, Class C and Class R shares (collectively, the “Plans”). The Fund, pursuant to the Class A Plan, reimburses IDI for its allocated share of expenses incurred for the period, up to a maximum annual rate of 0.25% of the average daily net assets of Class A shares. The Fund, pursuant to the Class C and Class R Plans, pays IDI compensation at the annual rate of 1.00% of the average daily net assets of Class C shares and 0.50% of the average daily net assets of Class R shares. The fees are accrued daily and paid monthly. Of the Plan payments, up to 0.25% of the average daily net assets of each class of shares may be paid to furnish continuing personal shareholder services to customers who purchase and own shares of such classes. Any amounts not paid as a service fee under the Plans would constitute an asset-based sales charge. Rules of the Financial Industry Regulatory Authority (“FINRA”) impose a cap on the total sales charges, including asset-based sales charges, that may be paid by any class of shares of the Fund. For the year ended October 31, 2022, expenses incurred under the Plans are shown in the Statement of Operations as Distribution fees.
Front-end sales commissions and CDSC (collectively, the “sales charges”) are not recorded as expenses of the Fund. Front-end sales commissions are deducted from proceeds from the sales of Fund shares prior to investment in Class A shares of the Fund. CDSC are deducted from redemption proceeds prior to remittance to the shareholder. During the year ended October 31, 2022, IDI advised the Fund that IDI retained $9,455 in front-end sales commissions from the sale of Class A shares and $629 and $575 from Class A and Class C shares, respectively, for CDSC imposed upon redemptions by shareholders.
Certain officers and trustees of the Trust are officers and directors of the Adviser, IIS and/or IDI.
NOTE 3–Additional Valuation Information
GAAP defines fair value as the price that would be received to sell an asset or paid to transfer a liability in an orderly transaction between market participants at the measurement date, under current market conditions. GAAP establishes a hierarchy that prioritizes the inputs to valuation methods, giving the highest priority to readily available unadjusted quoted prices in an active market for identical assets (Level 1) and the lowest priority to significant unobservable inputs (Level 3), generally when market prices are not readily available. Based on the valuation inputs, the securities or other investments are tiered into one of three levels. Changes in valuation methods may result in transfers in or out of an investment’s assigned level:
| | | | |
| | Level 1 - | | Prices are determined using quoted prices in an active market for identical assets. |
| | | Level 2 - | | Prices are determined using other significant observable inputs. Observable inputs are inputs that other market participants may use in pricing a security. These may include quoted prices for similar securities, interest rates, prepayment speeds, credit risk, yield curves, loss severities, default rates, discount rates, volatilities and others. |
| | Level 3 - | | Prices are determined using significant unobservable inputs. In situations where quoted prices or observable inputs are unavailable (for example, when there is little or no market activity for an investment at the end of the period), unobservable inputs may be used. Unobservable inputs reflect the Adviser’s assumptions about the factors market participants would use in determining fair value of the securities or instruments and would be based on the best available information. |
The following is a summary of the tiered valuation input levels, as of October 31, 2022. The level assigned to the securities valuations may not be an indication of the risk or liquidity associated with investing in those securities. Because of the inherent uncertainties of valuation, the values reflected in the financial statements may materially differ from the value received upon actual sale of those investments.
| | | | | | | | | | | | | | | | |
| | | Level 1 | | | Level 2 | | | Level 3 | | | Total | |
|
| |
Investments in Securities | | | | | | | | | | | | | | | | |
Australia | | $ | – | | | $ | 6,285,677 | | | | $– | | | $ | 6,285,677 | |
|
| |
Canada | | | 17,629,916 | | | | – | | | | – | | | | 17,629,916 | |
|
| |
China | | | – | | | | 2,836,705 | | | | – | | | | 2,836,705 | |
|
| |
France | | | – | | | | 7,414,951 | | | | – | | | | 7,414,951 | |
|
| |
Hong Kong | | | – | | | | 339,291 | | | | – | | | | 339,291 | |
|
| |
Italy | | | – | | | | 2,232,046 | | | | – | | | | 2,232,046 | |
|
| |
Japan | | | – | | | | 2,954,753 | | | | – | | | | 2,954,753 | |
|
| |
Luxembourg | | | – | | | | 993,993 | | | | – | | | | 993,993 | |
|
| |
Mexico | | | 1,595,426 | | | | – | | | | – | | | | 1,595,426 | |
|
| |
Nigeria | | | 587,370 | | | | – | | | | – | | | | 587,370 | |
|
| |
Spain | | | – | | | | 4,149,197 | | | | – | | | | 4,149,197 | |
|
| |
Switzerland | | | – | | | | 1,286,626 | | | | – | | | | 1,286,626 | |
|
| |
United Kingdom | | | – | | | | 5,297,489 | | | | – | | | | 5,297,489 | |
|
| |
United States | | | 58,139,288 | | | | – | | | | – | | | | 58,139,288 | |
|
| |
Money Market Funds | | | 552,505 | | | | 2,750,475 | | | | – | | | | 3,302,980 | |
|
| |
Total Investments | | $ | 78,504,505 | | | $ | 36,541,203 | | | | $– | | | $ | 115,045,708 | |
|
| |
| | |
| 16 | | Invesco Global Infrastructure Fund |
NOTE 4–Expense Offset Arrangement(s)
The expense offset arrangement is comprised of transfer agency credits which result from balances in demand deposit accounts used by the transfer agent for clearing shareholder transactions. For the year ended October 31, 2022, the Fund received credits from this arrangement, which resulted in the reduction of the Fund’s total expenses of $667.
NOTE 5–Trustees’ and Officers’ Fees and Benefits
Trustees’ and Officers’ Fees and Benefits include amounts accrued by the Fund to pay remuneration to certain Trustees and Officers of the Fund. Trustees have the option to defer compensation payable by the Fund, and Trustees’ and Officers’ Fees and Benefits also include amounts accrued by the Fund to fund such deferred compensation amounts. Those Trustees who defer compensation have the option to select various Invesco Funds in which their deferral accounts shall be deemed to be invested. Finally, certain current Trustees were eligible to participate in a retirement plan that provided for benefits to be paid upon retirement to Trustees over a period of time based on the number of years of service. The Fund may have certain former Trustees who also participate in a retirement plan and receive benefits under such plan. Trustees’ and Officers’ Fees and Benefits include amounts accrued by the Fund to fund such retirement benefits. Obligations under the deferred compensation and retirement plans represent unsecured claims against the general assets of the Fund.
NOTE 6–Cash Balances
The Fund is permitted to temporarily carry a negative or overdrawn balance in its account with SSB, the custodian bank. Such balances, if any at period-end, are shown in the Statement of Assets and Liabilities under the payable caption Amount due custodian. To compensate the custodian bank for such overdrafts, the overdrawn Fund may either (1) leave funds as a compensating balance in the account so the custodian bank can be compensated by earning the additional interest; or (2) compensate by paying the custodian bank at a rate agreed upon by the custodian bank and Invesco, not to exceed the contractually agreed upon rate. The Fund may not purchase additional securities when any borrowings from banks or broker-dealers exceed 5% of the Fund’s total assets, or when any borrowings from an Invesco Fund are outstanding.
NOTE 7–Distributions to Shareholders and Tax Components of Net Assets
Tax Character of Distributions to Shareholders Paid During the Fiscal Years Ended October 31, 2022 and 2021:
| | | | | | | | | | | | |
| | | 2022 | | | | | | 2021 | |
|
| |
Ordinary income* | | $ | 2,496,251 | | | | | | | $ | 1,852,848 | |
|
| |
| * | Includes short-term capital gain distributions, if any. |
Tax Components of Net Assets at Period-End:
| | | | |
| | | 2022 | |
|
| |
Undistributed ordinary income | | $ | 64,213 | |
|
| |
Net unrealized appreciation (depreciation) – investments | | | (1,503,476 | ) |
|
| |
Net unrealized appreciation (depreciation) – foreign currencies | | | (1,039 | ) |
|
| |
Temporary book/tax differences | | | (17,008 | ) |
|
| |
Capital loss carryforward | | | (1,063,376 | ) |
|
| |
Shares of beneficial interest | | | 115,184,692 | |
|
| |
Total net assets | | $ | 112,664,006 | |
|
| |
The difference between book-basis and tax-basis unrealized appreciation (depreciation) is due to differences in the timing of recognition of gains and losses on investments for tax and book purposes. The Fund’s net unrealized appreciation (depreciation) difference is attributable primarily to wash sales.
The temporary book/tax differences are a result of timing differences between book and tax recognition of income and/or expenses. The Fund’s temporary book/tax differences are the result of the trustee deferral of compensation and retirement plan benefits.
Capital loss carryforward is calculated and reported as of a specific date. Results of transactions and other activity after that date may affect the amount of capital loss carryforward actually available for the Fund to utilize. The ability to utilize capital loss carryforward in the future may be limited under the Internal Revenue Code and related regulations based on the results of future transactions.
The Fund has a capital loss carryforward as of October 31, 2022, as follows:
| | | | | | | | | | |
Capital Loss Carryforward* | |
| Expiration | | Short-Term | | | Long-Term | | Total | |
|
| |
Not subject to expiration | | $ | 1,063,376 | | | $– | | $ | 1,063,376 | |
|
| |
| * | Capital loss carryforward is reduced for limitations, if any, to the extent required by the Internal Revenue Code and may be further limited depending upon a variety of factors, including the realization of net unrealized gains or losses as of the date of any reorganization. |
NOTE 8–Investment Transactions
The aggregate amount of investment securities (other than short-term securities, U.S. Government obligations and money market funds, if any) purchased and sold by the Fund during the year ended October 31, 2022 was $162,837,348 and $152,785,995, respectively. Cost of investments, including any derivatives, on a tax basis includes the adjustments for financial reporting purposes as of the most recently completed federal income tax reporting period-end.
| | | | |
Unrealized Appreciation (Depreciation) of Investments on a Tax Basis | |
Aggregate unrealized appreciation of investments | | | $5,198,618 | |
|
| |
Aggregate unrealized (depreciation) of investments | | | (6,702,094 | ) |
|
| |
Net unrealized appreciation (depreciation) of investments | | | $(1,503,476 | ) |
|
| |
Cost of investments for tax purposes is $116,549,184.
| | |
| 17 | | Invesco Global Infrastructure Fund |
NOTE 9–Reclassification of Permanent Differences
Primarily as a result of differing book/tax treatment of passive foreign investment companies, foreign currency transactions and partnerships, on October 31, 2022, undistributed net investment income was decreased by $160,559, undistributed net realized gain (loss) was increased by $160,575 and shares of beneficial interest was decreased by $16. This reclassification had no effect on the net assets of the Fund.
NOTE 10–Share Information
| | | | | | | | | | | | | | | | |
| | | Summary of Share Activity | |
|
| |
| | |
| | | Year ended | | | Year ended | |
| | | October 31, 2022(a) | | | October 31, 2021 | |
| | | Shares | | | Amount | | | Shares | | | Amount | |
|
| |
Sold: | | | | | | | | | | | | | | | | |
Class A | | | 737,018 | | | $ | 9,232,181 | | | | 717,135 | | | $ | 8,583,964 | |
|
| |
Class C | | | 100,098 | | | | 1,255,824 | | | | 113,290 | | | | 1,341,239 | |
|
| |
Class R | | | 100,361 | | | | 1,258,512 | | | | 119,771 | | | | 1,442,625 | |
|
| |
Class Y | | | 1,771,710 | | | | 22,226,181 | | | | 775,642 | | | | 9,448,596 | |
|
| |
Class R5 | | | 12,275 | | | | 155,405 | | | | 1,974 | | | | 24,625 | |
|
| |
Class R6 | | | 383,428 | | | | 5,055,554 | | | | 1,263,213 | | | | 13,944,288 | |
|
| |
| | | | |
Issued as reinvestment of dividends: | | | | | | | | | | | | | | | | |
Class A | | | 31,270 | | | | 379,344 | | | | 20,131 | | | | 237,143 | |
|
| |
Class C | | | 3,051 | | | | 36,907 | | | | 1,899 | | | | 22,127 | |
|
| |
Class R | | | 7,432 | | | | 90,180 | | | | 4,954 | | | | 58,196 | |
|
| |
Class Y | | | 33,431 | | | | 407,847 | | | | 17,963 | | | | 210,507 | |
|
| |
Class R5 | | | 177 | | | | 2,132 | | | | 11 | | | | 140 | |
|
| |
Class R6 | | | 110,033 | | | | 1,340,763 | | | | 103,510 | | | | 1,216,073 | |
|
| |
| | | | |
Automatic conversion of Class C shares to Class A shares: | | | | | | | | | | | | | | | | |
Class A | | | 21,247 | | | | 255,114 | | | | 20,484 | | | | 235,395 | |
|
| |
Class C | | | (21,288 | ) | | | (255,114 | ) | | | (20,522 | ) | | | (235,395 | ) |
|
| |
| | | | |
Reacquired: | | | | | | | | | | | | | | | | |
Class A | | | (381,529 | ) | | | (4,658,293 | ) | | | (314,614 | ) | | | (3,665,661 | ) |
|
| |
Class C | | | (45,643 | ) | | | (551,516 | ) | | | (52,559 | ) | | | (610,462 | ) |
|
| |
Class R | | | (46,910 | ) | | | (591,692 | ) | | | (37,162 | ) | | | (423,376 | ) |
|
| |
Class Y | | | (1,098,491 | ) | | | (13,694,039 | ) | | | (260,580 | ) | | | (3,067,009 | ) |
|
| |
Class R5 | | | (4,183 | ) | | | (49,905 | ) | | | - | | | | - | |
|
| |
Class R6 | | | (908,854 | ) | | | (11,663,551 | ) | | | (738,625 | ) | | | (8,960,627 | ) |
|
| |
Net increase in share activity | | | 804,633 | | | $ | 10,231,834 | | | | 1,735,915 | | | $ | 19,802,388 | |
|
| |
| (a) | There are entities that are record owners of more than 5% of the outstanding shares of the Fund and in the aggregate own 15% of the outstanding shares of the Fund. IDI has an agreement with these entities to sell Fund shares. The Fund, Invesco and/or Invesco affiliates may make payments to these entities, which are considered to be related to the Fund, for providing services to the Fund, Invesco and/or Invesco affiliates including but not limited to services such as securities brokerage, distribution, third party record keeping and account servicing. The Fund has no knowledge as to whether all or any portion of the shares owned of record by these entities are also owned beneficially. |
In addition, 46% of the outstanding shares of the Fund are owned by the Adviser or an affiliate of the Adviser.
| | |
| 18 | | Invesco Global Infrastructure Fund |
Report of Independent Registered Public Accounting Firm
To the Board of Trustees of AIM Investment Funds (Invesco Investment Funds) and Shareholders of Invesco Global Infrastructure Fund
Opinion on the Financial Statements
We have audited the accompanying statement of assets and liabilities, including the schedule of investments, of Invesco Global Infrastructure Fund (one of the funds constituting AIM Investment Funds (Invesco Investment Funds), referred to hereafter as the “Fund”) as of October 31, 2022, the related statement of operations for the year ended October 31, 2022, the statement of changes in net assets for each of the two years in the period ended October 31, 2022, including the related notes, and the financial highlights for each of the five years in the period ended October 31, 2022 (collectively referred to as the “financial statements”). In our opinion, the financial statements present fairly, in all material respects, the financial position of the Fund as of October 31, 2022, the results of its operations for the year then ended, the changes in its net assets for each of the two years in the period ended October 31, 2022 and the financial highlights for each of the five years in the period ended October 31, 2022 in conformity with accounting principles generally accepted in the United States of America.
Basis for Opinion
These financial statements are the responsibility of the Fund’s management. Our responsibility is to express an opinion on the Fund’s financial statements based on our audits. We are a public accounting firm registered with the Public Company Accounting Oversight Board (United States) (PCAOB) and are required to be independent with respect to the Fund in accordance with the U.S. federal securities laws and the applicable rules and regulations of the Securities and Exchange Commission and the PCAOB.
We conducted our audits of these financial statements in accordance with the standards of the PCAOB. Those standards require that we plan and perform the audit to obtain reasonable assurance about whether the financial statements are free of material misstatement, whether due to error or fraud.
Our audits included performing procedures to assess the risks of material misstatement of the financial statements, whether due to error or fraud, and performing procedures that respond to those risks. Such procedures included examining, on a test basis, evidence regarding the amounts and disclosures in the financial statements. Our audits also included evaluating the accounting principles used and significant estimates made by management, as well as evaluating the overall presentation of the financial statements. Our procedures included confirmation of securities owned as of October 31, 2022 by correspondence with the custodian, transfer agent and brokers; when replies were not received from brokers, we performed other auditing procedures. We believe that our audits provide a reasonable basis for our opinion.
|
| /s/PricewaterhouseCoopers LLP |
|
| Houston, Texas |
| December 23, 2022 |
We have served as the auditor of one or more of the investment companies in the Invesco group of investment companies since at least 1995. We have not been able to determine the specific year we began serving as auditor.
| | |
| 19 | | Invesco Global Infrastructure Fund |
Calculating your ongoing Fund expenses
Example
As a shareholder of the Fund, you incur two types of costs: (1) transaction costs, which may include sales charges (loads) on purchase payments or contingent deferred sales charges on redemptions, if any; and (2) ongoing costs, including management fees, distribution and/or service (12b-1) fees, and other Fund expenses. This example is intended to help you understand your ongoing costs (in dollars) of investing in the Fund and to compare these costs with ongoing costs of investing in other mutual funds. The example is based on an investment of $1,000 invested at the beginning of the period and held for the entire period May 1, 2022 through October 31, 2022.
Actual expenses
The table below provides information about actual account values and actual expenses. You may use the information in this table, together with the amount you invested, to estimate the expenses that you paid over the period. Simply divide your account value by $1,000 (for example, an $8,600 account value divided by $1,000 = 8.6), then multiply the result by the number in the table under the heading entitled “Actual Expenses Paid During Period” to estimate the expenses you paid on your account during this period.
Hypothetical example for comparison purposes
The table below also provides information about hypothetical account values and hypothetical expenses based on the Fund’s actual expense ratio and an assumed rate of return of 5% per year before expenses, which is not the Fund’s actual return.
The hypothetical account values and expenses may not be used to estimate the actual ending account balance or expenses you paid for the period. You may use this information to compare the ongoing costs of investing in the Fund and other funds. To do so, compare this 5% hypothetical example with the 5% hypothetical examples that appear in the shareholder reports of the other funds.
Please note that the expenses shown in the table are meant to highlight your ongoing costs only and do not reflect any transaction costs, such as sales charges (loads) on purchase payments or contingent deferred sales charges on redemptions, if any. Therefore, the hypothetical information is useful in comparing ongoing costs only, and will not help you determine the relative total costs of owning different funds. In addition, if these transaction costs were included, your costs would have been higher.
| | | | | | | | | | | | |
| | | | | ACTUAL | | HYPOTHETICAL (5% annual return before expenses) | | |
| | | Beginning
Account Value
(05/01/22) | | Ending
Account Value
(10/31/22)1 | | Expenses
Paid During
Period2 | | Ending
Account Value
(10/31/22) | | Expenses
Paid During
Period2 | | Annualized
Expense
Ratio |
Class A | | $1,000.00 | | $882.80 | | $5.93 | | $1,018.90 | | $6.36 | | 1.25% |
Class C | | 1,000.00 | | 879.70 | | 9.48 | | 1,015.12 | | 10.16 | | 2.00 |
Class R | | 1,000.00 | | 881.50 | | 7.11 | | 1,017.64 | | 7.63 | | 1.50 |
Class Y | | 1,000.00 | | 884.70 | | 4.75 | | 1,020.16 | | 5.09 | | 1.00 |
Class R5 | | 1,000.00 | | 884.10 | | 4.75 | | 1,020.16 | | 5.09 | | 1.00 |
Class R6 | | 1,000.00 | | 884.80 | | 4.75 | | 1,020.16 | | 5.09 | | 1.00 |
| 1 | The actual ending account value is based on the actual total return of the Fund for the period May 1, 2022 through October 31, 2022, after actual expenses and will differ from the hypothetical ending account value which is based on the Fund’s expense ratio and a hypothetical annual return of 5% before expenses. |
| 2 | Expenses are equal to the Fund’s annualized expense ratio as indicated above multiplied by the average account value over the period, multiplied by 184/365 to reflect the most recent fiscal half year. |
| | |
| 20 | | Invesco Global Infrastructure Fund |
Approval of Investment Advisory and Sub-Advisory Contracts
At meetings held on June 13, 2022, the Board of Trustees (the Board or the Trustees) of AIM Investment Funds (Invesco Investment Funds) as a whole, and the independent Trustees, who comprise over 75% of the Board, voting separately, approved the continuance of the Invesco Global Infrastructure Fund’s (the Fund) Master Investment Advisory Agreement with Invesco Advisers, Inc. (Invesco Advisers and the investment advisory agreement) and the Master Intergroup Sub-Advisory Contract for Mutual Funds with Invesco Asset Management Deutschland GmbH, Invesco Asset Management Limited, Invesco Asset Management (Japan) Limited, Invesco Hong Kong Limited, Invesco Senior Secured Management, Inc. and Invesco Canada Ltd. and separate sub-advisory contracts with Invesco Capital Management LLC and Invesco Asset Management (India) Private Limited (collectively, the Affiliated Sub-Advisers and the sub-advisory contracts) for another year, effective July 1, 2022. After evaluating the factors discussed below, among others, the Board approved the renewal of the Fund’s investment advisory agreement and the sub-advisory contracts and determined that the compensation payable thereunder by the Fund to Invesco Advisers and by Invesco Advisers to the Affiliated Sub-Advisers is fair and reasonable.
The Board’s Evaluation Process
The Board has established an Investments Committee, which in turn has established Sub-Committees that meet throughout the year to review the performance of funds advised by Invesco Advisers (the Invesco Funds). The Sub-Committees meet regularly with portfolio managers for their assigned Invesco Funds and other members of management to review detailed information about investment performance and portfolio attributes of these funds. The Board has established additional standing and ad hoc committees that meet regularly throughout the year to review matters within their purview. The Board took into account evaluations and reports that it received from its committees and sub-committees, as well as the information provided to the Board and its committees and sub-committees throughout the year, in considering whether to approve each Invesco Fund’s investment advisory agreement and sub-advisory contracts.
As part of the contract renewal process, the Board reviews and considers information provided in response to detailed requests for information submitted to management by the independent Trustees with assistance from legal counsel to the independent Trustees and the Senior Officer, an officer of the Invesco Funds who reports directly to the independent Trustees. The Board receives comparative investment performance and fee and expense data regarding the Invesco Funds prepared by Broadridge Financial Solutions, Inc. (Broadridge), an independent mutual fund data provider, as well as information on the composition of the peer groups provided by Broadridge and its methodology for determining peer groups. The Board also receives an independent written evaluation from the Senior Officer. The Senior Officer’s evaluation is prepared as part of his responsibility to manage the process by which the Invesco Funds’ proposed management fees are negotiated during the annual contract renewal
process to ensure they are negotiated in a manner that is at arms’ length and reasonable in accordance with certain negotiated regulatory requirements. In addition to meetings with Invesco Advisers and fund counsel throughout the year and as part of meetings convened on May 2, 2022 and June 13, 2022, the independent Trustees also discussed the continuance of the investment advisory agreement and sub-advisory contracts in separate sessions with the Senior Officer and with independent legal counsel.
The discussion below is a summary of the Senior Officer’s independent written evaluation with respect to the Fund’s investment advisory agreement and sub-advisory contracts, as well as a discussion of the material factors and related conclusions that formed the basis for the Board’s approval of the Fund’s investment advisory agreement and sub-advisory contracts. The Trustees’ review and conclusions are based on the comprehensive consideration of all information presented to them during the course of the year and in prior years and are not the result of any single determinative factor. Moreover, one Trustee may have weighed a particular piece of information or factor differently than another Trustee. The information received and considered by the Board was current as of various dates prior to the Board’s approval on June 13, 2022.
Factors and Conclusions and Summary of Independent Written Fee Evaluation
| A. | Nature, Extent and Quality of Services Provided by Invesco Advisers and the Affiliated Sub-Advisers |
The Board reviewed the nature, extent and quality of the advisory services provided to the Fund by Invesco Advisers under the Fund’s investment advisory agreement, and the credentials and experience of the officers and employees of Invesco Advisers who provide these services, including the Fund’s portfolio manager(s). The Board’s review included consideration of Invesco Advisers’ investment process and oversight, credit analysis, and research capabilities. The Board considered information regarding Invesco Advisers’ programs for and resources devoted to risk management, including management of investment, enterprise, operational, liquidity, valuation and compliance risks, and technology used to manage such risks. The Board also received and reviewed information about Invesco Advisers’ role as administrator of the Invesco Funds’ liquidity risk management program. The Board received a description of, and reports related to, Invesco Advisers’ global security program and business continuity plans and of its approach to data privacy and cybersecurity, including related testing. The Board considered how the cybersecurity and business continuity plans of Invesco Advisers and its key service providers operated in the remote and hybrid working environment resulting from the novel coronavirus (“COVID-19”) pandemic and paved the way for a hybrid working framework in a normalized environment as employees return to the office. The Board also considered non-advisory services that Invesco Advisers and its affiliates provide to the Invesco Funds, such as various back office support functions, third party oversight, internal audit, valuation, portfolio trading and legal and compliance. The Board observed that Invesco Advisers’ systems preparedness and ongoing investment enabled
Invesco Advisers to manage, operate and oversee the Invesco Funds with minimal impact or disruption through challenging environments. The Board reviewed and considered the benefits to shareholders of investing in a Fund that is part of the family of funds under the umbrella of Invesco Ltd., Invesco Advisers’ parent company, and noted Invesco Ltd.’s depth and experience in running an investment management business, as well as its commitment of financial and other resources to such business. The Board concluded that the nature, extent and quality of the services provided to the Fund by Invesco Advisers are appropriate and satisfactory.
The Board reviewed the services that may be provided by the Affiliated Sub-Advisers under the sub-advisory contracts and the credentials and experience of the officers and employees of the Affiliated Sub-Advisers who provide these services. The Board noted the Affiliated Sub-Advisers’ expertise with respect to certain asset classes and that the Affiliated Sub-Advisers have offices and personnel that are located in financial centers around the world. As a result, the Board noted that the Affiliated Sub-Advisers can provide research and investment analysis on the markets and economies of various countries in which the Fund may invest, make recommendations regarding securities and assist with security trades. The Board concluded that the sub-advisory contracts may benefit the Fund and its shareholders by permitting Invesco Advisers to use the resources and talents of the Affiliated Sub-Advisers in managing the Fund. The Board concluded that the nature, extent and quality of the services that may be provided to the Fund by the Affiliated Sub-Advisers are appropriate and satisfactory.
| B. | Fund Investment Performance |
The Board considered Fund investment performance as a relevant factor in considering whether to approve the investment advisory agreement as well as the sub-advisory contracts for the Fund, as Invesco Asset Management Limited currently manages assets of the Fund.
The Board compared the Fund’s investment performance over multiple time periods ending December 31, 2021 to the performance of funds in the Broadridge performance universe and against the Dow Jones Brookfield Global Infrastructure Index (Index). The Board noted that performance of Class A shares of the Fund was in the first quintile of its performance universe for the one year period, the second quintile for the three year period and the third quintile for the five year period (the first quintile being the best performing funds and the fifth quintile being the worst performing funds). The Board noted that performance of Class A shares of the Fund was below the performance of the Index for the one year period and reasonably comparable to the performance of the Index for the three and five year periods. The Board recognized that the performance data reflects a snapshot in time as of a particular date and that selecting a different performance period could produce different results. The Board also reviewed more recent Fund performance as well as other performance metrics, which did not change its conclusions.
| | |
| 21 | | Invesco Global Infrastructure Fund |
| C. | Advisory and Sub-Advisory Fees and Fund Expenses |
The Board compared the Fund’s contractual management fee rate to the contractual management fee rates of funds in the Fund’s Broadridge expense group. The Board noted that the contractual management fee rate for Class A shares of the Fund was below the median contractual management fee rate of funds in its expense group. The Board noted that the term “contractual management fee” for funds in the expense group may include both advisory and certain non-portfolio management administrative services fees, but that Broadridge is not able to provide information on a fund by fund basis as to what is included. The Board also reviewed the methodology used by Broadridge in calculating expense group information, which includes using each fund’s contractual management fee schedule (including any applicable breakpoints) as reported in the most recent prospectus or statement of additional information for each fund in the expense group. The Board also considered comparative information regarding the Fund’s total expense ratio and its various components.
The Board noted that Invesco Advisers has contractually agreed to waive fees and/or limit expenses of the Fund for the term disclosed in the Fund’s registration statement in an amount necessary to limit total annual operating expenses to a specified percentage of average daily net assets for each class of the Fund.
The Board noted that Invesco Advisers and the Affiliated Sub-Advisers do not manage other similarly managed mutual funds or client accounts.
The Board also considered the services that may be provided by the Affiliated Sub-Advisers pursuant to the sub-advisory contracts, as well as the fees payable by Invesco Advisers to the Affiliated Sub-Advisers pursuant to the sub-advisory contracts. The Board noted that Invesco Advisers retains overall responsibility for, and provides services to, sub-advised Invesco Funds, including oversight of the Affiliated Sub-Advisers as well as the additional services described herein other than day-to-day portfolio management.
| D. | Economies of Scale and Breakpoints |
The Board considered the extent to which there may be economies of scale in the provision of advisory services to the Fund and the Invesco Funds, and the extent to which such economies of scale are shared with the Fund and the Invesco Funds. The Board considered that the Fund may benefit from economies of scale through contractual breakpoints in the Fund’s advisory fee schedule, which generally operate to reduce the Fund’s expense ratio as it grows in size. The Board noted that the Fund also shares in economies of scale through Invesco Advisers’ ability to negotiate lower fee arrangements with third party service providers. The Board noted that the Fund may also benefit from economies of scale through initial fee setting, fee waivers and expense reimbursements, as well as Invesco Advisers’ investment in its business, including investments in business infrastructure, technology and cybersecurity.
| E. | Profitability and Financial Resources |
The Board reviewed information from Invesco Advisers concerning the costs of the advisory and other services that Invesco Advisers and its affiliates provide to the Fund and the Invesco Funds and the profitability of Invesco Advisers and its affiliates in providing these services in the aggregate and on an
individual Fund-by-Fund basis. The Board considered the methodology used for calculating profitability and the periodic review and enhancement of such methodology. The Board noted that Invesco Advisers continues to operate at a net profit from services Invesco Advisers and its affiliates provide to the Invesco Funds in the aggregate and to most Funds individually. The Board did not deem the level of profits realized by Invesco Advisers and its affiliates from providing such services to be excessive, given the nature, extent and quality of the services provided. The Board noted that Invesco Advisers provided information demonstrating that Invesco Advisers is financially sound and has the resources necessary to perform its obligations under the investment advisory agreement, and provided representations indicating that the Affiliated Sub-Advisers are financially sound and have the resources necessary to perform their obligations under the sub-advisory contracts.
| F. | Collateral Benefits to Invesco Advisers and its Affiliates |
The Board considered various other benefits received by Invesco Advisers and its affiliates from the relationship with the Fund, including the fees received for providing administrative, transfer agency and distribution services to the Fund. The Board received comparative information regarding fees charged for these services, including information provided by Broadridge and other independent sources. The Board reviewed the performance of Invesco Advisers and its affiliates in providing these services and the organizational structure employed to provide these services. The Board noted that these services are provided to the Fund pursuant to written contracts that are reviewed and subject to approval on an annual basis by the Board based on its determination that the services are required for the operation of the Fund.
The Board considered the benefits realized by Invesco Advisers and the Affiliated Sub-Advisers as a result of portfolio brokerage transactions executed through “soft dollar” arrangements. The Board noted that soft dollar arrangements may result in the Fund bearing costs to purchase research that may be used by Invesco Advisers or the Affiliated Sub-Advisers with other clients and may reduce Invesco Advisers’ or the Affiliated Sub-Advisers’ expenses. The Board also considered that it receives from Invesco Advisers periodic reports that include a representation to the effect that these arrangements are consistent with regulatory requirements. The Board did not deem the soft dollar arrangements to be inappropriate.
The Board considered that the Fund’s uninvested cash and cash collateral from any securities lending arrangements may be invested in registered money market funds or, with regard to securities lending cash collateral, unregistered funds that comply with Rule 2a-7 (collectively referred to as “affiliated money market funds”) advised by Invesco Advisers. The Board considered information regarding the returns of the affiliated money market funds relative to comparable overnight investments, as well as the fees paid by the affiliated money market funds to Invesco Advisers and its affiliates. In this regard, the Board noted that Invesco Advisers receives advisory fees from these affiliated money market funds attributable to the Fund’s investments. The Board also noted that Invesco Advisers has contractually agreed to waive through varying periods an amount equal to 100% of the net advisory fee Invesco Advisers receives from the affiliated money market
funds with respect to the Fund’s investment in the affiliated money market funds of uninvested cash, but not cash collateral. The Board concluded that the advisory fees payable to Invesco Advisers from the Fund’s investment of cash collateral from any securities lending arrangements in the affiliated money market funds are for services that are not duplicative of services provided by Invesco Advisers to the Fund.
The Board considered that Invesco Advisers may serve as the Fund’s affiliated securities lending agent and evaluated the benefits realized by Invesco Advisers when serving in such role, including the compensation received. The Board considered Invesco Advisers’ securities lending platform and corporate governance structure for securities lending, including Invesco Advisers’ Securities Lending Governance Committee and its related responsibilities. The Board noted that to the extent the Fund utilizes Invesco Advisers as an affiliated securities lending agent, the Fund conducts its securities lending in accordance with, and in reliance upon, no-action letters issued by the SEC staff that provide guidance on how an affiliate may act as a direct agent lender and receive compensation for those services without obtaining exemptive relief. The Board considered information provided by Invesco Advisers related to the performance of Invesco Advisers as securities lending agent, including a summary of the securities lending services provided to the Fund by Invesco Advisers and the compensation paid to Invesco Advisers for such services, as well as any revenues generated for the Fund in connection with such securities lending activity and the allocation of such revenue between the Fund and Invesco Advisers.
The Board also received information about commissions that an affiliated broker may receive for executing certain trades for the Fund. Invesco Advisers and the Affiliated Sub-Advisers advised the Board of the benefits to the Fund of executing trades through the affiliated broker and that such trades were executed in compliance with rules under the federal securities laws and consistent with best execution obligations.
| | |
| 22 | | Invesco Global Infrastructure Fund |
Tax Information
Form 1099-DIV, Form 1042-S and other year–end tax information provide shareholders with actual calendar year amounts that should be included in their tax returns. Shareholders should consult their tax advisers.
The following distribution information is being provided as required by the Internal Revenue Code or to meet a specific state’s requirement.
The Fund designates the following amounts or, if subsequently determined to be different, the maximum amount allowable for its fiscal year ended October 31, 2022:
| | | | | | | | |
Federal and State Income Tax | | | | | | |
Qualified Dividend Income* | | | 100.00 | % | | | | |
Corporate Dividends Received Deduction* | | | 48.91 | % | | | | |
U.S. Treasury Obligations* | | | 0.00 | % | | | | |
Qualified Business Income* | | | 0.00 | % | | | | |
Business Interest Income* | | | 0.00 | % | | | | |
|
| * The above percentages are based on ordinary income dividends paid to shareholders during the Fund’s fiscal year. | |
| | |
| 23 | | Invesco Global Infrastructure Fund |
Trustees and Officers
The address of each trustee and officer is AIM Investment Funds (Invesco Investment Funds) (the “Trust”), 11 Greenway Plaza, Suite 1000, Houston, Texas 77046-1173. The trustees serve for the life of the Trust, subject to their earlier death, incapacitation, resignation, retirement or removal as more specifically provided in the Trust’s organizational documents. Each officer serves for a one year term or until their successors are elected and qualified. Column two below includes length of time served with predecessor entities, if any.
| | | | | | | | |
Name, Year of Birth and Position(s) Held with the Trust | | Trustee and/or Officer Since | | Principal Occupation(s) During Past 5 Years | | Number of Funds in Fund Complex
Overseen by
Trustee | | Other Directorship(s) Held by Trustee During Past 5 Years |
| Interested Trustee | | | | | | | | |
Martin L. Flanagan1 - 1960 Trustee and Vice Chair | | 2007 | | Executive Director, Chief Executive Officer and President, Invesco Ltd. (ultimate parent of Invesco and a global investment management firm); Trustee and Vice Chair, The Invesco Funds; Vice Chair, Investment Company Institute; and Member of Executive Board, SMU Cox School of Business Formerly: Advisor to the Board, Invesco Advisers, Inc. (formerly known as Invesco Institutional (N.A.), Inc.); Chairman and Chief Executive Officer, Invesco Advisers, Inc. (registered investment adviser); Director, Chairman, Chief Executive Officer and President, Invesco Holding Company (US), Inc. (formerly IVZ Inc.) (holding company), Invesco Group Services, Inc. (service provider) and Invesco North American Holdings, Inc. (holding company); Director, Chief Executive Officer and President, Invesco Holding Company Limited (parent of Invesco and a global investment management firm); Director, Invesco Ltd.; Chairman, Investment Company Institute and President, Co-Chief Executive Officer, Co-President, Chief Operating Officer and Chief Financial Officer, Franklin Resources, Inc. (global investment management organization) | | 189 | | None |
| 1 | Mr. Flanagan is considered an interested person (within the meaning of Section 2(a)(19) of the 1940 Act) of the Trust because he is an officer of the Adviser to the Trust, and an officer and a director of Invesco Ltd., ultimate parent of the Adviser. |
| | |
| T-1 | | Invesco Global Infrastructure Fund |
Trustees and Officers–(continued)
| | | | | | | | |
Name, Year of Birth and Position(s) Held with the Trust | | Trustee and/or Officer Since | | Principal Occupation(s) During Past 5 Years | | Number of
Funds in Fund Complex Overseen by Trustee | | Other Directorship(s) Held by Trustee
During Past 5 Years |
| Independent Trustees | | | | | | | | |
Beth Ann Brown - 1968 Trustee (2019) and Chair (August 2022) | | 2019 | | Independent Consultant Formerly: Head of Intermediary Distribution, Managing Director, Strategic Relations, Managing Director, Head of National Accounts, Senior Vice President, National Account Manager and Senior Vice President, Key Account Manager, Columbia Management Investment Advisers LLC; Vice President, Key Account Manager, Liberty Funds Distributor, Inc.; and Trustee of certain Oppenheimer Funds | | 189 | | Director, Board of Directors of Caron Engineering Inc.; Advisor, Board of Advisors of Caron Engineering Inc.; President and Director, Acton Shapleigh Youth Conservation Corps (non-profit) Formerly: President and Director Director of Grahamtastic Connection (non-profit) |
Cynthia Hostetler - 1962 Trustee | | 2017 | | Non-Executive Director and Trustee of a number of public and private business corporations Formerly: Director, Aberdeen Investment Funds (4 portfolios); Director, Artio Global Investment LLC (mutual fund complex); Director, Edgen Group, Inc. (specialized energy and infrastructure products distributor); Director, Genesee & Wyoming, Inc. (railroads); Head of Investment Funds and Private Equity, Overseas Private Investment Corporation; President, First Manhattan Bancorporation, Inc.; and Attorney, Simpson Thacher & Bartlett LLP | | 189 | | Resideo Technologies, Inc. (smart home technology); Vulcan Materials Company (construction materials company); Trilinc Global Impact Fund; Textainer Group Holdings, (shipping container leasing company); Investment Company Institute (professional organization); and Independent Directors Council (professional organization) |
Eli Jones - 1961 Trustee | | 2016 | | Professor and Dean Emeritus, Mays Business School - Texas A&M University Formerly: Dean of Mays Business School-Texas A&M University; Professor and Dean, Walton College of Business, University of Arkansas and E.J. Ourso College of Business, Louisiana State University; and Director, Arvest Bank | | 189 | | Insperity, Inc. (formerly known as Administaff) (human resources provider); and Member of Regional Board of Directors and Board of Directors, First Financial Bancorp (regional bank) |
Elizabeth Krentzman - 1959 Trustee | | 2019 | | Formerly: Principal and Chief Regulatory Advisor for Asset Management Services and U.S. Mutual Fund Leader of Deloitte & Touche LLP; General Counsel of the Investment Company Institute (trade association); National Director of the Investment Management Regulatory Consulting Practice, Principal, Director and Senior Manager of Deloitte & Touche LLP; Assistant Director of the Division of Investment Management - Office of Disclosure and Investment Adviser Regulation of the U.S. Securities and Exchange Commission and various positions with the Division of Investment Management – Office of Regulatory Policy of the U.S. Securities and Exchange Commission; Associate at Ropes & Gray LLP; and Trustee of certain Oppenheimer Funds | | 189 | | Formerly: Member of the Cartica Funds Board of Directors (private investment fund); Trustee of the University of Florida National Board Foundation; and Member of the University of Florida Law Center Association, Inc. Board of Trustees, Audit Committee and Membership Committee |
Anthony J. LaCava, Jr. - 1956 Trustee | | 2019 | | Formerly: Director and Member of the Audit Committee, Blue Hills Bank (publicly traded financial institution) and Managing Partner, KPMG LLP | | 189 | | Blue Hills Bank; Chairman, Bentley University; Member, Business School Advisory Council; and Nominating Committee, KPMG LLP |
Prema Mathai-Davis - 1950 Trustee | | 2001 | | Retired Formerly: Co-Founder & Partner of Quantalytics Research, LLC, (a FinTech Investment Research Platform for the Self-Directed Investor); Trustee of YWCA Retirement Fund; CEO of YWCA of the USA; Board member of the NY Metropolitan Transportation Authority; Commissioner of the NYC Department of Aging; and Board member of Johns Hopkins Bioethics Institute | | 189 | | Member of Board of Positive Planet US (non-profit) and HealthCare Chaplaincy Network (non-profit) |
| | |
| T-2 | | Invesco Global Infrastructure Fund |
Trustees and Officers–(continued)
| | | | | | | | |
Name, Year of Birth and Position(s) Held with the Trust | | Trustee and/or Officer Since | | Principal Occupation(s) During Past 5 Years | | Number of
Funds in Fund Complex Overseen by Trustee | | Other Directorship(s) Held by Trustee
During Past 5 Years |
| Independent Trustees–(continued) | | | | | | |
| Joel W. Motley - 1952 Trustee | | 2019 | | Director of Office of Finance, Federal Home Loan Bank System; Managing Director of Carmona Motley Inc. (privately held financial advisor); Member of the Council on Foreign Relations and its Finance and Budget Committee; Chairman Emeritus of Board of Human Rights Watch and Member of its Investment Committee; and Member of Investment Committee Board of Historic Hudson Valley (non-profit cultural organization); Member of the Board, Blue Ocean Acquisition Corp.; and Member of the Vestry and the Investment Committee of Trinity Church Wall Street. Formerly: Managing Director of Public Capital Advisors, LLC (privately held financial advisor); Managing Director of Carmona Motley Hoffman, Inc. (privately held financial advisor); Trustee of certain Oppenheimer Funds; and Director of Columbia Equity Financial Corp. (privately held financial advisor) | | 189 | | Member of Board of Trust for Mutual Understanding (non-profit promoting the arts and environment); Member of Board of Greenwall Foundation (bioethics research foundation) and its Investment Committee; Member of Board of Friends of the LRC (non-profit legal advocacy); and Board Member and Investment Committee Member of Pulitzer Center for Crisis Reporting (non-profit journalism) |
| Teresa M. Ressel - 1962 Trustee | | 2017 | | Non-executive director and trustee of a number of public and private business corporations Formerly: Chief Executive Officer, UBS Securities LLC (investment banking); Chief Operating Officer, UBS AG Americas (investment banking); Sr. Management Team Olayan America, The Olayan Group (international investor/commercial/industrial); Assistant Secretary for Management & Budget and Designated Chief Financial Officer, U.S. Department of Treasury and Director, ON Semiconductor Corporation (semiconductor manufacturing) | | 189 | | None |
| Robert C. Troccoli - 1949 Trustee | | 2016 | | Retired Formerly: Adjunct Professor, University of Denver - Daniels College of Business; and Managing Partner, KPMG LLP | | 189 | | None |
| Daniel S. Vandivort - 1954 Trustee | | 2019 | | President, Flyway Advisory Services LLC (consulting and property management) Formerly: President and Chief Investment Officer, previously Head of Fixed Income, Weiss Peck and Greer/Robeco Investment Management; Trustee and Chair, Weiss Peck and Greer Funds Board; and various capacities at CS First Boston including Head of Fixed Income at First Boston Asset Management. | | 189 | | Formerly: Trustee and Governance Chair, Oppenheimer Funds; Treasurer, Chairman of the Audit and Finance Committee, Huntington Disease Foundation of America |
| | |
| T-3 | | Invesco Global Infrastructure Fund |
Trustees and Officers–(continued)
| | | | | | | | |
Name, Year of Birth and Position(s) Held with the Trust | | Trustee and/or Officer Since | | Principal Occupation(s) During Past 5 Years | | Number of
Funds in Fund Complex Overseen by Trustee | | Other Directorship(s) Held by Trustee
During Past 5 Years |
| Officers | | | | | | | | |
Sheri Morris - 1964
President and Principal Executive Officer | | 1999 | | Director, Invesco Trust Company; Head of Global Fund Services, Invesco Ltd.; President and Principal Executive Officer, The Invesco Funds; Vice President, Invesco Exchange-Traded Fund Trust, Invesco Exchange-Traded Fund Trust II, Invesco India Exchange-Traded Fund Trust, Invesco Actively Managed Exchange-Traded Fund Trust, Invesco Actively Managed Exchange-Traded Commodity Fund Trust and Invesco Exchange-Traded Self-Indexed Fund Trust; and Vice President, OppenheimerFunds, Inc. Formerly: Vice President, Treasurer and Principal Financial Officer, The Invesco Funds; Vice President, Invesco AIM Advisers, Inc., Invesco AIM Capital Management, Inc. and Invesco AIM Private Asset Management, Inc.; Assistant Vice President and Assistant Treasurer, The Invesco Funds; Vice President and Assistant Vice President, Invesco Advisers, Inc.; Assistant Vice President, Invesco AIM Capital Management, Inc. and Invesco AIM Private Asset Management, Inc.; Treasurer, Invesco Exchange-Traded Fund Trust, Invesco Exchange-Traded Fund Trust II, Invesco India Exchange-Traded Fund Trust and Invesco Actively Managed Exchange-Traded Fund Trust; and Senior Vice President, Invesco Advisers, Inc. (formerly known as Invesco Institutional (N.A.), Inc.) (registered investment adviser) | | N/A | | N/A |
Jeffrey H. Kupor - 1968
Senior Vice President, Chief Legal Officer and Secretary | | 2018 | | Head of Legal of the Americas, Invesco Ltd.; Senior Vice President and Secretary, Invesco Advisers, Inc. (formerly known as Invesco Institutional (N.A.), Inc.) (registered investment adviser); Secretary, Invesco Distributors, Inc. (formerly known as Invesco AIM Distributors, Inc.); Vice President and Secretary, Invesco Investment Services, Inc. (formerly known as Invesco AIM Investment Services, Inc.); Senior Vice President, Chief Legal Officer and Secretary, The Invesco Funds; Secretary and General Counsel, Invesco Investment Advisers LLC (formerly known as Van Kampen Asset Management); Secretary and General Counsel, Invesco Capital Markets, Inc. (formerly known as Van Kampen Funds Inc.); Chief Legal Officer, Invesco Exchange-Traded Fund Trust, Invesco Exchange-Traded Fund Trust II, Invesco India Exchange-Traded Fund Trust, Invesco Actively Managed Exchange-Traded Fund Trust, Invesco Actively Managed Exchange-Traded Commodity Fund Trust and Invesco Exchange-Traded Self-Indexed Fund Trust;; Secretary and Vice President, Harbourview Asset Management Corporation; Secretary and Vice President, OppenheimerFunds, Inc. and Invesco Managed Accounts, LLC; Secretary and Senior Vice President, OFI Global Institutional, Inc.; Secretary and Vice President, OFI SteelPath, Inc.; Secretary and Vice President, Oppenheimer Acquisition Corp.; Secretary and Vice President, Shareholder Services, Inc.; and Secretary and Vice President, Trinity Investment Management Corporation Formerly: Senior Vice President, Invesco Distributors, Inc.; Secretary and Vice President, Jemstep, Inc.; Head of Legal, Worldwide Institutional, Invesco Ltd.; Secretary and General Counsel, INVESCO Private Capital Investments, Inc.; Senior Vice President, Secretary and General Counsel, Invesco Management Group, Inc. (formerly known as Invesco AIM Management Group, Inc.); Assistant Secretary, INVESCO Asset Management (Bermuda) Ltd.; Secretary and General Counsel, Invesco Private Capital, Inc.; Assistant Secretary and General Counsel, INVESCO Realty, Inc.; Secretary and General Counsel, Invesco Senior Secured Management, Inc.; Secretary, Sovereign G./P. Holdings Inc.; Secretary, Invesco Indexing LLC; and Secretary, W.L. Ross & Co., LLC | | N/A | | N/A |
Andrew R. Schlossberg - 1974 Senior Vice President | | 2019 | | Senior Vice President, Invesco Group Services, Inc.; Head of the Americas and Senior Managing Director, Invesco Ltd.; Director and Senior Vice President, Invesco Advisers, Inc. (formerly known as Invesco Institutional (N.A.), Inc.) (registered investment adviser); Director and Chairman, Invesco Investment Services, Inc. (formerly known as Invesco AIM Investment Services, Inc.) (registered transfer agent); Senior Vice President, The Invesco Funds; and Director, Invesco Investment Advisers LLC (formerly known as Van Kampen Asset Management) Formerly: Director, President and Chairman, Invesco Insurance Agency, Inc.; Director, Invesco UK Limited; Director and Chief Executive, Invesco Asset Management Limited and Invesco Fund Managers Limited; Assistant Vice President, The Invesco Funds; Senior Vice President, Invesco Advisers, Inc. (formerly known as Invesco Institutional (N.A.), Inc.) (registered investment adviser); Director and Chief Executive, Invesco Administration Services Limited and Invesco Global Investment Funds Limited; Director, Invesco Distributors, Inc.; Head of EMEA, Invesco Ltd.; President, Invesco Actively Managed Exchange-Traded Commodity Fund Trust, Invesco Actively Managed Exchange-Traded Fund Trust, Invesco Exchange-Traded Fund Trust, Invesco Exchange-Traded Fund Trust II and Invesco India Exchange-Traded Fund Trust; and Managing Director and Principal Executive Officer, Invesco Capital Management LLC | | N/A | | N/A |
| | |
| T-4 | | Invesco Global Infrastructure Fund |
Trustees and Officers–(continued)
| | | | | | | | |
Name, Year of Birth and Position(s) Held with the Trust | | Trustee and/or Officer Since | | Principal Occupation(s) During Past 5 Years | | Number of
Funds in Fund Complex Overseen by Trustee | | Other Directorship(s) Held by Trustee
During Past 5 Years |
| Officers–(continued) | | | | | | | | |
John M. Zerr - 1962
Senior Vice President | | 2006 | | Chief Operating Officer of the Americas; Senior Vice President, Invesco Advisers, Inc. (formerly known as Invesco Institutional (N.A.), Inc.) (registered investment adviser); Senior Vice President, Invesco Distributors, Inc. (formerly known as Invesco AIM Distributors, Inc.); Director and Vice President, Invesco Investment Services, Inc. (formerly known as Invesco AIM Investment Services, Inc.) Senior Vice President, The Invesco Funds; Managing Director, Invesco Capital Management LLC; Director, Invesco Investment Advisers LLC (formerly known as Van Kampen Asset Management); Senior Vice President, Invesco Capital Markets, Inc. (formerly known as Van Kampen Funds Inc.); Manager, Invesco Indexing LLC; Manager, Invesco Specialized Products, LLC; Member, Invesco Canada Funds Advisory Board; Director, President and Chief Executive Officer, Invesco Corporate Class Inc. (corporate mutual fund company); and Director, Chairman, President and Chief Executive Officer, Invesco Canada Ltd. (formerly known as Invesco Trimark Ltd./Invesco Trimark Ltèe) (registered investment adviser and registered transfer agent); President, Invesco, Inc.; President, Invesco Global Direct Real Estate Feeder GP Ltd.; President, Invesco IP Holdings (Canada) Ltd; President, Invesco Global Direct Real Estate GP Ltd.; President, Invesco Financial Services Ltd. / Services Financiers Invesco Ltée; and Director and Chairman, Invesco Trust Company Formerly: President, Trimark Investments Ltd/Services Financiers Invesco Ltee; Director and Senior Vice President, Invesco Insurance Agency, Inc.; Director and Senior Vice President, Invesco Management Group, Inc. (formerly known as Invesco AIM Management Group, Inc.); Secretary and General Counsel, Invesco Management Group, Inc. (formerly known as Invesco AIM Management Group, Inc.); Secretary, Invesco Investment Services, Inc. (formerly known as Invesco AIM Investment Services, Inc.); Chief Legal Officer and Secretary, The Invesco Funds; Secretary and General Counsel, Invesco Investment Advisers LLC (formerly known as Van Kampen Asset Management); Secretary and General Counsel, Invesco Capital Markets, Inc. (formerly known as Van Kampen Funds Inc.); Chief Legal Officer, Invesco Exchange-Traded Fund Trust, Invesco Exchange-Traded Fund Trust II, Invesco India Exchange-Traded Fund Trust, Invesco Actively Managed Exchange-Traded Fund Trust, Invesco Actively Managed Exchange-Traded Commodity Fund Trust and Invesco Exchange-Traded Self-Indexed Fund Trust; Secretary, Invesco Indexing LLC; Director, Secretary, General Counsel and Senior Vice President, Van Kampen Exchange Corp.; Director, Vice President and Secretary, IVZ Distributors, Inc. (formerly known as INVESCO Distributors, Inc.); Director and Vice President, INVESCO Funds Group, Inc.; Director and Vice President, Van Kampen Advisors Inc.; Director, Vice President, Secretary and General Counsel, Van Kampen Investor Services Inc.; Director and Secretary, Invesco Distributors, Inc. (formerly known as Invesco AIM Distributors, Inc.); Director, Senior Vice President, General Counsel and Secretary, Invesco AIM Advisers, Inc. and Van Kampen Investments Inc.; Director, Vice President and Secretary, Fund Management Company; Director, Senior Vice President, Secretary, General Counsel and Vice President, Invesco AIM Capital Management, Inc.; and Chief Operating Officer and General Counsel, Liberty Ridge Capital, Inc. (an investment adviser) | | N/A | | N/A |
Gregory G. McGreevey - 1962
Senior Vice President | | 2012 | | Senior Managing Director, Invesco Ltd.; Director, Chairman, President, and Chief Executive Officer, Invesco Advisers, Inc. (formerly known as Invesco Institutional (N.A.), Inc.) (registered investment adviser); Director, Invesco Mortgage Capital, Inc. and Invesco Senior Secured Management, Inc.; Senior Vice President, The Invesco Funds; President, SNW Asset Management Corporation and Invesco Managed Accounts, LLC; Chairman and Director, Invesco Private Capital, Inc.; Chairman and Director, INVESCO Private Capital Investments, Inc.; Chairman and Director, INVESCO Realty, Inc.; and Senior Vice President, Invesco Group Services, Inc. Formerly: Senior Vice President, Invesco Management Group, Inc. and Invesco Advisers, Inc.; Assistant Vice President, The Invesco Funds | | N/A | | N/A |
| Adrien Deberghes - 1967 Principal Financial Officer, Treasurer and Vice President | | 2020 | | Head of the Fund Office of the CFO and Fund Administration; Vice President, Invesco Advisers, Inc.; Principal Financial Officer, Treasurer and Vice President, The Invesco Funds; Vice President, Invesco Exchange-Traded Fund Trust, Invesco Exchange-Traded Fund Trust II, Invesco India Exchange-Traded Fund Trust, Invesco Actively Managed Exchange-Traded Fund Trust, Invesco Actively Managed Exchange-Traded Commodity Fund Trust and Invesco Exchange-Traded Self-Indexed Fund Trust Formerly: Senior Vice President and Treasurer, Fidelity Investments | | N/A | | N/A |
| Crissie M. Wisdom - 1969 Anti-Money Laundering Compliance Officer | | 2013 | | Anti-Money Laundering and OFAC Compliance Officer for Invesco U.S. entities including: Invesco Advisers, Inc. and its affiliates, Invesco Capital Markets, Inc., Invesco Distributors, Inc., Invesco Investment Services, Inc., The Invesco Funds, Invesco Capital Management, LLC, Invesco Trust Company; and Fraud Prevention Manager for Invesco Investment Services, Inc. | | N/A | | N/A |
| | |
| T-5 | | Invesco Global Infrastructure Fund |
Trustees and Officers–(continued)
| | | | | | | | |
Name, Year of Birth and Position(s) Held with the Trust | | Trustee and/or Officer Since | | Principal Occupation(s) During Past 5 Years | | Number of
Funds in
Fund Complex
Overseen by
Trustee | | Other
Directorship(s)
Held by Trustee
During Past 5 Years |
| | | | | |
| Officers–(continued) | | | | | | | | |
| | | | | |
Todd F. Kuehl - 1969 Chief Compliance Officer and Senior Vice President | | 2020 | | Chief Compliance Officer, Invesco Advisers, Inc. (registered investment adviser); and Chief Compliance Officer and Senior Vice President, The Invesco Funds Formerly: Managing Director and Chief Compliance Officer, Legg Mason (Mutual Funds); Chief Compliance Officer, Legg Mason Private Portfolio Group (registered investment adviser) | | N/A | | N/A |
| | | | | |
| James Bordewick, Jr. - 1959 Senior Vice President and Senior Officer | | 2022 | | Senior Vice President and Senior Officer, The Invesco Funds; and Chief Legal Officer, KingsCrowd, Inc. (research and analytical platform for investment in private capital markets) Formerly, Chief Operating Officer and Head of Legal and Regulatory, Netcapital (private capital investment platform); Managing Director, General Counsel of asset management and Chief Compliance Officer for asset management and private banking, Bank of America Corporation; Chief Legal Officer, Columbia Funds and BofA Funds; Senior Vice President and Associate General Counsel, MFS Investment Management; Chief Legal Officer, MFS Funds; Associate, Ropes & Gray; Associate, Gaston Snow & Ely Bartlett | | N/A | | N/A |
The Statement of Additional Information of the Trust includes additional information about the Fund’s Trustees and is available upon request, without charge, by calling 1.800.959.4246. Please refer to the Fund’s Statement of Additional Information for information on the Fund’s sub-advisers.
| | | | | | |
| Office of the Fund | | Investment Adviser | | Distributor | | Auditors |
| 11 Greenway Plaza, Suite 1000 | | Invesco Advisers, Inc. | | Invesco Distributors, Inc. | | PricewaterhouseCoopers LLP |
| Houston, TX 77046-1173 | | 1555 Peachtree Street, N.E. | | 11 Greenway Plaza, Suite 1000 | | 1000 Louisiana Street, Suite 5800 |
| | Atlanta, GA 30309 | | Houston, TX 77046-1173 | | Houston, TX 77002-5021 |
| | | |
| Counsel to the Fund | | Counsel to the Independent Trustees | | Transfer Agent | | Custodian |
| Stradley Ronon Stevens & Young, LLP | | Goodwin Procter LLP | | Invesco Investment Services, Inc. | | State Street Bank and Trust Company |
| 2005 Market Street, Suite 2600 | | 901 New York Avenue, N.W. | | 11 Greenway Plaza, Suite 1000 | | 225 Franklin Street |
| Philadelphia, PA 19103-7018 | | Washington, D.C. 20001 | | Houston, TX 77046-1173 | | Boston, MA 02110-2801 |
| | |
| T-6 | | Invesco Global Infrastructure Fund |
(This page intentionally left blank)
(This page intentionally left blank)

Go paperless with eDelivery
Visit invesco.com/edelivery to enjoy the convenience and security of anytime electronic access to your investment documents.
With eDelivery, you can elect to have any or all of the following materials delivered straight to your inbox to download, save and print from your own computer:
∎ Fund reports and prospectuses
∎ Quarterly statements
∎ Daily confirmations
∎ Tax forms
Invesco mailing information
Send general correspondence to Invesco Investment Services, Inc., P.O. Box 219078, Kansas City, MO 64121-9078.
Important notice regarding delivery of security holder documents
To reduce Fund expenses, only one copy of most shareholder documents may be mailed to shareholders with multiple accounts at the same address (Householding). Mailing of your shareholder documents may be householded indefinitely unless you instruct us otherwise. If you do not want the mailing of these documents to be combined with those for other members of your household, please contact Invesco Investment Services, Inc. at 800 959 4246 or contact your financial institution. We will begin sending you individual copies for each account within 30 days after receiving your request.
Fund holdings and proxy voting information
The Fund provides a complete list of its portfolio holdings four times each year, at the end of each fiscal quarter. For the second and fourth quarters, the list appears, respectively, in the Fund’s semiannual and annual reports to shareholders. For the first and third quarters, the Fund files the list with the Securities and Exchange Commission (SEC) as an exhibit to its reports on Form N-PORT. The most recent list of portfolio holdings is available at invesco.com/completeqtrholdings. Shareholders can also look up the Fund’s Form N-PORT filings on the SEC website, sec.gov. The SEC file numbers for the Fund are shown below.
A description of the policies and procedures that the Fund uses to determine how to vote proxies relating to portfolio securities is available without charge, upon request, from our Client Services department at 800 959 4246, or at invesco.com/corporate/about-us/esg. The information is also available on the SEC website, sec.gov.
Information regarding how the Fund voted proxies related to its portfolio securities during the most recent 12-month period ended June 30 is available at invesco.com/proxysearch. This information is also available on the SEC website, sec.gov.
Invesco Advisers, Inc. is an investment adviser; it provides investment advisory services to individual and institutional clients and does not sell securities. Invesco Distributors, Inc. is the US distributor for Invesco Ltd.’s retail mutual funds, exchange-traded funds and institutional money market funds. Both are wholly owned, indirect subsidiaries of Invesco Ltd.
| | | | |
| SEC file number(s): 811-05426 and 033-19338 | | Invesco Distributors, Inc. | | GBLI-AR-1 |

| | |
| Annual Report to Shareholders | | October 31, 2022 |
Invesco Global Strategic Income Fund
Nasdaq:
A: OPSIX ∎ C: OSICX ∎ R: OSINX ∎ Y: OSIYX ∎ R5: GLSSX ∎ R6: OSIIX
Management’s Discussion of Fund Performance
| | | | |
| |
Performance summary | |
For the fiscal year ended October 31, 2022, Class A shares of Invesco Global Strategic Income Fund (the Fund), at net asset value (NAV), outperformed the Bloomberg Global Aggregate Index. | |
Your Fund’s long-term performance appears later in this report. | |
| |
Fund vs. Indexes | |
Total returns, 10/31/21 to 10/31/22, at net asset value (NAV). Performance shown does not include applicable contingent deferred sales charges (CDSC) or front-end sales charges, which would have reduced performance. | |
Class A Shares | | | -16.12 | % |
Class C Shares | | | -16.83 | |
Class R Shares | | | -16.34 | |
Class Y Shares | | | -15.97 | |
Class R5 Shares | | | -15.81 | |
Class R6 Shares | | | -15.93 | |
Bloomberg Global Aggregate Index▼* | | | -20.79 | |
Bloomberg U.S. Aggregate Bond Index▼* | | | -15.68 | |
|
Source(s): ▼RIMES Technologies Corp. * Effective February 28, 2022, the Fund changed its benchmark index from the Bloomberg U.S. Aggregate Bond Index to the Bloomberg Global Aggregate Index. The Fund’s investment adviser believes the Bloomberg Global Aggregate Index provides a more appropriate comparison for evaluating the Fund’s performance. | |
Market conditions and your Fund
During the fiscal year ended October 31, 2022, global fixed-income markets remained volatile due to a series of shocks to financial markets from the Russia-Ukraine war, high commodity prices, high inflation, rapid monetary policy tightening, recession fears and slowing growth in China. Throughout the year, inflation data continued to surprise on the upside, leading both developed market (DM) and emerging market (EM) central banks to hike interest rates aggressively, prompting negative returns across fixed-income markets. In particular, the US Federal Reserve (the Fed) raised policy rates (which have a global impact) during the fiscal year at a pace and scale not seen in the past two decades. This prompted the US dollar to rise considerably over the fiscal year and generated uncertainty on the degree to which EM central banks would need to continue hiking despite getting an earlier start last year.
Towards the end of 2021, concerns about inflation were already heightened, although the Fed left policy rates unchanged in the fourth quarter. They indicated accommodative policies were coming to an end and announced the reduction of their monthly bond purchase program. In the first quarter of 2022, conflict and uncertainty drove sharp moves across risk assets following Russia’s invasion of Ukraine. As commodity prices spiked, this exacerbated existing inflationary pressures and forced several central banks to adopt a more hawkish stance. Global monetary policy divergence persisted, as most emerging markets (aside from China) seemed closer to the end of their interest rate hiking cycles, while various developed markets were in different stages. Elevated inflation and a
tight labor market led the Fed to officially commence its rate hiking cycle and the Bank of England raised rates twice after their initial increase in December, while China signaled a potential increase in its monetary policy accommodation. The US dollar ended the first quarter of 2022, 2.3% higher.1
In the second quarter of 2022, capital markets were preoccupied with surging inflation that prompted the Fed and subsequently the European Central Bank and Reserve Bank of Australia, to shift toward tighter monetary policy. EM central banks across Latin America and Central Europe followed suit, alongside elevated food and energy prices. Toward the end of June, market focus shifted from inflation fears and the prospect of increasingly aggressive interest rate hikes to recession fears and the anticipation of lower rates. Though US and European economies were already decelerating, growth in Asia remained relatively resilient, supported by post-COVID-19 reopenings, despite some drag from lingering lockdowns in China, which is typically the region’s main driver. The US dollar rose considerably in April, fell slightly in May and then rose again in June, ending the second quarter of 2022 almost 6.5% higher.1
The third quarter of 2022 began with a relief rally in July as markets anticipated slowing inflation and possible rate cuts by the Fed in 2023. This narrative quickly reversed course in August and September of 2022 on the back of continued geopolitical uncertainty, rising concerns of a global economic slowdown and persistent elevated inflation. As a result, central banks continued their aggressive rate hiking cycles, with the Federal Reserve hiking 1.5%, the European Central Bank hiking 1.25% and the Bank of England hiking 1%. In emerging markets, central
banks in Asia, Central and Eastern Europe and Latin America all raised their interest rates, though it seemed like central banks such as Brazil and Hungary might be reaching the end of their hiking cycles. While global growth indicators continued to slow, European concerns about an energy crisis heading into winter lingered and China’s lackluster re-opening dynamics remained intact, central banks continued to prioritize bringing down inflation over supporting growth. These conditions contributed to the US dollar’s rapid rise, increasing slightly in July and reaching 20-year highs in August and September, ending the third quarter of 2022 almost 7.1% higher.1
To better reflect its global approach to sourcing income, the Fund’s benchmark changed to the Bloomberg Global Aggregate Index (previously the Bloomberg U.S. Aggregate Bond Index), effective February 28, 2022. The investment team, philosophy and process remain unchanged and the Fund continues to offer investors a one-stop income solution with global diversification – including meaningful allocations to non-US developed and emerging market bonds and currencies. The Bloomberg Global Aggregate Index is a multi-currency measure of global investment grade debt including treasury, government-related, corporate and securitized fixed-rate bonds from both developed and emerging markets issuers, so this change simply aligns investor expectations of the Fund with the most appropriate benchmark for performance comparison, given the team’s approach.
Compared to the Bloomberg Global Aggregate Bond Index, the Fund’s interest rate and foreign currency exposure contributed positively to relative Fund performance, while credit exposure detracted. The top contributors to relative Fund performance were positioning in the Euro, interest rate positioning in Germany and positioning in the Japanese Yen, while the top detractors were interest rate positioning in the European Union, positioning in the Argentinian Peso and interest rate positioning in Russia.
Entering 2022, portfolio positioning favored emerging market rates and foreign currency (FX) exposure given high emerging markets’ nominal interest rates, with an expectation of inflation being less persistent. As global inflation was exacerbated by the Russia-Ukraine conflict and a delayed reopening in China, developed market central banks were forced to raise rates aggressively, which in turn impacted central bank expectations in emerging markets. While we have seen considerable market volatility during the fiscal year from the rapid repricing of inflation expectations and the path of US interest rates, we anticipate the value created from an income and total return perspective is meaningful. A year ago, EM monetary policy rates averaged around 3.25%, while today the average policy rate is over 6.75%,1 though
| | |
| 2 | | Invesco Global Strategic Income Fund |
there is divergence across regions. While conditions in the US will continue to have an outsized effect on the rest of the world, we continue to find attractive yields abroad, particularly in EMs.
After hiking considerably in 2021, EM central banks may be approaching their interest rate peaks (having started their hiking cycles ahead of developed markets) and we expect the growth picture for emerging markets to remain stronger than that of the US and Europe, where a growth revival could take some time. While uncertainty on the path of US interest rates has prevented markets from unlocking the value we see in emerging markets so far, we believe the path of US interest rates should soon become clearer and inflation expectations in emerging markets should become more anchored. With average EM inflation already lower than US inflation, this makes the real-rate differential compelling. Additionally, with the US dollar recently reaching 40-year highs and the Fed getting closer to the end of its hiking cycle, we may be seeing signs of stability and reversal.
Overall, we believe individual country dynamics will drive performance going forward and we expect the dispersion in returns between countries will be larger than in the past, which argues for an actively managed approach such as ours. We believe the environment remains favorable for global assets, particularly as the Fed’s monetary policy trajectory becomes more visible and we remain focused on capitalizing on it.
Please note that we implemented our strategy using derivative instruments, including futures, forwards, swaps and options. Therefore, a portion of the performance of the strategy, both positive and negative, can be attributed to these instruments. Derivatives can be a cost-effective way to gain or hedge exposure to certain risks. However, derivatives may amplify traditional investment risks through the creation of leverage and may be less liquid than traditional securities.
Part of the Fund’s strategy to manage credit and currency risk in the portfolio during the fiscal year entailed purchasing and selling credit and currency derivatives. We sought to manage credit market risk by purchasing and selling protection through credit default swaps at various points throughout the fiscal year. The currency management was carried out via currency forwards and options on an as-needed basis and we believe this strategy was effective in managing the currency positioning within the Fund.
We wish to remind you that the Fund is subject to interest rate risk, meaning when interest rates rise, the value of fixed-income securities tends to fall. The risk may be greater in the current market environment. The degree to which the value of fixed-income securities may decline due to rising interest rates may vary depending on the speed and magnitude of the increase in interest rates, as well as individual security characteristics such as price, maturity, duration and coupon and market forces such as supply and demand for similar securities. We are monitoring interest
rates and the market, economic and geopolitical factors that may impact the direction, speed and magnitude of changes to interest rates across the maturity spectrum, including the potential impact of monetary policy changes by the Fed and certain foreign central banks. If interest rates rise or fall faster than expected, markets may experience increased volatility, which may affect the value and/or liquidity of certain investments held by the Fund.
Thank you for investing in Invesco Global Strategic Income Fund.
Portfolio manager(s):
Hemant Baijal - Lead
Chris Kelly
The views and opinions expressed in management’s discussion of Fund performance are those of Invesco Advisers, Inc. and its affiliates. These views and opinions are subject to change at any time based on factors such as market and economic conditions. These views and opinions may not be relied upon as investment advice or recommendations, or as an offer for a particular security. The information is not a complete analysis of every aspect of any market, country, industry, security or the Fund. Statements of fact are from sources considered reliable, but Invesco Advisers, Inc. makes no representation or warranty as to their completeness or accuracy. Although historical performance is no guarantee of future results, these insights may help you understand our investment management philosophy.
See important Fund and, if applicable, index disclosures later in this report.
| | |
| 3 | | Invesco Global Strategic Income Fund |
Your Fund’s Long-Term Performance
Results of a $10,000 Investment – Oldest Share Class(es)
Fund and index data from 10/31/12
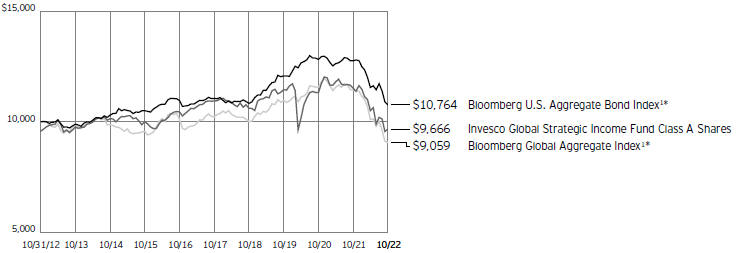
1 Source: RIMES Technologies Corp.
| * | Effective February 28, 2022, the Fund changed its benchmark index from the Bloomberg U.S. Aggregate Bond Index to the Bloomberg Global Aggregate Index. The Fund’s investment adviser believes the Bloomberg Global Aggregate Index provides a more appropriate comparison for evaluating the Fund’s performance. |
Past performance cannot guarantee future results.
The data shown in the chart include reinvested distributions, applicable sales charges and Fund expenses including management
fees. Index results include reinvested dividends, but they do not reflect sales charges. Performance of the peer group, if applicable, reflects fund expenses and management fees;
performance of a market index does not. Performance shown in the chart does not reflect deduction of taxes a shareholder would pay on Fund distributions or sale of Fund shares.
| | |
| 4 | | Invesco Global Strategic Income Fund |
| | | | |
| |
Average Annual Total Returns | |
As of 10/31/22, including maximum applicable sales charges | |
| |
Class A Shares | | | | |
Inception (10/16/89) | | | 5.41 | % |
10 Years | | | -0.34 | |
5 Years | | | -3.33 | |
1 Year | | | -19.73 | |
| |
Class C Shares | | | | |
Inception (5/26/95) | | | 4.30 | % |
10 Years | | | -0.51 | |
5 Years | | | -3.22 | |
1 Year | | | -17.65 | |
| |
Class R Shares | | | | |
Inception (3/1/01) | | | 3.55 | % |
10 Years | | | -0.20 | |
5 Years | | | -2.71 | |
1 Year | | | -16.34 | |
| |
Class Y Shares | | | | |
Inception (1/26/98) | | | 4.08 | % |
10 Years | | | 0.30 | |
5 Years | | | -2.29 | |
1 Year | | | -15.97 | |
| |
Class R5 Shares | | | | |
10 Years | | | 0.22 | % |
5 Years | | | -2.22 | |
1 Year | | | -15.81 | |
| |
Class R6 Shares | | | | |
Inception (1/27/12) | | | 1.13 | % |
10 Years | | | 0.44 | |
5 Years | | | -2.13 | |
1 Year | | | -15.93 | |
Effective May 24, 2019, Class A, Class C, Class R, Class Y and Class I shares of the Oppenheimer Global Strategic Income Fund, (the predecessor fund), were reorganized into Class A, Class C, Class R, Class Y and Class R6 shares, respectively, of the Invesco Oppenheimer Global Strategic Income Fund. Note: The Fund was subsequently renamed the Invesco Global Strategic Income Fund (the Fund). Returns shown above, for periods ending on or prior to May 24, 2019, for Class A, Class C, Class R, Class Y and Class R6 shares are those for Class A, Class C, Class R, Class Y and Class I shares of the predecessor fund. Share class returns will differ from the predecessor fund because of different expenses.
Class R5 shares incepted on May 24, 2019. Performance shown on and prior to that date is that of the predecessor fund’s Class A shares and includes the 12b-1 fees applicable to Class A shares.
The performance data quoted represent past performance and cannot guarantee future results; current performance may be lower or higher. Please visit invesco.com/performance for the most recent month-end performance. Performance figures reflect reinvested distributions, changes in net asset value and the effect of the maximum sales charge unless otherwise stated.
Performance figures do not reflect deduction of taxes a shareholder would pay on Fund distributions or sale of Fund shares. Investment return and principal value will fluctuate so that you may have a gain or loss when you sell shares.
Class A share performance reflects the maximum 4.25% sales charge, and Class C share performance reflects the applicable contingent deferred sales charge (CDSC) for the period involved. The CDSC on Class C shares is 1% for the first year after purchase. Class R, Class Y, Class R5 and Class R6 shares do not have a front-end sales charge or a CDSC; therefore, performance is at net asset value.
The performance of the Fund’s share classes will differ primarily due to different sales charge structures and class expenses.
Fund performance reflects any applicable fee waivers and/or expense reimbursements. Had the adviser not waived fees and/or reimbursed expenses currently or in the past, returns would have been lower. See current prospectus for more information.
| | |
| 5 | | Invesco Global Strategic Income Fund |
Supplemental Information
Invesco Global Strategic Income Fund’s investment objective is to seek total return.
| ∎ | Unless otherwise stated, information presented in this report is as of October 31, 2022, and is based on total net assets. |
| ∎ | Unless otherwise noted, all data is provided by Invesco. |
| ∎ | To access your Fund’s reports/prospectus, visit invesco.com/fundreports. |
About indexes used in this report
| ∎ | The Bloomberg Global Aggregate Index is an unmanaged index considered representative of global investment-grade, fixed-income markets. |
| | The Bloomberg U.S. Aggregate Bond Index is an unmanaged index considered representative of the US investment-grade, fixed-rate bond market. |
| ∎ | The Fund is not managed to track the performance of any particular index, including the index(es) described here, and consequently, the performance of the Fund may deviate significantly from the performance of the index(es). |
| ∎ | A direct investment cannot be made in an index. Unless otherwise indicated, index results include reinvested dividends, and they do not reflect sales charges. Performance of the peer group, if applicable, reflects fund expenses; performance of a market index does not. |
| | |
| |
This report must be accompanied or preceded by a currently effective Fund prospectus, which contains more complete information, including sales charges and expenses. Investors should read it carefully before investing. | | |
|
NOT FDIC INSURED | MAY LOSE VALUE | NO BANK GUARANTEE |
| | |
| 6 | | Invesco Global Strategic Income Fund |
Fund Information
Portfolio Composition
| | | | | |
| By security type | | | | % of total net assets | |
| |
U.S. Dollar Denominated Bonds & Notes | | | | 41.91% | |
| |
Non-U.S. Dollar Denominated Bonds & Notes | | | | 28.72 | |
| |
Asset-Backed Securities | | | | 8.81 | |
| |
Options Purchased | | | | 3.60 | |
| |
Agency Credit Risk Transfer Notes | | | | 2.22 | |
| |
Common Stocks & Other Equity Interests | | | | 1.11 | |
| |
Security Types Each Less Than 1% of Portfolio | | | | 1.91 | |
| |
Money Market Funds Plus Other Assets Less Liabilities | | | | 11.72 | |
Top Five Debt Issuers*
| | | | | | | |
| | | | | | % of total net assets | |
| | |
| 1. | | Brazil Notas do Tesouro Nacional | | | | 9.83% | |
| | |
| 2. | | Republic of South Africa Government Bond | | | | 3.36 | |
| | |
| 3. | | Colombian TES | | | | 2.17 | |
| | |
| 4. | | Mexican Bonos | | | | 1.30 | |
| | |
| 5. | | Argentina Treasury Bond BONCER | | | | 1.27 | |
The Fund’s holdings are subject to change, and there is no assurance that the Fund will continue to hold any particular security.
| * | Excluding money market fund holdings, if any. |
Data presented here are as of October 31, 2022.
| | |
| 7 | | Invesco Global Strategic Income Fund |
Consolidated Schedule of Investments
October 31, 2022
| | | | | | | | |
| | | Principal Amount | | | Value | |
|
| |
U.S. Dollar Denominated Bonds & Notes–41.91% | |
Bahamas–0.08% | | | | | | | | |
Bahamas Government International Bond, 9.00%, 06/16/2029(a) | | $ | 1,750,000 | | | $ | 1,269,264 | |
|
| |
| | |
Belgium–0.23% | | | | | | | | |
Telenet Finance Luxembourg Notes S.a r.l., 5.50%, 03/01/2028(a) | | | 4,325,000 | | | | 3,799,945 | |
|
| |
| | |
Bermuda–0.04% | | | | | | | | |
Bacardi Ltd., 2.75%, 07/15/2026(a) | | | 766,000 | | | | 679,915 | |
|
| |
| | |
Brazil–0.31% | | | | | | | | |
CSN Inova Ventures, 6.75%, 01/28/2028(a) | | | 1,775,000 | | | | 1,524,395 | |
|
| |
Klabin Austria GmbH, | | | | | | | | |
5.75%, 04/03/2029(a) | | | 710,000 | | | | 666,044 | |
|
| |
7.00%, 04/03/2049(a)(b) | | | 1,775,000 | | | | 1,580,096 | |
|
| |
Suzano Austria GmbH, 2.50%, 09/15/2028 | | | 1,716,000 | | | | 1,368,681 | |
|
| |
| | | | | | | 5,139,216 | |
|
| |
| | |
Canada–0.98% | | | | | | | | |
1011778 BC ULC/New Red Finance, Inc., | | | | | | | | |
3.88%, 01/15/2028(a) | | | 300,000 | | | | 264,246 | |
|
| |
4.00%, 10/15/2030(a) | | | 1,200,000 | | | | 981,420 | |
|
| |
1375209 BC Ltd., 9.00%, 01/30/2028(a) | | | 1,008,000 | | | | 980,280 | |
|
| |
Enbridge, Inc., 7.38%, 01/15/2083(c) | | | 6,974,000 | | | | 6,596,489 | |
|
| |
Enerflex Ltd., 9.00%, 10/15/2027(a) | | | 1,266,000 | | | | 1,233,540 | |
|
| |
Hudbay Minerals, Inc., 6.13%, 04/01/2029(a)(b) | | | 1,038,000 | | | | 861,872 | |
|
| |
Precision Drilling Corp., | | | | | | | | |
7.13%, 01/15/2026(a) | | | 90,000 | | | | 88,537 | |
|
| |
6.88%, 01/15/2029(a) | | | 1,009,000 | | | | 929,355 | |
|
| |
Ritchie Bros. Auctioneers, Inc., 5.38%, 01/15/2025(a) | | | 887,000 | | | | 874,954 | |
|
| |
Transcanada Trust, Series 16-A, 5.88%, 08/15/2076(b)(c) | | | 3,545,000 | | | | 3,306,776 | |
|
| |
| | | | | | | 16,117,469 | |
|
| |
| | |
Chile–0.53% | | | | | | | | |
AES Andes S.A., 6.35%, 10/07/2079(a)(c) | | | 1,750,000 | | | | 1,424,217 | |
|
| |
Kenbourne Invest S.A., 4.70%, 01/22/2028(a) | | | 2,084,000 | | | | 1,528,188 | |
|
| |
Mercury Chile Holdco LLC, 6.50%, 01/24/2027(a) | | | 7,100,000 | | | | 5,868,505 | |
|
| |
| | | | | | | 8,820,910 | |
|
| |
| | |
Colombia–0.64% | | | | | | | | |
Bancolombia S.A., 7.14%, 10/18/2027(c) | | | 7,200,000 | | | | 6,250,536 | |
|
| |
| | | | | | | | |
| | | Principal Amount | | | Value | |
|
| |
Colombia–(continued) | | | | | | | | |
Colombia Government International Bond, 4.13%, 02/22/2042 | | $ | 3,725,000 | | | $ | 2,102,937 | |
|
| |
Ecopetrol S.A., 4.63%, 11/02/2031 | | | 3,228,000 | | | | 2,231,363 | |
|
| |
| | | | | | | 10,584,836 | |
|
| |
| | |
Denmark–0.18% | | | | | | | | |
Danske Bank A/S, 7.00%(a)(c)(d) | | | 3,200,000 | | | | 2,964,368 | |
|
| |
| | |
Dominican Republic–0.16% | | | | | | | | |
Dominican Republic International Bond, | | | | | | | | |
4.50%, 01/30/2030(a) | | | 720,000 | | | | 579,748 | |
|
| |
4.88%, 09/23/2032(a) | | | 1,200,000 | | | | 929,107 | |
|
| |
5.30%, 01/21/2041(a) | | | 1,560,000 | | | | 1,080,341 | |
|
| |
| | | | | | | 2,589,196 | |
|
| |
| | |
Ecuador–0.06% | | | | | | | | |
Ecuador Government International Bond, 5.50%, 07/31/2030(a)(e) | | | 1,800,000 | | | | 964,723 | |
|
| |
| | |
Egypt–0.22% | | | | | | | | |
Egypt Government International Bond, | | | | | | | | |
7.63%, 05/29/2032(a) | | | 1,500,000 | | | | 966,789 | |
|
| |
8.50%, 01/31/2047(a) | | | 2,600,000 | | | | 1,542,070 | |
|
| |
8.88%, 05/29/2050(a) | | | 1,775,000 | | | | 1,060,311 | |
|
| |
| | | | | | | 3,569,170 | |
|
| |
| | |
Finland–0.22% | | | | | | | | |
Nordea Bank Abp, 5.38%, 09/22/2027(a) | | | 3,857,000 | | | | 3,719,643 | |
|
| |
| | |
France–1.60% | | | | | | | | |
Altice France S.A., | | | | | | | | |
8.13%, 02/01/2027(a) | | | 1,226,000 | | | | 1,124,242 | |
|
| |
5.13%, 07/15/2029(a) | | | 766,000 | | | | 578,330 | |
|
| |
5.50%, 10/15/2029(a) | | | 730,000 | | | | 558,030 | |
|
| |
BNP Paribas S.A., 7.75%(a)(c)(d) | | | 3,500,000 | | | | 3,308,673 | |
|
| |
BPCE S.A., 5.15%, 07/21/2024(a) | | | 3,500,000 | | | | 3,376,246 | |
|
| |
Credit Agricole S.A., | | | | | | | | |
8.13%(a)(c)(d) | | | 6,450,000 | | | | 6,439,022 | |
|
| |
6.88%(a)(c)(d) | | | 1,750,000 | | | | 1,637,090 | |
|
| |
Electricite de France S.A.,
5.25%(a)(c)(d) | | | 1,800,000 | | | | 1,694,744 | |
|
| |
Iliad Holding S.A.S., | | | | | | | | |
6.50%, 10/15/2026(a) | | | 275,000 | | | | 255,115 | |
|
| |
7.00%, 10/15/2028(a) | | | 1,899,000 | | | | 1,723,561 | |
|
| |
Societe Generale S.A., | | | | | | | | |
7.38%(a)(b)(c)(d) | | | 1,750,000 | | | | 1,603,895 | |
|
| |
4.75%(a)(c)(d) | | | 5,250,000 | | | | 4,054,313 | |
|
| |
| | | | | | | 26,353,261 | |
|
| |
See accompanying Notes to Consolidated Financial Statements which are an integral part of the financial statements.
| | |
| 8 | | Invesco Global Strategic Income Fund |
| | | | | | | | |
| | | Principal Amount | | | Value | |
|
| |
Guatemala–0.15% | | | | | | | | |
CT Trust, 5.13%, 02/03/2032(a) | | $ | 2,000,000 | | | $ | 1,602,346 | |
|
| |
Guatemala Government Bond, 3.70%, 10/07/2033(a) | | | 1,200,000 | | | | 913,452 | |
|
| |
| | | | | | | 2,515,798 | |
|
| |
| | |
Hong Kong–0.64% | | | | | | | | |
Melco Resorts Finance Ltd., | | | | | | | | |
4.88%, 06/06/2025(a)(b) | | | 9,250,000 | | | | 6,608,860 | |
|
| |
5.75%, 07/21/2028(a) | | | 1,775,000 | | | | 1,029,500 | |
|
| |
Prudential PLC, 4.88%(a)(d) | | | 3,550,000 | | | | 2,893,250 | |
|
| |
| | | | | | | 10,531,610 | |
|
| |
| | |
India–1.27% | | | | | | | | |
Adani Electricity Mumbai Ltd., | | | | | | | | |
3.95%, 02/12/2030(a) | | | 3,500,000 | | | | 2,345,242 | |
|
| |
3.87%, 07/22/2031(a) | | | 1,750,000 | | | | 1,070,032 | |
|
| |
GMR Hyderabad International Airport Ltd., 5.38%, 04/10/2024(a) | | | 3,475,000 | | | | 3,344,861 | |
|
| |
JSW Steel Ltd., 3.95%, 04/05/2027(a) | | | 4,260,000 | | | | 3,101,393 | |
|
| |
Muthoot Finance Ltd., 4.40%, 09/02/2023(a) | | | 3,700,000 | | | | 3,594,550 | |
|
| |
Network i2i Ltd., | | | | | | | | |
5.65%(a)(c)(d) | | | 1,050,000 | | | | 926,468 | |
|
| |
3.98%(a)(c)(d) | | | 1,050,000 | | | | 834,125 | |
|
| |
Oil & Natural Gas Corp. Ltd., 3.38%, 12/05/2029(a) | | | 3,500,000 | | | | 2,889,299 | |
|
| |
Reliance Industries Ltd., 4.88%, 02/10/2045(a) | | | 3,600,000 | | | | 2,795,404 | |
|
| |
| | | | | | | 20,901,374 | |
|
| |
| | |
Indonesia–1.88% | | | | | | | | |
Indonesia Government International Bond, | | | | | | | | |
4.65%, 09/20/2032 | | | 2,625,000 | | | | 2,435,057 | |
|
| |
5.45%, 09/20/2052 | | | 1,100,000 | | | | 995,115 | |
|
| |
PT Bank Tabungan Negara (Persero) Tbk, 4.20%, 01/23/2025(a) | | | 6,390,000 | | | | 5,495,400 | |
|
| |
PT Cikarang Listrindo Tbk, 4.95%, 09/14/2026(a) | | | 4,475,000 | | | | 3,877,730 | |
|
| |
PT Indofood CBP Sukses Makmur Tbk, 4.75%, 06/09/2051(a) | | | 7,100,000 | | | | 4,381,697 | |
|
| |
PT Indonesia Asahan Aluminium (Persero), 4.75%, 05/15/2025(a)(b) | | | 7,400,000 | | | | 7,064,685 | |
|
| |
PT Pertamina (Persero), 4.18%, 01/21/2050(a) | | | 1,775,000 | | | | 1,189,248 | |
|
| |
PT Perusahaan Perseroan (Persero) Perusahaan Listrik Negara, | | | | | | | | |
4.13%, 05/15/2027(a)(b) | | | 3,700,000 | | | | 3,391,124 | |
|
| |
4.38%, 02/05/2050(a) | | | 3,600,000 | | | | 2,228,091 | |
|
| |
| | | | | | | 31,058,147 | |
|
| |
| | |
Iraq–0.06% | | | | | | | | |
Iraq International Bond, 5.80%, 01/15/2028(a) | | | 1,237,500 | | | | 1,056,257 | |
|
| |
| | | | | | | | |
| | | Principal Amount | | | Value | |
|
| |
Ireland–0.59% | | | | | | | | |
BB Blue Financing DAC, Series A1, 4.40%, 09/20/2037(a) | | $ | 1,750,000 | | | $ | 1,673,934 | |
|
| |
Coriolanus DAC, | | | | | | | | |
Series 116, 0.00%, 04/30/2025(a)(f) | | | 943,134 | | | | 881,699 | |
|
| |
Series 119, 0.00%, 04/30/2025(a)(f) | | | 1,003,380 | | | | 938,020 | |
|
| |
Series 120, 0.00%, 04/30/2025(a)(f) | | | 1,255,979 | | | | 1,174,165 | |
|
| |
Series 122, 0.00%, 04/30/2025(a)(f) | | | 1,100,434 | | | | 1,028,753 | |
|
| |
Series 124, 0.00%, 04/30/2025(a)(f) | | | 883,835 | | | | 826,263 | |
|
| |
Series 126, 0.00%, 04/30/2025(a)(f) | | | 1,186,510 | | | | 1,109,222 | |
|
| |
Series 127, 0.00%, 04/30/2025(a)(f) | | | 1,145,271 | | | | 1,070,669 | |
|
| |
0.00%, 04/30/2025(a)(f) | | | 1,078,626 | | | | 1,008,366 | |
|
| |
| | | | | | | 9,711,091 | |
|
| |
| | |
Ivory Coast–0.12% | | | | | | | | |
Ivory Coast Government International Bond, 5.38%, 07/23/2024(a) | | | 2,100,000 | | | | 1,928,325 | |
|
| |
| | |
Japan–0.14% | | | | | | | | |
Takeda Pharmaceutical Co. Ltd., 3.18%, 07/09/2050 | | | 3,700,000 | | | | 2,390,375 | |
|
| |
| | |
Kazakhstan–0.12% | | | | | | | | |
Development Bank of Kazakhstan JSC, 5.75%, 05/12/2025(a) | | | 2,081,000 | | | | 2,066,350 | |
|
| |
| | |
Macau–0.47% | | | | | | | | |
MGM China Holdings Ltd., | | | | | | | | |
5.38%, 05/15/2024(a)(b) | | | 3,495,000 | | | | 3,015,137 | |
|
| |
5.88%, 05/15/2026(a)(b) | | | 3,200,000 | | | | 2,462,352 | |
|
| |
Wynn Macau Ltd., 4.88%, 10/01/2024(a)(b) | | | 2,840,000 | | | | 2,217,216 | |
|
| |
| | | | | | | 7,694,705 | |
|
| |
| | |
Malaysia–0.21% | | | | | | | | |
1MDB Global Investments Ltd., 4.40%, 03/09/2023(a) | | | 3,500,000 | | | | 3,421,500 | |
|
| |
| | |
Mexico–2.75% | | | | | | | | |
Alpek S.A.B. de C.V., 3.25%, 02/25/2031(a) | | | 1,782,000 | | | | 1,366,698 | |
|
| |
America Movil S.A.B. de C.V., 5.38%, 04/04/2032(a) | | | 4,745,000 | | | | 4,027,105 | |
|
| |
Banco Mercantil del Norte S.A., | | | | | | | | |
8.38%(a)(c)(d) | | | 1,850,000 | | | | 1,611,470 | |
|
| |
5.88%(a)(c)(d) | | | 1,764,000 | | | | 1,349,133 | |
|
| |
Braskem Idesa S.A.P.I., | | | | | | | | |
7.45%, 11/15/2029(a) | | | 3,550,000 | | | | 2,724,536 | |
|
| |
6.99%, 02/20/2032(a) | | | 2,136,000 | | | | 1,433,886 | |
|
| |
Cemex S.A.B. de C.V.,
5.13%(a)(b)(c)(d) | | | 2,487,000 | | | | 2,059,099 | |
|
| |
Mexico Remittances Funding Fiduciary Estate Management S.a.r.l., 4.88%, 01/15/2028(a) | | | 11,125,000 | | | | 9,124,587 | |
|
| |
See accompanying Notes to Consolidated Financial Statements which are an integral part of the financial statements.
| | |
| 9 | | Invesco Global Strategic Income Fund |
| | | | | | | | |
| | | Principal Amount | | | Value | |
|
| |
Mexico–(continued) | | | | | | | | |
Nemak S.A.B. de C.V., 3.63%, 06/28/2031(a) | | $ | 3,064,000 | | | $ | 2,233,549 | |
|
| |
Petroleos Mexicanos, | | | | | | | | |
6.50%, 03/13/2027(b) | | | 11,050,000 | | | | 9,710,582 | |
|
| |
8.75%, 06/02/2029 | | | 7,000,000 | | | | 6,246,234 | |
|
| |
7.69%, 01/23/2050 | | | 1,775,000 | | | | 1,159,529 | |
|
| |
6.95%, 01/28/2060 | | | 3,675,000 | | | | 2,211,625 | |
|
| |
| | | | | | | 45,258,033 | |
|
| |
| | |
Morocco–0.08% | | | | | | | | |
OCP S.A., 3.75%,
06/23/2031(a) | | | 1,750,000 | | | | 1,313,489 | |
|
| |
| | |
Netherlands–0.82% | | | | | | | | |
ING Groep N.V., | | | | | | | | |
6.50%(b)(c)(d) | | | 5,600,000 | | | | 5,108,886 | |
|
| |
5.75%(b)(c)(d) | | | 7,100,000 | | | | 6,071,238 | |
|
| |
6.75%(a)(c)(d) | | | 1,500,000 | | | | 1,424,063 | |
|
| |
VZ Secured Financing B.V., 5.00%, 01/15/2032(a) | | | 1,213,000 | | | | 968,817 | |
|
| |
| | | | | | | 13,573,004 | |
|
| |
| | |
Nigeria–0.16% | | | | | | | | |
Nigeria Government International Bond, | | | | | | | | |
6.50%, 11/28/2027(a) | | | 1,750,000 | | | | 1,246,875 | |
|
| |
8.38%, 03/24/2029(a) | | | 1,842,000 | | | | 1,338,010 | |
|
| |
| | | | | | | 2,584,885 | |
|
| |
| | |
Oman–0.58% | | | | | | | | |
Oman Government International Bond, | | | | | | | | |
4.75%, 06/15/2026(a) | | | 6,982,000 | | | | 6,621,247 | |
|
| |
6.75%, 01/17/2048(a) | | | 3,500,000 | | | | 2,950,679 | |
|
| |
| | | | | | | 9,571,926 | |
|
| |
| | |
Panama–0.09% | | | | | | | | |
Cable Onda S.A., 4.50%, 01/30/2030(a) | | | 1,750,000 | | | | 1,435,543 | |
|
| |
| | |
Peru–0.22% | | | | | | | | |
Fondo MIVIVIENDA S.A., 4.63%, 04/12/2027(a) | | | 3,995,000 | | | | 3,712,285 | |
|
| |
| | |
South Africa–0.25% | | | | | | | | |
Sasol Financing USA LLC, 4.38%, 09/18/2026 | | | 2,403,000 | | | | 2,109,990 | |
|
| |
Stillwater Mining Co., 4.00%, 11/16/2026(a) | | | 2,500,000 | | | | 2,063,800 | |
|
| |
| | | | | | | 4,173,790 | |
|
| |
| | |
Sweden–0.58% | | | | | | | | |
Skandinaviska Enskilda Banken AB, | | | | | | | | |
5.13%(a)(c)(d) | | | 3,400,000 | | | | 3,132,335 | |
|
| |
6.88%(a)(c)(d) | | | 3,400,000 | | | | 3,192,518 | |
|
| |
Swedbank AB, Series NC5, 5.63%(a)(c)(d) | | | 3,400,000 | | | | 3,207,050 | |
|
| |
| | | | | | | 9,531,903 | |
|
| |
| | |
Switzerland–1.22% | | | | | | | | |
Credit Suisse Group AG, | | | | | | | | |
6.37%, 07/15/2026(a)(c) | | | 875,000 | | | | 814,595 | |
|
| |
6.54%, 08/12/2033(a)(c) | | | 1,750,000 | | | | 1,525,513 | |
|
| |
6.25%(a)(b)(c)(d) | | | 7,385,000 | | | | 6,234,845 | |
|
| |
| | | | | | | | |
| | | Principal Amount | | | Value | |
|
| |
Switzerland–(continued) | | | | | | | | |
Swiss Re Finance (Luxembourg) S.A., 5.00%, 04/02/2049(a)(c) | | $ | 4,320,000 | | | $ | 3,770,950 | |
|
| |
UBS Group AG, | | | | | | | | |
7.00%(a)(c)(d) | | | 3,695,000 | | | | 3,588,414 | |
|
| |
5.13%(a)(c)(d) | | | 4,770,000 | | | | 4,149,900 | |
|
| |
| | | | | | | 20,084,217 | |
|
| |
| | |
Thailand–0.17% | | | | | | | | |
GC Treasury Center Co. Ltd., 4.40%, 03/30/2032(a) | | | 1,750,000 | | | | 1,418,463 | |
|
| |
Muang Thai Life Assurance PCL, 3.55%, 01/27/2037(a)(c) | | | 1,800,000 | | | | 1,465,936 | |
|
| |
| | | | | | | 2,884,399 | |
|
| |
| | |
United Kingdom–2.48% | | | | | | | | |
abrdn PLC, 4.25%, 06/30/2028(a) | | | 1,825,000 | | | | 1,550,867 | |
|
| |
BP Capital Markets PLC,
4.88%(c)(d) | | | 2,590,000 | | | | 2,194,054 | |
|
| |
British Telecommunications PLC, 4.25%, 11/23/2081(a)(c) | | | 10,650,000 | | | | 8,921,068 | |
|
| |
HSBC Holdings PLC, 2.01%, 09/22/2028(c) | | | 3,500,000 | | | | 2,753,178 | |
|
| |
Lloyds Banking Group PLC, 4.72%, 08/11/2026(b)(c) | | | 7,000,000 | | | | 6,627,432 | |
|
| |
M&G PLC, 6.50%, 10/20/2048(a)(c) | | | 1,825,000 | | | | 1,672,156 | |
|
| |
NatWest Group PLC, 6.00%(c)(d) | | | 3,500,000 | | | | 3,123,400 | |
|
| |
Standard Chartered PLC, 5.20%, 01/26/2024(a) | | | 6,300,000 | | | | 6,180,585 | |
|
| |
Virgin Media Finance PLC, 5.00%, 07/15/2030(a)(b) | | | 447,000 | | | | 359,054 | |
|
| |
Virgin Media Secured Finance PLC, 5.50%, 05/15/2029(a)(b) | | | 767,000 | | | | 698,438 | |
|
| |
Vodafone Group PLC, | | | | | | | | |
3.25%, 06/04/2081(c) | | | 6,876,000 | | | | 5,524,385 | |
|
| |
4.13%, 06/04/2081(c) | | | 1,698,000 | | | | 1,208,551 | |
|
| |
| | | | | | | 40,813,168 | |
|
| |
|
United Republic of Tanzania–0.18% | |
HTA Group Ltd., 7.00%, 12/18/2025(a) | | | 3,330,000 | | | | 2,938,725 | |
|
| |
| | |
United States–21.23% | | | | | | | | |
Aethon United BR L.P./Aethon United Finance Corp., 8.25%, 02/15/2026(a) | | | 2,586,000 | | | | 2,632,230 | |
|
| |
Alcoa Nederland Holding B.V., 6.13%, 05/15/2028(a) | | | 4,445,000 | | | | 4,211,949 | |
|
| |
Allison Transmission, Inc., | | | | | | | | |
4.75%, 10/01/2027(a) | | | 295,000 | | | | 272,081 | |
|
| |
3.75%, 01/30/2031(a) | | | 2,179,000 | | | | 1,743,735 | |
|
| |
American Airlines, Inc./AAdvantage Loyalty IP Ltd., 5.50%, 04/20/2026(a) | | | 5,069,000 | | | | 4,835,480 | |
|
| |
See accompanying Notes to Consolidated Financial Statements which are an integral part of the financial statements.
| | |
| 10 | | Invesco Global Strategic Income Fund |
| | | | | | | | |
| | | Principal Amount | | | Value | |
|
| |
United States–(continued) | | | | | | | | |
American Builders & Contractors Supply Co., Inc., 4.00%, 01/15/2028(a) | | $ | 1,317,000 | | | $ | 1,164,682 | |
|
| |
Apache Corp., 7.75%, 12/15/2029 | | | 1,139,000 | | | | 1,166,291 | |
|
| |
Arconic Corp., 6.13%, 02/15/2028(a) | | | 9,500,000 | | | | 8,923,160 | |
|
| |
Asbury Automotive Group, Inc., | | | | | | | | |
4.50%, 03/01/2028(b) | | | 299,000 | | | | 259,661 | |
|
| |
4.63%, 11/15/2029(a) | | | 1,444,000 | | | | 1,191,242 | |
|
| |
Ascent Resources Utica Holdings LLC/ARU Finance Corp., 7.00%, 11/01/2026(a) | | | 901,000 | | | | 889,084 | |
|
| |
Bausch Health Cos., Inc., | | | | | | | | |
4.88%, 06/01/2028(a) | | | 584,000 | | | | 358,941 | |
|
| |
11.00%, 09/30/2028(a) | | | 1,415,000 | | | | 1,096,625 | |
|
| |
14.00%, 10/15/2030(a) | | | 352,000 | | | | 203,280 | |
|
| |
Becton, Dickinson and Co., 3.79%, 05/20/2050 | | | 3,307,000 | | | | 2,399,235 | |
|
| |
Boeing Co. (The), 4.51%, 05/01/2023(b) | | | 7,000,000 | | | | 6,971,982 | |
|
| |
Callon Petroleum Co., 8.00%, 08/01/2028(a)(b) | | | 942,000 | | | | 940,841 | |
|
| |
Calpine Corp., 3.75%, 03/01/2031(a)(b) | | | 1,236,000 | | | | 1,015,126 | |
|
| |
Camelot Finance S.A., 4.50%, 11/01/2026(a) | | | 3,296,000 | | | | 3,086,969 | |
|
| |
Carnival Corp., 10.50%, 02/01/2026(a)(b) | | | 4,517,000 | | | | 4,433,435 | |
|
| |
Carriage Services, Inc., 4.25%, 05/15/2029(a) | | | 2,318,000 | | | | 1,787,271 | |
|
| |
CCO Holdings LLC/CCO Holdings Capital Corp., | | | | | | | | |
5.13%, 05/01/2027(a) | | | 77,000 | | | | 71,470 | |
|
| |
5.00%, 02/01/2028(a)(b) | | | 842,000 | | | | 763,475 | |
|
| |
4.75%, 03/01/2030(a) | | | 4,258,000 | | | | 3,585,939 | |
|
| |
4.50%, 08/15/2030(a) | | | 5,475,000 | | | | 4,452,708 | |
|
| |
4.50%, 05/01/2032 | | | 2,345,000 | | | | 1,856,560 | |
|
| |
4.25%, 01/15/2034(a) | | | 346,000 | | | | 254,857 | |
|
| |
Celanese US Holdings LLC, 5.90%, 07/05/2024 | | | 4,395,000 | | | | 4,319,783 | |
|
| |
Centene Corp., | | | | | | | | |
4.25%, 12/15/2027 | | | 1,619,000 | | | | 1,495,988 | |
|
| |
4.63%, 12/15/2029 | | | 1,261,000 | | | | 1,143,273 | |
|
| |
Charles Schwab Corp. (The), Series G, 5.38%(c)(d) | | | 7,500,000 | | | | 7,359,375 | |
|
| |
Clarios Global L.P., 6.75%, 05/15/2025(a) | | | 285,000 | | | | 285,604 | |
|
| |
Clarios Global L.P./Clarios US Finance Co., 8.50%, 05/15/2027(a) | | | 259,000 | | | | 254,259 | |
|
| |
Clarivate Science Holdings Corp., 4.88%, 07/01/2029(a) | | | 1,345,000 | | | | 1,124,057 | |
|
| |
Clear Channel Outdoor Holdings, Inc., 5.13%, 08/15/2027(a)(b) | | | 508,000 | | | | 458,147 | |
|
| |
Clearway Energy Operating LLC, 4.75%, 03/15/2028(a)(b) | | | 1,393,000 | | | | 1,290,645 | |
|
| |
CNX Resources Corp., 7.38%, 01/15/2031(a)(b) | | | 922,000 | | | | 916,325 | |
|
| |
| | | | | | | | |
| | | Principal Amount | | | Value | |
|
| |
United States–(continued) | | | | | | | | |
Cogent Communications Group, Inc., 7.00%, 06/15/2027(a) | | $ | 953,000 | | | $ | 905,991 | |
|
| |
Community Health Systems, Inc., | | | | | | | | |
8.00%, 03/15/2026(a) | | | 4,248,000 | | | | 3,672,162 | |
|
| |
8.00%, 12/15/2027(a) | | | 1,440,000 | | | | 1,169,374 | |
|
| |
5.25%, 05/15/2030(a) | | | 750,000 | | | | 520,834 | |
|
| |
4.75%, 02/15/2031(a) | | | 499,000 | | | | 335,011 | |
|
| |
Comstock Resources, Inc., 6.75%, 03/01/2029(a) | | | 961,000 | | | | 922,209 | |
|
| |
Cox Communications, Inc., 2.95%, 10/01/2050(a) | | | 2,720,000 | | | | 1,548,187 | |
|
| |
Crestwood Midstream Partners L.P./Crestwood Midstream Finance Corp., 8.00%, 04/01/2029(a) | | | 1,745,000 | | | | 1,747,504 | |
|
| |
Crowdstrike Holdings, Inc., 3.00%, 02/15/2029 | | | 3,020,000 | | | | 2,552,996 | |
|
| |
Crown Castle, Inc., 3.25%, 01/15/2051 | | | 3,700,000 | | | | 2,269,681 | |
|
| |
CSC Holdings LLC, | | | | | | | | |
5.50%, 04/15/2027(a)(b) | | | 1,195,000 | | | | 1,123,175 | |
|
| |
5.75%, 01/15/2030(a) | | | 1,814,000 | | | | 1,391,220 | |
|
| |
4.63%, 12/01/2030(a) | | | 213,000 | | | | 153,715 | |
|
| |
4.50%, 11/15/2031(a) | | | 649,000 | | | | 506,330 | |
|
| |
5.00%, 11/15/2031(a) | | | 253,000 | | | | 180,749 | |
|
| |
CTR Partnership L.P./CareTrust Capital Corp., 3.88%, 06/30/2028(a) | | | 1,245,000 | | | | 1,051,941 | |
|
| |
CVS Health Corp., 5.05%, 03/25/2048 | | | 3,500,000 | | | | 2,979,532 | |
|
| |
DaVita, Inc., 3.75%, 02/15/2031(a) | | | 632,000 | | | | 458,206 | |
|
| |
Delek Logistics Partners L.P./Delek Logistics Finance Corp., 7.13%, 06/01/2028(a) | | | 1,235,000 | | | | 1,107,858 | |
|
| |
Dell International LLC/EMC Corp., | | | | | | | | |
6.02%, 06/15/2026 | | | 3,500,000 | | | | 3,496,406 | |
|
| |
6.20%, 07/15/2030 | | | 7,400,000 | | | | 7,258,125 | |
|
| |
DISH DBS Corp., 5.13%, 06/01/2029 | | | 1,570,000 | | | | 1,058,420 | |
|
| |
DISH Network Corp., Conv., 3.38%, 08/15/2026 | | | 275,000 | | | | 190,850 | |
|
| |
Diversified Healthcare Trust, | | | | | | | | |
4.75%, 05/01/2024 | | | 573,000 | | | | 491,763 | |
|
| |
9.75%, 06/15/2025 | | | 672,000 | | | | 634,674 | |
|
| |
4.38%, 03/01/2031 | | | 402,000 | | | | 266,357 | |
|
| |
Dun & Bradstreet Corp. (The), 5.00%, 12/15/2029(a) | | | 233,000 | | | | 197,974 | |
|
| |
Encompass Health Corp., 4.50%, 02/01/2028(b) | | | 1,176,000 | | | | 1,055,342 | |
|
| |
EnerSys, | | | | | | | | |
5.00%, 04/30/2023(a) | | | 1,025,000 | | | | 1,019,506 | |
|
| |
4.38%, 12/15/2027(a)(b) | | | 1,452,000 | | | | 1,277,172 | |
|
| |
EnPro Industries, Inc., 5.75%, 10/15/2026 | | | 2,008,000 | | | | 1,922,600 | |
|
| |
Entegris Escrow Corp., 4.75%, 04/15/2029(a) | | | 1,347,000 | | | | 1,192,100 | |
|
| |
Enviva Partners L.P./Enviva Partners Finance Corp., 6.50%, 01/15/2026(a) | | | 287,000 | | | | 275,989 | |
|
| |
See accompanying Notes to Consolidated Financial Statements which are an integral part of the financial statements.
| | |
| 11 | | Invesco Global Strategic Income Fund |
| | | | | | | | |
| | | Principal Amount | | | Value | |
|
| |
United States–(continued) | | | | | | | | |
EQM Midstream Partners L.P., | | | | | | | | |
7.50%, 06/01/2027(a) | | $ | 326,000 | | | $ | 322,308 | |
|
| |
6.50%, 07/01/2027(a) | | | 853,000 | | | | 833,756 | |
|
| |
4.75%, 01/15/2031(a)(b) | | | 523,000 | | | | 438,324 | |
|
| |
EQT Corp., 5.68%, 10/01/2025 | | | 2,625,000 | | | | 2,597,680 | |
|
| |
Everi Holdings, Inc., 5.00%, 07/15/2029(a) | | | 1,194,000 | | | | 1,041,986 | |
|
| |
Expedia Group, Inc., 2.95%, 03/15/2031(b) | | | 840,000 | | | | 638,431 | |
|
| |
FedEx Corp., 4.05%, 02/15/2048 | | | 3,500,000 | | | | 2,473,960 | |
|
| |
FirstCash, Inc., 5.63%, 01/01/2030(a) | | | 1,012,000 | | | | 893,534 | |
|
| |
FirstEnergy Corp., Series B, 4.40%, 07/15/2027 | | | 1,950,000 | | | | 1,834,501 | |
|
| |
Ford Motor Co., | | | | | | | | |
3.25%, 02/12/2032 | | | 1,127,000 | | | | 848,096 | |
|
| |
4.75%, 01/15/2043 | | | 642,000 | | | | 448,228 | |
|
| |
Ford Motor Credit Co. LLC, | | | | | | | | |
5.13%, 06/16/2025 | | | 10,917,000 | | | | 10,550,080 | |
|
| |
3.38%, 11/13/2025 | | | 501,000 | | | | 455,422 | |
|
| |
4.39%, 01/08/2026 | | | 1,398,000 | | | | 1,293,343 | |
|
| |
4.95%, 05/28/2027 | | | 400,000 | | | | 366,808 | |
|
| |
5.11%, 05/03/2029(b) | | | 1,578,000 | | | | 1,413,486 | |
|
| |
Fortress Transportation and Infrastructure Investors LLC, 5.50%, 05/01/2028(a)(b) | | | 1,903,000 | | | | 1,596,151 | |
|
| |
Freeport-McMoRan, Inc., 4.63%, 08/01/2030(b) | | | 6,290,000 | | | | 5,568,352 | |
|
| |
Gap, Inc. (The), 3.63%, 10/01/2029(a) | | | 1,821,000 | | | | 1,281,237 | |
|
| |
Gartner, Inc., | | | | | | | | |
4.50%, 07/01/2028(a)(b) | | | 1,200,000 | | | | 1,114,494 | |
|
| |
3.63%, 06/15/2029(a) | | | 837,000 | | | | 713,224 | |
|
| |
General Motors Co., 6.80%, 10/01/2027 | | | 7,000,000 | | | | 7,097,807 | |
|
| |
Genesis Energy L.P./Genesis Energy Finance Corp., | | | | | | | | |
6.50%, 10/01/2025 | | | 406,000 | | | | 389,872 | |
|
| |
6.25%, 05/15/2026 | | | 791,000 | | | | 741,286 | |
|
| |
8.00%, 01/15/2027 | | | 550,000 | | | | 533,648 | |
|
| |
7.75%, 02/01/2028 | | | 283,000 | | | | 270,603 | |
|
| |
Global Partners L.P./GLP Finance Corp., 7.00%, 08/01/2027 | | | 990,000 | | | | 942,502 | |
|
| |
Gray Escrow II, Inc., 5.38%, 11/15/2031(a)(b) | | | 1,655,000 | | | | 1,330,438 | |
|
| |
Great Lakes Dredge & Dock Corp., 5.25%, 06/01/2029(a) | | | 1,224,000 | | | | 969,670 | |
|
| |
Group 1 Automotive, Inc., 4.00%, 08/15/2028(a) | | | 2,342,000 | | | | 1,929,211 | |
|
| |
HCA, Inc., | | | | | | | | |
5.38%, 02/01/2025 | | | 529,000 | | | | 522,600 | |
|
| |
5.63%, 09/01/2028 | | | 849,000 | | | | 816,411 | |
|
| |
4.13%, 06/15/2029 | | | 1,458,000 | | | | 1,288,123 | |
|
| |
Hess Midstream Operations L.P., 5.63%, 02/15/2026(a) | | | 1,316,000 | | | | 1,292,628 | |
|
| |
| | | | | | | | |
| | | Principal Amount | | | Value | |
|
| |
United States–(continued) | | | | | | | | |
Hilcorp Energy I L.P./Hilcorp Finance Co., | | | | | | | | |
6.25%, 11/01/2028(a) | | $ | 384,000 | | | $ | 362,045 | |
|
| |
6.00%, 04/15/2030(a) | | | 830,000 | | | | 752,672 | |
|
| |
6.25%, 04/15/2032(a) | | | 233,000 | | | | 214,010 | |
|
| |
Holly Energy Partners L.P./Holly Energy Finance Corp., 6.38%, 04/15/2027(a) | | | 1,015,000 | | | | 981,658 | |
|
| |
Howard Midstream Energy Partners LLC, 6.75%, 01/15/2027(a) | | | 1,144,000 | | | | 1,039,618 | |
|
| |
HP, Inc., 4.75%, 01/15/2028(b) | | | 7,000,000 | | | | 6,546,175 | |
|
| |
iStar, Inc., | | | | | | | | |
4.75%, 10/01/2024 | | | 1,637,000 | | | | 1,620,360 | |
|
| |
5.50%, 02/15/2026(b) | | | 574,000 | | | | 573,133 | |
|
| |
J.B. Poindexter & Co., Inc., 7.13%, 04/15/2026(a) | | | 1,898,000 | | | | 1,811,945 | |
|
| |
Jabil, Inc., 3.00%, 01/15/2031 | | | 3,700,000 | | | | 2,880,843 | |
|
| |
Jane Street Group/JSG Finance, Inc., 4.50%, 11/15/2029(a) | | | 1,097,000 | | | | 972,101 | |
|
| |
JBS USA LUX S.A./JBS USA Food Co./JBS USA Finance, Inc., | | | | | | | | |
5.13%, 02/01/2028(a) | | | 2,579,000 | | | | 2,402,475 | |
|
| |
5.75%, 04/01/2033(a)(b) | | | 4,700,000 | | | | 4,247,108 | |
|
| |
Kontoor Brands, Inc., 4.13%, 11/15/2029(a) | | | 1,152,000 | | | | 925,265 | |
|
| |
Kraft Heinz Foods Co. (The), 5.20%, 07/15/2045 | | | 9,490,000 | | | | 8,312,289 | |
|
| |
Lamar Media Corp., | | | | | | | | |
4.88%, 01/15/2029(b) | | | 1,861,000 | | | | 1,686,354 | |
|
| |
4.00%, 02/15/2030(b) | | | 2,325,000 | | | | 1,977,540 | |
|
| |
3.63%, 01/15/2031(b) | | | 1,046,000 | | | | 854,273 | |
|
| |
LCM Investments Holdings II LLC, 4.88%, 05/01/2029(a) | | | 1,118,000 | | | | 945,979 | |
|
| |
Level 3 Financing, Inc., 3.75%, 07/15/2029(a) | | | 1,977,000 | | | | 1,507,304 | |
|
| |
Lithia Motors, Inc., 3.88%, 06/01/2029(a)(b) | | | 1,206,000 | | | | 975,021 | |
|
| |
Lumen Technologies, Inc., Series P, 7.60%, 09/15/2039 | | | 1,041,000 | | | | 699,015 | |
|
| |
Macy’s Retail Holdings LLC, | | | | | | | | |
5.88%, 04/01/2029(a) | | | 1,112,000 | | | | 962,252 | |
|
| |
4.50%, 12/15/2034 | | | 703,000 | | | | 482,211 | |
|
| |
Marriott International, Inc., | | | | | | | | |
5.00%, 10/15/2027 | | | 2,617,000 | | | | 2,520,912 | |
|
| |
Series FF, 4.63%, 06/15/2030 | | | 745,000 | | | | 669,204 | |
|
| |
Series GG, 3.50%, 10/15/2032 | | | 8,360,000 | | | | 6,688,324 | |
|
| |
Match Group Holdings II LLC, 4.63%, 06/01/2028(a) | | | 1,652,000 | | | | 1,471,156 | |
|
| |
Mativ Holdings, Inc., 6.88%, 10/01/2026(a) | | | 5,212,000 | | | | 4,783,429 | |
|
| |
Mattel, Inc., | | | | | | | | |
6.20%, 10/01/2040 | | | 1,775,000 | | | | 1,514,856 | |
|
| |
5.45%, 11/01/2041 | | | 1,775,000 | | | | 1,382,960 | |
|
| |
See accompanying Notes to Consolidated Financial Statements which are an integral part of the financial statements.
| | |
| 12 | | Invesco Global Strategic Income Fund |
| | | | | | | | |
| | | Principal Amount | | | Value | |
|
| |
United States–(continued) | | | | | | | | |
Medline Borrower L.P., 3.88%, 04/01/2029(a) | | $ | 1,075,000 | | | $ | 880,049 | |
|
| |
Midwest Gaming Borrower LLC/Midwest Gaming Finance Corp., 4.88%, 05/01/2029(a) | | | 1,219,000 | | | | 1,033,551 | |
|
| |
Mohegan Gaming & Entertainment, 8.00%, 02/01/2026(a) | | | 1,081,000 | | | | 913,894 | |
|
| |
Mueller Water Products, Inc., 4.00%, 06/15/2029(a) | | | 1,126,000 | | | | 977,999 | |
|
| |
Murray Energy Corp., 3.00% PIK Rate, 9.00% Cash Rate, 04/15/2024(a)(g)(h) | | | 5,744,632 | | | | 29,298 | |
|
| |
Nabors Industries, Inc., 7.38%, 05/15/2027(a) | | | 1,045,000 | | | | 1,029,309 | |
|
| |
NESCO Holdings II, Inc., 5.50%, 04/15/2029(a) | | | 1,566,000 | | | | 1,376,412 | |
|
| |
Netflix, Inc., | | | | | | | | |
5.88%, 11/15/2028 | | | 704,000 | | | | 700,480 | |
|
| |
5.38%, 11/15/2029(a) | | | 1,101,000 | | | | 1,048,471 | |
|
| |
New Enterprise Stone & Lime Co., Inc., 5.25%, 07/15/2028(a) | | | 184,000 | | | | 160,492 | |
|
| |
NGL Energy Operating LLC/NGL Energy Finance Corp., 7.50%, 02/01/2026(a) | | | 1,006,000 | | | | 911,772 | |
|
| |
NMG Holding Co., Inc./Neiman Marcus Group LLC, 7.13%, 04/01/2026(a) | | | 592,000 | | | | 563,809 | |
|
| |
Novelis Corp., 4.75%, 01/30/2030(a) | | | 1,036,000 | | | | 882,113 | |
|
| |
NRG Energy, Inc., 4.45%, 06/15/2029(a) | | | 1,083,000 | | | | 958,015 | |
|
| |
Occidental Petroleum Corp., | | | | | | | | |
6.95%, 07/01/2024 | | | 428,000 | | | | 439,130 | |
|
| |
8.50%, 07/15/2027 | | | 219,000 | | | | 238,441 | |
|
| |
6.13%, 01/01/2031(b) | | | 439,000 | | | | 440,699 | |
|
| |
6.20%, 03/15/2040 | | | 661,000 | | | | 637,389 | |
|
| |
OneMain Finance Corp., | | | | | | | | |
6.88%, 03/15/2025 | | | 1,227,000 | | | | 1,191,693 | |
|
| |
7.13%, 03/15/2026 | | | 1,037,000 | | | | 1,000,565 | |
|
| |
3.88%, 09/15/2028 | | | 643,000 | | | | 502,530 | |
|
| |
Papa John’s International, Inc., 3.88%, 09/15/2029(a) | | | 1,215,000 | | | | 988,679 | |
|
| |
PetSmart, Inc./PetSmart Finance Corp., 4.75%, 02/15/2028(a) | | | 534,000 | | | | 488,615 | |
|
| |
Plains All American Pipeline L.P./PAA Finance Corp., | | | | | | | | |
4.50%, 12/15/2026 | | | 7,200,000 | | | | 6,765,306 | |
|
| |
3.80%, 09/15/2030 | | | 2,220,000 | | | | 1,853,387 | |
|
| |
Prestige Brands, Inc., 3.75%, 04/01/2031(a) | | | 1,815,000 | | | | 1,459,578 | |
|
| |
Rayonier A.M. Products, Inc., 7.63%, 01/15/2026(a) | | | 1,072,000 | | | | 933,305 | |
|
| |
Rockies Express Pipeline LLC, | | | | | | | | |
4.95%, 07/15/2029(a) | | | 462,000 | | | | 405,953 | |
|
| |
4.80%, 05/15/2030(a) | | | 1,112,000 | | | | 941,191 | |
|
| |
6.88%, 04/15/2040(a) | | | 875,000 | | | | 715,667 | |
|
| |
Roller Bearing Co. of America, Inc., 4.38%, 10/15/2029(a) | | | 995,000 | | | | 874,336 | |
|
| |
| | | | | | | | |
| | | Principal Amount | | | Value | |
|
| |
United States–(continued) | | | | | | | | |
RR Donnelley & Sons Co., 8.25%, 07/01/2027 | | $ | 447,000 | | | $ | 418,504 | |
|
| |
SBA Communications Corp., 3.88%, 02/15/2027 | | | 1,483,000 | | | | 1,337,399 | |
|
| |
Scientific Games Holdings L.P./Scientific Games US FinCo, Inc., 6.63%, 03/01/2030(a) | | | 1,324,000 | | | | 1,141,321 | |
|
| |
Seagate HDD Cayman, 4.13%, 01/15/2031 | | | 2,960,000 | | | | 2,230,182 | |
|
| |
Select Medical Corp., 6.25%, 08/15/2026(a)(b) | | | 1,049,000 | | | | 1,001,585 | |
|
| |
Sempra Energy, 4.13%, 04/01/2052(c) | | | 10,650,000 | | | | 8,033,973 | |
|
| |
Sensata Technologies B.V., | | | | | | | | |
5.63%, 11/01/2024(a) | | | 137,000 | | | | 136,108 | |
|
| |
4.00%, 04/15/2029(a) | | | 633,000 | | | | 534,129 | |
|
| |
5.88%, 09/01/2030(a) | | | 1,117,000 | | | | 1,062,809 | |
|
| |
Service Properties Trust, 4.38%, 02/15/2030 | | | 1,307,000 | | | | 933,080 | |
|
| |
Sirius XM Radio, Inc., | | | | | | | | |
3.13%, 09/01/2026(a) | | | 1,887,000 | | | | 1,690,271 | |
|
| |
4.00%, 07/15/2028(a) | | | 81,000 | | | | 69,764 | |
|
| |
Sonic Automotive, Inc., 4.63%, 11/15/2029(a) | | | 2,171,000 | | | | 1,706,048 | |
|
| |
Southern Co. (The), | | | | | | | | |
Series B, 4.00%, 01/15/2051(c) | | | 8,100,000 | | | | 7,063,119 | |
|
| |
Series 21-A, 3.75%, 09/15/2051(c) | | | 5,624,000 | | | | 4,471,616 | |
|
| |
Sprint Capital Corp., 8.75%, 03/15/2032 | | | 879,000 | | | | 1,032,865 | |
|
| |
Sprint Corp., 7.63%, 03/01/2026 | | | 168,000 | | | | 175,625 | |
|
| |
SS&C Technologies, Inc., 5.50%, 09/30/2027(a) | | | 1,728,000 | | | | 1,609,686 | |
|
| |
SunCoke Energy, Inc., 4.88%, 06/30/2029(a) | | | 1,233,000 | | | | 1,012,922 | |
|
| |
Sunoco L.P./Sunoco Finance Corp., | | | | | | | | |
6.00%, 04/15/2027 | | | 212,000 | | | | 208,187 | |
|
| |
5.88%, 03/15/2028 | | | 1,378,000 | | | | 1,314,110 | |
|
| |
Tenet Healthcare Corp., 4.88%, 01/01/2026(a) | | | 1,571,000 | | | | 1,487,596 | |
|
| |
Terminix Co. LLC (The), 7.45%, 08/15/2027 | | | 1,103,000 | | | | 1,231,257 | |
|
| |
TransDigm, Inc., 6.25%, 03/15/2026(a) | | | 1,746,000 | | | | 1,725,284 | |
|
| |
Twilio, Inc., 3.63%, 03/15/2029 | | | 1,118,000 | | | | 924,899 | |
|
| |
Uber Technologies, Inc., Conv., 0.00%, 12/15/2025(f) | | | 7,200,000 | | | | 5,982,563 | |
|
| |
United Airlines, Inc., 4.38%, 04/15/2026(a) | | | 3,600,000 | | | | 3,292,264 | |
|
| |
United States International Development Finance Corp., Series 4, 3.13%, 04/15/2028 | | | 1,120,000 | | | | 1,036,101 | |
|
| |
Universal Health Services, Inc., 2.65%, 10/15/2030(a) | | | 4,156,000 | | | | 3,113,521 | |
|
| |
See accompanying Notes to Consolidated Financial Statements which are an integral part of the financial statements.
| | |
| 13 | | Invesco Global Strategic Income Fund |
| | | | | | | | |
| | | Principal Amount | | | Value | |
|
| |
United States–(continued) | |
USA Compression Partners L.P./USA Compression Finance Corp., 6.88%, 09/01/2027 | | $ | 1,286,000 | | | $ | 1,231,223 | |
|
| |
Valaris Ltd., | | | | | | | | |
12.00% PIK Rate, 8.25% Cash Rate, 04/30/2028(a)(g) | | | 424,000 | | | | 417,752 | |
|
| |
Series 1145, 12.00% PIK Rate, 8.25% Cash Rate,
04/30/2028(b)(g) | | | 472,000 | | | | 465,045 | |
|
| |
Valvoline, Inc., 3.63%, 06/15/2031(a) | | | 1,233,000 | | | | 974,569 | |
|
| |
Viatris, Inc., 3.85%, 06/22/2040 | | | 2,220,000 | | | | 1,386,589 | |
|
| |
Vistra Corp., 7.00%(a)(c)(d) | | | 189,000 | | | | 167,617 | |
|
| |
Vistra Operations Co. LLC, | | | | | | | | |
5.50%, 09/01/2026(a) | | | 237,000 | | | | 228,095 | |
|
| |
5.63%, 02/15/2027(a)(b) | | | 423,000 | | | | 403,885 | |
|
| |
5.00%, 07/31/2027(a) | | | 890,000 | | | | 822,578 | |
|
| |
4.38%, 05/01/2029(a) | | | 999,000 | | | | 856,852 | |
|
| |
Warnermedia Holdings, Inc., 3.43%, 03/15/2024(a) | | | 7,000,000 | | | | 6,754,108 | |
|
| |
WMG Acquisition Corp., 3.75%, 12/01/2029(a) | | | 1,687,000 | | | | 1,406,891 | |
|
| |
WRKCo, Inc., 3.00%, 06/15/2033(b) | | | 5,180,000 | | | | 3,939,537 | |
|
| |
Wynn Resorts Finance LLC/ Wynn Resorts Capital Corp., 5.13%, 10/01/2029(a)(b) | | | 1,040,000 | | | | 829,712 | |
|
| |
Yum! Brands, Inc., 5.38%, 04/01/2032(b) | | | 1,014,000 | | | | 908,529 | |
|
| |
| | | | | | | 349,872,303 | |
|
| |
| | |
Zambia–0.20% | | | | | | | | |
First Quantum Minerals Ltd., 6.88%, 10/15/2027(a) | | | 3,500,000 | | | | 3,260,906 | |
|
| |
Total U.S. Dollar Denominated Bonds & Notes
(Cost $817,483,746) | | | | 690,856,024 | |
|
| |
|
Non-U.S. Dollar Denominated Bonds & Notes–28.72%(i) | |
Argentina–1.27% | | | | | | | | |
Argentina Treasury Bond BONCER, | | | | | | | | |
1.40%, 03/25/2023 | | ARS | 240,000,000 | | | | 4,854,231 | |
|
| |
1.50%, 03/25/2024 | | ARS | 250,000,000 | | | | 4,426,975 | |
|
| |
2.00%, 11/09/2026 | | ARS | 880,000,000 | | | | 11,586,273 | |
|
| |
| | | | | | | 20,867,479 | |
|
| |
| | |
Austria–0.08% | | | | | | | | |
Erste Group Bank AG, 4.25%(a)(c)(d) | | EUR | 1,800,000 | | | | 1,329,516 | |
|
| |
| | |
Belgium–0.49% | | | | | | | | |
KBC Group N.V., | | | | | | | | |
4.25%(a)(c)(d) | | EUR | 5,000,000 | | | | 4,135,346 | |
|
| |
4.75%(a)(c)(d) | | EUR | 2,200,000 | | | | 2,072,945 | |
|
| |
Kingdom of Belgium Government Bond, Series 88, 1.70%, 06/22/2050(a) | | EUR | 2,599,000 | | | | 1,889,509 | |
|
| |
| | | | | | | 8,097,800 | |
|
| |
| | | | | | | | |
| | | Principal Amount | | | Value | |
|
| |
Brazil–9.93% | | | | | | | | |
Brazil Notas do Tesouro Nacional, | | | | | | | | |
10.00%, 01/01/2027 | | BRL | 495,000,000 | | | $ | 90,997,131 | |
|
| |
Series B, 6.00%, 05/15/2055 | | BRL | 5,700,000 | | | | 4,496,760 | |
|
| |
Series F, 10.00%, 01/01/2025 | | BRL | 355,000,000 | | | | 66,538,292 | |
|
| |
Swiss Insured Brazil Power Finance S.a r.l., 9.85%, 07/16/2032(a) | | BRL | 9,233,963 | | | | 1,586,515 | |
|
| |
| | | | | | | 163,618,698 | |
|
| |
| | |
Chile–0.56% | | | | | | | | |
Bonos de la Tesoreria de la Republica en pesos, 2.80%, 10/01/2033(a) | | CLP | 12,000,000,000 | | | | 9,177,782 | |
|
| |
| | |
China–0.63% | | | | | | | | |
China Government Bond, 3.53%, 10/18/2051 | | CNY | 70,000,000 | | | | 10,331,728 | |
|
| |
| | |
Colombia–2.17% | | | | | | | | |
Colombian TES, | | | | | | | | |
Series B, 7.75%, 09/18/2030 | | COP | 79,000,000,000 | | | | 11,479,860 | |
|
| |
Series B, 7.00%, 06/30/2032 | | COP | 70,000,000,000 | | | | 9,158,995 | |
|
| |
Series B, 7.25%, 10/18/2034 | | COP | 33,425,000,000 | | | | 4,238,619 | |
|
| |
Series B, 9.25%, 05/28/2042 | | COP | 11,375,000,000 | | | | 1,595,846 | |
|
| |
Series B, 7.25%, 10/26/2050 | | COP | 85,050,000,000 | | | | 9,241,397 | |
|
| |
| | | | | | | 35,714,717 | |
|
| |
| | |
Czech Republic–0.13% | | | | | | | | |
CPI Property Group S.A., 4.88%(a)(c)(d) | | EUR | 4,100,000 | | | | 2,147,467 | |
|
| |
| | |
Egypt–0.09% | | | | | | | | |
Egypt Government International Bond, 4.75%, 04/16/2026(a) | | EUR | 2,000,000 | | | | 1,502,881 | |
|
| |
| | |
France–0.73% | | | | | | | | |
Accor S.A., 4.38%(a)(c)(d) | | EUR | 1,700,000 | | | | 1,469,812 | |
|
| |
BPCE S.A., Series NC5, 1.50%, 01/13/2042(a)(c) | | EUR | 5,000,000 | | | | 4,143,277 | |
|
| |
Credit Agricole S.A.,
7.50%(a)(c)(d) | | GBP | 1,377,000 | | | | 1,485,381 | |
|
| |
Electricite de France S.A., 5.38%(a)(c)(d) | | EUR | 5,400,000 | | | | 4,925,447 | |
|
| |
| | | | | | | 12,023,917 | |
|
| |
| | |
Germany–0.52% | | | | | | | | |
Bayer AG, 2.38%, 11/12/2079(a)(c) | | EUR | 3,700,000 | | | | 3,301,454 | |
|
| |
Deutsche Lufthansa AG, 4.38%, 08/12/2075(a)(c) | | EUR | 3,600,000 | | | | 2,899,525 | |
|
| |
Nidda Healthcare Holding GmbH, 3.50%, 09/30/2024(a) | | EUR | 990,000 | | | | 918,385 | |
|
| |
Volkswagen International Finance N.V., 4.63%(a)(c)(d) | | EUR | 1,480,000 | | | | 1,392,301 | |
|
| |
| | | | | | | 8,511,665 | |
|
| |
See accompanying Notes to Consolidated Financial Statements which are an integral part of the financial statements.
| | |
| 14 | | Invesco Global Strategic Income Fund |
| | | | | | | | |
| | | Principal Amount | | | Value | |
|
| |
Greece–0.27% | | | | | | | | |
Hellenic Republic Government Bond, | | | | | | | | |
1.88%, 01/24/2052(a) | | EUR | 7,727,000 | | | $ | 4,321,558 | |
|
| |
Series GDP, 0.00%, 10/15/2042(f) | | EUR | 76,770,000 | | | | 178,289 | |
|
| |
| | | | | | | 4,499,847 | |
|
| |
| | |
India–1.10% | | | | | | | | |
India Government Bond, | | | | | | | | |
6.54%, 01/17/2032 | | INR | 700,000,000 | | | | 7,949,020 | |
|
| |
7.26%, 08/22/2032 | | INR | 850,000,000 | | | | 10,142,188 | |
|
| |
| | | | | | | 18,091,208 | |
|
| |
| | |
Italy–0.10% | | | | | | | | |
Intesa Sanpaolo S.p.A., 7.75%(a)(c)(d) | | EUR | 1,750,000 | | | | 1,641,618 | |
|
| |
| | |
Ivory Coast–0.12% | | | | | | | | |
Ivory Coast Government International Bond, 4.88%, 01/30/2032(a) | | EUR | 2,900,000 | | | | 2,021,078 | |
|
| |
| | |
Malaysia–0.15% | | | | | | | | |
Malaysia Government Bond, Series 317, 4.76%, 04/07/2037 | | MYR | 11,900,000 | | | | 2,546,241 | |
|
| |
| | |
Mexico–1.30% | | | | | | | | |
Mexican Bonos, Series M, 7.75%, 05/29/2031 | | MXN | 481,850,000 | | | | 21,431,379 | |
|
| |
| | |
Netherlands–0.45% | | | | | | | | |
ABN AMRO Bank N.V., 4.38%(a)(c)(d) | | EUR | 1,700,000 | | | | 1,500,001 | |
|
| |
Cooperatieve Rabobank U.A., 4.38%(a)(c)(d) | | EUR | 6,800,000 | | | | 5,871,585 | |
|
| |
| | | | | | | 7,371,586 | |
|
| |
| | |
New Zealand–0.49% | | | | | | | | |
New Zealand Government Bond, Series 551, 2.75%, 05/15/2051 | | NZD | 19,000,000 | | | | 8,066,490 | |
|
| |
| | |
Poland–1.03% | | | | | | | | |
Republic of Poland Government Bond, Series 432, 1.75%, 04/25/2032 | | PLN | 140,000,000 | | | | 16,989,380 | |
|
| |
| | |
Romania–0.11% | | | | | | | | |
Romanian Government International Bond, 2.00%, 04/14/2033(a) | | EUR | 2,997,000 | | | | 1,817,558 | |
|
| |
| | |
Russia–0.00% | | | | | | | | |
Mos.ru, 5.00%, 08/22/2034 | | RUB | 72,806,608 | | | | 0 | |
|
| |
| | | | | | | | |
| | | Principal Amount | | | Value | |
|
| |
South Africa–3.36% | | | | | | | | |
Republic of South Africa Government Bond, | | | | | | | | |
Series 2030, 8.00%, 01/31/2030 | | ZAR | 661,350,000 | | | $ | 30,918,506 | |
|
| |
Series 2032, 8.25%, 03/31/2032 | | ZAR | 165,300,000 | | | | 7,416,509 | |
|
| |
Series 2035, 8.88%, 02/28/2035 | | ZAR | 200,000,000 | | | | 8,884,110 | |
|
| |
Series 2037, 8.50%, 01/31/2037 | | ZAR | 195,500,000 | | | | 8,195,701 | |
|
| |
| | | | | | | 55,414,826 | |
|
| |
| | |
Spain–1.08% | | | | | | | | |
Banco Bilbao Vizcaya Argentaria S.A., | | | | | | | | |
6.00%(a)(c)(d) | | EUR | 1,400,000 | | | | 1,334,565 | |
|
| |
6.00%(a)(c)(d) | | EUR | 400,000 | | | | 362,945 | |
|
| |
Banco Santander S.A., | | | | | | | | |
4.38%(a)(c)(d) | | EUR | 3,800,000 | | | | 3,043,654 | |
|
| |
4.13%(c)(d) | | EUR | 2,000,000 | | | | 1,447,161 | |
|
| |
CaixaBank S.A., | | | | | | | | |
5.25%(a)(c)(d) | | EUR | 2,000,000 | | | | 1,663,936 | |
|
| |
5.88%(a)(c)(d) | | EUR | 1,800,000 | | | | 1,587,925 | |
|
| |
Repsol International Finance B.V.,
3.75%(a)(c)(d) | | EUR | 1,950,000 | | | | 1,778,686 | |
|
| |
Telefonica Europe B.V., | | | | | | | | |
2.88%(a)(c)(d) | | EUR | 3,700,000 | | | | 3,029,028 | |
|
| |
4.38%(a)(c)(d) | | EUR | 3,700,000 | | | | 3,507,520 | |
|
| |
| | | | | | | 17,755,420 | |
|
| |
| | |
Supranational–0.79% | | | | | | | | |
African Development Bank, 0.00%, 01/17/2050(f) | | ZAR | 222,000,000 | | | | 1,105,479 | |
|
| |
Corp. Andina de Fomento, 6.82%, 02/22/2031(a) | | MXN | 221,200,000 | | | | 9,010,498 | |
|
| |
International Finance Corp., | | | | | | | | |
0.00%, 02/15/2029(a)(f) | | TRY | 10,300,000 | | | | 66,605 | |
|
| |
0.00%, 03/23/2038(f) | | MXN | 260,000,000 | | | | 2,799,071 | |
|
| |
| | | | | | | 12,981,653 | |
|
| |
| | |
Sweden–0.06% | | | | | | | | |
Heimstaden Bostad AB, 3.38%(a)(c)(d) | | EUR | 1,850,000 | | | | 1,042,841 | |
|
| |
| | |
Switzerland–0.08% | | | | | | | | |
Dufry One B.V., 2.00%, 02/15/2027(a) | | EUR | 1,750,000 | | | | 1,413,836 | |
|
| |
| | |
United Kingdom–1.63% | | | | | | | | |
Barclays PLC, | | | | | | | | |
7.25%(a)(c)(d) | | GBP | 4,200,000 | | | | 4,790,751 | |
|
| |
6.38%(a)(c)(d) | | GBP | 1,425,000 | | | | 1,450,343 | |
|
| |
7.13%(c)(d) | | GBP | 5,375,000 | | | | 5,676,163 | |
|
| |
Bellis Acquisition Co. PLC, 3.25%, 02/16/2026(a) | | GBP | 953,000 | | | | 893,400 | |
|
| |
Gatwick Airport Finance PLC, 4.38%, 04/07/2026(a) | | GBP | 5,925,000 | | | | 5,671,269 | |
|
| |
HSBC Holdings PLC, 5.88%(c)(d) | | GBP | 1,750,000 | | | | 1,647,736 | |
|
| |
International Consolidated Airlines Group S.A., | | | | | | | | |
2.75%, 03/25/2025(a) | | EUR | 1,700,000 | | | | 1,495,211 | |
|
| |
1.50%, 07/04/2027(a) | | EUR | 1,900,000 | | | | 1,382,438 | |
|
| |
See accompanying Notes to Consolidated Financial Statements which are an integral part of the financial statements.
| | |
| 15 | | Invesco Global Strategic Income Fund |
| | | | | | | | |
| | | Principal Amount | | | Value | |
|
| |
United Kingdom–(continued) | |
Nationwide Building Society, 5.75%(a)(c)(d) | | GBP | 1,775,000 | | | $ | 1,707,334 | |
|
| |
NatWest Group PLC,
5.13%(c)(d) | | GBP | 2,415,000 | | | | 2,180,651 | |
|
| |
| | | | | | | 26,895,296 | |
|
| |
Total Non-U.S. Dollar Denominated Bonds & Notes
(Cost $568,084,026) | | | | 473,303,907 | |
|
| |
|
Asset-Backed Securities–8.81% | |
American Credit Acceptance Receivables Trust, Series 2019-2, Class D, 3.41%, 06/12/2025(a) | | $ | 1,929,450 | | | | 1,922,599 | |
|
| |
Bear Stearns Adjustable Rate Mortgage Trust, Series 2006-1, Class A1, 0.65% (1 yr. U.S. Treasury Yield Curve Rate + 2.25%), 02/25/2036(j) | | | 11,702 | | | | 11,170 | |
|
| |
Benchmark Mortgage Trust, Series 2018-B1, Class XA, IO, 0.56%, 01/15/2051(k) | | | 10,478,506 | | | | 202,757 | |
|
| |
CarMax Auto Owner Trust, Series 2019-3, Class D, 2.85%, 01/15/2026 | | | 2,285,000 | | | | 2,206,254 | |
|
| |
CCG Receivables Trust, | | | | | | | | |
Series 2019-1, Class B, 3.22%, 09/14/2026(a) | | | 181,333 | | | | 181,223 | |
|
| |
Series 2019-1, Class C, 3.57%, 09/14/2026(a) | | | 80,000 | | | | 79,958 | |
|
| |
CD Mortgage Trust, Series 2017-CD6, Class XA, IO, 0.88%, 11/13/2050(k) | | | 4,764,956 | | | | 136,582 | |
|
| |
Citigroup Commercial Mortgage Trust, Series 2017-C4, Class XA, IO, 1.06%, 10/12/2050(k) | | | 13,329,096 | | | | 476,291 | |
|
| |
Citigroup Mortgage Loan Trust, Inc., | | | | | | | | |
Series 2005-2, Class 1A3, 2.82%, 05/25/2035(l) | | | 502,307 | | | | 477,807 | |
|
| |
Series 2006-AR1, Class 1A1, 3.15% (1 yr. U.S. Treasury Yield Curve Rate + 2.40%), 10/25/2035(j) | | | 103,983 | | | | 100,208 | |
|
| |
COMM Mortgage Trust, | | | | | | | | |
Series 2012-CR5, Class XA, IO, 1.37%, 12/10/2045(k) | | | 1,633,164 | | | | 16 | |
|
| |
Series 2014-UBS6, Class AM, 4.05%, 12/10/2047 | | | 4,690,000 | | | | 4,458,951 | |
|
| |
Series 2014-CR21, Class AM, 3.99%, 12/10/2047 | | | 70,000 | | | | 66,452 | |
|
| |
Countrywide Home Loans Mortgage Pass-Through Trust, | | | | | | | | |
Series 2005-17, Class 1A8, 5.50%, 09/25/2035 | | | 329,762 | | | | 301,444 | |
|
| |
Series 2005-J4, Class A7, 5.50%, 11/25/2035 | | | 553,145 | | | | 442,328 | |
|
| |
| | | | | | | | |
| | | Principal Amount | �� | | Value | |
|
| |
CWHEQ Revolving Home Equity Loan Trust, | | | | | | | | |
Series 2005-G, Class 2A, 3.64% (1 mo. USD LIBOR + 0.23%), 12/15/2035(j) | | $ | 5,964 | | | $ | 5,907 | |
|
| |
Series 2006-H, Class 2A1A, 3.56% (1 mo. USD LIBOR + 0.15%), 11/15/2036(j) | | | 22,610 | | | | 18,555 | |
|
| |
DT Auto Owner Trust, | | | | | | | | |
Series 2019-2A, Class D, 3.48%, 02/18/2025(a) | | | 452,811 | | | | 449,927 | |
|
| |
Series 2019-4A, Class D, 2.85%, 07/15/2025(a) | | | 6,025,000 | | | | 5,932,293 | |
|
| |
Exeter Automobile Receivables Trust, | | | | | | | | |
Series 2019-1A, Class D, 4.13%, 12/16/2024(a) | | | 1,930,685 | | | | 1,926,818 | |
|
| |
Series 2019-4A, Class D, 2.58%, 09/15/2025(a) | | | 5,810,843 | | | | 5,696,872 | |
|
| |
FREMF Mortgage Trust, | | | | | | | | |
Series 2017-K62, Class B, 3.88%, 01/25/2050(a)(l) | | | 840,000 | | | | 781,932 | |
|
| |
Series 2016-K54, Class C, 4.05%, 04/25/2048(a)(l) | | | 4,190,000 | | | | 3,897,704 | |
|
| |
GSR Mortgage Loan Trust, Series 2005-AR4, Class 6A1, 3.65%, 07/25/2035(l) | | | 53,137 | | | | 49,087 | |
|
| |
ILPT Commercial Mortgage Trust, Series 2022-LPF2, Class B, 6.12% (1 mo. Term SOFR + 2.74%), 10/15/2039(a)(j) | | | 2,100,000 | | | | 2,094,828 | |
|
| |
JP Morgan Chase Commercial Mortgage Securities Trust, Series 2013-LC11, Class AS, 3.22%, 04/15/2046 | | | 425,000 | | | | 415,096 | |
|
| |
JP Morgan Mortgage Trust, Series 2007-A1, Class 5A1, 2.84%, 07/25/2035(l) | | | 45,790 | | | | 44,272 | |
|
| |
JPMBB Commercial Mortgage Securities Trust, Series 2014-C24, Class B, 4.12%, 11/15/2047(l) | | | 1,655,000 | | | | 1,517,965 | |
|
| |
Lehman Structured Securities Corp., Series 2002-GE1, Class A, 0.00%,
07/26/2024(a)(f)(l) | | | 16,233 | | | | 2,913 | |
|
| |
MASTR Asset Backed Securities Trust, Series 2006-WMC3, Class A3, 3.69% (1 mo. USD LIBOR + 0.10%), 08/25/2036(j) | | | 2,988,442 | | | | 1,116,517 | |
|
| |
Morgan Stanley Bank of America Merrill Lynch Trust, | | | | | | | | |
Series 2013-C9, Class AS, 3.46%, 05/15/2046 | | | 1,565,000 | | | | 1,538,217 | |
|
| |
Series 2014-C14, Class B, 4.87%, 02/15/2047(l) | | | 680,000 | | | | 661,704 | |
|
| |
Morgan Stanley Capital I Trust, Series 2017-HR2, Class XA, IO, 0.87%, 12/15/2050(k) | | | 4,090,952 | | | | 141,464 | |
|
| |
See accompanying Notes to Consolidated Financial Statements which are an integral part of the financial statements.
| | |
| 16 | | Invesco Global Strategic Income Fund |
| | | | | | | | |
| | | Principal Amount | | | Value | |
|
| |
Morgan Stanley Re-REMIC Trust, Series 2012-R3, Class 1B, 6.00%, 11/26/2036(a)(l) | | $ | 6,325,247 | | | $ | 5,640,190 | |
|
| |
OBX Trust, | | | | | | | | |
Series 2022-NQM7, Class A3, 5.70%, 08/25/2062(a)(e) | | | 889,760 | | | | 834,625 | |
|
| |
Series 2022-NQM7, Class A2, 5.70%, 08/25/2062(a)(e) | | | 1,711,077 | | | | 1,615,352 | |
|
| |
Prestige Auto Receivables Trust, Series 2019-1A, Class C, 2.70%, 10/15/2024(a) | | | 1,608,460 | | | | 1,602,892 | |
|
| |
Residential Accredit Loans, Inc. Trust, Series 2006- QS13, Class 1A8, 6.00%, 09/25/2036 | | | 24,306 | | | | 18,572 | |
|
| |
UBS Commercial Mortgage Trust, Series 2017-C5, Class XA, IO, 1.07%, 11/15/2050(k) | | | 7,657,371 | | | | 258,524 | |
|
| |
Vendee Mortgage Trust, | | | | | | | | |
Series 1995-2B, Class 2, IO, 0.79%, 06/15/2025(m) | | | 64,056 | | | | 460 | |
|
| |
Series 1995-3, Class 1, IO, 0.00%, 09/15/2025(f)(k) | | | 1,489,909 | | | | 2 | |
|
| |
Verus Securitization Trust, Series 2022-7, Class A3, 5.35%, 07/25/2067(a)(l) | | | 1,183,530 | | | | 1,104,929 | |
|
| |
WaMu Mortgage Pass-Through Ctfs. Trust, Series 2003- AR10, Class A7, 4.24%, 10/25/2033(l) | | | 32,836 | | | | 30,621 | |
|
| |
Wells Fargo Commercial Mortgage Trust, Series 2017-C42, Class XA, IO, 0.86%, 12/15/2050(k) | | | 6,355,334 | | | | 222,004 | |
|
| |
WFRBS Commercial Mortgage Trust, | | | | | | | | |
Series 2013-C14, Class AS, 3.49%, 06/15/2046 | | | 1,800,000 | | | | 1,763,466 | |
|
| |
Series 2014-LC14, Class AS, 4.35%, 03/15/2047(l) | | | 1,135,000 | | | | 1,101,230 | |
|
| |
Series 2014-C20, Class AS, 4.18%, 05/15/2047 | | | 1,455,000 | | | | 1,398,172 | |
|
| |
Alba PLC, | | | | | | | | |
Series 2007-1, Class F, 5.47% (SONIA + 3.37%), 03/17/2039(a)(i)(j) | | GBP | 2,178,795 | | | | 2,249,616 | |
|
| |
Series 2007-1, Class E, 3.42% (SONIA + 1.32%), 03/17/2039(a)(i)(j) | | GBP | 5,683,812 | | | | 5,578,719 | |
|
| |
Series 2006-2, Class F, 5.43% (SONIA + 3.37%), 12/15/2038(a)(i)(j) | | GBP | 1,357,344 | | | | 1,438,454 | |
|
| |
| | | | | | | | |
| | | Principal Amount | | | Value | |
|
| |
Eurohome UK Mortgages PLC, | | | | | | | | |
Series 2007-1, Class B1, 3.64% (3 mo. GBP LIBOR + 0.90%), 06/15/2044(a)(i)(j) | | GBP | 2,006,000 | | | $ | 1,773,095 | |
|
| |
Series 2007-2, Class B1, 4.14% (SONIA + 1.52%), 09/15/2044(a)(i)(j) | | GBP | 2,243,000 | | | | 1,879,672 | |
|
| |
Eurosail PLC, | | | | | | | | |
Series 2006-2X, Class E1C, 5.43% (SONIA + 3.37%), 12/15/2044(a)(i)(j) | | GBP | 5,550,000 | | | | 5,084,960 | |
|
| |
Series 2006-4X, Class E1C, 5.16% (SONIA + 3.12%), 12/10/2044(a)(i)(j) | | GBP | 4,135,722 | | | | 4,240,070 | |
|
| |
Series 2007-2X, Class D1A, 1.73% (3 mo. EURIBOR + 0.80%), 03/13/2045(a)(i)(j) | | EUR | 3,500,000 | | | | 2,607,493 | |
|
| |
Series 2006-2X, Class D1A, 1.80% (3 mo. EURIBOR + 0.80%), 12/15/2044(a)(i)(j) | | EUR | 6,300,000 | | | | 4,514,565 | |
|
| |
Series 2007-2X, Class D1C, 2.96% (SONIA + 0.92%), 03/13/2045(a)(i)(j) | | GBP | 4,900,000 | | | | 4,321,705 | |
|
| |
Great Hall Mortgages No. 1 PLC, Series 2007-2X, Class EB, 4.81% (3 mo. EURIBOR + 3.75%), 06/18/2039(a)(i)(j) | | EUR | 4,570,000 | | | | 4,056,497 | |
|
| |
Ludgate Funding PLC, Series 2007-1, Class MA, 3.57% (3 mo. GBP LIBOR + 0.24%), 01/01/2061(a)(i)(j) | | GBP | 3,059,340 | | | | 3,077,300 | |
|
| |
Newday Funding Master Issuer PLC, | | | | | | | | |
Series 2021-1X, Class E, 6.24% (SONIA + 4.05%), 03/15/2029(a)(i)(j) | | GBP | 4,252,000 | | | | 4,753,438 | |
|
| |
Series 2021-3X, Class E, 6.54% (SONIA + 4.35%), 11/15/2029(a)(i)(j) | | GBP | 3,700,000 | | | | 4,174,864 | |
|
| |
Stratton Mortgage Funding PLC, | | | | | | | | |
Series 2021-1, Class D, 4.25% (SONIA + 2.10%), 09/25/2051(a)(i)(j) | | GBP | 3,700,000 | | | | 3,988,535 | |
|
| |
Series 2021-1, Class E, 4.90% (SONIA + 2.75%), 09/25/2051(a)(i)(j) | | GBP | 2,220,000 | | | | 2,384,768 | |
|
| |
Towd Point Mortgage Funding 2019 - Granite4 PLC, | | | | | | | | |
Series 2019-GR4X, Class FR, 4.24% (SONIA + 2.05%), 10/20/2051(a)(i)(j) | | GBP | 2,130,000 | | | | 2,339,035 | |
|
| |
Series 2019-GR4X, Class GR, 4.69% (SONIA + 2.50%), 10/20/2051(a)(i)(j) | | GBP | 1,775,000 | | | | 1,942,767 | |
|
| |
Prosil Acquisition S.A., Series 2019-1, Class A, 3.58% (3 mo. EURIBOR + 2.00%), 10/31/2039(a)(i)(j) | | EUR | 4,887,066 | | | | 4,287,824 | |
|
| |
See accompanying Notes to Consolidated Financial Statements which are an integral part of the financial statements.
| | |
| 17 | | Invesco Global Strategic Income Fund |
| | | | | | | | |
| | | Principal Amount | | | Value | |
|
| |
Alhambra SME Funding DAC, | | | | | | | | |
Series 2019-1, Class A, 2.69% (1 mo. EURIBOR + 2.00%),
11/30/2028(a)(i)(j) | | EUR | 4,103,902 | | | $ | 4,021,486 | |
|
| |
Series 2019-1, Class B, 3.19% (1 mo. EURIBOR + 2.50%),
11/30/2028(a)(i)(j) | | EUR | 1,875,000 | | | | 1,801,222 | |
|
| |
Series 2019-1, Class D, 9.94% (1 mo. EURIBOR + 9.25%),
11/30/2028(a)(i)(j) | | EUR | 424,276 | | | | 308,400 | |
|
| |
Lusitano Mortgages No. 5 PLC, Class D, 2.34% (3 mo. EURIBOR + 0.96%), 07/15/2059(a)(i)(j) | | EUR | 2,096,738 | | | | 1,730,416 | |
|
| |
Futura S.r.l., Series 2019-1, Class A, 3.63% (6 mo. EURIBOR + 3.00%), 07/31/2044(a)(i)(j) | | EUR | 4,119,544 | | | | 4,075,299 | |
|
| |
Taurus, Series 2018-IT1, Class A, 1.33% (3 mo. EURIBOR + 1.00%), 05/18/2030(i)(j) | | EUR | 5,150,965 | | | | 4,926,848 | |
|
| |
IM Pastor 4, FTA, Series A, 1.24% (3 mo. EURIBOR + 0.14%),
03/22/2044(a)(i)(j) | | EUR | 2,142,510 | | | | 1,789,097 | |
|
| |
Invernea Proteina PYME, Serie II, 0.00%, 08/25/2032(i)(n) | | ARS | 311,500,000 | | | | 1,985,430 | |
|
| |
SC Germany Consumer 2018-1 UG (haftungsbeschraenkt), Series 2018-1, Class D, 3.25%, 12/13/2031(a)(i) | | EUR | 7,200,000 | | | | 6,974,292 | |
|
| |
Total Asset-Backed Securities
(Cost $170,395,451) | | | | 145,253,017 | |
|
| |
| | | | | | | | |
| | | Principal Amount | | | Value | |
|
| |
Agency Credit Risk Transfer Notes–2.22% | |
United States–2.22% | | | | | | | | |
Fannie Mae Connecticut Avenue Securities, | | | | | | | | |
Series 2017-C04, Class 2M2, 6.44% (1 mo. USD LIBOR + 2.85%), 11/25/2029(j) | | $ | 2,001,281 | | | $ | 2,023,756 | |
|
| |
Series 2018-C06, Class 2M2, 5.69% (1 mo. USD LIBOR + 2.10%), 03/25/2031(j) | | | 3,924,178 | | | | 3,854,536 | |
|
| |
Series 2018-R07, Class 1M2, 5.99% (1 mo. USD LIBOR + 2.40%), 04/25/2031(a)(j) | | | 441,157 | | | | 438,957 | |
|
| |
Series 2019-R02, Class 1M2, 5.89% (1 mo. USD LIBOR + 2.30%), 08/25/2031(a)(j) | | | 78,072 | | | | 77,983 | |
|
| |
Series 2019-R03, Class 1M2, 5.74% (1 mo. USD LIBOR + 2.15%), 09/25/2031(a)(j) | | | 187,224 | | | | 186,772 | |
|
| |
Series 2022-R04, Class 1M2, 6.10% (30 Day Average SOFR + 3.10%), 03/25/2042(a)(j) | | | 1,795,000 | | | | 1,685,999 | |
|
| |
Series 2022-R08, Class 1M2, 6.60% (30 Day Average SOFR + 3.60%), 07/25/2042(a)(j) | | | 3,150,000 | | | | 2,986,596 | |
|
| |
Freddie Mac, | | | | | | | | |
Series 2022-DNA2, Class M1B, STACR® , 5.40% (30 Day Average SOFR + 2.40%), 02/25/2042(a)(j) | | | 3,500,000 | | | | 3,229,223 | |
|
| |
Series 2022-DNA3, Class M1B, STACR® , 5.90% (30 Day Average SOFR + 2.90%), 04/25/2042(a)(j) | | | 7,000,000 | | | | 6,512,762 | |
|
| |
Series 2022-DNA3, Class M1A, STACR® , 5.00% (30 Day Average SOFR + 2.00%), 04/25/2042(a)(j) | | | 5,447,785 | | | | 5,342,501 | |
|
| |
Series 2022-HQA2, Class M1, STACR® , 7.00% (30 Day Average SOFR + 4.00%), 07/25/2042(a)(j) | | | 3,500,000 | | | | 3,422,281 | |
|
| |
Series 2022-HQA3, Class M1, STACR® , 6.55% (30 Day Average SOFR + 3.55%), 08/25/2042(a)(j) | | | 3,500,000 | | | | 3,286,559 | |
|
| |
Series 2022-HQA3, Class M2, STACR® , 8.35% (30 Day Average SOFR + 5.35%), 08/25/2042(a)(j) | | | 3,745,000 | | | | 3,517,283 | |
|
| |
Total Agency Credit Risk Transfer Notes
(Cost $38,154,444) | | | | 36,565,208 | |
|
| |
| | |
| | | Shares | | | | |
Common Stocks & Other Equity Interests–1.11% | |
Argentina–1.08% | | | | | | | | |
TMF Trust Co. S.A.(n) | | | 478,972,801 | | | | 3,052,863 | |
|
| |
YPF S.A., Class D(o) | | | 980,000 | | | | 14,741,257 | |
|
| |
| | | | | | | 17,794,120 | |
|
| |
See accompanying Notes to Consolidated Financial Statements which are an integral part of the financial statements.
| | |
| 18 | | Invesco Global Strategic Income Fund |
| | | | | | | | |
| | | Shares | | | Value | |
|
| |
United States–0.03% | | | | | | | | |
ACNR Holdings, Inc. | | | 2,129 | | | $ | 220,352 | |
|
| |
Claire’s Holdings LLC | | | 614 | | | | 235,366 | |
|
| |
McDermott International Ltd.(o) | | | 38,319 | | | | 22,853 | |
|
| |
McDermott International Ltd., Series A, Wts., expiring 06/30/2027(n)(o) | | | 76,715 | | | | 9,973 | |
|
| |
McDermott International Ltd., Series B, Wts., expiring 06/30/2027(n)(o) | | | 85,239 | | | | 11,081 | |
|
| |
McDermott International Ltd., Wts., expiring 12/31/2049(n)(o) | | | 55,393 | | | | 31,311 | |
|
| |
Party City Holdco, Inc.(o) | | | 10,188 | | | | 17,218 | |
|
| |
Sabine Oil & Gas Holdings,
Inc.(n)(o) | | | 2,510 | | | | 1,707 | |
|
| |
Tenerity LLC, Wts., expiring 04/10/2024(n)(o) | | | 2,297 | | | | 0 | |
|
| |
Windstream Services LLC,
Wts.(n)(o) | | | 399 | | | | 6,384 | |
|
| |
| | | | | | | 556,245 | |
|
| |
Total Common Stocks & Other Equity Interests
(Cost $21,331,624) | | | | 18,350,365 | |
|
| |
| | |
| | | Principal
Amount | | | | |
U.S. Treasury Securities–0.88% | |
U.S. Treasury Inflation – Indexed Bonds–0.88% | |
0.13%, 02/15/2052
(Cost $18,359,720)(p) | | $ | 18,359,720 | | | | 14,449,266 | |
|
| |
|
Variable Rate Senior Loan Interests–0.50%(q)(r) | |
Brazil–0.03% | | | | | | | | |
Patagonia Holdco LLC, First Lien Term Loan B, 8.39% (1 mo. Term SOFR + 5.75%), 08/01/2029 | | | 714,000 | | | | 580,125 | |
|
| |
| | |
United States–0.47% | | | | | | | | |
Claire’s Stores, Inc., Term Loan, 10.25% (1 mo. USD LIBOR + 6.50%), 12/18/2026 | | | 185,745 | | | | 176,768 | |
|
| |
Dun & Bradstreet Corp. (The), Term Loan, 6.85% (1 mo. USD LIBOR + 3.25%), 02/06/2026 | | | 989,443 | | | | 975,838 | |
|
| |
Endo Luxembourg Finance Co. I S.a.r.l., Term Loan, 12.25% (1 mo. USD LIBOR + 4.00%), 03/27/2028 | | | 1,352,875 | | | | 1,118,449 | |
|
| |
IRB Holding Corp., Term Loan, 6.21% (1 mo. Term SOFR + 3.00%), 12/15/2027 | | | 938,539 | | | | 915,779 | |
|
| |
Mativ Holdings, Inc., Term Loan B, 7.56% (1 mo. USD LIBOR + 3.75%), 04/20/2028 | | | 2,394,208 | | | | 2,247,563 | |
|
| |
PetSmart LLC, Term Loan, 7.50% (1 mo. USD LIBOR + 3.75%), 02/11/2028 | | | 1,016,882 | | | | 981,082 | |
|
| |
United Natural Foods, Inc., Term Loan, 7.09% (3 mo. USD LIBOR + 3.25%), 10/22/2025 | | | 1,268,583 | | | | 1,260,167 | |
|
| |
| | | | | | | 7,675,646 | |
|
| |
Total Variable Rate Senior Loan Interests
(Cost $8,640,466) | | | | 8,255,771 | |
|
| |
| | | | | | | | |
| | | Principal
Amount | | | Value | |
|
| |
U.S. Government Sponsored Agency Mortgage-Backed Securities–0.34% | |
Fannie Mae Grantor Trust, IO, | | | | | | | | |
0.63%, 11/25/2040(k) | | $ | 2,154,212 | | | $ | 11,446 | |
|
| |
0.38%, 12/25/2041(k) | | | 13,354,362 | | | | 134,167 | |
|
| |
Fannie Mae Interest STRIPS, IO, | | | | | | | | |
7.50%, 05/25/2023 - 11/25/2029(m) | | | 55,287 | | | | 8,446 | |
|
| |
6.50%, 04/25/2029 - 07/25/2032(m) | | | 916,670 | | | | 150,626 | |
|
| |
6.00%, 12/25/2032 - 08/25/2035(m) | | | 1,151,000 | | | | 190,903 | |
|
| |
5.50%, 11/25/2033 - 06/25/2035(m) | | | 964,686 | | | | 166,036 | |
|
| |
Fannie Mae REMICs, IO, | | | | | | | | |
5.50%, 06/25/2023(m) | | | 1,419 | | | | 12 | |
|
| |
3.11%, 02/25/2024 - 05/25/2035(j)(m) | | | 572,950 | | | | 39,928 | |
|
| |
4.01% (7.60% - (1.00 x 1 mo. USD LIBOR)), 06/25/2026(j)(m) | | | 62,912 | | | | 2,328 | |
|
| |
4.46%, 11/18/2031 - 12/18/2031(j)(m) | | | 126,100 | | | | 12,187 | |
|
| |
4.31% (7.90% - (1.00 x 1 mo. USD LIBOR)), 11/25/2031(j)(m) | | | 2,484 | | | | 252 | |
|
| |
4.36% (7.95% - (1.00 x 1 mo. USD LIBOR)), 01/25/2032(j)(m) | | | 29,548 | | | | 2,793 | |
|
| |
4.56% (8.00% - (1.00 x 1 mo. USD LIBOR)), 03/18/2032(j)(m) | | | 57,996 | | | | 5,896 | |
|
| |
4.51%, 03/25/2032 - 04/25/2032(j)(m) | | | 82,840 | | | | 8,763 | |
|
| |
3.41% (7.00% - (1.00 x 1 mo. USD LIBOR)), 04/25/2032(j)(m) | | | 37,276 | | | | 2,656 | |
|
| |
4.21% (7.80% - (1.00 x 1 mo. USD LIBOR)), 04/25/2032(j)(m) | | | 27,630 | | | | 2,902 | |
|
| |
4.41%, 07/25/2032 - 09/25/2032(j)(m) | | | 121,695 | | | | 14,308 | |
|
| |
4.66%, 12/18/2032(j)(m) | | | 99,735 | | | | 8,526 | |
|
| |
4.61% (8.20% - (1.00 x 1 mo. USD LIBOR)), 01/25/2033(j)(m) | | | 333,110 | | | | 36,640 | |
|
| |
4.66%, 02/25/2033 - 05/25/2033(j)(m) | | | 199,567 | | | | 26,557 | |
|
| |
7.00%, 03/25/2033 - 04/25/2033(m) | | | 476,439 | | | | 74,227 | |
|
| |
3.96% (7.55% - (1.00 x 1 mo. USD LIBOR)), 10/25/2033(j)(m) | | | 154,575 | | | | 16,507 | |
|
| |
2.46%, 03/25/2035 - 07/25/2038(j)(m) | | | 134,517 | | | | 6,251 | |
|
| |
3.16%, 03/25/2035 - 05/25/2035(j)(m) | | | 235,683 | | | | 8,113 | |
|
| |
3.01% (6.60% - (1.00 x 1 mo. USD LIBOR)), 05/25/2035(j)(m) | | | 302,348 | | | | 17,435 | |
|
| |
3.64% (7.23% - (1.00 x 1 mo. USD LIBOR)), 09/25/2036(j)(m) | | | 608,261 | | | | 27,788 | |
|
| |
See accompanying Notes to Consolidated Financial Statements which are an integral part of the financial statements.
| | |
| 19 | | Invesco Global Strategic Income Fund |
| | | | | | | | |
| | | Principal
Amount | | | Value | |
|
| |
2.95% (6.54% - (1.00 x 1 mo. USD LIBOR)), 06/25/2037(j)(m) | | $ | 852,795 | | | $ | 59,837 | |
|
| |
4.00%, 04/25/2041(m) | | | 900,401 | | | | 106,469 | |
|
| |
2.96% (6.55% - (1.00 x 1 mo. USD LIBOR)), 10/25/2041(j)(m) | | | 149,548 | | | | 9,564 | |
|
| |
2.56% (6.15% - (1.00 x 1 mo. USD LIBOR)), 12/25/2042(j)(m) | | | 382,015 | | | | 34,935 | |
|
| |
7.00%, 07/25/2026 | | | 7,786 | | | | 7,853 | |
|
| |
4.00%, 08/25/2026 - 03/25/2041 | | | 74,327 | | | | 69,660 | |
|
| |
6.50%, 10/25/2028 - 04/25/2029 | | | 72,261 | | | | 73,674 | |
|
| |
6.00%, 05/25/2031 - 01/25/2032 | | | 135,650 | | | | 137,382 | |
|
| |
4.59%, 04/25/2032 - 12/25/2032(j) | | | 103,105 | | | | 103,599 | |
|
| |
3.94% (1 mo. USD LIBOR + 0.50%), 10/18/2032(j) | | | 38,302 | | | | 37,981 | |
|
| |
4.09% (1 mo. USD LIBOR + 0.50%), 12/25/2032(j) | | | 65,783 | | | | 65,239 | |
|
| |
3.99% (1 mo. USD LIBOR + 0.40%), 11/25/2033(j) | | | 36,823 | | | | 36,414 | |
|
| |
11.42% (24.57% - (3.67 x 1 mo. USD LIBOR)), 03/25/2036(j) | | | 140,859 | | | | 160,483 | |
|
| |
11.05% (24.20% - (3.67 x 1 mo. USD LIBOR)), 06/25/2036(j) | | | 149,151 | | | | 161,194 | |
|
| |
4.53% (1 mo. USD LIBOR + 0.94%), 06/25/2037(j) | | | 71,393 | | | | 71,031 | |
|
| |
Federal Home Loan Mortgage Corp., 8.50%, 08/01/2031 | | | 20,679 | | | | 21,651 | |
|
| |
Federal National Mortgage Association, | | | | | | | | |
7.50%, 03/01/2033 | | | 16,211 | | | | 16,894 | |
|
| |
7.00%, 12/01/2033 | | | 11,321 | | | | 11,616 | |
|
| |
5.50%, 02/01/2035 | | | 23,570 | | | | 24,118 | |
|
| |
Freddie Mac Multifamily Structured Pass-Through Ctfs., | | | | | | | | |
Series K734, Class X1, IO, 0.65%, 02/25/2026(k) | | | 4,002,710 | | | | 66,871 | |
|
| |
Series K735, Class X1, IO, 1.10%, 05/25/2026(k) | | | 6,718,500 | | | | 182,203 | |
|
| |
Series K093, Class X1, IO, 0.95%, 05/25/2029(k) | | | 45,551,279 | | | | 2,211,291 | |
|
| |
| | | | | | | | |
| | | Principal
Amount | | | Value | |
|
| |
Freddie Mac REMICs, | | | | | | | | |
5.00%, 09/15/2023 | | $ | 13,215 | | | $ | 13,170 | |
|
| |
6.75%, 02/15/2024 | | | 2,060 | | | | 2,065 | |
|
| |
6.50%, 02/15/2028 - 06/15/2032 | | | 67,054 | | | | 68,800 | |
|
| |
3.86% (1 mo. USD LIBOR + 0.45%), 02/15/2029(j) | | | 6,395 | | | | 6,348 | |
|
| |
4.06% (1 mo. USD LIBOR + 0.65%), 07/15/2029(j) | | | 9,584 | | | | 9,561 | |
|
| |
4.41%, 02/15/2032 - 03/15/2032(j) | | | 205,077 | | | | 205,673 | |
|
| |
3.50%, 05/15/2032 | | | 66,825 | | | | 63,513 | |
|
| |
3.91% (1 mo. USD LIBOR + 0.50%), 01/15/2033(j) | | | 5,971 | | | | 5,919 | |
|
| |
12.24% (24.75% - (3.67 x 1 mo. USD LIBOR)), 08/15/2035(j) | | | 106,618 | | | | 122,934 | |
|
| |
4.00%, 06/15/2038 | | | 56,532 | | | | 53,267 | |
|
| |
3.00%, 05/15/2040 | | | 1,269 | | | | 1,237 | |
|
| |
IO, | | | | | | | | |
2.59%, 03/15/2024 - 04/15/2038(j)(m) | | | 144,269 | | | | 4,760 | |
|
| |
7.00%, 03/15/2028 - 04/15/2028(m) | | | 33,690 | | | | 3,926 | |
|
| |
5.29%, 07/17/2028(j)(m) | | | 14,778 | | | | 276 | |
|
| |
4.69% (8.10% - (1.00 x 1 mo. USD LIBOR)), 06/15/2029(j)(m) | | | 47,773 | | | | 3,046 | |
|
| |
5.54% (8.95% - (1.00 x 1 mo. USD LIBOR)), 08/15/2029(j)(m) | | | 22,449 | | | | 1,227 | |
|
| |
3.64% (7.05% - (1.00 x 1 mo. USD LIBOR)), 10/15/2033(j)(m) | | | 224,204 | | | | 13,697 | |
|
| |
3.29% (6.70% - (1.00 x 1 mo. USD LIBOR)), 01/15/2035(j)(m) | | | 420,348 | | | | 20,266 | |
|
| |
3.34% (6.75% - (1.00 x 1 mo. USD LIBOR)), 02/15/2035(j)(m) | | | 24,933 | | | | 1,277 | |
|
| |
3.31%, 05/15/2035(j)(m) | | | 667,674 | | | | 41,170 | |
|
| |
2.74% (6.15% - (1.00 x 1 mo. USD LIBOR)), 07/15/2035(j)(m) | | | 450,942 | | | | 16,865 | |
|
| |
3.59% (7.00% - (1.00 x 1 mo. USD LIBOR)), 12/15/2037(j)(m) | | | 127,743 | | | | 11,991 | |
|
| |
2.66% (6.07% - (1.00 x 1 mo. USD LIBOR)), 05/15/2038(j)(m) | | | 233,192 | | | | 16,078 | |
|
| |
2.84% (6.25% - (1.00 x 1 mo. USD LIBOR)), 12/15/2039(j)(m) | | | 115,606 | | | | 6,982 | |
|
| |
Freddie Mac STRIPS, IO, | | | | | | | | |
7.00%, 04/01/2027 - 04/01/2030(m) | | | 173,368 | | | | 23,244 | |
|
| |
6.50%, 02/01/2028 - 06/01/2031(m) | | | 42,718 | | | | 6,209 | |
|
| |
7.50%, 12/15/2029(m) | | | 49,276 | | | | 7,590 | |
|
| |
6.00%, 12/15/2032(m) | | | 90,798 | | | | 11,944 | |
|
| |
See accompanying Notes to Consolidated Financial Statements which are an integral part of the financial statements.
| | |
| 20 | | Invesco Global Strategic Income Fund |
| | | | | | | | |
| | | Principal
Amount | | | Value | |
|
| |
Government National Mortgage Association, | | | | | | | | |
ARM, 2.63% (1 yr. U.S. Treasury Yield Curve Rate + 1.50%), 07/20/2027(j) | | $ | 749 | | | $ | 727 | |
|
| |
7.00%, 01/15/2028 - 01/20/2030 | | | 100,316 | | | | 101,603 | |
|
| |
8.00%, 01/15/2028 - 09/15/2028 | | | 64,299 | | | | 65,671 | |
|
| |
IO, | | | | | | | | |
3.14% (6.55% - (1.00 x 1 mo. USD LIBOR)), 04/16/2037(j)(m) | | | 440,006 | | | | 30,025 | |
|
| |
3.24% (6.65% - (1.00 x 1 mo. USD LIBOR)), 04/16/2041(j)(m) | | | 758,084 | | | | 42,650 | |
|
| |
Total U.S. Government Sponsored Agency Mortgage-Backed Securities
(Cost $8,835,802) | | | | 5,629,363 | |
|
| |
| | |
| | | Shares | | | | |
Preferred Stocks–0.19% | |
United States–0.19% | |
AT&T, Inc., 2.88%, Series B,
Pfd.(c) | | | 3,500,000 | | | | 3,098,912 | |
|
| |
Claire’s Holdings LLC, Series A, Pfd.(n) | | | 195 | | | | 49,725 | |
|
| |
Total Preferred Stocks (Cost $4,308,927) | | | | 3,148,637 | |
|
| |
|
Money Market Funds–5.43% | |
Invesco Government & Agency Portfolio, Institutional Class, 3.07%(s)(t) | | | 31,287,616 | | | | 31,287,616 | |
|
| |
| | | | | | | | |
| | | Shares | | | Value | |
|
| |
Money Market Funds–(continued) | |
Invesco Liquid Assets Portfolio, Institutional Class, 3.03%(s)(t) | | | 22,434,080 | | | $ | 22,438,567 | |
|
| |
Invesco Treasury Portfolio, Institutional Class, 3.08%(s)(t) | | | 35,757,276 | | | | 35,757,276 | |
|
| |
Total Money Market Funds
(Cost $89,482,685) | | | | 89,483,459 | |
|
| |
| |
Options Purchased–3.60% | | | | | |
(Cost $35,075,494)(u) | | | | 59,267,377 | |
|
| |
TOTAL INVESTMENTS IN SECURITIES (excluding Investments purchased with cash collateral from securities on loan)-93.71%
(Cost $1,780,152,385) | | | | | | | 1,544,562,394 | |
|
| |
|
Investments Purchased with Cash Collateral from Securities on Loan | |
Money Market Funds–3.95% | | | | | | | | |
Invesco Private Government Fund, 3.18%(s)(t)(v) | | | 17,970,670 | | | | 17,970,670 | |
|
| |
Invesco Private Prime Fund, 3.28%(s)(t)(v) | | | 47,071,670 | | | | 47,071,670 | |
|
| |
Total Investments Purchased with Cash Collateral from Securities on Loan
(Cost $65,043,941) | | | | 65,042,340 | |
|
| |
TOTAL INVESTMENTS IN
SECURITIES–97.66%
(Cost $1,845,196,326) | | | | 1,609,604,734 | |
|
| |
OTHER ASSETS LESS LIABILITIES–2.34% | | | | 38,628,376 | |
|
| |
NET ASSETS–100.00% | | | $ | 1,648,233,110 | |
|
| |
| | |
| Investment Abbreviations: |
| |
| ARM | | - Adjustable Rate Mortgage |
| ARS | | - Argentina Peso |
| BRL | | - Brazilian Real |
| CLP | | - Chile Peso |
| CNY | | - Chinese Yuan Renminbi |
| Conv. | | - Convertible |
| COP | | - Colombia Peso |
| Ctfs. | | - Certificates |
| EUR | | - Euro |
| EURIBOR | | - Euro Interbank Offered Rate |
| GBP | | - British Pound Sterling |
| INR | | - Indian Rupee |
| IO | | - Interest Only |
| LIBOR | | - London Interbank Offered Rate |
| MXN | | - Mexican Peso |
| MYR | | - Malaysian Ringgit |
| NZD | | - New Zealand Dollar |
| Pfd. | | - Preferred |
| PIK | | - Pay-in-Kind |
| PLN | | - Polish Zloty |
| REMICs | | - Real Estate Mortgage Investment Conduits |
| RUB | | - Russian Ruble |
| SOFR | | - Secured Overnight Financing Rate |
| SONIA | | - Sterling Overnight Index Average |
| STACR® | | - Structured Agency Credit Risk |
| STRIPS | | - Separately Traded Registered Interest and Principal Security |
| TRY | | - Turkish Lira |
| USD | | - U.S. Dollar |
| Wts. | | - Warrants |
| ZAR | | - South African Rand |
See accompanying Notes to Consolidated Financial Statements which are an integral part of the financial statements.
| | |
| 21 | | Invesco Global Strategic Income Fund |
Notes to Consolidated Schedule of Investments:
| (a) | Security purchased or received in a transaction exempt from registration under the Securities Act of 1933, as amended (the “1933 Act”). The security may be resold pursuant to an exemption from registration under the 1933 Act, typically to qualified institutional buyers. The aggregate value of these securities at October 31, 2022 was $677,016,292, which represented 41.08% of the Fund’s Net Assets. |
| (b) | All or a portion of this security was out on loan at October 31, 2022. |
| (c) | Security issued at a fixed rate for a specific period of time, after which it will convert to a variable rate. |
| (d) | Perpetual bond with no specified maturity date. |
| (e) | Step coupon bond. The interest rate represents the coupon rate at which the bond will accrue at a specified future date. |
| (f) | Zero coupon bond issued at a discount. |
| (g) | All or a portion of this security is Pay-in-Kind. Pay-in-Kind securities pay interest income in the form of securities. |
| (h) | Defaulted security. Currently, the issuer is in default with respect to principal and/or interest payments. The value of this security at October 31, 2022 represented less than 1% of the Fund’s Net Assets. |
| (i) | Foreign denominated security. Principal amount is denominated in the currency indicated. |
| (j) | Interest or dividend rate is redetermined periodically. Rate shown is the rate in effect on October 31, 2022. |
| (k) | Interest only security. Principal amount shown is the notional principal and does not reflect the maturity value of the security. Interest rate is redetermined periodically based on the cash flows generated by the pool of assets backing the security, less any applicable fees. The rate shown is the rate in effect on October 31, 2022. |
| (l) | Interest rate is redetermined periodically based on the cash flows generated by the pool of assets backing the security, less any applicable fees. The rate shown is the rate in effect on October 31, 2022. |
| (m) | Interest only security. Principal amount shown is the notional principal and does not reflect the maturity value of the security. |
| (n) | Security valued using significant unobservable inputs (Level 3). See Note 3. |
| (o) | Non-income producing security. |
| (p) | Principal amount of security and interest payments are adjusted for inflation. See Note 1K. |
| (q) | Variable rate senior loan interests often require prepayments from excess cash flow or permit the borrower to repay at its election. The degree to which borrowers repay, whether as a contractual requirement or at their election, cannot be predicted with any accuracy. As a result, the actual remaining maturity may be substantially less than the stated maturities shown. However, it is anticipated that the variable rate senior loan interests will have an expected average life of three to five years. |
| (r) | Variable rate senior loan interests are, at present, not readily marketable, not registered under the 1933 Act and may be subject to contractual and legal restrictions on sale. Variable rate senior loan interests in the Fund’s portfolio generally have variable rates which adjust to a base, such as the London Interbank Offered Rate (“LIBOR”), on set dates, typically every 30 days, but not greater than one year, and/or have interest rates that float at margin above a widely recognized base lending rate such as the Prime Rate of a designated U.S. bank. |
| (s) | Affiliated issuer. The issuer and/or the Fund is a wholly-owned subsidiary of Invesco Ltd., or is affiliated by having an investment adviser that is under common control of Invesco Ltd. The table below shows the Fund’s transactions in, and earnings from, its investments in affiliates for the fiscal year ended October 31, 2022. |
| | | | | | | | | | | | | | | | | | | | | | | | | | |
| | | Value
October 31, 2021 | | | Purchases
at Cost | | | Proceeds
from Sales | | | Change in Unrealized Appreciation (Depreciation) | | | Realized Gain (Loss) | | | Value
October 31, 2022 | | | Dividend Income |
Invesco Senior Loan ETF | | | $ 72,429,002 | | | | $ - | | | | $ (69,103,784) | | | | $687,187 | | | | $(4,012,405) | | | | $ - | | | $1,460,638 |
| Investments in Affiliated Money Market Funds: | | | | | | | | | | | | | | | | | | | | | | | | | | |
Invesco Government & Agency Portfolio, Institutional Class | | | 52,627,305 | | | | 360,230,202 | | | | (381,569,891 | ) | | | - | | | | - | | | | 31,287,616 | | | 341,570 |
Invesco Liquid Assets Portfolio, Institutional Class | | | 38,016,641 | | | | 257,307,287 | | | | (272,895,264 | ) | | | 3,510 | | | | 6,393 | | | | 22,438,567 | | | 246,463 |
Invesco Treasury Portfolio, Institutional Class | | | 60,145,492 | | | | 411,691,659 | | | | (436,079,875 | ) | | | - | | | | - | | | | 35,757,276 | | | 369,237 |
| Investments Purchased with Cash Collateral from Securities on Loan: | | | | | | | | | | | | | | | | | | | | | | | | | | |
Invesco Private Government Fund | | | 17,905,063 | | | | 198,655,734 | | | | (198,590,127 | ) | | | - | | | | - | | | | 17,970,670 | | | 201,891* |
Invesco Private Prime Fund | | | 41,778,482 | | | | 375,120,396 | | | | (369,791,108 | ) | | | (1,601 | ) | | | (34,499 | ) | | | 47,071,670 | | | 563,712* |
Total | | | $282,901,985 | | | | $1,603,005,278 | | | | $(1,728,030,049 | ) | | | $689,096 | | | | $(4,040,511 | ) | | | $154,525,799 | | | $3,183,511 |
| | * | Represents the income earned on the investment of cash collateral, which is included in securities lending income on the Consolidated Statement of Operations. Does not include rebates and fees paid to lending agent or premiums received from borrowers, if any. |
| (t) | The rate shown is the 7-day SEC standardized yield as of October 31, 2022. |
| (u) | The table below details options purchased. |
| (v) | The security has been segregated to satisfy the commitment to return the cash collateral received in securities lending transactions upon the borrower’s return of the securities loaned. See Note 1M. |
See accompanying Notes to Consolidated Financial Statements which are an integral part of the financial statements.
| | |
| 22 | | Invesco Global Strategic Income Fund |
| | | | | | | | | | | | | | | | | | |
| Open Over-The-Counter Foreign Currency Options Purchased(a) |
| Description | | Type of Contract | | Counterparty | | Expiration Date | | | Exercise Price | | | Notional Value | | | Value |
Currency Risk | | | | | | | | | | | | | | | | | | |
AUD versus USD | | Call | | Bank of America, N.A. | | | 12/05/2022 | | | USD | 0.80 | | | AUD | 5,325,000 | | | $ 266 |
AUD versus USD | | Call | | Bank of America, N.A. | | | 09/27/2023 | | | USD | 0.68 | | | AUD | 51,470,588 | | | 605,687 |
AUD versus USD | | Call | | Goldman Sachs International | | | 10/12/2023 | | | USD | 0.80 | | | AUD | 2,625,000 | | | 57,586 |
EUR versus HUF | | Call | | Bank of America, N.A. | | | 01/31/2023 | | | HUF | 480.00 | | | EUR | 28,000,000 | | | 176,790 |
EUR versus USD | | Call | | Goldman Sachs International | | | 11/28/2022 | | | USD | 1.03 | | | EUR | 84,000,000 | | | 126,346 |
NZD versus USD | | Call | | Goldman Sachs International | | | 10/12/2023 | | | USD | 0.70 | | | NZD | 5,000,000 | | | 173,670 |
Subtotal – Foreign Currency Call Options Purchased | | | | | | | | | | | | | | 1,140,345 |
Currency Risk | | | | | | | | | | | | | | | | | | |
EUR versus CHF | | Put | | Goldman Sachs International | | | 12/16/2022 | | | CHF | 0.93 | | | EUR | 26,250,000 | | | 18,211 |
EUR versus CZK | | Put | | J.P. Morgan Chase Bank, N.A. | | | 07/17/2023 | | | CZK | 24.00 | | | EUR | 1,400,000 | | | 141,893 |
EUR versus CZK | | Put | | J.P. Morgan Chase Bank, N.A. | | | 02/05/2024 | | | CZK | 24.30 | | | EUR | 2,500,000 | | | 404,098 |
EUR versus CZK | | Put | | Morgan Stanley and Co. International PLC | | | 12/07/2022 | | | CZK | 24.60 | | | EUR | 2,250,000 | | | 1,331,918 |
EUR versus HUF | | Put | | Bank of America, N.A. | | | 01/31/2023 | | | HUF | 400.00 | | | EUR | 28,000,000 | | | 241,761 |
EUR versus NOK | | Put | | J.P. Morgan Chase Bank, N.A. | | | 02/17/2023 | | | NOK | 9.70 | | | EUR | 2,800,000 | | | 11,102 |
EUR versus PLN | | Put | | Bank of America, N.A. | | | 03/24/2023 | | | PLN | 4.50 | | | EUR | 3,500,000 | | | 215,363 |
EUR versus PLN | | Put | | Bank of America, N.A. | | | 03/24/2023 | | | PLN | 4.50 | | | EUR | 1,400,000 | | | 86,145 |
EUR versus SEK | | Put | | Morgan Stanley and Co. International PLC | | | 02/17/2023 | | | SEK | 10.80 | | | EUR | 17,500,000 | | | 214,761 |
GBP versus USD | | Put | | Goldman Sachs International | | | 01/09/2023 | | | USD | 1.09 | | | GBP | 3,500,000 | | | 663,200 |
USD versus BRL | | Put | | Goldman Sachs International | | | 02/01/2023 | | | BRL | 5.00 | | | USD | 3,500,000 | | | 1,128,666 |
USD versus BRL | | Put | | J.P. Morgan Chase Bank, N.A. | | | 12/16/2022 | | | BRL | 5.05 | | | USD | 35,000,000 | | | 566,195 |
USD versus CAD | | Put | | Goldman Sachs International | | | 03/10/2023 | | | CAD | 1.26 | | | USD | 70,000,000 | | | 78,330 |
USD versus CLP | | Put | | Bank of America, N.A. | | | 12/20/2022 | | | CLP | 850.00 | | | USD | 42,000,000 | | | 42,714 |
USD versus JPY | | Put | | Goldman Sachs International | | | 11/04/2022 | | | JPY | 128.00 | | | USD | 2,800,000 | | | 3 |
USD versus JPY | | Put | | J.P. Morgan Chase Bank, N.A. | | | 03/14/2023 | | | JPY | 120.00 | | | USD | 2,100,000 | | | 45,186 |
USD versus MXN | | Put | | Bank of America, N.A. | | | 04/26/2023 | | | MXN | 19.00 | | | USD | 1,750,000 | | | 280,616 |
USD versus MXN | | Put | | J.P. Morgan Chase Bank, N.A. | | | 01/24/2023 | | | MXN | 20.00 | | | USD | 3,500,000 | | | 746,172 |
USD versus PLN | | Put | | Goldman Sachs International | | | 06/27/2023 | | | PLN | 4.40 | | | USD | 3,500,000 | | | 610,424 |
USD versus SEK | | Put | | Goldman Sachs International | | | 09/27/2023 | | | SEK | 10.25 | | | USD | 42,000,000 | | | 1,264,662 |
USD versus SGD | | Put | | Goldman Sachs International | | | 12/16/2022 | | | SGD | 1.38 | | | USD | 70,000,000 | | | 119,630 |
USD versus THB | | Put | | J.P. Morgan Chase Bank, N.A. | | | 12/13/2022 | | | THB | 35.85 | | | USD | 35,000,000 | | | 35,070 |
USD versus THB | | Put | | Standard Chartered Bank PLC | | | 04/26/2023 | | | THB | 33.75 | | | USD | 3,500,000 | | | 214,816 |
USD versus ZAR | | Put | | Bank of America, N.A. | | | 01/25/2023 | | | ZAR | 17.90 | | | USD | 35,000,000 | | | 572,460 |
USD versus ZAR | | Put | | Goldman Sachs International | | | 12/13/2022 | | | ZAR | 16.00 | | | USD | 3,500,000 | | | 25,490 |
USD versus ZAR | | Put | | Goldman Sachs International | | | 04/04/2023 | | | ZAR | 15.70 | | | USD | 4,550,000 | | | 216,025 |
USD versus ZAR | | Put | | Goldman Sachs International | | | 07/24/2023 | | | ZAR | 15.75 | | | USD | 2,100,000 | | | 202,356 |
USD versus ZAR | | Put | | J.P. Morgan Chase Bank, N.A. | | | 11/14/2022 | | | ZAR | 17.00 | | | USD | 35,000,000 | | | 1,890 |
Subtotal – Foreign Currency Put Options Purchased | | | | | | | | | | | | | | 9,479,157 |
Total Foreign Currency Options Purchased | | | | | | | | | | | $10,619,502 |
| (a) | Over-The-Counter options purchased, options written and swap agreements are collateralized by cash held with Counterparties in the amount of $73,299,000. |
See accompanying Notes to Consolidated Financial Statements which are an integral part of the financial statements.
| | |
| 23 | | Invesco Global Strategic Income Fund |
Open Over-The-Counter Interest Rate Swaptions Purchased(a)
| | | | | | | | | | | | | | | | | | | | | | | | | | | | | | | | |
| |
| | | | | | | | | | Pay/ | | | | | | | | | | | | | | | |
| | | | | | | | | | Receive | | | | | | | | | | | | | | | |
| | | Type of | | | | Exercise | | | Exercise | | | Floating Rate | | Payment | | | Expiration | | | Notional | | | | |
| Description | | Contract | | Counterparty | | Rate | | | Rate | | | Index | | Frequency | | | Date | | | Value | | | Value | |
| |
Interest Rate Risk | | | | | | | | | | | | | | | | | | | | | | | | | | | |
| |
10 Year Interest Rate Swap | | Put | | J.P. Morgan Chase Bank, N.A. | | | 0.55% | | | | Pay | | | TONAR | | | Annually | | | | 05/26/2025 | | | JPY | | | 15,000,000,000 | | | $ | 4,058,422 | |
| |
10 Year Interest Rate Swap | | Put | | Morgan Stanley and Co. International PLC | | | 2.84 | | | | Pay | | | SOFR | | | Annually | | | | 12/07/2022 | | | USD | | | 203,000,000 | | | | 16,500,593 | |
| |
10 Year Interest Rate Swap | | Put | | Morgan Stanley and Co. International PLC | | | 2.84 | | | | Pay | | | SOFR | | | Annually | | | | 06/07/2023 | | | USD | | | 247,800,000 | | | | 20,616,311 | |
| |
2 Year Interest Rate Swap | | Put | | Goldman Sachs International | | | 7.75 | | | | Pay | | | 6 Month WIBOR | | | Semi-Annually | | | | 12/12/2022 | | | PLN | | | 175,000,000 | | | | 375,778 | |
| |
30 Year Interest Rate Swap | | Put | | J.P. Morgan Chase Bank, N.A. | | | 1.93 | | | | Pay | | | 6 Month EURIBOR | | | Semi-Annually | | | | 06/12/2023 | | | EUR | | | 21,000,000 | | | | 3,168,879 | |
| |
50 Year Interest Rate Swap | | Put | | J.P. Morgan Chase Bank, N.A. | | | 1.37 | | | | Pay | | | 6 Month EURIBOR | | | Semi-Annually | | | | 04/21/2023 | | | EUR | | | 10,500,000 | | | | 2,325,055 | |
| |
Total Interest Rate Swaptions Purchased | | | | | | | | | | | | | | | | $ | 47,045,038 | |
| |
| (a) | Over-The-Counter options purchased, options written and swap agreements are collateralized by cash held with Counterparties in the amount of $73,299,000. |
| | | | | | | | | | | | | | | | | | | | | | | | | | | | | | | | | | | | |
| Open Over-The-Counter Credit Default Swaptions Purchased(a) | |
| |
| Counterparty | | Type of Contract | | | Exercise
Rate | | | Reference Entity | | (Pay)/
Receive
Fixed
Rate | | | Payment Frequency | | | Expiration
Date | | | Implied
Credit
Spread(b) | | | Notional
Value | | Value | |
| |
Credit Risk | | | | | | | | | | | | | | | | | | | | | | | | | | | | | | | | | |
| |
J.P. Morgan Chase Bank, N.A. | | | Call | | | | 600.00% | | | Markit iTraxx Europe Crossover Index, Series 38, Version 1 | | | 5.00% | | | | Quarterly | | | | 11/16/2022 | | | | 5.558% | | | | EUR | | | 84,000,000 | | $ | 1,602,837 | |
| |
| (a) | Over-The-Counter options purchased, options written and swap agreements are collateralized by cash held with Counterparties in the amount of $73,299,000. |
| (b) | Implied credit spreads represent the current level, as of October 31, 2022, at which protection could be bought or sold given the terms of the existing credit default swap agreement and serve as an indicator of the current status of the payment/performance risk of the credit default swap agreement. An implied credit spread that has widened or increased since entry into the initial agreement may indicate a deteriorating credit profile and increased risk of default for the reference entity. A declining or narrowing spread may indicate an improving credit profile or decreased risk of default for the reference entity. Alternatively, credit spreads may increase or decrease reflecting the general tolerance for risk in the credit markets generally. |
| | | | | | | | | | | | | | | | | | | | | | | | | | | | | | | | | | | | |
| Open Over-The-Counter Credit Default Swaptions Written(a) | |
| |
| | | | | | | | | | | (Pay)/ | | | | | | | | | | | | | | | |
| | | | | | | | | | | Receive | | | | | | | | | Implied | | | | | | |
| | | Type of | | | Exercise | | | Reference | | Fixed | | | Payment | | | Expiration | | | Credit | | | Notional | | | |
| Counterparty | | Contract | | | Rate | | | Entity | | Rate | | | Frequency | | | Date | | | Spread(b) | | | Value | | Value | |
| |
Credit Risk | | | | | | | | | | | | | | | | | | | | | | | | | | | | | | | | | |
| |
J.P. Morgan Chase Bank, N.A. | | | Call | | | | 550.00% | | | Markit iTraxx Europe Crossover Index, Series 38, Version 1 | | | 5.00% | | | | Quarterly | | | | 11/16/2022 | | | | 5.558% | | | | EUR | | | 126,000,000 | | $ | (1,021,775 | ) |
| |
| (a) | Over-The-Counter options purchased, options written and swap agreements are collateralized by cash held with Counterparties in the amount of $73,299,000. |
| (b) | Implied credit spreads represent the current level, as of October 31, 2022, at which protection could be bought or sold given the terms of the existing credit default swap agreement and serve as an indicator of the current status of the payment/performance risk of the credit default swap agreement. An implied credit spread that has widened or increased since entry into the initial agreement may indicate a deteriorating credit profile and increased risk of default for the reference entity. A declining or narrowing spread may indicate an improving credit profile or decreased risk of default for the reference entity. Alternatively, credit spreads may increase or decrease reflecting the general tolerance for risk in the credit markets generally. |
See accompanying Notes to Consolidated Financial Statements which are an integral part of the financial statements.
| | |
| 24 | | Invesco Global Strategic Income Fund |
Open Over-The-Counter Foreign Currency Options Written(a)
| | | | | | | | | | | | | | | | | | | | | | | | |
|
| |
| Description | | Type of
Contract | | Counterparty | | Expiration Date | | | Exercise Price | | | Notional Value | | | Value | |
|
| |
Currency Risk | | | | | | | | | | | | | | | | | | | | | | | | |
|
| |
AUD versus USD | | Call | | Bank of America, N.A. | | | 09/27/2023 | | | USD | | | 0.75 | | | AUD | | | 46,666,667 | | | $ | (135,461 | ) |
|
| |
EUR versus CHF | | Call | | Goldman Sachs International | | | 12/16/2022 | | | CHF | | | 0.99 | | | EUR | | | 26,250,000 | | | | (204,497 | ) |
|
| |
EUR versus HUF | | Call | | Bank of America, N.A. | | | 01/31/2023 | | | HUF | | | 460.00 | | | EUR | | | 28,000,000 | | | | (298,293 | ) |
|
| |
EUR versus SEK | | Call | | Morgan Stanley and Co. International PLC | | | 02/17/2023 | | | SEK | | | 11.35 | | | EUR | | | 17,500,000 | | | | (116,028 | ) |
|
| |
GBP versus USD | | Call | | Goldman Sachs International | | | 01/09/2023 | | | USD | | | 1.18 | | | GBP | | | 3,500,000 | | | | (1,517,886 | ) |
|
| |
USD versus BRL | | Call | | Goldman Sachs International | | | 02/01/2023 | | | BRL | | | 5.85 | | | USD | | | 3,500,000 | | | | (457,195 | ) |
|
| |
USD versus BRL | | Call | | J.P. Morgan Chase Bank, N.A. | | | 03/16/2023 | | | BRL | | | 6.05 | | | USD | | | 17,500,000 | | | | (224,123 | ) |
|
| |
USD versus HUF | | Call | | Goldman Sachs International | | | 12/02/2022 | | | HUF | | | 431.00 | | | USD | | | 52,500,000 | | | | (794,955 | ) |
|
| |
USD versus HUF | | Call | | J.P. Morgan Chase Bank, N.A. | | | 12/13/2022 | | | HUF | | | 433.60 | | | USD | | | 35,000,000 | | | | (630,140 | ) |
|
| |
USD versus MXN | | Call | | Goldman Sachs International | | | 09/01/2023 | | | MXN | | | 24.14 | | | USD | | | 77,000,000 | | | | (1,040,347 | ) |
|
| |
USD versus MXN | | Call | | Goldman Sachs International | | | 09/11/2023 | | | MXN | | | 23.54 | | | USD | | | 42,000,000 | | | | (724,374 | ) |
|
| |
USD versus SEK | | Call | | Goldman Sachs International | | | 09/27/2023 | | | SEK | | | 12.35 | | | USD | | | 42,000,000 | | | | (871,374 | ) |
|
| |
USD versus THB | | Call | | J.P. Morgan Chase Bank, N.A. | | | 12/13/2022 | | | THB | | | 37.60 | | | USD | | | 35,000,000 | | | | (654,570 | ) |
|
| |
Subtotal – Foreign Currency Call Options Written | | | | | | | | | | | | | (7,669,243 | ) |
|
| |
Currency Risk | | | | | | | | | | | | | | | | | | | | | | | | |
|
| |
AUD versus USD | | Put | | Bank of America, N.A. | | | 09/27/2023 | | | USD | | | 0.60 | | | AUD | | | 58,577,406 | | | | (622,623 | ) |
|
| |
EUR versus SEK | | Put | | Morgan Stanley and Co. International PLC | | | 02/17/2023 | | | SEK | | | 10.45 | | | EUR | | | 17,500,000 | | | | (54,840 | ) |
|
| |
USD versus THB | | Put | | J.P. Morgan Chase Bank, N.A. | | | 12/13/2022 | | | THB | | | 34.75 | | | USD | | | 35,000,000 | | | | (6,615 | ) |
|
| |
USD versus ZAR | | Put | | Bank of America, N.A. | | | 01/25/2023 | | | ZAR | | | 17.15 | | | USD | | | 35,000,000 | | | | (204,400 | ) |
|
| |
Subtotal – Foreign Currency Put Options Written | | | | | | | | | | (888,478 | ) |
|
| |
Total – Foreign Currency Options Written | | | | | | | | | $ | (8,557,721 | ) |
|
| |
| (a) | Over-The-Counter options purchased, options written and swap agreements are collateralized by cash held with Counterparties in the amount of $73,299,000. |
| | | | | | | | | | | | | | | | | | | | | | | | | | |
| Open Over-The-Counter Interest Rate Swaptions Written(a) | |
|
| |
| | | | | | | | | | | Pay/ | | | | | | | | | | | |
| | | | | | | | | | | Receive | | | | | | | | | | | |
| | | Type of | | | | Exercise | | Floating | | Exercise | | Payment | | Expiration | | | Notional | | | | |
| Description | | Contract | | Counterparty | | Rate | | Rate Index | | Rate | | Frequency | | Date | | | Value | | | Value | |
|
| |
Interest Rate Risk | | | | | | | | | | | | | | | | | | | | |
|
| |
30 Year Interest Rate Swap | | Call | | Bank of America, N.A. | | 3.15% | | SOFR | | Receive | | Annually | | | 12/21/2022 | | | USD | | | 70,000,000 | | | $ | (813,458 | ) |
|
| |
10 Year Interest Rate Swap | | Call | | Bank of America, N.A. | | 3.50 | | SOFR | | Receive | | Annually | | | 01/26/2023 | | | USD | | | 105,000,000 | | | | (1,203,029 | ) |
|
| |
30 Year Interest Rate Swap | | Call | | Barclays Bank PLC | | 2.50 | | SONIA | | Receive | | Annually | | | 11/07/2022 | | | GBP | | | 17,500,000 | | | | (2,480 | ) |
|
| |
10 Year Interest Rate Swap | | Call | | Goldman Sachs International | | 3.13 | | SOFR | | Receive | | Annually | | | 03/27/2023 | | | USD | | | 210,000,000 | | | | (1,947,427 | ) |
|
| |
30 Year Interest Rate Swap | | Call | | Goldman Sachs International | | 1.90 | | 6 Month EURIBOR | | Receive | | Semi-Annually | | | 11/07/2022 | | | EUR | | | 35,000,000 | | | | (931 | ) |
|
| |
10 Year Interest Rate Swap | | Call | | Goldman Sachs International | | 3.25 | | SOFR | | Receive | | Annually | | | 12/06/2022 | | | USD | | | 70,000,000 | | | | (156,790 | ) |
|
| |
10 Year Interest Rate Swap | | Call | | Goldman Sachs International | | 2.75 | | SOFR | | Receive | | Annually | | | 03/27/2024 | | | USD | | | 78,750,000 | | | | (1,429,837 | ) |
|
| |
5 Year Interest Rate Swap | | Call | | Goldman Sachs International | | 3.72 | | SOFR | | Receive | | Annually | | | 12/28/2022 | | | USD | | | 105,000,000 | | | | (601,631 | ) |
|
| |
2 Year Interest Rate Swap | | Call | | J.P. Morgan Chase Bank, N.A. | | 2.75 | | SOFR | | Receive | | Annually | | | 09/16/2024 | | | USD | | | 262,500,000 | | | | (1,850,352 | ) |
|
| |
30 Year Interest Rate Swap | | Call | | J.P. Morgan Chase Bank, N.A. | | 1.95 | | 6 Month EURIBOR | | Receive | | Semi-Annually | | | 09/28/2023 | | | EUR | | | 35,000,000 | | | | (2,063,380 | ) |
|
| |
10 Year Interest Rate Swap | | Call | | Morgan Stanley and Co.
International PLC | | 2.84 | | SOFR | | Receive | | Annually | | | 06/07/2023 | | | USD | | | 247,800,000 | | | | (2,185,772 | ) |
|
| |
See accompanying Notes to Consolidated Financial Statements which are an integral part of the financial statements.
| | |
| 25 | | Invesco Global Strategic Income Fund |
| | | | | | | | | | | | | | | | | | | | | | | | | | |
| Open Over-The-Counter Interest Rate Swaptions Written(a)–(continued) | |
|
| |
| | | | | | | | | | | Pay/ | | | | | | | | | | | |
| | | | | | | | | | | Receive | | | | | | | | | | | |
| | | Type of | | | | Exercise | | Floating | | Exercise | | Payment | | Expiration | | | Notional | | | | |
| Description | | Contract | | Counterparty | | Rate | | Rate Index | | Rate | | Frequency | | Date | | | Value | | | Value | |
|
| |
10 Year Interest Rate Swap | | Call | | Morgan Stanley and Co. International PLC | | 2.84% | | SOFR | | Receive | | Annually | | | 12/07/2022 | | | USD | | | 203,000,000 | | | $ | (86,657 | ) |
|
| |
30 Year Interest Rate Swap | | Call | | Morgan Stanley and Co. International PLC | | 3.00 | | SOFR | | Receive | | Annually | | | 12/19/2022 | | | USD | | | 105,000,000 | | | | (716,942 | ) |
|
| |
Subtotal–Interest Rate Call Swaptions Written | | | | | | | | | | | | | | | (13,058,686 | ) |
|
| |
Interest Rate Risk | | | | | | | | | | | | | | | | | | | | | | | | | | |
|
| |
5 Year Interest Rate Swap | | Put | | Bank of America, N.A. | | 3.91 | | SOFR | | Pay | | Annually | | | 12/05/2022 | | | USD | | | 122,500,000 | | | | (1,429,684 | ) |
|
| |
2 Year Interest Rate Swap | | Put | | Bank of America, N.A. | | 3.75 | | 3 Month CDOR | | Pay | | Quarterly | | | 12/07/2022 | | | CAD | | | 175,000,000 | | | | (1,562,282 | ) |
|
| |
30 Year Interest Rate Swap | | Put | | Bank of America, N.A. | | 3.20 | | SOFR | | Pay | | Annually | | | 12/05/2022 | | | USD | | | 52,500,000 | | | | (2,929,922 | ) |
|
| |
30 Year Interest Rate Swap | | Put | | Barclays Bank PLC | | 4.00 | | SONIA | | Pay | | Annually | | | 12/06/2022 | | | GBP | | | 17,500,000 | | | | (258,568 | ) |
|
| |
2 Year Interest Rate Swap | | Put | | Goldman Sachs International | | 8.25 | | 6 Month WIBOR | | Pay | | Semi-Annually | | | 12/12/2022 | | | PLN | | | 175,000,000 | | | | (197,326 | ) |
|
| |
10 Year Interest Rate Swap | | Put | | Goldman Sachs International | | 3.67 | | SOFR | | Pay | | Annually | | | 12/13/2022 | | | USD | | | 210,000,000 | | | | (5,025,649 | ) |
|
| |
10 Year Interest Rate Swap | | Put | | Goldman Sachs International | | 3.25 | | 6 Month EURIBOR | | Pay | | Semi-Annually | | | 06/16/2023 | | | EUR | | | 188,160,000 | | | | (6,410,010 | ) |
|
| |
30 Year Interest Rate Swap | | Put | | Goldman Sachs International | | 3.01 | | SOFR | | Pay | | Annually | | | 11/07/2022 | | | USD | | | 70,000,000 | | | | (5,657,151 | ) |
|
| |
10 Year Interest Rate Swap | | Put | | Goldman Sachs International | | 2.75 | | 6 Month EURIBOR | | Pay | | Semi-Annually | | | 04/22/2024 | | | EUR | | | 105,000,000 | | | | (7,463,266 | ) |
|
| |
30 Year Interest Rate Swap | | Put | | J.P. Morgan Chase Bank,
N.A. | | 2.95 | | 6 Month EURIBOR | | Pay | | Semi-Annually | | | 09/28/2023 | | | EUR | | | 35,000,000 | | | | (2,103,407 | ) |
|
| |
2 Year Interest Rate Swap | | Put | | J.P. Morgan Chase Bank,
N.A. | | 3.88 | | SONIA | | Pay | | Annually | | | 11/28/2022 | | | GBP | | | 87,500,000 | | | | (1,486,120 | ) |
|
| |
10 Year Interest Rate Swap | | Put | | J.P. Morgan Chase Bank,
N.A. | | 1.05 | | TONAR | | Pay | | Annually | | | 05/26/2025 | | | JPY | | | 15,000,000,000 | | | | (2,536,814 | ) |
|
| |
10 Year Interest Rate Swap | | Put | | J.P. Morgan Chase Bank,
N.A. | | 2.39 | | 6 Month EURIBOR | | Pay | | Semi-Annually | | | 06/12/2023 | | | EUR | | | 56,700,000 | | | | (4,271,205 | ) |
|
| |
10 Year Interest Rate Swap | | Put | | J.P. Morgan Chase Bank,
N.A. | | 2.16 | | 6 Month EURIBOR | | Pay | | Semi-Annually | | | 04/21/2023 | | | EUR | | | 42,000,000 | | | | (3,684,238 | ) |
|
| |
1 Year Interest Rate Swap | | Put | | J.P. Morgan Chase Bank,
N.A. | | 2.82 | | SOFR | | Pay | | Annually | | | 02/17/2023 | | | USD | | | 525,000,000 | | | | (10,384,972 | ) |
|
| |
2 Year Interest Rate Swap | | Put | | Morgan Stanley and Co.
International PLC | | 4.02 | | SONIA | | Pay | | Annually | | | 11/30/2022 | | | GBP | | | 87,500,000 | | | | (1,269,055 | ) |
|
| |
10 Year Interest Rate Swap | | Put | | Morgan Stanley and Co.
International PLC | | 3.75 | | SOFR | | Pay | | Annually | | | 04/22/2024 | | | USD | | | 525,000,000 | | | | (23,196,987 | ) |
|
| |
Subtotal–Interest Rate Put Swaptions Written | | | | | | | | | | | | | | | (79,866,656 | ) |
|
| |
Total Open Over-The-Counter Interest Rate Swaptions Written | | | | | | | | | | | | | | $ | (92,925,342 | ) |
|
| |
| (a) | Over-The-Counter options purchased, options written and swap agreements are collateralized by cash held with Counterparties in the amount of $73,299,000. |
| | | | | | | | | | | | | | | | | | | | |
| Open Futures Contracts(a) | |
|
| |
| | | | | | | | | | | | | | | Unrealized | |
| | | Number of | | | Expiration | | | Notional | | | | | | Appreciation | |
| Long Futures Contracts | | Contracts | | | Month | | | Value | | | Value | | | (Depreciation) | |
|
| |
Interest Rate Risk | | | | | | | | | | | | | | | | | | | | |
|
| |
U.S. Treasury 2 Year Notes | | | 267 | | | | December-2022 | | | $ | 54,570,211 | | | $ | (1,144,936 | ) | | $ | (1,144,936 | ) |
|
| |
U.S. Treasury 10 Year Notes | | | 821 | | | | December-2022 | | | | 90,797,469 | | | | (5,708,516 | ) | | | (5,708,516 | ) |
|
| |
U.S. Treasury 10 Year Ultra Notes | | | 337 | | | | December-2022 | | | | 39,086,734 | | | | (3,181,218 | ) | | | (3,181,218 | ) |
|
| |
Subtotal–Long Futures Contracts | | | | (10,034,670 | ) | | | (10,034,670 | ) |
|
| |
See accompanying Notes to Consolidated Financial Statements which are an integral part of the financial statements.
| | |
| 26 | | Invesco Global Strategic Income Fund |
| | | | | | | | | | | | | | | | | | | | |
| Open Futures Contracts(a)–(continued) | |
|
| |
| | | | | | | | | | | | | | | Unrealized | |
| | | Number of | | | Expiration | | | Notional | | | | | | Appreciation | |
| Short Futures Contracts | | Contracts | | | Month | | | Value | | | Value | | | (Depreciation) | |
|
| |
Interest Rate Risk | | | | | | | | | | | | | | | | | | | | |
|
| |
Euro-Bund | | | 100 | | | | December-2022 | | | $ | (13,681,329 | ) | | $ | 258,305 | | | $ | 258,305 | |
|
| |
Euro-BTP | | | 1,276 | | | | December-2022 | | | | (133,742,364 | ) | | | 393,739 | | | | 393,739 | |
|
| |
U.S. Treasury 5 Year Notes | | | 251 | | | | December-2022 | | | | (26,755,031 | ) | | | 944,906 | | | | 944,906 | |
|
| |
U.S. Treasury Long Bonds | | | 65 | | | | December-2022 | | | | (7,832,500 | ) | | | 1,072,500 | | | | 1,072,500 | |
|
| |
U.S. Treasury Ultra Bonds | | | 229 | | | | December-2022 | | | | (29,233,281 | ) | | | 4,252,421 | | | | 4,252,421 | |
|
| |
Subtotal—Short Futures Contracts | | | | 6,921,871 | | | | 6,921,871 | |
|
| |
Total Futures Contracts | | | $ | (3,112,799 | ) | | $ | (3,112,799 | ) |
|
| |
| (a) | Futures contracts collateralized by $9,171,793 cash held with Merrill Lynch International, the futures commission merchant. |
| | | | | | | | | | | | | | | | | | |
| Open Forward Foreign Currency Contracts | |
|
| |
| Settlement | | | | Contract to | | | Unrealized Appreciation | |
| Date | | Counterparty | | Deliver | | | Receive | | | (Depreciation) | |
|
| |
Currency Risk | | | | | | | | | | | | | | | | |
|
| |
| 11/03/2022 | | Bank of America, N.A. | | USD | | | 220,704,431 | | | BRL | | | 1,171,165,824 | | | $ | 6,024,022 | |
|
| |
| 12/21/2022 | | Bank of America, N.A. | | COP | | | 180,520,750,000 | | | USD | | | 40,421,126 | | | | 4,179,844 | |
|
| |
| 12/21/2022 | | Bank of America, N.A. | | EUR | | | 1,685,000 | | | USD | | | 1,678,242 | | | | 6,235 | |
|
| |
| 12/21/2022 | | Bank of America, N.A. | | GBP | | | 4,100,000 | | | USD | | | 4,751,344 | | | | 41,429 | |
|
| |
| 12/21/2022 | | Bank of America, N.A. | | NZD | | | 18,781,000 | | | USD | | | 11,379,898 | | | | 452,436 | |
|
| |
| 12/21/2022 | | Bank of America, N.A. | | USD | | | 8,405,600 | | | AUD | | | 13,300,000 | | | | 115,279 | |
|
| |
| 09/29/2023 | | Bank of America, N.A. | | AUD | | | 26,723,677 | | | USD | | | 17,500,000 | | | | 245,114 | |
|
| |
| 11/03/2022 | | Citibank, N.A. | | USD | | | 236,478,730 | | | BRL | | | 1,252,663,824 | | | | 6,027,092 | |
|
| |
| 12/02/2022 | | Citibank, N.A. | | USD | | | 62,070,752 | | | BRL | | | 331,560,234 | | | | 1,719,953 | |
|
| |
| 12/21/2022 | | Citibank, N.A. | | CAD | | | 994,509 | | | USD | | | 756,680 | | | | 26,265 | |
|
| |
| 12/21/2022 | | Citibank, N.A. | | CNY | | | 235,881,772 | | | USD | | | 33,896,416 | | | | 1,431,526 | |
|
| |
| 12/21/2022 | | Citibank, N.A. | | INR | | | 1,071,732,486 | | | USD | | | 13,023,374 | | | | 152,435 | |
|
| |
| 12/21/2022 | | Citibank, N.A. | | THB | | | 130,000,000 | | | USD | | | 3,475,657 | | | | 44,973 | |
|
| |
| 12/21/2022 | | Deutsche Bank AG | | GBP | | | 64,962,157 | | | USD | | | 75,072,094 | | | | 446,195 | |
|
| |
| 12/21/2022 | | Deutsche Bank AG | | INR | | | 743,170,000 | | | USD | | | 9,278,027 | | | | 352,950 | |
|
| |
| 12/21/2022 | | Deutsche Bank AG | | PLN | | | 103,155,000 | | | USD | | | 21,478,096 | | | | 51,908 | |
|
| |
| 12/21/2022 | | Deutsche Bank AG | | ZAR | | | 1,180,396,575 | | | USD | | | 67,208,963 | | | | 3,190,522 | |
|
| |
| 11/10/2022 | | Goldman Sachs International | | USD | | | 40,250,000 | | | MXN | | | 804,436,500 | | | | 300,282 | |
|
| |
| 11/14/2022 | | Goldman Sachs International | | ZAR | | | 238,757,750 | | | USD | | | 13,905,518 | | | | 919,559 | |
|
| |
| 11/21/2022 | | Goldman Sachs International | | CNY | | | 78,343,356 | | | USD | | | 10,920,000 | | | | 109,028 | |
|
| |
| 12/06/2022 | | Goldman Sachs International | | HUF | | | 3,211,267,500 | | | USD | | | 7,875,000 | | | | 198,906 | |
|
| |
| 12/15/2022 | | Goldman Sachs International | | ZAR | | | 148,514,275 | | | USD | | | 8,487,500 | | | | 429,269 | |
|
| |
| 12/21/2022 | | Goldman Sachs International | | INR | | | 800,000,000 | | | USD | | | 9,952,106 | | | | 344,530 | |
|
| |
| 12/21/2022 | | Goldman Sachs International | | USD | | | 3,124,319 | | | CLP | | | 3,127,600,000 | | | | 163,490 | |
|
| |
| 12/21/2022 | | Goldman Sachs International | | USD | | | 14,240,407 | | | COP | | | 71,378,615,000 | | | | 89,539 | |
|
| |
| 12/21/2022 | | Goldman Sachs International | | USD | | | 33,667,000 | | | MXN | | | 697,455,807 | | | | 1,234,388 | |
|
| |
| 12/29/2022 | | Goldman Sachs International | | CNY | | | 58,369,290 | | | USD | | | 8,260,000 | | | | 228,726 | |
|
| |
| 01/11/2023 | | Goldman Sachs International | | USD | | | 37,595,040 | | | GBP | | | 33,600,000 | | | | 1,034,924 | |
|
| |
| 02/27/2023 | | Goldman Sachs International | | USD | | | 4,791,708 | | | RUB | | | 374,472,000 | | | | 566,683 | |
|
| |
| 03/13/2023 | | Goldman Sachs International | | CAD | | | 23,387,438 | | | USD | | | 18,025,000 | | | | 820,866 | |
|
| |
| 11/16/2022 | | J.P. Morgan Chase Bank, N.A. | | ZAR | | | 36,834,000 | | | USD | | | 2,100,000 | | | | 96,930 | |
|
| |
| 12/15/2022 | | J.P. Morgan Chase Bank, N.A. | | HUF | | | 1,211,100,000 | | | USD | | | 3,000,000 | | | | 112,170 | |
|
| |
| 12/15/2022 | | J.P. Morgan Chase Bank, N.A. | | THB | | | 585,637,500 | | | USD | | | 16,100,000 | | | | 655,130 | |
|
| |
| 12/21/2022 | | J.P. Morgan Chase Bank, N.A. | | CLP | | | 12,995,000,000 | | | USD | | | 14,414,864 | | | | 754,204 | |
|
| |
| 12/21/2022 | | J.P. Morgan Chase Bank, N.A. | | USD | | | 16,834,000 | | | CAD | | | 23,121,972 | | | | 147,861 | |
|
| |
| 12/21/2022 | | J.P. Morgan Chase Bank, N.A. | | USD | | | 25,251,000 | | | PLN | | | 126,548,686 | | | | 1,034,260 | |
|
| |
See accompanying Notes to Consolidated Financial Statements which are an integral part of the financial statements.
| | |
| 27 | | Invesco Global Strategic Income Fund |
| | | | | | | | | | | | | | | | | | |
| Open Forward Foreign Currency Contracts–(continued) | |
|
| |
Settlement Date | | | | Contract to | | | Unrealized Appreciation (Depreciation) | |
| | Counterparty | | Deliver | | | Receive | |
|
| |
| 12/21/2022 | | J.P. Morgan Chase Bank, N.A. | | USD | | | 24,161,977 | | | ZAR | | | 446,580,000 | | | $ | 58,150 | |
|
| |
| 02/17/2023 | | J.P. Morgan Chase Bank, N.A. | | USD | | | 2,854,536 | | | RUB | | | 217,087,500 | | | | 279,552 | |
|
| |
| 02/22/2023 | | J.P. Morgan Chase Bank, N.A. | | USD | | | 3,046,501 | | | RUB | | | 232,295,700 | | | | 292,239 | |
|
| |
| 12/21/2022 | | Morgan Stanley and Co. International PLC | | COP | | | 25,214,115,000 | | | USD | | | 5,571,564 | | | | 509,588 | |
|
| |
| 12/21/2022 | | Morgan Stanley and Co. International PLC | | EUR | | | 142,930,783 | | | USD | | | 144,097,822 | | | | 2,269,161 | |
|
| |
| 12/21/2022 | | Morgan Stanley and Co. International PLC | | USD | | | 13,215,986 | | | EUR | | | 13,450,659 | | | | 130,957 | |
|
| |
| 12/21/2022 | | Morgan Stanley and Co. International PLC | | USD | | | 11,470,062 | | | MXN | | | 234,407,926 | | | | 259,946 | |
|
| |
| 12/21/2022 | | Morgan Stanley and Co. International PLC | | USD | | | 15,551,680 | | | NZD | | | 27,310,000 | | | | 338,262 | |
|
| |
| 12/21/2022 | | Royal Bank of Canada | | GBP | | | 3,980,000 | | | USD | | | 4,628,410 | | | | 56,347 | |
|
| |
| 12/21/2022 | | Royal Bank of Canada | | USD | | | 4,359,747 | | | GBP | | | 3,965,000 | | | | 195,084 | |
|
| |
Subtotal–Appreciation | | | | | | | | | | | | | | | 38,138,209 | |
|
| |
| | | | | |
Currency Risk | | | | | | | | | | | | | | | | |
|
| |
| 11/03/2022 | | Bank of America, N.A. | | BRL | | | 1,171,165,824 | | | USD | | | 217,266,674 | | | | (9,461,779 | ) |
|
| |
| 12/12/2022 | | Bank of America, N.A. | | USD | | | 22,600,000 | | | CAD | | | 29,481,926 | | | | (951,085 | ) |
|
| |
| 12/20/2022 | | Bank of America, N.A. | | USD | | | 12,279,400 | | | EUR | | | 12,250,000 | | | | (125,108 | ) |
|
| |
| 12/21/2022 | | Bank of America, N.A. | | USD | | | 36,697,375 | | | AUD | | | 54,289,206 | | | | (1,916,040 | ) |
|
| |
| 12/21/2022 | | Bank of America, N.A. | | USD | | | 1,129,982 | | | COP | | | 5,046,500,000 | | | | (116,849 | ) |
|
| |
| 12/21/2022 | | Bank of America, N.A. | | USD | | | 3,535,530 | | | EUR | | | 3,511,000 | | | | (51,603 | ) |
|
| |
| 12/21/2022 | | Bank of America, N.A. | | USD | | | 17,900,456 | | | NZD | | | 29,542,309 | | | | (711,677 | ) |
|
| |
| 01/27/2023 | | Bank of America, N.A. | | ZAR | | | 129,556,000 | | | USD | | | 7,000,000 | | | | (8,044 | ) |
|
| |
| 02/27/2023 | | Bank of America, N.A. | | RUB | | | 374,472,000 | | | USD | | | 4,200,000 | | | | (1,158,391 | ) |
|
| |
| 12/21/2022 | | BNP Paribas S.A. | | GBP | | | 7,895,682 | | | USD | | | 8,420,000 | | | | (650,240 | ) |
|
| |
| 11/03/2022 | | Citibank, N.A. | | BRL | | | 1,252,663,824 | | | USD | | | 237,709,681 | | | | (4,796,141 | ) |
|
| |
| 12/02/2022 | | Citibank, N.A. | | BRL | | | 850,700,000 | | | USD | | | 159,257,907 | | | | (4,412,969 | ) |
|
| |
| 12/21/2022 | | Citibank, N.A. | | COP | | | 70,438,530,000 | | | USD | | | 14,079,779 | | | | (61,436 | ) |
|
| |
| 12/21/2022 | | Citibank, N.A. | | USD | | | 25,251,000 | | | CNY | | | 178,963,937 | | | | (619,828 | ) |
|
| |
| 12/21/2022 | | Deutsche Bank AG | | GBP | | | 10,105,000 | | | USD | | | 11,244,251 | | | | (363,965 | ) |
|
| |
| 12/21/2022 | | Deutsche Bank AG | | USD | | | 4,264,042 | | | EUR | | | 4,250,000 | | | | (46,813 | ) |
|
| |
| 12/21/2022 | | Deutsche Bank AG | | USD | | | 9,020,833 | | | GBP | | | 7,806,000 | | | | (53,616 | ) |
|
| |
| 12/21/2022 | | Deutsche Bank AG | | USD | | | 16,285,798 | | | PLN | | | 78,217,430 | | | | (39,359 | ) |
|
| |
| 12/21/2022 | | Deutsche Bank AG | | USD | | | 24,894,443 | | | ZAR | | | 437,201,188 | | | | (1,182,972 | ) |
|
| |
| 11/14/2022 | | Goldman Sachs International | | USD | | | 27,730,518 | | | ZAR | | | 477,515,500 | | | | (1,758,599 | ) |
|
| |
| 12/21/2022 | | Goldman Sachs International | | MXN | | | 813,839,295 | | | USD | | | 40,400,000 | | | | (325,335 | ) |
|
| |
| 12/21/2022 | | Goldman Sachs International | | USD | | | 8,750,000 | | | HUF | | | 3,514,266,875 | | | | (384,093 | ) |
|
| |
| 06/29/2023 | | Goldman Sachs International | | PLN | | | 26,607,497 | | | USD | | | 5,165,000 | | | | (203,141 | ) |
|
| |
| 07/26/2023 | | Goldman Sachs International | | ZAR | | | 98,542,500 | | | USD | | | 5,250,000 | | | | (20,957 | ) |
|
| |
| 09/29/2023 | | Goldman Sachs International | | SEK | | | 115,583,565 | | | USD | | | 10,470,000 | | | | (209,082 | ) |
|
| |
| 10/16/2023 | | Goldman Sachs International | | AUD | | | 3,675,000 | | | USD | | | 2,326,275 | | | | (47,238 | ) |
|
| |
| 10/16/2023 | | Goldman Sachs International | | NZD | | | 8,166,667 | | | USD | | | 4,569,250 | | | | (190,891 | ) |
|
| |
| 11/28/2022 | | J.P. Morgan Chase Bank, N.A. | | EUR | | | 6,480,000 | | | NOK | | | 64,155,175 | | | | (239,505 | ) |
|
| |
| 12/20/2022 | | J.P. Morgan Chase Bank, N.A. | | BRL | | | 50,085,000 | | | USD | | | 9,275,000 | | | | (324,412 | ) |
|
| |
| 12/21/2022 | | J.P. Morgan Chase Bank, N.A. | | HUF | | | 16,415,462,260 | | | USD | | | 37,459,500 | | | | (1,618,418 | ) |
|
| |
| 12/21/2022 | | J.P. Morgan Chase Bank, N.A. | | USD | | | 4,697,084 | | | CLP | | | 4,234,421,350 | | | | (245,757 | ) |
|
| |
| 12/21/2022 | | J.P. Morgan Chase Bank, N.A. | | USD | | | 8,622,485 | | | HUF | | | 3,509,782,500 | | | | (267,253 | ) |
|
| |
| 12/21/2022 | | J.P. Morgan Chase Bank, N.A. | | USD | | | 13,330,338 | | | INR | | | 1,071,732,486 | | | | (459,399 | ) |
|
| |
| 12/21/2022 | | J.P. Morgan Chase Bank, N.A. | | USD | | | 31,966,883 | | | JPY | | | 4,546,869,097 | | | | (1,197,444 | ) |
|
| |
| 12/21/2022 | | J.P. Morgan Chase Bank, N.A. | | USD | | | 4,585,921 | | | KRW | | | 6,315,226,500 | | | | (157,334 | ) |
|
| |
| 12/21/2022 | | J.P. Morgan Chase Bank, N.A. | | USD | | | 13,889,145 | | | NOK | | | 138,893,859 | | | | (506,172 | ) |
|
| |
| 12/21/2022 | | J.P. Morgan Chase Bank, N.A. | | USD | | | 8,417,000 | | | ZAR | | | 150,521,219 | | | | (253,528 | ) |
|
| |
| 02/17/2023 | | J.P. Morgan Chase Bank, N.A. | | RUB | | | 217,087,500 | | | USD | | | 2,625,000 | | | | (509,089 | ) |
|
| |
See accompanying Notes to Consolidated Financial Statements which are an integral part of the financial statements.
| | |
| 28 | | Invesco Global Strategic Income Fund |
| | | | | | | | | | | | | | | | | | |
| Open Forward Foreign Currency Contracts–(continued) | |
|
| |
Settlement Date | | | | Contract to | | | Unrealized Appreciation (Depreciation) | |
| | Counterparty | | Deliver | | | Receive | |
|
| |
02/22/2023 | | J.P. Morgan Chase Bank, N.A. | | RUB | | | 232,295,700 | | | USD | | | 2,730,000 | | | $ | (608,740 | ) |
|
| |
03/20/2023 | | J.P. Morgan Chase Bank, N.A. | | BRL | | | 21,175,000 | | | USD | | | 3,850,000 | | | | (139,226 | ) |
|
| |
12/21/2022 | | Morgan Stanley and Co. International PLC | | CLP | | | 7,565,980,000 | | | USD | | | 7,656,325 | | | | (297,218 | ) |
|
| |
12/21/2022 | | Morgan Stanley and Co. International PLC | | MXN | | | 854,857,000 | | | USD | | | 41,829,912 | | | | (947,990 | ) |
|
| |
12/21/2022 | | Morgan Stanley and Co. International PLC | | USD | | | 13,191,889 | | | CZK | | | 327,567,800 | | | | (8,134 | ) |
|
| |
12/21/2022 | | Morgan Stanley and Co. International PLC | | USD | | | 93,024,929 | | | EUR | | | 92,269,179 | | | | (1,467,226 | ) |
|
| |
12/21/2022 | | Morgan Stanley and Co. International PLC | | USD | | | 16,317,000 | | | JPY | | | 2,376,924,313 | | | | (231,948 | ) |
|
| |
12/21/2022 | | Morgan Stanley and Co. International PLC | | USD | | | 10,938,875 | | | SEK | | | 116,321,083 | | | | (359,935 | ) |
|
| |
12/21/2022 | | Morgan Stanley and Co. International PLC | | USD | | | 45,060,865 | | | THB | | | 1,633,005,750 | | | | (1,966,047 | ) |
|
| |
12/21/2022 | | Royal Bank of Canada | | CAD | | | 30,320,000 | | | USD | | | 22,105,837 | | | | (162,593 | ) |
|
| |
12/21/2022 | | Royal Bank of Canada | | GBP | | | 883,000 | | | USD | | | 970,910 | | | | (43,445 | ) |
|
| |
12/21/2022 | | Standard Chartered Bank PLC | | GBP | | | 8,500,000 | | | USD | | | 9,073,082 | | | | (691,374 | ) |
|
| |
Subtotal–Depreciation | | | | | | | | | | (42,569,438 | ) |
|
| |
Total Forward Foreign Currency Contracts | | | | | | $ | (4,431,229 | ) |
|
| |
| | | | | | | | | | | | | | | | | | | | | | | | | | | | | | | | | | |
| Open Centrally Cleared Credit Default Swap Agreements(a) | |
|
| |
| | | | | (Pay)/ | | | | | | | | | | | | | | | | | | | | | | | |
| | | | | Receive | | | | | | | | Implied | | | | | | | | Upfront | | | | | | Unrealized | |
| | | Buy/Sell | | Fixed | | | Payment | | | | | Credit | | | | | | | | Payments Paid | | | | | | Appreciation | |
| Reference Entity | | Protection | | Rate | | | Frequency | | Maturity Date | | | Spread(b) | | | Notional Value | | | (Received) | | | Value | | | (Depreciation) | |
|
| |
Credit Risk | | | | | | | | | | | | | | | | | | | | | | | | | | | | | | | | | | |
|
| |
Markit iTraxx Europe Index, Series 37, Version 1 | | Buy | | | (1.00)% | | | Quarterly | | | 06/20/2027 | | | | 1.081% | | | EUR | | | 7,525,000 | | | | $ (77,432 | ) | | $ | 25,404 | | | | $ 102,836 | |
|
| |
Markit iTraxx Europe Sub Financials, Series 37, Version 1 | | Buy | | | (1.00) | | | Quarterly | | | 06/20/2027 | | | | 2.065 | | | EUR | | | 7,437,500 | | | | 236,016 | | | | 325,842 | | | | 89,826 | |
|
| |
Intercontinental Exchange, Inc. | | Buy | | | (1.00) | | | Quarterly | | | 12/20/2027 | | | | 2.959 | | | USD | | | 12,250,000 | | | | 998,589 | | | | 1,014,727 | | | | 16,138 | |
|
| |
Subtotal - Appreciation | | | | | | | | | | | | | | | | | 1,157,173 | | | | 1,365,973 | | | | 208,800 | |
|
| |
Credit Risk | | | | | | | | | | | | | | | | | | | | | | | | | | | | | | | | | | |
|
| |
South Africa Republic International Bonds | | Buy | | | (1.00) | | | Quarterly | | | 06/20/2027 | | | | 2.848 | | | USD | | | 3,500,000 | | | | 259,896 | | | | 255,456 | | | | (4,440) | |
|
| |
Societe Generale | | Sell | | | 1.00 | | | Quarterly | | | 06/20/2027 | | | | 1.300 | | | EUR | | | 10,500,000 | | | | 10,451 | | | | (132,040 | ) | | | (142,491) | |
|
| |
Subtotal - Depreciation | | | | | | | 270,347 | | | | 123,416 | | | | (146,931) | |
|
| |
Total Centrally Cleared Credit Default Swap Agreements | | | | | | | | | | $1,427,520 | | | $ | 1,489,389 | | | | $ 61,869 | |
|
| |
| (a) | Centrally cleared swap agreements collateralized by $40,567,587 cash held with Counterparties. |
| (b) | Implied credit spreads represent the current level, as of October 31, 2022, at which protection could be bought or sold given the terms of the existing credit default swap agreement and serve as an indicator of the current status of the payment/performance risk of the credit default swap agreement. An implied credit spread that has widened or increased since entry into the initial agreement may indicate a deteriorating credit profile and increased risk of default for the reference entity. A declining or narrowing spread may indicate an improving credit profile or decreased risk of default for the reference entity. Alternatively, credit spreads may increase or decrease reflecting the general tolerance for risk in the credit markets generally. |
See accompanying Notes to Consolidated Financial Statements which are an integral part of the financial statements.
| | |
| 29 | | Invesco Global Strategic Income Fund |
| | | | | | | | | | | | | | | | | | | | | | | | | | | | | | | | |
| Open Centrally Cleared Interest Rate Swap Agreements(a) | |
|
| |
| Pay/ | | | | | | (Pay)/ | | | | | | | | | | | | | Upfront | | | | | | |
| Receive | | | | | | Receive | | | | | | | | | | | | | Payments | | | | | | Unrealized |
| Floating | | Floating Rate | | Payment | | Fixed | | | Payment | | Maturity | | | | | | | | Paid | | | | | | Appreciation |
| Rate | | Index | | Frequency | | Rate | | | Frequency | | Date | | | Notional Value | | | (Received) | | | Value | | | (Depreciation) |
|
| |
Interest Rate Risk | | | | | | | | | | | | | | | | | | | | | | | | | |
|
| |
Receive | | 28 Day MXN TIIE | | 28 Day | | | (10.04 | )% | | 28 Day | | | 12/18/2024 | | | MXN | | | 385,000,000 | | | $ | – | | | $ | 8,721 | | | $ | 8,721 | |
|
| |
Receive | | 6 Month THBFIX | | Semi-Annually | | | (1.97 | ) | | Semi-Annually | | | 05/13/2024 | | | THB | | | 612,500,000 | | | | – | | | | 26,163 | | | | 26,163 | |
|
| |
Pay | | TONAR | | Annually | | | 0.24 | | | Annually | | | 09/29/2027 | | | JPY | | | 4,077,500,000 | | | | (33,768 | ) | | | (5,079 | ) | | | 28,689 | |
|
| |
Receive | | TTHORON | | Quarterly | | | (2.59 | ) | | Quarterly | | | 06/13/2027 | | | THB | | | 248,500,000 | | | | – | | | | 29,240 | | | | 29,240 | |
|
| |
Receive | | 6 Month THBFIX | | Semi-Annually | | | (1.95 | ) | | Semi-Annually | | | 05/13/2024 | | | THB | | | 595,000,000 | | | | – | | | | 30,118 | | | | 30,118 | |
|
| |
Receive | | COOVIBR | | Quarterly | | | (11.50 | ) | | Quarterly | | | 11/02/2024 | | | COP | | | 96,250,000,000 | | | | – | | | | 41,798 | | | | 41,798 | |
|
| |
Receive | | COOVIBR | | Quarterly | | | (11.46 | ) | | Quarterly | | | 11/01/2024 | | | COP | | | 96,250,000,000 | | | | – | | | | 57,044 | | | | 57,044 | |
|
| |
Receive | | 6 Month THBFIX | | Semi-Annually | | | (1.71 | ) | | Semi-Annually | | | 04/18/2025 | | | THB | | | 401,000,000 | | | | – | | | | 61,772 | | | | 61,772 | |
|
| |
Pay | | TONAR | | Annually | | | 0.30 | | | Annually | | | 09/29/2027 | | | JPY | | | 4,077,500,000 | | | | (9,690 | ) | | | 75,363 | | | | 85,053 | |
|
| |
Receive | | 6 Month THBFIX | | Semi-Annually | | | (1.66 | ) | | Semi-Annually | | | 05/26/2024 | | | THB | | | 595,000,000 | | | | – | | | | 98,331 | | | | 98,331 | |
|
| |
Receive | | BZDIOVRA | | At Maturity | | | (12.84 | ) | | At Maturity | | | 01/02/2024 | | | BRL | | | 487,066,027 | | | | – | | | | 116,770 | | | | 116,770 | |
|
| |
Receive | | COOVIBR | | Quarterly | | | (9.85 | ) | | Quarterly | | | 07/21/2032 | | | COP | | | 12,010,000,000 | | | | – | | | | 151,284 | | | | 151,284 | |
|
| |
Receive | | 6 Month WIBOR | | Semi-Annually | | | (7.61 | ) | | Annually | | | 09/21/2024 | | | PLN | | | 88,200,000 | | | | – | | | | 167,198 | | | | 167,198 | |
|
| |
Receive | | SOFR | | Annually | | | (3.39 | ) | | Annually | | | 11/09/2052 | | | USD | | | 14,280,000 | | | | – | | | | 173,970 | | | | 173,970 | |
|
| |
Receive | | COOVIBR | | Quarterly | | | (9.71 | ) | | Quarterly | | | 07/21/2032 | | | COP | | | 12,332,000,000 | | | | – | | | | 176,335 | | | | 176,335 | |
|
| |
Pay | | BZDIOVRA | | At Maturity | | | 11.72 | | | At Maturity | | | 01/02/2026 | | | BRL | | | 174,013,173 | | | | – | | | | 211,605 | | | | 211,605 | |
|
| |
Receive | | COOVIBR | | Quarterly | | | (8.54 | ) | | Quarterly | | | 05/27/2032 | | | COP | | | 9,450,000,000 | | | | – | | | | 268,710 | | | | 268,710 | |
|
| |
Receive | | COOVIBR | | Quarterly | | | (9.86 | ) | | Quarterly | | | 09/09/2032 | | | COP | | | 25,200,000,000 | | | | – | | | | 312,392 | | | | 312,392 | |
|
| |
Receive | | 28 Day MXN TIIE | | 28 Day | | | (9.43 | ) | | 28 Day | | | 12/18/2024 | | | MXN | | | 595,000,000 | | | | – | | | | 336,975 | | | | 336,975 | |
|
| |
Receive | | SOFR | | Annually | | | (3.36 | ) | | Annually | | | 11/09/2052 | | | USD | | | 19,040,000 | | | | – | | | | 346,004 | | | | 346,004 | |
|
| |
Receive | | 3 Month ADBB | | Quarterly | | | (3.70 | ) | | Quarterly | | | 09/07/2025 | | | AUD | | | 72,800,000 | | | | – | | | | 359,556 | | | | 359,556 | |
|
| |
Receive | | 3 Month JIBAR | | Quarterly | | | (6.61 | ) | | Quarterly | | | 10/19/2026 | | | ZAR | | | 119,500,000 | | | | 535 | | | | 363,197 | | | | 362,662 | |
|
| |
Receive | | 28 Day MXN TIIE | | 28 Day | | | (9.36 | ) | | 28 Day | | | 12/18/2024 | | | MXN | | | 595,000,000 | | | | – | | | | 377,078 | | | | 377,078 | |
|
| |
Receive | | 3 Month JIBAR | | Quarterly | | | (6.65 | ) | | Quarterly | | | 10/11/2026 | | | ZAR | | | 124,250,000 | | | | – | | | | 380,581 | | | | 380,581 | |
|
| |
Pay | | SONIA | | Annually | | | 3.99 | | | Annually | | | 10/24/2052 | | | GBP | | | 3,150,000 | | | | – | | | | 471,302 | | | | 471,302 | |
|
| |
Pay | | SOFR | | Annually | | | 3.89 | | | Annually | | | 10/27/2032 | | | USD | | | 110,250,000 | | | | (5,037 | ) | | | 551,644 | | | | 556,681 | |
|
| |
Receive | | COOVIBR | | Quarterly | | | (9.01 | ) | | Quarterly | | | 05/24/2032 | | | COP | | | 25,400,000,000 | | | | – | | | | 573,538 | | | | 573,538 | |
|
| |
Receive | | 3 Month JIBAR | | Quarterly | | | (6.63 | ) | | Quarterly | | | 02/11/2031 | | | ZAR | | | 68,250,000 | | | | – | | | | 591,926 | | | | 591,926 | |
|
| |
Receive | | COOVIBR | | Quarterly | | | (8.88 | ) | | Quarterly | | | 05/09/2032 | | | COP | | | 27,000,000,000 | | | | – | | | | 651,086 | | | | 651,086 | |
|
| |
Receive | | COOVIBR | | Quarterly | | | (9.06 | ) | | Quarterly | | | 05/16/2032 | | | COP | | | 25,900,000,000 | | | | – | | | | 728,086 | | | | 728,086 | |
|
| |
Receive | | 3 Month JIBAR | | Quarterly | | | (7.98 | ) | | Quarterly | | | 03/07/2032 | | | ZAR | | | 160,000,000 | | | | – | | | | 832,464 | | | | 832,464 | |
|
| |
Pay | | BZDIOVRA | | At Maturity | | | 12.88 | | | At Maturity | | | 01/04/2027 | | | BRL | | | 72,657,132 | | | | – | | | | 846,380 | | | | 846,380 | |
|
| |
Receive | | 3 Month JIBAR | | Quarterly | | | (7.95 | ) | | Quarterly | | | 03/07/2032 | | | ZAR | | | 165,000,000 | | | | – | | | | 875,732 | | | | 875,732 | |
|
| |
Receive | | 28 Day MXN TIIE | | 28 Day | | | (8.35 | ) | | 28 Day | | | 03/06/2025 | | | MXN | | | 551,250,000 | | | | – | | | | 897,551 | | | | 897,551 | |
|
| |
Pay | | BZDIOVRA | | At Maturity | | | 12.90 | | | At Maturity | | | 01/04/2027 | | | BRL | | | 85,909,982 | | | | – | | | | 1,011,892 | | | | 1,011,892 | |
|
| |
Receive | | FBIL Overnight MIBOR | | Semi-Annually | | | (5.65 | ) | | Semi-Annually | | | 02/17/2027 | | | INR | | | 1,837,500,000 | | | | – | | | | 1,063,346 | | | | 1,063,346 | |
|
| |
Receive | | 3 Month JIBAR | | Quarterly | | | (6.70 | ) | | Quarterly | | | 01/29/2031 | | | ZAR | | | 145,000,000 | | | | – | | | | 1,218,873 | | | | 1,218,873 | |
|
| |
Receive | | 3 Month JIBAR | | Quarterly | | | (6.70 | ) | | Quarterly | | | 01/27/2031 | | | ZAR | | | 148,000,000 | | | | – | | | | 1,242,638 | | | | 1,242,638 | |
|
| |
Receive | | 3 Month JIBAR | | Quarterly | | | (7.32 | ) | | Quarterly | | | 07/15/2031 | | | ZAR | | | 206,100,000 | | | | – | | | | 1,420,236 | | | | 1,420,236 | |
|
| |
Receive | | SOFR | | Annually | | | (3.05 | ) | | Annually | | | 09/27/2052 | | | USD | | | 25,293,625 | | | | – | | | | 1,888,916 | | | | 1,888,916 | |
|
| |
Receive | | SOFR | | Annually | | | (2.66 | ) | | Annually | | | 11/09/2052 | | | USD | | | 14,175,000 | | | | – | | | | 2,045,720 | | | | 2,045,720 | |
|
| |
Receive | | CLICP | | Semi-Annually | | | (2.35 | ) | | Semi-Annually | | | 03/11/2026 | | | CLP | | | 22,500,000,000 | | | | – | | | | 3,579,514 | | | | 3,579,514 | |
|
| |
Subtotal – Appreciation | | | | | | | | | | (47,960 | ) | | | 24,655,970 | | | | 24,703,930 | |
|
| |
See accompanying Notes to Consolidated Financial Statements which are an integral part of the financial statements.
| | |
| 30 | | Invesco Global Strategic Income Fund |
| | | | | | | | | | | | | | | | | | | | | | | | | | | | | | | | |
| Open Centrally Cleared Interest Rate Swap Agreements(a)–(continued) | |
|
| |
| Pay/ | | | | | | (Pay)/ | | | | | | | | | | | | | Upfront | | | | | | |
| Receive | | | | | | Receive | | | | | | | | | | | | | Payments | | | | | | Unrealized |
| Floating | | Floating Rate | | Payment | | Fixed | | | Payment | | Maturity | | | | | | | | Paid | | | | | | Appreciation |
| Rate | | Index | | Frequency | | Rate | | | Frequency | | Date | | | Notional Value | | | (Received) | | | Value | | | (Depreciation) |
|
| |
Interest Rate Risk | | | | | | | | | | | | | | | | | | | | | | |
|
| |
Pay | | SOFR | | Annually | | | 2.84 | % | | Annually | | | 06/09/2033 | | | USD | | | 189,000,000 | | | $ | – | | | $ | (14,056,731 | ) | | $ | (14,056,731 | ) |
|
| |
Pay | | SOFR | | Annually | | | 2.41 | | | Annually | | | 06/02/2052 | | | USD | | | 47,810,000 | | | | – | | | | (9,068,711 | ) | | | (9,068,711 | ) |
|
| |
Pay | | 6 Month EURIBOR | | Semi-Annually | | | 2.43 | | | Annually | | | 09/05/2032 | | | EUR | | | 88,200,000 | | | | (19,518 | ) | | | (4,227,435 | ) | | | (4,207,917 | ) |
|
| |
Pay | | SONIA | | Annually | | | 2.24 | | | Annually | | | 10/11/2032 | | | GBP | | | 17,500,000 | | | | – | | | | (2,543,887 | ) | | | (2,543,887 | ) |
|
| |
Pay | | SOFR | | Annually | | | 3.38 | | | Annually | | | 09/08/2025 | | | USD | | | 49,350,000 | | | | – | | | | (1,265,326 | ) | | | (1,265,326 | ) |
|
| |
Receive | | SONIA | | Annually | | | (5.73 | ) | | Annually | | | 09/28/2024 | | | GBP | | | 35,000,000 | | | | 3,522 | | | | (829,632 | ) | | | (833,154 | ) |
|
| |
Receive | | SONIA | | Annually | | | (5.41 | ) | | Annually | | | 09/27/2024 | | | GBP | | | 35,000,000 | | | | 3,153 | | | | (600,100 | ) | | | (603,253 | ) |
|
| |
Receive | | SONIA | | Annually | | | (4.96 | ) | | Annually | | | 10/04/2024 | | | GBP | | | 70,000,000 | | | | – | | | | (552,357 | ) | | | (552,357 | ) |
|
| |
Receive | | SONIA | | Annually | | | (5.51 | ) | | Annually | | | 09/28/2024 | | | GBP | | | 18,900,000 | | | | 1,786 | | | | (364,238 | ) | | | (366,024 | ) |
|
| |
Pay | | SOFR | | Annually | | | 3.94 | | | Annually | | | 11/09/2027 | | | USD | | | 77,945,000 | | | | – | | | | (322,063 | ) | | | (322,063 | ) |
|
| |
Pay | | 28 Day MXN TIIE | | 28 Day | | | 8.68 | | | 28 Day | | | 12/08/2032 | | | MXN | | | 161,875,000 | | | | – | | | | (310,278 | ) | | | (310,278 | ) |
|
| |
Pay | | 28 Day MXN TIIE | | 28 Day | | | 8.79 | | | 28 Day | | | 12/08/2032 | | | MXN | | | 162,750,000 | | | | – | | | | (255,648 | ) | | | (255,648 | ) |
|
| |
Pay | | BZDIOVRA | | At Maturity | | | 8.68 | | | At Maturity | | | 01/04/2027 | | | BRL | | | 56,292,938 | | | | – | | | | (207,994 | ) | | | (207,994 | ) |
|
| |
Receive | | CLICP | | Semi-Annually | | | (7.41 | ) | | Semi-Annually | | | 07/22/2027 | | | CLP | | | 7,700,000,000 | | | | – | | | | (188,756 | ) | | | (188,756 | ) |
|
| |
Pay | | BZDIOVRA | | At Maturity | | | 11.30 | | | At Maturity | | | 01/02/2026 | | | BRL | | | 181,797,497 | | | | – | | | | (188,076 | ) | | | (188,076 | ) |
|
| |
Receive | | FBIL Overnight MIBOR | | Semi-Annually | | | (7.02 | ) | | Semi-Annually | | | 05/25/2027 | | | INR | | | 1,312,500,000 | | | | – | | | | (180,669 | ) | | | (180,669 | ) |
|
| |
Pay | | BZDIOVRA | | At Maturity | | | 11.27 | | | At Maturity | | | 01/02/2029 | | | BRL | | | 60,141,391 | | | | – | | | | (114,914 | ) | | | (114,914 | ) |
|
| |
Receive | | BZDIOVRA | | At Maturity | | | (13.08 | ) | | At Maturity | | | 01/02/2024 | | | BRL | | | 447,125,210 | | | | – | | | | (98,877 | ) | | | (98,877 | ) |
|
| |
Pay | | CLICP | | Annually | | | 10.90 | | | Annually | | | 07/22/2023 | | | CLP | | | 34,895,000,000 | | | | – | | | | (84,939 | ) | | | (84,939 | ) |
|
| |
Pay | | SOFR | | Annually | | | 4.00 | | | Annually | | | 11/09/2027 | | | USD | | | 58,458,750 | | | | – | | | | (75,418 | ) | | | (75,418 | ) |
|
| |
Pay | | BZDIOVRA | | At Maturity | | | 11.44 | | | At Maturity | | | 01/02/2026 | | | BRL | | | 180,224,550 | | | | – | | | | (74,349 | ) | | | (74,349 | ) |
|
| |
Receive | | BZDIOVRA | | At Maturity | | | (13.00 | ) | | At Maturity | | | 01/02/2024 | | | BRL | | | 469,538,378 | | | | – | | | | (30,222 | ) | | | (30,222 | ) |
|
| |
Pay | | 28 Day MXN TIIE | | 28 Day | | | 9.24 | | | 28 Day | | | 12/08/2032 | | | MXN | | | 106,750,000 | | | | – | | | | (9,771 | ) | | | (9,771 | ) |
|
| |
Receive | | 6 Month THBFIX | | Semi-Annually | | | (2.11 | ) | | Semi-Annually | | | 05/11/2024 | | | THB | | | 595,000,000 | | | | – | | | | (6,122 | ) | | | (6,122 | ) |
|
| |
Subtotal – Depreciation | | | | | | | | | | | | | | | | | | | (11,057 | ) | | | (35,656,513 | ) | | | (35,645,456 | ) |
|
| |
Total Centrally Cleared Interest Rate Swap Agreements | | | | | | | | | $ | (59,017 | ) | | $ | (11,000,543 | ) | | $ | (10,941,526 | ) |
|
| |
| (a) | Centrally cleared swap agreements collateralized by $40,567,587 cash held with Counterparties. |
| | | | | | | | | | | | | | | | | | | | | | | | | | | | | | | | | | | | |
| Open Over-The-Counter Credit Default Swap Agreements(a) | |
|
| |
| | | | | | | (Pay)/ | | | | | | | | Implied | | | | | | Upfront | | | | | | Unrealized | |
| | | | | Buy/Sell | | Receive | | | Payment | | Maturity | | | Credit | | | Notional | | | Payments Paid | | | | | | Appreciation | |
| Counterparty | | Reference Entity | | Protection | | Fixed Rate | | | Frequency | | Date | | | Spread(b) | | | Value | | | (Received) | | | Value | | | (Depreciation) | |
|
| |
Credit Risk | | | | | | | | | | | | | | | | | | | | | | | | | | | | | | | | | | | | |
|
| |
| Goldman Sachs International | | Royal Bank of Scotland Group PLC (The) | | Buy | | | (1.00)% | | | Quarterly | | | 12/20/2027 | | | | 2.153% | | | EUR | | | 3,500,000 | | | $ | 135,541 | | | $ | 183,519 | | | $ | 47,978 | |
|
| |
| J.P. Morgan Chase Bank, N.A. | | Markit iTraxx Europe Crossover Index, Series 28, Version 9 | | Sell | | | 5.00 | | | Quarterly | | | 12/20/2022 | | | | 0.100 | | | EUR | | | 10,000,000 | | | | 48,738 | | | | 66,892 | | | | 18,154 | |
|
| |
| J.P. Morgan Chase Bank, N.A. | | Markit iTraxx Europe Crossover Index, Series 28, Version 9 | | Sell | | | 5.00 | | | Quarterly | | | 12/20/2022 | | | | 0.100 | | | EUR | | | 35,000,000 | | | | 121,152 | | | | 234,121 | | | | 112,969 | |
|
| |
| J.P. Morgan Chase Bank, N.A. | | Royal Bank of Scotland Group PLC (The) | | Buy | | | (1.00) | | | Quarterly | | | 06/20/2027 | | | | 2.047 | | | EUR | | | 5,250,000 | | | | 169,550 | | | | 229,142 | | | | 59,592 | |
|
| |
| J.P. Morgan Chase Bank, N.A. | | Markit CDX Investment Grade Index, Series 37, Version 1 | | Sell | | | 1.00 | | | Quarterly | | | 12/20/2026 | | | | 3.605 | | | USD | | | 17,500,000 | | | | (1,967,611 | ) | | | (1,661,967 | ) | | | 305,644 | |
|
| |
Subtotal–Appreciation | | | | | | | | | | | | | | (1,492,630 | ) | | | (948,293 | ) | | | 544,337 | |
|
| |
See accompanying Notes to Consolidated Financial Statements which are an integral part of the financial statements.
| | |
| 31 | | Invesco Global Strategic Income Fund |
| | | | | | | | | | | | | | | | | | | | | | | | | | | | | | | | | | | | |
| Open Over-The-Counter Credit Default Swap Agreements(a)–(continued) | |
|
| |
| | | | | | | (Pay)/ | | | | | | | | Implied | | | | | | Upfront | | | | | | Unrealized | |
| | | | | Buy/Sell | | Receive | | | Payment | | Maturity | | | Credit | | | Notional | | | Payments Paid | | | | | | Appreciation | |
| Counterparty | | Reference Entity | | Protection | | Fixed Rate | | | Frequency | | Date | | | Spread(b) | | | Value | | | (Received) | | | Value | | | (Depreciation) | |
|
| |
Credit Risk | | | | | | | | | | | | | | | | | | | | | | | | | | | | | | | | |
|
| |
| Citibank, N.A. | | Assicurazioni Generali S.p.A. | | Buy | | | (1.00)% | | | Quarterly | | | 12/20/2024 | | | | 1.105% | | | EUR | | | 3,750,000 | | | $ | 20,426 | | | $ | 8,071 | | | $ | (12,355 | ) |
|
| |
| Citibank, N.A. | | Assicurazioni Generali S.p.A. | | Sell | | | 1.00 | | | Quarterly | | | 12/20/2024 | | | | 0.742 | | | EUR | | | 3,750,000 | | | | 31,444 | | | | 19,913 | | | | (11,531 | ) |
|
| |
| Goldman Sachs International | | Markit CDX North America High Yield Index, Series 35, Version 1 | | Sell | | | 5.00 | | | Quarterly | | | 12/20/2025 | | | | 2.019 | | | USD | | | 46,800,000 | | | | 5,342,411 | | | | 4,046,561 | | | | (1,295,850 | ) |
|
| |
| Goldman Sachs International | | Markit iTraxx Europe Crossover Index, Series 32, Version 5 | | Sell | | | 5.00 | | | Quarterly | | | 12/20/2024 | | | | 8.244 | | | EUR | | | 7,100,000 | | | | 390,267 | | | | (450,116 | ) | | | (840,383 | ) |
|
| |
| J.P. Morgan Chase Bank, N.A. | | Markit CDX North America High Yield Index, Series 35, Version 1 | | Sell | | | 5.00 | | | Quarterly | | | 12/20/2025 | | | | 2.019 | | | USD | | | 14,600,000 | | | | 1,568,751 | | | | 1,262,389 | | | | (306,362 | ) |
|
| |
| J.P. Morgan Chase Bank, N.A. | | Markit iTraxx Europe Crossover Index, Series 30, Version 8 | | Sell | | | 5.00 | | | Quarterly | | | 12/20/2023 | | | | 13.894 | | | EUR | | | 7,500,000 | | | | 32,798 | | | | (707,519 | ) | | | (740,317 | ) |
|
| |
| J.P. Morgan Chase Bank, N.A. | | Markit iTraxx Europe Crossover Index, Series 30, Version 8 | | Sell | | | 5.00 | | | Quarterly | | | 12/20/2023 | | | | 13.894 | | | EUR | | | 7,100,000 | | | | 97,437 | | | | (669,785 | ) | | | (767,222 | ) |
|
| |
| J.P. Morgan Chase Bank, N.A. | | Markit iTraxx Europe Crossover Index, Series 30, Version 8 | | Sell | | | 5.00 | | | Quarterly | | | 12/20/2023 | | | | 13.894 | | | EUR | | | 3,550,000 | | | | 36,613 | | | | (334,892 | ) | | | (371,505 | ) |
|
| |
Subtotal–Depreciation | | | | | | | | | | | | | | 7,520,147 | | | | 3,174,622 | | | | (4,345,525 | ) |
|
| |
Total Open Over-The-Counter Credit Default Swap Agreements | | | | | | | | | | | | | $ | 6,027,517 | | | $ | 2,226,329 | | | $ | (3,801,188 | ) |
|
| |
| (a) | Over-The-Counter options purchased, options written and swap agreements are collateralized by cash held with Counterparties in the amount of $73,299,000. |
| (b) | Implied credit spreads represent the current level, as of October 31, 2022, at which protection could be bought or sold given the terms of the existing credit default swap agreement and serve as an indicator of the current status of the payment/performance risk of the credit default swap agreement. An implied credit spread that has widened or increased since entry into the initial agreement may indicate a deteriorating credit profile and increased risk of default for the reference entity. A declining or narrowing spread may indicate an improving credit profile or decreased risk of default for the reference entity. Alternatively, credit spreads may increase or decrease reflecting the general tolerance for risk in the credit markets generally. |
| | | | | | | | | | | | | | | | | | | | | | | | | | | | | | |
| Open Over-The-Counter Interest Rate Swap Agreements(a) | |
|
| |
| | | Pay/ | | | | | | (Pay)/ | | | | | | | | | | Upfront | | | | | | | |
| | | Receive | | | | | | Received | | | | | | | | | | Payments | | | | | | | |
| | | Floating | | Floating Rate | | Payment | | Fixed | | Payment | | Maturity | | | Notional | | | Paid | | | | | | Unrealized | |
| Counterparty | | Rate | | Index | | Frequency | | Rate | | Frequency | | Date | | | Value | | | (Received) | | | Value | | | Appreciation | |
|
| |
Interest Rate Risk | | | | | | | | | | | | | | | | | | | | | | |
|
| |
Bank of America, N.A. | | Receive | | 3 Month MYR KLIBOR | | Quarterly | | (2.70)% | | Quarterly | | | 03/16/2024 | | | | MYR 71,400,000 | | | | $542 | | | $ | 212,202 | | | $ | 211,660 | |
|
| |
| (a) | Over-The-Counter options purchased, options written and swap agreements are collateralized by cash held with Counterparties in the amount of $73,299,000. |
See accompanying Notes to Consolidated Financial Statements which are an integral part of the financial statements.
| | |
| 32 | | Invesco Global Strategic Income Fund |
| | |
| Abbreviations: |
| |
| ADBB | | –Australian Dollar Bank Bill |
| AUD | | –Australian Dollar |
| BRL | | –Brazilian Real |
| BZDIOVRA | | –Brazil Ceptip DI Interbank Deposit Rate |
| CAD | | –Canadian Dollar |
| CDOR | | –Canadian Dealer Offered Rate |
| CHF | | –Swiss Franc |
| CLICP | | –Sinacofi Chile Interbank Rate Avg (CAMARA) |
| CLP | | –Chile Peso |
| CNY | | –Chinese Yuan Renminbi |
| COOVIBR | | –Colombia IBR Overnight Nominal Interbank Reference Rate |
| COP | | –Colombia Peso |
| CZK | | –Czech Koruna |
| EUR | | –Euro |
| EURIBOR | | –Euro Interbank Offered Rate |
| FBIL | | –Financial Benchmarks India Private Ltd. |
| GBP | | –British Pound Sterling |
| HUF | | –Hungarian Forint |
| INR | | –Indian Rupee |
| JIBAR | | –Johannesburg Interbank Average Rate |
| JPY | | –Japanese Yen |
| KLIBOR | | –Kuala Lumpur Interbank Offered Rate |
| KRW | | –South Korean Won |
| MIBOR | | –Mumbai Interbank Offered Rate |
| MXN | | –Mexican Peso |
| MYR | | –Malaysian Ringgit |
| NOK | | –Norwegian Krone |
| NZD | | –New Zealand Dollar |
| PLN | | –Polish Zloty |
| RUB | | –Russian Ruble |
| SEK | | –Swedish Krona |
| SGD | | –Singapore Dollar |
| SOFR | | –Secured Overnight Financing Rate |
| SONIA | | –Sterling Overnight Index Average |
| THB | | –Thai Baht |
| THBFIX | | –Thai Baht Interest Rate Fixing |
| TIIE | | –Interbank Equilibrium Interest Rate |
| TONAR | | –Tokyo Overnight Average Rate |
| TTHORON | | –Thai Overnight Repurchase Rate |
| USD | | –U.S. Dollar |
| WIBOR | | –Warsaw Interbank Offered Rate |
| ZAR | | –South African Rand |
See accompanying Notes to Consolidated Financial Statements which are an integral part of the financial statements.
| | |
| 33 | | Invesco Global Strategic Income Fund |
Consolidated Statement of Assets and Liabilities
October 31, 2022
| | | | |
Assets: | | | | |
| |
Investments in unaffiliated securities, at value
(Cost $1,690,669,700)* | | $ | 1,455,078,935 | |
|
| |
Investments in affiliated money market funds, at value (Cost $154,526,626) | | | 154,525,799 | |
|
| |
Other investments: | | | | |
Variation margin receivable – futures contracts | | | 3,958,352 | |
|
| |
Variation margin receivable–centrally cleared swap agreements | | | 234,020 | |
|
| |
Swaps receivable – OTC | | | 817,064 | |
|
| |
Unrealized appreciation on swap agreements – OTC | | | 755,997 | |
|
| |
Premiums paid on swap agreements – OTC | | | 6,028,059 | |
|
| |
Unrealized appreciation on forward foreign currency contracts outstanding | | | 38,138,209 | |
|
| |
Deposits with brokers: | | | | |
Cash collateral – exchange-traded futures contracts | | | 9,171,793 | |
|
| |
Cash collateral – centrally cleared swap agreements | | | 40,567,587 | |
|
| |
Cash collateral – OTC Derivatives | | | 73,299,000 | |
|
| |
Cash collateral – TBA commitments | | | 669,000 | |
|
| |
Cash | | | 35,308,809 | |
|
| |
Foreign currencies, at value (Cost $10,011,467) | | | 9,949,716 | |
|
| |
Receivable for: | | | | |
Investments sold | | | 16,547,074 | |
|
| |
Fund shares sold | | | 410,618 | |
|
| |
Dividends | | | 278,208 | |
|
| |
Interest | | | 22,877,447 | |
|
| |
Investment for trustee deferred compensation and retirement plans | | | 363,419 | |
|
| |
Other assets | | | 92,270 | |
|
| |
Total assets | | | 1,869,071,376 | |
|
| |
| |
Liabilities: | | | | |
Other investments: | | | | |
Options written, at value (premiums received $77,551,361) | | | 102,504,838 | |
|
| |
Unrealized depreciation on forward foreign currency contracts outstanding | | | 42,569,438 | |
|
| |
Swaps payable – OTC | | | 14,330 | |
|
| |
Unrealized depreciation on swap agreements–OTC | | | 4,345,525 | |
|
| |
Payable for: | | | | |
Investments purchased | | | 2,519,633 | |
|
| |
Dividends | | | 966,609 | |
|
| |
Fund shares reacquired | | | 1,200,854 | |
|
| |
Collateral upon return of securities loaned | | | 65,043,941 | |
|
| |
Accrued fees to affiliates | | | 891,802 | |
|
| |
Accrued trustees’ and officers’ fees and benefits | | | 2,036 | |
|
| |
Accrued other operating expenses | | | 415,841 | |
|
| |
Trustee deferred compensation and retirement plans | | | 363,419 | |
|
| |
Total liabilities | | | 220,838,266 | |
|
| |
Net assets applicable to shares outstanding | | $ | 1,648,233,110 | |
|
| |
| | | | |
Net assets consist of: | | | | |
Shares of beneficial interest | | $ | 2,835,150,382 | |
|
| |
Distributable earnings (loss) | | | (1,186,917,272 | ) |
|
| |
| | $ | 1,648,233,110 | |
|
| |
| |
Net Assets: | | | | |
Class A | | $ | 1,433,891,922 | |
|
| |
Class C | | $ | 48,257,045 | |
|
| |
Class R | | $ | 51,835,827 | |
|
| |
Class Y | | $ | 103,793,711 | |
|
| |
Class R5 | | $ | 7,828 | |
|
| |
Class R6 | | $ | 10,446,777 | |
|
| |
|
Shares outstanding, no par value, with an unlimited number of shares authorized: | |
Class A | | | 496,801,461 | |
|
| |
Class C | | | 16,767,501 | |
|
| |
Class R | | | 17,947,059 | |
|
| |
Class Y | | | 36,026,951 | |
|
| |
Class R5 | | | 2,710 | |
|
| |
Class R6 | | | 3,636,515 | |
|
| |
Class A: | | | | |
Net asset value per share | | $ | 2.89 | |
|
| |
Maximum offering price per share | | | | |
(Net asset value of $2.89 ÷ 95.75%) | | $ | 3.02 | |
|
| |
Class C: | | | | |
Net asset value and offering price per share | | $ | 2.88 | |
|
| |
Class R: | | | | |
Net asset value and offering price per share | | $ | 2.89 | |
|
| |
Class Y: | | | | |
Net asset value and offering price per share | | $ | 2.88 | |
|
| |
Class R5: | | | | |
Net asset value and offering price per share | | $ | 2.89 | |
|
| |
Class R6: | | | | |
Net asset value and offering price per share | | $ | 2.87 | |
|
| |
| * | At October 31, 2022, securities with an aggregate value of $63,241,820 were on loan to brokers. |
See accompanying Notes to Consolidated Financial Statements which are an integral part of the financial statements.
| | |
| 34 | | Invesco Global Strategic Income Fund |
Consolidated Statement of Operations
For the year ended October 31, 2022
| | | | |
Investment income: | | | | |
| |
Interest (net of foreign withholding taxes of $253,834) | | $ | 75,684,454 | |
|
| |
Dividends from affiliates (includes net securities lending income of $834,144) | | | 3,252,052 | |
|
| |
Total investment income | | | 78,936,506 | |
|
| |
| |
Expenses: | | | | |
Advisory fees | | | 11,492,687 | |
|
| |
Administrative services fees | | | 284,445 | |
|
| |
Custodian fees | | | 684,188 | |
|
| |
Distribution fees: | | | | |
Class A | | | 4,068,715 | |
|
| |
Class C | | | 629,915 | |
|
| |
Class R | | | 305,920 | |
|
| |
Interest, facilities and maintenance fees | | | 1,619,247 | |
|
| |
Transfer agent fees – A, C, R and Y | | | 2,743,338 | |
|
| |
Transfer agent fees – R5 | | | 3 | |
|
| |
Transfer agent fees – R6 | | | 4,300 | |
|
| |
Trustees’ and officers’ fees and benefits | | | 35,757 | |
|
| |
Registration and filing fees | | | 107,164 | |
|
| |
Professional services fees | | | 137,052 | |
|
| |
Other | | | (113,022 | ) |
|
| |
Total expenses | | | 21,999,709 | |
|
| |
Less: Fees waived and/or expense offset arrangement(s) | | | (368,654 | ) |
|
| |
Net expenses | | | 21,631,055 | |
|
| |
Net investment income | | | 57,305,451 | |
|
| |
| |
Realized and unrealized gain (loss) from: | | | | |
Net realized gain (loss) from: | | | | |
Unaffiliated investment securities (net of foreign taxes of $867) | | | (126,114,717 | ) |
|
| |
Affiliated investment securities | | | (4,040,511 | ) |
|
| |
Foreign currencies | | | (7,047,624 | ) |
|
| |
Forward foreign currency contracts | | | 38,541,637 | |
|
| |
Futures contracts | | | 36,133,710 | |
|
| |
Option contracts written | | | (1,407,448 | ) |
|
| |
Swap agreements | | | (107,056,637 | ) |
|
| |
| | | (170,991,590 | ) |
|
| |
Change in net unrealized appreciation (depreciation) of: | | | | |
Unaffiliated investment securities | | | (190,655,740 | ) |
|
| |
Affiliated investment securities | | | 689,096 | |
|
| |
Foreign currencies | | | 508,922 | |
|
| |
Forward foreign currency contracts | | | (21,029,010 | ) |
|
| |
Futures contracts | | | (2,634,316 | ) |
|
| |
Option contracts written | | | (18,927,550 | ) |
|
| |
Swap agreements | | | 2,396,505 | |
|
| |
| | | (229,652,093 | ) |
|
| |
Net realized and unrealized gain (loss) | | | (400,643,683 | ) |
|
| |
Net increase (decrease) in net assets resulting from operations | | $ | (343,338,232 | ) |
|
| |
See accompanying Notes to Consolidated Financial Statements which are an integral part of the financial statements.
| | |
| 35 | | Invesco Global Strategic Income Fund |
Consolidated Statement of Changes in Net Assets
For the years ended October 31, 2022 and 2021
| | | | | | | | |
| | | 2022 | | | 2021 | |
|
| |
Operations: | | | | | | | | |
Net investment income | | $ | 57,305,451 | | | $ | 71,841,540 | |
|
| |
Net realized gain (loss) | | | (170,991,590 | ) | | | (25,589,444 | ) |
|
| |
Change in net unrealized appreciation (depreciation) | | | (229,652,093 | ) | | | 12,600,729 | |
|
| |
Net increase (decrease) in net assets resulting from operations | | | (343,338,232 | ) | | | 58,852,825 | |
|
| |
| | |
Distributions to shareholders from distributable earnings: | | | | | | | | |
Class A | | | – | | | | (25,957,364 | ) |
|
| |
Class C | | | – | | | | (1,216,045 | ) |
|
| |
Class R | | | – | | | | (905,564 | ) |
|
| |
Class Y | | | – | | | | (2,208,688 | ) |
|
| |
Class R5 | | | – | | | | (118 | ) |
|
| |
Class R6 | | | – | | | | (271,613 | ) |
|
| |
Total distributions from distributable earnings | | | – | | | | (30,559,392 | ) |
|
| |
| | |
Return of capital: | | | | | | | | |
Class A | | | (54,922,897 | ) | | | (30,499,206 | ) |
|
| |
Class C | | | (1,516,768 | ) | | | (619,123 | ) |
|
| |
Class R | | | (1,802,840 | ) | | | (867,377 | ) |
|
| |
Class Y | | | (4,613,921 | ) | | | (3,021,211 | ) |
|
| |
Class R5 | | | (316 | ) | | | (178 | ) |
|
| |
Class R6 | | | (534,000 | ) | | | (401,918 | ) |
|
| |
Total return of capital | | | (63,390,742 | ) | | | (35,409,013 | ) |
|
| |
Total distributions | | | (63,390,742 | ) | | | (65,968,405 | ) |
|
| |
| | |
Share transactions–net: | | | | | | | | |
Class A | | | (219,253,212 | ) | | | (222,799,297 | ) |
|
| |
Class C | | | (17,438,498 | ) | | | (78,911,388 | ) |
|
| |
Class R | | | (6,115,570 | ) | | | (8,352,959 | ) |
|
| |
Class Y | | | (26,212,159 | ) | | | (44,748,462 | ) |
|
| |
Class R6 | | | (5,302,195 | ) | | | (1,719,097 | ) |
|
| |
Net increase (decrease) in net assets resulting from share transactions | | | (274,321,634 | ) | | | (356,531,203 | ) |
|
| |
Net increase (decrease) in net assets | | | (681,050,608 | ) | | | (363,646,783 | ) |
|
| |
| | |
Net assets: | | | | | | | | |
Beginning of year | | | 2,329,283,718 | | | | 2,692,930,501 | |
|
| |
End of year | | $ | 1,648,233,110 | | | $ | 2,329,283,718 | |
|
| |
See accompanying Notes to Consolidated Financial Statements which are an integral part of the financial statements.
| | |
| 36 | | Invesco Global Strategic Income Fund |
Consolidated Financial Highlights
The following schedule presents financial highlights for a share of the Fund outstanding throughout the periods indicated.
| | | | | | | | | | | | | | | | | | | | | | | | | | | | | | | | | | | | | | | | | | | | | | | | | | | | | | | | | | | | | | | | | | | | | | |
| | | Net asset value, beginning of period | | Net investment income(a) | | Net gains (losses) on securities (both realized and unrealized) | | Total from investment operations | | Dividends from net investment income | | Return of capital | | Total distributions | | Net asset value, end of period | | Total return(b) | | Net assets, end of period (000’s omitted) | | Ratio of expenses to average net assets with fee waivers and/or expenses absorbed(c) | | Ratio of expenses to average net assets without fee waivers and/or expenses absorbed | | Ratio of net investment income to average net assets | | Portfolio turnover (d)(e) |
Class A | | | | | | | | | | | | | | | | | | | | | | | | | | | | | | | | | | | | | | | | | | | | | | | | | | | | | | | | | | | | | | | | | | | | | | |
Year ended 10/31/22 | | | $ | 3.56 | | | | $ | 0.09 | | | | $ | (0.66 | ) | | | $ | (0.57 | ) | | | $ | - | | | | $ | (0.10 | ) | | | $ | (0.10 | ) | | | $ | 2.89 | | | | | (16.12 | )%(f) | | | $ | 1,433,892 | | | | | 1.08 | %(f)(g) | | | | 1.10 | %(f)(g) | | | | 2.89 | %(f)(g) | | | | 88 | % |
Year ended 10/31/21 | | | | 3.58 | | | | | 0.10 | | | | | (0.03 | ) | | | | 0.07 | | | | | (0.04 | ) | | | | (0.05 | ) | | | | (0.09 | ) | | | | 3.56 | | | | | 2.04 | (f) | | | | 2,004,153 | | | | | 0.99 | (f) | | | | 1.01 | (f) | | | | 2.79 | (f) | | | | 241 | |
Year ended 10/31/20 | | | | 3.75 | | | | | 0.10 | | | | | (0.16 | ) | | | | (0.06 | ) | | | | (0.05 | ) | | | | (0.06 | ) | | | | (0.11 | ) | | | | 3.58 | | | | | (1.47 | )(f) | | | | 2,236,548 | | | | | 0.98 | (f) | | | | 0.99 | (f) | | | | 2.70 | (f) | | | | 273 | |
One month ended 10/31/19 | | | | 3.72 | | | | | 0.01 | | | | | 0.03 | | | | | 0.04 | | | | | (0.00 | ) | | | | (0.01 | ) | | | | (0.01 | ) | | | | 3.75 | | | | | (1.11 | ) | | | | 2,669,175 | | | | | 0.96 | (h) | | | | 1.00 | (h) | | | | 3.80 | (h) | | | | 25 | |
Year ended 09/30/19 | | | | 3.73 | | | | | 0.19 | | | | | (0.01 | ) | | | | 0.18 | | | | | (0.13 | ) | | | | (0.06 | ) | | | | (0.19 | ) | | | | 3.72 | | | | | 5.08 | | | | | 2,671,046 | | | | | 0.95 | | | | | 1.00 | | | | | 5.25 | | | | | 114 | |
Year ended 09/30/18 | | | | 3.96 | | | | | 0.18 | | | | | (0.23 | ) | | | | (0.05 | ) | | | | (0.18 | ) | | | | - | | | | | (0.18 | ) | | | | 3.73 | | | | | (1.49 | ) | | | | 2,699,688 | | | | | 1.00 | | | | | 1.07 | | | | | 4.79 | | | | | 67 | |
Class C | | | | | | | | | | | | | | | | | | | | | | | | | | | | | | | | | | | | | | | | | | | | | | | | | | | | | | | | | | | | | | | | | | | | | | |
Year ended 10/31/22 | | | | 3.55 | | | | | 0.07 | | | | | (0.66 | ) | | | | (0.59 | ) | | | | - | | | | | (0.08 | ) | | | | (0.08 | ) | | | | 2.88 | | | | | (16.83 | ) | | | | 48,257 | | | | | 1.84 | (g) | | | | 1.86 | (g) | | | | 2.13 | (g) | | | | 88 | |
Year ended 10/31/21 | | | | 3.57 | | | | | 0.07 | | | | | (0.02 | ) | | | | 0.05 | | | | | (0.05 | ) | | | | (0.02 | ) | | | | (0.07 | ) | | | | 3.55 | | | | | 1.27 | | | | | 78,455 | | | | | 1.75 | | | | | 1.77 | | | | | 2.03 | | | | | 241 | |
Year ended 10/31/20 | | | | 3.74 | | | | | 0.07 | | | | | (0.16 | ) | | | | (0.09 | ) | | | | (0.03 | ) | | | | (0.05 | ) | | | | (0.08 | ) | | | | 3.57 | | | | | (2.23 | ) | | | | 154,642 | | | | | 1.74 | | | | | 1.75 | | | | | 1.94 | | | | | 273 | |
One month ended 10/31/19 | | | | 3.71 | | | | | 0.01 | | | | | 0.03 | | | | | 0.04 | | | | | (0.00 | ) | | | | (0.01 | ) | | | | (0.01 | ) | | | | 3.74 | | | | | 1.04 | | | | | 220,077 | | | | | 1.72 | (h) | | | | 1.76 | (h) | | | | 3.03 | (h) | | | | 25 | |
Year ended 09/30/19 | | | | 3.72 | | | | | 0.17 | | | | | (0.02 | ) | | | | 0.15 | | | | | (0.11 | ) | | | | (0.05 | ) | | | | (0.16 | ) | | | | 3.71 | | | | | 4.28 | | | | | 224,035 | | | | | 1.71 | | | | | 1.76 | | | | | 4.49 | | | | | 114 | |
Year ended 09/30/18 | | | | 3.95 | | | | | 0.16 | | | | | (0.24 | ) | | | | (0.08 | ) | | | | (0.15 | ) | | | | - | | | | | (0.15 | ) | | | | 3.72 | | | | | (2.26 | ) | | | | 540,465 | | | | | 1.76 | | | | | 1.83 | | | | | 4.03 | | | | | 67 | |
Class R | | | | | | | | | | | | | | | | | | | | | | | | | | | | | | | | | | | | | | | | | | | | | | | | | | | | | | | | | | | | | | | | | | | | | | |
Year ended 10/31/22 | | | | 3.56 | | | | | 0.09 | | | | | (0.66 | ) | | | | (0.57 | ) | | | | - | | | | | (0.10 | ) | | | | (0.10 | ) | | | | 2.89 | | | | | (16.34 | ) | | | | 51,836 | | | | | 1.34 | (g) | | | | 1.36 | (g) | | | | 2.63 | (g) | | | | 88 | |
Year ended 10/31/21 | | | | 3.59 | | | | | 0.09 | | | | | (0.03 | ) | | | | 0.06 | | | | | (0.05 | ) | | | | (0.04 | ) | | | | (0.09 | ) | | | | 3.56 | | | | | 1.49 | | | | | 70,527 | | | | | 1.25 | | | | | 1.27 | | | | | 2.53 | | | | | 241 | |
Year ended 10/31/20 | | | | 3.75 | | | | | 0.09 | | | | | (0.15 | ) | | | | (0.06 | ) | | | | (0.04 | ) | | | | (0.06 | ) | | | | (0.10 | ) | | | | 3.59 | | | | | (1.45 | ) | | | | 79,116 | | | | | 1.24 | | | | | 1.25 | | | | | 2.44 | | | | | 273 | |
One month ended 10/31/19 | | | | 3.72 | | | | | 0.01 | | | | | 0.03 | | | | | 0.04 | | | | | (0.00 | ) | | | | (0.01 | ) | | | | (0.01 | ) | | | | 3.75 | | | | | 1.09 | | | | | 99,920 | | | | | 1.22 | (h) | | | | 1.26 | (h) | | | | 3.53 | (h) | | | | 25 | |
Year ended 09/30/19 | | | | 3.73 | | | | | 0.18 | | | | | (0.01 | ) | | | | 0.17 | | | | | (0.12 | ) | | | | (0.06 | ) | | | | (0.18 | ) | | | | 3.72 | | | | | 4.81 | | | | | 100,112 | | | | | 1.21 | | | | | 1.26 | | | | | 4.99 | | | | | 114 | |
Year ended 09/30/18 | | | | 3.96 | | | | | 0.17 | | | | | (0.23 | ) | | | | (0.06 | ) | | | | (0.17 | ) | | | | - | | | | | (0.17 | ) | | | | 3.73 | | | | | (1.75 | ) | | | | 111,816 | | | | | 1.26 | | | | | 1.33 | | | | | 4.53 | | | | | 67 | |
Class Y | | | | | | | | | | | | | | | | | | | | | | | | | | | | | | | | | | | | | | | | | | | | | | | | | | | | | | | | | | | | | | | | | | | | | | |
Year ended 10/31/22 | | | | 3.55 | | | | | 0.10 | | | | | (0.66 | ) | | | | (0.56 | ) | | | | - | | | | | (0.11 | ) | | | | (0.11 | ) | | | | 2.88 | | | | | (15.97 | ) | | | | 103,794 | | | | | 0.84 | (g) | | | | 0.86 | (g) | | | | 3.13 | (g) | | | | 88 | |
Year ended 10/31/21 | | | | 3.58 | | | | | 0.11 | | | | | (0.04 | ) | | | | 0.07 | | | | | (0.04 | ) | | | | (0.06 | ) | | | | (0.10 | ) | | | | 3.55 | | | | | 2.00 | | | | | 157,186 | | | | | 0.75 | | | | | 0.77 | | | | | 3.03 | | | | | 241 | |
Year ended 10/31/20 | | | | 3.75 | | | | | 0.11 | | | | | (0.16 | ) | | | | (0.05 | ) | | | | (0.05 | ) | | | | (0.07 | ) | | | | (0.12 | ) | | | | 3.58 | | | | | (1.24 | ) | | | | 201,675 | | | | | 0.74 | | | | | 0.75 | | | | | 2.94 | | | | | 273 | |
One month ended 10/31/19 | | | | 3.71 | | | | | 0.01 | | | | | 0.04 | | | | | 0.05 | | | | | (0.00 | ) | | | | (0.01 | ) | | | | (0.01 | ) | | | | 3.75 | | | | | 1.40 | | | | | 335,775 | | | | | 0.72 | (h) | | | | 0.77 | (h) | | | | 4.03 | (h) | | | | 25 | |
Year ended 09/30/19 | | | | 3.73 | | | | | 0.20 | | | | | (0.02 | ) | | | | 0.18 | | | | | (0.13 | ) | | | | (0.07 | ) | | | | (0.20 | ) | | | | 3.71 | | | | | 5.05 | | | | | 329,963 | | | | | 0.72 | | | | | 0.77 | | | | | 5.49 | | | | | 114 | |
Year ended 09/30/18 | | | | 3.96 | | | | | 0.19 | | | | | (0.23 | ) | | | | (0.04 | ) | | | | (0.19 | ) | | | | - | | | | | (0.19 | ) | | | | 3.73 | | | | | (1.26 | ) | | | | 371,434 | | | | | 0.76 | | | | | 0.83 | | | | | 5.03 | | | | | 67 | |
Class R5 | | | | | | | | | | | | | | | | | | | | | | | | | | | | | | | | | | | | | | | | | | | | | | | | | | | | | | | | | | | | | | | | | | | | | | |
Year ended 10/31/22 | | | | 3.56 | | | | | 0.11 | | | | | (0.66 | ) | | | | (0.55 | ) | | | | - | | | | | (0.12 | ) | | | | (0.12 | ) | | | | 2.89 | | | | | (15.81 | ) | | | | 8 | | | | | 0.73 | (g) | | | | 0.75 | (g) | | | | 3.24 | (g) | | | | 88 | |
Year ended 10/31/21 | | | | 3.59 | | | | | 0.12 | | | | | (0.04 | ) | | | | 0.08 | | | | | (0.04 | ) | | | | (0.07 | ) | | | | (0.11 | ) | | | | 3.56 | | | | | 2.14 | | | | | 10 | | | | | 0.61 | | | | | 0.62 | | | | | 3.17 | | | | | 241 | |
Year ended 10/31/20 | | | | 3.75 | | | | | 0.11 | | | | | (0.14 | ) | | | | (0.03 | ) | | | | (0.06 | ) | | | | (0.07 | ) | | | | (0.13 | ) | | | | 3.59 | | | | | (0.81 | ) | | | | 10 | | | | | 0.64 | | | | | 0.64 | | | | | 3.04 | | | | | 273 | |
One month ended 10/31/19 | | | | 3.72 | | | | | 0.01 | | | | | 0.03 | | | | | 0.04 | | | | | (0.00 | ) | | | | (0.01 | ) | | | | (0.01 | ) | | | | 3.75 | | | | | 1.14 | | | | | 10 | | | | | 0.70 | (h) | | | | 0.72 | (h) | | | | 4.05 | (h) | | | | 25 | |
Period ended 09/30/19(i) | | | | 3.69 | | | | | 0.07 | | | | | 0.02 | | | | | 0.09 | | | | | (0.04 | ) | | | | (0.02 | ) | | | | (0.06 | ) | | | | 3.72 | | | | | 2.40 | | | | | 10 | | | | | 0.63 | (h) | | | | 0.68 | (h) | | | | 5.58 | (h) | | | | 114 | |
Class R6 | | | | | | | | | | | | | | | | | | | | | | | | | | | | | | | | | | | | | | | | | | | | | | | | | | | | | | | | | | | | | | | | | | | | | | |
Year ended 10/31/22 | | | | 3.54 | | | | | 0.11 | | | | | (0.66 | ) | | | | (0.55 | ) | | | | - | | | | | (0.12 | ) | | | | (0.12 | ) | | | | 2.87 | | | | | (15.93 | ) | | | | 10,447 | | | | | 0.73 | (g) | | | | 0.75 | (g) | | | | 3.24 | (g) | | | | 88 | |
Year ended 10/31/21 | | | | 3.57 | | | | | 0.12 | | | | | (0.04 | ) | | | | 0.08 | | | | | (0.05 | ) | | | | (0.06 | ) | | | | (0.11 | ) | | | | 3.54 | | | | | 2.13 | | | | | 18,954 | | | | | 0.61 | | | | | 0.63 | | | | | 3.17 | | | | | 241 | |
Year ended 10/31/20 | | | | 3.73 | | | | | 0.11 | | | | | (0.15 | ) | | | | (0.04 | ) | | | | (0.05 | ) | | | | (0.07 | ) | | | | (0.12 | ) | | | | 3.57 | | | | | (0.86 | ) | | | | 20,939 | | | | | 0.63 | | | | | 0.63 | | | | | 3.05 | | | | | 273 | |
One month ended 10/31/19 | | | | 3.70 | | | | | 0.01 | | | | | 0.03 | | | | | 0.04 | | | | | (0.00 | ) | | | | (0.01 | ) | | | | (0.01 | ) | | | | 3.73 | | | | | 1.14 | | | | | 36,634 | | | | | 0.57 | (h) | | | | 0.62 | (h) | | | | 4.18 | (h) | | | | 25 | |
Year ended 09/30/19 | | | | 3.71 | | | | | 0.21 | | | | | (0.01 | ) | | | | 0.20 | | | | | (0.14 | ) | | | | (0.07 | ) | | | | (0.21 | ) | | | | 3.70 | | | | | 5.49 | | | | | 36,479 | | | | | 0.57 | | | | | 0.62 | | | | | 5.63 | | | | | 114 | |
Year ended 09/30/18 | | | | 3.94 | | | | | 0.20 | | | | | (0.23 | ) | | | | (0.03 | ) | | | | (0.20 | ) | | | | - | | | | | (0.20 | ) | | | | 3.71 | | | | | (1.15 | ) | | | | 41,461 | | | | | 0.61 | | | | | 0.68 | | | | | 5.18 | | | | | 67 | |
| (a) | Calculated using average shares outstanding. |
| (b) | Includes adjustments in accordance with accounting principles generally accepted in the United States of America and as such, the net asset value for financial reporting purposes and the returns based upon those net asset values may differ from the net asset value and returns for shareholder transactions. Does not include sales charges and is not annualized for periods less than one year, if applicable. |
| (c) | Does not include indirect expenses from affiliated fund fees and expenses of 0.04%, 0.04% and 0.01% for the one month ended October 31, 2019 and the years ended September 30, 2019 and 2018, respectively. |
| (d) | The portfolio turnover rate excludes purchase and sale transactions of To Be Announced (TBA) mortgage-related securities of $364,949,527 and $405,130,315, $5,760,311,794 and $5,754,174,138 and $6,366,360,171 and $6,415,700,475 for the one month ended October 31, 2019 and the years ended September 30, 2019 and 2018, respectively. |
| (e) | Portfolio turnover is calculated at the fund level and is not annualized for periods less than one year, if applicable. |
| (f) | The total return, ratio of expenses to average net assets and ratio of net investment income (loss) to average net assets reflect actual 12b-1 fees of 0.24% for the years ended October 31, 2022, 2021 and 2020. |
| (g) | Includes Interest, facilities and maintenance fees of 0.08% for the year ended October 31, 2022. |
| (i) | Commencement date after the close of business on May 24, 2019. |
See accompanying Notes to Consolidated Financial Statements which are an integral part of the financial statements.
| | |
| 37 | | Invesco Global Strategic Income Fund |
Notes to Consolidated Financial Statements
October 31, 2022
NOTE 1–Significant Accounting Policies
Invesco Global Strategic Income Fund (the “Fund”) is a series portfolio of AIM Investment Funds (Invesco Investment Funds) (the “Trust”). The Trust is organized as a Delaware statutory trust and is registered under the Investment Company Act of 1940, as amended (the “1940 Act”), as an open-end series management investment company authorized to issue an unlimited number of shares of beneficial interest. Information presented in these consolidated financial statements pertains only to the Fund and the Invesco Global Strategic Income Fund (Cayman) Ltd. (the “Subsidiary”), a wholly-owned and controlled subsidiary by the Fund organized under the laws of the Cayman Islands. Matters affecting the Fund or each class will be voted on exclusively by the shareholders of the Fund or each class.
The Fund will seek to gain exposure to Regulation S securities primarily through investments in the Subsidiary. The Subsidiary was organized by the Fund to invest in Regulation S securities. The Fund may invest up to 25% of its total assets in the Subsidiary.
The Fund’s investment objective is to seek total return.
The Fund currently consists of six different classes of shares: Class A, Class C, Class R, Class Y, Class R5 and Class R6. Class Y shares are available only to certain investors. Class A shares are sold with a front-end sales charge unless certain waiver criteria are met. Under certain circumstances, load waived shares may be subject to contingent deferred sales charges (“CDSC”). Class C shares are sold with a CDSC. Class R, Class Y, Class R5 and Class R6 shares are sold at net asset value. Class C shares held for eight years after purchase are eligible for automatic conversion into Class A shares of the same Fund (the “Conversion Feature”). The automatic conversion pursuant to the Conversion Feature will generally occur at the end of the month following the eighth anniversary after a purchase of Class C shares.
The Fund is an investment company and accordingly follows the investment company accounting and reporting guidance in accordance with Financial Accounting Standards Board Accounting Standards Codification Topic 946, Financial Services - Investment Companies.
The following is a summary of the significant accounting policies followed by the Fund in the preparation of its consolidated financial statements.
| A. | Security Valuations – Securities, including restricted securities, are valued according to the following policy. |
Fixed income securities (including convertible debt securities) generally are valued on the basis of prices provided by independent pricing services. Prices provided by the pricing service may be determined without exclusive reliance on quoted prices, and may reflect appropriate factors such as institution-size trading in similar groups of securities, developments related to specific securities, dividend rate (for unlisted equities), yield (for debt obligations), quality, type of issue, coupon rate (for debt obligations), maturity (for debt obligations), individual trading characteristics and other market data. Pricing services generally value debt obligations assuming orderly transactions of institutional round lot size, but a fund may hold or transact in the same securities in smaller, odd lot sizes. Odd lots often trade at lower prices than institutional round lots, and their value may be adjusted accordingly. Debt obligations are subject to interest rate and credit risks. In addition, all debt obligations involve some risk of default with respect to interest and/or principal payments.
A security listed or traded on an exchange is generally valued at its trade price or official closing price that day as of the close of the exchange where the security is principally traded, or lacking any trades or official closing price on a particular day, the security may be valued at the closing bid price on that day. Securities traded in the over-the-counter market are valued based on prices furnished by independent pricing services or market makers. When such securities are valued using prices provided by an independent pricing service they may be considered fair valued. Futures contracts are valued at the daily settlement price set by an exchange on which they are principally traded. U.S. exchange-traded options are valued at the mean between the last bid and asked prices from the exchange on which they are principally traded. Non-U.S. exchange-traded options are valued at the final settlement price set by the exchange on which they trade. Options not listed on an exchange and swaps generally are valued using pricing provided from independent pricing services.
Securities of investment companies that are not exchange-traded (e.g., open-end mutual funds) are valued using such company’s end-of-business-day net asset value per share.
Deposits, other obligations of U.S. and non-U.S. banks and financial institutions are valued at their daily account value.
Swap agreements are fair valued using an evaluated quote, if available, provided by an independent pricing service. Evaluated quotes provided by the pricing service are valued based on a model which may include end-of-day net present values, spreads, ratings, industry, company performance and returns of referenced assets. Centrally cleared swap agreements are valued at the daily settlement price determined by the relevant exchange or clearinghouse.
Foreign securities’ (including foreign exchange contracts) prices are converted into U.S. dollar amounts using the applicable exchange rates as of the close of the New York Stock Exchange (“NYSE”). If market quotations are available and reliable for foreign exchange-traded equity securities, the securities will be valued at the market quotations. Invesco Advisers, Inc. (the “Adviser” or “Invesco”) may use various pricing services to obtain market quotations as well as fair value prices. Because trading hours for certain foreign securities end before the close of the NYSE, closing market quotations may become not representative of market value in the Adviser’s judgment (“unreliable”). If, between the time trading ends on a particular security and the close of the customary trading session on the NYSE, a significant event occurs that makes the closing price of the security unreliable, the Adviser may fair value the security. If the event is likely to have affected the closing price of the security, the security will be valued at fair value in good faith in accordance with Board- approved policies and related Adviser procedures (“Valuation Procedures”). Adjustments to closing prices to reflect fair value may also be based on a screening process of an independent pricing service to indicate the degree of certainty, based on historical data, that the closing price in the principal market where a foreign security trades is not the current value as of the close of the NYSE. Foreign securities’ prices meeting the degree of certainty that the price is not reflective of current value will be priced at the indication of fair value from the independent pricing service. Multiple factors may be considered by the independent pricing service in determining adjustments to reflect fair value and may include information relating to sector indices, American Depositary Receipts and domestic and foreign index futures. Foreign securities may have additional risks including exchange rate changes, potential for sharply devalued currencies and high inflation, political and economic upheaval, the relative lack of issuer information, relatively low market liquidity and the potential lack of strict financial and accounting controls and standards.
Unlisted securities will be valued using prices provided by independent pricing services or by another method that the Adviser, in its judgment, believes better reflects the security’s fair value in accordance with the Valuation Procedures.
Securities for which market prices are not provided by any of the above methods may be valued based upon quotes furnished by independent sources. The last bid price may be used to value equity securities. The mean between the last bid and asked prices may be used to value debt obligations, including corporate loans.
Securities for which market quotations are not readily available are fair valued by the Adviser in accordance with the Valuation Procedures. If a fair value price provided by a pricing service is unreliable, the Adviser will fair value the security using the Valuation Procedures. Issuer specific events, market trends, bid/asked quotes of brokers and information providers and other market data may be reviewed in the course of making a good faith determination of a security’s fair value.
The Fund may invest in securities that are subject to interest rate risk, meaning the risk that the prices will generally fall as interest rates rise and, conversely, the prices will generally rise as interest rates fall. Specific securities differ in their sensitivity to changes in interest rates depending on their individual characteristics. Changes in interest rates may result in increased market volatility, which may affect the value and/or liquidity of certain Fund investments.
Valuations change in response to many factors including the historical and prospective earnings of the issuer, the value of the issuer’s assets, general market conditions which are not specifically related to the particular issuer, such as real or perceived adverse economic conditions, changes in the general outlook for revenues or corporate earnings, changes in interest or currency rates, regional or global instability, natural or environmental disasters, widespread disease or other public health issues, war, acts of terrorism, significant governmental actions or adverse investor sentiment generally and market liquidity. Because of the inherent uncertainties of valuation, the values reflected in the financial statements may materially differ from the value received upon actual sale of those investments.
| | |
| 38 | | Invesco Global Strategic Income Fund |
The price the Fund could receive upon the sale of any investment may differ from the Adviser’s valuation of the investment, particularly for securities that are valued using a fair valuation technique. When fair valuation techniques are applied, the Adviser uses available information, including both observable and unobservable inputs and assumptions, to determine a methodology that will result in a valuation that the Adviser believes approximates market value. Fund securities that are fair valued may be subject to greater fluctuation in their value from one day to the next than would be the case if market quotations were used. Because of the inherent uncertainties of valuation, and the degree of subjectivity in such decisions, the Fund could realize a greater or lesser than expected gain or loss upon the sale of the investment.
| B. | Securities Transactions and Investment Income – Securities transactions are accounted for on a trade date basis. Realized gains or losses on sales are computed on the basis of specific identification of the securities sold. Interest income (net of withholding tax, if any) is recorded on an accrual basis from settlement date and includes coupon interest and amortization of premium and accretion of discount on debt securities as applicable. Pay-in-kind interest income and non-cash dividend income received in the form of securities in-lieu of cash are recorded at the fair value of the securities received. Paydown gains and losses on mortgage and asset-backed securities are recorded as adjustments to interest income. Dividend income (net of withholding tax, if any) is recorded on the ex-dividend date. |
The Fund may periodically participate in litigation related to Fund investments. As such, the Fund may receive proceeds from litigation settlements. Any proceeds received are included in the Consolidated Statement of Operations as realized gain (loss) for investments no longer held and as unrealized gain (loss) for investments still held.
Brokerage commissions and mark ups are considered transaction costs and are recorded as an increase to the cost basis of securities purchased and/or a reduction of proceeds on a sale of securities. Such transaction costs are included in the determination of net realized and unrealized gain (loss) from investment securities reported in the Consolidated Statement of Operations and the Consolidated Statement of Changes in Net Assets and the net realized and unrealized gains (losses) on securities per share in the Consolidated Financial Highlights. Transaction costs are included in the calculation of the Fund’s net asset value and, accordingly, they reduce the Fund’s total returns. These transaction costs are not considered operating expenses and are not reflected in net investment income reported in the Consolidated Statement of Operations and the Consolidated Statement of Changes in Net Assets, or the net investment income per share and the ratios of expenses and net investment income reported in the Consolidated Financial Highlights, nor are they limited by any expense limitation arrangements between the Fund and the investment adviser.
The Fund allocates income and realized and unrealized capital gains and losses to a class based on the relative net assets of each class.
| C. | Country Determination – For the purposes of making investment selection decisions and presentation in the Consolidated Schedule of Investments, the investment adviser may determine the country in which an issuer is located and/or credit risk exposure based on various factors. These factors include the laws of the country under which the issuer is organized, where the issuer maintains a principal office, the country in which the issuer derives 50% or more of its total revenues, the country that has the primary market for the issuer’s securities and its “country of risk” as determined by a third party service provider, as well as other criteria. Among the other criteria that may be evaluated for making this determination are the country in which the issuer maintains 50% or more of its assets, the type of security, financial guarantees and enhancements, the nature of the collateral and the sponsor organization. Country of issuer and/or credit risk exposure has been determined to be the United States of America, unless otherwise noted. |
| D. | Distributions – Distributions from net investment income, if any, are declared and paid monthly. Distributions from net realized capital gain, if any, are generally declared and paid annually and recorded on the ex-dividend date. The Fund may elect to treat a portion of the proceeds from redemptions as distributions for federal income tax purposes. |
| E. | Federal Income Taxes – The Fund intends to comply with the requirements of Subchapter M of the Internal Revenue Code of 1986, as amended (the “Internal Revenue Code”), necessary to qualify as a regulated investment company and to distribute substantially all of the Fund’s taxable earnings to shareholders. As such, the Fund will not be subject to federal income taxes on otherwise taxable income (including net realized capital gain) that is distributed to shareholders. Therefore, no provision for federal income taxes is recorded in the consolidated financial statements. |
The Fund recognizes the tax benefits of uncertain tax positions only when the position is more likely than not to be sustained. Management has analyzed the Fund’s uncertain tax positions and concluded that no liability for unrecognized tax benefits should be recorded related to uncertain tax positions. Management is not aware of any tax positions for which it is reasonably possible that the total amounts of unrecognized tax benefits will change materially in the next 12 months.
The Subsidiary is classified as a controlled foreign corporation under Subchapter N of the Internal Revenue Code. Therefore, the Fund is required to increase its taxable income by its share of the Subsidiary’s income. Net investment losses of the Subsidiary cannot be deducted by the Fund in the current period nor carried forward to offset taxable income in future periods.
The Fund files tax returns in the U.S. Federal jurisdiction and certain other jurisdictions. Generally the Fund is subject to examinations by such taxing authorities for up to three years after the filing of the return for the tax period.
| F. | Expenses – Fees provided for under the Rule 12b-1 plan of a particular class of the Fund are charged to the operations of such class. Transfer agency fees and expenses and other shareholder recordkeeping fees and expenses attributable to Class R5 and Class R6 are allocated based on relative net assets of Class R5 and Class R6. Sub-accounting fees attributable to Class R5 are charged to the operations of the class. Transfer agency fees and expenses and other shareholder recordkeeping fees and expenses relating to all other classes are allocated among those classes based on relative net assets. All other expenses are allocated among the classes based on relative net assets. |
| G. | Interest, Facilities and Maintenance Fees – Interest, Facilities and Maintenance Fees include interest and related borrowing costs such as commitment fees, administrative expenses negative or overdrawn balances on margin accounts, and other expenses associated with establishing and maintaining a line of credit. |
| H. | Accounting Estimates – The financial statements are prepared on a consolidated basis in conformity with accounting principles generally accepted in the United States of America (“GAAP”), which requires management to make estimates and assumptions that affect the reported amounts of assets and liabilities at the date of the financial statements and the reported amounts of revenues and expenses during the reporting period including estimates and assumptions related to taxation. Actual results could differ from those estimates by a significant amount. The accompanying financial statements reflect the financial position of the Fund and its Subsidiary and the results of operations on a consolidated basis. All inter-company accounts and transactions have been eliminated in consolidation. |
In addition, the Fund monitors for material events or transactions that may occur or become known after the period-end date and before the date the consolidated financial statements are released to print.
| I. | Indemnifications – Under the Trust’s organizational documents, each Trustee, officer, employee or other agent of the Trust, and under the Subsidiary’s organizational documents, the directors and officers of the Subsidiary, are indemnified against certain liabilities that may arise out of the performance of their duties to the Fund and/or the Subsidiary, respectively. Additionally, in the normal course of business, the Fund enters into contracts, including the Fund’s servicing agreements, that contain a variety of indemnification clauses. The Fund’s maximum exposure under these arrangements is unknown as this would involve future claims that may be made against the Fund that have not yet occurred. The risk of material loss as a result of such indemnification claims is considered remote. |
| J. | Securities Purchased on a When-Issued and Delayed Delivery Basis – The Fund may purchase and sell interests in corporate loans and corporate debt securities and other portfolio securities on a when-issued and delayed delivery basis, with payment and delivery scheduled for a future date. No income accrues to the Fund on such interests or securities in connection with such transactions prior to the date the Fund actually takes delivery of such interests or securities. These transactions are subject to market fluctuations and are subject to the risk that the value at delivery may be more or less than the trade date |
| | |
| 39 | | Invesco Global Strategic Income Fund |
| | purchase price. Although the Fund will generally purchase these securities with the intention of acquiring such securities, they may sell such securities prior to the settlement date. |
| K. | Treasury Inflation-Protected Securities – The Fund may invest in Treasury Inflation-Protected Securities (“TIPS”). TIPS are fixed income securities whose principal value is periodically adjusted to the rate of inflation. The principal value of TIPS will be adjusted upward or downward, and any increase or decrease in the principal amount of TIPS will be included as interest income in the Consolidated Statement of Operations, even though investors do not receive their principal until maturity. |
| L. | Structured Securities – The Fund may invest in structured securities. Structured securities are a type of derivative security whose value is determined by reference to changes in the value of underlying securities, currencies, interest rates, commodities, indices or other financial indicators (“reference instruments”). Most structured securities are fixed-income securities that have maturities of three years or less. Structured securities may be positively or negatively indexed (i.e., their principal value or interest rates may increase or decrease if the underlying reference instrument appreciates) and may have return characteristics similar to direct investments in the underlying reference instrument. |
Structured securities may entail a greater degree of market risk than other types of debt securities because the investor bears the risk of the reference instruments. In addition to the credit risk of structured securities and the normal risks of price changes in response to changes in interest rates, the principal amount of structured notes or indexed securities may decrease as a result of changes in the value of the underlying reference instruments. Changes in the daily value of structured securities are recorded as unrealized gains (losses) in the Consolidated Statement of Operations. When the structured securities mature or are sold, the Fund recognizes a realized gain (loss) on the Consolidated Statement of Operations.
| M. | Securities Lending – The Fund may lend portfolio securities having a market value up to one-third of the Fund’s total assets. Such loans are secured by collateral equal to no less than the market value of the loaned securities determined daily by the securities lending provider. Such collateral will be cash or debt securities issued or guaranteed by the U.S. Government or any of its sponsored agencies. Cash collateral received in connection with these loans is invested in short-term money market instruments or affiliated, unregistered investment companies that comply with Rule 2a-7 under the 1940 Act and money market funds (collectively, “affiliated money market funds”) and is shown as such on the Consolidated Schedule of Investments. The Fund bears the risk of loss with respect to the investment of collateral. It is the Fund’s policy to obtain additional collateral from or return excess collateral to the borrower by the end of the next business day, following the valuation date of the securities loaned. Therefore, the value of the collateral held may be temporarily less than the value of the securities on loan. When loaning securities, the Fund retains certain benefits of owning the securities, including the economic equivalent of dividends or interest generated by the security. Lending securities entails a risk of loss to the Fund if, and to the extent that, the market value of the securities loaned were to increase and the borrower did not increase the collateral accordingly, and the borrower failed to return the securities. The securities loaned are subject to termination at the option of the borrower or the Fund. Upon termination, the borrower will return to the Fund the securities loaned and the Fund will return the collateral. Upon the failure of the borrower to return the securities, collateral may be liquidated and the securities may be purchased on the open market to replace the loaned securities. The Fund could experience delays and costs in gaining access to the collateral and the securities may lose value during the delay which could result in potential losses to the Fund. Some of these losses may be indemnified by the lending agent. The Fund bears the risk of any deficiency in the amount of the collateral available for return to the borrower due to any loss on the collateral invested. Dividends received on cash collateral investments for securities lending transactions, which are net of compensation to counterparties, are included in Dividends from affiliated money market funds on the Consolidated Statement of Operations. The aggregate value of securities out on loan, if any, is shown as a footnote on the Consolidated Statement of Assets and Liabilities. |
The Adviser serves as an affiliated securities lending agent for the Fund. The Bank of New York Mellon also serves as a lending agent. To the extent the Fund utilizes the Adviser as an affiliated securities lending agent, the Fund conducts its securities lending in accordance with, and in reliance upon, no-action letters issued by the SEC staff that provide guidance on how an affiliate may act as a direct agent lender and receive compensation for those services in a manner consistent with the federal securities laws. For the year ended October 31, 2022, the Fund paid the Adviser $48,136 in fees for securities lending agent services. Fees paid to the Adviser for securities lending agent services are included in Dividends from affiliated money market funds on the Consolidated Statement of Operations.
| N. | Foreign Currency Translations – Foreign currency is valued at the close of the NYSE based on quotations posted by banks and major currency dealers. Portfolio securities and other assets and liabilities denominated in foreign currencies are translated into U.S. dollar amounts at the date of valuation. Purchases and sales of portfolio securities (net of foreign taxes withheld on disposition) and income items denominated in foreign currencies are translated into U.S. dollar amounts on the respective dates of such transactions. The Fund does not separately account for the portion of the results of operations resulting from changes in foreign exchange rates on investments and the fluctuations arising from changes in market prices of securities held. The combined results of changes in foreign exchange rates and the fluctuation of market prices on investments (net of estimated foreign tax withholding) are included with the net realized and unrealized gain or loss from investments in the Consolidated Statement of Operations. Reported net realized foreign currency gains or losses arise from (1) sales of foreign currencies, (2) currency gains or losses realized between the trade and settlement dates on securities transactions, and (3) the difference between the amounts of dividends, interest, and foreign withholding taxes recorded on the Fund’s books and the U.S. dollar equivalent of the amounts actually received or paid. Net unrealized foreign currency gains and losses arise from changes in the fair values of assets and liabilities, other than investments in securities at fiscal period end, resulting from changes in exchange rates. |
The Fund may invest in foreign securities, which may be subject to foreign taxes on income, gains on investments or currency repatriation, a portion of which may be recoverable. Foreign taxes, if any, are recorded based on the tax regulations and rates that exist in the foreign markets in which the Fund invests and are shown in the Consolidated Statement of Operations.
| O. | Forward Foreign Currency Contracts – The Fund may engage in foreign currency transactions either on a spot (i.e. for prompt delivery and settlement) basis, or through forward foreign currency contracts, to manage or minimize currency or exchange rate risk. |
The Fund may also enter into forward foreign currency contracts for the purchase or sale of a security denominated in a foreign currency in order to “lock in” the U.S. dollar price of that security, or the Fund may also enter into forward foreign currency contracts that do not provide for physical exchange of the two currencies on the settlement date, but instead are settled by a single cash payment calculated as the difference between the agreed upon exchange rate and the spot rate at settlement based upon an agreed upon notional amount (non-deliverable forwards).
A forward foreign currency contract is an obligation between two parties (“Counterparties”) to purchase or sell a specific currency for an agreed-upon price at a future date. The use of forward foreign currency contracts for hedging does not eliminate fluctuations in the price of the underlying securities the Fund owns or intends to acquire but establishes a rate of exchange in advance. Fluctuations in the value of these contracts are measured by the difference in the contract date and reporting date exchange rates and are recorded as unrealized appreciation (depreciation) until the contracts are closed. When the contracts are closed, realized gains (losses) are recorded. Realized and unrealized gains (losses) on the contracts are included in the Consolidated Statement of Operations. The primary risks associated with forward foreign currency contracts include failure of the Counterparty to meet the terms of the contract and the value of the foreign currency changing unfavorably. These risks may be in excess of the amounts reflected in the Consolidated Statement of Assets and Liabilities.
| P. | Futures Contracts – The Fund may enter into futures contracts to equitize the Fund’s cash holdings or to manage exposure to interest rate, equity, commodity and market price movements and/or currency risks. A futures contract is an agreement between Counterparties to purchase or sell a specified underlying security, currency or commodity (or delivery of a cash settlement price, in the case of an index future) for a fixed price at a future date. The Fund currently invests only in exchange-traded futures and they are standardized as to maturity date and underlying financial instrument or asset. Initial margin deposits required upon entering into futures contracts are satisfied by the segregation of specific securities or cash as collateral at the futures commission merchant (broker). During the period the futures contracts are open, changes in the value of the contracts are recognized as unrealized gains or losses by |
| | |
| 40 | | Invesco Global Strategic Income Fund |
recalculating the value of the contracts on a daily basis. Subsequent or variation margin payments are received or made depending upon whether unrealized gains or losses are incurred. These amounts are reflected as receivables or payables on the Consolidated Statement of Assets and Liabilities. When the contracts are closed or expire, the Fund recognizes a realized gain or loss equal to the difference between the proceeds from, or cost of, the closing transaction and the Fund’s basis in the contract. The net realized gain (loss) and the change in unrealized gain (loss) on futures contracts held during the period is included on the Consolidated Statement of Operations. The primary risks associated with futures contracts are market risk and the absence of a liquid secondary market. If the Fund were unable to liquidate a futures contract and/or enter into an offsetting closing transaction, the Fund would continue to be subject to market risk with respect to the value of the contracts and continue to be required to maintain the margin deposits on the futures contracts. Futures contracts have minimal Counterparty risk since the exchange’s clearinghouse, as Counterparty to all exchange-traded futures, guarantees the futures against default. Risks may exceed amounts recognized in the Consolidated Statement of Assets and Liabilities.
| Q. | Call Options Purchased and Written – The Fund may write covered call options and/or buy call options. A covered call option gives the purchaser of such option the right to buy, and the writer the obligation to sell, the underlying security or foreign currency at the stated exercise price during the option period. Options written by the Fund normally will have expiration dates between three and nine months from the date written. The exercise price of a call option may be below, equal to, or above the current market value of the underlying security at the time the option is written. |
Additionally, the Fund may enter into an option on a swap agreement, also called a “swaption”. A swaption is an option that gives the buyer the right, but not the obligation, to enter into a swap on a future date in exchange for paying a market-based premium. A receiver swaption gives the owner the right to receive the total return of a specified asset, reference rate or index. Swaptions also include options that allow an existing swap to be terminated or extended by one of the Counterparties.
When the Fund writes a covered call option, an amount equal to the premium received by the Fund is recorded as an asset and an equivalent liability in the Consolidated Statement of Assets and Liabilities. The amount of the liability is subsequently “marked-to-market” to reflect the current market value of the option written. If a written covered call option expires on the stipulated expiration date, or if the Fund enters into a closing purchase transaction, the Fund realizes a gain (or a loss if the closing purchase transaction exceeds the premium received when the option was written) without regard to any unrealized gain or loss on the underlying security, and the liability related to such option is extinguished. If a written covered call option is exercised, the Fund realizes a gain or a loss from the sale of the underlying security and the proceeds of the sale are increased by the premium originally received. Realized and unrealized gains and losses on call options written are included in the Consolidated Statement of Operations as Net realized gain (loss) from and Change in net unrealized appreciation (depreciation) of Option contracts written. A risk in writing a covered call option is that the Fund gives up the opportunity for profit if the market price of the security increases and the option is exercised.
When the Fund buys a call option, an amount equal to the premium paid by the Fund is recorded as an investment on the Consolidated Statement of Assets and Liabilities. The amount of the investment is subsequently “marked-to-market” to reflect the current value of the option purchased. Realized and unrealized gains and losses on call options purchased are included in the Consolidated Statement of Operations as Net realized gain (loss) from and Change in net unrealized appreciation (depreciation) of Investment securities. A risk in buying an option is that the Fund pays a premium whether or not the option is exercised. In addition, there can be no assurance that a liquid secondary market will exist for any option purchased.
| R. | Put Options Purchased and Written – The Fund may purchase and write put options including options on securities indexes, or foreign currency and/or futures contracts. By purchasing a put option, the Fund obtains the right (but not the obligation) to sell the option’s underlying instrument at a fixed strike price. In return for this right, the Fund pays an option premium. The option’s underlying instrument may be a security, securities index, or a futures contract. |
Additionally, the Fund may enter into an option on a swap agreement, also called a “swaption”. A swaption is an option that gives the buyer the right, but not the obligation, to enter into a swap on a future date in exchange for paying a market-based premium. A receiver swaption gives the owner the right to receive the total return of a specified asset, reference rate or index. Swaptions also include options that allow an existing swap to be terminated or extended by one of the Counterparties.
Put options may be used by the Fund to hedge securities it owns by locking in a minimum price at which the Fund can sell. If security prices fall, the put option could be exercised to offset all or a portion of the Fund’s resulting losses. At the same time, because the maximum the Fund has at risk is the cost of the option, purchasing put options does not eliminate the potential for the Fund to profit from an increase in the value of the underlying portfolio securities. The Fund may write put options to earn additional income in the form of option premiums if it expects the price of the underlying instrument to remain stable or rise during the option period so that the option will not be exercised. The risk in this strategy is that the price of the underlying securities may decline by an amount greater than the premium received. Put options written are reported as a liability in the Consolidated Statement of Assets and Liabilities. Realized and unrealized gains and losses on put options purchased and put options written are included in the Consolidated Statement of Operations as Net realized gain (loss) from and Change in net unrealized appreciation (depreciation) of Investment securities and Option contracts written, respectively. A risk in buying an option is that the Fund pays a premium whether or not the option is exercised. In addition, there can be no assurance that a liquid secondary market will exist for any option purchased.
| S. | Swap Agreements – The Fund may enter into various swap transactions, including interest rate, total return, index, currency and credit default swap contracts (“CDS”) for investment purposes or to manage interest rate, currency, commodity or credit risk. Such transactions are agreements between Counterparties. A swap agreement may be negotiated bilaterally and traded over-the-counter (“OTC”) between two parties (“uncleared/OTC”) or, in some instances, must be transacted through a future commission merchant (“FCM”) and cleared through a clearinghouse that serves as a central Counterparty (“centrally cleared swap”). These agreements may contain among other conditions, events of default and termination events, and various covenants and representations such as provisions that require the Fund to maintain a pre-determined level of net assets, and/or provide limits regarding the decline of the Fund’s net asset value (“NAV”) per share over specific periods of time. If the Fund were to trigger such provisions and have open derivative positions at that time, the Counterparty may be able to terminate such agreement and request immediate payment in an amount equal to the net liability positions, if any. |
Interest rate, total return, index, and currency swap agreements are two-party contracts entered into primarily to exchange the returns (or differentials in rates of returns) earned or realized on particular predetermined investments or instruments. The gross returns to be exchanged or “swapped” between the parties are calculated with respect to a notional amount, i.e., the return on or increase in value of a particular dollar amount invested at a particular interest rate or return of an underlying asset, in a particular foreign currency, or in a “basket” of securities representing a particular index.
In a centrally cleared swap, the Fund’s ultimate Counterparty is a central clearinghouse. The Fund initially will enter into centrally cleared swaps through an executing broker. When a fund enters into a centrally cleared swap, it must deliver to the central Counterparty (via the FCM) an amount referred to as “initial margin.” Initial margin requirements are determined by the central Counterparty, but an FCM may require additional initial margin above the amount required by the central Counterparty. Initial margin deposits required upon entering into centrally cleared swaps are satisfied by cash or securities as collateral at the FCM. Securities deposited as initial margin are designated on the Consolidated Schedule of Investments and cash deposited is recorded on the Consolidated Statement of Assets and Liabilities. During the term of a cleared swap agreement, a “variation margin” amount may be required to be paid by the Fund or may be received by the Fund, based on the daily change in price of the underlying reference instrument subject to the swap agreement and is recorded as a receivable or payable for variation margin in the Consolidated Statement of Assets and Liabilities until the centrally cleared swap is terminated at which time a realized gain or loss is recorded.
A CDS is an agreement between Counterparties to exchange the credit risk of an issuer. A buyer of a CDS is said to buy protection by paying a fixed payment over the life of the agreement and in some situations an upfront payment to the seller of the CDS. If a defined credit event occurs (such as payment default or bankruptcy), the Fund as a protection buyer would cease paying its fixed payment, the Fund would deliver eligible bonds issued by the reference entity to the seller, and the seller would pay the full notional value, or the “par value”, of the referenced obligation to the Fund. A seller of a CDS is said to sell protection and
| | |
| 41 | | Invesco Global Strategic Income Fund |
thus would receive a fixed payment over the life of the agreement and an upfront payment, if applicable. If a credit event occurs, the Fund as a protection seller would cease to receive the fixed payment stream, the Fund would pay the buyer “par value” or the full notional value of the referenced obligation, and the Fund would receive the eligible bonds issued by the reference entity. In turn, these bonds may be sold in order to realize a recovery value. Alternatively, the seller of the CDS and its Counterparty may agree to net the notional amount and the market value of the bonds and make a cash payment equal to the difference to the buyer of protection. If no credit event occurs, the Fund receives the fixed payment over the life of the agreement. As the seller, the Fund would effectively add leverage to its portfolio because, in addition to its total net assets, the Fund would be subject to investment exposure on the notional amount of the CDS. In connection with these agreements, cash and securities may be identified as collateral in accordance with the terms of the respective swap agreements to provide assets of value and recourse in the event of default under the swap agreement or bankruptcy/insolvency of a party to the swap agreement. If a Counterparty becomes bankrupt or otherwise fails to perform its obligations due to financial difficulties, the Fund may experience significant delays in obtaining any recovery in a bankruptcy or other reorganization proceeding. The Fund may obtain only limited recovery or may obtain no recovery in such circumstances. The Fund’s maximum risk of loss from Counterparty risk, either as the protection seller or as the protection buyer, is the value of the contract. The risk may be mitigated by having a master netting arrangement between the Fund and the Counterparty and by the designation of collateral by the Counterparty to cover the Fund’s exposure to the Counterparty.
Implied credit spreads represent the current level at which protection could be bought or sold given the terms of the existing CDS contract and serve as an indicator of the current status of the payment/performance risk of the CDS. An implied spread that has widened or increased since entry into the initial contract may indicate a deteriorating credit profile and increased risk of default for the reference entity. A declining or narrowing spread may indicate an improving credit profile or decreased risk of default for the reference entity. Alternatively, credit spreads may increase or decrease reflecting the general tolerance for risk in the credit markets.
An interest rate swap is an agreement between Counterparties pursuant to which the parties exchange a floating rate payment for a fixed rate payment based on a specified notional amount.
A total return swap is an agreement in which one party makes payments based on a set rate, either fixed or variable, while the other party makes payments based on the return of an underlying asset, which includes both the income generated and capital gains, if any. The unrealized appreciation (depreciation) on total return swaps includes dividends on the underlying securities and financing rate payable from the Counterparty. At the maturity date, a net cash flow is exchanged where the total return is equivalent to the return of the underlying reference less a financing rate, if any. As a receiver, the Fund would receive payments based on any positive total return and would owe payments in the event of a negative total return. As the payer, the Fund would owe payments on any net positive total return, and would receive payment in the event of a negative total return.
Changes in the value of centrally cleared and OTC swap agreements are recognized as unrealized gains (losses) in the Consolidated Statement of Operations by “marking to market” on a daily basis to reflect the value of the swap agreement at the end of each trading day. Payments received or paid at the beginning of the agreement are reflected as such on the Consolidated Statement of Assets and Liabilities and may be referred to as upfront payments. The Fund accrues for the fixed payment stream and amortizes upfront payments, if any, on swap agreements on a daily basis with the net amount, recorded as a component of realized gain (loss) on the Consolidated Statement of Operations. A liquidation payment received or made at the termination of a swap agreement is recorded as realized gain (loss) on the Consolidated Statement of Operations. Cash held as collateral is recorded as deposits with brokers on the Consolidated Statement of Assets and Liabilities. Entering into these agreements involves, to varying degrees, lack of liquidity and elements of credit, market, and Counterparty risk in excess of amounts recognized on the Consolidated Statement of Assets and Liabilities. Such risks involve the possibility that a swap is difficult to sell or liquidate; the Counterparty does not honor its obligations under the agreement and unfavorable interest rates and market fluctuations. It is possible that developments in the swaps market, including potential government regulation, could adversely affect the Fund’s ability to terminate existing swap agreements or to realize amounts to be received under such agreements. Additionally, an International Swaps and Derivatives Association Master Agreement (“ISDA Master Agreement”) includes credit related contingent features which allow Counterparties to OTC derivatives to terminate derivative contracts prior to maturity in the event that, for example, the Fund’s net assets decline by a stated percentage or the Fund fails to meet the terms of its ISDA master agreements, which would cause the Fund to accelerate payment of any net liability owed to the Counterparty. A short position in a security poses more risk than holding the same security long. As there is no limit on how much the price of the security can increase, the Fund’s exposure is unlimited.
Notional amounts of each individual credit default swap agreement outstanding as of October 31, 2022, if any, for which the Fund is the seller of protection are disclosed in the open swap agreements table. These potential amounts would be partially offset by any recovery values of the respective referenced obligations, upfront payments received upon entering into the agreement, or net amounts received from the settlement of buy protection credit default swap agreements entered into by the Fund for the same referenced entity or entities.
| T. | Dollar Rolls and Forward Commitment Transactions – The Fund may enter into dollar roll transactions to enhance the Fund’s performance. The Fund executes its dollar roll transactions in the to be announced (“TBA”) market whereby the Fund makes a forward commitment to purchase a security and, instead of accepting delivery, the position is offset by the sale of the security with a simultaneous agreement to repurchase at a future date. |
The Fund accounts for dollar roll transactions as purchases and sales and realizes gains and losses on these transactions. These transactions increase the Fund’s portfolio turnover rate. The Fund will segregate liquid assets in an amount equal to its dollar roll commitments.
Dollar roll transactions involve the risk that a Counterparty to the transaction may fail to complete the transaction. If this occurs, the Fund may lose the opportunity to purchase or sell the security at the agreed upon price. Dollar roll transactions also involve the risk that the value of the securities retained by the Fund may decline below the price of the securities that the Fund has sold but is obligated to purchase under the agreement. Dollar roll transactions covered in this manner are not treated as senior securities for purposes of a Fund’s fundamental investment limitation on senior securities and borrowings.
| U. | LIBOR Risk – The Fund may have investments in financial instruments that utilize the London Interbank Offered Rate (“LIBOR”) as the reference or benchmark rate for variable interest rate calculations. LIBOR is intended to measure the rate generally at which banks can lend and borrow from one another in the relevant currency on an unsecured basis. The UK Financial Conduct Authority (“FCA”), the regulator that oversees LIBOR, announced that the majority of LIBOR rates would cease to be published or would no longer be representative on January 1, 2022. Although the publication of most LIBOR rates ceased at the end of 2021, a selection of widely used USD LIBOR rates continues to be published until June 2023 to allow for an orderly transition away from these rates. |
There remains uncertainty and risks relating to the continuing LIBOR transition and its effects on the Fund and the instruments in which the Fund invests. There can be no assurance that the composition or characteristics of any alternative reference rates (“ARRs”) or financial instruments in which the Fund invests that utilize ARRs will be similar to or produce the same value or economic equivalence as LIBOR or that these instruments will have the same volume or liquidity. Additionally, there remains uncertainty and risks relating to certain “legacy” USD LIBOR instruments that were issued or entered into before December 31, 2021 and the process by which a replacement interest rate will be identified and implemented into these instruments when USD LIBOR is ultimately discontinued. The effects of such uncertainty and risks in “legacy” USD LIBOR instruments held by the Fund could result in losses to the Fund.
| V. | Leverage Risk – Leverage exists when the Fund can lose more than it originally invests because it purchases or sells an instrument or enters into a transaction without investing an amount equal to the full economic exposure of the instrument or transaction. |
| W. | Collateral – To the extent the Fund has designated or segregated a security as collateral and that security is subsequently sold, it is the Fund’s practice to replace such collateral no later than the next business day. |
| | |
| 42 | | Invesco Global Strategic Income Fund |
| X. | Other Risks – The Fund is non-diversified and may invest in securities of fewer issuers than if it were diversified. Thus, the value of the Fund’s shares may vary more widely and the Fund may be subject to greater market and credit risk than if the Fund invested more broadly. |
The Fund may invest in lower-quality debt securities, i.e., “junk bonds”. Investments in lower-rated securities or unrated securities of comparable quality tend to be more sensitive to economic conditions than higher rated securities. Junk bonds involve a greater risk of default by the issuer because such securities are generally unsecured and are often subordinated to other creditors’ claims. Junk bonds are less liquid than investment grade debt securities and their prices tend to be more volatile.
The Fund may invest in obligations issued by agencies and instrumentalities of the U.S. Government that may vary in the level of support they receive from the government. The government may choose not to provide financial support to government sponsored agencies or instrumentalities if it is not legally obligated to do so. In this case, if the issuer defaulted, the Fund may not be able to recover its investment in such issuer from the U.S. Government. Many securities purchased by the Fund are not guaranteed by the U.S. Government. Additionally, from time to time, uncertainty regarding the status of negotiations in the U.S. Government to increase the statutory debt limit, commonly called the “debt ceiling”, could increase the risk that the U.S. Government may default on payments on certain U.S. Government securities, cause the credit rating of the U.S. Government to be downgraded, increase volatility in the stock and bond markets, result in higher interest rates, reduce prices of U.S. Treasury securities, and/or increase the costs of various kinds of debt. If a U.S. Government-sponsored entity is negatively impacted by legislative or regulatory action, is unable to meet its obligations, or its creditworthiness declines, the performance of a Fund that holds securities of that entity will be adversely impacted.
Following Russia’s invasion of Ukraine in late February 2022, various countries, including the United States, as well as NATO and the European Union, issued broad-ranging economic sanctions against Russia and Belarus. The resulting responses to the military actions (and potential further sanctions in response to continued military activity), the potential for military escalation and other corresponding events, have had, and could continue to have, severe negative effects on regional and global economic and financial markets, including increased volatility, reduced liquidity and overall uncertainty. The negative impacts may be particularly acute in certain sectors including, but not limited to, energy and financials. Russia may take additional counter measures or retaliatory actions (including cyberattacks), which could exacerbate negative consequences on global financial markets. The duration of ongoing hostilities and corresponding sanctions and related events cannot be predicted. The foregoing may result in a negative impact on Fund performance and the value of an investment in the Fund, even beyond any direct investment exposure the Fund may have to Russian issuers or the adjoining geographic regions.
| Y. | COVID-19 Risk – The COVID-19 strain of coronavirus has resulted in instances of market closures and dislocations, extreme volatility, liquidity constraints and increased trading costs. Efforts to contain its spread have resulted in travel restrictions, disruptions of healthcare systems, business operations (including business closures) and supply chains, layoffs, lower consumer demand and employee availability, and defaults and credit downgrades, among other significant economic impacts that have disrupted global economic activity across many industries. Such economic impacts may exacerbate other pre-existing political, social and economic risks locally or globally and cause general concern and uncertainty. The full economic impact and ongoing effects of COVID-19 (or other future epidemics or pandemics) at the macro-level and on individual businesses are unpredictable and may result in significant and prolonged effects on the Fund’s performance. |
NOTE 2–Advisory Fees and Other Fees Paid to Affiliates
The Trust has entered into a master investment advisory agreement with the Adviser. Under the terms of the investment advisory agreement, the Fund accrues daily and pays monthly an advisory fee to the Adviser based on the annual rate of the Fund’s average daily net assets as follows:
| | | | |
| Average Daily Net Assets | | Rate* | |
|
| |
First $200 million | | | 0.750% | |
|
| |
Next $200 million | | | 0.720% | |
|
| |
Next $200 million | | | 0.690% | |
|
| |
Next $200 million | | | 0.660% | |
|
| |
Next $200 million | | | 0.600% | |
|
| |
Next $4 billion | | | 0.500% | |
|
| |
Next $5 billion | | | 0.480% | |
|
| |
Over $10 billion | | | 0.460% | |
|
| |
| * | The advisory fee paid by the Fund shall be reduced by any amounts paid by the Fund under the administrative services agreement with the Adviser. |
For the year ended October 31, 2022, the effective advisory fee rate incurred by the Fund was 0.58%.
The Subsidiary has entered into a separate contract with the Adviser whereby the Adviser provides investment advisory and other services to the Subsidiary. In consideration of these services, the Subsidiary pays an advisory fee to the Adviser based on the annual rate of the Subsidiary’s average daily net assets as set forth in the table above.
Under the terms of a master sub-advisory agreement between the Adviser and each of Invesco Asset Management Deutschland GmbH, Invesco Asset Management Limited, Invesco Asset Management (Japan) Limited, Invesco Hong Kong Limited, Invesco Senior Secured Management, Inc. and Invesco Canada Ltd. and separate sub-advisory agreements with Invesco Capital Management LLC, and Invesco Asset Management (India) Private Limited (collectively, the “Affiliated Sub-Advisers”) the Adviser, not the Fund, will pay 40% of the fees paid to the Adviser to any such Affiliated Sub-Adviser(s) that provide(s) discretionary investment management services to the Fund based on the percentage of assets allocated to such Affiliated Sub-Adviser(s). Invesco has also entered into a Sub-Advisory Agreement with OppenheimerFunds, Inc. to provide discretionary management services to the Fund.
The Adviser has contractually agreed, through at least June 30, 2023, to waive advisory fees and/or reimburse expenses to the extent necessary to limit total annual fund operating expenses after fee waiver and/or expense reimbursement (excluding certain items discussed below) of Class A, Class C, Class R, Class Y, Class R5 and Class R6 shares to 1.50%, 2.25%, 1.75%, 1.25%, 1.25% and 1.25%, respectively, of the Fund’s average daily net assets (the “expense limits”). In determining the Adviser’s obligation to waive advisory fees and/or reimburse expenses, the following expenses are not taken into account, and could cause total annual fund operating expenses after fee waiver and/or expense reimbursement to exceed the numbers reflected above: (1) interest; (2) taxes; (3) dividend expense on short sales; (4) extraordinary or non-routine items, including litigation expenses; and (5) expenses that the Fund has incurred but did not actually pay because of an expense offset arrangement. Acquired Fund Fees and Expenses are not operating expenses of a Fund directly, but are fees and expenses, including management fees, of the investment companies in which a Fund invests. As a result, the total annual fund operating expenses after expense reimbursement may exceed the expense limits above. Unless Invesco continues the fee waiver agreement, it will terminate on June 30, 2023. During its term, the fee waiver agreement cannot be terminated or amended to increase the expense limits or reduce the advisory fee waiver without approval of the Board of Trustees. The Adviser did not waive fees and/or reimburse expenses during the period under these expense limits.
Further, the Adviser has contractually agreed, through at least June 30, 2024, to waive the advisory fee payable by the Fund in an amount equal to 100% of the net advisory fees the Adviser receives from the affiliated money market funds on investments by the Fund of uninvested cash (excluding investments of cash collateral from securities lending) in such affiliated money market funds.
| | |
| 43 | | Invesco Global Strategic Income Fund |
For the year ended October 31, 2022, the Adviser waived advisory fees of $351,758.
The Trust has entered into a master administrative services agreement with Invesco pursuant to which the Fund has agreed to pay Invesco for certain administrative costs incurred in providing accounting services to the Fund. For the year ended October 31, 2022, expenses incurred under the agreement are shown in the Consolidated Statement of Operations as Administrative services fees. Invesco has entered into a sub-administration agreement whereby State Street Bank and Trust Company (“SSB”) serves as fund accountant and provides certain administrative services to the Fund. Pursuant to a custody agreement with the Trust on behalf of the Fund, SSB also serves as the Fund’s custodian.
The Trust has entered into a transfer agency and service agreement with Invesco Investment Services, Inc. (“IIS”) pursuant to which the Fund has agreed to pay IIS a fee for providing transfer agency and shareholder services to the Fund and reimburse IIS for certain expenses incurred by IIS in the course of providing such services. IIS may make payments to intermediaries that provide omnibus account services, sub-accounting services and/or networking services. All fees payable by IIS to intermediaries that provide omnibus account services or sub-accounting services are charged back to the Fund, subject to certain limitations approved by the Trust’s Board of Trustees. For the year ended October 31, 2022, expenses incurred under the agreement are shown in the Consolidated Statement of Operations as Transfer agent fees.
The Trust has entered into master distribution agreements with Invesco Distributors, Inc. (“IDI”) to serve as the distributor for the Class A, Class C, Class R, Class Y, Class R5 and Class R6 shares of the Fund. The Trust has adopted plans pursuant to Rule 12b-1 under the 1940 Act with respect to the Fund’s Class A, Class C and Class R shares (collectively, the “Plans”). The Fund, pursuant to the Class A Plan, reimburses IDI for its allocated share of expenses incurred for the period, up to a maximum annual rate of 0.25% of the average daily net assets of Class A shares. The Fund, pursuant to the Class C and Class R Plans, pays IDI compensation at the annual rate of 1.00% of the average daily net assets of Class C shares and 0.50% of the average daily net assets of Class R shares. The fees are accrued daily and paid monthly. Of the Plan payments, up to 0.25% of the average daily net assets of each class of shares may be paid to furnish continuing personal shareholder services to customers who purchase and own shares of such classes. Any amounts not paid as a service fee under the Plans would constitute an asset-based sales charge. Rules of the Financial Industry Regulatory Authority (“FINRA”) impose a cap on the total sales charges, including asset-based sales charges, that may be paid by any class of shares of the Fund. For the year ended October 31, 2022, expenses incurred under the Plans are shown in the Consolidated Statement of Operations as Distribution fees.
Front-end sales commissions and CDSC (collectively, the “sales charges”) are not recorded as expenses of the Fund. Front-end sales commissions are deducted from proceeds from the sales of Fund shares prior to investment in Class A shares of the Fund. CDSC are deducted from redemption proceeds prior to remittance to the shareholder. During the year ended October 31, 2022, IDI advised the Fund that IDI retained $55,938 in front-end sales commissions from the sale of Class A shares and $97 and $2,883 from Class A and Class C shares, respectively, for CDSC imposed upon redemptions by shareholders.
Certain officers and trustees of the Trust are officers and directors of the Adviser, IIS and/or IDI.
NOTE 3–Additional Valuation Information
GAAP defines fair value as the price that would be received to sell an asset or paid to transfer a liability in an orderly transaction between market participants at the measurement date, under current market conditions. GAAP establishes a hierarchy that prioritizes the inputs to valuation methods, giving the highest priority to readily available unadjusted quoted prices in an active market for identical assets (Level 1) and the lowest priority to significant unobservable inputs (Level 3), generally when market prices are not readily available. Based on the valuation inputs, the securities or other investments are tiered into one of three levels. Changes in valuation methods may result in transfers in or out of an investment’s assigned level:
| | |
| Level 1 - | | Prices are determined using quoted prices in an active market for identical assets. |
| Level 2 - | | Prices are determined using other significant observable inputs. Observable inputs are inputs that other market participants may use in pricing a security. These may include quoted prices for similar securities, interest rates, prepayment speeds, credit risk, yield curves, loss severities, default rates, discount rates, volatilities and others. |
| Level 3 - | | Prices are determined using significant unobservable inputs. In situations where quoted prices or observable inputs are unavailable (for example, when there is little or no market activity for an investment at the end of the period), unobservable inputs may be used. Unobservable inputs reflect the Adviser’s assumptions about the factors market participants would use in determining fair value of the securities or instruments and would be based on the best available information. |
The following is a summary of the tiered valuation input levels, as of October 31, 2022. The level assigned to the securities valuations may not be an indication of the risk or liquidity associated with investing in those securities. Because of the inherent uncertainties of valuation, the values reflected in the consolidated financial statements may materially differ from the value received upon actual sale of those investments.
| | | | | | | | | | | | | | | | | | | | | | | | | | | | |
| | | Level 1 | | | | | | Level 2 | | | | | | Level 3 | | | | | | Total | |
|
| |
Investments in Securities | | | | | | | | | | | | | | | | | | | | | | | | | | | | |
|
| |
U.S. Dollar Denominated Bonds & Notes | | $ | – | | | | | | | $ | 690,856,024 | | | | | | | | $ – | | | | | | | $ | 690,856,024 | |
|
| |
Non–U.S. Dollar Denominated Bonds & Notes | | | – | | | | | | | | 473,303,907 | | | | | | | | – | | | | | | | | 473,303,907 | |
|
| |
Asset–Backed Securities | | | – | | | | | | | | 143,267,587 | | | | | | | | 1,985,430 | | | | | | | | 145,253,017 | |
|
| |
Agency Credit Risk Transfer Notes | | | – | | | | | | | | 36,565,208 | | | | | | | | – | | | | | | | | 36,565,208 | |
|
| |
Common Stocks & Other Equity Interests | | | 14,781,328 | | | | | | | | 455,718 | | | | | | | | 3,113,319 | | | | | | | | 18,350,365 | |
|
| |
U.S. Treasury Securities | | | – | | | | | | | | 14,449,266 | | | | | | | | – | | | | | | | | 14,449,266 | |
|
| |
Variable Rate Senior Loan Interests | | | – | | | | | | | | 8,255,771 | | | | | | | | – | | | | | | | | 8,255,771 | |
|
| |
U.S. Government Sponsored Agency Mortgage–Backed Securities | | | – | | | | | | | | 5,629,363 | | | | | | | | – | | | | | | | | 5,629,363 | |
|
| |
Preferred Stocks | | | – | | | | | | | | 3,098,912 | | | | | | | | 49,725 | | | | | | | | 3,148,637 | |
|
| |
Money Market Funds | | | 89,483,459 | | | | | | | | 65,042,340 | | | | | | | | – | | | | | | | | 154,525,799 | |
|
| |
Options Purchased | | | – | | | | | | | | 59,267,377 | | | | | | | | – | | | | | | | | 59,267,377 | |
|
| |
Total Investments in Securities | | | 104,264,787 | | | | | | | | 1,500,191,473 | | | | | | | | 5,148,474 | | | | | | | | 1,609,604,734 | |
|
| |
| | | | | | | |
Other Investments – Assets* | | | | | | | | | | | | | | | | | | | | | | | | | | | | |
|
| |
Futures Contracts | | | 6,921,871 | | | | | | | | – | | | | | | | | – | | | | | | | | 6,921,871 | |
|
| |
Forward Foreign Currency Contracts | | | – | | | | | | | | 38,138,209 | | | | | | | | – | | | | | | | | 38,138,209 | |
|
| |
Swap Agreements | | | – | | | | | | | | 25,668,727 | | | | | | | | – | | | | | | | | 25,668,727 | |
|
| |
| | | 6,921,871 | | | | | | | | 63,806,936 | | | | | | | | – | | | | | | | | 70,728,807 | |
|
| |
| | |
| 44 | | Invesco Global Strategic Income Fund |
| | | | | | | | | | | | | | | | | | | | | | | | | | | | |
| | | Level 1 | | | | | | Level 2 | | | | | | Level 3 | | | | | | Total | |
|
| |
Other Investments - Liabilities* | | | | | | | | | | | | | | | | | | | | | | | | | | | | |
|
| |
Futures Contracts | | $ | (10,034,670 | ) | | | | | | $ | – | | | | | | | | $ – | | | | | | | $ | (10,034,670 | ) |
|
| |
Forward Foreign Currency Contracts | | | – | | | | | | | | (42,569,438 | ) | | | | | | | – | | | | | | | | (42,569,438 | ) |
|
| |
Options Written | | | – | | | | | | | | (102,504,838 | ) | | | | | | | – | | | | | | | | (102,504,838 | ) |
|
| |
Swap Agreements | | | – | | | | | | | | (40,137,912 | ) | | | | | | | – | | | | | | | | (40,137,912 | ) |
|
| |
| | | (10,034,670 | ) | | | | | | | (185,212,188 | ) | | | | | | | – | | | | | | | | (195,246,858 | ) |
|
| |
Total Other Investments | | | (3,112,799 | ) | | | | | | | (121,405,252 | ) | | | | | | | – | | | | | | | | (124,518,051 | ) |
|
| |
Total Investments | | $ | 101,151,988 | | | | | | | $ | 1,378,786,221 | | | | | | | | $5,148,474 | | | | | | | $ | 1,485,086,683 | |
|
| |
| * | Forward foreign currency contracts, futures contracts and swap agreements are valued at unrealized appreciation (depreciation). Options written are shown at value. |
NOTE 4–Derivative Investments
The Fund may enter into an ISDA Master Agreement under which a fund may trade OTC derivatives. An OTC transaction entered into under an ISDA Master Agreement typically involves a collateral posting arrangement, payment netting provisions and close-out netting provisions. These netting provisions allow for reduction of credit risk through netting of contractual obligations. The enforceability of the netting provisions of the ISDA Master Agreement depends on the governing law of the ISDA Master Agreement, among other factors.
For financial reporting purposes, the Fund does not offset OTC derivative assets or liabilities that are subject to ISDA Master Agreements in the Consolidated Statement of Assets and Liabilities.
Value of Derivative Investments at Period-End
The table below summarizes the value of the Fund’s derivative investments, detailed by primary risk exposure, held as of October 31, 2022:
| | | | | | | | | | | | | | | | | | | | | | | | | | | | |
| | | Value | |
| | | Credit | | | | | | Currency | | | | | | Interest | | | | | | | |
| Derivative Assets | | Risk | | | | | | Risk | | | | | | Rate Risk | | | | | | Total | |
|
| |
Unrealized appreciation on futures contracts – Exchange-Traded(a) | | $ | – | | | | | | | $ | – | | | | | | | $ | 6,921,871 | | | | | | | $ | 6,921,871 | |
|
| |
Unrealized appreciation on swap agreements – Centrally Cleared(a) | | | 208,800 | | | | | | | | – | | | | | | | | 24,703,930 | | | | | | | | 24,912,730 | |
|
| |
Unrealized appreciation on forward foreign currency contracts outstanding | | | – | | | | | | | | 38,138,209 | | | | | | | | – | | | | | | | | 38,138,209 | |
|
| |
Unrealized appreciation on swap agreements – OTC | | | 544,337 | | | | | | | | – | | | | | | | | 211,660 | | | | | | | | 755,997 | |
|
| |
Options purchased, at value – OTC(b) | | | 1,602,837 | | | | | | | | 10,619,502 | | | | | | | | 47,045,038 | | | | | | | | 59,267,377 | |
|
| |
Total Derivative Assets | | | 2,355,974 | | | | | | | | 48,757,711 | | | | | | | | 78,882,499 | | | | | | | | 129,996,184 | |
|
| |
Derivatives not subject to master netting agreements | | | (208,800 | ) | | | | | | | – | | | | | | | | (31,625,801 | ) | | | | | | | (31,834,601 | ) |
|
| |
Total Derivative Assets subject to master netting agreements | | $ | 2,147,174 | | | | | | | $ | 48,757,711 | | | | | | | $ | 47,256,698 | | | | | | | $ | 98,161,583 | |
|
| |
| | | | | | | | | | | | | | | | | | | | | | | | | | | | |
| | | Value | |
| | | Credit | | | | | | Currency | | | | | | Interest | | | | | | | |
| Derivative Liabilities | | Risk | | | | | | Risk | | | | | | Rate Risk | | | | | | Total | |
|
| |
Unrealized depreciation on futures contracts – Exchange-Traded(a) | | $ | – | | | | | | | $ | – | | | | | | | $ | (10,034,670 | ) | | | | | | $ | (10,034,670 | ) |
|
| |
Unrealized depreciation on swap agreements – Centrally Cleared(a) | | | (146,931 | ) | | | | | | | – | | | | | | | | (35,645,456 | ) | | | | | | | (35,792,387 | ) |
|
| |
Unrealized depreciation on forward foreign currency contracts outstanding | | | – | | | | | | | | (42,569,438 | ) | | | | | | | – | | | | | | | | (42,569,438 | ) |
|
| |
Unrealized depreciation on swap agreements – OTC | | | (4,345,525 | ) | | | | | | | – | | | | | | | | – | | | | | | | | (4,345,525 | ) |
|
| |
Options written, at value – OTC | | | (1,021,775 | ) | | | | | | | (8,557,721 | ) | | | | | | | (92,925,342 | ) | | | | | | | (102,504,838 | ) |
|
| |
Total Derivative Liabilities | | | (5,514,231 | ) | | | | | | | (51,127,159 | ) | | | | | | | (138,605,468 | ) | | | | | | | (195,246,858 | ) |
|
| |
Derivatives not subject to master netting agreements | | | 146,931 | | | | | | | | – | | | | | | | | 45,680,126 | | | | | | | | 45,827,057 | |
|
| |
Total Derivative Liabilities subject to master netting agreements | | $ | (5,367,300 | ) | | | | | | $ | (51,127,159 | ) | | | | | | $ | (92,925,342 | ) | | | | | | $ | (149,419,801 | ) |
|
| |
| (a) | The daily variation margin receivable (payable) at period-end is recorded in the Consolidated Statement of Assets and Liabilities. |
| (b) | Options purchased, at value as reported in the Consolidated Schedule of Investments. |
| | |
| 45 | | Invesco Global Strategic Income Fund |
Offsetting Assets and Liabilities
The table below reflects the Fund’s exposure to Counterparties subject to either an ISDA Master Agreement or other agreement for OTC derivative transactions as of October 31, 2022.
| | | | | | | | | | | | | | | | | | | | | | | | | | | | | | | | | | | | | | | | | | | | | | |
| | | Financial Derivative Assets | | | Financial Derivative Liabilities | | | Collateral (Received)/Pledged | |
| Counterparty | | Forward
Foreign
Currency
Contracts | | | Options
Purchased | | | Swap
Agreements | | | Total
Assets | | | Forward
Foreign
Currency
Contracts | | | Options
Written | | | Swap
Agreements | | | Total
Liabilities | | | Net Value of
Derivatives | | | Non-Cash | | Cash | | | Net
Amount | |
|
| |
Bank of America, N.A. | | $ | 11,064,359 | | | $ | 2,221,802 | | | $ | 218,272 | | | $ | 13,504,433 | | | $ | (14,500,576 | ) | | $ | (9,199,152 | ) | | $ | – | | | $ | (23,699,728 | ) | | $ | (10,195,295 | ) | | $– | | $ | 9,330,000 | | | $ | (865,295 | ) |
|
| |
Barclays Bank PLC | | | – | | | | – | | | | – | | | | – | | | | – | | | | (261,048 | ) | | | – | | | | (261,048 | ) | | | (261,048 | ) | | – | | | 261,048 | | | | – | |
|
| |
BNP Paribas S.A. | | | – | | | | – | | | | – | | | | – | | | | (650,240 | ) | | | – | | | | – | | | | (650,240 | ) | | | (650,240 | ) | | – | | | – | | | | (650,240 | ) |
|
| |
Citibank, N.A. | | | 9,402,244 | | | | – | | | | 4,299 | | | | 9,406,543 | | | | (9,890,374 | ) | | | – | | | | (28,185 | ) | | | (9,918,559 | ) | | | (512,016 | ) | | – | | | – | | | | (512,016 | ) |
|
| |
Deutsche Bank AG | | | 4,041,575 | | | | – | | | | – | | | | 4,041,575 | | | | (1,686,725 | ) | | | – | | | | – | | | | (1,686,725 | ) | | | 2,354,850 | | | – | | | – | | | | 2,354,850 | |
|
| |
Goldman Sachs International | | | 6,440,190 | | | | 5,060,377 | | | | 361,675 | | | | 11,862,242 | | | | (3,139,336 | ) | | | (34,500,646 | ) | | | (2,140,245 | ) | | | (39,780,227 | ) | | | (27,917,985 | ) | | – | | | 26,040,000 | | | | (1,877,985 | ) |
|
| |
J.P. Morgan Chase Bank, N.A. | | | 3,430,496 | | | | 13,106,799 | | | | 988,815 | | | | 17,526,110 | | | | (6,526,277 | ) | | | (30,917,711 | ) | | | (2,191,425 | ) | | | (39,635,413 | ) | | | (22,109,303 | ) | | – | | | 21,069,000 | | | | (1,040,303 | ) |
|
| |
Morgan Stanley and Co. International PLC | | | 3,507,914 | | | | 38,663,583 | | | | – | | | | 42,171,497 | | | | (5,278,498 | ) | | | (27,626,281 | ) | | | – | | | | (32,904,779 | ) | | | 9,266,718 | | | – | | | – | | | | 9,266,718 | |
|
| |
Royal Bank of Canada | | | 251,431 | | | | – | | | | – | | | | 251,431 | | | | (206,038 | ) | | | – | | | | – | | | | (206,038 | ) | | | 45,393 | | | – | | | – | | | | 45,393 | |
|
| |
Standard Chartered Bank PLC | | | – | | | | 214,816 | | | | – | | | | 214,816 | | | | (691,374 | ) | | | – | | | | – | | | | (691,374 | ) | | | (476,558 | ) | | – | | | 476,558 | | | | – | |
|
| |
Total | | $ | 38,138,209 | | | $ | 59,267,377 | | | $ | 1,573,061 | | | $ | 98,978,647 | | | $ | (42,569,438 | ) | | $ | (102,504,838 | ) | | $ | (4,359,855 | ) | | $ | (149,434,131 | ) | | $ | (50,455,484 | ) | | $– | | $ | 57,176,606 | | | $ | 6,721,122 | |
|
| |
Effect of Derivative Investments for the year ended October 31, 2022
The table below summarizes the gains (losses) on derivative investments, detailed by primary risk exposure, recognized in earnings during the period:
| | | | | | | | | | | | | | | | |
| | | Location of Gain (Loss) on
Consolidated Statement of Operations | |
| | | Credit Risk | | | Currency Risk | | | Interest
Rate Risk | | | Total | |
|
| |
Realized Gain (Loss): | | | | | | | | | | | | | | | | |
Forward foreign currency contracts | | $ | - | | | $ | 38,541,637 | | | $ | - | | | $ | 38,541,637 | |
|
| |
Futures contracts | | | - | | | | - | | | | 36,133,710 | | | | 36,133,710 | |
|
| |
Options purchased(a) | | | - | | | | (8,877,059 | ) | | | 732,046 | | | | (8,145,013 | ) |
|
| |
Options written | | | - | | | | (13,790,609 | ) | | | 12,383,161 | | | | (1,407,448 | ) |
|
| |
Swap agreements | | | 7,501,870 | | | | - | | | | (114,558,507 | ) | | | (107,056,637 | ) |
|
| |
Change in Net Unrealized Appreciation (Depreciation): | | | | | | | | | | | | | | | | |
Forward foreign currency contracts | | | - | | | | (21,029,010 | ) | | | - | | | | (21,029,010 | ) |
|
| |
Futures contracts | | | - | | | | - | | | | (2,634,316 | ) | | | (2,634,316 | ) |
|
| |
Options purchased(a) | | | 991,611 | | | | 2,869,654 | | | | 26,708,542 | | | | 30,569,807 | |
|
| |
Options written | | | (779,196 | ) | | | 1,688,762 | | | | (19,837,116 | ) | | | (18,927,550 | ) |
|
| |
Swap agreements | | | (4,705,492 | ) | | | - | | | | 7,101,997 | | | | 2,396,505 | |
|
| |
Total | | $ | 3,008,793 | | | $ | (596,625 | ) | | $ | (53,970,483 | ) | | $ | (51,558,315 | ) |
|
| |
| (a) | Options purchased are included in the net realized gain (loss) from investment securities and the change in net unrealized appreciation (depreciation) of investment securities. |
The table below summarizes the average notional value of derivatives held during the period.
| | | | | | | | | | | | | | | | | | | | | | | | | | | | |
| | | Forward
Foreign Currency
Contracts | | | Futures
Contracts | | | Swaptions
Purchased | | | Foreign
Currency
Options
Purchased | | | Swaptions
Written | | | Foreign
Currency
Options
Written | | | Swap
Agreements | |
|
| |
Average notional value | | $ | 3,054,583,670 | | | $ | 497,559,898 | | | $ | 426,658,287 | | | $ | 775,621,446 | | | $ | 3,338,589,492 | | | $ | 491,735,640 | | | $ | 2,103,439,566 | |
|
| |
NOTE 5—Expense Offset Arrangement(s)
The expense offset arrangement is comprised of transfer agency credits which result from balances in demand deposit accounts used by the transfer agent for clearing shareholder transactions. For the year ended October 31, 2022, the Fund received credits from this arrangement, which resulted in the reduction of the Fund’s total expenses of $16,896.
| | |
| 46 | | Invesco Global Strategic Income Fund |
NOTE 6–Trustees’ and Officers’ Fees and Benefits
Trustees’ and Officers’ Fees and Benefits include amounts accrued by the Fund to pay remuneration to certain Trustees and Officers of the Fund. Trustees have the option to defer compensation payable by the Fund, and Trustees’ and Officers’ Fees and Benefits also include amounts accrued by the Fund to fund such deferred compensation amounts. Those Trustees who defer compensation have the option to select various Invesco Funds in which their deferral accounts shall be deemed to be invested. Finally, certain current Trustees were eligible to participate in a retirement plan that provided for benefits to be paid upon retirement to Trustees over a period of time based on the number of years of service. The Fund may have certain former Trustees who also participate in a retirement plan and receive benefits under such plan. Trustees’ and Officers’ Fees and Benefits include amounts accrued by the Fund to fund such retirement benefits. Obligations under the deferred compensation and retirement plans represent unsecured claims against the general assets of the Fund.
NOTE 7–Cash Balances
The Fund is permitted to temporarily carry a negative or overdrawn balance in its account with SSB, the custodian bank. Such balances, if any at period-end, are shown in the Consolidated Statement of Assets and Liabilities under the payable caption Amount due custodian. To compensate the custodian bank for such overdrafts, the overdrawn Fund may either (1) leave funds as a compensating balance in the account so the custodian bank can be compensated by earning the additional interest; or (2) compensate by paying the custodian bank at a rate agreed upon by the custodian bank and Invesco, not to exceed the contractually agreed upon rate. The Fund may not purchase additional securities when any borrowings from banks or broker-dealers exceed 5% of the Fund’s total assets, or when any borrowings from an Invesco Fund are outstanding.
NOTE 8–Distributions to Shareholders and Tax Components of Net Assets
Tax Character of Distributions to Shareholders Paid During the Fiscal Years Ended October 31, 2022 and 2021:
| | | | | | | | | | | | |
| | | 2022 | | | | | | 2021 | |
|
| |
Ordinary income* | | $ | – | | | | | | | $ | 30,559,392 | |
|
| |
Return of capital | | | 63,390,742 | | | | | | | | 35,409,013 | |
|
| |
Total distributions | | $ | 63,390,742 | | | | | | | $ | 65,968,405 | |
|
| |
| * | Includes short-term capital gain distributions, if any. |
Tax Components of Net Assets at Period-End:
| | | | |
| | | 2022 | |
|
| |
Net unrealized appreciation (depreciation) – investments | | $ | (298,098,625 | ) |
|
| |
Net unrealized appreciation (depreciation) – foreign currencies | | | (912,727 | ) |
|
| |
Temporary book/tax differences | | | (359,953 | ) |
|
| |
Capital loss carryforward | | | (887,545,967 | ) |
|
| |
Shares of beneficial interest | | | 2,835,150,382 | |
|
| |
Total net assets | | $ | 1,648,233,110 | |
|
| |
The difference between book-basis and tax-basis unrealized appreciation (depreciation) is due to differences in the timing of recognition of gains and losses on investments for tax and book purposes. The Fund’s net unrealized appreciation (depreciation) difference is attributable primarily to derivative instruments, partnerships, straddles, amortization and accretion on debt securities.
The temporary book/tax differences are a result of timing differences between book and tax recognition of income and/or expenses. The Fund’s temporary book/tax differences are the result of the trustee deferral of compensation and retirement plan benefits.
Capital loss carryforward is calculated and reported as of a specific date. Results of transactions and other activity after that date may affect the amount of capital loss carryforward actually available for the Fund to utilize. The ability to utilize capital loss carryforward in the future may be limited under the Internal Revenue Code and related regulations based on the results of future transactions.
The Fund has a capital loss carryforward as of October 31, 2022, as follows:
| | | | | | | | | | | | |
Capital Loss Carryforward* | |
| Expiration | | Short-Term | | | Long-Term | | | Total | |
|
| |
Not subject to expiration | | | $518,098,653 | | | | $369,447,314 | | | | $887,545,967 | |
|
| |
| * | Capital loss carryforward is reduced for limitations, if any, to the extent required by the Internal Revenue Code and may be further limited depending upon a variety of factors, including the realization of net unrealized gains or losses as of the date of any reorganization. |
NOTE 9–Investment Transactions
The aggregate amount of investment securities (other than short-term securities, U.S. Government obligations and money market funds, if any) purchased and sold by the Fund during the year ended October 31, 2022 was $1,262,095,393 and $1,590,847,745, respectively. Cost of investments, including any derivatives, on a tax basis includes the adjustments for financial reporting purposes as of the most recently completed federal income tax reporting period-end.
| | | | |
Unrealized Appreciation (Depreciation) of Investments on a Tax Basis | |
Aggregate unrealized appreciation of investments | | $ | 145,371,840 | |
|
| |
Aggregate unrealized (depreciation) of investments | | | (443,470,465 | ) |
|
| |
Net unrealized appreciation (depreciation) of investments | | $ | (298,098,625 | ) |
|
| |
Cost of investments for tax purposes is $1,789,467,171.
| | |
| 47 | | Invesco Global Strategic Income Fund |
NOTE 10–Reclassification of Permanent Differences
Primarily as a result of differing book/tax treatment of foreign currency transactions, net operating losses and return of capital distributions, on October 31, 2022, undistributed net investment income was increased by $30,583,564, undistributed net realized gain (loss) was increased by $93,871,486 and shares of beneficial interest was decreased by $124,455,050. This reclassification had no effect on the net assets of the Fund.
NOTE 11–Share Information
| | | | | | | | | | | | | | | | |
| | | Summary of Share Activity | |
|
| |
| | |
| | | Year ended | | | Year ended | |
| | | October 31, 2022(a) | | | October 31, 2021 | |
| | | Shares | | | Amount | | | Shares | | | Amount | |
|
| |
Sold: | | | | | | | | | | | | | | | | |
Class A | | | 13,995,663 | | | $ | 46,075,249 | | | | 20,863,492 | | | $ | 77,179,461 | |
|
| |
Class C | | | 1,981,985 | | | | 6,501,825 | | | | 2,783,504 | | | | 10,254,185 | |
|
| |
Class R | | | 2,169,448 | | | | 7,151,175 | | | | 2,586,094 | | | | 9,566,017 | |
|
| |
Class Y | | | 18,495,604 | | | | 63,481,249 | | | | 9,009,632 | | | | 33,154,213 | |
|
| |
Class R6 | | | 1,035,855 | | | | 3,362,129 | | | | 2,402,163 | | | | 8,955,150 | |
|
| |
| | | | |
Issued as reinvestment of dividends: | | | | | | | | | | | | | | | | |
Class A | | | 14,040,687 | | | | 44,995,175 | | | | 12,530,450 | | | | 46,049,135 | |
|
| |
Class C | | | 431,954 | | | | 1,381,234 | | | | 435,507 | | | | 1,597,225 | |
|
| |
Class R | | | 551,262 | | | | 1,767,204 | | | | 473,313 | | | | 1,740,994 | |
|
| |
Class Y | | | 1,018,630 | | | | 3,265,663 | | | | 1,030,851 | | | | 3,786,930 | |
|
| |
Class R6 | | | 134,665 | | | | 433,369 | | | | 160,580 | | | | 587,476 | |
|
| |
| | | | |
Automatic conversion of Class C shares to Class A shares: | | | | | | | | | | | | | | | | |
Class A | | | 3,023,398 | | | | 9,784,129 | | | | 16,627,596 | | | | 62,391,544 | |
|
| |
Class C | | | (3,032,222 | ) | | | (9,784,129 | ) | | | (16,673,698 | ) | | | (62,391,544 | ) |
|
| |
| | | | |
Reacquired: | | | | | | | | | | | | | | | | |
Class A | | | (97,664,404 | ) | | | (320,107,765 | ) | | | (110,699,267 | ) | | | (408,419,437 | ) |
|
| |
Class C | | | (4,736,373 | ) | | | (15,537,428 | ) | | | (7,693,690 | ) | | | (28,371,254 | ) |
|
| |
Class R | | | (4,586,861 | ) | | | (15,033,949 | ) | | | (5,305,908 | ) | | | (19,659,970 | ) |
|
| |
Class Y | | | (27,744,639 | ) | | | (92,959,071 | ) | | | (22,140,461 | ) | | | (81,689,605 | ) |
|
| |
Class R6 | | | (2,888,897 | ) | | | (9,097,693 | ) | | | (3,079,741 | ) | | | (11,261,723 | ) |
|
| |
Net increase (decrease) in share activity | | | (83,774,245 | ) | | $ | (274,321,634 | ) | | | (96,689,583 | ) | | $ | (356,531,203 | ) |
|
| |
| (a) | There are entities that are record owners of more than 5% of the outstanding shares of the Fund and in the aggregate own 13% of the outstanding shares of the Fund. IDI has an agreement with these entities to sell Fund shares. The Fund, Invesco and/or Invesco affiliates may make payments to these entities, which are considered to be related to the Fund, for providing services to the Fund, Invesco and/or Invesco affiliates including but not limited to services such as securities brokerage, distribution, third party record keeping and account servicing. The Fund has no knowledge as to whether all or any portion of the shares owned of record by these entities are also owned beneficially. |
| | |
| 48 | | Invesco Global Strategic Income Fund |
Report of Independent Registered Public Accounting Firm
To the Board of Trustees of AIM Investment Funds (Invesco Investment Funds) and Shareholders of Invesco Global Strategic Income Fund
Opinion on the Consolidated Financial Statements
We have audited the accompanying consolidated statement of assets and liabilities, including the consolidated schedule of investments, of Invesco Global Strategic Income Fund and its subsidiary (one of the funds constituting AIM Investment Funds (Invesco Investment Funds), referred to hereafter as the “Fund”) as of October 31, 2022, the related consolidated statement of operations for the year ended October 31, 2022, the consolidated statement of changes in net assets for each of the two years in the period ended October 31, 2022, including the related notes, and the consolidated financial highlights for each of the periods indicated in the table below (collectively referred to as the “consolidated financial statements”). In our opinion, the consolidated financial statements present fairly, in all material respects, the financial position of the Fund as of October 31, 2022, the results of its operations for the year then ended, the changes in its net assets for each of the two years in the period ended October 31, 2022 and the financial highlights for each of the periods indicated in the table below, in conformity with accounting principles generally accepted in the United States of America.
|
| Consolidated Financial Highlights |
For each of the three years in the period ended October 31, 2022, the one month ended October 31, 2019, and the year ended September 30, 2019 for Class A, Class C, Class R, Class Y and Class R6. For each of the three years in the period ended October 31, 2022, the one month ended October 31, 2019, and the period May 24, 2019 (commencement of operations) through September 30, 2019 for Class R5. |
The consolidated financial statements of Oppenheimer Global Strategic Income Fund (subsequently renamed Invesco Global Strategic Income Fund) as of and for the year ended September 30, 2018 and the consolidated financial highlights for the year then ended (not presented herein, other than the consolidated financial highlights) were audited by other auditors whose report dated November 28, 2018 expressed an unqualified opinion on those consolidated financial statements and consolidated financial highlights.
Basis for Opinion
These consolidated financial statements are the responsibility of the Fund’s management. Our responsibility is to express an opinion on the Fund’s consolidated financial statements based on our audits. We are a public accounting firm registered with the Public Company Accounting Oversight Board (United States) (PCAOB) and are required to be independent with respect to the Fund in accordance with the U.S. federal securities laws and the applicable rules and regulations of the Securities and Exchange Commission and the PCAOB.
We conducted our audits of these consolidated financial statements in accordance with the standards of the PCAOB. Those standards require that we plan and perform the audit to obtain reasonable assurance about whether the consolidated financial statements are free of material misstatement, whether due to error or fraud.
Our audits included performing procedures to assess the risks of material misstatement of the consolidated financial statements, whether due to error or fraud, and performing procedures that respond to those risks. Such procedures included examining, on a test basis, evidence regarding the amounts and disclosures in the consolidated financial statements. Our audits also included evaluating the accounting principles used and significant estimates made by management, as well as evaluating the overall presentation of the consolidated financial statements. Our procedures included confirmation of securities owned as of October 31, 2022 by correspondence with the custodian, portfolio company investees, transfer agent, brokers and agent banks; when replies were not received from brokers, portfolio company investees or agent banks, we performed other auditing procedures. We believe that our audits provide a reasonable basis for our opinion.
/s/PricewaterhouseCoopers LLP
Houston, Texas
December 23, 2022
We have served as the auditor of one or more of the investment companies in the Invesco group of investment companies since at least 1995. We have not been able to determine the specific year we began serving as auditor.
| | |
| 49 | | Invesco Global Strategic Income Fund |
Calculating your ongoing Fund expenses
Example
As a shareholder of the Fund, you incur two types of costs: (1) transaction costs, which may include sales charges (loads) on purchase payments or contingent deferred sales charges on redemptions, if any; and (2) ongoing costs, including management fees, distribution and/or service (12b-1) fees, and other Fund expenses. This example is intended to help you understand your ongoing costs (in dollars) of investing in the Fund and to compare these costs with ongoing costs of investing in other mutual funds. The example is based on an investment of $1,000 invested at the beginning of the period and held for the entire period May 1, 2022 through October 31, 2022.
Actual expenses
The table below provides information about actual account values and actual expenses. You may use the information in this table, together with the amount you invested, to estimate the expenses that you paid over the period. Simply divide your account value by $1,000 (for example, an $8,600 account value divided by $1,000 = 8.6), then multiply the result by the number in the table under the heading entitled “Actual Expenses Paid During Period” to estimate the expenses you paid on your account during this period.
Hypothetical example for comparison purposes
The table below also provides information about hypothetical account values and hypothetical expenses based on the Fund’s actual expense ratio and an assumed rate of return of 5% per year before expenses, which is not the Fund’s actual return.
The hypothetical account values and expenses may not be used to estimate the actual ending account balance or expenses you paid for the period. You may use this information to compare the ongoing costs of investing in the Fund and other funds. To do so, compare this 5% hypothetical example with the 5% hypothetical examples that appear in the shareholder reports of the other funds.
Please note that the expenses shown in the table are meant to highlight your ongoing costs only and do not reflect any transaction costs, such as sales charges (loads) on purchase payments or contingent deferred sales charges on redemptions, if any. Therefore, the hypothetical information is useful in comparing ongoing costs only, and will not help you determine the relative total costs of owning different funds. In addition, if these transaction costs were included, your costs would have been higher.
| | | | | | | | | | | | |
| | | | | ACTUAL | | HYPOTHETICAL (5% annual return before expenses) | | |
| | | Beginning
Account Value
(05/01/22) | | Ending
Account Value
(10/31/22)1 | | Expenses
Paid During
Period2 | | Ending
Account Value
(10/31/22) | | Expenses
Paid During
Period2 | | Annualized
Expense Ratio |
Class A | | $1,000.00 | | $919.60 | | $5.76 | | $1,019.21 | | $6.06 | | 1.19% |
Class C | | 1,000.00 | | 915.60 | | 9.42 | | 1,015.38 | | 9.91 | | 1.95 |
Class R | | 1,000.00 | | 918.30 | | 7.01 | | 1,017.90 | | 7.38 | | 1.45 |
Class Y | | 1,000.00 | | 917.50 | | 4.59 | | 1,020.42 | | 4.84 | | 0.95 |
Class R5 | | 1,000.00 | | 921.30 | | 4.07 | | 1,020.97 | | 4.28 | | 0.84 |
Class R6 | | 1,000.00 | | 917.80 | | 4.06 | | 1,020.97 | | 4.28 | | 0.84 |
| 1 | The actual ending account value is based on the actual total return of the Fund for the period May 1, 2022 through October 31, 2022, after actual expenses and will differ from the hypothetical ending account value which is based on the Fund’s expense ratio and a hypothetical annual return of 5% before expenses. |
| 2 | Expenses are equal to the Fund’s annualized expense ratio as indicated above multiplied by the average account value over the period, multiplied by 184/365 to reflect the most recent fiscal half year. |
| | |
| 50 | | Invesco Global Strategic Income Fund |
Approval of Investment Advisory and Sub-Advisory Contracts
At meetings held on June 13, 2022, the Board of Trustees (the Board or the Trustees) of AIM Investment Funds (Invesco Investment Funds) as a whole, and the independent Trustees, who comprise over 75% of the Board, voting separately, approved the continuance of the Invesco Global Strategic Income Fund’s (the Fund) Master Investment Advisory Agreement with Invesco Advisers, Inc. (Invesco Advisers and the investment advisory agreement) and the Master Intergroup Sub-Advisory Contract for Mutual Funds with Invesco Asset Management Deutschland GmbH, Invesco Asset Management Limited, Invesco Asset Management (Japan) Limited, Invesco Hong Kong Limited, Invesco Senior Secured Management, Inc. and Invesco Canada Ltd. and separate sub-advisory contracts with Invesco Capital Management LLC and Invesco Asset Management (India) Private Limited and OppenheimerFunds, Inc. (collectively, the Affiliated Sub-Advisers and the sub-advisory contracts) for another year, effective July 1, 2022. After evaluating the factors discussed below, among others, the Board approved the renewal of the Fund’s investment advisory agreement and the sub-advisory contracts and determined that the compensation payable thereunder by the Fund to Invesco Advisers and by Invesco Advisers to the Affiliated Sub-Advisers is fair and reasonable.
The Board’s Evaluation Process
The Board has established an Investments Committee, which in turn has established Sub-Committees that meet throughout the year to review the performance of funds advised by Invesco Advisers (the Invesco Funds). The Sub-Committees meet regularly with portfolio managers for their assigned Invesco Funds and other members of management to review detailed information about investment performance and portfolio attributes of these funds. The Board has established additional standing and ad hoc committees that meet regularly throughout the year to review matters within their purview. The Board took into account evaluations and reports that it received from its committees and sub-committees, as well as the information provided to the Board and its committees and sub-committees throughout the year, in considering whether to approve each Invesco Fund’s investment advisory agreement and sub-advisory contracts.
As part of the contract renewal process, the Board reviews and considers information provided in response to detailed requests for information submitted to management by the independent Trustees with assistance from legal counsel to the independent Trustees and the Senior Officer, an officer of the Invesco Funds who reports directly to the independent Trustees. The Board receives comparative investment performance and fee and expense data regarding the Invesco Funds prepared by Broadridge Financial Solutions, Inc. (Broadridge), an independent mutual fund data provider, as well as information on the composition of the peer groups provided by Broadridge and its methodology for determining peer groups. The Board also receives an independent written evaluation from the Senior Officer. The Senior Officer’s evaluation is prepared as part of his responsibility to manage the process by which the Invesco Funds’ proposed management fees are negotiated during the annual contract renewal
process to ensure they are negotiated in a manner that is at arms’ length and reasonable in accordance with certain negotiated regulatory requirements. In addition to meetings with Invesco Advisers and fund counsel throughout the year and as part of meetings convened on May 2, 2022 and June 13, 2022, the independent Trustees also discussed the continuance of the investment advisory agreement and sub-advisory contracts in separate sessions with the Senior Officer and with independent legal counsel. Also, as part of the contract renewal process, the independent Trustees reviewed and considered information provided in response to detailed follow-up requests for information submitted by the independent Trustees to management. The independent Trustees met and discussed those follow-up responses with legal counsel to the independent Trustees and the Senior Officer.
The discussion below is a summary of the Senior Officer’s independent written evaluation with respect to the Fund’s investment advisory agreement and sub-advisory contracts, as well as a discussion of the material factors and related conclusions that formed the basis for the Board’s approval of the Fund’s investment advisory agreement and sub-advisory contracts. The Trustees’ review and conclusions are based on the comprehensive consideration of all information presented to them during the course of the year and in prior years and are not the result of any single determinative factor. Moreover, one Trustee may have weighed a particular piece of information or factor differently than another Trustee. The information received and considered by the Board was current as of various dates prior to the Board’s approval on June 13, 2022.
Factors and Conclusions and Summary of Independent Written Fee Evaluation
| A. | Nature, Extent and Quality of Services Provided by Invesco Advisers and the Affiliated Sub-Advisers |
The Board reviewed the nature, extent and quality of the advisory services provided to the Fund by Invesco Advisers under the Fund’s investment advisory agreement, and the credentials and experience of the officers and employees of Invesco Advisers who provide these services, including the Fund’s portfolio manager(s). The Board’s review included consideration of Invesco Advisers’ investment process and oversight, credit analysis, and research capabilities. The Board considered information regarding Invesco Advisers’ programs for and resources devoted to risk management, including management of investment, enterprise, operational, liquidity, valuation and compliance risks, and technology used to manage such risks. The Board also received and reviewed information about Invesco Advisers’ role as administrator of the Invesco Funds’ liquidity risk management program. The Board received a description of, and reports related to, Invesco Advisers’ global security program and business continuity plans and of its approach to data privacy and cybersecurity, including related testing. The Board considered how the cybersecurity and business continuity plans of Invesco Advisers and its key service providers operated in the remote and hybrid working environment resulting from the novel coronavirus (“COVID-19”) pandemic and paved the way for a hybrid working framework in a normalized
environment as employees return to the office. The Board also considered non-advisory services that Invesco Advisers and its affiliates provide to the Invesco Funds, such as various back office support functions, third party oversight, internal audit, valuation, portfolio trading and legal and compliance. The Board observed that Invesco Advisers’ systems preparedness and ongoing investment enabled Invesco Advisers to manage, operate and oversee the Invesco Funds with minimal impact or disruption through challenging environments. The Board reviewed and considered the benefits to shareholders of investing in a Fund that is part of the family of funds under the umbrella of Invesco Ltd., Invesco Advisers’ parent company, and noted Invesco Ltd.’s depth and experience in running an investment management business, as well as its commitment of financial and other resources to such business. The Board concluded that the nature, extent and quality of the services provided to the Fund by Invesco Advisers are appropriate and satisfactory.
The Board reviewed the services that may be provided by the Affiliated Sub-Advisers under the sub-advisory contracts and the credentials and experience of the officers and employees of the Affiliated Sub-Advisers who provide these services. The Board noted the Affiliated Sub-Advisers’ expertise with respect to certain asset classes and that the Affiliated Sub-Advisers have offices and personnel that are located in financial centers around the world. As a result, the Board noted that the Affiliated Sub-Advisers can provide research and investment analysis on the markets and economies of various countries in which the Fund may invest, make recommendations regarding securities and assist with security trades. The Board concluded that the sub-advisory contracts may benefit the Fund and its shareholders by permitting Invesco Advisers to use the resources and talents of the Affiliated Sub-Advisers in managing the Fund. The Board concluded that the nature, extent and quality of the services that may be provided to the Fund by the Affiliated Sub-Advisers are appropriate and satisfactory.
| B. | Fund Investment Performance |
The Board considered Fund investment performance as a relevant factor in considering whether to approve the investment advisory agreement. The Board did not view Fund investment performance as a relevant factor in considering whether to approve the sub-advisory contracts for the Fund, as no Affiliated Sub-Adviser currently manages assets of the Fund.
The Board compared the Fund’s investment performance over multiple time periods ending December 31, 2021 to the performance of funds in the Broadridge performance universe and against the Bloomberg U.S. Aggregate Bond Index (Index). The Board noted that performance of Class A shares of the Fund was in the fifth quintile of its performance universe for the one, three and five year periods (the first quintile being the best performing funds and the fifth quintile being the worst performing funds). The Board noted that performance of Class A shares of the Fund was below the performance of the Index for the one, three and five year periods. The Board considered that the Fund was created in connection with Invesco Ltd.’s acquisition of OppenheimerFunds, Inc. and its subsidiaries (the “Transaction”) and that
| | |
| 51 | | Invesco Global Strategic Income Fund |
the Fund’s performance prior to the closing of the Transaction on May 24, 2019 is that of its predecessor fund. The Board noted that the Fund’s negative duration exposure to the U.S. detracted from short-term performance and that the Fund’s duration, credit, and exposure to emerging market currencies and the energy sector detracted from longer-term performance. The Board also consided that, effective February 28, 2022, the Fund changed its primary benchmark to the Bloomberg Global Aggregate Bond Index. The Board considered that the Fund’s performance universe was expected to change in connection with the primary benchmark change, and requested and considered comparative data showing the Fund’s performance compared to the anticipated new performance universe. The Board recognized that the performance data reflects a snapshot in time as of a particular date and that selecting a different performance period could produce different results. The Board also reviewed more recent Fund performance as well as other performance metrics, which did not change its conclusions.
| C. | Advisory and Sub-Advisory Fees and Fund Expenses |
The Board compared the Fund’s contractual management fee rate to the contractual management fee rates of funds in the Fund’s Broadridge expense group. The Board noted that the contractual management fee rate for Class A shares of the Fund was reasonably comparable to the median contractual management fee rate of funds in its expense group. The Board noted that the term “contractual management fee” for funds in the expense group may include both advisory and certain non-portfolio management administrative services fees, but that Broadridge is not able to provide information on a fund by fund basis as to what is included. The Board also reviewed the methodology used by Broadridge in calculating expense group information, which includes using each fund’s contractual management fee schedule (including any applicable breakpoints) as reported in the most recent prospectus or statement of additional information for each fund in the expense group. The Board also considered comparative information regarding the Fund’s total expense ratio and its various components. The Board noted that the Fund’s total expense ratio was in the fourth quintile of its expense group and discussed with management reasons for such relative total expenses. The Board requested and considered additional information from management regarding the Fund’s actual and contractual management fees in light of current asset levels, as well as the Fund’s total expenses relative to peers. The Board considered that the Fund’s expense group was expected to change in connection with the change in the Fund’s benchmark described above under “Fund Investment Performance,” and requested and considered comparative data showing how the Fund’s actual management fees, contractual management fees and total expense ratio compared against the anticipated new expense group. As previously noted, the independent Trustees reviewed and considered information provided in response to detailed follow-up requests for information submitted by the independent Trustees to management, including with respect to management’s philosophy regarding breakpoints in the Fund’s contractual management fee schedule. The independent Trustees met and discussed those follow-up responses with legal counsel to the independent Trustees and the
Senior Officer, and subsequently with representatives of management.
The Board noted that Invesco Advisers has contractually agreed to waive fees and/or limit expenses of the Fund for the term disclosed in the Fund’s registration statement in an amount necessary to limit total annual operating expenses to a specified percentage of average daily net assets for each class of the Fund.
The Board noted that Invesco Advisers and the Affiliated Sub-Advisers do not manage other similarly managed mutual funds or client accounts.
The Board also considered the services that may be provided by the Affiliated Sub-Advisers pursuant to the sub-advisory contracts, as well as the fees payable by Invesco Advisers to the Affiliated Sub-Advisers pursuant to the sub-advisory contracts.
| D. | Economies of Scale and Breakpoints |
The Board considered the extent to which there may be economies of scale in the provision of advisory services to the Fund and the Invesco Funds, and the extent to which such economies of scale are shared with the Fund and the Invesco Funds. The Board considered that the Fund benefits from economies of scale through contractual breakpoints in the Fund’s advisory fee schedule, which generally operate to reduce the Fund’s expense ratio as it grows in size. The Board noted that the Fund also shares in economies of scale through Invesco Advisers’ ability to negotiate lower fee arrangements with third party service providers. The Board noted that the Fund may also benefit from economies of scale through initial fee setting, fee waivers and expense reimbursements, as well as Invesco Advisers’ investment in its business, including investments in business infrastructure, technology and cybersecurity.
| E. | Profitability and Financial Resources |
The Board reviewed information from Invesco Advisers concerning the costs of the advisory and other services that Invesco Advisers and its affiliates provide to the Fund and the Invesco Funds and the profitability of Invesco Advisers and its affiliates in providing these services in the aggregate and on an individual Fund-by-Fund basis. The Board considered the methodology used for calculating profitability and the periodic review and enhancement of such methodology. The Board noted that Invesco Advisers continues to operate at a net profit from services Invesco Advisers and its affiliates provide to the Invesco Funds in the aggregate and to most Funds individually. The Board did not deem the level of profits realized by Invesco Advisers and its affiliates from providing such services to be excessive, given the nature, extent and quality of the services provided. The Board noted that Invesco Advisers provided information demonstrating that Invesco Advisers is financially sound and has the resources necessary to perform its obligations under the investment advisory agreement, and provided representations indicating that the Affiliated Sub-Advisers are financially sound and have the resources necessary to perform their obligations under the sub-advisory contracts.
| F. | Collateral Benefits to Invesco Advisers and its Affiliates |
The Board considered various other benefits received by Invesco Advisers and its affiliates from the relationship with the Fund, including the fees received for providing administrative, transfer agency and distribution services to the Fund. The Board received comparative information regarding
fees charged for these services, including information provided by Broadridge and other independent sources. The Board reviewed the performance of Invesco Advisers and its affiliates in providing these services and the organizational structure employed to provide these services. The Board noted that these services are provided to the Fund pursuant to written contracts that are reviewed and subject to approval on an annual basis by the Board based on its determination that the services are required for the operation of the Fund.
The Board considered the benefits realized by Invesco Advisers and the Affiliated Sub-Advisers as a result of portfolio brokerage transactions executed through “soft dollar” arrangements. Invesco Advisers noted that the Fund does not execute brokerage transactions through “soft dollar” arrangements to any significant degree.
The Board considered that the Fund’s uninvested cash and cash collateral from any securities lending arrangements may be invested in registered money market funds or, with regard to securities lending cash collateral, unregistered funds that comply with Rule 2a-7 (collectively referred to as “affiliated money market funds”) advised by Invesco Advisers. The Board considered information regarding the returns of the affiliated money market funds relative to comparable overnight investments, as well as the fees paid by the affiliated money market funds to Invesco Advisers and its affiliates. In this regard, the Board noted that Invesco Advisers receives advisory fees from these affiliated money market funds attributable to the Fund’s investments. The Board also noted that Invesco Advisers has contractually agreed to waive through varying periods an amount equal to 100% of the net advisory fee Invesco Advisers receives from the affiliated money market funds with respect to the Fund’s investment in the affiliated money market funds of uninvested cash, but not cash collateral. The Board concluded that the advisory fees payable to Invesco Advisers from the Fund’s investment of cash collateral from any securities lending arrangements in the affiliated money market funds are for services that are not duplicative of services provided by Invesco Advisers to the Fund.
The Board considered that Invesco Advisers may serve as the Fund’s affiliated securities lending agent and evaluated the benefits realized by Invesco Advisers when serving in such role, including the compensation received. The Board considered Invesco Advisers’ securities lending platform and corporate governance structure for securities lending, including Invesco Advisers’ Securities Lending Governance Committee and its related responsibilities. The Board noted that to the extent the Fund utilizes Invesco Advisers as an affiliated securities lending agent, the Fund conducts its securities lending in accordance with, and in reliance upon, no-action letters issued by the SEC staff that provide guidance on how an affiliate may act as a direct agent lender and receive compensation for those services without obtaining exemptive relief. The Board considered information provided by Invesco Advisers related to the performance of Invesco Advisers as securities lending agent, including a summary of the securities lending services provided to the Fund by Invesco Advisers and the compensation paid to Invesco Advisers for such services, as well as any revenues generated for the Fund in connection with such securities lending
| | |
| 52 | | Invesco Global Strategic Income Fund |
activity and the allocation of such revenue between the Fund and Invesco Advisers.
The Board also received information about commissions that an affiliated broker may receive for executing certain trades for the Fund. Invesco Advisers and the Affiliated Sub-Advisers advised the Board of the benefits to the Fund of executing trades through the affiliated broker and that such trades were executed in compliance with rules under the federal securities laws and consistent with best execution obligations.
| | |
| 53 | | Invesco Global Strategic Income Fund |
Tax Information
Form 1099-DIV, Form 1042-S and other year-end tax information provide shareholders with actual calendar year amounts that should be included in their tax returns. Shareholders should consult their tax advisers.
The following distribution information is being provided as required by the Internal Revenue Code or to meet a specific state’s requirement.
The Fund designates the following amounts or, if subsequently determined to be different, the maximum amount allowable for its fiscal year ended October 31, 2022:
| | | | | | | | |
Federal and State Income Tax | | | | | | |
Qualified Dividend Income* | | | 0.00 | % | | | | |
Corporate Dividends Received Deduction* | | | 0.00 | % | | | | |
U.S. Treasury Obligations* | | | 0.00 | % | | | | |
Qualified Business Income* | | | 0.00 | % | | | | |
Business Interest Income* | | | 0.00 | % | | | | |
| | * | The above percentages are based on ordinary income dividends paid to shareholders during the Fund’s fiscal year. |
| | |
| 54 | | Invesco Global Strategic Income Fund |
Trustees and Officers
The address of each trustee and officer is AIM Investment Funds (Invesco Investment Funds) (the “Trust”), 11 Greenway Plaza, Suite 1000, Houston, Texas 77046-1173. The trustees serve for the life of the Trust, subject to their earlier death, incapacitation, resignation, retirement or removal as more specifically provided in the Trust’s organizational documents. Each officer serves for a one year term or until their successors are elected and qualified. Column two below includes length of time served with predecessor entities, if any.
| | | | | | | | |
Name, Year of Birth and Position(s) Held with the Trust | | Trustee and/or
Officer Since | | Principal Occupation(s) During Past 5 Years | | Number of Funds in
Fund Complex
Overseen by
Trustee | | Other Directorship(s) Held by Trustee During Past 5 Years |
| Interested Trustee | | | | | | | | |
Martin L. Flanagan1 – 1960 Trustee and Vice Chair | | 2007 | | Executive Director, Chief Executive Officer and President, Invesco Ltd. (ultimate parent of Invesco and a global investment management firm); Trustee and Vice Chair, The Invesco Funds; Vice Chair, Investment Company Institute; and Member of Executive Board, SMU Cox School of Business Formerly: Advisor to the Board, Invesco Advisers, Inc. (formerly known as Invesco Institutional (N.A.), Inc.); Chairman and Chief Executive Officer, Invesco Advisers, Inc. (registered investment adviser); Director, Chairman, Chief Executive Officer and President, Invesco Holding Company (US), Inc. (formerly IVZ Inc.) (holding company), Invesco Group Services, Inc. (service provider) and Invesco North American Holdings, Inc. (holding company); Director, Chief Executive Officer and President, Invesco Holding Company Limited (parent of Invesco and a global investment management firm); Director, Invesco Ltd.; Chairman, Investment Company Institute and President, Co-Chief Executive Officer, Co-President, Chief Operating Officer and Chief Financial Officer, Franklin Resources, Inc. (global investment management organization) | | 189 | | None |
| 1 | Mr. Flanagan is considered an interested person (within the meaning of Section 2(a)(19) of the 1940 Act) of the Trust because he is an officer of the Adviser to the Trust, and an officer and a director of Invesco Ltd., ultimate parent of the Adviser. |
| | |
| T-1 | | Invesco Global Strategic Income Fund |
Trustees and Officers–(continued)
| | | | | | | | |
Name, Year of Birth and
Position(s) Held with the Trust | | Trustee and/or
Officer Since | | Principal Occupation(s) During Past 5 Years | | Number of
Funds in Fund Complex
Overseen by
Trustee | | Other Directorship(s) Held by Trustee
During Past 5 Years |
| Independent Trustees | | | | | | | | |
Beth Ann Brown – 1968 Trustee (2019) and Chair (August 2022) | | 2019 | | Independent Consultant Formerly: Head of Intermediary Distribution, Managing Director, Strategic Relations, Managing Director, Head of National Accounts, Senior Vice President, National Account Manager and Senior Vice President, Key Account Manager, Columbia Management Investment Advisers LLC; Vice President, Key Account Manager, Liberty Funds Distributor, Inc.; and Trustee of certain Oppenheimer Funds | | 189 | | Director, Board of Directors of Caron Engineering Inc.; Advisor, Board of Advisors of Caron Engineering Inc.; President and Director, Acton Shapleigh Youth Conservation Corps (non-profit) Formerly: President and Director Director of Grahamtastic Connection (non-profit) |
Cynthia Hostetler – 1962 Trustee | | 2017 | | Non-Executive Director and Trustee of a number of public and private business corporations Formerly: Director, Aberdeen Investment Funds (4 portfolios); Director, Artio Global Investment LLC (mutual fund complex); Director, Edgen Group, Inc. (specialized energy and infrastructure products distributor); Director, Genesee & Wyoming, Inc. (railroads); Head of Investment Funds and Private Equity, Overseas Private Investment Corporation; President, First Manhattan Bancorporation, Inc.; and Attorney, Simpson Thacher & Bartlett LLP | | 189 | | Resideo Technologies, Inc. (smart home technology); Vulcan Materials Company (construction materials company); Trilinc Global Impact Fund; Textainer Group Holdings, (shipping container leasing company); Investment Company Institute (professional organization); and Independent Directors Council (professional organization) |
Eli Jones – 1961 Trustee | | 2016 | | Professor and Dean Emeritus, Mays Business School - Texas A&M University Formerly: Dean of Mays Business School-Texas A&M University; Professor and Dean, Walton College of Business, University of Arkansas and E.J. Ourso College of Business, Louisiana State University; and Director, Arvest Bank | | 189 | | Insperity, Inc. (formerly known as Administaff) (human resources provider); and Member of Regional Board of Directors and Board of Directors, First Financial Bancorp (regional bank) |
Elizabeth Krentzman – 1959 Trustee | | 2019 | | Formerly: Principal and Chief Regulatory Advisor for Asset Management Services and U.S. Mutual Fund Leader of Deloitte & Touche LLP; General Counsel of the Investment Company Institute (trade association); National Director of the Investment Management Regulatory Consulting Practice, Principal, Director and Senior Manager of Deloitte & Touche LLP; Assistant Director of the Division of Investment Management - Office of Disclosure and Investment Adviser Regulation of the U.S. Securities and Exchange Commission and various positions with the Division of Investment Management – Office of Regulatory Policy of the U.S. Securities and Exchange Commission; Associate at Ropes & Gray LLP; and Trustee of certain Oppenheimer Funds | | 189 | | Formerly: Member of the Cartica Funds Board of Directors (private investment fund); Trustee of the University of Florida National Board Foundation; and Member of the University of Florida Law Center Association, Inc. Board of Trustees, Audit Committee and Membership Committee |
Anthony J. LaCava, Jr. – 1956 Trustee | | 2019 | | Formerly: Director and Member of the Audit Committee, Blue Hills Bank (publicly traded financial institution) and Managing Partner, KPMG LLP | | 189 | | Blue Hills Bank; Chairman, Bentley University; Member, Business School Advisory Council; and Nominating Committee, KPMG LLP |
Prema Mathai-Davis – 1950 Trustee | | 2001 | | Retired Formerly: Co-Founder & Partner of Quantalytics Research, LLC, (a FinTech Investment Research Platform for the Self-Directed Investor); Trustee of YWCA Retirement Fund; CEO of YWCA of the USA; Board member of the NY Metropolitan Transportation Authority; Commissioner of the NYC Department of Aging; and Board member of Johns Hopkins Bioethics Institute | | 189 | | Member of Board of Positive Planet US (non-profit) and HealthCare Chaplaincy Network (non-profit) |
| | |
| T-2 | | Invesco Global Strategic Income Fund |
Trustees and Officers–(continued)
| | | | | | | | |
Name, Year of Birth and
Position(s) Held with the Trust | | Trustee and/or
Officer Since | | Principal Occupation(s) During Past 5 Years | | Number of
Funds in Fund Complex
Overseen by
Trustee | | Other Directorship(s) Held by Trustee
During Past 5 Years |
| Independent Trustees–(continued) | | | | |
Joel W. Motley – 1952 Trustee | | 2019 | | Director of Office of Finance, Federal Home Loan Bank System; Managing Director of Carmona Motley Inc. (privately held financial advisor); Member of the Council on Foreign Relations and its Finance and Budget Committee; Chairman Emeritus of Board of Human Rights Watch and Member of its Investment Committee; and Member of Investment Committee Board of Historic Hudson Valley (non-profit cultural organization); Member of the Board, Blue Ocean Acquisition Corp.; and Member of the Vestry and the Investment Committee of Trinity Church Wall Street. Formerly: Managing Director of Public Capital Advisors, LLC (privately held financial advisor); Managing Director of Carmona Motley Hoffman, Inc. (privately held financial advisor); Trustee of certain Oppenheimer Funds; and Director of Columbia Equity Financial Corp. (privately held financial advisor) | | 189 | | Member of Board of Trust for Mutual Understanding (non-profit promoting the arts and environment); Member of Board of Greenwall Foundation (bioethics research foundation) and its Investment Committee; Member of Board of Friends of the LRC (non-profit legal advocacy); and Board Member and Investment Committee Member of Pulitzer Center for Crisis Reporting (non-profit journalism) |
| Teresa M. Ressel – 1962 Trustee | | 2017 | | Non-executive director and trustee of a number of public and private business corporations Formerly: Chief Executive Officer, UBS Securities LLC (investment banking); Chief Operating Officer, UBS AG Americas (investment banking); Sr. Management Team Olayan America, The Olayan Group (international investor/commercial/industrial); Assistant Secretary for Management & Budget and Designated Chief Financial Officer, U.S. Department of Treasury and Director, ON Semiconductor Corporation (semiconductor manufacturing) | | 189 | | None |
| Robert C. Troccoli – 1949 Trustee | | 2016 | | Retired Formerly: Adjunct Professor, University of Denver – Daniels College of Business; and Managing Partner, KPMG LLP | | 189 | | None |
| Daniel S. Vandivort – 1954 Trustee | | 2019 | | President, Flyway Advisory Services LLC (consulting and property management) Formerly: President and Chief Investment Officer, previously Head of Fixed Income, Weiss Peck and Greer/Robeco Investment Management; Trustee and Chair, Weiss Peck and Greer Funds Board; and various capacities at CS First Boston including Head of Fixed Income at First Boston Asset Management. | | 189 | | Formerly: Trustee and Governance Chair, Oppenheimer Funds; Treasurer, Chairman of the Audit and Finance Committee, Huntington Disease Foundation of America |
| | |
| T-3 | | Invesco Global Strategic Income Fund |
Trustees and Officers–(continued)
| | | | | | | | |
Name, Year of Birth and
Position(s) Held with the Trust | | Trustee and/or
Officer Since | | Principal Occupation(s) During Past 5 Years | | Number of
Funds in Fund Complex
Overseen by
Trustee | | Other Directorship(s) Held by Trustee
During Past 5 Years |
| Officers | | | | | | | | |
Sheri Morris – 1964 President and Principal Executive Officer | | 1999 | | Director, Invesco Trust Company; Head of Global Fund Services, Invesco Ltd.; President and Principal Executive Officer, The Invesco Funds; Vice President, Invesco Exchange-Traded Fund Trust, Invesco Exchange-Traded Fund Trust II, Invesco India Exchange-Traded Fund Trust, Invesco Actively Managed Exchange-Traded Fund Trust, Invesco Actively Managed Exchange-Traded Commodity Fund Trust and Invesco Exchange-Traded Self-Indexed Fund Trust; and Vice President, OppenheimerFunds, Inc. Formerly: Vice President, Treasurer and Principal Financial Officer, The Invesco Funds; Vice President, Invesco AIM Advisers, Inc., Invesco AIM Capital Management, Inc. and Invesco AIM Private Asset Management, Inc.; Assistant Vice President and Assistant Treasurer, The Invesco Funds; Vice President and Assistant Vice President, Invesco Advisers, Inc.; Assistant Vice President, Invesco AIM Capital Management, Inc. and Invesco AIM Private Asset Management, Inc.; Treasurer, Invesco Exchange-Traded Fund Trust, Invesco Exchange-Traded Fund Trust II, Invesco India Exchange-Traded Fund Trust and Invesco Actively Managed Exchange-Traded Fund Trust; and Senior Vice President, Invesco Advisers, Inc. (formerly known as Invesco Institutional (N.A.), Inc.) (registered investment adviser) | | N/A | | N/A |
| Jeffrey H. Kupor – 1968 Senior Vice President, Chief Legal Officer and Secretary | | 2018 | | Head of Legal of the Americas, Invesco Ltd.; Senior Vice President and Secretary, Invesco Advisers, Inc. (formerly known as Invesco Institutional (N.A.), Inc.) (registered investment adviser); Secretary, Invesco Distributors, Inc. (formerly known as Invesco AIM Distributors, Inc.); Vice President and Secretary, Invesco Investment Services, Inc. (formerly known as Invesco AIM Investment Services, Inc.); Senior Vice President, Chief Legal Officer and Secretary, The Invesco Funds; Secretary and General Counsel, Invesco Investment Advisers LLC (formerly known as Van Kampen Asset Management); Secretary and General Counsel, Invesco Capital Markets, Inc. (formerly known as Van Kampen Funds Inc.); Chief Legal Officer, Invesco Exchange-Traded Fund Trust, Invesco Exchange-Traded Fund Trust II, Invesco India Exchange-Traded Fund Trust, Invesco Actively Managed Exchange-Traded Fund Trust, Invesco Actively Managed Exchange-Traded Commodity Fund Trust and Invesco Exchange-Traded Self-Indexed Fund Trust;; Secretary and Vice President, Harbourview Asset Management Corporation; Secretary and Vice President, OppenheimerFunds, Inc. and Invesco Managed Accounts, LLC; Secretary and Senior Vice President, OFI Global Institutional, Inc.; Secretary and Vice President, OFI SteelPath, Inc.; Secretary and Vice President, Oppenheimer Acquisition Corp.; Secretary and Vice President, Shareholder Services, Inc.; and Secretary and Vice President, Trinity Investment Management Corporation Formerly: Senior Vice President, Invesco Distributors, Inc.; Secretary and Vice President, Jemstep, Inc.; Head of Legal, Worldwide Institutional, Invesco Ltd.; Secretary and General Counsel, INVESCO Private Capital Investments, Inc.; Senior Vice President, Secretary and General Counsel, Invesco Management Group, Inc. (formerly known as Invesco AIM Management Group, Inc.); Assistant Secretary, INVESCO Asset Management (Bermuda) Ltd.; Secretary and General Counsel, Invesco Private Capital, Inc.; Assistant Secretary and General Counsel, INVESCO Realty, Inc.; Secretary and General Counsel, Invesco Senior Secured Management, Inc.; Secretary, Sovereign G./P. Holdings Inc.; Secretary, Invesco Indexing LLC; and Secretary, W.L. Ross & Co., LLC | | N/A | | N/A |
Andrew R. Schlossberg – 1974 Senior Vice President | | 2019 | | Senior Vice President, Invesco Group Services, Inc.; Head of the Americas and Senior Managing Director, Invesco Ltd.; Director and Senior Vice President, Invesco Advisers, Inc. (formerly known as Invesco Institutional (N.A.), Inc.) (registered investment adviser); Director and Chairman, Invesco Investment Services, Inc. (formerly known as Invesco AIM Investment Services, Inc.) (registered transfer agent); Senior Vice President, The Invesco Funds; and Director, Invesco Investment Advisers LLC (formerly known as Van Kampen Asset Management) Formerly: Director, President and Chairman, Invesco Insurance Agency, Inc.; Director, Invesco UK Limited; Director and Chief Executive, Invesco Asset Management Limited and Invesco Fund Managers Limited; Assistant Vice President, The Invesco Funds; Senior Vice President, Invesco Advisers, Inc. (formerly known as Invesco Institutional (N.A.), Inc.) (registered investment adviser); Director and Chief Executive, Invesco Administration Services Limited and Invesco Global Investment Funds Limited; Director, Invesco Distributors, Inc.; Head of EMEA, Invesco Ltd.; President, Invesco Actively Managed Exchange-Traded Commodity Fund Trust, Invesco Actively Managed Exchange-Traded Fund Trust, Invesco Exchange-Traded Fund Trust, Invesco Exchange-Traded Fund Trust II and Invesco India Exchange-Traded Fund Trust; and Managing Director and Principal Executive Officer, Invesco Capital Management LLC | | N/A | | N/A |
| | |
| T-4 | | Invesco Global Strategic Income Fund |
Trustees and Officers–(continued)
| | | | | | | | |
Name, Year of Birth and
Position(s) Held with the Trust | | Trustee and/or
Officer Since | | Principal Occupation(s) During Past 5 Years | | Number of
Funds in Fund Complex
Overseen by
Trustee | | Other Directorship(s) Held by Trustee
During Past 5 Years |
| Officers–(continued) | | | | | | | | |
John M. Zerr – 1962 Senior Vice President | | 2006 | | Chief Operating Officer of the Americas; Senior Vice President, Invesco Advisers, Inc. (formerly known as Invesco Institutional (N.A.), Inc.) (registered investment adviser); Senior Vice President, Invesco Distributors, Inc. (formerly known as Invesco AIM Distributors, Inc.); Director and Vice President, Invesco Investment Services, Inc. (formerly known as Invesco AIM Investment Services, Inc.) Senior Vice President, The Invesco Funds; Managing Director, Invesco Capital Management LLC; Director, Invesco Investment Advisers LLC (formerly known as Van Kampen Asset Management); Senior Vice President, Invesco Capital Markets, Inc. (formerly known as Van Kampen Funds Inc.); Manager, Invesco Indexing LLC; Manager, Invesco Specialized Products, LLC; Member, Invesco Canada Funds Advisory Board; Director, President and Chief Executive Officer, Invesco Corporate Class Inc. (corporate mutual fund company); and Director, Chairman, President and Chief Executive Officer, Invesco Canada Ltd. (formerly known as Invesco Trimark Ltd./Invesco Trimark Ltèe) (registered investment adviser and registered transfer agent); President, Invesco, Inc.; President, Invesco Global Direct Real Estate Feeder GP Ltd.; President, Invesco IP Holdings (Canada) Ltd; President, Invesco Global Direct Real Estate GP Ltd.; President, Invesco Financial Services Ltd. / Services Financiers Invesco Ltée; and Director and Chairman, Invesco Trust Company Formerly: President, Trimark Investments Ltd/Services Financiers Invesco Ltee; Director and Senior Vice President, Invesco Insurance Agency, Inc.; Director and Senior Vice President, Invesco Management Group, Inc. (formerly known as Invesco AIM Management Group, Inc.); Secretary and General Counsel, Invesco Management Group, Inc. (formerly known as Invesco AIM Management Group, Inc.); Secretary, Invesco Investment Services, Inc. (formerly known as Invesco AIM Investment Services, Inc.); Chief Legal Officer and Secretary, The Invesco Funds; Secretary and General Counsel, Invesco Investment Advisers LLC (formerly known as Van Kampen Asset Management); Secretary and General Counsel, Invesco Capital Markets, Inc. (formerly known as Van Kampen Funds Inc.); Chief Legal Officer, Invesco Exchange-Traded Fund Trust, Invesco Exchange-Traded Fund Trust II, Invesco India Exchange-Traded Fund Trust, Invesco Actively Managed Exchange-Traded Fund Trust, Invesco Actively Managed Exchange-Traded Commodity Fund Trust and Invesco Exchange-Traded Self-Indexed Fund Trust; Secretary, Invesco Indexing LLC; Director, Secretary, General Counsel and Senior Vice President, Van Kampen Exchange Corp.; Director, Vice President and Secretary, IVZ Distributors, Inc. (formerly known as INVESCO Distributors, Inc.); Director and Vice President, INVESCO Funds Group, Inc.; Director and Vice President, Van Kampen Advisors Inc.; Director, Vice President, Secretary and General Counsel, Van Kampen Investor Services Inc.; Director and Secretary, Invesco Distributors, Inc. (formerly known as Invesco AIM Distributors, Inc.); Director, Senior Vice President, General Counsel and Secretary, Invesco AIM Advisers, Inc. and Van Kampen Investments Inc.; Director, Vice President and Secretary, Fund Management Company; Director, Senior Vice President, Secretary, General Counsel and Vice President, Invesco AIM Capital Management, Inc.; and Chief Operating Officer and General Counsel, Liberty Ridge Capital, Inc. (an investment adviser) | | N/A | | N/A |
Gregory G. McGreevey – 1962 Senior Vice President | | 2012 | | Senior Managing Director, Invesco Ltd.; Director, Chairman, President, and Chief Executive Officer, Invesco Advisers, Inc. (formerly known as Invesco Institutional (N.A.), Inc.) (registered investment adviser); Director, Invesco Mortgage Capital, Inc. and Invesco Senior Secured Management, Inc.; Senior Vice President, The Invesco Funds; President, SNW Asset Management Corporation and Invesco Managed Accounts, LLC; Chairman and Director, Invesco Private Capital, Inc.; Chairman and Director, INVESCO Private Capital Investments, Inc.; Chairman and Director, INVESCO Realty, Inc.; and Senior Vice President, Invesco Group Services, Inc. Formerly: Senior Vice President, Invesco Management Group, Inc. and Invesco Advisers, Inc.; Assistant Vice President, The Invesco Funds | | N/A | | N/A |
| Adrien Deberghes – 1967 Principal Financial Officer, Treasurer and Vice President | | 2020 | | Head of the Fund Office of the CFO and Fund Administration; Vice President, Invesco Advisers, Inc.; Principal Financial Officer, Treasurer and Vice President, The Invesco Funds; Vice President, Invesco Exchange-Traded Fund Trust, Invesco Exchange-Traded Fund Trust II, Invesco India Exchange-Traded Fund Trust, Invesco Actively Managed Exchange-Traded Fund Trust, Invesco Actively Managed Exchange-Traded Commodity Fund Trust and Invesco Exchange-Traded Self-Indexed Fund Trust Formerly: Senior Vice President and Treasurer, Fidelity Investments | | N/A | | N/A |
| Crissie M. Wisdom – 1969 Anti-Money Laundering Compliance Officer | | 2013 | | Anti-Money Laundering and OFAC Compliance Officer for Invesco U.S. entities including: Invesco Advisers, Inc. and its affiliates, Invesco Capital Markets, Inc., Invesco Distributors, Inc., Invesco Investment Services, Inc., The Invesco Funds, Invesco Capital Management, LLC, Invesco Trust Company; and Fraud Prevention Manager for Invesco Investment Services, Inc. | | N/A | | N/A |
| | |
| T-5 | | Invesco Global Strategic Income Fund |
Trustees and Officers–(continued)
| | | | | | | | |
Name, Year of Birth and
Position(s) Held with the Trust | | Trustee and/or
Officer Since | | Principal Occupation(s) During Past 5 Years | | Number of
Funds in Fund Complex
Overseen by
Trustee | | Other Directorship(s) Held by Trustee
During Past 5 Years |
| Officers–(continued) | | | | | | | | |
Todd F. Kuehl – 1969 Chief Compliance Officer and Senior Vice President | | 2020 | | Chief Compliance Officer, Invesco Advisers, Inc. (registered investment adviser); and Chief Compliance Officer and Senior Vice President, The Invesco Funds Formerly: Managing Director and Chief Compliance Officer, Legg Mason (Mutual Funds); Chief Compliance Officer, Legg Mason Private Portfolio Group (registered investment adviser) | | N/A | | N/A |
| James Bordewick, Jr. – 1959 Senior Vice President and Senior Officer | | 2022 | | Senior Vice President and Senior Officer, The Invesco Funds; and Chief Legal Officer, KingsCrowd, Inc. (research and analytical platform for investment in private capital markets) Formerly, Chief Operating Officer and Head of Legal and Regulatory, Netcapital (private capital investment platform); Managing Director, General Counsel of asset management and Chief Compliance Officer for asset management and private banking, Bank of America Corporation; Chief Legal Officer, Columbia Funds and BofA Funds; Senior Vice President and Associate General Counsel, MFS Investment Management; Chief Legal Officer, MFS Funds; Associate, Ropes & Gray; Associate, Gaston Snow & Ely Bartlett | | N/A | | N/A |
The Statement of Additional Information of the Trust includes additional information about the Fund’s Trustees and is available upon request, without charge, by calling 1.800.959.4246. Please refer to the Fund’s Statement of Additional Information for information on the Fund’s sub-advisers.
| | | | | | |
| Office of the Fund | | Investment Adviser | | Distributor | | Auditors |
| 11 Greenway Plaza, Suite 1000 | | Invesco Advisers, Inc. | | Invesco Distributors, Inc. | | PricewaterhouseCoopers LLP |
| Houston, TX 77046-1173 | | 1555 Peachtree Street, N.E. | | 11 Greenway Plaza, Suite 1000 | | 1000 Louisiana Street, Suite 5800 |
| | Atlanta, GA 30309 | | Houston, TX 77046-1173 | | Houston, TX 77002-5021 |
| | | |
| Counsel to the Fund | | Counsel to the Independent Trustees | | Transfer Agent | | Custodian |
| Stradley Ronon Stevens & Young, LLP | | Goodwin Procter LLP | | Invesco Investment Services, Inc. | | State Street Bank and Trust Company |
| 2005 Market Street, Suite 2600 | | 901 New York Avenue, N.W. | | 11 Greenway Plaza, Suite 1000 | | 225 Franklin Street |
| Philadelphia, PA 19103-7018 | | Washington, D.C. 20001 | | Houston, TX 77046-1173 | | Boston, MA 02110-2801 |
| | |
| T-6 | | Invesco Global Strategic Income Fund |
(This page intentionally left blank)
(This page intentionally left blank)
(This page intentionally left blank)

Go paperless with eDelivery
Visit invesco.com/edelivery to enjoy the convenience and security of anytime electronic access to your investment documents.
With eDelivery, you can elect to have any or all of the following materials delivered straight to your inbox to download, save and print from your own computer:
∎ Fund reports and prospectuses
∎ Quarterly statements
∎ Daily confirmations
∎ Tax forms
Invesco mailing information
Send general correspondence to Invesco Investment Services, Inc., P.O. Box 219078, Kansas City, MO 64121-9078.
Important notice regarding delivery of security holder documents
To reduce Fund expenses, only one copy of most shareholder documents may be mailed to shareholders with multiple accounts at the same address (Householding). Mailing of your shareholder documents may be householded indefinitely unless you instruct us otherwise. If you do not want the mailing of these documents to be combined with those for other members of your household, please contact Invesco Investment Services, Inc. at 800 959 4246 or contact your financial institution. We will begin sending you individual copies for each account within 30 days after receiving your request.
Fund holdings and proxy voting information
The Fund provides a complete list of its portfolio holdings four times each year, at the end of each fiscal quarter. For the second and fourth quarters, the list appears, respectively, in the Fund’s semiannual and annual reports to shareholders. For the first and third quarters, the Fund files the list with the Securities and Exchange Commission (SEC) as an exhibit to its reports on Form N-PORT. The most recent list of portfolio holdings is available at invesco.com/completeqtrholdings. Shareholders can also look up the Fund’s Form N-PORT filings on the SEC website, sec.gov. The SEC file numbers for the Fund are shown below.
A description of the policies and procedures that the Fund uses to determine how to vote proxies relating to portfolio securities is available without charge, upon request, from our Client Services department at 800 959 4246, or at invesco.com/corporate/about-us/esg. The information is also available on the SEC website, sec.gov.
Information regarding how the Fund voted proxies related to its portfolio securities during the most recent 12-month period ended June 30 is available at invesco.com/proxysearch. This information is also available on the SEC website, sec.gov.
Invesco Advisers, Inc. is an investment adviser; it provides investment advisory services to individual and institutional clients and does not sell securities. Invesco Distributors, Inc. is the US distributor for Invesco Ltd.’s retail mutual funds, exchange-traded funds and institutional money market funds. Both are wholly owned, indirect subsidiaries of Invesco Ltd.

| | | | |
| SEC file number(s): 811-05426 and 033-19338 | | Invesco Distributors, Inc. | | O-GLSI-AR-1 |

| | |
| Annual Report to Shareholders | | October 31, 2022 |
| | |
| Invesco Greater China Fund |
|
| Nasdaq: |
| A: AACFX ∎ C: CACFX ∎ R: IGCRX ∎ Y: AMCYX ∎ R5: IACFX ∎ R6: CACSX |
Management’s Discussion of Fund Performance
| | | | |
| |
Performance summary For the fiscal year ended October 31, 2022, Class A shares of Invesco Greater China Fund (the Fund), at net asset value (NAV), outperformed the MSCI China All Shares Index, the Fund’s style-specific benchmark. | |
Your Fund’s long-term performance appears later in this report. | |
Fund vs. Indexes | | | | |
Total returns, 10/31/21 to 10/31/22, at net asset value (NAV). Performance shown does not include applicable contingent deferred sales charges (CDSC) or front-end sales charges, which would have reduced performance. | |
| |
Class A Shares | | | -41.77 | % |
Class C Shares | | | -42.23 | |
Class R Shares | | | -41.89 | |
Class Y Shares | | | -41.64 | |
Class R5 Shares | | | -41.61 | |
Class R6 Shares | | | -41.55 | |
MSCI China Index▼ (Broad Market Index) | | | -47.90 | |
MSCI China All Shares Index∎ (Style-Specific Index) | | | -42.58 | |
Lipper China Region Funds Index◆ (Peer Group Index) | | | -46.77 | |
Source(s): ▼RIMES Technologies Corp.; ∎Bloomberg LP; ◆Lipper Inc. | | | | |
Market conditions and your Fund
At the beginning of the fiscal year ended October 31, 2022, developed global equity markets were mostly positive, despite rising inflation and the emergence of Omicron, a new COVID-19 variant. Pandemic-related supply chain disruptions and labor shortages intensified at the end of 2021, resulting in broadly higher costs for companies and consumers. Emerging market equities declined due in part to COVID-19 concerns and China’s ongoing regulatory tightening in the private education and technology sectors and slowing economic growth.
Global equity markets declined in the first half of 2022 amid volatility sparked by Russia’s invasion of Ukraine, rising commodity prices, rampant global inflation and central banks shifting toward tighter monetary policy. Russia’s invasion exacerbated inflationary pressures, disrupting already strained supply chains, and increasing shortages of oil, gas and raw materials, with the price of oil rising sharply.
Inflation headwinds continued into the third quarter of 2022. The US Federal Reserve (the Fed), the European Central Bank and the Bank of England all raised interest rates. In contrast, the People’s Bank of China lowered its policy rate and the Bank of Japan kept rates the same. Emerging market equities, hampered by the strong US dollar, underperformed developed market equities.
During October 2022, developed market equities rebounded and were in positive territory. Developed market equities outperformed emerging market equities, which declined primarily driven by weakness in China as Chinese markets reacted to the reappointment of President Xi and his authority, with no signs of the country’s zero-COVID-19 policy being relaxed. Despite the rebound in October for developed market equities, at the
end of the fiscal year, trailing one-year returns for developed market equities and emerging market equities were both in negative territory.
For the fiscal year, stock selection in the information technology sector contributed to the Fund’s performance relative to the style-specific benchmark. LARGAN Precision, a global leader in plastic aspherical lens design and production based in Taiwan was a top contributor to performance in this sector. We exited this position during the fiscal year. Also, stock selection in the health care sector helped the Fund’s relative performance.
Stock selection in the consumer discretionary sector also contributed to the Fund’s performance relative to the style-specific index during the fiscal year.
In contrast, the Fund’s underweight to the financials sector had a negative impact on the Fund’s performance relative to the style-specific index. One of the top detractors of the Fund’s relative performance was China Merchants Bank, a retail focused commercial bank headquartered in China. An underweight in the industrials sectors was also a detractor from Fund performance relative to the style-specific benchmark.
Additionally stock selection and an underweight in the energy sector detracted from Fund performance relative to the style-specific benchmark.
Our investment strategy remains purely focused on bottom-up stock opportunities that we believe add the most value to the Fund. We adopt a selective approach, favoring companies with sustainable leadership and competitive advantages. This has led to the Fund having meaningful exposure in consumer-related sectors. We believe the Fund’s holdings are well-positioned to gain from structural opportunities in China’s consumer sector.
Thank you for your continued investment in Invesco Greater China Fund.
Portfolio manager(s):
Mike Shiao
The views and opinions expressed in management’s discussion of Fund performance are those of Invesco Advisers, Inc. and its affiliates. These views and opinions are subject to change at any time based on factors such as market and economic conditions. These views and opinions may not be relied upon as investment advice or recommendations, or as an offer for a particular security. The information is not a complete analysis of every aspect of any market, country, industry, security or the Fund. Statements of fact are from sources considered reliable, but Invesco Advisers, Inc. makes no representation or warranty as to their completeness or accuracy. Although historical performance is no guarantee of future results, these insights may help you understand our investment management philosophy.
See important Fund and, if applicable, index disclosures later in this report.
| | |
| 2 | | Invesco Greater China Fund |
Your Fund’s Long-Term Performance
Results of a $10,000 Investment – Oldest Share Class(es)
Fund and index data from 10/31/12
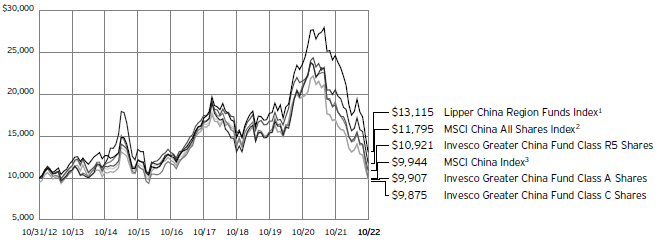
| 3 | Source: RIMES Technologies Corp. |
Past performance cannot guarantee future results.
The data shown in the chart include reinvested distributions, applicable sales charges and Fund expenses including management
fees. Index results include reinvested dividends, but they do not reflect sales charges. Performance of the peer group, if applicable, reflects fund expenses and management fees;
performance of a market index does not. Performance shown in the chart does not reflect deduction of taxes a shareholder would pay on Fund distributions or sale of Fund shares.
| | |
| 3 | | Invesco Greater China Fund |
| | | | |
Average Annual Total Returns | |
As of 10/31/22, including maximum applicable sales charges | |
| |
Class A Shares | | | | |
Inception (3/31/06) | | | 3.88 | % |
10 Years | | | -0.09 | |
5 Years | | | -10.32 | |
1 Year | | | -44.97 | |
| |
Class C Shares | | | | |
Inception (3/31/06) | | | 3.86 | % |
10 Years | | | -0.13 | |
5 Years | | | -9.98 | |
1 Year | | | -42.80 | |
| |
Class R Shares | | | | |
10 Years | | | 0.22 | % |
5 Years | | | -9.53 | |
1 Year | | | -41.89 | |
Class Y Shares | | | | |
Inception (10/3/08) | | | 3.61 | % |
10 Years | | | 0.71 | |
5 Years | | | -9.09 | |
1 Year | | | -41.64 | |
| |
Class R5 Shares | | | | |
Inception (3/31/06) | | | 4.69 | % |
10 Years | | | 0.88 | |
5 Years | | | -8.97 | |
1 Year | | | -41.61 | |
| |
Class R6 Shares | | | | |
10 Years | | | 0.69 | % |
5 Years | | | -8.94 | |
1 Year | | | -41.55 | |
Performance includes litigation proceeds. Had these proceeds not been received, total returns would have been lower.
Class R shares incepted on April 23, 2021. Class R6 shares incepted on April 4, 2017. Performance shown prior to that date is that of Class A shares at net asset value and includes the 12b-1 fees applicable to Class A shares.
The performance data quoted represent past performance and cannot guarantee future results; current performance may be lower or higher. Please visit invesco.com/performance for the most recent month-end performance. Performance figures reflect reinvested distributions, changes in net asset value and the effect of the maximum sales charge unless otherwise stated. Performance figures do not reflect deduction of taxes a shareholder would pay on Fund distributions or sale of Fund shares. Investment return and principal value will fluctuate so that you may have a gain or loss when you sell shares.
Class A share performance reflects the maximum 5.50% sales charge, and Class C share performance reflects the applicable contingent deferred sales charge (CDSC) for the period involved. The CDSC on Class C shares is 1% for the first year after purchase. Class R, Class Y, Class R5 and Class R6 shares do not have a front-end
sales charge or a CDSC; therefore, performance is at net asset value.
The performance of the Fund’s share classes will differ primarily due to different sales charge structures and class expenses.
Fund performance reflects any applicable fee waivers and/or expense reimbursements. Had the adviser not waived fees and/or reimbursed expenses currently or in the past, returns would have been lower. See current prospectus for more information.
| | |
| 4 | | Invesco Greater China Fund |
Supplemental Information
Invesco Greater China Fund’s investment objective is long-term growth of capital.
| ∎ | | Unless otherwise stated, information presented in this report is as of October 31, 2022, and is based on total net assets. |
| ∎ | | Unless otherwise noted, all data is provided by Invesco. |
| ∎ | | To access your Fund’s reports/prospectus, visit invesco.com/fundreports. |
About indexes used in this report
| ∎ | | The MSCI China Index is an unmanaged index considered representative of Chinese stocks. The index is computed using the net return, which withholds applicable taxes for non-resident investors. |
| ∎ | | The MSCI China All Shares Index is composed of large-and mid-cap stocks issued as China A-shares, B-shares, H-shares, Red-chips, P-chips and foreign listings. |
| ∎ | | The Lipper China Region Funds Index is an unmanaged index considered representative of China region funds tracked by Lipper. |
| ∎ | | The Fund is not managed to track the performance of any particular index, including the index(es) described here, and consequently, the performance of the Fund may deviate significantly from the performance of the index(es). |
| ∎ | | A direct investment cannot be made in an index. Unless otherwise indicated, index results include reinvested dividends, and they do not reflect sales charges. Performance of the peer group, if applicable, reflects fund expenses; performance of a market index does not. |
This report must be accompanied or preceded by a currently effective Fund prospectus, which contains more complete information, including sales charges and expenses. Investors should read it carefully before investing.
NOT FDIC INSURED | MAY LOSE VALUE | NO BANK GUARANTEE
| | |
| 5 | | Invesco Greater China Fund |
Fund Information
Portfolio Composition
| | | | | |
| By sector | | % of total net assets |
| |
Consumer Discretionary | | | | 28.84 | % |
Financials | | | | 16.11 | |
Communication Services | | | | 12.93 | |
Consumer Staples | | | | 12.27 | |
Health Care | | | | 10.72 | |
Materials | | | | 8.66 | |
Information Technology | | | | 6.84 | |
Energy | | | | 2.21 | |
Utilities | | | | 2.07 | |
Money Market Funds Plus Other Assets Less Liabilities | | | | (0.65 | ) |
Top 10 Equity Holdings*
| | | | | | | |
| | | | | % of total net assets |
| | |
1. | | Tencent Holdings Ltd. | | | | 9.21 | % |
2. | | Alibaba Group Holding Ltd. | | | | 7.46 | |
3. | | China Merchants Bank Co. Ltd., A Shares | | | | 4.41 | |
4. | | Zijin Mining Group Co. Ltd., H Shares | | | | 4.20 | |
5. | | China Construction Bank Corp., H Shares | | | | 4.14 | |
6. | | Tingyi Cayman Islands Holding Corp. | | | | 4.04 | |
7. | | Uni-President China Holdings Ltd. | | | | 3.73 | |
8. | | Shenzhou International Group Holdings Ltd. | | | | 3.70 | |
9. | | Great Wall Motor Co. Ltd., H Shares | | | | 3.46 | |
10. | | Baoshan Iron & Steel Co. Ltd., A Shares | | | | 3.30 | |
The Fund’s holdings are subject to change, and there is no assurance that the Fund will continue to hold any particular security.
* Excluding money market fund holdings, if any.
Data presented here are as of October 31, 2022.
| | |
| 6 | | Invesco Greater China Fund |
Schedule of Investments(a)
October 31, 2022
| | | | | | | | |
| | | Shares | | | Value | |
|
| |
Common Stocks & Other Equity Interests–100.65%(b) | |
Apparel Retail–0.95% | | | | | | | | |
Pou Sheng International (Holdings) Ltd. (Hong Kong) | | | 11,922,000 | | | $ | 599,913 | |
|
| |
|
Apparel, Accessories & Luxury Goods–3.69% | |
Shenzhou International Group Holdings Ltd. | | | 336,700 | | | | 2,323,893 | |
|
| |
| | |
Application Software–1.14% | | | | | | | | |
Beijing Shiji Information Technology Co. Ltd., A Shares | | | 412,909 | | | | 714,337 | |
|
| |
| | |
Automobile Manufacturers–3.87% | | | | | | | | |
Great Wall Motor Co. Ltd., H Shares | | | 1,998,500 | | | | 2,173,161 | |
|
| |
Jiangling Motors Corp. Ltd., B Shares | | | 311,100 | | | | 257,960 | |
|
| |
| | | | | | | 2,431,121 | |
|
| |
| | |
Biotechnology–2.52% | | | | | | | | |
Innovent Biologics, Inc.(c)(d) | | | 447,500 | | | | 1,588,062 | |
|
| |
| | |
Construction Materials–1.16% | | | | | | | | |
Asia Cement China Holdings Corp. | | | 2,090,500 | | | | 731,000 | |
|
| |
| | |
Diversified Banks–14.31% | | | | | | | | |
Bank of China Ltd., H Shares | | | 5,529,000 | | | | 1,782,314 | |
|
| |
China Construction Bank Corp., H Shares | | | 4,896,000 | | | | 2,601,607 | |
|
| |
China Merchants Bank Co. Ltd., A Shares | | | 756,232 | | | | 2,774,838 | |
|
| |
China Merchants Bank Co. Ltd., H Shares | | | 175,000 | | | | 575,424 | |
|
| |
Industrial & Commercial Bank of China Ltd., H Shares | | | 2,925,000 | | | | 1,268,097 | |
|
| |
| | | | | | | 9,002,280 | |
|
| |
| | |
Electronic Components–1.91% | | | | | | | | |
Simplo Technology Co. Ltd. (Taiwan) | | | 151,000 | | | | 1,198,242 | |
|
| |
|
Electronic Manufacturing Services–0.55% | |
FIH Mobile Ltd.(d) | | | 4,268,000 | | | | 347,467 | |
|
| |
| | |
Financial Exchanges & Data–1.80% | | | | | | | | |
Hong Kong Exchanges & Clearing Ltd. (Hong Kong) | | | 42,600 | | | | 1,131,012 | |
|
| |
| | |
Footwear–2.27% | | | | | | | | |
Stella International Holdings Ltd. | | | 1,472,000 | | | | 1,425,233 | |
|
| |
| | |
Gas Utilities–2.07% | | | | | | | | |
Towngas Smart Energy Co. Ltd.(d) | | | 3,715,564 | | | | 1,302,070 | |
|
| |
| | |
Gold–4.20% | | | | | | | | |
Zijin Mining Group Co. Ltd., H Shares | | | 2,776,000 | | | | 2,642,717 | |
|
| |
| | |
Health Care Equipment–2.60% | | | | | | | | |
MicroPort CardioFlow Medtech
Corp.(c)(d) | | | 4,645 | | | | 1,411 | |
|
| |
MicroPort NeuroTech Ltd.(d) | | | 286 | | | | 911 | |
|
| |
MicroPort Scientific Corp.(d) | | | 772,400 | | | | 1,632,485 | |
|
| |
Shanghai MicroPort MedBot Group Co. Ltd.(d) | | | 352 | | | | 1,166 | |
|
| |
| | | | | | | 1,635,973 | |
|
| |
| | | | | | | | |
| | | Shares | | | Value | |
|
| |
Health Care Supplies–2.54% | |
Shandong Weigao Group Medical Polymer Co. Ltd., H Shares | | | 1,157,200 | | | $ | 1,595,761 | |
|
| |
| |
Hotels, Resorts & Cruise Lines–1.11% | | | | | |
Shanghai Jinjiang International Hotels Co. Ltd., B Shares | | | 381,578 | | | | 696,874 | |
|
| |
| |
Household Appliances–3.15% | | | | | |
Beijing Roborock Technology Co. Ltd., A Shares | | | 61,694 | | | | 1,984,210 | |
|
| |
| |
Household Products–3.20% | | | | | |
Vinda International Holdings Ltd. (Hong Kong) | | | 1,074,000 | | | | 2,014,311 | |
|
| |
| |
Hypermarkets & Super Centers–1.30% | | | | | |
Sun Art Retail Group Ltd. | | | 5,139,500 | | | | 818,674 | |
|
| |
| |
Interactive Home Entertainment–2.58% | | | | | |
NetEase, Inc., ADR(e) | | | 29,145 | | | | 1,621,045 | |
|
| |
| |
Interactive Media & Services–10.35% | | | | | |
Tencent Holdings Ltd. | | | 220,800 | | | | 5,793,740 | |
|
| |
Weibo Corp., ADR(d)(e) | | | 63,358 | | | | 717,212 | |
|
| |
| | | | | | | 6,510,952 | |
|
| |
| |
Internet & Direct Marketing Retail–10.71% | | | | | |
Alibaba Group Holding Ltd.(d) | | | 589,400 | | | | 4,692,492 | |
|
| |
Alibaba Group Holding Ltd., ADR(d)(e) | | | 8,977 | | | | 570,758 | |
|
| |
JD.com, Inc., A Shares | | | 78,850 | | | | 1,472,357 | |
|
| |
| | | | | | | 6,735,607 | |
|
| |
| |
Oil & Gas Refining & Marketing–2.21% | | | | | |
Formosa Petrochemical Corp. (Taiwan) | | | 540,000 | | | | 1,388,298 | |
|
| |
| |
Packaged Foods & Meats–7.77% | | | | | |
Tingyi Cayman Islands Holding Corp. | | | 1,622,000 | | | | 2,538,577 | |
|
| |
Uni-President China Holdings Ltd. | | | 3,176,000 | | | | 2,347,290 | |
|
| |
| | | | | | | 4,885,867 | |
|
| |
| |
Pharmaceuticals–3.06% | | | | | |
China Animal Healthcare Ltd.(f) | | | 349,000 | | | | 0 | |
|
| |
Jiangsu Hengrui Medicine Co. Ltd., A Shares | | | 312,360 | | | | 1,721,094 | |
|
| |
Shanghai Fudan-Zhangjiang Bio- Pharmaceutical Co. Ltd., H Shares | | | 615,000 | | | | 202,285 | |
|
| |
| | | | | | | 1,923,379 | |
|
| |
| |
Restaurants–3.09% | | | | | |
Ajisen (China) Holdings Ltd. (Hong Kong) | | | 3,929,000 | | | | 310,599 | |
|
| |
Gourmet Master Co. Ltd. (Taiwan) | | | 537,000 | | | | 1,630,387 | |
|
| |
| | | | | | | 1,940,986 | |
|
| |
| |
Semiconductors–1.71% | | | | | |
MediaTek, Inc. (Taiwan) | | | 59,000 | | | | 1,074,939 | |
|
| |
| |
Steel–3.30% | | | | | |
Baoshan Iron & Steel Co. Ltd., A Shares | | | 3,152,500 | | | | 2,077,932 | |
|
| |
|
Technology Hardware, Storage & Peripherals–1.53% | |
Asustek Computer, Inc. (Taiwan) | | | 132,000 | | | | 963,736 | |
|
| |
Total Common Stocks & Other Equity Interests
(Cost $93,630,045) | | | | 63,305,891 | |
|
| |
See accompanying Notes to Financial Statements which are an integral part of the financial statements.
| | |
| 7 | | Invesco Greater China Fund |
| | | | | | | | |
| | | Shares | | | Value | |
|
| |
Money Market Funds–0.05% | |
Invesco Liquid Assets Portfolio, Institutional Class, 3.03%(g)(h)
(Cost $31,644) | | | 31,657 | | | $ | 31,663 | |
|
| |
TOTAL INVESTMENTS IN SECURITIES
(excluding investments purchased with cash collateral from securities on loan)–100.70% (Cost $93,661,689) | | | | | | | 63,337,554 | |
|
| |
Investments Purchased with Cash Collateral from Securities on Loan–4.32% | |
Money Market Funds–4.32% | | | | | | | | |
Invesco Private Government Fund, 3.18%(g)(h)(i) | | | 760,848 | | | | 760,848 | |
|
| |
| | | | | | | | |
| | | Shares | | | Value | |
|
| |
Money Market Funds–(continued) | | | | | | | | |
Invesco Private Prime Fund,
3.28%(g)(h)(i) | | | 1,956,079 | | | $ | 1,956,079 | |
|
| |
Total Investments Purchased with Cash Collateral from Securities on Loan
(Cost $2,716,915) | | | | 2,716,927 | |
|
| |
TOTAL INVESTMENTS IN SECURITIES–105.02% (Cost $96,378,604) | | | | 66,054,481 | |
|
| |
OTHER ASSETS LESS LIABILITIES–(5.02)% | | | | (3,158,948 | ) |
|
| |
NET ASSETS–100.00% | | | $ | 62,895,533 | |
|
| |
Investment Abbreviations:
ADR – American Depositary Receipt
Notes to Schedule of Investments:
| (a) | Industry and/or sector classifications used in this report are generally according to the Global Industry Classification Standard, which was developed by and is the exclusive property and a service mark of MSCI Inc. and Standard & Poor’s. |
| (b) | Country of issuer and/or credit risk exposure listed in Common Stocks & Other Equity Interests has been determined to be China unless otherwise noted. |
| (c) | Security purchased or received in a transaction exempt from registration under the Securities Act of 1933, as amended (the “1933 Act”). The security may be resold pursuant to an exemption from registration under the 1933 Act, typically to qualified institutional buyers. The aggregate value of these securities at October 31, 2022 was $1,589,473, which represented 2.53% of the Fund’s Net Assets. |
| (d) | Non-income producing security. |
| (e) | All or a portion of this security was out on loan at October 31, 2022. |
| (f) | Security valued using significant unobservable inputs (Level 3). See Note 3. |
| (g) | Affiliated issuer. The issuer and/or the Fund is a wholly-owned subsidiary of Invesco Ltd., or is affiliated by having an investment adviser that is under common control of Invesco Ltd. The table below shows the Fund’s transactions in, and earnings from, its investments in affiliates for the fiscal year ended October 31, 2022. |
| | | | | | | | | | | | | | | | | | | | | | | | | | | | | | | | | | | |
| | | Value
October 31, 2021 | | Purchases
at Cost | | Proceeds
from Sales | | Change in
Unrealized
Appreciation | | Realized
Gain
(Loss) | | Value
October 31, 2022 | | Dividend Income |
| | | | | | | |
| Investments in Affiliated Money Market Funds: | | | | | | | | | | | | | | | | | | | | | | | | | | | | | | | | | | | |
Invesco Government & Agency Portfolio, Institutional Class | | | $ | 3,397,896 | | | | $ | 26,628,949 | | | | $ | (30,026,845 | ) | | | $ | – | | | | $ | – | | | | $ | – | | | | $ | 16,850 | |
Invesco Liquid Assets Portfolio, Institutional Class | | | | 2,519,751 | | | | | 19,020,679 | | | | | (21,508,042 | ) | | | | 67 | | | | | (792 | ) | | | | 31,663 | | | | | 12,664 | |
Invesco Treasury Portfolio, Institutional Class | | | | 3,883,309 | | | | | 30,433,086 | | | | | (34,316,395 | ) | | | | – | | | | | – | | | | | – | | | | | 18,486 | |
| | | | | | | |
| Investments Purchased with Cash Collateral from Securities on Loan: | | | | | | | | | | | | | | | | | | | | | | | | | | | | | | | | | | | |
Invesco Private Government Fund | | | | 28,962 | | | | | 20,031,587 | | | | | (19,299,701 | ) | | | | – | | | | | – | | | | | 760,848 | | | | | 11,775* | |
Invesco Private Prime Fund | | | | 67,579 | | | | | 48,386,749 | | | | | (46,498,499 | ) | | | | 12 | | | | | 238 | | | | | 1,956,079 | | | | | 27,502* | |
Total | | | $ | 9,897,497 | | | | $ | 144,501,050 | | | | $ | (151,649,482 | ) | | | $ | 79 | | | | $ | (554 | ) | | | $ | 2,748,590 | | | | $ | 87,277 | |
| | * | Represents the income earned on the investment of cash collateral, which is included in securities lending income on the Statement of Operations. Does not include rebates and fees paid to lending agent or premiums received from borrowers, if any. |
| (h) | The rate shown is the 7-day SEC standardized yield as of October 31, 2022. |
| (i) | The security has been segregated to satisfy the commitment to return the cash collateral received in securities lending transactions upon the borrower’s return of the securities loaned. See Note 1I. |
See accompanying Notes to Financial Statements which are an integral part of the financial statements.
| | |
| 8 | | Invesco Greater China Fund |
Statement of Assets and Liabilities
October 31, 2022
| | | | |
Assets: | | | | |
| |
Investments in unaffiliated securities, at value
(Cost $93,630,045)* | | $ | 63,305,891 | |
|
| |
Investments in affiliated money market funds, at value (Cost $2,748,559) | | | 2,748,590 | |
|
| |
Foreign currencies, at value (Cost $38,519) | | | 38,518 | |
|
| |
Receivable for: | | | | |
Fund shares sold | | | 8,102 | |
|
| |
Dividends | | | 6,035 | |
|
| |
Investment for trustee deferred compensation and retirement plans | | | 48,984 | |
|
| |
Other assets | | | 150,126 | |
|
| |
Total assets | | | 66,306,246 | |
|
| |
| |
Liabilities: | | | | |
Payable for: | | | | |
Fund shares reacquired | | | 318,953 | |
|
| |
Amount due custodian | | | 139,773 | |
|
| |
Collateral upon return of securities loaned | | | 2,716,915 | |
|
| |
Accrued fees to affiliates | | | 57,241 | |
|
| |
Accrued trustees’ and officers’ fees and benefits | | | 874 | |
|
| |
Accrued other operating expenses | | | 81,155 | |
|
| |
Trustee deferred compensation and retirement plans | | | 95,802 | |
|
| |
Total liabilities | | | 3,410,713 | |
|
| |
Net assets applicable to shares outstanding | | $ | 62,895,533 | |
|
| |
| |
Net assets consist of: | | | | |
Shares of beneficial interest | | $ | 102,625,698 | |
|
| |
Distributable earnings (loss) | | | (39,730,165 | ) |
|
| |
| | $ | 62,895,533 | |
|
| |
| | | | |
Net Assets: | | | | |
Class A | | $ | 55,282,347 | |
|
| |
Class C | | $ | 2,109,792 | |
|
| |
Class R | | $ | 366,427 | |
|
| |
Class Y | | $ | 4,804,682 | |
|
| |
Class R5 | | $ | 5,795 | |
|
| |
Class R6 | | $ | 326,490 | |
|
| |
|
Shares outstanding, no par value, with an unlimited number of shares authorized: | |
Class A | | | 3,761,329 | |
|
| |
Class C | | | 150,995 | |
|
| |
Class R | | | 25,019 | |
|
| |
Class Y | | | 325,866 | |
|
| |
Class R5 | | | 393 | |
|
| |
Class R6 | | | 22,121 | |
|
| |
Class A: | | | | |
Net asset value per share | | $ | 14.70 | |
| |
Maximum offering price per share | | | | |
(Net asset value of $14.70 ÷ 94.50%) | | $ | 15.56 | |
|
| |
Class C: | | | | |
Net asset value and offering price per share | | $ | 13.97 | |
|
| |
Class R: | | | | |
Net asset value and offering price per share | | $ | 14.65 | |
|
| |
Class Y: | | | | |
Net asset value and offering price per share | | $ | 14.74 | |
|
| |
Class R5: | | | | |
Net asset value and offering price per share | | $ | 14.75 | |
|
| |
Class R6: | | | | |
Net asset value and offering price per share | | $ | 14.76 | |
|
| |
| * | At October 31, 2022, securities with an aggregate value of $2,680,088 were on loan to brokers. |
See accompanying Notes to Financial Statements which are an integral part of the financial statements.
| | |
| 9 | | Invesco Greater China Fund |
Statement of Operations
For the year ended October 31, 2022
| | | | |
Investment income: | | | | |
Dividends (net of foreign withholding taxes of $192,979) | | $ | 2,514,139 | |
|
| |
Dividends from affiliated money market funds (includes net securities lending income of $5,809) | | | 53,809 | |
|
| |
Total investment income | | | 2,567,948 | |
|
| |
| |
Expenses: | | | | |
Advisory fees | | | 844,203 | |
|
| |
Administrative services fees | | | 12,849 | |
|
| |
Custodian fees | | | 54,287 | |
|
| |
Distribution fees: | | | | |
Class A | | | 210,019 | |
|
| |
Class C | | | 31,756 | |
|
| |
Class R | | | 2,693 | |
|
| |
Transfer agent fees – A, C, R and Y | | | 189,857 | |
|
| |
Transfer agent fees – R5 | | | 10 | |
|
| |
Transfer agent fees – R6 | | | 160 | |
|
| |
Trustees’ and officers’ fees and benefits | | | 21,749 | |
|
| |
Registration and filing fees | | | 83,155 | |
|
| |
Reports to shareholders | | | 18,665 | |
|
| |
Professional services fees | | | 70,040 | |
|
| |
Other | | | 13,297 | |
|
| |
Total expenses | | | 1,552,740 | |
|
| |
Less: Fees waived, expenses reimbursed and/or expense offset arrangement(s) | | | (50,066 | ) |
|
| |
Net expenses | | | 1,502,674 | |
|
| |
Net investment income | | | 1,065,274 | |
|
| |
| |
Realized and unrealized gain (loss) from: | | | | |
Net realized gain (loss) from: | | | | |
Unaffiliated investment securities | | | (9,869,514 | ) |
|
| |
Affiliated investment securities | | | (554 | ) |
|
| |
Foreign currencies | | | (82,686 | ) |
|
| |
Forward foreign currency contracts | | | (280 | ) |
|
| |
| | | (9,953,034 | ) |
|
| |
Change in net unrealized appreciation (depreciation) of: | | | | |
Unaffiliated investment securities | | | (39,877,468 | ) |
|
| |
Affiliated investment securities | | | 79 | |
|
| |
Foreign currencies | | | (9,996 | ) |
|
| |
| | | (39,887,385 | ) |
|
| |
Net realized and unrealized gain (loss) | | | (49,840,419 | ) |
|
| |
Net increase (decrease) in net assets resulting from operations | | $ | (48,775,145 | ) |
|
| |
See accompanying Notes to Financial Statements which are an integral part of the financial statements.
| | |
| 10 | | Invesco Greater China Fund |
Statement of Changes in Net Assets
For the years ended October 31, 2022 and 2021
| | | | | | | | |
| | | 2022 | | | 2021 | |
|
| |
Operations: | | | | | | | | |
Net investment income | | $ | 1,065,274 | | | | $ 285,485 | |
|
| |
Net realized gain (loss) | | | (9,953,034 | ) | | | 773,471 | |
|
| |
Change in net unrealized appreciation (depreciation) | | | (39,887,385 | ) | | | (31,937,409 | ) |
|
| |
Net increase (decrease) in net assets resulting from operations | | | (48,775,145 | ) | | | (30,878,453 | ) |
|
| |
| | |
Distributions to shareholders from distributable earnings: | | | | | | | | |
Class A | | | (65,397 | ) | | | (368,979 | ) |
|
| |
Class C | | | – | | | | (19,714 | ) |
|
| |
Class Y | | | (30,560 | ) | | | (40,345 | ) |
|
| |
Class R5 | | | (71 | ) | | | (427 | ) |
|
| |
Class R6 | | | (4,044 | ) | | | (4,688 | ) |
|
| |
Total distributions from distributable earnings | | | (100,072 | ) | | | (434,153 | ) |
|
| |
| | |
Share transactions–net: | | | | | | | | |
Class A | | | (12,713,278 | ) | | | 68,016,911 | |
|
| |
Class C | | | (552,038 | ) | | | 1,787,175 | |
|
| |
Class R | | | (52,658 | ) | | | 911,501 | |
|
| |
Class Y | | | (1,661,147 | ) | | | 6,185,251 | |
|
| |
Class R5 | | | (5,106 | ) | | | 4,762 | |
|
| |
Class R6 | | | (365,504 | ) | | | 352,739 | |
|
| |
Net increase (decrease) in net assets resulting from share transactions | | | (15,349,731 | ) | | | 77,258,339 | |
|
| |
Net increase (decrease) in net assets | | | (64,224,948 | ) | | | 45,945,733 | |
|
| |
| | |
Net assets: | | | | | | | | |
Beginning of year | | | 127,120,481 | | | | 81,174,748 | |
|
| |
End of year | | $ | 62,895,533 | | | $ | 127,120,481 | |
|
| |
See accompanying Notes to Financial Statements which are an integral part of the financial statements.
| | |
| 11 | | Invesco Greater China Fund |
Financial Highlights
The following schedule presents financial highlights for a share of the Fund outstanding throughout the periods indicated.
| | | | | | | | | | | | | | | | | | | | | | | | | | | | | | | | | | | | | | | | | | | | | | | | | | | | | | | | | | | | | | | | | | | | | | |
| | | Net asset value, beginning of period | | Net investment income (loss)(a) | | Net gains (losses) on securities (both realized and unrealized) | | Total from investment operations | | Dividends from net investment income | | Distributions from net realized gains | | Total distributions | | Net asset value, end of period | | Total return (b) | | Net assets, end of period (000’s omitted) | | Ratio of expenses to average net assets with fee waivers and/or expenses absorbed | | Ratio of expenses to average net assets without fee waivers and/or expenses absorbed | | Ratio of net investment income (loss) to average net assets | | Portfolio turnover (c) |
Class A | | | | | | | | | | | | | | | | | | | | | | | | | | | | | | | | | | | | | | | | | | | | | | | | | | | | | | | | | | | | | | | | | | | | | | |
Year ended 10/31/22 | | | $ | 25.26 | | | | $ | 0.23 | (d) | | | $ | (10.77 | ) | | | $ | (10.54 | ) | | | $ | (0.02 | ) | | | $ | – | | | | $ | (0.02 | ) | | | $ | 14.70 | | | | | (41.77 | )% | | | $ | 55,282 | | | | | 1.55 | % | | | | 1.60 | % | | | | 1.10 | %(d) | | | | 114 | % |
Year ended 10/31/21 | | | | 29.41 | | | | | 0.07 | | | | | (4.06 | ) | | | | (3.99 | ) | | | | – | | | | | (0.16 | ) | | | | (0.16 | ) | | | | 25.26 | | | | | (13.66 | ) | | | | 110,423 | | | | | 1.52 | | | | | 1.52 | | | | | 0.23 | | | | | 101 | |
Year ended 10/31/20 | | | | 23.24 | | | | | 0.00 | (d) | | | | 6.42 | | | | | 6.42 | | | | | (0.25 | ) | | | | – | | | | | (0.25 | ) | | | | 29.41 | | | | | 27.92 | | | | | 68,875 | | | | | 1.66 | | | | | 1.67 | | | | | 0.02 | (d) | | | | 59 | |
Year ended 10/31/19 | | | | 25.52 | | | | | 0.20 | (d) | | | | 1.77 | | | | | 1.97 | | | | | (0.21 | ) | | | | (4.04 | ) | | | | (4.25 | ) | | | | 23.24 | | | | | 9.33 | | | | | 62,869 | | | | | 1.76 | | | | | 1.76 | | | | | 0.86 | (d) | | | | 59 | |
Year ended 10/31/18 | | | | 29.40 | | | | | 0.34 | (d) | | | | (4.06 | )(e) | | | | (3.72 | ) | | | | (0.16 | ) | | | | – | | | | | (0.16 | ) | | | | 25.52 | | | | | (12.71 | )(e) | | | | 59,615 | | | | | 1.79 | | | | | 1.80 | | | | | 1.15 | (d) | | | | 45 | |
Class C | | | | | | | | | | | | | | | | | | | | | | | | | | | | | | | | | | | | | | | | | | | | | | | | | | | | | | | | | | | | | | | | | | | | | | |
Year ended 10/31/22 | | | | 24.17 | | | | | 0.07 | (d) | | | | (10.27 | ) | | | | (10.20 | ) | | | | – | | | | | – | | | | | – | | | | | 13.97 | | | | | (42.20 | ) | | | | 2,110 | | | | | 2.30 | | | | | 2.35 | | | | | 0.35 | (d) | | | | 114 | |
Year ended 10/31/21 | | | | 28.37 | | | | | (0.15 | ) | | | | (3.89 | ) | | | | (4.04 | ) | | | | – | | | | | (0.16 | ) | | | | (0.16 | ) | | | | 24.17 | | | | | (14.33 | ) | | | | 4,296 | | | | | 2.27 | | | | | 2.27 | | | | | (0.52 | ) | | | | 101 | |
Year ended 10/31/20 | | | | 22.35 | | | | | (0.18 | )(d) | | | | 6.21 | | | | | 6.03 | | | | | (0.01 | ) | | | | – | | | | | (0.01 | ) | | | | 28.37 | | | | | 26.98 | | | | | 3,647 | | | | | 2.41 | | | | | 2.42 | | | | | (0.73 | )(d) | | | | 59 | |
Year ended 10/31/19 | | | | 24.65 | | | | | 0.02 | (d) | | | | 1.72 | | | | | 1.74 | | | | | – | | | | | (4.04 | ) | | | | (4.04 | ) | | | | 22.35 | | | | | 8.51 | | | | | 5,198 | | | | | 2.51 | | | | | 2.51 | | | | | 0.11 | (d) | | | | 59 | |
Year ended 10/31/18 | | | | 28.45 | | | | | 0.11 | (d) | | | | (3.91 | )(e) | | | | (3.80 | ) | | | | – | | | | | – | | | | | – | | | | | 24.65 | | | | | (13.36 | )(e) | | | | 10,155 | | | | | 2.54 | | | | | 2.55 | | | | | 0.40 | (d) | | | | 45 | |
Class R | | | | | | | | | | | | | | | | | | | | | | | | | | | | | | | | | | | | | | | | | | | | | | | | | | | | | | | | | | | | | | | | | | | | | | |
Year ended 10/31/22 | | | | 25.21 | | | | | 0.18 | (d) | | | | (10.74 | ) | | | | (10.56 | ) | | | | – | | | | | – | | | | | – | | | | | 14.65 | | | | | (41.89 | ) | | | | 366 | | | | | 1.80 | | | | | 1.85 | | | | | 0.85 | (d) | | | | 114 | |
Period ended 10/31/21(f) | | | | 32.59 | | | | | 0.01 | | | | | (7.39 | ) | | | | (7.38 | ) | | | | – | | | | | – | | | | | – | | | | | 25.21 | | | | | (22.65 | ) | | | | 701 | | | | | 1.71 | (g) | | | | 1.71 | (g) | | | | 0.04 | (g) | | | | 101 | |
Class Y | | | | | | | | | | | | | | | | | | | | | | | | | | | | | | | | | | | | | | | | | | | | | | | | | | | | | | | | | | | | | | | | | | | | | | |
Year ended 10/31/22 | | | | 25.34 | | | | | 0.28 | (d) | | | | (10.80 | ) | | | | (10.52 | ) | | | | (0.08 | ) | | | | – | | | | | (0.08 | ) | | | | 14.74 | | | | | (41.64 | ) | | | | 4,805 | | | | | 1.30 | | | | | 1.35 | | | | | 1.35 | (d) | | | | 114 | |
Year ended 10/31/21 | | | | 29.44 | | | | | 0.14 | | | | | (4.08 | ) | | | | (3.94 | ) | | | | – | | | | | (0.16 | ) | | | | (0.16 | ) | | | | 25.34 | | | | | (13.47 | ) | | | | 10,703 | | | | | 1.27 | | | | | 1.27 | | | | | 0.48 | | | | | 101 | |
Year ended 10/31/20 | | | | 23.26 | | | | | 0.06 | (d) | | | | 6.43 | | | | | 6.49 | | | | | (0.31 | ) | | | | – | | | | | (0.31 | ) | | | | 29.44 | | | | | 28.26 | | | | | 7,754 | | | | | 1.41 | | | | | 1.42 | | | | | 0.27 | (d) | | | | 59 | |
Year ended 10/31/19 | | | | 25.57 | | | | | 0.26 | (d) | | | | 1.76 | | | | | 2.02 | | | | | (0.29 | ) | | | | (4.04 | ) | | | | (4.33 | ) | | | | 23.26 | | | | | 9.56 | | | | | 9,339 | | | | | 1.51 | | | | | 1.51 | | | | | 1.11 | (d) | | | | 59 | |
Year ended 10/31/18 | | | | 29.44 | | | | | 0.42 | (d) | | | | (4.07 | )(e) | | | | (3.65 | ) | | | | (0.22 | ) | | | | – | | | | | (0.22 | ) | | | | 25.57 | | | | | (12.48 | )(e) | | | | 7,801 | | | | | 1.54 | | | | | 1.55 | | | | | 1.40 | (d) | | | | 45 | |
Class R5 | | | | | | | | | | | | | | | | | | | | | | | | | | | | | | | | | | | | | | | | | | | | | | | | | | | | | | | | | | | | | | | | | | | | | | |
Year ended 10/31/22 | | | | 25.37 | | | | | 0.30 | (d) | | | | (10.82 | ) | | | | (10.52 | ) | | | | (0.10 | ) | | | | – | | | | | (0.10 | ) | | | | 14.75 | | | | | (41.61 | ) | | | | 6 | | | | | 1.24 | | | | | 1.24 | | | | | 1.41 | (d) | | | | 114 | |
Year ended 10/31/21 | | | | 29.45 | | | | | 0.18 | | | | | (4.10 | ) | | | | (3.92 | ) | | | | – | | | | | (0.16 | ) | | | | (0.16 | ) | | | | 25.37 | | | | | (13.40 | ) | | | | 17 | | | | | 1.17 | | | | | 1.17 | | | | | 0.58 | | | | | 101 | |
Year ended 10/31/20 | | | | 23.27 | | | | | 0.11 | (d) | | | | 6.43 | | | | | 6.54 | | | | | (0.36 | ) | | | | – | | | | | (0.36 | ) | | | | 29.45 | | | | | 28.49 | | | | | 32 | | | | | 1.26 | | | | | 1.27 | | | | | 0.42 | (d) | | | | 59 | |
Year ended 10/31/19 | | | | 25.58 | | | | | 0.30 | (d) | | | | 1.77 | | | | | 2.07 | | | | | (0.34 | ) | | | | (4.04 | ) | | | | (4.38 | ) | | | | 23.27 | | | | | 9.79 | | | | | 23 | | | | | 1.33 | | | | | 1.33 | | | | | 1.29 | (d) | | | | 59 | |
Year ended 10/31/18 | | | | 29.46 | | | | | 0.46 | (d) | | | | (4.08 | )(e) | | | | (3.62 | ) | | | | (0.26 | ) | | | | – | | | | | (0.26 | ) | | | | 25.58 | | | | | (12.38 | )(e) | | | | 25 | | | | | 1.40 | | | | | 1.40 | | | | | 1.54 | (d) | | | | 45 | |
Class R6 | | | | | | | | | | | | | | | | | | | | | | | | | | | | | | | | | | | | | | | | | | | | | | | | | | | | | | | | | | | | | | | | | | | | | | |
Year ended 10/31/22 | | | | 25.37 | | | | | 0.31 | (d) | | | | (10.81 | ) | | | | (10.50 | ) | | | | (0.11 | ) | | | | – | | | | | (0.11 | ) | | | | 14.76 | | | | | (41.55 | ) | | | | 326 | | | | | 1.18 | | | | | 1.18 | | | | | 1.47 | (d) | | | | 114 | |
Year ended 10/31/21 | | | | 29.43 | | | | | 0.18 | | | | | (4.08 | ) | | | | (3.90 | ) | | | | – | | | | | (0.16 | ) | | | | (0.16 | ) | | | | 25.37 | | | | | (13.34 | ) | | | | 981 | | | | | 1.13 | | | | | 1.13 | | | | | 0.62 | | | | | 101 | |
Year ended 10/31/20 | | | | 23.26 | | | | | 0.11 | (d) | | | | 6.42 | | | | | 6.53 | | | | | (0.36 | ) | | | | – | | | | | (0.36 | ) | | | | 29.43 | | | | | 28.46 | | | | | 867 | | | | | 1.25 | | | | | 1.26 | | | | | 0.43 | (d) | | | | 59 | |
Year ended 10/31/19 | | | | 25.57 | | | | | 0.30 | (d) | | | | 1.77 | | | | | 2.07 | | | | | (0.34 | ) | | | | (4.04 | ) | | | | (4.38 | ) | | | | 23.26 | | | | | 9.79 | | | | | 642 | | | | | 1.33 | | | | | 1.33 | | | | | 1.29 | (d) | | | | 59 | |
Year ended 10/31/18 | | | | 29.45 | | | | | 0.46 | (d) | | | | (4.07 | )(e) | | | | (3.61 | ) | | | | (0.27 | ) | | | | – | | | | | (0.27 | ) | | | | 25.57 | | | | | (12.36 | )(e) | | | | 629 | | | | | 1.40 | | | | | 1.40 | | | | | 1.54 | (d) | | | | 45 | |
| (a) | Calculated using average shares outstanding. |
| (b) | Includes adjustments in accordance with accounting principles generally accepted in the United States of America and as such, the net asset value for financial reporting purposes and the returns based upon those net asset values may differ from the net asset value and returns for shareholder transactions. Does not include sales charges and is not annualized for periods less than one year, if applicable. |
| (c) | Portfolio turnover is calculated at the fund level and is not annualized for periods less than one year, if applicable. For the year ended October 31, 2021, the portfolio turnover calculation excludes the value of securities purchased of $64,937,627 in connection with the acquisition of Invesco Pacific Growth Fund into the Fund. |
| (d) | Net investment income (loss) per share and the ratio of net investment income (loss) to average net assets includes significant dividends received during the year ended October 31, 2022. Net investment income (loss) per share and the ratio of net investment income (loss) to average net assets excluding the significant dividends are $ 0.23 and 1.09%, $0.06 and 0.34%, $0.17 and 0.84%, $0.28 and 1.34% , $0.30 and 1.40% and $0.31 and 1.46% for Class A, Class C, Class R, Class Y, Class R5 and Class R6 shares, respectively. Net investment income (loss) per share and the ratio of net investment income (loss) to average net assets includes significant dividends received during the Year ended October 31, 2020. Net investment income (loss) per share and the ratio of net investment income (loss) to average net assets excluding the significant dividends are $(0.05) and (0.17)%, $(0.23) and (0.92)%, $0.01 and 0.08%, $0.06 and 0.23% and $0.06 and 0.24% for Class A, Class C, Class Y, Class R5 and Class R6 shares, respectively. Net investment income (loss) per share and the ratio of net investment income (loss) to average net assets includes significant dividends received during the Year ended October 31, 2019. Net investment income (loss) per share and the ratio of net investment income (loss) to average net assets excluding the significant dividends are $0.05 and 0.20%, $(0.13) and (0.55)%, $0.11 and 0.45%, $0.15 and 0.63% and $0.15 and 0.63% for Class A, Class C, Class Y, Class R5 and Class R6 shares, respectively. Net investment income (loss) per share and the ratio of net investment income (loss) to average net assets includes significant dividends received during the Year ended October 31, 2018. Net investment income (loss) per share and the ratio of net investment income (loss) to average net assets excluding the significant dividends are $0.18 and 0.60%, $(0.05) and (0.15)%, $0.26 and 0.85%, $0.30 and 0.99% and $0.30 and 0.99% for Class A, Class C, Class Y, Class R5 and Class R6 shares, respectively. |
| (e) | Includes litigation proceeds received during the year. Had these litigation proceeds not been received, Net gains (losses) on securities (both realized and unrealized) per share would have been $(4.16), $(4.01), $(4.17), $(4.18) and $(4.17) for Class A, Class C, Class Y, Class R5, and Class R6 shares, respectively. Total returns would have been lower. |
| (f) | Commencement date of April 23, 2021. |
See accompanying Notes to Financial Statements which are an integral part of the financial statements.
| | |
| 12 | | Invesco Greater China Fund |
Notes to Financial Statements
October 31, 2022
NOTE 1–Significant Accounting Policies
Invesco Greater China Fund (the “Fund”) is a series portfolio of AIM Investment Funds (Invesco Investment Funds) (the “Trust”). The Trust is organized as a Delaware statutory trust and is registered under the Investment Company Act of 1940, as amended (the “1940 Act”), as an open-end series management investment company authorized to issue an unlimited number of shares of beneficial interest. Information presented in these financial statements pertains only to the Fund. Matters affecting the Fund or each class will be voted on exclusively by the shareholders of the Fund or each class.
The Fund’s investment objective is long-term growth of capital.
The Fund currently consists of six different classes of shares: Class A, Class C, Class R, Class Y, Class R5 and Class R6. Class Y shares are available only to certain investors. Class A shares are sold with a front-end sales charge unless certain waiver criteria are met. Under certain circumstances, load waived shares may be subject to contingent deferred sales charges (“CDSC”). Class C shares are sold with a CDSC. Class R, Class Y, Class R5 and Class R6 shares are sold at net asset value. Class C shares held for eight years after purchase are eligible for automatic conversion into Class A shares of the same Fund (the “Conversion Feature”). The automatic conversion pursuant to the Conversion Feature will generally occur at the end of the month following the eighth anniversary after a purchase of Class C shares.
The Fund is an investment company and accordingly follows the investment company accounting and reporting guidance in accordance with Financial Accounting Standards Board Accounting Standards Codification Topic 946, Financial Services – Investment Companies.
The following is a summary of the significant accounting policies followed by the Fund in the preparation of its financial statements.
| A. | Security Valuations – Securities, including restricted securities, are valued according to the following policy. |
A security listed or traded on an exchange is generally valued at its trade price or official closing price that day as of the close of the exchange where the security is principally traded, or lacking any trades or official closing price on a particular day, the security may be valued at the closing bid price on that day. Securities traded in the over-the-counter market are valued based on prices furnished by independent pricing services or market makers. When such securities are valued using prices provided by an independent pricing service they may be considered fair valued. Futures contracts are valued at the daily settlement price set by an exchange on which they are principally traded. U.S. exchange-traded options are valued at the mean between the last bid and asked prices from the exchange on which they are principally traded. Non-U.S. exchange-traded options are valued at the final settlement price set by the exchange on which they trade. Options not listed on an exchange and swaps generally are valued using pricing provided from independent pricing services.
Securities of investment companies that are not exchange-traded (e.g., open-end mutual funds) are valued using such company’s end-of-business-day net asset value per share.
Deposits, other obligations of U.S. and non-U.S. banks and financial institutions are valued at their daily account value.
Fixed income securities (including convertible debt securities) generally are valued on the basis of prices provided by independent pricing services. Prices provided by the pricing service may be determined without exclusive reliance on quoted prices, and may reflect appropriate factors such as institution-size trading in similar groups of securities, developments related to specific securities, dividend rate (for unlisted equities), yield (for debt obligations), quality, type of issue, coupon rate (for debt obligations), maturity (for debt obligations), individual trading characteristics and other market data. Pricing services generally value debt obligations assuming orderly transactions of institutional round lot size, but a fund may hold or transact in the same securities in smaller, odd lot sizes. Odd lots often trade at lower prices than institutional round lots, and their value may be adjusted accordingly. Debt obligations are subject to interest rate and credit risks. In addition, all debt obligations involve some risk of default with respect to interest and/or principal payments.
Foreign securities’ (including foreign exchange contracts) prices are converted into U.S. dollar amounts using the applicable exchange rates as of the close of the New York Stock Exchange (“NYSE”). If market quotations are available and reliable for foreign exchange-traded equity securities, the securities will be valued at the market quotations. Invesco Advisers, Inc. (the “Adviser” or “Invesco”) may use various pricing services to obtain market quotations as well as fair value prices. Because trading hours for certain foreign securities end before the close of the NYSE, closing market quotations may become not representative of market value in the Adviser’s judgment (“unreliable”). If, between the time trading ends on a particular security and the close of the customary trading session on the NYSE, a significant event occurs that makes the closing price of the security unreliable, the Adviser may fair value the security. If the event is likely to have affected the closing price of the security, the security will be valued at fair value in good faith in accordance with Board- approved policies and related Adviser procedures (“Valuation Procedures”). Adjustments to closing prices to reflect fair value may also be based on a screening process of an independent pricing service to indicate the degree of certainty, based on historical data, that the closing price in the principal market where a foreign security trades is not the current value as of the close of the NYSE. Foreign securities’ prices meeting the degree of certainty that the price is not reflective of current value will be priced at the indication of fair value from the independent pricing service. Multiple factors may be considered by the independent pricing service in determining adjustments to reflect fair value and may include information relating to sector indices, American Depositary Receipts and domestic and foreign index futures. Foreign securities may have additional risks including exchange rate changes, potential for sharply devalued currencies and high inflation, political and economic upheaval, the relative lack of issuer information, relatively low market liquidity and the potential lack of strict financial and accounting controls and standards.
Unlisted securities will be valued using prices provided by independent pricing services or by another method that the Adviser, in its judgment, believes better reflects the security’s fair value in accordance with the Valuation Procedures.
Securities for which market prices are not provided by any of the above methods may be valued based upon quotes furnished by independent sources. The last bid price may be used to value equity securities. The mean between the last bid and asked prices may be used to value debt obligations, including corporate loans.
Securities for which market quotations are not readily available are fair valued by the Adviser in accordance with the Valuation Procedures. If a fair value price provided by a pricing service is unreliable, the Adviser will fair value the security using the Valuation Procedures. Issuer specific events, market trends, bid/asked quotes of brokers and information providers and other market data may be reviewed in the course of making a good faith determination of a security’s fair value.
The Fund may invest in securities that are subject to interest rate risk, meaning the risk that the prices will generally fall as interest rates rise and, conversely, the prices will generally rise as interest rates fall. Specific securities differ in their sensitivity to changes in interest rates depending on their individual characteristics. Changes in interest rates may result in increased market volatility, which may affect the value and/or liquidity of certain Fund investments.
Valuations change in response to many factors including the historical and prospective earnings of the issuer, the value of the issuer’s assets, general market conditions which are not specifically related to the particular issuer, such as real or perceived adverse economic conditions, changes in the general outlook for revenues or corporate earnings, changes in interest or currency rates, regional or global instability, natural or environmental disasters, widespread disease or other public health issues, war, acts of terrorism, significant governmental actions or adverse investor sentiment generally and market liquidity. Because of the inherent uncertainties of valuation, the values reflected in the financial statements may materially differ from the value received upon actual sale of those investments.
The price the Fund could receive upon the sale of any investment may differ from the Adviser’s valuation of the investment, particularly for securities that are valued using a fair valuation technique. When fair valuation techniques are applied, the Adviser uses available information, including both observable and unobservable inputs and assumptions, to determine a methodology that will result in a valuation that the Adviser believes approximates market value. Fund securities that are fair valued may be subject to greater fluctuation in their value from one day to the next than would be the case if market quotations were used. Because of the inherent uncertainties of valuation, and the degree of subjectivity in such decisions, the Fund could realize a greater or lesser than expected gain or loss upon the sale of the investment.
| | |
| 13 | | Invesco Greater China Fund |
| B. | Securities Transactions and Investment Income – Securities transactions are accounted for on a trade date basis. Realized gains or losses on sales are computed on the basis of specific identification of the securities sold. Interest income (net of withholding tax, if any) is recorded on an accrual basis from settlement date and includes coupon interest and amortization of premium and accretion of discount on debt securities as applicable. Dividend income (net of withholding tax, if any) is recorded on the ex-dividend date. |
The Fund may periodically participate in litigation related to Fund investments. As such, the Fund may receive proceeds from litigation settlements. Any proceeds received are included in the Statement of Operations as realized gain (loss) for investments no longer held and as unrealized gain (loss) for investments still held.
Brokerage commissions and mark ups are considered transaction costs and are recorded as an increase to the cost basis of securities purchased and/or a reduction of proceeds on a sale of securities. Such transaction costs are included in the determination of net realized and unrealized gain (loss) from investment securities reported in the Statement of Operations and the Statement of Changes in Net Assets and the net realized and unrealized gains (losses) on securities per share in the Financial Highlights. Transaction costs are included in the calculation of the Fund’s net asset value and, accordingly, they reduce the Fund’s total returns. These transaction costs are not considered operating expenses and are not reflected in net investment income reported in the Statement of Operations and the Statement of Changes in Net Assets, or the net investment income per share and the ratios of expenses and net investment income reported in the Financial Highlights, nor are they limited by any expense limitation arrangements between the Fund and the investment adviser.
The Fund allocates income and realized and unrealized capital gains and losses to a class based on the relative net assets of each class.
| C. | Country Determination – For the purposes of making investment selection decisions and presentation in the Schedule of Investments, the investment adviser may determine the country in which an issuer is located and/or credit risk exposure based on various factors. These factors include the laws of the country under which the issuer is organized, where the issuer maintains a principal office, the country in which the issuer derives 50% or more of its total revenues, the country that has the primary market for the issuer’s securities and its “country of risk” as determined by a third party service provider, as well as other criteria. Among the other criteria that may be evaluated for making this determination are the country in which the issuer maintains 50% or more of its assets, the type of security, financial guarantees and enhancements, the nature of the collateral and the sponsor organization. Country of issuer and/or credit risk exposure has been determined to be the United States of America, unless otherwise noted. |
| D. | Distributions – Distributions from net investment income and net realized capital gain, if any, are generally declared and paid annually and recorded on the ex-dividend date. The Fund may elect to treat a portion of the proceeds from redemptions as distributions for federal income tax purposes. |
| E. | Federal Income Taxes – The Fund intends to comply with the requirements of Subchapter M of the Internal Revenue Code of 1986, as amended (the “Internal Revenue Code”), necessary to qualify as a regulated investment company and to distribute substantially all of the Fund’s taxable earnings to shareholders. As such, the Fund will not be subject to federal income taxes on otherwise taxable income (including net realized capital gain) that is distributed to shareholders. Therefore, no provision for federal income taxes is recorded in the financial statements. |
The Fund recognizes the tax benefits of uncertain tax positions only when the position is more likely than not to be sustained. Management has analyzed the Fund’s uncertain tax positions and concluded that no liability for unrecognized tax benefits should be recorded related to uncertain tax positions. Management is not aware of any tax positions for which it is reasonably possible that the total amounts of unrecognized tax benefits will change materially in the next 12 months.
The Fund files tax returns in the U.S. Federal jurisdiction and certain other jurisdictions. Generally, the Fund is subject to examinations by such taxing authorities for up to three years after the filing of the return for the tax period.
| F. | Expenses – Fees provided for under the Rule 12b-1 plan of a particular class of the Fund are charged to the operations of such class. Transfer agency fees and expenses and other shareholder recordkeeping fees and expenses attributable to Class R5 and Class R6 are allocated based on relative net assets of Class R5 and Class R6. Sub-accounting fees attributable to Class R5 are charged to the operations of the class. Transfer agency fees and expenses and other shareholder recordkeeping fees and expenses relating to all other classes are allocated among those classes based on relative net assets. All other expenses are allocated among the classes based on relative net assets. |
| G. | Accounting Estimates – The preparation of financial statements in conformity with accounting principles generally accepted in the United States of America (“GAAP”) requires management to make estimates and assumptions that affect the reported amounts of assets and liabilities at the date of the financial statements and the reported amounts of revenues and expenses during the reporting period including estimates and assumptions related to taxation. Actual results could differ from those estimates by a significant amount. In addition, the Fund monitors for material events or transactions that may occur or become known after the period-end date and before the date the financial statements are released to print. |
| H. | Indemnifications – Under the Trust’s organizational documents, each Trustee, officer, employee or other agent of the Trust is indemnified against certain liabilities that may arise out of the performance of their duties to the Fund. Additionally, in the normal course of business, the Fund enters into contracts, including the Fund’s servicing agreements, that contain a variety of indemnification clauses. The Fund’s maximum exposure under these arrangements is unknown as this would involve future claims that may be made against the Fund that have not yet occurred. The risk of material loss as a result of such indemnification claims is considered remote. |
| I. | Securities Lending – The Fund may lend portfolio securities having a market value up to one-third of the Fund’s total assets. Such loans are secured by collateral equal to no less than the market value of the loaned securities determined daily by the securities lending provider. Such collateral will be cash or debt securities issued or guaranteed by the U.S. Government or any of its sponsored agencies. Cash collateral received in connection with these loans is invested in short-term money market instruments or affiliated, unregistered investment companies that comply with Rule 2a-7 under the 1940 Act and money market funds (collectively, “affiliated money market funds”) and is shown as such on the Schedule of Investments. The Fund bears the risk of loss with respect to the investment of collateral. It is the Fund’s policy to obtain additional collateral from or return excess collateral to the borrower by the end of the next business day, following the valuation date of the securities loaned. Therefore, the value of the collateral held may be temporarily less than the value of the securities on loan. When loaning securities, the Fund retains certain benefits of owning the securities, including the economic equivalent of dividends or interest generated by the security. Lending securities entails a risk of loss to the Fund if, and to the extent that, the market value of the securities loaned were to increase and the borrower did not increase the collateral accordingly, and the borrower failed to return the securities. The securities loaned are subject to termination at the option of the borrower or the Fund. Upon termination, the borrower will return to the Fund the securities loaned and the Fund will return the collateral. Upon the failure of the borrower to return the securities, collateral may be liquidated and the securities may be purchased on the open market to replace the loaned securities. The Fund could experience delays and costs in gaining access to the collateral and the securities may lose value during the delay which could result in potential losses to the Fund. Some of these losses may be indemnified by the lending agent. The Fund bears the risk of any deficiency in the amount of the collateral available for return to the borrower due to any loss on the collateral invested. Dividends received on cash collateral investments for securities lending transactions, which are net of compensation to counterparties, are included in Dividends from affiliated money market funds on the Statement of Operations. The aggregate value of securities out on loan, if any, is shown as a footnote on the Statement of Assets and Liabilities. |
The Adviser serves as an affiliated securities lending agent for the Fund. The Bank of New York Mellon also serves as a lending agent. To the extent the Fund utilizes the Adviser as an affiliated securities lending agent, the Fund conducts its securities lending in accordance with, and in reliance upon, no-action letters issued by the SEC staff that provide guidance on how an affiliate may act as a direct agent lender and receive compensation for those services in a manner consistent with the federal securities laws. For the year ended October 31, 2022, fees paid to the Adviser were less than $500. Fees paid to the Adviser for securities lending agent services are included in Dividends from affiliated money market funds on the Statement of Operations.
| J. | Foreign Currency Translations – Foreign currency is valued at the close of the NYSE based on quotations posted by banks and major currency dealers. Portfolio securities and other assets and liabilities denominated in foreign currencies are translated into U.S. dollar amounts at the date of valuation. Purchases |
| | |
| 14 | | Invesco Greater China Fund |
| | and sales of portfolio securities (net of foreign taxes withheld on disposition) and income items denominated in foreign currencies are translated into U.S. dollar amounts on the respective dates of such transactions. The Fund does not separately account for the portion of the results of operations resulting from changes in foreign exchange rates on investments and the fluctuations arising from changes in market prices of securities held. The combined results of changes in foreign exchange rates and the fluctuation of market prices on investments (net of estimated foreign tax withholding) are included with the net realized and unrealized gain or loss from investments in the Statement of Operations. Reported net realized foreign currency gains or losses arise from (1) sales of foreign currencies, (2) currency gains or losses realized between the trade and settlement dates on securities transactions, and (3) the difference between the amounts of dividends, interest, and foreign withholding taxes recorded on the Fund’s books and the U.S. dollar equivalent of the amounts actually received or paid. Net unrealized foreign currency gains and losses arise from changes in the fair values of assets and liabilities, other than investments in securities at fiscal period end, resulting from changes in exchange rates. |
The Fund may invest in foreign securities, which may be subject to foreign taxes on income, gains on investments or currency repatriation, a portion of which may be recoverable. Foreign taxes, if any, are recorded based on the tax regulations and rates that exist in the foreign markets in which the Fund invests and are shown in the Statement of Operations.
| K. | Forward Foreign Currency Contracts – The Fund may engage in foreign currency transactions either on a spot (i.e. for prompt delivery and settlement) basis, or through forward foreign currency contracts, to manage or minimize currency or exchange rate risk. |
The Fund may also enter into forward foreign currency contracts for the purchase or sale of a security denominated in a foreign currency in order to “lock in” the U.S. dollar price of that security, or the Fund may also enter into forward foreign currency contracts that do not provide for physical exchange of the two currencies on the settlement date, but instead are settled by a single cash payment calculated as the difference between the agreed upon exchange rate and the spot rate at settlement based upon an agreed upon notional amount (non-deliverable forwards).
A forward foreign currency contract is an obligation between two parties (“Counterparties”) to purchase or sell a specific currency for an agreed-upon price at a future date. The use of forward foreign currency contracts for hedging does not eliminate fluctuations in the price of the underlying securities the Fund owns or intends to acquire but establishes a rate of exchange in advance. Fluctuations in the value of these contracts are measured by the difference in the contract date and reporting date exchange rates and are recorded as unrealized appreciation (depreciation) until the contracts are closed. When the contracts are closed, realized gains (losses) are recorded. Realized and unrealized gains (losses) on the contracts are included in the Statement of Operations. The primary risks associated with forward foreign currency contracts include failure of the Counterparty to meet the terms of the contract and the value of the foreign currency changing unfavorably. These risks may be in excess of the amounts reflected in the Statement of Assets and Liabilities.
| L. | Other Risks – Investing in a single-country mutual fund involves greater risk than investing in a more diversified fund due to lack of exposure to other countries. |
Investments in companies located or operating in Greater China (normally considered to be the geographical area that includes mainland China, Hong Kong, Macau and Taiwan) involve risks and considerations not typically associated with investments in the U.S. and other Western nations, such as greater government control over the economy; political, legal and regulatory uncertainty; nationalization, expropriation, or confiscation of property; difficulty in obtaining information necessary for investigations into and/or litigation against Chinese companies, as well as in obtaining and/or enforcing judgments; limited legal remedies for shareholders; alteration or discontinuation of economic reforms; military conflicts, either internal or with other countries; inflation, currency fluctuations and fluctuations in inflation and interest rates that may have negative effects on the economy and securities markets of Greater China; and Greater China’s dependency on the economies of other Asian countries, many of which are developing countries. Events in any one country within Greater China may impact the other countries in the region or Greater China as a whole.
The level of development of the economies of countries in the Asia Pacific region varies greatly. Furthermore, since the economies of the countries in the region are largely intertwined, if an economic recession is experienced by any of these countries, it will likely adversely impact the economic performance of other countries in the region. Certain economies in the region may be adversely affected by increased competition, high inflation rates, undeveloped financial services sectors, currency fluctuations or restrictions, political and social instability and increased economic volatility. In addition, the risks of expropriation and/or nationalization of assets, confiscatory taxation, and armed conflict as a result of religious, ethnic, socio-economic and/or political unrest may adversely affect the value of the Fund’s Asia Pacific investments.
Certain securities issued by companies located or operating in Greater China, such as China A-shares, are subject to trading restrictions and suspensions, quota limitations and sudden changes in those limitations, and operational, clearing and settlement risks. Significant portions of the Chinese securities markets may become rapidly illiquid, as Chinese issuers have the ability to suspend the trading of their equity securities, and have shown a willingness to exercise that option in response to market volatility and other events. The liquidity of Chinese securities may shrink or disappear suddenly and without warning as a result of adverse economic, market or political events, or adverse investor perceptions, whether or not accurate.
Active trading of portfolio securities may result in added expenses, a lower return and increased tax liability.
| M. | COVID-19 Risk – The COVID-19 strain of coronavirus has resulted in instances of market closures and dislocations, extreme volatility, liquidity constraints and increased trading costs. Efforts to contain its spread have resulted in travel restrictions, disruptions of healthcare systems, business operations (including business closures) and supply chains, layoffs, lower consumer demand and employee availability, and defaults and credit downgrades, among other significant economic impacts that have disrupted global economic activity across many industries. Such economic impacts may exacerbate other pre-existing political, social and economic risks locally or globally and cause general concern and uncertainty. The full economic impact and ongoing effects of COVID-19 (or other future epidemics or pandemics) at the macro-level and on individual businesses are unpredictable and may result in significant and prolonged effects on the Fund’s performance. |
NOTE 2–Advisory Fees and Other Fees Paid to Affiliates
The Trust has entered into a master investment advisory agreement with the Adviser. Under the terms of the investment advisory agreement, the Fund accrues daily and pays monthly an advisory fee to the Adviser based on the annual rate of the Fund’s average daily net assets as follows:
| | | | |
| Average Daily Net Assets | | Rate | |
|
| |
First $1 billion | | | 0.870% | |
|
| |
Next $ 1 billion | | | 0.820% | |
|
| |
Next $ 49 billion | | | 0.770% | |
|
| |
Over $51 billion | | | 0.760% | |
|
| |
For the year ended October 31, 2022, the effective advisory fee rate incurred by the Fund was 0.87%.
Under the terms of a master sub-advisory agreement between the Adviser and each of Invesco Asset Management Deutschland GmbH, Invesco Asset Management Limited, Invesco Asset Management (Japan) Limited, Invesco Hong Kong Limited, Invesco Senior Secured Management, Inc. and Invesco Canada Ltd. (collectively, the “Affiliated Sub-Advisers”) the Adviser, not the Fund, will pay 40% of the fees paid to the Adviser to any such Affiliated Sub-Adviser(s) that provide(s) discretionary investment management services to the Fund based on the percentage of assets allocated to such Affiliated Sub-Adviser(s).
| | |
| 15 | | Invesco Greater China Fund |
The Adviser has contractually agreed, through at least June 30, 2023, to waive advisory fees and/or reimburse expenses to the extent necessary to limit total annual fund operating expenses after fee waiver and/or expense reimbursement (excluding certain items discussed below) of Class A, Class C, Class R, Class Y, Class R5 and Class R6 shares to 2.25%, 3.00%, 2.50%, 2.00%, 2.00% and 2.00%, respectively, of the Fund’s average daily net assets (the “expense limits”). In determining the Adviser’s obligation to waive advisory fees and/or reimburse expenses, the following expenses are not taken into account, a could cause the total annual fund operating expenses after fee waiver and/or reimbursement to exceed the numbers reflected above: (1) interest; (2) taxes; (3) dividend expense on short sales; (4) extraordinary or non-routine items, including litigation expenses; and (5) expenses that the Fund has incurred but did not actually pay because of an expense offset arrangement. Unless Invesco continues the fee waiver agreement, it will terminate on June 30, 2023. During its term, the fee waiver agreement cannot be terminated or amended to increase the expense limits or reduce the advisory fee waiver without approval of the Board of Trustees. To the extent that the annualized expense ratio does not exceed the expense limit, the Adviser will retain its ability to be reimbursed for such fee wavers or reimbursements prior to the end of each fiscal year end.
Further, the Adviser has contractually agreed, through at least June 30, 2024, to waive the advisory fee payable by the Fund in an amount equal to 100% of the net advisory fees the Adviser receives from the affiliated money market funds on investments by the Fund of uninvested cash (excluding investments of cash collateral from securities lending) in such affiliated money market funds.
For the year ended October 31, 2022, the Adviser waived advisory fees of $3,790 and reimbursed class level expenses of $39,980, $1,448, $259, $3,806, $0, $0 and $0 of Class A, Class C, Class R, Class Y, Investor Class, Class R5 and Class R6 shares, respectively.
The Trust has entered into a master administrative services agreement with Invesco pursuant to which the Fund has agreed to pay Invesco for certain administrative costs incurred in providing accounting services to the Fund. For the year ended October 31, 2022, expenses incurred under the agreement are shown in the Statement of Operations as Administrative services fees. Invesco has entered into a sub-administration agreement whereby State Street Bank and Trust Company (“SSB”) serves as fund accountant and provides certain administrative services to the Fund. Pursuant to a custody agreement with the Trust on behalf of the Fund, SSB also serves as the Fund’s custodian.
The Trust has entered into a transfer agency and service agreement with Invesco Investment Services, Inc. (“IIS”) pursuant to which the Fund has agreed to pay IIS a fee for providing transfer agency and shareholder services to the Fund and reimburse IIS for certain expenses incurred by IIS in the course of providing such services. IIS may make payments to intermediaries that provide omnibus account services, sub-accounting services and/or networking services. All fees payable by IIS to intermediaries that provide omnibus account services or sub-accounting services are charged back to the Fund, subject to certain limitations approved by the Trust’s Board of Trustees. For the year ended October 31, 2022, expenses incurred under the agreement are shown in the Statement of Operations as Transfer agent fees.
The Trust has entered into master distribution agreements with Invesco Distributors, Inc. (“IDI”) to serve as the distributor for the Class A, Class C, Class R, Class Y, Class R5 and Class R6 shares of the Fund. The Trust has adopted plans pursuant to Rule 12b-1 under the 1940 Act with respect to the Fund’s Class A, Class C and Class R shares (collectively the “Plans”). The Fund, pursuant to the Plans, reimburses IDI for its allocated share of expenses incurred for the period, up to a maximum annual rate of 0.25% of the average daily net assets of Class A shares, up to 1.00% of the average daily net assets of Class C shares, and up to 0.50% of the average daily net assets of Class R shares. The fees are accrued daily and paid monthly. Of the Plan payments, up to 0.25% of the average daily net assets of each class of shares may be paid to furnish continuing personal shareholder services to customers who purchase and own shares of such classes. Any amounts not paid as a service fee under the Plan would constitute an asset-based sales charge. Rules of the Financial Industry Regulatory Authority (“FINRA”) impose a cap on the total sales charges, including asset-based sales charges, that may be paid by any class of shares of the Fund. For the year ended October 31, 2022, expenses incurred under the Plans are shown in the Statement of Operations as Distribution fees.
Front-end sales commissions and CDSC (collectively, the “sales charges”) are not recorded as expenses of the Fund. Front-end sales commissions are deducted from proceeds from the sales of Fund shares prior to investment in Class A shares of the Fund. CDSC are deducted from redemption proceeds prior to remittance to the shareholder. During the year ended October 31, 2022, IDI advised the Fund that IDI retained $9,528 in front-end sales commissions from the sale of Class A shares and $21 and $99 from Class A and Class C shares, respectively, for CDSC imposed upon redemptions by shareholders.
Certain officers and trustees of the Trust are officers and directors of the Adviser, IIS and/or IDI.
NOTE 3–Additional Valuation Information
GAAP defines fair value as the price that would be received to sell an asset or paid to transfer a liability in an orderly transaction between market participants at the measurement date, under current market conditions. GAAP establishes a hierarchy that prioritizes the inputs to valuation methods, giving the highest priority to readily available unadjusted quoted prices in an active market for identical assets (Level 1) and the lowest priority to significant unobservable inputs (Level 3), generally when market prices are not readily available. Based on the valuation inputs, the securities or other investments are tiered into one of three levels. Changes in valuation methods may result in transfers in or out of an investment’s assigned level:
| | |
| Level 1 - | | Prices are determined using quoted prices in an active market for identical assets. |
| Level 2 - | | Prices are determined using other significant observable inputs. Observable inputs are inputs that other market participants may use in pricing a security. These may include quoted prices for similar securities, interest rates, prepayment speeds, credit risk, yield curves, loss severities, default rates, discount rates, volatilities and others. |
| Level 3 - | | Prices are determined using significant unobservable inputs. In situations where quoted prices or observable inputs are unavailable (for example, when there is little or no market activity for an investment at the end of the period), unobservable inputs may be used. Unobservable inputs reflect the Adviser’s assumptions about the factors market participants would use in determining fair value of the securities or instruments and would be based on the best available information. |
The following is a summary of the tiered valuation input levels, as of October 31, 2022. The level assigned to the securities valuations may not be an indication of the risk or liquidity associated with investing in those securities. Because of the inherent uncertainties of valuation, the values reflected in the financial statements may materially differ from the value received upon actual sale of those investments.
| | | | | | | | | | | | | | | | |
| | | Level 1 | | | Level 2 | | | Level 3 | | | Total | |
|
| |
Investments in Securities | | | | | | | | | | | | | | | | |
|
| |
Common Stocks & Other Equity Interests | | $ | 2,909,015 | | | $ | 60,396,876 | | | | $0 | | | $ | 63,305,891 | |
|
| |
Money Market Funds | | | 31,663 | | | | 2,716,927 | | | | – | | | | 2,748,590 | |
|
| |
Total Investments | | $ | 2,940,678 | | | $ | 63,113,803 | | | | $0 | | | $ | 66,054,481 | |
|
| |
NOTE 4–Derivative Investments
The Fund may enter into an ISDA Master Agreement under which a fund may trade OTC derivatives. An OTC transaction entered into under an ISDA Master Agreement typically involves a collateral posting arrangement, payment netting provisions and close-out netting provisions. These netting provisions allow for reduction of credit risk through netting of contractual obligations. The enforceability of the netting provisions of the ISDA Master Agreement depends on the governing law of the ISDA Master Agreement, among other factors.
| | |
| 16 | | Invesco Greater China Fund |
For financial reporting purposes, the Fund does not offset OTC derivative assets or liabilities that are subject to ISDA Master Agreements in the Statement of Assets and Liabilities.
Effect of Derivative Investments for the year ended October 31, 2022
The table below summarizes the gains (losses) on derivative investments, detailed by primary risk exposure, recognized in earnings during the period:
| | | | |
| | | Location of Gain (Loss) on
Statement of Operations | |
| | | Currency Risk | |
|
| |
Realized Gain (Loss): | | | | |
Forward foreign currency contracts | | | $(280) | |
|
| |
The table below summarizes the average notional value of derivatives held during the period.
| | |
| | | Forward |
| | | Foreign Currency |
| | | Contracts |
|
|
Average notional value | | $1,038,761 |
|
|
NOTE 5–Expense Offset Arrangement(s)
The expense offset arrangement is comprised of transfer agency credits which result from balances in demand deposit accounts used by the transfer agent for clearing shareholder transactions. For the year ended October 31, 2022, the Fund received credits from this arrangement, which resulted in the reduction of the Fund’s total expenses of $783.
NOTE 6–Trustees’ and Officers’ Fees and Benefits
Trustees’ and Officers’ Fees and Benefits include amounts accrued by the Fund to pay remuneration to certain Trustees and Officers of the Fund. Trustees have the option to defer compensation payable by the Fund, and Trustees’ and Officers’ Fees and Benefits also include amounts accrued by the Fund to fund such deferred compensation amounts. Those Trustees who defer compensation have the option to select various Invesco Funds in which their deferral accounts shall be deemed to be invested. Finally, certain current Trustees were eligible to participate in a retirement plan that provided for benefits to be paid upon retirement to Trustees over a period of time based on the number of years of service. The Fund may have certain former Trustees who also participate in a retirement plan and receive benefits under such plan. Trustees’ and Officers’ Fees and Benefits include amounts accrued by the Fund to fund such retirement benefits. Obligations under the deferred compensation and retirement plans represent unsecured claims against the general assets of the Fund.
NOTE 7–Cash Balances
The Fund is permitted to temporarily carry a negative or overdrawn balance in its account with SSB, the custodian bank. Such balances, if any at period-end, are shown in the Statement of Assets and Liabilities under the payable caption Amount due custodian. To compensate the custodian bank for such overdrafts, the overdrawn Fund may either (1) leave funds as a compensating balance in the account so the custodian bank can be compensated by earning the additional interest; or (2) compensate by paying the custodian bank at a rate agreed upon by the custodian bank and Invesco, not to exceed the contractually agreed upon rate. The Fund may not purchase additional securities when any borrowings from banks or broker-dealers exceed 5% of the Fund’s total assets, or when any borrowings from an Invesco Fund are outstanding.
NOTE 8–Distributions to Shareholders and Tax Components of Net Assets
Tax Character of Distributions to Shareholders Paid During the Fiscal Years Ended October 31, 2022 and 2021:
| | | | | | | | | | | | |
| | | 2022 | | | | | | 2021 | |
|
| |
Ordinary income* | | $ | 100,072 | | | | | | | $ | 145,108 | |
|
| |
Long-term capital gain | | | – | | | | | | | | 289,045 | |
|
| |
Total distributions | | $ | 100,072 | | | | | | | $ | 434,153 | |
|
| |
| * | Includes short-term capital gain distributions, if any. |
Tax Components of Net Assets at Period-End:
| | | | |
| | | 2022 | |
|
| |
Undistributed ordinary income | | $ | 1,274,620 | |
|
| |
Net unrealized appreciation (depreciation) – investments | | | (30,419,262 | ) |
|
| |
Net unrealized appreciation (depreciation) – foreign currencies | | | (23,978 | ) |
|
| |
Temporary book/tax differences | | | (85,047 | ) |
|
| |
Capital loss carryforward | | | (10,476,498 | ) |
|
| |
Shares of beneficial interest | | | 102,625,698 | |
|
| |
Total net assets | | $ | 62,895,533 | |
|
| |
The difference between book-basis and tax-basis unrealized appreciation (depreciation) is due to differences in the timing of recognition of gains and losses on investments for tax and book purposes. The Fund’s net unrealized appreciation (depreciation) difference is attributable primarily to bankrupt securities and wash sales.
The temporary book/tax differences are a result of timing differences between book and tax recognition of income and/or expenses. The Fund’s temporary book/tax differences are the result of the trustee deferral of compensation and retirement plan benefits.
| | |
| 17 | | Invesco Greater China Fund |
Capital loss carryforward is calculated and reported as of a specific date. Results of transactions and other activity after that date may affect the amount of capital loss carryforward actually available for the Fund to utilize. The ability to utilize capital loss carryforward in the future may be limited under the Internal Revenue Code and related regulations based on the results of future transactions.
The Fund has a capital loss carryforward as of October 31, 2022, as follows:
| | | | | | | | | | | | |
| Capital Loss Carryforward* | |
|
| |
| Expiration | | Short-Term | | | | Long-Term | | | | Total | |
|
| |
Not subject to expiration | | $10,476,498 | | | | $– | | | | $ | 10,476,498 | |
|
| |
| * | Capital loss carryforward is reduced for limitations, if any, to the extent required by the Internal Revenue Code and may be further limited depending upon a variety of factors, including the realization of net unrealized gains or losses as of the date of any reorganization. |
NOTE 9–Investment Transactions
The aggregate amount of investment securities (other than short-term securities, U.S. Government obligations and money market funds, if any) purchased and sold by the Fund during the year ended October 31, 2022 was $99,542,236 and $103,433,622, respectively. Cost of investments, including any derivatives, on a tax basis includes the adjustments for financial reporting purposes as of the most recently completed federal income tax reporting period-end.
| | | | |
| Unrealized Appreciation (Depreciation) of Investments on a Tax Basis | | | |
|
| |
Aggregate unrealized appreciation of investments | | $ | 1,682,036 | |
|
| |
Aggregate unrealized (depreciation) of investments | | | (32,101,298 | ) |
|
| |
Net unrealized appreciation (depreciation) of investments | | $ | (30,419,262 | ) |
|
| |
Cost of investments for tax purposes is $96,473,743.
NOTE 10–Reclassification of Permanent Differences
Primarily as a result of differing book/tax treatment of distributions and foreign currency transactions, on October 31, 2022, undistributed net investment income was increased by $234,817 and undistributed net realized gain (loss) was decreased by $234,817. This reclassification had no effect on the net assets or the distributable earnings (loss) of the Fund.
NOTE 11–Share Information
| | | | | | | | | | | | | | | | |
| | | Summary of Share Activity | |
|
| |
| | | Year ended | | | Year ended | |
| | | October 31, 2022(a) | | | October 31, 2021 | |
| | | Shares | | | Amount | | | Shares | | | Amount | |
|
| |
Sold: | | | | | | | | | | | | | | | | |
Class A | | | 551,375 | | | $ | 11,191,105 | | | | 486,983 | | | $ | 14,703,904 | |
|
| |
Class C | | | 56,736 | | | | 1,128,081 | | | | 31,778 | | | | 952,536 | |
|
| |
Class R | | | 9,502 | | | | 198,380 | | | | 5,448 | | | | 148,412 | |
|
| |
Class Y | | | 355,448 | | | | 7,310,714 | | | | 102,517 | | | | 3,096,780 | |
|
| |
Class R5 | | | 1,070 | | | | 22,421 | | | | 2,735 | | | | 83,928 | |
|
| |
Class R6 | | | 8,289 | | | | 172,430 | | | | 15,152 | | | | 427,144 | |
|
| |
| | | | |
Issued as reinvestment of dividends: | | | | | | | | | | | | | | | | |
Class A | | | 2,464 | | | | 57,624 | | | | 11,997 | | | | 350,678 | |
|
| |
Class C | | | - | | | | - | | | | 654 | | | | 18,429 | |
|
| |
Class Y | | | 1,118 | | | | 26,181 | | | | 1,258 | | | | 36,821 | |
|
| |
Class R5 | | | 1 | | | | 31 | | | | 11 | | | | 313 | |
|
| |
Class R6 | | | 144 | | | | 3,377 | | | | 157 | | | | 4,589 | |
|
| |
| | | | |
Automatic conversion of Class C shares to Class A shares: | | | | | | | | | | | | | | | | |
Class A | | | 11,489 | | | | 230,452 | | | | 36,493 | | | | 1,081,327 | |
|
| |
Class C | | | (12,039 | ) | | | (230,452 | ) | | | (37,913 | ) | | | (1,081,327 | ) |
|
| |
| | | | |
Issued in connection with acquisitions:(b) | | | | | | | | | | | | | | | | |
Class A | | | - | | | | - | | | | 2,392,360 | | | | 77,968,123 | |
|
| |
Class C | | | - | | | | - | | | | 118,746 | | | | 3,718,418 | |
|
| |
Class R | | | - | | | | - | | | | 31,836 | | | | 1,037,560 | |
|
| |
Class Y | | | - | | | | - | | | | 516,671 | | | | 16,873,017 | |
|
| |
Class R5 | | | - | | | | - | | | | 553 | | | | 18,086 | |
|
| |
Class R6 | | | - | | | | - | | | | 19,702 | | | | 643,779 | |
|
| |
| | |
| 18 | | Invesco Greater China Fund |
| | | | | | | | | | | | | | | | |
| | | Summary of Share Activity | |
|
| |
| | | Year ended | | | Year ended | |
| | | October 31, 2022(a) | | | October 31, 2021 | |
| | | Shares | | | Amount | | | Shares | | | Amount | |
|
| |
| | | | |
Reacquired: | | | | | | | | | | | | | | | | |
Class A | | | (1,176,210 | ) | | $ | (24,192,459 | ) | | | (897,378 | ) | | $ | (26,087,121 | ) |
|
| |
Class C | | | (71,412 | ) | | | (1,449,667 | ) | | | (64,105 | ) | | | (1,820,881 | ) |
|
| |
Class R | | | (12,296 | ) | | | (251,038 | ) | | | (9,471 | ) | | | (274,471 | ) |
|
| |
Class Y | | | (453,053 | ) | | | (8,998,042 | ) | | | (461,461 | ) | | | (13,821,367 | ) |
|
| |
Class R5 | | | (1,366 | ) | | | (27,558 | ) | | | (3,701 | ) | | | (97,565 | ) |
|
| |
Class R6 | | | (24,964 | ) | | | (541,311 | ) | | | (25,816 | ) | | | (722,773 | ) |
|
| |
Net increase (decrease) in share activity | | | (753,704 | ) | | $ | (15,349,731 | ) | | | 2,275,206 | | | $ | 77,258,339 | |
|
| |
| (a) | There are entities that are record owners of more than 5% of the outstanding shares of the Fund and in the aggregate own 39% of the outstanding shares of the Fund. IDI has an agreement with these entities to sell Fund shares. The Fund, Invesco and/or Invesco affiliates may make payments to these entities, which are considered to be related to the Fund, for providing services to the Fund, Invesco and/or Invesco affiliates including but not limited to services such as securities brokerage, distribution, third party record keeping and account servicing. The Fund has no knowledge as to whether all or any portion of the shares owned of record by these entities are also owned beneficially. |
| (b) | After the close of business on April 23, 2021, the Fund acquired all the net assets of Invesco Pacific Growth Fund (the “Target Fund”) pursuant to a plan of reorganization approved by the Board of Trustees of the Fund on January 22, 2021. The reorganization was executed in order to reduce overlap and increase efficiencies in the Adviser’s product line. The acquisition was accomplished by a tax-free exchange of 3,079,868 shares of the Fund for 2,996,030 shares outstanding of the Target Fund as of the close of business on April 23, 2021. Shares of the Target Fund were exchanged for the like class of shares of the Fund, based on the relative net asset value of the Target Fund to the net asset value of the Fund on the close of business, April 23, 2021. The Target Fund’s net assets as of the close of business on April 23, 2021 of $100,258,983, including $21,757,300 of unrealized appreciation, were combined with those of the Fund. The net assets of the Fund immediately before the acquisition were $92,373,846 and $192,632,829 immediately after the acquisition. |
The pro forma results of operations for the October 31, 2021 assuming the reorganization had been completed on November 1, 2020, the beginning of the annual reporting period are as follows:
| | | | |
Net investment income | | $ | (440,870 | ) |
|
| |
Net realized/unrealized gains | | | (18,268,537 | ) |
|
| |
Change in net assets resulting from operations | | $ | (18,709,407 | ) |
|
| |
As the combined investment portfolios have been managed as a single integrated portfolio since the acquisition was completed, it is not practicable to separate the amounts of revenue and earnings of the Target Fund that has been included in the Fund’s Statement of Operations since April 24, 2021.
| | |
| 19 | | Invesco Greater China Fund |
Report of Independent Registered Public Accounting Firm
To the Board of Trustees of AIM Investment Funds (Invesco Investment Funds) and Shareholders of Invesco Greater China Fund
Opinion on the Financial Statements
We have audited the accompanying statement of assets and liabilities, including the schedule of investments, of Invesco Greater China Fund (one of the funds constituting AIM Investment Funds (Invesco Investment Funds), referred to hereafter as the “Fund”) as of October 31, 2022, the related statement of operations for the year ended October 31, 2022, the statement of changes in net assets for each of the two years in the period ended October 31, 2022, including the related notes, and the financial highlights for each of the periods indicated therein (collectively referred to as the “financial statements”). In our opinion, the financial statements present fairly, in all material respects, the financial position of the Fund as of October 31, 2022, the results of its operations for the year then ended, the changes in its net assets for each of the two years in the period ended October 31, 2022 and the financial highlights for each of the periods indicated therein in conformity with accounting principles generally accepted in the United States of America.
Basis for Opinion
These financial statements are the responsibility of the Fund’s management. Our responsibility is to express an opinion on the Fund’s financial statements based on our audits. We are a public accounting firm registered with the Public Company Accounting Oversight Board (United States) (PCAOB) and are required to be independent with respect to the Fund in accordance with the U.S. federal securities laws and the applicable rules and regulations of the Securities and Exchange Commission and the PCAOB.
We conducted our audits of these financial statements in accordance with the standards of the PCAOB. Those standards require that we plan and perform the audit to obtain reasonable assurance about whether the financial statements are free of material misstatement, whether due to error or fraud.
Our audits included performing procedures to assess the risks of material misstatement of the financial statements, whether due to error or fraud, and performing procedures that respond to those risks. Such procedures included examining, on a test basis, evidence regarding the amounts and disclosures in the financial statements. Our audits also included evaluating the accounting principles used and significant estimates made by management, as well as evaluating the overall presentation of the financial statements. Our procedures included confirmation of securities owned as of October 31, 2022 by correspondence with the custodian, transfer agent and brokers; when replies were not received from brokers, we performed other auditing procedures. We believe that our audits provide a reasonable basis for our opinion.
/s/PricewaterhouseCoopers LLP
Houston, Texas
December 27, 2022
We have served as the auditor of one or more of the investment companies in the Invesco group of investment companies since at least 1995. We have not been able to determine the specific year we began serving as auditor.
| | |
| 20 | | Invesco Greater China Fund |
Calculating your ongoing Fund expenses
Example
As a shareholder of the Fund, you incur two types of costs: (1) transaction costs, which may include sales charges (loads) on purchase payments or contingent deferred sales charges on redemptions, if any; and (2) ongoing costs, including management fees, distribution and/or service (12b-1) fees, and other Fund expenses. This example is intended to help you understand your ongoing costs (in dollars) of investing in the Fund and to compare these costs with ongoing costs of investing in other mutual funds. The example is based on an investment of $1,000 invested at the beginning of the period and held for the entire period May 1, 2022 through October 31, 2022.
Actual expenses
The table below provides information about actual account values and actual expenses. You may use the information in this table, together with the amount you invested, to estimate the expenses that you paid over the period. Simply divide your account value by $1,000 (for example, an $8,600 account value divided by $1,000 = 8.6), then multiply the result by the number in the table under the heading entitled “Actual Expenses Paid During Period” to estimate the expenses you paid on your account during this period.
Hypothetical example for comparison purposes
The table below also provides information about hypothetical account values and hypothetical expenses based on the Fund’s actual expense ratio and an assumed rate of return of 5% per year before expenses, which is not the Fund’s actual return.
The hypothetical account values and expenses may not be used to estimate the actual ending account balance or expenses you paid for the period. You may use this information to compare the ongoing costs of investing in the Fund and other funds. To do so, compare this 5% hypothetical example with the 5% hypothetical examples that appear in the shareholder reports of the other funds.
Please note that the expenses shown in the table are meant to highlight your ongoing costs only and do not reflect any transaction costs, such as sales charges (loads) on purchase payments or contingent deferred sales charges on redemptions, if any. Therefore, the hypothetical information is useful in comparing ongoing costs only, and will not help you determine the relative total costs of owning different funds. In addition, if these transaction costs were included, your costs would have been higher.
| | | | | | | | | | | | | | | | | | | | | | | | | | | | | | |
| | | | | ACTUAL | | HYPOTHETICAL (5% annual return before expenses) | | |
| | | Beginning
Account Value
(05/01/22) | | Ending
Account Value
(10/31/22)1 | | Expenses
Paid During
Period2 | | Ending
Account Value
(10/31/22) | | Expenses
Paid During
Period2 | | Annualized
Expense Ratio |
Class A | | $1,000.00 | | $754.60 | | $7.12 | | $1,017.09 | | $8.19 | | 1.61% |
Class C | | 1,000.00 | | 751.10 | | 10.86 | | 1,012.80 | | 12.48 | | 2.46 |
Class R | | 1,000.00 | | 753.60 | | 8.22 | | 1,015.83 | | 9.45 | | 1.86 |
Class Y | | 1,000.00 | | 755.10 | | 6.02 | | 1,018.35 | | 6.92 | | 1.36 |
Class R5 | | 1,000.00 | | 756.00 | | 5.58 | | 1,018.85 | | 6.41 | | 1.26 |
Class R6 | | 1,000.00 | | 756.20 | | 5.27 | | 1,019.21 | | 6.06 | | 1.19 |
| 1 | The actual ending account value is based on the actual total return of the Fund for the period May 1, 2022 through October 31, 2022, after actual expenses and will differ from the hypothetical ending account value which is based on the Fund’s expense ratio and a hypothetical annual return of 5% before expenses. |
| 2 | Expenses are equal to the Fund’s annualized expense ratio as indicated above multiplied by the average account value over the period, multiplied by 184/365 to reflect the most recent fiscal half year. |
| | |
| 21 | | Invesco Greater China Fund |
Approval of Investment Advisory and Sub-Advisory Contracts
At meetings held on June 13, 2022, the Board of Trustees (the Board or the Trustees) of AIM Investment Funds (Invesco Investment Funds) as a whole, and the independent Trustees, who comprise over 75% of the Board, voting separately, approved the continuance of the Invesco Greater China Fund’s (the Fund) Master Investment Advisory Agreement with Invesco Advisers, Inc. (Invesco Advisers and the investment advisory agreement) and the Master Intergroup Sub-Advisory Contract for Mutual Funds with Invesco Asset Management Deutschland GmbH, Invesco Asset Management Limited, Invesco Asset Management (Japan) Limited, Invesco Hong Kong Limited, Invesco Senior Secured Management, Inc. and Invesco Canada Ltd. (collectively, the Affiliated Sub-Advisers and the sub-advisory contracts) for another year, effective July 1, 2022. After evaluating the factors discussed below, among others, the Board approved the renewal of the Fund’s investment advisory agreement and the sub-advisory contracts and determined that the compensation payable thereunder by the Fund to Invesco Advisers and by Invesco Advisers to the Affiliated Sub-Advisers is fair and reasonable.
The Board’s Evaluation Process
The Board has established an Investments Committee, which in turn has established Sub-Committees that meet throughout the year to review the performance of funds advised by Invesco Advisers (the Invesco Funds). The Sub-Committees meet regularly with portfolio managers for their assigned Invesco Funds and other members of management to review detailed information about investment performance and portfolio attributes of these funds. The Board has established additional standing and ad hoc committees that meet regularly throughout the year to review matters within their purview. The Board took into account evaluations and reports that it received from its committees and sub-committees, as well as the information provided to the Board and its committees and sub-committees throughout the year, in considering whether to approve each Invesco Fund’s investment advisory agreement and sub-advisory contracts.
As part of the contract renewal process, the Board reviews and considers information provided in response to detailed requests for information submitted to management by the independent Trustees with assistance from legal counsel to the independent Trustees and the Senior Officer, an officer of the Invesco Funds who reports directly to the independent Trustees. The Board receives comparative investment performance and fee and expense data regarding the Invesco Funds prepared by Broadridge Financial Solutions, Inc. (Broadridge), an independent mutual fund data provider, as well as information on the composition of the peer groups provided by Broadridge and its methodology for determining peer groups. The Board also receives an independent written evaluation from the Senior Officer. The Senior Officer’s evaluation is prepared as part of his responsibility to manage the process by which the Invesco Funds’ proposed management fees are negotiated during the annual contract renewal process to ensure they are negotiated in a manner that is at arms’ length and reasonable in accordance with certain negotiated regulatory requirements. In
addition to meetings with Invesco Advisers and fund counsel throughout the year and as part of meetings convened on May 2, 2022 and June 13, 2022, the independent Trustees also discussed the continuance of the investment advisory agreement and sub-advisory contracts in separate sessions with the Senior Officer and with independent legal counsel.
The discussion below is a summary of the Senior Officer’s independent written evaluation with respect to the Fund’s investment advisory agreement and sub-advisory contracts, as well as a discussion of the material factors and related conclusions that formed the basis for the Board’s approval of the Fund’s investment advisory agreement and sub-advisory contracts. The Trustees’ review and conclusions are based on the comprehensive consideration of all information presented to them during the course of the year and in prior years and are not the result of any single determinative factor. Moreover, one Trustee may have weighed a particular piece of information or factor differently than another Trustee. The information received and considered by the Board was current as of various dates prior to the Board’s approval on June 13, 2022.
Factors and Conclusions and Summary of Independent Written Fee Evaluation
| A. | Nature, Extent and Quality of Services Provided by Invesco Advisers and the Affiliated Sub-Advisers |
The Board reviewed the nature, extent and quality of the advisory services provided to the Fund by Invesco Advisers under the Fund’s investment advisory agreement, and the credentials and experience of the officers and employees of Invesco Advisers who provide these services, including the Fund’s portfolio manager(s). The Board’s review included consideration of Invesco Advisers’ investment process and oversight, credit analysis, and research capabilities. The Board considered information regarding Invesco Advisers’ programs for and resources devoted to risk management, including management of investment, enterprise, operational, liquidity, valuation and compliance risks, and technology used to manage such risks. The Board also received and reviewed information about Invesco Advisers’ role as administrator of the Invesco Funds’ liquidity risk management program. The Board received a description of, and reports related to, Invesco Advisers’ global security program and business continuity plans and of its approach to data privacy and cybersecurity, including related testing. The Board considered how the cybersecurity and business continuity plans of Invesco Advisers and its key service providers operated in the remote and hybrid working environment resulting from the novel coronavirus (“COVID-19”) pandemic and paved the way for a hybrid working framework in a normalized environment as employees return to the office. The Board also considered non-advisory services that Invesco Advisers and its affiliates provide to the Invesco Funds, such as various back office support functions, third party oversight, internal audit, valuation, portfolio trading and legal and compliance. The Board observed that Invesco Advisers’ systems preparedness and ongoing investment enabled Invesco Advisers to manage, operate and oversee the Invesco Funds with minimal impact or disruption through challenging environments. The Board
reviewed and considered the benefits to shareholders of investing in a Fund that is part of the family of funds under the umbrella of Invesco Ltd., Invesco Advisers’ parent company, and noted Invesco Ltd.’s depth and experience in running an investment management business, as well as its commitment of financial and other resources to such business. The Board concluded that the nature, extent and quality of the services provided to the Fund by Invesco Advisers are appropriate and satisfactory.
The Board reviewed the services that may be provided by the Affiliated Sub-Advisers under the sub-advisory contracts and the credentials and experience of the officers and employees of the Affiliated Sub-Advisers who provide these services. The Board noted the Affiliated Sub-Advisers’ expertise with respect to certain asset classes and that the Affiliated Sub-Advisers have offices and personnel that are located in financial centers around the world. As a result, the Board noted that the Affiliated Sub-Advisers can provide research and investment analysis on the markets and economies of various countries in which the Fund may invest, make recommendations regarding securities and assist with security trades. The Board concluded that the sub-advisory contracts may benefit the Fund and its shareholders by permitting Invesco Advisers to use the resources and talents of the Affiliated Sub-Advisers in managing the Fund. The Board concluded that the nature, extent and quality of the services that may be provided to the Fund by the Affiliated Sub-Advisers are appropriate and satisfactory.
| B. | Fund Investment Performance |
The Board considered Fund investment performance as a relevant factor in considering whether to approve the investment advisory agreement as well as the sub-advisory contracts for the Fund, as Invesco Hong Kong Limited currently manages assets of the Fund.
The Board compared the Fund’s investment performance over multiple time periods ending December 31, 2021 to the performance of funds in the Broadridge performance universe and against the MSCI China All Shares Index (Index). The Board noted that performance of Class A shares of the Fund was in the fifth quintile of its performance universe for the one, three and five year periods (the first quintile being the best performing funds and the fifth quintile being the worst performing funds). The Board noted that performance of Class A shares of the Fund was below the performance of the Index for the one, three and five year periods. The Board noted that stock selection in and overweight allocation to certain Chinese companies and sectors were the primary detractors from Fund performance. The Board recognized that the performance data reflects a snapshot in time as of a particular date and that selecting a different performance period could produce different results. The Board also reviewed more recent Fund performance as well as other performance metrics, which did not change its conclusions.
| C. | Advisory and Sub-Advisory Fees and Fund Expenses |
The Board compared the Fund’s contractual management fee rate to the contractual management fee rates of funds in the Fund’s Broadridge expense
| | |
| 22 | | Invesco Greater China Fund |
group. The Board noted that the contractual management fee rate for Class A shares of the Fund was reasonably comparable to the median contractual management fee rate of funds in its expense group. The Board noted that the Fund’s contractual management fee schedule was reduced at certain breakpoint levels effective 2021. The Board noted that the term “contractual management fee” for funds in the expense group may include both advisory and certain non-portfolio management administrative services fees, but that Broadridge is not able to provide information on a fund by fund basis as to what is included. The Board also reviewed the methodology used by Broadridge in calculating expense group information, which includes using each fund’s contractual management fee schedule (including any applicable breakpoints) as reported in the most recent prospectus or statement of additional information for each fund in the expense group. The Board also considered comparative information regarding the Fund’s total expense ratio and its various components.
The Board noted that Invesco Advisers has contractually agreed to waive fees and/or limit expenses of the Fund for the term disclosed in the Fund’s registration statement in an amount necessary to limit total annual operating expenses to a specified percentage of average daily net assets for each class of the Fund.
The Board also considered the fees charged by Invesco Advisers and its affiliates to other client accounts that are similarly managed. Invesco Advisers reviewed with the Board differences in the scope of services it provides to the Invesco Funds relative to that provided by Invesco Advisers and its affiliates to certain other types of client accounts, including, among others: management of cash flows as a result of redemptions and purchases; necessary infrastructure such as officers, office space, technology, legal and distribution; oversight of service providers; costs and business risks associated with launching new funds and sponsoring and maintaining the product line; and compliance with federal and state laws and regulations. Invesco Advisers also advised the Board that many of the similarly managed client accounts have all-inclusive fee structures, which are not easily un-bundled.
The Board also considered the services that may be provided by the Affiliated Sub-Advisers pursuant to the sub-advisory contracts, as well as the fees payable by Invesco Advisers to the Affiliated Sub-Advisers pursuant to the sub-advisory contracts. The Board noted that Invesco Advisers retains overall responsibility for, and provides services to, sub-advised Invesco Funds, including oversight of the Affiliated Sub-Advisers as well as the additional services described herein other than day-to-day portfolio management.
| D. | Economies of Scale and Breakpoints |
The Board considered the extent to which there may be economies of scale in the provision of advisory services to the Fund and the Invesco Funds, and the extent to which such economies of scale are shared with the Fund and the Invesco Funds. The Board considered that the Fund may benefit from economies of scale through contractual breakpoints in the Fund’s advisory fee schedule, which generally operate to reduce the Fund’s expense ratio as it grows in size. The Board noted that the Fund also shares in economies of scale through Invesco Advisers’ ability to negotiate lower fee arrangements with third party service providers. The Board noted
that the Fund may also benefit from economies of scale through initial fee setting, fee waivers and expense reimbursements, as well as Invesco Advisers’ investment in its business, including investments in business infrastructure, technology and cybersecurity.
| E. | Profitability and Financial Resources |
The Board reviewed information from Invesco Advisers concerning the costs of the advisory and other services that Invesco Advisers and its affiliates provide to the Fund and the Invesco Funds and the profitability of Invesco Advisers and its affiliates in providing these services in the aggregate and on an individual Fund-by-Fund basis. The Board considered the methodology used for calculating profitability and the periodic review and enhancement of such methodology. The Board noted that Invesco Advisers continues to operate at a net profit from services Invesco Advisers and its affiliates provide to the Invesco Funds in the aggregate and to most Funds individually. The Board did not deem the level of profits realized by Invesco Advisers and its affiliates from providing such services to be excessive, given the nature, extent and quality of the services provided. The Board noted that Invesco Advisers provided information demonstrating that Invesco Advisers is financially sound and has the resources necessary to perform its obligations under the investment advisory agreement, and provided representations indicating that the Affiliated Sub-Advisers are financially sound and have the resources necessary to perform their obligations under the sub-advisory contracts.
| F. | Collateral Benefits to Invesco Advisers and its Affiliates |
The Board considered various other benefits received by Invesco Advisers and its affiliates from the relationship with the Fund, including the fees received for providing administrative, transfer agency and distribution services to the Fund. The Board received comparative information regarding fees charged for these services, including information provided by Broadridge and other independent sources. The Board reviewed the performance of Invesco Advisers and its affiliates in providing these services and the organizational structure employed to provide these services. The Board noted that these services are provided to the Fund pursuant to written contracts that are reviewed and subject to approval on an annual basis by the Board based on its determination that the services are required for the operation of the Fund.
The Board considered the benefits realized by Invesco Advisers and the Affiliated Sub-Advisers as a result of portfolio brokerage transactions executed through “soft dollar” arrangements. The Board noted that soft dollar arrangements may result in the Fund bearing costs to purchase research that may be used by Invesco Advisers or the Affiliated Sub-Advisers with other clients and may reduce Invesco Advisers’ or the Affiliated Sub-Advisers’ expenses. The Board also considered that it receives from Invesco Advisers periodic reports that include a representation to the effect that these arrangements are consistent with regulatory requirements. The Board did not deem the soft dollar arrangements to be inappropriate.
The Board considered that the Fund’s uninvested cash and cash collateral from any securities lending arrangements may be invested in registered money market funds or, with regard to securities lending cash collateral, unregistered funds that comply with Rule 2a-7 (collectively referred to as “affiliated
money market funds”) advised by Invesco Advisers. The Board considered information regarding the returns of the affiliated money market funds relative to comparable overnight investments, as well as the fees paid by the affiliated money market funds to Invesco Advisers and its affiliates. In this regard, the Board noted that Invesco Advisers receives advisory fees from these affiliated money market funds attributable to the Fund’s investments. The Board also noted that Invesco Advisers has contractually agreed to waive through varying periods an amount equal to 100% of the net advisory fee Invesco Advisers receives from the affiliated money market funds with respect to the Fund’s investment in the affiliated money market funds of uninvested cash, but not cash collateral. The Board concluded that the advisory fees payable to Invesco Advisers from the Fund’s investment of cash collateral from any securities lending arrangements in the affiliated money market funds are for services that are not duplicative of services provided by Invesco Advisers to the Fund.
The Board considered that Invesco Advisers may serve as the Fund’s affiliated securities lending agent and evaluated the benefits realized by Invesco Advisers when serving in such role, including the compensation received. The Board considered Invesco Advisers’ securities lending platform and corporate governance structure for securities lending, including Invesco Advisers’ Securities Lending Governance Committee and its related responsibilities. The Board noted that to the extent the Fund utilizes Invesco Advisers as an affiliated securities lending agent, the Fund conducts its securities lending in accordance with, and in reliance upon, no-action letters issued by the SEC staff that provide guidance on how an affiliate may act as a direct agent lender and receive compensation for those services without obtaining exemptive relief. The Board considered information provided by Invesco Advisers related to the performance of Invesco Advisers as securities lending agent, including a summary of the securities lending services provided to the Fund by Invesco Advisers and the compensation paid to Invesco Advisers for such services, as well as any revenues generated for the Fund in connection with such securities lending activity and the allocation of such revenue between the Fund and Invesco Advisers.
The Board also received information about commissions that an affiliated broker may receive for executing certain trades for the Fund. Invesco Advisers and the Affiliated Sub-Advisers advised the Board of the benefits to the Fund of executing trades through the affiliated broker and that such trades were executed in compliance with rules under the federal securities laws and consistent with best execution obligations.
| | |
| 23 | | Invesco Greater China Fund |
Tax Information
Form 1099-DIV, Form 1042-S and other year–end tax information provide shareholders with actual calendar year amounts that should be included in their tax returns. Shareholders should consult their tax advisers.
The following distribution information is being provided as required by the Internal Revenue Code or to meet a specific state’s requirement.
The Fund designates the following amounts or, if subsequently determined to be different, the maximum amount allowable for its fiscal year ended October 31, 2022:
| | | | | | | | | | | | |
Federal and State Income Tax | | | | | | | | | |
Qualified Dividend Income* | | | 91.02 | % | | | | | | | | |
Corporate Dividends Received Deduction* | | | 0.00 | % | | | | | | | | |
U.S. Treasury Obligations* | | | 0.06 | % | | | | | | | | |
Qualified Business Income* | | | 0.00 | % | | | | | | | | |
Business Interest Income* | | | 0.00 | % | | | | | | | | |
Foreign Taxes | | $ | 0.0450 | | | | per share | | | | | |
Foreign Source Income | | $ | 0.7057 | | | | per share | | | | | |
|
* The above percentages are based on ordinary income dividends paid to shareholders during the Fund’s fiscal year. | |
| | |
| 24 | | Invesco Greater China Fund |
Trustees and Officers
The address of each trustee and officer is AIM Investment Funds (Invesco Investment Funds) (the “Trust”), 11 Greenway Plaza, Suite 1000, Houston, Texas 77046-1173. The trustees serve for the life of the Trust, subject to their earlier death, incapacitation, resignation, retirement or removal as more specifically provided in the Trust’s organizational documents. Each officer serves for a one year term or until their successors are elected and qualified. Column two below includes length of time served with predecessor entities, if any.
| | | | | | | | |
Name, Year of Birth and Position(s) Held with the Trust | | Trustee and/or Officer Since | | Principal Occupation(s) During Past 5 Years | | Number of
Funds in Fund Complex
Overseen by
Trustee | | Other Directorship(s) Held by Trustee During Past 5 Years |
| Interested Trustee | | | | | | | | |
Martin L. Flanagan1 - 1960 Trustee and Vice Chair | | 2007 | | Executive Director, Chief Executive Officer and President, Invesco Ltd. (ultimate parent of Invesco and a global investment management firm); Trustee and Vice Chair, The Invesco Funds; Vice Chair, Investment Company Institute; and Member of Executive Board, SMU Cox School of Business Formerly: Advisor to the Board, Invesco Advisers, Inc. (formerly known as Invesco Institutional (N.A.), Inc.); Chairman and Chief Executive Officer, Invesco Advisers, Inc. (registered investment adviser); Director, Chairman, Chief Executive Officer and President, Invesco Holding Company (US), Inc. (formerly IVZ Inc.) (holding company), Invesco Group Services, Inc. (service provider) and Invesco North American Holdings, Inc. (holding company); Director, Chief Executive Officer and President, Invesco Holding Company Limited (parent of Invesco and a global investment management firm); Director, Invesco Ltd.; Chairman, Investment Company Institute and President, Co-Chief Executive Officer, Co-President, Chief Operating Officer and Chief Financial Officer, Franklin Resources, Inc. (global investment management organization) | | 189 | | None |
| 1 | Mr. Flanagan is considered an interested person (within the meaning of Section 2(a)(19) of the 1940 Act) of the Trust because he is an officer of the Adviser to the Trust, and an officer and a director of Invesco Ltd., ultimate parent of the Adviser. |
| | |
| T-1 | | Invesco Greater China Fund |
Trustees and Officers–(continued)
| | | | | | | | |
Name, Year of Birth and Position(s) Held with the Trust | | Trustee and/or Officer Since | | Principal Occupation(s) During Past 5 Years | | Number of
Funds in Fund Complex
Overseen by
Trustee | | Other Directorship(s) Held by Trustee During Past 5 Years |
| Independent Trustees | | | | | | | | |
Beth Ann Brown - 1968 Trustee (2019) and Chair (August 2022) | | 2019 | | Independent Consultant Formerly: Head of Intermediary Distribution, Managing Director, Strategic Relations, Managing Director, Head of National Accounts, Senior Vice President, National Account Manager and Senior Vice President, Key Account Manager, Columbia Management Investment Advisers LLC; Vice President, Key Account Manager, Liberty Funds Distributor, Inc.; and Trustee of certain Oppenheimer Funds | | 189 | | Director, Board of Directors of Caron Engineering Inc.; Advisor, Board of Advisors of Caron Engineering Inc.; President and Director, Acton Shapleigh Youth Conservation Corps (non-profit) Formerly: President and Director Director of Grahamtastic Connection (non-profit) |
Cynthia Hostetler -1962 Trustee | | 2017 | | Non-Executive Director and Trustee of a number of public and private business corporations Formerly: Director, Aberdeen Investment Funds (4 portfolios); Director, Artio Global Investment LLC (mutual fund complex); Director, Edgen Group, Inc. (specialized energy and infrastructure products distributor); Director, Genesee & Wyoming, Inc. (railroads); Head of Investment Funds and Private Equity, Overseas Private Investment Corporation; President, First Manhattan Bancorporation, Inc.; and Attorney, Simpson Thacher & Bartlett LLP | | 189 | | Resideo Technologies, Inc. (smart home technology); Vulcan Materials Company (construction materials company); Trilinc Global Impact Fund; Textainer Group Holdings, (shipping container leasing company); Investment Company Institute (professional organization); and Independent Directors Council (professional organization) |
Eli Jones - 1961 Trustee | | 2016 | | Professor and Dean Emeritus, Mays Business School - Texas A&M University Formerly: Dean of Mays Business School-Texas A&M University; Professor and Dean, Walton College of Business, University of Arkansas and E.J. Ourso College of Business, Louisiana State University; and Director, Arvest Bank | | 189 | | Insperity, Inc. (formerly known as Administaff) (human resources provider); and Member of Regional Board of Directors and Board of Directors, First Financial Bancorp (regional bank) |
Elizabeth Krentzman - 1959 Trustee | | 2019 | | Formerly: Principal and Chief Regulatory Advisor for Asset Management Services and U.S. Mutual Fund Leader of Deloitte & Touche LLP; General Counsel of the Investment Company Institute (trade association); National Director of the Investment Management Regulatory Consulting Practice, Principal, Director and Senior Manager of Deloitte & Touche LLP; Assistant Director of the Division of Investment Management - Office of Disclosure and Investment Adviser Regulation of the U.S. Securities and Exchange Commission and various positions with the Division of Investment Management – Office of Regulatory Policy of the U.S. Securities and Exchange Commission; Associate at Ropes & Gray LLP; and Trustee of certain Oppenheimer Funds | | 189 | | Formerly: Member of the Cartica Funds Board of Directors (private investment fund); Trustee of the University of Florida National Board Foundation; and Member of the University of Florida Law Center Association, Inc. Board of Trustees, Audit Committee and Membership Committee |
Anthony J. LaCava, Jr. - 1956 Trustee | | 2019 | | Formerly: Director and Member of the Audit Committee, Blue Hills Bank (publicly traded financial institution) and Managing Partner, KPMG LLP | | 189 | | Blue Hills Bank; Chairman, Bentley University; Member, Business School Advisory Council; and Nominating Committee, KPMG LLP |
Prema Mathai-Davis - 1950 Trustee | | 2001 | | Retired Formerly: Co-Founder & Partner of Quantalytics Research, LLC, (a FinTech Investment Research Platform for the Self-Directed Investor); Trustee of YWCA Retirement Fund; CEO of YWCA of the USA; Board member of the NY Metropolitan Transportation Authority; Commissioner of the NYC Department of Aging; and Board member of Johns Hopkins Bioethics Institute | | 189 | | Member of Board of Positive Planet US (non-profit) and HealthCare Chaplaincy Network (non-profit) |
| | |
| T-2 | | Invesco Greater China Fund |
Trustees and Officers–(continued)
| | | | | | | | |
Name, Year of Birth and Position(s) Held with the Trust | | Trustee and/or Officer Since | | Principal Occupation(s) During Past 5 Years | | Number of
Funds in Fund Complex
Overseen by
Trustee | | Other Directorship(s) Held by Trustee During Past 5 Years |
| Independent Trustees–(continued) | | | | | | |
Joel W. Motley - 1952 Trustee | | 2019 | | Director of Office of Finance, Federal Home Loan Bank System; Managing Director of Carmona Motley Inc. (privately held financial advisor); Member of the Council on Foreign Relations and its Finance and Budget Committee; Chairman Emeritus of Board of Human Rights Watch and Member of its Investment Committee; and Member of Investment Committee Board of Historic Hudson Valley (non-profit cultural organization); Member of the Board, Blue Ocean Acquisition Corp.; and Member of the Vestry and the Investment Committee of Trinity Church Wall Street. Formerly: Managing Director of Public Capital Advisors, LLC (privately held financial advisor); Managing Director of Carmona Motley Hoffman, Inc. (privately held financial advisor); Trustee of certain Oppenheimer Funds; and Director of Columbia Equity Financial Corp. (privately held financial advisor) | | 189 | | Member of Board of Trust for Mutual Understanding (non-profit promoting the arts and environment); Member of Board of Greenwall Foundation (bioethics research foundation) and its Investment Committee; Member of Board of Friends of the LRC (non-profit legal advocacy); and Board Member and Investment Committee Member of Pulitzer Center for Crisis Reporting (non-profit journalism) |
Teresa M. Ressel - 1962 Trustee | | 2017 | | Non-executive director and trustee of a number of public and private business corporations Formerly: Chief Executive Officer, UBS Securities LLC (investment banking); Chief Operating Officer, UBS AG Americas (investment banking); Sr. Management Team Olayan America, The Olayan Group (international investor/commercial/industrial); Assistant Secretary for Management & Budget and Designated Chief Financial Officer, U.S. Department of Treasury and Director, ON Semiconductor Corporation (semiconductor manufacturing) | | 189 | | None |
Robert C. Troccoli - 1949 Trustee | | 2016 | | Retired Formerly: Adjunct Professor, University of Denver – Daniels College of Business; and Managing Partner, KPMG LLP | | 189 | | None |
Daniel S. Vandivort - 1954 Trustee | | 2019 | | President, Flyway Advisory Services LLC (consulting and property management) Formerly: President and Chief Investment Officer, previously Head of Fixed Income, Weiss Peck and Greer/Robeco Investment Management; Trustee and Chair, Weiss Peck and Greer Funds Board; and various capacities at CS First Boston including Head of Fixed Income at First Boston Asset Management. | | 189 | | Formerly: Trustee and Governance Chair, Oppenheimer Funds; Treasurer, Chairman of the Audit and Finance Committee, Huntington Disease Foundation of America |
| | |
| T-3 | | Invesco Greater China Fund |
Trustees and Officers–(continued)
| | | | | | | | |
Name, Year of Birth and Position(s) Held with the Trust | | Trustee and/or Officer Since | | Principal Occupation(s) During Past 5 Years | | Number of
Funds in Fund Complex
Overseen by
Trustee | | Other Directorship(s) Held by Trustee During Past 5 Years |
| Officers | | | | | | | | |
Sheri Morris - 1964 President and Principal Executive Officer | | 1999 | | Director, Invesco Trust Company; Head of Global Fund Services, Invesco Ltd.; President and Principal Executive Officer, The Invesco Funds; Vice President, Invesco Exchange-Traded Fund Trust, Invesco Exchange-Traded Fund Trust II, Invesco India Exchange-Traded Fund Trust, Invesco Actively Managed Exchange-Traded Fund Trust, Invesco Actively Managed Exchange-Traded Commodity Fund Trust and Invesco Exchange-Traded Self-Indexed Fund Trust; and Vice President, OppenheimerFunds, Inc. Formerly: Vice President, Treasurer and Principal Financial Officer, The Invesco Funds; Vice President, Invesco AIM Advisers, Inc., Invesco AIM Capital Management, Inc. and Invesco AIM Private Asset Management, Inc.; Assistant Vice President and Assistant Treasurer, The Invesco Funds; Vice President and Assistant Vice President, Invesco Advisers, Inc.; Assistant Vice President, Invesco AIM Capital Management, Inc. and Invesco AIM Private Asset Management, Inc.; Treasurer, Invesco Exchange-Traded Fund Trust, Invesco Exchange-Traded Fund Trust II, Invesco India Exchange-Traded Fund Trust and Invesco Actively Managed Exchange-Traded Fund Trust; and Senior Vice President, Invesco Advisers, Inc. (formerly known as Invesco Institutional (N.A.), Inc.) (registered investment adviser) | | N/A | | N/A |
Jeffrey H. Kupor - 1968 Senior Vice President, Chief Legal Officer and Secretary | | 2018 | | Head of Legal of the Americas, Invesco Ltd.; Senior Vice President and Secretary, Invesco Advisers, Inc. (formerly known as Invesco Institutional (N.A.), Inc.) (registered investment adviser); Secretary, Invesco Distributors, Inc. (formerly known as Invesco AIM Distributors, Inc.); Vice President and Secretary, Invesco Investment Services, Inc. (formerly known as Invesco AIM Investment Services, Inc.); Senior Vice President, Chief Legal Officer and Secretary, The Invesco Funds; Secretary and General Counsel, Invesco Investment Advisers LLC (formerly known as Van Kampen Asset Management); Secretary and General Counsel, Invesco Capital Markets, Inc. (formerly known as Van Kampen Funds Inc.); Chief Legal Officer, Invesco Exchange-Traded Fund Trust, Invesco Exchange-Traded Fund Trust II, Invesco India Exchange-Traded Fund Trust, Invesco Actively Managed Exchange-Traded Fund Trust, Invesco Actively Managed Exchange-Traded Commodity Fund Trust and Invesco Exchange-Traded Self-Indexed Fund Trust;; Secretary and Vice President, Harbourview Asset Management Corporation; Secretary and Vice President, OppenheimerFunds, Inc. and Invesco Managed Accounts, LLC; Secretary and Senior Vice President, OFI Global Institutional, Inc.; Secretary and Vice President, OFI SteelPath, Inc.; Secretary and Vice President, Oppenheimer Acquisition Corp.; Secretary and Vice President, Shareholder Services, Inc.; and Secretary and Vice President, Trinity Investment Management Corporation Formerly: Senior Vice President, Invesco Distributors, Inc.; Secretary and Vice President, Jemstep, Inc.; Head of Legal, Worldwide Institutional, Invesco Ltd.; Secretary and General Counsel, INVESCO Private Capital Investments, Inc.; Senior Vice President, Secretary and General Counsel, Invesco Management Group, Inc. (formerly known as Invesco AIM Management Group, Inc.); Assistant Secretary, INVESCO Asset Management (Bermuda) Ltd.; Secretary and General Counsel, Invesco Private Capital, Inc.;Assistant Secretary and General Counsel, INVESCO Realty, Inc.; Secretary and General Counsel, Invesco Senior Secured Management, Inc.; Secretary, Sovereign G./P. Holdings Inc.; Secretary, Invesco Indexing LLC; and Secretary, W.L. Ross & Co., LLC | | N/A | | N/A |
Andrew R. Schlossberg - 1974 Senior Vice President | | 2019 | | Senior Vice President, Invesco Group Services, Inc.; Head of the Americas and Senior Managing Director, Invesco Ltd.; Director and Senior Vice President, Invesco Advisers, Inc. (formerly known as Invesco Institutional (N.A.), Inc.) (registered investment adviser); Director and Chairman, Invesco Investment Services, Inc. (formerly known as Invesco AIM Investment Services, Inc.) (registered transfer agent); Senior Vice President, The Invesco Funds; and Director, Invesco Investment Advisers LLC (formerly known as Van Kampen Asset Management) Formerly: Director, President and Chairman, Invesco Insurance Agency, Inc.; Director, Invesco UK Limited; Director and Chief Executive, Invesco Asset Management Limited and Invesco Fund Managers Limited; Assistant Vice President, The Invesco Funds; Senior Vice President, Invesco Advisers, Inc. (formerly known as Invesco Institutional (N.A.), Inc.) (registered investment adviser); Director and Chief Executive, Invesco Administration Services Limited and Invesco Global Investment Funds Limited; Director, Invesco Distributors, Inc.; Head of EMEA, Invesco Ltd.; President, Invesco Actively Managed Exchange-Traded Commodity Fund Trust, Invesco Actively Managed Exchange-Traded Fund Trust, Invesco Exchange-Traded Fund Trust, Invesco Exchange-Traded Fund Trust II and Invesco India Exchange-Traded Fund Trust; and Managing Director and Principal Executive Officer, Invesco Capital Management LLC | | N/A | | N/A |
| | |
| T-4 | | Invesco Greater China Fund |
Trustees and Officers–(continued)
| | | | | | | | |
Name, Year of Birth and Position(s) Held with the Trust | | Trustee and/or Officer Since | | Principal Occupation(s) During Past 5 Years | | Number of
Funds in Fund Complex
Overseen by
Trustee | | Other Directorship(s) Held by Trustee During Past 5 Years |
| Officers–(continued) | | | | | | | | |
John M. Zerr - 1962 Senior Vice President | | 2006 | | Chief Operating Officer of the Americas; Senior Vice President, Invesco Advisers, Inc. (formerly known as Invesco Institutional (N.A.), Inc.) (registered investment adviser); Senior Vice President, Invesco Distributors, Inc. (formerly known as Invesco AIM Distributors, Inc.); Director and Vice President, Invesco Investment Services, Inc. (formerly known as Invesco AIM Investment Services, Inc.) Senior Vice President, The Invesco Funds; Managing Director, Invesco Capital Management LLC; Director, Invesco Investment Advisers LLC (formerly known as Van Kampen Asset Management); Senior Vice President, Invesco Capital Markets, Inc. (formerly known as Van Kampen Funds Inc.); Manager, Invesco Indexing LLC; Manager, Invesco Specialized Products, LLC; Member, Invesco Canada Funds Advisory Board; Director, President and Chief Executive Officer, Invesco Corporate Class Inc. (corporate mutual fund company); and Director, Chairman, President and Chief Executive Officer, Invesco Canada Ltd. (formerly known as Invesco Trimark Ltd./Invesco Trimark Ltèe) (registered investment adviser and registered transfer agent); President, Invesco, Inc.; President, Invesco Global Direct Real Estate Feeder GP Ltd.; President, Invesco IP Holdings (Canada) Ltd; President, Invesco Global Direct Real Estate GP Ltd.; President, Invesco Financial Services Ltd. / Services Financiers Invesco Ltée; and Director and Chairman, Invesco Trust Company Formerly: President, Trimark Investments Ltd/Services Financiers Invesco Ltee; Director and Senior Vice President, Invesco Insurance Agency, Inc.; Director and Senior Vice President, Invesco Management Group, Inc. (formerly known as Invesco AIM Management Group, Inc.); Secretary and General Counsel, Invesco Management Group, Inc. (formerly known as Invesco AIM Management Group, Inc.); Secretary, Invesco Investment Services, Inc. (formerly known as Invesco AIM Investment Services, Inc.); Chief Legal Officer and Secretary, The Invesco Funds; Secretary and General Counsel, Invesco Investment Advisers LLC (formerly known as Van Kampen Asset Management); Secretary and General Counsel, Invesco Capital Markets, Inc. (formerly known as Van Kampen Funds Inc.); Chief Legal Officer, Invesco Exchange-Traded Fund Trust, Invesco Exchange-Traded Fund Trust II, Invesco India Exchange-Traded Fund Trust, Invesco Actively Managed Exchange-Traded Fund Trust, Invesco Actively Managed Exchange-Traded Commodity Fund Trust and Invesco Exchange-Traded Self-Indexed Fund Trust; Secretary, Invesco Indexing LLC; Director, Secretary, General Counsel and Senior Vice President, Van Kampen Exchange Corp.; Director, Vice President and Secretary, IVZ Distributors, Inc. (formerly known as INVESCO Distributors, Inc.); Director and Vice President, INVESCO Funds Group, Inc.; Director and Vice President, Van Kampen Advisors Inc.; Director, Vice President, Secretary and General Counsel, Van Kampen Investor Services Inc.; Director and Secretary, Invesco Distributors, Inc. (formerly known as Invesco AIM Distributors, Inc.); Director, Senior Vice President, General Counsel and Secretary, Invesco AIM Advisers, Inc. and Van Kampen Investments Inc.; Director, Vice President and Secretary, Fund Management Company; Director, Senior Vice President, Secretary, General Counsel and Vice President, Invesco AIM Capital Management, Inc.; and Chief Operating Officer and General Counsel, Liberty Ridge Capital, Inc. (an investment adviser) | | N/A | | N/A |
Gregory G. McGreevey - 1962 Senior Vice President | | 2012 | | Senior Managing Director, Invesco Ltd.; Director, Chairman, President, and Chief Executive Officer, Invesco Advisers, Inc. (formerly known as Invesco Institutional (N.A.), Inc.) (registered investment adviser); Director, Invesco Mortgage Capital, Inc. and Invesco Senior Secured Management, Inc.; Senior Vice President, The Invesco Funds; President, SNW Asset Management Corporation and Invesco Managed Accounts, LLC; Chairman and Director, Invesco Private Capital, Inc.; Chairman and Director, INVESCO Private Capital Investments, Inc.; Chairman and Director, INVESCO Realty, Inc.; and Senior Vice President, Invesco Group Services, Inc. Formerly: Senior Vice President, Invesco Management Group, Inc. and Invesco Advisers, Inc.; Assistant Vice President, The Invesco Funds | | N/A | | N/A |
Adrien Deberghes - 1967 Principal Financial Officer, Treasurer and Vice President | | 2020 | | Head of the Fund Office of the CFO and Fund Administration; Vice President, Invesco Advisers, Inc.; Principal Financial Officer, Treasurer and Vice President, The Invesco Funds; Vice President, Invesco Exchange-Traded Fund Trust, Invesco Exchange-Traded Fund Trust II, Invesco India Exchange-Traded Fund Trust, Invesco Actively Managed Exchange-Traded Fund Trust, Invesco Actively Managed Exchange-Traded Commodity Fund Trust and Invesco Exchange-Traded Self-Indexed Fund Trust Formerly: Senior Vice President and Treasurer, Fidelity Investments | | N/A | | N/A |
Crissie M. Wisdom - 1969 Anti-Money Laundering Compliance Officer | | 2013 | | Anti-Money Laundering and OFAC Compliance Officer for Invesco U.S. entities including: Invesco Advisers, Inc. and its affiliates, Invesco Capital Markets, Inc., Invesco Distributors, Inc., Invesco Investment Services, Inc., The Invesco Funds, Invesco Capital Management, LLC, Invesco Trust Company; and Fraud Prevention Manager for Invesco Investment Services, Inc. | | N/A | | N/A |
| | |
| T-5 | | Invesco Greater China Fund |
Trustees and Officers–(continued)
| | | | | | | | |
Name, Year of Birth and Position(s) Held with the Trust | | Trustee and/or Officer Since | | Principal Occupation(s) During Past 5 Years | | Number of
Funds in Fund Complex
Overseen by
Trustee | | Other Directorship(s) Held by Trustee During Past 5 Years |
| Officers–(continued) | | | | | | | | |
Todd F. Kuehl - 1969 Chief Compliance Officer and Senior Vice President | | 2020 | | Chief Compliance Officer, Invesco Advisers, Inc. (registered investment adviser); and Chief Compliance Officer and Senior Vice President, The Invesco Funds Formerly: Managing Director and Chief Compliance Officer, Legg Mason (Mutual Funds); Chief Compliance Officer, Legg Mason Private Portfolio Group (registered investment adviser) | | N/A | | N/A |
James Bordewick, Jr. - 1959 Senior Vice President and Senior Officer | | 2022 | | Senior Vice President and Senior Officer, The Invesco Funds; and Chief Legal Officer, KingsCrowd, Inc. (research and analytical platform for investment in private capital markets) Formerly, Chief Operating Officer and Head of Legal and Regulatory, Netcapital (private capital investment platform); Managing Director, General Counsel of asset management and Chief Compliance Officer for asset management and private banking, Bank of America Corporation; Chief Legal Officer, Columbia Funds and BofA Funds; Senior Vice President and Associate General Counsel, MFS Investment Management; Chief Legal Officer, MFS Funds; Associate, Ropes & Gray; Associate, Gaston Snow & Ely Bartlett | | N/A | | N/A |
The Statement of Additional Information of the Trust includes additional information about the Fund’s Trustees and is available upon request, without charge, by calling 1.800.959.4246. Please refer to the Fund’s Statement of Additional Information for information on the Fund’s sub-advisers.
Office of the Fund
11 Greenway Plaza, Suite 1000
Houston, TX 77046-1173
Counsel to the Fund
Stradley Ronon Stevens & Young, LLP
2005 Market Street, Suite 2600
Philadelphia, PA 19103-7018
Investment Adviser
Invesco Advisers, Inc.
1555 Peachtree Street, N.E.
Atlanta, GA 30309
Counsel to the Independent Trustees
Goodwin Procter LLP
901 New York Avenue, N.W.
Washington, D.C. 20001
Distributor
Invesco Distributors, Inc.
11 Greenway Plaza, Suite 1000
Houston, TX 77046-1173
Transfer Agent
Invesco Investment Services, Inc.
11 Greenway Plaza, Suite 1000
Houston, TX 77046-1173
Auditors
PricewaterhouseCoopers LLP
1000 Louisiana Street, Suite 5800
Houston, TX 77002-5021
Custodian
State Street Bank and Trust Company
225 Franklin Street
Boston, MA 02110-2801
| | |
| T-6 | | Invesco Greater China Fund |
(This page intentionally left blank)

Go paperless with eDelivery
Visit invesco.com/edelivery to enjoy the convenience and security of anytime electronic access to your investment documents.
With eDelivery, you can elect to have any or all of the following materials delivered straight to your inbox to download, save and print from your own computer:
| ∎ | | Fund reports and prospectuses |
Invesco mailing information
Send general correspondence to Invesco Investment Services, Inc., P.O. Box 219078, Kansas City, MO 64121-9078.
Important notice regarding delivery of security holder documents
To reduce Fund expenses, only one copy of most shareholder documents may be mailed to shareholders with multiple accounts at the same address (Householding). Mailing of your shareholder documents may be householded indefinitely unless you instruct us otherwise. If you do not want the mailing of these documents to be combined with those for other members of your household, please contact Invesco Investment Services, Inc. at 800 959 4246 or contact your financial institution. We will begin sending you individual copies for each account within 30 days after receiving your request.
Fund holdings and proxy voting information
The Fund provides a complete list of its portfolio holdings four times each year, at the end of each fiscal quarter. For the second and fourth quarters, the list appears, respectively, in the Fund’s semiannual and annual reports to shareholders. For the first and third quarters, the Fund files the list with the Securities and Exchange Commission (SEC) as an exhibit to its reports on Form N-PORT. The most recent list of portfolio holdings is available at invesco.com/completeqtrholdings. Shareholders can also look up the Fund’s Form N-PORT filings on the SEC website, sec.gov. The SEC file numbers for the Fund are shown below.
A description of the policies and procedures that the Fund uses to determine how to vote proxies relating to portfolio securities is available without charge, upon request, from our Client Services department at 800 959 4246, or at invesco.com/corporate/about-us/esg. The information is also available on the SEC website, sec.gov.
Information regarding how the Fund voted proxies related to its portfolio securities during the most recent 12-month period ended June 30 is available at invesco.com/proxysearch. This information is also available on the SEC website, sec.gov.
Invesco Advisers, Inc. is an investment adviser; it provides investment advisory services to individual and institutional clients and does not sell securities. Invesco Distributors, Inc. is the US distributor for Invesco Ltd.’s retail mutual funds, exchange-traded funds and institutional money market funds. Both are wholly owned, indirect subsidiaries of Invesco Ltd.
SEC file number(s): 811-05426 and 033-19338 Invesco Distributors, Inc. CHI-AR-1

| | |
| | |
| Annual Report to Shareholders | | October 31, 2022 |
Invesco Health Care Fund
Nasdaq:
A: GGHCX ∎ C: GTHCX ∎ Y: GGHYX ∎ Investor: GTHIX ∎ R6: GGHSX
Management’s Discussion of Fund Performance
| | | | |
| |
Performance summary | |
For the fiscal year ended October 31, 2022, Class A shares of Invesco Health Care Fund (the Fund), at net asset value (NAV), underperformed the S&P Composite 1500 Health Care Index, the Fund’s style-specific benchmark. | |
Your Fund’s long-term performance appears later in this report. | |
| |
Fund vs. Indexes | |
Total returns, 10/31/21 to 10/31/22, at net asset value (NAV). Performance shown does not include applicable contingent deferred sales charges (CDSC) or front-end sales charges, which would have reduced performance. | |
Class A Shares | | | -14.72 | % |
Class C Shares | | | -15.35 | |
Class Y Shares | | | -14.51 | |
Investor Class Shares | | | -14.71 | |
Class R6 Shares | | | -14.40 | |
MSCI World Index▼ (Broad Market Index) | | | -18.48 | |
S&P Composite 1500 Health Care Index▼ (Style-Specific Index) | | | -0.76 | |
| |
Source(s): ▼RIMES Technologies Corp. | | | | |
Market conditions and your Fund
The fiscal year began with continued volatility in equity markets in the fourth quarter of 2021 amid record inflation and the emergence of a new COVID-19 variant. Pandemicrelated supply chain disruption and labor shortages intensified during the quarter, resulting in broadly higher input costs for companies and consumers alike. Additionally, the price of oil rose,1 causing higher gas prices for consumers, and the Consumer Price Index (CPI) reported for November 2021 increased 0.8%, resulting in a 6.8% increase over the prior 12 months, the highest since 1982.2 To combat inflation, the US Federal Reserve (the Fed) announced the potential for three or more interest rate increases in 2022. With solid corporate earnings and optimism about the COVID-19 Omicron variant reporting milder symptoms, stocks rallied at the 2021 year-end.
Equity markets declined in the first quarter of 2022 amid volatility sparked by Russia’s invasion of Ukraine, rising commodity prices, rampant global inflation and the Fed’s shift toward tighter monetary policy. Russia’s invasion exacerbated inflation pressures, disrupting already strained supply chains and increasing shortages of oil, gas and raw materials. The price of oil rose sharply, with crude prices reaching their highest price per barrel since 2008.1 Inflation continued to be a top concern for consumers, investors and the Fed. To combat inflation, the Fed raised the federal funds rate by one-quarter percentage point in March and the Fed indicated it would “taper” its asset purchase program quickly.3
As the war in Ukraine continued and corporate earnings in high-profile names like Netflix reported slowing growth and profits, the equity markets sold off for much of April 2022. The downward direction of the equity markets continued into second quarter of 2022 amid record inflation, rising interest rates and an
increasing likelihood of a US recession. Driven by higher food and energy prices, the CPI rose by yet another 40-year high to 8.6% for the twelve months ended May 2022.2 Oil prices peaked near $122 per barrel in early June, resulting in skyrocketing gasoline prices; the national average price reached a record high above $5 per gallon in early June.1 To tame inflation, the Fed raised the benchmark federal funds rate three more times, by 0.50% in May, by 0.75% in June and another 0.75% in July, which were the largest increases in nearly 30 years.3 US equity markets rose in July and August until Fed chairman Jerome Powell’s hawkish comments at an economic policy symposium held in Jackson Hole, which sparked a sharp selloff at month-end. The Fed reiterated that it would continue taking aggressive action to curb inflation, even though such measures could “bring pain to households and businesses,” and the Fed raised the benchmark federal funds rate by another 0.75% in September.3
After experiencing a sharp drop in September 2022, US equity markets rebounded in October with strong gains, despite mixed data on the economy and corporate earnings. Inflation data reported in October came in higher than expected, and the labor market remained strong, with payroll employment gains and a decline in the unemployment rate to a near record low of 3.5% in September.2 The initial estimate of third quarter real gross domestic product showed an increase of 2.6% (annualized) after falling in the prior two quarters, but the headline number masked a drop in demand and investment. Corporate earnings were generally in line with expectations, but many companies’ forward earnings guidance was weaker than expected.
In this environment, US stocks had negative double-digit returns for the fiscal year of -14.61%, as measured by the S&P 500 Index.4
During the fiscal year, the Fund’s Class A shares at NAV underperformed the S&P Composite 1500 Health Care Index. Underperformance was mainly attributed to weaker stock selection in biotechnology and health care equipment. This was partially offset by our overweight allocation and stock selection within managed care.
At the stock level, the top three individual contributors to absolute Fund performance during the fiscal year were Eli Lilly, United-Health and Elevance Health. All three companies benefited from the general outperformance of the pharmaceutical and managed care industries as they are typically viewed as defensive industries in down markets. Eli Lilly, a large cap pharmaceuticals company, also reported positive data for its drug Tirzepatide and received the U.S. Food and Drug Administration’s approval to use the drug for adults with type 2 diabetes. UnitedHealth and Elevance Health, both managed care companies, reported strong earnings reports that exceeded expectations during the fiscal year.
At the stock level, the top three individual detractors from absolute Fund performance during the fiscal year were Intuitive Surgical, IDEXX Laboratories and Thermo Fisher Scientific. Intuitive Surgical, maker of health care robotic products used in surgeries, fell in sympathy with the market sell-off during the COVID-19 winter surge of 2021 with the Omicron variant. IDEXX Laboratories makes products and services to test and diagnose companion animals, livestock and poultry and to test water and dairy. The stock declined because clinical veterinary visits have decreased due to capacity constraints. However, demand for veterinary care remains strong. Thermo Fisher Scientific, a provider of life science instruments and consumables, was affected from the general underperformance of the life science tools and services industry experienced during the fiscal year.
We invest in premier health care companies that we believe are positioned to compound multi-year growth. We combine in-depth health care experience with bottom-up fundamental analysis to evaluate company management, identify growth prospects and manage risk.
We thank you for your investment in the Invesco Health Care Fund.
1 Source: Bloomberg LP
2 Source: US Bureau of Labor Statistics
3 Source: US Federal Reserve
4 Source: Lipper Inc.
Portfolio manager(s):
Justin Livengood
The views and opinions expressed in management’s discussion of Fund performance are those of Invesco Advisers, Inc. and its affiliates. These views and opinions are subject to change at any time based on factors such as market and economic conditions. These views and opinions may not be
| | |
| 2 | | Invesco Health Care Fund |
relied upon as investment advice or recommendations, or as an offer for a particular security. The information is not a complete analysis of every aspect of any market, country, industry, security or the Fund. Statements of fact are from sources considered reliable, but Invesco Advisers, Inc. makes no representation or warranty as to their completeness or accuracy. Although historical performance is no guarantee of future results, these insights may help you understand our investment management philosophy.
See important Fund and, if applicable, index disclosures later in this report.
| | |
| 3 | | Invesco Health Care Fund |
Your Fund’s Long-Term Performance
Results of a $10,000 Investment – Oldest Share Class(es)
Fund and index data from 10/31/12
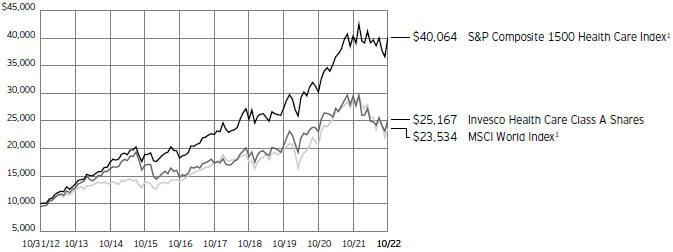
| 1 | Source: RIMES Technologies Corp. |
Past performance cannot guarantee future results.
The data shown in the chart include reinvested distributions, applicable sales charges and Fund expenses including management
fees. Index results include reinvested dividends, but they do not reflect sales charges. Performance of the peer group, if applicable, reflects fund expenses and management fees;
performance of a market index does not. Performance shown in the chart does not reflect deduction of taxes a shareholder would pay on Fund distributions or sale of Fund shares.
| | |
| 4 | | Invesco Health Care Fund |
| | | | |
| |
Average Annual Total Returns | |
As of 10/31/22, including maximum applicable sales charges | |
| |
Class A Shares | | | | |
Inception (8/7/89) | | | 10.06 | % |
10 Years | | | 9.67 | |
5 Years | | | 6.53 | |
1 Year | | | -19.41 | |
| |
Class C Shares | | | | |
Inception (3/1/99) | | | 8.25 | % |
10 Years | | | 9.63 | |
5 Years | | | 6.94 | |
1 Year | | | -15.91 | |
| |
Class Y Shares | | | | |
Inception (10/3/08) | | | 10.00 | % |
10 Years | | | 10.56 | |
5 Years | | | 8.01 | |
1 Year | | | -14.51 | |
| |
Investor Class Shares | | | | |
Inception (7/15/05) | | | 8.17 | % |
10 Years | | | 10.29 | |
5 Years | | | 7.74 | |
1 Year | | | -14.71 | |
| |
Class R6 Shares | | | | |
10 Years | | | 10.49 | % |
5 Years | | | 8.09 | |
1 Year | | | -14.40 | |
Class R6 shares incepted on April 4, 2017. Performance shown prior to that date is that of Class A shares at net asset value and includes the 12b-1 fees applicable to Class A shares.
The performance data quoted represent past performance and cannot guarantee future results; current performance may be lower or higher. Please visit invesco.com/performance for the most recent month-end performance. Performance figures reflect reinvested distributions, changes in net asset value and the effect of the maximum sales charge unless otherwise stated. Performance figures do not reflect deduction of taxes a shareholder would pay on Fund distributions or sale of Fund shares. Investment return and principal value will fluctuate so that you may have a gain or loss when you sell shares.
Class A share performance reflects the maximum 5.50% sales charge, and Class C share performance reflects the applicable contingent deferred sales charge (CDSC) for the period involved. The CDSC on Class C shares is 1% for the first year after purchase. Class Y shares, Investor Class shares and Class R6 shares do not have a front-end sales charge or a CDSC; therefore, performance is at net asset value.
The performance of the Fund’s share classes will differ primarily due to different sales charge structures and class expenses.
Fund performance reflects any applicable fee waivers and/or expense reimbursements. Had the adviser not waived fees and/or reimbursed expenses currently or in
the past, returns would have been lower. See current prospectus for more information.
| | |
| 5 | | Invesco Health Care Fund |
Supplemental Information
Invesco Health Care Fund’s investment objective is long-term growth of capital.
| ∎ | Unless otherwise stated, information presented in this report is as of October 31, 2022, and is based on total net assets. |
| ∎ | Unless otherwise noted, all data is provided by Invesco. |
| ∎ | To access your Fund’s reports/prospectus, visit invesco.com/fundreports. |
About indexes used in this report
| ∎ | The MSCI World IndexSM is an unmanaged index considered representative of stocks of developed countries. The index is computed using the net return, which withholds applicable taxes for non-resident investors. |
| ∎ | The S&P Composite 1500® Health Care Index comprises those companies included in the S&P Composite 1500 that are classified as members of the GICS® Health Care sector. |
| ∎ | The Fund is not managed to track the performance of any particular index, including the index(es) described here, and consequently, the performance of the Fund may deviate significantly from the performance of the index(es). |
| ∎ | A direct investment cannot be made in an index. Unless otherwise indicated, index results include reinvested dividends, and they do not reflect sales charges. Performance of the peer group, if applicable, reflects fund expenses; performance of a market index does not. |
|
|
This report must be accompanied or preceded by a currently effective Fund prospectus, which contains more complete information, including sales charges and expenses. Investors should read it carefully before investing. |
|
| NOT FDIC INSURED | MAY LOSE VALUE | NO BANK GUARANTEE |
| | |
| 6 | | Invesco Health Care Fund |
Fund Information
Portfolio Composition
By industry, based on Net Assets
| | | | |
| |
Pharmaceuticals | | | 21.80 | % |
| |
Managed Health Care | | | 20.87 | |
| |
Biotechnology | | | 19.47 | |
| |
Health Care Equipment | | | 12.82 | |
| |
Life Sciences Tools & Services | | | 11.38 | |
| |
Health Care Distributors | | | 4.20 | |
| |
Health Care Services | | | 2.33 | |
| |
Other Sectors, Each Less than 2% of Net Assets | | | 3.06 | |
| |
Money Market Funds Plus Other Assets Less Liabilities | | | 4.07 | |
Top 10 Equity Holdings*
| | | | | | | |
| | | | | % of total net assets |
| | |
| 1. | | UnitedHealth Group, Inc. | | 9.79% |
| | |
| 2. | | Eli Lilly and Co. | | 6.84 |
| | |
| 3. | | Elevance Health, Inc. | | 5.59 |
| | |
| 4. | | Merck & Co., Inc. | | 4.53 |
| | |
| 5. | | AbbVie, Inc. | | 3.94 |
| | |
| 6. | | Danaher Corp. | | 3.79 |
| | |
| 7. | | Humana, Inc. | | 3.46 |
| | |
| 8. | | Thermo Fisher Scientific, Inc. | | 3.40 |
| | |
| 9. | | Vertex Pharmaceuticals, Inc. | | 2.97 |
| | |
| 10. | | Novo Nordisk A/S, Class B | | 2.89 |
The Fund’s holdings are subject to change, and there is no assurance that the Fund will continue to hold any particular security.
| * | Excluding money market fund holdings, if any. |
Data presented here are as of October 31, 2022.
| | |
| 7 | | Invesco Health Care Fund |
Schedule of Investments(a)
October 31, 2022
| | | | | | | | |
| | | Shares | | | Value | |
|
| |
Common Stocks & Other Equity Interests–95.93% | |
Biotechnology–19.47% | | | | | | | | |
AbbVie, Inc. | | | 363,972 | | | $ | 53,285,501 | |
|
| |
Alnylam Pharmaceuticals, Inc.(b) | | | 58,114 | | | | 12,044,708 | |
|
| |
Amgen, Inc. | | | 87,006 | | | | 23,522,072 | |
|
| |
Argenx SE, ADR (Netherlands)(b) | | | 36,795 | | | | 14,273,884 | |
|
| |
BioCryst Pharmaceuticals, Inc.(b)(c) | | | 204,428 | | | | 2,729,114 | |
|
| |
Biogen, Inc.(b) | | | 16,331 | | | | 4,628,859 | |
|
| |
Cytokinetics, Inc.(b)(c) | | | 36,250 | | | | 1,582,675 | |
|
| |
Genmab A/S, ADR (Denmark)(b)(c) | | | 190,320 | | | | 7,329,223 | |
|
| |
Gilead Sciences, Inc. | | | 111,044 | | | | 8,712,512 | |
|
| |
Halozyme Therapeutics, Inc.(b)(c) | | | 183,104 | | | | 8,754,202 | |
|
| |
Horizon Therapeutics PLC(b) | | | 89,636 | | | | 5,586,115 | |
|
| |
Incyte Corp.(b) | | | 165,438 | | | | 12,298,661 | |
|
| |
Karuna Therapeutics, Inc.(b) | | | 13,882 | | | | 3,044,878 | |
|
| |
Legend Biotech Corp., ADR(b)(c) | | | 74,591 | | | | 3,716,124 | |
|
| |
Myovant Sciences Ltd.(b) | | | 145,262 | | | | 3,884,306 | |
|
| |
Natera, Inc.(b)(c) | | | 46,434 | | | | 2,180,541 | |
|
| |
Neurocrine Biosciences, Inc.(b) | | | 98,041 | | | | 11,286,480 | |
|
| |
Regeneron Pharmaceuticals, Inc.(b) | | | 40,773 | | | | 30,528,784 | |
|
| |
Seagen, Inc.(b) | | | 46,409 | | | | 5,901,368 | |
|
| |
United Therapeutics Corp.(b) | | | 33,404 | | | | 7,700,624 | |
|
| |
Vertex Pharmaceuticals, Inc.(b) | | | 128,669 | | | | 40,144,728 | |
|
| |
| | | | | | | 263,135,359 | |
|
| |
| | |
Health Care Distributors–4.20% | | | | | | | | |
AmerisourceBergen Corp. | | | 172,439 | | | | 27,110,859 | |
|
| |
McKesson Corp. | | | 76,200 | | | | 29,669,994 | |
|
| |
| | | | | | | 56,780,853 | |
|
| |
| | |
Health Care Equipment–12.82% | | | | | | | | |
AtriCure, Inc.(b) | | | 74,734 | | | | 3,147,796 | |
|
| |
Axonics, Inc.(b) | | | 95,297 | | | | 6,970,023 | |
|
| |
Becton, Dickinson and Co. | | | 51,515 | | | | 12,155,995 | |
|
| |
Boston Scientific Corp.(b) | | | 580,640 | | | | 25,031,390 | |
|
| |
DexCom, Inc.(b) | | | 149,524 | | | | 18,059,509 | |
|
| |
Edwards Lifesciences Corp.(b) | | | 103,727 | | | | 7,512,947 | |
|
| |
Globus Medical, Inc., Class A(b)(c) | | | 111,124 | | | | 7,445,308 | |
|
| |
IDEXX Laboratories, Inc.(b) | | | 8,682 | | | | 3,122,742 | |
|
| |
Inari Medical, Inc.(b)(c) | | | 74,514 | | | | 5,732,362 | |
|
| |
Inspire Medical Systems, Inc.(b) | | | 38,074 | | | | 7,422,526 | |
|
| |
Insulet Corp.(b) | | | 42,958 | | | | 11,117,960 | |
|
| |
Intuitive Surgical, Inc.(b) | | | 85,686 | | | | 21,119,028 | |
|
| |
iRhythm Technologies, Inc.(b) | | | 39,941 | | | | 5,092,078 | |
|
| |
ResMed, Inc. | | | 27,166 | | | | 6,076,762 | |
|
| |
Shockwave Medical, Inc.(b) | | | 52,680 | | | | 15,443,142 | |
|
| |
Stryker Corp. | | | 77,801 | | | | 17,835,101 | |
|
| |
| | | | | | | 173,284,669 | |
|
| |
| | |
Health Care Facilities–1.84% | | | | | | | | |
Acadia Healthcare Co., Inc.(b) | | | 107,696 | | | | 8,755,685 | |
|
| |
HCA Healthcare, Inc. | | | 31,985 | | | | 6,955,778 | |
|
| |
Surgery Partners, Inc.(b)(c) | | | 230,242 | | | | 6,260,280 | |
|
| |
Tenet Healthcare Corp.(b) | | | 65,620 | | | | 2,910,903 | |
|
| |
| | | | | | | 24,882,646 | |
|
| |
| | | | | | | | |
| | | Shares | | | Value | |
|
| |
Health Care Services–2.33% | | | | | | | | |
AMN Healthcare Services, Inc.(b) | | | 57,090 | | | $ | 7,164,795 | |
|
| |
CVS Health Corp. | | | 149,503 | | | | 14,157,934 | |
|
| |
Option Care Health, Inc.(b) | | | 213,466 | | | | 6,459,481 | |
|
| |
Privia Health Group, Inc.(b)(c) | | | 110,010 | | | | 3,683,135 | |
|
| |
| | | | | | | 31,465,345 | |
|
| |
| | |
Health Care Supplies–0.79% | | | | | | | | |
Alcon, Inc. (Switzerland) | | | 86,008 | | | | 5,218,966 | |
|
| |
Lantheus Holdings, Inc.(b) | | | 29,063 | | | | 2,150,371 | |
|
| |
Silk Road Medical, Inc.(b) | | | 75,913 | | | | 3,346,245 | |
|
| |
| | | | | | | 10,715,582 | |
|
| |
| | |
Health Care Technology–0.43% | | | | | | | | |
Doximity, Inc., Class A(b)(c) | | | 42,092 | | | | 1,114,175 | |
|
| |
Evolent Health, Inc., Class A(b) | | | 147,949 | | | | 4,706,258 | |
|
| |
| | | | | | | 5,820,433 | |
|
| |
| |
Life Sciences Tools & Services–11.38% | | | | | |
Agilent Technologies, Inc. | | | 43,527 | | | | 6,021,961 | |
|
| |
Bio-Techne Corp. | | | 13,709 | | | | 4,061,428 | |
|
| |
Danaher Corp. | | | 203,569 | | | | 51,232,210 | |
|
| |
IQVIA Holdings, Inc.(b) | | | 37,393 | | | | 7,840,190 | |
|
| |
Lonza Group AG (Switzerland) | | | 4,584 | | | | 2,356,582 | |
|
| |
Maravai LifeSciences Holdings, Inc., Class A(b) | | | 147,526 | | | | 2,448,932 | |
|
| |
Medpace Holdings, Inc.(b)(c) | | | 24,222 | | | | 5,376,800 | |
|
| |
Mettler-Toledo International, Inc.(b) | | | 6,911 | | | | 8,741,931 | |
|
| |
Repligen Corp.(b)(c) | | | 87,611 | | | | 15,988,131 | |
|
| |
Thermo Fisher Scientific, Inc. | | | 89,236 | | | | 45,864,627 | |
|
| |
West Pharmaceutical Services, Inc. | | | 16,870 | | | | 3,881,787 | |
|
| |
| | | | | | | 153,814,579 | |
|
| |
| | |
Managed Health Care–20.87% | | | | | | | | |
Elevance Health, Inc. | | | 138,152 | | | | 75,537,369 | |
|
| |
HealthEquity, Inc.(b)(c) | | | 102,823 | | | | 8,010,940 | |
|
| |
Humana, Inc. | | | 83,775 | | | | 46,753,152 | |
|
| |
Molina Healthcare, Inc.(b) | | | 54,445 | | | | 19,538,133 | |
|
| |
UnitedHealth Group, Inc. | | | 238,401 | | | | 132,348,315 | |
|
| |
| | | | | | | 282,187,909 | |
|
| |
| | |
Pharmaceuticals–21.80% | | | | | | | | |
AstraZeneca PLC (United Kingdom) | | | 39,053 | | | | 4,581,717 | |
|
| |
AstraZeneca PLC, ADR (United Kingdom) | | | 541,560 | | | | 31,849,144 | |
|
| |
Eli Lilly and Co. | | | 255,385 | | | | 92,472,355 | |
|
| |
Harmony Biosciences Holdings,
Inc.(b)(c) | | | 36,308 | | | | 1,888,016 | |
|
| |
Intra-Cellular Therapies, Inc.(b) | | | 81,057 | | | | 3,701,873 | |
|
| |
Merck & Co., Inc. | | | 604,862 | | | | 61,212,034 | |
|
| |
Novo Nordisk A/S, Class B (Denmark) | | | 359,549 | | | | 39,074,081 | |
|
| |
Pacira BioSciences, Inc.(b)(c) | | | 40,130 | | | | 2,077,129 | |
|
| |
Pfizer, Inc. | | | 644,881 | | | | 30,019,210 | |
|
| |
Roche Holding AG | | | 23,046 | | | | 7,659,363 | |
|
| |
Royalty Pharma PLC, Class A | | | 311,378 | | | | 13,177,517 | |
|
| |
Zoetis, Inc. | | | 46,551 | | | | 7,018,960 | |
|
| |
| | | | | | | 294,731,399 | |
|
| |
Total Common Stocks & Other Equity Interests
(Cost $937,083,207) | | | | 1,296,818,774 | |
|
| |
See accompanying Notes to Financial Statements which are an integral part of the financial statements.
| | |
| 8 | | Invesco Health Care Fund |
| | | | | | | | |
| | | Shares | | | Value | |
|
| |
Money Market Funds–3.59% | | | | | | | | |
Invesco Government & Agency Portfolio, Institutional Class, 3.07%(d)(e) | | | 16,763,030 | | | $ | 16,763,030 | |
|
| |
Invesco Liquid Assets Portfolio, Institutional Class, 3.03%(d)(e) | | | 12,621,828 | | | | 12,624,352 | |
|
| |
Invesco Treasury Portfolio, Institutional Class, 3.08%(d)(e) | | | 19,157,749 | | | | 19,157,749 | |
|
| |
Total Money Market Funds
(Cost $48,539,966) | | | | 48,545,131 | |
|
| |
TOTAL INVESTMENTS IN SECURITIES (excluding investments purchased with cash collateral from securities on loan)-99.52%
(Cost $985,623,173) | | | | | | | 1,345,363,905 | |
|
| |
| | | | | | | | |
| | | Shares | | | Value | |
|
| |
Investments Purchased with Cash Collateral from Securities on Loan | |
Money Market Funds–2.80% | | | | | | | | |
Invesco Private Government Fund, 3.18%(d)(e)(f) | | | 10,015,507 | | | $ | 10,015,507 | |
|
| |
Invesco Private Prime Fund, 3.28%(d)(e)(f) | | | 27,798,816 | | | | 27,798,816 | |
|
| |
Total Investments Purchased with Cash Collateral from Securities on Loan
(Cost $37,814,313) | | | | 37,814,323 | |
|
| |
TOTAL INVESTMENTS IN SECURITIES–102.32%
(Cost $1,023,437,486) | | | | 1,383,178,228 | |
|
| |
OTHER ASSETS LESS LIABILITIES–(2.32)% | | | | (31,338,709 | ) |
|
| |
NET ASSETS–100.00% | | | | | | $ | 1,351,839,519 | |
|
| |
Investment Abbreviations:
ADR – American Depositary Receipt
Notes to Schedule of Investments:
| (a) | Industry and/or sector classifications used in this report are generally according to the Global Industry Classification Standard, which was developed by and is the exclusive property and a service mark of MSCI Inc. and Standard & Poor’s. |
| (b) | Non-income producing security. |
| (c) | All or a portion of this security was out on loan at October 31, 2022. |
| (d) | Affiliated issuer. The issuer and/or the Fund is a wholly-owned subsidiary of Invesco Ltd., or is affiliated by having an investment adviser that is under common control of Invesco Ltd. The table below shows the Fund’s transactions in, and earnings from, its investments in affiliates for the fiscal year ended October 31, 2022. |
| | | | | | | | | | | | | | | | | | | | | | | | | | | | |
| | | Value
October 31, 2021 | | | Purchases
at Cost | | | Proceeds
from Sales | | | Change in
Unrealized
Appreciation | | | Realized Gain
(Loss) | | | Value
October 31, 2022 | | | Dividend Income | |
| | | | | | | |
| Investments in Affiliated Money Market Funds: | | | | | | | | | | | | | | | | | | | | | | | | | | | | |
| | | | | | | |
Invesco Government & Agency Portfolio, Institutional Class | | | $ 9,024,801 | | | | $112,819,754 | | | $ | (105,081,525 | ) | | | $ - | | | | $ - | | | | $16,763,030 | | | | $ 161,443 | |
| | | | | | | |
Invesco Liquid Assets Portfolio, Institutional Class | | | 7,098,845 | | | | 80,585,538 | | | | (75,058,232 | ) | | | 3,345 | | | | (5,144 | ) | | | 12,624,352 | | | | 122,465 | |
| | | | | | | |
Invesco Treasury Portfolio, Institutional Class | | | 10,314,059 | | | | 128,936,862 | | | | (120,093,172 | ) | | | - | | | | - | | | | 19,157,749 | | | | 176,475 | |
| | | | | | | |
| Investments Purchased with Cash Collateral from Securities on Loan: | | | | | | | | | | | | | | | | | | | | | | | | | | | | |
| | | | | | | |
Invesco Private Government Fund | | | 20,776,049 | | | | 185,877,046 | | | | (196,637,588 | ) | | | - | | | | - | | | | 10,015,507 | | | | 171,513* | |
| | | | | | | |
Invesco Private Prime Fund | | | 48,477,448 | | | | 381,298,818 | | | | (401,963,004 | ) | | | 10 | | | | (14,456 | ) | | | 27,798,816 | | | | 481,026* | |
| | | | | | | |
Total | | | $95,691,202 | | | | $889,518,018 | | | $ | (898,833,521 | ) | | | $3,355 | | | | $(19,600 | ) | | | $86,359,454 | | | | $1,112,922 | |
| | * | Represents the income earned on the investment of cash collateral, which is included in securities lending income on the Statement of Operations. Does not include rebates and fees paid to lending agent or premiums received from borrowers, if any. |
| (e) | The rate shown is the 7-day SEC standardized yield as of October 31, 2022. |
| (f) | The security has been segregated to satisfy the commitment to return the cash collateral received in securities lending transactions upon the borrower’s return of the securities loaned. See Note 1I. |
See accompanying Notes to Financial Statements which are an integral part of the financial statements.
| | |
| 9 | | Invesco Health Care Fund |
Statement of Assets and Liabilities
October 31, 2022
| | | | |
Assets: | | | | |
| |
Investments in unaffiliated securities, at value
(Cost $937,083,207)* | | $ | 1,296,818,774 | |
|
| |
Investments in affiliated money market funds, at value
(Cost $86,354,279) | | | 86,359,454 | |
|
| |
Foreign currencies, at value (Cost $1,028) | | | 930 | |
|
| |
Receivable for: | | | | |
Investments sold | | | 9,618,219 | |
|
| |
Fund shares sold | | | 165,676 | |
|
| |
Dividends | | | 2,088,514 | |
|
| |
Investment for trustee deferred compensation and retirement plans | | | 177,574 | |
|
| |
Other assets | | | 53,094 | |
|
| |
Total assets | | | 1,395,282,235 | |
|
| |
| |
Liabilities: | | | | |
| |
Payable for: | | | | |
Investments purchased | | | 3,816,999 | |
|
| |
Fund shares reacquired | | | 770,885 | |
|
| |
Amount due custodian | | | 3,540 | |
|
| |
Collateral upon return of securities loaned | | | 37,814,313 | |
|
| |
Accrued fees to affiliates | | | 646,070 | |
|
| |
Accrued trustees’ and officers’ fees and benefits | | | 1,152 | |
|
| |
Accrued other operating expenses | | | 153,183 | |
|
| |
Trustee deferred compensation and retirement plans | | | 236,574 | |
|
| |
Total liabilities | | | 43,442,716 | |
|
| |
Net assets applicable to shares outstanding | | $ | 1,351,839,519 | |
|
| |
| |
Net assets consist of: | | | | |
| |
Shares of beneficial interest | | $ | 1,020,812,291 | |
|
| |
Distributable earnings | | | 331,027,228 | |
|
| |
| | $ | 1,351,839,519 | |
|
| |
| | | | |
Net Assets: | | | | |
| |
Class A | | $ | 696,307,857 | |
|
| |
Class C | | $ | 20,023,114 | |
|
| |
Class Y | | $ | 46,087,474 | |
|
| |
Investor Class | | $ | 588,159,404 | |
|
| |
Class R6 | | $ | 1,261,670 | |
|
| |
|
Shares outstanding, no par value, with an unlimited number of shares authorized: | |
| |
Class A | | | 20,398,929 | |
|
| |
Class C | | | 1,138,296 | |
|
| |
Class Y | | | 1,301,394 | |
|
| |
Investor Class | | | 17,226,330 | |
|
| |
Class R6 | | | 35,483 | |
|
| |
Class A: | | | | |
Net asset value per share | | $ | 34.13 | |
|
| |
Maximum offering price per share
(Net asset value of $34.13 ÷ 94.50%) | | $ | 36.12 | |
|
| |
Class C: | | | | |
Net asset value and offering price per share | | $ | 17.59 | |
|
| |
Class Y: | | | | |
Net asset value and offering price per share | | $ | 35.41 | |
|
| |
Investor Class: | | | | |
Net asset value and offering price per share | | $ | 34.14 | |
|
| |
Class R6: | | | | |
Net asset value and offering price per share | | $ | 35.56 | |
|
| |
| | |
* At October 31, 2022, securities with an aggregate value of $36,979,548 were on loan to brokers. |
See accompanying Notes to Financial Statements which are an integral part of the financial statements.
| | |
| 10 | | Invesco Health Care Fund |
Statement of Operations
For the year ended October 31, 2022
| | | | |
Investment income: | | | | |
| |
Dividends (net of foreign withholding taxes of $169,789) | | $ | 12,245,272 | |
|
| |
Dividends from affiliated money market funds (includes net securities lending income of $72,886) | | | 533,269 | |
|
| |
Total investment income | | | 12,778,541 | |
|
| |
| |
Expenses: | | | | |
| |
Advisory fees | | | 8,993,881 | |
|
| |
Administrative services fees | | | 204,725 | |
|
| |
Custodian fees | | | 76,554 | |
|
| |
Distribution fees: | | | | |
Class A | | | 1,863,318 | |
|
| |
Class C | | | 228,914 | |
|
| |
Investor Class | | | 1,563,095 | |
|
| |
Transfer agent fees - A, C, Y and Investor | | | 1,805,680 | |
|
| |
Transfer agent fees - R6 | | | 444 | |
|
| |
Trustees’ and officers’ fees and benefits | | | 32,865 | |
|
| |
Registration and filing fees | | | 105,864 | |
|
| |
Reports to shareholders | | | 73,738 | |
|
| |
Professional services fees | | | 59,167 | |
|
| |
Other | | | 19,515 | |
|
| |
Total expenses | | | 15,027,760 | |
|
| |
Less: Fees waived and/or expense offset arrangement(s) | | | (42,715 | ) |
|
| |
Net expenses | | | 14,985,045 | |
|
| |
Net investment income (loss) | | | (2,206,504 | ) |
|
| |
| |
Realized and unrealized gain (loss) from: | | | | |
| |
Net realized gain (loss) from: | | | | |
Unaffiliated investment securities | | | (27,620,525 | ) |
|
| |
Affiliated investment securities | | | (19,600 | ) |
|
| |
Foreign currencies | | | 27,395 | |
|
| |
| | | (27,612,730 | ) |
|
| |
Change in net unrealized appreciation (depreciation) of: | | | | |
Unaffiliated investment securities | | | (219,539,556 | ) |
|
| |
Affiliated investment securities | | | 3,355 | |
|
| |
Foreign currencies | | | (80,489 | ) |
|
| |
| | | (219,616,690 | ) |
|
| |
Net realized and unrealized gain (loss) | | | (247,229,420 | ) |
|
| |
Net increase (decrease) in net assets resulting from operations | | $ | (249,435,924 | ) |
|
| |
See accompanying Notes to Financial Statements which are an integral part of the financial statements.
| | |
| 11 | | Invesco Health Care Fund |
Statement of Changes in Net Assets
For the years ended October 31, 2022 and 2021
| | | | | | | | |
| | | 2022 | | | 2021 | |
|
| |
Operations: | | | | | | | | |
Net investment income (loss) | | $ | (2,206,504 | ) | | $ | (4,051,113 | ) |
|
| |
Net realized gain (loss) | | | (27,612,730 | ) | | | 353,783,297 | |
|
| |
Change in net unrealized appreciation (depreciation) | | | (219,616,690 | ) | | | 45,114,847 | |
|
| |
Net increase (decrease) in net assets resulting from operations | | | (249,435,924 | ) | | | 394,847,031 | |
|
| |
| | |
Distributions to shareholders from distributable earnings: | | | | | | | | |
Class A | | | (175,765,430 | ) | | | (51,038,869 | ) |
|
| |
Class C | | | (9,290,808 | ) | | | (3,032,486 | ) |
|
| |
Class Y | | | (11,596,963 | ) | | | (3,235,578 | ) |
|
| |
Investor Class | | | (146,619,587 | ) | | | (42,472,982 | ) |
|
| |
Class R6 | | | (399,985 | ) | | | (48,621 | ) |
|
| |
Total distributions from distributable earnings | | | (343,672,773 | ) | | | (99,828,536 | ) |
|
| |
| | |
Share transactions–net: | | | | | | | | |
Class A | | | 104,833,962 | | | | 1,975,758 | |
|
| |
Class C | | | 4,224,192 | | | | (2,348,157 | ) |
|
| |
Class Y | | | 5,704,868 | | | | 6,894,946 | |
|
| |
Investor Class | | | 96,663,657 | | | | (1,056,978 | ) |
|
| |
Class R6 | | | (232,412 | ) | | | 1,657,633 | |
|
| |
Net increase in net assets resulting from share transactions | | | 211,194,267 | | | | 7,123,202 | |
|
| |
Net increase (decrease) in net assets | | | (381,914,430 | ) | | | 302,141,697 | |
|
| |
| | |
Net assets: | | | | | | | | |
Beginning of year | | | 1,733,753,949 | | | | 1,431,612,252 | |
|
| |
End of year | | $ | 1,351,839,519 | | | $ | 1,733,753,949 | |
|
| |
See accompanying Notes to Financial Statements which are an integral part of the financial statements.
| | |
| 12 | | Invesco Health Care Fund |
Financial Highlights
The following schedule presents financial highlights for a share of the Fund outstanding throughout the periods indicated.
| | | | | | | | | | | | | | | | | | | | | | | | | | | | | | | | | | | | | | | | | | | | | | | | | | | | | | | | |
| | | Net asset value, beginning of period | | Net investment income (loss)(a) | | Net gains (losses) on securities (both realized and unrealized) | | Total from investment operations | | Dividends from net investment income | | Distributions from net realized gains | | Total distributions | | Net asset value, end of period | | Total return (b) | | Net assets, end of period (000’s omitted) | | Ratio of expenses to average net assets with fee waivers and/or expenses absorbed | | Ratio of expenses to average net assets without fee waivers and/or expenses absorbed | | Ratio of net investment income (loss) to average net assets | | Portfolio turnover (c) |
Class A | | | | | | | | | | | | | | | | | | | | | | | | | | | | | | | | | | | | | | | | | | | | | | | | | | | | | | | | |
Year ended 10/31/22 | | | $50.30 | | | | $(0.05 | ) | | | $(6.19 | ) | | | $(6.24 | ) | | | $ - | | | | $(9.93 | ) | | | $(9.93 | ) | | | $34.13 | | | | (14.73 | )% | | | $696,308 | | | | 1.04 | % | | | 1.04 | % | | | (0.16 | )% | | | 44 | % |
Year ended 10/31/21 | | | 41.82 | | | | (0.11 | ) | | | 11.49 | | | | 11.38 | | | | (0.01 | ) | | | (2.89 | ) | | | (2.90 | ) | | | 50.30 | | | | 28.20 | | | | 896,054 | | | | 1.02 | | | | 1.02 | | | | (0.24 | ) | | | 78 | |
Year ended 10/31/20 | | | 38.59 | | | | 0.03 | | | | 4.67 | | | | 4.70 | | | | (0.10 | ) | | | (1.37 | ) | | | (1.47 | ) | | | 41.82 | | | | 12.32 | | | | 740,884 | | | | 1.06 | | | | 1.06 | | | | 0.08 | | | | 17 | |
Year ended 10/31/19 | | | 37.89 | | | | 0.08 | | | | 3.52 | | | | 3.60 | | | | - | | | | (2.90 | ) | | | (2.90 | ) | | | 38.59 | | | | 10.46 | | | | 700,483 | | | | 1.08 | | | | 1.08 | | | | 0.22 | | | | 11 | |
Year ended 10/31/18 | | | 37.84 | | | | (0.02 | ) | | | 2.52 | | | | 2.50 | | | | - | | | | (2.45 | ) | | | (2.45 | ) | | | 37.89 | | | | 7.03 | | | | 687,513 | | | | 1.09 | | | | 1.09 | | | | (0.06 | ) | | | 36 | |
Class C | | | | | | | | | | | | | | | | | | | | | | | | | | | | | | | | | | | | | | | | | | | | | | | | | | | | | | | | |
Year ended 10/31/22 | | | 31.06 | | | | (0.17 | ) | | | (3.37 | ) | | | (3.54 | ) | | | - | | | | (9.93 | ) | | | (9.93 | ) | | | 17.59 | | | | (15.35 | ) | | | 20,023 | | | | 1.79 | | | | 1.79 | | | | (0.91 | ) | | | 44 | |
Year ended 10/31/21 | | | 26.99 | | | | (0.29 | ) | | | 7.25 | | | | 6.96 | | | | - | | | | (2.89 | ) | | | (2.89 | ) | | | 31.06 | | | | 27.26 | | | | 29,391 | | | | 1.77 | | | | 1.77 | | | | (0.99 | ) | | | 78 | |
Year ended 10/31/20 | | | 25.48 | | | | (0.18 | ) | | | 3.06 | | | | 2.88 | | | | - | | | | (1.37 | ) | | | (1.37 | ) | | | 26.99 | | | | 11.46 | | | | 27,720 | | | | 1.81 | | | | 1.81 | | | | (0.67 | ) | | | 17 | |
Year ended 10/31/19 | | | 26.20 | | | | (0.13 | ) | | | 2.31 | | | | 2.18 | | | | - | | | | (2.90 | ) | | | (2.90 | ) | | | 25.48 | | | | 9.62 | | | | 24,570 | | | | 1.83 | | | | 1.83 | | | | (0.53 | ) | | | 11 | |
Year ended 10/31/18 | | | 27.10 | | | | (0.21 | ) | | | 1.76 | | | | 1.55 | | | | - | | | | (2.45 | ) | | | (2.45 | ) | | | 26.20 | | | | 6.24 | | | | 45,895 | | | | 1.84 | | | | 1.84 | | | | (0.81 | ) | | | 36 | |
Class Y | | | | | | | | | | | | | | | | | | | | | | | | | | | | | | | | | | | | | | | | | | | | | | | | | | | | | | | | |
Year ended 10/31/22 | | | 51.69 | | | | 0.04 | | | | (6.39 | ) | | | (6.35 | ) | | | - | | | | (9.93 | ) | | | (9.93 | ) | | | 35.41 | | | | (14.51 | ) | | | 46,087 | | | | 0.79 | | | | 0.79 | | | | 0.09 | | | | 44 | |
Year ended 10/31/21 | | | 42.90 | | | | 0.00 | | | | 11.79 | | | | 11.79 | | | | (0.11 | ) | | | (2.89 | ) | | | (3.00 | ) | | | 51.69 | | | | 28.52 | | | | 60,527 | | | | 0.77 | | | | 0.77 | | | | 0.01 | | | | 78 | |
Year ended 10/31/20 | | | 39.54 | | | | 0.14 | | | | 4.79 | | | | 4.93 | | | | (0.20 | ) | | | (1.37 | ) | | | (1.57 | ) | | | 42.90 | | | | 12.62 | | | | 43,816 | | | | 0.81 | | | | 0.81 | | | | 0.33 | | | | 17 | |
Year ended 10/31/19 | | | 38.67 | | | | 0.18 | | | | 3.59 | | | | 3.77 | | | | - | | | | (2.90 | ) | | | (2.90 | ) | | | 39.54 | | | | 10.70 | | | | 38,519 | | | | 0.83 | | | | 0.83 | | | | 0.47 | | | | 11 | |
Year ended 10/31/18 | | | 38.47 | | | | 0.07 | | | | 2.58 | | | | 2.65 | | | | - | | | | (2.45 | ) | | | (2.45 | ) | | | 38.67 | | | | 7.32 | | | | 36,930 | | | | 0.84 | | | | 0.84 | | | | 0.19 | | | | 36 | |
Investor Class | | | | | | | | | | | | | | | | | | | | | | | | | | | | | | | | | | | | | | | | | | | | | | | | | | | | | | | | |
Year ended 10/31/22 | | | 50.31 | | | | (0.05 | ) | | | (6.19 | ) | | | (6.24 | ) | | | - | | | | (9.93 | ) | | | (9.93 | ) | | | 34.14 | | | | (14.73 | ) | | | 588,159 | | | | 1.04 | | | | 1.04 | | | | (0.16 | ) | | | 44 | |
Year ended 10/31/21 | | | 41.83 | | | | (0.11 | ) | | | 11.49 | | | | 11.38 | | | | (0.01 | ) | | | (2.89 | ) | | | (2.90 | ) | | | 50.31 | | | | 28.20 | | | | 745,607 | | | | 1.02 | | | | 1.02 | | | | (0.24 | ) | | | 78 | |
Year ended 10/31/20 | | | 38.60 | | | | 0.03 | | | | 4.67 | | | | 4.70 | | | | (0.10 | ) | | | (1.37 | ) | | | (1.47 | ) | | | 41.83 | | | | 12.33 | | | | 618,818 | | | | 1.06 | | | | 1.06 | | | | 0.08 | | | | 17 | |
Year ended 10/31/19 | | | 37.90 | | | | 0.08 | | | | 3.52 | | | | 3.60 | | | | - | | | | (2.90 | ) | | | (2.90 | ) | | | 38.60 | | | | 10.45 | | | | 597,301 | | | | 1.08 | | | | 1.08 | | | | 0.22 | | | | 11 | |
Year ended 10/31/18 | | | 37.85 | | | | (0.02 | ) | | | 2.52 | | | | 2.50 | | | | - | | | | (2.45 | ) | | | (2.45 | ) | | | 37.90 | | | | 7.03 | | | | 583,069 | | | | 1.09 | | | | 1.09 | | | | (0.06 | ) | | | 36 | |
Class R6 | | | | | | | | | | | | | | | | | | | | | | | | | | | | | | | | | | | | | | | | | | | | | | | | | | | | | | | | |
Year ended 10/31/22 | | | 51.82 | | | | 0.07 | | | | (6.40 | ) | | | (6.33 | ) | | | - | | | | (9.93 | ) | | | (9.93 | ) | | | 35.56 | | | | (14.42 | ) | | | 1,262 | | | | 0.69 | | | | 0.69 | | | | 0.19 | | | | 44 | |
Year ended 10/31/21 | | | 42.97 | | | | 0.04 | | | | 11.83 | | | | 11.87 | | | | (0.13 | ) | | | (2.89 | ) | | | (3.02 | ) | | | 51.82 | | | | 28.66 | | | | 2,174 | | | | 0.69 | | | | 0.69 | | | | 0.09 | | | | 78 | |
Year ended 10/31/20 | | | 39.61 | | | | 0.16 | | | | 4.79 | | | | 4.95 | | | | (0.22 | ) | | | (1.37 | ) | | | (1.59 | ) | | | 42.97 | | | | 12.65 | | | | 374 | | | | 0.77 | | | | 0.77 | | | | 0.37 | | | | 17 | |
Year ended 10/31/19 | | | 38.71 | | | | 0.20 | | | | 3.60 | | | | 3.80 | | | | - | | | | (2.90 | ) | | | (2.90 | ) | | | 39.61 | | | | 10.77 | | | | 52 | | | | 0.77 | | | | 0.77 | | | | 0.53 | | | | 11 | |
Year ended 10/31/18 | | | 38.49 | | | | 0.09 | | | | 2.58 | | | | 2.67 | | | | - | | | | (2.45 | ) | | | (2.45 | ) | | | 38.71 | | | | 7.37 | | | | 41 | | | | 0.79 | | | | 0.79 | | | | 0.24 | | | | 36 | |
| (a) | Calculated using average shares outstanding. |
| (b) | Includes adjustments in accordance with accounting principles generally accepted in the United States of America and as such, the net asset value for financial reporting purposes and the returns based upon those net asset values may differ from the net asset value and returns for shareholder transactions. Does not include sales charges and is not annualized for periods less than one year, if applicable. |
| (c) | Portfolio turnover is calculated at the fund level and is not annualized for periods less than one year, if applicable. |
See accompanying Notes to Financial Statements which are an integral part of the financial statements.
| | |
| 13 | | Invesco Health Care Fund |
Notes to Financial Statements
October 31, 2022
NOTE 1–Significant Accounting Policies
Invesco Health Care Fund (the “Fund”) is a series portfolio of AIM Investment Funds (Invesco Investment Funds) (the “Trust”). The Trust is organized as a Delaware statutory trust and is registered under the Investment Company Act of 1940, as amended (the “1940 Act”), as an open-end series management investment company authorized to issue an unlimited number of shares of beneficial interest. Information presented in these financial statements pertains only to the Fund. Matters affecting the Fund or each class will be voted on exclusively by the shareholders of the Fund or each class.
The Fund’s investment objective is long-term growth of capital.
The Fund currently consists of five different classes of shares: Class A, Class C, Class Y, Investor Class and Class R6. Class Y and Investor Class shares are available only to certain investors. Class A shares are sold with a front-end sales charge unless certain waiver criteria are met. Under certain circumstances, load waived shares may be subject to contingent deferred sales charges (“CDSC”). Class C shares are sold with a CDSC. Class Y, Investor Class and Class R6 shares are sold at net asset value. Class C shares held for eight years after purchase are eligible for automatic conversion into Class A shares of the same Fund (the “Conversion Feature”). The automatic conversion pursuant to the Conversion Feature will generally occur at the end of the month following the eighth anniversary after a purchase of Class C shares.
The Fund is an investment company and accordingly follows the investment company accounting and reporting guidance in accordance with Financial Accounting Standards Board Accounting Standards Codification Topic 946, Financial Services - Investment Companies.
The following is a summary of the significant accounting policies followed by the Fund in the preparation of its financial statements.
| A. | Security Valuations – Securities, including restricted securities, are valued according to the following policy. |
A security listed or traded on an exchange is generally valued at its trade price or official closing price that day as of the close of the exchange where the security is principally traded, or lacking any trades or official closing price on a particular day, the security may be valued at the closing bid price on that day. Securities traded in the over-the-counter market are valued based on prices furnished by independent pricing services or market makers. When such securities are valued using prices provided by an independent pricing service they may be considered fair valued. Futures contracts are valued at the daily settlement price set by an exchange on which they are principally traded. U.S. exchange-traded options are valued at the mean between the last bid and asked prices from the exchange on which they are principally traded. Non-U.S. exchange-traded options are valued at the final settlement price set by the exchange on which they trade. Options not listed on an exchange and swaps generally are valued using pricing provided from independent pricing services.
Securities of investment companies that are not exchange-traded (e.g., open-end mutual funds) are valued using such company’s end-of-business-day net asset value per share.
Deposits, other obligations of U.S. and non-U.S. banks and financial institutions are valued at their daily account value.
Fixed income securities (including convertible debt securities) generally are valued on the basis of prices provided by independent pricing services. Prices provided by the pricing service may be determined without exclusive reliance on quoted prices, and may reflect appropriate factors such as institution-size trading in similar groups of securities, developments related to specific securities, dividend rate (for unlisted equities), yield (for debt obligations), quality, type of issue, coupon rate (for debt obligations), maturity (for debt obligations), individual trading characteristics and other market data. Pricing services generally value debt obligations assuming orderly transactions of institutional round lot size, but a fund may hold or transact in the same securities in smaller, odd lot sizes. Odd lots often trade at lower prices than institutional round lots, and their value may be adjusted accordingly. Debt obligations are subject to interest rate and credit risks. In addition, all debt obligations involve some risk of default with respect to interest and/or principal payments.
Foreign securities’ (including foreign exchange contracts) prices are converted into U.S. dollar amounts using the applicable exchange rates as of the close of the New York Stock Exchange (“NYSE”). If market quotations are available and reliable for foreign exchange-traded equity securities, the securities will be valued at the market quotations. Invesco Advisers, Inc. (the “Adviser” or “Invesco”) may use various pricing services to obtain market quotations as well as fair value prices. Because trading hours for certain foreign securities end before the close of the NYSE, closing market quotations may become not representative of market value in the Adviser’s judgment (“unreliable”). If, between the time trading ends on a particular security and the close of the customary trading session on the NYSE, a significant event occurs that makes the closing price of the security unreliable, the Adviser may fair value the security. If the event is likely to have affected the closing price of the security, the security will be valued at fair value in good faith in accordance with Board- approved policies and related Adviser procedures (“Valuation Procedures”). Adjustments to closing prices to reflect fair value may also be based on a screening process of an independent pricing service to indicate the degree of certainty, based on historical data, that the closing price in the principal market where a foreign security trades is not the current value as of the close of the NYSE. Foreign securities’ prices meeting the degree of certainty that the price is not reflective of current value will be priced at the indication of fair value from the independent pricing service. Multiple factors may be considered by the independent pricing service in determining adjustments to reflect fair value and may include information relating to sector indices, American Depositary Receipts and domestic and foreign index futures. Foreign securities may have additional risks including exchange rate changes, potential for sharply devalued currencies and high inflation, political and economic upheaval, the relative lack of issuer information, relatively low market liquidity and the potential lack of strict financial and accounting controls and standards.
Unlisted securities will be valued using prices provided by independent pricing services or by another method that the Adviser, in its judgment, believes better reflects the security’s fair value in accordance with the Valuation Procedures.
Securities for which market prices are not provided by any of the above methods may be valued based upon quotes furnished by independent sources. The last bid price may be used to value equity securities. The mean between the last bid and asked prices may be used to value debt obligations, including corporate loans.
Securities for which market quotations are not readily available are fair valued by the Adviser in accordance with the Valuation Procedures. If a fair value price provided by a pricing service is unreliable, the Adviser will fair value the security using the Valuation Procedures. Issuer specific events, market trends, bid/asked quotes of brokers and information providers and other market data may be reviewed in the course of making a good faith determination of a security’s fair value.
The Fund may invest in securities that are subject to interest rate risk, meaning the risk that the prices will generally fall as interest rates rise and, conversely, the prices will generally rise as interest rates fall. Specific securities differ in their sensitivity to changes in interest rates depending on their individual characteristics. Changes in interest rates may result in increased market volatility, which may affect the value and/or liquidity of certain Fund investments.
Valuations change in response to many factors including the historical and prospective earnings of the issuer, the value of the issuer’s assets, general market conditions which are not specifically related to the particular issuer, such as real or perceived adverse economic conditions, changes in the general outlook for revenues or corporate earnings, changes in interest or currency rates, regional or global instability, natural or environmental disasters, widespread disease or other public health issues, war, acts of terrorism, significant governmental actions or adverse investor sentiment generally and market liquidity. Because of the inherent uncertainties of valuation, the values reflected in the financial statements may materially differ from the value received upon actual sale of those investments.
The price the Fund could receive upon the sale of any investment may differ from the Adviser’s valuation of the investment, particularly for securities that are valued using a fair valuation technique. When fair valuation techniques are applied, the Adviser uses available information, including both observable and unobservable inputs and assumptions, to determine a methodology that will result in a valuation that the Adviser believes approximates market value. Fund securities that are fair valued may be subject to greater fluctuation in their value from one day to the next than would be the case if market quotations were used.
| | |
| 14 | | Invesco Health Care Fund |
Because of the inherent uncertainties of valuation, and the degree of subjectivity in such decisions, the Fund could realize a greater or lesser than expected gain or loss upon the sale of the investment.
| B. | Securities Transactions and Investment Income – Securities transactions are accounted for on a trade date basis. Realized gains or losses on sales are computed on the basis of specific identification of the securities sold. Interest income (net of withholding tax, if any) is recorded on an accrual basis from settlement date and includes coupon interest and amortization of premium and accretion of discount on debt securities as applicable. Dividend income (net of withholding tax, if any) is recorded on the ex-dividend date. |
The Fund may periodically participate in litigation related to Fund investments. As such, the Fund may receive proceeds from litigation settlements. Any proceeds received are included in the Statement of Operations as realized gain (loss) for investments no longer held and as unrealized gain (loss) for investments still held.
Brokerage commissions and mark ups are considered transaction costs and are recorded as an increase to the cost basis of securities purchased and/or a reduction of proceeds on a sale of securities. Such transaction costs are included in the determination of net realized and unrealized gain (loss) from investment securities reported in the Statement of Operations and the Statement of Changes in Net Assets and the net realized and unrealized gains (losses) on securities per share in the Financial Highlights. Transaction costs are included in the calculation of the Fund’s net asset value and, accordingly, they reduce the Fund’s total returns. These transaction costs are not considered operating expenses and are not reflected in net investment income reported in the Statement of Operations and the Statement of Changes in Net Assets, or the net investment income per share and the ratios of expenses and net investment income reported in the Financial Highlights, nor are they limited by any expense limitation arrangements between the Fund and the investment adviser.
The Fund allocates income and realized and unrealized capital gains and losses to a class based on the relative net assets of each class.
| C. | Country Determination – For the purposes of making investment selection decisions and presentation in the Schedule of Investments, the investment adviser may determine the country in which an issuer is located and/or credit risk exposure based on various factors. These factors include the laws of the country under which the issuer is organized, where the issuer maintains a principal office, the country in which the issuer derives 50% or more of its total revenues, the country that has the primary market for the issuer’s securities and its “country of risk” as determined by a third party service provider, as well as other criteria. Among the other criteria that may be evaluated for making this determination are the country in which the issuer maintains 50% or more of its assets, the type of security, financial guarantees and enhancements, the nature of the collateral and the sponsor organization. Country of issuer and/or credit risk exposure has been determined to be the United States of America, unless otherwise noted. |
| D. | Distributions – Distributions from net investment income and net realized capital gain, if any, are generally declared and paid annually and recorded on the ex-dividend date. The Fund may elect to treat a portion of the proceeds from redemptions as distributions for federal income tax purposes. |
| E. | Federal Income Taxes – The Fund intends to comply with the requirements of Subchapter M of the Internal Revenue Code of 1986, as amended (the “Internal Revenue Code”), necessary to qualify as a regulated investment company and to distribute substantially all of the Fund’s taxable earnings to shareholders. As such, the Fund will not be subject to federal income taxes on otherwise taxable income (including net realized capital gain) that is distributed to shareholders. Therefore, no provision for federal income taxes is recorded in the financial statements. |
The Fund recognizes the tax benefits of uncertain tax positions only when the position is more likely than not to be sustained. Management has analyzed the Fund’s uncertain tax positions and concluded that no liability for unrecognized tax benefits should be recorded related to uncertain tax positions. Management is not aware of any tax positions for which it is reasonably possible that the total amounts of unrecognized tax benefits will change materially in the next 12 months.
The Fund files tax returns in the U.S. Federal jurisdiction and certain other jurisdictions. Generally, the Fund is subject to examinations by such taxing authorities for up to three years after the filing of the return for the tax period.
| F. | Expenses – Fees provided for under the Rule 12b-1 plan of a particular class of the Fund are charged to the operations of such class. Transfer agency fees and expenses and other shareholder recordkeeping fees and expenses attributable to Class R6 are charged to such class. Transfer agency fees and expenses and other shareholder recordkeeping fees and expenses relating to all other classes are allocated among those classes based on relative net assets. All other expenses are allocated among the classes based on relative net assets. |
| G. | Accounting Estimates – The preparation of financial statements in conformity with accounting principles generally accepted in the United States of America (“GAAP”) requires management to make estimates and assumptions that affect the reported amounts of assets and liabilities at the date of the financial statements and the reported amounts of revenues and expenses during the reporting period including estimates and assumptions related to taxation. Actual results could differ from those estimates by a significant amount. In addition, the Fund monitors for material events or transactions that may occur or become known after the period-end date and before the date the financial statements are released to print. |
| H. | Indemnifications – Under the Trust’s organizational documents, each Trustee, officer, employee or other agent of the Trust is indemnified against certain liabilities that may arise out of the performance of their duties to the Fund. Additionally, in the normal course of business, the Fund enters into contracts, including the Fund’s servicing agreements, that contain a variety of indemnification clauses. The Fund’s maximum exposure under these arrangements is unknown as this would involve future claims that may be made against the Fund that have not yet occurred. The risk of material loss as a result of such indemnification claims is considered remote. |
| I. | Securities Lending – The Fund may lend portfolio securities having a market value up to one-third of the Fund’s total assets. Such loans are secured by collateral equal to no less than the market value of the loaned securities determined daily by the securities lending provider. Such collateral will be cash or debt securities issued or guaranteed by the U.S. Government or any of its sponsored agencies. Cash collateral received in connection with these loans is invested in short-term money market instruments or affiliated, unregistered investment companies that comply with Rule 2a-7 under the 1940 Act and money market funds (collectively, “affiliated money market funds”) and is shown as such on the Schedule of Investments. The Fund bears the risk of loss with respect to the investment of collateral. It is the Fund’s policy to obtain additional collateral from or return excess collateral to the borrower by the end of the next business day, following the valuation date of the securities loaned. Therefore, the value of the collateral held may be temporarily less than the value of the securities on loan. When loaning securities, the Fund retains certain benefits of owning the securities, including the economic equivalent of dividends or interest generated by the security. Lending securities entails a risk of loss to the Fund if, and to the extent that, the market value of the securities loaned were to increase and the borrower did not increase the collateral accordingly, and the borrower failed to return the securities. The securities loaned are subject to termination at the option of the borrower or the Fund. Upon termination, the borrower will return to the Fund the securities loaned and the Fund will return the collateral. Upon the failure of the borrower to return the securities, collateral may be liquidated and the securities may be purchased on the open market to replace the loaned securities. The Fund could experience delays and costs in gaining access to the collateral and the securities may lose value during the delay which could result in potential losses to the Fund. Some of these losses may be indemnified by the lending agent. The Fund bears the risk of any deficiency in the amount of the collateral available for return to the borrower due to any loss on the collateral invested. Dividends received on cash collateral investments for securities lending transactions, which are net of compensation to counterparties, are included in Dividends from affiliated money market funds on the Statement of Operations. The aggregate value of securities out on loan, if any, is shown as a footnote on the Statement of Assets and Liabilities. |
The Adviser serves as an affiliated securities lending agent for the Fund. The Bank of New York Mellon also serves as a lending agent. To the extent the Fund utilizes the Adviser as an affiliated securities lending agent, the Fund conducts its securities lending in accordance with, and in reliance upon, no-action letters issued by the SEC staff that provide guidance on how an affiliate may act as a direct agent lender and receive compensation for those services in a manner consistent with the federal securities laws. For the year ended October 31, 2022, the Fund paid the Adviser $3,098 in fees for securities lending agent services. Fees paid to the Adviser for securities lending agent services are included in Dividends from affiliated money market funds on the Statement of Operations.
| | |
| 15 | | Invesco Health Care Fund |
| J. | Foreign Currency Translations – Foreign currency is valued at the close of the NYSE based on quotations posted by banks and major currency dealers. Portfolio securities and other assets and liabilities denominated in foreign currencies are translated into U.S. dollar amounts at the date of valuation. Purchases and sales of portfolio securities (net of foreign taxes withheld on disposition) and income items denominated in foreign currencies are translated into U.S. dollar amounts on the respective dates of such transactions. The Fund does not separately account for the portion of the results of operations resulting from changes in foreign exchange rates on investments and the fluctuations arising from changes in market prices of securities held. The combined results of changes in foreign exchange rates and the fluctuation of market prices on investments (net of estimated foreign tax withholding) are included with the net realized and unrealized gain or loss from investments in the Statement of Operations. Reported net realized foreign currency gains or losses arise from (1) sales of foreign currencies, (2) currency gains or losses realized between the trade and settlement dates on securities transactions, and (3) the difference between the amounts of dividends, interest, and foreign withholding taxes recorded on the Fund’s books and the U.S. dollar equivalent of the amounts actually received or paid. Net unrealized foreign currency gains and losses arise from changes in the fair values of assets and liabilities, other than investments in securities at fiscal period end, resulting from changes in exchange rates. |
The Fund may invest in foreign securities, which may be subject to foreign taxes on income, gains on investments or currency repatriation, a portion of which may be recoverable. Foreign taxes, if any, are recorded based on the tax regulations and rates that exist in the foreign markets in which the Fund invests and are shown in the Statement of Operations.
| K. | Forward Foreign Currency Contracts – The Fund may engage in foreign currency transactions either on a spot (i.e. for prompt delivery and settlement) basis, or through forward foreign currency contracts, to manage or minimize currency or exchange rate risk. |
The Fund may also enter into forward foreign currency contracts for the purchase or sale of a security denominated in a foreign currency in order to “lock in” the U.S. dollar price of that security, or the Fund may also enter into forward foreign currency contracts that do not provide for physical exchange of the two currencies on the settlement date, but instead are settled by a single cash payment calculated as the difference between the agreed upon exchange rate and the spot rate at settlement based upon an agreed upon notional amount (non-deliverable forwards).
A forward foreign currency contract is an obligation between two parties (“Counterparties”) to purchase or sell a specific currency for an agreed-upon price at a future date. The use of forward foreign currency contracts for hedging does not eliminate fluctuations in the price of the underlying securities the Fund owns or intends to acquire but establishes a rate of exchange in advance. Fluctuations in the value of these contracts are measured by the difference in the contract date and reporting date exchange rates and are recorded as unrealized appreciation (depreciation) until the contracts are closed. When the contracts are closed, realized gains (losses) are recorded. Realized and unrealized gains (losses) on the contracts are included in the Statement of Operations. The primary risks associated with forward foreign currency contracts include failure of the Counterparty to meet the terms of the contract and the value of the foreign currency changing unfavorably. These risks may be in excess of the amounts reflected in the Statement of Assets and Liabilities.
| L. | Other Risks – The Fund’s performance is vulnerable to factors affecting the health care industry, including government regulation, obsolescence caused by scientific advances and technological innovations. |
The Fund has invested in non-publicly traded companies, some of which are in the startup or development stages. These investments are inherently risky, as the market for the technologies or products these companies are developing are typically in the early stages and may never materialize. The Fund could lose its entire investment in these companies. These investments are valued at fair value as determined in good faith in accordance with procedures approved by the Board of Trustees. Investments in privately held venture capital securities are illiquid.
| M. | COVID-19 Risk – The COVID-19 strain of coronavirus has resulted in instances of market closures and dislocations, extreme volatility, liquidity constraints and increased trading costs. Efforts to contain its spread have resulted in travel restrictions, disruptions of healthcare systems, business operations (including business closures) and supply chains, layoffs, lower consumer demand and employee availability, and defaults and credit downgrades, among other significant economic impacts that have disrupted global economic activity across many industries. Such economic impacts may exacerbate other pre-existing political, social and economic risks locally or globally and cause general concern and uncertainty. The full economic impact and ongoing effects of COVID-19 (or other future epidemics or pandemics) at the macro-level and on individual businesses are unpredictable and may result in significant and prolonged effects on the Fund’s performance. |
NOTE 2–Advisory Fees and Other Fees Paid to Affiliates
The Trust has entered into a master investment advisory agreement with the Adviser. Under the terms of the investment advisory agreement, the Fund accrues daily and pays monthly an advisory fee to the Adviser based on the annual rate of the Fund’s average daily net assets as follows:
| | | | | | |
| Average Daily Net Assets | | Rate | |
|
| |
First $ 350 million | | | 0.750% | |
|
| |
Next $350 million | | | 0.650% | |
|
| |
Next $1.3 billion | | | 0.550% | |
|
| |
Next $2 billion | | | 0.450% | |
|
| |
Next $2 billion | | | 0.400% | |
|
| |
Next $2 billion | | | 0.375% | |
|
| |
Over $8 billion | | | 0.350% | |
|
| |
For the year ended October 31, 2022, the effective advisory fee rate incurred by the Fund was 0.62%.
Under the terms of a master sub-advisory agreement between the Adviser and each of Invesco Asset Management Deutschland GmbH, Invesco Asset Management Limited, Invesco Asset Management (Japan) Limited, Invesco Hong Kong Limited, Invesco Senior Secured Management, Inc. and Invesco Canada Ltd. (collectively, the “Affiliated Sub-Advisers”) the Adviser, not the Fund, will pay 40% of the fees paid to the Adviser to any such Affiliated Sub-Adviser(s) that provide(s) discretionary investment management services to the Fund based on the percentage of assets allocated to such Affiliated Sub-Adviser(s).
The Adviser has contractually agreed, through at least June 30, 2023, to waive advisory fees and/or reimburse expenses of all shares to the extent necessary to limit total annual fund operating expenses after fee waiver and/or expense reimbursement (excluding certain items discussed below) of Class A, Class C, Class Y, Investor Class and Class R6 shares to 2.00%, 2.75%, 1.75%, 2.00% and 1.75% of the Fund’s average daily net assets (the “expense limits”), respectively.In determining the Adviser’s obligation to waive advisory fees and/or reimburse expenses, the following expenses are not taken into account, and could cause total annual fund operating expenses after fee waiver and/or expense reimbursement to exceed the numbers reflected above: (1) interest; (2) taxes; (3) dividend expense on short sales; (4) extraordinary or non-routine items, including litigation expenses; and (5) expenses that the Fund has incurred but did not actually pay because of an expense offset arrangement. Unless Invesco continues the fee waiver agreement, it will terminate on June 30, 2023. During its term, the fee waiver agreement cannot be terminated or amended to increase the expense limits or reduce the advisory fee waiver without approval of the Board of Trustees. The Adviser did not waive fees and/or reimburse expenses during the period under these expense limits.
Further, the Adviser has contractually agreed, through at least June 30, 2024, to waive the advisory fee payable by the Fund in an amount equal to 100% of the net advisory fees the Adviser receives from the affiliated money market funds on investments by the Fund of uninvested cash (excluding investments of cash collateral from securities lending) in such affiliated money market funds.
| | |
| 16 | | Invesco Health Care Fund |
For the year ended October 31, 2022, the Adviser waived advisory fees of $35,692.
The Trust has entered into a master administrative services agreement with Invesco pursuant to which the Fund has agreed to pay Invesco for certain administrative costs incurred in providing accounting services to the Fund. For the year ended October 31, 2022, expenses incurred under the agreement are shown in the Statement of Operations as Administrative services fees. Invesco has entered into a sub-administration agreement whereby State Street Bank and Trust Company (“SSB”) serves as fund accountant and provides certain administrative services to the Fund. Pursuant to a custody agreement with the Trust on behalf of the Fund, SSB also serves as the Fund’s custodian.
The Trust has entered into a transfer agency and service agreement with Invesco Investment Services, Inc. (“IIS”) pursuant to which the Fund has agreed to pay IIS a fee for providing transfer agency and shareholder services to the Fund and reimburse IIS for certain expenses incurred by IIS in the course of providing such services. IIS may make payments to intermediaries that provide omnibus account services, sub-accounting services and/or networking services. All fees payable by IIS to intermediaries that provide omnibus account services or sub-accounting services are charged back to the Fund, subject to certain limitations approved by the Trust’s Board of Trustees. For the year ended October 31, 2022, expenses incurred under the agreement are shown in the Statement of Operations as Transfer agent fees.
The Trust has entered into master distribution agreements with Invesco Distributors, Inc. (“IDI”) to serve as the distributor for the Class A, Class C, Class Y, Investor Class and Class R6 shares of the Fund. The Trust has adopted plans pursuant to Rule 12b-1 under the 1940 Act with respect to the Fund’s Class A, Class C and Investor Class shares (collectively, the “Plans”). The Fund, pursuant to the Plans, pays IDI compensation at the annual rate of 0.25% of the Fund’s average daily net assets of Class A shares, 1.00% of the average daily net assets of Class C shares and 0.25% of the average daily net assets of Investor Class shares. The fees are accrued daily and paid monthly. Of the Plan payments, up to 0.25% of the average daily net assets of each class of shares may be paid to furnish continuing personal shareholder services to customers who purchase and own shares of such classes. Any amounts not paid as a service fee under the Plans would constitute an asset-based sales charge. Rules of the Financial Industry Regulatory Authority (“FINRA”) impose a cap on the total sales charges, including asset-based sales charges, that may be paid by any class of shares of the Fund. For the year ended October 31, 2022, expenses incurred under the Plan are shown in the Statement of Operations as Distribution fees.
Front-end sales commissions and CDSC (collectively, the “sales charges”) are not recorded as expenses of the Fund. Front-end sales commissions are deducted from proceeds from the sales of Fund shares prior to investment in Class A shares of the Fund. CDSC are deducted from redemption proceeds prior to remittance to the shareholder. During the year ended October 31, 2022, IDI advised the Fund that IDI retained $86,632 in front-end sales commissions from the sale of Class A shares and $584 and $1,513 from Class A and Class C shares, respectively, for CDSC imposed upon redemptions by shareholders.
For the year ended October 31, 2022, the Fund incurred $31,776 in brokerage commissions with Invesco Capital Markets, Inc., an affiliate of the Adviser and IDI, for portfolio transactions executed on behalf of the Fund.
Certain officers and trustees of the Trust are officers and directors of the Adviser, IIS and/or IDI.
NOTE 3–Additional Valuation Information
GAAP defines fair value as the price that would be received to sell an asset or paid to transfer a liability in an orderly transaction between market participants at the measurement date, under current market conditions. GAAP establishes a hierarchy that prioritizes the inputs to valuation methods, giving the highest priority to readily available unadjusted quoted prices in an active market for identical assets (Level 1) and the lowest priority to significant unobservable inputs (Level 3), generally when market prices are not readily available. Based on the valuation inputs, the securities or other investments are tiered into one of three levels. Changes in valuation methods may result in transfers in or out of an investment’s assigned level:
| | |
| Level 1 – | | Prices are determined using quoted prices in an active market for identical assets. |
| Level 2 – | | Prices are determined using other significant observable inputs. Observable inputs are inputs that other market participants may use in pricing a security. These may include quoted prices for similar securities, interest rates, prepayment speeds, credit risk, yield curves, loss severities, default rates, discount rates, volatilities and others. |
| Level 3 – | | Prices are determined using significant unobservable inputs. In situations where quoted prices or observable inputs are unavailable (for example, when there is little or no market activity for an investment at the end of the period), unobservable inputs may be used. Unobservable inputs reflect the Adviser’s assumptions about the factors market participants would use in determining fair value of the securities or instruments and would be based on the best available information. |
The following is a summary of the tiered valuation input levels, as of October 31, 2022. The level assigned to the securities valuations may not be an indication of the risk or liquidity associated with investing in those securities. Because of the inherent uncertainties of valuation, the values reflected in the financial statements may materially differ from the value received upon actual sale of those investments.
| | | | | | | | | | | | | | | | | | | | | | | | | | | | |
| | | Level 1 | | | | | | Level 2 | | | | | | Level 3 | | | | | | Total | |
|
| |
Investments in Securities | | | | | | | | | | | | | | | | | | | | | | | | | | | | |
|
| |
Common Stocks & Other Equity Interests | | $ | 1,243,147,031 | | | | | | | $ | 53,671,743 | | | | | | | | $- | | | | | | | $ | 1,296,818,774 | |
|
| |
Money Market Funds | | | 48,545,131 | | | | | | | | 37,814,323 | | | | | | | | - | | | | | | | | 86,359,454 | |
|
| |
Total Investments | | $ | 1,291,692,162 | | | | | | | $ | 91,486,066 | | | | | | | | $- | | | | | | | $ | 1,383,178,228 | |
|
| |
NOTE 4–Expense Offset Arrangement(s)
The expense offset arrangement is comprised of transfer agency credits which result from balances in demand deposit accounts used by the transfer agent for clearing shareholder transactions. For the year ended October 31, 2022, the Fund received credits from this arrangement, which resulted in the reduction of the Fund’s total expenses of $7,023.
NOTE 5–Trustees’ and Officers’ Fees and Benefits
Trustees’ and Officers’ Fees and Benefits include amounts accrued by the Fund to pay remuneration to certain Trustees and Officers of the Fund. Trustees have the option to defer compensation payable by the Fund, and Trustees’ and Officers’ Fees and Benefits also include amounts accrued by the Fund to fund such deferred compensation amounts. Those Trustees who defer compensation have the option to select various Invesco Funds in which their deferral accounts shall be deemed to be invested. Finally, certain current Trustees were eligible to participate in a retirement plan that provided for benefits to be paid upon retirement to Trustees over a period of time based on the number of years of service. The Fund may have certain former Trustees who also participate in a retirement plan and receive benefits under such plan. Trustees’ and Officers’ Fees and Benefits include amounts accrued by the Fund to fund such retirement benefits. Obligations under the deferred compensation and retirement plans represent unsecured claims against the general assets of the Fund.
| | |
| 17 | | Invesco Health Care Fund |
NOTE 6–Cash Balances
The Fund is permitted to temporarily carry a negative or overdrawn balance in its account with SSB, the custodian bank. Such balances, if any at period-end, are shown in the Statement of Assets and Liabilities under the payable caption Amount due custodian. To compensate the custodian bank for such overdrafts, the overdrawn Fund may either (1) leave funds as a compensating balance in the account so the custodian bank can be compensated by earning the additional interest; or (2) compensate by paying the custodian bank at a rate agreed upon by the custodian bank and Invesco, not to exceed the contractually agreed upon rate. The Fund may not purchase additional securities when any borrowings from banks or broker-dealers exceed 5% of the Fund’s total assets, or when any borrowings from an Invesco Fund are outstanding.
NOTE 7–Distributions to Shareholders and Tax Components of Net Assets
Tax Character of Distributions to Shareholders Paid During the Fiscal Years Ended October 31, 2022 and 2021:
| | | | | | | | | | | | |
| | | 2022 | | | | | | 2021 | |
|
| |
Ordinary income* | | $ | - | | | | | | | $ | 16,339,203 | |
|
| |
Long-term capital gain | | | 343,672,773 | | | | | | | | 83,489,333 | |
|
| |
Total distributions | | $ | 343,672,773 | | | | | | | $ | 99,828,536 | |
|
| |
| * | Includes short-term capital gain distributions, if any. |
Tax Components of Net Assets at Period-End:
| | | | |
| | | 2022 | |
|
| |
Net unrealized appreciation — investments | | $ | 356,317,662 | |
|
| |
Net unrealized appreciation (depreciation) — foreign currencies | | | (65,322 | ) |
|
| |
Temporary book/tax differences | | | (186,286 | ) |
|
| |
Capital loss carryforward | | | (25,038,826 | ) |
|
| |
Shares of beneficial interest | | | 1,020,812,291 | |
|
| |
Total net assets | | $ | 1,351,839,519 | |
|
| |
The difference between book-basis and tax-basis unrealized appreciation (depreciation) is due to differences in the timing of recognition of gains and losses on investments for tax and book purposes. The Fund’s net unrealized appreciation (depreciation) difference is attributable primarily to wash sales and passive foreign investment companies.
The temporary book/tax differences are a result of timing differences between book and tax recognition of income and/or expenses. The Fund’s temporary book/tax differences are the result of the trustee deferral of compensation and retirement plan benefits.
Capital loss carryforward is calculated and reported as of a specific date. Results of transactions and other activity after that date may affect the amount of capital loss carryforward actually available for the Fund to utilize. The ability to utilize capital loss carryforward in the future may be limited under the Internal Revenue Code and related regulations based on the results of future transactions.
The Fund has a capital loss carryforward as of October 31, 2022, as follows:
| | | | | | | | | | | | | | | | | | |
Capital Loss Carryforward* | |
|
| |
| Expiration | | Short-Term | | | | | | Long-Term | | | | | Total | |
|
| |
Not subject to expiration | | $ | 25,038,826 | | | | | | | $- | | | | | | $ | 25,038,826 | |
|
| |
| * | Capital loss carryforward is reduced for limitations, if any, to the extent required by the Internal Revenue Code and may be further limited depending upon a variety of factors, including the realization of net unrealized gains or losses as of the date of any reorganization. |
NOTE 8–Investment Transactions
The aggregate amount of investment securities (other than short-term securities, U.S. Government obligations and money market funds, if any) purchased and sold by the Fund during the year ended October 31, 2022 was $620,128,346 and $779,504,061, respectively. Cost of investments, including any derivatives, on a tax basis includes the adjustments for financial reporting purposes as of the most recently completed federal income tax reporting period-end.
Unrealized Appreciation (Depreciation) of Investments on a Tax Basis
| | | | |
|
| |
Aggregate unrealized appreciation of investments | | $ | 387,047,501 | |
|
| |
Aggregate unrealized (depreciation) of investments | | | (30,729,839 | ) |
|
| |
Net unrealized appreciation of investments | | $ | 356,317,662 | |
|
| |
Cost of investments for tax purposes is $1,026,860,566.
NOTE 9–Reclassification of Permanent Differences
Primarily as a result of differing book/tax treatment of net operating losses, on October 31, 2022, undistributed net investment income (loss) was increased by $5,044,221, undistributed net realized gain (loss) was increased by $67,759 and shares of beneficial interest was decreased by $5,111,980. This reclassification had no effect on the net assets of the Fund.
| | |
| 18 | | Invesco Health Care Fund |
NOTE 10–Share Information
| | | | | | | | | | | | | | | | | | | | | | | | | | | | |
| | | Summary of Share Activity | |
|
| |
| | | Year ended | | | Year ended | |
| | | October 31, 2022(a) | | | October 31, 2021 | |
| | | Shares | | | | | | Amount | | | | | | Shares | | | | | | Amount | |
|
| |
Sold: | | | | | | | | | | | | | | | | | | | | | | | | | | | | |
Class A | | | 1,020,924 | | | | | | | $ | 37,178,045 | | | | | | | | 1,021,136 | | | | | | | $ | 47,149,711 | |
|
| |
Class C | | | 241,467 | | | | | | | | 4,562,878 | | | | | | | | 253,829 | | | | | | | | 7,316,274 | |
|
| |
Class Y | | | 292,440 | | | | | | | | 10,821,049 | | | | | | | | 355,766 | | | | | | | | 16,886,586 | |
|
| |
Investor Class | | | 141,992 | | | | | | | | 5,399,582 | | | | | | | | 137,542 | | | | | | | | 6,363,951 | |
|
| |
Class R6 | | | 9,899 | | | | | | | | 373,272 | | | | | | | | 34,237 | | | | | | | | 1,708,753 | |
|
| |
| | | | | | | |
Issued as reinvestment of dividends: | | | | | | | | | | | | | | | | | | | | | | | | | | | | |
Class A | | | 4,091,961 | | | | | | | | 158,317,977 | | | | | | | | 1,048,926 | | | | | | | | 46,121,227 | |
|
| |
Class C | | | 440,490 | | | | | | | | 8,840,630 | | | | | | | | 103,744 | | | | | | | | 2,835,324 | |
|
| |
Class Y | | | 233,867 | | | | | | | | 9,366,384 | | | | | | | | 62,753 | | | | | | | | 2,829,545 | |
|
| |
Investor Class | | | 3,463,003 | | | | | | | | 134,018,202 | | | | | | | | 899,683 | | | | | | | | 39,568,061 | |
|
| |
Class R6 | | | 7,307 | | | | | | | | 293,596 | | | | | | | | 980 | | | | | | | | 44,284 | |
|
| |
| | | | | | | |
Automatic conversion of Class C shares to Class A shares: | | | | | | | | | | | | | | | | | | | | | | | | | | | | |
Class A | | | 73,766 | | | | | | | | 2,605,013 | | | | | | | | 138,688 | | | | | | | | 6,338,338 | |
|
| |
Class C | | | (141,001 | ) | | | | | | | (2,605,013 | ) | | | | | | | (223,346 | ) | | | | | | | (6,338,338 | ) |
|
| |
| | | | | | | |
Reacquired: | | | | | | | | | | | | | | | | | | | | | | | | | | | | |
Class A | | | (2,601,958 | ) | | | | | | | (93,267,073 | ) | | | | | | | (2,111,190 | ) | | | | | | | (97,633,518 | ) |
|
| |
Class C | | | (348,834 | ) | | | | | | | (6,574,303 | ) | | | | | | | (215,019 | ) | | | | | | | (6,161,417 | ) |
|
| |
Class Y | | | (395,818 | ) | | | | | | | (14,482,565 | ) | | | | | | | (269,011 | ) | | | | | | | (12,821,185 | ) |
|
| |
Investor Class | | | (1,199,075 | ) | | | | | | | (42,754,127 | ) | | | | | | | (1,012,104 | ) | | | | | | | (46,988,990 | ) |
|
| |
Class R6 | | | (23,683 | ) | | | | | | | (899,280 | ) | | | | | | | (1,953 | ) | | | | | | | (95,404 | ) |
|
| |
Net increase in share activity | | | 5,306,747 | | | | | | | $ | 211,194,267 | | | | | | | | 224,661 | | | | | | | $ | 7,123,202 | |
|
| |
| (a) | There are entities that are record owners of more than 5% of the outstanding shares of the Fund and in the aggregate own 7% of the outstanding shares of the Fund. IDI has an agreement with these entities to sell Fund shares. The Fund, Invesco and/or Invesco affiliates may make payments to these entities, which are considered to be related to the Fund, for providing services to the Fund, Invesco and/or Invesco affiliates including but not limited to services such as securities brokerage, distribution, third party record keeping and account servicing. The Fund has no knowledge as to whether all or any portion of the shares owned of record by these entities are also owned beneficially. |
| | |
| 19 | | Invesco Health Care Fund |
Report of Independent Registered Public Accounting Firm
To the Board of Trustees of AIM Investment Funds (Invesco Investment Funds) and Shareholders of Invesco Health Care Fund
Opinion on the Financial Statements
We have audited the accompanying statement of assets and liabilities, including the schedule of investments, of Invesco Health Care Fund (one of the funds constituting AIM Investment Funds (Invesco Investment Funds), referred to hereafter as the “Fund”) as of October 31, 2022, the related statement of operations for the year ended October 31, 2022, the statement of changes in net assets for each of the two years in the period ended October 31, 2022, including the related notes, and the financial highlights for each of the five years in the period ended October 31, 2022 (collectively referred to as the “financial statements”). In our opinion, the financial statements present fairly, in all material respects, the financial position of the Fund as of October 31, 2022, the results of its operations for the year then ended, the changes in its net assets for each of the two years in the period ended October 31, 2022 and the financial highlights for each of the five years in the period ended October 31, 2022 in conformity with accounting principles generally accepted in the United States of America.
Basis for Opinion
These financial statements are the responsibility of the Fund’s management. Our responsibility is to express an opinion on the Fund’s financial statements based on our audits. We are a public accounting firm registered with the Public Company Accounting Oversight Board (United States) (PCAOB) and are required to be independent with respect to the Fund in accordance with the U.S. federal securities laws and the applicable rules and regulations of the Securities and Exchange Commission and the PCAOB.
We conducted our audits of these financial statements in accordance with the standards of the PCAOB. Those standards require that we plan and perform the audit to obtain reasonable assurance about whether the financial statements are free of material misstatement, whether due to error or fraud.
Our audits included performing procedures to assess the risks of material misstatement of the financial statements, whether due to error or fraud, and performing procedures that respond to those risks. Such procedures included examining, on a test basis, evidence regarding the amounts and disclosures in the financial statements. Our audits also included evaluating the accounting principles used and significant estimates made by management, as well as evaluating the overall presentation of the financial statements. Our procedures included confirmation of securities owned as of October 31, 2022 by correspondence with the custodian, transfer agent and brokers; when replies were not received from brokers, we performed other auditing procedures. We believe that our audits provide a reasonable basis for our opinion.
/s/PricewaterhouseCoopers LLP
Houston, Texas
December 23, 2022
We have served as the auditor of one or more of the investment companies in the Invesco group of investment companies since at least 1995. We have not been able to determine the specific year we began serving as auditor.
| | |
| 20 | | Invesco Health Care Fund |
Calculating your ongoing Fund expenses
Example
As a shareholder of the Fund, you incur two types of costs: (1) transaction costs, which may include sales charges (loads) on purchase payments or contingent deferred sales charges on redemptions, if any; and (2) ongoing costs, including management fees, distribution and/or service (12b-1) fees, and other Fund expenses. This example is intended to help you understand your ongoing costs (in dollars) of investing in the Fund and to compare these costs with ongoing costs of investing in other mutual funds. The example is based on an investment of $1,000 invested at the beginning of the period and held for the entire period May 1, 2022 through October 31, 2022.
Actual expenses
The table below provides information about actual account values and actual expenses. You may use the information in this table, together with the amount you invested, to estimate the expenses that you paid over the period. Simply divide your account value by $1,000 (for example, an $8,600 account value divided by $1,000 = 8.6), then multiply the result by the number in the table under the heading entitled “Actual Expenses Paid During Period” to estimate the expenses you paid on your account during this period.
Hypothetical example for comparison purposes
The table below also provides information about hypothetical account values and hypothetical expenses based on the Fund’s actual expense ratio and an assumed rate of return of 5% per year before expenses, which is not the Fund’s actual return.
The hypothetical account values and expenses may not be used to estimate the actual ending account balance or expenses you paid for the period. You may use this information to compare the ongoing costs of investing in the Fund and other funds. To do so, compare this 5% hypothetical example with the 5% hypothetical examples that appear in the shareholder reports of the other funds.
Please note that the expenses shown in the table are meant to highlight your ongoing costs only and do not reflect any transaction costs, such as sales charges (loads) on purchase payments or contingent deferred sales charges on redemptions, if any. Therefore, the hypothetical information is useful in comparing ongoing costs only, and will not help you determine the relative total costs of owning different funds. In addition, if these transaction costs were included, your costs would have been higher.
| | | | | | | | | | | | |
| | | | | ACTUAL | | HYPOTHETICAL (5% annual return before
expenses) | | |
| | | Beginning
Account Value
(05/01/22) | | Ending
Account Value
(10/31/22)1 | | Expenses
Paid During
Period2 | | Ending
Account Value
(10/31/22) | | Expenses
Paid During
Period2 | | Annualized
Expense Ratio |
Class A | | $1,000.00 | | $1,008.60 | | $5.37 | | $1,019.86 | | $5.40 | | 1.06% |
Class C | | 1,000.00 | | 1,005.10 | | 9.15 | | 1,016.08 | | 9.20 | | 1.81 |
Class Y | | 1,000.00 | | 1,010.00 | | 4.10 | | 1,021.12 | | 4.13 | | 0.81 |
Investor Class | | 1,000.00 | | 1,008.90 | | 5.37 | | 1,019.86 | | 5.40 | | 1.06 |
Class R6 | | 1,000.00 | | 1,010.80 | | 3.60 | | 1,021.63 | | 3.62 | | 0.71 |
| 1 | The actual ending account value is based on the actual total return of the Fund for the period May 1, 2022 through October 31, 2022, after actual expenses and will differ from the hypothetical ending account value which is based on the Fund’s expense ratio and a hypothetical annual return of 5% before expenses. |
| 2 | Expenses are equal to the Fund’s annualized expense ratio as indicated above multiplied by the average account value over the period, multiplied by 184/365 to reflect the most recent fiscal half year. |
| | |
| 21 | | Invesco Health Care Fund |
Approval of Investment Advisory and Sub-Advisory Contracts
At meetings held on June 13, 2022, the Board of Trustees (the Board or the Trustees) of AIM Investment Funds (Invesco Investment Funds) as a whole, and the independent Trustees, who comprise over 75% of the Board, voting separately, approved the continuance of the Invesco Health Care Fund’s (the Fund) Master Investment Advisory Agreement with Invesco Advisers, Inc. (Invesco Advisers and the investment advisory agreement) and the Master Intergroup Sub-Advisory Contract for Mutual Funds with Invesco Asset Management Deutschland GmbH, Invesco Asset Management Limited, Invesco Asset Management (Japan) Limited, Invesco Hong Kong Limited, Invesco Senior Secured Management, Inc. and Invesco Canada Ltd. (collectively, the Affiliated Sub-Advisers and the sub-advisory contracts) for another year, effective July 1, 2022. After evaluating the factors discussed below, among others, the Board approved the renewal of the Fund’s investment advisory agreement and the sub-advisory contracts and determined that the compensation payable thereunder by the Fund to Invesco Advisers and by Invesco Advisers to the Affiliated Sub-Advisers is fair and reasonable.
The Board’s Evaluation Process
The Board has established an Investments Committee, which in turn has established Sub-Committees that meet throughout the year to review the performance of funds advised by Invesco Advisers (the Invesco Funds). The Sub-Committees meet regularly with portfolio managers for their assigned Invesco Funds and other members of management to review detailed information about investment performance and portfolio attributes of these funds. The Board has established additional standing and ad hoc committees that meet regularly throughout the year to review matters within their purview. The Board took into account evaluations and reports that it received from its committees and sub-committees, as well as the information provided to the Board and its committees and sub-committees throughout the year, in considering whether to approve each Invesco Fund’s investment advisory agreement and sub-advisory contracts.
As part of the contract renewal process, the Board reviews and considers information provided in response to detailed requests for information submitted to management by the independent Trustees with assistance from legal counsel to the independent Trustees and the Senior Officer, an officer of the Invesco Funds who reports directly to the independent Trustees. The Board receives comparative investment performance and fee and expense data regarding the Invesco Funds prepared by Broadridge Financial Solutions, Inc. (Broadridge), an independent mutual fund data provider, as well as information on the composition of the peer groups provided by Broadridge and its methodology for determining peer groups. The Board also receives an independent written evaluation from the Senior Officer. The Senior Officer’s evaluation is prepared as part of his responsibility to manage the process by which the Invesco Funds’ proposed management fees are negotiated during the annual contract renewal process to ensure they are negotiated in a manner that is at arms’ length and reasonable in accordance with certain negotiated regulatory requirements. In
addition to meetings with Invesco Advisers and fund counsel throughout the year and as part of meetings convened on May 2, 2022 and June 13, 2022, the independent Trustees also discussed the continuance of the investment advisory agreement and sub-advisory contracts in separate sessions with the Senior Officer and with independent legal counsel.
The discussion below is a summary of the Senior Officer’s independent written evaluation with respect to the Fund’s investment advisory agreement and sub-advisory contracts, as well as a discussion of the material factors and related conclusions that formed the basis for the Board’s approval of the Fund’s investment advisory agreement and sub-advisory contracts. The Trustees’ review and conclusions are based on the comprehensive consideration of all information presented to them during the course of the year and in prior years and are not the result of any single determinative factor. Moreover, one Trustee may have weighed a particular piece of information or factor differently than another Trustee. The information received and considered by the Board was current as of various dates prior to the Board’s approval on June 13, 2022.
Factors and Conclusions and Summary of Independent Written Fee Evaluation
| A. | Nature, Extent and Quality of Services Provided by Invesco Advisers and the Affiliated Sub-Advisers |
The Board reviewed the nature, extent and quality of the advisory services provided to the Fund by Invesco Advisers under the Fund’s investment advisory agreement, and the credentials and experience of the officers and employees of Invesco Advisers who provide these services, including the Fund’s portfolio manager(s). The Board’s review included consideration of Invesco Advisers’ investment process and oversight, credit analysis, and research capabilities. The Board considered information regarding Invesco Advisers’ programs for and resources devoted to risk management, including management of investment, enterprise, operational, liquidity, valuation and compliance risks, and technology used to manage such risks. The Board also received and reviewed information about Invesco Advisers’ role as administrator of the Invesco Funds’ liquidity risk management program. The Board received a description of, and reports related to, Invesco Advisers’ global security program and business continuity plans and of its approach to data privacy and cybersecurity, including related testing. The Board considered how the cybersecurity and business continuity plans of Invesco Advisers and its key service providers operated in the remote and hybrid working environment resulting from the novel coronavirus (“COVID-19”) pandemic and paved the way for a hybrid working framework in a normalized environment as employees return to the office. The Board also considered non-advisory services that Invesco Advisers and its affiliates provide to the Invesco Funds, such as various back office support functions, third party oversight, internal audit, valuation, portfolio trading and legal and compliance. The Board observed that Invesco Advisers’ systems preparedness and ongoing investment enabled Invesco Advisers to manage, operate and oversee the Invesco Funds with minimal impact or disruption through challenging environments. The Board
reviewed and considered the benefits to shareholders of investing in a Fund that is part of the family of funds under the umbrella of Invesco Ltd., Invesco Advisers’ parent company, and noted Invesco Ltd.’s depth and experience in running an investment management business, as well as its commitment of financial and other resources to such business. The Board concluded that the nature, extent and quality of the services provided to the Fund by Invesco Advisers are appropriate and satisfactory.
The Board reviewed the services that may be provided by the Affiliated Sub-Advisers under the sub-advisory contracts and the credentials and experience of the officers and employees of the Affiliated Sub-Advisers who provide these services. The Board noted the Affiliated Sub-Advisers’ expertise with respect to certain asset classes and that the Affiliated Sub-Advisers have offices and personnel that are located in financial centers around the world. As a result, the Board noted that the Affiliated Sub-Advisers can provide research and investment analysis on the markets and economies of various countries in which the Fund may invest, make recommendations regarding securities and assist with security trades. The Board concluded that the sub-advisory contracts may benefit the Fund and its shareholders by permitting Invesco Advisers to use the resources and talents of the Affiliated Sub-Advisers in managing the Fund. The Board concluded that the nature, extent and quality of the services that may be provided to the Fund by the Affiliated Sub-Advisers are appropriate and satisfactory.
| B. | Fund Investment Performance |
The Board considered Fund investment performance as a relevant factor in considering whether to approve the investment advisory agreement. The Board did not view Fund investment performance as a relevant factor in considering whether to approve the sub-advisory contracts for the Fund, as no Affiliated Sub-Adviser currently manages assets of the Fund.
The Board compared the Fund’s investment performance over multiple time periods ending December 31, 2021 to the performance of funds in the Broadridge performance universe and against the S&P Composite 1500 Health Care Index (Index). The Board noted that performance of Class A shares of the Fund was in the second quintile of its performance universe for the one year period and the fourth quintile for the three and five year periods (the first quintile being the best performing funds and the fifth quintile being the worst performing funds). The Board noted that performance of Class A shares of the Fund was below the performance of the Index for the one and five year periods and reasonably comparable to the performance of the Index for the three year period. The Board noted that the Fund underwent a portfolio management change in November 2021. The Board noted that stock selection in certain health care sub-sectors detracted from longer-term Fund performance. The Board recognized that the performance data reflects a snapshot in time as of a particular date and that selecting a different performance period could produce different results. The Board also reviewed more recent Fund performance as well as other performance metrics, which did not change its conclusions.
| | |
| 22 | | Invesco Health Care Fund |
| C. | Advisory and Sub-Advisory Fees and Fund Expenses |
The Board compared the Fund’s contractual management fee rate to the contractual management fee rates of funds in the Fund’s Broadridge expense group. The Board noted that the contractual management fee rate for Class A shares of the Fund was below the median contractual management fee rate of funds in its expense group. The Board noted that the term “contractual management fee” for funds in the expense group may include both advisory and certain non-portfolio management administrative services fees, but that Broadridge is not able to provide information on a fund by fund basis as to what is included. The Board also reviewed the methodology used by Broadridge in calculating expense group information, which includes using each fund’s contractual management fee schedule (including any applicable breakpoints) as reported in the most recent prospectus or statement of additional information for each fund in the expense group. The Board also considered comparative information regarding the Fund’s total expense ratio and its various components. The Board noted that there were only five funds (including the Fund) in the expense group.
The Board noted that Invesco Advisers has contractually agreed to waive fees and/or limit expenses of the Fund for the term disclosed in the Fund’s registration statement in an amount necessary to limit total annual operating expenses to a specified percentage of average daily net assets for each class of the Fund.
The Board also considered the fees charged by Invesco Advisers and its affiliates to other client accounts that are similarly managed. Invesco Advisers reviewed with the Board differences in the scope of services it provides to the Invesco Funds relative to that provided by Invesco Advisers and its affiliates to certain other types of client accounts, including, among others: management of cash flows as a result of redemptions and purchases; necessary infrastructure such as officers, office space, technology, legal and distribution; oversight of service providers; costs and business risks associated with launching new funds and sponsoring and maintaining the product line; and compliance with federal and state laws and regulations. Invesco Advisers also advised the Board that many of the similarly managed client accounts have all-inclusive fee structures, which are not easily un-bundled.
The Board also considered the services that may be provided by the Affiliated Sub-Advisers pursuant to the sub-advisory contracts, as well as the fees payable by Invesco Advisers to the Affiliated Sub-Advisers pursuant to the sub-advisory contracts.
| D. | Economies of Scale and Breakpoints |
The Board considered the extent to which there may be economies of scale in the provision of advisory services to the Fund and the Invesco Funds, and the extent to which such economies of scale are shared with the Fund and the Invesco Funds. The Board considered that the Fund benefits from economies of scale through contractual breakpoints in the Fund’s advisory fee schedule, which generally operate to reduce the Fund’s expense ratio as it grows in size. The Board noted that the Fund also shares in economies of scale through Invesco Advisers’ ability to negotiate lower fee arrangements with third party service providers. The Board noted that the Fund may also benefit from economies of scale through initial fee setting, fee waivers and expense
reimbursements, as well as Invesco Advisers’ investment in its business, including investments in business infrastructure, technology and cybersecurity.
| E. | Profitability and Financial Resources |
The Board reviewed information from Invesco Advisers concerning the costs of the advisory and other services that Invesco Advisers and its affiliates provide to the Fund and the Invesco Funds and the profitability of Invesco Advisers and its affiliates in providing these services in the aggregate and on an individual Fund-by-Fund basis. The Board considered the methodology used for calculating profitability and the periodic review and enhancement of such methodology. The Board noted that Invesco Advisers continues to operate at a net profit from services Invesco Advisers and its affiliates provide to the Invesco Funds in the aggregate and to most Funds individually. The Board did not deem the level of profits realized by Invesco Advisers and its affiliates from providing such services to be excessive, given the nature, extent and quality of the services provided. The Board noted that Invesco Advisers provided information demonstrating that Invesco Advisers is financially sound and has the resources necessary to perform its obligations under the investment advisory agreement, and provided representations indicating that the Affiliated Sub-Advisers are financially sound and have the resources necessary to perform their obligations under the sub-advisory contracts.
| F. | Collateral Benefits to Invesco Advisers and its Affiliates |
The Board considered various other benefits received by Invesco Advisers and its affiliates from the relationship with the Fund, including the fees received for providing administrative, transfer agency and distribution services to the Fund. The Board received comparative information regarding fees charged for these services, including information provided by Broadridge and other independent sources. The Board reviewed the performance of Invesco Advisers and its affiliates in providing these services and the organizational structure employed to provide these services. The Board noted that these services are provided to the Fund pursuant to written contracts that are reviewed and subject to approval on an annual basis by the Board based on its determination that the services are required for the operation of the Fund.
The Board considered the benefits realized by Invesco Advisers and the Affiliated Sub-Advisers as a result of portfolio brokerage transactions executed through “soft dollar” arrangements. The Board noted that soft dollar arrangements may result in the Fund bearing costs to purchase research that may be used by Invesco Advisers or the Affiliated Sub-Advisers with other clients and may reduce Invesco Advisers’ or the Affiliated Sub-Advisers’ expenses. The Board also considered that it receives from Invesco Advisers periodic reports that include a representation to the effect that these arrangements are consistent with regulatory requirements. The Board did not deem the soft dollar arrangements to be inappropriate.
The Board considered that the Fund’s uninvested cash and cash collateral from any securities lending arrangements may be invested in registered money market funds or, with regard to securities lending cash collateral, unregistered funds that comply with Rule 2a-7 (collectively referred to as “affiliated money market funds”) advised by Invesco Advisers. The Board considered information regarding the
returns of the affiliated money market funds relative to comparable overnight investments, as well as the fees paid by the affiliated money market funds to Invesco Advisers and its affiliates. In this regard, the Board noted that Invesco Advisers receives advisory fees from these affiliated money market funds attributable to the Fund’s investments. The Board also noted that Invesco Advisers has contractually agreed to waive through varying periods an amount equal to 100% of the net advisory fee Invesco Advisers receives from the affiliated money market funds with respect to the Fund’s investment in the affiliated money market funds of uninvested cash, but not cash collateral. The Board concluded that the advisory fees payable to Invesco Advisers from the Fund’s investment of cash collateral from any securities lending arrangements in the affiliated money market funds are for services that are not duplicative of services provided by Invesco Advisers to the Fund.
The Board considered that Invesco Advisers may serve as the Fund’s affiliated securities lending agent and evaluated the benefits realized by Invesco Advisers when serving in such role, including the compensation received. The Board considered Invesco Advisers’ securities lending platform and corporate governance structure for securities lending, including Invesco Advisers’ Securities Lending Governance Committee and its related responsibilities. The Board noted that to the extent the Fund utilizes Invesco Advisers as an affiliated securities lending agent, the Fund conducts its securities lending in accordance with, and in reliance upon, no-action letters issued by the SEC staff that provide guidance on how an affiliate may act as a direct agent lender and receive compensation for those services without obtaining exemptive relief. The Board considered information provided by Invesco Advisers related to the performance of Invesco Advisers as securities lending agent, including a summary of the securities lending services provided to the Fund by Invesco Advisers and the compensation paid to Invesco Advisers for such services, as well as any revenues generated for the Fund in connection with such securities lending activity and the allocation of such revenue between the Fund and Invesco Advisers.
The Board also received information about commissions that an affiliated broker may receive for executing certain trades for the Fund. Invesco Advisers and the Affiliated Sub-Advisers advised the Board of the benefits to the Fund of executing trades through the affiliated broker and that such trades were executed in compliance with rules under the federal securities laws and consistent with best execution obligations.
| | |
| 23 | | Invesco Health Care Fund |
Tax Information
Form 1099-DIV, Form 1042-S and other year–end tax information provide shareholders with actual calendar year amounts that should be included in their tax returns. Shareholders should consult their tax advisers.
The following distribution information is being provided as required by the Internal Revenue Code or to meet a specific state’s requirement.
The Fund designates the following amounts or, if subsequently determined to be different, the maximum amount allowable for its fiscal year ended October 31, 2022:
| | | | | | |
Federal and State Income Tax | | | | | |
Long-Term Capital Gain Distributions | | $ | 343,672,773 | |
Qualified Dividend Income* | | | 0.00 | % |
Corporate Dividends Received Deduction* | | | 0.00 | % |
U.S. Treasury Obligations* | | | 0.00 | % |
Qualified Business Income* | | | 0.00 | % |
Business Interest Income* | | | 0.00 | % |
| | * | The above percentages are based on ordinary income dividends paid to shareholders during the Fund’s fiscal year. |
| | |
| 24 | | Invesco Health Care Fund |
Trustees and Officers
The address of each trustee and officer is AIM Investment Funds (Invesco Investment Funds) (the “Trust”), 11 Greenway Plaza, Suite 1000, Houston, Texas 77046-1173. The trustees serve for the life of the Trust, subject to their earlier death, incapacitation, resignation, retirement or removal as more specifically provided in the Trust’s organizational documents. Each officer serves for a one year term or until their successors are elected and qualified. Column two below includes length of time served with predecessor entities, if any.
| | | | | | | | |
Name, Year of Birth and
Position(s) Held with the Trust | | Trustee and/or
Officer Since | | Principal Occupation(s) During Past 5 Years | | Number of
Funds in Fund Complex
Overseen by
Trustee | | Other Directorship(s) Held by Trustee
During Past 5 Years |
| | | | | |
| Interested Trustee | | | | | | | | |
Martin L. Flanagan1 – 1960 Trustee and Vice Chair | | 2007 | | Executive Director, Chief Executive Officer and President, Invesco Ltd. (ultimate parent of Invesco and a global investment management firm); Trustee and Vice Chair, The Invesco Funds; Vice Chair, Investment Company Institute; and Member of Executive Board, SMU Cox School of Business Formerly: Advisor to the Board, Invesco Advisers, Inc. (formerly known as Invesco Institutional (N.A.), Inc.); Chairman and Chief Executive Officer, Invesco Advisers, Inc. (registered investment adviser); Director, Chairman, Chief Executive Officer and President, Invesco Holding Company (US), Inc. (formerly IVZ Inc.) (holding company), Invesco Group Services, Inc. (service provider) and Invesco North American Holdings, Inc. (holding company); Director, Chief Executive Officer and President, Invesco Holding Company Limited (parent of Invesco and a global investment management firm); Director, Invesco Ltd.; Chairman, Investment Company Institute and President, Co-Chief Executive Officer, Co-President, Chief Operating Officer and Chief Financial Officer, Franklin Resources, Inc. (global investment management organization) | | 189 | | None |
| | 1 | Mr. Flanagan is considered an interested person (within the meaning of Section 2(a)(19) of the 1940 Act) of the Trust because he is an officer of the Adviser to the Trust, and an officer and a director of Invesco Ltd., ultimate parent of the Adviser. |
| | |
| T-1 | | Invesco Health Care Fund |
Trustees and Officers–(continued)
| | | | | | | | |
Name, Year of Birth and Position(s) Held with the Trust | | Trustee and/or
Officer Since | | Principal Occupation(s) During Past 5 Years | | Number of
Funds in Fund Complex
Overseen by
Trustee | | Other Directorship(s) Held by Trustee
During Past 5 Years |
| Independent Trustees | | | | | | | | |
Beth Ann Brown – 1968 Trustee (2019) and Chair (August 2022) | | 2019 | | Independent Consultant Formerly: Head of Intermediary Distribution, Managing Director, Strategic Relations, Managing Director, Head of National Accounts, Senior Vice President, National Account Manager and Senior Vice President, Key Account Manager, Columbia Management Investment Advisers LLC; Vice President, Key Account Manager, Liberty Funds Distributor, Inc.; and Trustee of certain Oppenheimer Funds | | 189 | | Director, Board of Directors of Caron Engineering Inc.; Advisor, Board of Advisors of Caron Engineering Inc.; President and Director, Acton Shapleigh Youth Conservation Corps (non-profit) Formerly: President and Director Director of Grahamtastic Connection (non-profit) |
Cynthia Hostetler –1962 Trustee | | 2017 | | Non-Executive Director and Trustee of a number of public and private business corporations Formerly: Director, Aberdeen Investment Funds (4 portfolios); Director, Artio Global Investment LLC (mutual fund complex); Director, Edgen Group, Inc. (specialized energy and infrastructure products distributor); Director, Genesee & Wyoming, Inc. (railroads); Head of Investment Funds and Private Equity, Overseas Private Investment Corporation; President, First Manhattan Bancorporation, Inc.; and Attorney, Simpson Thacher & Bartlett LLP | | 189 | | Resideo Technologies, Inc. (smart home technology); Vulcan Materials Company (construction materials company); Trilinc Global Impact Fund; Textainer Group Holdings, (shipping container leasing company); Investment Company Institute (professional organization); and Independent Directors Council (professional organization) |
Eli Jones – 1961 Trustee | | 2016 | | Professor and Dean Emeritus, Mays Business School - Texas A&M University Formerly: Dean of Mays Business School-Texas A&M University; Professor and Dean, Walton College of Business, University of Arkansas and E.J. Ourso College of Business, Louisiana State University; and Director, Arvest Bank | | 189 | | Insperity, Inc. (formerly known as Administaff) (human resources provider); and Member of Regional Board of Directors and Board of Directors, First Financial Bancorp (regional bank) |
Elizabeth Krentzman – 1959 Trustee | | 2019 | | Formerly: Principal and Chief Regulatory Advisor for Asset Management Services and U.S. Mutual Fund Leader of Deloitte & Touche LLP; General Counsel of the Investment Company Institute (trade association); National Director of the Investment Management Regulatory Consulting Practice, Principal, Director and Senior Manager of Deloitte & Touche LLP; Assistant Director of the Division of Investment Management - Office of Disclosure and Investment Adviser Regulation of the U.S. Securities and Exchange Commission and various positions with the Division of Investment Management – Office of Regulatory Policy of the U.S. Securities and Exchange Commission; Associate at Ropes & Gray LLP; and Trustee of certain Oppenheimer Funds | | 189 | | Formerly: Member of the Cartica Funds Board of Directors (private investment fund); Trustee of the University of Florida National Board Foundation; and Member of the University of Florida Law Center Association, Inc. Board of Trustees, Audit Committee and Membership Committee |
Anthony J. LaCava, Jr. – 1956 Trustee | | 2019 | | Formerly: Director and Member of the Audit Committee, Blue Hills Bank (publicly traded financial institution) and Managing Partner, KPMG LLP | | 189 | | Blue Hills Bank; Chairman, Bentley University; Member, Business School Advisory Council; and Nominating Committee, KPMG LLP |
Prema Mathai-Davis – 1950 Trustee | | 2001 | | Retired Formerly: Co-Founder & Partner of Quantalytics Research, LLC, (a FinTech Investment Research Platform for the Self-Directed Investor); Trustee of YWCA Retirement Fund; CEO of YWCA of the USA; Board member of the NY Metropolitan Transportation Authority; Commissioner of the NYC Department of Aging; and Board member of Johns Hopkins Bioethics Institute | | 189 | | Member of Board of Positive Planet US (non-profit) and HealthCare Chaplaincy Network (non-profit) |
| | |
| T-2 | | Invesco Health Care Fund |
Trustees and Officers–(continued)
| | | | | | | | |
Name, Year of Birth and
Position(s) Held with the Trust | | Trustee and/or
Officer Since | | Principal Occupation(s) During Past 5 Years | | Number of
Funds in Fund Complex
Overseen by
Trustee | | Other Directorship(s) Held by Trustee
During Past 5 Years |
| Independent Trustees–(continued) | | | | |
Joel W. Motley – 1952 Trustee | | 2019 | | Director of Office of Finance, Federal Home Loan Bank System; Managing Director of Carmona Motley Inc. (privately held financial advisor); Member of the Council on Foreign Relations and its Finance and Budget Committee; Chairman Emeritus of Board of Human Rights Watch and Member of its Investment Committee; and Member of Investment Committee Board of Historic Hudson Valley (non-profit cultural organization); Member of the Board, Blue Ocean Acquisition Corp.; and Member of the Vestry and the Investment Committee of Trinity Church Wall Street. Formerly: Managing Director of Public Capital Advisors, LLC (privately held financial advisor); Managing Director of Carmona Motley Hoffman, Inc. (privately held financial advisor); Trustee of certain Oppenheimer Funds; and Director of Columbia Equity Financial Corp. (privately held financial advisor) | | 189 | | Member of Board of Trust for Mutual Understanding (non-profit promoting the arts and environment); Member of Board of Greenwall Foundation (bioethics research foundation) and its Investment Committee; Member of Board of Friends of the LRC (non-profit legal advocacy); and Board Member and Investment Committee Member of Pulitzer Center for Crisis Reporting (non-profit journalism) |
Teresa M. Ressel – 1962 Trustee | | 2017 | | Non-executive director and trustee of a number of public and private business corporations Formerly: Chief Executive Officer, UBS Securities LLC (investment banking); Chief Operating Officer, UBS AG Americas (investment banking); Sr. Management Team Olayan America, The Olayan Group (international investor/commercial/industrial); Assistant Secretary for Management & Budget and Designated Chief Financial Officer, U.S. Department of Treasury and Director, ON Semiconductor Corporation (semiconductor manufacturing) | | 189 | | None |
Robert C. Troccoli – 1949 Trustee | | 2016 | | Retired Formerly: Adjunct Professor, University of Denver – Daniels College of Business; and Managing Partner, KPMG LLP | | 189 | | None |
Daniel S. Vandivort – 1954 Trustee | | 2019 | | President, Flyway Advisory Services LLC (consulting and property management) Formerly: President and Chief Investment Officer, previously Head of Fixed Income, Weiss Peck and Greer/Robeco Investment Management; Trustee and Chair, Weiss Peck and Greer Funds Board; and various capacities at CS First Boston including Head of Fixed Income at First Boston Asset Management. | | 189 | | Formerly: Trustee and Governance Chair, Oppenheimer Funds; Treasurer, Chairman of the Audit and Finance Committee, Huntington Disease Foundation of America |
| | |
| T-3 | | Invesco Health Care Fund |
Trustees and Officers–(continued)
| | | | | | | | |
Name, Year of Birth and
Position(s) Held with the Trust | | Trustee and/or
Officer Since | | Principal Occupation(s) During Past 5 Years | | Number of
Funds in Fund Complex
Overseen by
Trustee | | Other Directorship(s) Held by Trustee
During Past 5 Years |
| Officers | | | | | | | | |
Sheri Morris – 1964 President and Principal Executive Officer | | 1999 | | Director, Invesco Trust Company; Head of Global Fund Services, Invesco Ltd.; President and Principal Executive Officer, The Invesco Funds; Vice President, Invesco Exchange-Traded Fund Trust, Invesco Exchange-Traded Fund Trust II, Invesco India Exchange-Traded Fund Trust, Invesco Actively Managed Exchange-Traded Fund Trust, Invesco Actively Managed Exchange-Traded Commodity Fund Trust and Invesco Exchange-Traded Self-Indexed Fund Trust; and Vice President, OppenheimerFunds, Inc. Formerly: Vice President, Treasurer and Principal Financial Officer, The Invesco Funds; Vice President, Invesco AIM Advisers, Inc., Invesco AIM Capital Management, Inc. and Invesco AIM Private Asset Management, Inc.; Assistant Vice President and Assistant Treasurer, The Invesco Funds; Vice President and Assistant Vice President, Invesco Advisers, Inc.; Assistant Vice President, Invesco AIM Capital Management, Inc. and Invesco AIM Private Asset Management, Inc.; Treasurer, Invesco Exchange-Traded Fund Trust, Invesco Exchange-Traded Fund Trust II, Invesco India Exchange-Traded Fund Trust and Invesco Actively Managed Exchange-Traded Fund Trust; and Senior Vice President, Invesco Advisers, Inc. (formerly known as Invesco Institutional (N.A.), Inc.) (registered investment adviser) | | N/A | | N/A |
| Jeffrey H. Kupor – 1968 Senior Vice President, Chief Legal Officer and Secretary | | 2018 | | Head of Legal of the Americas, Invesco Ltd.; Senior Vice President and Secretary, Invesco Advisers, Inc. (formerly known as Invesco Institutional (N.A.), Inc.) (registered investment adviser); Secretary, Invesco Distributors, Inc. (formerly known as Invesco AIM Distributors, Inc.); Vice President and Secretary, Invesco Investment Services, Inc. (formerly known as Invesco AIM Investment Services, Inc.); Senior Vice President, Chief Legal Officer and Secretary, The Invesco Funds; Secretary and General Counsel, Invesco Investment Advisers LLC (formerly known as Van Kampen Asset Management); Secretary and General Counsel, Invesco Capital Markets, Inc. (formerly known as Van Kampen Funds Inc.); Chief Legal Officer, Invesco Exchange-Traded Fund Trust, Invesco Exchange-Traded Fund Trust II, Invesco India Exchange-Traded Fund Trust, Invesco Actively Managed Exchange-Traded Fund Trust, Invesco Actively Managed Exchange-Traded Commodity Fund Trust and Invesco Exchange-Traded Self-Indexed Fund Trust;; Secretary and Vice President, Harbourview Asset Management Corporation; Secretary and Vice President, OppenheimerFunds, Inc. and Invesco Managed Accounts, LLC; Secretary and Senior Vice President, OFI Global Institutional, Inc.; Secretary and Vice President, OFI SteelPath, Inc.; Secretary and Vice President, Oppenheimer Acquisition Corp.; Secretary and Vice President, Shareholder Services, Inc.; and Secretary and Vice President, Trinity Investment Management Corporation Formerly: Senior Vice President, Invesco Distributors, Inc.; Secretary and Vice President, Jemstep, Inc.; Head of Legal, Worldwide Institutional, Invesco Ltd.; Secretary and General Counsel, INVESCO Private Capital Investments, Inc.; Senior Vice President, Secretary and General Counsel, Invesco Management Group, Inc. (formerly known as Invesco AIM Management Group, Inc.); Assistant Secretary, INVESCO Asset Management (Bermuda) Ltd.; Secretary and General Counsel, Invesco Private Capital, Inc.;Assistant Secretary and General Counsel, INVESCO Realty, Inc.; Secretary and General Counsel, Invesco Senior Secured Management, Inc.; Secretary, Sovereign G./P. Holdings Inc.; Secretary, Invesco Indexing LLC; and Secretary, W.L. Ross & Co., LLC | | N/A | | N/A |
Andrew R. Schlossberg –1974 Senior Vice President | | 2019 | | Senior Vice President, Invesco Group Services, Inc.; Head of the Americas and Senior Managing Director, Invesco Ltd.; Director and Senior Vice President, Invesco Advisers, Inc. (formerly known as Invesco Institutional (N.A.), Inc.) (registered investment adviser); Director and Chairman, Invesco Investment Services, Inc. (formerly known as Invesco AIM Investment Services, Inc.) (registered transfer agent); Senior Vice President, The Invesco Funds; and Director, Invesco Investment Advisers LLC (formerly known as Van Kampen Asset Management) Formerly: Director, President and Chairman, Invesco Insurance Agency, Inc.; Director, Invesco UK Limited; Director and Chief Executive, Invesco Asset Management Limited and Invesco Fund Managers Limited; Assistant Vice President, The Invesco Funds; Senior Vice President, Invesco Advisers, Inc. (formerly known as Invesco Institutional (N.A.), Inc.) (registered investment adviser); Director and Chief Executive, Invesco Administration Services Limited and Invesco Global Investment Funds Limited; Director, Invesco Distributors, Inc.; Head of EMEA, Invesco Ltd.; President, Invesco Actively Managed Exchange-Traded Commodity Fund Trust, Invesco Actively Managed Exchange-Traded Fund Trust, Invesco Exchange-Traded Fund Trust, Invesco Exchange-Traded Fund Trust II and Invesco India Exchange-Traded Fund Trust; and Managing Director and Principal Executive Officer, Invesco Capital Management LLC | | N/A | | N/A |
| | |
| T-4 | | Invesco Health Care Fund |
Trustees and Officers–(continued)
| | | | | | | | |
Name, Year of Birth and
Position(s) Held with the Trust | | Trustee and/or
Officer Since | | Principal Occupation(s) During Past 5 Years | | Number of
Funds in Fund Complex
Overseen by
Trustee | | Other Directorship(s) Held by Trustee
During Past 5 Years |
| Officers–(continued) | | | | | | | | |
John M. Zerr – 1962 Senior Vice President | | 2006 | | Chief Operating Officer of the Americas; Senior Vice President, Invesco Advisers, Inc. (formerly known as Invesco Institutional (N.A.), Inc.) (registered investment adviser); Senior Vice President, Invesco Distributors, Inc. (formerly known as Invesco AIM Distributors, Inc.); Director and Vice President, Invesco Investment Services, Inc. (formerly known as Invesco AIM Investment Services, Inc.) Senior Vice President, The Invesco Funds; Managing Director, Invesco Capital Management LLC; Director, Invesco Investment Advisers LLC (formerly known as Van Kampen Asset Management); Senior Vice President, Invesco Capital Markets, Inc. (formerly known as Van Kampen Funds Inc.); Manager, Invesco Indexing LLC; Manager, Invesco Specialized Products, LLC; Member, Invesco Canada Funds Advisory Board; Director, President and Chief Executive Officer, Invesco Corporate Class Inc. (corporate mutual fund company); and Director, Chairman, President and Chief Executive Officer, Invesco Canada Ltd. (formerly known as Invesco Trimark Ltd./Invesco Trimark Ltèe) (registered investment adviser and registered transfer agent); President, Invesco, Inc.; President, Invesco Global Direct Real Estate Feeder GP Ltd.; President, Invesco IP Holdings (Canada) Ltd; President, Invesco Global Direct Real Estate GP Ltd.; President, Invesco Financial Services Ltd. / Services Financiers Invesco Ltée; and Director and Chairman, Invesco Trust Company Formerly: President, Trimark Investments Ltd/Services Financiers Invesco Ltee; Director and Senior Vice President, Invesco Insurance Agency, Inc.; Director and Senior Vice President, Invesco Management Group, Inc. (formerly known as Invesco AIM Management Group, Inc.); Secretary and General Counsel, Invesco Management Group, Inc. (formerly known as Invesco AIM Management Group, Inc.); Secretary, Invesco Investment Services, Inc. (formerly known as Invesco AIM Investment Services, Inc.); Chief Legal Officer and Secretary, The Invesco Funds; Secretary and General Counsel, Invesco Investment Advisers LLC (formerly known as Van Kampen Asset Management); Secretary and General Counsel, Invesco Capital Markets, Inc. (formerly known as Van Kampen Funds Inc.); Chief Legal Officer, Invesco Exchange-Traded Fund Trust, Invesco Exchange-Traded Fund Trust II, Invesco India Exchange-Traded Fund Trust, Invesco Actively Managed Exchange-Traded Fund Trust, Invesco Actively Managed Exchange-Traded Commodity Fund Trust and Invesco Exchange-Traded Self-Indexed Fund Trust; Secretary, Invesco Indexing LLC; Director, Secretary, General Counsel and Senior Vice President, Van Kampen Exchange Corp.; Director, Vice President and Secretary, IVZ Distributors, Inc. (formerly known as INVESCO Distributors, Inc.); Director and Vice President, INVESCO Funds Group, Inc.; Director and Vice President, Van Kampen Advisors Inc.; Director, Vice President, Secretary and General Counsel, Van Kampen Investor Services Inc.;Director and Secretary, Invesco Distributors, Inc. (formerly known as Invesco AIM Distributors, Inc.); Director, Senior Vice President, General Counsel and Secretary, Invesco AIM Advisers, Inc. and Van Kampen Investments Inc.; Director, Vice President and Secretary, Fund Management Company; Director, Senior Vice President, Secretary, General Counsel and Vice President, Invesco AIM Capital Management, Inc.; and Chief Operating Officer and General Counsel, Liberty Ridge Capital, Inc. (an investment adviser) | | N/A | | N/A |
Gregory G. McGreevey – 1962 Senior Vice President | | 2012 | | Senior Managing Director, Invesco Ltd.; Director, Chairman, President, and Chief Executive Officer, Invesco Advisers, Inc. (formerly known as Invesco Institutional (N.A.), Inc.) (registered investment adviser); Director, Invesco Mortgage Capital, Inc. and Invesco Senior Secured Management, Inc.; Senior Vice President, The Invesco Funds; President, SNW Asset Management Corporation and Invesco Managed Accounts, LLC; Chairman and Director, Invesco Private Capital, Inc.; Chairman and Director, INVESCO Private Capital Investments, Inc.; Chairman and Director, INVESCO Realty, Inc.; and Senior Vice President, Invesco Group Services, Inc. Formerly: Senior Vice President, Invesco Management Group, Inc. and Invesco Advisers, Inc.; Assistant Vice President, The Invesco Funds | | N/A | | N/A |
Adrien Deberghes – 1967 Principal Financial Officer, Treasurer and Vice President | | 2020 | | Head of the Fund Office of the CFO and Fund Administration; Vice President, Invesco Advisers, Inc.; Principal Financial Officer, Treasurer and Vice President, The Invesco Funds; Vice President, Invesco Exchange-Traded Fund Trust, Invesco Exchange-Traded Fund Trust II, Invesco India Exchange-Traded Fund Trust, Invesco Actively Managed Exchange-Traded Fund Trust, Invesco Actively Managed Exchange-Traded Commodity Fund Trust and Invesco Exchange-Traded Self-Indexed Fund Trust Formerly: Senior Vice President and Treasurer, Fidelity Investments | | N/A | | N/A |
| Crissie M. Wisdom – 1969 Anti-Money Laundering Compliance Officer | | 2013 | | Anti-Money Laundering and OFAC Compliance Officer for Invesco U.S. entities including: Invesco Advisers, Inc. and its affiliates, Invesco Capital Markets, Inc., Invesco Distributors, Inc., Invesco Investment Services, Inc., The Invesco Funds, Invesco Capital Management, LLC, Invesco Trust Company; and Fraud Prevention Manager for Invesco Investment Services, Inc. | | N/A | | N/A |
| | |
| T-5 | | Invesco Health Care Fund |
Trustees and Officers–(continued)
| | | | | | | | |
Name, Year of Birth and
Position(s) Held with the Trust | | Trustee and/or
Officer Since | | Principal Occupation(s) During Past 5 Years | | Number of
Funds in Fund Complex
Overseen by
Trustee | | Other Directorship(s) Held by Trustee
During Past 5 Years |
| Officers – (continued) | | | | | | | | |
Todd F. Kuehl – 1969 Chief Compliance Officer and Senior Vice President | | 2020 | | Chief Compliance Officer, Invesco Advisers, Inc. (registered investment adviser); and Chief Compliance Officer and Senior Vice President, The Invesco Funds Formerly: Managing Director and Chief Compliance Officer, Legg Mason (Mutual Funds); Chief Compliance Officer, Legg Mason Private Portfolio Group (registered investment adviser) | | N/A | | N/A |
James Bordewick, Jr. – 1959 Senior Vice President and Senior Officer | | 2022 | | Senior Vice President and Senior Officer, The Invesco Funds; and Chief Legal Officer, KingsCrowd, Inc. (research and analytical platform for investment in private capital markets) Formerly, Chief Operating Officer and Head of Legal and Regulatory, Netcapital (private capital investment platform); Managing Director, General Counsel of asset management and Chief Compliance Officer for asset management and private banking, Bank of America Corporation; Chief Legal Officer, Columbia Funds and BofA Funds; Senior Vice President and Associate General Counsel, MFS Investment Management; Chief Legal Officer, MFS Funds; Associate, Ropes & Gray; Associate, Gaston Snow & Ely Bartlett | | N/A | | N/A |
The Statement of Additional Information of the Trust includes additional information about the Fund’s Trustees and is available upon request, without charge, by calling 1.800.959.4246. Please refer to the Fund’s Statement of Additional Information for information on the Fund’s sub-advisers.
| | | | | | |
Office of the Fund 11 Greenway Plaza, Suite 1000
Houston, TX 77046-1173 | | Investment Adviser Invesco Advisers, Inc. 1555 Peachtree Street, N.E. Atlanta, GA 30309 | | Distributor Invesco Distributors, Inc. 11 Greenway Plaza, Suite 1000
Houston, TX 77046-1173 | | Auditors PricewaterhouseCoopers LLP 1000 Louisiana Street, Suite 5800 Houston, TX 77002-5021 |
Counsel to the Fund Stradley Ronon Stevens & Young, LLP 2005 Market Street, Suite 2600 Philadelphia, PA 19103-7018 | | Counsel to the Independent Trustees Goodwin Procter LLP 901 New York Avenue, N.W. Washington, D.C. 20001 | | Transfer Agent Invesco Investment Services, Inc. 11 Greenway Plaza, Suite 1000
Houston, TX 77046-1173 | | Custodian State Street Bank and Trust Company 225 Franklin Street Boston, MA 02110-2801 |
| | |
| T-6 | | Invesco Health Care Fund |
(This page intentionally left blank)

Go paperless with eDelivery
Visit invesco.com/edelivery to enjoy the convenience and security of anytime electronic access to your investment documents.
With eDelivery, you can elect to have any or all of the following materials delivered straight to your inbox to download, save and print from your own computer:
∎ Fund reports and prospectuses
∎ Quarterly statements
∎ Daily confirmations
∎ Tax forms
Invesco mailing information
Send general correspondence to Invesco Investment Services, Inc., P.O. Box 219078, Kansas City, MO 64121-9078.
Important notice regarding delivery of security holder documents
To reduce Fund expenses, only one copy of most shareholder documents may be mailed to shareholders with multiple accounts at the same address (Householding). Mailing of your shareholder documents may be householded indefinitely unless you instruct us otherwise. If you do not want the mailing of these documents to be combined with those for other members of your household, please contact Invesco Investment Services, Inc. at 800 959 4246 or contact your financial institution. We will begin sending you individual copies for each account within 30 days after receiving your request.
Fund holdings and proxy voting information
The Fund provides a complete list of its portfolio holdings four times each year, at the end of each fiscal quarter. For the second and fourth quarters, the list appears, respectively, in the Fund’s semiannual and annual reports to shareholders. For the first and third quarters, the Fund files the list with the Securities and Exchange Commission (SEC) as an exhibit to its reports on Form N-PORT. The most recent list of portfolio holdings is available at invesco.com/completeqtrholdings. Shareholders can also look up the Fund’s Form N-PORT filings on the SEC website, sec.gov. The SEC file numbers for the Fund are shown below.
A description of the policies and procedures that the Fund uses to determine how to vote proxies relating to portfolio securities is available without charge, upon request, from our Client Services department at 800 959 4246, or at invesco.com/corporate/about-us/esg. The information is also available on the SEC website, sec.gov.
Information regarding how the Fund voted proxies related to its portfolio securities during the most recent 12-month period ended June 30 is available at invesco.com/proxysearch. This information is also available on the SEC website, sec.gov.
Invesco Advisers, Inc. is an investment adviser; it provides investment advisory services to individual and institutional clients and does not sell securities. Invesco Distributors, Inc. is the US distributor for Invesco Ltd.’s retail mutual funds, exchange-traded funds and institutional money market funds. Both are wholly owned, indirect subsidiaries of Invesco Ltd.
| | | | |
| SEC file number(s): 811-05426 and 033-19338 | | Invesco Distributors, Inc. | | GHC-AR-1 |

| | |
| | |
| Annual Report to Shareholders | | October 31, 2022 |
Invesco International Bond Fund
Nasdaq:
A: OIBAX ∎ C: OIBCX ∎ R: OIBNX ∎ Y: OIBYX ∎ R5: INBQX ∎ R6: OIBIX
Management’s Discussion of Fund Performance
| | | | |
| |
Performance summary | |
For the fiscal year ended October 31, 2022, Class A shares of Invesco International Bond Fund (the Fund), at net asset value (NAV), outperformed the FTSE Non-U.S. Dollar World Government Bond Index. Your Fund’s long-term performance appears later in this report. | |
| |
Fund vs. Indexes | |
Total returns, 10/31/21 to 10/31/22, at net asset value (NAV). Performance shown does not include applicable contingent deferred sales charges (CDSC) or front-end sales charges, which would have reduced performance. | |
Class A Shares | | | -19.50 | % |
Class C Shares | | | -20.21 | |
Class R Shares | | | -19.59 | |
Class Y Shares | | | -19.49 | |
Class R5 Shares | | | -19.23 | |
Class R6 Shares | | | -19.25 | |
FTSE Non-U.S. Dollar World Government Bond Index▼ | | | -27.64 | |
JP Morgan Government Bond Index - Emerging Markets (GBI-EM) Global Diversified Index▼ | | | -20.27 | |
JP Morgan EMBI Global Diversified Index▼ | | | -24.19 | |
Custom Invesco International Bond Index∎ | | | -24.71 | |
|
Source(s): ▼RIMES Technologies Corp.; ∎Invesco, RIMES Technologies Corp. | |
Market conditions and your Fund
During the fiscal year ended October 31, 2022, global fixed-income markets remained volatile due to a series of shocks to financial markets from the Russia-Ukraine war, high commodity prices, high inflation, rapid monetary policy tightening, recession fears and slowing growth in China. Throughout the year, inflation data continued to surprise on the upside, leading both developed market (DM) and emerging market (EM) central banks to hike interest rates aggressively, prompting negative returns across fixed-income markets. In particular, the US Federal Reserve (the Fed) raised policy rates (which have a global impact) during the fiscal year at a pace and scale not seen in the past two decades. This prompted the US dollar to rise considerably over the fiscal year and generated uncertainty on the degree to which EM central banks would need to continue hiking despite getting an earlier start last fiscal year.
Towards the end of 2021, concerns about inflation were already heightened, although the Fed left policy rates unchanged in the fourth quarter. They indicated accommodative policies were coming to an end and announced the reduction of their monthly bond purchase program. In the first quarter of 2022, conflict and uncertainty drove sharp moves across risk assets following Russia’s invasion of Ukraine. As commodity prices spiked, this exacerbated existing inflationary pressures and forced several central banks to adopt a more hawkish stance. Global monetary policy divergence persisted, as most emerging markets (aside from China) seemed closer to the end of their interest rate hiking cycles, while various developed markets were in different stages. Elevated inflation and a tight labor market led the Fed to officially
commence its rate hiking cycle and the Bank of England raised rates twice after their initial increase in December, while China signaled a potential increase in its monetary policy accommodation. The US dollar ended the first quarter of 2022, 2.3% higher.1
In the second quarter of 2022, capital markets were preoccupied with surging inflation that prompted the Fed and subsequently the European Central Bank and Reserve Bank of Australia, to shift toward tighter monetary policy. EM central banks across Latin America and Central Europe followed suit, alongside elevated food and energy prices. Toward the end of June, market focus shifted from inflation fears and the prospect of increasingly aggressive interest rate hikes to recession fears and the anticipation of lower rates. Though US and European economies were already decelerating, growth in Asia remained relatively resilient, supported by post-COVID-19 reopenings, despite some drag from lingering lockdowns in China, which is typically the region’s main driver. The US dollar rose considerably in April, fell slightly in May and then rose again in June, ending the second quarter of 2022 almost 6.5% higher.1
The third quarter of 2022 began with a relief rally in July as markets anticipated slowing inflation and possible rate cuts by the Fed in 2023. This narrative quickly reversed course in August and September of 2022 on the back of continued geopolitical uncertainty, rising concerns of a global economic slowdown and persistent elevated inflation. As a result, central banks continued their aggressive rate hiking cycles, with the Fed hiking 1.5%, the European Central Bank hiking 1.25% and the Bank of England hiking 1%. In emerging markets, central banks in Asia, Central and Eastern Europe and Latin America all raised their interest rates, though it seemed
like central banks such as Brazil and Hungary might be reaching the end of their hiking cycles. While global growth indicators continued to slow, European concerns about an energy crisis heading into winter lingered and China’s lackluster re-opening dynamics remained intact, central banks continued to prioritize bringing down inflation over supporting growth. These conditions contributed to the US dollar’s rapid rise, increasing slightly in July and reaching 20-year highs in August and September, ending the third quarter of 2022 almost 7.1% higher.1
Compared to the Custom Invesco International Bond Index, the Fund’s interest rate and foreign currency exposure contributed positively to relative Fund performance, while credit exposure detracted. The top contributors to relative Fund performance were interest rate positioning in Germany, positioning in the Japanese Yen and interest rate positioning in Brazil, while the top detractors were interest rate positioning in the European Union, positioning in the Argentinian Peso and the overall yield curve positioning.
Entering 2022, portfolio positioning favored emerging market rates and foreign currency (FX) exposure given high emerging markets nominal interest rates, with an expectation of inflation being less persistent. As global inflation was exacerbated by the Russia-Ukraine conflict and a delayed reopening in China, developed market central banks were forced to raise rates aggressively, which in turn impacted central bank expectations in emerging markets. While we have seen considerable market volatility this year from the rapid repricing of inflation expectations and the path of US interest rates, we anticipate the value created from an income and total return perspective is meaningful. A year ago, EM monetary policy rates averaged around 3.25%, while today the average policy rate is over 6.75%,1 though there is divergence across regions. We believe the conditions are aligning for international fixed-income to potentially outperform over the next two to three years, led by EMs.
After hiking considerably in 2021, EM central banks may be approaching their interest rate peaks (having started their hiking cycles ahead of developed markets) and we expect the growth picture for emerging markets to remain stronger than that of the US and Europe, where a growth revival could take some time. While uncertainty on the path of US interest rates has prevented markets from unlocking the value we see in emerging markets so far, we believe the path of US interest rates should soon become clearer and inflation expectations in emerging markets should become more anchored. With average EM inflation already lower than US inflation, this makes the real-rate differential compelling. Additionally, with the US dollar recently reaching 40-year highs and the Fed getting closer to the end of its hiking cycle, we may be seeing signs of stability and reversal. A
| | |
| 2 | | Invesco International Bond Fund |
decline in the US dollar could serve as a tailwind for international markets.
Overall, we believe individual country dynamics will drive performance going forward and we expect the dispersion in returns between countries will be larger than in the past, which argues for an actively managed approach such as ours. We believe this is a fertile landscape to extract performance alpha in the asset class, particularly as the Fed’s monetary policy trajectory becomes more visible and we remain focused on capitalizing on it.
Please note that we implemented our strategy using derivative instruments, including futures, forwards, swaps and options. Therefore, a portion of the performance of the strategy, both positive and negative, can be attributed to these instruments. Derivatives can be a cost-effective way to gain or hedge exposure to certain risks. However, derivatives may amplify traditional investment risks through the creation of leverage and may be less liquid than traditional securities.
Part of the Fund’s strategy to manage credit and currency risk in the portfolio during the fiscal year entailed purchasing and selling credit and currency derivatives. We sought to manage credit market risk by purchasing and selling protection through credit default swaps at various points throughout the fiscal year. The currency management was carried out via currency forwards and options on an as-needed basis and we believe this strategy was effective in managing the currency positioning within the Fund.
We wish to remind you that the Fund is subject to interest rate risk, meaning when interest rates rise, the value of fixed-income securities tend to fall. The risk may be greater in the current market environment. The degree to which the value of fixed-income securities may decline due to rising interest rates may vary depending on the speed and magnitude of the increase in interest rates, as well as individual security characteristics such as price, maturity, duration and coupon, and market forces such as supply and demand for similar securities. We are monitoring interest rates, and the market, economic and geopolitical factors that may impact the direction, speed and magnitude of changes to interest rates across the maturity spectrum, including the potential impact of monetary policy changes by the Fed and certain foreign central banks. If interest rates rise or fall faster than expected, markets may experience increased volatility, which may affect the value and/or liquidity of certain investments held by the Fund.
Thank you for investing in Invesco International Bond Fund.
1 Source: Bloomberg LP
Portfolio manager(s):
Hemant Baijal
Chris Kelly
Wim Vandenhoeck
The views and opinions expressed in management’s discussion of Fund performance are those of Invesco Advisers, Inc. and its affiliates. These views and opinions are subject to change at any time based on factors such as market and economic conditions. These views and opinions may not be relied upon as investment advice or recommendations, or as an offer for a particular security. The information is not a complete analysis of every aspect of any market, country, industry, security or the Fund. Statements of fact are from sources considered reliable, but Invesco Advisers, Inc. makes no representation or warranty as to their completeness or accuracy. Although historical performance is no guarantee of future results, these insights may help you understand our investment management philosophy.
See important Fund and, if applicable, index disclosures later in this report.
| | |
| 3 | | Invesco International Bond Fund |
Your Fund’s Long-Term Performance
Results of a $10,000 Investment – Oldest Share Class(es)
Fund and index data from 10/31/12

1 Source: RIMES Technologies Corp.
2 Source: Invesco, RIMES Technologies Corp.
Past performance cannot guarantee future results.
The data shown in the chart include reinvested distributions, applicable sales charges and Fund expenses including management
fees. Index results include reinvested dividends, but they do not reflect sales charges. Performance of the peer group, if applicable, reflects fund expenses and management fees;
performance of a market index does not. Performance shown in the chart does not reflect deduction of taxes a shareholder would pay on Fund distributions or sale of Fund shares.
| | |
| 4 | | Invesco International Bond Fund |
| | | | |
| |
Average Annual Total Returns | |
As of 10/31/22, including maximum applicable sales charges | |
Class A Shares | | | | |
Inception (6/15/95) | | | 5.08 | % |
10 Years | | | -1.67 | |
5 Years | | | -4.93 | |
1 Year | | | -22.99 | |
| |
Class C Shares | | | | |
Inception (6/15/95) | | | 5.00 | % |
10 Years | | | -1.83 | |
5 Years | | | -4.86 | |
1 Year | | | -20.99 | |
| |
Class R Shares | | | | |
Inception (3/1/01) | | | 4.25 | % |
10 Years | | | -1.50 | |
5 Years | | | -4.36 | |
1 Year | | | -19.59 | |
| |
Class Y Shares | | | | |
Inception (9/27/04) | | | 3.15 | % |
10 Years | | | -1.01 | |
5 Years | | | -3.91 | |
1 Year | | | -19.49 | |
| |
Class R5 Shares | | | | |
10 Years | | | -1.13 | % |
5 Years | | | -3.89 | |
1 Year | | | -19.23 | |
| |
Class R6 Shares | | | | |
Inception (1/27/12) | | | -0.22 | % |
10 Years | | | -0.85 | |
5 Years | | | -3.78 | |
1 Year | | | -19.25 | |
Effective May 24, 2019, Class A, Class C, Class R, Class Y and Class I shares of the Oppenheimer International Bond Fund, (the predecessor fund), were reorganized into Class A, Class C, Class R, Class Y and Class R6 shares, respectively, of the Invesco Oppenheimer International Bond Fund. Note: The Fund was subsequently renamed the Invesco International Bond Fund (the Fund). Returns shown above, for periods ending on or prior to May 24, 2019, for Class A, Class C, Class R, Class Y and Class R6 shares are those for Class A, Class C, Class R, Class Y and Class I shares of the predecessor fund. Share class returns will differ from the predecessor fund because of different expenses.
Class R5 shares incepted on May 24, 2019. Performance shown on and prior to that date is that of the predecessor fund’s Class A shares and includes the 12b-1 fees applicable to Class A shares.
The performance data quoted represent past performance and cannot guarantee future results; current performance may be lower or higher. Please visit invesco.com/performance for the most recent month-end performance. Performance figures reflect reinvested distributions, changes in net asset value and the effect of the maximum sales charge unless otherwise stated. Performance figures do not reflect deduction
of taxes a shareholder would pay on Fund distributions or sale of Fund shares. Investment return and principal value will fluctuate so that you may have a gain or loss when you sell shares.
Class A share performance reflects the maximum 4.25% sales charge, and Class C share performance reflects the applicable contingent deferred sales charge (CDSC) for the period involved. The CDSC on Class C shares is 1% for the first year after purchase. Class R, Class Y, Class R5 and Class R6 shares do not have a front-end sales charge or a CDSC; therefore, performance is at net asset value.
The performance of the Fund’s share classes will differ primarily due to different sales charge structures and class expenses.
Fund performance reflects any applicable fee waivers and/or expense reimbursements. Had the adviser not waived fees and/or reimbursed expenses currently or in the past, returns would have been lower. See current prospectus for more information.
| | |
| 5 | | Invesco International Bond Fund |
Supplemental Information
Invesco International Bond Fund’s investment objective is to seek total return.
| ∎ | Unless otherwise stated, information presented in this report is as of October 31, 2022, and is based on total net assets. |
| ∎ | Unless otherwise noted, all data is provided by Invesco. |
| ∎ | To access your Fund’s reports/prospectus, visit invesco.com/fundreports. |
About indexes used in this report
| ∎ | The Custom Invesco International Bond Index is an index composed of 50% FTSE Non-U.S. Dollar World Government Bond Index, 30% JPMorgan Government Bond Index-Emerging Markets (GBI-EM) Global Diversified Index and 20% JP Morgan EMBI Global Diversified Index. |
| ∎ | The FTSE Non-U.S. Dollar World Government Bond Index is a broad benchmark providing exposure to the global sovereign fixed income market, excluding the US. |
| ∎ | The JP Morgan Government Bond Index–Emerging Markets (GBI-EM) Global Diversified Index is a comprehensive global local emerging markets index comprising liquid, fixed-rate, domestic currency government bonds. |
| ∎ | The JP Morgan EMBI Global Diversified Index is an unmanaged index that tracks the traded market for US-dollar-denominated Brady bonds, Eurobonds, traded loans and local market debt instruments issued by sovereign and quasi-sovereign entities. |
| ∎ | The Fund is not managed to track the performance of any particular index, including the index(es) described here, and consequently, the performance of the Fund may deviate significantly from the performance of the index(es). |
| ∎ | A direct investment cannot be made in an index. Unless otherwise indicated, index results include reinvested dividends, and they do not reflect sales charges. Performance of the peer group, if applicable, reflects fund expenses; performance of a market index does not. |
|
|
This report must be accompanied or preceded by a currently effective Fund prospectus, which contains more complete information, including sales charges and expenses. Investors should read it carefully before investing. |
| |
| NOT FDIC INSURED | MAY LOSE VALUE | NO BANK GUARANTEE |
| | |
| 6 | | Invesco International Bond Fund |
Fund Information
Portfolio Composition
| | | | | | | |
| By security type | | % of total net assets |
| |
Non-U.S. Dollar Denominated Bonds & Notes | | | | 50.44 | % |
| |
U.S. Dollar Denominated Bonds & Notes | | | | 18.53 | |
| |
Asset-Backed Securities | | | | 8.63 | |
| |
Options Purchased | | | | 5.63 | |
| |
U.S. Treasury Securities | | | | 2.01 | |
| |
Common Stocks & Other Equity Interests | | | | 1.97 | |
| |
Security Types Each Less Than 1% of Portfolio | | | | 0.53 | |
| |
Money Market Funds Plus Other Assets Less Liabilities | | | | 12.26 | |
|
| Top Five Debt Issuers* | |
| | | | | % of total net assets |
| | |
| 1. | | Brazil Notas do Tesouro Nacional | | | | 11.68 | % |
| | |
| 2. | | Republic of South Africa Government Bond | | | | 7.00 | |
| | |
| 3. | | India Government Bond | | | | 4.47 | |
| | |
| 4. | | Colombian TES | | | | 3.89 | |
| | |
| 5. | | Mexican Bonos | | | | 3.83 | |
The Fund’s holdings are subject to change, and there is no assurance that the Fund will continue to hold any particular security.
| * | Excluding money market fund holdings, if any. |
Data presented here are as of October 31, 2022.
| | |
| 7 | | Invesco International Bond Fund |
Consolidated Schedule of Investments
October 31, 2022
| | | | | | | | | | |
| | | | | | Principal Amount | | | Value |
Non-U.S. Dollar Denominated Bonds & Notes–50.44%(a) |
Argentina–2.77% | | | |
Argentina Treasury Bond BONCER, | | | |
| | | |
1.40%, 03/25/2023 | | | ARS | | | | 500,000,000 | | | $ 10,112,982 |
| | | |
1.50%, 03/25/2024 | | | ARS | | | | 600,000,000 | | | 10,624,739 |
| | | |
2.00%, 11/09/2026 | | | ARS | | | | 1,075,000,000 | | | 14,153,695 |
| | | |
Argentine Bonos del Tesoro, 15.50%,
10/17/2026 | | | ARS | | | | 135,000,000 | | | 195,850 |
| | | |
Provincia de Buenos Aires Government Bonds, 72.74% (BADLAR + 3.75%),
04/12/2025(b)(c) | | | ARS | | | | 120,000,000 | | | 675,489 |
| | | |
| | | | | | | | | | | 35,762,755 |
| | | |
Austria–0.15% | | | | | | | | | | |
| | | |
Erste Group Bank AG,
4.25%(b)(d)(e) | | | EUR | | | | 2,600,000 | | | 1,920,412 |
| | | |
Belgium–1.28% | | | | | | | | | | |
KBC Group N.V., | | | | | | | | | | |
| | | |
4.25%(b)(d)(e) | | | EUR | | | | 7,000,000 | | | 5,789,484 |
| | | |
4.75%(b)(d)(e) | | | EUR | | | | 2,800,000 | | | 2,638,293 |
| | | |
Kingdom of Belgium Government Bond, Series 88, 1.70%, 06/22/2050(b) | | | EUR | | | | 11,137,000 | | | 8,096,753 |
| | | |
| | | | | | | | | | | 16,524,530 |
| | | |
Brazil–11.86% | | | | | | | | | | |
Brazil Notas do Tesouro Nacional, | | | |
| | | |
10.00%, 01/01/2027 | | | BRL | | | | 700,000,000 | | | 128,683,886 |
| | | |
Series B, 6.00%, 05/15/2055 | | | BRL | | | | 28,000,000 | | | 22,089,347 |
| | | |
Swiss Insured Brazil Power Finance S.a r.l., 9.85%, 07/16/2032(b) | | | BRL | | | | 13,191,375 | | | 2,266,449 |
| | | |
| | | | | | | | | | | 153,039,682 |
| | | |
Chile–0.95% | | | | | | | | | | |
| | | |
Bonos de la Tesoreria de la Republica en pesos, 2.80%, 10/01/2033(b) | | | CLP | | | | 16,000,000,000 | | | 12,237,042 |
| | | |
China–1.53% | | | | | | | | | | |
| | | |
China Government Bond, 3.72%, 04/12/2051 | | | CNY | | | | 130,000,000 | | | 19,727,432 |
| | | |
Colombia–4.32% | | | | | | | | | | |
Colombian TES, | | | | | | | |
| | | |
Series B, 7.75%, 09/18/2030 | | | COP | | | | 175,000,000,000 | | | 25,430,071 |
| | | |
Series B, 7.25%, 10/18/2034 | | | COP | | | | 47,750,000,000 | | | 6,055,170 |
| | | |
Series B, 9.25%, 05/28/2042 | | | COP | | | | 16,250,000,000 | | | 2,279,780 |
| | | |
Series B, 7.25%, 10/26/2050 | | | COP | | | | 151,500,000,000 | | | 16,461,748 |
| | | | | | | | | | |
| | | | | | Principal Amount | | | Value |
Colombia–(continued) |
| | | |
Fideicomiso PA Concesion Ruta al Mar, 6.75%, 02/15/2044(b) | | | COP | | | | 8,000,000,000 | | | $ 894,963 |
| | | |
Fideicomiso PA Costera, Series B, 6.25%, 01/15/2034(b) | | | COP | | | | 6,107,644,400 | | | 1,041,901 |
| | | |
PA Autopista Rio Magdalena, 6.05%, 06/15/2036(b) | | | COP | | | | 23,500,000,000 | | | 3,653,795 |
| | | |
| | | | | | | | | | | 55,817,428 |
| | | |
Egypt–0.40% | | | | | | | | | | |
| | | |
Egypt Government International Bond, 4.75%, 04/16/2026(b) | | | EUR | | | | 6,800,000 | | | 5,109,795 |
| | | |
France–0.33% | | | | | | | | | | |
| | | |
Accor S.A., 4.38%(b)(d)(e) | | | EUR | | | | 2,500,000 | | | 2,161,487 |
| | | |
Credit Agricole S.A., 7.50%(b)(d)(e) | | | GBP | | | | 1,968,000 | | | 2,122,898 |
| | | |
| | | | | | | | | | | 4,284,385 |
| | | |
Germany–0.66% | | | | | | | | | | |
| | | |
Bayer AG, 2.38%, 11/12/2079(b)(d) | | | EUR | | | | 5,000,000 | | | 4,461,424 |
| | | |
Deutsche Lufthansa AG, 4.38%,
08/12/2075(b)(d) | | | EUR | | | | 5,000,000 | | | 4,027,117 |
| | | |
| | | | | | | | | | | 8,488,541 |
| | | |
Greece–0.95% | | | | | | | | | | |
| | | |
Hellenic Republic Government Bond, | | | | | | | | | | |
| | | |
1.88%, 01/24/2052(b) | | | EUR | | | | 21,400,000 | | | 11,968,596 |
| | | |
Series GDP, 0.00%, 10/15/2042 | | | EUR | | | | 107,000,000 | | | 248,495 |
| | | |
| | | | | | | | | | | 12,217,091 |
| | | |
India–5.89% | | | | | | | | | | |
India Government Bond, | | | | | | | |
| | | |
8.40%, 07/28/2024 | | | INR | | | | 1,997,000,000 | | | 24,673,992 |
| | | |
8.15%, 11/24/2026 | | | INR | | | | 500,000,000 | | | 6,201,564 |
| | | |
6.54%, 01/17/2032 | | | INR | | | | 1,000,000,000 | | | 11,355,743 |
| | | |
7.26%, 08/22/2032 | | | INR | | | | 1,300,000,000 | | | 15,511,582 |
| | | |
State of Gujarat India, 7.52%, 05/24/2027 | | | INR | | | | 500,000,000 | | | 6,051,241 |
| | | |
State of Maharashtra India, 7.99%, 10/28/2025 | | | INR | | | | 500,000,000 | | | 6,092,052 |
| | | |
State of Tamil Nadu India, 8.53%, 03/09/2026 | | | INR | | | | 500,000,000 | | | 6,203,024 |
| | | |
| | | | | | | | | | | 76,089,198 |
| | | |
Italy–0.18% | | | | | | | | | | |
| | | |
Intesa Sanpaolo S.p.A., 7.75%(b)(d)(e) | | | EUR | | | | 2,500,000 | | | 2,345,168 |
See accompanying Notes to Consolidated Financial Statements which are an integral part of the financial statements.
| | |
| 8 | | Invesco International Bond Fund |
| | | | | | | | | | |
| | | | | | Principal Amount | | | Value |
Ivory Coast–0.21% | | | | | | | | | | |
| | | |
Ivory Coast Government International Bond, 4.88%, 01/30/2032(b) | | | EUR | | | | 3,950,000 | | | $ 2,752,848 |
| | | |
Malaysia–0.55% | | | | | | | | | | |
| | | |
Malaysia Government Bond, Series 317, 4.76%, 04/07/2037 | | | MYR | | | | 33,000,000 | | | 7,061,005 |
| | | |
Mexico–3.83% | | | | | | | | | | |
Mexican Bonos, | | | | | | | | | | |
| | | |
Series M, 7.75%, 05/29/2031 | | | MXN | | | | 951,000,000 | | | 42,297,896 |
| | | |
Series M 30, 8.50%, 11/18/2038 | | | MXN | | | | 160,000,000 | | | 7,122,141 |
| | | |
| | | | | | | | | | | 49,420,037 |
| | | |
Netherlands–0.81% | | | | | | | | | | |
| | | |
ABN AMRO Bank N.V., 4.38%(b)(d)(e) | | | EUR | | | | 2,500,000 | | | 2,205,885 |
| | | |
Cooperatieve Rabobank U.A., 4.38%(b)(d)(e) | | | EUR | | | | 9,600,000 | | | 8,289,296 |
| | | |
| | | | | | | | | | | 10,495,181 |
| | | |
New Zealand–0.85% | | | | | | | | | | |
| | | |
New Zealand Government Bond, Series 551, 2.75%, 05/15/2051 | | | NZD | | | | 26,000,000 | | | 11,038,354 |
| | | |
Poland–1.88% | | | | | | | | | | |
| | | |
Republic of Poland Government Bond, Series 432, 1.75%, 04/25/2032 | | | PLN | | | | 200,000,000 | | | 24,270,543 |
| | | |
Romania–0.19% | | | | | | | | | | |
| | | |
Romanian Government International Bond, 2.00%, 04/14/2033(b) | | | EUR | | | | 4,106,000 | | | 2,490,122 |
| | | |
Russia–0.00% | | | | | | | | | | |
| | | |
Mos.ru, 5.00%, 08/22/2034 | | | RUB | | | | 103,214,252 | | | 0 |
| | | |
South Africa–7.00% | | | | | | | | | | |
Republic of South Africa Government Bond, | | | | | | | | | | |
| | | |
Series 2030, 8.00%, 01/31/2030 | | | ZAR | | | | 792,700,000 | | | 37,059,197 |
| | | |
Series 2032, 8.25%, 03/31/2032 | | | ZAR | | | | 533,300,000 | | | 23,927,551 |
| | | |
Series 2037, 8.50%, 01/31/2037 | | | ZAR | | | | 700,000,000 | | | 29,345,219 |
| | | |
| | | | | | | | | | | 90,331,967 |
| | | |
Spain–1.35% | | | | | | | | | | |
| | | |
Banco Bilbao Vizcaya Argentaria S.A.,
6.00%(b)(d)(e) | | | EUR | | | | 2,400,000 | | | 2,260,286 |
Banco Santander S.A., | | | | | | | | | | |
| | | |
4.38%(b)(d)(e) | | | EUR | | | | 4,400,000 | | | 3,524,231 |
| | | |
4.13%(d)(e) | | | EUR | | | | 2,000,000 | | | 1,447,161 |
| | | | | | | | | | |
| | | | | | Principal Amount | | | Value |
Spain–(continued) | | | | | | | | | | |
CaixaBank S.A., | | | | | | | | | | |
| | | |
5.25%(b)(d)(e) | | | EUR | | | | 2,000,000 | | | $ 1,663,936 |
| | | |
5.88%(b)(d)(e) | | | EUR | | | | 2,400,000 | | | 2,117,234 |
| | | |
Repsol International Finance
B.V., 3.75%(b)(d)(e) | | | EUR | | | | 2,500,000 | | | 2,280,367 |
| | | |
Telefonica Europe B.V.,
2.88%(b)(d)(e) | | | EUR | | | | 5,000,000 | | | 4,093,281 |
| | | |
| | | | | | | | | | | 17,386,496 |
| | | |
Supranational–0.71% | | | | | | | | | | |
African Development Bank, | | | | | | | | | | |
| | | |
0.00%, 04/05/2046(f) | | | ZAR | | | | 600,000,000 | | | 3,900,161 |
| | | |
0.00%, 01/17/2050(f) | | | ZAR | | | | 310,000,000 | | | 1,543,687 |
| | | |
International Finance Corp., 0.00%, 03/23/2038(f) | | | MXN | | | | 350,000,000 | | | 3,767,981 |
| | | |
| | | | | | | | | | | 9,211,829 |
| | | |
Sweden–0.11% | | | | | | | | | | |
| | | |
Heimstaden Bostad AB,
3.38%(b)(d)(e) | | | EUR | | | | 2,500,000 | | | 1,409,244 |
|
Switzerland–0.16% |
| | | |
Dufry One B.V., 2.00%, 02/15/2027(b) | | | EUR | | | | 2,500,000 | | | 2,019,765 |
|
United Kingdom–1.52% |
Barclays PLC, | | | | | | | | | | |
| | | |
6.38%(b)(d)(e) | | | GBP | | | | 2,025,000 | | | 2,061,014 |
| | | |
7.13%(d)(e) | | | GBP | | | | 2,150,000 | | | 2,270,465 |
| | | |
Gatwick Airport Finance PLC, 4.38%, 04/07/2026(b) | | | GBP | | | | 5,400,000 | | | 5,168,752 |
| | | |
HSBC Holdings PLC,
5.88%(d)(e) | | | GBP | | | | 2,500,000 | | | 2,353,909 |
International Consolidated Airlines Group S.A., | | | | | | | |
| | | |
2.75%, 03/25/2025(b) | | | EUR | | | | 2,400,000 | | | 2,110,886 |
| | | |
1.50%, 07/04/2027(b) | | | EUR | | | | 2,600,000 | | | 1,891,757 |
| | | |
Nationwide Building Society, 5.75%(b)(d)(e) | | | GBP | | | | 2,500,000 | | | 2,404,695 |
| | | |
NatWest Group PLC,
5.13%(d)(e) | | | GBP | | | | 1,550,000 | | | 1,399,590 |
| | | |
| | | | | | | | | | | 19,661,068 |
| |
Total Non-U.S. Dollar Denominated Bonds & Notes
(Cost $824,322,405) | | | 651,111,918 |
|
U.S. Dollar Denominated Bonds & Notes–18.53% |
Bahamas–0.14% | | | | | | | | | | |
| | | |
Bahamas Government International Bond, 9.00%, 06/16/2029(b) | | | $ | | | | 2,500,000 | | | 1,813,242 |
| | | |
Brazil–0.41% | | | | | | | | | | |
| | | |
CSN Inova Ventures, 6.75%, 01/28/2028(b) | | | | | | | 2,500,000 | | | 2,147,035 |
See accompanying Notes to Consolidated Financial Statements which are an integral part of the financial statements.
| | |
| 9 | | Invesco International Bond Fund |
| | | | | | | | | | |
| | | | | | Principal Amount | | | Value |
Brazil–(continued) | | | | | | | | | | |
Klabin Austria GmbH, | | | | | | | | | | |
| | | |
5.75%, 04/03/2029(b) | | | | | | $ | 1,000,000 | | | $ 938,090 |
| | | |
7.00%, 04/03/2049(b)(g) | | | | | | | 2,500,000 | | | 2,225,487 |
| | | |
| | | | | | | | | | | 5,310,612 |
| | | |
Chile–0.80% | | | | | | | | | | |
| | | |
AES Andes S.A., 6.35%, 10/07/2079(b)(d) | | | | | | | 2,500,000 | | | 2,034,595 |
| | | |
Mercury Chile Holdco LLC, 6.50%, 01/24/2027(b) | | | | | | | 10,000,000 | | | 8,265,500 |
| | | |
| | | | | | | | | | | 10,300,095 |
| | | |
Colombia–1.13% | | | | | | | | | | |
| | | |
Bancolombia S.A., 7.14%, 10/18/2027(d) | | | | | | | 10,000,000 | | | 8,681,300 |
| | | |
Colombia Government International Bond, 4.13%, 02/22/2042 | | | | | | | 5,000,000 | | | 2,822,734 |
| | | |
Ecopetrol S.A., 4.63%, 11/02/2031 | | | | | | | 4,546,000 | | | 3,142,434 |
| | | |
| | | | | | | | | | | 14,646,468 |
| | | |
Denmark–0.18% | | | | | | | | | | |
| | | |
Danske Bank A/S,
7.00%(b)(d)(e) | | | | | | | 2,500,000 | | | 2,315,913 |
| |
Dominican Republic–0.28% | | | |
| | | |
Dominican Republic International Bond, | | | | | | | | | | |
| | | |
4.50%, 01/30/2030(b) | | | | | | | 975,000 | | | 785,076 |
| | | |
4.88%, 09/23/2032(b) | | | | | | | 1,800,000 | | | 1,393,660 |
| | | |
5.30%, 01/21/2041(b) | | | | | | | 2,110,000 | | | 1,461,230 |
| | | |
| | | | | | | | | | | 3,639,966 |
| | | |
Ecuador–0.10% | | | | | | | | | | |
| | | |
Ecuador Government International Bond, 5.50%, 07/31/2030(b)(h) | | | | | | | 2,500,000 | | | 1,339,893 |
| | | |
Egypt–0.38% | | | | | | | | | | |
Egypt Government International Bond, | | | | | | | | | | |
| | | |
7.63%, 05/29/2032(b) | | | | | | | 2,000,000 | | | 1,289,052 |
| | | |
8.50%, 01/31/2047(b) | | | | | | | 3,550,000 | | | 2,105,519 |
| | | |
8.88%, 05/29/2050(b) | | | | | | | 2,500,000 | | | 1,493,395 |
| | | |
| | | | | | | | | | | 4,887,966 |
| | | |
France–1.56% | | | | | | | | | | |
| | | |
BNP Paribas S.A.,
7.75%(b)(d)(e) | | | | | | | 5,000,000 | | | 4,726,676 |
Credit Agricole S.A., | | | | | | | | | | |
| | | |
8.13%(b)(d)(e) | | | | | | | 2,500,000 | | | 2,495,745 |
| | | |
6.88%(b)(d)(e) | | | | | | | 2,500,000 | | | 2,338,700 |
| | | |
Electricite de France S.A., 5.25%(b)(d)(e) | | | | | | | 2,600,000 | | | 2,447,964 |
| | | | | | | | | | |
| | | | | | Principal Amount | | | Value |
France–(continued) | | | | | | | | | | |
Societe Generale S.A., | | | | | | | | | | |
| | | |
7.38%(b)(d)(e) | | | | | | $ | 2,500,000 | | | $ 2,291,278 |
| | | |
4.75%(b)(d)(e) | | | | | | | 7,500,000 | | | 5,791,875 |
| | | |
| | | | | | | | | | | 20,092,238 |
| | | |
Guatemala–0.27% | | | | | | | | | | |
| | | |
CT Trust, 5.13%, 02/03/2032(b) | | | | | | | 2,817,000 | | | 2,256,905 |
| | | |
Guatemala Government Bond, 3.70%, 10/07/2033(b)(g) | | | | | | | 1,600,000 | | | 1,217,935 |
| | | |
| | | | | | | | | | | 3,474,840 |
| | | |
Hong Kong–0.25% | | | | | | | | | | |
| | | |
Melco Resorts Finance Ltd., | | | | | | | | | | |
| | | |
4.88%, 06/06/2025(b) | | | | | | | 2,500,000 | | | 1,786,179 |
| | | |
5.75%, 07/21/2028(b) | | | | | | | 2,500,000 | | | 1,450,000 |
| | | |
| | | | | | | | | | | 3,236,179 |
| | | |
India–1.27% | | | | | | | | | | |
| | | |
Adani Electricity Mumbai Ltd., 3.87%, 07/22/2031(b) | | | | | | | 2,500,000 | | | 1,528,617 |
| | | |
JSW Steel Ltd., 3.95%, 04/05/2027(b) | | | | | | | 6,000,000 | | | 4,368,159 |
Network i2i Ltd., | | | | | | | | | | |
| | | |
5.65%(b)(d)(e) | | | | | | | 1,500,000 | | | 1,323,525 |
| | | |
3.98%(b)(d)(e) | | | | | | | 1,500,000 | | | 1,191,608 |
| | | |
Oil & Natural Gas Corp. Ltd., 3.38%, 12/05/2029(b) | | | | | | | 5,000,000 | | | 4,127,570 |
| | | |
Reliance Industries Ltd., 4.88%, 02/10/2045(b) | | | | | | | 5,000,000 | | | 3,882,505 |
| | | |
| | | | | | | | | | | 16,421,984 |
| | | |
Indonesia–1.09% | | | | | | | | | | |
Indonesia Government International Bond, | | | | | | | | | | |
| | | |
4.65%, 09/20/2032 | | | | | | | 3,750,000 | | | 3,478,653 |
| | | |
5.45%, 09/20/2052 | | | | | | | 1,600,000 | | | 1,447,440 |
| | | |
PT Indofood CBP Sukses Makmur Tbk, 4.75%, 06/09/2051(b) | | | | | | | 7,000,000 | | | 4,319,983 |
| | | |
PT Pertamina (Persero), 4.18%, 01/21/2050(b) | | | | | | | 2,500,000 | | | 1,674,997 |
| | | |
PT Perusahaan Perseroan (Persero) Perusahaan Listrik Negara, 4.38%, 02/05/2050(b) | | | | | | | 5,000,000 | | | 3,094,570 |
| | | |
| | | | | | | | | | | 14,015,643 |
| | | |
Iraq–0.11% | | | | | | | | | | |
| | | |
Iraq International Bond, 5.80%, 01/15/2028(b) | | | | | | | 1,718,750 | | | 1,467,024 |
| | | |
Ireland–0.76% | | | | | | | | | | |
| | | |
BB Blue Financing DAC, Series A1, 4.40%, 09/20/2037(b) | | | | | | | 2,500,000 | | | 2,391,335 |
See accompanying Notes to Consolidated Financial Statements which are an integral part of the financial statements.
| | |
| 10 | | Invesco International Bond Fund |
| | | | | | | | | | |
| | | | | | Principal Amount | | | Value |
Ireland–(continued) | | | | | | | | | | |
Coriolanus DAC, | | | | | | | | | | |
| | | |
Series 116, 0.00%, 04/30/2025(b)(f) | | | | | | $ | 866,628 | | | $ 810,176 |
| | | |
Series 119, 0.00%, 04/30/2025(b)(f) | | | | | | | 921,986 | | | 861,929 |
| | | |
Series 120, 0.00%, 04/30/2025(b)(f) | | | | | | | 1,154,095 | | | 1,078,918 |
| | | |
Series 122, 0.00%, 04/30/2025(b)(f) | | | | | | | 1,011,168 | | | 945,301 |
| | | |
Series 124, 0.00%, 04/30/2025(b)(f) | | | | | | | 812,139 | | | 759,237 |
| | | |
Series 126, 0.00%, 04/30/2025(b)(f) | | | | | | | 1,090,261 | | | 1,019,242 |
| | | |
Series 127, 0.00%, 04/30/2025(b)(f) | | | | | | | 1,052,367 | | | 983,817 |
| | | |
0.00%, 04/30/2025(b)(f) | | | | | | | 991,129 | | | 926,568 |
| | | |
| | | | | | | | | | | 9,776,523 |
| | | |
Ivory Coast–0.21% | | | | | | | | | | |
| | | |
Ivory Coast Government International Bond, 5.38%, 07/23/2024(b) | | | | | | | 3,009,000 | | | 2,763,014 |
| | | |
Kazakhstan–0.23% | | | | | | | | | | |
| | | |
Development Bank of Kazakhstan JSC, 5.75%, 05/12/2025(b) | | | | | | | 2,975,000 | | | 2,954,056 |
| | | |
Macau–0.15% | | | | | | | | | | |
| | | |
MGM China Holdings Ltd., 5.88%, 05/15/2026(b)(g) | | | | | | | 2,500,000 | | | 1,923,713 |
| | | |
Mexico–2.49% | | | | | | | | | | |
| | | |
Alpek S.A.B. de C.V., 3.25%, 02/25/2031(b) | | | | | | | 2,443,000 | | | 1,873,649 |
| | | |
America Movil S.A.B. de C.V., 5.38%, 04/04/2032(b) | | | | | | | 6,786,000 | | | 5,759,312 |
Banco Mercantil del Norte S.A., | | | | | | | | | | |
| | | |
8.38%(b)(d)(e) | | | | | | | 2,500,000 | | | 2,177,663 |
| | | |
5.88%(b)(d)(e) | | | | | | | 2,490,000 | | | 1,904,389 |
Braskem Idesa S.A.P.I., | | | | | | | | | | |
| | | |
7.45%, 11/15/2029(b) | | | | | | | 5,000,000 | | | 3,837,375 |
| | | |
6.99%, 02/20/2032(b) | | | | | | | 2,076,000 | | | 1,393,608 |
| | | |
Cemex S.A.B. de C.V., 5.13%(b)(d)(e) | | | | | | | 3,457,000 | | | 2,862,206 |
| | | |
Nemak S.A.B. de C.V., 3.63%, 06/28/2031(b) | | | | | | | 4,254,000 | | | 3,101,017 |
Petroleos Mexicanos, | | | | | | | | | | |
| | | |
8.75%, 06/02/2029 | | | | | | | 5,000,000 | | | 4,461,596 |
| | | |
7.69%, 01/23/2050 | | | | | | | 2,500,000 | | | 1,633,139 |
| | | |
6.95%, 01/28/2060 | | | | | | | 5,250,000 | | | 3,159,464 |
| | | |
| | | | | | | | | | | 32,163,418 |
| | | |
Morocco–0.14% | | | | | | | | | | |
| | | |
OCP S.A., 3.75%, 06/23/2031(b) | | | | | | | 2,500,000 | | | 1,876,413 |
| | | | | | | | | | |
| | | | | | Principal Amount | | | Value |
Netherlands–0.15% | | | | | | | | | | |
| | | |
ING Groep N.V.,
6.75%(b)(d)(e) | | | | | | $ | 2,000,000 | | | $ 1,898,750 |
| | | |
Nigeria–0.29% | | | | | | | | | | |
Nigeria Government International Bond, | | | | | | | | | | |
| | | |
6.50%, 11/28/2027(b) | | | | | | | 2,500,000 | | | 1,781,250 |
| | | |
8.38%, 03/24/2029(b) | | | | | | | 2,632,000 | | | 1,911,858 |
| | | |
| | | | | | | | | | | 3,693,108 |
| | | |
Oman–0.33% | | | | | | | | | | |
| | | |
Oman Government International Bond, 6.75%, 01/17/2048(b) | | | | | | | 5,000,000 | | | 4,215,255 |
| | | |
Panama–0.16% | | | | | | | | | | |
| | | |
Cable Onda S.A., 4.50%, 01/30/2030(b) | | | | | | | 2,500,000 | | | 2,050,775 |
| | | |
South Africa–0.44% | | | | | | | | | | |
| | | |
Sasol Financing USA LLC, 4.38%, 09/18/2026 | | | | | | | 3,249,000 | | | 2,852,833 |
| | | |
Stillwater Mining Co., 4.00%, 11/16/2026(b) | | | | | | | 3,500,000 | | | 2,889,320 |
| | | |
| | | | | | | | | | | 5,742,153 |
| | | |
Sweden–0.36% | | | | | | | | | | |
| | | |
Swedbank AB, Series NC5, 5.63%(b)(d)(e) | | | | | | | 5,000,000 | | | 4,716,250 |
| | | |
Switzerland–1.78% | | | | | | | | | | |
Credit Suisse Group AG, | | | | | | | | | | |
| | | |
6.37%, 07/15/2026(b)(d) | | | | | | | 1,250,000 | | | 1,163,708 |
| | | |
6.54%, 08/12/2033(b)(d) | | | | | | | 2,500,000 | | | 2,179,304 |
| | | |
6.25%(b)(d)(e) | | | | | | | 9,800,000 | | | 8,273,728 |
UBS Group AG, | | | | | | | | | | |
| | | |
7.00%(b)(d)(e) | | | | | | | 3,900,000 | | | 3,787,500 |
| | | |
5.13%(b)(d)(e) | | | | | | | 8,639,000 | | | 7,515,930 |
| | | |
| | | | | | | | | | | 22,920,170 |
| | | |
Thailand–0.31% | | | | | | | | | | |
| | | |
GC Treasury Center Co. Ltd., 4.40%, 03/30/2032(b) | | | | | | | 2,500,000 | | | 2,026,375 |
| | | |
Muang Thai Life Assurance PCL, 3.55%, 01/27/2037(b)(d) | | | | | | | 2,450,000 | | | 1,995,302 |
| | | |
| | | | | | | | | | | 4,021,677 |
| | | |
United Kingdom–1.86% | | | | | | | | | | |
| | | |
abrdn PLC, 4.25%, 06/30/2028(b) | | | | | | | 2,500,000 | | | 2,124,475 |
| | | |
BP Capital Markets PLC, 4.88%(d)(e) | | | | | | | 3,500,000 | | | 2,964,937 |
| | | |
British Telecommunications PLC, 4.25%,
11/23/2081(b)(d) | | | | | | | 5,000,000 | | | 4,188,295 |
See accompanying Notes to Consolidated Financial Statements which are an integral part of the financial statements.
| | |
| 11 | | Invesco International Bond Fund |
| | | | | | | | |
| | | | | Principal Amount | | | Value |
United Kingdom–(continued) | | | |
| | | |
HSBC Holdings PLC, 2.01%, 09/22/2028(d) | | $ | | | 5,000,000 | | | $ 3,933,112 |
| | | |
M&G PLC, 6.50%, 10/20/2048(b)(d) | | | | | 2,500,000 | | | 2,290,625 |
| | | |
NatWest Group PLC,
6.00%(d)(e) | | | | | 5,000,000 | | | 4,462,000 |
| | | |
Vodafone Group PLC, 3.25%,
06/04/2081(d)(g) | | | | | 5,000,000 | | | 4,017,150 |
| | | |
| | | | | | | | | 23,980,594 |
|
United Republic of Tanzania–0.31% |
| | | |
HTA Group Ltd., 7.00%, 12/18/2025(b) | | | | | 4,500,000 | | | 3,971,250 |
| | | |
United States–0.59% | | | | | | | | |
| | | |
JBS USA LUX S.A./JBS USA Food Co./JBS USA Finance, Inc., 5.75%, 04/01/2033(b)(g) | | | | | 6,750,000 | | | 6,099,570 |
| | | |
United States International Development Finance Corp., Series 4, 3.13%, 04/15/2028 | | | | | 1,600,000 | | | 1,480,145 |
| | | |
| | | | | | | | | 7,579,715 |
| |
Total U.S. Dollar Denominated Bonds & Notes
(Cost $294,550,758) | | | 239,208,897 |
|
Asset-Backed Securities–8.63%(a) |
Alba PLC, | | | | | | | | |
| | | |
Series 2007-1, Class F, 5.47% (SONIA + 3.37%), 03/17/2039(b)(c) | | GBP | | | 2,443,042 | | | 2,522,453 |
| | | |
Series 2006-2, Class F, 5.43% (SONIA + 3.37%), 12/15/2038(b)(c) | | GBP | | | 1,281,936 | | | 1,358,540 |
Eurohome UK Mortgages PLC, | | | | | | | | |
| | | |
Series 2007-1, Class M2, 3.24% (3 mo. GBP LIBOR + 0.50%), 06/15/2044(b)(c) | | GBP | | | 4,000,000 | | | 3,793,925 |
| | | |
Series 2007-1, Class B1, 3.64% (3 mo. GBP LIBOR + 0.90%), 06/15/2044(b)(c) | | GBP | | | 5,275,000 | | | 4,662,550 |
| | | |
Series 2007-2, Class B1, 4.14% (SONIA + 1.52%), 09/15/2044(b)(c) | | GBP | | | 4,000,000 | | | 3,352,067 |
| | | |
Series 2007-1, Class M1, 3.04% (3 mo. GBP LIBOR + 0.30%), 06/15/2044(b)(c) | | GBP | | | 5,200,000 | | | 5,188,145 |
| | | |
Series 2007-2, Class B2, 6.74% (SONIA + 4.12%), 09/15/2044(b)(c) | | GBP | | | 3,750,000 | | | 3,733,606 |
| | | | | | | | | | |
| | | | | | Principal Amount | | | Value |
| | | |
Eurosail PLC, Series 2007-4X, Class D1A, 3.91% (SONIA + 1.87%), 06/13/2045(b)(c) | | | GBP | | | | 4,573,569 | | | $ 4,540,048 |
| | | |
Grifonas Finance No. 1 PLC, Class B, 1.50% (6 mo. EURIBOR + 0.52%), 08/28/2039(b)(c) | | | EUR | | | | 5,000,000 | | | 4,178,804 |
| | | |
Ludgate Funding PLC, Series 2007-1, Class RES, 1.00%, 01/01/2061(b)(i) | | | GBP | | | | 207,500,000 | | | 4,857,258 |
Mansard Mortgages PLC, | | | | | | | | | | |
| | | |
Series 2006-1X, Class B2, 5.81% (SONIA + 3.62%), 10/15/2048(b)(c) | | | GBP | | | | 4,054,981 | | | 4,363,070 |
| | | |
Series 2007-1X, Class B2, 5.31% (SONIA + 3.12%), 04/15/2049(b)(c) | | | GBP | | | | 2,591,536 | | | 2,576,186 |
Newgate Funding PLC, | | | | | | | | | | |
| | | |
Series 2006-2, Class CB, 1.59% (3 mo. EURIBOR + 0.43%), 12/01/2050(b)(c) | | | EUR | | | | 1,630,877 | | | 1,455,066 |
| | | |
Series 2007-2X, Class CB, 1.44% (3 mo. EURIBOR + 0.44%), 12/15/2050(b)(c) | | | EUR | | | | 2,249,497 | | | 1,926,684 |
| | | |
Series 2007-1X, Class CB, 1.00% (3 mo. EURIBOR + 0.38%), 12/01/2050(b)(c) | | | EUR | | | | 1,249,420 | | | 987,250 |
| | | |
ResLoC UK PLC, Series 2007-1X, Class D1A, 0.92% (3 mo. EURIBOR + 1.20%), 12/15/2043(b)(c) | | | EUR | | | | 4,487,096 | | | 3,834,928 |
| | | |
RMAC Securities No. 1 PLC, Series 2006-NS4X, Class B1C, 1.69% (3 mo. EURIBOR + 0.85%), 06/12/2044(b)(c) | | | EUR | | | | 8,515,735 | | | 7,338,139 |
Towd Point Mortgage Funding 2019 - Granite4 PLC, | | | | | | | | | | |
| | | |
Series 2019-GR4X, Class FR, 4.24% (SONIA +2.05%), 10/20/2051(b)(c) | | | GBP | | | | 3,000,000 | | | 3,294,416 |
| | | |
Series 2019-GR4X, Class GR, 4.69% (SONIA +2.50%), 10/20/2051(b)(c) | | | GBP | | | | 2,500,000 | | | 2,736,292 |
| | | |
Sestante Finance S.r.l., Series 2005, Class C1, 2.18% (3 mo. EURIBOR +0.80%), 07/15/2045(b)(c) | | | EUR | | | | 9,700,000 | | | 5,250,897 |
See accompanying Notes to Consolidated Financial Statements which are an integral part of the financial statements.
| | |
| 12 | | Invesco International Bond Fund |
| | | | | | | | | | |
| | | | | | Principal Amount | | | Value |
IM Pastor 4, FTA, | | | | | | | | | | |
| | | |
Series A, 1.24% (3 mo. EURIBOR + 0.14%), 03/22/2044(b)(c) | | | EUR | | | | 7,977,431 | | | $ 6,661,532 |
| | | |
Series B, 1.29% (3 mo. EURIBOR + 0.19%), 03/22/2044(b)(c) | | | EUR | | | | 3,800,000 | | | 2,126,324 |
| | | |
Titulizacion de Activos Sociedad Gestora de Fondos de Titulizacion S.A., Series 27, Class A3, 1.36% (3 mo. EURIBOR + 0.19%), 12/28/2050(b)(c) | | | EUR | | | | 28,935,526 | | | 22,651,544 |
| | | |
Lusitano Mortgages No. 5 PLC, Class D, 2.34% (3 mo. EURIBOR + 0.96%), 07/15/2059(b)(c) | | | EUR | | | | 6,334,827 | | | 5,228,065 |
| | | |
Invernea Proteina PYME, Serie II, 0.00%, 08/25/2032(j) | | | ARS | | | | 445,000,000 | | | 2,836,328 |
| |
Total Asset-Backed Securities
(Cost $139,965,932) | | | 111,454,117 |
|
U.S. Treasury Securities–2.01% |
U.S. Treasury Bills–1.52% |
| | | |
4.40%, 04/27/2023(k) | | | $ | | | | 19,576,724 | | | 19,568,317 |
|
U.S. Treasury Inflation – Indexed Bonds–0.49% |
| | | |
0.13%, 02/15/2052(l) | | | | | | | 8,059,471 | | | 6,356,583 |
| |
Total U.S. Treasury Securities
(Cost $27,636,195) | | | 25,924,900 |
| | | |
| | | | | | Shares | | | |
|
Common Stocks & Other Equity Interests–1.97% |
Argentina–1.97% | | | | | | | | | | |
| | | |
TMF Trust Co. S.A.(j) | | | | | | | 674,609,578 | | | 4,299,807 |
| | | |
YPF S.A., Class D(m) | | | | | | | 1,400,000 | | | 21,058,938 |
| |
Total Common Stocks & Other Equity Interests
(Cost $18,770,854) | | | 25,358,745 |
| | | | | | | | | | |
| | | | | | Shares | | | Value |
Preferred Stocks–0.53% |
United States–0.53% | | | | | | | | | | |
| | | |
AT&T, Inc., 2.88%, Series B,
Pfd.(d)
(Cost $8,958,627) | | | | | | | 7,700,000 | | | $ 6,817,607 |
|
Money Market Funds–5.16% |
| | | |
Invesco Government & Agency Portfolio, Institutional Class,
3.07%(n)(o) | | | | | | | 23,284,920 | | | 23,284,920 |
| | | |
Invesco Liquid Assets Portfolio, Institutional Class, 3.03%(n)(o) | | | | | | | 16,739,032 | | | 16,742,380 |
| | | |
Invesco Treasury Portfolio, Institutional Class,
3.08%(n)(o) | | | | | | | 26,611,337 | | | 26,611,337 |
| |
Total Money Market Funds
(Cost $66,638,291) | | | 66,638,637 |
|
Options Purchased–5.63% |
| | | |
(Cost $45,481,036)(p) | | | | | | | | | | 72,720,922 |
| | | |
TOTAL INVESTMENTS IN SECURITIES (excluding Investments purchased with cash collateral from securities on loan)–92.90%
(Cost $1,426,324,098) | | | | | | | | | | 1,199,235,743 |
|
Investments Purchased with Cash Collateral from Securities on Loan |
Money Market Funds–0.35% |
| | | |
Invesco Private Government Fund, 3.18%(n)(o)(q) | | | | | | | 1,248,525 | | | 1,248,525 |
| | | |
Invesco Private Prime Fund, 3.28%(n)(o)(q) | | | | | | | 3,209,614 | | | 3,209,614 |
| |
Total Investments Purchased with Cash Collateral from Securities on Loan
(Cost $4,458,070) | | | 4,458,139 |
| |
TOTAL INVESTMENTS IN SECURITIES–93.25%
(Cost $1,430,782,168) | | | 1,203,693,882 |
| |
OTHER ASSETS LESS LIABILITIES–6.75% | | | 87,135,665 |
| |
NET ASSETS–100.00% | | | $1,290,829,547 |
| | |
| Investment Abbreviations: |
| |
| ARS | | – Argentina Peso |
| BADLAR | | – Buenos Aires Deposits of Large Amounts Rate |
| BRL | | – Brazilian Real |
| CLP | | – Chile Peso |
| CNY | | – Chinese Yuan Renminbi |
| COP | | – Colombia Peso |
| EUR | | – Euro |
| EURIBOR | | – Euro Interbank Offered Rate |
| GBP | | – British Pound Sterling |
| INR | | – Indian Rupee |
| LIBOR | | – London Interbank Offered Rate |
| MXN | | – Mexican Peso |
| MYR | | – Malaysian Ringgit |
| NZD | | – New Zealand Dollar |
| Pfd. | | – Preferred |
| PLN | | – Polish Zloty |
| RUB | | – Russian Ruble |
| SONIA | | – Sterling Overnight Index Average |
| ZAR | | – South African Rand |
See accompanying Notes to Consolidated Financial Statements which are an integral part of the financial statements.
| | |
| 13 | | Invesco International Bond Fund |
Notes to Consolidated Schedule of Investments:
| (a) | Foreign denominated security. Principal amount is denominated in the currency indicated. |
| (b) | Security purchased or received in a transaction exempt from registration under the Securities Act of 1933, as amended (the “1933 Act”). The security may be resold pursuant to an exemption from registration under the 1933 Act, typically to qualified institutional buyers. The aggregate value of these securities at October 31, 2022 was $419,444,414, which represented 32.49% of the Fund’s Net Assets. |
| (c) | Interest or dividend rate is redetermined periodically. Rate shown is the rate in effect on October 31, 2022. |
| (d) | Security issued at a fixed rate for a specific period of time, after which it will convert to a variable rate. |
| (e) | Perpetual bond with no specified maturity date. |
| (f) | Zero coupon bond issued at a discount. |
| (g) | All or a portion of this security was out on loan at October 31, 2022. |
| (h) | Step coupon bond. The interest rate represents the coupon rate at which the bond will accrue at a specified future date. |
| (i) | Interest rate is redetermined periodically based on the cash flows generated by the pool of assets backing the security, less any applicable fees. The rate shown is the rate in effect on October 31, 2022. |
| (j) | Security valued using significant unobservable inputs (Level 3). See Note 3. |
| (k) | Security traded on a discount basis. The interest rate shown represents the discount rate at the time of purchase by the Fund. |
| (l) | Principal amount of security and interest payments are adjusted for inflation. See Note 1J. |
| (m) | Non-income producing security. |
| (n) | Affiliated issuer. The issuer and/or the Fund is a wholly-owned subsidiary of Invesco Ltd., or is affiliated by having an investment adviser that is under common control of Invesco Ltd. The table below shows the Fund’s transactions in, and earnings from, its investments in affiliates for the fiscal year ended October 31, 2022. |
| | | | | | | | | | | | | | | | | | | | | | | | | | | | |
| | | Value
October 31, 2021 | | | Purchases at Cost | | | Proceeds from Sales | | | Change in
Unrealized
Appreciation | | | Realized Gain (Loss) | | | Value
October 31, 2022 | | | Dividend Income | |
| Investments in Affiliated Money Market Funds: | | | | | | | | | | | | | | | | | | | | | | | | | | | | |
Invesco Government & Agency Portfolio, Institutional Class | | $ | - | | | $ | 525,559,806 | | | $ | (502,274,886 | ) | | | $ - | | | $ | - | | | $ | 23,284,920 | | | $ | 298,194 | |
Invesco Liquid Assets Portfolio, Institutional Class | | | 937,266 | | | | 375,399,862 | | | | (359,606,005 | ) | | | 627 | | | | 10,630 | | | | 16,742,380 | | | | 215,912 | |
Invesco Treasury Portfolio, Institutional Class | | | - | | | | 600,639,778 | | | | (574,028,441 | ) | | | - | | | | - | | | | 26,611,337 | | | | 318,439 | |
| Investments Purchased with Cash Collateral from Securities on Loan: | | | | | | | | | | | | | | | | | | | | | | | | | | | | |
Invesco Private Government Fund | | | 3,260,112 | | | | 48,651,530 | | | | (50,663,117 | ) | | | - | | | | - | | | | 1,248,525 | | | | 18,309* | |
Invesco Private Prime Fund | | | 7,606,928 | | | | 83,289,550 | | | | (87,682,840 | ) | | | 69 | | | | (4,093) | | | | 3,209,614 | | | | 50,590* | |
Total | | $ | 11,804,306 | | | $ | 1,633,540,526 | | | $ | (1,574,255,289 | ) | | | $696 | | | $ | 6,537 | | | $ | 71,096,776 | | | $ | 901,444 | |
| | * | Represents the income earned on the investment of cash collateral, which is included in securities lending income on the Consolidated Statement of Operations. Does not include rebates and fees paid to lending agent or premiums received from borrowers, if any. |
| (o) | The rate shown is the 7-day SEC standardized yield as of October 31, 2022. |
| (p) | The table below details options purchased. |
| (q) | The security has been segregated to satisfy the commitment to return the cash collateral received in securities lending transactions upon the borrower’s return of the securities loaned. See Note 1L. |
| | | | | | | | | | | | | | | | | | | | | | | | |
| Open Over-The-Counter Foreign Currency Options Purchased(a) | |
| Description | | Type of
Contract | | | Counterparty | | | Expiration
Date | | | Exercise Price | | | Notional Value | | | Value | |
| Currency Risk | | | | | | | | | | | | | | | | | | | | | | | | |
AUD versus USD | | | Call | | | | Bank of America, N.A. | | | | 12/05/2022 | | | USD | 0.80 | | | AUD | 7,500,000 | | | $ | 374 | |
AUD versus USD | | | Call | | | | Bank of America, N.A. | | | | 09/27/2023 | | | USD | 0.68 | | | AUD | 73,529,412 | | | | 865,268 | |
AUD versus USD | | | Call | | | | Goldman Sachs International | | | | 10/12/2023 | | | USD | 0.80 | | | AUD | 8,750,000 | | | | 191,953 | |
EUR versus HUF | | | Call | | | | Bank of America, N.A. | | | | 01/31/2023 | | | HUF | 480.00 | | | EUR | 40,000,000 | | | | 252,557 | |
EUR versus USD | | | Call | | | | Goldman Sachs International | | | | 11/28/2022 | | | USD | 1.03 | | | EUR | 80,000,000 | | | | 120,329 | |
NZD versus USD | | | Call | | | | Goldman Sachs International | | | | 10/12/2023 | | | USD | 0.70 | | | NZD | 14,285,714 | | | | 496,200 | |
Subtotal – Foreign Currency Call Options Purchased | | | | | | | | | | | | | | | | 1,926,681 | |
See accompanying Notes to Consolidated Financial Statements which are an integral part of the financial statements.
| | |
| 14 | | Invesco International Bond Fund |
| | | | | | | | | | | | | | | | | | | | | | | | |
| Open Over-The-Counter Foreign Currency Options Purchased(a)–(continued) | |
| Description | | Type of Contract | | | Counterparty | | | Expiration
Date | | | Exercise
Price | | | Notional Value | | | Value | |
| Currency Risk | | | | | | | | | | | | | | | | | | | | | | | | |
EUR versus CHF | | | Put | | | | Goldman Sachs International | | | | 12/16/2022 | | | CHF | 0.93 | | | EUR | 37,500,000 | | | $ | 26,016 | |
EUR versus CZK | | | Put | | | | J.P. Morgan Chase Bank, N.A. | | | | 07/17/2023 | | | CZK | 24.00 | | | EUR | 2,000,000 | | | | 202,704 | |
EUR versus CZK | | | Put | | | | J.P. Morgan Chase Bank, N.A. | | | | 02/05/2024 | | | CZK | 24.30 | | | EUR | 2,500,000 | | | | 404,098 | |
EUR versus CZK | | | Put | | |
| Morgan Stanley and Co.
International PLC |
| | | 12/07/2022 | | | CZK | 24.60 | | | EUR | 3,000,000 | | | | 1,775,891 | |
EUR versus HUF | | | Put | | | | Bank of America, N.A. | | | | 01/31/2023 | | | HUF | 400.00 | | | EUR | 40,000,000 | | | | 345,373 | |
EUR versus NOK | | | Put | | | | J.P. Morgan Chase Bank, N.A. | | | | 02/17/2023 | | | NOK | 9.70 | | | EUR | 4,000,000 | | | | 15,859 | |
EUR versus PLN | | | Put | | | | Bank of America, N.A. | | | | 03/24/2023 | | | PLN | 4.50 | | | EUR | 5,000,000 | | | | 307,662 | |
EUR versus PLN | | | Put | | | | Bank of America, N.A. | | | | 03/24/2023 | | | PLN | 4.50 | | | EUR | 2,000,000 | | | | 123,065 | |
EUR versus SEK | | | Put | | |
| Morgan Stanley and Co.
International PLC |
| | | 02/17/2023 | | | SEK | 10.80 | | | EUR | 25,000,000 | | | | 306,802 | |
GBP versus USD | | | Put | | | | Goldman Sachs International | | | | 01/09/2023 | | | USD | 1.09 | | | GBP | 5,000,000 | | | | 947,428 | |
USD versus BRL | | | Put | | | | Goldman Sachs International | | | | 02/01/2023 | | | BRL | 5.00 | | | USD | 5,000,000 | | | | 1,612,380 | |
USD versus BRL | | | Put | | | | J.P. Morgan Chase Bank, N.A. | | | | 12/16/2022 | | | BRL | 5.05 | | | USD | 50,000,000 | | | | 808,850 | |
USD versus CAD | | | Put | | | | Goldman Sachs International | | | | 03/10/2023 | | | CAD | 1.26 | | | USD | 100,000,000 | | | | 111,900 | |
USD versus CLP | | | Put | | | | Bank of America, N.A. | | | | 12/20/2022 | | | CLP | 850.00 | | | USD | 60,000,000 | | | | 61,020 | |
USD versus JPY | | | Put | | | | Goldman Sachs International | | | | 11/04/2022 | | | JPY | 128.00 | | | USD | 4,000,000 | | | | 4 | |
USD versus JPY | | | Put | | | | J.P. Morgan Chase Bank, N.A. | | | | 03/14/2023 | | | JPY | 120.00 | | | USD | 6,000,000 | | | | 129,102 | |
USD versus MXN | | | Put | | | | Bank of America, N.A. | | | | 04/26/2023 | | | MXN | 19.00 | | | USD | 2,500,000 | | | | 400,880 | |
USD versus MXN | | | Put | | | | J.P. Morgan Chase Bank, N.A. | | | | 01/24/2023 | | | MXN | 20.00 | | | USD | 5,000,000 | | | | 1,065,960 | |
USD versus PLN | | | Put | | | | Goldman Sachs International | | | | 06/27/2023 | | | PLN | 4.40 | | | USD | 5,000,000 | | | | 872,035 | |
USD versus SEK | | | Put | | | | Goldman Sachs International | | | | 09/27/2023 | | | SEK | 10.25 | | | USD | 40,000,000 | | | | 1,204,440 | |
USD versus SGD | | | Put | | | | Goldman Sachs International | | | | 12/16/2022 | | | SGD | 1.38 | | | USD | 100,000,000 | | | | 170,900 | |
USD versus THB | | | Put | | | | J.P. Morgan Chase Bank, N.A. | | | | 12/13/2022 | | | THB | 35.85 | | | USD | 50,000,000 | | | | 50,100 | |
USD versus THB | | | Put | | | | Standard Chartered Bank PLC | | | | 04/26/2023 | | | THB | 33.75 | | | USD | 5,000,000 | | | | 306,880 | |
USD versus ZAR | | | Put | | | | Bank of America, N.A. | | | | 01/25/2023 | | | ZAR | 17.90 | | | USD | 50,000,000 | | | | 817,800 | |
USD versus ZAR | | | Put | | | | Goldman Sachs International | | | | 12/13/2022 | | | ZAR | 16.00 | | | USD | 5,000,000 | | | | 36,415 | |
USD versus ZAR | | | Put | | | | Goldman Sachs International | | | | 04/04/2023 | | | ZAR | 15.70 | | | USD | 3,500,000 | | | | 166,173 | |
USD versus ZAR | | | Put | | | | Goldman Sachs International | | | | 07/24/2023 | | | ZAR | 15.75 | | | USD | 3,000,000 | | | | 289,080 | |
USD versus ZAR | | | Put | | | | J.P. Morgan Chase Bank, N.A. | | | | 11/14/2022 | | | ZAR | 17.00 | | | USD | 50,000,000 | | | | 2,700 | |
Subtotal – Foreign Currency Put Options Purchased | | | | | | | | | | | | | | | | 12,561,517 | |
Total Foreign Currency Options Purchased | | | | | | | | | | | | | | | $ | 14,488,198 | |
| (a) | Over-The-Counter options purchased, options written and swap agreements are collateralized by cash held with Counterparties in the amount of $68,869,000. |
| | | | | | | | | | | | | | | | | | | | | | | | | | | | | | |
| Open Over-The-Counter Interest Rate Swaptions Purchased(a) | |
| Description | | Type of
Contract | | Counterparty | | Exercise
Rate | | Pay/
Receive Exercise
Rate | | | Floating Rate Index | | | Payment
Frequency | | | Expiration
Date | | | Notional Value | | | Value | |
| Interest Rate Risk | | | | | | | | | | | | | | | | | | | | | | | | | | |
10 Year Interest Rate Swap | | Put | | J.P. Morgan Chase Bank,
N.A. | | 0.55% | | | Pay | | | | TONAR | | | | Annually | | | | 05/26/2025 | | | JPY | 28,571,000,000 | | | $ | 7,730,212 | |
10 Year Interest Rate Swap | | Put | | Morgan Stanley and Co.
International PLC | | 2.84 | | | Pay | | | | SOFR | | | | Annually | | | | 12/07/2022 | | | USD | 290,000,000 | | | | 23,572,276 | |
10 Year Interest Rate Swap | | Put | | Morgan Stanley and Co.
International PLC | | 2.84 | | | Pay | | | | SOFR | | | | Annually | | | | 06/07/2023 | | | USD | 236,000,000 | | | | 19,634,582 | |
2 Year Interest Rate Swap | | Put | | Goldman Sachs
International | | 7.75 | | | Pay | | | | 6 Month WIBOR | | | | Semi-Annually | | | | 12/12/2022 | | | PLN | 250,000,000 | | | | 536,825 | |
30 Year Interest Rate Swap | | Put | | J.P. Morgan Chase Bank,
N.A. | | 1.93 | | | Pay | | | | 6 Month EURIBOR | | | | Semi-Annually | | | | 06/12/2023 | | | EUR | 20,000,000 | | | | 3,017,980 | |
50 Year Interest Rate Swap | | Put | | J.P. Morgan Chase Bank,
N.A. | | 1.37 | | | Pay | | | | 6 Month EURIBOR | | | | Semi-Annually | | | | 04/21/2023 | | | EUR | 10,000,000 | | | | 2,214,338 | |
Total Interest Rate Swaptions Purchased | | | | | | | | | | | | | | | | | | | | | | $ | 56,706,213 | |
See accompanying Notes to Consolidated Financial Statements which are an integral part of the financial statements.
| | |
| 15 | | Invesco International Bond Fund |
| (a) | Over-The-Counter options purchased, options written and swap agreements are collateralized by cash held with Counterparties in the amount of $68,869,000. |
| | | | | | | | | | | | | | | | | | | | | | | | | | | | | | | | | | | | |
| Open Over-The-Counter Credit Default Swaptions Purchased(a) | |
| Counterparty | | Type of
Contract | | | Exercise
Rate | | | Reference Entity | | | (Pay)/
Receive
Fixed Rate | | | Payment
Frequency | | | Expiration
Date | | | Implied
Credit
Spread(b) | | | Notional Value | | | Value | |
| Credit Risk | | | | | | | | | | | | | | | | | | | | | | | | | | | | | | | | | | | | |
J.P. Morgan Chase Bank, N.A. | | | Call | | | | 600.00% | | |
| Markit iTraxx Europe
Crossover Index,
Series 38, Version 1 |
| | | 5.00% | | | | Quarterly | | | | 11/16/2022 | | | | 5.558% | | | | EUR 80,000,000 | | | $ | 1,526,511 | |
| (a) | Over-The-Counter options purchased, options written and swap agreements are collateralized by cash held with Counterparties in the amount of $68,869,000. |
| (b) | Implied credit spreads represent the current level, as of October 31, 2022, at which protection could be bought or sold given the terms of the existing credit default swap agreement and serve as an indicator of the current status of the payment/performance risk of the credit default swap agreement. An implied credit spread that has widened or increased since entry into the initial agreement may indicate a deteriorating credit profile and increased risk of default for the reference entity. A declining or narrowing spread may indicate an improving credit profile or decreased risk of default for the reference entity. Alternatively, credit spreads may increase or decrease reflecting the general tolerance for risk in the credit markets generally. |
| | | | | | | | | | | | | | | | | | | | | | | | | | | | | | | | | | | | |
| Open Over-The-Counter Credit Default Swaptions Written(a) | |
|
| |
| Counterparty | | Type of Contract | | | Exercise
Rate | | | Reference Entity | | | (Pay)/
Receive
Fixed
Rate | | | Payment
Frequency | | | Expiration
Date | | | Implied
Credit
Spread(b) | | | Notional Value | | | Value | |
|
| |
| Credit Risk | | | | | | | | | | | | | | | | | | | | | | | | | | | | | | | | | | | | |
|
| |
J.P. Morgan Chase Bank, N.A. | | | Call | | | | 550.00 | % | |
| Markit iTraxx Europe Crossover
Index, Series 38, Version 1 |
| | | 5.00 | % | | | Quarterly | | | | 11/16/2022 | | | | 5.558 | % | | EUR | 120,000,000 | | | $ | (973,120 | ) |
|
| |
| (a) | Over-The-Counter options purchased, options written and swap agreements are collateralized by cash held with Counterparties in the amount of $68,869,000. |
| (b) | Implied credit spreads represent the current level, as of October 31, 2022, at which protection could be bought or sold given the terms of the existing credit default swap agreement and serve as an indicator of the current status of the payment/performance risk of the credit default swap agreement. An implied credit spread that has widened or increased since entry into the initial agreement may indicate a deteriorating credit profile and increased risk of default for the reference entity. A declining or narrowing spread may indicate an improving credit profile or decreased risk of default for the reference entity. Alternatively, credit spreads may increase or decrease reflecting the general tolerance for risk in the credit markets generally. |
| | | | | | | | | | | | | | | | | | | | | | |
| Open Over-The-Counter Foreign Currency Options Written(a) | |
| Description | | Type of Contract | | | Counterparty | | Expiration
Date | | | Exercise Price | | | Notional Value | | | Value | |
| Currency Risk | | | | | | | | | | | | | | | | | | | | | | |
|
| |
AUD versus USD | | | Call | | | Bank of America, N.A. | | | 09/27/2023 | | | USD | 0.75 | | | AUD | 66,666,667 | | | $ | (193,515 | ) |
EUR versus CHF | | | Call | | | Goldman Sachs International | | | 12/16/2022 | | | CHF | 0.99 | | | EUR | 37,500,000 | | | | (292,139 | ) |
|
| |
EUR versus HUF | | | Call | | | Bank of America, N.A. | | | 01/31/2023 | | | HUF | 460.00 | | | EUR | 40,000,000 | | | | (426,133 | ) |
|
| |
EUR versus SEK | | | Call | | | Morgan Stanley and Co. International PLC | | | 02/17/2023 | | | SEK | 11.35 | | | EUR | 25,000,000 | | | | (165,754 | ) |
|
| |
GBP versus USD | | | Call | | | Goldman Sachs International | | | 01/09/2023 | | | USD | 1.18 | | | GBP | 5,000,000 | | | | (2,168,409 | ) |
|
| |
USD versus BRL | | | Call | | | Goldman Sachs International | | | 02/01/2023 | | | BRL | 5.85 | | | USD | 5,000,000 | | | | (653,135 | ) |
|
| |
USD versus BRL | | | Call | | | J.P. Morgan Chase Bank, N.A. | | | 03/16/2023 | | | BRL | 6.05 | | | USD | 25,000,000 | | | | (320,175 | ) |
|
| |
USD versus HUF | | | Call | | | Goldman Sachs International | | | 12/02/2022 | | | HUF | 431.00 | | | USD | 45,000,000 | | | | (681,390 | ) |
|
| |
USD versus HUF | | | Call | | | J.P. Morgan Chase Bank, N.A. | | | 12/13/2022 | | | HUF | 433.60 | | | USD | 50,000,000 | | | | (900,200 | ) |
|
| |
USD versus MXN | | | Call | | | Goldman Sachs International | | | 09/01/2023 | | | MXN | 24.14 | | | USD | 90,000,000 | | | | (1,215,990 | ) |
|
| |
USD versus MXN | | | Call | | | Goldman Sachs International | | | 09/11/2023 | | | MXN | 23.54 | | | USD | 30,000,000 | | | | (517,410 | ) |
|
| |
USD versus SEK | | | Call | | | Goldman Sachs International | | | 09/27/2023 | | | SEK | 12.35 | | | USD | 40,000,000 | | | | (829,880 | ) |
|
| |
USD versus THB | | | Call | | | J.P. Morgan Chase Bank, N.A. | | | 12/13/2022 | | | THB | 37.60 | | | USD | 50,000,000 | | | | (935,100 | ) |
|
| |
Subtotal – Foreign Currency Call Options Written | | | | (9,299,230 | ) |
|
| |
| Currency Risk | | | | | | | | | | | | | | | | | | | | | | |
|
| |
AUD versus USD | | | Put | | | Bank of America, N.A. | | | 09/27/2023 | | | USD | 0.60 | | | AUD | 83,682,008 | | | | (889,461 | ) |
|
| |
EUR versus SEK | | | Put | | | Morgan Stanley and Co. International PLC | | | 02/17/2023 | | | SEK | 10.45 | | | EUR | 25,000,000 | | | | (78,344 | ) |
|
| |
USD versus THB | | | Put | | | J.P. Morgan Chase Bank, N.A. | | | 12/13/2022 | | | THB | 34.75 | | | USD | 50,000,000 | | | | (9,450 | ) |
|
| |
USD versus ZAR | | | Put | | | Bank of America, N.A. | | | 01/25/2023 | | | ZAR | 17.15 | | | USD | 50,000,000 | | | | (292,000 | ) |
|
| |
Subtotal – Foreign Currency Put Options Written | | | | | | | | (1,269,255 | ) |
|
| |
Total – Foreign Currency Options Written | | | | | | | $ | (10,568,485 | ) |
|
| |
See accompanying Notes to Consolidated Financial Statements which are an integral part of the financial statements.
| | |
| 16 | | Invesco International Bond Fund |
| (a) | Over-The-Counter options purchased, options written and swap agreements are collateralized by cash held with Counterparties in the amount of $68,869,000. |
| | | | | | | | | | | | | | | | | | | | | | | | | | | | | | | | | | |
Open Over-The-Counter Interest Rate Swaptions Written(a) | |
| Description | | Type of
Contract | | Counterparty | | | Exercise Rate | | | Floating Rate Index | | | Pay/
Receive
Exercise
Rate | | | Payment
Frequency | | | Expiration
Date | | | Notional Value | | | Value | |
|
| |
| Interest Rate Risk | | | | | | | | | | | | | | | | | | | | | | | | | | | | | | | | |
30 Year Interest Rate Swap | | Call | | | Bank of America, N.A. | | | | 3.15% | | | | SOFR | | | | Receive | | | | Annually | | | | 12/21/2022 | | | USD | 100,000,000 | | | $ | (1,162,083 | ) |
|
| |
10 Year Interest Rate Swap | | Call | | | Bank of America, N.A. | | | | 3.50 | | | | SOFR | | | | Receive | | | | Annually | | | | 01/26/2023 | | | USD | 150,000,000 | | | | (1,718,613 | ) |
|
| |
30 Year Interest Rate Swap | | Call | | | Barclays Bank PLC | | | | 2.50 | | | | SONIA | | | | Receive | | | | Annually | | | | 11/07/2022 | | | GBP | 25,000,000 | | | | (3,543 | ) |
|
| |
30 Year Interest Rate Swap | | Call | |
| Goldman Sachs
International |
| | | 1.90 | | |
| 6 Month
EURIBOR |
| | | Receive | | | | Semi-Annually | | | | 11/07/2022 | | | EUR | 50,000,000 | | | | (1,330 | ) |
|
| |
10 Year Interest Rate Swap | | Call | |
| Goldman Sachs
International |
| | | 2.75 | | | | SOFR | | | | Receive | | | | Annually | | | | 03/27/2024 | | | USD | 37,500,000 | | | | (680,875 | ) |
|
| |
5 Year Interest Rate Swap | | Call | |
| Goldman Sachs
International |
| | | 3.72 | | | | SOFR | | | | Receive | | | | Annually | | | | 12/28/2022 | | | USD | 150,000,000 | | | | (859,473 | ) |
|
| |
30 Year Interest Rate Swap | | Call | |
| J.P. Morgan Chase
Bank, N.A. |
| | | 1.95 | | |
| 6 Month
EURIBOR |
| | | Receive | | | | Semi-Annually | | | | 09/28/2023 | | | EUR | 50,000,000 | | | | (2,947,686 | ) |
|
| |
2 Year Interest Rate Swap | | Call | |
| J.P. Morgan Chase
Bank, N.A. |
| | | 2.75 | | | | SOFR | | | | Receive | | | | Annually | | | | 09/16/2024 | | | USD | 125,000,000 | | | | (881,120 | ) |
|
| |
10 Year Interest Rate Swap | | Call | |
| Morgan Stanley and
Co. International PLC |
| | | 2.84 | | | | SOFR | | | | Receive | | | | Annually | | | | 12/07/2022 | | | USD | 290,000,000 | | | | (123,795 | ) |
|
| |
10 Year Interest Rate Swap | | Call | |
| Morgan Stanley and
Co. International PLC |
| | | 2.84 | | | | SOFR | | | | Receive | | | | Annually | | | | 06/07/2023 | | | USD | 236,000,000 | | | | (2,081,688 | ) |
|
| |
30 Year Interest Rate Swap | | Call | |
| Morgan Stanley and
Co. International PLC |
| | | 3.00 | | | | SOFR | | | | Receive | | | | Annually | | | | 12/19/2022 | | | USD | 150,000,000 | | | | (1,024,203 | ) |
|
| |
Subtotal–Interest Rate Call Swaptions Written | | | | | | | | | | | | | | | | | | | | (11,484,409 | ) |
|
| |
| Interest Rate Risk | | | | | | | | | | | | | | | | | | | | | | | | | | | | | |
|
| |
5 Year Interest Rate Swap | | Put | | | Bank of America, N.A. | | | | 3.91 | | | | SOFR | | | | Pay | | | | Annually | | | | 12/05/2022 | | | USD | 175,000,000 | | | | (2,042,406 | ) |
|
| |
2 Year Interest Rate Swap | | Put | | | Bank of America, N.A. | | | | 3.75 | | |
| 3 Month
CDOR |
| | | Pay | | | | Quarterly | | | | 12/07/2022 | | | CAD | 250,000,000 | | | | (2,231,831 | ) |
|
| |
30 Year Interest Rate Swap | | Put | | | Bank of America, N.A. | | | | 3.20 | | | | SOFR | | | | Pay | | | | Annually | | | | 12/05/2022 | | | USD | 75,000,000 | | | | (4,185,602 | ) |
|
| |
30 Year Interest Rate Swap | | Put | | | Barclays Bank PLC | | | | 4.00 | | | | SONIA | | | | Pay | | | | Annually | | | | 12/06/2022 | | | GBP | 25,000,000 | | | | (369,383 | ) |
|
| |
2 Year Interest Rate Swap | | Put | |
| Goldman Sachs
International |
| | | 8.25 | | |
| 6 Month
WIBOR |
| | | Pay | | | | Semi-Annually | | | | 12/12/2022 | | | PLN | 250,000,000 | | | | (281,894 | ) |
|
| |
10 Year Interest Rate Swap | | Put | |
| Goldman Sachs
International |
| | | 3.25 | | |
| 6 Month
EURIBOR |
| | | Pay | | | | Semi-Annually | | | | 06/16/2023 | | | EUR | 151,200,000 | | | | (5,150,901 | ) |
|
| |
10 Year Interest Rate Swap | | Put | |
| Goldman Sachs
International |
| | | 3.67 | | | | SOFR | | | | Pay | | | | Annually | | | | 12/13/2022 | | | USD | 200,000,000 | | | | (4,786,332 | ) |
|
| |
30 Year Interest Rate Swap | | Put | |
| Goldman Sachs
International |
| | | 3.01 | | | | SOFR | | | | Pay | | | | Annually | | | | 11/07/2022 | | | USD | 100,000,000 | | | | (8,081,645 | ) |
|
| |
10 Year Interest Rate Swap | | Put | |
| Goldman Sachs
International |
| | | 2.75 | | |
| 6 Month
EURIBOR |
| | | Pay | | | | Semi-Annually | | | | 04/22/2024 | | | EUR | 150,000,000 | | | | (10,661,809 | ) |
|
| |
30 Year Interest Rate Swap | | Put | |
| J.P. Morgan Chase
Bank, N.A. |
| | | 2.95 | | |
| 6 Month
EURIBOR |
| | | Pay | | | | Semi-Annually | | | | 09/28/2023 | | | EUR | 50,000,000 | | | | (3,004,867 | ) |
|
| |
2 Year Interest Rate Swap | | Put | |
| J.P. Morgan Chase
Bank, N.A. |
| | | 3.88 | | | | SONIA | | | | Pay | | | | Annually | | | | 11/28/2022 | | | GBP | 125,000,000 | | | | (2,123,028 | ) |
|
| |
10 Year Interest Rate Swap | | Put | |
| J.P. Morgan Chase
Bank, N.A. |
| | | 2.39 | | |
| 6 Month
EURIBOR |
| | | Pay | | | | Semi-Annually | | | | 06/12/2023 | | | EUR | 54,000,000 | | | | (4,067,814 | ) |
|
| |
10 Year Interest Rate Swap | | Put | |
| J.P. Morgan Chase
Bank, N.A. |
| | | 1.05 | | | | TONAR | | | | Pay | | | | Annually | | | | 05/26/2025 | | | JPY | 28,571,000,000 | | | | (4,831,955 | ) |
|
| |
10 Year Interest Rate Swap | | Put | |
| J.P. Morgan Chase
Bank, N.A. |
| | | 2.16 | | |
| 6 Month
EURIBOR |
| | | Pay | | | | Semi-Annually | | | | 04/21/2023 | | | EUR | 40,000,000 | | | | (3,508,798 | ) |
|
| |
1 Year Interest Rate Swap | | Put | |
| J.P. Morgan Chase
Bank, N.A. |
| | | 2.82 | | | | SOFR | | | | Pay | | | | Annually | | | | 02/17/2023 | | | USD | 250,000,000 | | | | (4,945,225 | ) |
|
| |
See accompanying Notes to Consolidated Financial Statements which are an integral part of the financial statements.
| | |
| 17 | | Invesco International Bond Fund |
| | | | | | | | | | | | | | | | | | | | | | | | | | | | | | |
| Open Over-The-Counter Interest Rate Swaptions Written(a)–(continued) | |
|
| |
| Description | | Type of Contract | | Counterparty | | Exercise
Rate | | | Floating
Rate Index | | Pay/
Receive
Exercise
Rate | | | Payment
Frequency | | | Expiration
Date | | | Notional Value | | | Value | |
|
| |
2 Year Interest Rate Swap | | Put | | Morgan Stanley and Co.
International PLC | | | 4.02% | | | SONIA | | | Pay | | | | Annually | | | | 11/30/2022 | | | GBP | 125,000,000 | | | $ | (1,812,935 | ) |
|
| |
10 Year Interest Rate Swap | | Put | | Morgan Stanley and Co.
International PLC | | | 3.75 | | | SOFR | | | Pay | | | | Annually | | | | 04/22/2024 | | | USD | 250,000,000 | | | | (11,046,185 | ) |
|
| |
Subtotal–Interest Rate Put Swaptions Written | | | | | | | | | | | | | | | | | | | (73,132,610 | ) |
|
| |
Total Open Over-The-Counter Interest Rate Swaptions Written | | | | | | | | | | | | | | | | | | $ | (84,617,019 | ) |
|
| |
| (a) | Over-The-Counter options purchased, options written and swap agreements are collateralized by cash held with Counterparties in the amount of $68,869,000. |
| | | | | | | | | | | | | | | | | | | | |
| Open Futures Contracts(a) | |
| Short Futures Contracts | | Number of
Contracts | | | Expiration Month | | | Notional Value | | | Value | | | Unrealized
Appreciation | |
| Interest Rate Risk | | | | | | | | | | | | | | | | | | | | |
Euro-Bund | | | 100 | | | | December-2022 | | | $ | (13,681,329 | ) | | $ | 192,447 | | | $ | 192,447 | |
Euro-BTP | | | 1,366 | | | | December-2022 | | | | (143,175,602 | ) | | | 458,548 | | | | 458,548 | |
U.S. Treasury 2 Year Notes | | | 8 | | | | December-2022 | | | | (1,635,063 | ) | | | 21,375 | | | | 21,375 | |
U.S. Treasury 5 Year Notes | | | 42 | | | | December-2022 | | | | (4,476,938 | ) | | | 200,156 | | | | 200,156 | |
U.S. Treasury 10 Year Notes | | | 40 | | | | December-2022 | | | | (4,423,750 | ) | | | 275,328 | | | | 275,328 | |
U.S. Treasury 10 Year Ultra Notes | | | 152 | | | | December-2022 | | | | (17,629,625 | ) | | | 1,291,003 | | | | 1,291,003 | |
U.S. Treasury Ultra Bonds | | | 102 | | | | December-2022 | | | | (13,020,937 | ) | | | 2,229,688 | | | | 2,229,688 | |
Total Futures Contracts | | | | | | | | | | | | | | $ | 4,668,545 | | | $ | 4,668,545 | |
| (a) | Futures contracts collateralized by $3,898,686 cash held with Merrill Lynch International, the futures commission merchant. |
| | | | | | | | | | | | | | |
| Open Forward Foreign Currency Contracts | |
Settlement Date | | | |
Contract to | | | Unrealized
Appreciation
(Depreciation) | |
| | Counterparty | | Deliver | | | Receive | |
| Currency Risk | | | | | | | | | | | | | | |
11/03/2022 | | Bank of America, N.A. | | USD | 202,768,296 | | | BRL | 1,075,504,985 | | | $ | 5,440,975 | |
12/21/2022 | | Bank of America, N.A. | | COP | 311,000,000,000 | | | USD | 69,637,259 | | | | 7,201,008 | |
12/21/2022 | | Bank of America, N.A. | | EUR | 2,405,000 | | | USD | 2,395,354 | | | | 8,899 | |
12/21/2022 | | Bank of America, N.A. | | NZD | 21,700,000 | | | USD | 13,148,596 | | | | 522,755 | |
12/21/2022 | | Bank of America, N.A. | | USD | 13,067,449 | | | GBP | 11,500,000 | | | | 143,286 | |
02/27/2023 | | Bank of America, N.A. | | USD | 4,794,480 | | | RUB | 384,028,743 | | | | 700,660 | |
09/29/2023 | | Bank of America, N.A. | | AUD | 38,176,682 | | | USD | 25,000,000 | | | | 350,163 | |
11/03/2022 | | Citibank, N.A. | | USD | 231,601,085 | | | BRL | 1,227,634,585 | | | | 6,059,275 | |
12/02/2022 | | Citibank, N.A. | | USD | 58,774,881 | | | BRL | 313,954,841 | | | | 1,628,627 | |
12/21/2022 | | Citibank, N.A. | | CAD | 781,430 | | | USD | 594,557 | | | | 20,638 | |
12/21/2022 | | Citibank, N.A. | | CNY | 383,562,229 | | | USD | 55,118,227 | | | | 2,327,774 | |
12/21/2022 | | Citibank, N.A. | | COP | 20,100,000,000 | | | USD | 4,198,942 | | | | 163,673 | |
12/21/2022 | | Citibank, N.A. | | INR | 3,152,008,261 | | | USD | 38,290,699 | | | | 436,750 | |
12/21/2022 | | Citibank, N.A. | | THB | 185,000,000 | | | USD | 4,946,127 | | | | 64,000 | |
12/21/2022 | | Citibank, N.A. | | USD | 26,294,806 | | | SEK | 292,740,000 | | | | 328,734 | |
12/21/2022 | | Deutsche Bank AG | | GBP | 71,974,000 | | | USD | 83,175,177 | | | | 494,358 | |
12/21/2022 | | Deutsche Bank AG | | INR | 1,091,670,000 | | | USD | 13,628,839 | | | | 518,461 | |
12/21/2022 | | Deutsche Bank AG | | PLN | 131,710,000 | | | USD | 27,423,586 | | | | 66,276 | |
12/21/2022 | | Deutsche Bank AG | | ZAR | 2,019,931,780 | | | USD | 115,011,048 | | | | 5,460,675 | |
11/10/2022 | | Goldman Sachs International | | USD | 57,500,000 | | | MXN | 1,149,195,000 | | | | 428,975 | |
11/14/2022 | | Goldman Sachs International | | ZAR | 341,082,500 | | | USD | 19,865,026 | | | | 1,313,655 | |
11/21/2022 | | Goldman Sachs International | | CNY | 167,878,620 | | | USD | 23,400,000 | | | | 233,631 | |
12/06/2022 | | Goldman Sachs International | | HUF | 2,752,515,000 | | | USD | 6,750,000 | | | | 170,491 | |
12/15/2022 | | Goldman Sachs International | | ZAR | 212,163,250 | | | USD | 12,125,000 | | | | 613,242 | |
See accompanying Notes to Consolidated Financial Statements which are an integral part of the financial statements.
| | |
| 18 | | Invesco International Bond Fund |
| | | | | | | | | | | | | | | | | | | | | | |
| Open Forward Foreign Currency Contracts–(continued) | |
|
| |
| | | | | | | | | | | | | | | | | Unrealized | |
| Settlement | | | | Contract to | | | Appreciation | |
| Date | | Counterparty | | Deliver | | | Receive | | | (Depreciation) | |
|
| |
| 12/21/2022 | | Goldman Sachs International | | | INR | | | | 1,200,000,000 | | | | USD | | | | 14,928,158 | | | $ | 516,794 | |
|
| |
| 12/21/2022 | | Goldman Sachs International | | | USD | | | | 4,463,314 | | | | CLP | | | | 4,468,000,000 | | | | 233,557 | |
|
| |
| 12/21/2022 | | Goldman Sachs International | | | USD | | | | 20,343,438 | | | | COP | | | | 101,969,450,000 | | | | 127,913 | |
|
| |
| 12/21/2022 | | Goldman Sachs International | | | USD | | | | 36,850,000 | | | | MXN | | | | 763,395,803 | | | | 1,351,092 | |
|
| |
| 12/29/2022 | | Goldman Sachs International | | | CNY | | | | 125,077,050 | | | | USD | | | | 17,700,000 | | | | 490,128 | |
|
| |
| 01/11/2023 | | Goldman Sachs International | | | USD | | | | 53,707,200 | | | | GBP | | | | 48,000,000 | | | | 1,478,463 | |
|
| |
| 02/27/2023 | | Goldman Sachs International | | | USD | | | | 1,931,302 | | | | RUB | | | | 150,931,257 | | | | 228,402 | |
|
| |
| 03/13/2023 | | Goldman Sachs International | | | CAD | | | | 36,330,000 | | | | USD | | | | 28,000,000 | | | | 1,275,131 | |
|
| |
| 11/16/2022 | | J.P. Morgan Chase Bank, N.A. | | | ZAR | | | | 52,620,000 | | | | USD | | | | 3,000,000 | | | | 138,472 | |
|
| |
| 12/15/2022 | | J.P. Morgan Chase Bank, N.A. | | | HUF | | | | 4,037,000,000 | | | | USD | | | | 10,000,000 | | | | 373,900 | |
|
| |
| 12/15/2022 | | J.P. Morgan Chase Bank, N.A. | | | THB | | | | 836,625,000 | | | | USD | | | | 23,000,000 | | | | 935,900 | |
|
| |
| 12/21/2022 | | J.P. Morgan Chase Bank, N.A. | | | CLP | | | | 17,978,073,650 | | | | USD | | | | 19,942,400 | | | | 1,043,412 | |
|
| |
| 12/21/2022 | | J.P. Morgan Chase Bank, N.A. | | | INR | | | | 4,224,235,000 | | | | USD | | | | 52,541,543 | | | | 1,810,720 | |
|
| |
| 12/21/2022 | | J.P. Morgan Chase Bank, N.A. | | | JPY | | | | 21,539,346 | | | | USD | | | | 151,433 | | | | 5,672 | |
|
| |
| 12/21/2022 | | J.P. Morgan Chase Bank, N.A. | | | NOK | | | | 11,047 | | | | USD | | | | 1,105 | | | | 40 | |
|
| |
| 12/21/2022 | | J.P. Morgan Chase Bank, N.A. | | | USD | | | | 5,407,656 | | | | EUR | | | | 5,500,000 | | | | 49,934 | |
|
| |
| 12/21/2022 | | J.P. Morgan Chase Bank, N.A. | | | USD | | | | 20,100,000 | | | | PLN | | | | 100,733,776 | | | | 823,279 | |
|
| |
| 12/21/2022 | | J.P. Morgan Chase Bank, N.A. | | | USD | | | | 18,920,335 | | | | ZAR | | | | 349,700,000 | | | | 45,535 | |
|
| |
| 02/17/2023 | | J.P. Morgan Chase Bank, N.A. | | | USD | | | | 4,034,896 | | | | RUB | | | | 310,125,000 | | | | 442,373 | |
|
| |
| 02/22/2023 | | J.P. Morgan Chase Bank, N.A. | | | USD | | | | 4,232,793 | | | | RUB | | | | 331,851,000 | | | | 536,836 | |
|
| |
| 12/21/2022 | | Morgan Stanley and Co. International PLC | | | COP | | | | 36,020,165,000 | | | | USD | | | | 7,959,378 | | | | 727,982 | |
|
| |
| 12/21/2022 | | Morgan Stanley and Co. International PLC | | | EUR | | | | 260,030,671 | | | | USD | | | | 262,160,505 | | | | 4,134,898 | |
|
| |
| 12/21/2022 | | Morgan Stanley and Co. International PLC | | | USD | | | | 22,589,650 | | | | EUR | | | | 22,996,195 | | | | 229,224 | |
|
| |
| 12/21/2022 | | Morgan Stanley and Co. International PLC | | | USD | | | | 10,264,926 | | | | MXN | | | | 209,779,168 | | | | 232,634 | |
|
| |
| 12/21/2022 | | Royal Bank of Canada | | | GBP | | | | 1,585,000 | | | | USD | | | | 1,843,224 | | | | 22,440 | |
|
| |
| 12/21/2022 | | Royal Bank of Canada | | | USD | | | | 6,228,996 | | | | GBP | | | | 5,665,000 | | | | 278,727 | |
|
| |
Subtotal–Appreciation | | | | | | | | | | | | | | | | | | | 52,230,439 | |
|
| |
| | | | | |
Currency Risk | | | | | | | | | | | | | | | | | | | | |
|
| |
| 11/03/2022 | | Bank of America, N.A. | | | BRL | | | | 1,075,504,985 | | | | USD | | | | 199,429,324 | | | | (8,779,946 | ) |
|
| |
| 12/12/2022 | | Bank of America, N.A. | | | USD | | | | 64,700,000 | | | | CAD | | | | 84,401,797 | | | | (2,722,795 | ) |
|
| |
| 12/20/2022 | | Bank of America, N.A. | | | USD | | | | 17,542,000 | | | | EUR | | | | 17,500,000 | | | | (178,726 | ) |
|
| |
| 12/21/2022 | | Bank of America, N.A. | | | GBP | | | | 11,520,000 | | | | USD | | | | 13,090,175 | | | | (143,535 | ) |
|
| |
| 12/21/2022 | | Bank of America, N.A. | | | USD | | | | 56,968,566 | | | | AUD | | | | 84,277,914 | | | | (2,974,438 | ) |
|
| |
| 12/21/2022 | | Bank of America, N.A. | | | USD | | | | 4,884,460 | | | | COP | | | | 21,814,000,000 | | | | (505,089 | ) |
|
| |
| 12/21/2022 | | Bank of America, N.A. | | | USD | | | | 5,034,933 | | | | EUR | | | | 5,000,000 | | | | (73,488 | ) |
|
| |
| 12/21/2022 | | Bank of America, N.A. | | | USD | | | | 15,662,899 | | | | NZD | | | | 25,849,521 | | | | (622,717 | ) |
|
| |
| 12/21/2022 | | Bank of America, N.A. | | | USD | | | | 13,840,741 | | | | SGD | | | | 19,441,895 | | | | (102,667 | ) |
|
| |
| 01/27/2023 | | Bank of America, N.A. | | | ZAR | | | | 185,080,000 | | | | USD | | | | 10,000,000 | | | | (11,492 | ) |
|
| |
| 02/27/2023 | | Bank of America, N.A. | | | RUB | | | | 534,960,000 | | | | USD | | | | 6,000,000 | | | | (1,654,845 | ) |
|
| |
| 12/21/2022 | | BNP Paribas S.A. | | | GBP | | | | 6,282,787 | | | | USD | | | | 6,700,000 | | | | (517,412 | ) |
|
| |
| 11/03/2022 | | Citibank, N.A. | | | BRL | | | | 1,227,634,585 | | | | USD | | | | 232,993,909 | | | | (4,666,449 | ) |
|
| |
| 12/02/2022 | | Citibank, N.A. | | | BRL | | | | 795,251,244 | | | | USD | | | | 148,877,452 | | | | (4,125,331 | ) |
|
| |
| 12/21/2022 | | Citibank, N.A. | | | COP | | | | 99,848,910,000 | | | | USD | | | | 19,958,545 | | | | (87,087 | ) |
|
| |
| 12/21/2022 | | Citibank, N.A. | | | USD | | | | 5,636,906 | | | | CAD | | | | 7,408,624 | | | | (195,665 | ) |
|
| |
| 12/21/2022 | | Citibank, N.A. | | | USD | | | | 53,685,743 | | | | CNY | | | | 377,898,464 | | | | (1,674,806 | ) |
|
| |
| 12/21/2022 | | Citibank, N.A. | | | USD | | | | 4,178,052 | | | | COP | | | | 20,000,000,000 | | | | (162,859 | ) |
|
| |
| 12/21/2022 | | Deutsche Bank AG | | | GBP | | | | 3,425,000 | | | | USD | | | | 3,642,894 | | | | (291,607 | ) |
|
| |
| 12/21/2022 | | Deutsche Bank AG | | | USD | | | | 13,041,163 | | | | GBP | | | | 11,284,913 | | | | (77,511 | ) |
|
| |
| 12/21/2022 | | Deutsche Bank AG | | | USD | | | | 7,966,332 | | | | IDR | | | | 119,136,500,000 | | | | (354,187 | ) |
|
| |
| 12/21/2022 | | Deutsche Bank AG | | | USD | | | | 24,073,645 | | | | PLN | | | | 115,620,900 | | | | (58,180 | ) |
|
| |
See accompanying Notes to Consolidated Financial Statements which are an integral part of the financial statements.
| | |
| 19 | | Invesco International Bond Fund |
| | | | | | | | | | | | | | | | | | | | | | |
| Open Forward Foreign Currency Contracts–(continued) | |
|
| |
| | | | | | | | | | | | | | | | | Unrealized | |
| Settlement | | | | Contract to | | | Appreciation | |
| Date | | Counterparty | | Deliver | | | Receive | | | (Depreciation) | |
|
| |
| 12/21/2022 | | Deutsche Bank AG | | | USD | | | | 44,292,546 | | | | ZAR | | | | 777,874,550 | | | $ | (2,104,761 | ) |
|
| |
| 11/14/2022 | | Goldman Sachs International | | | USD | | | | 39,615,026 | | | | ZAR | | | | 682,165,000 | | | | (2,512,284 | ) |
|
| |
| 12/21/2022 | | Goldman Sachs International | | | MXN | | | | 888,374,082 | | | | USD | | | | 44,100,000 | | | | (355,131 | ) |
|
| |
| 12/21/2022 | | Goldman Sachs International | | | PLN | | | | 105,870,000 | | | | USD | | | | 21,673,740 | | | | (316,377 | ) |
|
| |
| 12/21/2022 | | Goldman Sachs International | | | USD | | | | 14,000,000 | | | | HUF | | | | 5,622,827,000 | | | | (614,548 | ) |
|
| |
| 06/29/2023 | | Goldman Sachs International | | | PLN | | | | 37,966,555 | | | | USD | | | | 7,370,000 | | | | (289,864 | ) |
|
| |
| 07/26/2023 | | Goldman Sachs International | | | ZAR | | | | 140,775,000 | | | | USD | | | | 7,500,000 | | | | (29,939 | ) |
|
| |
| 09/29/2023 | | Goldman Sachs International | | | SEK | | | | 55,197,500 | | | | USD | | | | 5,000,000 | | | | (99,848 | ) |
|
| |
| 10/16/2023 | | Goldman Sachs International | | | AUD | | | | 12,250,000 | | | | USD | | | | 7,754,250 | | | | (157,460 | ) |
|
| |
| 10/16/2023 | | Goldman Sachs International | | | NZD | | | | 23,333,333 | | | | USD | | | | 13,055,000 | | | | (545,402 | ) |
|
| |
| 11/28/2022 | | J.P. Morgan Chase Bank, N.A. | | | EUR | | | | 9,000,000 | | | | NOK | | | | 89,104,410 | | | | (332,646 | ) |
|
| |
| 12/20/2022 | | J.P. Morgan Chase Bank, N.A. | | | BRL | | | | 71,550,000 | | | | USD | | | | 13,250,000 | | | | (463,446 | ) |
|
| |
| 12/21/2022 | | J.P. Morgan Chase Bank, N.A. | | | EUR | | | | 5,520,000 | | | | USD | | | | 5,427,320 | | | | (50,116 | ) |
|
| |
| 12/21/2022 | | J.P. Morgan Chase Bank, N.A. | | | HUF | | | | 14,817,056,473 | | | | USD | | | | 33,800,000 | | | | (1,472,825 | ) |
|
| |
| 12/21/2022 | | J.P. Morgan Chase Bank, N.A. | | | MXN | | | | 341,880,000 | | | | USD | | | | 16,637,428 | | | | (470,591 | ) |
|
| |
| 12/21/2022 | | J.P. Morgan Chase Bank, N.A. | | | USD | | | | 106,126 | | | | CLP | | | | 95,672,818 | | | | (5,553 | ) |
|
| |
| 12/21/2022 | | J.P. Morgan Chase Bank, N.A. | | | USD | | | | 13,795,976 | | | | HUF | | | | 5,615,652,000 | | | | (427,605 | ) |
|
| |
| 12/21/2022 | | J.P. Morgan Chase Bank, N.A. | | | USD | | | | 37,396,942 | | | | INR | | | | 3,006,639,386 | | | | (1,288,797 | ) |
|
| |
| 12/21/2022 | | J.P. Morgan Chase Bank, N.A. | | | USD | | | | 57,781,468 | | | | JPY | | | | 8,218,654,529 | | | | (2,164,430 | ) |
|
| |
| 12/21/2022 | | J.P. Morgan Chase Bank, N.A. | | | USD | | | | 25,554,165 | | | | KRW | | | | 35,190,384,742 | | | | (876,714 | ) |
|
| |
| 12/21/2022 | | J.P. Morgan Chase Bank, N.A. | | | USD | | | | 28,532,645 | | | | NOK | | | | 285,331,389 | | | | (1,039,835 | ) |
|
| |
| 12/21/2022 | | J.P. Morgan Chase Bank, N.A. | | | USD | | | | 6,700,000 | | | | ZAR | | | | 119,816,107 | | | | (201,811 | ) |
|
| |
| 02/17/2023 | | J.P. Morgan Chase Bank, N.A. | | | RUB | | | | 310,125,000 | | | | USD | | | | 3,750,000 | | | | (727,269 | ) |
|
| |
| 02/22/2023 | | J.P. Morgan Chase Bank, N.A. | | | RUB | | | | 331,851,000 | | | | USD | | | | 3,900,000 | | | | (869,629 | ) |
|
| |
| 03/20/2023 | | J.P. Morgan Chase Bank, N.A. | | | BRL | | | | 30,250,000 | | | | USD | | | | 5,500,000 | | | | (198,894 | ) |
|
| |
| 12/21/2022 | | Morgan Stanley and Co. International PLC | | | MXN | | | | 351,207,000 | | | | USD | | | | 17,185,281 | | | | (389,469 | ) |
|
| |
| 12/21/2022 | | Morgan Stanley and Co. International PLC | | | USD | | | | 20,089,372 | | | | CZK | | | | 498,839,200 | | | | (12,387 | ) |
|
| |
| 12/21/2022 | | Morgan Stanley and Co. International PLC | | | USD | | | | 322,999,308 | | | | EUR | | | | 320,375,211 | | | | (5,094,473 | ) |
|
| |
| 12/21/2022 | | Morgan Stanley and Co. International PLC | | | USD | | | | 25,642,000 | | | | JPY | | | | 3,735,312,449 | | | | (364,503 | ) |
|
| |
| 12/21/2022 | | Morgan Stanley and Co. International PLC | | | USD | | | | 5,669,611 | | | | SEK | | | | 60,289,130 | | | | (186,553 | ) |
|
| |
| 12/21/2022 | | Morgan Stanley and Co. International PLC | | | USD | | | | 58,149,476 | | | | THB | | | | 2,107,337,000 | | | | (2,537,115 | ) |
|
| |
| 12/21/2022 | | Standard Chartered Bank PLC | | | GBP | | | | 7,000,000 | | | | USD | | | | 7,471,950 | | | | (569,367 | ) |
|
| |
Subtotal–Depreciation | | | | | | | | | | | | | | | | | | | (56,750,474 | ) |
|
| |
Total Forward Foreign Currency Contracts | | | | | | | | | | | | | | | | | | $ | (4,520,035 | ) |
|
| |
| | | | | | | | | | | | | | | | | | | | | | | | | | | | | | | | | | | | | | | | |
| Open Centrally Cleared Credit Default Swap Agreements(a) | |
| Reference Entity | | Buy/Sell Protection | | | (Pay)/
Receive
Fixed
Rate | | | Payment
Frequency | | | Maturity Date | | | Implied
Credit
Spread(b) | | | Notional Value | | | Upfront
Payments Paid (Received) | | | Value | | | Unrealized
Appreciation (Depreciation) | |
Credit Risk | | | | | | | | | | | | | | | | | | | | | | | | | | | | | | | | | | | | | | | | |
Markit iTraxx Europe Index, Series 37, Version 1 | | | Buy | | | | (1.00)% | | | | Quarterly | | | | 06/20/2027 | | | | 1.081% | | | | EUR | | | | 10,750,000 | | | | $(110,617 | ) | | | $ 36,292 | | | | $146,909 | |
Markit iTraxx Europe Sub Financials, Series 37, Version 1 | | | Buy | | | | (1.00) | | | | Quarterly | | | | 06/20/2027 | | | | 2.065 | | | | EUR | | | | 10,625,000 | | | | 337,165 | | | | 465,488 | | | | 128,323 | |
Intercontinental Exchange, Inc. | | | Buy | | | | (1.00) | | | | Quarterly | | | | 12/20/2027 | | | | 2.959 | | | | USD | | | | 17,500,000 | | | | 1,426,556 | | | | 1,449,610 | | | | 23,054 | |
Subtotal - Appreciation | | | | | | | | | | | | | | | | 1,653,104 | | | | 1,951,390 | | | | 298,286 | |
See accompanying Notes to Consolidated Financial Statements which are an integral part of the financial statements.
| | |
| 20 | | Invesco International Bond Fund |
| | | | | | | | | | | | | | | | | | | | | | | | | | | | | | | | | | | | | | |
| | | Open Centrally Cleared Credit Default Swap Agreements(a)–(continued) | | | |
|
|
| Reference Entity | | Buy/Sell Protection | | | (Pay)/ Receive Fixed Rate | | | Payment Frequency | | | Maturity Date | | | Implied Credit Spread(b) | | | Notional Value | | | Upfront
Payments Paid (Received) | | | Value | | | Unrealized
Appreciation (Depreciation) |
|
|
Credit Risk | | | | | | | | | | | | | | | | | | | | | | | | | | | | | | | | | | | | | | |
|
|
South Africa Republic International Bonds | | | Buy | | | | (1.00)% | | | | Quarterly | | | | 06/20/2027 | | | | 2.848% | | | | USD | | | | 5,000,000 | | | | $ 371,280 | | | $ | 364,938 | | | $ (6,342) |
|
|
Societe Generale | | | Sell | | | | 1.00 | | | | Quarterly | | | | 06/20/2027 | | | | 1.300 | | | | EUR | | | | 15,000,000 | | | | 14,931 | | | | (188,629 | ) | | (203,560) |
|
|
Subtotal - Depreciation | | | | | | | | 386,211 | | | | 176,309 | | | (209,902) |
|
|
Total Centrally Cleared Credit Default Swap Agreements | | | | $2,039,315 | | | $ | 2,127,699 | | | $ 88,384 |
|
|
| (a) | Centrally cleared swap agreements collateralized by $46,682,751 cash held with Counterparties. |
| (b) | Implied credit spreads represent the current level, as of October 31, 2022, at which protection could be bought or sold given the terms of the existing credit default swap agreement and serve as an indicator of the current status of the payment/performance risk of the credit default swap agreement. An implied credit spread that has widened or increased since entry into the initial agreement may indicate a deteriorating credit profile and increased risk of default for the reference entity. A declining or narrowing spread may indicate an improving credit profile or decreased risk of default for the reference entity. Alternatively, credit spreads may increase or decrease reflecting the general tolerance for risk in the credit markets generally. |
| | | | | | | | | | | | | | | | | | | | | | | | | | | | | | | | | | |
| Open Centrally Cleared Interest Rate Swap Agreements(a) | |
Pay/ Receive
Floating Rate | | Floating Rate Index | | Payment
Frequency | | (Pay)/
Receive
Fixed
Rate | | | Payment
Frequency | | Maturity
Date | | | Notional Value | | | Upfront
Payments
Paid
(Received) | | | Value | | | Unrealized
Appreciation
(Depreciation) | |
Interest Rate Risk | |
Receive | | 28 Day MXN
TIIE | | 28 Day | | | (10.04 | )% | | 28 Day | | | 12/18/2024 | | | | MXN | | | | 550,000,000 | | | $ | – | | | $ | 12,458 | | | | $ 12,458 | |
Receive | | 6 Month
THBFIX | | Semi-Annually | | | (1.97 | ) | | Semi-Annually | | | 05/13/2024 | | | | THB | | | | 875,000,000 | | | | – | | | | 37,376 | | | | 37,376 | |
Receive | | TTHORON | | Quarterly | | | (2.59 | ) | | Quarterly | | | 06/13/2027 | | | | THB | | | | 355,000,000 | | | | – | | | | 41,772 | | | | 41,772 | |
Receive | | 6 Month
THBFIX | | Semi-Annually | | | (1.95 | ) | | Semi-Annually | | | 05/13/2024 | | | | THB | | | | 850,000,000 | | | | – | | | | 43,026 | | | | 43,026 | |
Receive | | COOVIBR | | Quarterly | | | (11.50 | ) | | Quarterly | | | 11/02/2024 | | | | COP | | | | 137,500,000,000 | | | | – | | | | 59,711 | | | | 59,711 | |
Pay | | TONAR | | Annually | | | 0.24 | | | Annually | | | 09/29/2027 | | | | JPY | | | | 8,825,000,000 | | | | (73,086 | ) | | | (10,993 | ) | | | 62,093 | |
Receive | | FBIL
Overnight MIBOR | | Semi-Annually | | | (6.62 | ) | | Semi-Annually | | | 05/02/2027 | | | | INR | | | | 1,800,000,000 | | | | – | | | | 71,611 | | | | 71,611 | |
Receive | | COOVIBR | | Quarterly | | | (11.46 | ) | | Quarterly | | | 11/01/2024 | | | | COP | | | | 137,500,000,000 | | | | – | | | | 81,491 | | | | 81,491 | |
Receive | | 3 Month
JIBAR | | Quarterly | | | (7.98 | ) | | Quarterly | | | 03/07/2032 | | | | ZAR | | | | 16,000,000 | | | | – | | | | 83,246 | | | | 83,246 | |
Receive | | 3 Month
JIBAR | | Quarterly | | | (7.95 | ) | | Quarterly | | | 03/07/2032 | | | | ZAR | | | | 16,500,000 | | | | – | | | | 87,573 | | | | 87,573 | |
Receive | | 6 Month
THBFIX | | Semi-Annually | | | (1.71 | ) | | Semi-Annually | | | 04/18/2025 | | | | THB | | | | 573,000,000 | | | | – | | | | 88,267 | | | | 88,267 | |
Receive | | 6 Month
THBFIX | | Semi-Annually | | | (1.66 | ) | | Semi-Annually | | | 05/26/2024 | | | | THB | | | | 850,000,000 | | | | – | | | | 140,473 | | | | 140,473 | |
Receive | | BZDIOVRA | | At Maturity | | | (12.84 | ) | | At Maturity | | | 01/02/2024 | | | | BRL | | | | 695,808,610 | | | | – | | | | 166,814 | | | | 166,814 | |
Pay | | TONAR | | Annually | | | 0.30 | | | Annually | | | 09/29/2027 | | | | JPY | | | | 8,825,000,000 | | | | (39,985 | ) | | | 163,110 | | | | 203,095 | |
Receive | | COOVIBR | | Quarterly | | | (9.85 | ) | | Quarterly | | | 07/21/2032 | | | | COP | | | | 17,843,000,000 | | | | – | | | | 224,759 | | | | 224,759 | |
Receive | | 6 Month
WIBOR | | Semi-Annually | | | (7.61 | ) | | Annually | | | 09/21/2024 | | | | PLN | | | | 127,000,000 | | | | – | | | | 240,749 | | | | 240,749 | |
Receive | | COOVIBR | | Quarterly | | | (9.71 | ) | | Quarterly | | | 07/21/2032 | | | | COP | | | | 16,883,000,000 | | | | – | | | | 241,409 | | | | 241,409 | |
Receive | | SOFR | | Annually | | | (3.39 | ) | | Annually | | | 11/09/2052 | | | | USD | | | | 20,400,000 | | | | – | | | | 248,529 | | | | 248,529 | |
Pay | | BZDIOVRA | | At Maturity | | | 11.72 | | | At Maturity | | | 01/02/2026 | | | | BRL | | | | 248,590,247 | | | | – | | | | 302,293 | | | | 302,293 | |
Receive | | COOVIBR | | Quarterly | | | (8.54 | ) | | Quarterly | | | 05/27/2032 | | | | COP | | | | 13,500,000,000 | | | | – | | | | 383,872 | | | | 383,872 | |
Receive | | COOVIBR | | Quarterly | | | (9.86 | ) | | Quarterly | | | 09/09/2032 | | | | COP | | | | 36,000,000,000 | | | | – | | | | 446,274 | | | | 446,274 | |
Receive | | 28 Day MXN
TIIE | | 28 Day | | | (9.43 | ) | | 28 Day | | | 12/18/2024 | | | | MXN | | | | 850,000,000 | | | | – | | | | 481,393 | | | | 481,393 | |
Receive | | SOFR | | Annually | | | (3.36 | ) | | Annually | | | 11/09/2052 | | | | USD | | | | 27,200,000 | | | | – | | | | 494,291 | | | | 494,291 | |
Receive | | 3 Month
ADBB | | Quarterly | | | (3.70 | ) | | Quarterly | | | 09/07/2025 | | | | AUD | | | | 104,000,000 | | | | – | | | | 513,652 | | | | 513,652 | |
See accompanying Notes to Consolidated Financial Statements which are an integral part of the financial statements.
| | |
| 21 | | Invesco International Bond Fund |
| | | | | | | | | | | | | | | | | | | | | | | | | | | | | | | | | | |
| Open Centrally Cleared Interest Rate Swap Agreements(a)–(continued) | |
|
| |
Pay/ Receive
Floating Rate | | Floating Rate Index | | Payment
Frequency | | (Pay)/
Receive
Fixed
Rate | | | Payment
Frequency | | Maturity
Date | | | Notional Value | | | Upfront
Payments
Paid
(Received) | | | Value | | | Unrealized
Appreciation
(Depreciation) | |
|
| |
Receive | | 28 Day MXN TIIE | | 28 Day | | | (9.36 | )% | | 28 Day | | | 12/18/2024 | | | | MXN | | | | 850,000,000 | | | $ | – | | | $ | 538,683 | | | $ | 538,683 | |
|
| |
Pay | | SONIA | | Annually | | | 3.99 | | | Annually | | | 10/24/2052 | | | | GBP | | | | 4,500,000 | | | | – | | | | 673,288 | | | | 673,288 | |
|
| |
Receive | | 3 Month JIBAR | | Quarterly | | | (7.42 | ) | | Quarterly | | | 05/05/2027 | | | | ZAR | | | | 370,000,000 | | | | – | | | | 740,980 | | | | 740,980 | |
|
| |
Receive | | 3 Month JIBAR | | Quarterly | | | (7.45 | ) | | Quarterly | | | 04/29/2027 | | | | ZAR | | | | 385,000,000 | | | | – | | | | 741,819 | | | | 741,819 | |
|
| |
Pay | | SOFR | | Annually | | | 3.89 | | | Annually | | | 10/27/2032 | | | | USD | | | | 157,500,000 | | | | (7,196 | ) | | | 788,062 | | | | 795,258 | |
|
| |
Receive | | COOVIBR | | Quarterly | | | (9.01 | ) | | Quarterly | | | 05/24/2032 | | | | COP | | | | 36,300,000,000 | | | | – | | | | 819,663 | | | | 819,663 | |
|
| |
Receive | | 3 Month JIBAR | | Quarterly | | | (6.61 | ) | | Quarterly | | | 10/19/2026 | | | | ZAR | | | | 336,700,000 | | | | 1,507 | | | | 1,023,335 | | | | 1,021,828 | |
|
| |
Receive | | 3 Month JIBAR | | Quarterly | | | (6.65 | ) | | Quarterly | | | 10/11/2026 | | | | ZAR | | | | 350,000,000 | | | | – | | | | 1,072,059 | | | | 1,072,059 | |
|
| |
Pay | | BZDIOVRA | | At Maturity | | | 12.88 | | | At Maturity | | | 01/04/2027 | | | | BRL | | | | 103,795,903 | | | | – | | | | 1,209,114 | | | | 1,209,114 | |
|
| |
Pay | | BZDIOVRA | | At Maturity | | | 12.90 | | | At Maturity | | | 01/04/2027 | | | | BRL | | | | 122,728,546 | | | | – | | | | 1,445,560 | | | | 1,445,560 | |
|
| |
Receive | | SOFR | | Annually | | | (3.53 | ) | | Annually | | | 09/27/2032 | | | | USD | | | | 62,000,000 | | | | – | | | | 1,511,660 | | | | 1,511,660 | |
|
| |
Receive | | FBIL Overnight MIBOR | | Semi-Annually | | | (5.65 | ) | | Semi-Annually | | | 02/17/2027 | | | | INR | | | | 2,625,000,000 | | | | – | | | | 1,519,066 | | | | 1,519,066 | |
|
| |
Receive | | 3 Month JIBAR | | Quarterly | | | (7.50 | ) | | Quarterly | | | 03/01/2031 | | | | ZAR | | | | 310,000,000 | | | | 1,830 | | | | 1,826,405 | | | | 1,824,575 | |
|
| |
Receive | | COOVIBR | | Quarterly | | | (4.20 | ) | | Quarterly | | | 02/08/2031 | | | | COP | | | | 43,000,000,000 | | | | – | | | | 4,145,809 | | | | 4,145,809 | |
|
| |
Receive | | CLICP | | Semi-Annually | | | (2.34 | ) | | Semi-Annually | | | 03/10/2026 | | | | CLP | | | | 30,000,000,000 | | | | – | | | | 4,780,130 | | | | 4,780,130 | |
|
| |
Subtotal – Appreciation | | | | | | | | | | | | | | | | | | (116,930 | ) | | | 27,478,789 | | | | 27,595,719 | |
|
| |
Interest Rate Risk | | | | | | | | | | | | | | | | | | | | | | | | | | | | | | | | |
|
| |
Pay | | SOFR | | Annually | | | 2.84 | | | Annually | | | 06/09/2033 | | | | USD | | | | 132,500,000 | | | | – | | | | (9,854,587 | ) | | | (9,854,587 | ) |
|
| |
Pay | | 6 Month EURIBOR | | Semi-Annually | | | 0.64 | | | Annually | | | 03/03/2032 | | | | EUR | | | | 45,000,000 | | | | – | | | | (8,490,415 | ) | | | (8,490,415 | ) |
|
| |
Pay | | 6 Month EURIBOR | | Semi-Annually | | | 2.43 | | | Annually | | | 09/05/2032 | | | | EUR | | | | 91,400,000 | | | | (20,227 | ) | | | (4,380,812 | ) | | | (4,360,585 | ) |
|
| |
Pay | | SONIA | | Annually | | | 2.24 | | | Annually | | | 10/11/2032 | | | | GBP | | | | 25,000,000 | | | | – | | | | (3,634,124 | ) | | | (3,634,124 | ) |
|
| |
Pay | | SOFR | | Annually | | | 3.38 | | | Annually | | | 09/08/2025 | | | | USD | | | | 70,500,000 | | | | – | | | | (1,807,609 | ) | | | (1,807,609 | ) |
|
| |
Receive | | SONIA | | Annually | | | (5.73 | ) | | Annually | | | 09/28/2024 | | | | GBP | | | | 50,000,000 | | | | 5,032 | | | | (1,185,188 | ) | | | (1,190,220 | ) |
|
| |
Receive | | SONIA | | Annually | | | (5.41 | ) | | Annually | | | 09/27/2024 | | | | GBP | | | | 50,000,000 | | | | 4,504 | | | | (857,285 | ) | | | (861,789 | ) |
|
| |
Receive | | SONIA | | Annually | | | (4.96 | ) | | Annually | | | 10/04/2024 | | | | GBP | | | | 100,000,000 | | | | – | | | | (789,082 | ) | | | (789,082 | ) |
|
| |
Receive | | SONIA | | Annually | | | (5.51 | ) | | Annually | | | 09/28/2024 | | | | GBP | | | | 27,000,000 | | | | 2,552 | | | | (520,339 | ) | | | (522,891 | ) |
|
| |
Pay | | SOFR | | Annually | | | 3.94 | | | Annually | | | 11/09/2027 | | | | USD | | | | 111,350,000 | | | | – | | | | (460,090 | ) | | | (460,090 | ) |
|
| |
Pay | | 28 Day MXN TIIE | | 28 Day | | | 8.68 | | | 28 Day | | | 12/08/2032 | | | | MXN | | | | 231,250,000 | | | | – | | | | (443,254 | ) | | | (443,254 | ) |
|
| |
Pay | | 28 Day MXN TIIE | | 28 Day | | | 8.79 | | | 28 Day | | | 12/08/2032 | | | | MXN | | | | 232,500,000 | | | | – | | | | (365,211 | ) | | | (365,211 | ) |
|
| |
Receive | | CLICP | | Semi-Annually | | | (7.41 | ) | | Semi-Annually | | | 07/22/2027 | | | | CLP | | | | 11,000,000,000 | | | | – | | | | (269,652 | ) | | | (269,652 | ) |
|
| |
Pay | | BZDIOVRA | | At Maturity | | | 11.30 | | | At Maturity | | | 01/02/2026 | | | | BRL | | | | 259,730,842 | | | | – | | | | (268,701 | ) | | | (268,701 | ) |
|
| |
Receive | | FBIL Overnight MIBOR | | Semi-Annually | | | (7.02 | ) | | Semi-Annually | | | 05/25/2027 | | | | INR | | | | 1,875,000,000 | | | | – | | | | (258,099 | ) | | | (258,099 | ) |
|
| |
Pay | | BZDIOVRA | | At Maturity | | | 11.27 | | | At Maturity | | | 01/02/2029 | | | | BRL | | | | 85,886,849 | | | | – | | | | (164,106 | ) | | | (164,106 | ) |
|
| |
Receive | | BZDIOVRA | | At Maturity | | | (13.08 | ) | | At Maturity | | | 01/02/2024 | | | | BRL | | | | 638,756,367 | | | | – | | | | (141,253 | ) | | | (141,253 | ) |
|
| |
Pay | | CLICP | | Annually | | | 10.90 | | | Annually | | | 07/22/2023 | | | | CLP | | | | 49,850,000,000 | | | | – | | | | (121,341 | ) | | | (121,341 | ) |
|
| |
Pay | | SOFR | | Annually | | | 4.00 | | | Annually | | | 11/09/2027 | | | | USD | | | | 83,512,500 | | | | – | | | | (107,740 | ) | | | (107,740 | ) |
|
| |
Pay | | BZDIOVRA | | At Maturity | | | 11.44 | | | At Maturity | | | 01/02/2026 | | | | BRL | | | | 257,483,601 | | | | – | | | | (106,221 | ) | | | (106,221 | ) |
|
| |
Receive | | BZDIOVRA | | At Maturity | | | (13.00 | ) | | At Maturity | | | 01/02/2024 | | | | BRL | | | | 670,830,035 | | | | – | | | | (43,178 | ) | | | (43,178 | ) |
|
| |
See accompanying Notes to Consolidated Financial Statements which are an integral part of the financial statements.
| | |
| 22 | | Invesco International Bond Fund |
| | | | | | | | | | | | | | | | | | | | | | | | | | |
| Open Centrally Cleared Interest Rate Swap Agreements(a)–(continued) | |
|
| |
Pay/
Receive
Floating
Rate | | Floating Rate Index | | Payment
Frequency | | (Pay)/
Receive
Fixed
Rate | | Payment
Frequency | | Maturity
Date | | Notional Value | | | Upfront
Payments
Paid (Received) | | | Value | | | Unrealized
Appreciation
(Depreciation) | |
|
| |
Pay | | 28 Day MXN TIIE | | 28 Day | | 9.24% | | 28 Day | | 12/08/2032 | | | MXN 152,500,000 | | | | $ – | | | | $ (13,958 | ) | | | $ (13,958 | ) |
|
| |
Receive | | 6 Month THBFIX | | Semi-Annually | | (2.11) | | Semi-Annually | | 05/11/2024 | | | THB 850,000,000 | | | | – | | | | (8,746 | ) | | | (8,746 | ) |
|
| |
Subtotal – Depreciation | | | | | | | (8,139 | ) | | | (34,290,991 | ) | | | (34,282,852 | ) |
|
| |
Total Centrally Cleared Interest Rate Swap Agreements | | | | | | | $(125,069 | ) | | | $(6,812,202 | ) | | | $(6,687,133 | ) |
|
| |
| (a) | Centrally cleared swap agreements collateralized by $46,682,751 cash held with Counterparties. |
| | | | | | | | | | | | | | | | | | | | | | | | | | | | | | | | | | | | | | |
| Open Over-The-Counter Credit Default Swap Agreements(a) | |
|
| |
| Counterparty | | Reference Entity | | Buy/Sell
Protection | | (Pay)/
Receive Fixed
Rate | | Payment
Frequency | | | Maturity
Date | | | Implied
Credit
Spread(b) | | | Notional Value | | | Upfront
Payments Paid
(Received) | | | Value | | | Unrealized
Appreciation
(Depreciation) | |
|
| |
Credit Risk | | | | | | | | | | | | | | | | | | | | | | | | | | | | | | | | | | | | | | |
|
| |
| Goldman Sachs International | | Royal Bank of Scotland Group PLC (The) | | Buy | | (1.00)% | | | Quarterly | | | | 12/20/2027 | | | | 2.153% | | | | EUR | | | | 5,000,000 | | | | $ 193,630 | | | $ | 262,170 | | | | $ 68,540 | |
|
| |
| J.P. Morgan Chase Bank, N.A. | | Royal Bank of Scotland Group PLC (The) | | Buy | | (1.00) | | | Quarterly | | | | 06/20/2027 | | | | 2.047 | | | | EUR | | | | 7,500,000 | | | | 241,772 | | | | 327,346 | | | | 85,574 | |
|
| |
Subtotal–Appreciation | | | | | | | | | | | | | | | | | | | | | | | | | 435,402 | | | | 589,516 | | | | 154,114 | |
|
| |
| Credit Risk | | | | | | | | | | | | | | | | | | | | | | | | | | | | | | | | | | | | | | |
|
| |
| Citibank, N.A. | | Assicurazioni Generali S.p.A. | | Buy | | (1.00) | | | Quarterly | | | | 12/20/2024 | | | | 1.105 | | | | EUR | | | | 5,000,000 | | | | 27,225 | | | | 10,761 | | | | (16,464 | ) |
|
| |
| Citibank, N.A. | | Assicurazioni Generali S.p.A. | | Sell | | 1.00 | | | Quarterly | | | | 12/20/2024 | | | | 0.742 | | | | EUR | | | | 10,000,000 | | | | 41,911 | | | | 26,551 | | | | (15,360 | ) |
|
| |
| Goldman Sachs International | | Markit iTraxx Europe Crossover Index, Series 32, Version 5 | | Sell | | 5.00 | | | Quarterly | | | | 12/20/2024 | | | | 8.244 | | | | EUR | | | | 10,000,000 | | | | 549,672 | | | | (633,966 | ) | | | (1,183,638 | ) |
|
| |
| J.P. Morgan Chase Bank, N.A. | | Markit iTraxx Europe Crossover Index, Series 30, Version 8 | | Sell | | 5.00 | | | Quarterly | | | | 12/20/2023 | | | | 13.894 | | | | EUR | | | | 5,000,000 | | | | 23,081 | | | | (471,679 | ) | | | (494,760 | ) |
|
| |
| J.P. Morgan Chase Bank, N.A. | | Markit iTraxx Europe Crossover Index, Series 30, Version 8 | | Sell | | 5.00 | | | Quarterly | | | | 12/20/2023 | | | | 13.894 | | | | EUR | | | | 10,000,000 | | | | 137,236 | | | | (943,359 | ) | | | (1,080,595 | ) |
|
| |
| J.P. Morgan Chase Bank, N.A. | | Markit iTraxx Europe Crossover Index, Series 30, Version 8 | | Sell | | 5.00 | | | Quarterly | | | | 12/20/2023 | | | | 13.894 | | | | EUR | | | | 5,000,000 | | | | 51,568 | | | | (471,679 | ) | | | (523,247 | ) |
|
| |
Subtotal–Depreciation | | | | | | | | | | | | | | | | 830,693 | | | | (2,483,371 | ) | | | (3,314,064 | ) |
|
| |
Total Open Over-The-Counter Credit Default Swap Agreements | | | | | | | | | | | | | | | | $ 1,266,095 | | | $ | (1,893,855 | ) | | | $(3,159,950 | ) |
|
| |
| (a) | Over-The-Counter options purchased, options written and swap agreements are collateralized by cash held with Counterparties in the amount of $68,869,000. |
| (b) | Implied credit spreads represent the current level, as of October 31, 2022, at which protection could be bought or sold given the terms of the existing credit default swap agreement and serve as an indicator of the current status of the payment/performance risk of the credit default swap agreement. An implied credit spread that has widened or increased since entry into the initial agreement may indicate a deteriorating credit profile and increased risk of default for the reference entity. A declining or narrowing spread may indicate an improving credit profile or decreased risk of default for the reference entity. Alternatively, credit spreads may increase or decrease reflecting the general tolerance for risk in the credit markets generally. |
| | | | | | | | | | | | | | | | | | | | | | |
| | | | | Open Over-The-Counter Interest Rate Swap Agreements(a) | | | | |
|
|
| Counterparty | | Pay/
Receive
Floating
Rate | | Floating Rate Index | | Payment Frequency | | | (Pay)/ Received
Fixed
Rate | | Payment
Frequency | | Maturity
Date | | Notional Value | | Upfront
Payments
Paid
(Received) | | Value | | Unrealized
Appreciation |
|
|
Interest Rate Risk |
|
|
Bank of America, N.A. | | Receive | | 3 Month MYR KLIBOR | | | Quarterly | | | (2.70)% | | Quarterly | | 03/16/2024 | | MYR 198,000,000 | | $– | | $588,460 | | $588,460 |
|
|
| (a) | Over-The-Counter options purchased, options written and swap agreements are collateralized by cash held with Counterparties in the amount of $68,869,000. |
See accompanying Notes to Consolidated Financial Statements which are an integral part of the financial statements.
| | |
| 23 | | Invesco International Bond Fund |
| | |
| Abbreviations: |
| |
| ADBB | | –Australian Dollar Bank Bill |
| AUD | | –Australian Dollar |
| BRL | | –Brazilian Real |
| BZDIOVRA | | –Brazil Ceptip DI Interbank Deposit Rate |
| CAD | | –Canadian Dollar |
| CDOR | | –Canadian Dealer Offered Rate |
| CHF | | –Swiss Franc |
| CLICP | | –Sinacofi Chile Interbank Rate Avg (CAMARA) |
| CLP | | –Chile Peso |
| CNY | | –Chinese Yuan Renminbi |
| COOVIBR | | –Colombia IBR Overnight Nominal Interbank Reference Rate |
| COP | | –Colombia Peso |
| CZK | | –Czech Koruna |
| EUR | | –Euro |
| EURIBOR | | –Euro Interbank Offered Rate |
| FBIL | | –Financial Benchmarks India Private Ltd. |
| GBP | | –British Pound Sterling |
| HUF | | –Hungarian Forint |
| IDR | | –Indonesian Rupiah |
| INR | | –Indian Rupee |
| JIBAR | | –Johannesburg Interbank Average Rate |
| JPY | | –Japanese Yen |
| KLIBOR | | –Kuala Lumpur Interbank Offered Rate |
| KRW | | –South Korean Won |
| MIBOR | | –Mumbai Interbank Offered Rate |
| MXN | | –Mexican Peso |
| MYR | | –Malaysian Ringgit |
| NOK | | –Norwegian Krone |
| NZD | | –New Zealand Dollar |
| PLN | | –Polish Zloty |
| RUB | | –Russian Ruble |
| SEK | | –Swedish Krona |
| SGD | | –Singapore Dollar |
| SOFR | | –Secured Overnight Financing Rate |
| SONIA | | –Sterling Overnight Index Average |
| THB | | –Thai Baht |
| THBFIX | | –Thai Baht Interest Rate Fixing |
| TIIE | | –Interbank Equilibrium Interest Rate |
| TONAR | | –Tokyo Overnight Average Rate |
| TTHORON | | –Thai Overnight Repurchase Rate |
| USD | | –U.S. Dollar |
| WIBOR | | –Warsaw Interbank Offered Rate |
| ZAR | | –South African Rand |
See accompanying Notes to Consolidated Financial Statements which are an integral part of the financial statements.
| | |
| 24 | | Invesco International Bond Fund |
Consolidated Statement of Assets and Liabilities
October 31, 2022
| | | | |
Assets: | | | | |
| |
Investments in unaffiliated securities, at value
(Cost $1,359,685,807)* | | $ | 1,132,597,106 | |
|
| |
Investments in affiliated money market funds, at value (Cost $71,096,361) | | | 71,096,776 | |
|
| |
Other investments: | | | | |
Variation margin receivable – futures contracts | | | 1,768,476 | |
|
| |
Swaps receivable – OTC | | | 230,871 | |
|
| |
Unrealized appreciation on swap agreements – OTC | | | 742,574 | |
|
| |
Premiums paid on swap agreements – OTC | | | 1,266,095 | |
|
| |
Unrealized appreciation on forward foreign currency contracts outstanding | | | 52,230,439 | |
|
| |
Deposits with brokers: | |
Cash collateral – exchange-traded futures contracts | | | 3,898,686 | |
|
| |
Cash collateral – centrally cleared swap agreements | | | 46,682,751 | |
|
| |
Cash collateral – OTC Derivatives | | | 68,869,000 | |
|
| |
Cash | | | 42,158,928 | |
|
| |
Foreign currencies, at value (Cost $4,633,269) | | | 4,552,334 | |
|
| |
Receivable for: | | | | |
Investments sold | | | 11,474,175 | |
|
| |
Fund shares sold | | | 491,164 | |
|
| |
Dividends | | | 179,801 | |
|
| |
Interest | | | 18,257,452 | |
|
| |
Investment for trustee deferred compensation and retirement plans | | | 305,552 | |
|
| |
Other assets | | | 80,500 | |
|
| |
Total assets | | | 1,456,882,680 | |
|
| |
| |
Liabilities: | | | | |
Other investments: | | | | |
Options written, at value (premiums received $77,289,829) | | | 96,158,624 | |
|
| |
Variation margin payable – centrally cleared swap agreements | | | 474,887 | |
|
| |
Unrealized depreciation on forward foreign currency contracts outstanding | | | 56,750,474 | |
|
| |
Swaps payable – OTC | | | 20,061 | |
|
| |
Unrealized depreciation on swap agreements–OTC | | | 3,314,064 | |
|
| |
Payable for: | | | | |
Investments purchased | | | 562,500 | |
|
| |
Dividends | | | 793,071 | |
|
| |
Fund shares reacquired | | | 1,978,614 | |
|
| |
Collateral upon return of securities loaned | | | 4,458,070 | |
|
| |
Accrued fees to affiliates | | | 745,594 | |
|
| |
Accrued trustees’ and officers’ fees and benefits | | | 2,557 | |
|
| |
Accrued other operating expenses | | | 489,065 | |
|
| |
Trustee deferred compensation and retirement plans | | | 305,552 | |
|
| |
Total liabilities | | | 166,053,133 | |
|
| |
Net assets applicable to shares outstanding | | $ | 1,290,829,547 | |
|
| |
| | | | |
Net assets consist of: | | | | |
Shares of beneficial interest | | $ | 1,784,450,508 | |
|
| |
Distributable earnings (loss) | | | (493,620,961 | ) |
|
| |
| | $ | 1,290,829,547 | |
|
| |
| |
Net Assets: | | | | |
Class A | | $ | 449,632,034 | |
|
| |
Class C | | $ | 17,453,871 | |
|
| |
Class R | | $ | 40,961,932 | |
|
| |
Class Y | | $ | 497,024,787 | |
|
| |
Class R5 | | $ | 964,460 | |
|
| |
Class R6 | | $ | 284,792,463 | |
|
| |
|
Shares outstanding, no par value, with an unlimited number of shares authorized: | |
Class A | | | 113,585,050 | |
|
| |
Class C | | | 4,426,215 | |
|
| |
Class R | | | 10,378,270 | |
|
| |
Class Y | | | 125,643,837 | |
|
| |
Class R5 | | | 243,253 | |
|
| |
Class R6 | | | 72,041,044 | |
|
| |
Class A: | | | | |
Net asset value per share | | $ | 3.96 | |
|
| |
Maximum offering price per share
(Net asset value of $3.96 ÷ 95.75%) | | $ | 4.14 | |
|
| |
Class C: | | | | |
Net asset value and offering price per share | | $ | 3.94 | |
|
| |
Class R: | | | | |
Net asset value and offering price per share | | $ | 3.95 | |
|
| |
Class Y: | | | | |
Net asset value and offering price per share | | $ | 3.96 | |
|
| |
Class R5: | | | | |
Net asset value and offering price per share | | $ | 3.96 | |
|
| |
Class R6: | | | | |
Net asset value and offering price per share | | $ | 3.95 | |
|
| |
| * | At October 31, 2022, securities with an aggregate value of $4,378,635 were on loan to brokers. |
See accompanying Notes to Consolidated Financial Statements which are an integral part of the financial statements.
| | |
| 25 | | Invesco International Bond Fund |
Consolidated Statement of Operations
For the year ended October 31, 2022
| | | | |
Investment income: | | | | |
| |
Interest (net of foreign withholding taxes of $885,055) | | $ | 74,849,595 | |
|
| |
Dividends from affiliated money market funds (includes net securities lending income of $16,581) | | | 849,126 | |
|
| |
Total investment income | | | 75,698,721 | |
|
| |
| |
Expenses: | | | | |
| |
Advisory fees | | | 10,246,466 | |
|
| |
Administrative services fees | | | 247,363 | |
|
| |
Custodian fees | | | 384,380 | |
|
| |
Distribution fees: | | | | |
Class A | | | 1,393,647 | |
|
| |
Class C | | | 231,354 | |
|
| |
Class R | | | 252,328 | |
|
| |
Interest, facilities and maintenance fees | | | 2,543,181 | |
|
| |
Transfer agent fees – A, C, R and Y | | | 2,488,787 | |
|
| |
Transfer agent fees – R5 | | | 574 | |
|
| |
Transfer agent fees – R6 | | | 120,348 | |
|
| |
Trustees’ and officers’ fees and benefits | | | 34,663 | |
|
| |
Registration and filing fees | | | 99,601 | |
|
| |
Professional services fees | | | 135,227 | |
|
| |
Other | | | (755,898 | ) |
|
| |
Total expenses | | | 17,422,021 | |
|
| |
Less: Fees waived, expenses reimbursed and/or expense offset arrangement(s) | | | (366,861 | ) |
|
| |
Net expenses | | | 17,055,160 | |
|
| |
Net investment income | | | 58,643,561 | |
|
| |
| |
Realized and unrealized gain (loss) from: | | | | |
Net realized gain (loss) from: | | | | |
Unaffiliated investment securities (net of foreign taxes of $ 19,900) | | | (211,296,134 | ) |
|
| |
Affiliated investment securities | | | 6,537 | |
|
| |
Foreign currencies | | | (8,159,641 | ) |
|
| |
Forward foreign currency contracts | | | 10,925,978 | |
|
| |
Futures contracts | | | 59,070,747 | |
|
| |
Option contracts written | | | 10,577,835 | |
|
| |
Swap agreements | | | (164,269,292 | ) |
|
| |
| | | (303,143,970 | ) |
|
| |
Change in net unrealized appreciation (depreciation) of: | | | | |
Unaffiliated investment securities (net of foreign taxes of $ 341,826) | | | (134,898,751 | ) |
|
| |
Affiliated investment securities | | | 696 | |
|
| |
Foreign currencies | | | (568,132 | ) |
|
| |
Forward foreign currency contracts | | | (15,480,119 | ) |
|
| |
Futures contracts | | | 4,824,930 | |
|
| |
Option contracts written | | | (8,908,052 | ) |
|
| |
Swap agreements | | | 37,685,704 | |
|
| |
| | | (117,343,724 | ) |
|
| |
Net realized and unrealized gain (loss) | | | (420,487,694 | ) |
|
| |
Net increase (decrease) in net assets resulting from operations | | $ | (361,844,133 | ) |
|
| |
See accompanying Notes to Consolidated Financial Statements which are an integral part of the financial statements.
| | |
| 26 | | Invesco International Bond Fund |
Consolidated Statement of Changes in Net Assets
For the years ended October 31, 2022 and 2021
| | | | | | | | |
| | | 2022 | | | 2021 | |
|
| |
Operations: | | | | | | | | |
Net investment income | | $ | 58,643,561 | | | $ | 74,439,003 | |
|
| |
Net realized gain (loss) | | | (303,143,970 | ) | | | (79,750,107 | ) |
|
| |
Change in net unrealized appreciation (depreciation) | | | (117,343,724 | ) | | | (56,669,898 | ) |
|
| |
Net increase (decrease) in net assets resulting from operations | | | (361,844,133 | ) | | | (61,981,002 | ) |
|
| |
| | |
Return of capital: | | | | | | | | |
Class A | | | (17,732,927 | ) | | | (21,704,815 | ) |
|
| |
Class C | | | (542,467 | ) | | | (810,790 | ) |
|
| |
Class R | | | (1,451,576 | ) | | | (1,769,009 | ) |
|
| |
Class Y | | | (24,106,074 | ) | | | (31,503,592 | ) |
|
| |
Class R5 | | | (22,987 | ) | | | (907 | ) |
|
| |
Class R6 | | | (12,876,954 | ) | | | (17,034,255 | ) |
|
| |
Total return of capital | | | (56,732,985 | ) | | | (72,823,368 | ) |
|
| |
| | |
Share transactions–net: | | | | | | | | |
Class A | | | (102,712,578 | ) | | | (163,005,229 | ) |
|
| |
Class C | | | (7,390,569 | ) | | | (33,693,204 | ) |
|
| |
Class R | | | (7,684,378 | ) | | | (15,250,325 | ) |
|
| |
Class Y | | | (266,241,633 | ) | | | (109,968,834 | ) |
|
| |
Class R5 | | | 1,078,038 | | | | 62,702 | |
|
| |
Class R6 | | | (96,211,294 | ) | | | (73,986,017 | ) |
|
| |
Net increase (decrease) in net assets resulting from share transactions | | | (479,162,414 | ) | | | (395,840,907 | ) |
|
| |
Net increase (decrease) in net assets | | | (897,739,532 | ) | | | (530,645,277 | ) |
|
| |
| | |
Net assets: | | | | | | | | |
Beginning of year | | | 2,188,569,079 | | | | 2,719,214,356 | |
|
| |
End of year | | $ | 1,290,829,547 | | | $ | 2,188,569,079 | |
|
| |
See accompanying Notes to Consolidated Financial Statements which are an integral part of the financial statements.
| | |
| 27 | | Invesco International Bond Fund |
Consolidated Financial Highlights
The following schedule presents financial highlights for a share of the Fund outstanding throughout the periods indicated.
| | | | | | | | | | | | | | | | | | | | | | | | | | | | | | | | | | | | | | | | | | | | | | | | | | | | | | | | | | | | | | | | | | | | | | | | | | | | | | | | | | | | | | | | | | | | | | | | | | | | | | | | | | | | | | | | | | | | | | | | | | | | | | | | | | | | | | | |
| | | Net asset value, beginning of period | | | | Net investment income(a) | | | | Net gains (losses) on securities (both realized and unrealized) | | | | Total from investment operations | | | | Dividends from net investment income | | | | Return of capital | | | | Total distributions | | | | Net asset value, end of period | | | | Total return(b) | | | | Net assets, end of period (000’s omitted) | | | | Ratio of expenses to average net assets with fee waivers and/or expenses absorbed | | | | Ratio of expenses to average net assets without fee waivers and/or expenses absorbed(c) | | | | Ratio of net investment income to average net assets | | | | Portfolio turnover (d) |
Class A | | | | | | | | | | | | | | | | | | | | | | | | | | | | | | | | | | | | | | | | | | | | | | | | | | | | | | | | | | | | | | | | | | | | | | | | | | | | | | | | | | | | | | | | | | | | | | | | | | | | | | | | | | | | | | | | | | | | | | | | | | | | | | | | | | | | | | | |
Year ended 10/31/22 | | | $ | 5.08 | | | | | | | | | $ | 0.15 | | | | | | | | | $ | (1.13 | ) | | | | | | | | $ | (0.98 | ) | | | | | | | | $ | – | | | | | | | | | $ | (0.14 | ) | | | | | | | | $ | (0.14 | ) | | | | | | | | $ | 3.96 | | | | | | | | | | (19.50 | )% | | | | | | | | $ | 449,632 | | | | | | | | | | 1.16 | %(e) | | | | | | | | | 1.18 | %(e) | | | | | | | | | 3.21 | %(e) | | | | | | | | | 90 | % |
Year ended 10/31/21 | | | | 5.41 | | | | | | | | | | 0.15 | | | | | | | | | | (0.33 | ) | | | | | | | | | (0.18 | ) | | | | | | | | | – | | | | | | | | | | (0.15 | ) | | | | | | | | | (0.15 | ) | | | | | | | | | 5.08 | | | | | | | | | | (3.54 | ) | | | | | | | | | 690,866 | | | | | | | | | | 1.01 | | | | | | | | | | 1.07 | | | | | | | | | | 2.73 | | | | | | | | | | 197 | |
Year ended 10/31/20 | | | | 5.53 | | | | | | | | | | 0.17 | | | | | | | | | | (0.10 | ) | | | | | | | | | 0.07 | | | | | | | | | | (0.12 | ) | | | | | | | | | (0.07 | ) | | | | | | | | | (0.19 | ) | | | | | | | | | 5.41 | | | | | | | | | | 1.35 | | | | | | | | | | 894,798 | | | | | | | | | | 1.00 | | | | | | | | | | 1.04 | | | | | | | | | | 3.17 | | | | | | | | | | 162 | |
One month ended 10/31/19 | | | | 5.41 | | | | | | | | | | 0.02 | | | | | | | | | | 0.12 | | | | | | | | | | 0.14 | | | | | | | | | | – | | | | | | | | | | (0.02 | ) | | | | | | | | | (0.02 | ) | | | | | | | | | 5.53 | | | | | | | | | | 2.60 | | | | | | | | | | 1,043,265 | | | | | | | | | | 1.01 | (f) | | | | | | | | | 1.03 | (f) | | | | | | | | | 4.60 | (f) | | | | | | | | | 7 | |
Year ended 09/30/19 | | | | 5.47 | | | | | | | | | | 0.28 | | | | | | | | | | (0.06 | ) | | | | | | | | | 0.22 | | | | | | | | | | – | | | | | | | | | | (0.28 | ) | | | | | | | | | (0.28 | ) | | | | | | | | | 5.41 | | | | | | | | | | 4.15 | | | | | | | | | | 1,039,683 | | | | | | | | | | 0.99 | | | | | | | | | | 1.02 | | | | | | | | | | 5.15 | | | | | | | | | | 105 | |
Year ended 09/30/18 | | | | 5.95 | | | | | | | | | | 0.25 | | | | | | | | | | (0.48 | ) | | | | | | | | | (0.23 | ) | | | | | | | | | (0.13 | ) | | | | | | | | | (0.12 | ) | | | | | | | | | (0.25 | ) | | | | | | | | | 5.47 | | | | | | | | | | (4.20 | ) | | | | | | | | | 1,082,539 | | | | | | | | | | 0.99 | | | | | | | | | | 1.01 | | | | | | | | | | 4.31 | | | | | | | | | | 115 | |
Class C | | | | | | | | | | | | | | | | | | | | | | | | | | | | | | | | | | | | | | | | | | | | | | | | | | | | | | | | | | | | | | | | | | | | | | | | | | | | | | | | | | | | | | | | | | | | | | | | | | | | | | | | | | | | | | | | | | | | | | | | | | | | | | | | | | | | | | | |
Year ended 10/31/22 | | | | 5.06 | | | | | | | | | | 0.11 | | | | | | | | | | (1.12 | ) | | | | | | | | | (1.01 | ) | | | | | | | | | – | | | | | | | | | | (0.11 | ) | | | | | | | | | (0.11 | ) | | | | | | | | | 3.94 | | | | | | | | | | (20.21 | ) | | | | | | | | | 17,454 | | | | | | | | | | 1.91 | (e) | | | | | | | | | 1.93 | (e) | | | | | | | | | 2.46 | (e) | | | | | | | | | 90 | |
Year ended 10/31/21 | | | | 5.39 | | | | | | | | | | 0.11 | | | | | | | | | | (0.33 | ) | | | | | | | | | (0.22 | ) | | | | | | | | | – | | | | | | | | | | (0.11 | ) | | | | | | | | | (0.11 | ) | | | | | | | | | 5.06 | | | | | | | | | | (4.29 | ) | | | | | | | | | 30,414 | | | | | | | | | | 1.76 | | | | | | | | | | 1.82 | | | | | | | | | | 1.98 | | | | | | | | | | 197 | |
Year ended 10/31/20 | | | | 5.51 | | | | | | | | | | 0.13 | | | | | | | | | | (0.10 | ) | | | | | | | | | 0.03 | | | | | | | | | | (0.09 | ) | | | | | | | | | (0.06 | ) | | | | | | | | | (0.15 | ) | | | | | | | | | 5.39 | | | | | | | | | | 0.58 | | | | | | | | | | 64,440 | | | | | | | | | | 1.75 | | | | | | | | | | 1.79 | | | | | | | | | | 2.42 | | | | | | | | | | 162 | |
One month ended 10/31/19 | | | | 5.39 | | | | | | | | | | 0.02 | | | | | | | | | | 0.12 | | | | | | | | | | 0.14 | | | | | | | | | | – | | | | | | | | | | (0.02 | ) | | | | | | | | | (0.02 | ) | | | | | | | | | 5.51 | | | | | | | | | | 2.55 | | | | | | | | | | 113,329 | | | | | | | | | | 1.77 | (f) | | | | | | | | | 1.79 | (f) | | | | | | | | | 3.84 | (f) | | | | | | | | | 7 | |
Year ended 09/30/19 | | | | 5.45 | | | | | | | | | | 0.24 | | | | | | | | | | (0.06 | ) | | | | | | | | | 0.18 | | | | | | | | | | – | | | | | | | | | | (0.24 | ) | | | | | | | | | (0.24 | ) | | | | | | | | | 5.39 | | | | | | | | | | 3.36 | | | | | | | | | | 116,134 | | | | | | | | | | 1.74 | | | | | | | | | | 1.77 | | | | | | | | | | 4.39 | | | | | | | | | | 105 | |
Year ended 09/30/18 | | | | 5.93 | | | | | | | | | | 0.21 | | | | | | | | | | (0.48 | ) | | | | | | | | | (0.27 | ) | | | | | | | | | (0.11 | ) | | | | | | | | | (0.10 | ) | | | | | | | | | (0.21 | ) | | | | | | | | | 5.45 | | | | | | | | | | (4.79 | ) | | | | | | | | | 291,793 | | | | | | | | | | 1.74 | | | | | | | | | | 1.76 | | | | | | | | | | 3.56 | | | | | | | | | | 115 | |
Class R | | | | | | | | | | | | | | | | | | | | | | | | | | | | | | | | | | | | | | | | | | | | | | | | | | | | | | | | | | | | | | | | | | | | | | | | | | | | | | | | | | | | | | | | | | | | | | | | | | | | | | | | | | | | | | | | | | | | | | | | | | | | | | | | | | | | | | | |
Year ended 10/31/22 | | | | 5.06 | | | | | | | | | | 0.14 | | | | | | | | | | (1.12 | ) | | | | | | | | | (0.98 | ) | | | | | | | | | – | | | | | | | | | | (0.13 | ) | | | | | | | | | (0.13 | ) | | | | | | | | | 3.95 | | | | | | | | | | (19.59 | ) | | | | | | | | | 40,962 | | | | | | | | | | 1.41 | (e) | | | | | | | | | 1.43 | (e) | | | | | | | | | 2.96 | (e) | | | | | | | | | 90 | |
Year ended 10/31/21 | | | | 5.39 | | | | | | | | | | 0.14 | | | | | | | | | | (0.34 | ) | | | | | | | | | (0.20 | ) | | | | | | | | | – | | | | | | | | | | (0.13 | ) | | | | | | | | | (0.13 | ) | | | | | | | | | 5.06 | | | | | | | | | | (3.80 | ) | | | | | | | | | 60,913 | | | | | | | | | | 1.26 | | | | | | | | | | 1.32 | | | | | | | | | | 2.48 | | | | | | | | | | 197 | |
Year ended 10/31/20 | | | | 5.51 | | | | | | | | | | 0.15 | | | | | | | | | | (0.10 | ) | | | | | | | | | 0.05 | | | | | | | | | | (0.10 | ) | | | | | | | | | (0.07 | ) | | | | | | | | | (0.17 | ) | | | | | | | | | 5.39 | | | | | | | | | | 1.09 | | | | | | | | | | 79,763 | | | | | | | | | | 1.25 | | | | | | | | | | 1.29 | | | | | | | | | | 2.92 | | | | | | | | | | 162 | |
One month ended 10/31/19 | | | | 5.39 | | | | | | | | | | 0.02 | | | | | | | | | | 0.12 | | | | | | | | | | 0.14 | | | | | | | | | | – | | | | | | | | | | (0.02 | ) | | | | | | | | | (0.02 | ) | | | | | | | | | 5.51 | | | | | | | | | | 2.59 | | | | | | | | | | 99,080 | | | | | | | | | | 1.27 | (f) | | | | | | | | | 1.29 | (f) | | | | | | | | | 4.34 | (f) | | | | | | | | | 7 | |
Year ended 09/30/19 | | | | 5.45 | | | | | | | | | | 0.27 | | | | | | | | | | (0.06 | ) | | | | | | | | | 0.21 | | | | | | | | | | – | | | | | | | | | | (0.27 | ) | | | | | | | | | (0.27 | ) | | | | | | | | | 5.39 | | | | | | | | | | 3.88 | | | | | | | | | | 98,380 | | | | | | | | | | 1.24 | | | | | | | | | | 1.27 | | | | | | | | | | 4.90 | | | | | | | | | | 105 | |
Year ended 09/30/18 | | | | 5.93 | | | | | | | | | | 0.24 | | | | | | | | | | (0.49 | ) | | | | | | | | | (0.25 | ) | | | | | | | | | (0.12 | ) | | | | | | | | | (0.11 | ) | | | | | | | | | (0.23 | ) | | | | | | | | | 5.45 | | | | | | | | | | (4.47 | ) | | | | | | | | | 117,668 | | | | | | | | | | 1.23 | | | | | | | | | | 1.25 | | | | | | | | | | 4.06 | | | | | | | | | | 115 | |
Class Y | | | | | | | | | | | | | | | | | | | | | | | | | | | | | | | | | | | | | | | | | | | | | | | | | | | | | | | | | | | | | | | | | | | | | | | | | | | | | | | | | | | | | | | | | | | | | | | | | | | | | | | | | | | | | | | | | | | | | | | | | | | | | | | | | | | | | | | |
Year ended 10/31/22 | | | | 5.08 | | | | | | | | | | 0.16 | | | | | | | | | | (1.12 | ) | | | | | | | | | (0.96 | ) | | | | | | | | | – | | | | | | | | | | (0.16 | ) | | | | | | | | | (0.16 | ) | | | | | | | | | 3.96 | | | | | | | | | | (19.28 | ) | | | | | | | | | 497,025 | | | | | | | | | | 0.91 | (e) | | | | | | | | | 0.93 | (e) | | | | | | | | | 3.46 | (e) | | | | | | | | | 90 | |
Year ended 10/31/21 | | | | 5.40 | | | | | | | | | | 0.16 | | | | | | | | | | (0.32 | ) | | | | | | | | | (0.16 | ) | | | | | | | | | – | | | | | | | | | | (0.16 | ) | | | | | | | | | (0.16 | ) | | | | | | | | | 5.08 | | | | | | | | | | (3.11 | ) | | | | | | | | | 936,624 | | | | | | | | | | 0.76 | | | | | | | | | | 0.82 | | | | | | | | | | 2.98 | | | | | | | | | | 197 | |
Year ended 10/31/20 | | | | 5.53 | | | | | | | | | | 0.18 | | | | | | | | | | (0.11 | ) | | | | | | | | | 0.07 | | | | | | | | | | (0.12 | ) | | | | | | | | | (0.08 | ) | | | | | | | | | (0.20 | ) | | | | | | | | | 5.40 | | | | | | | | | | 1.41 | | | | | | | | | | 1,105,508 | | | | | | | | | | 0.75 | | | | | | | | | | 0.79 | | | | | | | | | | 3.42 | | | | | | | | | | 162 | |
One month ended 10/31/19 | | | | 5.41 | | | | | | | | | | 0.02 | | | | | | | | | | 0.12 | | | | | | | | | | 0.14 | | | | | | | | | | – | | | | | | | | | | (0.02 | ) | | | | | | | | | (0.02 | ) | | | | | | | | | 5.53 | | | | | | | | | | 2.62 | | | | | | | | | | 1,623,640 | | | | | | | | | | 0.77 | (f) | | | | | | | | | 0.79 | (f) | | | | | | | | | 4.84 | (f) | | | | | | | | | 7 | |
Year ended 09/30/19 | | | | 5.47 | | | | | | | | | | 0.29 | | | | | | | | | | (0.05 | ) | | | | | | | | | 0.24 | | | | | | | | | | – | | | | | | | | | | (0.30 | ) | | | | | | | | | (0.30 | ) | | | | | | | | | 5.41 | | | | | | | | | | 4.40 | | | | | | | | | | 1,611,797 | | | | | | | | | | 0.74 | | | | | | | | | | 0.77 | | | | | | | | | | 5.39 | | | | | | | | | | 105 | |
Year ended 09/30/18 | | | | 5.95 | | | | | | | | | | 0.26 | | | | | | | | | | (0.48 | ) | | | | | | | | | (0.22 | ) | | | | | | | | | (0.14 | ) | | | | | | | | | (0.12 | ) | | | | | | | | | (0.26 | ) | | | | | | | | | 5.47 | | | | | | | | | | (3.80 | ) | | | | | | | | | 2,597,821 | | | | | | | | | | 0.74 | | | | | | | | | | 0.76 | | | | | | | | | | 4.56 | | | | | | | | | | 115 | |
Class R5 | | | | | | | | | | | | | | | | | | | | | | | | | | | | | | | | | | | | | | | | | | | | | | | | | | | | | | | | | | | | | | | | | | | | | | | | | | | | | | | | | | | | | | | | | | | | | | | | | | | | | | | | | | | | | | | | | | | | | | | | | | | | | | | | | | | | | | | |
Year ended 10/31/22 | | | | 5.08 | | | | | | | | | | 0.15 | | | | | | | | | | (1.11 | ) | | | | | | | | | (0.96 | ) | | | | | | | | | – | | | | | | | | | | (0.16 | ) | | | | | | | | | (0.16 | ) | | | | | | | | | 3.96 | | | | | | | | | | (19.23 | ) | | | | | | | | | 964 | | | | | | | | | | 0.84 | (e) | | | | | | | | | 0.84 | (e) | | | | | | | | | 3.53 | (e) | | | | | | | | | 90 | |
Year ended 10/31/21 | | | | 5.41 | | | | | | | | | | 0.16 | | | | | | | | | | (0.32 | ) | | | | | | | | | (0.16 | ) | | | | | | | | | – | | | | | | | | | | (0.17 | ) | | | | | | | | | (0.17 | ) | | | | | | | | | 5.08 | | | | | | | | | | (3.16 | ) | | | | | | | | | 70 | | | | | | | | | | 0.64 | | | | | | | | | | 0.64 | | | | | | | | | | 3.10 | | | | | | | | | | 197 | |
Year ended 10/31/20 | | | | 5.53 | | | | | | | | | | 0.19 | | | | | | | | | | (0.11 | ) | | | | | | | | | 0.08 | | | | | | | | | | (0.12 | ) | | | | | | | | | (0.08 | ) | | | | | | | | | (0.20 | ) | | | | | | | | | 5.41 | | | | | | | | | | 1.71 | | | | | | | | | | 10 | | | | | | | | | | 0.61 | | | | | | | | | | 0.62 | | | | | | | | | | 3.56 | | | | | | | | | | 162 | |
One month ended 10/31/19 | | | | 5.41 | | | | | | | | | | 0.02 | | | | | | | | | | 0.12 | | | | | | | | | | 0.14 | | | | | | | | | | – | | | | | | | | | | (0.02 | ) | | | | | | | | | (0.02 | ) | | | | | | | | | 5.53 | | | | | | | | | | 2.62 | | | | | | | | | | 10 | | | | | | | | | | 0.68 | (f) | | | | | | | | | 0.68 | (f) | | | | | | | | | 4.93 | (f) | | | | | | | | | 7 | |
Period ended 09/30/19(g) | | | | 5.41 | | | | | | | | | | 0.11 | | | | | | | | | | (0.01 | ) | | | | | | | | | 0.10 | | | | | | | | | | – | | | | | | | | | | (0.10 | ) | | | | | | | | | (0.10 | ) | | | | | | | | | 5.41 | | | | | | | | | | 1.74 | | | | | | | | | | 10 | | | | | | | | | | 0.65 | (f) | | | | | | | | | 0.67 | (f) | | | | | | | | | 5.48 | (f) | | | | | | | | | 105 | |
Class R6 | | | | | | | | | | | | | | | | | | | | | | | | | | | | | | | | | | | | | | | | | | | | | | | | | | | | | | | | | | | | | | | | | | | | | | | | | | | | | | | | | | | | | | | | | | | | | | | | | | | | | | | | | | | | | | | | | | | | | | | | | | | | | | | | | | | | | | | |
Year ended 10/31/22 | | | | 5.07 | | | | | | | | | | 0.17 | | | | | | | | | | (1.13 | ) | | | | | | | | | (0.96 | ) | | | | | | | | | – | | | | | | | | | | (0.16 | ) | | | | | | | | | (0.16 | ) | | | | | | | | | 3.95 | | | | | | | | | | (19.25 | ) | | | | | | | | | 284,792 | | | | | | | | | | 0.78 | (e) | | | | | | | | | 0.78 | (e) | | | | | | | | | 3.59 | (e) | | | | | | | | | 90 | |
Year ended 10/31/21 | | | | 5.40 | | | | | | | | | | 0.17 | | | | | | | | | | (0.33 | ) | | | | | | | | | (0.16 | ) | | | | | | | | | – | | | | | | | | | | (0.17 | ) | | | | | | | | | (0.17 | ) | | | | | | | | | 5.07 | | | | | | | | | | (3.17 | ) | | | | | | | | | 469,683 | | | | | | | | | | 0.64 | | | | | | | | | | 0.65 | | | | | | | | | | 3.10 | | | | | | | | | | 197 | |
Year ended 10/31/20 | | | | 5.52 | | | | | | | | | | 0.19 | | | | | | | | | | (0.10 | ) | | | | | | | | | 0.09 | | | | | | | | | | (0.13 | ) | | | | | | | | | (0.08 | ) | | | | | | | | | (0.21 | ) | | | | | | | | | 5.40 | | | | | | | | | | 1.75 | | | | | | | | | | 574,695 | | | | | | | | | | 0.61 | | | | | | | | | | 0.62 | | | | | | | | | | 3.56 | | | | | | | | | | 162 | |
One month ended 10/31/19 | | | | 5.40 | | | | | | | | | | 0.02 | | | | | | | | | | 0.12 | | | | | | | | | | 0.14 | | | | | | | | | | – | | | | | | | | | | (0.02 | ) | | | | | | | | | (0.02 | ) | | | | | | | | | 5.52 | | | | | | | | | | 2.64 | | | | | | | | | | 878,616 | | | | | | | | | | 0.60 | (f) | | | | | | | | | 0.62 | (f) | | | | | | | | | 5.01 | (f) | | | | | | | | | 7 | |
Year ended 09/30/19 | | | | 5.46 | | | | | | | | | | 0.30 | | | | | | | | | | (0.06 | ) | | | | | | | | | 0.24 | | | | | | | | | | – | | | | | | | | | | (0.30 | ) | | | | | | | | | (0.30 | ) | | | | | | | | | 5.40 | | | | | | | | | | 4.55 | | | | | | | | | | 857,498 | | | | | | | | | | 0.60 | | | | | | | | | | 0.62 | | | | | | | | | | 5.53 | | | | | | | | | | 105 | |
Year ended 09/30/18 | | | | 5.94 | | | | | | | | | | 0.27 | | | | | | | | | | (0.48 | ) | | | | | | | | | (0.21 | ) | | | | | | | | | (0.14 | ) | | | | | | | | | (0.13 | ) | | | | | | | | | (0.27 | ) | | | | | | | | | 5.46 | | | | | | | | | | (3.83 | ) | | | | | | | | | 1,404,290 | | | | | | | | | | 0.58 | | | | | | | | | | 0.60 | | | | | | | | | | 4.71 | | | | | | | | | | 115 | |
| (a) | Calculated using average shares outstanding. |
| (b) | Includes adjustments in accordance with accounting principles generally accepted in the United States of America and as such, the net asset value for financial reporting purposes and the returns based upon those net asset values may differ from the net asset value and returns for shareholder transactions. Does not include sales charges and is not annualized for periods less than one year, if applicable. |
| (c) | Does not include estimated acquired fund fees from underlying funds of 0.01%, 0.01% and 0.01% for the one month ended October 31, 2019 and the years ended September 30, 2019 and 2018 respectively. |
| (d) | Portfolio turnover is calculated at the fund level and is not annualized for periods less than one year, if applicable. |
| (e) | Ratios include interest, facilities and maintenance fees of 0.15% for the year ended October 31, 2022. |
| (g) | Commencement date after the close of business on May 24, 2019. |
See accompanying Notes to Consolidated Financial Statements which are an integral part of the financial statements.
| | |
| 28 | | Invesco International Bond Fund |
Notes to Consolidated Financial Statements
October 31, 2022
NOTE 1–Significant Accounting Policies
Invesco International Bond Fund (the “Fund”) is a series portfolio of AIM Investment Funds (Invesco Investment Funds) (the “Trust”). The Trust is organized as a Delaware statutory trust and is registered under the Investment Company Act of 1940, as amended (the “1940 Act”), as an open-end series management investment company authorized to issue an unlimited number of shares of beneficial interest. Information presented in these consolidated financial statements pertains only to the Fund and the Invesco International Bond Fund (Cayman) Ltd. (the “Subsidiary”), a wholly-owned and controlled subsidiary by the Fund organized under the laws of the Cayman Islands. Matters affecting the Fund or each class will be voted on exclusively by the shareholders of the Fund or each class.
The Fund will seek to gain exposure to Regulation S securities primarily through investments in the Susbsidiary. The Subsidiary was organized by the Fund to invest in Regulation S securities. The Fund may invest up to 25% of its total assets in the Subsidiary.
The Fund’s investment objective is total return.
The Fund currently consists of six different classes of shares: Class A, Class C, Class R, Class Y, Class R5 and Class R6. Class Y shares are available only to certain investors. Class A shares are sold with a front-end sales charge unless certain waiver criteria are met. Under certain circumstances, load waived shares may be subject to contingent deferred sales charges (“CDSC”). Class C shares are sold with a CDSC. Class R, Class Y, Class R5 and Class R6 shares are sold at net asset value. Class C shares held for eight years after purchase are eligible for automatic conversion into Class A shares of the same Fund (the “Conversion Feature”). The automatic conversion pursuant to the Conversion Feature will generally occur at the end of the month following the eighth anniversary after a purchase of Class C shares.
The Fund is an investment company and accordingly follows the investment company accounting and reporting guidance in accordance with Financial Accounting Standards Board Accounting Standards Codification Topic 946, Financial Services - Investment Companies.
The following is a summary of the significant accounting policies followed by the Fund in the preparation of its consolidated financial statements.
| A. | Security Valuations - Securities, including restricted securities, are valued according to the following policy. |
Fixed income securities (including convertible debt securities) generally are valued on the basis of prices provided by independent pricing services. Prices provided by the pricing service may be determined without exclusive reliance on quoted prices, and may reflect appropriate factors such as institution-size trading in similar groups of securities, developments related to specific securities, dividend rate (for unlisted equities), yield (for debt obligations), quality, type of issue, coupon rate (for debt obligations), maturity (for debt obligations), individual trading characteristics and other market data. Pricing services generally value debt obligations assuming orderly transactions of institutional round lot size, but a fund may hold or transact in the same securities in smaller, odd lot sizes. Odd lots often trade at lower prices than institutional round lots, and their value may be adjusted accordingly. Debt obligations are subject to interest rate and credit risks. In addition, all debt obligations involve some risk of default with respect to interest and/or principal payments.
A security listed or traded on an exchange is generally valued at its trade price or official closing price that day as of the close of the exchange where the security is principally traded, or lacking any trades or official closing price on a particular day, the security may be valued at the closing bid price on that day. Securities traded in the over-the-counter market are valued based on prices furnished by independent pricing services or market makers. When such securities are valued using prices provided by an independent pricing service they may be considered fair valued. Futures contracts are valued at the daily settlement price set by an exchange on which they are principally traded. U.S. exchange-traded options are valued at the mean between the last bid and asked prices from the exchange on which they are principally traded. Non-U.S. exchange-traded options are valued at the final settlement price set by the exchange on which they trade. Options not listed on an exchange and swaps generally are valued using pricing provided from independent pricing services.
Securities of investment companies that are not exchange-traded (e.g., open-end mutual funds) are valued using such company’s end-of-business-day net asset value per share.
Deposits, other obligations of U.S. and non-U.S. banks and financial institutions are valued at their daily account value.
Swap agreements are fair valued using an evaluated quote, if available, provided by an independent pricing service. Evaluated quotes provided by the pricing service are valued based on a model which may include end-of-day net present values, spreads, ratings, industry, company performance and returns of referenced assets. Centrally cleared swap agreements are valued at the daily settlement price determined by the relevant exchange or clearinghouse.
Foreign securities’ (including foreign exchange contracts) prices are converted into U.S. dollar amounts using the applicable exchange rates as of the close of the New York Stock Exchange (“NYSE”). If market quotations are available and reliable for foreign exchange-traded equity securities, the securities will be valued at the market quotations. Invesco Advisers, Inc. (the “Adviser” or “Invesco”) may use various pricing services to obtain market quotations as well as fair value prices. Because trading hours for certain foreign securities end before the close of the NYSE, closing market quotations may become not representative of market value in the Adviser’s judgment (“unreliable”). If, between the time trading ends on a particular security and the close of the customary trading session on the NYSE, a significant event occurs that makes the closing price of the security unreliable, the Adviser may fair value the security. If the event is likely to have affected the closing price of the security, the security will be valued at fair value in good faith in accordance with Board- approved policies and related Adviser procedures (“Valuation Procedures”). Adjustments to closing prices to reflect fair value may also be based on a screening process of an independent pricing service to indicate the degree of certainty, based on historical data, that the closing price in the principal market where a foreign security trades is not the current value as of the close of the NYSE. Foreign securities’ prices meeting the degree of certainty that the price is not reflective of current value will be priced at the indication of fair value from the independent pricing service. Multiple factors may be considered by the independent pricing service in determining adjustments to reflect fair value and may include information relating to sector indices, American Depositary Receipts and domestic and foreign index futures. Foreign securities may have additional risks including exchange rate changes, potential for sharply devalued currencies and high inflation, political and economic upheaval, the relative lack of issuer information, relatively low market liquidity and the potential lack of strict financial and accounting controls and standards.
Unlisted securities will be valued using prices provided by independent pricing services or by another method that the Adviser, in its judgment, believes better reflects the security’s fair value in accordance with the Valuation Procedures.
Securities for which market prices are not provided by any of the above methods may be valued based upon quotes furnished by independent sources. The last bid price may be used to value equity securities. The mean between the last bid and asked prices may be used to value debt obligations, including corporate loans.
Securities for which market quotations are not readily available are fair valued by the Adviser in accordance with the Valuation Procedures. If a fair value price provided by a pricing service is unreliable, the Adviser will fair value the security using the Valuation Procedures. Issuer specific events, market trends, bid/asked quotes of brokers and information providers and other market data may be reviewed in the course of making a good faith determination of a security’s fair value.
The Fund may invest in securities that are subject to interest rate risk, meaning the risk that the prices will generally fall as interest rates rise and, conversely, the prices will generally rise as interest rates fall. Specific securities differ in their sensitivity to changes in interest rates depending on their individual characteristics. Changes in interest rates may result in increased market volatility, which may affect the value and/or liquidity of certain Fund investments.
Valuations change in response to many factors including the historical and prospective earnings of the issuer, the value of the issuer’s assets, general market conditions which are not specifically related to the particular issuer, such as real or perceived adverse economic conditions, changes in the general outlook for revenues or corporate earnings, changes in interest or currency rates, regional or global instability, natural or environmental disasters, widespread disease or other public health issues, war, acts of terrorism, significant governmental actions or adverse investor sentiment generally and market liquidity. Because of the inherent uncertainties of valuation, the values reflected in the financial statements may materially differ from the value received upon actual sale of those investments.
| | |
| 29 | | Invesco International Bond Fund |
The price the Fund could receive upon the sale of any investment may differ from the Adviser’s valuation of the investment, particularly for securities that are valued using a fair valuation technique. When fair valuation techniques are applied, the Adviser uses available information, including both observable and unobservable inputs and assumptions, to determine a methodology that will result in a valuation that the Adviser believes approximates market value. Fund securities that are fair valued may be subject to greater fluctuation in their value from one day to the next than would be the case if market quotations were used. Because of the inherent uncertainties of valuation, and the degree of subjectivity in such decisions, the Fund could realize a greater or lesser than expected gain or loss upon the sale of the investment.
| B. | Securities Transactions and Investment Income - Securities transactions are accounted for on a trade date basis. Realized gains or losses on sales are computed on the basis of specific identification of the securities sold. Interest income (net of withholding tax, if any) is recorded on an accrual basis from settlement date and includes coupon interest and amortization of premium and accretion of discount on debt securities as applicable. Pay-in-kind interest income and non-cash dividend income received in the form of securities in-lieu of cash are recorded at the fair value of the securities received. Paydown gains and losses on mortgage and asset-backed securities are recorded as adjustments to interest income. Dividend income (net of withholding tax, if any) is recorded on the ex-dividend date. |
The Fund may periodically participate in litigation related to Fund investments. As such, the Fund may receive proceeds from litigation settlements. Any proceeds received are included in the Consolidated Statement of Operations as realized gain (loss) for investments no longer held and as unrealized gain (loss) for investments still held.
Brokerage commissions and mark ups are considered transaction costs and are recorded as an increase to the cost basis of securities purchased and/or a reduction of proceeds on a sale of securities. Such transaction costs are included in the determination of net realized and unrealized gain (loss) from investment securities reported in the Consolidated Statement of Operations and the Consolidated Statement of Changes in Net Assets and the net realized and unrealized gains (losses) on securities per share in the Consolidated Financial Highlights. Transaction costs are included in the calculation of the Fund’s net asset value and, accordingly, they reduce the Fund’s total returns. These transaction costs are not considered operating expenses and are not reflected in net investment income reported in the Consolidated Statement of Operations and the Consolidated Statement of Changes in Net Assets, or the net investment income per share and the ratios of expenses and net investment income reported in the Consolidated Financial Highlights, nor are they limited by any expense limitation arrangements between the Fund and the investment adviser.
The Fund allocates income and realized and unrealized capital gains and losses to a class based on the relative net assets of each class.
| C. | Country Determination - For the purposes of making investment selection decisions and presentation in the Schedule of Investments, the investment adviser may determine the country in which an issuer is located and/or credit risk exposure based on various factors. These factors include the laws of the country under which the issuer is organized, where the issuer maintains a principal office, the country in which the issuer derives 50% or more of its total revenues, the country that has the primary market for the issuer’s securities and its “country of risk” as determined by a third party service provider, as well as other criteria. Among the other criteria that may be evaluated for making this determination are the country in which the issuer maintains 50% or more of its assets, the type of security, financial guarantees and enhancements, the nature of the collateral and the sponsor organization. Country of issuer and/or credit risk exposure has been determined to be the United States of America, unless otherwise noted. |
| D. | Distributions - Distributions from net investment income, if any, are declared and paid monthly. Distributions from net realized capital gain, if any, are generally declared and paid annually and recorded on the ex-dividend date. The Fund may elect to treat a portion of the proceeds from redemptions as distributions for federal income tax purposes. |
| E. | Federal Income Taxes - The Fund intends to comply with the requirements of Subchapter M of the Internal Revenue Code of 1986, as amended (the “Internal Revenue Code”), necessary to qualify as a regulated investment company and to distribute substantially all of the Fund’s taxable earnings to shareholders. As such, the Fund will not be subject to federal income taxes on otherwise taxable income (including net realized capital gain) that is distributed to shareholders. Therefore, no provision for federal income taxes is recorded in the consolidated financial statements. |
The Fund recognizes the tax benefits of uncertain tax positions only when the position is more likely than not to be sustained. Management has analyzed the Fund’s uncertain tax positions and concluded that no liability for unrecognized tax benefits should be recorded related to uncertain tax positions. Management is not aware of any tax positions for which it is reasonably possible that the total amounts of unrecognized tax benefits will change materially in the next 12 months.
The Fund files tax returns in the U.S. Federal jurisdiction and certain other jurisdictions. Generally, the Fund is subject to examinations by such taxing authorities for up to three years after the filing of the return for the tax period.
| F. | Expenses - Fees provided for under the Rule 12b-1 plan of a particular class of the Fund are charged to the operations of such class. Transfer agency fees and expenses and other shareholder recordkeeping fees and expenses attributable to Class R5 and Class R6 are allocated based on relative net assets of Class R5 and Class R6. Sub-accounting fees attributable to Class R5 are charged to the operations of the class. Transfer agency fees and expenses and other shareholder recordkeeping fees and expenses relating to all other classes are allocated among those classes based on relative net assets. All other expenses are allocated among the classes based on relative net assets. |
| G. | Interest, Facilities and Maintenance Fees - Interest, Facilities and Maintenance Fees include interest and related borrowing costs such as commitment fees, administrative expenses, negative or overdrawn balances on margin accounts, and other expenses associated with establishing and maintaining a line of credit. |
| H. | Accounting Estimates - The preparation of financial statements in conformity with accounting principles generally accepted in the United States of America (“GAAP”) requires management to make estimates and assumptions that affect the reported amounts of assets and liabilities at the date of the financial statements and the reported amounts of revenues and expenses during the reporting period including estimates and assumptions related to taxation. Actual results could differ from those estimates by a significant amount. In addition, the Fund monitors for material events or transactions that may occur or become known after the period-end date and before the date the consolidated financial statements are released to print. |
| I. | Indemnifications - Under the Trust’s organizational documents, each Trustee, officer, employee or other agent of the Trust is indemnified against certain liabilities that may arise out of the performance of their duties to the Fund. Additionally, in the normal course of business, the Fund enters into contracts, including the Fund’s servicing agreements, that contain a variety of indemnification clauses. The Fund’s maximum exposure under these arrangements is unknown as this would involve future claims that may be made against the Fund that have not yet occurred. The risk of material loss as a result of such indemnification claims is considered remote. |
| J. | Treasury Inflation-Protected Securities - The Fund may invest in Treasury Inflation-Protected Securities (“TIPS”). TIPS are fixed income securities whose principal value is periodically adjusted to the rate of inflation. The principal value of TIPS will be adjusted upward or downward, and any increase or decrease in the principal amount of TIPS will be included as interest income in the Consolidated Statement of Operations, even though investors do not receive their principal until maturity. |
| K. | Structured Securities - The Fund may invest in structured securities. Structured securities are a type of derivative security whose value is determined by reference to changes in the value of underlying securities, currencies, interest rates, commodities, indices or other financial indicators (“reference instruments”). Most structured securities are fixed-income securities that have maturities of three years or less. Structured securities may be positively or negatively indexed (i.e., their principal value or interest rates may increase or decrease if the underlying reference instrument appreciates) and may have return characteristics similar to direct investments in the underlying reference instrument. |
Structured securities may entail a greater degree of market risk than other types of debt securities because the investor bears the risk of the reference instruments. In addition to the credit risk of structured securities and the normal risks of price changes in response to changes in interest rates, the principal
| | |
| 30 | | Invesco International Bond Fund |
amount of structured notes or indexed securities may decrease as a result of changes in the value of the underlying reference instruments. Changes in the daily value of structured securities are recorded as unrealized gains (losses) in the Consolidated Statement of Operations. When the structured securities mature or are sold, the Fund recognizes a realized gain (loss) on the Consolidated Statement of Operations.
| L. | Securities Lending - The Fund may lend portfolio securities having a market value up to one-third of the Fund’s total assets. Such loans are secured by collateral equal to no less than the market value of the loaned securities determined daily by the securities lending provider. Such collateral will be cash or debt securities issued or guaranteed by the U.S. Government or any of its sponsored agencies. Cash collateral received in connection with these loans is invested in short-term money market instruments or affiliated, unregistered investment companies that comply with Rule 2a-7 under the 1940 Act and money market funds (collectively, “affiliated money market funds”) and is shown as such on the Consolidated Schedule of Investments. The Fund bears the risk of loss with respect to the investment of collateral. It is the Fund’s policy to obtain additional collateral from or return excess collateral to the borrower by the end of the next business day, following the valuation date of the securities loaned. Therefore, the value of the collateral held may be temporarily less than the value of the securities on loan. When loaning securities, the Fund retains certain benefits of owning the securities, including the economic equivalent of dividends or interest generated by the security. Lending securities entails a risk of loss to the Fund if, and to the extent that, the market value of the securities loaned were to increase and the borrower did not increase the collateral accordingly, and the borrower failed to return the securities. The securities loaned are subject to termination at the option of the borrower or the Fund. Upon termination, the borrower will return to the Fund the securities loaned and the Fund will return the collateral. Upon the failure of the borrower to return the securities, collateral may be liquidated and the securities may be purchased on the open market to replace the loaned securities. The Fund could experience delays and costs in gaining access to the collateral and the securities may lose value during the delay which could result in potential losses to the Fund. Some of these losses may be indemnified by the lending agent. The Fund bears the risk of any deficiency in the amount of the collateral available for return to the borrower due to any loss on the collateral invested. Dividends received on cash collateral investments for securities lending transactions, which are net of compensation to counterparties, are included in Dividends from affiliated money market funds on the Consolidated Statement of Operations. The aggregate value of securities out on loan, if any, is shown as a footnote on the Consolidated Statement of Assets and Liabilities. |
The Adviser serves as an affiliated securities lending agent for the Fund. The Bank of New York Mellon also serves as a lending agent. To the extent the Fund utilizes the Adviser as an affiliated securities lending agent, the Fund conducts its securities lending in accordance with, and in reliance upon, no-action letters issued by the SEC staff that provide guidance on how an affiliate may act as a direct agent lender and receive compensation for those services in a manner consistent with the federal securities laws. For the year ended October 31, 2022, Fees paid to the Adviser for securities lending agent services are included in Dividends from affiliated money market funds on the Consolidated Statement of Operations.
| M. | Foreign Currency Translations - Foreign currency is valued at the close of the NYSE based on quotations posted by banks and major currency dealers. Portfolio securities and other assets and liabilities denominated in foreign currencies are translated into U.S. dollar amounts at the date of valuation. Purchases and sales of portfolio securities (net of foreign taxes withheld on disposition) and income items denominated in foreign currencies are translated into U.S. dollar amounts on the respective dates of such transactions. The Fund does not separately account for the portion of the results of operations resulting from changes in foreign exchange rates on investments and the fluctuations arising from changes in market prices of securities held. The combined results of changes in foreign exchange rates and the fluctuation of market prices on investments (net of estimated foreign tax withholding) are included with the net realized and unrealized gain or loss from investments in the Consolidated Statement of Operations. Reported net realized foreign currency gains or losses arise from (1) sales of foreign currencies, (2) currency gains or losses realized between the trade and settlement dates on securities transactions, and (3) the difference between the amounts of dividends, interest, and foreign withholding taxes recorded on the Fund’s books and the U.S. dollar equivalent of the amounts actually received or paid. Net unrealized foreign currency gains and losses arise from changes in the fair values of assets and liabilities, other than investments in securities at fiscal period end, resulting from changes in exchange rates. |
The Fund may invest in foreign securities, which may be subject to foreign taxes on income, gains on investments or currency repatriation, a portion of which may be recoverable. Foreign taxes, if any, are recorded based on the tax regulations and rates that exist in the foreign markets in which the Fund invests and are shown in the Consolidated Statement of Operations.
| N. | Forward Foreign Currency Contracts - The Fund may engage in foreign currency transactions either on a spot (i.e. for prompt delivery and settlement) basis, or through forward foreign currency contracts, to manage or minimize currency or exchange rate risk. |
The Fund may also enter into forward foreign currency contracts for the purchase or sale of a security denominated in a foreign currency in order to “lock in” the U.S. dollar price of that security, or the Fund may also enter into forward foreign currency contracts that do not provide for physical exchange of the two currencies on the settlement date, but instead are settled by a single cash payment calculated as the difference between the agreed upon exchange rate and the spot rate at settlement based upon an agreed upon notional amount (non-deliverable forwards).
A forward foreign currency contract is an obligation between two parties (“Counterparties”) to purchase or sell a specific currency for an agreed-upon price at a future date. The use of forward foreign currency contracts for hedging does not eliminate fluctuations in the price of the underlying securities the Fund owns or intends to acquire but establishes a rate of exchange in advance. Fluctuations in the value of these contracts are measured by the difference in the contract date and reporting date exchange rates and are recorded as unrealized appreciation (depreciation) until the contracts are closed. When the contracts are closed, realized gains (losses) are recorded. Realized and unrealized gains (losses) on the contracts are included in the Consolidated Statement of Operations. The primary risks associated with forward foreign currency contracts include failure of the Counterparty to meet the terms of the contract and the value of the foreign currency changing unfavorably. These risks may be in excess of the amounts reflected in the Consolidated Statement of Assets and Liabilities.
| O. | Futures Contracts - The Fund may enter into futures contracts to equitize the Fund’s cash holdings or to manage exposure to interest rate, equity, commodity and market price movements and/or currency risks. A futures contract is an agreement between Counterparties to purchase or sell a specified underlying security, currency or commodity (or delivery of a cash settlement price, in the case of an index future) for a fixed price at a future date. The Fund currently invests only in exchange-traded futures and they are standardized as to maturity date and underlying financial instrument or asset. Initial margin deposits required upon entering into futures contracts are satisfied by the segregation of specific securities or cash as collateral at the futures commission merchant (broker). During the period the futures contracts are open, changes in the value of the contracts are recognized as unrealized gains or losses by recalculating the value of the contracts on a daily basis. Subsequent or variation margin payments are received or made depending upon whether unrealized gains or losses are incurred. These amounts are reflected as receivables or payables on the Consolidated Statement of Assets and Liabilities. When the contracts are closed or expire, the Fund recognizes a realized gain or loss equal to the difference between the proceeds from, or cost of, the closing transaction and the Fund’s basis in the contract. The net realized gain (loss) and the change in unrealized gain (loss) on futures contracts held during the period is included on the Consolidated Statement of Operations. The primary risks associated with futures contracts are market risk and the absence of a liquid secondary market. If the Fund were unable to liquidate a futures contract and/or enter into an offsetting closing transaction, the Fund would continue to be subject to market risk with respect to the value of the contracts and continue to be required to maintain the margin deposits on the futures contracts. Futures contracts have minimal Counterparty risk since the exchange’s clearinghouse, as Counterparty to all exchange-traded futures, guarantees the futures against default. Risks may exceed amounts recognized in the Consolidated Statement of Assets and Liabilities. |
| P. | Call Options Purchased and Written - The Fund may write covered call options and/or buy call options. A covered call option gives the purchaser of such option the right to buy, and the writer the obligation to sell, the underlying security or foreign currency at the stated exercise price during the option period. |
| | |
| 31 | | Invesco International Bond Fund |
Options written by the Fund normally will have expiration dates between three and nine months from the date written. The exercise price of a call option may be below, equal to, or above the current market value of the underlying security at the time the option is written.
Additionally, the Fund may enter into an option on a swap agreement, also called a “swaption”. A swaption is an option that gives the buyer the right, but not the obligation, to enter into a swap on a future date in exchange for paying a market-based premium. A receiver swaption gives the owner the right to receive the total return of a specified asset, reference rate or index. Swaptions also include options that allow an existing swap to be terminated or extended by one of the Counterparties.
When the Fund writes a covered call option, an amount equal to the premium received by the Fund is recorded as an asset and an equivalent liability in the Consolidated Statement of Assets and Liabilities. The amount of the liability is subsequently “marked-to-market” to reflect the current market value of the option written. If a written covered call option expires on the stipulated expiration date, or if the Fund enters into a closing purchase transaction, the Fund realizes a gain (or a loss if the closing purchase transaction exceeds the premium received when the option was written) without regard to any unrealized gain or loss on the underlying security, and the liability related to such option is extinguished. If a written covered call option is exercised, the Fund realizes a gain or a loss from the sale of the underlying security and the proceeds of the sale are increased by the premium originally received. Realized and unrealized gains and losses on call options written are included in the Consolidated Statement of Operations as Net realized gain (loss) from and Change in net unrealized appreciation (depreciation) of Option contracts written. A risk in writing a covered call option is that the Fund gives up the opportunity for profit if the market price of the security increases and the option is exercised.
When the Fund buys a call option, an amount equal to the premium paid by the Fund is recorded as an investment on the Consolidated Statement of Assets and Liabilities. The amount of the investment is subsequently “marked-to-market” to reflect the current value of the option purchased. Realized and unrealized gains and losses on call options purchased are included in the Consolidated Statement of Operations as Net realized gain (loss) from and Change in net unrealized appreciation (depreciation) of Investment securities. A risk in buying an option is that the Fund pays a premium whether or not the option is exercised. In addition, there can be no assurance that a liquid secondary market will exist for any option purchased.
| Q. | Put Options Purchased and Written - The Fund may purchase and write put options including options on securities indexes, or foreign currency and/or futures contracts. By purchasing a put option, the Fund obtains the right (but not the obligation) to sell the option’s underlying instrument at a fixed strike price. In return for this right, the Fund pays an option premium. The option’s underlying instrument may be a security, securities index, or a futures contract. |
Additionally, the Fund may enter into an option on a swap agreement, also called a “swaption”. A swaption is an option that gives the buyer the right, but not the obligation, to enter into a swap on a future date in exchange for paying a market-based premium. A receiver swaption gives the owner the right to receive the total return of a specified asset, reference rate or index. Swaptions also include options that allow an existing swap to be terminated or extended by one of the Counterparties.
Put options may be used by the Fund to hedge securities it owns by locking in a minimum price at which the Fund can sell. If security prices fall, the put option could be exercised to offset all or a portion of the Fund’s resulting losses. At the same time, because the maximum the Fund has at risk is the cost of the option, purchasing put options does not eliminate the potential for the Fund to profit from an increase in the value of the underlying portfolio securities. The Fund may write put options to earn additional income in the form of option premiums if it expects the price of the underlying instrument to remain stable or rise during the option period so that the option will not be exercised. The risk in this strategy is that the price of the underlying securities may decline by an amount greater than the premium received. Put options written are reported as a liability in the Consolidated Statement of Assets and Liabilities. Realized and unrealized gains and losses on put options purchased and put options written are included in the Consolidated Statement of Operations as Net realized gain (loss) from and Change in net unrealized appreciation (depreciation) of Investment securities and Option contracts written, respectively. A risk in buying an option is that the Fund pays a premium whether or not the option is exercised. In addition, there can be no assurance that a liquid secondary market will exist for any option purchased.
| R. | Swap Agreements - The Fund may enter into various swap transactions, including interest rate, total return, index, currency and credit default swap contracts (“CDS”) for investment purposes or to manage interest rate, currency, commodity or credit risk. Such transactions are agreements between Counterparties. A swap agreement may be negotiated bilaterally and traded over-the-counter (“OTC”) between two parties (“uncleared/OTC”) or, in some instances, must be transacted through a future commission merchant (“FCM”) and cleared through a clearinghouse that serves as a central Counterparty (“centrally cleared swap”). These agreements may contain among other conditions, events of default and termination events, and various covenants and representations such as provisions that require the Fund to maintain a pre-determined level of net assets, and/or provide limits regarding the decline of the Fund’s net asset value (“NAV”) per share over specific periods of time. If the Fund were to trigger such provisions and have open derivative positions at that time, the Counterparty may be able to terminate such agreement and request immediate payment in an amount equal to the net liability positions, if any. |
Interest rate, total return, index, and currency swap agreements are two-party contracts entered into primarily to exchange the returns (or differentials in rates of returns) earned or realized on particular predetermined investments or instruments. The gross returns to be exchanged or “swapped” between the parties are calculated with respect to a notional amount, i.e., the return on or increase in value of a particular dollar amount invested at a particular interest rate or return of an underlying asset, in a particular foreign currency, or in a “basket” of securities representing a particular index.
In a centrally cleared swap, the Fund’s ultimate Counterparty is a central clearinghouse. The Fund initially will enter into centrally cleared swaps through an executing broker. When a fund enters into a centrally cleared swap, it must deliver to the central Counterparty (via the FCM) an amount referred to as “initial margin.” Initial margin requirements are determined by the central Counterparty, but an FCM may require additional initial margin above the amount required by the central Counterparty. Initial margin deposits required upon entering into centrally cleared swaps are satisfied by cash or securities as collateral at the FCM. Securities deposited as initial margin are designated on the Consolidated Schedule of Investments and cash deposited is recorded on the Consolidated Statement of Assets and Liabilities. During the term of a cleared swap agreement, a “variation margin” amount may be required to be paid by the Fund or may be received by the Fund, based on the daily change in price of the underlying reference instrument subject to the swap agreement and is recorded as a receivable or payable for variation margin in the Consolidated Statement of Assets and Liabilities until the centrally cleared swap is terminated at which time a realized gain or loss is recorded.
A CDS is an agreement between Counterparties to exchange the credit risk of an issuer. A buyer of a CDS is said to buy protection by paying a fixed payment over the life of the agreement and in some situations an upfront payment to the seller of the CDS. If a defined credit event occurs (such as payment default or bankruptcy), the Fund as a protection buyer would cease paying its fixed payment, the Fund would deliver eligible bonds issued by the reference entity to the seller, and the seller would pay the full notional value, or the “par value”, of the referenced obligation to the Fund. A seller of a CDS is said to sell protection and thus would receive a fixed payment over the life of the agreement and an upfront payment, if applicable. If a credit event occurs, the Fund as a protection seller would cease to receive the fixed payment stream, the Fund would pay the buyer “par value” or the full notional value of the referenced obligation, and the Fund would receive the eligible bonds issued by the reference entity. In turn, these bonds may be sold in order to realize a recovery value. Alternatively, the seller of the CDS and its Counterparty may agree to net the notional amount and the market value of the bonds and make a cash payment equal to the difference to the buyer of protection. If no credit event occurs, the Fund receives the fixed payment over the life of the agreement. As the seller, the Fund would effectively add leverage to its portfolio because, in addition to its total net assets, the Fund would be subject to investment exposure on the notional amount of the CDS. In connection with these agreements, cash and securities may be identified as collateral in accordance with the terms of the respective swap agreements to provide assets of value and recourse in the event of default under the swap agreement or bankruptcy/insolvency of a party to the swap agreement. If a Counterparty becomes bankrupt or otherwise fails to perform its obligations due to financial difficulties, the Fund may experience significant delays in obtaining any recovery in a bankruptcy or other reorganization proceeding. The Fund may obtain only limited recovery or may obtain no recovery in such circumstances. The Fund’s maximum risk of loss from Counterparty risk, either as the protection seller or as the protection buyer, is the value of the contract. The risk may be mitigated by
| | |
| 32 | | Invesco International Bond Fund |
having a master netting arrangement between the Fund and the Counterparty and by the designation of collateral by the Counterparty to cover the Fund’s exposure to the Counterparty.
Implied credit spreads represent the current level at which protection could be bought or sold given the terms of the existing CDS contract and serve as an indicator of the current status of the payment/performance risk of the CDS. An implied spread that has widened or increased since entry into the initial contract may indicate a deteriorating credit profile and increased risk of default for the reference entity. A declining or narrowing spread may indicate an improving credit profile or decreased risk of default for the reference entity. Alternatively, credit spreads may increase or decrease reflecting the general tolerance for risk in the credit markets.
An interest rate swap is an agreement between Counterparties pursuant to which the parties exchange a floating rate payment for a fixed rate payment based on a specified notional amount.
A total return swap is an agreement in which one party makes payments based on a set rate, either fixed or variable, while the other party makes payments based on the return of an underlying asset, which includes both the income generated and capital gains, if any. The unrealized appreciation (depreciation) on total return swaps includes dividends on the underlying securities and financing rate payable from the Counterparty. At the maturity date, a net cash flow is exchanged where the total return is equivalent to the return of the underlying reference less a financing rate, if any. As a receiver, the Fund would receive payments based on any positive total return and would owe payments in the event of a negative total return. As the payer, the Fund would owe payments on any net positive total return, and would receive payment in the event of a negative total return.
Changes in the value of centrally cleared and OTC swap agreements are recognized as unrealized gains (losses) in the Consolidated Statement of Operations by “marking to market” on a daily basis to reflect the value of the swap agreement at the end of each trading day. Payments received or paid at the beginning of the agreement are reflected as such on the Consolidated Statement of Assets and Liabilities and may be referred to as upfront payments. The Fund accrues for the fixed payment stream and amortizes upfront payments, if any, on swap agreements on a daily basis with the net amount, recorded as a component of realized gain (loss) on the Consolidated Statement of Operations. A liquidation payment received or made at the termination of a swap agreement is recorded as realized gain (loss) on the Consolidated Statement of Operations. Cash held as collateral is recorded as deposits with brokers on the Consolidated Statement of Assets and Liabilities. Entering into these agreements involves, to varying degrees, lack of liquidity and elements of credit, market, and Counterparty risk in excess of amounts recognized on the Consolidated Statement of Assets and Liabilities. Such risks involve the possibility that a swap is difficult to sell or liquidate; the Counterparty does not honor its obligations under the agreement and unfavorable interest rates and market fluctuations. It is possible that developments in the swaps market, including potential government regulation, could adversely affect the Fund’s ability to terminate existing swap agreements or to realize amounts to be received under such agreements. Additionally, an International Swaps and Derivatives Association Master Agreement (“ISDA Master Agreement”) includes credit related contingent features which allow Counterparties to OTC derivatives to terminate derivative contracts prior to maturity in the event that, for example, the Fund’s net assets decline by a stated percentage or the Fund fails to meet the terms of its ISDA master agreements, which would cause the Fund to accelerate payment of any net liability owed to the Counterparty. A short position in a security poses more risk than holding the same security long. As there is no limit on how much the price of the security can increase, the Fund’s exposure is unlimited.
Notional amounts of each individual credit default swap agreement outstanding as of October 31, 2022, if any, for which the Fund is the seller of protection are disclosed in the open swap agreements table. These potential amounts would be partially offset by any recovery values of the respective referenced obligations, upfront payments received upon entering into the agreement, or net amounts received from the settlement of buy protection credit default swap agreements entered into by the Fund for the same referenced entity or entities.
| S. | LIBOR Risk - The Fund may have investments in financial instruments that utilize the London Interbank Offered Rate (“LIBOR”) as the reference or benchmark rate for variable interest rate calculations. LIBOR is intended to measure the rate generally at which banks can lend and borrow from one another in the relevant currency on an unsecured basis. The UK Financial Conduct Authority (“FCA”), the regulator that oversees LIBOR, announced that the majority of LIBOR rates would cease to be published or would no longer be representative on January 1, 2022. Although the publication of most LIBOR rates ceased at the end of 2021, a selection of widely used USD LIBOR rates continues to be published until June 2023 to allow for an orderly transition away from these rates. |
There remains uncertainty and risks relating to the continuing LIBOR transition and its effects on the Fund and the instruments in which the Fund invests. There can be no assurance that the composition or characteristics of any alternative reference rates (“ARRs”) or financial instruments in which the Fund invests that utilize ARRs will be similar to or produce the same value or economic equivalence as LIBOR or that these instruments will have the same volume or liquidity. Additionally, there remains uncertainty and risks relating to certain “legacy” USD LIBOR instruments that were issued or entered into before December 31, 2021 and the process by which a replacement interest rate will be identified and implemented into these instruments when USD LIBOR is ultimately discontinued. The effects of such uncertainty and risks in “legacy” USD LIBOR instruments held by the Fund could result in losses to the Fund.
| T. | Leverage Risk - Leverage exists when the Fund can lose more than it originally invests because it purchases or sells an instrument or enters into a transaction without investing an amount equal to the full economic exposure of the instrument or transaction. |
| U. | Collateral - To the extent the Fund has designated or segregated a security as collateral and that security is subsequently sold, it is the Fund’s practice to replace such collateral no later than the next business day. |
| V. | Other Risks - Active trading of portfolio securities may result in added expenses, a lower return and increased tax liability. |
The Fund may invest in lower-quality debt securities, i.e., “junk bonds”. Investments in lower-rated securities or unrated securities of comparable quality tend to be more sensitive to economic conditions than higher rated securities. Junk bonds involve a greater risk of default by the issuer because such securities are generally unsecured and are often subordinated to other creditors’ claims. Junk bonds are less liquid than investment grade debt securities and their prices tend to be more volatile.
The Fund is non-diversified and may invest in securities of fewer issuers than if it were diversified. Thus, the value of the Fund’s shares may vary more widely and the Fund may be subject to greater market and credit risk than if the Fund invested more broadly.
Following Russia’s invasion of Ukraine in late February 2022, various countries, including the United States, as well as NATO and the European Union, issued broad-ranging economic sanctions against Russia and Belarus. The resulting responses to the military actions (and potential further sanctions in response to continued military activity), the potential for military escalation and other corresponding events, have had, and could continue to have, severe negative effects on regional and global economic and financial markets, including increased volatility, reduced liquidity and overall uncertainty. The negative impacts may be particularly acute in certain sectors including, but not limited to, energy and financials. Russia may take additional counter measures or retaliatory actions (including cyberattacks), which could exacerbate negative consequences on global financial markets. The duration of ongoing hostilities and corresponding sanctions and related events cannot be predicted. The foregoing may result in a negative impact on Fund performance and the value of an investment in the Fund, even beyond any direct investment exposure the Fund may have to Russian issuers or the adjoining geographic regions.
| W. | COVID-19 Risk - The COVID-19 strain of coronavirus has resulted in instances of market closures and dislocations, extreme volatility, liquidity constraints and increased trading costs. Efforts to contain its spread have resulted in travel restrictions, disruptions of healthcare systems, business operations (including business closures) and supply chains, layoffs, lower consumer demand and employee availability, and defaults and credit downgrades, among other significant economic impacts that have disrupted global economic activity across many industries. Such economic impacts may exacerbate other pre-existing political, social and economic risks locally or globally and cause general concern and uncertainty. The full economic impact and ongoing effects of COVID-19 (or other future epidemics or pandemics) at the macro-level and on individual businesses are unpredictable and may result in significant and prolonged effects on the Fund’s performance. |
| | |
| 33 | | Invesco International Bond Fund |
NOTE 2–Advisory Fees and Other Fees Paid to Affiliates
The Trust has entered into a master investment advisory agreement with the Adviser. Under the terms of the investment advisory agreement, the Fund accrues daily and pays monthly an advisory fee to the Adviser based on the annual rate of the Fund’s average daily net assets as follows:
| | |
| Average Daily Net Assets | | Rate* |
First $ 200 million | | 0.750% |
Next $200 million | | 0.720% |
Next $200 million | | 0.690% |
Next $200 million | | 0.660% |
Next $200 million | | 0.600% |
Next $4 billion | | 0.500% |
Next $10 billion | | 0.480% |
Over $15 billion | | 0.450% |
| * | The advisory fee paid by the Fund shall be reduced by any amounts paid by the Fund under the administrative services agreement with the Adviser. |
For the year ended October 31, 2022, the effective advisory fee rate incurred by the Fund was 0.59%.
The Subsidiary has entered into a separate contract with the Adviser whereby the Adviser provides investment advisory and other services to the Subsidiary. In consideration of these services, the Subsidiary pays an advisory fee to the Adviser based on the annual rate of the Subsidiary’s average daily net assets as set forth in the table above.
Under the terms of a master sub-advisory agreement between the Adviser and each of Invesco Asset Management Deutschland GmbH, Invesco Asset Management Limited, Invesco Asset Management (Japan) Limited, Invesco Hong Kong Limited, Invesco Senior Secured Management, Inc. and Invesco Canada Ltd. and separate sub-advisory agreements with Invesco Capital Management LLC and Invesco Asset Management (India) Private Limited (collectively, the “Affiliated Sub-Advisers”) the Adviser, not the Fund, will pay 40% of the fees paid to the Adviser to any such Affiliated Sub-Adviser(s) that provide(s) discretionary investment management services to the Fund based on the percentage of assets allocated to such Affiliated Sub-Adviser(s). Invesco has also entered into a sub-advisory agreement with OppenheimerFunds, Inc. to provide discretionary management services to the Fund.
The Adviser has contractually agreed, through February 28, 2023, to waive advisory fees and/or reimburse expenses of all shares to the extent necessary to limit total annual fund operating expenses after fee waiver and/or expense reimbursement (excluding certain items discussed below) of Class A, Class C, Class R, Class Y, Class R5 and Class R6 shares to 1.01%, 1.76%, 1.26%, 0.76%, 0.76%, and 0.76%, respectively, of the Fund’s average daily net assets (the “expense limits”). Effective March 1, 2023, through at least February 29, 2024, the Adviser has contractually agreed to waive advisory fees and/or reimburse expenses of all shares to the extent necessary to limit total annual fund operating expenses after fee waiver and/or expense reimbursement (excluding certain items discussed below) of Class A, Class C, Class R, Class Y, Class R5 and Class R6 shares to 1.04%, 1.79%, 1.29%, 0.79%, 0.79%, and 0.79%, respectively, of the Fund’s average daily net assets. In determining the Adviser’s obligation to waive advisory fees and/or reimburse expenses, the following expenses are not taken into account, and could cause total annual fund operating expenses after fee waivers and/or expense reimbursement to exceed the numbers reflected above: (1) interest, facilities and maintenance fees; (2) taxes; (3) dividend expenses on short sales; (4) extraordinary or non-routine items, including litigation expenses; and (5) expenses that the Fund has incurred but did not actually pay because of an expense offset arrangement. Unless Invesco continues the fee waiver agreement, it will terminate February 29, 2024. During its term, the fee waiver agreement cannot be terminated or amended to increase the expense limits or reduce the advisory fee waiver without approval of the Board of Trustees.
Further, the Adviser has contractually agreed, through at least June 30, 2024, to waive the advisory fee payable by the Fund in an amount equal to 100% of the net advisory fees the Adviser receives from the affiliated money market funds on investments by the Fund of uninvested cash (excluding investments of cash collateral from securities lending) in such affiliated money market funds.
For the year ended October 31, 2022, the Adviser waived advisory fees of $70,091 and reimbursed class level expenses of $112,011, $5,389, $12,296, $161,412, $0 and $0 of Class A, Class C, Class R, Class Y, Class R5 and Class R6 shares, respectively.
The Trust has entered into a master administrative services agreement with Invesco pursuant to which the Fund has agreed to pay Invesco for certain administrative costs incurred in providing accounting services to the Fund. For the year ended October 31, 2022, expenses incurred under the agreement are shown in the Consolidated Statement of Operations as Administrative services fees. Invesco has entered into a sub-administration agreement whereby State Street Bank and Trust Company (“SSB”) serves as fund accountant and provides certain administrative services to the Fund. Pursuant to a custody agreement with the Trust on behalf of the Fund, SSB also serves as the Fund’s custodian.
The Trust has entered into a transfer agency and service agreement with Invesco Investment Services, Inc. (“IIS”) pursuant to which the Fund has agreed to pay IIS a fee for providing transfer agency and shareholder services to the Fund and reimburse IIS for certain expenses incurred by IIS in the course of providing such services. IIS may make payments to intermediaries that provide omnibus account services, sub-accounting services and/or networking services. All fees payable by IIS to intermediaries that provide omnibus account services or sub-accounting services are charged back to the Fund, subject to certain limitations approved by the Trust’s Board of Trustees. For the year ended October 31, 2022, expenses incurred under the agreement are shown in the Consolidated Statement of Operations as Transfer agent fees.
The Trust has entered into master distribution agreements with Invesco Distributors, Inc. (“IDI”) to serve as the distributor for the Class A, Class C, Class R, Class Y, Class R5 and Class R6 shares of the Fund. The Trust has adopted plans pursuant to Rule 12b-1 under the 1940 Act with respect to the Fund’s Class A, Class C and Class R shares (collectively, the “Plans”). The Fund, pursuant to the Class A Plan, reimburses IDI for its allocated share of expenses incurred for the period, up to a maximum annual rate of 0.25% of the average daily net assets of Class A shares. The Fund, pursuant to the Class C and Class R Plans, pays IDI compensation at the annual rate of 1.00% of the average daily net assets of Class C shares and 0.50% of the average daily net assets of Class R shares. The fees are accrued daily and paid monthly. Of the Plan payments, up to 0.25% of the average daily net assets of each class of shares may be paid to furnish continuing personal shareholder services to customers who purchase and own shares of such classes. Any amounts not paid as a service fee under the Plans would constitute an asset-based sales charge. Rules of the Financial Industry Regulatory Authority (“FINRA”) impose a cap on the total sales charges, including asset-based sales charges, that may be paid by any class of shares of the Fund. For the year ended October 31, 2022, expenses incurred under the Plans are shown in the Consolidated Statement of Operations as Distribution fees.
Front-end sales commissions and CDSC (collectively, the “sales charges”) are not recorded as expenses of the Fund. Front-end sales commissions are deducted from proceeds from the sales of Fund shares prior to investment in Class A shares of the Fund. CDSC are deducted from redemption proceeds prior to remittance to the shareholder. During the year ended October 31, 2022, IDI advised the Fund that IDI retained $17,330 in front-end sales commissions from the sale of Class A shares and $591 and $962 from Class A and Class C shares, respectively, for CDSC imposed upon redemptions by shareholders.
Certain officers and trustees of the Trust are officers and directors of the Adviser, IIS and/or IDI.
| | |
| 34 | | Invesco International Bond Fund |
NOTE 3–Additional Valuation Information
GAAP defines fair value as the price that would be received to sell an asset or paid to transfer a liability in an orderly transaction between market participants at the measurement date, under current market conditions. GAAP establishes a hierarchy that prioritizes the inputs to valuation methods, giving the highest priority to readily available unadjusted quoted prices in an active market for identical assets (Level 1) and the lowest priority to significant unobservable inputs (Level 3), generally when market prices are not readily available. Based on the valuation inputs, the securities or other investments are tiered into one of three levels. Changes in valuation methods may result in transfers in or out of an investment’s assigned level:
Level 1 - Prices are determined using quoted prices in an active market for identical assets.
Level 2 - Prices are determined using other significant observable inputs. Observable inputs are inputs that other market participants may use in pricing a security. These may include quoted prices for similar securities, interest rates, prepayment speeds, credit risk, yield curves, loss severities, default rates, discount rates, volatilities and others.
Level 3 - Prices are determined using significant unobservable inputs. In situations where quoted prices or observable inputs are unavailable (for example, when there is little or no market activity for an investment at the end of the period), unobservable inputs may be used. Unobservable inputs reflect the Adviser’s assumptions about the factors market participants would use in determining fair value of the securities or instruments and would be based on the best available information.
The following is a summary of the tiered valuation input levels, as of October 31, 2022. The level assigned to the securities valuations may not be an indication of the risk or liquidity associated with investing in those securities. Because of the inherent uncertainties of valuation, the values reflected in the consolidated financial statements may materially differ from the value received upon actual sale of those investments.
| | | | | | | | | | | | | | | | |
| | | Level 1 | | | Level 2 | | | Level 3 | | | Total | |
|
| |
Investments in Securities | | | | | | | | | | | | | | | | |
|
| |
Non-U.S. Dollar Denominated Bonds & Notes | | $ | – | | | $ | 651,111,918 | | | $ | – | | | $ | 651,111,918 | |
|
| |
U.S. Dollar Denominated Bonds & Notes | | | – | | | | 239,208,897 | | | | – | | | | 239,208,897 | |
|
| |
Asset-Backed Securities | | | – | | | | 108,617,789 | | | | 2,836,328 | | | | 111,454,117 | |
|
| |
U.S. Treasury Securities | | | – | | | | 25,924,900 | | | | – | | | | 25,924,900 | |
|
| |
Common Stocks & Other Equity Interests | | | 21,058,938 | | | | – | | | | 4,299,807 | | | | 25,358,745 | |
|
| |
Preferred Stocks | | | – | | | | 6,817,607 | | | | – | | | | 6,817,607 | |
|
| |
Money Market Funds | | | 66,638,637 | | | | 4,458,139 | | | | – | | | | 71,096,776 | |
|
| |
Options Purchased | | | – | | | | 72,720,922 | | | | – | | | | 72,720,922 | |
|
| |
Total Investments in Securities | | | 87,697,575 | | | | 1,108,860,172 | | | | 7,136,135 | | | | 1,203,693,882 | |
|
| |
| | | | |
Other Investments - Assets* | | | | | | | | | | | | | | | | |
|
| |
Futures Contracts | | | 4,668,545 | | | | – | | | | – | | | | 4,668,545 | |
|
| |
Forward Foreign Currency Contracts | | | – | | | | 52,230,439 | | | | – | | | | 52,230,439 | |
|
| |
Swap Agreements | | | – | | | | 28,636,579 | | | | – | | | | 28,636,579 | |
|
| |
| | | 4,668,545 | | | | 80,867,018 | | | | – | | | | 85,535,563 | |
|
| |
| | | | |
Other Investments - Liabilities* | | | | | | | | | | | | | | | | |
|
| |
Forward Foreign Currency Contracts | | | – | | | | (56,750,474 | ) | | | – | | | | (56,750,474 | ) |
|
| |
Options Written | | | – | | | | (96,158,624 | ) | | | – | | | | (96,158,624 | ) |
|
| |
Swap Agreements | | | – | | | | (37,806,818 | ) | | | – | | | | (37,806,818 | ) |
|
| |
| | | – | | | | (190,715,916 | ) | | | – | | | | (190,715,916 | ) |
|
| |
Total Other Investments | | | 4,668,545 | | | | (109,848,898 | ) | | | – | | | | (105,180,353 | ) |
|
| |
Total Investments | | $ | 92,366,120 | | | $ | 999,011,274 | | | $ | 7,136,135 | | | $ | 1,098,513,529 | |
|
| |
| * | Forward foreign currency contracts, futures contracts and swap agreements are valued at unrealized appreciation (depreciation). Options written are shown at value. |
NOTE 4–Derivative Investments
The Fund may enter into an ISDA Master Agreement under which a fund may trade OTC derivatives. An OTC transaction entered into under an ISDA Master Agreement typically involves a collateral posting arrangement, payment netting provisions and close-out netting provisions. These netting provisions allow for reduction of credit risk through netting of contractual obligations. The enforceability of the netting provisions of the ISDA Master Agreement depends on the governing law of the ISDA Master Agreement, among other factors.
For financial reporting purposes, the Fund does not offset OTC derivative assets or liabilities that are subject to ISDA Master Agreements in the Consolidated Statement of Assets and Liabilities.
| | |
| 35 | | Invesco International Bond Fund |
Value of Derivative Investments at Period-End
The table below summarizes the value of the Fund’s derivative investments, detailed by primary risk exposure, held as of October 31, 2022:
| | | | | | | | | | | | | | | | |
| | | Value | |
| Derivative Assets | | Credit Risk | | | Currency Risk | | | Interest Rate Risk | | | Total | |
|
| |
Unrealized appreciation on futures contracts –Exchange-Traded(a) | | $ | – | | | $ | – | | | $ | 4,668,545 | | | $ | 4,668,545 | |
|
| |
Unrealized appreciation on swap agreements – Centrally Cleared(a) | | | 298,286 | | | | – | | | | 27,595,719 | | | | 27,894,005 | |
|
| |
Unrealized appreciation on forward foreign currency contracts outstanding | | | – | | | | 52,230,439 | | | | – | | | | 52,230,439 | |
|
| |
Unrealized appreciation on swap agreements – OTC | | | 154,114 | | | | – | | | | 588,460 | | | | 742,574 | |
|
| |
Options purchased, at value – OTC(b) | | | 1,526,511 | | | | 14,488,198 | | | | 56,706,213 | | | | 72,720,922 | |
|
| |
Total Derivative Assets | | | 1,978,911 | | | | 66,718,637 | | | | 89,558,937 | | | | 158,256,485 | |
|
| |
Derivatives not subject to master netting agreements | | | (298,286 | ) | | | – | | | | (32,264,264 | ) | | | (32,562,550 | ) |
|
| |
Total Derivative Assets subject to master netting agreements | | $ | 1,680,625 | | | $ | 66,718,637 | | | $ | 57,294,673 | | | $ | 125,693,935 | |
|
| |
| |
| | | Value | |
| Derivative Liabilities | | Credit Risk | | | Currency Risk | | | Interest Rate Risk | | | Total | |
|
| |
Unrealized depreciation on swap agreements – Centrally Cleared(a) | | $ | (209,902 | ) | | $ | – | | | $ | (34,282,852 | ) | | $ | (34,492,754 | ) |
|
| |
Unrealized depreciation on forward foreign currency contracts outstanding | | | – | | | | (56,750,474 | ) | | | – | | | | (56,750,474 | ) |
|
| |
Unrealized depreciation on swap agreements – OTC | | | (3,314,064 | ) | | | – | | | | – | | | | (3,314,064 | ) |
|
| |
Options written, at value – OTC | | | (973,120 | ) | | | (10,568,485 | ) | | | (84,617,019 | ) | | | (96,158,624 | ) |
|
| |
Total Derivative Liabilities | | | (4,497,086 | ) | | | (67,318,959 | ) | | | (118,899,871 | ) | | | (190,715,916 | ) |
|
| |
Derivatives not subject to master netting agreements | | | 209,902 | | | | – | | | | 34,282,852 | | | | 34,492,754 | |
|
| |
Total Derivative Liabilities subject to master netting agreements | | $ | (4,287,184 | ) | | $ | (67,318,959 | ) | | $ | (84,617,019 | ) | | $ | (156,223,162 | ) |
|
| |
| (a) | The daily variation margin receivable (payable) at period-end is recorded in the Consolidated Statement of Assets and Liabilities. |
| (b) | Options purchased, at value as reported in the Consolidated Schedule of Investments. |
Offsetting Assets and Liabilities
The table below reflects the Fund’s exposure to Counterparties subject to either an ISDA Master Agreement or other agreement for OTC derivative transactions as of October 31, 2022.
| | | | | | | | | | | | | | | | | | | | | | | | | | | | | | | | | | | | | | | | | | | | | | |
| | | | | | | | | | | | | | | | | | | | | | | | | | | | | | Collateral | | | | |
| | | Financial Derivative Assets | | | Financial Derivative Liabilities | | | | | | (Received)/Pledged | | | | |
| Counterparty | | Forward
Foreign
Currency
Contracts | | | Options
Purchased | | | Swap Agreements | | | Total Assets | | | Forward
Foreign
Currency
Contracts | | | Options
Written | | | Swap
Agreements | | | Total Liabilities | | | Net Value of Derivatives | | | Non-Cash | | Cash | | | Net
Amount | |
|
| |
Bank of America, N.A. | | $ | 14,367,746 | | | $ | 3,173,999 | | | | $ 605,293 | | | $ | 18,147,038 | | | $ | (17,769,738 | ) | | $ | (13,141,644 | ) | | $ | – | | | $ | (30,911,382 | ) | | $ | (12,764,344 | ) | | $– | | $ | 12,270,000 | | | $ | (494,344 | ) |
|
| |
Barclays Bank PLC | | | – | | | | – | | | | – | | | | – | | | | – | | | | (372,926 | ) | | | – | | | | (372,926 | ) | | | (372,926 | ) | | – | | | 372,926 | | | | – | |
|
| |
BNP Paribas S.A. | | | – | | | | – | | | | – | | | | – | | | | (517,412 | ) | | | – | | | | – | | | | (517,412 | ) | | | (517,412 | ) | | – | | | – | | | | (517,412 | ) |
|
| |
Citibank, N.A. | | | 11,029,471 | | | | – | | | | 5,732 | | | | 11,035,203 | | | | (10,912,197 | ) | | | – | | | | (37,555 | ) | | | (10,949,752 | ) | | | 85,451 | | | – | | | (85,451 | ) | | | – | |
|
| |
Deutsche Bank AG | | | 6,539,770 | | | | – | | | | – | | | | 6,539,770 | | | | (2,886,246 | ) | | | – | | | | – | | | | (2,886,246 | ) | | | 3,653,524 | | | – | | | – | | | | 3,653,524 | |
|
| |
Goldman Sachs International | | | 8,461,474 | | | | 6,782,078 | | | | 125,859 | | | | 15,369,411 | | | | (4,920,853 | ) | | | (36,862,612 | ) | | | (1,189,370 | ) | | | (42,972,835 | ) | | | (27,603,424 | ) | | – | | | 27,603,424 | | | | – | |
|
| |
J.P. Morgan Chase Bank, N.A. | | | 6,206,073 | | | | 17,168,414 | | | | 236,561 | | | | 23,611,048 | | | | (10,590,161 | ) | | | (29,448,538 | ) | | | (2,107,200 | ) | | | (42,145,899 | ) | | | (18,534,851 | ) | | – | | | 18,534,851 | | | | – | |
|
| |
Morgan Stanley and Co. International PLC | | | 5,324,738 | | | | 45,289,551 | | | | – | | | | 50,614,289 | | | | (8,584,500 | ) | | | (16,332,904 | ) | | | – | | | | (24,917,404 | ) | | | 25,696,885 | | | – | | | – | | | | 25,696,885 | |
|
| |
Royal Bank of Canada | | | 301,167 | | | | – | | | | – | | | | 301,167 | | | | – | | | | – | | | | – | | | | – | | | | 301,167 | | | – | | | (280,000 | ) | | | 21,167 | |
|
| |
Standard Chartered Bank PLC | | | – | | | | 306,880 | | | | – | | | | 306,880 | | | | (569,367 | ) | | | – | | | | – | | | | (569,367 | ) | | | (262,487 | ) | | – | | | 262,487 | | | | – | |
|
| |
Total | | $ | 52,230,439 | | | $ | 72,720,922 | | | | $973,445 | | | $ | 125,924,806 | | | $ | (56,750,474 | ) | | $ | (96,158,624 | ) | | $ | (3,334,125 | ) | | $ | (156,243,223 | ) | | $ | (30,318,417 | ) | | $– | | $ | 58,678,237 | | | $ | 28,359,820 | |
|
| |
| | |
| 36 | | Invesco International Bond Fund |
Effect of Derivative Investments for the year ended October 31, 2022
The table below summarizes the gains (losses) on derivative investments, detailed by primary risk exposure, recognized in earnings during the period:
| | | | | | | | | | | | | | | | |
| | | Location of Gain (Loss) on | |
| | | Consolidated Statement of Operations | |
| | | Credit Risk | | | Currency Risk | | | Interest Rate Risk | | | Total | |
|
| |
Realized Gain (Loss): | | | | | | | | | | | | | | | | |
Forward foreign currency contracts | | $ | - | | | $ | 10,925,978 | | | $ | - | | | $ | 10,925,978 | |
|
| |
Futures contracts | | | - | | | | - | | | | 59,070,747 | | | | 59,070,747 | |
|
| |
Options purchased(a) | | | - | | | | (22,100,576 | ) | | | 208,191 | | | | (21,892,385 | ) |
|
| |
Options written | | | (1,532,883 | ) | | | (16,581,884 | ) | | | 28,692,602 | | | | 10,577,835 | |
|
| |
Swap agreements | | | 4,903,027 | | | | - | | | | (169,172,319 | ) | | | (164,269,292 | ) |
|
| |
Change in Net Unrealized Appreciation (Depreciation): | | | | | | | | | | | | | | | | |
Forward foreign currency contracts | | | - | | | | (15,480,119 | ) | | | - | | | | (15,480,119 | ) |
|
| |
Futures contracts | | | - | | | | - | | | | 4,824,930 | | | | 4,824,930 | |
|
| |
Options purchased(a) | | | 944,391 | | | | 5,614,999 | | | | 31,807,913 | | | | 38,367,303 | |
|
| |
Options written | | | (783,861 | ) | | | 3,320,653 | | | | (11,444,844 | ) | | | (8,908,052 | ) |
|
| |
Swap agreements | | | (3,344,181 | ) | | | - | | | | 41,029,885 | | | | 37,685,704 | |
|
| |
Total | | $ | 186,493 | | | $ | (34,300,949 | ) | | $ | (14,982,895 | ) | | $ | (49,097,351 | ) |
|
| |
| (a) | Options purchased are included in the net realized gain (loss) from investment securities and the change in net unrealized appreciation (depreciation) of investment securities. |
The table below summarizes the average notional value of derivatives held during the period.
| | | | | | | | | | | | | | | | | | | | | | | | | | | | |
| | | | | | | | | | | | Foreign | | | | | | Foreign | | | | |
| | | Forward | | | | | | | | | Currency | | | | | | Currency | | | | |
| | | Foreign Currency | | | Futures | | | Swaptions | | | Options | | | Swaptions | | | Options | | | Swap | |
| | | Contracts | | | Contracts | | | Purchased | | | Purchased | | | Written | | | Written | | | Agreements | |
|
| |
Average notional value | | | $5,397,178,779 | | | $ | 360,220,408 | | | $ | 490,429,147 | | | $ | 1,279,873,493 | | | $ | 3,311,255,064 | | | $ | 636,311,690 | | | $ | 19,759,422,857 | |
|
| |
NOTE 5–Expense Offset Arrangement(s)
The expense offset arrangement is comprised of transfer agency credits which result from balances in demand deposit accounts used by the transfer agent for clearing shareholder transactions. For the year ended October 31, 2022, the Fund received credits from this arrangement, which resulted in the reduction of the Fund’s total expenses of $5,662.
NOTE 6–Trustees’ and Officers’ Fees and Benefits
Trustees’ and Officers’ Fees and Benefits include amounts accrued by the Fund to pay remuneration to certain Trustees and Officers of the Fund. Trustees have the option to defer compensation payable by the Fund, and Trustees’ and Officers’ Fees and Benefits also include amounts accrued by the Fund to fund such deferred compensation amounts. Those Trustees who defer compensation have the option to select various Invesco Funds in which their deferral accounts shall be deemed to be invested. Finally, certain current Trustees were eligible to participate in a retirement plan that provided for benefits to be paid upon retirement to Trustees over a period of time based on the number of years of service. The Fund may have certain former Trustees who also participate in a retirement plan and receive benefits under such plan. Trustees’ and Officers’ Fees and Benefits include amounts accrued by the Fund to fund such retirement benefits. Obligations under the deferred compensation and retirement plans represent unsecured claims against the general assets of the Fund.
NOTE 7–Cash Balances
The Fund is permitted to temporarily carry a negative or overdrawn balance in its account with SSB, the custodian bank. Such balances, if any at period-end, are shown in the Consolidated Statement of Assets and Liabilities under the payable caption Amount due custodian. To compensate the custodian bank for such overdrafts, the overdrawn Fund may either (1) leave funds as a compensating balance in the account so the custodian bank can be compensated by earning the additional interest; or (2) compensate by paying the custodian bank at a rate agreed upon by the custodian bank and Invesco, not to exceed the contractually agreed upon rate. The Fund may not purchase additional securities when any borrowings from banks or broker-dealers exceed 5% of the Fund’s total assets, or when any borrowings from an Invesco Fund are outstanding.
NOTE 8–Distributions to Shareholders and Tax Components of Net Assets
Tax Character of Distributions to Shareholders Paid During the Fiscal Years Ended October 31, 2022 and 2021:
| | | | | | | | | | | | |
| | | 2022 | | | | | | 2021 | |
|
| |
Return of capital | | | 56,732,985 | | | | | | | | 72,823,368 | |
|
| |
| | |
| 37 | | Invesco International Bond Fund |
Tax Components of Net Assets at Period-End:
| | | | |
| | | 2022 | |
|
| |
Net unrealized appreciation (depreciation) – investments | | $ | (255,739,005 | ) |
|
| |
Net unrealized appreciation (depreciation) – foreign currencies | | | (1,535,814 | ) |
|
| |
Temporary book/tax differences | | | (302,025 | ) |
|
| |
Capital loss carryforward | | | (236,044,117 | ) |
|
| |
Shares of beneficial interest | | | 1,784,450,508 | |
|
| |
Total net assets | | $ | 1,290,829,547 | |
|
| |
The difference between book-basis and tax-basis unrealized appreciation (depreciation) is due to differences in the timing of recognition of gains and losses on investments for tax and book purposes. The Fund’s net unrealized appreciation (depreciation) difference is attributable primarily to derivative instruments and straddles.
The temporary book/tax differences are a result of timing differences between book and tax recognition of income and/or expenses. The Fund’s temporary book/tax differences are the result of the trustee deferral of compensation and retirement plan benefits.
Capital loss carryforward is calculated and reported as of a specific date. Results of transactions and other activity after that date may affect the amount of capital loss carryforward actually available for the Fund to utilize. The ability to utilize capital loss carryforward in the future may be limited under the Internal Revenue Code and related regulations based on the results of future transactions.
The Fund has a capital loss carryforward as of October 31, 2022, as follows:
| | | | | | | | | | | | | | | | | | | | |
| Capital Loss Carryforward* | |
|
| |
| Expiration | | Short-Term | | | | | | Long-Term | | | | | | Total | |
|
| |
Not subject to expiration | | $ | 198,541,915 | | | | | | | $ | 37,502,202 | | | | | | | $ | 236,044,117 | |
|
| |
| * | Capital loss carryforward is reduced for limitations, if any, to the extent required by the Internal Revenue Code and may be further limited depending upon a variety of factors, including the realization of net unrealized gains or losses as of the date of any reorganization. |
NOTE 9–Investment Transactions
The aggregate amount of investment securities (other than short-term securities, U.S. Government obligations and money market funds, if any) purchased and sold by the Fund during the year ended October 31, 2022 was $1,223,529,939 and $1,662,611,453, respectively. Cost of investments, including any derivatives, on a tax basis includes the adjustments for financial reporting purposes as of the most recently completed federal income tax reporting period-end.
| | | | |
Unrealized Appreciation (Depreciation) of Investments on a Tax Basis | |
Aggregate unrealized appreciation of investments | | $ | 167,894,585 | |
|
| |
Aggregate unrealized (depreciation) of investments | | | (423,633,590 | ) |
|
| |
Net unrealized appreciation (depreciation) of investments | | $ | (255,739,005 | ) |
|
| |
Cost of investments for tax purposes is $1,356,206,808.
NOTE 10–Reclassification of Permanent Differences
Primarily as a result of differing book/tax treatment of foreign currency transactions, net operating losses and return of capital distributions, on October 31, 2022, undistributed net investment income was increased by $16,084,588, undistributed net realized gain (loss) was increased by $223,148,368 and shares of beneficial interest was decreased by $239,232,955. This reclassification had no effect on the net assets of the Fund.
NOTE 11–Share Information
| | | | | | | | | | | | | | | | |
| | | Summary of Share Activity | |
|
| |
| | |
| | | Year ended | | | Year ended | |
| | | October 31, 2022(a) | | | October 31, 2021 | |
| | | Shares | | | Amount | | | Shares | | | Amount | |
|
| |
Sold: | | | | | | | | | | | | | | | | |
Class A | | | 6,791,760 | | | $ | 31,312,761 | | | | 10,679,165 | | | $ | 59,163,264 | |
|
| |
Class C | | | 482,560 | | | | 2,196,516 | | | | 749,964 | | | | 4,152,544 | |
|
| |
Class R | | | 1,266,442 | | | | 5,839,373 | | | | 1,933,033 | | | | 10,661,305 | |
|
| |
Class Y | | | 39,767,405 | | | | 189,983,572 | | | | 52,906,667 | | | | 292,887,665 | |
|
| |
Class R5 | | | 248,165 | | | | 1,156,653 | | | | 11,857 | | | | 62,852 | |
|
| |
Class R6 | | | 11,857,360 | | | | 54,706,960 | | | | 25,033,048 | | | | 138,232,595 | |
|
| |
| | | | |
Issued as reinvestment of dividends: | | | | | | | | | | | | | | | | |
Class A | | | 3,281,576 | | | | 14,668,894 | | | | 3,272,113 | | | | 17,895,284 | |
|
| |
Class C | | | 103,470 | | | | 459,930 | | | | 120,518 | | | | 658,289 | |
|
| |
Class R | | | 323,717 | | | | 1,439,296 | | | | 321,804 | | | | 1,754,902 | |
|
| |
Class Y | | | 3,842,890 | | | | 17,291,282 | | | | 4,262,472 | | | | 23,303,587 | |
|
| |
Class R5 | | | 5,409 | | | | 22,693 | | | | 114 | | | | 596 | |
|
| |
Class R6 | | | 2,593,720 | | | | 11,614,884 | | | | 2,726,524 | | | | 14,911,604 | |
|
| |
| | |
| 38 | | Invesco International Bond Fund |
| | | | | | | | | | | | | | | | |
| | | Summary of Share Activity | |
|
| |
| | |
| | | Year ended | | | Year ended | |
| | | October 31, 2022(a) | | | October 31, 2021 | |
| | | Shares | | | Amount | | | Shares | | | Amount | |
|
| |
| | | | |
Automatic conversion of Class C shares to Class A shares: | | | | | | | | | | | | | | | | |
Class A | | | 656,099 | | | $ | 3,019,260 | | | | 4,513,898 | | | $ | 25,808,212 | |
|
| |
Class C | | | (658,721 | ) | | | (3,019,260 | ) | | | (4,530,213 | ) | | | (25,808,212 | ) |
|
| |
| | | | |
Reacquired: | | | | | | | | | | | | | | | | |
Class A | | | (33,153,319 | ) | | | (151,713,493 | ) | | | (47,989,282 | ) | | | (265,871,989 | ) |
|
| |
Class C | | | (1,512,565 | ) | | | (7,027,755 | ) | | | (2,295,274 | ) | | | (12,695,825 | ) |
|
| |
Class R | | | (3,239,823 | ) | | | (14,963,047 | ) | | | (5,025,642 | ) | | | (27,666,532 | ) |
|
| |
Class Y | | | (102,430,021 | ) | | | (473,516,487 | ) | | | (77,271,663 | ) | | | (426,160,086 | ) |
|
| |
Class R5 | | | (23,998 | ) | | | (101,308 | ) | | | (142 | ) | | | (746 | ) |
|
| |
Class R6 | | | (35,016,427 | ) | | | (162,533,138 | ) | | | (41,611,072 | ) | | | (227,130,216 | ) |
|
| |
Net increase (decrease) in share activity | | | (104,814,301 | ) | | $ | (479,162,414 | ) | | | (72,192,111 | ) | | $ | (395,840,907 | ) |
|
| |
| (a) | There are entities that are record owners of more than 5% of the outstanding shares of the Fund and in the aggregate own 46% of the outstanding shares of the Fund. IDI has an agreement with these entities to sell Fund shares. The Fund, Invesco and/or Invesco affiliates may make payments to these entities, which are considered to be related to the Fund, for providing services to the Fund, Invesco and/or Invesco affiliates including but not limited to services such as securities brokerage, distribution, third party record keeping and account servicing. The Fund has no knowledge as to whether all or any portion of the shares owned of record by these entities are also owned beneficially. |
| | |
| 39 | | Invesco International Bond Fund |
Report of Independent Registered Public Accounting Firm
To the Board of Trustees of AIM Investment Funds (Invesco Investment Funds) and Shareholders of Invesco International Bond Fund
Opinion on the Consolidated Financial Statements
We have audited the accompanying consolidated statement of assets and liabilities, including the consolidated schedule of investments, of Invesco International Bond Fund and its subsidiary (one of the funds constituting AIM Investment Funds (Invesco Investment Funds), referred to hereafter as the “Fund”) as of October 31, 2022, the related consolidated statement of operations for the year ended October 31, 2022, the consolidated statement of changes in net assets for each of the two years in the period ended October 31, 2022, including the related notes, and the consolidated financial highlights for each of the periods indicated in the table below (collectively referred to as the “consolidated financial statements”). In our opinion, the consolidated financial statements present fairly, in all material respects, the financial position of the Fund as of October 31, 2022, the results of its operations for the year then ended, the changes in its net assets for each of the two years in the period ended October 31, 2022 and the financial highlights for each of the periods indicated in the table below, in conformity with accounting principles generally accepted in the United States of America.
|
| |
Consolidated Financial Highlights |
| |
For each of the three years in the period ended October 31, 2022, the one month ended October 31, 2019, and the year ended September 30, 2019 for Class A, Class C, Class R, Class Y and Class R6. |
For each of the three years in the period ended October 31, 2022, the one month ended October 31, 2019, and the period May 24, 2019 (commencement of operations) through September 30, 2019 for Class R5. |
The consolidated financial statements of Oppenheimer International Bond Fund (subsequently renamed Invesco International Bond Fund) as of and for the year ended September 30, 2018 and the consolidated financial highlights for the year then ended (not presented herein, other than the consolidated financial highlights) were audited by other auditors whose report dated November 28, 2018 expressed an unqualified opinion on those consolidated financial statements and consolidated financial highlights.
Basis for Opinion
These consolidated financial statements are the responsibility of the Fund’s management. Our responsibility is to express an opinion on the Fund’s consolidated financial statements based on our audits. We are a public accounting firm registered with the Public Company Accounting Oversight Board (United States) (PCAOB) and are required to be independent with respect to the Fund in accordance with the U.S. federal securities laws and the applicable rules and regulations of the Securities and Exchange Commission and the PCAOB.
We conducted our audits of these consolidated financial statements in accordance with the standards of the PCAOB. Those standards require that we plan and perform the audit to obtain reasonable assurance about whether the consolidated financial statements are free of material misstatement, whether due to error or fraud.
Our audits included performing procedures to assess the risks of material misstatement of the consolidated financial statements, whether due to error or fraud, and performing procedures that respond to those risks. Such procedures included examining, on a test basis, evidence regarding the amounts and disclosures in the consolidated financial statements. Our audits also included evaluating the accounting principles used and significant estimates made by management, as well as evaluating the overall presentation of the consolidated financial statements. Our procedures included confirmation of securities owned as of October 31, 2022 by correspondence with the custodian, transfer agent, portfolio company investees, and brokers; when replies were not received from brokers or portfolio company investees, we performed other auditing procedures. We believe that our audits provide a reasonable basis for our opinion.
/s/PricewaterhouseCoopers LLP
Houston, Texas
December 23, 2022
We have served as the auditor of one or more of the investment companies in the Invesco group of investment companies since at least 1995. We have not been able to determine the specific year we began serving as auditor.
| | |
| 40 | | Invesco International Bond Fund |
Calculating your ongoing Fund expenses
Example
As a shareholder of the Fund, you incur two types of costs: (1) transaction costs, which may include sales charges (loads) on purchase payments or contingent deferred sales charges on redemptions, if any; and (2) ongoing costs, including management fees, distribution and/or service (12b-1) fees, and other Fund expenses. This example is intended to help you understand your ongoing costs (in dollars) of investing in the Fund and to compare these costs with ongoing costs of investing in other mutual funds. The example is based on an investment of $1,000 invested at the beginning of the period and held for the entire period May 1, 2022 through October 31, 2022.
Actual expenses
The table below provides information about actual account values and actual expenses. You may use the information in this table, together with the amount you invested, to estimate the expenses that you paid over the period. Simply divide your account value by $1,000 (for example, an $8,600 account value divided by $1,000 = 8.6), then multiply the result by the number in the table under the heading entitled “Actual Expenses Paid During Period” to estimate the expenses you paid on your account during this period.
Hypothetical example for comparison purposes
The table below also provides information about hypothetical account values and hypothetical expenses based on the Fund’s actual expense ratio and an assumed rate of return of 5% per year before expenses, which is not the Fund’s actual return.
The hypothetical account values and expenses may not be used to estimate the actual ending account balance or expenses you paid for the period. You may use this information to compare the ongoing costs of investing in the Fund and other funds. To do so, compare this 5% hypothetical example with the 5% hypothetical examples that appear in the shareholder reports of the other funds.
Please note that the expenses shown in the table are meant to highlight your ongoing costs only and do not reflect any transaction costs, such as sales charges (loads) on purchase payments or contingent deferred sales charges on redemptions, if any. Therefore, the hypothetical information is useful in comparing ongoing costs only, and will not help you determine the relative total costs of owning different funds. In addition, if these transaction costs were included, your costs would have been higher.
| | | | | | | | | | | | |
| | | Beginning Account Value (05/01/22) | | ACTUAL | | HYPOTHETICAL (5% annual return before expenses) | | Annualized Expense Ratio |
| | Ending Account Value (10/31/22)1 | | Expenses Paid During Period2 | | Ending Account Value (10/31/22) | | Expenses Paid During Period2 |
Class A | | $1,000.00 | | $902.20 | | $6.42 | | $1,018.45 | | $6.82 | | 1.34% |
Class C | | 1,000.00 | | 898.20 | | 10.00 | | 1,014.67 | | 10.61 | | 2.09 |
Class R | | 1,000.00 | | 902.80 | | 7.63 | | 1,017.19 | | 8.08 | | 1.59 |
Class Y | | 1,000.00 | | 903.20 | | 5.23 | | 1,019.71 | | 5.55 | | 1.09 |
Class R5 | | 1,000.00 | | 903.60 | | 4.17 | | 1,020.82 | | 4.43 | | 0.87 |
Class R6 | | 1,000.00 | | 903.50 | | 4.70 | | 1,020.27 | | 4.99 | | 0.98 |
| 1 | The actual ending account value is based on the actual total return of the Fund for the period May 1, 2022 through October 31, 2022, after actual expenses and will differ from the hypothetical ending account value which is based on the Fund’s expense ratio and a hypothetical annual return of 5% before expenses. |
| 2 | Expenses are equal to the Fund’s annualized expense ratio as indicated above multiplied by the average account value over the period, multiplied by 184/365 to reflect the most recent fiscal half year. |
| | |
| 41 | | Invesco International Bond Fund |
Approval of Investment Advisory and Sub-Advisory Contracts
At meetings held on June 13, 2022, the Board of Trustees (the Board or the Trustees) of AIM Investment Funds (Invesco Investment Funds) as a whole, and the independent Trustees, who comprise over 75% of the Board, voting separately, approved the continuance of the Invesco International Bond Fund’s (the Fund) Master Investment Advisory Agreement with Invesco Advisers, Inc. (Invesco Advisers and the investment advisory agreement) and the Master Intergroup Sub-Advisory Contract for Mutual Funds with Invesco Asset Management Deutschland GmbH, Invesco Asset Management Limited, Invesco Asset Management (Japan) Limited, Invesco Hong Kong Limited, Invesco Senior Secured Management, Inc. and Invesco Canada Ltd. and separate sub-advisory contracts with Invesco Capital Management LLC and Invesco Asset Management (India) Private Limited and OppenheimerFunds, Inc. (collectively, the Affiliated Sub-Advisers and the sub-advisory contracts) for another year, effective July 1, 2022. After evaluating the factors discussed below, among others, the Board approved the renewal of the Fund’s investment advisory agreement and the sub-advisory contracts and determined that the compensation payable thereunder by the Fund to Invesco Advisers and by Invesco Advisers to the Affiliated Sub-Advisers is fair and reasonable.
The Board’s Evaluation Process
The Board has established an Investments Committee, which in turn has established Sub-Committees that meet throughout the year to review the performance of funds advised by Invesco Advisers (the Invesco Funds). The Sub-Committees meet regularly with portfolio managers for their assigned Invesco Funds and other members of management to review detailed information about investment performance and portfolio attributes of these funds. The Board has established additional standing and ad hoc committees that meet regularly throughout the year to review matters within their purview. The Board took into account evaluations and reports that it received from its committees and sub-committees, as well as the information provided to the Board and its committees and sub-committees throughout the year, in considering whether to approve each Invesco Fund’s investment advisory agreement and sub-advisory contracts.
As part of the contract renewal process, the Board reviews and considers information provided in response to detailed requests for information submitted to management by the independent Trustees with assistance from legal counsel to the independent Trustees and the Senior Officer, an officer of the Invesco Funds who reports directly to the independent Trustees. The Board receives comparative investment performance and fee and expense data regarding the Invesco Funds prepared by Broadridge Financial Solutions, Inc. (Broadridge), an independent mutual fund data provider, as well as information on the composition of the peer groups provided by Broadridge and its methodology for determining peer groups. The Board also receives an independent written evaluation from the Senior Officer. The Senior Officer’s evaluation is prepared as part of his responsibility to manage the process by which the Invesco Funds’ proposed management fees are negotiated during the annual contract renewal
process to ensure they are negotiated in a manner that is at arms’ length and reasonable in accordance with certain negotiated regulatory requirements. In addition to meetings with Invesco Advisers and fund counsel throughout the year and as part of meetings convened on May 2, 2022 and June 13, 2022, the independent Trustees also discussed the continuance of the investment advisory agreement and sub-advisory contracts in separate sessions with the Senior Officer and with independent legal counsel.
The discussion below is a summary of the Senior Officer’s independent written evaluation with respect to the Fund’s investment advisory agreement and sub-advisory contracts, as well as a discussion of the material factors and related conclusions that formed the basis for the Board’s approval of the Fund’s investment advisory agreement and sub-advisory contracts. The Trustees’ review and conclusions are based on the comprehensive consideration of all information presented to them during the course of the year and in prior years and are not the result of any single determinative factor. Moreover, one Trustee may have weighed a particular piece of information or factor differently than another Trustee. The information received and considered by the Board was current as of various dates prior to the Board’s approval on June 13, 2022.
Factors and Conclusions and Summary of Independent Written Fee Evaluation
| A. | Nature, Extent and Quality of Services Provided by Invesco Advisers and the Affiliated Sub-Advisers |
The Board reviewed the nature, extent and quality of the advisory services provided to the Fund by Invesco Advisers under the Fund’s investment advisory agreement, and the credentials and experience of the officers and employees of Invesco Advisers who provide these services, including the Fund’s portfolio manager(s). The Board’s review included consideration of Invesco Advisers’ investment process and oversight, credit analysis, and research capabilities. The Board considered information regarding Invesco Advisers’ programs for and resources devoted to risk management, including management of investment, enterprise, operational, liquidity, valuation and compliance risks, and technology used to manage such risks. The Board also received and reviewed information about Invesco Advisers’ role as administrator of the Invesco Funds’ liquidity risk management program. The Board received a description of, and reports related to, Invesco Advisers’ global security program and business continuity plans and of its approach to data privacy and cybersecurity, including related testing. The Board considered how the cybersecurity and business continuity plans of Invesco Advisers and its key service providers operated in the remote and hybrid working environment resulting from the novel coronavirus (“COVID-19”) pandemic and paved the way for a hybrid working framework in a normalized environment as employees return to the office. The Board also considered non-advisory services that Invesco Advisers and its affiliates provide to the Invesco Funds, such as various back office support functions, third party oversight, internal audit, valuation, portfolio trading and legal and compliance. The Board observed that Invesco Advisers’ systems preparedness and ongoing investment enabled
Invesco Advisers to manage, operate and oversee the Invesco Funds with minimal impact or disruption through challenging environments. The Board reviewed and considered the benefits to shareholders of investing in a Fund that is part of the family of funds under the umbrella of Invesco Ltd., Invesco Advisers’ parent company, and noted Invesco Ltd.’s depth and experience in running an investment management business, as well as its commitment of financial and other resources to such business. The Board concluded that the nature, extent and quality of the services provided to the Fund by Invesco Advisers are appropriate and satisfactory.
The Board reviewed the services that may be provided by the Affiliated Sub-Advisers under the sub-advisory contracts and the credentials and experience of the officers and employees of the Affiliated Sub-Advisers who provide these services. The Board noted the Affiliated Sub-Advisers’ expertise with respect to certain asset classes and that the Affiliated Sub-Advisers have offices and personnel that are located in financial centers around the world. As a result, the Board noted that the Affiliated Sub-Advisers can provide research and investment analysis on the markets and economies of various countries in which the Fund may invest, make recommendations regarding securities and assist with security trades. The Board concluded that the sub-advisory contracts may benefit the Fund and its shareholders by permitting Invesco Advisers to use the resources and talents of the Affiliated Sub-Advisers in managing the Fund. The Board concluded that the nature, extent and quality of the services that may be provided to the Fund by the Affiliated Sub-Advisers are appropriate and satisfactory.
| B. | Fund Investment Performance |
The Board considered Fund investment performance as a relevant factor in considering whether to approve the investment advisory agreement. The Board did not view Fund investment performance as a relevant factor in considering whether to approve the sub-advisory contracts for the Fund, as no Affiliated Sub-Adviser currently manages assets of the Fund.
The Board compared the Fund’s investment performance over multiple time periods ending December 31, 2021 to the performance of funds in the Broadridge performance universe and against the Custom Invesco International Bond Index (Index). The Board noted that performance of Class A shares of the Fund was in the fifth quintile of its performance universe for the one year period and the fourth quintile for the three and five year periods (the first quintile being the best performing funds and the fifth quintile being the worst performing funds). The Board noted that performance of Class A shares of the Fund was below the performance of the Index for the one, three and five year periods. The Board considered that the Fund was created in connection with Invesco Ltd.’s acquisition of OppenheimerFunds, Inc. and its subsidiaries (the “Transaction”) and that the Fund’s performance prior to the closing of the Transaction on May 24, 2019 is that of its predecessor fund. The Board considered that the Fund’s exposure to emerging market interest rates and currencies detracted from performance. The Board recognized that the performance data reflects a snapshot in time as of a particular date and that selecting a different
| | |
| 42 | | Invesco International Bond Fund |
performance period could produce different results. The Board also reviewed more recent Fund performance as well as other performance metrics, which did not change its conclusions.
| C. | Advisory and Sub-Advisory Fees and Fund Expenses |
The Board compared the Fund’s contractual management fee rate to the contractual management fee rates of funds in the Fund’s Broadridge expense group. The Board noted that the contractual management fee rate for Class A shares of the Fund was below the median contractual management fee rate of funds in its expense group. The Board noted that the term “contractual management fee” for funds in the expense group may include both advisory and certain non-portfolio management administrative services fees, but that Broadridge is not able to provide information on a fund by fund basis as to what is included. The Board also reviewed the methodology used by Broadridge in calculating expense group information, which includes using each fund’s contractual management fee schedule (including any applicable breakpoints) as reported in the most recent prospectus or statement of additional information for each fund in the expense group. The Board also considered comparative information regarding the Fund’s total expense ratio and its various components.
The Board noted that Invesco Advisers has contractually agreed to waive fees and/or limit expenses of the Fund for the term disclosed in the Fund’s registration statement in an amount necessary to limit total annual operating expenses to a specified percentage of average daily net assets for each class of the Fund.
The Board noted that Invesco Advisers and the Affiliated Sub-Advisers do not manage other similarly managed mutual funds or client accounts.
The Board also considered the services that may be provided by the Affiliated Sub-Advisers pursuant to the sub-advisory contracts, as well as the fees payable by Invesco Advisers to the Affiliated Sub-Advisers pursuant to the sub-advisory contracts.
| D. | Economies of Scale and Breakpoints |
The Board considered the extent to which there may be economies of scale in the provision of advisory services to the Fund and the Invesco Funds, and the extent to which such economies of scale are shared with the Fund and the Invesco Funds. The Board considered that the Fund benefits from economies of scale through contractual breakpoints in the Fund’s advisory fee schedule, which generally operate to reduce the Fund’s expense ratio as it grows in size. The Board noted that the Fund also shares in economies of scale through Invesco Advisers’ ability to negotiate lower fee arrangements with third party service providers. The Board noted that the Fund may also benefit from economies of scale through initial fee setting, fee waivers and expense reimbursements, as well as Invesco Advisers’ investment in its business, including investments in business infrastructure, technology and cybersecurity.
| E. | Profitability and Financial Resources |
The Board reviewed information from Invesco Advisers concerning the costs of the advisory and other services that Invesco Advisers and its affiliates provide to the Fund and the Invesco Funds and the profitability of Invesco Advisers and its affiliates in providing these services in the aggregate and on an individual Fund-by-Fund basis. The Board considered the methodology used for calculating profitability and
the periodic review and enhancement of such methodology. The Board noted that Invesco Advisers continues to operate at a net profit from services Invesco Advisers and its affiliates provide to the Invesco Funds in the aggregate and to most Funds individually. The Board did not deem the level of profits realized by Invesco Advisers and its affiliates from providing such services to be excessive, given the nature, extent and quality of the services provided. The Board noted that Invesco Advisers provided information demonstrating that Invesco Advisers is financially sound and has the resources necessary to perform its obligations under the investment advisory agreement, and provided representations indicating that the Affiliated Sub-Advisers are financially sound and have the resources necessary to perform their obligations under the sub-advisory contracts.
| F. | Collateral Benefits to Invesco Advisers and its Affiliates |
The Board considered various other benefits received by Invesco Advisers and its affiliates from the relationship with the Fund, including the fees received for providing administrative, transfer agency and distribution services to the Fund. The Board received comparative information regarding fees charged for these services, including information provided by Broadridge and other independent sources. The Board reviewed the performance of Invesco Advisers and its affiliates in providing these services and the organizational structure employed to provide these services. The Board noted that these services are provided to the Fund pursuant to written contracts that are reviewed and subject to approval on an annual basis by the Board based on its determination that the services are required for the operation of the Fund.
The Board considered the benefits realized by Invesco Advisers and the Affiliated Sub-Advisers as a result of portfolio brokerage transactions executed through “soft dollar” arrangements. Invesco Advisers noted that the Fund does not execute brokerage transactions through “soft dollar” arrangements to any significant degree.
The Board considered that the Fund’s uninvested cash and cash collateral from any securities lending arrangements may be invested in registered money market funds or, with regard to securities lending cash collateral, unregistered funds that comply with Rule 2a-7 (collectively referred to as “affiliated money market funds”) advised by Invesco Advisers. The Board considered information regarding the returns of the affiliated money market funds relative to comparable overnight investments, as well as the fees paid by the affiliated money market funds to Invesco Advisers and its affiliates. In this regard, the Board noted that Invesco Advisers receives advisory fees from these affiliated money market funds attributable to the Fund’s investments. The Board also noted that Invesco Advisers has contractually agreed to waive through varying periods an amount equal to 100% of the net advisory fee Invesco Advisers receives from the affiliated money market funds with respect to the Fund’s investment in the affiliated money market funds of uninvested cash, but not cash collateral. The Board concluded that the advisory fees payable to Invesco Advisers from the Fund’s investment of cash collateral from any securities lending arrangements in the affiliated money market funds are for services that are not duplicative of services provided by Invesco Advisers to the Fund.
The Board considered that Invesco Advisers may serve as the Fund’s affiliated securities lending agent and evaluated the benefits realized by Invesco Advisers when serving in such role, including the compensation received. The Board considered Invesco Advisers’ securities lending platform and corporate governance structure for securities lending, including Invesco Advisers’ Securities Lending Governance Committee and its related responsibilities. The Board noted that to the extent the Fund utilizes Invesco Advisers as an affiliated securities lending agent, the Fund conducts its securities lending in accordance with, and in reliance upon, no-action letters issued by the SEC staff that provide guidance on how an affiliate may act as a direct agent lender and receive compensation for those services without obtaining exemptive relief. The Board considered information provided by Invesco Advisers related to the performance of Invesco Advisers as securities lending agent, including a summary of the securities lending services provided to the Fund by Invesco Advisers and the compensation paid to Invesco Advisers for such services, as well as any revenues generated for the Fund in connection with such securities lending activity and the allocation of such revenue between the Fund and Invesco Advisers.
The Board also received information about commissions that an affiliated broker may receive for executing certain trades for the Fund. Invesco Advisers and the Affiliated Sub-Advisers advised the Board of the benefits to the Fund of executing trades through the affiliated broker and that such trades were executed in compliance with rules under the federal securities laws and consistent with best execution obligations.
| | |
| 43 | | Invesco International Bond Fund |
Tax Information
Form 1099-DIV, Form 1042-S and other year-end tax information provide shareholders with actual calendar year amounts that should be included in their tax returns. Shareholders should consult their tax advisers.
The following distribution information is being provided as required by the Internal Revenue Code or to meet a specific state’s requirement.
The Fund designates the following amounts or, if subsequently determined to be different, the maximum amount allowable for its fiscal year ended October 31, 2022:
| | | | | | |
Federal and State Income Tax | | | | | |
Qualified Dividend Income* | | | 0.00 | % |
Corporate Dividends Received Deduction* | | | 0.00 | % |
U.S. Treasury Obligations* | | | 0.00 | % |
Qualified Business Income* | | | 0.00 | % |
Business Interest Income* | | | 0.00 | % |
|
| * The above percentages are based on ordinary income dividends paid to shareholders during the Fund’s fiscal year. |
| | |
| 44 | | Invesco International Bond Fund |
Trustees and Officers
The address of each trustee and officer is AIM Investment Funds (Invesco Investment Funds) (the “Trust”), 11 Greenway Plaza, Suite 1000, Houston, Texas 77046-1173. The trustees serve for the life of the Trust, subject to their earlier death, incapacitation, resignation, retirement or removal as more specifically provided in the Trust’s organizational documents. Each officer serves for a one year term or until their successors are elected and qualified. Column two below includes length of time served with predecessor entities, if any.
| | | | | | | | |
Name, Year of Birth and
Position(s) Held with the Trust | | Trustee and/or
Officer Since | | Principal Occupation(s) During Past 5 Years | | Number of
Funds in Fund Complex
Overseen by
Trustee | | Other Directorship(s) Held by Trustee
During Past 5 Years |
| Interested Trustee | | | | | | | | |
Martin L. Flanagan1 - 1960 Trustee and Vice Chair | | 2007 | | Executive Director, Chief Executive Officer and President, Invesco Ltd. (ultimate parent of Invesco and a global investment management firm); Trustee and Vice Chair, The Invesco Funds; Vice Chair, Investment Company Institute; and Member of Executive Board, SMU Cox School of Business Formerly: Advisor to the Board, Invesco Advisers, Inc. (formerly known as Invesco Institutional (N.A.), Inc.); Chairman and Chief Executive Officer, Invesco Advisers, Inc. (registered investment adviser); Director, Chairman, Chief Executive Officer and President, Invesco Holding Company (US), Inc. (formerly IVZ Inc.) (holding company), Invesco Group Services, Inc. (service provider) and Invesco North American Holdings, Inc. (holding company); Director, Chief Executive Officer and President, Invesco Holding Company Limited (parent of Invesco and a global investment management firm); Director, Invesco Ltd.; Chairman, Investment Company Institute and President, Co-Chief Executive Officer, Co-President, Chief Operating Officer and Chief Financial Officer, Franklin Resources, Inc. (global investment management organization) | | 189 | | None |
| 1 | Mr. Flanagan is considered an interested person (within the meaning of Section 2(a)(19) of the 1940 Act) of the Trust because he is an officer of the Adviser to the Trust, and an officer and a director of Invesco Ltd., ultimate parent of the Adviser. |
| | |
| T-1 | | Invesco International Bond Fund |
Trustees and Officers–(continued)
| | | | | | | | |
Name, Year of Birth and Position(s) Held with the Trust | | Trustee and/or Officer Since | | Principal Occupation(s) During Past 5 Years | | Number of Funds in Fund Complex
Overseen by
Trustee | | Other Directorship(s) Held by Trustee During Past 5 Years |
| Independent Trustees | | | | | | | | |
Beth Ann Brown - 1968 Trustee (2019) and Chair (August 2022) | | 2019 | | Independent Consultant Formerly: Head of Intermediary Distribution, Managing Director, Strategic Relations, Managing Director, Head of National Accounts, Senior Vice President, National Account Manager and Senior Vice President, Key Account Manager, Columbia Management Investment Advisers LLC; Vice President, Key Account Manager, Liberty Funds Distributor, Inc.; and Trustee of certain Oppenheimer Funds | | 189 | | Director, Board of Directors of Caron Engineering Inc.; Advisor, Board of Advisors of Caron Engineering Inc.; President and Director, Acton Shapleigh Youth Conservation Corps (non-profit) Formerly: President and Director Director of Grahamtastic Connection (non-profit) |
Cynthia Hostetler - 1962 Trustee | | 2017 | | Non-Executive Director and Trustee of a number of public and private business corporations Formerly: Director, Aberdeen Investment Funds (4 portfolios); Director, Artio Global Investment LLC (mutual fund complex); Director, Edgen Group, Inc. (specialized energy and infrastructure products distributor); Director, Genesee & Wyoming, Inc. (railroads); Head of Investment Funds and Private Equity, Overseas Private Investment Corporation; President, First Manhattan Bancorporation, Inc.; and Attorney, Simpson Thacher & Bartlett LLP | | 189 | | Resideo Technologies, Inc. (smart home technology); Vulcan Materials Company (construction materials company); Trilinc Global Impact Fund; Textainer Group Holdings, (shipping container leasing company); Investment Company Institute (professional organization); and Independent Directors Council (professional organization) |
Eli Jones - 1961 Trustee | | 2016 | | Professor and Dean Emeritus, Mays Business School - Texas A&M University Formerly: Dean of Mays Business School-Texas A&M University; Professor and Dean, Walton College of Business, University of Arkansas and E.J. Ourso College of Business, Louisiana State University; and Director, Arvest Bank | | 189 | | Insperity, Inc. (formerly known as Administaff) (human resources provider); and Member of Regional Board of Directors and Board of Directors, First Financial Bancorp (regional bank) |
Elizabeth Krentzman - 1959 Trustee | | 2019 | | Formerly: Principal and Chief Regulatory Advisor for Asset Management Services and U.S. Mutual Fund Leader of Deloitte & Touche LLP; General Counsel of the Investment Company Institute (trade association); National Director of the Investment Management Regulatory Consulting Practice, Principal, Director and Senior Manager of Deloitte & Touche LLP; Assistant Director of the Division of Investment Management - Office of Disclosure and Investment Adviser Regulation of the U.S. Securities and Exchange Commission and various positions with the Division of Investment Management – Office of Regulatory Policy of the U.S. Securities and Exchange Commission; Associate at Ropes & Gray LLP; and Trustee of certain Oppenheimer Funds | | 189 | | Formerly: Member of the Cartica Funds Board of Directors (private investment fund); Trustee of the University of Florida National Board Foundation; and Member of the University of Florida Law Center Association, Inc. Board of Trustees, Audit Committee and Membership Committee |
Anthony J. LaCava, Jr. - 1956 Trustee | | 2019 | | Formerly: Director and Member of the Audit Committee, Blue Hills Bank (publicly traded financial institution) and Managing Partner, KPMG LLP | | 189 | | Blue Hills Bank; Chairman, Bentley University; Member, Business School Advisory Council; and Nominating Committee, KPMG LLP |
Prema Mathai-Davis - 1950 Trustee | | 2001 | | Retired Formerly: Co-Founder & Partner of Quantalytics Research, LLC, (a FinTech Investment Research Platform for the Self-Directed Investor); Trustee of YWCA Retirement Fund; CEO of YWCA of the USA; Board member of the NY Metropolitan Transportation Authority; Commissioner of the NYC Department of Aging; and Board member of Johns Hopkins Bioethics Institute | | 189 | | Member of Board of Positive Planet US (non-profit) and HealthCare Chaplaincy Network (non-profit) |
| | |
| T-2 | | Invesco International Bond Fund |
Trustees and Officers–(continued)
| | | | | | | | |
Name, Year of Birth and Position(s) Held with the Trust | | Trustee and/or Officer Since | | Principal Occupation(s) During Past 5 Years | | Number of Funds in Fund Complex
Overseen by
Trustee | | Other Directorship(s) Held by Trustee
During Past 5 Years |
| Independent Trustees–(continued) | | | | |
Joel W. Motley - 1952 Trustee | | 2019 | | Director of Office of Finance, Federal Home Loan Bank System; Managing Director of Carmona Motley Inc. (privately held financial advisor); Member of the Council on Foreign Relations and its Finance and Budget Committee; Chairman Emeritus of Board of Human Rights Watch and Member of its Investment Committee; and Member of Investment Committee Board of Historic Hudson Valley (non-profit cultural organization); Member of the Board, Blue Ocean Acquisition Corp.; and Member of the Vestry and the Investment Committee of Trinity Church Wall Street. Formerly: Managing Director of Public Capital Advisors, LLC (privately held financial advisor); Managing Director of Carmona Motley Hoffman, Inc. (privately held financial advisor); Trustee of certain Oppenheimer Funds; and Director of Columbia Equity Financial Corp. (privately held financial advisor) | | 189 | | Member of Board of Trust for Mutual Understanding (non-profit promoting the arts and environment); Member of Board of Greenwall Foundation (bioethics research foundation) and its Investment Committee; Member of Board of Friends of the LRC (non-profit legal advocacy); and Board Member and Investment Committee Member of Pulitzer Center for Crisis Reporting (non-profit journalism) |
Teresa M. Ressel - 1962 Trustee | | 2017 | | Non-executive director and trustee of a number of public and private business corporations Formerly: Chief Executive Officer, UBS Securities LLC (investment banking); Chief Operating Officer, UBS AG Americas (investment banking); Sr. Management Team Olayan America, The Olayan Group (international investor/commercial/industrial); Assistant Secretary for Management & Budget and Designated Chief Financial Officer, U.S. Department of Treasury and Director, ON Semiconductor Corporation (semiconductor manufacturing) | | 189 | | None |
Robert C. Troccoli - 1949 Trustee | | 2016 | | Retired Formerly: Adjunct Professor, University of Denver – Daniels College of Business; and Managing Partner, KPMG LLP | | 189 | | None |
Daniel S. Vandivort - 1954 Trustee | | 2019 | | President, Flyway Advisory Services LLC (consulting and property management) Formerly: President and Chief Investment Officer, previously Head of Fixed Income, Weiss Peck and Greer/Robeco Investment Management; Trustee and Chair, Weiss Peck and Greer Funds Board; and various capacities at CS First Boston including Head of Fixed Income at First Boston Asset Management. | | 189 | | Formerly: Trustee and Governance Chair, Oppenheimer Funds; Treasurer, Chairman of the Audit and Finance Committee, Huntington Disease Foundation of America |
| | |
| T-3 | | Invesco International Bond Fund |
Trustees and Officers–(continued)
| | | | | | | | |
Name, Year of Birth and Position(s) Held with the Trust | | Trustee and/or Officer Since | | Principal Occupation(s) During Past 5 Years | | Number of Funds in Fund Complex
Overseen by
Trustee | | Other Directorship(s) Held by Trustee During Past 5 Years |
| Officers | | | | | | | | |
| Sheri Morris - 1964 President and Principal Executive Officer | | 1999 | | Director, Invesco Trust Company; Head of Global Fund Services, Invesco Ltd.; President and Principal Executive Officer, The Invesco Funds; Vice President, Invesco Exchange-Traded Fund Trust, Invesco Exchange-Traded Fund Trust II, Invesco India Exchange-Traded Fund Trust, Invesco Actively Managed Exchange-Traded Fund Trust, Invesco Actively Managed Exchange-Traded Commodity Fund Trust and Invesco Exchange-Traded Self-Indexed Fund Trust; and Vice President, OppenheimerFunds, Inc. Formerly: Vice President, Treasurer and Principal Financial Officer, The Invesco Funds; Vice President, Invesco AIM Advisers, Inc., Invesco AIM Capital Management, Inc. and Invesco AIM Private Asset Management, Inc.; Assistant Vice President and Assistant Treasurer, The Invesco Funds; Vice President and Assistant Vice President, Invesco Advisers, Inc.; Assistant Vice President, Invesco AIM Capital Management, Inc. and Invesco AIM Private Asset Management, Inc.; Treasurer, Invesco Exchange-Traded Fund Trust, Invesco Exchange-Traded Fund Trust II, Invesco India Exchange-Traded Fund Trust and Invesco Actively Managed Exchange-Traded Fund Trust; and Senior Vice President, Invesco Advisers, Inc. (formerly known as Invesco Institutional (N.A.), Inc.) (registered investment adviser) | | N/A | | N/A |
Jeffrey H. Kupor - 1968 Senior Vice President, Chief Legal Officer and Secretary | | 2018 | | Head of Legal of the Americas, Invesco Ltd.; Senior Vice President and Secretary, Invesco Advisers, Inc. (formerly known as Invesco Institutional (N.A.), Inc.) (registered investment adviser); Secretary, Invesco Distributors, Inc. (formerly known as Invesco AIM Distributors, Inc.); Vice President and Secretary, Invesco Investment Services, Inc. (formerly known as Invesco AIM Investment Services, Inc.); Senior Vice President, Chief Legal Officer and Secretary, The Invesco Funds; Secretary and General Counsel, Invesco Investment Advisers LLC (formerly known as Van Kampen Asset Management); Secretary and General Counsel, Invesco Capital Markets, Inc. (formerly known as Van Kampen Funds Inc.); Chief Legal Officer, Invesco Exchange-Traded Fund Trust, Invesco Exchange-Traded Fund Trust II, Invesco India Exchange-Traded Fund Trust, Invesco Actively Managed Exchange-Traded Fund Trust, Invesco Actively Managed Exchange-Traded Commodity Fund Trust and Invesco Exchange-Traded Self-Indexed Fund Trust;; Secretary and Vice President, Harbourview Asset Management Corporation; Secretary and Vice President, OppenheimerFunds, Inc. and Invesco Managed Accounts, LLC; Secretary and Senior Vice President, OFI Global Institutional, Inc.; Secretary and Vice President, OFI SteelPath, Inc.; Secretary and Vice President, Oppenheimer Acquisition Corp.; Secretary and Vice President, Shareholder Services, Inc.; and Secretary and Vice President, Trinity Investment Management Corporation Formerly: Senior Vice President, Invesco Distributors, Inc.; Secretary and Vice President, Jemstep, Inc.; Head of Legal, Worldwide Institutional, Invesco Ltd.; Secretary and General Counsel, INVESCO Private Capital Investments, Inc.; Senior Vice President, Secretary and General Counsel, Invesco Management Group, Inc. (formerly known as Invesco AIM Management Group, Inc.); Assistant Secretary, INVESCO Asset Management (Bermuda) Ltd.; Secretary and General Counsel, Invesco Private Capital, Inc.; Assistant Secretary and General Counsel, INVESCO Realty, Inc.; Secretary and General Counsel, Invesco Senior Secured Management, Inc.; Secretary, Sovereign G./P. Holdings Inc.; Secretary, Invesco Indexing LLC; and Secretary, W.L. Ross & Co., LLC | | N/A | | N/A |
Andrew R. Schlossberg - 1974 Senior Vice President | | 2019 | | Senior Vice President, Invesco Group Services, Inc.; Head of the Americas and Senior Managing Director, Invesco Ltd.; Director and Senior Vice President, Invesco Advisers, Inc. (formerly known as Invesco Institutional (N.A.), Inc.) (registered investment adviser); Director and Chairman, Invesco Investment Services, Inc. (formerly known as Invesco AIM Investment Services, Inc.) (registered transfer agent); Senior Vice President, The Invesco Funds; and Director, Invesco Investment Advisers LLC (formerly known as Van Kampen Asset Management) Formerly: Director, President and Chairman, Invesco Insurance Agency, Inc.; Director, Invesco UK Limited; Director and Chief Executive, Invesco Asset Management Limited and Invesco Fund Managers Limited; Assistant Vice President, The Invesco Funds; Senior Vice President, Invesco Advisers, Inc. (formerly known as Invesco Institutional (N.A.), Inc.) (registered investment adviser); Director and Chief Executive, Invesco Administration Services Limited and Invesco Global Investment Funds Limited; Director, Invesco Distributors, Inc.; Head of EMEA, Invesco Ltd.; President, Invesco Actively Managed Exchange-Traded Commodity Fund Trust, Invesco Actively Managed Exchange-Traded Fund Trust, Invesco Exchange-Traded Fund Trust, Invesco Exchange-Traded Fund Trust II and Invesco India Exchange-Traded Fund Trust; and Managing Director and Principal Executive Officer, Invesco Capital Management LLC | | N/A | | N/A |
| | |
| T-4 | | Invesco International Bond Fund |
Trustees and Officers–(continued)
| | | | | | | | |
Name, Year of Birth and Position(s) Held with the Trust | | Trustee and/or Officer Since | | Principal Occupation(s) During Past 5 Years | | Number of Funds in Fund Complex
Overseen by
Trustee | | Other Directorship(s) Held by Trustee
During Past 5 Years |
| Officers– (continued) | | | | | | | | |
John M. Zerr - 1962 Senior Vice President | | 2006 | | Chief Operating Officer of the Americas; Senior Vice President, Invesco Advisers, Inc. (formerly known as Invesco Institutional (N.A.), Inc.) (registered investment adviser); Senior Vice President, Invesco Distributors, Inc. (formerly known as Invesco AIM Distributors, Inc.); Director and Vice President, Invesco Investment Services, Inc. (formerly known as Invesco AIM Investment Services, Inc.) Senior Vice President, The Invesco Funds; Managing Director, Invesco Capital Management LLC; Director, Invesco Investment Advisers LLC (formerly known as Van Kampen Asset Management); Senior Vice President, Invesco Capital Markets, Inc. (formerly known as Van Kampen Funds Inc.); Manager, Invesco Indexing LLC; Manager, Invesco Specialized Products, LLC; Member, Invesco Canada Funds Advisory Board; Director, President and Chief Executive Officer, Invesco Corporate Class Inc. (corporate mutual fund company); and Director, Chairman, President and Chief Executive Officer, Invesco Canada Ltd. (formerly known as Invesco Trimark Ltd./Invesco Trimark Ltèe) (registered investment adviser and registered transfer agent); President, Invesco, Inc.; President, Invesco Global Direct Real Estate Feeder GP Ltd.; President, Invesco IP Holdings (Canada) Ltd; President, Invesco Global Direct Real Estate GP Ltd.; President, Invesco Financial Services Ltd. / Services Financiers Invesco Ltée; and Director and Chairman, Invesco Trust Company Formerly: President, Trimark Investments Ltd/Services Financiers Invesco Ltee; Director and Senior Vice President, Invesco Insurance Agency, Inc.; Director and Senior Vice President, Invesco Management Group, Inc. (formerly known as Invesco AIM Management Group, Inc.); Secretary and General Counsel, Invesco Management Group, Inc. (formerly known as Invesco AIM Management Group, Inc.); Secretary, Invesco Investment Services, Inc. (formerly known as Invesco AIM Investment Services, Inc.); Chief Legal Officer and Secretary, The Invesco Funds; Secretary and General Counsel, Invesco Investment Advisers LLC (formerly known as Van Kampen Asset Management); Secretary and General Counsel, Invesco Capital Markets, Inc. (formerly known as Van Kampen Funds Inc.); Chief Legal Officer, Invesco Exchange-Traded Fund Trust, Invesco Exchange-Traded Fund Trust II, Invesco India Exchange-Traded Fund Trust, Invesco Actively Managed Exchange-Traded Fund Trust, Invesco Actively Managed Exchange-Traded Commodity Fund Trust and Invesco Exchange-Traded Self-Indexed Fund Trust; Secretary, Invesco Indexing LLC; Director, Secretary, General Counsel and Senior Vice President, Van Kampen Exchange Corp.; Director, Vice President and Secretary, IVZ Distributors, Inc. (formerly known as INVESCO Distributors, Inc.); Director and Vice President, INVESCO Funds Group, Inc.; Director and Vice President, Van Kampen Advisors Inc.; Director, Vice President, Secretary and General Counsel, Van Kampen Investor Services Inc.; Director and Secretary, Invesco Distributors, Inc. (formerly known as Invesco AIM Distributors, Inc.); Director, Senior Vice President, General Counsel and Secretary, Invesco AIM Advisers, Inc. and Van Kampen Investments Inc.; Director, Vice President and Secretary, Fund Management Company; Director, Senior Vice President, Secretary, General Counsel and Vice President, Invesco AIM Capital Management, Inc.; and Chief Operating Officer and General Counsel, Liberty Ridge Capital, Inc. (an investment adviser) | | N/A | | N/A |
Gregory G. McGreevey - 1962 Senior Vice President | | 2012 | | Senior Managing Director, Invesco Ltd.; Director, Chairman, President, and Chief Executive Officer, Invesco Advisers, Inc. (formerly known as Invesco Institutional (N.A.), Inc.) (registered investment adviser); Director, Invesco Mortgage Capital, Inc. and Invesco Senior Secured Management, Inc.; Senior Vice President, The Invesco Funds; President, SNW Asset Management Corporation and Invesco Managed Accounts, LLC; Chairman and Director, Invesco Private Capital, Inc.; Chairman and Director, INVESCO Private Capital Investments, Inc.; Chairman and Director, INVESCO Realty, Inc.; and Senior Vice President, Invesco Group Services, Inc. Formerly: Senior Vice President, Invesco Management Group, Inc. and Invesco Advisers, Inc.; Assistant Vice President, The Invesco Funds | | N/A | | N/A |
Adrien Deberghes - 1967 Principal Financial Officer, Treasurer and Vice President | | 2020 | | Head of the Fund Office of the CFO and Fund Administration; Vice President, Invesco Advisers, Inc.; Principal Financial Officer, Treasurer and Vice President, The Invesco Funds; Vice President, Invesco Exchange-Traded Fund Trust, Invesco Exchange-Traded Fund Trust II, Invesco India Exchange-Traded Fund Trust, Invesco Actively Managed Exchange-Traded Fund Trust, Invesco Actively Managed Exchange-Traded Commodity Fund Trust and Invesco Exchange-Traded Self-Indexed Fund Trust Formerly: Senior Vice President and Treasurer, Fidelity Investments | | N/A | | N/A |
Crissie M. Wisdom - 1969 Anti-Money Laundering Compliance Officer | | 2013 | | Anti-Money Laundering and OFAC Compliance Officer for Invesco U.S. entities including: Invesco Advisers, Inc. and its affiliates, Invesco Capital Markets, Inc., Invesco Distributors, Inc., Invesco Investment Services, Inc., The Invesco Funds, Invesco Capital Management, LLC, Invesco Trust Company; and Fraud Prevention Manager for Invesco Investment Services, Inc. | | N/A | | N/A |
| | |
| T-5 | | Invesco International Bond Fund |
Trustees and Officers–(continued)
| | | | | | | | |
Name, Year of Birth and Position(s) Held with the Trust | | Trustee and/or Officer Since | | Principal Occupation(s) During Past 5 Years | | Number of Funds in Fund Complex
Overseen by
Trustee | | Other Directorship(s) Held by Trustee
During Past 5 Years |
| Officers–(continued) | | | | | | | | |
Todd F. Kuehl - 1969 Chief Compliance Officer and Senior Vice President | | 2020 | | Chief Compliance Officer, Invesco Advisers, Inc. (registered investment adviser); and Chief Compliance Officer and Senior Vice President, The Invesco Funds Formerly: Managing Director and Chief Compliance Officer, Legg Mason (Mutual Funds); Chief Compliance Officer, Legg Mason Private Portfolio Group (registered investment adviser) | | N/A | | N/A |
James Bordewick, Jr. - 1959 Senior Vice President and Senior Officer | | 2022 | | Senior Vice President and Senior Officer, The Invesco Funds; and Chief Legal Officer, KingsCrowd, Inc. (research and analytical platform for investment in private capital markets) Formerly, Chief Operating Officer and Head of Legal and Regulatory, Netcapital (private capital investment platform); Managing Director, General Counsel of asset management and Chief Compliance Officer for asset management and private banking, Bank of America Corporation; Chief Legal Officer, Columbia Funds and BofA Funds; Senior Vice President and Associate General Counsel, MFS Investment Management; Chief Legal Officer, MFS Funds; Associate, Ropes & Gray; Associate, Gaston Snow & Ely Bartlett | | N/A | | N/A |
The Statement of Additional Information of the Trust includes additional information about the Fund’s Trustees and is available upon request, without charge, by calling 1.800.959.4246. Please refer to the Fund’s Statement of Additional Information for information on the Fund’s sub-advisers.
| | | | | | |
Office of the Fund 11 Greenway Plaza, Suite 1000 Houston, TX 77046-1173 | | Investment Adviser Invesco Advisers, Inc. 1555 Peachtree Street, N.E. Atlanta, GA 30309 | | Distributor Invesco Distributors, Inc. 11 Greenway Plaza, Suite 1000 Houston, TX 77046-1173 | | Auditors PricewaterhouseCoopers LLP 1000 Louisiana Street, Suite 5800 Houston, TX 77002-5021 |
| | | |
Counsel to the Fund Stradley Ronon Stevens & Young, LLP 2005 Market Street, Suite 2600 Philadelphia, PA 19103-7018 | | Counsel to the Independent Trustees Goodwin Procter LLP 901 New York Avenue, N.W. Washington, D.C. 20001 | | Transfer Agent Invesco Investment Services, Inc. 11 Greenway Plaza, Suite 1000 Houston, TX 77046-1173 | | Custodian State Street Bank and Trust Company 225 Franklin Street Boston, MA 02110-2801 |
| | |
| T-6 | | Invesco International Bond Fund |
(This page intentionally left blank)

Go paperless with eDelivery
Visit invesco.com/edelivery to enjoy the convenience and security of anytime electronic access to your investment documents.
With eDelivery, you can elect to have any or all of the following materials delivered straight to your inbox to download, save and print from your own computer:
∎ Fund reports and prospectuses
∎ Quarterly statements
∎ Daily confirmations
∎ Tax forms
Invesco mailing information
Send general correspondence to Invesco Investment Services, Inc., P.O. Box 219078, Kansas City, MO 64121-9078.
Important notice regarding delivery of security holder documents
To reduce Fund expenses, only one copy of most shareholder documents may be mailed to shareholders with multiple accounts at the same address (Householding). Mailing of your shareholder documents may be householded indefinitely unless you instruct us otherwise. If you do not want the mailing of these documents to be combined with those for other members of your household, please contact Invesco Investment Services, Inc. at 800 959 4246 or contact your financial institution. We will begin sending you individual copies for each account within 30 days after receiving your request.
Fund holdings and proxy voting information
The Fund provides a complete list of its portfolio holdings four times each year, at the end of each fiscal quarter. For the second and fourth quarters, the list appears, respectively, in the Fund’s semiannual and annual reports to shareholders. For the first and third quarters, the Fund files the list with the Securities and Exchange Commission (SEC) as an exhibit to its reports on Form N-PORT. The most recent list of portfolio holdings is available at invesco.com/completeqtrholdings. Shareholders can also look up the Fund’s Form N-PORT filings on the SEC website, sec.gov. The SEC file numbers for the Fund are shown below.
A description of the policies and procedures that the Fund uses to determine how to vote proxies relating to portfolio securities is available without charge, upon request, from our Client Services department at 800 959 4246, or at
invesco.com/corporate/about-us/esg. The information is also available on the SEC website, sec.gov.
Information regarding how the Fund voted proxies related to its portfolio securities during the most recent 12-month period ended June 30 is available at invesco.com/proxysearch. This information is also available on the SEC website, sec.gov.
Invesco Advisers, Inc. is an investment adviser; it provides investment advisory services to individual and institutional clients and does not sell securities. Invesco Distributors, Inc. is the US distributor for Invesco Ltd.’s retail mutual funds, exchange-traded funds and institutional money market funds. Both are wholly owned, indirect subsidiaries of Invesco Ltd.

| | | | |
| SEC file number(s): 811-05426 and 033-19338 | | Invesco Distributors, Inc. | | O-IBD-AR-1 |

| | |
| | |
| Annual Report to Shareholders | | October 31, 2022 |
Invesco Macro Allocation Strategy Fund
Nasdaq:
A: GMSDX ∎ C: GMSEX ∎ R: GMSJX ∎ Y: GMSHX ∎ R5: GMSKX ∎ R6: GMSLX
Management’s Discussion of Fund Performance
| | | | |
| |
Performance summary | |
For the fiscal year ended October 31, 2022, Class A shares of Invesco Macro Allocation Strategy Fund (the Fund), at net asset value (NAV), underperformed the Bloomberg 3-Month Treasury Bellwether Index, the Fund’s broad market/style-specific benchmark. | |
Your Fund’s long-term performance appears later in this report. | |
| |
Fund vs. Indexes | |
Total returns, 10/31/21 to 10/31/22, at net asset value (NAV). Performance shown does not include applicable contingent deferred sales charges (CDSC) or front-end sales charges, which would have reduced performance. | |
Class A Shares | | | -9.88 | % |
Class C Shares | | | -10.66 | |
Class R Shares | | | -10.11 | |
Class Y Shares | | | -9.70 | |
Class R5 Shares | | | -9.69 | |
Class R6 Shares | | | -9.72 | |
Bloomberg 3-Month Treasury Bellwether Index▼ (Broad Market/Style-Specific Index) | | | 0.80 | |
Lipper Absolute Return Funds Index∎ (Peer Group Index) | | | -6.39 | |
| |
Source(s): ▼RIMES Technologies Corp.; ∎Lipper Inc. | | | | |
Market conditions and your Fund
For the fiscal year ended October 31, 2022, the Fund at NAV reported negative absolute performance as two of the major asset classes in which the Fund invests (stocks and sovereign debt) detracted from results, while the commodities exposure contributed. The Fund operates on a fully systematic platform and invests in derivatives, such as swaps, options and futures, which are expected to correspond to the performance of US and international fixed-income, equity and commodity markets. The portfolio operates on two components that fulfill specific roles for the aggregate portfolio: adaptive positioning that seeks to capitalize on the long-term characteristics of asset classes within a macro factor framework, and a diversified defense component that is designed to exhibit low correlation to broad capital markets and with that provide a level of defense to the strategy.
The adaptive positioning’s investment process involves first selecting representative assets for each asset class from a universe of more than 50 assets. Next, we seek to construct the portfolio so that an approximately equal amount of risk comes from our equity, fixed-income and commodity allocations. Tactical adjustments to the Fund’s portfolio are then made on a monthly basis to try to take advantage of shorter-term market dynamics. Here, the team introduces a module to the aggregate portfolio that is anchored on the premise that, over the long-term, asset classes typically generate an excess return over cash. This concept has a long-term orientation and therefore needs to be complemented with an overlay that takes into account the differentiated behavior of assets over the short term.
The adaptive positioning generated a negative result for the Fund for the fiscal year.
The exposures to equities, commodities and sovereign debt detracted from results. This result is consistent with the current inflationary environment that has forced global central banks to embark on highly restrictive monetary policies, a diametrically opposite stance from where we were a year ago and the emergence toward the end of the fiscal year of fears of a global recession.
The diversified defense module introduces dedicated defensive assets and strategies to the aggregate portfolio. This module is designed in a manner that we believe improves the reactivity during market turbulence.
The final portfolio is then put together seeking to achieve a long-term correlation to equities of zero. From a risk-contribution perspective, the adaptive position contributes 80% while the diversified defense contributes 20% of the portfolio’s aggregate risk.
In equities, all markets detracted from Fund results with North America performing the worst, followed by Japanese and European markets, with UK stocks performing the best. Commodities were a relative bright spot, broadly rising in response to supply chain bottlenecks, adverse weather conditions that impede transportation and also affect key agriculture asset growing regions, and a general sense of underinvestment in an asset class that never recovered from the all-time height in June of 2008. Nonetheless, the volatile nature of the market environment allowed only for a limited contribution to the Fund’s overall results during the fiscal year.
The Fund’s exposure to global government bonds detracted from Fund results as a combination of strong tightening moves across most major central banks and persistently high inflation readings reduced the attractiveness of bonds. The yield of the US 10-year Treasury reached levels not seen since the latter part of 2018. Japan was an outlier as
the Bank of Japan continued to hold rates steady at its September 2022 meeting. At the other end of the spectrum, UK gilts were hammered in September as details of the mini budget emerged. Gilts regained some ground at the end of September when the Bank of England stepped in to make temporary purchases of long-dated gilts in an effort to stabilize bond yields and prevent pensions from failing. Rate hikes in the US and Canada, along with a hotter-than-expected consumer price index print in the US, served to push yields higher in North America. The Federal Reserve also doubled the pace of its quantitative tightening efforts during the fiscal year. German bund yields also rose on comments from President Lagarde that indicated rates were far from where they need to be to counter inflation.
Within the diversified defense module, only the dedicated sovereign debt exposure detracted from Fund results. The other defensive assets and strategies, including long put options, defensive equity factor exposure and optimal roll within commodities, delivered positive results.
Please note that our strategy is principally implemented with derivative instruments that include futures, options and total return swaps. Therefore, all or most of the performance of the strategy, both positive and negative, can be attributed to these instruments. Derivatives can be a cost-effective way to gain exposure to asset classes. However, derivatives may amplify traditional investment risks through the creation of leverage and may be less liquid than traditional securities.
We thank you for your investment in Invesco Macro Allocation Strategy Fund.
Portfolio manager(s):
Mark Ahnrud
John Burrello
Chris Devine
Scott Hixon
Christian Ulrich
Scott Wolle - Lead
The views and opinions expressed in management’s discussion of Fund performance are those of Invesco Advisers, Inc. and its affiliates. These views and opinions are subject to change at any time based on factors such as market and economic conditions. These views and opinions may not be relied upon as investment advice or recommendations, or as an offer for a particular security. The information is not a complete analysis of every aspect of any market, country, industry, security or the Fund. Statements of fact are from sources considered reliable, but Invesco Advisers, Inc. makes no representation or warranty as to their completeness or accuracy. Although historical performance is no guarantee of future results, these insights may help you understand our investment management philosophy.
See important Fund and, if applicable, index disclosures later in this report.
| | |
| 2 | | Invesco Macro Allocation Strategy Fund |
Your Fund’s Long-Term Performance
Results of a $10,000 Investment – Oldest Share Class(es)
Fund and index data from 10/31/12
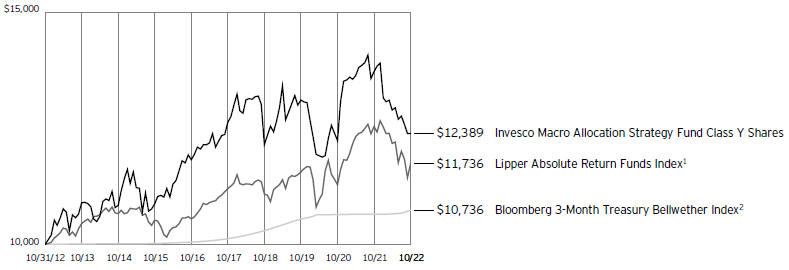
1 Source: Lipper Inc.
2 Source: RIMES Technologies Corp.
Past performance cannot guarantee future results.
The data shown in the chart include reinvested distributions, applicable sales charges and Fund expenses including management
fees. Index results include reinvested dividends, but they do not reflect sales charges. Performance of the peer group, if applicable, reflects fund expenses and management fees;
performance of a market index does not. Performance shown in the chart does not reflect deduction of taxes a shareholder would pay on Fund distributions or sale of Fund shares.
| | |
| 3 | | Invesco Macro Allocation Strategy Fund |
| | | | |
| |
Average Annual Total Returns | |
As of 10/31/22, including maximum applicable sales charges | |
| |
Class A Shares | | | | |
10 Years | | | 1.33 | % |
5 Years | | | -1.74 | |
1 Year | | | -14.81 | |
| |
Class C Shares | | | | |
10 Years | | | 1.25 | % |
5 Years | | | -1.38 | |
1 Year | | | -11.49 | |
| |
Class R Shares | | | | |
10 Years | | | 1.68 | % |
5 Years | | | -0.86 | |
1 Year | | | -10.11 | |
| |
Class Y Shares | | | | |
Inception (9/26/12) | | | 2.05 | % |
10 Years | | | 2.17 | |
5 Years | | | -0.39 | |
1 Year | | | -9.70 | |
| |
Class R5 Shares | | | | |
10 Years | | | 2.18 | % |
5 Years | | | -0.38 | |
1 Year | | | -9.69 | |
| |
Class R6 Shares | | | | |
10 Years | | | 2.16 | % |
5 Years | | | -0.39 | |
1 Year | | | -9.72 | |
On August 28, 2013, Class H1 shares converted to Class Y shares.
Class A, Class C and Class R shares incepted on August 28, 2013. Performance shown prior to that date is that of Class Y shares at net asset value, restated to reflect the higher 12b-1 fees applicable to Class A, Class C and Class R shares.
Class R5 shares and Class R6 shares incepted on August 28, 2013. Performance shown prior to that date is that of Class Y shares at net asset value.
The performance data quoted represent past performance and cannot guarantee future results; current performance may be lower or higher. Please visit invesco.com/performance for the most recent month-end performance. Performance figures reflect reinvested distributions, changes in net asset value and the effect of the maximum sales charge unless otherwise stated. Performance figures do not reflect deduction of taxes a shareholder would pay on Fund distributions or sale of Fund shares. Investment return and principal value will fluctuate so that you may have a gain or loss when you sell shares.
Class A share performance reflects the maximum 5.50% sales charge, and Class C share performance reflects the applicable contingent deferred sales charge (CDSC) for the period involved. The CDSC on Class C shares is 1% for the first year after purchase. Class R, Class Y, Class R5 and Class R6 shares do not have a front-end
sales charge or a CDSC; therefore, performance is at net asset value.
The performance of the Fund’s share classes will differ primarily due to different sales charge structures and class expenses.
Fund performance reflects any applicable fee waivers and/or expense reimbursements. Had the adviser not waived fees and/or reimbursed expenses currently or in the past, returns would have been lower. See current prospectus for more information.
| | |
| 4 | | Invesco Macro Allocation Strategy Fund |
Supplemental Information
Invesco Macro Allocation Strategy Fund’s investment objective is to seek a positive absolute return over a complete economic and market cycle.
| ∎ | Unless otherwise stated, information presented in this report is as of October 31, 2022, and is based on total net assets. |
| ∎ | Unless otherwise noted, all data is provided by Invesco. |
| ∎ | To access your Fund’s reports/prospectus, visit invesco.com/fundreports. |
About indexes used in this report
| ∎ | The Bloomberg 3-Month Treasury Bellwether Index measures the performance of treasury bills with maturities of less than three months. |
| ∎ | The Lipper Absolute Return Funds Index is an unmanaged index considered representative of absolute return funds tracked by Lipper. |
| ∎ | The Fund is not managed to track the performance of any particular index, including the index(es) described here, and consequently, the performance of the Fund may deviate significantly from the performance of the index(es). |
| ∎ | A direct investment cannot be made in an index. Unless otherwise indicated, index results include reinvested dividends, and they do not reflect sales charges. Performance of the peer group, if applicable, reflects fund expenses; performance of a market index does not. |
|
|
This report must be accompanied or preceded by a currently effective Fund prospectus, which contains more complete information, including sales charges and expenses. Investors should read it carefully before investing. |
|
| NOT FDIC INSURED | MAY LOSE VALUE | NO BANK GUARANTEE |
| | |
| 5 | | Invesco Macro Allocation Strategy Fund |
Fund Information
Notional Asset Weights as of October 31, 2022
| | | | |
| Asset Class | | Notional Asset Weights* | |
| |
Equities | | | -5.09 | % |
| |
Fixed Income | | | 44.27 | |
| |
Commodities | | | 27.35 | |
| |
Options | | | 60.64 | |
| |
Total | | | 127.17 | % |
| * | Total Notional Asset Weights greater than 100% is achieved through derivatives and other instruments that create leverage. |
| | |
| 6 | | Invesco Macro Allocation Strategy Fund |
Consolidated Schedule of Investments
October 31, 2022
| | | | | | | | | | | | | | |
| | | Interest
Rate | | | Maturity
Date | | | Principal
Amount
(000) | | | Value |
U.S. Treasury Securities–42.59%(a) | | | | | | | | | | | | | | |
U.S. Treasury Bills–13.02% | | | | | | | | | | | | | | |
| | | | |
U.S. Treasury Bills | | | 1.48% | | | | 11/25/2022 | | | $ | 10,630 | | | $ 10,619,583 |
| | | | |
U.S. Treasury Bills | | | 1.71% | | | | 12/08/2022 | | | | 1,540 | | | 1,537,278 |
| | | | |
U.S. Treasury Bills | | | 3.39% | | | | 03/09/2023 | | | | 8,300 | | | 8,176,643 |
| | | | |
| | | | | | | | | | | | | | | 20,333,504 |
| | | | |
U.S. Treasury Floating Rate Notes–29.57% | | | | | | | | | | | | | | |
| | | | |
U.S. Treasury Floating Rate Notes (3 mo. U.S. Treasury Bill Money Market Yield Rate - 0.02%)(b) | | | 4.09% | | | | 01/31/2024 | | | | 23,500 | | | 23,497,334 |
| | | | |
U.S. Treasury Floating Rate Notes (3 mo. U.S. Treasury Bill Money Market Yield Rate - 0.08%)(b) | | | 4.04% | | | | 04/30/2024 | | | | 22,700 | | | 22,667,036 |
| | | | |
| | | | | | | | | | | | | | | 46,164,370 |
| | | | |
Total U.S. Treasury Securities (Cost $66,558,586) | | | | | | | | | | | | | | 66,497,874 |
| | | | |
| | | | | | | | | Shares | | | |
Money Market Funds–39.58% | | | | | | | | | | | | | | |
| | | | |
Invesco Government & Agency Portfolio, Institutional Class, 3.07%(c)(d) | | | | | | | | | | | 28,357,639 | | | 28,357,639 |
| | | | |
Invesco Liquid Assets Portfolio, Institutional Class, 3.03%(c)(d) | | | | | | | | | | | 9,054,524 | | | 9,056,334 |
| | | | |
Invesco Liquidity Funds PLC, Invesco US Dollar Liquidity Portfolio (Ireland), Institutional Class, 3.16%(c)(d) | | | | | | | | | | | 10,138,306 | | | 10,138,306 |
| | | | |
Invesco Treasury Portfolio, Institutional Class, 3.08%(c)(d) | | | | | | | | | | | 14,239,588 | | | 14,239,588 |
| | | | |
Total Money Market Funds (Cost $61,788,615) | | | | | | | | | | | | | | 61,791,867 |
| | | | |
Options Purchased–5.28% | | | | | | | | | | | | | | |
| | | | |
(Cost $7,904,738)(e) | | | | | | | | | | | | | | 8,235,440 |
| | | | |
TOTAL INVESTMENTS IN SECURITIES–87.45% (Cost $136,251,939) | | | | | | | | | | | | | | 136,525,181 |
| | | | |
OTHER ASSETS LESS LIABILITIES–12.55% | | | | | | | | | | | | | | 19,590,973 |
| | | | |
NET ASSETS–100.00% | | | | | | | | | | | | | | $156,116,154 |
Notes to Consolidated Schedule of Investments:
| (a) | Security traded on a discount basis. The interest rate shown represents the discount rate at the time of purchase by the Fund. |
| (b) | Interest or dividend rate is redetermined periodically. Rate shown is the rate in effect on October 31, 2022. |
| (c) | Affiliated issuer. The issuer and/or the Fund is a wholly-owned subsidiary of Invesco Ltd., or is affiliated by having an investment adviser that is under common control of Invesco Ltd. The table below shows the Fund’s transactions in, and earnings from, its investments in affiliates for the fiscal year ended October 31, 2022. |
| | | | | | | | | | | | | | | | | | | | | | | | | | | | |
| | | Value
October 31, 2021 | | | Purchases
at Cost | | | Proceeds
from Sales | | | Change in
Unrealized
Appreciation | | | Realized
Gain
(Loss) | | | Value
October 31, 2022 | | | Dividend Income | |
| | | | | | | |
Investments in Affiliated Money Market Funds: | | | | | | | | | | | | | | | | | | | | | | | | | | | | |
| | | | | | | |
Invesco Government & Agency Portfolio, Institutional Class | | $ | 53,989,266 | | | $ | 112,863,541 | | | $ | (138,495,168) | | | $ | - | | | $ | - | | | $ | 28,357,639 | | | $ | 264,751 | |
| | | | | | | |
Invesco Liquid Assets Portfolio, Institutional Class | | | 18,897,176 | | | | 79,059,672 | | | | (88,896,548) | | | | 3,946 | | | | (7,912) | | | | 9,056,334 | | | | 99,894 | |
| | | | | | | |
Invesco Liquidity Funds PLC, Invesco US Dollar Liquidity Portfolio, Institutional Class | | | 20,435,916 | | | | 91,994,080 | | | | (102,291,690) | | | | - | | | | - | | | | 10,138,306 | | | | 104,957 | |
| | | | | | | |
Invesco Treasury Portfolio, Institutional Class | | | 29,978,590 | | | | 126,495,475 | | | | (142,234,477) | | | | - | | | | - | | | | 14,239,588 | | | | 147,615 | |
| | | | | | | |
| Investments Purchased with Cash Collateral from Securities on Loan: | | | | | | | | | | | | | | | | | | | | | | | | | | | | |
| | | | | | | |
Invesco Private Government Fund | | | - | | | | 729 | | | | (729) | | | | - | | | | - | | | | - | | | | 1* | |
| | | | | | | |
Invesco Private Prime Fund | | | - | | | | 4,406,400 | | | | (4,406,841) | | | | - | | | | 441 | | | | - | | | | 288* | |
| | | | | | | |
Total | | $ | 123,300,948 | | | $ | 414,819,897 | | | $ | (476,325,453) | | | $ | 3,946 | | | $ | (7,471) | | | $ | 61,791,867 | | | $ | 617,506 | |
| | * | Represents the income earned on the investment of cash collateral, which is included in securities lending income on the Consolidated Statement of Operations. Does not include rebates and fees paid to lending agent or premiums received from borrowers, if any. |
| (d) | The rate shown is the 7-day SEC standardized yield as of October 31, 2022. |
| (e) | The table below details options purchased. |
See accompanying Notes to Consolidated Financial Statements which are an integral part of the financial statements.
| | |
| 7 | | Invesco Macro Allocation Strategy Fund |
| | | | | | | | | | | | | | | | | | | | | | | | | | | | | | |
| Open Exchange-Traded Index Options Purchased(a) |
| Description | | Type of
Contract | | | Expiration
Date | | | Number of
Contracts | | | Exercise Price | | | Notional Value* | | | Value |
| | | | | | | | |
Equity Risk | | | | | | | | | | | | | | | | | | | | | | | | | | | | | | |
| | | | | | | | |
S&P 500 Index | | | Put | | | | 09/15/2023 | | | | 16 | | | | USD | | | | 3,900.00 | | | | USD | | | | 6,240,000 | | | $ 494,560 |
| | | | | | | | |
S&P 500 Index | | | Put | | | | 10/20/2023 | | | | 16 | | | | USD | | | | 3,625.00 | | | | USD | | | | 5,800,000 | | | 364,880 |
| | | | | | | | |
S&P 500 Index | | | Put | | | | 08/18/2023 | | | | 16 | | | | USD | | | | 4,075.00 | | | | USD | | | | 6,520,000 | | | 598,400 |
| | | | | | | | |
S&P 500 Index | | | Put | | | | 11/18/2022 | | | | 16 | | | | USD | | | | 4,450.00 | | | | USD | | | | 7,120,000 | | | 918,640 |
| | | | | | | | |
S&P 500 Index | | | Put | | | | 12/16/2022 | | | | 16 | | | | USD | | | | 4,475.00 | | | | USD | | | | 7,160,000 | | | 948,800 |
| | | | | | | | |
S&P 500 Index | | | Put | | | | 01/20/2023 | | | | 16 | | | | USD | | | | 4,650.00 | | | | USD | | | | 7,440,000 | | | 1,199,280 |
| | | | | | | | |
S&P 500 Index | | | Put | | | | 02/17/2023 | | | | 16 | | | | USD | | | | 4,375.00 | | | | USD | | | | 7,000,000 | | | 800,880 |
| | | | | | | | |
S&P 500 Index | | | Put | | | | 03/17/2023 | | | | 16 | | | | USD | | | | 4,175.00 | | | | USD | | | | 6,680,000 | | | 586,000 |
| | | | | | | | |
S&P 500 Index | | | Put | | | | 04/21/2023 | | | | 16 | | | | USD | | | | 4,450.00 | | | | USD | | | | 7,120,000 | | | 910,240 |
| | | | | | | | |
S&P 500 Index | | | Put | | | | 06/16/2023 | | | | 16 | | | | USD | | | | 4,025.00 | | | | USD | | | | 6,440,000 | | | 522,560 |
| | | | | | | | |
S&P 500 Index | | | Put | | | | 07/21/2023 | | | | 16 | | | | USD | | | | 3,750.00 | | | | USD | | | | 6,000,000 | | | 369,680 |
| | | | | | | | |
S&P 500 Index | | | Put | | | | 05/19/2023 | | | | 16 | | | | USD | | | | 4,050.00 | | | | USD | | | | 6,480,000 | | | 521,520 |
| | | | | | | | |
Total Index Options Purchased | | | | | | | | | | | | | | | | | | | | | | | | | | | | | | $8,235,440 |
| (a) | Open Exchange-Traded Index Options Purchased collateralized by $4,095,000 cash held with Morgan Stanley & Co. |
| * | Notional Value is calculated by multiplying the Number of Contracts by the Exercise Price by the multiplier. |
| | | | | | | | | | | | | | | | | | | | |
| Open Futures Contracts(a) | |
|
| |
| Long Futures Contracts | | Number of
Contracts | | | Expiration
Month | | | Notional
Value | | | Value | | | Unrealized
Appreciation
(Depreciation) | |
|
| |
Commodity Risk | | | | | | | | | | | | | | | | | | | | |
|
| |
Brent Crude | | | 30 | | | | December-2022 | | | $ | 2,730,600 | | | $ | 181,360 | | | $ | 181,360 | |
|
| |
Coffee ’C’ | | | 7 | | | | March-2023 | | | | 456,881 | | | | (84,203 | ) | | | (84,203 | ) |
|
| |
Corn | | | 46 | | | | December-2022 | | | | 1,590,450 | | | | 81,031 | | | | 81,031 | |
|
| |
Cotton No. 2 | | | 2 | | | | December-2022 | | | | 72,000 | | | | (20,924 | ) | | | (20,924 | ) |
|
| |
Gasoline Reformulated Blendstock Oxygenate Blending | | | 29 | | | | November-2022 | | | | 3,076,303 | | | | 55,354 | | | | 55,354 | |
|
| |
Low Sulphur Gas Oil | | | 40 | | | | December-2022 | | | | 4,079,000 | | | | 259,056 | | | | 259,056 | |
|
| |
Natural Gas | | | 43 | | | | November-2022 | | | | 2,732,650 | | | | (599,941 | ) | | | (599,941 | ) |
|
| |
New York Harbor Ultra-Low Sulfur Diesel | | | 26 | | | | November-2022 | | | | 4,012,117 | | | | 120,908 | | | | 120,908 | |
|
| |
Soybeans | | | 23 | | | | July-2023 | | | | 1,653,988 | | | | 26,219 | | | | 26,219 | |
|
| |
Soybean Meal | | | 45 | | | | December-2022 | | | | 1,926,450 | | | | 122,289 | | | | 122,289 | |
|
| |
Soybean Oil | | | 7 | | | | December-2022 | | | | 307,482 | | | | 36,863 | | | | 36,863 | |
|
| |
WTI Crude | | | 33 | | | | January-2023 | | | | 2,775,300 | | | | 53,679 | | | | 53,679 | |
|
| |
Subtotal | | | | | | | | | | | | | | | 231,691 | | | | 231,691 | |
|
| |
Equity Risk | | | | | | | | | | | | | | | | | | | | |
|
| |
E-Mini S&P 500 Index | | | 47 | | | | December-2022 | | | | 9,125,050 | | | | 385,892 | | | | 385,892 | |
|
| |
FTSE 100 Index | | | 29 | | | | December-2022 | | | | 2,363,754 | | | | (123,175 | ) | | | (123,175 | ) |
|
| |
Tokyo Stock Price Index | | | 4 | | | | December-2022 | | | | 518,108 | | | | 4,483 | | | | 4,483 | |
|
| |
Subtotal | | | | | | | | | | | | | | | 267,200 | | | | 267,200 | |
|
| |
Interest Rate Risk | | | | | | | | | | | | | | | | | | | | |
|
| |
Australia 10 Year Bonds | | | 296 | | | | December-2022 | | | | 22,432,885 | | | | (281,569 | ) | | | (281,569 | ) |
|
| |
Canada 10 Year Bonds | | | 217 | | | | December-2022 | | | | 19,596,660 | | | | (294,569 | ) | | | (294,569 | ) |
|
| |
Euro-Bund | | | 65 | | | | December-2022 | | | | 8,892,864 | | | | (439,813 | ) | | | (439,813 | ) |
|
| |
Japan 10 Year Bonds | | | 6 | | | | December-2022 | | | | 6,003,026 | | | | 6,891 | | | | 6,891 | |
|
| |
Long Gilt | | | 96 | | | | December-2022 | | | | 11,243,773 | | | | (305,572 | ) | | | (305,572 | ) |
|
| |
U.S. Treasury Long Bonds | | | 22 | | | | December-2022 | | | | 2,651,000 | | | | (179,260 | ) | | | (179,260 | ) |
|
| |
Subtotal | | | | | | | | | | | | | | | (1,493,892 | ) | | | (1,493,892 | ) |
|
| |
Subtotal-Long Futures Contracts | | | | | | | | | | | | | | | (995,001 | ) | | | (995,001 | ) |
|
| |
See accompanying Notes to Consolidated Financial Statements which are an integral part of the financial statements.
| | |
| 8 | | Invesco Macro Allocation Strategy Fund |
| | | | | | | | | | | | | | | | | | | | |
| Open Futures Contracts(a)–(continued) | |
|
| |
| Short Futures Contracts | | Number of
Contracts | | | Expiration
Month | | | Notional
Value | | | Value | | | Unrealized
Appreciation
(Depreciation) | |
|
| |
Commodity Risk | | | | | | | | | | | | | | | | | | | | |
|
| |
Cocoa | | | 61 | | | | March-2023 | | | $ | (1,429,230 | ) | | $ | 21,994 | | | | $ 21,994 | |
|
| |
Gold 100 oz. | | | 58 | | | | December-2022 | | | | (9,516,060 | ) | | | 736,388 | | | | 736,388 | |
|
| |
Kansas City Wheat | | | 18 | | | | December-2022 | | | | (880,875 | ) | | | (90,925 | ) | | | (90,925 | ) |
|
| |
Lean Hogs | | | 15 | | | | December-2022 | | | | (509,550 | ) | | | (5,080 | ) | | | (5,080 | ) |
|
| |
Live Cattle | | | 38 | | | | December-2022 | | | | (2,317,620 | ) | | | (59,170 | ) | | | (59,170 | ) |
|
| |
LME Nickel | | | 29 | | | | December-2022 | | | | (3,784,848 | ) | | | (67,320 | ) | | | (67,320 | ) |
|
| |
Silver | | | 67 | | | | December-2022 | | | | (6,404,865 | ) | | | 842 | | | | 842 | |
|
| |
Sugar No. 11 | | | 44 | | | | February-2023 | | | | (885,562 | ) | | | (15,699 | ) | | | (15,699 | ) |
|
| |
Wheat | | | 25 | | | | December-2022 | | | | (1,102,812 | ) | | | 117,396 | | | | 117,396 | |
|
| |
Subtotal | | | | | | | | | | | | | | | 638,426 | | | | 638,426 | |
|
| |
Equity Risk | | | | | | | | | | | | | | | | | | | | |
|
| |
E-Mini Russell 2000 Index | | | 12 | | | | December-2022 | | | | (1,111,800 | ) | | | (81,029 | ) | | | (81,029 | ) |
|
| |
EURO STOXX 50 Index | | | 43 | | | | December-2022 | | | | (1,537,460 | ) | | | (99,094 | ) | | | (99,094 | ) |
|
| |
MSCI EAFE Index | | | 130 | | | | December-2022 | | | | (11,413,350 | ) | | | 625,332 | | | | 625,332 | |
|
| |
MSCI Emerging Markets Index | | | 212 | | | | December-2022 | | | | (9,048,160 | ) | | | 1,276,012 | | | | 1,276,012 | |
|
| |
S&P/TSX 60 Index | | | 43 | | | | December-2022 | | | | (7,433,743 | ) | | | (189,149 | ) | | | (189,149 | ) |
|
| |
Subtotal | | | | | | | | | | | | | | | 1,532,072 | | | | 1,532,072 | |
|
| |
Subtotal–Short Futures Contracts | | | | | | | | | | | | | | | 2,170,498 | | | | 2,170,498 | |
|
| |
Total Futures Contracts | | | | | | | | | | | | | | $ | 1,175,497 | | | | $1,175,497 | |
|
| |
| (a) | Futures contracts collateralized by $14,695,000 cash held with Goldman Sachs & Co. LLC, the futures commission merchant. |
| | | | | | | | | | | | | | | | | | | | | | | | | | | | | | | | |
| Open Over-The-Counter Total Return Swap Agreements(a)(b) | |
|
| |
| Counterparty | | Pay/
Receive | | Reference Entity(c) | | Fixed
Rate | | | Payment
Frequency | | Number of
Contracts | | | Maturity Date | | Notional Value | | | Upfront
Payments
Paid
(Received) | | | Value | | | Unrealized
Appreciation
(Depreciation) | |
|
| |
Commodity Risk | | | | | | | | | | | | | | | | | | | | | | | | | | | | | | |
|
| |
Canadian Imperial Bank of Commerce | | Pay | | Canadian Imperial Bank of Commerce Dynamic Roll LME Copper Excess Return Index 2 | | | 0.27% | | | Monthly | | | 7,000 | | | August–2023 | | USD | 646,546 | | | | $– | | | $ | 10,419 | | | | $ 10,419 | |
|
| |
Commodity Risk | | | | | | | | | | | | | | | | | | | | | | | | | | | | | | |
|
| |
Macquarie Bank Ltd. | | Receive | | Macquarie F6 Carry Alpha Index | | | 0.32 | | | Monthly | | | 171,050 | | | April–2023 | | USD | 46,781,320 | | | | – | | | | (243,182 | ) | | | (243,182 | ) |
|
| |
Morgan Stanley Capital Services LLC | | Pay | | S&P GSCI Aluminum Dynamic Roll Index Excess Return | | | 0.03 | | | Monthly | | | 22,550 | | | June–2023 | | USD | 2,345,229 | | | | – | | | | (2,363 | ) | | | (2,363 | ) |
|
| |
Subtotal – Depreciation | | | | | | | | | | | | | | | | | | | – | | | | (245,545 | ) | | | (245,545 | ) |
|
| |
Total – Total Return Swap Agreements | | | | | | | | | | | | | | | | $– | | | $ | (235,126 | ) | | | $(235,126 | ) |
|
| |
| (a) | Open Over-The-Counter Total Return Swap Agreements are collateralized by cash held with the swap Counterparties in the amount of $520,000. |
| (b) | The Fund receives or pays payments based on any positive or negative return on the Reference Entity, respectively. |
| (c) | The Reference Entity Components table below includes additional information regarding the underlying components of certain reference entities that are not publicly available. |
See accompanying Notes to Consolidated Financial Statements which are an integral part of the financial statements.
| | |
| 9 | | Invesco Macro Allocation Strategy Fund |
| | | | | | | | | | | | | | | | | | | | | | | | | | | | | | | | | | | | | | | | | | |
| Open Over-The-Counter Total Return Swap Agreements(a)(b) | |
|
| |
| Counterparty | | Pay/
Receive | | | Reference Entity | | Floating
Rate
Index | | | Payment
Frequency | | | Number of
Contracts | | | Maturity Date | | | Notional Value | | | Upfront
Payments
Paid
(Received) | | | Value | | | Unrealized
Appreciation
(Depreciation) | |
|
| |
| | | | | | | | | | | |
Equity Risk | | | | | | | | | | | | | | | | | | | | | | | | | | | | | | | | | | | | | | | | | | |
|
| |
| | | | | | | | | | | |
BNP Paribas S.A. | | | Receive | | | Invesco U.S. Low Volatility Total Return Index | |
| SOFR +
0.050% |
| | | Monthly | | | | 531 | | | | November–2022 | | | | USD | | | | 2,970,653 | | | | $– | | | $ | 188,016 | | | $ | 188,016 | |
|
| |
| | | | | | | | | | | |
BNP Paribas S.A. | | | Receive | | | Invesco US Large Cap Broad Quality Total Return Index | |
| SOFR +
0.280% |
| | | Monthly | | | | 400 | | | | November–2022 | | | | USD | | | | 3,259,932 | | | | – | | | | 138,536 | | | | 138,536 | |
|
| |
| | | | | | | | | | | |
BNP Paribas S.A. | | | Receive | | | MSCI EAFE Minimum Volatility Daily Net Total Return Index | |
| SOFR +
0.340% |
| | | Monthly | | | | 1,987 | | | | February–2023 | | | | USD | | | | 3,345,432 | | | | – | | | | 83,414 | | | | 83,414 | |
|
| |
| | | | | | | | | | | |
Citibank, N.A. | | | Receive | | | MSCI EAFE Minimum Volatility Daily Net Total Return Index | |
| SOFR +
0.410% |
| | | Monthly | | | | 243 | | | | February–2023 | | | | USD | | | | 409,273 | | | | – | | | | 10,058 | | | | 10,058 | |
|
| |
| | | | | | | | | | | |
Citibank, N.A. | | | Receive | | | MSCI EAFE Momentum Index | |
| SOFR +
0.300% |
| | | Monthly | | | | 710 | | | | February–2023 | | | | USD | | | | 3,696,090 | | | | – | | | | 169,512 | | | | 169,512 | |
|
| |
| | | | | | | | | | | |
Citibank, N.A. | | | Receive | | | MSCI EAFE Quality Index | |
| SOFR +
0.350% |
| | | Monthly | | | | 1,010 | | | | February–2023 | | | | USD | | | | 3,697,842 | | | | – | | | | 154,453 | | | | 154,453 | |
|
| |
| | | | | | | | | | | |
Goldman Sachs International | | | Receive | | | Invesco U.S. Low Volatility Total Return Index | |
| SOFR +
0.200% |
| | | Monthly | | | | 124 | | | | November–2022 | | | | USD | | | | 693,712 | | | | – | | | | 43,906 | | | | 43,906 | |
|
| |
| | | | | | | | | | | |
Goldman Sachs International | | | Receive | | | MSCI Emerging Markets Minimum Volatility Index | |
| SOFR +
0.800% |
| | | Monthly | | | | 60 | | | | December–2022 | | | | USD | | | | 100,024 | | | | – | | | | 422 | | | | 422 | |
|
| |
| | | | | | | | | | | |
J.P. Morgan Chase Bank, N.A. | | | Receive | | | Invesco US Large Cap Broad Price Momentum Index | |
| SOFR +
0.230% |
| | | Monthly | | | | 45 | | | | November–2022 | | | | USD | | | | 306,111 | | | | – | | | | 23,635 | | | | 23,635 | |
|
| |
| | | | | | | | | | | |
J.P. Morgan Chase Bank, N.A. | | | Receive | | | Invesco US Large Cap Broad Price Momentum Total Return Index | |
| SOFR +
0.280% |
| | | Monthly | | | | 485 | | | | November–2022 | | | | USD | | | | 3,299,198 | | | | – | | | | 254,728 | | | | 254,728 | |
|
| |
| | | | | | | | | | | |
J.P. Morgan Chase Bank, N.A. | | | Receive | | | Invesco US Large Cap Broad Quality Total Return Index | |
| SOFR +
0.240% |
| | | Monthly | | | | 45 | | | | November–2022 | | | | USD | | | | 366,742 | | | | – | | | | 15,585 | | | | 15,585 | |
|
| |
| | | | | | | | | | | |
J.P. Morgan Chase Bank, N.A. | | | Receive | | | MSCI Emerging Markets Minimum Volatility Index | |
| SOFR +
0.680% |
| | | Monthly | | | | 3,220 | | | | December–2022 | | | | USD | | | | 5,367,933 | | | | – | | | | 22,637 | | | | 22,637 | |
|
| |
| | | | | | | | | |
Subtotal – Appreciation | | | | | | | | | | | | | | | | | | | | | | | | | | | – | | | | 1,104,902 | | | | 1,104,902 | |
|
| |
| | | | | | | | | | | |
Equity Risk | | | | | | | | | | | | | | | | | | | | | | | | | | | | | | | | | | | | | | | | | | |
|
| |
| | | | | | | | | | | |
J.P. Morgan Chase Bank, N.A. | | | Receive | | | Invesco Emerging Markets + Korea Large Cap Broad Price Momentum Net Total Return Index | |
| SOFR +
0.550% |
| | | Monthly | | | | 920 | | | | November–2022 | | | | USD | | | | 5,498,987 | | | | – | | | | (71,454 | ) | | | (71,454 | ) |
|
| |
| | | | | | | |
Total – Total Return Swap Agreements | | | | | | | | | | | | | | | | | | | | $– | | | $ | 1,033,448 | | | $ | 1,033,448 | |
|
| |
| (a) | Open Over-The-Counter Total Return Swap Agreements are collateralized by cash held with the swap Counterparties in the amount of $520,000. |
| (b) | The Fund receives or pays payments based on any positive or negative return on the Reference Entity, respectively. |
| | | | | | |
| Reference Entity Components | |
| Reference Entity | | Underlying Components | | Percentage | |
| Canadian Imperial Bank of Commerce Dynamic Roll LME Copper Excess Return Index 2 | | | | | | |
| | | | |
| Long Futures Contracts | | | |
|
| |
Copper | | | 100% | |
|
| |
See accompanying Notes to Consolidated Financial Statements which are an integral part of the financial statements.
| | |
| 10 | | Invesco Macro Allocation Strategy Fund |
Reference Entity Components–(continued)
| | | | |
| Reference Entity | | Underlying Components | | Percentage |
Macquarie F6 Carry Alpha Index
| | |
| Long Futures Contracts | | |
| |
Aluminum | | 4.26% |
| |
Coffee ‘C’ | | 2.55% |
| |
Copper | | 5.48% |
| |
Corn | | 8.19% |
| |
Cotton No. 2 | | 1.23% |
| |
Heating Oil | | 3.29% |
| |
KC HRW Wheat | | 2.59% |
| |
Lean Hogs | | 2.86% |
| |
Live Cattle | | 5.23% |
| |
Low Sulphur Gasoil | | 4.26% |
| |
Natural Gas | | 15.16% |
| |
Nickel | | 3.88% |
| |
RBOB Gasoline | | 3.21% |
| |
Soybean Meal | | 4.46% |
| |
Soybean Oil | | 4.45% |
| |
Soybeans | | 7.70% |
| |
Sugar No. 11 | | 3.23% |
| |
Wheat | | 4.27% |
| |
WTI Crude | | 10.58% |
| |
Zinc | | 3.12% |
| |
Total | | 100% |
Macquarie F6 Carry Alpha Index
| | |
| Short Futures Contracts | | |
| |
Aluminum | | (3.85)% |
| |
Coffee ‘C’ | | (2.40)% |
| |
Copper | | (5.10)% |
| |
Corn | | (7.56)% |
| |
Cotton No. 2 | | (1.13)% |
| |
Heating Oil | | (3.61)% |
| |
KC HRW Wheat | | (2.40)% |
| |
Lean Hogs | | (2.18)% |
| |
Live Cattle | | (4.78)% |
| |
Low Sulphur Gasoil | | (4.54)% |
| |
Natural Gas | | (19.80)% |
| |
Nickel | | (3.52)% |
| |
RBOB Gasoline | | (2.81)% |
| |
Soybean Meal | | (4.27)% |
| |
Soybean Oil | | (4.47)% |
| |
Soybeans | | (7.00)% |
| |
Sugar No. 11 | | (3.24)% |
| |
Wheat | | (3.79)% |
| |
WTI Crude | | (10.58)% |
| |
Zinc | | (2.97)% |
| |
Total | | 100% |
S&P GSCI Aluminum Dynamic Roll Index Excess Return
| | |
| Long Futures Contracts | | |
| |
Aluminum | | 100% |
See accompanying Notes to Consolidated Financial Statements which are an integral part of the financial statements.
| | |
| 11 | | Invesco Macro Allocation Strategy Fund |
Abbreviations:
SOFR –Secured Overnight Financing Rate
USD –U.S. Dollar
See accompanying Notes to Consolidated Financial Statements which are an integral part of the financial statements.
| | |
| 12 | | Invesco Macro Allocation Strategy Fund |
Consolidated Statement of Assets and Liabilities
October 31, 2022
| | | | |
Assets: | | | | |
| |
Investments in unaffiliated securities, at value (Cost $74,463,324) | | $ | 74,733,314 | |
|
| |
Investments in affiliated money market funds, at value (Cost $61,788,615) | | | 61,791,867 | |
|
| |
Other investments: | | | | |
LME futures contracts receivable | | | 204,873 | |
|
| |
Unrealized appreciation on swap agreements – OTC | | | 1,115,321 | |
|
| |
Deposits with brokers: | | | | |
Cash collateral – exchange-traded futures contracts | | | 14,695,000 | |
|
| |
Cash collateral – exchange-traded options contracts | | | 4,095,000 | |
|
| |
Cash collateral – OTC Derivatives | | | 520,000 | |
|
| |
Foreign currencies, at value (Cost $31) | | | 25 | |
|
| |
Receivable for: | | | | |
Fund shares sold | | | 5,439 | |
|
| |
Dividends | | | 161,294 | |
|
| |
Interest | | | 5,129 | |
|
| |
Investment for trustee deferred compensation and retirement plans | | | 20,258 | |
|
| |
Other assets | | | 53,727 | |
|
| |
Total assets | | | 157,401,247 | |
|
| |
| |
Liabilities: | | | | |
Other investments: | | | | |
Variation margin payable – non-LME futures contracts | | | 191,182 | |
|
| |
Swaps payable – OTC | | | 250,881 | |
|
| |
Unrealized depreciation on LME futures contracts | | | 67,320 | |
|
| |
Unrealized depreciation on swap agreements–OTC | | | 316,999 | |
|
| |
Payable for: | | | | |
Fund shares reacquired | | | 211 | |
|
| |
Amount due custodian | | | 310,683 | |
|
| |
Accrued fees to affiliates | | | 42,859 | |
|
| |
Accrued trustees’ and officers’ fees and benefits | | | 1,016 | |
|
| |
Accrued other operating expenses | | | 81,547 | |
|
| |
Trustee deferred compensation and retirement plans | | | 22,395 | |
|
| |
Total liabilities | | | 1,285,093 | |
|
| |
Net assets applicable to shares outstanding | | $ | 156,116,154 | |
|
| |
| | | | |
Net assets consist of: | | | | |
| |
Shares of beneficial interest | | $ | 163,385,059 | |
|
| |
Distributable earnings (loss) | | | (7,268,905 | ) |
|
| |
| | $ | 156,116,154 | |
|
| |
| |
Net Assets: | | | | |
Class A | | $ | 1,410,862 | |
|
| |
Class C | | $ | 196,674 | |
|
| |
Class R | | $ | 126,760 | |
|
| |
Class Y | | $ | 4,275,184 | |
|
| |
Class R5 | | $ | 7,250 | |
|
| |
Class R6 | | $ | 150,099,424 | |
|
| |
|
Shares outstanding, no par value, with an unlimited number of shares authorized: | |
Class A | | | 187,176 | |
|
| |
Class C | | | 26,460 | |
|
| |
Class R | | | 16,850 | |
|
| |
Class Y | | | 561,462 | |
|
| |
Class R5 | | | 952 | |
|
| |
Class R6 | | | 19,742,148 | |
|
| |
Class A: | | | | |
Net asset value per share | | $ | 7.54 | |
|
| |
Maximum offering price per share
(Net asset value of $7.54 ÷ 94.50%) | | $ | 7.98 | |
|
| |
Class C: | | | | |
Net asset value and offering price per share | | $ | 7.43 | |
|
| |
Class R: | | | | |
Net asset value and offering price per share | | $ | 7.52 | |
|
| |
Class Y: | | | | |
Net asset value and offering price per share | | $ | 7.61 | |
|
| |
Class R5: | | | | |
Net asset value and offering price per share | | $ | 7.62 | |
|
| |
Class R6: | | | | |
Net asset value and offering price per share | | $ | 7.60 | |
|
| |
See accompanying Notes to Consolidated Financial Statements which are an integral part of the financial statements.
| | |
| 13 | | Invesco Macro Allocation Strategy Fund |
Consolidated Statement of Operations
For the year ended October 31, 2022
| | | | |
Investment income: | | | | |
| |
Interest | | $ | 897,004 | |
|
| |
Dividends from affiliated money market funds | | | 617,217 | |
|
| |
Total investment income | | | 1,514,221 | |
|
| |
| |
Expenses: | | | | |
Advisory fees | | | 2,236,860 | |
|
| |
Administrative services fees | | | 28,646 | |
|
| |
Custodian fees | | | 86,394 | |
|
| |
Distribution fees: | | | | |
Class A | | | 4,271 | |
|
| |
Class C | | | 2,347 | |
|
| |
Class R | | | 607 | |
|
| |
Transfer agent fees – A, C, R and Y | | | 10,890 | |
|
| |
Transfer agent fees – R5 | | | 3 | |
|
| |
Transfer agent fees – R6 | | | 64,523 | |
|
| |
Trustees’ and officers’ fees and benefits | | | 20,810 | |
|
| |
Registration and filing fees | | | 76,212 | |
|
| |
Professional services fees | | | 82,229 | |
|
| |
Other | | | (12,074 | ) |
|
| |
Total expenses | | | 2,601,718 | |
|
| |
Less: Fees waived and/or expenses reimbursed | | | (235,638 | ) |
|
| |
Net expenses | | | 2,366,080 | |
|
| |
Net investment income (loss) | | | (851,859 | ) |
|
| |
| |
Realized and unrealized gain (loss) from: | | | | |
Net realized gain (loss) from: | | | | |
Unaffiliated investment securities | | | (3,544,398 | ) |
|
| |
Affiliated investment securities | | | (7,471 | ) |
|
| |
Foreign currencies | | | 246,897 | |
|
| |
Futures contracts | | | (6,028,584 | ) |
|
| |
Swap agreements | | | (11,986,594 | ) |
|
| |
| | | (21,320,150 | ) |
|
| |
Change in net unrealized appreciation (depreciation) of: | | | | |
Unaffiliated investment securities | | | 1,828,497 | |
|
| |
Affiliated investment securities | | | 3,946 | |
|
| |
Foreign currencies | | | (36 | ) |
|
| |
Futures contracts | | | 728,614 | |
|
| |
Swap agreements | | | (1,293,581 | ) |
|
| |
| | | 1,267,440 | |
|
| |
Net realized and unrealized gain (loss) | | | (20,052,710 | ) |
|
| |
Net increase (decrease) in net assets resulting from operations | | $ | (20,904,569 | ) |
|
| |
See accompanying Notes to Consolidated Financial Statements which are an integral part of the financial statements.
| | |
| 14 | | Invesco Macro Allocation Strategy Fund |
Consolidated Statement of Changes in Net Assets
For the years ended October 31, 2022 and 2021
| | | | | | | | |
| | | 2022 | | | 2021 | |
|
| |
Operations: | | | | | | | | |
| | |
Net investment income (loss) | | $ | (851,859 | ) | | $ | (2,587,535 | ) |
|
| |
Net realized gain (loss) | | | (21,320,150 | ) | | | 21,118,307 | |
|
| |
Change in net unrealized appreciation | | | 1,267,440 | | | | 4,259,818 | |
|
| |
Net increase (decrease) in net assets resulting from operations | | | (20,904,569 | ) | | | 22,790,590 | |
|
| |
| | |
Distributions to shareholders from distributable earnings: | | | | | | | | |
| | |
Class A | | | (169,053 | ) | | | – | |
|
| |
Class C | | | (19,921 | ) | | | – | |
|
| |
Class R | | | (10,162 | ) | | | – | |
|
| |
Class Y | | | (529,967 | ) | | | – | |
|
| |
Class R5 | | | (796 | ) | | | – | |
|
| |
Class R6 | | | (22,091,201 | ) | | | – | |
|
| |
Total distributions from distributable earnings | | | (22,821,100 | ) | | | – | |
|
| |
| | |
Share transactions–net: | | | | | | | | |
| | |
Class A | | | (225,349 | ) | | | (372,312 | ) |
|
| |
Class C | | | (122,716 | ) | | | (554,593 | ) |
|
| |
Class R | | | (1,478 | ) | | | 40,352 | |
|
| |
Class Y | | | (619,490 | ) | | | (5,461,382 | ) |
|
| |
Class R6 | | | (51,010,922 | ) | | | 52,072,741 | |
|
| |
Net increase (decrease) in net assets resulting from share transactions | | | (51,979,955 | ) | | | 45,724,806 | |
|
| |
Net increase (decrease) in net assets | | | (95,705,624 | ) | | | 68,515,396 | |
|
| |
| | |
Net assets: | | | | | | | | |
Beginning of year | | | 251,821,778 | | | | 183,306,382 | |
|
| |
End of year | | $ | 156,116,154 | | | $ | 251,821,778 | |
|
| |
See accompanying Notes to Consolidated Financial Statements which are an integral part of the financial statements.
| | |
| 15 | | Invesco Macro Allocation Strategy Fund |
Consolidated Financial Highlights
The following schedule presents financial highlights for a share of the Fund outstanding throughout the periods indicated.
| | | | | | | | | | | | | | | | | | | | | | | | | | | | | | | | | | | | | | | | | | | | | | | | | | | | | | | | |
| | | Net asset value, beginning of period | | Net investment income (loss)(a) | | Net gains (losses) on securities (both realized and unrealized) | | Total from investment operations | | Dividends from net investment income | | Distributions from net realized gains | | Total distributions | | Net asset value, end of period | | Total return (b) | | Net assets, end of period (000’s omitted) | | Ratio of expenses to average net assets with fee waivers and/or expenses absorbed | | Ratio of expenses to average net assets without fee waivers and/or expenses absorbed | | Ratio of net investment income (loss) to average net assets | | Portfolio turnover (c) |
Class A | | | | | | | | | | | | | | | | | | | | | | | | | | | | | | | | | | | | | | | | | | | | | | | | | | | | | | | | |
Year ended 10/31/22 | | | $9.16 | | | | $(0.05 | ) | | | $(0.76 | ) | | | $(0.81 | ) | | | $(0.49 | ) | | | $(0.32 | ) | | | $(0.81 | ) | | | $7.54 | | | | (9.88 | )% | | | $1,411 | | | | 1.41 | % | | | 1.58 | % | | | (0.67 | )% | | | 104 | % |
Year ended 10/31/21 | | | 8.18 | | | | (0.12 | ) | | | 1.10 | | | | 0.98 | | | | – | | | | – | | | | – | | | | 9.16 | | | | 11.98 | | | | 1,982 | | | | 1.42 | | | | 1.62 | | | | (1.36 | ) | | | 86 | |
Year ended 10/31/20 | | | 9.47 | | | | (0.06 | ) | | | (0.56 | ) | | | (0.62 | ) | | | (0.67 | ) | | | – | | | | (0.67 | ) | | | 8.18 | | | | (7.02 | ) | | | 2,111 | | | | 1.38 | | | | 1.85 | | | | (0.75 | ) | | | 120 | |
Year ended 10/31/19 | | | 8.81 | | | | 0.08 | | | | 0.60 | | | | 0.68 | | | | (0.02 | ) | | | – | | | | (0.02 | ) | | | 9.47 | | | | 7.67 | | | | 4,982 | | | | 1.37 | (d) | | | 2.12 | (d) | | | 0.87 | (d) | | | 0 | |
Year ended 10/31/18 | | | 9.60 | | | | 0.03 | | | | (0.40 | ) | | | (0.37 | ) | | | – | | | | (0.42 | ) | | | (0.42 | ) | | | 8.81 | | | | (4.03 | ) | | | 4,491 | | | | 1.36 | | | | 2.12 | | | | 0.29 | | | | 94 | |
Class C | | | | | | | | | | | | | | | | | | | | | | | | | | | | | | | | | | | | | | | | | | | | | | | | | | | | | | | | |
Year ended 10/31/22 | | | 8.98 | | | | (0.11 | ) | | | (0.77 | ) | | | (0.88 | ) | | | (0.35 | ) | | | (0.32 | ) | | | (0.67 | ) | | | 7.43 | | | | (10.66 | ) | | | 197 | | | | 2.16 | | | | 2.33 | | | | (1.42 | ) | | | 104 | |
Year ended 10/31/21 | | | 8.08 | | | | (0.19 | ) | | | 1.09 | | | | 0.90 | | | | – | | | | – | | | | – | | | | 8.98 | | | | 11.14 | | | | 364 | | | | 2.17 | | | | 2.37 | | | | (2.11 | ) | | | 86 | |
Year ended 10/31/20 | | | 9.30 | | | | (0.13 | ) | | | (0.54 | ) | | | (0.67 | ) | | | (0.55 | ) | | | – | | | | (0.55 | ) | | | 8.08 | | | | (7.61 | ) | | | 828 | | | | 2.13 | | | | 2.60 | | | | (1.50 | ) | | | 120 | |
Year ended 10/31/19 | | | 8.71 | | | | 0.01 | | | | 0.58 | | | | 0.59 | | | | (0.00 | ) | | | – | | | | (0.00 | ) | | | 9.30 | | | | 6.82 | | | | 3,329 | | | | 2.12 | (d) | | | 2.87 | (d) | | | 0.12 | (d) | | | 0 | |
Year ended 10/31/18 | | | 9.57 | | | | (0.04 | ) | | | (0.40 | ) | | | (0.44 | ) | | | – | | | | (0.42 | ) | | | (0.42 | ) | | | 8.71 | | | | (4.80 | ) | | | 6,167 | | | | 2.11 | | | | 2.87 | | | | (0.46 | ) | | | 94 | |
Class R | | | | | | | | | | | | | | | | | | | | | | | | | | | | | | | | | | | | | | | | | | | | | | | | | | | | | | | | |
Year ended 10/31/22 | | | 9.12 | | | | (0.07 | ) | | | (0.76 | ) | | | (0.83 | ) | | | (0.45 | ) | | | (0.32 | ) | | | (0.77 | ) | | | 7.52 | | | | (10.11 | ) | | | 127 | | | | 1.66 | | | | 1.83 | | | | (0.92 | ) | | | 104 | |
Year ended 10/31/21 | | | 8.17 | | | | (0.15 | ) | | | 1.10 | | | | 0.95 | | | | – | | | | – | | | | – | | | | 9.12 | | | | 11.63 | | | | 151 | | | | 1.67 | | | | 1.87 | | | | (1.61 | ) | | | 86 | |
Year ended 10/31/20 | | | 9.44 | | | | (0.08 | ) | | | (0.56 | ) | | | (0.64 | ) | | | (0.63 | ) | | | – | | | | (0.63 | ) | | | 8.17 | | | | (7.22 | ) | | | 98 | | | | 1.63 | | | | 2.10 | | | | (1.00 | ) | | | 120 | |
Year ended 10/31/19 | | | 8.80 | | | | 0.06 | | | | 0.59 | | | | 0.65 | | | | (0.01 | ) | | | – | | | | (0.01 | ) | | | 9.44 | | | | 7.41 | | | | 128 | | | | 1.62 | (d) | | | 2.37 | (d) | | | 0.62 | (d) | | | 0 | |
Year ended 10/31/18 | | | 9.61 | | | | 0.00 | | | | (0.39 | ) | | | (0.39 | ) | | | – | | | | (0.42 | ) | | | (0.42 | ) | | | 8.80 | | | | (4.24 | ) | | | 100 | | | | 1.61 | | | | 2.37 | | | | 0.04 | | | | 94 | |
Class Y | | | | | | | | | | | | | | | | | | | | | | | | | | | | | | | | | | | | | | | | | | | | | | | | | | | | | | | | |
Year ended 10/31/22 | | | 9.25 | | | | (0.03 | ) | | | (0.77 | ) | | | (0.80 | ) | | | (0.52 | ) | | | (0.32 | ) | | | (0.84 | ) | | | 7.61 | | | | (9.70 | ) | | | 4,275 | | | | 1.16 | | | | 1.33 | | | | (0.42 | ) | | | 104 | |
Year ended 10/31/21 | | | 8.25 | | | | (0.10 | ) | | | 1.10 | | | | 1.00 | | | | – | | | | – | | | | – | | | | 9.25 | | | | 12.12 | | | | 5,934 | | | | 1.17 | | | | 1.37 | | | | (1.11 | ) | | | 86 | |
Year ended 10/31/20 | | | 9.54 | | | | (0.04 | ) | | | (0.55 | ) | | | (0.59 | ) | | | (0.70 | ) | | | – | | | | (0.70 | ) | | | 8.25 | | | | (6.66 | ) | | | 10,377 | | | | 1.13 | | | | 1.60 | | | | (0.50 | ) | | | 120 | |
Year ended 10/31/19 | | | 8.87 | | | | 0.10 | | | | 0.60 | | | | 0.70 | | | | (0.03 | ) | | | – | | | | (0.03 | ) | | | 9.54 | | | | 7.88 | | | | 17,768 | | | | 1.12 | (d) | | | 1.87 | (d) | | | 1.12 | (d) | | | 0 | |
Year ended 10/31/18 | | | 9.64 | | | | 0.05 | | | | (0.40 | ) | | | (0.35 | ) | | | – | | | | (0.42 | ) | | | (0.42 | ) | | | 8.87 | | | | (3.80 | ) | | | 30,581 | | | | 1.11 | | | | 1.87 | | | | 0.54 | | | | 94 | |
Class R5 | | | | | | | | | | | | | | | | | | | | | | | | | | | | | | | | | | | | | | | | | | | | | | | | | | | | | | | | |
Year ended 10/31/22 | | | 9.26 | | | | (0.03 | ) | | | (0.77 | ) | | | (0.80 | ) | | | (0.52 | ) | | | (0.32 | ) | | | (0.84 | ) | | | 7.62 | | | | (9.69 | ) | | | 7 | | | | 1.16 | | | | 1.27 | | | | (0.42 | ) | | | 104 | |
Year ended 10/31/21 | | | 8.26 | | | | (0.10 | ) | | | 1.10 | | | | 1.00 | | | | – | | | | – | | | | – | | | | 9.26 | | | | 12.11 | | | | 9 | | | | 1.17 | | | | 1.22 | | | | (1.11 | ) | | | 86 | |
Year ended 10/31/20 | | | 9.54 | | | | (0.04 | ) | | | (0.54 | ) | | | (0.58 | ) | | | (0.70 | ) | | | – | | | | (0.70 | ) | | | 8.26 | | | | (6.55 | ) | | | 8 | | | | 1.13 | | | | 1.58 | | | | (0.50 | ) | | | 120 | |
Year ended 10/31/19 | | | 8.88 | | | | 0.11 | | | | 0.58 | | | | 0.69 | | | | (0.03 | ) | | | – | | | | (0.03 | ) | | | 9.54 | | | | 7.76 | | | | 9 | | | | 1.12 | (d) | | | 1.83 | (d) | | | 1.12 | (d) | | | 0 | |
Year ended 10/31/18 | | | 9.65 | | | | 0.05 | | | | (0.40 | ) | | | (0.35 | ) | | | – | | | | (0.42 | ) | | | (0.42 | ) | | | 8.88 | | | | (3.79 | ) | | | 8 | | | | 1.11 | | | | 1.82 | | | | 0.54 | | | | 94 | |
Class R6 | | | | | | | | | | | | | | | | | | | | | | | | | | | | | | | | | | | | | | | | | | | | | | | | | | | | | | | | |
Year ended 10/31/22 | | | 9.24 | | | | (0.03 | ) | | | (0.77 | ) | | | (0.80 | ) | | | (0.52 | ) | | | (0.32 | ) | | | (0.84 | ) | | | 7.60 | | | | (9.72 | ) | | | 150,099 | | | | 1.16 | | | | 1.27 | | | | (0.42 | ) | | | 104 | |
Year ended 10/31/21 | | | 8.23 | | | | (0.10 | ) | | | 1.11 | | | | 1.01 | | | | – | | | | – | | | | – | | | | 9.24 | | | | 12.27 | | | | 243,382 | | | | 1.17 | | | | 1.22 | | | | (1.11 | ) | | | 86 | |
Year ended 10/31/20 | | | 9.53 | | | | (0.04 | ) | | | (0.56 | ) | | | (0.60 | ) | | | (0.70 | ) | | | – | | | | (0.70 | ) | | | 8.23 | | | | (6.77 | ) | | | 169,884 | | | | 1.13 | | | | 1.58 | | | | (0.50 | ) | | | 120 | |
Year ended 10/31/19 | | | 8.86 | | | | 0.10 | | | | 0.60 | | | | 0.70 | | | | (0.03 | ) | | | – | | | | (0.03 | ) | | | 9.53 | | | | 7.89 | | | | 244 | | | | 1.12 | (d) | | | 1.83 | (d) | | | 1.12 | (d) | | | 0 | |
Year ended 10/31/18 | | | 9.63 | | | | 0.05 | | | | (0.40 | ) | | | (0.35 | ) | | | – | | | | (0.42 | ) | | | (0.42 | ) | | | 8.86 | | | | (3.80 | ) | | | 440 | | | | 1.11 | | | | 1.82 | | | | 0.54 | | | | 94 | |
| (a) | Calculated using average shares outstanding. |
| (b) | Includes adjustments in accordance with accounting principles generally accepted in the United States of America and as such, the net asset value for financial reporting purposes and the returns based upon those net asset values may differ from the net asset value and returns for shareholder transactions. Does not include sales charges and is not annualized for periods less than one year, if applicable. |
| (c) | Portfolio turnover is calculated at the fund level and is not annualized for periods less than one year, if applicable. |
| (d) | In addition to the fees and expenses which the Fund bears directly, the Fund indirectly bears a pro rata share of the fees and expenses of the investment companies in which the Fund invests. Estimated investment companies’ expenses are not expenses that are incurred directly by the Fund. They are expenses that are incurred directly by the investment companies and are deducted from the value of the investment companies the Fund invests in. The effect of the estimated investment companies’ expenses that the Fund bears indirectly is included in the Fund’s total return. Estimated acquired fund fees from underlying funds was 0.11% for the year ended October 31, 2019. |
See accompanying Notes to Consolidated Financial Statements which are an integral part of the financial statements.
| | |
| 16 | | Invesco Macro Allocation Strategy Fund |
Notes to Consolidated Financial Statements
October 31, 2022
NOTE 1–Significant Accounting Policies
Invesco Macro Allocation Strategy Fund (the “Fund”), is a series portfolio of AIM Investment Funds (Invesco Investment Funds) (the “Trust”). The Trust is organized as a Delaware statutory trust and is registered under the Investment Company Act of 1940, as amended (the “1940 Act”), as an open-end series management investment company authorized to issue an unlimited number of shares of beneficial interest. Information presented in these consolidated financial statements pertains only to the Fund and the Invesco Cayman Commodity Fund V Ltd. (the “Subsidiary”), a wholly-owned subsidiary of the Fund organized under the laws of the Cayman Islands. Matters affecting the Fund or each class will be voted on exclusively by the shareholders of the Fund or each class.
The Fund will seek to gain exposure to the commodity markets primarily through investments in the Subsidiary. The Subsidiary was organized by the Fund to invest in commodity-linked derivatives and other securities that may provide leveraged and non-leveraged exposure to commodities. The Fund may invest up to 25% of its total assets in the Subsidiary.
The Fund’s investment objective is to seek a positive absolute return over a complete economic and market cycle.
The Fund currently consists of six different classes of shares: Class A, Class C, Class R, Class Y, Class R5 and Class R6. Class Y shares are available only to certain investors. Class A shares are sold with a front-end sales charge unless certain waiver criteria are met. Under certain circumstances, load waived shares may be subject to contingent deferred sales charges (“CDSC”). Class C shares are sold with a CDSC. Class R, Class Y, Class R5 and Class R6 shares are sold at net asset value. Class C shares held for eight years after purchase are eligible for automatic conversion into Class A shares of the same Fund (the “Conversion Feature”). The automatic conversion pursuant to the Conversion Feature will generally occur at the end of the month following the eighth anniversary after a purchase of Class C shares.
The Fund is an investment company and accordingly follows the investment company accounting and reporting guidance in accordance with Financial Accounting Standards Board Accounting Standards Codification Topic 946, Financial Services - Investment Companies.
The following is a summary of the significant accounting policies followed by the Fund in the preparation of its consolidated financial statements.
| A. | Security Valuations - Securities, including restricted securities, are valued according to the following policy. |
Fixed income securities (including convertible debt securities) generally are valued on the basis of prices provided by independent pricing services. Prices provided by the pricing service may be determined without exclusive reliance on quoted prices, and may reflect appropriate factors such as institution-size trading in similar groups of securities, developments related to specific securities, dividend rate (for unlisted equities), yield (for debt obligations), quality, type of issue, coupon rate (for debt obligations), maturity (for debt obligations), individual trading characteristics and other market data. Pricing services generally value debt obligations assuming orderly transactions of institutional round lot size, but a fund may hold or transact in the same securities in smaller, odd lot sizes. Odd lots often trade at lower prices than institutional round lots, and their value may be adjusted accordingly. Debt obligations are subject to interest rate and credit risks. In addition, all debt obligations involve some risk of default with respect to interest and/or principal payments.
A security listed or traded on an exchange is generally valued at its trade price or official closing price that day as of the close of the exchange where the security is principally traded, or lacking any trades or official closing price on a particular day, the security may be valued at the closing bid price on that day. Securities traded in the over-the-counter market are valued based on prices furnished by independent pricing services or market makers. When such securities are valued using prices provided by an independent pricing service they may be considered fair valued. Futures contracts are valued at the daily settlement price set by an exchange on which they are principally traded. U.S. exchange-traded options are valued at the mean between the last bid and asked prices from the exchange on which they are principally traded. Non-U.S. exchange-traded options are valued at the final settlement price set by the exchange on which they trade. Options not listed on an exchange and swaps generally are valued using pricing provided from independent pricing services.
Securities of investment companies that are not exchange-traded (e.g., open-end mutual funds) are valued using such company’s end-of-business-day net asset value per share.
Deposits, other obligations of U.S. and non-U.S. banks and financial institutions are valued at their daily account value.
Swap agreements are fair valued using an evaluated quote, if available, provided by an independent pricing service. Evaluated quotes provided by the pricing service are valued based on a model which may include end-of-day net present values, spreads, ratings, industry, company performance and returns of referenced assets. Centrally cleared swap agreements are valued at the daily settlement price determined by the relevant exchange or clearinghouse.
Foreign securities’ (including foreign exchange contracts) prices are converted into U.S. dollar amounts using the applicable exchange rates as of the close of the New York Stock Exchange (“NYSE”). If market quotations are available and reliable for foreign exchange-traded equity securities, the securities will be valued at the market quotations. Invesco Advisers, Inc. (the “Adviser” or “Invesco”) may use various pricing services to obtain market quotations as well as fair value prices. Because trading hours for certain foreign securities end before the close of the NYSE, closing market quotations may become not representative of market value in the Adviser’s judgment (“unreliable”). If between the time trading ends on a particular security and the close of the customary trading session on the NYSE, a significant event occurs that makes the closing price of the security unreliable, the Adviser may fair value the security. If the event is likely to have affected the closing price of the security, the security will be valued at fair value in good faith in accordance with Board-approved policies and related Adviser procedures (“Valuation Procedures”). Adjustments to closing prices to reflect fair value may also be based on a screening process of an independent pricing service to indicate the degree of certainty, based on historical data, that the closing price in the principal market where a foreign security trades is not the current value as of the close of the NYSE. Foreign securities’ prices meeting the degree of certainty that the price is not reflective of current value will be priced at the indication of fair value from the independent pricing service. Multiple factors may be considered by the independent pricing service in determining adjustments to reflect fair value and may include information relating to sector indices, American Depositary Receipts and domestic and foreign index futures. Foreign securities may have additional risks including exchange rate changes, potential for sharply devalued currencies and high inflation, political and economic upheaval, the relative lack of issuer information, relatively low market liquidity and the potential lack of strict financial and accounting controls and standards.
Unlisted securities will be valued using prices provided by independent pricing services or by another method that the Adviser, in its judgment, believes better reflects the security’s fair value in accordance with the Valuation Procedures.
Securities for which market prices are not provided by any of the above methods may be valued based upon quotes furnished by independent sources. The last bid price may be used to value equity securities. The mean between the last bid and asked prices may be used to value debt obligations, including corporate loans.
Securities for which market quotations are not readily available are fair valued by the Adviser in accordance with the Valuation Procedures. If a fair value price provided by a pricing service is unreliable, the Adviser will fair value the security using the Valuation Procedures. Issuer specific events, market trends, bid/asked quotes of brokers and information providers and other market data may be reviewed in the course of making a good faith determination of a security’s fair value.
The Fund may invest in securities that are subject to interest rate risk, meaning the risk that the prices will generally fall as interest rates rise and, conversely, the prices will generally rise as interest rates fall. Specific securities differ in their sensitivity to changes in interest rates depending on their individual characteristics. Changes in interest rates may result in increased market volatility, which may affect the value and/or liquidity of certain Fund investments.
Valuations change in response to many factors including the historical and prospective earnings of the issuer, the value of the issuer’s assets, general market conditions which are not specifically related to the particular issuer, such as real or perceived adverse economic conditions, changes in the general outlook for revenues or corporate earnings, changes in interest or currency rates, regional or global instability, natural or environmental disasters, widespread disease or other public health issues, war, acts of terrorism, significant governmental actions or adverse investor sentiment generally and market liquidity. Because of the
| | |
| 17 | | Invesco Macro Allocation Strategy Fund |
inherent uncertainties of valuation, the values reflected in the consolidated financial statements may materially differ from the value received upon actual sale of those investments.
The price the Fund could receive upon the sale of any investment may differ from the Adviser’s valuation of the investment, particularly for securities that are valued using a fair valuation technique. When fair valuation techniques are applied, the Adviser uses available information, including both observable and unobservable inputs and assumptions, to determine a methodology that will result in a valuation that the Adviser believes approximates market value. Fund securities that are fair valued may be subject to greater fluctuation in their value from one day to the next than would be the case if market quotations were used. Because of the inherent uncertainties of valuation, and the degree of subjectivity in such decisions, the Fund could realize a greater or lesser than expected gain or loss upon the sale of the investment.
| B. | Securities Transactions and Investment Income – Securities transactions are accounted for on a trade date basis. Realized gains or losses on sales are computed on the basis of specific identification of the securities sold. Interest income (net of withholding tax, if any) is recorded on an accrual basis from settlement date and includes coupon interest and amortization of premium and accretion of discount on debt securities as applicable. Pay-in-kind interest income and non-cash dividend income received in the form of securities in-lieu of cash are recorded at the fair value of the securities received. Dividend income (net of withholding tax, if any) is recorded on the ex-dividend date. |
The Fund may periodically participate in litigation related to Fund investments. As such, the Fund may receive proceeds from litigation settlements. Any proceeds received are included in the Consolidated Statement of Operations as realized gain (loss) for investments no longer held and as unrealized gain (loss) for investments still held.
Brokerage commissions and mark ups are considered transaction costs and are recorded as an increase to the cost basis of securities purchased and/or a reduction of proceeds on a sale of securities. Such transaction costs are included in the determination of net realized and unrealized gain (loss) from investment securities reported in the Consolidated Statement of Operations and the Consolidated Statement of Changes in Net Assets and the net realized and unrealized gains (losses) on securities per share in the Consolidated Financial Highlights. Transaction costs are included in the calculation of the Fund’s net asset value and, accordingly, they reduce the Fund’s total returns. These transaction costs are not considered operating expenses and are not reflected in net investment income reported in the Consolidated Statement of Operations and the Consolidated Statement of Changes in Net Assets, or the net investment income per share and the ratios of expenses and net investment income reported in the Consolidated Financial Highlights, nor are they limited by any expense limitation arrangements between the Fund and the investment adviser.
The Fund allocates income and realized and unrealized capital gains and losses to a class based on the relative net assets of each class.
| C. | Country Determination – For the purposes of making investment selection decisions and presentation in the Consolidated Schedule of Investments, the investment adviser may determine the country in which an issuer is located and/or credit risk exposure based on various factors. These factors include the laws of the country under which the issuer is organized, where the issuer maintains a principal office, the country in which the issuer derives 50% or more of its total revenues, the country that has the primary market for the issuer’s securities and its “country of risk” as determined by a third party service provider, as well as other criteria. Among the other criteria that may be evaluated for making this determination are the country in which the issuer maintains 50% or more of its assets, the type of security, financial guarantees and enhancements, the nature of the collateral and the sponsor organization. Country of issuer and/or credit risk exposure has been determined to be the United States of America, unless otherwise noted. |
| D. | Distributions – Distributions from net investment income and net realized capital gain, if any, are generally declared and paid annually and recorded on the ex-dividend date. The Fund may elect to treat a portion of the proceeds from redemptions as distributions for federal income tax purposes. |
| E. | Federal Income Taxes – The Fund intends to comply with the requirements of Subchapter M of the Internal Revenue Code of 1986, as amended (the “Internal Revenue Code”), necessary to qualify as a regulated investment company and to distribute substantially all of the Fund’s taxable earnings to shareholders. As such, the Fund will not be subject to federal income taxes on otherwise taxable income (including net realized capital gain) that is distributed to shareholders. Therefore, no provision for federal income taxes is recorded in the consolidated financial statements. |
The Fund recognizes the tax benefits of uncertain tax positions only when the position is more likely than not to be sustained. Management has analyzed the Fund’s uncertain tax positions and concluded that no liability for unrecognized tax benefits should be recorded related to uncertain tax positions. Management is not aware of any tax positions for which it is reasonably possible that the total amounts of unrecognized tax benefits will change materially in the next 12 months.
The Subsidiary is classified as a controlled foreign corporation under Subchapter N of the Internal Revenue Code. Therefore, the Fund is required to increase its taxable income by its share of the Subsidiary’s income. Net investment losses of the Subsidiary cannot be deducted by the Fund in the current period nor carried forward to offset taxable income in future periods.
The Fund files tax returns in the U.S. Federal jurisdiction and certain other jurisdictions. Generally the Fund is subject to examinations by such taxing authorities for up to three years after the filing of the return for the tax period.
| F. | Expenses – Fees provided for under the Rule 12b-1 plan of a particular class of the Fund are charged to the operations of such class. Transfer agency fees and expenses and other shareholder recordkeeping fees and expenses attributable to Class R5 and Class R6 are allocated based on relative net assets of Class R5 and Class R6. Sub-accounting fees attributable to Class R5 are charged to the operations of the class. Transfer agency fees and expenses and other shareholder recordkeeping fees and expenses relating to all other classes are allocated among those classes based on relative net assets. All other expenses are allocated among the classes based on relative net assets. |
| G. | Accounting Estimates – The financial statements are prepared on a consolidated basis in conformity with accounting principles generally accepted in the United States of America (“GAAP”), which requires management to make estimates and assumptions that affect the reported amounts of assets and liabilities at the date of the financial statements and the reported amounts of revenues and expenses during the reporting period including estimates and assumptions related to taxation. Actual results could differ from those estimates by a significant amount. The accompanying financial statements reflect the financial position of the Fund and its Subsidiary and the results of operations on a consolidated basis. All inter-company accounts and transactions have been eliminated in consolidation. |
In addition, the Fund monitors for material events or transactions that may occur or become known after the period-end date and before the date the consolidated financial statements are released to print.
| H. | Indemnifications – Under the Trust’s organizational documents, each Trustee, officer, employee or other agent of the Trust, and under the Subsidiary’s organizational documents, the directors and officers of the Subsidiary, are indemnified against certain liabilities that may arise out of the performance of their duties to the Fund and/or the Subsidiary, respectively. Additionally, in the normal course of business, the Fund enters into contracts, including the Fund’s servicing agreements, that contain a variety of indemnification clauses. The Fund’s maximum exposure under these arrangements is unknown as this would involve future claims that may be made against the Fund that have not yet occurred. The risk of material loss as a result of such indemnification claims is considered remote. |
| I. | Structured Securities – The Fund may invest in structured securities. Structured securities are a type of derivative security whose value is determined by reference to changes in the value of underlying securities, currencies, interest rates, commodities, indices or other financial indicators (“reference instruments”). Most structured securities are fixed-income securities that have maturities of three years or less. Structured securities may be positively or negatively indexed (i.e., their principal value or interest rates may increase or decrease if the underlying reference instrument appreciates) and may have return characteristics similar to direct investments in the underlying reference instrument. |
Structured securities may entail a greater degree of market risk than other types of debt securities because the investor bears the risk of the reference instruments. In addition to the credit risk of structured securities and the normal risks of price changes in response to changes in interest rates, the principal amount of structured notes or indexed securities may decrease as a result of changes in the value of the underlying reference instruments. Changes in the daily
| | |
| 18 | | Invesco Macro Allocation Strategy Fund |
value of structured securities are recorded as unrealized gains (losses) in the Consolidated Statement of Operations. When the structured securities mature or are sold, the Fund recognizes a realized gain (loss) on the Consolidated Statement of Operations.
| J. | Securities Lending – The Fund may lend portfolio securities having a market value up to one-third of the Fund’s total assets. Such loans are secured by collateral equal to no less than the market value of the loaned securities determined daily by the securities lending provider. Such collateral will be cash or debt securities issued or guaranteed by the U.S. Government or any of its sponsored agencies. Cash collateral received in connection with these loans is invested in short-term money market instruments or affiliated, unregistered investment companies that comply with Rule 2a-7 under the 1940 Act and money market funds (collectively, “affiliated money market funds”) and is shown as such on the Consolidated Schedule of Investments. The Fund bears the risk of loss with respect to the investment of collateral. It is the Fund’s policy to obtain additional collateral from or return excess collateral to the borrower by the end of the next business day, following the valuation date of the securities loaned. Therefore, the value of the collateral held may be temporarily less than the value of the securities on loan. When loaning securities, the Fund retains certain benefits of owning the securities, including the economic equivalent of dividends or interest generated by the security. Lending securities entails a risk of loss to the Fund if, and to the extent that, the market value of the securities loaned were to increase and the borrower did not increase the collateral accordingly, and the borrower failed to return the securities. The securities loaned are subject to termination at the option of the borrower or the Fund. Upon termination, the borrower will return to the Fund the securities loaned and the Fund will return the collateral. Upon the failure of the borrower to return the securities, collateral may be liquidated and the securities may be purchased on the open market to replace the loaned securities. The Fund could experience delays and costs in gaining access to the collateral and the securities may lose value during the delay which could result in potential losses to the Fund. Some of these losses may be indemnified by the lending agent. The Fund bears the risk of any deficiency in the amount of the collateral available for return to the borrower due to any loss on the collateral invested. Dividends received on cash collateral investments for securities lending transactions, which are net of compensation to counterparties, are included in Dividends from affiliated money market funds on the Consolidated Statement of Operations. The aggregate value of securities out on loan, if any, is shown as a footnote on the Consolidated Statement of Assets and Liabilities. |
The Adviser serves as an affiliated securities lending agent for the Fund. The Bank of New York Mellon also serves as a lending agent. To the extent the Fund utilizes the Adviser as an affiliated securities lending agent, the Fund conducts its securities lending in accordance with, and in reliance upon, no-action letters issued by the SEC staff that provide guidance on how an affiliate may act as a direct agent lender and receive compensation for those services in a manner consistent with the federal securities laws. For the year ended October 31, 2022, there were no securities lending transactions with the Adviser. Fees paid to the Adviser for securities lending agent services are included in Dividends from affiliated money market funds on the Consolidated Statement of Operations.
| K. | Foreign Currency Translations – Foreign currency is valued at the close of the NYSE based on quotations posted by banks and major currency dealers. Portfolio securities and other assets and liabilities denominated in foreign currencies are translated into U.S. dollar amounts at the date of valuation. Purchases and sales of portfolio securities (net of foreign taxes withheld on disposition) and income items denominated in foreign currencies are translated into U.S. dollar amounts on the respective dates of such transactions. The Fund does not separately account for the portion of the results of operations resulting from changes in foreign exchange rates on investments and the fluctuations arising from changes in market prices of securities held. The combined results of changes in foreign exchange rates and the fluctuation of market prices on investments (net of estimated foreign tax withholding) are included with the net realized and unrealized gain or loss from investments in the Consolidated Statement of Operations. Reported net realized foreign currency gains or losses arise from (1) sales of foreign currencies, (2) currency gains or losses realized between the trade and settlement dates on securities transactions, and (3) the difference between the amounts of dividends, interest, and foreign withholding taxes recorded on the Fund’s books and the U.S. dollar equivalent of the amounts actually received or paid. Net unrealized foreign currency gains and losses arise from changes in the fair values of assets and liabilities, other than investments in securities at fiscal period end, resulting from changes in exchange rates. |
The Fund may invest in foreign securities, which may be subject to foreign taxes on income, gains on investments or currency repatriation, a portion of which may be recoverable. Foreign taxes, if any, are recorded based on the tax regulations and rates that exist in the foreign markets in which the Fund invests and are shown in the Consolidated Statement of Operations.
| L. | Forward Foreign Currency Contracts – The Fund may engage in foreign currency transactions either on a spot (i.e. for prompt delivery and settlement) basis, or through forward foreign currency contracts, to manage or minimize currency or exchange rate risk. |
The Fund may also enter into forward foreign currency contracts for the purchase or sale of a security denominated in a foreign currency in order to “lock in” the U.S. dollar price of that security, or the Fund may also enter into forward foreign currency contracts that do not provide for physical exchange of the two currencies on the settlement date, but instead are settled by a single cash payment calculated as the difference between the agreed upon exchange rate and the spot rate at settlement based upon an agreed upon notional amount (non-deliverable forwards).
A forward foreign currency contract is an obligation between two parties (“Counterparties”) to purchase or sell a specific currency for an agreed-upon price at a future date. The use of forward foreign currency contracts for hedging does not eliminate fluctuations in the price of the underlying securities the Fund owns or intends to acquire but establishes a rate of exchange in advance. Fluctuations in the value of these contracts are measured by the difference in the contract date and reporting date exchange rates and are recorded as unrealized appreciation (depreciation) until the contracts are closed. When the contracts are closed, realized gains (losses) are recorded. Realized and unrealized gains (losses) on the contracts are included in the Consolidated Statement of Operations. The primary risks associated with forward foreign currency contracts include failure of the Counterparty to meet the terms of the contract and the value of the foreign currency changing unfavorably. These risks may be in excess of the amounts reflected in the Consolidated Statement of Assets and Liabilities.
| M. | Futures Contracts – The Fund may enter into futures contracts to equitize the Fund’s cash holdings or to manage exposure to interest rate, equity and market price movements and/or currency risks. A futures contract is an agreement between Counterparties to purchase or sell a specified underlying security, currency or commodity (or delivery of a cash settlement price, in the case of an index future) for a fixed price at a future date. The Fund currently invests only in exchange-traded futures and they are standardized as to maturity date and underlying financial instrument or asset. Initial margin deposits required upon entering into futures contracts are satisfied by the segregation of specific securities or cash as collateral at the futures commission merchant (broker). During the period the futures contracts are open, changes in the value of the contracts are recognized as unrealized gains or losses by recalculating the value of the contracts on a daily basis. Subsequent or variation margin payments are received or made on non-LME futures contracts depending upon whether unrealized gains or losses are incurred. These amounts are reflected as receivables or payables on the Consolidated Statement of Assets and Liabilities. For LME contracts, subsequent or variation margin payments are not made and the value of the contracts is presented as unrealized appreciation or depreciation on the Consolidated Statement of Assets and Liabilities. When LME or non-LME contracts are closed or expire, the Fund recognizes a realized gain or loss equal to the difference between the proceeds from, or cost of, the closing transaction and the Fund’s basis in the contract. The net realized gain (loss) and the change in unrealized gain (loss) on futures contracts held during the period is included on the Consolidated Statement of Operations. For settlement of LME commodity futures contracts, cash is not transferred until the settled futures contracts expire. Net realized gains or losses on LME contracts which have been closed out but for which the contract has not yet expired are reflected as a receivable or payable on the Consolidated Statements of Assets and Liabilities. The primary risks associated with futures contracts are market risk and the absence of a liquid secondary market. If the Fund were unable to liquidate a futures contract and/or enter into an offsetting closing transaction, the Fund would continue to be subject to market risk with respect to the value of the contracts and continue to be required to maintain the margin deposits on the futures contracts. Futures contracts have minimal Counterparty risk since the exchange’s clearinghouse, as Counterparty to all exchange-traded futures, guarantees the futures against default. Risks may exceed amounts recognized in the Consolidated Statement of Assets and Liabilities. |
| N. | Call Options Purchased and Written – The Fund may write covered call options and/or buy call options. A covered call option gives the purchaser of such option the right to buy, and the writer the obligation to sell, the underlying security or foreign currency at the stated exercise price during the option period. |
| | |
| 19 | | Invesco Macro Allocation Strategy Fund |
Options written by the Fund normally will have expiration dates between three and nine months from the date written. The exercise price of a call option may be below, equal to, or above the current market value of the underlying security at the time the option is written.
Additionally, the Fund may enter into an option on a swap agreement, also called a “swaption”. A swaption is an option that gives the buyer the right, but not the obligation, to enter into a swap on a future date in exchange for paying a market-based premium. A receiver swaption gives the owner the right to receive the total return of a specified asset, reference rate or index. Swaptions also include options that allow an existing swap to be terminated or extended by one of the Counterparties.
When the Fund writes a covered call option, an amount equal to the premium received by the Fund is recorded as an asset and an equivalent liability in the Consolidated Statement of Assets and Liabilities. The amount of the liability is subsequently “marked-to-market” to reflect the current market value of the option written. If a written covered call option expires on the stipulated expiration date, or if the Fund enters into a closing purchase transaction, the Fund realizes a gain (or a loss if the closing purchase transaction exceeds the premium received when the option was written) without regard to any unrealized gain or loss on the underlying security, and the liability related to such option is extinguished. If a written covered call option is exercised, the Fund realizes a gain or a loss from the sale of the underlying security and the proceeds of the sale are increased by the premium originally received. Realized and unrealized gains and losses on call options written are included in the Consolidated Statement of Operations as Net realized gain (loss) from and Change in net unrealized appreciation (depreciation) of Option contracts written. A risk in writing a covered call option is that the Fund gives up the opportunity for profit if the market price of the security increases and the option is exercised.
When the Fund buys a call option, an amount equal to the premium paid by the Fund is recorded as an investment on the Consolidated Statement of Assets and Liabilities. The amount of the investment is subsequently “marked-to-market” to reflect the current value of the option purchased. Realized and unrealized gains and losses on call options purchased are included in the Consolidated Statement of Operations as Net realized gain (loss) from and Change in net unrealized appreciation (depreciation) of Investment securities. A risk in buying an option is that the Fund pays a premium whether or not the option is exercised. In addition, there can be no assurance that a liquid secondary market will exist for any option purchased.
| O. | Put Options Purchased and Written – The Fund may purchase and write put options including options on securities indexes, or foreign currency and/or futures contracts. By purchasing a put option, the Fund obtains the right (but not the obligation) to sell the option’s underlying instrument at a fixed strike price. In return for this right, the Fund pays an option premium. The option’s underlying instrument may be a security, securities index, or a futures contract. Put options may be used by the Fund to hedge securities it owns by locking in a minimum price at which the Fund can sell. If security prices fall, the put option could be exercised to offset all or a portion of the Fund’s resulting losses. At the same time, because the maximum the Fund has at risk is the cost of the option, purchasing put options does not eliminate the potential for the Fund to profit from an increase in the value of the underlying portfolio securities. The Fund may write put options to earn additional income in the form of option premiums if it expects the price of the underlying instrument to remain stable or rise during the option period so that the option will not be exercised. The risk in this strategy is that the price of the underlying securities may decline by an amount greater than the premium received. Put options written are reported as a liability in the Consolidated Statement of Assets and Liabilities. Realized and unrealized gains and losses on put options purchased and put options written are included in the Consolidated Statement of Operations as Net realized gain (loss) from and Change in net unrealized appreciation (depreciation) of Investment securities and Option contracts written, respectively. A risk in buying an option is that the Fund pays a premium whether or not the option is exercised. In addition, there can be no assurance that a liquid secondary market will exist for any option purchased. |
| P. | Swap Agreements – The Fund may enter into various swap transactions, including interest rate, total return, index, currency and credit default swap contracts (“CDS”) for investment purposes or to manage interest rate, currency, commodity or credit risk. Such transactions are agreements between Counterparties. These agreements may contain among other conditions, events of default and termination events, and various covenants and representations such as provisions that require the Fund to maintain a pre-determined level of net assets, and/or provide limits regarding the decline of the Fund’s net asset value (“NAV”) per share over specific periods of time. If the Fund were to trigger such provisions and have open derivative positions at that time, the Counterparty may be able to terminate such agreement and request immediate payment in an amount equal to the net liability positions, if any. |
Interest rate, total return, index, and currency swap agreements are two-party contracts entered into primarily to exchange the returns (or differentials in rates of returns) earned or realized on particular predetermined investments or instruments. The gross returns to be exchanged or “swapped” between the parties are calculated with respect to a notional amount, i.e., the return on or increase in value of a particular dollar amount invested at a particular interest rate or return of an underlying asset, in a particular foreign currency, or in a “basket” of securities representing a particular index. At the maturity date, a net cash flow is exchanged where the total return is equivalent to the return of the underlying reference less a financing rate, if any. As a receiver, the Fund would receive payments based on any positive total return and would owe payments in the event of a negative total return. As the payer, the Fund would owe payments on any net positive total return, and would receive payment in the event of a negative total return.
Changes in the value of swap agreements are recognized as unrealized gains (losses) in the Consolidated Statement of Operations by “marking to market” on a daily basis to reflect the value of the swap agreement at the end of each trading day. Payments received or paid at the beginning of the agreement are reflected as such on the Consolidated Statement of Assets and Liabilities and may be referred to as upfront payments. The Fund accrues for the fixed payment stream and amortizes upfront payments, if any, on swap agreements on a daily basis with the net amount, recorded as a component of realized gain (loss) on the Consolidated Statement of Operations. A liquidation payment received or made at the termination of a swap agreement is recorded as realized gain (loss) on the Consolidated Statement of Operations. Cash held as collateral is recorded as deposits with brokers on the Consolidated Statement of Assets and Liabilities. Entering into these agreements involves, to varying degrees, lack of liquidity and elements of credit, market, and Counterparty risk in excess of amounts recognized on the Consolidated Statement of Assets and Liabilities. Such risks involve the possibility that a swap is difficult to sell or liquidate; the Counterparty does not honor its obligations under the agreement and unfavorable interest rates and market fluctuations. It is possible that developments in the swaps market, including potential government regulation, could adversely affect the Fund’s ability to terminate existing swap agreements or to realize amounts to be received under such agreements. Additionally, an International Swaps and Derivatives Association Master Agreement (“ISDA Master Agreement”) includes credit related contingent features which allow Counterparties to OTC derivatives to terminate derivative contracts prior to maturity in the event that, for example, the Fund’s net assets decline by a stated percentage or the Fund fails to meet the terms of its ISDA master agreements, which would cause the Fund to accelerate payment of any net liability owed to the Counterparty. A short position in a security poses more risk than holding the same security long. As there is no limit on how much the price of the security can increase, the Fund’s exposure is unlimited.
| Q. | Leverage Risk – Leverage exists when the Fund can lose more than it originally invests because it purchases or sells an instrument or enters into a transaction without investing an amount equal to the full economic exposure of the instrument or transaction. |
| R. | Collateral – To the extent the Fund has designated or segregated a security as collateral and that security is subsequently sold, it is the Fund’s practice to replace such collateral no later than the next business day. |
| S. | Other Risks – Active trading of portfolio securities may result in added expenses, a lower return and increased tax liability. |
The Fund will seek to gain exposure to commodity markets primarily through an investment in the Subsidiary and through investments in exchange-traded funds and commodity-linked derivatives. The Subsidiary, unlike the Fund, may invest without limitation in commodities, commodity-linked derivatives and other securities, such as exchange-traded and commodity-linked notes, that may provide leveraged and non-leveraged exposure to commodity markets. The Fund is indirectly exposed to the risks associated with the Subsidiary’s investments.
The Fund is non-diversified and may invest in securities of fewer issuers than if it were diversified. Thus, the value of the Fund’s shares may vary more widely and the Fund may be subject to greater market and credit risk than if the Fund invested more broadly.
| T. | COVID-19 Risk – The COVID-19 strain of coronavirus has resulted in instances of market closures and dislocations, extreme volatility, liquidity constraints and |
| | |
| 20 | | Invesco Macro Allocation Strategy Fund |
increased trading costs. Efforts to contain its spread have resulted in travel restrictions, disruptions of healthcare systems, business operations (including business closures) and supply chains, layoffs, lower consumer demand and employee availability, and defaults and credit downgrades, among other significant economic impacts that have disrupted global economic activity across many industries. Such economic impacts may exacerbate other pre-existing political, social and economic risks locally or globally and cause general concern and uncertainty. The full economic impact and ongoing effects of COVID-19 (or other future epidemics or pandemics) at the macro-level and on individual businesses are unpredictable and may result in significant and prolonged effects on the Fund’s performance.
NOTE 2–Advisory Fees and Other Fees Paid to Affiliates
The Trust has entered into a master investment advisory agreement with the Adviser. Under the terms of the investment advisory agreement, the Fund accrues daily and pays monthly an advisory fee to the Adviser less the amount paid by the Subsidiary to the Adviser based on the annual rate of the Fund’s average daily net assets as follows:
| | |
| Average Daily Net Assets | | Rate |
First $ 250 million | | 1.100% |
Next $250 million | | 1.080% |
Next $500 million | | 1.050% |
Next $1.5 billion | | 1.030% |
Next $2.5 billion | | 1.000% |
Next $2.5 billion | | 0.980% |
Next $2.5 billion | | 0.950% |
Over $10 billion | | 0.930% |
For the year ended October 31, 2022, the effective advisory fee rate incurred by the Fund was 1.10%.
The Subsidiary has entered into a separate contract with the Adviser whereby the Adviser provides investment advisory and other services to the Subsidiary. In consideration of these services, the Subsidiary pays an advisory fee to the Adviser based on the annual rate of the Subsidiary’s average daily net assets as set forth in the table above.
Under the terms of a master sub-advisory agreement between the Adviser and each of Invesco Asset Management Deutschland GmbH, Invesco Asset Management Limited, Invesco Asset Management (Japan) Limited, Invesco Hong Kong Limited, Invesco Senior Secured Management, Inc. and Invesco Canada Ltd. and separate sub-advisory agreements with Invesco Capital Management LLC, and Invesco Asset Management (India) Private Limited (collectively, the “Affiliated Sub-Advisers”) the Adviser, not the Fund, will pay 40% of the fees paid to the Adviser to any such Affiliated Sub-Adviser(s) that provide(s) discretionary investment management services to the Fund based on the percentage of assets allocated to such Affiliated Sub-Adviser(s).
The Adviser has contractually agreed, through at least February 29, 2024, to waive advisory fees and/or reimburse expenses to the extent necessary to limit total annual fund operating expenses after fee waiver and/or expense reimbursement (excluding certain items discussed below) of Class A, Class C, Class R, Class Y, Class R5 and Class R6 shares to 1.44%, 2.19%, 1.69%, 1.19%, 1.19% and 1.19%, respectively, of the Fund’s average daily net assets (the “expense limits”). In determining the Adviser’s obligation to waive advisory fees and/or reimburse expenses, the following expenses are not taken into account, and could cause total annual fund operating expenses after fee waiver and/or expense reimbursement to exceed the numbers reflected above: (1) interest; (2) taxes; (3) dividend expense on short sales; (4) extraordinary or non-routine items, including litigation expenses; and (5) expenses that the Fund has incurred but did not actually pay because of an expense offset arrangement. Acquired Fund Fees and Expenses are not operating expenses of a Fund directly, but are fees and expenses, including management fees, of the investment companies in which a Fund invests. As a result, the total annual fund operating expenses after expense reimbursement may exceed the expense limits above. Unless Invesco continues the fee waiver agreement, it will terminate on February 29, 2024. During its term, the fee waiver agreement cannot be terminated or amended to increase the expense limits or reduce the advisory fee waiver without approval of the Board of Trustees.
Further, the Adviser has contractually agreed, through at least June 30, 2024, to waive the advisory fee payable by the Fund in an amount equal to 100% of the net advisory fees the Adviser receives from the affiliated money market funds on investments by the Fund of uninvested cash (excluding investments of cash collateral from securities lending) in such affiliated money market funds.
For the year ended October 31, 2022, the Adviser waived advisory fees of $164,776 and reimbursed class level expenses of $1,553, $212, $112, $4,459, $3 and $64,523 of Class A, Class C, Class R, Class Y, Class R5 and Class R6 shares, respectively.
The Trust has entered into a master administrative services agreement with Invesco pursuant to which the Fund has agreed to pay Invesco for certain administrative costs incurred in providing accounting services to the Fund. For the year ended October 31, 2022, expenses incurred under the agreement are shown in the Consolidated Statement of Operations as Administrative services fees. Invesco has entered into a sub-administration agreement whereby State Street Bank and Trust Company (“SSB”) serves as fund accountant and provides certain administrative services to the Fund. Pursuant to a custody agreement with the Trust on behalf of the Fund, SSB also serves as the Fund’s custodian.
The Trust has entered into a transfer agency and service agreement with Invesco Investment Services, Inc. (“IIS”) pursuant to which the Fund has agreed to pay IIS a fee for providing transfer agency and shareholder services to the Fund and reimburse IIS for certain expenses incurred by IIS in the course of providing such services. IIS may make payments to intermediaries that provide omnibus account services, sub-accounting services and/or networking services. All fees payable by IIS to intermediaries that provide omnibus account services or sub-accounting services are charged back to the Fund, subject to certain limitations approved by the Trust’s Board of Trustees. For the year ended October 31, 2022, expenses incurred under the agreement are shown in the Consolidated Statement of Operations as Transfer agent fees.
The Trust has entered into master distribution agreements with Invesco Distributors, Inc. (“IDI”) to serve as the distributor for the Class A, Class C, Class R, Class Y, Class R5 and Class R6 shares of the Fund. The Trust has adopted plans pursuant to Rule 12b-1 under the 1940 Act with respect to the Fund’s Class A, Class C and Class R shares (collectively, the “Plans”). The Fund, pursuant to the Plans, pays IDI compensation at the annual rate of 0.25% of the Fund’s average daily net assets of Class A shares, 1.00% of the average daily net assets of Class C shares and 0.50% of the average daily net assets of Class R shares. The fees are accrued daily and paid monthly. Of the Plan payments, up to 0.25% of the average daily net assets of each class of shares may be paid to furnish continuing personal shareholder services to customers who purchase and own shares of such classes. Any amounts not paid as a service fee under the Plans would constitute an asset-based sales charge. Rules of the Financial Industry Regulatory Authority (“FINRA”) impose a cap on the total sales charges, including asset-based sales charges, that may be paid by any class of shares of the Fund. For the year ended October 31, 2022, expenses incurred under the Plans are shown in the Consolidated Statement of Operations as Distribution fees.
Front-end sales commissions and CDSC (collectively, the “sales charges”) are not recorded as expenses of the Fund. Front-end sales commissions are deducted from proceeds from the sales of Fund shares prior to investment in Class A shares of the Fund. CDSC are deducted from redemption proceeds prior to remittance to the shareholder. During the year ended October 31, 2022, IDI advised the Fund that IDI retained $246 in front-end sales commissions from the sale of Class A shares and $0 and $0 from Class A and Class C shares, respectively, for CDSC imposed upon redemptions by shareholders.
Certain officers and trustees of the Trust are officers and directors of the Adviser, IIS and/or IDI.
| | |
| 21 | | Invesco Macro Allocation Strategy Fund |
NOTE 3–Additional Valuation Information
GAAP defines fair value as the price that would be received to sell an asset or paid to transfer a liability in an orderly transaction between market participants at the measurement date, under current market conditions. GAAP establishes a hierarchy that prioritizes the inputs to valuation methods, giving the highest priority to readily available unadjusted quoted prices in an active market for identical assets (Level 1) and the lowest priority to significant unobservable inputs (Level 3), generally when market prices are not readily available. Based on the valuation inputs, the securities or other investments are tiered into one of three levels. Changes in valuation methods may result in transfers in or out of an investment’s assigned level:
| | |
| Level 1 - | | Prices are determined using quoted prices in an active market for identical assets. |
| Level 2 - | | Prices are determined using other significant observable inputs. Observable inputs are inputs that other market participants may use in pricing a security. These may include quoted prices for similar securities, interest rates, prepayment speeds, credit risk, yield curves, loss severities, default rates, discount rates, volatilities and others. |
| Level 3 - | | Prices are determined using significant unobservable inputs. In situations where quoted prices or observable inputs are unavailable (for example, when there is little or no market activity for an investment at the end of the period), unobservable inputs may be used. Unobservable inputs reflect the Adviser’s assumptions about the factors market participants would use in determining fair value of the securities or instruments and would be based on the best available information. |
The following is a summary of the tiered valuation input levels, as of October 31, 2022. The level assigned to the securities valuations may not be an indication of the risk or liquidity associated with investing in those securities. Because of the inherent uncertainties of valuation, the values reflected in the consolidated financial statements may materially differ from the value received upon actual sale of those investments.
| | | | | | | | | | | | | | | | |
| | | Level 1 | | | Level 2 | | | Level 3 | | | Total | |
|
| |
Investments in Securities | | | | | | | | | | | | | | | | |
|
| |
U.S. Treasury Securities | | $ | – | | | $ | 66,497,874 | | | | $– | | | $ | 66,497,874 | |
|
| |
Money Market Funds | | | 61,791,867 | | | | – | | | | – | | | | 61,791,867 | |
|
| |
Options Purchased | | | 8,235,440 | | | | – | | | | – | | | | 8,235,440 | |
|
| |
Total Investments in Securities | | | 70,027,307 | | | | 66,497,874 | | | | – | | | | 136,525,181 | |
|
| |
| | | | |
Other Investments - Assets* | | | | | | | | | | | | | | | | |
|
| |
Futures Contracts | | | 4,111,989 | | | | – | | | | – | | | | 4,111,989 | |
|
| |
Swap Agreements | | | – | | | | 1,115,321 | | | | – | | | | 1,115,321 | |
|
| |
| | | 4,111,989 | | | | 1,115,321 | | | | – | | | | 5,227,310 | |
|
| |
| | | | |
Other Investments - Liabilities* | | | | | | | | | | | | | | | | |
|
| |
Futures Contracts | | | (2,936,492 | ) | | | – | | | | – | | | | (2,936,492 | ) |
|
| |
Swap Agreements | | | – | | | | (316,999 | ) | | | – | | | | (316,999 | ) |
|
| |
| | | (2,936,492 | ) | | | (316,999 | ) | | | – | | | | (3,253,491 | ) |
|
| |
Total Other Investments | | | 1,175,497 | | | | 798,322 | | | | – | | | | 1,973,819 | |
|
| |
Total Investments | | $ | 71,202,804 | | | $ | 67,296,196 | | | | $– | | | $ | 138,499,000 | |
|
| |
| * | Unrealized appreciation (depreciation). |
NOTE 4–Derivative Investments
The Fund may enter into an ISDA Master Agreement under which a fund may trade OTC derivatives. An OTC transaction entered into under an ISDA Master Agreement typically involves a collateral posting arrangement, payment netting provisions and close-out netting provisions. These netting provisions allow for reduction of credit risk through netting of contractual obligations. The enforceability of the netting provisions of the ISDA Master Agreement depends on the governing law of the ISDA Master Agreement, among other factors.
For financial reporting purposes, the Fund does not offset OTC derivative assets or liabilities that are subject to ISDA Master Agreements in the Consolidated Statement of Assets and Liabilities.
Value of Derivative Investments at Period-End
The table below summarizes the value of the Fund’s derivative investments, detailed by primary risk exposure, held as of October 31, 2022:
| | | | | | | | | | | | | | | | |
| | | Value | |
| | | Commodity | | | Equity | | | Interest | | | | |
| Derivative Assets | | Risk | | | Risk | | | Rate Risk | | | Total | |
|
| |
Unrealized appreciation on futures contracts –Exchange-Traded(a) | | $ | 1,813,379 | | | $ | 2,291,719 | | | $ | 6,891 | | | $ | 4,111,989 | |
|
| |
Unrealized appreciation on swap agreements – OTC | | | 10,419 | | | | 1,104,902 | | | | – | | | | 1,115,321 | |
|
| |
Options purchased, at value – Exchange-Traded(b) | | | – | | | | 8,235,440 | | | | – | | | | 8,235,440 | |
|
| |
Total Derivative Assets | | | 1,823,798 | | | | 11,632,061 | | | | 6,891 | | | | 13,462,750 | |
|
| |
Derivatives not subject to master netting agreements | | | (1,813,379 | ) | | | (10,527,159 | ) | | | (6,891 | ) | | | (12,347,429 | ) |
|
| |
Total Derivative Assets subject to master netting agreements | | $ | 10,419 | | | $ | 1,104,902 | | | $ | – | | | $ | 1,115,321 | |
|
| |
| | |
| 22 | | Invesco Macro Allocation Strategy Fund |
| | | | | | | | | | | | | | | | |
| | | Value | |
| | | Commodity | | | Equity | | | Interest | | | | |
| Derivative Liabilities | | Risk | | | Risk | | | Rate Risk | | | Total | |
|
| |
Unrealized depreciation on futures contracts – Exchange-Traded(a) | | $ | (943,262 | ) | | $ | (492,447 | ) | | $ | (1,500,783 | ) | | $ | (2,936,492 | ) |
|
| |
Unrealized depreciation on swap agreements – OTC | | | (245,545 | ) | | | (71,454 | ) | | | – | | | | (316,999 | ) |
|
| |
Total Derivative Liabilities | | | (1,188,807 | ) | | | (563,901 | ) | | | (1,500,783 | ) | | | (3,253,491 | ) |
|
| |
Derivatives not subject to master netting agreements | | | 943,262 | | | | 492,447 | | | | 1,500,783 | | | | 2,936,492 | |
|
| |
Total Derivative Liabilities subject to master netting agreements | | $ | (245,545 | ) | | $ | (71,454 | ) | | $ | – | | | $ | (316,999) | |
|
| |
| (a) | The daily variation margin receivable (payable) at period-end is recorded in the Consolidated Statement of Assets and Liabilities. |
| (b) | Options purchased, at value as reported in the Consolidated Schedule of Investments. |
Offsetting Assets and Liabilities
The table below reflects the Fund’s exposure to Counterparties subject to either an ISDA Master Agreement or other agreement for OTC derivative transactions as of October 31, 2022.
| | | | | | | | | | | | | | | | | | | | | | | | |
| | | Financial | | | Financial | | | | | | | | | | | | | |
| | | Derivative | | | Derivative | | | | | | Collateral | | | | |
| | | Assets | | | Liabilities | | | | | | (Received)/Pledged | | | | |
| | | Swap | | | Swap | | | Net Value of | | | | | | | | | Net | |
| Counterparty | | Agreements | | | Agreements | | | Derivatives | | | Non-Cash | | | Cash | | | Amount(a) | |
|
| |
Fund | | | | | | | | | | | | | | | | | | | | | | | | |
BNP Paribas S.A. | | $ | 409,966 | | | $ | (11,274 | ) | | $ | 398,692 | | | | $– | | | $ | (360,000 | ) | | $ | 38,692 | |
|
| |
Citibank, N.A. | | | 334,023 | | | | (214,445 | ) | | | 119,578 | | | | – | | | | (119,578 | ) | | | – | |
|
| |
Goldman Sachs International | | | 44,328 | | | | (969 | ) | | | 43,359 | | | | – | | | | – | | | | 43,359 | |
|
| |
J.P. Morgan Chase Bank, N.A. | | | 316,584 | | | | (92,702 | ) | | | 223,882 | | | | – | | | | (223,882 | ) | | | – | |
|
| |
Subtotal - Fund | | | 1,104,901 | | | | (319,390 | ) | | | 785,511 | | | | – | | | | (703,460 | ) | | | 82,051 | |
|
| |
Subsidiary | | | | | | | | | | | | | | | | | | | | | | | | |
| | | | | | |
Canadian Imperial Bank of Commerce | | | 10,420 | | | | (99 | ) | | | 10,321 | | | | – | | | | – | | | | 10,321 | |
|
| |
Macquarie Bank Ltd. | | | – | | | | (246,000 | ) | | | (246,000 | ) | | | – | | | | 220,000 | | | | (26,000 | ) |
|
| |
Morgan Stanley Capital Services LLC | | | – | | | | (2,391 | ) | | | (2,391 | ) | | | – | | | | – | | | | (2,391 | ) |
|
| |
Subtotal - Subsidiary | | | 10,420 | | | | (248,490 | ) | | | (238,070 | ) | | | – | | | | 220,000 | | | | (18,070 | ) |
|
| |
Total | | $ | 1,115,321 | | | $ | (567,880 | ) | | $ | 547,441 | | | | $– | | | $ | (483,460 | ) | | $ | 63,981 | |
|
| |
| (a) | The Fund and the Subsidiary are recognized as separate legal entities and as such are subject to separate netting arrangements with the Counterparty. |
Effect of Derivative Investments for the year ended October 31, 2022
The table below summarizes the gains (losses) on derivative investments, detailed by primary risk exposure, recognized in earnings during the period:
| | | | | | | | | | | | | | | | |
| | | Location of Gain (Loss) on | |
| | | Consolidated Statement of Operations | |
| | | Commodity | | | Equity | | | Interest | | | | |
| | | Risk | | | Risk | | | Rate Risk | | | Total | |
|
| |
Realized Gain (Loss): | | | | | | | | | | | | | | | | |
Futures contracts | | $ | (2,288,991 | ) | | $ | 2,890,320 | | | $ | (6,629,913 | ) | | $ | (6,028,584 | ) |
|
| |
Options purchased(a) | | | - | | | | (3,565,785 | ) | | | - | | | | (3,565,785 | ) |
|
| |
Swap agreements | | | 3,248,322 | | | | (15,234,916 | ) | | | - | | | | (11,986,594 | ) |
|
| |
Change in Net Unrealized Appreciation (Depreciation): | | | | | | | | | | | | | | | | |
Futures contracts | | | 196,977 | | | | (105,231 | ) | | | 636,868 | | | | 728,614 | |
|
| |
Options purchased(a) | | | - | | | | 1,895,392 | | | | - | | | | 1,895,392 | |
|
| |
Swap agreements | | | (1,309,835 | ) | | | 16,254 | | | | - | | | | (1,293,581 | ) |
|
| |
Total | | $ | (153,527 | ) | | $ | (14,103,966 | ) | | $ | (5,993,045 | ) | | $ | (20,250,538 | ) |
|
| |
| (a) | Options purchased are included in the net realized gain (loss) from investment securities and the change in net unrealized appreciation (depreciation) of investment securities. |
The table below summarizes the average notional value of derivatives held during the period.
| | | | | | | | | | | | | | | | | | | | |
| | | Futures | | | | | | Options | | | | | | Swap | |
| | | Contracts | | | | | | Purchased | | | | | | Agreements | |
|
| |
Average notional value | | $ | 281,304,331 | | | | | | | $ | 55,851,042 | | | | | | | $ | 150,040,509 | |
|
| |
Average contracts | | | – | | | | | | | | 132 | | | | | | | | – | |
|
| |
| | |
| 23 | | Invesco Macro Allocation Strategy Fund |
NOTE 5–Trustees’ and Officers’ Fees and Benefits
Trustees’ and Officers’ Fees and Benefits include amounts accrued by the Fund to pay remuneration to certain Trustees and Officers of the Fund. Trustees have the option to defer compensation payable by the Fund, and Trustees’ and Officers’ Fees and Benefits also include amounts accrued by the Fund to fund such deferred compensation amounts. Those Trustees who defer compensation have the option to select various Invesco Funds in which their deferral accounts shall be deemed to be invested. Finally, certain current Trustees were eligible to participate in a retirement plan that provided for benefits to be paid upon retirement to Trustees over a period of time based on the number of years of service. The Fund may have certain former Trustees who also participate in a retirement plan and receive benefits under such plan. Trustees’ and Officers’ Fees and Benefits include amounts accrued by the Fund to fund such retirement benefits. Obligations under the deferred compensation and retirement plans represent unsecured claims against the general assets of the Fund.
NOTE 6–Cash Balances
The Fund is permitted to temporarily carry a negative or overdrawn balance in its account with SSB, the custodian bank. Such balances, if any at period-end, are shown in the Consolidated Statement of Assets and Liabilities under the payable caption Amount due custodian. To compensate the custodian bank for such overdrafts, the overdrawn Fund may either (1) leave funds as a compensating balance in the account so the custodian bank can be compensated by earning the additional interest; or (2) compensate by paying the custodian bank at a rate agreed upon by the custodian bank and Invesco, not to exceed the contractually agreed upon rate. The Fund may not purchase additional securities when any borrowings from banks or broker-dealers exceed 5% of the Fund’s total assets, or when any borrowings from an Invesco Fund are outstanding.
NOTE 7–Distributions to Shareholders and Tax Components of Net Assets
Tax Character of Distributions to Shareholders Paid During the Fiscal Years Ended October 31, 2022 and 2021:
| | | | | | | | | | |
| | | 2022 | | | | | | 2021 |
|
|
Ordinary income* | | $ | 22,821,100 | | | | | | | $– |
|
|
| * | Includes short-term capital gain distributions, if any. |
Tax Components of Net Assets at Period-End:
| | | | |
| | | 2022 | |
|
| |
Net unrealized appreciation (depreciation) – investments | | $ | (885,886 | ) |
|
| |
Net unrealized appreciation (depreciation) – foreign currencies | | | (1,033 | ) |
|
| |
Temporary book/tax differences | | | (19,228 | ) |
|
| |
Capital loss carryforward | | | (6,362,758 | ) |
|
| |
Shares of beneficial interest | | | 163,385,059 | |
|
| |
Total net assets | | $ | 156,116,154 | |
|
| |
The difference between book-basis and tax-basis unrealized appreciation (depreciation) is due to differences in the timing of recognition of gains and losses on investments for tax and book purposes. The Fund’s net unrealized appreciation (depreciation) difference is attributable primarily to derivative instruments and subsidiary differences.
The temporary book/tax differences are a result of timing differences between book and tax recognition of income and/or expenses. The Fund’s temporary book/tax differences are the result of the trustee deferral of compensation and retirement plan benefits.
Capital loss carryforward is calculated and reported as of a specific date. Results of transactions and other activity after that date may affect the amount of capital loss carryforward actually available for the Fund to utilize. The ability to utilize capital loss carryforward in the future may be limited under the Internal Revenue Code and related regulations based on the results of future transactions.
The Fund has a capital loss carryforward as of October 31, 2022, as follows:
| | | | | | | | | | | | |
| Capital Loss Carryforward* | |
| Expiration | | Short-Term | | | Long-Term | | | Total | |
Not subject to expiration | | $ | 4,930,273 | | | $ | 1,432,485 | | | $ | 6,362,758 | |
| * | Capital loss carryforward is reduced for limitations, if any, to the extent required by the Internal Revenue Code and may be further limited depending upon a variety of factors, including the realization of net unrealized gains or losses as of the date of any reorganization. |
NOTE 8–Investment Transactions
The aggregate amount of investment securities (other than short-term securities, U.S. Government obligations and money market funds, if any) purchased and sold by the Fund during the year ended October 31, 2022 was $4,531,260 and $1,670,268, respectively. Cost of investments, including any derivatives, on a tax basis includes the adjustments for financial reporting purposes as of the most recently completed federal income tax reporting period-end.
| | | | |
Unrealized Appreciation (Depreciation) of Investments on a Tax Basis | |
Aggregate unrealized appreciation of investments | | | $2,925,928 | |
|
| |
Aggregate unrealized (depreciation) of investments | | | (3,811,814 | ) |
|
| |
Net unrealized appreciation (depreciation) of investments | | | $ (885,886 | ) |
|
| |
Cost of investments for tax purposes is $139,384,886.
NOTE 9–Reclassification of Permanent Differences
Primarily as a result of differing book/tax treatment of net operating losses,foreign currency transactions and derivative instruments, on October 31, 2022, undistributed net investment income (loss) was increased by $2,192,569, undistributed net realized gain (loss) was increased by $16,035,665 and shares of beneficial interest was decreased by $18,228,234. This reclassification had no effect on the net assets of the Fund.
| | |
| 24 | | Invesco Macro Allocation Strategy Fund |
NOTE 10–Share Information
| | | | | | | | | | | | | | | | |
| | | Summary of Share Activity | |
|
| |
| | | Year ended | | | Year ended | |
| | | October 31, 2022(a) | | | October 31, 2021 | |
| | | Shares | | | Amount | | | Shares | | | Amount | |
|
| |
Sold: | | | | | | | | | | | | | | | | |
Class A | | | 37,914 | | | $ | 298,375 | | | | 79,759 | | | $ | 733,387 | |
|
| |
Class C | | | 4,285 | | | | 33,815 | | | | 2,580 | | | | 23,183 | |
|
| |
Class R | | | 4,722 | | | | 37,670 | | | | 5,178 | | | | 46,899 | |
|
| |
Class Y | | | 20,824 | | | | 167,103 | | | | 137,105 | | | | 1,261,958 | |
|
| |
Class R6 | | | 297,557 | | | | 2,446,746 | | | | 7,293,808 | | | | 66,867,282 | |
|
| |
| | | | |
Issued as reinvestment of dividends: | | | | | | | | | | | | | | | | |
Class A | | | 16,258 | | | | 138,513 | | | | - | | | | - | |
|
| |
Class C | | | 2,045 | | | | 17,284 | | | | - | | | | - | |
|
| |
Class R | | | 1,107 | | | | 9,432 | | | | - | | | | - | |
|
| |
Class Y | | | 56,522 | | | | 484,963 | | | | - | | | | - | |
|
| |
Class R6 | | | 2,577,644 | | | | 22,090,405 | | | | - | | | | - | |
|
| |
| | | | |
Automatic conversion of Class C shares to Class A shares: | | | | | | | | | | | | | | | | |
Class A | | | 7,936 | | | | 65,455 | | | | 28,670 | | | | 258,713 | |
|
| |
Class C | | | (8,047 | ) | | | (65,455 | ) | | | (29,083 | ) | | | (258,713 | ) |
|
| |
| | | | |
Reacquired: | | | | | | | | | | | | | | | | |
Class A | | | (91,257 | ) | | | (727,692 | ) | | | (150,015 | ) | | | (1,364,412 | ) |
|
| |
Class C | | | (12,373 | ) | | | (108,360 | ) | | | (35,389 | ) | | | (319,063 | ) |
|
| |
Class R | | | (5,484 | ) | | | (48,580 | ) | | | (706 | ) | | | (6,547 | ) |
|
| |
Class Y | | | (157,159 | ) | | | (1,271,556 | ) | | | (754,036 | ) | | | (6,723,340 | ) |
|
| |
Class R6 | | | (9,470,381 | ) | | | (75,548,073 | ) | | | (1,588,368 | ) | | | (14,794,541 | ) |
|
| |
Net increase (decrease) in share activity | | | (6,717,887 | ) | | $ | (51,979,955 | ) | | | 4,989,503 | | | $ | 45,724,806 | |
|
| |
| (a) | 95% of the outstanding shares of the Fund are owned by the Adviser or an affiliate of the Adviser. |
| | |
| 25 | | Invesco Macro Allocation Strategy Fund |
Report of Independent Registered Public Accounting Firm
To the Board of Trustees of AIM Investment Funds (Invesco Investment Funds) and Shareholders of Invesco Macro Allocation Strategy Fund
Opinion on the Consolidated Financial Statements
We have audited the accompanying consolidated statement of assets and liabilities, including the consolidated schedule of investments, of Invesco Macro Allocation Strategy Fund and its subsidiary (one of the funds constituting AIM Investment Funds (Invesco Investment Funds), referred to hereafter as the “Fund”)as of October 31, 2022, the related consolidated statement of operations for the year ended October 31, 2022, the consolidated statement of changes in net assets for each of the two years in the period ended October 31, 2022, including the related notes, and the consolidated financial highlights for each of the five years in the period ended October 31, 2022 (collectively referred to as the “consolidated financial statements”). In our opinion, the consolidated financial statements present fairly, in all material respects, the financial position of the Fund as of October 31, 2022, the results of its operations for the year then ended, the changes in its net assets for each of the two years in the period ended October 31, 2022 and the financial highlights for each of the five years in the period ended October 31, 2022 in conformity with accounting principles generally accepted in the United States of America.
Basis for Opinion
These consolidated financial statements are the responsibility of the Fund’s management. Our responsibility is to express an opinion on the Fund’s consolidated financial statements based on our audits. We are a public accounting firm registered with the Public Company Accounting Oversight Board (United States) (PCAOB) and are required to be independent with respect to the Fund in accordance with the U.S. federal securities laws and the applicable rules and regulations of the Securities and Exchange Commission and the PCAOB.
We conducted our audits of these consolidated financial statements in accordance with the standards of the PCAOB. Those standards require that we plan and perform the audit to obtain reasonable assurance about whether the consolidated financial statements are free of material misstatement, whether due to error or fraud.
Our audits included performing procedures to assess the risks of material misstatement of the consolidated financial statements, whether due to error or fraud, and performing procedures that respond to those risks. Such procedures included examining, on a test basis, evidence regarding the amounts and disclosures in the consolidated financial statements. Our audits also included evaluating the accounting principles used and significant estimates made by management, as well as evaluating the overall presentation of the consolidated financial statements. Our procedures included confirmation of securities owned as of October 31, 2022 by correspondence with the custodian, transfer agent and brokers; when replies were not received from brokers, we performed other auditing procedures. We believe that our audits provide a reasonable basis for our opinion.
/s/PricewaterhouseCoopers LLP
Houston, Texas
December 23, 2022
We have served as the auditor of one or more of the investment companies in the Invesco group of investment companies since at least 1995. We have not been able to determine the specific year we began serving as auditor.
| | |
| 26 | | Invesco Macro Allocation Strategy Fund |
Calculating your ongoing Fund expenses
Example
As a shareholder of the Fund, you incur two types of costs: (1) transaction costs, which may include sales charges (loads) on purchase payments or contingent deferred sales charges on redemptions, if any; and (2) ongoing costs, including management fees, distribution and/or service (12b-1) fees, and other Fund expenses. This example is intended to help you understand your ongoing costs (in dollars) of investing in the Fund and to compare these costs with ongoing costs of investing in other mutual funds. The example is based on an investment of $1,000 invested at the beginning of the period and held for the entire period May 1, 2022 through October 31, 2022.
Actual expenses
The table below provides information about actual account values and actual expenses. You may use the information in this table, together with the amount you invested, to estimate the expenses that you paid over the period. Simply divide your account value by $1,000 (for example, an $8,600 account value divided by $1,000 = 8.6), then multiply the result by the number in the table under the heading entitled “Actual Expenses Paid During Period” to estimate the expenses you paid on your account during this period.
Hypothetical example for comparison purposes
The table below also provides information about hypothetical account values and hypothetical expenses based on the Fund’s actual expense ratio and an assumed rate of return of 5% per year before expenses, which is not the Fund’s actual return.
The hypothetical account values and expenses may not be used to estimate the actual ending account balance or expenses you paid for the period. You may use this information to compare the ongoing costs of investing in the Fund and other funds. To do so, compare this 5% hypothetical example with the 5% hypothetical examples that appear in the shareholder reports of the other funds.
Please note that the expenses shown in the table are meant to highlight your ongoing costs only and do not reflect any transaction costs, such as sales charges (loads) on purchase payments or contingent deferred sales charges on redemptions, if any. Therefore, the hypothetical information is useful in comparing ongoing costs only, and will not help you determine the relative total costs of owning different funds. In addition, if these transaction costs were included, your costs would have been higher.
| | | | | | | | | | | | |
| | | | | ACTUAL | | HYPOTHETICAL (5% annual return before expenses) | | |
| | | Beginning
Account Value
(05/01/22) | | Ending
Account Value
(10/31/22)1 | | Expenses
Paid During
Period2 | | Ending
Account Value
(10/31/22) | | Expenses
Paid During
Period2 | | Annualized
Expense Ratio |
Class A | | $1,000.00 | | $960.50 | | $6.92 | | $1,018.15 | | $7.12 | | 1.40% |
Class C | | 1,000.00 | | 956.20 | | 10.60 | | 1,014.37 | | 10.92 | | 2.15 |
Class R | | 1,000.00 | | 959.20 | | 8.15 | | 1,016.89 | | 8.39 | | 1.65 |
Class Y | | 1,000.00 | | 960.90 | | 5.68 | | 1,019.41 | | 5.85 | | 1.15 |
Class R5 | | 1,000.00 | | 960.90 | | 5.54 | | 1,019.56 | | 5.70 | | 1.12 |
Class R6 | | 1,000.00 | | 960.80 | | 5.63 | | 1,019.46 | | 5.80 | | 1.14 |
| 1 | The actual ending account value is based on the actual total return of the Fund for the period May 1, 2022 through October 31, 2022, after actual expenses and will differ from the hypothetical ending account value which is based on the Fund’s expense ratio and a hypothetical annual return of 5% before expenses. |
| 2 | Expenses are equal to the Fund’s annualized expense ratio as indicated above multiplied by the average account value over the period, multiplied by 184/365 to reflect the most recent fiscal half year. |
| | |
| 27 | | Invesco Macro Allocation Strategy Fund |
Approval of Investment Advisory and Sub-Advisory Contracts
At meetings held on June 13, 2022, the Board of Trustees (the Board or the Trustees) of AIM Investment Funds (Invesco Investment Funds) as a whole, and the independent Trustees, who comprise over 75% of the Board, voting separately, approved the continuance of the Invesco Macro Allocation Strategy Fund’s (the Fund) Master Investment Advisory Agreement with Invesco Advisers, Inc. (Invesco Advisers and the investment advisory agreement) and the Master Intergroup Sub-Advisory Contract for Mutual Funds with Invesco Asset Management Deutschland GmbH, Invesco Asset Management Limited, Invesco Asset Management (Japan) Limited, Invesco Hong Kong Limited, Invesco Senior Secured Management, Inc. and Invesco Canada Ltd. and separate sub-advisory contracts with Invesco Capital Management LLC and Invesco Asset Management (India) Private Limited (collectively, the Affiliated Sub-Advisers and the sub-advisory contracts) for another year, effective July 1, 2022. After evaluating the factors discussed below, among others, the Board approved the renewal of the Fund’s investment advisory agreement and the sub-advisory contracts and determined that the compensation payable thereunder by the Fund to Invesco Advisers and by Invesco Advisers to the Affiliated Sub-Advisers is fair and reasonable.
The Board’s Evaluation Process
The Board has established an Investments Committee, which in turn has established Sub-Committees that meet throughout the year to review the performance of funds advised by Invesco Advisers (the Invesco Funds). The Sub-Committees meet regularly with portfolio managers for their assigned Invesco Funds and other members of management to review detailed information about investment performance and portfolio attributes of these funds. The Board has established additional standing and ad hoc committees that meet regularly throughout the year to review matters within their purview. The Board took into account evaluations and reports that it received from its committees and sub-committees, as well as the information provided to the Board and its committees and sub-committees throughout the year, in considering whether to approve each Invesco Fund’s investment advisory agreement and sub-advisory contracts.
As part of the contract renewal process, the Board reviews and considers information provided in response to detailed requests for information submitted to management by the independent Trustees with assistance from legal counsel to the independent Trustees and the Senior Officer, an officer of the Invesco Funds who reports directly to the independent Trustees. The Board receives comparative investment performance and fee and expense data regarding the Invesco Funds prepared by Broadridge Financial Solutions, Inc. (Broadridge), an independent mutual fund data provider, as well as information on the composition of the peer groups provided by Broadridge and its methodology for determining peer groups. The Board also receives an independent written evaluation from the Senior Officer. The Senior Officer’s evaluation is prepared as part of his responsibility to manage the process by which the Invesco Funds’ proposed management fees are negotiated during the annual contract renewal
process to ensure they are negotiated in a manner that is at arms’ length and reasonable in accordance with certain negotiated regulatory requirements. In addition to meetings with Invesco Advisers and fund counsel throughout the year and as part of meetings convened on May 2, 2022 and June 13, 2022, the independent Trustees also discussed the continuance of the investment advisory agreement and sub-advisory contracts in separate sessions with the Senior Officer and with independent legal counsel. Also, as part of the contract renewal process, the independent Trustees reviewed and considered information provided in response to detailed follow-up requests for information submitted by the independent Trustees to management. The independent Trustees met and discussed those follow-up responses with legal counsel to the independent Trustees and the Senior Officer.
The discussion below is a summary of the Senior Officer’s independent written evaluation with respect to the Fund’s investment advisory agreement and sub-advisory contracts, as well as a discussion of the material factors and related conclusions that formed the basis for the Board’s approval of the Fund’s investment advisory agreement and sub-advisory contracts. The Trustees’ review and conclusions are based on the comprehensive consideration of all information presented to them during the course of the year and in prior years and are not the result of any single determinative factor. Moreover, one Trustee may have weighed a particular piece of information or factor differently than another Trustee. The information received and considered by the Board was current as of various dates prior to the Board’s approval on June 13, 2022.
Factors and Conclusions and Summary of Independent Written Fee Evaluation
| A. | Nature, Extent and Quality of Services Provided by Invesco Advisers and the Affiliated Sub-Advisers |
The Board reviewed the nature, extent and quality of the advisory services provided to the Fund by Invesco Advisers under the Fund’s investment advisory agreement, and the credentials and experience of the officers and employees of Invesco Advisers who provide these services, including the Fund’s portfolio manager(s). The Board’s review included consideration of Invesco Advisers’ investment process and oversight, credit analysis, and research capabilities. The Board considered information regarding Invesco Advisers’ programs for and resources devoted to risk management, including management of investment, enterprise, operational, liquidity, valuation and compliance risks, and technology used to manage such risks. The Board also received and reviewed information about Invesco Advisers’ role as administrator of the Invesco Funds’ liquidity risk management program. The Board received a description of, and reports related to, Invesco Advisers’ global security program and business continuity plans and of its approach to data privacy and cybersecurity, including related testing. The Board considered how the cybersecurity and business continuity plans of Invesco Advisers and its key service providers operated in the remote and hybrid working environment resulting from the novel coronavirus (“COVID-19”) pandemic and paved the way for a hybrid working framework in a normalized
environment as employees return to the office. The Board also considered non-advisory services that Invesco Advisers and its affiliates provide to the Invesco Funds, such as various back office support functions, third party oversight, internal audit, valuation, portfolio trading and legal and compliance. The Board observed that Invesco Advisers’ systems preparedness and ongoing investment enabled Invesco Advisers to manage, operate and oversee the Invesco Funds with minimal impact or disruption through challenging environments. The Board reviewed and considered the benefits to shareholders of investing in a Fund that is part of the family of funds under the umbrella of Invesco Ltd., Invesco Advisers’ parent company, and noted Invesco Ltd.’s depth and experience in running an investment management business, as well as its commitment of financial and other resources to such business. The Board concluded that the nature, extent and quality of the services provided to the Fund by Invesco Advisers are appropriate and satisfactory.
The Board reviewed the services that may be provided by the Affiliated Sub-Advisers under the sub-advisory contracts and the credentials and experience of the officers and employees of the Affiliated Sub-Advisers who provide these services. The Board noted the Affiliated Sub-Advisers’ expertise with respect to certain asset classes and that the Affiliated Sub-Advisers have offices and personnel that are located in financial centers around the world. As a result, the Board noted that the Affiliated Sub-Advisers can provide research and investment analysis on the markets and economies of various countries in which the Fund may invest, make recommendations regarding securities and assist with security trades. The Board concluded that the sub-advisory contracts may benefit the Fund and its shareholders by permitting Invesco Advisers to use the resources and talents of the Affiliated Sub-Advisers in managing the Fund. The Board concluded that the nature, extent and quality of the services that may be provided to the Fund by the Affiliated Sub-Advisers are appropriate and satisfactory.B. Fund Investment Performance
The Board considered Fund investment performance as a relevant factor in considering whether to approve the investment advisory agreement. The Board did not view Fund investment performance as a relevant factor in considering whether to approve the sub-advisory contracts for the Fund, as no Affiliated Sub-Adviser currently manages assets of the Fund.
The Board compared the Fund’s investment performance over multiple time periods ending December 31, 2021 to the performance of funds in the Broadridge performance universe and against the Bloomberg 3-Month Treasury Bellwether Index (Index). The Board noted that performance of Class Y shares of the Fund was in the third quintile of its performance universe for the one and five year periods and the fourth quintile for the three year period (the first quintile being the best performing funds and the fifth quintile being the worst performing funds). The Board noted that performance of Class Y shares of the Fund was above the performance of the Index for the one, three and five year periods. The Board acknowledged limitations
| | |
| 28 | | Invesco Macro Allocation Strategy Fund |
regarding the Broadridge data, in particular that differences may exist between a Fund’s investment objective, principal investment strategies and/or investment restrictions and those of its performance peer funds. The Board recognized that the performance data reflects a snapshot in time as of a particular date and that selecting a different performance period could produce different results. The Board also reviewed more recent Fund performance as well as other performance metrics, which did not change its conclusions.
| C. | Advisory and Sub-Advisory Fees and Fund Expenses |
The Board compared the Fund’s contractual management fee rate to the contractual management fee rates of funds in the Fund’s Broadridge expense group. The Board noted that the contractual management fee rate for Class Y shares of the Fund was above the median contractual management fee rate of funds in its expense group. The Board noted that the term “contractual management fee” for funds in the expense group may include both advisory and certain non-portfolio management administrative services fees, but that Broadridge is not able to provide information on a fund by fund basis as to what is included. The Board also reviewed the methodology used by Broadridge in calculating expense group information, which includes using each fund’s contractual management fee schedule (including any applicable breakpoints) as reported in the most recent prospectus or statement of additional information for each fund in the expense group. As previously noted, the independent Trustees reviewed and considered information provided in response to detailed follow-up requests for information submitted by the independent Trustees to management, including with respect to management’s philosophy regarding breakpoints in the Fund’s contractual management fee schedule. The independent Trustees met and discussed those follow-up responses with legal counsel to the independent Trustees and the Senior Officer, and subsequently with representatives of management. The Board also considered comparative information regarding the Fund’s total expense ratio and its various components. The Board noted that there were only three funds (including the Fund) in the expense group and requested and considered additional information from management regarding the appropriateness of the actual and contractual management fees in light of the Fund’s relative ranking in its expense group.
The Board noted that Invesco Advisers has contractually agreed to waive fees and/or limit expenses of the Fund for the term disclosed in the Fund’s registration statement in an amount necessary to limit total annual operating expenses to a specified percentage of average daily net assets for each class of the Fund.
The Board also considered the fees charged by Invesco Advisers and its affiliates to other client accounts that are similarly managed. Invesco Advisers reviewed with the Board differences in the scope of services it provides to the Invesco Funds relative to that provided by Invesco Advisers and its affiliates to certain other types of client accounts, including, among others: management of cash flows as a result of redemptions and purchases; necessary infrastructure such as officers, office space, technology, legal and distribution; oversight of service providers; costs and business risks associated with launching new funds and sponsoring and
maintaining the product line; and compliance with federal and state laws and regulations. Invesco Advisers also advised the Board that many of the similarly managed client accounts have all-inclusive fee structures, which are not easily un-bundled.
The Board also considered the services that may be provided by the Affiliated Sub-Advisers pursuant to the sub-advisory contracts, as well as the fees payable by Invesco Advisers to the Affiliated Sub-Advisers pursuant to the sub-advisory contracts.
| D. | Economies of Scale and Breakpoints |
The Board considered the extent to which there may be economies of scale in the provision of advisory services to the Fund and the Invesco Funds, and the extent to which such economies of scale are shared with the Fund and the Invesco Funds. The Board considered that the Fund benefits from economies of scale through contractual breakpoints in the Fund’s advisory fee schedule, which generally operate to reduce the Fund’s expense ratio as it grows in size. The Board noted that the Fund also shares in economies of scale through Invesco Advisers’ ability to negotiate lower fee arrangements with third party service providers. The Board noted that the Fund may also benefit from economies of scale through initial fee setting, fee waivers and expense reimbursements, as well as Invesco Advisers’ investment in its business, including investments in business infrastructure, technology and cybersecurity.
| E. | Profitability and Financial Resources |
The Board reviewed information from Invesco Advisers concerning the costs of the advisory and other services that Invesco Advisers and its affiliates provide to the Fund and the Invesco Funds and the profitability of Invesco Advisers and its affiliates in providing these services in the aggregate and on an individual Fund-by-Fund basis. The Board considered the methodology used for calculating profitability and the periodic review and enhancement of such methodology. The Board noted that Invesco Advisers continues to operate at a net profit from services Invesco Advisers and its affiliates provide to the Invesco Funds in the aggregate and to most Funds individually. The Board did not deem the level of profits realized by Invesco Advisers and its affiliates from providing such services to be excessive, given the nature, extent and quality of the services provided. The Board noted that Invesco Advisers provided information demonstrating that Invesco Advisers is financially sound and has the resources necessary to perform its obligations under the investment advisory agreement, and provided representations indicating that the Affiliated Sub-Advisers are financially sound and have the resources necessary to perform their obligations under the sub-advisory contracts.
| F. | Collateral Benefits to Invesco Advisers and its Affiliates |
The Board considered various other benefits received by Invesco Advisers and its affiliates from the relationship with the Fund, including the fees received for providing administrative, transfer agency and distribution services to the Fund. The Board received comparative information regarding fees charged for these services, including information provided by Broadridge and other independent sources. The Board reviewed the performance of Invesco Advisers and its affiliates in providing these services and the organizational structure employed to provide these services. The Board noted that these services are provided to the
Fund pursuant to written contracts that are reviewed and subject to approval on an annual basis by the Board based on its determination that the services are required for the operation of the Fund.
The Board considered the benefits realized by Invesco Advisers and the Affiliated Sub-Advisers as a result of portfolio brokerage transactions executed through “soft dollar” arrangements. Invesco Advisers noted that the Fund does not execute brokerage transactions through “soft dollar” arrangements to any significant degree.
The Board considered that the Fund’s uninvested cash and cash collateral from any securities lending arrangements may be invested in registered money market funds or, with regard to securities lending cash collateral, unregistered funds that comply with Rule 2a-7 (collectively referred to as “affiliated money market funds”) advised by Invesco Advisers. The Board considered information regarding the returns of the affiliated money market funds relative to comparable overnight investments, as well as the fees paid by the affiliated money market funds to Invesco Advisers and its affiliates. In this regard, the Board noted that Invesco Advisers receives advisory fees from these affiliated money market funds attributable to the Fund’s investments. The Board also noted that Invesco Advisers has contractually agreed to waive through varying periods an amount equal to 100% of the net advisory fee Invesco Advisers receives from the affiliated money market funds with respect to the Fund’s investment in the affiliated money market funds of uninvested cash, but not cash collateral. The Board concluded that the advisory fees payable to Invesco Advisers from the Fund’s investment of cash collateral from any securities lending arrangements in the affiliated money market funds are for services that are not duplicative of services provided by Invesco Advisers to the Fund.
The Board considered that Invesco Advisers may serve as the Fund’s affiliated securities lending agent and evaluated the benefits realized by Invesco Advisers when serving in such role, including the compensation received. The Board considered Invesco Advisers’ securities lending platform and corporate governance structure for securities lending, including Invesco Advisers’ Securities Lending Governance Committee and its related responsibilities. The Board noted that to the extent the Fund utilizes Invesco Advisers as an affiliated securities lending agent, the Fund conducts its securities lending in accordance with, and in reliance upon, no-action letters issued by the SEC staff that provide guidance on how an affiliate may act as a direct agent lender and receive compensation for those services without obtaining exemptive relief. The Board considered information provided by Invesco Advisers related to the performance of Invesco Advisers as securities lending agent, including a summary of the securities lending services provided to the Fund by Invesco Advisers and the compensation paid to Invesco Advisers for such services, as well as any revenues generated for the Fund in connection with such securities lending activity and the allocation of such revenue between the Fund and Invesco Advisers.
The Board also received information about commissions that an affiliated broker may receive for executing certain trades for the Fund. Invesco Advisers and the Affiliated Sub-Advisers advised the Board of the benefits to the Fund of executing trades through the affiliated broker and that such trades
| | |
| 29 | | Invesco Macro Allocation Strategy Fund |
were executed in compliance with rules under the federal securities laws and consistent with best execution obligations.
| | |
| 30 | | Invesco Macro Allocation Strategy Fund |
Tax Information
Form 1099-DIV, Form 1042-S and other year–end tax information provide shareholders with actual calendar year amounts that should be included in their tax returns. Shareholders should consult their tax advisers.
The following distribution information is being provided as required by the Internal Revenue Code or to meet a specific state’s requirement.
The Fund designates the following amounts or, if subsequently determined to be different, the maximum amount allowable for its fiscal year ended October 31, 2022:
| | | | | | | | |
Federal and State Income Tax | | | | | | |
Qualified Dividend Income* | | | 0.00 | % | | | | |
Corporate Dividends Received Deduction* | | | 0.00 | % | | | | |
U.S. Treasury Obligations* | | | 0.49 | % | | | | |
Qualified Business Income* | | | 0.00 | % | | | | |
Business Interest Income* | | | 0.00 | % | | | | |
|
| * The above percentages are based on ordinary income dividends paid to shareholders during the Fund’s fiscal year. | |
| | | | | | | | |
Non-Resident Alien Shareholders | | | | | | |
Short-Term Capital Gain Distributions | | | $8,710,305 | | | | | |
| | |
| 31 | | Invesco Macro Allocation Strategy Fund |
Trustees and Officers
The address of each trustee and officer is AIM Investment Funds (Invesco Investment Funds) (the “Trust”), 11 Greenway Plaza, Suite 1000, Houston, Texas 77046-1173. The trustees serve for the life of the Trust, subject to their earlier death, incapacitation, resignation, retirement or removal as more specifically provided in the Trust’s organizational documents. Each officer serves for a one year term or until their successors are elected and qualified. Column two below includes length of time served with predecessor entities, if any.
| | | | | | | | |
Name, Year of Birth and Position(s) Held with the Trust | | Trustee and/or
Officer Since | | Principal Occupation(s) During Past 5 Years | | Number of
Funds in Fund Complex
Overseen by
Trustee | | Other Directorship(s) Held by Trustee During Past 5 Years |
| Interested Trustee | | | | | | | | |
Martin L. Flanagan1 - 1960 Trustee and Vice Chair | | 2007 | | Executive Director, Chief Executive Officer and President, Invesco Ltd. (ultimate parent of Invesco and a global investment management firm); Trustee and Vice Chair, The Invesco Funds; Vice Chair, Investment Company Institute; and Member of Executive Board, SMU Cox School of Business Formerly: Advisor to the Board, Invesco Advisers, Inc. (formerly known as Invesco Institutional (N.A.), Inc.); Chairman and Chief Executive Officer, Invesco Advisers, Inc. (registered investment adviser); Director, Chairman, Chief Executive Officer and President, Invesco Holding Company (US), Inc. (formerly IVZ Inc.) (holding company), Invesco Group Services, Inc. (service provider) and Invesco North American Holdings, Inc. (holding company); Director, Chief Executive Officer and President, Invesco Holding Company Limited (parent of Invesco and a global investment management firm); Director, Invesco Ltd.; Chairman, Investment Company Institute and President, Co-Chief Executive Officer, Co-President, Chief Operating Officer and Chief Financial Officer, Franklin Resources, Inc. (global investment management organization) | | 189 | | None |
| 1 | Mr. Flanagan is considered an interested person (within the meaning of Section 2(a)(19) of the 1940 Act) of the Trust because he is an officer of the Adviser to the Trust, and an officer and a director of Invesco Ltd., ultimate parent of the Adviser. |
| | |
| T-1 | | Invesco Macro Allocation Strategy Fund |
Trustees and Officers–(continued)
| | | | | | | | |
Name, Year of Birth and Position(s) Held with the Trust | | Trustee and/or
Officer Since | | Principal Occupation(s) During Past 5 Years | | Number of
Funds in Fund Complex
Overseen by
Trustee | | Other Directorship(s) Held by Trustee During Past 5 Years |
| Independent Trustees | | | | | | | | |
Beth Ann Brown - 1968 Trustee (2019) and Chair (August 2022) | | 2019 | | Independent Consultant Formerly: Head of Intermediary Distribution, Managing Director, Strategic Relations, Managing Director, Head of National Accounts, Senior Vice President, National Account Manager and Senior Vice President, Key Account Manager, Columbia Management Investment Advisers LLC; Vice President, Key Account Manager, Liberty Funds Distributor, Inc.; and Trustee of certain Oppenheimer Funds | | 189 | | Director, Board of Directors of Caron Engineering Inc.; Advisor, Board of Advisors of Caron Engineering Inc.; President and Director, Acton Shapleigh Youth Conservation Corps (non-profit) Formerly: President and Director Director of Grahamtastic Connection (non-profit) |
Cynthia Hostetler - 1962 Trustee | | 2017 | | Non-Executive Director and Trustee of a number of public and private business corporations Formerly: Director, Aberdeen Investment Funds (4 portfolios); Director, Artio Global Investment LLC (mutual fund complex); Director, Edgen Group, Inc. (specialized energy and infrastructure products distributor); Director, Genesee & Wyoming, Inc. (railroads); Head of Investment Funds and Private Equity, Overseas Private Investment Corporation; President, First Manhattan Bancorporation, Inc.; and Attorney, Simpson Thacher & Bartlett LLP | | 189 | | Resideo Technologies, Inc. (smart home technology); Vulcan Materials Company (construction materials company); Trilinc Global Impact Fund; Textainer Group Holdings, (shipping container leasing company); Investment Company Institute (professional organization); and Independent Directors Council (professional organization) |
Eli Jones - 1961 Trustee | | 2016 | | Professor and Dean Emeritus, Mays Business School - Texas A&M University Formerly: Dean of Mays Business School-Texas A&M University; Professor and Dean, Walton College of Business, University of Arkansas and E.J. Ourso College of Business, Louisiana State University; and Director, Arvest Bank | | 189 | | Insperity, Inc. (formerly known as Administaff) (human resources provider); and Member of Regional Board of Directors and Board of Directors, First Financial Bancorp (regional bank) |
Elizabeth Krentzman - 1959 Trustee | | 2019 | | Formerly: Principal and Chief Regulatory Advisor for Asset Management Services and U.S. Mutual Fund Leader of Deloitte & Touche LLP; General Counsel of the Investment Company Institute (trade association); National Director of the Investment Management Regulatory Consulting Practice, Principal, Director and Senior Manager of Deloitte��& Touche LLP; Assistant Director of the Division of Investment Management - Office of Disclosure and Investment Adviser Regulation of the U.S. Securities and Exchange Commission and various positions with the Division of Investment Management – Office of Regulatory Policy of the U.S. Securities and Exchange Commission; Associate at Ropes & Gray LLP; and Trustee of certain Oppenheimer Funds | | 189 | | Formerly: Member of the Cartica Funds Board of Directors (private investment fund); Trustee of the University of Florida National Board Foundation; and Member of the University of Florida Law Center Association, Inc. Board of Trustees, Audit Committee and Membership Committee |
Anthony J. LaCava, Jr. - 1956 Trustee | | 2019 | | Formerly: Director and Member of the Audit Committee, Blue Hills Bank (publicly traded financial institution) and Managing Partner, KPMG LLP | | 189 | | Blue Hills Bank; Chairman, Bentley University; Member, Business School Advisory Council; and Nominating Committee, KPMG LLP |
Prema Mathai-Davis - 1950 Trustee | | 2001 | | Retired Formerly: Co-Founder & Partner of Quantalytics Research, LLC, (a FinTech Investment Research Platform for the Self-Directed Investor); Trustee of YWCA Retirement Fund; CEO of YWCA of the USA; Board member of the NY Metropolitan Transportation Authority; Commissioner of the NYC Department of Aging; and Board member of Johns Hopkins Bioethics Institute | | 189 | | Member of Board of Positive Planet US (non-profit) and HealthCare Chaplaincy Network (non-profit) |
| | |
| T-2 | | Invesco Macro Allocation Strategy Fund |
Trustees and Officers–(continued)
| | | | | | | | |
Name, Year of Birth and Position(s) Held with the Trust | | Trustee and/or
Officer Since | | Principal Occupation(s) During Past 5 Years | | Number of
Funds in Fund Complex
Overseen by
Trustee | | Other Directorship(s) Held by Trustee During Past 5 Years |
| Independent Trustees–(continued) | | | | | | |
Joel W. Motley - 1952 Trustee | | 2019 | | Director of Office of Finance, Federal Home Loan Bank System; Managing Director of Carmona Motley Inc. (privately held financial advisor); Member of the Council on Foreign Relations and its Finance and Budget Committee; Chairman Emeritus of Board of Human Rights Watch and Member of its Investment Committee; and Member of Investment Committee Board of Historic Hudson Valley (non-profit cultural organization); Member of the Board, Blue Ocean Acquisition Corp.; and Member of the Vestry and the Investment Committee of Trinity Church Wall Street. Formerly: Managing Director of Public Capital Advisors, LLC (privately held financial advisor); Managing Director of Carmona Motley Hoffman, Inc. (privately held financial advisor); Trustee of certain Oppenheimer Funds; and Director of Columbia Equity Financial Corp. (privately held financial advisor) | | 189 | | Member of Board of Trust for Mutual Understanding (non-profit promoting the arts and environment); Member of Board of Greenwall Foundation (bioethics research foundation) and its Investment Committee; Member of Board of Friends of the LRC (non-profit legal advocacy); and Board Member and Investment Committee Member of Pulitzer Center for Crisis Reporting (non-profit journalism) |
Teresa M. Ressel - 1962 Trustee | | 2017 | | Non-executive director and trustee of a number of public and private business corporations Formerly: Chief Executive Officer, UBS Securities LLC (investment banking); Chief Operating Officer, UBS AG Americas (investment banking); Sr. Management Team Olayan America, The Olayan Group (international investor/commercial/industrial); Assistant Secretary for Management & Budget and Designated Chief Financial Officer, U.S. Department of Treasury and Director, ON Semiconductor Corporation (semiconductor manufacturing) | | 189 | | None |
Robert C. Troccoli - 1949 Trustee | | 2016 | | Retired Formerly: Adjunct Professor, University of Denver - Daniels College of Business; and Managing Partner, KPMG LLP | | 189 | | None |
Daniel S. Vandivort - 1954 Trustee | | 2019 | | President, Flyway Advisory Services LLC (consulting and property management) Formerly: President and Chief Investment Officer, previously Head of Fixed Income, Weiss Peck and Greer/Robeco Investment Management; Trustee and Chair, Weiss Peck and Greer Funds Board; and various capacities at CS First Boston including Head of Fixed Income at First Boston Asset Management. | | 189 | | Formerly: Trustee and Governance Chair, Oppenheimer Funds; Treasurer, Chairman of the Audit and Finance Committee, Huntington Disease Foundation of America |
| | |
| T-3 | | Invesco Macro Allocation Strategy Fund |
Trustees and Officers–(continued)
| | | | | | | | |
Name, Year of Birth and Position(s) Held with the Trust | | Trustee and/or
Officer Since | | Principal Occupation(s) During Past 5 Years | | Number of
Funds in Fund Complex
Overseen by
Trustee | | Other Directorship(s) Held by Trustee During Past 5 Years |
| Officers | | | | | | | | |
Sheri Morris - 1964 President and Principal Executive Officer | | 1999 | | Director, Invesco Trust Company; Head of Global Fund Services, Invesco Ltd.; President and Principal Executive Officer, The Invesco Funds; Vice President, Invesco Exchange-Traded Fund Trust, Invesco Exchange-Traded Fund Trust II, Invesco India Exchange-Traded Fund Trust, Invesco Actively Managed Exchange-Traded Fund Trust, Invesco Actively Managed Exchange-Traded Commodity Fund Trust and Invesco Exchange-Traded Self-Indexed Fund Trust; and Vice President, OppenheimerFunds, Inc. Formerly: Vice President, Treasurer and Principal Financial Officer, The Invesco Funds; Vice President, Invesco AIM Advisers, Inc., Invesco AIM Capital Management, Inc. and Invesco AIM Private Asset Management, Inc.; Assistant Vice President and Assistant Treasurer, The Invesco Funds; Vice President and Assistant Vice President, Invesco Advisers, Inc.; Assistant Vice President, Invesco AIM Capital Management, Inc. and Invesco AIM Private Asset Management, Inc.; Treasurer, Invesco Exchange-Traded Fund Trust, Invesco Exchange-Traded Fund Trust II, Invesco India Exchange-Traded Fund Trust and Invesco Actively Managed Exchange-Traded Fund Trust; and Senior Vice President, Invesco Advisers, Inc. (formerly known as Invesco Institutional (N.A.), Inc.) (registered investment adviser) | | N/A | | N/A |
Jeffrey H. Kupor - 1968 Senior Vice President, Chief Legal Officer and Secretary | | 2018 | | Head of Legal of the Americas, Invesco Ltd.; Senior Vice President and Secretary, Invesco Advisers, Inc. (formerly known as Invesco Institutional (N.A.), Inc.) (registered investment adviser); Secretary, Invesco Distributors, Inc. (formerly known as Invesco AIM Distributors, Inc.); Vice President and Secretary, Invesco Investment Services, Inc. (formerly known as Invesco AIM Investment Services, Inc.); Senior Vice President, Chief Legal Officer and Secretary, The Invesco Funds; Secretary and General Counsel, Invesco Investment Advisers LLC (formerly known as Van Kampen Asset Management); Secretary and General Counsel, Invesco Capital Markets, Inc. (formerly known as Van Kampen Funds Inc.); Chief Legal Officer, Invesco Exchange-Traded Fund Trust, Invesco Exchange-Traded Fund Trust II, Invesco India Exchange-Traded Fund Trust, Invesco Actively Managed Exchange-Traded Fund Trust, Invesco Actively Managed Exchange-Traded Commodity Fund Trust and Invesco Exchange-Traded Self-Indexed Fund Trust;; Secretary and Vice President, Harbourview Asset Management Corporation; Secretary and Vice President, OppenheimerFunds, Inc. and Invesco Managed Accounts, LLC; Secretary and Senior Vice President, OFI Global Institutional, Inc.; Secretary and Vice President, OFI SteelPath, Inc.; Secretary and Vice President, Oppenheimer Acquisition Corp.; Secretary and Vice President, Shareholder Services, Inc.; and Secretary and Vice President, Trinity Investment Management Corporation Formerly: Senior Vice President, Invesco Distributors, Inc.; Secretary and Vice President, Jemstep, Inc.; Head of Legal, Worldwide Institutional, Invesco Ltd.; Secretary and General Counsel, INVESCO Private Capital Investments, Inc.; Senior Vice President, Secretary and General Counsel, Invesco Management Group, Inc. (formerly known as Invesco AIM Management Group, Inc.); Assistant Secretary, INVESCO Asset Management (Bermuda) Ltd.; Secretary and General Counsel, Invesco Private Capital, Inc.; Assistant Secretary and General Counsel, INVESCO Realty, Inc.; Secretary and General Counsel, Invesco Senior Secured Management, Inc.; Secretary, Sovereign G./P. Holdings Inc.; Secretary, Invesco Indexing LLC; and Secretary, W.L. Ross & Co., LLC | | N/A | | N/A |
Andrew R. Schlossberg - 1974 Senior Vice President | | 2019 | | Senior Vice President, Invesco Group Services, Inc.; Head of the Americas and Senior Managing Director, Invesco Ltd.; Director and Senior Vice President, Invesco Advisers, Inc. (formerly known as Invesco Institutional (N.A.), Inc.) (registered investment adviser); Director and Chairman, Invesco Investment Services, Inc. (formerly known as Invesco AIM Investment Services, Inc.) (registered transfer agent); Senior Vice President, The Invesco Funds; and Director, Invesco Investment Advisers LLC (formerly known as Van Kampen Asset Management) Formerly: Director, President and Chairman, Invesco Insurance Agency, Inc.; Director, Invesco UK Limited; Director and Chief Executive, Invesco Asset Management Limited and Invesco Fund Managers Limited; Assistant Vice President, The Invesco Funds; Senior Vice President, Invesco Advisers, Inc. (formerly known as Invesco Institutional (N.A.), Inc.) (registered investment adviser); Director and Chief Executive, Invesco Administration Services Limited and Invesco Global Investment Funds Limited; Director, Invesco Distributors, Inc.; Head of EMEA, Invesco Ltd.; President, Invesco Actively Managed Exchange-Traded Commodity Fund Trust, Invesco Actively Managed Exchange-Traded Fund Trust, Invesco Exchange-Traded Fund Trust, Invesco Exchange-Traded Fund Trust II and Invesco India Exchange-Traded Fund Trust; and Managing Director and Principal Executive Officer, Invesco Capital Management LLC | | N/A | | N/A |
| | |
| T-4 | | Invesco Macro Allocation Strategy Fund |
Trustees and Officers–(continued)
| | | | | | | | |
Name, Year of Birth and Position(s) Held with the Trust | | Trustee and/or
Officer Since | | Principal Occupation(s) During Past 5 Years | | Number of
Funds in Fund Complex
Overseen by
Trustee | | Other Directorship(s) Held by Trustee During Past 5 Years |
| Officers–(continued) | | | | | | | | |
| John M. Zerr - 1962 Senior Vice President | | 2006 | | Chief Operating Officer of the Americas; Senior Vice President, Invesco Advisers, Inc. (formerly known as Invesco Institutional (N.A.), Inc.) (registered investment adviser); Senior Vice President, Invesco Distributors, Inc. (formerly known as Invesco AIM Distributors, Inc.); Director and Vice President, Invesco Investment Services, Inc. (formerly known as Invesco AIM Investment Services, Inc.) Senior Vice President, The Invesco Funds; Managing Director, Invesco Capital Management LLC; Director, Invesco Investment Advisers LLC (formerly known as Van Kampen Asset Management); Senior Vice President, Invesco Capital Markets, Inc. (formerly known as Van Kampen Funds Inc.); Manager, Invesco Indexing LLC; Manager, Invesco Specialized Products, LLC; Member, Invesco Canada Funds Advisory Board; Director, President and Chief Executive Officer, Invesco Corporate Class Inc. (corporate mutual fund company); and Director, Chairman, President and Chief Executive Officer, Invesco Canada Ltd. (formerly known as Invesco Trimark Ltd./Invesco Trimark Ltèe) (registered investment adviser and registered transfer agent); President, Invesco, Inc.; President, Invesco Global Direct Real Estate Feeder GP Ltd.; President, Invesco IP Holdings (Canada) Ltd; President, Invesco Global Direct Real Estate GP Ltd.; President, Invesco Financial Services Ltd. / Services Financiers Invesco Ltée; and Director and Chairman, Invesco Trust Company Formerly: President, Trimark Investments Ltd/Services Financiers Invesco Ltee; Director and Senior Vice President, Invesco Insurance Agency, Inc.; Director and Senior Vice President, Invesco Management Group, Inc. (formerly known as Invesco AIM Management Group, Inc.); Secretary and General Counsel, Invesco Management Group, Inc. (formerly known as Invesco AIM Management Group, Inc.); Secretary, Invesco Investment Services, Inc. (formerly known as Invesco AIM Investment Services, Inc.); Chief Legal Officer and Secretary, The Invesco Funds; Secretary and General Counsel, Invesco Investment Advisers LLC (formerly known as Van Kampen Asset Management); Secretary and General Counsel, Invesco Capital Markets, Inc. (formerly known as Van Kampen Funds Inc.); Chief Legal Officer, Invesco Exchange-Traded Fund Trust, Invesco Exchange-Traded Fund Trust II, Invesco India Exchange-Traded Fund Trust, Invesco Actively Managed Exchange-Traded Fund Trust, Invesco Actively Managed Exchange-Traded Commodity Fund Trust and Invesco Exchange-Traded Self-Indexed Fund Trust; Secretary, Invesco Indexing LLC; Director, Secretary, General Counsel and Senior Vice President, Van Kampen Exchange Corp.; Director, Vice President and Secretary, IVZ Distributors, Inc. (formerly known as INVESCO Distributors, Inc.); Director and Vice President, INVESCO Funds Group, Inc.; Director and Vice President, Van Kampen Advisors Inc.; Director, Vice President, Secretary and General Counsel, Van Kampen Investor Services Inc.; Director and Secretary, Invesco Distributors, Inc. (formerly known as Invesco AIM Distributors, Inc.); Director, Senior Vice President, General Counsel and Secretary, Invesco AIM Advisers, Inc. and Van Kampen Investments Inc.; Director, Vice President and Secretary, Fund Management Company; Director, Senior Vice President, Secretary, General Counsel and Vice President, Invesco AIM Capital Management, Inc.; and Chief Operating Officer and General Counsel, Liberty Ridge Capital, Inc. (an investment adviser) | | N/A | | N/A |
Gregory G. McGreevey - 1962 Senior Vice President | | 2012 | | Senior Managing Director, Invesco Ltd.; Director, Chairman, President, and Chief Executive Officer, Invesco Advisers, Inc. (formerly known as Invesco Institutional (N.A.), Inc.) (registered investment adviser); Director, Invesco Mortgage Capital, Inc. and Invesco Senior Secured Management, Inc.; Senior Vice President, The Invesco Funds; President, SNW Asset Management Corporation and Invesco Managed Accounts, LLC; Chairman and Director, Invesco Private Capital, Inc.; Chairman and Director, INVESCO Private Capital Investments, Inc.; Chairman and Director, INVESCO Realty, Inc.; and Senior Vice President, Invesco Group Services, Inc. Formerly: Senior Vice President, Invesco Management Group, Inc. and Invesco Advisers, Inc.; Assistant Vice President, The Invesco Funds | | N/A | | N/A |
Adrien Deberghes - 1967 Principal Financial Officer, Treasurer and Vice President | | 2020 | | Head of the Fund Office of the CFO and Fund Administration; Vice President, Invesco Advisers, Inc.; Principal Financial Officer, Treasurer and Vice President, The Invesco Funds; Vice President, Invesco Exchange-Traded Fund Trust, Invesco Exchange-Traded Fund Trust II, Invesco India Exchange-Traded Fund Trust, Invesco Actively Managed Exchange-Traded Fund Trust, Invesco Actively Managed Exchange-Traded Commodity Fund Trust and Invesco Exchange-Traded Self-Indexed Fund Trust Formerly: Senior Vice President and Treasurer, Fidelity Investments | | N/A | | N/A |
Crissie M. Wisdom - 1969 Anti-Money Laundering Compliance Officer | | 2013 | | Anti-Money Laundering and OFAC Compliance Officer for Invesco U.S. entities including: Invesco Advisers, Inc. and its affiliates, Invesco Capital Markets, Inc., Invesco Distributors, Inc., Invesco Investment Services, Inc., The Invesco Funds, Invesco Capital Management, LLC, Invesco Trust Company; and Fraud Prevention Manager for Invesco Investment Services, Inc. | | N/A | | N/A |
| | |
| T-5 | | Invesco Macro Allocation Strategy Fund |
Trustees and Officers–(continued)
| | | | | | | | |
Name, Year of Birth and Position(s) Held with the Trust | | Trustee and/or
Officer Since | | Principal Occupation(s) During Past 5 Years | | Number of
Funds in Fund Complex
Overseen by
Trustee | | Other Directorship(s) Held by Trustee During Past 5 Years |
| Officers–(continued) | | | | | | | | |
Todd F. Kuehl - 1969 Chief Compliance Officer and Senior Vice President | | 2020 | | Chief Compliance Officer, Invesco Advisers, Inc. (registered investment adviser); and Chief Compliance Officer and Senior Vice President, The Invesco Funds Formerly: Managing Director and Chief Compliance Officer, Legg Mason (Mutual Funds); Chief Compliance Officer, Legg Mason Private Portfolio Group (registered investment adviser) | | N/A | | N/A |
James Bordewick, Jr. - 1959 Senior Vice President and Senior Officer | | 2022 | | Senior Vice President and Senior Officer, The Invesco Funds; and Chief Legal Officer, KingsCrowd, Inc. (research and analytical platform for investment in private capital markets) Formerly, Chief Operating Officer and Head of Legal and Regulatory, Netcapital (private capital investment platform); Managing Director, General Counsel of asset management and Chief Compliance Officer for asset management and private banking, Bank of America Corporation; Chief Legal Officer, Columbia Funds and BofA Funds; Senior Vice President and Associate General Counsel, MFS Investment Management; Chief Legal Officer, MFS Funds; Associate, Ropes & Gray; Associate, Gaston Snow & Ely Bartlett | | N/A | | N/A |
The Statement of Additional Information of the Trust includes additional information about the Fund’s Trustees and is available upon request, without charge, by calling 1.800.959.4246. Please refer to the Fund’s Statement of Additional Information for information on the Fund’s sub-advisers.
| | | | | | |
Office of the Fund 11 Greenway Plaza, Suite 1000 Houston, TX 77046-1173 | | Investment Adviser Invesco Advisers, Inc. 1555 Peachtree Street, N.E. Atlanta, GA 30309 | | Distributor Invesco Distributors, Inc. 11 Greenway Plaza, Suite 1000 Houston, TX 77046-1173 | | Auditors PricewaterhouseCoopers LLP 1000 Louisiana Street, Suite 5800 Houston, TX 77002-5021 |
| | | |
Counsel to the Fund Stradley Ronon Stevens & Young, LLP 2005 Market Street, Suite 2600 Philadelphia, PA 19103-7018 | | Counsel to the Independent Trustees Goodwin Procter LLP 901 New York Avenue, N.W. Washington, D.C. 20001 | | Transfer Agent Invesco Investment Services, Inc. 11 Greenway Plaza, Suite 1000 Houston, TX 77046-1173 | | Custodian State Street Bank and Trust Company 225 Franklin Street Boston, MA 02110-2801 |
| | |
| T-6 | | Invesco Macro Allocation Strategy Fund |
(This page intentionally left blank)
(This page intentionally left blank)

Go paperless with eDelivery
Visit invesco.com/edelivery to enjoy the convenience and security of anytime electronic access to your investment documents.
With eDelivery, you can elect to have any or all of the following materials delivered straight to your inbox to download, save and print from your own computer:
∎ Fund reports and prospectuses
∎ Quarterly statements
∎ Daily confirmations
∎ Tax forms
Invesco mailing information
Send general correspondence to Invesco Investment Services, Inc., P.O. Box 219078, Kansas City, MO 64121-9078.
Important notice regarding delivery of security holder documents
To reduce Fund expenses, only one copy of most shareholder documents may be mailed to shareholders with multiple accounts at the same address (Householding). Mailing of your shareholder documents may be householded indefinitely unless you instruct us otherwise. If you do not want the mailing of these documents to be combined with those for other members of your household, please contact Invesco Investment Services, Inc. at 800 959 4246 or contact your financial institution. We will begin sending you individual copies for each account within 30 days after receiving your request.
Fund holdings and proxy voting information
The Fund provides a complete list of its portfolio holdings four times each year, at the end of each fiscal quarter. For the second and fourth quarters, the list appears, respectively, in the Fund’s semiannual and annual reports to shareholders. For the first and third quarters, the Fund files the list with the Securities and Exchange Commission (SEC) as an exhibit to its reports on Form N-PORT. The most recent list of portfolio holdings is available at invesco.com/completeqtrholdings. Shareholders can also look up the Fund’s Form N-PORT filings on the SEC website, sec.gov. The SEC file numbers for the Fund are shown below.
A description of the policies and procedures that the Fund uses to determine how to vote proxies relating to portfolio securities is available without charge, upon request, from our Client Services department at 800 959 4246, or at invesco.com/corporate/about-us/esg. The information is also available on the SEC website, sec.gov.
Information regarding how the Fund voted proxies related to its portfolio securities during the most recent 12-month period ended June 30 is available at invesco.com/proxysearch. This information is also available on the SEC website, sec.gov.
Invesco Advisers, Inc. is an investment adviser; it provides investment advisory services to individual and institutional clients and does not sell securities. Invesco Distributors, Inc. is the US distributor for Invesco Ltd.’s retail mutual funds, exchange-traded funds and institutional money market funds. Both are wholly owned, indirect subsidiaries of Invesco Ltd.

| | |
| SEC file number(s): 811-05426 and 033-19338 Invesco Distributors, Inc. | | MAS-AR-1 |

| | |
| | |
| Annual Report to Shareholders | | October 31, 2022 |
Invesco Multi-Asset Income Fund
Nasdaq:
A: PIAFX ∎ C: PICFX ∎ R: PIRFX ∎ Y: PIYFX ∎ R5: IPNFX ∎ R6: PIFFX
Management’s Discussion of Fund Performance
| | | | |
| |
Performance summary | |
For the fiscal year ended October 31, 2022, Class A shares of Invesco Multi-Asset Income Fund (the Fund), at net asset value (NAV), underperformed the Custom Invesco Multi-Asset Income Index, the Fund’s style-specific benchmark. | |
Your Fund’s long-term performance appears later in this report. | |
| |
Fund vs. Indexes | |
Total returns, 10/31/21 to 10/31/22, at net asset value (NAV). Performance shown does not include applicable contingent deferred sales charges (CDSC) or front-end sales charges, which would have reduced performance. | |
Class A Shares | | | -18.16 | % |
Class C Shares | | | -18.80 | |
Class R Shares | | | -18.47 | |
Class Y Shares | | | -18.05 | |
Class R5 Shares | | | -17.97 | |
Class R6 Shares | | | -18.01 | |
Bloomberg U.S. Aggregate Bond Index▼ (Broad Market Index) | | | -15.68 | |
Custom Invesco Multi-Asset Income Index∎ (Style-Specific Index) | | | -16.54 | |
Lipper Mixed-Asset Target Allocation Conservative Funds Index¨ (Peer Group Index) | | | -14.56 | |
|
Source(s): ▼RIMES Technologies Corp.; ∎Invesco, RIMES Technologies Corp.; ¨Lipper Inc. | |
Market conditions and your Fund
For the fiscal year ended October 31, 2022, the Fund at NAV reported negative absolute performance. Early in the fiscal year risky assets continued to rally but the mood for financial assets shifted dramatically at the beginning of 2022 as central banks took steps to curb inflation. The fiscal year began with global equities and commodities benefiting from the reflationary trade after the implementation of massive monetary policies around the globe and improving economic data. Ultimately, the massive intervention and money injections led to levels of inflation not seen for several decades. Eventually this forced central banks to start increasing interest rates aggressively, which led to violent volatility in equity markets only to be exasperated by the invasion of Russia into Ukraine. Moreover, following central banks’ steps to curb inflation, interest rate sensitive fixed-income securities came under significant pressure. Occasionally, macroeconomic data suggesting an improvement of the environment led to short spurs in risky assets that proved to be only short lived.
The strategic allocation experienced a difficult period with both equity and fixed-income assets broadly producing detractions. The bonds generated the largest detraction, in line with the prevailing market environment of aggressive interest rate hikes, which in turn puts downward pressure on prices for fixed-income securities. Generally, the higher the duration the higher the sensitivity of the security to rate increases.
The equity allocations, invested through the equity-linked note (ELN) structure, performed well in some of the markets. Energy and the energy aligned master limited partnerships, performed positively due to surging energy prices as a result of the aforementioned
Eastern European conflict and supply concern. Also performing well were the more defensive industrial sectors such as utilities, healthcare and consumer staples. On the flipside, technology, telecommunications, consumer discretionary and financials saw prices retreat in line with the direction of broad equity markets. Nonetheless, the ELNs managed to buffer some of the market swings and helped performance relative to the underlying industry exposure. Real estate investment trusts also detracted but did so in a muted fashion. Finally, US preferred shares were the worst performing asset in the bunch due to their sensitivity to interest rate movements.
On the fixed-income side of things, the emerging market bonds struggled on the back of continued strict lockdown policies in China, softening manufacturing data and fears that a strong US dollar might import inflation to some of the region’s countries. Moreover, US high yield bonds could not escape the effects of higher interest rates, as most of the issuers in that space tend to be particularly susceptible to higher financing costs. The highly interest sensitive long duration treasuries struggled to a larger degree than the shorter duration bonds and were a top detractor over the fiscal year.
The Fund’s tactical positioning, expressed through the use of exchange-traded futures, was negative for the fiscal year. In general, the portfolio’s short bond positions produced a contribution, but this performance was not enough to offset the detraction from equities, which struggled with frequent and continuous change in tactical signals.
Please note that our tactical strategy utilizes derivative instruments, primarily futures, but also foreign currency contracts and swaps where needed. The use of liquid derivative instruments within the tactical allocation allows us to better manage portfolio risk
without disrupting the underlying strategic allocation that provides the Fund’s income. Therefore, some of the performance of the Fund’s strategy, both positive and negative, can be attributed to these instruments. Derivatives can be a cost-effective way to gain exposure to asset classes. However, derivatives may amplify traditional investment risks through the creation of leverage and may be less liquid than traditional securities.
Thank you for your continued investment in Invesco Multi-Asset Income Fund.
Portfolio manager(s):
Mark Ahnrud
John Burrello
Chris Devine
Scott Hixon
Peter Hubbard
Christian Ulrich
Scott Wolle - Lead
The views and opinions expressed in management’s discussion of Fund performance are those of Invesco Advisers, Inc. and its affiliates. These views and opinions are subject to change at any time based on factors such as market and economic conditions. These views and opinions may not be relied upon as investment advice or recommendations, or as an offer for a particular security. The information is not a complete analysis of every aspect of any market, country, industry, security or the Fund. Statements of fact are from sources considered reliable, but Invesco Advisers, Inc. makes no representation or warranty as to their completeness or accuracy. Although historical performance is no guarantee of future results, these insights may help you understand our investment management philosophy.
See important Fund and, if applicable, index disclosures later in this report.
| | |
| 2 | | Invesco Multi-Asset Income Fund |
Your Fund’s Long-Term Performance
Results of a $10,000 Investment – Oldest Share Class(es)
Fund and index data from 10/31/12
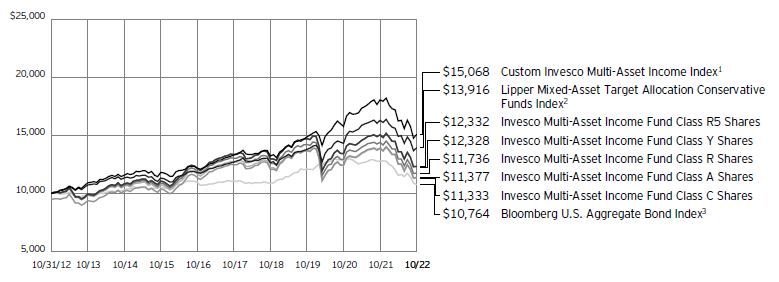
1 Source: Invesco, RIMES Technologies Corp.
2 Source: Lipper Inc.
3 Source: RIMES Technologies Corp.
Past performance cannot guarantee future results.
The data shown in the chart include reinvested distributions, applicable sales charges and Fund expenses including management
fees. Index results include reinvested dividends, but they do not reflect sales charges. Performance of the peer group, if applicable, reflects fund expenses and management fees;
performance of a market index does not. Performance shown in the chart does not reflect deduction of taxes a shareholder would pay on Fund distributions or sale of Fund shares.
| | |
| 3 | | Invesco Multi-Asset Income Fund |
| | | | |
| |
Average Annual Total Returns | |
As of 10/31/22, including maximum applicable sales charges | |
| |
Class A Shares | | | | |
Inception (12/14/11) | | | 2.31 | % |
10 Years | | | 1.30 | |
5 Years | | | -2.92 | |
1 Year | | | -22.69 | |
| |
Class C Shares | | | | |
Inception (12/14/11) | | | 2.27 | % |
10 Years | | | 1.26 | |
5 Years | | | -2.54 | |
1 Year | | | -19.57 | |
| |
Class R Shares | | | | |
Inception (12/14/11) | | | 2.58 | % |
10 Years | | | 1.61 | |
5 Years | | | -2.07 | |
1 Year | | | -18.47 | |
| |
Class Y Shares | | | | |
Inception (12/14/11) | | | 3.09 | % |
10 Years | | | 2.11 | |
5 Years | | | -1.57 | |
1 Year | | | -18.05 | |
| |
Class R5 Shares | | | | |
Inception (12/14/11) | | | 3.09 | % |
10 Years | | | 2.12 | |
5 Years | | | -1.57 | |
| |
1 Year | | | -17.97 | |
| |
Class R6 Shares | | | | |
Inception (9/24/12) | | | 2.24 | % |
10 Years | | | 2.13 | |
5 Years | | | -1.54 | |
1 Year | | | -18.01 | |
The performance data quoted represent past performance and cannot guarantee future results; current performance may be lower or higher. Please visit invesco.com/performance for the most recent month-end performance. Performance figures reflect reinvested distributions, changes in net asset value and the effect of the maximum sales charge unless otherwise stated. Performance figures do not reflect deduction of taxes a shareholder would pay on Fund distributions or sale of Fund shares. Investment return and principal value will fluctuate so that you may have a gain or loss when you sell shares.
Class A share performance reflects the maximum 5.50% sales charge, and Class C share performance reflects the applicable contingent deferred sales charge (CDSC) for the period involved. The CDSC on Class C shares is 1% for the first year after purchase. Class R, Class Y, Class R5 and Class R6 shares do not have a front-end sales charge or a CDSC; therefore, performance is at net asset value.
The performance of the Fund’s share classes will differ primarily due to different sales charge structures and class expenses.
Fund performance reflects any applicable fee waivers and/or expense reimbursements. Had the adviser not waived fees
and/or reimbursed expenses currently or in the past, returns would have been lower. See current prospectus for more information.
| | |
| 4 | | Invesco Multi-Asset Income Fund |
Supplemental Information
Invesco Multi-Asset Income Fund’s investment objective is to provide current income.
| ∎ | Unless otherwise stated, information presented in this report is as of October 31, 2022, and is based on total net assets. |
| ∎ | Unless otherwise noted, all data is provided by Invesco. |
| ∎ | To access your Fund’s reports/prospectus, visit invesco.com/fundreports. |
About indexes used in this report
| ∎ | The Bloomberg U.S. Aggregate Bond Index is an unmanaged index considered representative of the US investment-grade, fixed-rate bond market. |
| ∎ | The Custom Invesco Multi-Asset Income Index comprises the following indexes: 60% Bloomberg U.S. Aggregate Bond Index and 40% MSCI World Index. The MSCI World Index is an unmanaged index considered representative of stocks of developed countries. The index return is computed using the net return, which withholds applicable taxes for non-resident investors. |
| ∎ | The Lipper Mixed-Asset Target Allocation Conservative Funds Index is an unmanaged index considered representative of mixed-asset target allocation conservative funds tracked by Lipper. |
| ∎ | The Fund is not managed to track the performance of any particular index, including the index(es) described here, and consequently, the performance of the Fund may deviate significantly from the performance of the index(es). |
| ∎ | A direct investment cannot be made in an index. Unless otherwise indicated, index results include reinvested dividends, and they do not reflect sales charges. Performance of the peer group, if applicable, reflects fund expenses; performance of a market index does not. |
|
|
This report must be accompanied or preceded by a currently effective Fund prospectus, which contains more complete information, including sales charges and expenses. Investors should read it carefully before investing. |
|
| NOT FDIC INSURED | MAY LOSE VALUE | NO BANK GUARANTEE |
| | |
| 5 | | Invesco Multi-Asset Income Fund |
Fund Information
Portfolio Composition
| | | | | |
| By security type | | % of total net assets |
| |
U.S. Dollar Denominated Bonds & Notes | | | | 32.00 | % |
| |
Equity Linked Notes | | | | 27.68 | |
| |
U.S. Treasury Securities | | | | 20.84 | |
| |
Preferred Stocks | | | | 4.73 | |
| |
Security Types Each Less Than 1% of Portfolio | | | | 0.75 | |
| |
Money Market Funds Plus Other Assets Less Liabilities | | | | 14.00 | |
Top Five Debt Issuers*
| | | | | | | |
| | | | | % of total net assets |
| | |
| 1. | | U.S. Treasury | | | | 20.84 | % |
| | |
| 2. | | Turkey Government International Bond | | | | 0.72 | |
| | |
| 3. | | Indonesia Government International Bond | | | | 0.70 | |
| | |
| 4. | | Oman Government International Bond | | | | 0.63 | |
| | |
| 5. | | Philippine Government International Bond | | | | 0.62 | |
The Fund’s holdings are subject to change, and there is no assurance that the Fund will continue to hold any particular security.
| * | Excluding money market fund holdings, if any. |
Data presented here are as of October 31, 2022.
| | |
| 6 | | Invesco Multi-Asset Income Fund |
Schedule of Investments(a)
October 31, 2022
| | | | | | | | |
| | | Principal
Amount | | | Value | |
|
| |
U.S. Dollar Denominated Bonds & Notes–32.00% | |
Aerospace & Defense–0.52% | |
Boeing Co. (The), | | | | | | | | |
2.75%, 02/01/2026 | | $ | 119,000 | | | $ | 107,408 | |
|
| |
2.25%, 06/15/2026 | | | 134,000 | | | | 117,388 | |
|
| |
Bombardier, Inc. (Canada), 7.50%, 03/15/2025(b) | | | 548,000 | | | | 539,654 | |
|
| |
General Dynamics Corp., 3.25%, 04/01/2025 | | | 201,000 | | | | 193,222 | |
|
| |
Rolls-Royce PLC (United Kingdom), | | | | | | | | |
3.63%, 10/14/2025(b) | | | 870,000 | | | | 769,689 | |
|
| |
5.75%, 10/15/2027(b) | | | 984,000 | | | | 891,838 | |
|
| |
Spirit AeroSystems, Inc., | | | | | | | | |
5.50%, 01/15/2025(b) | | | 503,000 | | | | 486,087 | |
|
| |
7.50%, 04/15/2025(b) | | | 585,000 | | | | 569,729 | |
|
| |
TransDigm, Inc., | | | | | | | | |
8.00%, 12/15/2025(b) | | | 698,000 | | | | 711,073 | |
|
| |
6.25%, 03/15/2026(b) | | | 1,746,000 | | | | 1,725,284 | |
|
| |
| | | | | | | 6,111,372 | |
|
| |
|
Agricultural & Farm Machinery–0.02% | |
Deere & Co., 2.75%, 04/15/2025 | | | 225,000 | | | | 214,213 | |
|
| |
| | |
Airlines–0.41% | | | | | | | | |
American Airlines Pass-Through Trust, Series 16-1, Class A, 4.10%, 01/15/2028 | | | 242,883 | | | | 191,012 | |
|
| |
American Airlines, Inc., 11.75%, 07/15/2025(b) | | | 1,415,000 | | | | 1,549,435 | |
|
| |
American Airlines, Inc./AAdvantage Loyalty IP Ltd., 5.50%, 04/20/2026(b)(c) | | | 939,000 | | | | 895,742 | |
|
| |
Delta Air Lines, Inc., 7.38%, 01/15/2026(c) | | | 591,000 | | | | 604,294 | |
|
| |
Hawaiian Brand Intellectual Property Ltd./HawaiianMiles Loyalty Ltd., 5.75%, 01/20/2026(b) | | | 838,000 | | | | 773,620 | |
|
| |
Southwest Airlines Co., 3.45%, 11/16/2027 | | | 125,000 | | | | 112,295 | |
|
| |
United Airlines, Inc., 4.38%, 04/15/2026(b) | | | 799,000 | | | | 730,700 | |
|
| |
| | | | | | | 4,857,098 | |
|
| |
| | |
Airport Services–0.02% | | | | | | | | |
Promontoria Holding 264 B.V. (Netherlands), 7.88%, 03/01/2027(b) | | | 263,000 | | | | 239,715 | |
|
| |
| | |
Alternative Carriers–0.14% | | | | | | | | |
Lumen Technologies, Inc., | | | | | | | | |
5.13%, 12/15/2026(b) | | | 471,000 | | | | 404,299 | |
|
| |
4.50%, 01/15/2029(b) | | | 305,000 | | | | 215,872 | |
|
| |
Series P, 7.60%, 09/15/2039 | | | 1,045,000 | | | | 701,701 | |
|
| |
Series U, 7.65%, 03/15/2042 | | | 590,000 | | | | 391,760 | |
|
| |
| | | | | | | 1,713,632 | |
|
| |
| | | | | | | | |
| | | Principal
Amount | | | Value | |
|
| |
Aluminum–0.18% | | | | | | | | |
Arconic Corp., 6.00%, 05/15/2025(b) | | $ | 744,000 | | | $ | 738,562 | |
|
| |
Kaiser Aluminum Corp., 4.50%, 06/01/2031(b)(c) | | | 1,721,000 | | | | 1,352,680 | |
|
| |
| | | | | | | 2,091,242 | |
|
| |
| | |
Apparel Retail–0.08% | | | | | | | | |
Gap, Inc. (The), 3.63%, 10/01/2029(b)(c) | | | 975,000 | | | | 686,000 | |
|
| |
Ross Stores, Inc., 0.88%, 04/15/2026 | | | 264,000 | | | | 227,249 | |
|
| |
| | | | | | | 913,249 | |
|
| |
|
Apparel, Accessories & Luxury Goods–0.25% | |
G-III Apparel Group Ltd., 7.88%, 08/15/2025(b) | | | 635,000 | | | | 602,339 | |
|
| |
Hanesbrands, Inc., 4.88%, 05/15/2026(b)(c) | | | 495,000 | | | | 455,145 | |
|
| |
Macy’s Retail Holdings LLC, 6.13%, 03/15/2032(b)(c) | | | 1,569,000 | | | | 1,306,095 | |
|
| |
Under Armour, Inc., 3.25%, 06/15/2026(c) | | | 752,000 | | | | 650,709 | |
|
| |
| | | | | | | 3,014,288 | |
|
| |
|
Application Software–0.08% | |
Adobe, Inc., 3.25%, 02/01/2025 | | | 225,000 | | | | 217,694 | |
|
| |
GoTo Group, Inc., 5.50%, 09/01/2027(b) | | | 739,000 | | | | 430,482 | |
|
| |
PTC, Inc., 3.63%, 02/15/2025(b) | | | 263,000 | | | | 251,016 | |
|
| |
| | | | | | | 899,192 | |
|
| |
|
Asset Management & Custody Banks–0.10% | |
Brightsphere Investment Group, Inc., 4.80%, 07/27/2026 | | | 528,000 | | | | 474,244 | |
|
| |
FS KKR Capital Corp., 4.63%, 07/15/2024 | | | 150,000 | | | | 144,087 | |
|
| |
Golub Capital BDC, Inc., 3.38%, 04/15/2024 | | | 193,000 | | | | 183,762 | |
|
| |
Legg Mason, Inc., 4.75%, 03/15/2026 | | | 59,000 | | | | 58,025 | |
|
| |
Main Street Capital Corp., 5.20%, 05/01/2024 | | | 174,000 | | | | 169,778 | |
|
| |
Owl Rock Capital Corp., 5.25%, 04/15/2024 | | | 138,000 | | | | 135,410 | |
|
| |
| | | | | | | 1,165,306 | |
|
| |
|
Auto Parts & Equipment–0.38% | |
American Honda Finance Corp., 2.35%, 01/08/2027 | | | 170,000 | | | | 151,253 | |
|
| |
Clarios Global L.P./Clarios US Finance Co., 8.50%, 05/15/2027(b) | | | 719,000 | | | | 705,839 | |
|
| |
Dana, Inc., 4.50%, 02/15/2032 | | | 283,000 | | | | 216,775 | |
|
| |
IHO Verwaltungs GmbH (Germany), 0.00%7.13% PIK Rate, 6.38% Cash Rate, 05/15/2029(b)(d) | | | 1,757,000 | | | | 1,507,629 | |
|
| |
See accompanying Notes to Financial Statements which are an integral part of the financial statements.
| | |
| 7 | | Invesco Multi-Asset Income Fund |
| | | | | | | | |
| | | Principal
Amount | | | Value | |
|
| |
Auto Parts & Equipment–(continued) | |
Patrick Industries, Inc., 4.75%, 05/01/2029(b) | | $ | 1,095,000 | | | $ | 828,460 | |
|
| |
ZF North America Capital, Inc. (Germany), 4.75%, 04/29/2025(b) | | | 1,182,000 | | | | 1,107,632 | |
|
| |
| | | | | | | 4,517,588 | |
|
| |
| |
Automobile Manufacturers–0.40% | | | | | |
Ford Motor Credit Co. LLC, | | | | | | | | |
2.30%, 02/10/2025(c) | | | 607,000 | | | | 550,185 | |
|
| |
4.69%, 06/09/2025 | | | 291,000 | | | | 276,364 | |
|
| |
5.13%, 06/16/2025(c) | | | 682,000 | | | | 659,078 | |
|
| |
4.13%, 08/04/2025 | | | 306,000 | | | | 285,217 | |
|
| |
3.38%, 11/13/2025 | | | 811,000 | | | | 737,219 | |
|
| |
4.39%, 01/08/2026 | | | 582,000 | | | | 538,428 | |
|
| |
General Motors Co., 6.13%, 10/01/2025 | | | 135,000 | | | | 134,524 | |
|
| |
General Motors Financial Co., Inc., 2.75%, 06/20/2025 | | | 200,000 | | | | 184,141 | |
|
| |
J.B. Poindexter & Co., Inc., 7.13%, 04/15/2026(b) | | | 167,000 | | | | 159,428 | |
|
| |
Jaguar Land Rover Automotive PLC (United Kingdom), | | | | | | | | |
7.75%, 10/15/2025(b) | | | 434,000 | | | | 401,363 | |
|
| |
5.88%, 01/15/2028(b) | | | 585,000 | | | | 434,129 | |
|
| |
PM General Purchaser LLC, 9.50%, 10/01/2028(b) | | | 239,000 | | | | 206,063 | |
|
| |
Toyota Motor Credit Corp., | | | | | | | | |
3.20%, 01/11/2027 | | | 100,000 | | | | 92,565 | |
|
| |
1.15%, 08/13/2027 | | | 100,000 | | | | 83,129 | |
|
| |
| | | | | | | 4,741,833 | |
|
| |
| | |
Automotive Retail–0.15% | | | | | | | | |
Penske Automotive Group, Inc., 3.50%, 09/01/2025(c) | | | 342,000 | | | | 318,386 | |
|
| |
Sonic Automotive, Inc., 4.63%, 11/15/2029(b)(c) | | | 1,801,000 | | | | 1,415,289 | |
|
| |
| | | | | | | 1,733,675 | |
|
| |
| | |
Biotechnology–0.03% | | | | | | | | |
Emergent BioSolutions, Inc., 3.88%, 08/15/2028(b) | | | 570,000 | | | | 342,561 | |
|
| |
| | |
Broadcasting–0.30% | | | | | | | | |
AMC Networks, Inc., 4.75%, 08/01/2025(c) | | | 494,000 | | | | 452,667 | |
|
| |
Discovery Communications LLC, 3.80%, 03/13/2024 | | | 225,000 | | | | 218,639 | |
|
| |
Fox Corp., 4.03%, 01/25/2024 | | | 250,000 | | | | 245,819 | |
|
| |
iHeartCommunications, Inc., | | | | | | | | |
6.38%, 05/01/2026 | | | 490,000 | | | | 468,066 | |
|
| |
8.38%, 05/01/2027(c) | | | 532,000 | | | | 478,809 | |
|
| |
Liberty Interactive LLC, | | | | | | | | |
8.50%, 07/15/2029 | | | 284,000 | | | | 180,777 | |
|
| |
8.25%, 02/01/2030(c) | | | 710,000 | | | | 444,343 | |
|
| |
Paramount Global, 6.38%, 03/30/2062(e) | | | 745,000 | | | | 631,528 | |
|
| |
Univision Communications, Inc., 5.13%, 02/15/2025(b) | | | 444,000 | | | | 429,752 | |
|
| |
| | | | | | | 3,550,400 | |
|
| |
| | | | | | | | |
| | | Principal
Amount | | | Value | |
|
| |
Building Products–0.21% | | | | | | | | |
Cornerstone Building Brands, Inc., 6.13%, 01/15/2029(b) | | $ | 269,000 | | | $ | 168,516 | |
|
| |
Masonite International Corp., 3.50%, 02/15/2030(b) | | | 546,000 | | | | 434,698 | |
|
| |
Standard Industries, Inc., | | | | | | | | |
5.00%, 02/15/2027(b)(c) | | | 630,000 | | | | 571,035 | |
|
| |
4.75%, 01/15/2028(b) | | | 967,000 | | | | 849,722 | |
|
| |
4.38%, 07/15/2030(b) | | | 509,000 | | | | 412,499 | |
|
| |
| | | | | | | 2,436,470 | |
|
| |
| | |
Cable & Satellite–0.93% | | | | | | | | |
Altice Financing S.A. (Luxembourg), 5.75%, 08/15/2029(b) | | | 802,000 | | | | 631,479 | |
|
| |
CCO Holdings LLC/CCO Holdings Capital Corp., 5.50%, 05/01/2026(b)(c) | | | 1,583,000 | | | | 1,525,798 | |
|
| |
Charter Communications Operating LLC/Charter Communications Operating Capital Corp., 4.91%, 07/23/2025 | | | 100,000 | | | | 97,144 | |
|
| |
CSC Holdings LLC, | | | | | | | | |
5.25%, 06/01/2024(c) | | | 440,000 | | | | 427,264 | |
|
| |
7.50%, 04/01/2028(b) | | | 411,000 | | | | 356,845 | |
|
| |
6.50%, 02/01/2029(b) | | | 1,286,000 | | | | 1,214,132 | |
|
| |
5.75%, 01/15/2030(b) | | | 877,000 | | | | 672,602 | |
|
| |
4.50%, 11/15/2031(b) | | | 371,000 | | | | 289,443 | |
|
| |
5.00%, 11/15/2031(b) | | | 320,000 | | | | 228,615 | |
|
| |
DIRECTV Financing LLC/DIRECTV Financing Co-Obligor, Inc., 5.88%, 08/15/2027(b) | | | 1,863,000 | | | | 1,681,274 | |
|
| |
DISH DBS Corp., | | | | | | | | |
7.75%, 07/01/2026 | | | 915,000 | | | | 773,765 | |
|
| |
5.25%, 12/01/2026(b) | | | 532,000 | | | | 463,173 | |
|
| |
7.38%, 07/01/2028 | | | 814,000 | | | | 618,485 | |
|
| |
5.13%, 06/01/2029 | | | 751,000 | | | | 506,289 | |
|
| |
LCPR Senior Secured Financing DAC, 6.75%, 10/15/2027(b) | | | 982,000 | | | | 916,913 | |
|
| |
Telesat Canada/Telesat LLC (Canada), 5.63%, 12/06/2026(b) | | | 352,000 | | | | 166,684 | |
|
| |
UPC Broadband Finco B.V. (Netherlands), 4.88%, 07/15/2031(b) | | | 558,000 | | | | 469,953 | |
|
| |
| | | | | | | 11,039,858 | |
|
| |
| | |
Casinos & Gaming–0.78% | | | | | | | | |
Caesars Entertainment, Inc., | | | | | | | | |
8.13%, 07/01/2027(b) | | | 662,000 | | | | 644,957 | |
|
| |
4.63%, 10/15/2029(b) | | | 283,000 | | | | 226,960 | |
|
| |
Caesars Resort Collection LLC/CRC Finco, Inc., 5.75%, 07/01/2025(b) | | | 532,000 | | | | 520,363 | |
|
| |
Codere Finance 2 (Luxembourg) S.A. (Spain), 11.63% PIK Rate, 2.00% Cash Rate, 11/30/2027 (Acquired 11/30/2021;
Cost $100,894)(b)(d)(f) | | | 100,894 | | | | 84,449 | |
|
| |
Genting New York LLC/GENNY Capital, Inc., 3.30%, 02/15/2026(b) | | | 325,000 | | | | 285,153 | |
|
| |
See accompanying Notes to Financial Statements which are an integral part of the financial statements.
| | |
| 8 | | Invesco Multi-Asset Income Fund |
| | | | | | | | |
| | | Principal
Amount | | | Value | |
|
| |
Casinos & Gaming–(continued) | |
International Game Technology PLC, | | | | | | | | |
6.50%, 02/15/2025(b) | | $ | 222,000 | | | $ | 222,426 | |
|
| |
4.13%, 04/15/2026(b) | | | 227,000 | | | | 211,056 | |
|
| |
Las Vegas Sands Corp., 2.90%, 06/25/2025 | | | 233,000 | | | | 211,158 | |
|
| |
Melco Resorts Finance Ltd. (Hong Kong), | | | | | | | | |
4.88%, 06/06/2025(b) | | | 616,000 | | | | 440,114 | |
|
| |
5.25%, 04/26/2026(b) | | | 310,000 | | | | 197,382 | |
|
| |
5.75%, 07/21/2028(b) | | | 819,000 | | | | 475,020 | |
|
| |
MGM China Holdings Ltd. (Macau), | | | | | | | | |
5.25%, 06/18/2025(b) | | | 683,000 | | | | 544,235 | |
|
| |
4.75%, 02/01/2027(b) | | | 646,000 | | | | 486,167 | |
|
| |
MGM Resorts International, | | | | | | | | |
6.75%, 05/01/2025(c) | | | 613,000 | | | | 605,990 | |
|
| |
5.75%, 06/15/2025(c) | | | 415,000 | | | | 403,432 | |
|
| |
Premier Entertainment Sub LLC/Premier Entertainment Finance Corp., 5.63%, 09/01/2029(b) | | | 447,000 | | | | 332,025 | |
|
| |
Sabre GLBL, Inc., | | | | | | | | |
9.25%, 04/15/2025(b) | | | 1,014,000 | | | | 984,325 | |
|
| |
7.38%, 09/01/2025(b) | | | 1,180,000 | | | | 1,110,404 | |
|
| |
Studio City Finance Ltd. (Macau), 6.00%, 07/15/2025(b) | | | 530,000 | | | | 254,883 | |
|
| |
Wynn Macau Ltd. (Macau), | | | | | | | | |
5.50%, 01/15/2026(b) | | | 385,000 | | | | 267,575 | |
|
| |
5.63%, 08/26/2028(b) | | | 740,000 | | | | 453,435 | |
|
| |
5.13%, 12/15/2029(b) | | | 397,000 | | | | 241,134 | |
|
| |
| | | | | | | 9,202,643 | |
|
| |
|
Coal & Consumable Fuels–0.10% | |
Alliance Resource Operating Partners L.P./Alliance Resource Finance Corp., 7.50%, 05/01/2025(b) | | | 745,000 | | | | 731,892 | |
|
| |
Enviva Partners L.P./Enviva Partners Finance Corp., 6.50%, 01/15/2026(b) | | | 463,000 | | | | 445,237 | |
|
| |
| | | | | | | 1,177,129 | |
|
| |
|
Commodity Chemicals–0.07% | |
Methanex Corp. (Canada), | | | | | | | | |
5.25%, 12/15/2029(c) | | | 508,000 | | | | 435,710 | |
|
| |
5.65%, 12/01/2044 | | | 597,000 | | | | 413,422 | |
|
| |
| | | | | | | 849,132 | |
|
| |
|
Communications Equipment–0.24% | |
CommScope Technologies LLC, 6.00%, 06/15/2025(b) | | | 477,000 | | | | 445,928 | |
|
| |
Hughes Satellite Systems Corp., | | | | | | | | |
5.25%, 08/01/2026 | | | 944,000 | | | | 903,290 | |
|
| |
6.63%, 08/01/2026(c) | | | 513,000 | | | | 484,606 | |
|
| |
Viasat, Inc., | | | | | | | | |
5.63%, 09/15/2025(b) | | | 786,000 | | | | 726,688 | |
|
| |
6.50%, 07/15/2028(b) | | | 277,000 | | | | 231,911 | |
|
| |
| | | | | | | 2,792,423 | |
|
| |
|
Computer & Electronics Retail–0.01% | |
Dell International LLC/EMC Corp., 6.02%, 06/15/2026 | | | 125,000 | | | | 124,872 | |
|
| |
| | | | | | | | |
| | | Principal
Amount | | | Value | |
|
| |
Construction & Engineering–0.04% | |
Artera Services LLC, 9.03%, 12/04/2025(b) | | $ | 279,000 | | | $ | 233,790 | |
|
| |
Howard Midstream Energy Partners LLC, 6.75%, 01/15/2027(b) | | | 36,000 | | | | 32,715 | |
|
| |
Tutor Perini Corp., 6.88%, 05/01/2025(b) | | | 264,000 | | | | 210,415 | |
|
| |
| | | | | | | 476,920 | |
|
| |
|
Construction Machinery & Heavy Trucks–0.03% | |
Caterpillar Financial Services Corp., 1.10%, 09/14/2027 | | | 130,000 | | | | 108,468 | |
|
| |
Wabtec Corp., 3.45%, 11/15/2026 | | | 235,000 | | | | 211,600 | |
|
| |
| | | | | | | 320,068 | |
|
| |
|
Construction Materials–0.07% | |
Camelot Return Merger Sub, Inc., 8.75%, 08/01/2028(b) | | | 427,000 | | | | 356,545 | |
|
| |
Eco Material Technologies, Inc., 7.88%, 01/31/2027(b) | | | 492,000 | | | | 460,527 | |
|
| |
| | | | | | | 817,072 | |
|
| |
|
Consumer Finance–0.46% | |
Ally Financial, Inc., 5.75%, 11/20/2025(c) | | | 558,000 | | | | 537,212 | |
|
| |
American Express Co., 3.30%, 05/03/2027 | | | 130,000 | | | | 117,846 | |
|
| |
ASG Finance Designated Activity Co. (Cyprus), 7.88%, 12/03/2024(b) | | | 712,000 | | | | 672,484 | |
|
| |
Credit Acceptance Corp., 5.13%, 12/31/2024(b) | | | 495,000 | | | | 460,979 | |
|
| |
goeasy Ltd. (Canada), 5.38%, 12/01/2024(b) | | | 335,000 | | | | 313,103 | |
|
| |
Navient Corp., | | | | | | | | |
5.88%, 10/25/2024 | | | 272,000 | | | | 263,405 | |
|
| |
6.75%, 06/25/2025 | | | 271,000 | | | | 259,766 | |
|
| |
5.00%, 03/15/2027 | | | 300,000 | | | | 253,485 | |
|
| |
4.88%, 03/15/2028 | | | 279,000 | | | | 222,385 | |
|
| |
5.50%, 03/15/2029 | | | 416,000 | | | | 331,054 | |
|
| |
5.63%, 08/01/2033 | | | 302,000 | | | | 213,514 | |
|
| |
OneMain Finance Corp., | | | | | | | | |
6.88%, 03/15/2025(c) | | | 686,000 | | | | 666,260 | |
|
| |
7.13%, 03/15/2026(c) | | | 952,000 | | | | 918,551 | |
|
| |
Synchrony Financial, 3.95%, 12/01/2027 | | | 75,000 | | | | 64,557 | |
|
| |
World Acceptance Corp., 7.00%, 11/01/2026(b) | | | 279,000 | | | | 175,073 | |
|
| |
| | | | | | | 5,469,674 | |
|
| |
| | |
Copper–0.01% | | | | | | | | |
Freeport-McMoRan, Inc., 5.00%, 09/01/2027 | | | 75,000 | | | | 71,553 | |
|
| |
|
Data Processing & Outsourced Services–0.02% | |
Automatic Data Processing, Inc., 3.38%, 09/15/2025 | | | 100,000 | | | | 96,333 | |
|
| |
Global Payments, Inc., 2.15%, 01/15/2027 | | | 110,000 | | | | 93,974 | |
|
| |
Western Union Co. (The), 1.35%, 03/15/2026 | | | 75,000 | | | | 64,259 | |
|
| |
| | | | | | | 254,566 | |
|
| |
See accompanying Notes to Financial Statements which are an integral part of the financial statements.
| | |
| 9 | | Invesco Multi-Asset Income Fund |
| | | | | | | | |
| | | Principal
Amount | | | Value | |
|
| |
Department Stores–0.12% | | | | | | | | |
Nordstrom, Inc., | | | | | | | | |
6.95%, 03/15/2028 | | $ | 462,000 | | | $ | 429,685 | |
|
| |
4.38%, 04/01/2030(c) | | | 692,000 | | | | 532,207 | |
|
| |
4.25%, 08/01/2031 | | | 578,000 | | | | 420,481 | |
|
| |
| | | | | | | 1,382,373 | |
|
| |
| | |
Distillers & Vintners–0.01% | | | | | | | | |
Constellation Brands, Inc., 3.70%, 12/06/2026 | | | 117,000 | | | | 109,235 | |
|
| |
| | |
Diversified Banks–0.65% | | | | | | | | |
Banco Santander S.A. (Spain), | | | | | | | | |
2.75%, 05/28/2025 | | | 200,000 | | | | 181,529 | |
|
| |
4.25%, 04/11/2027 | | | 200,000 | | | | 180,708 | |
|
| |
Bank of America Corp., | | | | | | | | |
4.45%, 03/03/2026 | | | 200,000 | | | | 191,998 | |
|
| |
1.32%, 06/19/2026(e) | | | 160,000 | | | | 141,360 | |
|
| |
1.20%, 10/24/2026(e) | | | 160,000 | | | | 138,958 | |
|
| |
1.73%, 07/22/2027(e) | | | 70,000 | | | | 59,904 | |
|
| |
Series L, 4.18%, 11/25/2027 | | | 100,000 | | | | 91,682 | |
|
| |
Banque Centrale de Tunisie International Bond (Tunisia), 5.75%, 01/30/2025(b) | | | 600,000 | | | | 380,627 | |
|
| |
Barclays PLC (United Kingdom), 4.38%, 09/11/2024 | | | 306,000 | | | | 290,898 | |
|
| |
Canadian Imperial Bank of Commerce (Canada), 2.25%, 01/28/2025(c) | | | 350,000 | | | | 326,168 | |
|
| |
Citigroup, Inc., | | | | | | | | |
3.11%, 04/08/2026(e) | | | 225,000 | | | | 210,144 | |
|
| |
1.12%, 01/28/2027(e) | | | 110,000 | | | | 93,598 | |
|
| |
1.46%, 06/09/2027(e) | | | 140,000 | | | | 118,680 | |
|
| |
4.45%, 09/29/2027 | | | 75,000 | | | | 69,678 | |
|
| |
HSBC Holdings PLC (United Kingdom), | | | | | | | | |
1.59%, 05/24/2027(e) | | | 200,000 | | | | 164,471 | |
|
| |
2.25%, 11/22/2027(e) | | | 200,000 | | | | 164,567 | |
|
| |
Intesa Sanpaolo S.p.A. (Italy), | | | | | | | | |
5.71%, 01/15/2026(b)(c) | | | 956,000 | | | | 891,218 | |
|
| |
4.20%, 06/01/2032(b)(e) | | | 940,000 | | | | 637,226 | |
|
| |
JPMorgan Chase & Co., | | | | | | | | |
2.30%, 10/15/2025(e) | | | 200,000 | | | | 186,630 | |
|
| |
2.01%, 03/13/2026(e) | | | 134,000 | | | | 122,252 | |
|
| |
2.08%, 04/22/2026(e) | | | 134,000 | | | | 122,054 | |
|
| |
1.05%, 11/19/2026(e) | | | 60,000 | | | | 51,725 | |
|
| |
4.25%, 10/01/2027 | | | 75,000 | | | | 70,504 | |
|
| |
Lloyds Banking Group PLC (United Kingdom), | | | | | | | | |
3.90%, 03/12/2024 | | | 200,000 | | | | 194,839 | |
|
| |
4.45%, 05/08/2025 | | | 275,000 | | | | 263,736 | |
|
| |
Mitsubishi UFJ Financial Group, Inc. (Japan), | | | | | | | | |
0.96%, 10/11/2025(e) | | | 200,000 | | | | 181,902 | |
|
| |
3.68%, 02/22/2027 | | | 125,000 | | | | 114,806 | |
|
| |
3.29%, 07/25/2027 | | | 60,000 | | | | 53,787 | |
|
| |
NatWest Group PLC (United Kingdom), 5.13%, 05/28/2024 | | | 400,000 | | | | 390,073 | |
|
| |
PNC Bank N.A., 4.20%, 11/01/2025 | | | 275,000 | | | | 265,355 | |
|
| |
Royal Bank of Canada (Canada), 4.65%, 01/27/2026 | | | 125,000 | | | | 120,729 | |
|
| |
| | | | | | | | |
| | | Principal
Amount | | | Value | |
|
| |
Diversified Banks–(continued) | |
Sumitomo Mitsui Financial Group, Inc. (Japan), | | | | | | | | |
2.35%, 01/15/2025 | | $ | 275,000 | | | $ | 256,125 | |
|
| |
2.63%, 07/14/2026 | | | 150,000 | | | | 134,492 | |
|
| |
U.S. Bancorp, 1.45%, 05/12/2025 | | | 125,000 | | | | 114,293 | |
|
| |
Vnesheconombank Via VEB Finance PLC (Russia), 5.94%, 11/21/2023(b)(g) | | | 1,450,000 | | | | 0 | |
|
| |
Wells Fargo & Co., | | | | | | | | |
2.19%, 04/30/2026(e) | | | 150,000 | | | | 136,581 | |
|
| |
4.30%, 07/22/2027 | | | 130,000 | | | | 121,689 | |
|
| |
Westpac Banking Corp. (Australia), 3.30%, 02/26/2024(c) | | | 470,000 | | | | 461,251 | |
|
| |
| | | | | | | 7,696,237 | |
|
| |
|
Diversified Capital Markets–0.15% | |
Deutsche Bank AG (Germany), | | | | | | | | |
3.70%, 05/30/2024 | | | 185,000 | | | | 177,104 | |
|
| |
3.70%, 05/30/2024 | | | 188,000 | | | | 181,657 | |
|
| |
4.50%, 04/01/2025 | | | 353,000 | | | | 328,657 | |
|
| |
5.88%, 07/08/2031(e) | | | 747,000 | | | | 614,731 | |
|
| |
3.74%, 01/07/2033(e) | | | 763,000 | | | | 520,193 | |
|
| |
| | | | | | | 1,822,342 | |
|
| |
|
Diversified Chemicals–0.04% | |
Chemours Co. (The), 4.63%, 11/15/2029(b) | | | 290,000 | | | | 226,935 | |
|
| |
Trinseo Materials Operating S.C.A./Trinseo Materials Finance, Inc., 5.13%, 04/01/2029(b) | | | 476,000 | | | | 270,820 | |
|
| |
| | | | | | | 497,755 | |
|
| |
|
Diversified Metals & Mining–0.15% | |
Corp. Nacional del Cobre de Chile (Chile), | | | | | | | | |
5.63%, 10/18/2043(b) | | | 95,000 | | | | 84,519 | |
|
| |
4.88%, 11/04/2044(b) | | | 105,000 | | | | 86,262 | |
|
| |
Mineral Resources Ltd. (Australia), 8.13%, 05/01/2027(b) | | | 928,000 | | | | 925,369 | |
|
| |
Perenti Finance Pty. Ltd. (Australia), 6.50%,
10/07/2025(b)(c) | | | 740,000 | | | | 675,428 | |
|
| |
| | | | | | | 1,771,578 | |
|
| |
|
Diversified Real Estate Activities–0.05% | |
Five Point Operating Co. L.P./Five Point Capital Corp., 7.88%, 11/15/2025(b) | | | 321,000 | | | | 266,286 | |
|
| |
Greystar Real Estate Partners LLC, 5.75%, 12/01/2025(b) | | | 376,000 | | | | 364,278 | |
|
| |
| | | | | | | 630,564 | |
|
| |
| | |
Diversified REITs–0.18% | | | | | | | | |
GLP Capital L.P./GLP Financing II, Inc., 3.35%, 09/01/2024 | | | 100,000 | | | | 93,799 | |
|
| |
HAT Holdings I LLC/HAT Holdings II LLC, 3.38%, 06/15/2026(b) | | | 253,000 | | | | 206,261 | |
|
| |
iStar, Inc., 4.25%, 08/01/2025(c) | | | 519,000 | | | | 502,794 | |
|
| |
See accompanying Notes to Financial Statements which are an integral part of the financial statements.
| | |
| 10 | | Invesco Multi-Asset Income Fund |
| | | | | | | | |
| | | Principal
Amount | | | Value | |
|
| |
Diversified REITs–(continued) | | | | | |
MGM Growth Properties Operating Partnership L.P./MGP Finance Co-Issuer, Inc., 4.63%, 06/15/2025(b) | | $ | 630,000 | | | $ | 617,047 | |
|
| |
Uniti Group L.P./Uniti Fiber Holdings, Inc./CSL Capital LLC, 7.88%, 02/15/2025(b) | | | 691,000 | | | | 685,120 | |
|
| |
| | | | | | | 2,105,021 | |
|
| |
|
Diversified Support Services–0.03% | |
MPH Acquisition Holdings LLC, 5.75%, 11/01/2028(b)(c) | | | 528,000 | | | | 409,044 | |
|
| |
| | |
Drug Retail–0.02% | | | | | | | | |
Rite Aid Corp., 8.00%, 11/15/2026(b) | | | 225,000 | | | | 146,351 | |
|
| |
Walgreens Boots Alliance, Inc., 3.45%, 06/01/2026 | | | 75,000 | | | | 70,273 | |
|
| |
| | | | | | | 216,624 | |
|
| |
| | |
Electric Utilities–0.22% | | | | | | | | |
Berkshire Hathaway Energy Co., 3.50%, 02/01/2025 | | | 127,000 | | | | 123,079 | |
|
| |
Drax Finco PLC (United Kingdom), 6.63%, 11/01/2025(b) | | | 706,000 | | | | 657,544 | |
|
| |
Duke Energy Corp., 3.75%, 04/15/2024 | | | 200,000 | | | | 196,296 | |
|
| |
Edison International, 5.75%, 06/15/2027 | | | 75,000 | | | | 73,202 | |
|
| |
NRG Energy, Inc., 3.88%, 02/15/2032(b) | | | 547,000 | | | | 432,431 | |
|
| |
Pacific Gas and Electric Co., | | | | | | | | |
3.75%, 02/15/2024 | | | 230,000 | | | | 223,093 | |
|
| |
3.30%, 12/01/2027 | | | 100,000 | | | | 84,888 | |
|
| |
PG&E Corp., 5.25%, 07/01/2030 | | | 523,000 | | | | 463,948 | |
|
| |
Terraform Global Operating L.P., 6.13%, 03/01/2026(b) | | | 351,000 | | | | 324,096 | |
|
| |
| | | | | | | 2,578,577 | |
|
| |
|
Electrical Components & Equipment–0.12% | |
Emerson Electric Co., 1.80%, 10/15/2027 | | | 80,000 | | | | 68,578 | |
|
| |
Sensata Technologies B.V., 5.00%, 10/01/2025(b) | | | 445,000 | | | | 432,165 | |
|
| |
WESCO Distribution, Inc., 7.13%, 06/15/2025(b)(c) | | | 863,000 | | | | 872,700 | |
|
| |
| | | | | | | 1,373,443 | |
|
| |
| | |
Electronic Components–0.02% | | | | | | | | |
Likewize Corp., 9.75%, 10/15/2025(b) | | | 239,000 | | | | 216,584 | |
|
| |
|
Electronic Manufacturing Services–0.01% | |
Tyco Electronics Group S.A. (Switzerland), 3.13%, 08/15/2027 | | | 75,000 | | | | 68,298 | |
|
| |
|
Environmental & Facilities Services–0.17% | |
GFL Environmental, Inc. (Canada), | | | | | | | | |
4.25%, 06/01/2025(b) | | | 493,000 | | | | 471,372 | |
|
| |
3.75%, 08/01/2025(b) | | | 1,040,000 | | | | 985,337 | |
|
| |
| | | | | | | | |
| | | Principal
Amount | | | Value | |
|
| |
Environmental & Facilities Services–(continued) | |
Harsco Corp., 5.75%, 07/31/2027(b) | | $ | 763,000 | | | $ | 542,543 | |
|
| |
| | | | | | | 1,999,252 | |
|
| |
|
Financial Exchanges & Data–0.14% | |
Cboe Global Markets, Inc., 3.65%, 01/12/2027 | | | 60,000 | | | | 56,218 | |
|
| |
Coinbase Global, Inc., | | | | | | | | |
3.38%, 10/01/2028(b) | | | 1,215,000 | | | | 796,904 | |
|
| |
3.63%, 10/01/2031(b) | | | 1,146,000 | | | | 681,456 | |
|
| |
Intercontinental Exchange, Inc., 3.10%, 09/15/2027 | | | 75,000 | | | | 68,062 | |
|
| |
S&P Global, Inc., 2.45%, 03/01/2027(b) | | | 65,000 | | | | 58,288 | |
|
| |
| | | | | | | 1,660,928 | |
|
| |
| | |
Food Distributors–0.09% | | | | | | | | |
C&S Group Enterprises LLC, 5.00%, 12/15/2028(b) | | | 1,087,000 | | | | 805,125 | |
|
| |
US Foods, Inc., 6.25%, 04/15/2025(b) | | | 307,000 | | | | 305,970 | |
|
| |
| | | | | | | 1,111,095 | |
|
| |
| | |
Food Retail–0.13% | | | | | | | | |
Albertson’s Cos., Inc./Safeway, Inc./New Albertson’s L.P./Albertson’s LLC, | | | | | | | | |
7.50%, 03/15/2026(b) | | | 538,000 | | | | 552,604 | |
|
| |
4.63%, 01/15/2027(b) | | | 1,128,000 | | | | 1,047,184 | |
|
| |
| | | | | | | 1,599,788 | |
|
| |
| | |
Footwear–0.03% | | | | | | | | |
Abercrombie & Fitch Management Co., 8.75%, 07/15/2025(b)(c) | | | 401,000 | | | | 379,456 | |
|
| |
|
Gas Utilities–0.13% | |
AmeriGas Partners L.P./AmeriGas Finance Corp., | | | | | | | | |
5.50%, 05/20/2025 | | | 399,000 | | | | 383,054 | |
|
| |
5.75%, 05/20/2027 | | | 694,000 | | | | 640,971 | |
|
| |
Ferrellgas L.P./Ferrellgas Finance Corp., 5.88%, 04/01/2029(b) | | | 458,000 | | | | 384,922 | |
|
| |
ONE Gas, Inc., 1.10%, 03/11/2024 | | | 118,000 | | | | 111,667 | |
|
| |
| | | | | | | 1,520,614 | |
|
| |
|
Health Care Facilities–0.21% | |
CommonSpirit Health, 1.55%, 10/01/2025 | | | 64,000 | | | | 56,929 | |
|
| |
Encompass Health Corp., 5.75%, 09/15/2025 | | | 250,000 | | | | 248,028 | |
|
| |
HCA, Inc., 5.00%, 03/15/2024 | | | 468,000 | | | | 464,100 | |
|
| |
RegionalCare Hospital Partners Holdings, Inc./LifePoint Health, Inc., 9.75%, 12/01/2026(b) | | | 522,000 | | | | 417,271 | |
|
| |
Tenet Healthcare Corp., 4.88%, 01/01/2026(b) | | | 1,293,000 | | | | 1,224,355 | |
|
| |
Universal Health Services, Inc., 1.65%, 09/01/2026(b) | | | 134,000 | | | | 112,403 | |
|
| |
| | | | | | | 2,523,086 | |
|
| |
See accompanying Notes to Financial Statements which are an integral part of the financial statements.
| | |
| 11 | | Invesco Multi-Asset Income Fund |
| | | | | | | | |
| | | Principal
Amount | | | Value | |
|
| |
Health Care REITs–0.07% | | | | | | | | |
Diversified Healthcare Trust, | | | | | | | | |
9.75%, 06/15/2025 | | $ | 355,000 | | | $ | 335,282 | |
|
| |
4.75%, 02/15/2028 | | | 588,000 | | | | 403,294 | |
|
| |
Omega Healthcare Investors, Inc., 5.25%, 01/15/2026 | | | 120,000 | | | | 115,076 | |
|
| |
| | | | | | | 853,652 | |
|
| |
| | |
Health Care Services–0.43% | | | | | | | | |
Akumin Escrow, Inc., 7.50%, 08/01/2028(b) | | | 639,000 | | | | 460,082 | |
|
| |
Akumin, Inc., 7.00%, 11/01/2025(b) | | | 444,000 | | | | 359,780 | |
|
| |
Community Health Systems, Inc., | | | | | | | | |
8.00%, 03/15/2026(b)(c) | | | 1,436,000 | | | | 1,241,343 | |
|
| |
5.63%, 03/15/2027(b) | | | 507,000 | | | | 405,042 | |
|
| |
6.88%, 04/15/2029(b) | | | 650,000 | | | | 263,142 | |
|
| |
6.13%, 04/01/2030(b) | | | 530,000 | | | | 218,609 | |
|
| |
5.25%, 05/15/2030(b) | | | 1,122,000 | | | | 779,167 | |
|
| |
LifePoint Health, Inc., 5.38%, 01/15/2029(b) | | | 318,000 | | | | 203,616 | |
|
| |
Prime Healthcare Services, Inc., 7.25%, 11/01/2025(b) | | | 453,000 | | | | 395,856 | |
|
| |
RP Escrow Issuer LLC, 5.25%, 12/15/2025(b) | | | 397,000 | | | | 297,837 | |
|
| |
Sutter Health, Series 20A, 1.32%, 08/15/2025 | | | 167,000 | | | | 149,736 | |
|
| |
US Acute Care Solutions LLC, 6.38%, 03/01/2026(b) | | | 361,000 | | | | 328,187 | |
|
| |
| | | | | | | 5,102,397 | |
|
| |
|
Health Care Technology–0.06% | |
AthenaHealth Group, Inc., 6.50%, 02/15/2030(b) | | | 858,000 | | | | 670,759 | |
|
| |
| | |
Home Furnishings–0.13% | | | | | | | | |
Tempur Sealy International, Inc., | | | | | | | | |
4.00%, 04/15/2029(b)(c) | | | 1,064,000 | | | | 858,191 | |
|
| |
3.88%, 10/15/2031(b) | | | 937,000 | | | | 705,495 | |
|
| |
| | | | | | | 1,563,686 | |
|
| |
|
Home Improvement Retail–0.15% | |
Home Depot, Inc. (The), 2.50%, 04/15/2027 | | | 80,000 | | | | 72,342 | |
|
| |
JELD-WEN, Inc., | | | | | | | | |
6.25%, 05/15/2025(b) | | | 887,000 | | | | 830,622 | |
|
| |
4.63%, 12/15/2025(b) | | | 521,000 | | | | 430,773 | |
|
| |
Specialty Building Products Holdings LLC/SBP Finance Corp., 6.38%, 09/30/2026(b) | | | 485,000 | | | | 390,778 | |
|
| |
| | | | | | | 1,724,515 | |
|
| |
| | |
Homebuilding–0.40% | | | | | | | | |
Beazer Homes USA, Inc., 5.88%, 10/15/2027(c) | | | 750,000 | | | | 631,061 | |
|
| |
Century Communities, Inc., 6.75%, 06/01/2027 | | | 674,000 | | | | 644,445 | |
|
| |
Empire Communities Corp. (Canada), 7.00%, 12/15/2025(b) | | | 477,000 | | | | 411,833 | |
|
| |
Lennar Corp., 4.75%, 11/29/2027 | | | 60,000 | | | | 55,539 | |
|
| |
Mattamy Group Corp. (Canada), 4.63%, 03/01/2030(b) | | | 276,000 | | | | 215,869 | |
|
| |
| | | | | | | | |
| | | Principal
Amount | | | Value | |
|
| |
Homebuilding–(continued) | |
Meritage Homes Corp., 6.00%, 06/01/2025 | | $ | 246,000 | | | $ | 239,114 | |
|
| |
Taylor Morrison Communities, Inc., 5.75%, 01/15/2028(b) | | | 975,000 | | | | 894,943 | |
|
| |
TopBuild Corp., 4.13%, 02/15/2032(b) | | | 1,060,000 | | | | 831,473 | |
|
| |
Tri Pointe Homes, Inc., 5.25%, 06/01/2027 | | | 977,000 | | | | 841,733 | |
|
| |
| | | | | | | 4,766,010 | |
|
| |
|
Hotel & Resort REITs–0.22% | |
Host Hotels & Resorts L.P., Series F, 4.50%, 02/01/2026 | | | 50,000 | | | | 46,712 | |
|
| |
Service Properties Trust, | | | | | | | | |
4.35%, 10/01/2024 | | | 805,000 | | | | 740,278 | |
|
| |
4.50%, 03/15/2025 | | | 422,000 | | | | 374,016 | |
|
| |
7.50%, 09/15/2025 | | | 552,000 | | | | 538,890 | |
|
| |
5.25%, 02/15/2026 | | | 323,000 | | | | 279,868 | |
|
| |
4.95%, 02/15/2027 | | | 277,000 | | | | 224,655 | |
|
| |
4.95%, 10/01/2029 | | | 595,000 | | | | 432,451 | |
|
| |
| | | | | | | 2,636,870 | |
|
| |
|
Hotels, Resorts & Cruise Lines–0.59% | |
Carnival Corp., | | | | | | | | |
10.50%, 02/01/2026(b)(c) | | | 777,000 | | | | 762,625 | |
|
| |
7.63%, 03/01/2026(b)(c) | | | 587,000 | | | | 442,378 | |
|
| |
5.75%, 03/01/2027(b) | | | 1,706,000 | | | | 1,185,329 | |
|
| |
6.00%, 05/01/2029(b) | | | 745,000 | | | | 495,375 | |
|
| |
Carnival Holdings Bermuda Ltd., 10.38%, 05/01/2028(b) | | | 450,000 | | | | 456,469 | |
|
| |
Hilton Domestic Operating Co., Inc., 5.38%, 05/01/2025(b) | | | 490,000 | | | | 483,875 | |
|
| |
Royal Caribbean Cruises Ltd., | | | | | | | | |
11.50%, 06/01/2025(b)(c) | | | 1,241,000 | | | | 1,338,071 | |
|
| |
11.63%, 08/15/2027(b) | | | 629,000 | | | | 604,293 | |
|
| |
5.50%, 04/01/2028(b)(c) | | | 631,000 | | | | 487,700 | |
|
| |
Six Flags Theme Parks, Inc., 7.00%, 07/01/2025(b)(c) | | | 248,000 | | | | 250,777 | |
|
| |
Travel + Leisure Co., 6.60%, 10/01/2025 | | | 444,000 | | | | 434,576 | |
|
| |
| | | | | | | 6,941,468 | |
|
| |
| | |
Household Products–0.12% | | | | | | | | |
Energizer Holdings, Inc., 4.38%, 03/31/2029(b) | | | 564,000 | | | | 452,909 | |
|
| |
Kronos Acquisition Holdings, Inc./KIK Custom Products, Inc. (Canada), 5.00%, 12/31/2026(b) | | | 576,000 | | | | 522,919 | |
|
| |
Spectrum Brands, Inc., 5.75%, 07/15/2025 | | | 501,000 | | | | 495,088 | |
|
| |
| | | | | | | 1,470,916 | |
|
| |
|
Housewares & Specialties–0.13% | |
Newell Brands, Inc., | | | | | | | | |
4.88%, 06/01/2025(c) | | | 490,000 | | | | 473,614 | |
|
| |
4.45%, 04/01/2026 | | | 1,099,000 | | | | 1,024,373 | |
|
| |
| | | | | | | 1,497,987 | |
|
| |
See accompanying Notes to Financial Statements which are an integral part of the financial statements.
| | |
| 12 | | Invesco Multi-Asset Income Fund |
| | | | | | | | |
| | | Principal
Amount | | | Value | |
|
| |
Independent Power Producers & Energy Traders–0.13% | |
EnfraGen Energia Sur S.A./EnfraGen Spain S.A./Prime Energia S.p.A. (Colombia), 5.38%, 12/30/2030(b) | | $ | 1,044,000 | | | $ | 534,992 | |
|
| |
TransAlta Corp. (Canada), 6.50%, 03/15/2040 | | | 413,000 | | | | 355,943 | |
|
| |
Vistra Operations Co. LLC, 5.63%, 02/15/2027(b)(c) | | | 689,000 | | | | 657,864 | |
|
| |
| | | | | | | 1,548,799 | |
|
| |
|
Industrial Conglomerates–0.11% | |
Icahn Enterprises L.P./Icahn Enterprises Finance Corp., | | | | | | | | |
6.38%, 12/15/2025 | | | 667,000 | | | | 649,031 | |
|
| |
6.25%, 05/15/2026 | | | 719,000 | | | | 691,563 | |
|
| |
| | | | | | | 1,340,594 | |
|
| |
| | |
Industrial Machinery–0.01% | | | | | | | | |
Stanley Black & Decker, Inc., 3.40%, 03/01/2026 | | | 80,000 | | | | 75,260 | |
|
| |
|
Insurance Brokers–0.08% | |
Alliant Holdings Intermediate LLC/ Alliant Holdings Co-Issuer, 6.75%, 10/15/2027(b) | | | 257,000 | | | | 234,871 | |
|
| |
HUB International Ltd., 7.00%, 05/01/2026(b) | | | 616,000 | | | | 609,436 | |
|
| |
Willis North America, Inc., 4.65%, 06/15/2027 | | | 75,000 | | | | 70,626 | |
|
| |
| | | | | | | 914,933 | |
|
| |
|
Integrated Oil & Gas–1.32% | |
BP Capital Markets America, Inc., 3.54%, 04/06/2027 | | | 75,000 | | | | 69,831 | |
|
| |
Chevron USA, Inc., 1.02%, 08/12/2027 | | | 100,000 | | | | 84,108 | |
|
| |
Exxon Mobil Corp., 3.29%, 03/19/2027 | | | 110,000 | | | | 103,395 | |
|
| |
KazMunayGas National Co. JSC (Kazakhstan), | | | | | | | | |
5.38%, 04/24/2030(b) | | | 1,400,000 | | | | 1,153,215 | |
|
| |
6.38%, 10/24/2048(b) | | | 1,500,000 | | | | 1,085,070 | |
|
| |
Occidental Petroleum Corp., | | | | | | | | |
8.00%, 07/15/2025 | | | 310,000 | | | | 327,636 | |
|
| |
5.88%, 09/01/2025(c) | | | 556,000 | | | | 560,848 | |
|
| |
5.50%, 12/01/2025 | | | 464,000 | | | | 465,944 | |
|
| |
5.55%, 03/15/2026 | | | 1,031,000 | | | | 1,047,924 | |
|
| |
Petroleos Mexicanos (Mexico), | | | | | | | | |
6.63%, 06/15/2035 | | | 2,455,000 | | | | 1,708,999 | |
|
| |
7.69%, 01/23/2050 | | | 4,600,000 | | | | 3,004,976 | |
|
| |
Petronas Capital Ltd. (Malaysia), | | | | | | | | |
3.50%, 03/18/2025(b) | | | 1,000,000 | | | | 966,810 | |
|
| |
4.55%, 04/21/2050(b) | | | 1,220,000 | | | | 1,006,443 | |
|
| |
4.80%, 04/21/2060(b) | | | 1,200,000 | | | | 1,000,776 | |
|
| |
Qatar Energy (Qatar), 1.38%, 09/12/2026(b) | | | 800,000 | | | | 704,450 | |
|
| |
Saudi Arabian Oil Co. (Saudi Arabia), 4.25%, 04/16/2039(b) | | | 2,812,000 | | | | 2,316,498 | |
|
| |
| | | | | | | 15,606,923 | |
|
| |
| | | | | | | | |
| | | Principal
Amount | | | Value | |
|
| |
Integrated Telecommunication Services–0.67% | |
Altice France Holding S.A. (Luxembourg), 10.50%, 05/15/2027(b) | | $ | 574,000 | | | $ | 448,541 | |
|
| |
Altice France S.A. (France), | |
5.13%, 07/15/2029(b) | | | 200,000 | | | | 151,000 | |
|
| |
5.50%, 10/15/2029(b) | | | 200,000 | | | | 152,885 | |
|
| |
Connect Finco S.a.r.l./Connect US Finco LLC (United Kingdom), 6.75%, 10/01/2026(b) | | | 1,682,000 | | | | 1,583,855 | |
|
| |
Consolidated Communications, Inc., 6.50%, 10/01/2028(b) | | | 292,000 | | | | 239,528 | |
|
| |
Embarq Corp., 8.00%, 06/01/2036 | | | 1,176,000 | | | | 476,057 | |
|
| |
Frontier Communications Holdings LLC, | |
5.88%, 11/01/2029 | | | 600,000 | | | | 469,125 | |
|
| |
6.00%, 01/15/2030(b) | | | 266,000 | | | | 208,627 | |
|
| |
Iliad Holding S.A.S. (France), 6.50%, 10/15/2026(b) | | | 889,000 | | | | 824,716 | |
|
| |
Level 3 Financing, Inc., 3.75%, 07/15/2029(b)(c) | | | 1,127,000 | | | | 859,247 | |
|
| |
Telecom Italia Capital S.A. (Italy), | |
6.38%, 11/15/2033 | | | 548,000 | | | | 421,864 | |
|
| |
7.72%, 06/04/2038 | | | 414,000 | | | | 330,138 | |
|
| |
Telecom Italia S.p.A. (Italy), 5.30%, 05/30/2024(b) | | | 696,000 | | | | 655,980 | |
|
| |
Windstream Escrow LLC/ Windstream Escrow Finance Corp., 7.75%, 08/15/2028(b) | | | 1,228,000 | | | | 1,065,996 | |
|
| |
| | | | 7,887,559 | |
|
| |
|
Interactive Media & Services–0.03% | |
TripAdvisor, Inc., 7.00%, 07/15/2025(b) | | | 309,000 | | | | 305,812 | |
|
| |
|
Internet & Direct Marketing Retail–0.20% | |
Amazon.com, Inc., 3.30%, 04/13/2027 | | | 250,000 | | | | 234,832 | |
|
| |
GrubHub Holdings, Inc., 5.50%, 07/01/2027(b) | | | 289,000 | | | | 194,216 | |
|
| |
Macy’s Retail Holdings LLC, 5.88%, 04/01/2029(b) | | | 740,000 | | | | 640,348 | |
|
| |
Photo Holdings Merger Sub, Inc., 8.50%, 10/01/2026(b) | | | 311,000 | | | | 205,395 | |
|
| |
QVC, Inc., | |
4.75%, 02/15/2027(c) | | | 605,000 | | | | 480,797 | |
|
| |
4.38%, 09/01/2028 | | | 506,000 | | | | 367,806 | |
|
| |
5.45%, 08/15/2034 | | | 436,000 | | | | 275,336 | |
|
| |
| | | | 2,398,730 | |
|
| |
|
Internet Services & Infrastructure–0.10% | |
Cablevision Lightpath LLC, 5.63%, 09/15/2028(b) | | | 278,000 | | | | 221,431 | |
|
| |
Cogent Communications Group, Inc., 3.50%, 05/01/2026(b) | | | 261,000 | | | | 235,953 | |
|
| |
Condor Merger Sub, Inc., 7.38%, 02/15/2030(b) | | | 740,000 | | | | 613,259 | |
|
| |
VeriSign, Inc., 5.25%, 04/01/2025 | | | 150,000 | | | | 148,651 | |
|
| |
| | | | 1,219,294 | |
|
| |
See accompanying Notes to Financial Statements which are an integral part of the financial statements.
| | |
| 13 | | Invesco Multi-Asset Income Fund |
| | | | | | | | |
| | | Principal
Amount | | | Value | |
|
| |
Investment Banking & Brokerage–0.13% | |
Goldman Sachs Group, Inc. (The), | | | | | | | | |
3.85%, 01/26/2027 | | $ | 125,000 | | | $ | 115,960 | |
|
| |
1.54%, 09/10/2027(e) | | | 140,000 | | | | 117,578 | |
|
| |
1.95%, 10/21/2027(e) | | | 75,000 | | | | 63,772 | |
|
| |
Morgan Stanley, | | | | | | | | |
2.72%, 07/22/2025(e) | | | 100,000 | | | | 94,426 | |
|
| |
3.63%, 01/20/2027 | | | 130,000 | | | | 119,879 | |
|
| |
1.59%, 05/04/2027(e) | | | 110,000 | | | | 94,199 | |
|
| |
1.51%, 07/20/2027(e) | | | 110,000 | | | | 93,339 | |
|
| |
NFP Corp., 6.88%, 08/15/2028(b) | | | 763,000 | | | | 650,164 | |
|
| |
Nomura Holdings, Inc. (Japan), 1.65%, 07/14/2026 | | | 200,000 | | | | 170,069 | |
|
| |
| | | | | | | 1,519,386 | |
|
| |
|
IT Consulting & Other Services–0.05% | |
Conduent Business Services LLC/Conduent State & Local Solutions, Inc., 6.00%, 11/01/2029(b) | | | 273,000 | | | | 224,383 | |
|
| |
International Business Machines Corp., | | | | | | | | |
3.45%, 02/19/2026 | | | 150,000 | | | | 142,359 | |
|
| |
3.30%, 05/15/2026 | | | 100,000 | | | | 93,660 | |
|
| |
Kyndryl Holdings, Inc., 2.05%, 10/15/2026 | | | 100,000 | | | | 78,276 | |
|
| |
| | | | | | | 538,678 | |
|
| |
|
Leisure Facilities–0.12% | |
Cedar Fair L.P./Canada’s Wonderland Co./Magnum Management Corp., 5.50%, 05/01/2025(b) | | | 635,000 | | | | 631,028 | |
|
| |
SeaWorld Parks & Entertainment, Inc., 8.75%, 05/01/2025(b) | | | 235,000 | | | | 241,024 | |
|
| |
Vail Resorts, Inc., 6.25%, 05/15/2025(b) | | | 370,000 | | | | 368,968 | |
|
| |
Viking Cruises Ltd., 13.00%, 05/15/2025(b) | | | 222,000 | | | | 239,233 | |
|
| |
| | | | | | | 1,480,253 | |
|
| |
|
Leisure Products–0.05% | |
Mattel, Inc., 3.38%, 04/01/2026(b) | | | 513,000 | | | | 469,170 | |
|
| |
Party City Holdings, Inc., 8.75%, 02/15/2026(b) | | | 198,000 | | | | 125,683 | |
|
| |
| | | | | | | 594,853 | |
|
| |
|
Life & Health Insurance–0.03% | |
Genworth Holdings, Inc., 6.50%, 06/15/2034 | | | 268,000 | | | | 222,833 | |
|
| |
Principal Financial Group, Inc., 3.40%, 05/15/2025 | | | 160,000 | | | | 153,019 | |
|
| |
| | | | | | | 375,852 | |
|
| |
| | |
Marine–0.05% | | | | | | | | |
NCL Corp. Ltd., 5.88%, 03/15/2026(b)(c) | | | 524,000 | | | | 430,117 | |
|
| |
Seaspan Corp. (Hong Kong), 5.50%, 08/01/2029(b) | | | 276,000 | | | | 213,276 | |
|
| |
| | | | | | | 643,393 | |
|
| |
| | | | | | | | |
| | | Principal
Amount | | | Value | |
|
| |
Marine Ports & Services–0.07% | | | | | | | | |
DP World Ltd. (United Arab Emirates), 6.85%, 07/02/2037(b) | | $ | 810,000 | | | $ | 780,960 | |
|
| |
| | |
Metal & Glass Containers–0.20% | | | | | | | | |
Ardagh Packaging Finance PLC/Ardagh Holdings USA, Inc., | | | | | | | | |
5.25%, 04/30/2025(b) | | | 819,000 | | | | 774,139 | |
|
| |
4.13%, 08/15/2026(b) | | | 307,000 | | | | 264,651 | |
|
| |
Ball Corp., 4.88%, 03/15/2026(c) | | | 741,000 | | | | 712,972 | |
|
| |
Intelligent Packaging Ltd. Finco, Inc./Intelligent Packaging Ltd. Co-Issuer LLC (Canada), 6.00%, 09/15/2028(b) | | | 350,000 | | | | 261,253 | |
|
| |
Mauser Packaging Solutions Holding Co., 5.50%, 04/15/2024(b) | | | 394,000 | | | | 386,847 | |
|
| |
| | | | | | | 2,399,862 | |
|
| |
| | |
Mortgage REITs–0.07% | | | | | | | | |
Ladder Capital Finance Holdings LLLP/Ladder Capital Finance Corp., 4.75%, 06/15/2029(b) | | | 420,000 | | | | 335,296 | |
|
| |
Rithm Capital Corp., 6.25%, 10/15/2025(b) | | | 522,000 | | | | 458,804 | |
|
| |
| | | | | | | 794,100 | |
|
| |
|
Movies & Entertainment–0.23% | |
Cinemark USA, Inc., 8.75%, 05/01/2025(b) | | | 646,000 | | | | 648,709 | |
|
| |
Netflix, Inc., | | | | | | | | |
5.88%, 02/15/2025 | | | 496,000 | | | | 499,576 | |
|
| |
5.88%, 11/15/2028 | | | 901,000 | | | | 896,495 | |
|
| |
6.38%, 05/15/2029 | | | 347,000 | | | | 354,336 | |
|
| |
5.38%, 11/15/2029(b) | | | 393,000 | | | | 374,250 | |
|
| |
| | | | | | | 2,773,366 | |
|
| |
| | |
Multi-line Insurance–0.01% | | | | | | | | |
Boardwalk Pipelines L.P., 5.95%, 06/01/2026 | | | 94,000 | | | | 94,217 | |
|
| |
| | |
Multi-Utilities–0.10% | | | | | | | | |
Algonquin Power & Utilities Corp. (Canada), 4.75%,
01/18/2082(c)(e) | | | 1,037,000 | | | | 837,377 | |
|
| |
DTE Energy Co., Series E, Investment Units, 5.25%, 12/01/2077 | | | 8,506 | | | | 182,709 | |
|
| |
Public Service Enterprise Group, Inc., 2.88%, 06/15/2024 | | | 230,000 | | | | 221,168 | |
|
| |
| | | | | | | 1,241,254 | |
|
| |
| | |
Office REITs–0.01% | | | | | | | | |
Office Properties Income Trust, 2.65%, 06/15/2026 | | | 133,000 | | | | 97,062 | |
|
| |
|
Office Services & Supplies–0.10% | |
ACCO Brands Corp., 4.25%, 03/15/2029(b) | | | 545,000 | | | | 434,365 | |
|
| |
Pitney Bowes, Inc., | | | | | | | | |
6.88%, 03/15/2027(b) | | | 578,000 | | | | 371,599 | |
|
| |
7.25%, 03/15/2029(b)(c) | | | 540,000 | | | | 346,764 | |
|
| |
| | | | | | | 1,152,728 | |
|
| |
See accompanying Notes to Financial Statements which are an integral part of the financial statements.
| | |
| 14 | | Invesco Multi-Asset Income Fund |
| | | | | | | | |
| | | Principal
Amount | | | Value | |
|
| |
Oil & Gas Drilling–0.31% | | | | | | | | |
NGL Energy Operating LLC/NGL Energy Finance Corp., 7.50%, 02/01/2026(b) | | $ | 1,565,000 | | | $ | 1,418,412 | |
|
| |
Patterson-UTI Energy, Inc., 5.15%, 11/15/2029 | | | 531,000 | | | | 469,367 | |
|
| |
Rockies Express Pipeline LLC, | | | | | | | | |
4.80%, 05/15/2030(b) | | | 142,000 | | | | 120,188 | |
|
| |
7.50%, 07/15/2038(b) | | | 366,000 | | | | 319,965 | |
|
| |
6.88%, 04/15/2040(b) | | | 1,577,000 | | | | 1,289,837 | |
|
| |
| | | | | | | 3,617,769 | |
|
| |
|
Oil & Gas Equipment & Services–0.16% | |
Baker Hughes Holdings LLC/Baker Hughes Co-Obligor, Inc., 3.34%, 12/15/2027 | | | 75,000 | | | | 67,260 | |
|
| |
Oceaneering International, Inc., 6.00%, 02/01/2028 | | | 259,000 | | | | 231,480 | |
|
| |
USA Compression Partners L.P./USA Compression Finance Corp., | | | | | | | | |
6.88%, 04/01/2026 | | | 622,000 | | | | 597,907 | |
|
| |
6.88%, 09/01/2027 | | | 257,000 | | | | 246,053 | |
|
| |
Weatherford International Ltd., 8.63%, 04/30/2030(b)(c) | | | 818,000 | | | | 772,650 | |
|
| |
| | | | | | | 1,915,350 | |
|
| |
|
Oil & Gas Exploration & Production–0.66% | |
CrownRock L.P./CrownRock Finance, Inc., 5.63%, 10/15/2025(b) | | | 738,000 | | | | 714,668 | |
|
| |
Devon Energy Corp., 5.25%, 10/15/2027 | | | 75,000 | | | | 74,431 | |
|
| |
Hilcorp Energy I L.P./Hilcorp Finance Co., | | | | | | | | |
5.75%, 02/01/2029(b) | | | 553,000 | | | | 507,253 | |
|
| |
6.00%, 02/01/2031(b) | | | 788,000 | | | | 718,010 | |
|
| |
Ithaca Energy North Sea PLC (United Kingdom), 9.00%, 07/15/2026(b) | | | 249,000 | | | | 246,448 | |
|
| |
Moss Creek Resources Holdings, Inc., | | | | | | | | |
7.50%, 01/15/2026(b)(c) | | | 344,000 | | | | 317,233 | |
|
| |
10.50%, 05/15/2027(b) | | | 284,000 | | | | 273,104 | |
|
| |
Murphy Oil Corp., | | | | | | | | |
5.75%, 08/15/2025 | | | 338,000 | | | | 333,645 | |
|
| |
7.05%, 05/01/2029 | | | 473,000 | | | | 468,200 | |
|
| |
Par Petroleum LLC/Par Petroleum Finance Corp., 7.75%, 12/15/2025(b) | | | 531,000 | | | | 509,813 | |
|
| |
PDC Energy, Inc., 5.75%, 05/15/2026 | | | 496,000 | | | | 476,116 | |
|
| |
Range Resources Corp., 4.88%, 05/15/2025(c) | | | 467,000 | | | | 451,505 | |
|
| |
Sinopec Group Overseas Development 2018 Ltd. (China), 2.95%, 11/12/2029(b) | | | 2,760,000 | | | | 2,397,540 | |
|
| |
Talos Production, Inc., 12.00%, 01/15/2026 | | | 288,000 | | | | 305,843 | |
|
| |
| | | | | | | 7,793,809 | |
|
| |
|
Oil & Gas Refining & Marketing–0.20% | |
CVR Energy, Inc., 5.25%, 02/15/2025(b) | | | 445,000 | | | | 429,559 | |
|
| |
EnLink Midstream Partners L.P., 5.60%, 04/01/2044 | | | 454,000 | | | | 354,541 | |
|
| |
| | | | | | | | |
| | | Principal
Amount | | | Value | |
|
| |
Oil & Gas Refining & Marketing–(continued) | |
HF Sinclair Corp., 5.88%, 04/01/2026 | | $ | 94,000 | | | $ | 91,499 | |
|
| |
NuStar Logistics L.P., | | | | | | | | |
5.75%, 10/01/2025(c) | | | 358,000 | | | | 345,973 | |
|
| |
6.00%, 06/01/2026(c) | | | 422,000 | | | | 409,878 | |
|
| |
Parkland Corp. (Canada), 4.50%, 10/01/2029(b) | | | 229,000 | | | | 193,290 | |
|
| |
Puma International Financing S.A. (Singapore), 5.13%, 10/06/2024(b) | | | 600,000 | | | | 563,664 | |
|
| |
| | | | | | | 2,388,404 | |
|
| |
|
Oil & Gas Storage & Transportation–1.31% | |
Abu Dhabi Crude Oil Pipeline LLC (United Arab Emirates), 4.60%, 11/02/2047(b) | | | 3,587,000 | | | | 3,086,076 | |
|
| |
Blue Racer Midstream LLC/Blue Racer Finance Corp., 7.63%, 12/15/2025(b) | | | 373,000 | | | | 369,207 | |
|
| |
Cheniere Corpus Christi Holdings LLC, 5.13%, 06/30/2027 | | | 125,000 | | | | 122,053 | |
|
| |
Crestwood Midstream Partners L.P./Crestwood Midstream Finance Corp., | | | | | | | | |
5.75%, 04/01/2025 | | | 151,000 | | | | 147,436 | |
|
| |
8.00%, 04/01/2029(b) | | | 1,178,000 | | | | 1,179,690 | |
|
| |
Energy Transfer L.P., | | | | | | | | |
3.90%, 05/15/2024 | | | 236,000 | | | | 229,375 | |
|
| |
4.40%, 03/15/2027 | | | 60,000 | | | | 55,718 | |
|
| |
5.50%, 06/01/2027 | | | 50,000 | | | | 48,698 | |
|
| |
EQM Midstream Partners L.P., | | | | | | | | |
6.00%, 07/01/2025(b) | | | 589,000 | | | | 571,212 | |
|
| |
5.50%, 07/15/2028(c) | | | 381,000 | | | | 341,178 | |
|
| |
7.50%, 06/01/2030(b) | | | 224,000 | | | | 218,142 | |
|
| |
6.50%, 07/15/2048 | | | 1,568,000 | | | | 1,209,665 | |
|
| |
Genesis Energy L.P./Genesis Energy Finance Corp., | | | | | | | | |
8.00%, 01/15/2027 | | | 1,257,000 | | | | 1,219,629 | |
|
| |
7.75%, 02/01/2028 | | | 350,000 | | | | 334,668 | |
|
| |
Hess Midstream Operations L.P., 5.63%, 02/15/2026(b) | | | 243,000 | | | | 238,684 | |
|
| |
Holly Energy Partners L.P./Holly Energy Finance Corp., 5.00%, 02/01/2028(b) | | | 313,000 | | | | 283,339 | |
|
| |
ITT Holdings LLC, 6.50%, 08/01/2029(b) | | | 497,000 | | | | 400,582 | |
|
| |
New Fortress Energy, Inc., | | | | | | | | |
6.75%, 09/15/2025(b) | | | 1,188,000 | | | | 1,167,983 | |
|
| |
6.50%, 09/30/2026(b) | | | 490,000 | | | | 476,283 | |
|
| |
Northriver Midstream Finance L.P. (Canada), 5.63%, 02/15/2026(b) | | | 443,000 | | | | 420,033 | |
|
| |
Summit Midstream Holdings LLC/Summit Midstream Finance Corp., 8.50%, 10/15/2026(b) | | | 1,741,000 | | | | 1,673,484 | |
|
| |
Tallgrass Energy Partners L.P./Tallgrass Energy Finance Corp., | | | | | | | | |
7.50%, 10/01/2025(b) | | | 358,000 | | | | 362,378 | |
|
| |
5.50%, 01/15/2028(b) | | | 758,000 | | | | 681,419 | |
|
| |
6.00%, 12/31/2030(b) | | | 495,000 | | | | 449,341 | |
|
| |
See accompanying Notes to Financial Statements which are an integral part of the financial statements.
| | |
| 15 | | Invesco Multi-Asset Income Fund |
| | | | | | | | |
| | | Principal
Amount | | | Value | |
|
| |
Oil & Gas Storage & Transportation–(continued) | |
Western Midstream Operating L.P., 3.35%, 02/01/2025 | | $ | 243,000 | | | $ | 231,498 | |
|
| |
| | | | | | | 15,517,771 | |
|
| |
|
Other Diversified Financial Services–0.45% | |
Albion Financing 1 S.a.r.l/Aggreko Holdings, Inc. (Luxembourg), 6.13%, 10/15/2026(b) | | | 200,000 | | | | 171,268 | |
|
| |
Albion Financing 2 S.a.r.l. (Luxembourg), 8.75%, 04/15/2027(b) | | | 635,000 | | | | 536,575 | |
|
| |
Corebridge Financial, Inc., 3.65%, 04/05/2027(b) | | | 130,000 | | | | 117,827 | |
|
| |
Jefferson Capital Holdings LLC, 6.00%, 08/15/2026(b) | | | 251,000 | | | | 209,334 | |
|
| |
Midcap Financial Issuer Trust, | | | | | | | | |
6.50%, 05/01/2028(b) | | | 306,000 | | | | 260,831 | |
|
| |
5.63%, 01/15/2030(b) | | | 285,000 | | | | 219,914 | |
|
| |
PHH Mortgage Corp., 7.88%, 03/15/2026(b) | | | 1,299,000 | | | | 1,080,157 | |
|
| |
Resorts World Las Vegas LLC/RWLV Capital, Inc., | | | | | | | | |
4.63%, 04/16/2029(b) | | | 1,200,000 | | | | 860,217 | |
|
| |
4.63%, 04/06/2031(b) | | | 500,000 | | | | 339,528 | |
|
| |
United Wholesale Mortgage LLC, | | | | | | | | |
5.50%, 11/15/2025(b) | | | 677,000 | | | | 612,888 | |
|
| |
5.75%, 06/15/2027(b) | | | 350,000 | | | | 287,345 | |
|
| |
5.50%, 04/15/2029(b)(c) | | | 410,000 | | | | 310,438 | |
|
| |
VistaJet Malta Finance PLC/XO Management Holding, Inc. (Switzerland), 6.38%, 02/01/2030(b) | | | 407,000 | | | | 338,874 | |
|
| |
| | | | | | | 5,345,196 | |
|
| |
|
Packaged Foods & Meats–0.12% | |
Conagra Brands, Inc., 1.38%, 11/01/2027 | | | 100,000 | | | | 80,848 | |
|
| |
FAGE International S.A./FAGE USA Dairy Industry, Inc. (Luxembourg), 5.63%, 08/15/2026(b) | | | 1,265,000 | | | | 1,111,357 | |
|
| |
TreeHouse Foods, Inc., 4.00%, 09/01/2028 | | | 177,000 | | | | 149,572 | |
|
| |
Tyson Foods, Inc., 4.00%, 03/01/2026 | | | 127,000 | | | | 121,568 | |
|
| |
| | | | | | | 1,463,345 | |
|
| |
| | |
Paper Packaging–0.09% | | | | | | | | |
Berry Global, Inc., 1.57%, 01/15/2026 | | | 80,000 | | | | 69,395 | |
|
| |
Crown Americas LLC/Crown Americas Capital Corp. VI, 4.75%, 02/01/2026(c) | | | 544,000 | | | | 521,536 | |
|
| |
LABL, Inc., | | | | | | | | |
6.75%, 07/15/2026(b) | | | 276,000 | | | | 262,844 | |
|
| |
5.88%, 11/01/2028(b) | | | 266,000 | | | | 231,562 | |
|
| |
| | | | | | | 1,085,337 | |
|
| |
| | |
Paper Products–0.08% | | | | | | | | |
Domtar Corp., 6.75%, 10/01/2028(b) | | | 499,000 | | | | 425,372 | |
|
| |
Glatfelter Corp., 4.75%, 11/15/2029(b) | | | 885,000 | | | | 571,254 | |
|
| |
| | | | | | | 996,626 | |
|
| |
| | | | | | | | |
| | | Principal
Amount | | | Value | |
|
| |
Personal Products–0.03% | | | | | | | | |
Herbalife Nutrition Ltd./HLF Financing, Inc., 7.88%, 09/01/2025(b) | | $ | 381,000 | | | $ | 356,561 | |
|
| |
|
Pharmaceuticals–0.38% | |
1375209 BC Ltd. (Canada), 9.00%, 01/30/2028(b) | | | 668,996 | | | | 650,598 | |
|
| |
Bausch Health Cos., Inc., | | | | | | | | |
5.50%, 11/01/2025(b) | | | 1,514,000 | | | | 1,212,623 | |
|
| |
4.88%, 06/01/2028(b) | | | 805,000 | | | | 494,773 | |
|
| |
Bristol-Myers Squibb Co., 0.75%, 11/13/2025 | | | 275,000 | | | | 243,083 | |
|
| |
Merck & Co., Inc., 2.75%, 02/10/2025 | | | 183,000 | | | | 174,927 | |
|
| |
Par Pharmaceutical, Inc., 7.50%, 04/01/2027(b)(h) | | | 814,000 | | | | 624,177 | |
|
| |
Perrigo Finance Unlimited Co., 3.90%, 12/15/2024 | | | 705,000 | | | | 673,159 | |
|
| |
Royalty Pharma PLC, 1.20%, 09/02/2025 | | | 200,000 | | | | 176,527 | |
|
| |
Utah Acquisition Sub, Inc., 3.95%, 06/15/2026 | | | 134,000 | | | | 122,150 | |
|
| |
Viatris, Inc., 2.30%, 06/22/2027 | | | 85,000 | | | | 69,582 | |
|
| |
| | | | | | | 4,441,599 | |
|
| |
| | |
Publishing–0.11% | | | | | | | | |
Gannett Holdings LLC, 6.00%, 11/01/2026(b)(c) | | | 1,806,000 | | | | 1,353,936 | |
|
| |
| | |
Railroads–0.11% | | | | | | | | |
Empresa de Transporte de Pasajeros Metro S.A. (Chile), 4.70%, 05/07/2050(b) | | | 1,550,000 | | | | 1,156,280 | |
|
| |
Union Pacific Corp., 3.15%, 03/01/2024 | | | 200,000 | | | | 195,439 | |
|
| |
| | | | | | | 1,351,719 | |
|
| |
|
Real Estate Development–0.07% | |
Forestar Group, Inc., 3.85%, 05/15/2026(b) | | | 558,000 | | | | 475,899 | |
|
| |
Realogy Group LLC/Realogy Co-Issuer Corp., 5.25%, 04/15/2030(b) | | | 571,000 | | | | 397,016 | |
|
| |
| | | | | | | 872,915 | |
|
| |
| | |
Regional Banks–0.07% | | | | | | | | |
Santander Holdings USA, Inc., 4.40%, 07/13/2027 | | | 75,000 | | | | 67,838 | |
|
| |
Synovus Financial Corp., 5.90%, 02/07/2029(c)(e) | | | 456,000 | | | | 446,479 | |
|
| |
Truist Financial Corp., 4.00%, 05/01/2025 | | | 275,000 | | | | 266,585 | |
|
| |
| | | | | | | 780,902 | |
|
| |
| | |
Reinsurance–0.14% | | | | | | | | |
Enstar Finance LLC, | | | | | | | | |
5.75%, 09/01/2040(e) | | | 410,000 | | | | 365,210 | |
|
| |
5.50%, 01/15/2042(e) | | | 638,000 | | | | 502,298 | |
|
| |
Global Atlantic Fin Co., 4.70%, 10/15/2051(b)(e) | | | 992,000 | | | | 733,500 | |
|
| |
| | | | | | | 1,601,008 | |
|
| |
See accompanying Notes to Financial Statements which are an integral part of the financial statements.
| | |
| 16 | | Invesco Multi-Asset Income Fund |
| | | | | | | | |
| | | Principal
Amount | | | Value | |
|
| |
Renewable Electricity–0.05% | |
Sunnova Energy Corp., 5.88%, 09/01/2026(b)(c) | | $ | 700,000 | | | $ | 617,088 | |
|
| |
| | |
Residential REITs–0.01% | | | | | | | | |
Spirit Realty L.P., 4.45%, 09/15/2026 | | | 75,000 | | | | 70,000 | |
|
| |
| | |
Restaurants–0.11% | | | | | | | | |
Aramark Services, Inc., | | | | | | | | |
5.00%, 04/01/2025(b) | | | 382,000 | | | | 370,094 | |
|
| |
6.38%, 05/01/2025(b) | | | 953,000 | | | | 944,364 | |
|
| |
| | | | | | | 1,314,458 | |
|
| |
|
Retail REITs–0.19% | |
Brookfield Property REIT, Inc./BPR Cumulus LLC/BPR Nimbus LLC/GGSI Sellco LLC, | | | | | | | | |
5.75%, 05/15/2026(b)(c) | | | 1,290,000 | | | | 1,200,358 | |
|
| |
4.50%, 04/01/2027(b)(c) | | | 517,000 | | | | 440,960 | |
|
| |
Necessity Retail REIT, Inc. (The)/American Finance Operating Partner L.P., 4.50%, 09/30/2028(b) | | | 594,000 | | | | 434,576 | |
|
| |
Realty Income Corp., 4.88%, 06/01/2026 | | | 80,000 | | | | 77,849 | |
|
| |
Simon Property Group L.P., 3.30%, 01/15/2026 | | | 64,000 | | | | 59,724 | |
|
| |
| | | | | | | 2,213,467 | |
|
| |
|
Security & Alarm Services–0.13% | |
CoreCivic, Inc., 8.25%, 04/15/2026 | | | 651,000 | | | | 661,319 | |
|
| |
Prime Security Services Borrower LLC/Prime Finance, Inc., 5.75%, 04/15/2026(b)(c) | | | 858,000 | | | | 836,695 | |
|
| |
| | | | | | | 1,498,014 | |
|
| |
|
Semiconductor Equipment–0.02% | |
NXP B.V./NXP Funding LLC/NXP USA, Inc. (China), 2.70%, 05/01/2025 | | | 200,000 | | | | 185,194 | |
|
| |
| | |
Semiconductors–0.04% | | | | | | | | |
ams-OSRAM AG (Austria), 7.00%, 07/31/2025(b)(c) | | | 394,000 | | | | 352,559 | |
|
| |
Broadcom Corp./Broadcom Cayman Finance Ltd., 3.88%, 01/15/2027 | | | 77,000 | | | | 70,828 | |
|
| |
Micron Technology, Inc., 4.19%, 02/15/2027 | | | 75,000 | | | | 69,650 | |
|
| |
| | | | | | | 493,037 | |
|
| |
|
Soft Drinks–0.01% | |
Triton Water Holdings, Inc., 6.25%, 04/01/2029(b) | | | 226,000 | | | | 171,707 | |
|
| |
|
Sovereign Debt–10.85% | |
Abu Dhabi Government International Bond (United Arab Emirates), 2.70%, 09/02/2070(b) | | | 3,400,000 | | | | 1,925,250 | |
|
| |
Angolan Government International Bond (Angola), 9.13%, 11/26/2049(b) | | | 1,140,000 | | | | 864,006 | |
|
| |
| | | | | | | | |
| | | Principal
Amount | | | Value | |
|
| |
Sovereign Debt–(continued) | | | | | | | | |
Argentine Republic Government International Bond (Argentina), 0.75%, 07/09/2030(i) | | $ | 3,000,000 | | | $ | 639,829 | |
|
| |
Bahrain Government International Bond (Bahrain), 7.00%, 01/26/2026(b) | | | 2,000,000 | | | | 2,002,700 | |
|
| |
Bolivian Government International Bond (Bolivia), 4.50%, 03/20/2028(b) | | | 699,000 | | | | 555,705 | |
|
| |
Brazilian Government International Bond (Brazil), | | | | | | | | |
4.25%, 01/07/2025 | | | 1,600,000 | | | | 1,559,725 | |
|
| |
4.63%, 01/13/2028 | | | 2,400,000 | | | | 2,257,312 | |
|
| |
7.13%, 01/20/2037 | | | 2,000,000 | | | | 2,002,588 | |
|
| |
CBB International Sukuk Programme Co. WLL (Bahrain), 4.50%, 03/30/2027(b) | | | 2,000,000 | | | | 1,894,652 | |
|
| |
Chile Government International Bond (Chile), | | | | | | | | |
3.24%, 02/06/2028 | | | 1,641,000 | | | | 1,476,358 | |
|
| |
2.45%, 01/31/2031 | | | 707,000 | | | | 566,751 | |
|
| |
3.10%, 01/22/2061 | | | 1,800,000 | | | | 1,010,836 | |
|
| |
Colombia Government International Bond (Colombia), | | | | | | | | |
3.88%, 04/25/2027 | | | 2,250,000 | | | | 1,879,980 | |
|
| |
7.38%, 09/18/2037 | | | 3,800,000 | | | | 3,206,856 | |
|
| |
6.13%, 01/18/2041 | | | 1,950,000 | | | | 1,393,253 | |
|
| |
Costa Rica Government International Bond (Costa Rica), | | | | | | | | |
5.63%, 04/30/2043(b) | | | 1,300,000 | | | | 949,152 | |
|
| |
7.16%, 03/12/2045(b) | | | 800,000 | | | | 693,610 | |
|
| |
Dominican Republic International Bond (Dominican Republic), | | | | | | | | |
5.95%, 01/25/2027(b) | | | 2,228,000 | | | | 2,089,298 | |
|
| |
6.85%, 01/27/2045(b) | | | 2,902,000 | | | | 2,251,850 | |
|
| |
6.40%, 06/05/2049(b) | | | 935,000 | | | | 675,822 | |
|
| |
Ecuador Government International Bond (Ecuador), 6.00%, 07/31/2030(b)(i) | | | 3,135,000 | | | | 1,680,226 | |
|
| |
Egypt Government International Bond (Egypt), | | | | | | | | |
7.60%, 03/01/2029(b) | | | 200,000 | | | | 144,168 | |
|
| |
8.50%, 01/31/2047(b) | | | 2,896,000 | | | | 1,717,629 | |
|
| |
7.90%, 02/21/2048(b) | | | 1,200,000 | | | | 680,352 | |
|
| |
8.70%, 03/01/2049(b) | | | 2,110,000 | | | | 1,262,291 | |
|
| |
Ghana Government International Bond (Ghana), | | | | | | | | |
7.63%, 05/16/2029(b) | | | 818,000 | | | | 234,152 | |
|
| |
8.95%, 03/26/2051(b) | | | 738,000 | | | | 215,050 | |
|
| |
Hazine Mustesarligi Varlik Kiralama A.S. (Turkey), 5.00%, 04/06/2023(b) | | | 320,000 | | | | 318,736 | |
|
| |
Hungary Government International Bond (Hungary), | | | | | | | | |
2.13%, 09/22/2031(b) | | | 600,000 | | | | 431,095 | |
|
| |
7.63%, 03/29/2041(c) | | | 700,000 | | | | 703,242 | |
|
| |
Indonesia Government International Bond (Indonesia), | | | | | | | | |
8.50%, 10/12/2035(b) | | | 3,830,000 | | | | 4,496,168 | |
|
| |
6.63%, 02/17/2037(b) | | | 1,100,000 | | | | 1,142,350 | |
|
| |
6.75%, 01/15/2044(b) | | | 2,530,000 | | | | 2,617,661 | |
|
| |
See accompanying Notes to Financial Statements which are an integral part of the financial statements.
| | |
| 17 | | Invesco Multi-Asset Income Fund |
| | | | | | | | |
| | | Principal
Amount | | | Value | |
|
| |
Sovereign Debt–(continued) | | | | | | | | |
Ivory Coast Government International Bond (Ivory Coast), 6.38%, 03/03/2028(b) | | $ | 650,000 | | | $ | 593,125 | |
|
| |
Jamaica Government International Bond (Jamaica), 6.75%, 04/28/2028 | | | 1,600,000 | | | | 1,680,328 | |
|
| |
Jordan Government International Bond (Jordan), 6.13%, 01/29/2026(b) | | | 1,000,000 | | | | 959,825 | |
|
| |
Kazakhstan Government International Bond (Kazakhstan), | | | | | | | | |
3.88%, 10/14/2024(b) | | | 1,650,000 | | | | 1,642,954 | |
|
| |
5.13%, 07/21/2025(b) | | | 2,000,000 | | | | 2,049,834 | |
|
| |
4.88%, 10/14/2044(b) | | | 1,000,000 | | | | 768,741 | |
|
| |
6.50%, 07/21/2045(b) | | | 1,700,000 | | | | 1,512,674 | |
|
| |
KSA Sukuk Ltd. (Saudi Arabia), 4.30%, 01/19/2029(b) | | | 2,000,000 | | | | 1,917,832 | |
|
| |
Kuwait International Government Bond (Kuwait), 3.50%, 03/20/2027(b) | | | 800,000 | | | | 764,462 | |
|
| |
Malaysia Sukuk Global Bhd. (Malaysia), 3.18%, 04/27/2026(b) | | | 250,000 | | | | 239,364 | |
|
| |
Mexico Government International Bond (Mexico), | | | | | | | | |
4.13%, 01/21/2026 | | | 2,310,000 | | | | 2,229,944 | |
|
| |
4.28%, 08/14/2041 | | | 1,400,000 | | | | 1,016,525 | |
|
| |
Nigeria Government International Bond (Nigeria), 8.75%, 01/21/2031(b) | | | 2,550,000 | | | | 1,807,172 | |
|
| |
Oman Government International Bond (Oman), | | | | | | | | |
4.75%, 06/15/2026(b) | | | 3,310,000 | | | | 3,138,976 | |
|
| |
5.63%, 01/17/2028(b) | | | 1,000,000 | | | | 956,521 | |
|
| |
6.25%, 01/25/2031(b) | | | 1,000,000 | | | | 955,750 | |
|
| |
6.75%, 01/17/2048(b) | | | 2,854,000 | | | | 2,406,068 | |
|
| |
Pakistan Government International Bond (Pakistan), 8.25%, 04/15/2024(b) | | | 1,640,000 | | | | 702,576 | |
|
| |
Panama Government International Bond (Panama), | | | | | | | | |
7.13%, 01/29/2026 | | | 1,110,000 | | | | 1,164,607 | |
|
| |
3.88%, 03/17/2028(c) | | | 1,000,000 | | | | 908,638 | |
|
| |
6.70%, 01/26/2036(c) | | | 1,350,000 | | | | 1,317,415 | |
|
| |
4.50%, 04/01/2056 | | | 2,320,000 | | | | 1,529,584 | |
|
| |
Paraguay Government International Bond (Paraguay), 5.00%, 04/15/2026(b) | | | 1,000,000 | | | | 981,079 | |
|
| |
Perusahaan Penerbit SBSN Indonesia III (Indonesia), | | | | | | | | |
4.33%, 05/28/2025(b) | | | 300,000 | | | | 295,356 | |
|
| |
4.15%, 03/29/2027(b) | | | 294,000 | | | | 280,003 | |
|
| |
Peruvian Government International Bond (Peru), | | | | | | | | |
2.39%, 01/23/2026 | | | 770,000 | | | | 695,799 | |
|
| |
4.13%, 08/25/2027 | | | 1,226,000 | | | | 1,156,870 | |
|
| |
2.84%, 06/20/2030 | | | 500,000 | | | | 406,880 | |
|
| |
3.60%, 01/15/2072 | | | 650,000 | | | | 385,863 | |
|
| |
| | | | | | | | |
| | | Principal
Amount | | | Value | |
|
| |
Sovereign Debt–(continued) | | | | | | | | |
Philippine Government International Bond (Philippines), | | | | | | | | |
4.20%, 01/21/2024 | | $ | 100,000 | | | $ | 98,499 | |
|
| |
10.63%, 03/16/2025 | | | 2,144,000 | | | | 2,397,997 | |
|
| |
3.00%, 02/01/2028 | | | 1,000,000 | | | | 907,415 | |
|
| |
6.38%, 01/15/2032 | | | 2,000,000 | | | | 2,076,906 | |
|
| |
5.00%, 01/13/2037 | | | 2,000,000 | | | | 1,830,000 | |
|
| |
Qatar Government International Bond (Qatar), 5.10%, 04/23/2048(b) | | | 3,660,000 | | | | 3,415,786 | |
|
| |
RAK Capital (United Arab Emirates), 3.09%, 03/31/2025(b) | | | 743,000 | | | | 709,373 | |
|
| |
Republic of Poland Government International Bond (Poland), | | | | | | | | |
3.00%, 03/17/2023 | | | 599,000 | | | | 595,556 | |
|
| |
4.00%, 01/22/2024 | | | 3,595,000 | | | | 3,547,959 | |
|
| |
Republic of South Africa Government International Bond (South Africa), | | | | | | | | |
5.88%, 09/16/2025 | | | 200,000 | | | | 198,401 | |
|
| |
4.88%, 04/14/2026 | | | 1,540,000 | | | | 1,449,531 | |
|
| |
5.75%, 09/30/2049 | | | 5,853,000 | | | | 3,909,383 | |
|
| |
7.30%, 04/20/2052 | | | 400,000 | | | | 314,800 | |
|
| |
Romanian Government International Bond (Romania), | | | | | | | | |
4.38%, 08/22/2023(b) | | | 33,000 | | | | 32,785 | |
|
| |
3.00%, 02/27/2027(b) | | | 1,250,000 | | | | 1,077,402 | |
|
| |
3.00%, 02/14/2031(b) | | | 750,000 | | | | 557,693 | |
|
| |
5.13%, 06/15/2048(b) | | | 2,344,000 | | | | 1,644,021 | |
|
| |
4.00%, 02/14/2051(b) | | | 1,750,000 | | | | 1,031,579 | |
|
| |
Saudi Government International Bond (Saudi Arabia), | | | | | | | | |
4.00%, 04/17/2025(b) | | | 770,000 | | | | 751,974 | |
|
| |
3.25%, 10/26/2026(b) | | | 500,000 | | | | 470,250 | |
|
| |
4.38%, 04/16/2029(b) | | | 538,000 | | | | 514,635 | |
|
| |
4.50%, 10/26/2046(b) | | | 1,000,000 | | | | 798,764 | |
|
| |
5.00%, 04/17/2049(b) | | | 1,548,000 | | | | 1,320,953 | |
|
| |
5.25%, 01/16/2050(b) | | | 2,680,000 | | | | 2,379,194 | |
|
| |
3.45%, 02/02/2061(b) | | | 1,400,000 | | | | 901,320 | |
|
| |
Sharjah Sukuk Program Ltd. (United Arab Emirates), | | | | | | | | |
3.85%, 04/03/2026(b) | | | 600,000 | | | | 546,330 | |
|
| |
4.23%, 03/14/2028(b) | | | 1,019,000 | | | | 902,121 | |
|
| |
Sri Lanka Government International Bond (Sri Lanka), 6.83%, 07/18/2026(b)(h) | | | 903,000 | | | | 214,516 | |
|
| |
Turkey Government International Bond (Turkey), | | | | | | | | |
7.38%, 02/05/2025 | | | 527,000 | | | | 519,472 | |
|
| |
4.88%, 10/09/2026 | | | 326,000 | | | | 278,416 | |
|
| |
6.00%, 03/25/2027 | | | 1,890,000 | | | | 1,654,780 | |
|
| |
7.63%, 04/26/2029 | | | 2,430,000 | | | | 2,155,301 | |
|
| |
11.88%, 01/15/2030 | | | 1,920,000 | | | | 2,126,097 | |
|
| |
6.88%, 03/17/2036 | | | 1,218,000 | | | | 920,141 | |
|
| |
7.25%, 03/05/2038 | | | 1,170,000 | | | | 927,377 | |
|
| |
UAE International Government Bond (United Arab Emirates), 3.25%, 10/19/2061(b) | | | 3,600,000 | | | | 2,378,160 | |
|
| |
See accompanying Notes to Financial Statements which are an integral part of the financial statements.
| | |
| 18 | | Invesco Multi-Asset Income Fund |
| | | | | | | | |
| | | Principal
Amount | | | Value | |
|
| |
Sovereign Debt–(continued) | | | | | |
Ukraine Government International Bond (Ukraine), | | | | | | | | |
7.75%, 09/01/2025(b)(h) | | $ | 650,000 | | | $ | 138,593 | |
|
| |
7.75%, 09/01/2026(b)(h) | | | 650,000 | | | | 111,800 | |
|
| |
7.75%, 09/01/2028(b)(h) | | | 4,450,000 | | | | 756,500 | |
|
| |
7.75%, 09/01/2029(b)(h) | | �� | 1,090,000 | | | | 196,153 | |
|
| |
9.75%, 11/01/2030(b)(h) | | | 900,000 | | | | 169,524 | |
|
| |
Uruguay Government International Bond (Uruguay), 4.50%, 08/14/2024 | | | 1,477,281 | | | | 1,476,730 | |
|
| |
| | | | | | | 128,407,605 | |
|
| |
| |
Specialized Consumer Services–0.01% | | | | | |
WW International, Inc., 4.50%, 04/15/2029(b) | | | 308,000 | | | | 169,773 | |
|
| |
| | |
Specialized Finance–0.01% | | | | | | | | |
Blackstone Private Credit Fund, 3.25%, 03/15/2027 | | | 75,000 | | | | 62,289 | |
|
| |
| | |
Specialized REITs–0.13% | | | | | | | | |
American Tower Corp., | | | | | | | | |
1.30%, 09/15/2025 | | | 134,000 | | | | 118,126 | |
|
| |
3.65%, 03/15/2027 | | | 105,000 | | | | 95,049 | |
|
| |
3.55%, 07/15/2027 | | | 105,000 | | | | 93,914 | |
|
| |
EPR Properties, 4.75%, 12/15/2026 | | | 75,000 | | | | 64,650 | |
|
| |
Iron Mountain, Inc., | | | | | | | | |
4.88%, 09/15/2029(b) | | | 313,000 | | | | 269,923 | |
|
| |
5.25%, 07/15/2030(b) | | | 519,000 | | | | 448,578 | |
|
| |
4.50%, 02/15/2031(b) | | | 562,000 | | | | 456,277 | |
|
| |
| | | | | | | 1,546,517 | |
|
| |
| | |
Specialty Chemicals–0.16% | | | | | | | | |
Avient Corp., 5.75%, 05/15/2025(b) | | | 377,000 | | | | 369,501 | |
|
| |
PPG Industries, Inc., 1.20%, 03/15/2026 | | | 67,000 | | | | 58,083 | |
|
| |
Rayonier A.M. Products, Inc., 7.63%, 01/15/2026(b) | | | 871,000 | | | | 758,310 | |
|
| |
SCIL IV LLC/SCIL USA Holdings LLC, 5.38%, 11/01/2026(b)(c) | | | 832,000 | | | | 663,437 | |
|
| |
| | | | | | | 1,849,331 | |
|
| |
| | |
Specialty Stores–0.15% | | | | | | | | |
Bath & Body Works, Inc., 6.75%, 07/01/2036 | | | 175,000 | | | | 145,022 | |
|
| |
LSF9 Atlantis Holdings LLC/Victra Finance Corp., 7.75%, 02/15/2026(b) | | | 377,000 | | | | 341,132 | |
|
| |
Michaels Cos., Inc. (The), 5.25%, 05/01/2028(b) | | | 427,000 | | | | 304,267 | |
|
| |
Sally Holdings LLC/Sally Capital, Inc., 5.63%, 12/01/2025(c) | | | 363,000 | | | | 343,017 | |
|
| |
Staples, Inc., 7.50%, 04/15/2026(b) | | | 786,000 | | | | 684,244 | |
|
| |
| | | | | | | 1,817,682 | |
|
| |
| | |
Steel–0.01% | | | | | | | | |
ArcelorMittal S.A. (Luxembourg), 4.55%, 03/11/2026 | | | 134,000 | | | | 127,808 | |
|
| |
| | | | | | | | |
| | | Principal
Amount | | | Value | |
|
| |
Systems Software–0.11% | | | | | | | | |
NortonLifeLock, Inc., 5.00%, 04/15/2025(b) | | $ | 678,000 | | | $ | 659,477 | |
|
| |
Rackspace Technology Global, Inc., 3.50%, 02/15/2028(b) | | | 300,000 | | | | 198,657 | |
|
| |
Veritas US, Inc./Veritas Bermuda Ltd., 7.50%, 09/01/2025(b)(c) | | | 502,000 | | | | 423,550 | |
|
| |
| | | | | | | 1,281,684 | |
|
| |
| |
Technology Distributors–0.03% | | | | | |
Avnet, Inc., 4.63%, 04/15/2026 | | | 75,000 | | | | 71,185 | |
|
| |
Tempo Acquisition LLC/Tempo Acquisition Finance Corp., 5.75%, 06/01/2025(b) | | | 260,000 | | | | 255,938 | |
|
| |
| | | | | | | 327,123 | |
|
| |
|
Technology Hardware, Storage & Peripherals–0.27% | |
Apple, Inc., | | | | | | | | |
3.25%, 02/23/2026 | | | 150,000 | | | | 143,145 | |
|
| |
3.20%, 05/11/2027 | | | 135,000 | | | | 126,528 | |
|
| |
HP, Inc., 1.45%, 06/17/2026 | | | 150,000 | | | | 128,245 | |
|
| |
Seagate HDD Cayman, | | | | | | | | |
4.75%, 01/01/2025 | | | 249,000 | | | | 240,671 | |
|
| |
3.13%, 07/15/2029 | | | 622,000 | | | | 460,818 | |
|
| |
4.13%, 01/15/2031 | | | 685,000 | | | | 516,106 | |
|
| |
Xerox Corp., 6.75%, 12/15/2039 | | | 513,000 | | | | 378,836 | |
|
| |
Xerox Holdings Corp., | | | | | | | | |
5.00%, 08/15/2025(b) | | | 476,000 | | | | 430,859 | |
|
| |
5.50%, 08/15/2028(b)(c) | | | 930,000 | | | | 737,434 | |
|
| |
| | | | | | | 3,162,642 | |
|
| |
|
Thrifts & Mortgage Finance–0.22% | |
Enact Holdings, Inc., 6.50%, 08/15/2025(b) | | | 1,356,000 | | | | 1,338,928 | |
|
| |
Home Point Capital, Inc., 5.00%, 02/01/2026(b) | | | 466,000 | | | | 276,068 | |
|
| |
NMI Holdings, Inc., 7.38%, 06/01/2025(b) | | | 431,000 | | | | 431,170 | |
|
| |
PennyMac Financial Services, Inc., | | | | | | | | |
5.38%, 10/15/2025(b) | | | 362,000 | | | | 328,450 | |
|
| |
5.75%, 09/15/2031(b) | | | 280,000 | | | | 211,353 | |
|
| |
| | | | | | | 2,585,969 | |
|
| |
| | |
Tires & Rubber–0.09% | | | | | | | | |
FXI Holdings, Inc., 12.25%, 11/15/2026(b) | | | 512,000 | | | | 445,286 | |
|
| |
Goodyear Tire & Rubber Co. (The), 9.50%, 05/31/2025(c) | | | 567,000 | | | | 589,946 | |
|
| |
| | | | | | | 1,035,232 | |
|
| |
| | |
Tobacco–0.04% | | | | | | | | |
Altria Group, Inc., 4.40%, 02/14/2026 | | | 134,000 | | | | 128,678 | |
|
| |
B.A.T Capital Corp. (United Kingdom), 3.22%, 09/06/2026 | | | 134,000 | | | | 119,201 | |
|
| |
Vector Group Ltd., 5.75%, 02/01/2029(b) | | | 317,000 | | | | 278,148 | |
|
| |
| | | | | | | 526,027 | |
|
| |
See accompanying Notes to Financial Statements which are an integral part of the financial statements.
| | |
| 19 | | Invesco Multi-Asset Income Fund |
| | | | | | | | |
| | | Principal
Amount | | | Value | |
|
| |
Trading Companies & Distributors–0.04% | |
Fortress Transportation and Infrastructure Investors LLC, 6.50%, 10/01/2025(b) | | $ | 540,000 | | | $ | 519,413 | |
|
| |
| | |
Trucking–0.04% | | | | | | | | |
Hertz Corp. (The), 5.00%, 12/01/2029(b) | | | 253,000 | | | | 201,103 | |
|
| |
Ryder System, Inc., 3.65%, 03/18/2024 | | | 150,000 | | | | 146,510 | |
|
| |
XPO Logistics, Inc., 6.25%, 05/01/2025(b) | | | 154,000 | | | | 155,772 | |
|
| |
| | | | | | | 503,385 | |
|
| |
|
Wireless Telecommunication Services–0.12% | |
Sprint Corp., | | | | | | | | |
7.63%, 02/15/2025 | | | 453,000 | | | | 466,069 | |
|
| |
7.63%, 03/01/2026(c) | | | 940,000 | | | | 982,662 | |
|
| |
| | | | | | | 1,448,731 | |
|
| |
Total U.S. Dollar Denominated Bonds & Notes (Cost $452,656,108) | | | | 378,638,189 | |
|
| |
| |
Equity Linked Notes–27.68% | | | | | |
Diversified Banks–23.75% | | | | | |
Bank of Montreal (Consumer Discretionary Select Sector SPDR Fund) (Canada), | | | | | | | | |
11.42%, 11/02/2022 | | | 9,824,000 | | | | 10,247,855 | |
|
| |
18.26%, 11/15/2022(b) | | | 11,370,000 | | | | 11,585,163 | |
|
| |
Bank of Montreal (Materials Select Sector SPDR Fund) (Canada), 16.41%, 12/09/2022(b) | | | 6,933,000 | | | | 6,761,128 | |
|
| |
Bank of Montreal (Utilities Select Sector SPDR Fund) (Canada), 15.03%, 12/09/2022(b) | | | 8,338,000 | | | | 8,365,588 | |
|
| |
BNP Paribas Issuance B.V. (Financial Select Sector SPDR Fund) (France), 21.92%, 11/16/2022(b) | | | 10,323,000 | | | | 10,909,537 | |
|
| |
BNP Paribas Issuance B.V. (Technology Select Sector SPDR Fund) (France), 16.56%, 12/12/2022(b) | | | 14,659,000 | | | | 14,790,572 | |
|
| |
BNP Paribas S.A. (Technology Select Sector SPDR Fund) (France), 19.31%, 11/17/2022(b) | | | 15,090,000 | | | | 16,088,509 | |
|
| |
Canadian Imperial Bank of Commerce (Consumer Discretionary Select Sector SPDR Fund) (Canada), 15.25%, 12/02/2022(b) | | | 11,160,000 | | | | 11,475,766 | |
|
| |
Canadian Imperial Bank of Commerce (Consumer Staples Select Sector SPDR Fund) (Canada), | | | | | | | | |
15.15%, 11/18/2022(b) | | | 9,745,000 | | | | 10,094,724 | |
|
| |
14.45%, 12/13/2022(b) | | | 10,098,000 | | | | 9,970,245 | |
|
| |
Canadian Imperial Bank of Commerce (Technology Select Sector SPDR Fund) (Canada), 21.52%, 11/14/2022(b) | | | 15,031,000 | | | | 15,200,985 | |
|
| |
Citigroup Global Markets Holdings, Inc. (Health Care Select Sector SPDR Fund), 17.13%, 11/10/2022(b) | | | 13,867,000 | | | | 14,348,092 | |
|
| |
| | | | | | | | |
| | | Principal
Amount | | | Value | |
|
| |
Diversified Banks–(continued) | | | | | |
Citigroup Global Markets Holdings, Inc. (Technology Select Sector SPDR Fund), 20.29%, 12/01/2022(b) | | $ | 15,211,000 | | | $ | 15,698,919 | |
|
| |
Citigroup, Inc. (Technology Select Sector SPDR Fund), 21.48%, 11/01/2022 | | | 16,050,000 | | | | 16,189,256 | |
|
| |
J.P. Morgan Structured Products B.V. (Consumer Discretionary Select Sector SPDR Fund), 17.20%, 12/14/2022 | | | 11,114,000 | | | | 11,114,000 | |
|
| |
J.P. Morgan Structured Products B.V. (Energy Select Sector SPDR Fund), 20.62%, 11/08/2022(b) | | | 13,500,000 | | | | 15,058,368 | |
|
| |
JPMorgan Chase & Co. (Consumer Discretionary Select Sector SPDR Fund), 18.03%, 11/03/2022(b) | | | 10,980,000 | | | | 10,581,712 | |
|
| |
JPMorgan Chase & Co. (Technology Select Sector SPDR Fund), 18.35%, 11/21/2022(b) | | | 14,809,000 | | | | 15,789,167 | |
|
| |
Royal Bank of Canada (Communication Services Select Sector SPDR Fund) (Canada), Conv., 23.23%, 11/22/2022(b) | | | 11,460,000 | | | | 11,226,732 | |
|
| |
Royal Bank of Canada (iShares Dow Jones US Real Estate) (Canada), 19.06%, 11/08/2022(b) | | | 7,967,000 | | | | 8,172,819 | |
|
| |
Societe Generale S.A. (Communication Services Select Sector SPDR Fund) (France), 23.67%, 11/07/2022(b) | | | 11,892,000 | | | | 11,826,482 | |
|
| |
Societe Generale S.A. (Health Care Select Sector SPDR Fund) (France), 12.70%, 12/07/2022(b) | | | 14,184,000 | | | | 14,363,779 | |
|
| |
Societe Generale S.A. (Industrial Select Sector SPDR Fund) (France), 18.54%, 11/23/2022(b) | | | 10,753,000 | | | | 11,222,203 | |
|
| |
| | | | | | | 281,081,601 | |
|
| |
|
Investment Banking & Brokerage–3.93% | |
Goldman Sachs Group, Inc. (The) (Financial Select Sector SPDR Fund), 20.37%, 11/09/2022(b) | | | 10,355,000 | | | | 10,752,652 | |
|
| |
Goldman Sachs International (Financial Select Sector SPDR Fund), 16.95%, 12/05/2022(b) | | | 10,080,000 | | | | 10,355,507 | |
|
| |
Goldman Sachs International (Health Care Select Sector SPDR Fund), 17.83%, 11/16/2022(b) | | | 13,709,000 | | | | 14,354,468 | |
|
| |
Goldman Sachs International (Industrial Select Sector SPDR Fund), 14.58%, 12/08/2022(b) | | | 10,801,000 | | | | 10,982,216 | |
|
| |
| | | | | | | 46,444,843 | |
|
| |
Total Equity Linked Notes
(Cost $315,677,849) | | | | 327,526,444 | |
|
| |
See accompanying Notes to Financial Statements which are an integral part of the financial statements.
| | |
| 20 | | Invesco Multi-Asset Income Fund |
| | | | | | | | |
| | | Principal
Amount | | | Value | |
|
| |
U.S. Treasury Securities–20.84% | |
U.S. Treasury Bills–0.09% | | | | | | | | |
1.45% - 2.69%, 11/17/2022(j)(k) | | $ | 739,000 | | | $ | 738,374 | |
|
| |
3.71% - 4.17%, 03/09/2023(j)(k) | | | 347,000 | | | | 341,843 | |
|
| |
| | | | | | | 1,080,217 | |
|
| |
| | |
U.S. Treasury Bonds–17.88% | | | | | | | | |
1.88%, 11/15/2051 | | | 347,200,000 | | | | 211,636,031 | |
|
| |
U.S. Treasury Notes–2.87% | | | | | | | | |
0.13%, 01/31/2023 | | | 6,950,000 | | | | 6,882,079 | |
|
| |
0.75%, 12/31/2023 | | | 6,000,000 | | | | 5,736,797 | |
|
| |
1.13%, 01/15/2025 | | | 15,250,000 | | | | 14,179,521 | |
|
| |
1.25%, 12/31/2026 | | | 8,100,000 | | | | 7,157,742 | |
|
| |
| | | | | | | 33,956,139 | |
|
| |
Total U.S. Treasury Securities
(Cost $347,732,325) | | | | 246,672,387 | |
|
| |
| | |
| | | Shares | | | | |
Preferred Stocks–4.73% | | | | | |
Alternative Carriers–0.05% | | | | | |
Qwest Corp., 6.50%, Pfd. | | | 20,526 | | | | 352,021 | |
|
| |
Qwest Corp., 6.75%, Pfd. | | | 13,859 | | | | 249,462 | |
|
| |
| | | | | | | 601,483 | |
|
| |
|
Apparel, Accessories & Luxury Goods–0.00% | |
Fossil Group, Inc., 7.00%, Pfd. | | | 3,150 | | | | 39,784 | |
|
| |
|
Asset Management & Custody Banks–0.14% | |
Affiliated Managers Group, Inc., 5.88%, Pfd. | | | 6,316 | | | | 130,552 | |
|
| |
Affiliated Managers Group, Inc., 4.75%, Pfd. | | | 5,772 | | | | 98,643 | |
|
| |
Affiliated Managers Group, Inc., 4.20%, Pfd. | | | 4,181 | | | | 62,046 | |
|
| |
Apollo Asset Management, Inc., 6.38%, Series A, Pfd. | | | 5,775 | | | | 125,144 | |
|
| |
Apollo Asset Management, Inc., 6.38%, Series B, Pfd. | | | 6,299 | | | | 137,318 | |
|
| |
Northern Trust Corp., 4.70%, Series E, Pfd. | | | 8,400 | | | | 168,168 | |
|
| |
Oaktree Capital Group LLC, 6.63%, Series A, Pfd. | | | 3,960 | | | | 93,852 | |
|
| |
Oaktree Capital Group LLC, 6.55%, Series B, Pfd. | | | 5,511 | | | | 127,635 | |
|
| |
Prospect Capital Corp., 5.35%, Series A, Pfd. | | | 3,150 | | | | 51,503 | |
|
| |
State Street Corp., 5.35%, Series G, Pfd.(e) | | | 10,499 | | | | 252,501 | |
|
| |
State Street Corp., 5.90%, Series D, Pfd.(e) | | | 15,749 | | | | 383,803 | |
|
| |
| | | | | | | 1,631,165 | |
|
| |
| |
Automobile Manufacturers–0.09% | | | | | |
Ford Motor Co., 6.20%, Pfd. | | | 16,239 | | | | 370,899 | |
|
| |
Ford Motor Co., 6.00%, Pfd. | | | 17,322 | | | | 382,816 | |
|
| |
Ford Motor Co., 6.50%, Pfd. | | | 11,592 | | | | 264,298 | |
|
| |
| | | | | | | 1,018,013 | |
|
| |
| |
Consumer Finance–0.15% | | | | | |
Capital One Financial Corp., 5.00%, Series I, Pfd. | | | 31,330 | | | | 580,545 | |
|
| |
| | | | | | | | |
| | | Shares | | | Value | |
|
| |
Consumer Finance–(continued) | | | | | |
Capital One Financial Corp., 4.80%, Series J, Pfd. | | | 26,109 | | | $ | 454,297 | |
|
| |
Capital One Financial Corp., 4.63%, Series K, Pfd. | | | 3,063 | | | | 51,121 | |
|
| |
Capital One Financial Corp., 4.38%, Series L, Pfd. | | | 14,099 | | | | 224,174 | |
|
| |
Capital One Financial Corp., 4.25%, Series N, Pfd. | | | 8,877 | | | | 140,257 | |
|
| |
Navient Corp., 6.00%, Pfd. | | | 6,300 | | | | 116,172 | |
|
| |
Synchrony Financial, 5.63%, Series A, Pfd. | | | 15,749 | | | | 267,260 | |
|
| |
| | | | | | | 1,833,826 | |
|
| |
| | |
Department Stores–0.01% | | | | | | | | |
Dillard’s Capital Trust I, 7.50%, Pfd. | | | 4,200 | | | | 108,444 | |
|
| |
| | |
Diversified Banks–1.12% | | | | | | | | |
Bank of America Corp., 6.00%, Series GG, Pfd.(c) | | | 32,465 | | | | 772,667 | |
|
| |
Bank of America Corp., 5.88%, Series HH, Pfd. | | | 21,937 | | | | 508,719 | |
|
| |
Bank of America Corp., 5.38%, Series KK, Pfd. | | | 34,938 | | | | 747,673 | |
|
| |
Bank of America Corp., 5.00%, Series LL, Pfd. | | | 33,706 | | | | 672,098 | |
|
| |
Bank of America Corp., 4.38%, Series NN, Pfd.(c) | | | 29,546 | | | | 514,396 | |
|
| |
Bank of America Corp., 4.13%, Series PP, Pfd.(c) | | | 27,876 | | | | 454,100 | |
|
| |
Bank of America Corp., 4.25%, Series QQ, Pfd. | | | 34,552 | | | | 576,327 | |
|
| |
Citigroup, Inc., 7.13%, Series J, Pfd.(e) | | | 19,845 | | | | 495,331 | |
|
| |
Citigroup, Inc., 6.88%, Series K, Pfd.(e) | | | 31,498 | | | | 795,010 | |
|
| |
JPMorgan Chase & Co., 5.75%, Series DD, Pfd. | | | 35,671 | | | | 826,497 | |
|
| |
JPMorgan Chase & Co., 6.00%, Series EE, Pfd. | | | 38,950 | | | | 950,380 | |
|
| |
JPMorgan Chase & Co., 4.75%, Series GG, Pfd. | | | 18,846 | | | | 372,397 | |
|
| |
JPMorgan Chase & Co., 4.55%, Series JJ, Pfd. | | | 31,723 | | | | 577,676 | |
|
| |
JPMorgan Chase & Co., 4.63%, Series LL, Pfd. | | | 38,319 | | | | 710,434 | |
|
| |
JPMorgan Chase & Co., 4.20%, Series MM, Pfd. | | | 42,177 | | | | 725,866 | |
|
| |
U.S. Bancorp, 5.50%, Series K, Pfd. | | | 12,074 | | | | 272,993 | |
|
| |
U.S. Bancorp, 3.75%, Series L, Pfd. | | | 10,499 | | | | 158,850 | |
|
| |
U.S. Bancorp, 4.00%, Series M, Pfd.(c) | | | 15,749 | | | | 254,819 | |
|
| |
U.S. Bancorp, 4.50%, Series O, Pfd. | | | 9,450 | | | | 174,825 | |
|
| |
Wells Fargo & Co., 5.63%, Series Y, Pfd.(c) | | | 14,489 | | | | 309,050 | |
|
| |
Wells Fargo & Co., 6.63%, Series R, Pfd.(e) | | | 17,639 | | | | 441,151 | |
|
| |
Wells Fargo & Co., 4.75%, Series Z, Pfd. | | | 42,260 | | | | 760,680 | |
|
| |
Wells Fargo & Co., 4.70%, Series AA, Pfd. | | | 24,569 | | | | 441,014 | |
|
| |
Wells Fargo & Co., 4.38%, Series CC, Pfd. | | | 22,049 | | | | 365,572 | |
|
| |
Wells Fargo & Co., 4.25%, Series DD, Pfd. | | | 26,249 | | | | 421,297 | |
|
| |
| | | | | | | 13,299,822 | |
|
| |
See accompanying Notes to Financial Statements which are an integral part of the financial statements.
| | |
| 21 | | Invesco Multi-Asset Income Fund |
| | | | | | | | |
| | | Shares | | | Value | |
|
| |
Diversified Chemicals–0.01% | | | | | | | | |
EI du Pont de Nemours and Co., 4.50%, Series B, Pfd. | | | 878 | | | $ | 82,348 | |
|
| |
| | |
Diversified REITs–0.02% | | | | | | | | |
Global Net Lease, Inc., 7.25%, Series A, Pfd. | | | 3,618 | | | | 77,208 | |
|
| |
Global Net Lease, Inc., 6.88%, Series B, Pfd. | | | 2,409 | | | | 48,493 | |
|
| |
iStar, Inc., 8.00%, Series D, Pfd. | | | 2,100 | | | | 51,219 | |
|
| |
iStar, Inc., 7.50%, Series I, Pfd. | | | 2,625 | | | | 58,511 | |
|
| |
| | | | | | | 235,431 | |
|
| |
| | |
Electric Utilities–0.30% | | | | | | | | |
BIP Bermuda Holdings I Ltd., 5.13%, Pfd. | | | 5,970 | | | | 104,177 | |
|
| |
Brookfield Infrastructure Finance ULC, 5.00%, Pfd. | | | 5,131 | | | | 81,686 | |
|
| |
Duke Energy Corp., 5.63%, Pfd. | | | 10,499 | | | | 248,721 | |
|
| |
Duke Energy Corp., 5.75%, Series A, Pfd. | | | 20,999 | | | | 496,206 | |
|
| |
Entergy Arkansas LLC, 4.88%, Pfd. | | | 8,488 | | | | 177,229 | |
|
| |
Entergy Louisiana LLC, 4.88%, Pfd. | | | 5,590 | | | | 120,744 | |
|
| |
Entergy Mississippi LLC, 4.90%, Pfd. | | | 5,382 | | | | 112,968 | |
|
| |
Entergy New Orleans LLC, 5.50%, Pfd. | | | 2,590 | | | | 56,980 | |
|
| |
Georgia Power Co., 5.00%, Series 2017-A, Pfd. | | | 5,456 | | | | 119,650 | |
|
| |
National Rural Utilities Cooperative Finance Corp., 5.50%, Pfd. | | | 5,250 | | | | 119,963 | |
|
| |
NextEra Energy Capital Holdings, Inc., 5.65%, Series N, Pfd.(c) | | | 14,437 | | | | 347,787 | |
|
| |
Pacific Gas and Electric Co., 6.00%, Series A, Pfd. | | | 2,211 | | | | 43,999 | |
|
| |
SCE Trust II, 5.10%, Pfd. | | | 4,115 | | | | 77,156 | |
|
| |
SCE Trust III, 5.75%, Series H, Pfd.(e) | | | 5,827 | | | | 112,694 | |
|
| |
SCE Trust IV, 5.38%, Series J, Pfd.(e) | | | 6,825 | | | | 122,441 | |
|
| |
SCE Trust V, 5.45%, Series K, Pfd.(e) | | | 6,356 | | | | 121,908 | |
|
| |
SCE Trust VI, 5.00%, Pfd. | | | 10,422 | | | | 178,737 | |
|
| |
Southern Co. (The), 5.25%, Pfd. | | | 9,430 | | | | 201,519 | |
|
| |
Southern Co. (The), 4.95%, Series 2020, Pfd. | | | 21,238 | | | | 406,071 | |
|
| |
Southern Co. (The), 4.20%, Series C, Pfd. | | | 16,078 | | | | 286,992 | |
|
| |
| | | | | | | 3,537,628 | |
|
| |
| | |
Gas Utilities–0.02% | | | | | | | | |
South Jersey Industries, Inc., 5.63%, Pfd. | | | 4,200 | | | | 73,542 | |
|
| |
Spire, Inc., 5.90%, Series A, Pfd. | | | 5,250 | | | | 120,225 | |
|
| |
| | | | | | | 193,767 | |
|
| |
| | |
Health Care REITs–0.01% | | | | | | | | |
Diversified Healthcare Trust, 5.63%, Pfd. | | | 12,719 | | | | 155,235 | |
|
| |
|
Integrated Telecommunication Services–0.18% | |
AT&T, Inc., 5.35%, Pfd. | | | 27,771 | | | | 596,521 | |
|
| |
AT&T, Inc., 5.63%, Pfd. | | | 17,324 | | | | 387,538 | |
|
| |
AT&T, Inc., 5.00%, Series A, Pfd. | | | 25,199 | | | | 473,489 | |
|
| |
AT&T, Inc., 4.75%, Series C, Pfd. | | | 36,747 | | | | 636,458 | |
|
| |
| | | | | | | 2,094,006 | |
|
| |
| | | | | | | | |
| | | Shares | | | Value | |
|
| |
Internet & Direct Marketing Retail–0.05% | |
Qurate Retail, Inc., 8.00%, Pfd. | | | 6,486 | | | $ | 312,755 | |
|
| |
QVC, Inc., 6.38%, Pfd. | | | 5,364 | | | | 84,751 | |
|
| |
QVC, Inc., 6.25%, Pfd. | | | 10,245 | | | | 159,925 | |
|
| |
| | | | | | | 557,431 | |
|
| |
|
Investment Banking & Brokerage–0.39% | |
Brookfield Finance I (UK) PLC, 4.50%, Pfd. | | | 4,637 | | | | 71,503 | |
|
| |
Brookfield Finance, Inc., 4.63%, Series 50, Pfd. | | | 8,354 | | | | 140,180 | |
|
| |
Charles Schwab Corp. (The), 5.95%, Series D, Pfd. | | | 15,749 | | | | 362,699 | |
|
| |
Charles Schwab Corp. (The), 4.45%, Series J, Pfd. | | | 12,600 | | | | 231,462 | |
|
| |
Goldman Sachs Group, Inc. (The), 6.38%, Series K, Pfd.(e) | | | 14,699 | | | | 363,800 | |
|
| |
Morgan Stanley, 5.85%, Series K, Pfd.(e) | | | 21,300 | | | | 487,983 | |
|
| |
Morgan Stanley, 7.13%, Series E, Pfd.(e) | | | 18,371 | | | | 460,194 | |
|
| |
Morgan Stanley, 6.88%, Series F, Pfd.(e) | | | 18,105 | | | | 452,987 | |
|
| |
Morgan Stanley, 6.38%, Series I, Pfd.(e) | | | 21,300 | | | | 517,377 | |
|
| |
Morgan Stanley, 4.88%, Series L, Pfd. | | | 10,650 | | | | 206,823 | |
|
| |
Morgan Stanley, 4.25%, Series O, Pfd. | | | 27,690 | | | | 450,793 | |
|
| |
Morgan Stanley, 6.50%, Series P, Pfd. | | | 19,497 | | | | 483,526 | |
|
| |
Stifel Financial Corp., 5.20%, Pfd. | | | 4,736 | | | | 96,993 | |
|
| |
Stifel Financial Corp., 6.25%, Series B, Pfd. | | | 3,314 | | | | 75,162 | |
|
| |
Stifel Financial Corp., 6.13%, Series C, Pfd. | | | 4,749 | | | | 106,235 | |
|
| |
Stifel Financial Corp., 4.50%, Series D, Pfd. | | | 6,315 | | | | 102,240 | |
|
| |
| | | | | | | 4,609,957 | |
|
| |
| | |
Leisure Products–0.02% | | | | | | | | |
Brunswick Corp., 6.50%, Pfd. | | | 3,264 | | | | 79,576 | |
|
| |
Brunswick Corp., 6.63%, Pfd. | | | 3,092 | | | | 79,464 | |
|
| |
Brunswick Corp., 6.38%, Pfd. | | | 4,961 | | | | 113,260 | |
|
| |
| | | | | | | 272,300 | |
|
| |
| | |
Life & Health Insurance–0.38% | | | | | | | | |
AEGON Funding Co. LLC, 5.10%, Pfd. | | | 19,424 | | | | 378,768 | |
|
| |
American Equity Investment Life Holding Co., 5.95%, Series A, Pfd.(e) | | | 8,400 | | | | 189,252 | |
|
| |
American Equity Investment Life Holding Co., 6.63%, Series B, Pfd.(e) | | | 6,300 | | | | 145,908 | |
|
| |
Athene Holding Ltd., 6.35%, Series A, Pfd.(e) | | | 18,111 | | | | 431,223 | |
|
| |
Athene Holding Ltd., 5.63%, Series B, Pfd. | | | 7,244 | | | | 148,864 | |
|
| |
Athene Holding Ltd., 6.38%, Series C, Pfd.(e) | | | 12,600 | | | | 314,118 | |
|
| |
Athene Holding Ltd., 4.88%, Series D, Pfd. | | | 12,074 | | | | 207,794 | |
|
| |
Brighthouse Financial, Inc., 6.25%, Pfd. | | | 7,875 | | | | 169,312 | |
|
| |
Brighthouse Financial, Inc., 6.60%, Series A, Pfd. | | | 8,924 | | | | 200,701 | |
|
| |
Brighthouse Financial, Inc., 6.75%, Series B, Pfd. | | | 8,452 | | | | 191,776 | |
|
| |
See accompanying Notes to Financial Statements which are an integral part of the financial statements.
| | |
| 22 | | Invesco Multi-Asset Income Fund |
| | | | | | | | |
| | | Shares | | | Value | |
|
| |
Life & Health Insurance–(continued) | |
Brighthouse Financial, Inc., 5.38%, Series C, Pfd. | | | 12,074 | | | $ | 216,849 | |
|
| |
Brighthouse Financial, Inc., 4.63%, Series D, Pfd. | | | 7,349 | | | | 112,293 | |
|
| |
CNO Financial Group, Inc., 5.13%, Pfd. | | | 3,150 | | | | 57,330 | |
|
| |
Globe Life, Inc., 4.25%, Pfd. | | | 6,825 | | | | 118,619 | |
|
| |
MetLife, Inc., 5.63%, Series E, Pfd. | | | 16,904 | | | | 393,018 | |
|
| |
MetLife, Inc., 4.75%, Series F, Pfd. | | | 20,999 | | | | 412,840 | |
|
| |
Prudential Financial, Inc., 5.63%, Pfd. | | | 12,430 | | | | 285,393 | |
|
| |
Prudential Financial, Inc., 4.13%, Pfd.(c) | | | 11,000 | | | | 203,775 | |
|
| |
Prudential Financial, Inc., 5.95%, Pfd. | | | 5,319 | | | | 127,496 | |
|
| |
Unum Group, 6.25%, Pfd. | | | 6,300 | | | | 141,687 | |
|
| |
| | | | | | | 4,447,016 | |
|
| |
| | |
Multi-line Insurance–0.04% | | | | | | | | |
American International Group, Inc., 5.85%, Series A, Pfd. | | | 10,499 | | | | 230,978 | |
|
| |
Assurant, Inc., 5.25%, Pfd. | | | 5,250 | | | | 98,858 | |
|
| |
Hartford Financial Services Group, Inc. (The), 6.00%, Series G, Pfd. | | | 7,245 | | | | 177,792 | |
|
| |
| | | | | | | 507,628 | |
|
| |
| | |
Multi-Utilities–0.15% | | | | | | | | |
Algonquin Power & Utilities Corp., 6.88%, Pfd.(e) | | | 6,037 | | | | 135,531 | |
|
| |
Algonquin Power & Utilities Corp., 6.20%, Series 19-A, Pfd.(e) | | | 7,350 | | | | 166,625 | |
|
| |
Brookfield Infrastructure Partners L.P., 5.13%, Series 13, Pfd. | | | 4,584 | | | | 73,252 | |
|
| |
Brookfield Infrastructure Partners L.P., 5.00%, Series 14, Pfd. | | | 4,177 | | | | 64,535 | |
|
| |
CMS Energy Corp., 5.63%, Pfd. | | | 4,298 | | | | 92,966 | |
|
| |
CMS Energy Corp., 5.88%, Pfd.(l) | | | 4,516 | | | | 98,313 | |
|
| |
CMS Energy Corp., 5.88%, Pfd.(l) | | | 13,945 | | | | 303,862 | |
|
| |
CMS Energy Corp., 4.20%, Series C, Pfd. | | | 5,556 | | | | 91,396 | |
|
| |
DTE Energy Co., 4.38%, Series G, Pfd. | | | 4,301 | | | | 74,321 | |
|
| |
DTE Energy Co., 4.38%, Pfd. | | | 6,269 | | | | 107,701 | |
|
| |
NiSource, Inc., 6.50%, Series B, Pfd.(e) | | | 10,499 | | | | 259,430 | |
|
| |
Sempra Energy, 5.75%, Pfd. | | | 15,907 | | | | 345,500 | |
|
| |
| | | | | | | 1,813,432 | |
|
| |
| | |
Office REITs–0.06% | | | | | | | | |
Hudson Pacific Properties, Inc., 4.75%, Series C, Pfd. | | | 8,925 | | | | 113,437 | |
|
| |
Office Properties Income Trust, 6.38%, Pfd. | | | 3,402 | | | | 59,161 | |
|
| |
SL Green Realty Corp., 6.50%, Series I, Pfd. | | | 4,830 | | | | 94,185 | |
|
| |
Vornado Realty Trust, 5.40%, Series L, Pfd. | | | 5,630 | | | | 92,782 | |
|
| |
Vornado Realty Trust, 5.25%, Series M, Pfd. | | | 7,441 | | | | 119,205 | |
|
| |
Vornado Realty Trust, 5.25%, Series N, Pfd. | | | 6,287 | | | | 97,511 | |
|
| |
Vornado Realty Trust, 4.45%, Series O, Pfd. | | | 6,287 | | | | 86,258 | |
|
| |
| | | | | | | 662,539 | |
|
| |
| |
Office Services & Supplies–0.01% | | | | | |
Pitney Bowes, Inc., 6.70%, Pfd. | | | 8,925 | | | | 145,120 | |
|
| |
| | | | | | | | |
| | | Shares | | | Value | |
|
| |
Oil & Gas Storage & Transportation–0.04% | |
DCP Midstream L.P., 7.95%, Series C, Pfd.(e) | | | 2,310 | | | $ | 54,724 | |
|
| |
Energy Transfer L.P., 7.60%, Series E, Pfd.(e) | | | 16,799 | | | | 386,881 | |
|
| |
| | | | | | | 441,605 | |
|
| |
|
Other Diversified Financial Services–0.09% | |
Brookfield BRP Holdings Canada, Inc., 4.63%, Pfd. | | | 7,262 | | | | 105,807 | |
|
| |
Brookfield BRP Holdings Canada, Inc., 4.88%, Pfd. | | | 5,384 | | | | 80,114 | |
|
| |
Carlyle Finance LLC, 4.63%, Pfd. | | | 10,499 | | | | 166,829 | |
|
| |
Equitable Holdings, Inc., 5.25%, Series A, Pfd. | | | 16,799 | | | | 312,797 | |
|
| |
Equitable Holdings, Inc., 4.30%, Series C, Pfd. | | | 6,299 | | | | 102,863 | |
|
| |
KKR Group Finance Co. IX LLC, 4.63%, Pfd. | | | 10,499 | | | | 182,998 | |
|
| |
Voya Financial, Inc., 5.35%, Series B, Pfd.(e) | | | 6,300 | | | | 133,497 | |
|
| |
| | | | | | | 1,084,905 | |
|
| |
|
Property & Casualty Insurance–0.22% | |
Allstate Corp. (The), 5.63%, Series G, Pfd. | | | 12,074 | | | | 262,247 | |
|
| |
Allstate Corp. (The), 5.10%, Series H, Pfd. | | | 24,149 | | | | 474,528 | |
|
| |
Allstate Corp. (The), 4.75%, Series I, Pfd. | | | 6,299 | | | | 117,539 | |
|
| |
American Financial Group, Inc., 5.88%, Pfd. | | | 2,893 | | | | 63,038 | |
|
| |
American Financial Group, Inc., 5.13%, Pfd. | | | 4,051 | | | | 80,453 | |
|
| |
American Financial Group, Inc., 5.63%, Pfd. | | | 3,079 | | | | 63,366 | |
|
| |
American Financial Group, Inc., 4.50%, Pfd. | | | 4,119 | | | | 74,595 | |
|
| |
Arch Capital Group Ltd., 5.45%, Series F, Pfd. | | | 6,930 | | | | 140,402 | |
|
| |
Arch Capital Group Ltd., 4.55%, Series G, Pfd. | | | 10,499 | | | | 184,362 | |
|
| |
Argo Group International Holdings Ltd., 7.00%, Pfd.(e) | | | 3,154 | | | | 63,080 | |
|
| |
Argo Group U.S., Inc., 6.50%, Pfd. | | | 3,015 | | | | 62,501 | |
|
| |
Aspen Insurance Holdings Ltd., 5.63%, Pfd. | | | 5,250 | | | | 101,325 | |
|
| |
Aspen Insurance Holdings Ltd., 5.63%, Pfd. | | | 5,250 | | | | 99,698 | |
|
| |
AXIS Capital Holdings Ltd., 5.50%, Series E, Pfd. | | | 11,549 | | | | 228,208 | |
|
| |
Kemper Corp., 5.88%, Pfd.(e) | | | 3,150 | | | | 65,804 | |
|
| |
PartnerRe Ltd., 4.88%, Series J, Pfd. | | | 4,200 | | | | 79,086 | |
|
| |
Selective Insurance Group, Inc., 4.60%, Series B, Pfd. | | | 4,200 | | | | 70,287 | |
|
| |
W.R. Berkley Corp., 5.70%, Pfd. | | | 3,639 | | | | 78,602 | |
|
| |
W.R. Berkley Corp., 5.10%, Pfd. | | | 6,378 | | | | 127,624 | |
|
| |
W.R. Berkley Corp., 4.25%, Pfd. | | | 5,532 | | | | 91,887 | |
|
| |
W.R. Berkley Corp., 4.13%, Pfd. | | | 6,258 | | | | 100,128 | |
|
| |
| | | | | | | 2,628,760 | |
|
| |
|
Real Estate Operating Companies–0.04% | |
Brookfield Property Partners L.P., 6.50%, Series A-1, Pfd. | | | 4,073 | | | | 67,815 | |
|
| |
See accompanying Notes to Financial Statements which are an integral part of the financial statements.
| | |
| 23 | | Invesco Multi-Asset Income Fund |
| | | | | | | | |
| | | Shares | | | Value | |
|
| |
Real Estate Operating Companies–(continued) | |
Brookfield Property Partners L.P., 6.38%, Series A-2, Pfd. | | | 5,069 | | | $ | 82,625 | |
|
| |
Brookfield Property Partners L.P., 5.75%, Series A, Pfd. | | | 6,023 | | | | 91,128 | |
|
| |
Brookfield Property Preferred L.P., 6.25%, Pfd. | | | 13,976 | | | | 218,305 | |
|
| |
| | | | | | | 459,873 | |
|
| |
| | |
Regional Banks–0.63% | | | | | | | | |
Associated Banc-Corp, 5.88%, Series E, Pfd. | | | 2,100 | | | | 49,938 | |
|
| |
Associated Banc-Corp, 5.63%, Series F, Pfd. | | | 2,100 | | | | 48,447 | |
|
| |
Bank of Hawaii Corp., 4.38%, Series A, Pfd. | | | 3,780 | | | | 64,260 | |
|
| |
Bank OZK, 4.63%, Series A, Pfd. | | | 7,350 | | | | 122,010 | |
|
| |
Cadence Bank, 5.50%, Series A, Pfd. | | | 3,622 | | | | 73,128 | |
|
| |
Citizens Financial Group, Inc., 6.35%, Series D, Pfd.(e) | | | 5,326 | | | | 124,895 | |
|
| |
Citizens Financial Group, Inc., 5.00%, Series E, Pfd. | | | 10,712 | | | | 206,527 | |
|
| |
Cullen/Frost Bankers, Inc., 4.45%, Series B, Pfd. | | | 3,229 | | | | 62,481 | |
|
| |
F.N.B. Corp., 7.25%, Pfd.(e) | | | 2,328 | | | | 57,758 | |
|
| |
Fifth Third Bancorp, 6.63%, Series I, Pfd.(e) | | | 9,988 | | | | 251,897 | |
|
| |
Fifth Third Bancorp, 6.00%, Series A, Pfd. | | | 3,165 | | | | 69,124 | |
|
| |
Fifth Third Bancorp, 4.95%, Series K, Pfd. | | | 5,762 | | | | 110,573 | |
|
| |
First Citizens BancShares, Inc., 5.38%, Series A, Pfd. | | | 7,245 | | | | 147,798 | |
|
| |
First Citizens BancShares, Inc., 5.63%, Series C, Pfd. | | | 4,200 | | | | 84,252 | |
|
| |
First Horizon Corp., 6.50%, Pfd. | | | 3,112 | | | | 74,532 | |
|
| |
First Horizon Corp., 6.10%, Series D, Pfd.(e) | | | 2,138 | | | | 48,191 | |
|
| |
First Horizon Corp., 4.70%, Series F, Pfd. | | | 3,150 | | | | 58,181 | |
|
| |
First Republic Bank, 5.13%, Series H, Pfd. | | | 4,430 | | | | 86,651 | |
|
| |
First Republic Bank, 5.50%, Series I, Pfd. | | | 6,276 | | | | 134,620 | |
|
| |
First Republic Bank, 4.70%, Series J, Pfd. | | | 8,265 | | | | 145,216 | |
|
| |
First Republic Bank, 4.13%, Series K, Pfd. | | | 10,461 | | | | 161,413 | |
|
| |
First Republic Bank, 4.25%, Series L, Pfd. | | | 15,639 | | | | 248,347 | |
|
| |
First Republic Bank, 4.00%, Series M, Pfd. | | | 15,691 | | | | 235,522 | |
|
| |
First Republic Bank, 4.50%, Series N, Pfd. | | | 15,482 | | | | 260,717 | |
|
| |
Fulton Financial Corp., 5.13%, Series A, Pfd. | | | 4,200 | | | | 84,336 | |
|
| |
Hancock Whitney Corp., 6.25%, Pfd. | | | 3,622 | | | | 86,558 | |
|
| |
Huntington Bancshares, Inc., 4.50%, Series H, Pfd. | | | 10,727 | | | | 186,864 | |
|
| |
Huntington Bancshares, Inc., 5.70%, Series C, Pfd. | | | 3,495 | | | | 78,183 | |
|
| |
KeyCorp, 6.13%, Series E,
Pfd.(e) | | | 10,860 | | | | 253,472 | |
|
| |
KeyCorp, 5.65%, Series F, Pfd. | | | 9,231 | | | | 195,143 | |
|
| |
KeyCorp, 5.63%, Series G, Pfd. | | | 9,774 | | | | 206,720 | |
|
| |
| | | | | | | | |
| | | Shares | | | Value | |
|
| |
Regional Banks–(continued) | | | | | | | | |
KeyCorp, 6.20%, Pfd.(e) | | | 11,628 | | | $ | 283,491 | |
|
| |
M&T Bank Corp., 5.63%, Series H, Pfd.(e) | | | 5,250 | | | | 119,385 | |
|
| |
Old National Bancorp, 7.00%, Series C, Pfd. | | | 2,566 | | | | 66,690 | |
|
| |
Old National Bancorp, 7.00%, Series A, Pfd. | | | 2,274 | | | | 58,556 | |
|
| |
PacWest Bancorp, 7.75%, Series A, Pfd.(e) | | | 10,778 | | | | 267,510 | |
|
| |
Popular Capital Trust II, 6.13%, Pfd. | | | 2,717 | | | | 69,528 | |
|
| |
Regions Financial Corp., 6.38%, Series B, Pfd.(e) | | | 10,499 | | | | 259,325 | |
|
| |
Regions Financial Corp., 5.70%, Series C, Pfd.(e) | | | 10,499 | | | | 218,589 | |
|
| |
Regions Financial Corp., 4.45%, Series E, Pfd. | | | 8,400 | | | | 146,832 | |
|
| |
Signature Bank, 5.00%, Series A, Pfd. | | | 15,329 | | | | 270,097 | |
|
| |
Silvergate Capital Corp., 5.38%, Series A, Pfd. | | | 4,200 | | | | 59,892 | |
|
| |
SVB Financial Group, 5.25%, Series A, Pfd. | | | 8,053 | | | | 145,598 | |
|
| |
Synovus Financial Corp., 5.88%, Series E, Pfd.(e) | | | 7,350 | | | | 162,435 | |
|
| |
Texas Capital Bancshares, Inc., 5.75%, Series B, Pfd. | | | 6,300 | | | | 124,929 | |
|
| |
Truist Financial Corp., 5.25%, Series O, Pfd. | | | 12,074 | | | | 254,399 | |
|
| |
Truist Financial Corp., 4.75%, Series R, Pfd. | | | 19,424 | | | | 368,085 | |
|
| |
Valley National Bancorp, 6.25%, Series A, Pfd.(e) | | | 2,415 | | | | 53,637 | |
|
| |
Washington Federal, Inc., 4.88%, Series A, Pfd. | | | 6,300 | | | | 109,809 | |
|
| |
Webster Financial Corp., 5.25%, Series F, Pfd. | | | 3,150 | | | | 61,583 | |
|
| |
Western Alliance Bancorporation, 4.25%, Series A, Pfd.(e) | | | 6,300 | | | | 126,000 | |
|
| |
Wintrust Financial Corp., 6.50%, Series D, Pfd.(e) | | | 2,921 | | | | 71,740 | |
|
| |
Wintrust Financial Corp., 6.88%, Series E, Pfd.(e) | | | 5,744 | | | | 145,496 | |
|
| |
| | | | | | | 7,461,360 | |
|
| |
| | |
Reinsurance–0.10% | | | | | | | | |
Enstar Group Ltd., 7.00%, Series D, Pfd.(e) | | | 8,320 | | | | 182,874 | |
|
| |
Enstar Group Ltd., 7.00%, Series E, Pfd. | | | 2,386 | | | | 53,780 | |
|
| |
Reinsurance Group of America, Inc., 5.75%, Pfd.(e) | | | 8,400 | | | | 197,316 | |
|
| |
Reinsurance Group of America, Inc., 7.13%, Pfd.(e) | | | 14,750 | | | | 373,617 | |
|
| |
RenaissanceRe Holdings Ltd., 5.75%, Series F, Pfd. | | | 5,250 | | | | 114,188 | |
|
| |
RenaissanceRe Holdings Ltd., 4.20%, Series G, Pfd. | | | 10,499 | | | | 175,018 | |
|
| |
SiriusPoint Ltd., 8.00%, Series B, Pfd.(e) | | | 4,200 | | | | 99,120 | |
|
| |
| | | | | | | 1,195,913 | |
|
| |
| | |
Renewable Electricity–0.01% | | | | | | | | |
Brookfield Renewable Partners L.P., 5.25%, Series 17, Pfd. | | | 3,859 | | | | 63,249 | |
|
| |
See accompanying Notes to Financial Statements which are an integral part of the financial statements.
| | |
| 24 | | Invesco Multi-Asset Income Fund |
| | | | | | | | | | |
| | | | | Shares | | | Value | |
|
| |
Residential REITs–0.01% | | | | | | | | | | |
American Homes 4 Rent, 5.88%, Series G, Pfd. | | | | | 2,563 | | | $ | 56,335 | |
|
| |
American Homes 4 Rent, 6.25%, Series H, Pfd. | | | | | 2,278 | | | | 51,164 | |
|
| |
| | | | | | | | | 107,499 | |
|
| |
| | | |
Retail REITs–0.04% | | | | | | | | | | |
Agree Realty Corp., 4.25%, Series A, Pfd. | | | | | 3,675 | | | | 58,433 | |
|
| |
Federal Realty Investment Trust, 5.00%, Series C, Pfd. | | | | | 3,150 | | | | 62,590 | |
|
| |
Kimco Realty Corp., 5.13%, Series L, Pfd. | | | | | 4,725 | | | | 90,673 | |
|
| |
Kimco Realty Corp., 5.25%, Series M, Pfd. | | | | | 5,554 | | | | 109,081 | |
|
| |
SITE Centers Corp., 6.38%, Series A, Pfd. | | | | | 3,675 | | | | 73,720 | |
|
| |
Spirit Realty Capital, Inc., 6.00%, Series A, Pfd. | | | | | 3,622 | | | | 77,692 | |
|
| |
| | | | | | | | | 472,189 | |
|
| |
| | | |
Specialized REITs–0.17% | | | | | | | | | | |
Digital Realty Trust, Inc., 5.25%, Series J, Pfd. | | | | | 4,281 | | | | 85,149 | |
|
| |
Digital Realty Trust, Inc., 5.85%, Series K, Pfd. | | | | | 4,354 | | | | 95,353 | |
|
| |
Digital Realty Trust, Inc., 5.20%, Series L, Pfd. | | | | | 7,221 | | | | 139,510 | |
|
| |
EPR Properties, 5.75%, Series G, Pfd. | | | | | 3,150 | | | | 53,078 | |
|
| |
Public Storage, 5.15%, Series F, Pfd. | | | | | 2,378 | | | | 50,009 | |
|
| |
Public Storage, 5.05%, Series G, Pfd. | | | | | 5,244 | | | | 108,446 | |
|
| |
Public Storage, 5.60%, Series H, Pfd. | | | | | 7,041 | | | | 160,746 | |
|
| |
Public Storage, 4.88%, Series I, Pfd. | | | | | 7,814 | | | | 153,701 | |
|
| |
Public Storage, 4.75%, Series K, Pfd. | | | | | 1,940 | | | | 38,140 | |
|
| |
Public Storage, 4.63%, Series L, Pfd. | | | | | 11,742 | | | | 218,401 | |
|
| |
Public Storage, 4.13%, Series M, Pfd. | | | | | 5,922 | | | | 99,075 | |
|
| |
Public Storage, 3.88%, Series N, Pfd. | | | | | 7,352 | | | | 114,471 | |
|
| |
Public Storage, 3.90%, Series O, Pfd. | | | | | 4,533 | | | | 71,576 | |
|
| |
Public Storage, 4.00%, Series P, Pfd. | | | | | 12,547 | | | | 204,265 | |
|
| |
Public Storage, 3.95%, Series Q, Pfd. | | | | | 2,988 | | | | 47,718 | |
|
| |
Public Storage, 4.00%, Series R, Pfd. | | | | | 8,578 | | | | 138,020 | |
|
| |
Public Storage, 4.10%, Series S, Pfd. | | | | | 14,564 | | | | 239,578 | |
|
| |
| | | | | | | | | 2,017,236 | |
|
| |
| |
Thrifts & Mortgage Finance–0.03% | | | | | |
Merchants Bancorp, 6.00%, Series B, Pfd.(e) | | | | | 2,625 | | | | 57,724 | |
|
| |
Merchants Bancorp, 6.00%, Series C, Pfd. | | | | | 4,120 | | | | 90,599 | |
|
| |
New York Community Bancorp, Inc., 6.38%, Series A, Pfd.(e) | | | | | 10,814 | | | | 231,311 | |
|
| |
| | | | | | | | | 379,634 | |
|
| |
|
Trading Companies & Distributors–0.07% | |
Air Lease Corp., 6.15%, Series A, Pfd.(e) | | | | | 5,250 | | | | 112,875 | |
|
| |
Fortress Transportation and Infrastructure Investors LLC, 8.00%, Series B, Pfd.(e) | | | | | 2,601 | | | | 51,812 | |
|
| |
Fortress Transportation and Infrastructure Investors LLC, 8.25%, Series A, Pfd.(e) | | | | | 2,190 | | | | 44,457 | |
|
| |
| | | | | | | | | | | | |
| | | | | | Shares | | | Value | |
|
| |
Trading Companies & Distributors–(continued) | |
Fortress Transportation and Infrastructure Investors LLC, 8.25%, Series C,
Pfd.(e) | | | | 2,202 | | | $ | 41,287 | |
|
| |
Triton International Ltd., 8.00%, Pfd. | | | | 3,445 | | | | 84,127 | |
|
| |
Triton International Ltd., 7.38%, Pfd. | | | | 4,221 | | | | 96,788 | |
|
| |
Triton International Ltd., 6.88%, Pfd. | | | | 2,531 | | | | 55,758 | |
|
| |
Triton International Ltd., 5.75%, Series E, Pfd. | | | | 3,241 | | | | 62,843 | |
|
| |
WESCO International, Inc., 10.63%, Series A, Pfd.(e) | | | | 11,345 | | | | 306,315 | |
|
| |
| | | | | | | | | | | 856,262 | |
|
| |
|
Wireless Telecommunication Services–0.08% | |
Telephone and Data Systems, Inc., 6.63%, Series UU, Pfd. | | | | 8,819 | | | | 177,174 | |
|
| |
Telephone and Data Systems, Inc., 6.00%, Series VV, Pfd. | | | | 14,490 | | | | 256,473 | |
|
| |
United States Cellular Corp., 6.25%, Pfd. | | | | 10,499 | | | | 204,310 | |
|
| |
United States Cellular Corp., 5.50%, Pfd. | | | | 10,499 | | | | 179,218 | |
|
| |
United States Cellular Corp., 5.50%, Pfd. | | | | 10,499 | | | | 179,533 | |
|
| |
| | | | | | | | | | | 996,708 | |
|
| |
Total Preferred Stocks (Cost $70,052,927) | | | | 56,011,568 | |
|
| |
| | |
| | | Principal Amount | | | | |
Non-U.S. Dollar Denominated Bonds & Notes–0.75%(m) | |
Aerospace & Defense–0.02% | | | | | |
Thales S.A. (France), 0.75%, 01/23/2025(b) | | | EUR | | | | 200,000 | | | | 185,911 | |
|
| |
| |
Agricultural Products–0.01% | | | | | |
Archer-Daniels-Midland Co., 1.00%, 09/12/2025 | | | EUR | | | | 125,000 | | | | 116,401 | |
|
| |
| |
Apparel, Accessories & Luxury Goods–0.01% | | | | | |
PVH Corp., 3.13%, 12/15/2027(b) | | | EUR | | | | 100,000 | | | | 84,655 | |
|
| |
| |
Auto Parts & Equipment–0.01% | | | | | |
Magna International, Inc. (Canada), 1.50%, 09/25/2027 | | | EUR | | | | 100,000 | | | | 87,985 | |
|
| |
| |
Automobile Manufacturers–0.05% | | | | | |
BMW Finance N.V. (Germany), 1.00%, 01/21/2025(b) | | | EUR | | | | 150,000 | | | | 142,939 | |
|
| |
Mercedes-Benz International Finance B.V. (Germany), 2.00%, 08/22/2026(b) | | | EUR | | | | 45,000 | | | | 42,866 | |
|
| |
Nissan Motor Co. Ltd. (Japan), 2.65%, 03/17/2026(b) | | | EUR | | | | 100,000 | | | | 90,058 | |
|
| |
Volkswagen Financial Services AG (Germany), | | | | | | | | | | | | |
0.13%, 02/12/2027(b) | | | EUR | | | | 90,000 | | | | 75,395 | |
|
| |
2.25%, 10/01/2027(b) | | | EUR | | | | 49,000 | | | | 44,601 | |
|
| |
Volkswagen Leasing GmbH (Germany), | | | | | | | | | | | | |
1.50%, 06/19/2026(b) | | | EUR | | | | 100,000 | | | | 91,312 | |
|
| |
0.38%, 07/20/2026(b) | | | EUR | | | | 85,000 | | | | 73,846 | |
|
| |
| | | | | | | | | | | 561,017 | |
|
| |
See accompanying Notes to Financial Statements which are an integral part of the financial statements.
| | |
| 25 | | Invesco Multi-Asset Income Fund |
| | | | | | | | | | | | |
| | |
| | | Principal Amount | | | Value | |
|
| |
Brewers–0.01% | | | | | | | | | | | | |
Anheuser-Busch InBev S.A./N.V. (Belgium), 2.88%, 09/25/2024(b) | | | EUR | | | | 175,000 | | | $ | 172,807 | |
|
| |
| | | |
Broadcasting–0.02% | | | | | | | | | | | | |
ITV PLC (United Kingdom), 1.38%, 09/26/2026(b) | | | EUR | | | | 125,000 | | | | 107,214 | |
|
| |
TDF Infrastructure S.A.S.U. (France), 2.50%, 04/07/2026(b) | | | EUR | | | | 100,000 | | | | 88,350 | |
|
| |
| | | | | | | | | | | 195,564 | |
|
| |
| | | |
Cable & Satellite–0.01% | | | | | | | | | | | | |
SES S.A. (Luxembourg), 1.63%, 03/22/2026(b) | | | EUR | | | | 120,000 | | | | 107,019 | |
|
| |
| |
Casinos & Gaming–0.02% | | | | | |
Codere Finance 2 (Luxembourg) S.A. (Spain), 3.00% PIK Rate, 8.00% Cash Rate, 09/30/2026 (Acquired 07/24/2020-09/30/2022;
Cost $247,901)(b)(d)(f) | | | EUR | | | | 216,503 | | | | 200,052 | |
|
| |
|
Construction & Engineering–0.01% | |
Autoroutes du Sud de la France S.A. (France), 2.95%, 01/17/2024(b) | | | EUR | | | | 100,000 | | | | 98,853 | |
|
| |
|
Construction Machinery & Heavy Trucks–0.01% | |
Metso Outotec OYJ (Finland), 1.13%, 06/13/2024(b) | | | EUR | | | | 100,000 | | | | 94,354 | |
|
| |
|
Construction Materials–0.00% | |
HeidelbergCement Finance (Luxembourg) S.A. (Germany), 1.63%, 04/07/2026(b) | | | EUR | | | | 60,000 | | | | 55,228 | |
|
| |
| |
Consumer Finance–0.02% | | | | | |
Santander Consumer Finance S.A. (Spain), 1.00%, 02/27/2024(b) | | | EUR | | | | 200,000 | | | | 191,565 | |
|
| |
|
Data Processing & Outsourced Services–0.01% | |
Euronet Worldwide, Inc., 1.38%, 05/22/2026 | | | EUR | | | | 100,000 | | | | 85,476 | |
|
| |
| | | |
Diversified Banks–0.22% | | | | | | | | | | | | |
Banco Bilbao Vizcaya Argentaria S.A. (Spain), 0.38%, 10/02/2024(b) | | | EUR | | | | 200,000 | | | | 186,764 | |
|
| |
Banco Santander S.A. (Spain), | | | | | | | | | | | | |
3.13%, 01/19/2027(b) | | | EUR | | | | 100,000 | | | | 93,032 | |
|
| |
0.50%, 02/04/2027(b) | | | EUR | | | | 100,000 | | | | 84,196 | |
|
| |
Bankinter S.A. (Spain), 0.88%, 07/08/2026(b) | | | EUR | | | | 100,000 | | | | 86,579 | |
|
| |
Banque Federative du Credit Mutuel S.A. (France), | | | | | | | | | | | | |
1.25%, 01/14/2025(b) | | | EUR | | | | 100,000 | | | | 93,951 | |
|
| |
2.13%, 09/12/2026(b) | | | EUR | | | | 100,000 | | | | 91,440 | |
|
| |
0.63%, 11/19/2027(b) | | | EUR | | | | 100,000 | | | | 82,487 | |
|
| |
Belfius Bank S.A. (Belgium), 0.01%, 10/15/2025(b) | | | EUR | | | | 200,000 | | | | 179,105 | |
|
| |
BNP Paribas S.A. (France), | | | | | | | | | | | | |
2.88%, 10/01/2026(b) | | | EUR | | | | 100,000 | | | | 93,693 | |
|
| |
0.25%, 04/13/2027(b)(e) | | | EUR | | | | 100,000 | | | | 85,571 | |
|
| |
| | | | | | | | | | | | |
| | |
| | | Principal Amount | | | Value | |
|
| |
Diversified Banks–(continued) | | | | | |
BPCE S.A. (France), | | | | | | | | | | | | |
0.88%, 01/31/2024(b) | | | EUR | | | | 100,000 | | | $ | 95,703 | |
|
| |
0.63%, 09/26/2024(b) | | | EUR | | | | 200,000 | | | | 186,277 | |
|
| |
Cooperatieve Rabobank U.A. (Netherlands), 0.63%, 02/27/2024(b) | | | EUR | | | | 100,000 | | | | 95,607 | |
|
| |
Credit Agricole S.A. (France), | | | | | | | | | | | | |
1.00%, 09/16/2024(b) | | | EUR | | | | 100,000 | | | | 95,290 | |
|
| |
1.38%, 03/13/2025(b) | | | EUR | | | | 200,000 | | | | 187,998 | |
|
| |
de Volksbank N.V. (Netherlands), 0.01%, 09/16/2024(b) | | | EUR | | | | 100,000 | | | | 92,979 | |
|
| |
ING Groep N.V. (Netherlands), 1.13%, 02/14/2025(b) | | | EUR | | | | 100,000 | | | | 93,940 | |
|
| |
KBC Group N.V. (Belgium), 1.13%, 01/25/2024(b) | | | EUR | | | | 100,000 | | | | 95,922 | |
|
| |
Mediobanca Banca di Credito Finanziario S.p.A. (Italy), 0.88%, 01/15/2026(b) | | | EUR | | | | 100,000 | | | | 88,865 | |
|
| |
Nordea Bank Abp (Finland), 1.13%, 02/12/2025(b) | | | EUR | | | | 100,000 | | | | 94,790 | |
|
| |
OP Corporate Bank PLC (Finland), 0.38%, 02/26/2024(b) | | | EUR | | | | 100,000 | | | | 95,179 | |
|
| |
Skandinaviska Enskilda Banken AB (Sweden), 0.75%, 08/09/2027(b) | | | EUR | | | | 200,000 | | | | 170,114 | |
|
| |
Standard Chartered PLC (United Kingdom), 0.90%, 07/02/2027(b)(e) | | | EUR | | | | 100,000 | | | | 86,327 | |
|
| |
Swedbank AB (Sweden), 0.30%, 05/20/2027(b)(e) | | | EUR | | | | 100,000 | | | | 86,068 | |
|
| |
| | | | | | | | | | | 2,641,877 | |
|
| |
|
Diversified Capital Markets–0.02% | |
Deutsche Bank AG (Germany), | | | | | | | | | | | | |
2.63%, 02/12/2026(b) | | | EUR | | | | 100,000 | | | | 91,192 | |
|
| |
0.75%, 02/17/2027(b)(e) | | | EUR | | | | 100,000 | | | | 84,144 | |
|
| |
Macquarie Group Ltd. (Australia), 0.63%, 02/03/2027(b) | | | EUR | | | | 100,000 | | | | 84,190 | |
|
| |
| | | | | | | | | | | 259,526 | |
|
| |
|
Diversified Chemicals–0.01% | |
BASF SE (Germany), | | | | | | | | | | | | |
2.50%, 01/22/2024(b) | | | EUR | | | | 74,000 | | | | 72,920 | |
|
| |
0.25%, 06/05/2027(b) | | | EUR | | | | 100,000 | | | | 86,078 | |
|
| |
| | | | | | | | | | | 158,998 | |
|
| |
|
Diversified Support Services–0.01% | |
APRR S.A. (France), 1.50%, 01/15/2024(b) | | | EUR | | | | 100,000 | | | | 96,916 | |
|
| |
| | | |
Electric Utilities–0.02% | | | | | | | | | | | | |
AusNet Services Holdings Pty. Ltd. (Australia), 1.50%, 02/26/2027(b) | | | EUR | | | | 100,000 | | | | 89,170 | |
|
| |
EDP Finance B.V. (Portugal), 1.50%, 11/22/2027(b) | | | EUR | | | | 100,000 | | | | 89,067 | |
|
| |
Elenia Verkko OYJ (Finland), 0.38%, 02/06/2027(b) | | | EUR | | | | 140,000 | | | | 117,484 | |
|
| |
| | | | | | | | | | | 295,721 | |
|
| |
| | | |
Food Retail–0.01% | | | | | | | | | | | | |
ELO SACA (France), 2.88%, 01/29/2026(b) | | | EUR | | | | 100,000 | | | | 92,187 | |
|
| |
See accompanying Notes to Financial Statements which are an integral part of the financial statements.
| | |
| 26 | | Invesco Multi-Asset Income Fund |
| | | | | | | | | | | | |
| | |
| | | Principal Amount | | | Value | |
|
| |
Gas Utilities–0.01% | | | | | | | | | | | | |
2i Rete Gas S.p.A. (Italy), 1.75%, 08/28/2026(b) | | | EUR | | | | 100,000 | | | $ | 89,175 | |
|
| |
APA Infrastructure Ltd. (Australia), 2.00%, 03/22/2027(b) | | | EUR | | | | 100,000 | | | | 88,905 | |
|
| |
| | | | | | | | | | | 178,080 | |
|
| |
| |
Health Care Equipment–0.01% | | | | | |
Zimmer Biomet Holdings, Inc., 2.43%, 12/13/2026 | | | EUR | | | | 100,000 | | | | 92,450 | |
|
| |
| |
Health Care Services–0.00% | | | | | |
Fresenius Medical Care AG & Co. KGaA (Germany), 0.63%, 11/30/2026(b) | | | EUR | | | | 30,000 | | | | 25,883 | |
|
| |
| |
Health Care Supplies–0.01% | | | | | |
EssilorLuxottica S.A. (France), 2.38%, 04/09/2024(b) | | | EUR | | | | 100,000 | | | | 98,382 | |
|
| |
|
Household Appliances–0.01% | |
Whirlpool Finance Luxembourg S.a.r.l., 1.10%, 11/09/2027 | | | EUR | | | | 100,000 | | | | 84,924 | |
|
| |
| |
Household Products–0.01% | | | | | |
Procter & Gamble Co. (The), 4.88%, 05/11/2027 | | | EUR | | | | 75,000 | | | | 79,990 | |
|
| |
| |
Integrated Oil & Gas–0.02% | | | | | |
Eni S.p.A. (Italy), 1.00%, 03/14/2025(b) | | | EUR | | | | 130,000 | | | | 122,096 | |
|
| |
Shell International Finance B.V. (Netherlands), 0.38%, 02/15/2025(b) | | | EUR | | | | 160,000 | | | | 148,999 | |
|
| |
| | | | | | | | | | | 271,095 | |
|
| |
|
Integrated Telecommunication Services–0.01% | |
Vantage Towers AG (Germany), 0.38%, 03/31/2027(b) | | | EUR | | | | 100,000 | | | | 83,250 | |
|
| |
|
IT Consulting & Other Services–0.01% | |
DXC Technology Co., 1.75%, 01/15/2026 | | | EUR | | | | 100,000 | | | | 91,622 | |
|
| |
International Business Machines Corp., 1.25%, 01/29/2027 | | | EUR | | | | 100,000 | | | | 90,677 | |
|
| |
| | | | | | | | | | | 182,299 | |
|
| |
| |
Life & Health Insurance–0.01% | | | | | |
Ethias S.A. (Belgium), 5.00%, 01/14/2026(b) | | | EUR | | | | 100,000 | | | | 95,028 | |
|
| |
New York Life Global Funding, 0.25%, 01/23/2027(b) | | | EUR | | | | 100,000 | | | | 85,807 | |
|
| |
| | | | | | | | | | | 180,835 | |
|
| |
| |
Multi-line Insurance–0.01% | | | | | |
Cloverie PLC for Zurich Insurance Co. Ltd. (Switzerland), 1.75%, 09/16/2024(b) | | | EUR | | | | 100,000 | | | | 95,621 | |
|
| |
|
Multi-Sector Holdings–0.01% | |
Berkshire Hathaway, Inc., 1.13%, 03/16/2027 | | | EUR | | | | 100,000 | | | | 88,696 | |
|
| |
Groupe Bruxelles Lambert N.V. (Belgium), 1.88%, 06/19/2025(b) | | | EUR | | | | 100,000 | | | | 94,787 | |
|
| |
| | | | | | | | | | | 183,483 | |
|
| |
| | | | | | | | | | | | |
| | |
| | | Principal Amount | | | Value | |
|
| |
Office REITs–0.02% | | | | | | | | | | | | |
Globalworth Real Estate Investments Ltd. (Poland), 2.95%, 07/29/2026(b) | | | EUR | | | | 100,000 | | | $ | 76,693 | |
|
| |
Inmobiliaria Colonial SOCIMI S.A. (Spain), 1.63%, 11/28/2025(b) | | | EUR | | | | 200,000 | | | | 181,810 | |
|
| |
| | | | | | | | | | | 258,503 | |
|
| |
|
Other Diversified Financial Services–0.02% | |
Clearstream Banking AG (Germany), 0.01%, 12/01/2025(b) | | | EUR | | | | 100,000 | | | | 90,140 | |
|
| |
LeasePlan Corp. N.V. (Netherlands), 3.50%, 04/09/2025(b) | | | EUR | | | | 200,000 | | | | 192,054 | |
|
| |
| | | | | | | | | | | 282,194 | |
|
| |
| | | |
Pharmaceuticals–0.02% | | | | | | | | | | | | |
Bayer AG (Germany), 0.38%, 07/06/2024(b) | | | EUR | | | | 200,000 | | | | 188,816 | |
|
| |
Novartis Finance S.A. (Switzerland), 1.63%, 11/09/2026(b) | | | EUR | | | | 100,000 | | | | 93,691 | |
|
| |
| | | | | | | | | | | 282,507 | |
|
| |
|
Precious Metals & Minerals–0.01% | |
Anglo American Capital PLC (South Africa), 1.63%, 03/11/2026(b) | | | EUR | | | | 100,000 | | | | 91,173 | |
|
| |
|
Real Estate Operating Companies–0.01% | |
Samhallsbyggnadsbolaget i Norden AB (Sweden), 1.13%, 09/04/2026(b) | | | EUR | | | | 100,000 | | | | 72,382 | |
|
| |
|
Renewable Electricity–0.01% | |
Southern Power Co., 1.85%, 06/20/2026 | | | EUR | | | | 100,000 | | | | 92,512 | |
|
| |
| | | |
Restaurants–0.01% | | | | | | | | | | | | |
Sodexo S.A. (France), 0.75%, 04/27/2025(b) | | | EUR | | | | 150,000 | | | | 138,779 | |
|
| |
| | | |
Specialized REITs–0.01% | | | | | | | | | | | | |
American Tower Corp., 1.95%, 05/22/2026 | | | EUR | | | | 100,000 | | | | 91,667 | |
|
| |
|
Thrifts & Mortgage Finance–0.01% | |
Aareal Bank AG (Germany), 0.50%, 04/07/2027(b) | | | EUR | | | | 200,000 | | | | 156,286 | |
|
| |
| | | |
Tobacco–0.01% | | | | | | | | | | | | |
Imperial Brands Finance PLC (United Kingdom), 3.38%, 02/26/2026(b) | | | EUR | | | | 100,000 | | | | 92,670 | |
|
| |
Total Non-U.S. Dollar Denominated Bonds & Notes (Cost $10,838,615) | | | | 8,897,077 | |
|
| |
|
Asset-Backed Securities–0.00% | |
Banc of America Funding Trust, Series 2007-1, Class 1A3, 6.00%, 01/25/2037 | | | $ | | | | 51,786 | | | | 41,142 | |
|
| |
GMACM Home Equity Loan Trust, Series 2007-HE2, Class A2, 6.05%, 12/25/2037(n) | | | | | | | 1,594 | | | | 1,590 | |
|
| |
Total Asset-Backed Securities
(Cost $48,604) | | | | 42,732 | |
|
| |
See accompanying Notes to Financial Statements which are an integral part of the financial statements.
| | |
| 27 | | Invesco Multi-Asset Income Fund |
| | | | | | | | |
| | |
| | | Principal Amount | | | Value | |
|
| |
U.S. Government Sponsored Agency Mortgage-Backed Securities–0.00% | |
Collateralized Mortgage Obligations–0.00% | |
Fannie Mae REMICs,
IO, 3.11% (6.70% - (1.00 x 1 mo. USD LIBOR)), 02/25/2024(o)(p) | | $ | 60 | | | $ | 0 | |
|
| |
6.39% (9.80% - (1.00 x 1 mo. USD LIBOR)),
03/17/2031(o)(p) | | | 16 | | | | 1 | |
|
| |
Total U.S. Government Sponsored Agency Mortgage-Backed Securities
(Cost $1,197) | | | | 1 | |
|
| |
| | |
| | | Shares | | | | |
Money Market Funds–17.36% | | | | | |
Invesco Government & Agency Portfolio, Institutional Class, 3.07%(q)(r) | | | 71,909,306 | | | | 71,909,306 | |
|
| |
Invesco Liquid Assets Portfolio, Institutional Class, 3.03%(q)(r) | | | 51,358,692 | | | | 51,368,964 | |
|
| |
Invesco Treasury Portfolio, Institutional Class, 3.08%(q)(r) | | | 82,182,063 | | | | 82,182,063 | |
|
| |
Total Money Market Funds (Cost $205,455,260) | | | | 205,460,333 | |
|
| |
TOTAL INVESTMENTS IN SECURITIES (excluding investments purchased with cash collateral from securities on loan)-103.36%
(Cost $1,402,462,885) | | | | | | | 1,223,248,731 | |
|
| |
| | |
| Investment Abbreviations: |
| |
| Conv. | | – Convertible |
| EUR | | – Euro |
| IO | | – Interest Only |
| LIBOR | | – London Interbank Offered Rate |
| Pfd. | | – Preferred |
| PIK | | – Pay-in-Kind |
| REIT | | – Real Estate Investment Trust |
| REMICs | | – Real Estate Mortgage Investment Conduits |
| SPDR | | – Standard & Poor’s Depositary Receipt |
| USD | | – U.S. Dollar |
| | | | | | | | |
| | | Shares | | | Value | |
|
| |
Investments Purchased with Cash Collateral from Securities on Loan | |
Money Market Funds–3.57% | | | | | |
Invesco Private Government Fund, 3.18%(q)(r)(s) | | | 11,815,323 | | | $ | 11,815,323 | |
|
| |
Invesco Private Prime Fund, 3.28%(q)(r)(s) | | | 30,374,276 | | | | 30,374,276 | |
|
| |
Total Investments Purchased with Cash Collateral from Securities on Loan
(Cost $42,189,702) | | | | 42,189,599 | |
|
| |
TOTAL INVESTMENTS IN SECURITIES–106.93%
(Cost $1,444,652,587) | | | | 1,265,438,330 | |
|
| |
OTHER ASSETS LESS LIABILITIES–(6.93)% | | | | (82,044,356 | ) |
|
| |
NET ASSETS–100.00% | | | | | | $ | 1,183,393,974 | |
|
| |
See accompanying Notes to Financial Statements which are an integral part of the financial statements.
| | |
| 28 | | Invesco Multi-Asset Income Fund |
Notes to Schedule of Investments:
| (a) | Industry and/or sector classifications used in this report are generally according to the Global Industry Classification Standard, which was developed by and is the exclusive property and a service mark of MSCI Inc. and Standard & Poor’s. |
| (b) | Security purchased or received in a transaction exempt from registration under the Securities Act of 1933, as amended (the “1933 Act”). The security may be resold pursuant to an exemption from registration under the 1933 Act, typically to qualified institutional buyers. The aggregate value of these securities at October 31, 2022 was $537,755,002, which represented 45.44% of the Fund’s Net Assets. |
| (c) | All or a portion of this security was out on loan at October 31, 2022. |
| (d) | All or a portion of this security is Pay-in-Kind. Pay-in-Kind securities pay interest income in the form of securities. |
| (e) | Security issued at a fixed rate for a specific period of time, after which it will convert to a variable rate. |
| (f) | Restricted security. The aggregate value of these securities at October 31, 2022 was $284,501, which represented less than 1% of the Fund’s Net Assets. |
| (g) | Security valued using significant unobservable inputs (Level 3). See Note 3. |
| (h) | Defaulted security. Currently, the issuer is in default with respect to principal and/or interest payments. The aggregate value of these securities at October 31, 2022 was $2,211,263, which represented less than 1% of the Fund’s Net Assets. |
| (i) | Step coupon bond. The interest rate represents the coupon rate at which the bond will accrue at a specified future date. |
| (j) | All or a portion of the value was pledged as collateral to cover margin requirements for open futures contracts. See Note 1N. |
| (k) | Security traded on a discount basis. The interest rate shown represents the discount rate at the time of purchase by the Fund. |
| (l) | The Fund holds securities which have been issued by the same entity and that trade on separate exchanges. |
| (m) | Foreign denominated security. Principal amount is denominated in the currency indicated. |
| (n) | Interest rate is redetermined periodically based on the cash flows generated by the pool of assets backing the security, less any applicable fees. The rate shown is the rate in effect on October 31, 2022. |
| (o) | Interest only security. Principal amount shown is the notional principal and does not reflect the maturity value of the security. |
| (p) | Interest or dividend rate is redetermined periodically. Rate shown is the rate in effect on October 31, 2022. |
| (q) | Affiliated issuer. The issuer and/or the Fund is a wholly-owned subsidiary of Invesco Ltd., or is affiliated by having an investment adviser that is under common control of Invesco Ltd. The table below shows the Fund’s transactions in, and earnings from, its investments in affiliates for the fiscal year ended October 31, 2022. |
| | | | | | | | | | | | | | | | | | | | | | | | | | | | |
| | | Value
October 31, 2021 | | | Purchases at Cost | | | Proceeds from Sales | | | Change in
Unrealized
Appreciation
(Depreciation) | | | Realized Gain (Loss) | | | Value
October 31, 2022 | | | Dividend Income | |
| Investments in Affiliated Money Market Funds: | | | | | | | | | | | | | | | | | | | | | | | | | | | | |
Invesco Government & Agency Portfolio, Institutional Class | | $ | 92,515,254 | | | $ | 380,575,422 | | | $ | (401,181,370 | ) | | $ | - | | | $ | - | | | $ | 71,909,306 | | | $ | 711,194 | |
Invesco Liquid Assets Portfolio, Institutional Class | | | 74,264,221 | | | | 271,839,588 | | | | (294,721,858 | ) | | | (7,766) | | | | (5,221) | | | | 51,368,964 | | | | 584,429 | |
Invesco Treasury Portfolio, Institutional Class | | | 105,731,720 | | | | 434,943,340 | | | | (458,492,997 | ) | | | - | | | | - | | | | 82,182,063 | | | | 772,583 | |
| Investments Purchased with Cash Collateral from Securities on Loan: | | | | | | | | | | | | | | | | | | | | | | | | | | | | |
Invesco Private Government Fund | | | 16,713,748 | | | | 78,867,975 | | | | (83,766,400 | ) | | | - | | | | - | | | | 11,815,323 | | | | 93,948* | |
Invesco Private Prime Fund | | | 38,998,746 | | | | 152,156,930 | | | | (160,769,149 | ) | | | (103) | | | | (12,148) | | | | 30,374,276 | | | | 264,523* | |
Total | | $ | 328,223,689 | | | $ | 1,318,383,255 | | | $ | (1,398,931,774 | ) | | $ | (7,869) | | | $ | (17,369) | | | $ | 247,649,932 | | | $ | 2,426,677 | |
| | * | Represents the income earned on the investment of cash collateral, which is included in securities lending income on the Statement of Operations. Does not include rebates and fees paid to lending agent or premiums received from borrowers, if any. |
| (r) | The rate shown is the 7-day SEC standardized yield as of October 31, 2022. |
| (s) | The security has been segregated to satisfy the commitment to return the cash collateral received in securities lending transactions upon the borrower’s return of the securities loaned. See Note 1K. |
| | | | | | | | | | | | | | | | | | | | |
| Open Futures Contracts(a) | |
|
| |
| Long Futures Contracts | | Number of
Contracts | | | Expiration Month | | | Notional
Value | | | Value | | | Unrealized
Appreciation (Depreciation) | |
|
| |
Interest Rate Risk | | | | | | | | | | | | | | | | | | | | |
|
| |
U.S. Treasury 5 Year Notes | | | 29 | | | | December-2022 | | | $ | 3,091,219 | | | $ | (2,266 | ) | | $ | (2,266 | ) |
|
| |
U.S. Treasury 10 Year Notes | | | 262 | | | | December-2022 | | | | 28,975,562 | | | | (1,728,234 | ) | | | (1,728,234 | ) |
|
| |
U.S. Treasury 10 Year Ultra Notes | | | 114 | | | | December-2022 | | | | 13,222,219 | | | | (1,108,063 | ) | | | (1,108,063 | ) |
|
| |
Subtotal–Long Futures Contracts | | | | | | | | | | | | | | | (2,838,563 | ) | | | (2,838,563 | ) |
|
| |
See accompanying Notes to Financial Statements which are an integral part of the financial statements.
| | |
| 29 | | Invesco Multi-Asset Income Fund |
| | | | | | | | | | | | | | | | | | | | |
| Open Futures Contracts(a)–(continued) | |
|
| |
| Short Futures Contracts | | Number of
Contracts | | | Expiration
Month | | | Notional
Value | | | Value | | | Unrealized
Appreciation
(Depreciation) | |
|
| |
Equity Risk | | | | | | | | | | | | | | | | | | | | |
|
| |
E-Mini Russell 2000 Index | | | 357 | | | | December-2022 | | | | $(33,076,050 | ) | | | $(2,567,111 | ) | | | $(2,567,111 | ) |
|
| |
E-Mini S&P 500 Index | | | 179 | | | | December-2022 | | | | (34,752,850 | ) | | | (1,885,644 | ) | | | (1,885,644 | ) |
|
| |
EURO STOXX 50 Index | | | 705 | | | | December-2022 | | | | (25,207,187 | ) | | | (1,472,057 | ) | | | (1,472,057 | ) |
|
| |
MSCI Emerging Markets Index | | | 245 | | | | December-2022 | | | | (10,456,600 | ) | | | 383,153 | | | | 383,153 | |
|
| |
Tokyo Stock Price Index | | | 110 | | | | December-2022 | | | | (14,247,957 | ) | | | (237,264 | ) | | | (237,264 | ) |
|
| |
Subtotal | | | | | | | | | | | | | | | (5,778,923 | ) | | | (5,778,923 | ) |
|
| |
Interest Rate Risk | | | | | | | | | | | | | | | | | | | | |
|
| |
Euro-Bobl | | | 36 | | | | December-2022 | | | | (4,257,498 | ) | | | 105,703 | | | | 105,703 | |
|
| |
Euro-Bund | | | 173 | | | | December-2022 | | | | (23,668,699 | ) | | | 410,460 | | | | 410,460 | |
|
| |
Euro-Schatz | | | 23 | | | | December-2022 | | | | (2,430,605 | ) | | | 20,891 | | | | 20,891 | |
|
| |
Long Gilt | | | 227 | | | | December-2022 | | | | (26,586,838 | ) | | | 661,050 | | | | 661,050 | |
|
| |
U.S. Treasury 2 Year Notes | | | 33 | | | | December-2022 | | | | (6,744,633 | ) | | | 101,695 | | | | 101,695 | |
|
| |
U.S. Treasury Long Bonds | | | 339 | | | | December-2022 | | | | (40,849,500 | ) | | | 4,424,209 | | | | 4,424,209 | |
|
| |
U.S. Treasury Ultra Bonds | | | 26 | | | | December-2022 | | | | (3,319,063 | ) | | | 423,375 | | | | 423,375 | |
|
| |
Subtotal | | | | | | | | | | | | | | | 6,147,383 | | | | 6,147,383 | |
|
| |
Subtotal–Short Futures Contracts | | | | | | | | | | | | | | | 368,460 | | | | 368,460 | |
|
| |
Total Futures Contracts | | | | | | | | | | | | | | | $(2,470,103 | ) | | | $(2,470,103 | ) |
|
| |
| (a) | Futures contracts collateralized by $11,805,000 cash held with Goldman Sachs & Co. LLC, the futures commission merchant. |
| | | | | | | | | | | | | | | | | | | | | | |
| Open Forward Foreign Currency Contracts | |
|
| |
| | | | | Contract to | | | Unrealized Appreciation (Depreciation) | |
Settlement Date | | Counterparty | | Deliver | | | Receive | |
|
| |
Currency Risk | | | | | | | | | | | | | | | | | | | | |
|
| |
12/21/2022 | | Bank of America, N.A. | | | EUR | | | | 126,000 | | | | USD | | | | 125,823 | | | | $ 795 | |
|
| |
12/21/2022 | | Bank of America, N.A. | | | USD | | | | 109,128 | | | | EUR | | | | 112,000 | | | | 2,008 | |
|
| |
12/21/2022 | | J.P. Morgan Chase Bank, N.A. | | | USD | | | | 55,569 | | | | EUR | | | | 57,000 | | | | 992 | |
|
| |
12/21/2022 | | UBS AG | | | EUR | | | | 8,077,000 | | | | USD | | | | 8,129,969 | | | | 115,250 | |
|
| |
Subtotal–Appreciation | | | | | | | | | | | | | | | | | | | 119,045 | |
|
| |
| | | | | |
Currency Risk | | | | | | | | | | | | | | | | | | | | |
|
| |
12/21/2022 | | Bank of America, N.A. | | | USD | | | | 72,194 | | | | EUR | | | | 72,000 | | | | (749) | |
|
| |
12/21/2022 | | Canadian Imperial Bank of Commerce | | | USD | | | | 22,835 | | | | EUR | | | | 23,000 | | | | (13) | |
|
| |
12/21/2022 | | Royal Bank of Canada | | | EUR | | | | 919,482 | | | | USD | | | | 900,000 | | | | (12,392) | |
|
| |
12/21/2022 | | UBS AG | | | EUR | | | | 69,500 | | | | USD | | | | 68,149 | | | | (815) | |
|
| |
Subtotal–Depreciation | | | | | | | | | | | | | | | | | | | (13,969) | |
|
| |
Total Forward Foreign Currency Contracts | | | | | | | | | | | | | | | | | | | $105,076 | |
|
| |
| | | | | | | | | | | | | | | | | | | | | | | | | | | | | | | | | | | | |
| Open Centrally Cleared Credit Default Swap Agreements(a) | |
|
| |
| Reference Entity | | Buy/Sell Protection | | | (Pay)/
Receive Fixed Rate | | | Payment
Frequency | | | Maturity
Date | | | Implied
Credit
Spread(b) | | | Notional Value | | | Upfront
Payments Paid
(Received) | | | Value | | | Unrealized
Appreciation | |
|
| |
Credit Risk | | | | | | | | | | | | | | | | | | | | | | | | | | | | | | | | | | | | |
|
| |
Markit CDX North America High Yield Index, Series 38, Version 1 | | | Sell | | | | 5.00% | | | | Quarterly | | | | 06/20/2027 | | | | 4.793% | | | | USD 3,199,680 | | | | $(30,641) | | | | $27,767 | | | | $58,408 | |
|
| |
| (a) | Swaps are collateralized by $282,782 cash held with Merrill Lynch International, the Counterparty. |
| (b) | Implied credit spreads represent the current level, as of October 31, 2022, at which protection could be bought or sold given the terms of the existing credit default swap agreement and serve as an indicator of the current status of the payment/performance risk of the credit default swap agreement. An implied credit spread that has widened or increased since entry into the initial agreement may indicate a deteriorating credit profile and increased risk of default for the reference entity. A declining or narrowing spread may indicate an improving credit profile or decreased risk of default for the reference entity. Alternatively, credit spreads may increase or decrease reflecting the general tolerance for risk in the credit markets generally. |
See accompanying Notes to Financial Statements which are an integral part of the financial statements.
| | |
| 30 | | Invesco Multi-Asset Income Fund |
|
| Abbreviations: |
|
| EUR –Euro |
| USD –U.S. Dollar |
See accompanying Notes to Financial Statements which are an integral part of the financial statements.
| | |
| 31 | | Invesco Multi-Asset Income Fund |
Statement of Assets and Liabilities
October 31, 2022
| | | | |
Assets: | | | | |
| |
Investments in unaffiliated securities, at value
(Cost $1,197,007,625)* | | | $1,017,788,398 | |
|
| |
Investments in affiliated money market funds, at value
(Cost $247,644,962) | | | 247,649,932 | |
|
| |
Other investments: | | | | |
Variation margin receivable – futures contracts | | | 539,606 | |
|
| |
Variation margin receivable–centrally cleared swap agreements | | | 149,342 | |
|
| |
Unrealized appreciation on forward foreign currency contracts outstanding | | | 119,045 | |
|
| |
Deposits with brokers: | | | | |
Cash collateral – exchange-traded futures contracts | | | 11,805,000 | |
|
| |
Cash collateral – centrally cleared swap agreements | | | 282,782 | |
|
| |
Cash | | | 74,539,089 | |
|
| |
Foreign currencies, at value (Cost $103,414) | | | 104,641 | |
|
| |
Receivable for: | | | | |
Investments sold | | | 13,849,810 | |
|
| |
Fund shares sold | | | 108,777 | |
|
| |
Dividends | | | 1,096,102 | |
|
| |
Interest | | | 11,193,306 | |
|
| |
Principal paydowns | | | 19 | |
|
| |
Investment for trustee deferred compensation and retirement plans | | | 169,454 | |
|
| |
Other assets | | | 33,550 | |
|
| |
Total assets | | | 1,379,428,853 | |
|
| |
| |
Liabilities: | | | | |
Other investments: | | | | |
Unrealized depreciation on forward foreign currency contracts outstanding | | | 13,969 | |
|
| |
Payable for: | | | | |
Investments purchased | | | 65,567,799 | |
|
| |
Due to broker | | | 85,142,452 | |
|
| |
Fund shares reacquired | | | 1,461,127 | |
|
| |
Collateral upon return of securities loaned | | | 42,189,702 | |
|
| |
Accrued fees to affiliates | | | 605,246 | |
|
| |
Accrued trustees’ and officers’ fees and benefits | | | 1,539 | |
|
| |
Accrued other operating expenses | | | 840,636 | |
|
| |
Trustee deferred compensation and retirement plans | | | 212,409 | |
|
| |
Total liabilities | | | 196,034,879 | |
|
| |
Net assets applicable to shares outstanding | | | $1,183,393,974 | |
|
| |
| | | | |
Net assets consist of: | | | | |
Shares of beneficial interest | | $ | 1,964,231,185 | |
|
| |
Distributable earnings (loss) | | | (780,837,211 | ) |
|
| |
| | $ | 1,183,393,974 | |
|
| |
| |
Net Assets: | | | | |
Class A | | $ | 852,898,543 | |
|
| |
Class C | | $ | 84,143,299 | |
|
| |
Class R | | $ | 23,451,569 | |
|
| |
Class Y | | $ | 172,527,527 | |
|
| |
Class R5 | | $ | 63,225 | |
|
| |
Class R6 | | $ | 50,309,811 | |
|
| |
|
Shares outstanding, no par value, with an unlimited number of shares authorized: | |
Class A | | | 113,882,439 | |
|
| |
Class C | | | 11,238,704 | |
|
| |
Class R | | | 3,129,053 | |
|
| |
Class Y | | | 23,019,540 | |
|
| |
Class R5 | | | 8,442 | |
|
| |
Class R6 | | | 6,713,357 | |
|
| |
Class A: | | | | |
Net asset value per share | | $ | 7.49 | |
|
| |
Maximum offering price per share
(Net asset value of $7.49 ÷ 94.50%) | | $ | 7.93 | |
|
| |
Class C: | | | | |
Net asset value and offering price per share | | $ | 7.49 | |
|
| |
Class R: | | | | |
Net asset value and offering price per share | | $ | 7.49 | |
|
| |
Class Y: | | | | |
Net asset value and offering price per share | | $ | 7.49 | |
|
| |
Class R5: | | | | |
Net asset value and offering price per share | | $ | 7.49 | |
|
| |
Class R6: | | | | |
Net asset value and offering price per share | | $ | 7.49 | |
|
| |
| * | At October 31, 2022, securities with an aggregate value of $40,829,092 were on loan to brokers. |
See accompanying Notes to Financial Statements which are an integral part of the financial statements.
| | |
| 32 | | Invesco Multi-Asset Income Fund |
Statement of Operations
For the year ended October 31, 2022
| | | | |
Investment income: | | | | |
| |
Interest | | $ | 82,835,483 | |
|
| |
Dividends (net of foreign withholding taxes of $228,111) | | | 9,033,322 | |
|
| |
Dividends from affiliated money market funds (includes net securities lending income of $216,540) | | | 2,284,746 | |
|
| |
Total investment income | | | 94,153,551 | |
|
| |
| |
Expenses: | | | | |
Advisory fees | | | 6,539,622 | |
|
| |
Administrative services fees | | | 207,282 | |
|
| |
Custodian fees | | | 79,453 | |
|
| |
Distribution fees: | | | | |
Class A | | | 2,372,486 | |
|
| |
Class C | | | 1,154,134 | |
|
| |
Class R | | | 141,581 | |
|
| |
Transfer agent fees – A, C, R and Y | | | 1,707,433 | |
|
| |
Transfer agent fees – R5 | | | 71 | |
|
| |
Transfer agent fees – R6 | | | 18,461 | |
|
| |
Trustees’ and officers’ fees and benefits | | | 35,062 | |
|
| |
Registration and filing fees | | | 109,512 | |
|
| |
Licensing fees | | | 395,379 | |
|
| |
Reports to shareholders | | | 50,456 | |
|
| |
Professional services fees | | | 87,769 | |
|
| |
Other | | | 24,701 | |
|
| |
Total expenses | | | 12,923,402 | |
|
| |
Less: Fees waived, expenses reimbursed and/or expense offset arrangement(s) | | | (780,377 | ) |
|
| |
Net expenses | | | 12,143,025 | |
|
| |
Net investment income | | | 82,010,526 | |
|
| |
| |
Realized and unrealized gain (loss) from: | | | | |
Net realized gain (loss) from: | | | | |
Unaffiliated investment securities | | | (127,415,854 | ) |
|
| |
Affiliated investment securities | | | (17,369 | ) |
|
| |
Foreign currencies | | | 329,382 | |
|
| |
Forward foreign currency contracts | | | 1,498,084 | |
|
| |
Futures contracts | | | (20,731,187 | ) |
|
| |
Swap agreements | | | 124,095 | |
|
| |
| | | (146,212,849 | ) |
|
| |
Change in net unrealized appreciation (depreciation) of: | | | | |
Unaffiliated investment securities | | | (213,852,247 | ) |
|
| |
Affiliated investment securities | | | (7,869 | ) |
|
| |
Foreign currencies | | | (35,357 | ) |
|
| |
Forward foreign currency contracts | | | 44,155 | |
|
| |
Futures contracts | | | (4,311,387 | ) |
|
| |
Swap agreements | | | 58,408 | |
|
| |
| | | (218,104,297 | ) |
|
| |
Net realized and unrealized gain (loss) | | | (364,317,146 | ) |
|
| |
Net increase (decrease) in net assets resulting from operations | | $ | (282,306,620 | ) |
|
| |
See accompanying Notes to Financial Statements which are an integral part of the financial statements.
| | |
| 33 | | Invesco Multi-Asset Income Fund |
Statement of Changes in Net Assets
For the years ended October 31, 2022 and 2021
| | | | | | | | |
| | | 2022 | | | 2021 | |
|
| |
Operations: | | | | | | | | |
Net investment income | | $ | 82,010,526 | | | $ | 88,982,572 | |
|
| |
Net realized gain (loss) | | | (146,212,849 | ) | | | 82,998,501 | |
|
| |
Change in net unrealized appreciation (depreciation) | | | (218,104,297 | ) | | | 34,412,725 | |
|
| |
Net increase (decrease) in net assets resulting from operations | | | (282,306,620 | ) | | | 206,393,798 | |
|
| |
| | |
Distributions to shareholders from distributable earnings: | | | | | | | | |
Class A | | | (63,724,100 | ) | | | (71,763,758 | ) |
|
| |
Class C | | | (6,302,892 | ) | | | (8,990,275 | ) |
|
| |
Class R | | | (1,654,502 | ) | | | (2,967,083 | ) |
|
| |
Class Y | | | (14,535,382 | ) | | | (19,341,966 | ) |
|
| |
Class R5 | | | (4,645 | ) | | | (5,253 | ) |
|
| |
Class R6 | | | (3,841,106 | ) | | | (4,148,032 | ) |
|
| |
Total distributions from distributable earnings | | | (90,062,627 | ) | | | (107,216,367 | ) |
|
| |
| | |
Share transactions–net: | | | | | | | | |
Class A | | | (62,425,231 | ) | | | (94,140,757 | ) |
|
| |
Class C | | | (33,565,852 | ) | | | (74,779,394 | ) |
|
| |
Class R | | | (16,663,281 | ) | | | (11,542,014 | ) |
|
| |
Class Y | | | (43,908,235 | ) | | | (105,129,569 | ) |
|
| |
Class R5 | | | 3,957 | | | | (12,046 | ) |
|
| |
Class R6 | | | 665,585 | | | | (4,237,143 | ) |
|
| |
Net increase (decrease) in net assets resulting from share transactions | | | (155,893,057 | ) | | | (289,840,923 | ) |
|
| |
Net increase (decrease) in net assets | | | (528,262,304 | ) | | | (190,663,492 | ) |
|
| |
| | |
Net assets: | | | | | | | | |
Beginning of year | | | 1,711,656,278 | | | | 1,902,319,770 | |
|
| |
End of year | | $ | 1,183,393,974 | | | $ | 1,711,656,278 | |
|
| |
See accompanying Notes to Financial Statements which are an integral part of the financial statements.
| | |
| 34 | | Invesco Multi-Asset Income Fund |
Financial Highlights
The following schedule presents financial highlights for a share of the Fund outstanding throughout the periods indicated.
| | | | | | | | | | | | | | | | | | | | | | | | | | | | | | | | | | | | | | | | | | | | | | | | | | | | | | | | |
| | | Net asset value, beginning of period | | Net
investment
income(a) | | Net gains (losses) on securities (both realized and unrealized) | | Total from investment operations | | Dividends from net investment
income | | Distributions from net realized
gains | | Total
distributions | | Net asset value, end of period | | Total return (b) | | Net assets, end of period (000’s omitted) | | Ratio of expenses to average net assets with fee waivers
and/or expenses absorbed | | Ratio of expenses to average net assets without fee waivers
and/or expenses
absorbed | | Ratio of net investment income to average net assets | | Portfolio turnover (c) |
Class A | | | | | | | | | | | | | | | | | | | | | | | | | | | | | | | | | | | | | | | | | | | | | | | | | | | | | | | | |
Year ended 10/31/22 | | | $ 9.75 | | | | $0.50 | | | | $(2.21 | ) | | | $(1.71 | ) | | | $(0.55 | ) | | | $ - | | | | $(0.55 | ) | | | $ 7.49 | | | | (18.16 | )%(d) | | | $ 852,899 | | | | 0.82 | %(d) | | | 0.87 | %(d) | | | 5.68 | %(d) | | | 94 | % |
Year ended 10/31/21 | | | 9.26 | | | | 0.48 | | | | 0.59 | | | | 1.07 | | | | (0.58 | ) | | | - | | | | (0.58 | ) | | | 9.75 | | | | 11.73 | (d) | | | 1,178,389 | | | | 0.82 | (d) | | | 0.91 | (d) | | | 4.93 | (d) | | | 53 | |
Year ended 10/31/20 | | | 10.79 | | | | 0.58 | | | | (1.55 | ) | | | (0.97 | ) | | | (0.56 | ) | | | - | | | | (0.56 | ) | | | 9.26 | | | | (8.97 | )(d) | | | 1,209,154 | | | | 0.82 | (d) | | | 0.92 | (d) | | | 6.13 | (d) | | | 117 | |
Year ended 10/31/19 | | | 10.07 | | | | 0.55 | | | | 0.74 | | | | 1.29 | | | | (0.57 | ) | | | - | | | | (0.57 | ) | | | 10.79 | | | | 13.18 | | | | 188,655 | | | | 0.84 | | | | 0.97 | | | | 5.21 | | | | 76 | |
Year ended 10/31/18 | | | 11.01 | | | | 0.51 | | | | (0.84 | ) | | | (0.33 | ) | | | (0.52 | ) | | | (0.09 | ) | | | (0.61 | ) | | | 10.07 | | | | (3.13 | ) | | | 131,971 | | | | 0.85 | | | | 1.00 | | | | 4.76 | | | | 59 | |
Class C | | | | | | | | | | | | | | | | | | | | | | | | | | | | | | | | | | | | | | | | | | | | | | | | | | | | | | | | |
Year ended 10/31/22 | | | 9.75 | | | | 0.43 | | | | (2.21 | ) | | | (1.78 | ) | | | (0.48 | ) | | | - | | | | (0.48 | ) | | | 7.49 | | | | (18.80 | ) | | | 84,143 | | | | 1.59 | | | | 1.64 | | | | 4.91 | | | | 94 | |
Year ended 10/31/21 | | | 9.26 | | | | 0.40 | | | | 0.60 | | | | 1.00 | | | | (0.51 | ) | | | - | | | | (0.51 | ) | | | 9.75 | | | | 10.89 | | | | 147,030 | | | | 1.59 | | | | 1.68 | | | | 4.16 | | | | 53 | |
Year ended 10/31/20 | | | 10.78 | | | | 0.51 | | | | (1.54 | ) | | | (1.03 | ) | | | (0.49 | ) | | | - | | | | (0.49 | ) | | | 9.26 | | | | (9.58 | ) | | | 210,967 | | | | 1.59 | | | | 1.69 | | | | 5.36 | | | | 117 | |
Year ended 10/31/19 | | | 10.06 | | | | 0.47 | | | | 0.74 | | | | 1.21 | | | | (0.49 | ) | | | - | | | | (0.49 | ) | | | 10.78 | | | | 12.35 | | | | 118,619 | | | | 1.59 | | | | 1.72 | | | | 4.46 | | | | 76 | |
Year ended 10/31/18 | | | 11.00 | | | | 0.43 | | | | (0.84 | ) | | | (0.41 | ) | | | (0.44 | ) | | | (0.09 | ) | | | (0.53 | ) | | | 10.06 | | | | (3.87 | ) | | | 85,370 | | | | 1.60 | | | | 1.75 | | | | 4.01 | | | | 59 | |
Class R | | | | | | | | | | | | | | | | | | | | | | | | | | | | | | | | | | | | | | | | | | | | | | | | | | | | | | | | |
Year ended 10/31/22 | | | 9.76 | | | | 0.47 | | | | (2.22 | ) | | | (1.75 | ) | | | (0.52 | ) | | | - | | | | (0.52 | ) | | | 7.49 | | | | (18.47 | ) | | | 23,452 | | | | 1.09 | | | | 1.14 | | | | 5.41 | | | | 94 | |
Year ended 10/31/21 | | | 9.27 | | | | 0.45 | | | | 0.59 | | | | 1.04 | | | | (0.55 | ) | | | - | | | | (0.55 | ) | | | 9.76 | | | | 11.43 | | | | 47,214 | | | | 1.09 | | | | 1.18 | | | | 4.66 | | | | 53 | |
Year ended 10/31/20 | | | 10.78 | | | | 0.55 | | | | (1.52 | ) | | | (0.97 | ) | | | (0.54 | ) | | | - | | | | (0.54 | ) | | | 9.27 | | | | (9.02 | ) | | | 55,930 | | | | 1.09 | | | | 1.19 | | | | 5.86 | | | | 117 | |
Year ended 10/31/19 | | | 10.07 | | | | 0.52 | | | | 0.74 | | | | 1.26 | | | | (0.55 | ) | | | - | | | | (0.55 | ) | | | 10.78 | | | | 12.80 | | | | 5,202 | | | | 1.09 | | | | 1.22 | | | | 4.96 | | | | 76 | |
Year ended 10/31/18 | | | 11.01 | | | | 0.48 | | | | (0.84 | ) | | | (0.36 | ) | | | (0.49 | ) | | | (0.09 | ) | | | (0.58 | ) | | | 10.07 | | | | (3.38 | ) | | | 2,220 | | | | 1.10 | | | | 1.25 | | | | 4.51 | | | | 59 | |
Class Y | | | | | | | | | | | | | | | | | | | | | | | | | | | | | | | | | | | | | | | | | | | | | | | | | | | | | | | | |
Year ended 10/31/22 | | | 9.76 | | | | 0.52 | | | | (2.22 | ) | | | (1.70 | ) | | | (0.57 | ) | | | - | | | | (0.57 | ) | | | 7.49 | | | | (18.05 | ) | | | 172,528 | | | | 0.59 | | | | 0.64 | | | | 5.91 | | | | 94 | |
Year ended 10/31/21 | | | 9.27 | | | | 0.50 | | | | 0.59 | | | | 1.09 | | | | (0.60 | ) | | | - | | | | (0.60 | ) | | | 9.76 | | | | 11.99 | | | | 274,095 | | | | 0.59 | | | | 0.68 | | | | 5.16 | | | | 53 | |
Year ended 10/31/20 | | | 10.79 | | | | 0.62 | | | | (1.55 | ) | | | (0.93 | ) | | | (0.59 | ) | | | - | | | | (0.59 | ) | | | 9.27 | | | | (8.65 | ) | | | 360,565 | | | | 0.59 | | | | 0.69 | | | | 6.36 | | | | 117 | |
Year ended 10/31/19 | | | 10.07 | | | | 0.57 | | | | 0.75 | | | | 1.32 | | | | (0.60 | ) | | | - | | | | (0.60 | ) | | | 10.79 | | | | 13.47 | | | | 397,303 | | | | 0.59 | | | | 0.72 | | | | 5.46 | | | | 76 | |
Year ended 10/31/18 | | | 11.01 | | | | 0.53 | | | | (0.83 | ) | | | (0.30 | ) | | | (0.55 | ) | | | (0.09 | ) | | | (0.64 | ) | | | 10.07 | | | | (2.89 | ) | | | 288,116 | | | | 0.60 | | | | 0.75 | | | | 5.01 | | | | 59 | |
Class R5 | | | | | | | | | | | | | | | | | | | | | | | | | | | | | | | | | | | | | | | | | | | | | | | | | | | | | | | | |
Year ended 10/31/22 | | | 9.75 | | | | 0.52 | | | | (2.21 | ) | | | (1.69 | ) | | | (0.57 | ) | | | - | | | | (0.57 | ) | | | 7.49 | | | | (17.97 | ) | | | 63 | | | | 0.59 | | | | 0.62 | | | | 5.91 | | | | 94 | |
Year ended 10/31/21 | | | 9.27 | | | | 0.50 | | | | 0.58 | | | | 1.08 | | | | (0.60 | ) | | | - | | | | (0.60 | ) | | | 9.75 | | | | 11.89 | | | | 78 | | | | 0.59 | | | | 0.60 | | | | 5.16 | | | | 53 | |
Year ended 10/31/20 | | | 10.79 | | | | 0.62 | | | | (1.55 | ) | | | (0.93 | ) | | | (0.59 | ) | | | - | | | | (0.59 | ) | | | 9.27 | | | | (8.63 | ) | | | 85 | | | | 0.59 | | | | 0.63 | | | | 6.36 | | | | 117 | |
Year ended 10/31/19 | | | 10.08 | | | | 0.57 | | | | 0.74 | | | | 1.31 | | | | (0.60 | ) | | | - | | | | (0.60 | ) | | | 10.79 | | | | 13.35 | | | | 104 | | | | 0.59 | | | | 0.68 | | | | 5.46 | | | | 76 | |
Year ended 10/31/18 | | | 11.01 | | | | 0.53 | | | | (0.82 | ) | | | (0.29 | ) | | | (0.55 | ) | | | (0.09 | ) | | | (0.64 | ) | | | 10.08 | | | | (2.79 | ) | | | 150 | | | | 0.60 | | | | 0.69 | | | | 5.01 | | | | 59 | |
Class R6 | | | | | | | | | | | | | | | | | | | | | | | | | | | | | | | | | | | | | | | | | | | | | | | | | | | | | | | | |
Year ended 10/31/22 | | | 9.76 | | | | 0.52 | | | | (2.22 | ) | | | (1.70 | ) | | | (0.57 | ) | | | - | | | | (0.57 | ) | | | 7.49 | | | | (18.01 | ) | | | 50,310 | | | | 0.54 | | | | 0.55 | | | | 5.96 | | | | 94 | |
Year ended 10/31/21 | | | 9.27 | | | | 0.51 | | | | 0.59 | | | | 1.10 | | | | (0.61 | ) | | | - | | | | (0.61 | ) | | | 9.76 | | | | 12.05 | | | | 64,850 | | | | 0.54 | | | | 0.55 | | | | 5.21 | | | | 53 | |
Year ended 10/31/20 | | | 10.79 | | | | 0.62 | | | | (1.55 | ) | | | (0.93 | ) | | | (0.59 | ) | | | - | | | | (0.59 | ) | | | 9.27 | | | | (8.59 | ) | | | 65,618 | | | | 0.53 | | | | 0.54 | | | | 6.42 | | | | 117 | |
Year ended 10/31/19 | | | 10.07 | | | | 0.57 | | | | 0.75 | | | | 1.32 | | | | (0.60 | ) | | | - | | | | (0.60 | ) | | | 10.79 | | | | 13.47 | | | | 59,569 | | | | 0.59 | | | | 0.60 | | | | 5.46 | | | | 76 | |
Year ended 10/31/18 | | | 11.01 | | | | 0.53 | | | | (0.83 | ) | | | (0.30 | ) | | | (0.55 | ) | | | (0.09 | ) | | | (0.64 | ) | | | 10.07 | | | | (2.89 | ) | | | 53,904 | | | | 0.60 | | | | 0.63 | | | | 5.01 | | | | 59 | |
| (a) | Calculated using average shares outstanding. |
| (b) | Includes adjustments in accordance with accounting principles generally accepted in the United States of America and as such, the net asset value for financial reporting purposes and the returns based upon those net asset values may differ from the net asset value and returns for shareholder transactions. Does not include sales charges and is not annualized for periods less than one year, if applicable. |
| (c) | Portfolio turnover is calculated at the fund level and is not annualized for periods less than one year, if applicable. For the year ended October 31, 2020, the portfolio turnover calculation excludes the value of securities purchased of $1,279,950,104 in connection with the acquisition of Invesco Oppenheimer Capital Income Fund and Invesco Oppenheimer Global Multi-Asset Income Fund into the Fund. |
| (d) | The total return, ratio of expenses to average net assets and ratio of net investment income to average net assets reflect actual 12b-1 fees of 0.23% for Class A for the years ended October 31, 2022, 2021 and 2020. |
See accompanying Notes to Financial Statements which are an integral part of the financial statements.
| | |
| 35 | | Invesco Multi-Asset Income Fund |
Notes to Financial Statements
October 31, 2022
NOTE 1–Significant Accounting Policies
Invesco Multi-Asset Income Fund (the “Fund”) is a series portfolio of AIM Investment Funds (Invesco Investment Funds) (the “Trust”). The Trust is organized as a Delaware statutory trust and is registered under the Investment Company Act of 1940, as amended (the “1940 Act”), as an open-end series management investment company authorized to issue an unlimited number of shares of beneficial interest. Information presented in these financial statements pertains only to the Fund. Matters affecting the Fund or each class will be voted on exclusively by the shareholders of the Fund or each class.
The Fund’s investment objective is to provide current income.
The Fund currently consists of six different classes of shares: Class A, Class C, Class R, Class Y, Class R5 and Class R6. Class Y shares are available only to certain investors. Class A shares are sold with a front-end sales charge unless certain waiver criteria are met. Under certain circumstances, load waived shares may be subject to contingent deferred sales charges (“CDSC”). Class C shares are sold with a CDSC. Class R, Class Y, Class R5 and Class R6 shares are sold at net asset value. Class C shares held for eight years after purchase are eligible for automatic conversion into Class A shares of the same Fund (the “Conversion Feature”). The automatic conversion pursuant to the Conversion Feature will generally occur at the end of the month following the eighth anniversary after a purchase of Class C shares.
The Fund is an investment company and accordingly follows the investment company accounting and reporting guidance in accordance with Financial Accounting Standards Board Accounting Standards Codification Topic 946, Financial Services – Investment Companies.
The following is a summary of the significant accounting policies followed by the Fund in the preparation of its financial statements.
| A. | Security Valuations – Securities, including restricted securities, are valued according to the following policy. |
Fixed income securities (including convertible debt securities) generally are valued on the basis of prices provided by independent pricing services. Prices provided by the pricing service may be determined without exclusive reliance on quoted prices, and may reflect appropriate factors such as institution-size trading in similar groups of securities, developments related to specific securities, dividend rate (for unlisted equities), yield (for debt obligations), quality, type of issue, coupon rate (for debt obligations), maturity (for debt obligations), individual trading characteristics and other market data. Pricing services generally value debt obligations assuming orderly transactions of institutional round lot size, but a fund may hold or transact in the same securities in smaller, odd lot sizes. Odd lots often trade at lower prices than institutional round lots, and their value may be adjusted accordingly. Debt obligations are subject to interest rate and credit risks. In addition, all debt obligations involve some risk of default with respect to interest and/or principal payments.
A security listed or traded on an exchange is generally valued at its trade price or official closing price that day as of the close of the exchange where the security is principally traded, or lacking any trades or official closing price on a particular day, the security may be valued at the closing bid price on that day. Securities traded in the over-the-counter market are valued based on prices furnished by independent pricing services or market makers. When such securities are valued using prices provided by an independent pricing service they may be considered fair valued. Futures contracts are valued at the daily settlement price set by an exchange on which they are principally traded. U.S. exchange-traded options are valued at the mean between the last bid and asked prices from the exchange on which they are principally traded. Non-U.S. exchange-traded options are valued at the final settlement price set by the exchange on which they trade. Options not listed on an exchange and swaps generally are valued using pricing provided from independent pricing services.
Securities of investment companies that are not exchange-traded (e.g., open-end mutual funds) are valued using such company’s end-of-business-day net asset value per share.
Deposits, other obligations of U.S. and non-U.S. banks and financial institutions are valued at their daily account value.
Swap agreements are fair valued using an evaluated quote, if available, provided by an independent pricing service. Evaluated quotes provided by the pricing service are valued based on a model which may include end-of-day net present values, spreads, ratings, industry, company performance and returns of referenced assets. Centrally cleared swap agreements are valued at the daily settlement price determined by the relevant exchange or clearinghouse.
Foreign securities’ (including foreign exchange contracts) prices are converted into U.S. dollar amounts using the applicable exchange rates as of the close of the New York Stock Exchange (“NYSE”). If market quotations are available and reliable for foreign exchange-traded equity securities, the securities will be valued at the market quotations. Invesco Advisers, Inc. (the “Adviser” or “Invesco”) may use various pricing services to obtain market quotations as well as fair value prices. Because trading hours for certain foreign securities end before the close of the NYSE, closing market quotations may become not representative of market value in the Adviser’s judgment (“unreliable”). If, between the time trading ends on a particular security and the close of the customary trading session on the NYSE, a significant event occurs that makes the closing price of the security unreliable, the Adviser may fair value the security. If the event is likely to have affected the closing price of the security, the security will be valued at fair value in good faith in accordance with Board- approved policies and related Adviser procedures (“Valuation Procedures”). Adjustments to closing prices to reflect fair value may also be based on a screening process of an independent pricing service to indicate the degree of certainty, based on historical data, that the closing price in the principal market where a foreign security trades is not the current value as of the close of the NYSE. Foreign securities’ prices meeting the degree of certainty that the price is not reflective of current value will be priced at the indication of fair value from the independent pricing service. Multiple factors may be considered by the independent pricing service in determining adjustments to reflect fair value and may include information relating to sector indices, American Depositary Receipts and domestic and foreign index futures. Foreign securities may have additional risks including exchange rate changes, potential for sharply devalued currencies and high inflation, political and economic upheaval, the relative lack of issuer information, relatively low market liquidity and the potential lack of strict financial and accounting controls and standards.
Unlisted securities will be valued using prices provided by independent pricing services or by another method that the Adviser, in its judgment, believes better reflects the security’s fair value in accordance with the Valuation Procedures.
Securities for which market prices are not provided by any of the above methods may be valued based upon quotes furnished by independent sources. The last bid price may be used to value equity securities. The mean between the last bid and asked prices may be used to value debt obligations, including corporate loans.
Securities for which market quotations are not readily available are fair valued by the Adviser in accordance with the Valuation Procedures. If a fair value price provided by a pricing service is unreliable, the Adviser will fair value the security using the Valuation Procedures. Issuer specific events, market trends, bid/asked quotes of brokers and information providers and other market data may be reviewed in the course of making a good faith determination of a security’s fair value.
The Fund may invest in securities that are subject to interest rate risk, meaning the risk that the prices will generally fall as interest rates rise and, conversely, the prices will generally rise as interest rates fall. Specific securities differ in their sensitivity to changes in interest rates depending on their individual characteristics. Changes in interest rates may result in increased market volatility, which may affect the value and/or liquidity of certain Fund investments.
Valuations change in response to many factors including the historical and prospective earnings of the issuer, the value of the issuer’s assets, general market conditions which are not specifically related to the particular issuer, such as real or perceived adverse economic conditions, changes in the general outlook for revenues or corporate earnings, changes in interest or currency rates, regional or global instability, natural or environmental disasters, widespread disease or other public health issues, war, acts of terrorism, significant governmental actions or adverse investor sentiment generally and market liquidity. Because of the inherent uncertainties of valuation, the values reflected in the financial statements may materially differ from the value received upon actual sale of those investments.
The price the Fund could receive upon the sale of any investment may differ from the Adviser’s valuation of the investment, particularly for securities that are valued using a fair valuation technique. When fair valuation techniques are applied, the Adviser uses available information, including both observable and unobservable inputs and assumptions, to determine a methodology that will result in a valuation that the Adviser believes approximates market value. Fund
| | |
| 36 | | Invesco Multi-Asset Income Fund |
securities that are fair valued may be subject to greater fluctuation in their value from one day to the next than would be the case if market quotations were used. Because of the inherent uncertainties of valuation, and the degree of subjectivity in such decisions, the Fund could realize a greater or lesser than expected gain or loss upon the sale of the investment.
| B. | Securities Transactions and Investment Income – Securities transactions are accounted for on a trade date basis. Realized gains or losses on sales are computed on the basis of specific identification of the securities sold. Interest income (net of withholding tax, if any) is recorded on an accrual basis from settlement date and includes coupon interest and amortization of premium and accretion of discount on debt securities as applicable. Pay-in-kind interest income and non-cash dividend income received in the form of securities in-lieu of cash are recorded at the fair value of the securities received. Paydown gains and losses on mortgage and asset-backed securities are recorded as adjustments to interest income. Dividend income (net of withholding tax, if any) is recorded on the ex-dividend date. |
The Fund may periodically participate in litigation related to Fund investments. As such, the Fund may receive proceeds from litigation settlements. Any proceeds received are included in the Statement of Operations as realized gain (loss) for investments no longer held and as unrealized gain (loss) for investments still held.
Brokerage commissions and mark ups are considered transaction costs and are recorded as an increase to the cost basis of securities purchased and/or a reduction of proceeds on a sale of securities. Such transaction costs are included in the determination of net realized and unrealized gain (loss) from investment securities reported in the Statement of Operations and the Statement of Changes in Net Assets and the net realized and unrealized gains (losses) on securities per share in the Financial Highlights. Transaction costs are included in the calculation of the Fund’s net asset value and, accordingly, they reduce the Fund’s total returns. These transaction costs are not considered operating expenses and are not reflected in net investment income reported in the Statement of Operations and the Statement of Changes in Net Assets, or the net investment income per share and the ratios of expenses and net investment income reported in the Financial Highlights, nor are they limited by any expense limitation arrangements between the Fund and the investment adviser.
The Fund allocates income and realized and unrealized capital gains and losses to a class based on the relative net assets of each class.
The Fund recharacterizes distributions received from REIT investments based on information provided by the REIT into the following categories: ordinary income, long-term and short-term capital gains, and return of capital. If information is not available on a timely basis from the REIT, the recharacterization will be based on available information which may include the previous year’s allocation. If new or additional information becomes available from the REIT at a later date, a recharacterization will be made in the following year. The Fund records as dividend income the amount recharacterized as ordinary income and as realized gain the amount recharacterized as capital gain in the Statement of Operations, and the amount recharacterized as return of capital as a reduction of the cost of the related investment. These recharacterizations are reflected in the accompanying financial statements.
| C. | Country Determination – For the purposes of making investment selection decisions and presentation in the Schedule of Investments, the investment adviser may determine the country in which an issuer is located and/or credit risk exposure based on various factors. These factors include the laws of the country under which the issuer is organized, where the issuer maintains a principal office, the country in which the issuer derives 50% or more of its total revenues, the country that has the primary market for the issuer’s securities and its “country of risk” as determined by a third party service provider, as well as other criteria. Among the other criteria that may be evaluated for making this determination are the country in which the issuer maintains 50% or more of its assets, the type of security, financial guarantees and enhancements, the nature of the collateral and the sponsor organization. Country of issuer and/or credit risk exposure has been determined to be the United States of America, unless otherwise noted. |
| D. | Distributions – Distributions from net investment income, if any, are declared and paid monthly. Distributions from net realized capital gain, if any, are generally declared and paid annually and recorded on the ex-dividend date. The Fund may elect to treat a portion of the proceeds from redemptions as distributions for federal income tax purposes. |
| E. | Master Limited Partnerships – The Fund invests in Master Limited Partnerships (“MLPs”). MLPs are publicly traded partnerships and limited liability companies taxed as partnerships under the Internal Revenue Code of 1986, as amended (the “Internal Revenue Code”). The Fund invests in MLPs engaged in, among other things, the transportation, storage, processing, refining, marketing, exploration, production and mining of minerals and natural resources. The Fund is a partner in each MLP; accordingly, the Fund is required to take into account the Fund’s allocable share of income, gains, losses, deductions, expenses, and tax credits recognized by each MLP. |
MLP’s may be less liquid and subject to more abrupt or erratic price movements than conventional publicly traded securities.
| F. | Federal Income Taxes – The Fund intends to comply with the requirements of Subchapter M of the Internal Revenue Code of 1986, as amended (the “Internal Revenue Code”), necessary to qualify as a regulated investment company and to distribute substantially all of the Fund’s taxable earnings to shareholders. As such, the Fund will not be subject to federal income taxes on otherwise taxable income (including net realized capital gain) that is distributed to shareholders. Therefore, no provision for federal income taxes is recorded in the financial statements. |
The Fund recognizes the tax benefits of uncertain tax positions only when the position is more likely than not to be sustained. Management has analyzed the Fund’s uncertain tax positions and concluded that no liability for unrecognized tax benefits should be recorded related to uncertain tax positions. Management is not aware of any tax positions for which it is reasonably possible that the total amounts of unrecognized tax benefits will change materially in the next 12 months.
The Fund files tax returns in the U.S. Federal jurisdiction and certain other jurisdictions. Generally, the Fund is subject to examinations by such taxing authorities for up to three years after the filing of the return for the tax period.
| G. | Expenses – Fees provided for under the Rule 12b-1 plan of a particular class of the Fund are charged to the operations of such class. Transfer agency fees and expenses and other shareholder recordkeeping fees and expenses attributable to Class R5 and Class R6 are allocated based on relative net assets of Class R5 and Class R6. Sub-accounting fees attributable to Class R5 are charged to the operations of the class. Transfer agency fees and expenses and other shareholder recordkeeping fees and expenses relating to all other classes are allocated among those classes based on relative net assets. All other expenses are allocated among the classes based on relative net assets. |
| H. | Accounting Estimates – The preparation of financial statements in conformity with accounting principles generally accepted in the United States of America (“GAAP”) requires management to make estimates and assumptions that affect the reported amounts of assets and liabilities at the date of the financial statements and the reported amounts of revenues and expenses during the reporting period including estimates and assumptions related to taxation. Actual results could differ from those estimates by a significant amount. In addition, the Fund monitors for material events or transactions that may occur or become known after the period-end date and before the date the financial statements are released to print. |
| I. | Indemnifications – Under the Trust’s organizational documents, each Trustee, officer, employee or other agent of the Trust is indemnified against certain liabilities that may arise out of the performance of their duties to the Fund. Additionally, in the normal course of business, the Fund enters into contracts, including the Fund’s servicing agreements, that contain a variety of indemnification clauses. The Fund’s maximum exposure under these arrangements is unknown as this would involve future claims that may be made against the Fund that have not yet occurred. The risk of material loss as a result of such indemnification claims is considered remote. |
| J. | Equity-Linked Notes – The Fund may invest in Equity-Linked Notes (ELNs). ELNs are hybrid derivative-type instruments, in a single note form, that are specially designed to combine the characteristics of one or more reference securities (such as a single stock, an exchange traded fund, exchange-traded note, or an index or basket of securities (underlying securities)) and a related equity derivative, such as a put or call option. Generally, when purchasing an ELN, a Fund pays the counterparty the current value of the underlying securities plus a commission. Upon the maturity of the note, the Fund generally receives the par value of the note plus a return based on the appreciation of the underlying securities. Investments in ELNs possess the risks associated with the underlying securities, such as management risk, market risk and, as applicable, foreign securities and currency risks. In addition, as a note, ELNs are also subject to certain debt securities |
| | |
| 37 | | Invesco Multi-Asset Income Fund |
| | risks, such as interest rate and credit risk. An investment in an ELN also bears the risk that the ELN issuer will default or become bankrupt. In such an event, the Fund may have difficulty being repaid, or fail to be repaid, the principal amount of, or income from, its investment. As the holder of an ELN, the Fund generally has no rights to the underlying securities, including no voting rights or rights to receive dividends. Should the prices of the underlying securities move in an unexpected manner, the Fund may not achieve the anticipated benefits of its ELN investments, and it may realize losses, which could be significant and could include the Fund’s entire principal investment. |
| K. | Securities Lending – The Fund may lend portfolio securities having a market value up to one-third of the Fund’s total assets. Such loans are secured by collateral equal to no less than the market value of the loaned securities determined daily by the securities lending provider. Such collateral will be cash or debt securities issued or guaranteed by the U.S. Government or any of its sponsored agencies. Cash collateral received in connection with these loans is invested in short-term money market instruments or affiliated, unregistered investment companies that comply with Rule 2a-7 under the 1940 Act and money market funds (collectively, “affiliated money market funds”) and is shown as such on the Schedule of Investments. The Fund bears the risk of loss with respect to the investment of collateral. It is the Fund’s policy to obtain additional collateral from or return excess collateral to the borrower by the end of the next business day, following the valuation date of the securities loaned. Therefore, the value of the collateral held may be temporarily less than the value of the securities on loan. When loaning securities, the Fund retains certain benefits of owning the securities, including the economic equivalent of dividends or interest generated by the security. Lending securities entails a risk of loss to the Fund if, and to the extent that, the market value of the securities loaned were to increase and the borrower did not increase the collateral accordingly, and the borrower failed to return the securities. The securities loaned are subject to termination at the option of the borrower or the Fund. Upon termination, the borrower will return to the Fund the securities loaned and the Fund will return the collateral. Upon the failure of the borrower to return the securities, collateral may be liquidated and the securities may be purchased on the open market to replace the loaned securities. The Fund could experience delays and costs in gaining access to the collateral and the securities may lose value during the delay which could result in potential losses to the Fund. Some of these losses may be indemnified by the lending agent. The Fund bears the risk of any deficiency in the amount of the collateral available for return to the borrower due to any loss on the collateral invested. Dividends received on cash collateral investments for securities lending transactions, which are net of compensation to counterparties, are included in Dividends from affiliated money market funds on the Statement of Operations. The aggregate value of securities out on loan, if any, is shown as a footnote on the Statement of Assets and Liabilities. |
The Adviser serves as an affiliated securities lending agent for the Fund. The Bank of New York Mellon also serves as a lending agent. To the extent the Fund utilizes the Adviser as an affiliated securities lending agent, the Fund conducts its securities lending in accordance with, and in reliance upon, no-action letters issued by the SEC staff that provide guidance on how an affiliate may act as a direct agent lender and receive compensation for those services in a manner consistent with the federal securities laws. For the year ended October 31, 2022, the Fund paid the Adviser $9,744 in fees for securities lending agent services. Fees paid to the Adviser for securities lending agent services are included in Dividends from affiliated money market funds on the Statement of Operations.
| L. | Foreign Currency Translations – Foreign currency is valued at the close of the NYSE based on quotations posted by banks and major currency dealers. Portfolio securities and other assets and liabilities denominated in foreign currencies are translated into U.S. dollar amounts at the date of valuation. Purchases and sales of portfolio securities (net of foreign taxes withheld on disposition) and income items denominated in foreign currencies are translated into U.S. dollar amounts on the respective dates of such transactions. The Fund does not separately account for the portion of the results of operations resulting from changes in foreign exchange rates on investments and the fluctuations arising from changes in market prices of securities held. The combined results of changes in foreign exchange rates and the fluctuation of market prices on investments (net of estimated foreign tax withholding) are included with the net realized and unrealized gain or loss from investments in the Statement of Operations. Reported net realized foreign currency gains or losses arise from (1) sales of foreign currencies, (2) currency gains or losses realized between the trade and settlement dates on securities transactions, and (3) the difference between the amounts of dividends, interest, and foreign withholding taxes recorded on the Fund’s books and the U.S. dollar equivalent of the amounts actually received or paid. Net unrealized foreign currency gains and losses arise from changes in the fair values of assets and liabilities, other than investments in securities at fiscal period end, resulting from changes in exchange rates. |
The Fund may invest in foreign securities, which may be subject to foreign taxes on income, gains on investments or currency repatriation, a portion of which may be recoverable. Foreign taxes, if any, are recorded based on the tax regulations and rates that exist in the foreign markets in which the Fund invests and are shown in the Statement of Operations.
| M. | Forward Foreign Currency Contracts – The Fund may engage in foreign currency transactions either on a spot (i.e. for prompt delivery and settlement) basis, or through forward foreign currency contracts, to manage or minimize currency or exchange rate risk. |
The Fund may also enter into forward foreign currency contracts for the purchase or sale of a security denominated in a foreign currency in order to “lock in” the U.S. dollar price of that security, or the Fund may also enter into forward foreign currency contracts that do not provide for physical exchange of the two currencies on the settlement date, but instead are settled by a single cash payment calculated as the difference between the agreed upon exchange rate and the spot rate at settlement based upon an agreed upon notional amount (non-deliverable forwards).
A forward foreign currency contract is an obligation between two parties (“Counterparties”) to purchase or sell a specific currency for an agreed-upon price at a future date. The use of forward foreign currency contracts for hedging does not eliminate fluctuations in the price of the underlying securities the Fund owns or intends to acquire but establishes a rate of exchange in advance. Fluctuations in the value of these contracts are measured by the difference in the contract date and reporting date exchange rates and are recorded as unrealized appreciation (depreciation) until the contracts are closed. When the contracts are closed, realized gains (losses) are recorded. Realized and unrealized gains (losses) on the contracts are included in the Statement of Operations. The primary risks associated with forward foreign currency contracts include failure of the Counterparty to meet the terms of the contract and the value of the foreign currency changing unfavorably. These risks may be in excess of the amounts reflected in the Statement of Assets and Liabilities.
| N. | Futures Contracts – The Fund may enter into futures contracts to manage exposure to interest rate, equity and market price movements and/or currency risks. A futures contract is an agreement between two parties (“Counterparties”) to purchase or sell a specified underlying security, currency or commodity (or delivery of a cash settlement price, in the case of an index future) for a fixed price at a future date. The Fund currently invests only in exchange-traded futures and they are standardized as to maturity date and underlying financial instrument or asset. Initial margin deposits required upon entering into futures contracts are satisfied by the segregation of specific securities or cash as collateral at the futures commission merchant (broker). During the period the futures contracts are open, changes in the value of the contracts are recognized as unrealized gains or losses by recalculating the value of the contracts on a daily basis. Subsequent or variation margin payments are received or made depending upon whether unrealized gains or losses are incurred. These amounts are reflected as receivables or payables on the Statement of Assets and Liabilities. When the contracts are closed or expire, the Fund recognizes a realized gain or loss equal to the difference between the proceeds from, or cost of, the closing transaction and the Fund’s basis in the contract. The net realized gain (loss) and the change in unrealized gain (loss) on futures contracts held during the period is included on the Statement of Operations. The primary risks associated with futures contracts are market risk and the absence of a liquid secondary market. If the Fund were unable to liquidate a futures contract and/or enter into an offsetting closing transaction, the Fund would continue to be subject to market risk with respect to the value of the contracts and continue to be required to maintain the margin deposits on the futures contracts. Futures contracts have minimal Counterparty risk since the exchange’s clearinghouse, as Counterparty to all exchange-traded futures, guarantees the futures against default. Risks may exceed amounts recognized in the Statement of Assets and Liabilities. |
| O. | Swap Agreements – The Fund may enter into various swap transactions, including interest rate, total return, index, currency and credit default swap contracts (“CDS”) for investment purposes or to manage interest rate, currency or credit risk. Such transactions are agreements between Counterparties. A swap agreement may be negotiated bilaterally and traded over-the-counter (“OTC”) between two parties (“uncleared/ OTC”) or, in some instances, must be transacted |
| | |
| 38 | | Invesco Multi-Asset Income Fund |
| | through a future commission merchant (“FCM”) and cleared through a clearinghouse that serves as a central Counterparty (“centrally cleared swap”). These agreements may contain among other conditions, events of default and termination events, and various covenants and representations such as provisions that require the Fund to maintain a pre-determined level of net assets, and/ or provide limits regarding the decline of the Fund’s net asset value (“NAV”) per share over specific periods of time. If the Fund were to trigger such provisions and have open derivative positions at that time, the Counterparty may be able to terminate such agreement and request immediate payment in an amount equal to the net liability positions, if any. |
Interest rate, total return, index, and currency swap agreements are two-party contracts entered into primarily to exchange the returns (or differentials in rates of returns) earned or realized on particular predetermined investments or instruments. The gross returns to be exchanged or “swapped” between the parties are calculated with respect to a notional amount, i.e., the return on or increase in value of a particular dollar amount invested at a particular interest rate or return of an underlying asset, in a particular foreign currency, or in a “basket” of securities representing a particular index.
In a centrally cleared swap, the Fund’s ultimate Counterparty is a central clearinghouse. The Fund initially will enter into centrally cleared swaps through an executing broker. When a fund enters into a centrally cleared swap, it must deliver to the central Counterparty (via the FCM) an amount referred to as “initial margin.” Initial margin requirements are determined by the central Counterparty, but an FCM may require additional initial margin above the amount required by the central Counterparty. Initial margin deposits required upon entering into centrally cleared swaps are satisfied by cash or securities as collateral at the FCM. Securities deposited as initial margin are designated on the Schedule of Investments and cash deposited is recorded on the Statement of Assets and Liabilities. During the term of a cleared swap agreement, a “variation margin” amount may be required to be paid by the Fund or may be received by the Fund, based on the daily change in price of the underlying reference instrument subject to the swap agreement and is recorded as a receivable or payable for variation margin in the Statement of Assets and Liabilities until the centrally cleared swap is terminated at which time a realized gain or loss is recorded.
A CDS is an agreement between Counterparties to exchange the credit risk of an issuer. A buyer of a CDS is said to buy protection by paying a fixed payment over the life of the agreement and in some situations an upfront payment to the seller of the CDS. If a defined credit event occurs (such as payment default or bankruptcy), the Fund as a protection buyer would cease paying its fixed payment, the Fund would deliver eligible bonds issued by the reference entity to the seller, and the seller would pay the full notional value, or the “par value”, of the referenced obligation to the Fund. A seller of a CDS is said to sell protection and thus would receive a fixed payment over the life of the agreement and an upfront payment, if applicable. If a credit event occurs, the Fund as a protection seller would cease to receive the fixed payment stream, the Fund would pay the buyer “par value” or the full notional value of the referenced obligation, and the Fund would receive the eligible bonds issued by the reference entity. In turn, these bonds may be sold in order to realize a recovery value. Alternatively, the seller of the CDS and its Counterparty may agree to net the notional amount and the market value of the bonds and make a cash payment equal to the difference to the buyer of protection. If no credit event occurs, the Fund receives the fixed payment over the life of the agreement. As the seller, the Fund would effectively add leverage to its portfolio because, in addition to its total net assets, the Fund would be subject to investment exposure on the notional amount of the CDS. In connection with these agreements, cash and securities may be identified as collateral in accordance with the terms of the respective swap agreements to provide assets of value and recourse in the event of default under the swap agreement or bankruptcy/insolvency of a party to the swap agreement. If a Counterparty becomes bankrupt or otherwise fails to perform its obligations due to financial difficulties, the Fund may experience significant delays in obtaining any recovery in a bankruptcy or other reorganization proceeding. The Fund may obtain only limited recovery or may obtain no recovery in such circumstances. The Fund’s maximum risk of loss from Counterparty risk, either as the protection seller or as the protection buyer, is the value of the contract. The risk may be mitigated by having a master netting arrangement between the Fund and the Counterparty and by the designation of collateral by the Counterparty to cover the Fund’s exposure to the Counterparty.
Implied credit spreads represent the current level at which protection could be bought or sold given the terms of the existing CDS contract and serve as an indicator of the current status of the payment/performance risk of the CDS. An implied spread that has widened or increased since entry into the initial contract may indicate a deteriorating credit profile and increased risk of default for the reference entity. A declining or narrowing spread may indicate an improving credit profile or decreased risk of default for the reference entity. Alternatively, credit spreads may increase or decrease reflecting the general tolerance for risk in the credit markets.
An interest rate swap is an agreement between Counterparties pursuant to which the parties exchange a floating rate payment for a fixed rate payment based on a specified notional amount.
Changes in the value of centrally cleared and OTC swap agreements are recognized as unrealized gains (losses) in the Statement of Operations by “marking to market” on a daily basis to reflect the value of the swap agreement at the end of each trading day. Payments received or paid at the beginning of the agreement are reflected as such on the Statement of Assets and Liabilities and may be referred to as upfront payments. The Fund accrues for the fixed payment stream and amortizes upfront payments, if any, on swap agreements on a daily basis with the net amount, recorded as a component of realized gain (loss) on the Statement of Operations. A liquidation payment received or made at the termination of a swap agreement is recorded as realized gain (loss) on the Statement of Operations. Cash held as collateral is recorded as deposits with brokers on the Statement of Assets and Liabilities. Entering into these agreements involves, to varying degrees, lack of liquidity and elements of credit, market, and Counterparty risk in excess of amounts recognized on the Statement of Assets and Liabilities. Such risks involve the possibility that a swap is difficult to sell or liquidate; the Counterparty does not honor its obligations under the agreement and unfavorable interest rates and market fluctuations. It is possible that developments in the swaps market, including potential government regulation, could adversely affect the Fund’s ability to terminate existing swap agreements or to realize amounts to be received under such agreements. Additionally, an International Swaps and Derivatives Association Master Agreement (“ISDA Master Agreement”) includes credit related contingent features which allow Counterparties to OTC derivatives to terminate derivative contracts prior to maturity in the event that, for example, the Fund’s net assets decline by a stated percentage or the Fund fails to meet the terms of its ISDA Master Agreement, which would cause the Fund to accelerate payment of any net liability owed to the Counterparty. A short position in a security poses more risk than holding the same security long. As there is no limit on how much the price of the security can increase, the Fund’s exposure is unlimited.
Notional amounts of each individual credit default swap agreement outstanding as of October 31, 2022, if any, for which the Fund is the seller of protection are disclosed in the open swap agreements table. These potential amounts would be partially offset by any recovery values of the respective referenced obligations, upfront payments received upon entering into the agreement, or net amounts received from the settlement of buy protection credit default swap agreements entered into by the Fund for the same referenced entity or entities.
| P. | Leverage Risk – Leverage exists when the Fund can lose more than it originally invests because it purchases or sells an instrument or enters into a transaction without investing an amount equal to the full economic exposure of the instrument or transaction. |
| Q. | Collateral –To the extent the Fund has designated or segregated a security as collateral and that security is subsequently sold, it is the Fund’s practice to replace such collateral no later than the next business day. |
| R. | Other Risks – The Fund may invest in lower-quality debt securities, i.e., “junk bonds”. Investments in lower-rated securities or unrated securities of comparable quality tend to be more sensitive to economic conditions than higher rated securities. Junk bonds involve a greater risk of default by the issuer because such securities are generally unsecured and are often subordinated to other creditors’ claims. Junk bonds are less liquid than investment grade debt securities and their prices tend to be more volatile. |
During the period, the Fund experienced a low interest rate environment created in part by the Federal Reserve Board (FRB) and certain foreign central banks keeping the federal funds and equivalent foreign rates near historical lows. Increases in the federal funds and equivalent foreign rates may expose fixed income markets to heightened volatility and reduced liquidity for certain fixed income investments, particularly those with longer maturities. In addition, decreases in fixed income dealer market-making capacity may also potentially lead to heightened volatility and reduced liquidity in the fixed income markets. As a result, the
| | |
| 39 | | Invesco Multi-Asset Income Fund |
value of the Fund’s investments and share price may decline. Changes in central bank policies could also result in higher than normal shareholder redemptions, which could potentially increase portfolio turnover and the Fund’s transaction costs.
Policy changes by the U.S. government or its regulatory agencies and political events within the U.S. and abroad may, among other things, affect investor and consumer confidence and increase volatility in the financial markets, perhaps suddenly and to a significant degree, which may adversely impact the Fund’s operations, universe of potential investment options, and return potential.
| S. | COVID-19 Risk - The COVID-19 strain of coronavirus has resulted in instances of market closures and dislocations, extreme volatility, liquidity constraints and increased trading costs. Efforts to contain its spread have resulted in travel restrictions, disruptions of healthcare systems, business operations (including business closures) and supply chains, layoffs, lower consumer demand and employee availability, and defaults and credit downgrades, among other significant economic impacts that have disrupted global economic activity across many industries. Such economic impacts may exacerbate other pre-existing political, social and economic risks locally or globally and cause general concern and uncertainty. The full economic impact and ongoing effects of COVID-19 (or other future epidemics or pandemics) at the macro-level and on individual businesses are unpredictable and may result in significant and prolonged effects on the Fund’s performance. |
NOTE 2–Advisory Fees and Other Fees Paid to Affiliates
The Trust has entered into a master investment advisory agreement with the Adviser. Under the terms of the investment advisory agreement, the Fund accrues daily and pays monthly an advisory fee to the Adviser based on the annual rate of the Fund’s average daily net assets as follows:
| | | | |
| Average Daily Net Assets | | Rate | |
|
| |
First $ 500 million | | | 0.500% | |
|
| |
Next $500 million | | | 0.450% | |
|
| |
Next $500 million | | | 0.400% | |
|
| |
Over $1.5 billion | | | 0.390% | |
|
| |
For the year ended October 31, 2022, the effective advisory fee rate incurred by the Fund was 0.45%.
Under the terms of a master sub-advisory agreement between the Adviser and each of Invesco Asset Management Deutschland GmbH, Invesco Asset Management Limited, Invesco Asset Management (Japan) Limited, Invesco Hong Kong Limited, Invesco Senior Secured Management, Inc. and Invesco Canada Ltd. and separate sub-advisory agreements with Invesco Capital Management LLC and Invesco Asset Management (India) Private Limited (collectively, the “Affiliated Sub-Advisers”) the Adviser, not the Fund, will pay 40% of the fees paid to the Adviser to any such Affiliated Sub-Adviser(s) that provide(s) discretionary investment management services to the Fund based on the percentage of assets allocated to such Affiliated Sub-Adviser(s).
The Adviser has contractually agreed, through February 28, 2023, to waive advisory fees and/or reimburse expenses of all shares to the extent necessary to limit total annual fund operating expenses after fee waiver and/or reimbursement (excluding certain items discussed below) of Class A, Class C, Class R, Class Y, Class R5 and Class R6 shares to 0.85%, 1.60%, 1.10%, 0.60%, 0.60% and 0.60%, respectively, of the Fund’s average daily net assets (the “expense limits”). Effective March 1, 2023, through at least February 29, 2024, the Adviser has contractually agreed to waive advisory fees and/or reimburse expenses of all shares to the extent necessary to limit total annual fund operating expenses after fee waiver and/or reimbursement (excluding certain items discussed below) of Class A, Class C, Class R, Class Y, Class R5 and Class R6 shares to 0.90%, 1.65%, 1.15%, 0.65%, 0.65% and 0.65%, respectively, of the Fund’s average daily net assets. In determining the Adviser’s obligation to waive advisory fees and/or reimburse expenses, the following expenses are not taken into account, and could cause the total annual fund operating expenses after fee waiver and/or reimbursement to exceed the numbers reflected above: (1) interest, facilities and maintenance fees; (2) taxes; (3) dividend expense on short sales; (4) extraordinary or non-routine items, including litigation expenses; and (5) expenses that the Fund has incurred but did not actually pay because of an expense offset arrangement. Unless Invesco continues the fee waiver agreement, it will terminate on February 29, 2024. During its term, the fee waiver agreement cannot be terminated or amended to increase the expense limits or reduce the advisory fee waivers without approval of the Board of Trustees.
Further, the Adviser has contractually agreed, through at least June 30, 2024, to waive the advisory fee payable by the Fund in an amount equal to 100% of the net advisory fees the Adviser receives from the affiliated money market funds on investments by the Fund of uninvested cash (excluding investments of cash collateral from securities lending) in such affiliated money market funds.
For the year ended October 31, 2022, the Adviser waived advisory fees of $186,464 and reimbursed class level expenses of $428,952, $48,773, $11,875, $94,726, $14 and $0 of Class A, Class C, Class R, Class Y, Class R5 and Class R6 shares, respectively.
The Trust has entered into a master administrative services agreement with Invesco pursuant to which the Fund has agreed to pay Invesco for certain administrative costs incurred in providing accounting services to the Fund. For the year ended October 31, 2022, expenses incurred under the agreement are shown in the Statement of Operations as Administrative services fees. Invesco has entered into a sub-administration agreement whereby State Street Bank and Trust Company (“SSB”) serves as fund accountant and provides certain administrative services to the Fund. Pursuant to a custody agreement with the Trust on behalf of the Fund, SSB also serves as the Fund’s custodian.
The Trust has entered into a transfer agency and service agreement with Invesco Investment Services, Inc. (“IIS”) pursuant to which the Fund has agreed to pay IIS a fee for providing transfer agency and shareholder services to the Fund and reimburse IIS for certain expenses incurred by IIS in the course of providing such services. IIS may make payments to intermediaries that provide omnibus account services, sub-accounting services and/or networking services. All fees payable by IIS to intermediaries that provide omnibus account services or sub-accounting services are charged back to the Fund, subject to certain limitations approved by the Trust’s Board of Trustees. For the year ended October 31, 2022, expenses incurred under the agreement are shown in the Statement of Operations as Transfer agent fees.
The Trust has entered into master distribution agreements with Invesco Distributors, Inc. (“IDI”) to serve as the distributor for the Class A, Class C, Class R, Class Y, Class R5 and Class R6 shares of the Fund. The Trust has adopted plans pursuant to Rule 12b-1 under the 1940 Act with respect to the Fund’s Class A, Class C and Class R shares (collectively, the “Plans”). The Fund, pursuant to the Class A Plan, reimburses IDI for its allocated share of expenses incurred for the period, up to a maximum annual rate of 0.25% of the average daily net assets of Class A shares. The Fund, pursuant to the Class C and Class R Plans, pays IDI compensation at the annual rate of 1.00% of the average daily net assets of Class C shares and 0.50% of the average daily net assets of Class R shares. The fees are accrued daily and paid monthly. Of the Plan payments, up to 0.25% of the average daily net assets of each class of shares may be paid to furnish continuing personal shareholder services to customers who purchase and own shares of such classes. Any amounts not paid as a service fee under the Plans would constitute an asset-based sales charge. Rules of the Financial Industry Regulatory Authority (“FINRA”) impose a cap on the total sales charges, including asset-based sales charges, that may be paid by any class of shares of the Fund. For the year ended October 31, 2022, expenses incurred under the Plans are shown in the Statement of Operations as Distribution fees.
Front-end sales commissions and CDSC (collectively, the “sales charges”) are not recorded as expenses of the Fund. Front-end sales commissions are deducted from proceeds from the sales of Fund shares prior to investment in Class A shares of the Fund. CDSC are deducted from redemption proceeds prior to remittance to the shareholder. During the year ended October 31, 2022, IDI advised the Fund that IDI retained $96,952 in front-end sales commissions from the sale of Class A shares and $1,869 and $6,567 from Class A and Class C shares, respectively, for CDSC imposed upon redemptions by shareholders.
Certain officers and trustees of the Trust are officers and directors of Invesco.
| | |
| 40 | | Invesco Multi-Asset Income Fund |
NOTE 3–Additional Valuation Information
GAAP defines fair value as the price that would be received to sell an asset or paid to transfer a liability in an orderly transaction between market participants at the measurement date, under current market conditions. GAAP establishes a hierarchy that prioritizes the inputs to valuation methods, giving the highest priority to readily available unadjusted quoted prices in an active market for identical assets (Level 1) and the lowest priority to significant unobservable inputs (Level 3), generally when market prices are not readily available. Based on the valuation inputs, the securities or other investments are tiered into one of three levels. Changes in valuation methods may result in transfers in or out of an investment’s assigned level:
| | |
| Level 1 - | | Prices are determined using quoted prices in an active market for identical assets. |
| Level 2 - | | Prices are determined using other significant observable inputs. Observable inputs are inputs that other market participants may use in pricing a security. These may include quoted prices for similar securities, interest rates, prepayment speeds, credit risk, yield curves, loss severities, default rates, discount rates, volatilities and others. |
| Level 3 - | | Prices are determined using significant unobservable inputs. In situations where quoted prices or observable inputs are unavailable (for example, when there is little or no market activity for an investment at the end of the period), unobservable inputs may be used. Unobservable inputs reflect the Adviser’s assumptions about the factors market participants would use in determining fair value of the securities or instruments and would be based on the best available information. |
The following is a summary of the tiered valuation input levels, as of October 31, 2022. The level assigned to the securities valuations may not be an indication of the risk or liquidity associated with investing in those securities. Because of the inherent uncertainties of valuation, the values reflected in the financial statements may materially differ from the value received upon actual sale of those investments.
| | | | | | | | | | | | | | | | |
| | | Level 1 | | | Level 2 | | | Level 3 | | | Total | |
|
| |
Investments in Securities | | | | | | | | | | | | | | | | |
|
| |
U.S. Dollar Denominated Bonds & Notes | | $ | 182,709 | | | $ | 378,455,480 | | | | $0 | | | $ | 378,638,189 | |
|
| |
Equity Linked Notes | | | – | | | | 327,526,444 | | | | – | | | | 327,526,444 | |
|
| |
U.S. Treasury Securities | | | – | | | | 246,672,387 | | | | – | | | | 246,672,387 | |
|
| |
Preferred Stocks | | | 56,011,568 | | | | – | | | | – | | | | 56,011,568 | |
|
| |
Non-U.S. Dollar Denominated Bonds & Notes | | | – | | | | 8,897,077 | | | | – | | | | 8,897,077 | |
|
| |
Asset-Backed Securities | | | – | | | | 42,732 | | | | – | | | | 42,732 | |
|
| |
U.S. Government Sponsored Agency Mortgage-Backed Securities | | | – | | | | 1 | | | | – | | | | 1 | |
|
| |
Money Market Funds | | | 205,460,333 | | | | 42,189,599 | | | | – | | | | 247,649,932 | |
|
| |
Total Investments in Securities | | | 261,654,610 | | | | 1,003,783,720 | | | | 0 | | | | 1,265,438,330 | |
|
| |
| | | | |
Other Investments - Assets* | | | | | | | | | | | | | | | | |
|
| |
Futures Contracts | | | 6,530,536 | | | | – | | | | – | | | | 6,530,536 | |
|
| |
Forward Foreign Currency Contracts | | | – | | | | 119,045 | | | | – | | | | 119,045 | |
|
| |
Swap Agreements | | | – | | | | 58,408 | | | | – | | | | 58,408 | |
|
| |
| | | 6,530,536 | | | | 177,453 | | | | – | | | | 6,707,989 | |
|
| |
| | | | |
Other Investments - Liabilities* | | | | | | | | | | | | | | | | |
|
| |
Futures Contracts | | | (9,000,639 | ) | | | – | | | | – | | | | (9,000,639 | ) |
|
| |
Forward Foreign Currency Contracts | | | – | | | | (13,969 | ) | | | – | | | | (13,969 | ) |
|
| |
| | | (9,000,639 | ) | | | (13,969 | ) | | | – | | | | (9,014,608 | ) |
|
| |
Total Other Investments | | | (2,470,103 | ) | | | 163,484 | | | | – | | | | (2,306,619 | ) |
|
| |
Total Investments | | $ | 259,184,507 | | | $ | 1,003,947,204 | | | | $0 | | | $ | 1,263,131,711 | |
|
| |
| * | Forward foreign currency contracts, futures contracts and swap agreements are valued at unrealized appreciation (depreciation). |
NOTE 4–Derivative Investments
The Fund may enter into an International Swaps and Derivatives Association Master Agreement (“ISDA Master Agreement”) under which a fund may trade OTC derivatives. An OTC transaction entered into under an ISDA Master Agreement typically involves a collateral posting arrangement, payment netting provisions and close-out netting provisions. These netting provisions allow for reduction of credit risk through netting of contractual obligations. The enforceability of the netting provisions of the ISDA Master Agreement depends on the governing law of the ISDA Master Agreement, among other factors.
For financial reporting purposes, the Fund does not offset OTC derivative assets or liabilities that are subject to ISDA Master Agreements in the Statement of Assets and Liabilities.
Value of Derivative Investments at Period-End
The table below summarizes the value of the Fund’s derivative investments, detailed by primary risk exposure, held as of October 31, 2022:
| | | | | | | | | | | | | | | | | | | | |
| | | Value | |
| Derivative Assets | | Credit
Risk | | | Currency
Risk | | | Equity
Risk | | | Interest
Rate Risk | | | Total | |
|
| |
Unrealized appreciation on futures contracts – Exchange-Traded | | $ | – | | | $ | – | | | $ | 383,153 | | | $ | 6,147,383 | | | | $ 6,530,536 | |
|
| |
Unrealized appreciation on swap agreements – Centrally Cleared(a) | | | 58,408 | | | | – | | | | – | | | | – | | | | 58,408 | |
|
| |
Unrealized appreciation on forward foreign currency contracts outstanding | | | – | | | | 119,045 | | | | – | | | | – | | | | 119,045 | |
|
| |
Total Derivative Assets | | | 58,408 | | | | 119,045 | | | | 383,153 | | | | 6,147,383 | | | | 6,707,989 | |
|
| |
Derivatives not subject to master netting agreements | | | (58,408 | ) | | | – | | | | (383,153 | ) | | | (6,147,383 | ) | | | (6,588,944 | ) |
|
| |
Total Derivative Assets subject to master netting agreements | | $ | – | | | $ | 119,045 | | | $ | – | | | $ | – | | | | $ 119,045 | |
|
| |
| | |
| 41 | | Invesco Multi-Asset Income Fund |
| | | | | | | | | | | | | | | | | | | | | | | | | | | | |
| | | Value | |
| Derivative Liabilities | | Currency
Risk | | | | | | Equity Risk | | | | | | Interest
Rate Risk | | | | | | Total | |
|
| |
Unrealized depreciation on futures contracts – Exchange-Traded | | $ | – | | | | | | | $ | (6,162,076 | ) | | | | | | $ | (2,838,563 | ) | | | | | | | $(9,000,639 | ) |
|
| |
Unrealized depreciation on forward foreign currency contracts outstanding | | | (13,969 | ) | | | | | | | – | | | | | | | | – | | | | | | | | (13,969 | ) |
|
| |
Total Derivative Liabilities | | | (13,969 | ) | | | | | | | (6,162,076 | ) | | | | | | | (2,838,563 | ) | | | | | | | (9,014,608 | ) |
|
| |
Derivatives not subject to master netting agreements | | | – | | | | | | | | 6,162,076 | | | | | | | | 2,838,563 | | | | | | | | 9,000,639 | |
|
| |
Total Derivative Liabilities subject to master netting agreements | | $ | (13,969 | ) | | | | | | $ | – | | | | | | | $ | – | | | | | | | | $ (13,969 | ) |
|
| |
| (a) | The daily variation margin receivable (payable) at period-end is recorded in the Statement of Assets and Liabilities. |
Offsetting Assets and Liabilities
The table below reflects the Fund’s exposure to Counterparties subject to either an ISDA Master Agreement or other agreement for OTC derivative transactions as of October 31, 2022.
| | | | | | | | | | | | | | | | | | | | |
| | | Financial
Derivative
Assets | | | Financial
Derivative
Liabilities | | | | | | Collateral
(Received)/Pledged | | | |
| Counterparty | | Forward Foreign
Currency Contracts | | | Forward Foreign
Currency Contracts | | | Net Value of
Derivatives | | | Non-Cash | | Cash | | Net
Amount | |
|
| |
Bank of America, N.A. | | | $ 2,803 | | | | $ (749) | | | | $ 2,054 | | | $– | | $– | | | $ 2,054 | |
|
| |
Canadian Imperial Bank of Commerce | | | – | | | | (13) | | | | (13 | ) | | – | | – | | | (13 | ) |
|
| |
J.P. Morgan Chase Bank, N.A. | | | 992 | | | | – | | | | 992 | | | – | | – | | | 992 | |
|
| |
Royal Bank of Canada | | | – | | | | (12,392) | | | | (12,392 | ) | | – | | – | | | (12,392 | ) |
|
| |
UBS AG | | | 115,250 | | | | (815) | | | | 114,435 | | | – | | – | | | 114,435 | |
|
| |
Total | | | $119,045 | | | | $(13,969) | | | | $105,076 | | | $– | | $– | | | $105,076 | |
|
| |
Effect of Derivative Investments for the year ended October 31, 2022
The table below summarizes the gains (losses) on derivative investments, detailed by primary risk exposure, recognized in earnings during the period:
| | | | | | | | | | | | | | | | | | | | | | | | | | | | | | | | | | | | |
| | | Location of Gain (Loss) on Statement of Operations | |
| | | Credit
Risk | | | | | | Currency
Risk | | | | | | Equity Risk | | | | | | Interest
Rate Risk | | | | | | Total | |
|
| |
Realized Gain (Loss): | | | | | | | | | | | | | | | | | | | | | | | | | | | | | | | | | | | | |
Forward foreign currency contracts | | $ | - | | | | | | | $ | 1,498,084 | | | | | | | $ | - | | | | | | | $ | - | | | | | | | | $1,498,084 | |
|
| |
Futures contracts | | | - | | | | | | | | - | | | | | | | | (27,131,355 | ) | | | | | | | 6,400,168 | | | | | | | | (20,731,187 | ) |
|
| |
Swap agreements | | | 124,095 | | | | | | | | - | | | | | | | | - | | | | | | | | - | | | | | | | | 124,095 | |
|
| |
Change in Net Unrealized Appreciation (Depreciation): | | | | | | | | | | | | | | | | | | | | | | | | | | | | | | | | | | | | |
Forward foreign currency contracts | | | - | | | | | | | | 44,155 | | | | | | | | - | | | | | | | | - | | | | | | | | 44,155 | |
|
| |
Futures contracts | | | - | | | | | | | | - | | | | | | | | (7,338,851 | ) | | | | | | | 3,027,464 | | | | | | | | (4,311,387 | ) |
|
| |
Swap agreements | | | 58,408 | | | | | | | | - | | | | | | | | - | | | | | | | | - | | | | | | | | 58,408 | |
|
| |
Total | | $ | 182,503 | | | | | | | $ | 1,542,239 | | | | | | | $ | (34,470,206 | ) | | | | | | $ | 9,427,632 | | | | | | | | $(23,317,832 | ) |
|
| |
The table below summarizes the average notional value of derivatives held during the period.
| | | | | | | | | | | | | | | | | | | | |
| | | Forward
Foreign Currency
Contracts | | | | | | Futures
Contracts | | | | | | Swap
Agreements | |
|
| |
Average notional value | | | $10,105,733 | | | | | | | | $342,046,935 | | | | | | | | $4,388,260 | |
|
| |
NOTE 5–Expense Offset Arrangement(s)
The expense offset arrangement is comprised of transfer agency credits which result from balances in demand deposit accounts used by the transfer agent for clearing shareholder transactions. For the year ended October 31, 2022, the Fund received credits from this arrangement, which resulted in the reduction of the Fund’s total expenses of $9,573.
NOTE 6–Trustees’ and Officers’ Fees and Benefits
Trustees’ and Officers’ Fees and Benefits include amounts accrued by the Fund to pay remuneration to certain Trustees and Officers of the Fund. Trustees have the option to defer compensation payable by the Fund, and Trustees’ and Officers’ Fees and Benefits also include amounts accrued by the Fund to fund such deferred compensation amounts. Those Trustees who defer compensation have the option to select various Invesco Funds in which their deferral accounts shall be deemed to be invested. Finally, certain current Trustees were eligible to participate in a retirement plan that provided for benefits to be paid upon retirement to Trustees over a period of time based on the number of years of service. The Fund may have certain former Trustees who also participate in a retirement plan and receive benefits under such plan. Trustees’ and Officers’ Fees and Benefits include amounts accrued by the Fund to fund such retirement benefits. Obligations under the deferred compensation and retirement plans represent unsecured claims against the general assets of the Fund.
| | |
| 42 | | Invesco Multi-Asset Income Fund |
NOTE 7–Cash Balances
The Fund is permitted to temporarily carry a negative or overdrawn balance in its account with SSB, the custodian bank. Such balances, if any at period-end, are shown in the Statement of Assets and Liabilities under the payable caption Amount due custodian. To compensate the custodian bank for such overdrafts, the overdrawn Fund may either (1) leave funds as a compensating balance in the account so the custodian bank can be compensated by earning the additional interest; or (2) compensate by paying the custodian bank at a rate agreed upon by the custodian bank and Invesco, not to exceed the contractually agreed upon rate. The Fund may not purchase additional securities when any borrowings from banks or broker-dealers exceed 5% of the Fund’s total assets, or when any borrowings from an Invesco Fund are outstanding.
NOTE 8–Distributions to Shareholders and Tax Components of Net Assets
Tax Character of Distributions to Shareholders Paid During the Fiscal Years Ended October 31, 2022 and 2021:
| | | | | | | | | | | | |
| | | 2022 | | | | | | 2021 | |
|
| |
Ordinary income* | | $ | 90,062,627 | | | | | | | $ | 107,216,367 | |
|
| |
| * | Includes short-term capital gain distributions, if any. |
Tax Components of Net Assets at Period-End:
| | | | |
| | | 2022 | |
|
| |
Undistributed ordinary income | | $ | 1,494,209 | |
|
| |
Net unrealized appreciation (depreciation) – investments | | | (188,125,466 | ) |
|
| |
Net unrealized appreciation (depreciation) – foreign currencies | | | (6,595 | ) |
|
| |
Temporary book/tax differences | | | (632,917 | ) |
|
| |
Capital loss carryforward | | | (593,566,442 | ) |
|
| |
Shares of beneficial interest | | | 1,964,231,185 | |
|
| |
Total net assets | | $ | 1,183,393,974 | |
|
| |
The difference between book-basis and tax-basis unrealized appreciation (depreciation) is due to differences in the timing of recognition of gains and losses on investments for tax and book purposes. The Fund’s net unrealized appreciation (depreciation) difference is attributable primarily to wash sales, amortization and accretion on debt securities and derivative instruments.
The temporary book/tax differences are a result of timing differences between book and tax recognition of income and/or expenses. The Fund’s temporary book/tax differences are the result of the trustee deferral of compensation and retirement plan benefits.
Capital loss carryforward is calculated and reported as of a specific date. Results of transactions and other activity after that date may affect the amount of capital loss carryforward actually available for the Fund to utilize. The ability to utilize capital loss carryforward in the future may be limited under the Internal Revenue Code and related regulations based on the results of future transactions.
The Fund has a capital loss carryforward as of October 31, 2022, as follows:
| | | | | | | | | | | | | | | | | | | | |
| Capital Loss Carryforward* | |
|
| |
| Expiration | | Short-Term | | | | | | Long-Term | | | | | | Total | |
|
| |
Not subject to expiration | | $ | 432,117,662 | | | | | | | $ | 161,448,780 | | | | | | | $ | 593,566,442 | |
|
| |
| * | Capital loss carryforward is reduced for limitations, if any, to the extent required by the Internal Revenue Code and may be further limited depending upon a variety of factors, including the realization of net unrealized gains or losses as of the date of any reorganization. |
NOTE 9–Investment Transactions
The aggregate amount of investment securities (other than short-term securities, U.S. Government obligations and money market funds, if any) purchased and sold by the Fund during the year ended October 31, 2022 was $471,827,506 and $867,807,233, respectively. Cost of investments, including any derivatives, on a tax basis includes the adjustments for financial reporting purposes as of the most recently completed federal income tax reporting period-end.
| | | | |
Unrealized Appreciation (Depreciation) of Investments on a Tax Basis | |
Aggregate unrealized appreciation of investments | | | $ 20,124,207 | |
|
| |
Aggregate unrealized (depreciation) of investments | | | (208,249,673 | ) |
|
| |
Net unrealized appreciation (depreciation) of investments | | | $(188,125,466 | ) |
|
| |
Cost of investments for tax purposes is $1,451,257,177.
NOTE 10–Reclassification of Permanent Differences
Primarily as a result of differing book/tax treatment of foreign currency transactions and amortization and accretion on debt securities, on October 31, 2022, undistributed net investment income was increased by $9,998,412 and undistributed net realized gain (loss) was decreased by $9,998,412. This reclassification had no effect on the net assets or the distributable earnings (loss) of the Fund.
| | |
| 43 | | Invesco Multi-Asset Income Fund |
NOTE 11–Share Information
| | | | | | | | | | | | | | | | |
| | | Summary of Share Activity | |
|
| |
| | |
| | | Year ended | | | Year ended | |
| | | October 31, 2022(a) | | | October 31, 2021 | |
| | | Shares | | | Amount | | | Shares | | | Amount | |
|
| |
Sold: | | | | | | | | | | | | | | | | |
Class A | | | 5,403,012 | | | $ | 48,658,733 | | | | 7,128,123 | | | $ | 69,477,960 | |
|
| |
Class C | | | 767,584 | | | | 6,837,877 | | | | 1,252,443 | | | | 12,208,067 | |
|
| |
Class R | | | 557,747 | | | | 4,911,397 | | | | 1,078,403 | | | | 10,463,046 | |
|
| |
Class Y | | | 4,587,419 | | | | 40,884,204 | | | | 5,484,763 | | | | 53,435,990 | |
|
| |
Class R6 | | | 462,081 | | | | 3,952,822 | | | | 516,714 | | | | 5,035,545 | |
|
| |
| | | | |
Issued as reinvestment of dividends: | | | | | | | | | | | | | | | | |
Class A | | | 6,454,141 | | | | 55,750,272 | | | | 6,476,987 | | | | 63,061,818 | |
|
| |
Class C | | | 547,183 | | | | 4,751,803 | | | | 695,997 | | | | 6,772,970 | |
|
| |
Class R | | | 188,054 | | | | 1,623,583 | | | | 301,005 | | | | 2,933,273 | |
|
| |
Class Y | | | 1,161,909 | | | | 10,077,631 | | | | 1,361,455 | | | | 13,260,495 | |
|
| |
Class R5 | | | 459 | | | | 3,957 | | | | 406 | | | | 3,954 | |
|
| |
Class R6 | | | 434,745 | | | | 3,752,196 | | | | 417,894 | | | | 4,070,849 | |
|
| |
| | | | |
Automatic conversion of Class C shares to Class A shares: | | | | | | | | | | | | | | | | |
Class A | | | 1,720,539 | | | | 14,795,155 | | | | 3,713,985 | | | | 36,122,567 | |
|
| |
Class C | | | (1,720,805 | ) | | | (14,795,155 | ) | | | (3,714,866 | ) | | | (36,122,567 | ) |
|
| |
| | | | |
Reacquired: | | | | | | | | | | | | | | | | |
Class A | | | (20,542,216 | ) | | | (181,629,391 | ) | | | (26,983,354 | ) | | | (262,803,102 | ) |
|
| |
Class C | | | (3,440,536 | ) | | | (30,360,377 | ) | | | (5,926,072 | ) | | | (57,637,864 | ) |
|
| |
Class R | | | (2,454,515 | ) | | | (23,198,261 | ) | | | (2,572,091 | ) | | | (24,938,333 | ) |
|
| |
Class Y | | | (10,817,953 | ) | | | (94,870,070 | ) | | | (17,640,042 | ) | | | (171,826,054 | ) |
|
| |
Class R5 | | | - | | | | - | | | | (1,616 | ) | | | (16,000 | ) |
|
| |
Class R6 | | | (829,639 | ) | | | (7,039,433 | ) | | | (1,364,800 | ) | | | (13,343,537 | ) |
|
| |
Net increase (decrease) in share activity | | | (17,520,791 | ) | | $ | (155,893,057 | ) | | | (29,774,666 | ) | | $ | (289,840,923 | ) |
|
| |
| (a) | There are entities that are record owners of more than 5% of the outstanding shares of the Fund and in the aggregate own 12% of the outstanding shares of the Fund. IDI has an agreement with these entities to sell Fund shares. The Fund, Invesco and/or Invesco affiliates may make payments to these entities, which are considered to be related to the Fund, for providing services to the Fund, Invesco and/or Invesco affiliates including but not limited to services such as securities brokerage, distribution, third party record keeping and account servicing. The Fund has no knowledge as to whether all or any portion of the shares owned of record by these entities are also owned beneficially. |
In addition, 4% of the outstanding shares of the Fund are owned by the Adviser or an affiliate of the Adviser.
| | |
| 44 | | Invesco Multi-Asset Income Fund |
Report of Independent Registered Public Accounting Firm
To the Board of Trustees of AIM Investment Funds (Invesco Investment Funds) and Shareholders of Invesco Multi-Asset Income Fund
Opinion on the Financial Statements
We have audited the accompanying statement of assets and liabilities, including the schedule of investments, of Invesco Multi-Asset Income Fund (one of the funds constituting AIM Investment Funds (Invesco Investment Funds), referred to hereafter as the “Fund”) as of October 31, 2022, the related statement of operations for the year ended October 31, 2022, the statement of changes in net assets for each of the two years in the period ended October 31, 2022, including the related notes, and the financial highlights for each of the five years in the period ended October 31, 2022 (collectively referred to as the “financial statements”). In our opinion, the financial statements present fairly, in all material respects, the financial position of the Fund as of October 31, 2022, the results of its operations for the year then ended, the changes in its net assets for each of the two years in the period ended October 31, 2022 and the financial highlights for each of the five years in the period ended October 31, 2022 in conformity with accounting principles generally accepted in the United States of America.
Basis for Opinion
These financial statements are the responsibility of the Fund’s management. Our responsibility is to express an opinion on the Fund’s financial statements based on our audits. We are a public accounting firm registered with the Public Company Accounting Oversight Board (United States) (PCAOB) and are required to be independent with respect to the Fund in accordance with the U.S. federal securities laws and the applicable rules and regulations of the Securities and Exchange Commission and the PCAOB.
We conducted our audits of these financial statements in accordance with the standards of the PCAOB. Those standards require that we plan and perform the audit to obtain reasonable assurance about whether the financial statements are free of material misstatement, whether due to error or fraud. Our audits included performing procedures to assess the risks of material misstatement of the financial statements, whether due to error or fraud, and performing procedures that respond to those risks. Such procedures included examining, on a test basis, evidence regarding the amounts and disclosures in the financial statements. Our audits also included evaluating the accounting principles used and significant estimates made by management, as well as evaluating the overall presentation of the financial statements. Our procedures included confirmation of securities owned as of October 31, 2022 by correspondence with the custodian, transfer agent, and brokers; when replies were not received from brokers, we performed other auditing procedures. We believe that our audits provide a reasonable basis for our opinion.
/s/PricewaterhouseCoopers LLP
Houston, Texas
December 23, 2022
We have served as the auditor of one or more of the investment companies in the Invesco group of investment companies since at least 1995. We have not been able to determine the specific year we began serving as auditor.
| | |
| 45 | | Invesco Multi-Asset Income Fund |
Calculating your ongoing Fund expenses
Example
As a shareholder of the Fund, you incur two types of costs: (1) transaction costs, which may include sales charges (loads) on purchase payments or contingent deferred sales charges on redemptions, if any; and (2) ongoing costs, including management fees, distribution and/or service (12b-1) fees, and other Fund expenses. This example is intended to help you understand your ongoing costs (in dollars) of investing in the Fund and to compare these costs with ongoing costs of investing in other mutual funds. The example is based on an investment of $1,000 invested at the beginning of the period and held for the entire period May 1, 2022 through October 31, 2022.
Actual expenses
The table below provides information about actual account values and actual expenses. You may use the information in this table, together with the amount you invested, to estimate the expenses that you paid over the period. Simply divide your account value by $1,000 (for example, an $8,600 account value divided by $1,000 = 8.6), then multiply the result by the number in the table under the heading entitled “Actual Expenses Paid During Period” to estimate the expenses you paid on your account during this period.
Hypothetical example for comparison purposes
The table below also provides information about hypothetical account values and hypothetical expenses based on the Fund’s actual expense ratio and an assumed rate of return of 5% per year before expenses, which is not the Fund’s actual return.
The hypothetical account values and expenses may not be used to estimate the actual ending account balance or expenses you paid for the period. You may use this information to compare the ongoing costs of investing in the Fund and other funds. To do so, compare this 5% hypothetical example with the 5% hypothetical examples that appear in the shareholder reports of the other funds.
Please note that the expenses shown in the table are meant to highlight your ongoing costs only and do not reflect any transaction costs, such as sales charges (loads) on purchase payments or contingent deferred sales charges on redemptions, if any. Therefore, the hypothetical information is useful in comparing ongoing costs only, and will not help you determine the relative total costs of owning different funds. In addition, if these transaction costs were included, your costs would have been higher.
| | | | | | | | | | | | |
| | | | | ACTUAL | | HYPOTHETICAL
(5% annual return before expenses) | | |
| | | Beginning Account Value (05/01/22) | | Ending Account Value (10/31/22)1 | | Expenses Paid During Period2 | | Ending Account Value (10/31/22) | | Expenses Paid During Period2 | | Annualized Expense Ratio |
Class A | | $1,000.00 | | $906.00 | | $3.94 | | $1,021.07 | | $4.18 | | 0.82% |
Class C | | 1,000.00 | | 903.50 | | 7.63 | | 1,017.19 | | 8.08 | | 1.59 |
Class R | | 1,000.00 | | 904.70 | | 5.23 | | 1,019.71 | | 5.55 | | 1.09 |
Class Y | | 1,000.00 | | 907.00 | | 2.84 | | 1,022.23 | | 3.01 | | 0.59 |
Class R5 | | 1,000.00 | | 907.10 | | 2.84 | | 1,022.23 | | 3.01 | | 0.59 |
Class R6 | | 1,000.00 | | 907.40 | | 2.45 | | 1,022.63 | | 2.60 | | 0.51 |
| 1 | The actual ending account value is based on the actual total return of the Fund for the period May 1, 2022 through October 31, 2022, after actual expenses and will differ from the hypothetical ending account value which is based on the Fund’s expense ratio and a hypothetical annual return of 5% before expenses. |
| 2 | Expenses are equal to the Fund’s annualized expense ratio as indicated above multiplied by the average account value over the period, multiplied by 184/365 to reflect the most recent fiscal half year. |
| | |
| 46 | | Invesco Multi-Asset Income Fund |
Approval of Investment Advisory and Sub-Advisory Contracts
At meetings held on June 13, 2022, the Board of Trustees (the Board or the Trustees) of AIM Investment Funds (Invesco Investment Funds) as a whole, and the independent Trustees, who comprise over 75% of the Board, voting separately, approved the continuance of the Invesco Multi-Asset Income Fund’s (the Fund) Master Investment Advisory Agreement with Invesco Advisers, Inc. (Invesco Advisers and the investment advisory agreement) and the Master Intergroup Sub-Advisory Contract for Mutual Funds with Invesco Asset Management Deutschland GmbH, Invesco Asset Management Limited, Invesco Asset Management (Japan) Limited, Invesco Hong Kong Limited, Invesco Senior Secured Management, Inc. and Invesco Canada Ltd. and separate sub-advisory contracts with Invesco Capital Management LLC and Invesco Asset Management (India) Private Limited (collectively, the Affiliated Sub-Advisers and the sub-advisory contracts) for another year, effective July 1, 2022. After evaluating the factors discussed below, among others, the Board approved the renewal of the Fund’s investment advisory agreement and the sub-advisory contracts and determined that the compensation payable thereunder by the Fund to Invesco Advisers and by Invesco Advisers to the Affiliated Sub-Advisers is fair and reasonable.
The Board’s Evaluation Process
The Board has established an Investments Committee, which in turn has established Sub-Committees that meet throughout the year to review the performance of funds advised by Invesco Advisers (the Invesco Funds). The Sub-Committees meet regularly with portfolio managers for their assigned Invesco Funds and other members of management to review detailed information about investment performance and portfolio attributes of these funds. The Board has established additional standing and ad hoc committees that meet regularly throughout the year to review matters within their purview. The Board took into account evaluations and reports that it received from its committees and sub-committees, as well as the information provided to the Board and its committees and sub-committees throughout the year, in considering whether to approve each Invesco Fund’s investment advisory agreement and sub-advisory contracts.
As part of the contract renewal process, the Board reviews and considers information provided in response to detailed requests for information submitted to management by the independent Trustees with assistance from legal counsel to the independent Trustees and the Senior Officer, an officer of the Invesco Funds who reports directly to the independent Trustees. The Board receives comparative investment performance and fee and expense data regarding the Invesco Funds prepared by Broadridge Financial Solutions, Inc. (Broadridge), an independent mutual fund data provider, as well as information on the composition of the peer groups provided by Broadridge and its methodology for determining peer groups. The Board also receives an independent written evaluation from the Senior Officer. The Senior Officer’s evaluation is prepared as part of his responsibility to manage the process by which the Invesco Funds’ proposed management fees are negotiated during the annual contract renewal
process to ensure they are negotiated in a manner that is at arms’ length and reasonable in accordance with certain negotiated regulatory requirements. In addition to meetings with Invesco Advisers and fund counsel throughout the year and as part of meetings convened on May 2, 2022 and June 13, 2022, the independent Trustees also discussed the continuance of the investment advisory agreement and sub-advisory contracts in separate sessions with the Senior Officer and with independent legal counsel. Also, as part of the contract renewal process, the independent Trustees reviewed and considered information provided in response to detailed follow-up requests for information submitted by the independent Trustees to management. The independent Trustees met and discussed those follow-up responses with legal counsel to the independent Trustees and the Senior Officer.
The discussion below is a summary of the Senior Officer’s independent written evaluation with respect to the Fund’s investment advisory agreement and sub-advisory contracts, as well as a discussion of the material factors and related conclusions that formed the basis for the Board’s approval of the Fund’s investment advisory agreement and sub-advisory contracts. The Trustees’ review and conclusions are based on the comprehensive consideration of all information presented to them during the course of the year and in prior years and are not the result of any single determinative factor. Moreover, one Trustee may have weighed a particular piece of information or factor differently than another Trustee. The information received and considered by the Board was current as of various dates prior to the Board’s approval on June 13, 2022.
Factors and Conclusions and Summary of Independent Written Fee Evaluation
| A. | Nature, Extent and Quality of Services Provided by Invesco Advisers and the Affiliated Sub-Advisers |
The Board reviewed the nature, extent and quality of the advisory services provided to the Fund by Invesco Advisers under the Fund’s investment advisory agreement, and the credentials and experience of the officers and employees of Invesco Advisers who provide these services, including the Fund’s portfolio manager(s). The Board’s review included consideration of Invesco Advisers’ investment process and oversight, credit analysis, and research capabilities. The Board considered information regarding Invesco Advisers’ programs for and resources devoted to risk management, including management of investment, enterprise, operational, liquidity, valuation and compliance risks, and technology used to manage such risks. The Board also received and reviewed information about Invesco Advisers’ role as administrator of the Invesco Funds’ liquidity risk management program. The Board received a description of, and reports related to, Invesco Advisers’ global security program and business continuity plans and of its approach to data privacy and cybersecurity, including related testing. The Board considered how the cybersecurity and business continuity plans of Invesco Advisers and its key service providers operated in the remote and hybrid working environment resulting from the novel coronavirus (“COVID-19”) pandemic and paved the way for a hybrid working framework in a normalized
environment as employees return to the office. The Board also considered non-advisory services that Invesco Advisers and its affiliates provide to the Invesco Funds, such as various back office support functions, third party oversight, internal audit, valuation, portfolio trading and legal and compliance. The Board observed that Invesco Advisers’ systems preparedness and ongoing investment enabled Invesco Advisers to manage, operate and oversee the Invesco Funds with minimal impact or disruption through challenging environments. The Board reviewed and considered the benefits to shareholders of investing in a Fund that is part of the family of funds under the umbrella of Invesco Ltd., Invesco Advisers’ parent company, and noted Invesco Ltd.’s depth and experience in running an investment management business, as well as its commitment of financial and other resources to such business. The Board concluded that the nature, extent and quality of the services provided to the Fund by Invesco Advisers are appropriate and satisfactory.
The Board reviewed the services that may be provided by the Affiliated Sub-Advisers under the sub-advisory contracts and the credentials and experience of the officers and employees of the Affiliated Sub-Advisers who provide these services. The Board noted the Affiliated Sub-Advisers’ expertise with respect to certain asset classes and that the Affiliated Sub-Advisers have offices and personnel that are located in financial centers around the world. As a result, the Board noted that the Affiliated Sub-Advisers can provide research and investment analysis on the markets and economies of various countries in which the Fund may invest, make recommendations regarding securities and assist with security trades. The Board concluded that the sub-advisory contracts may benefit the Fund and its shareholders by permitting Invesco Advisers to use the resources and talents of the Affiliated Sub-Advisers in managing the Fund. The Board concluded that the nature, extent and quality of the services that may be provided to the Fund by the Affiliated Sub-Advisers are appropriate and satisfactory.
B. Fund Investment Performance
The Board considered Fund investment performance as a relevant factor in considering whether to approve the investment advisory agreement as well as the sub-advisory contracts for the Fund, as Invesco Capital Management LLC currently manages assets of the Fund.
The Board compared the Fund’s investment performance over multiple time periods ending December 31, 2021 to the performance of funds in the Broadridge performance universe and against the Custom Invesco Multi-Asset Income Index (Index). The Board noted that performance of Class A shares of the Fund was in the third quintile of its performance universe for the one year period and the fifth quintile for the three and five year periods (the first quintile being the best performing funds and the fifth quintile being the worst performing funds). The Board noted that performance of Class A shares of the Fund was below the performance of the Index for the one, three and five year periods. The Board considered how the Fund’s strategy is implemented using a multi-sleeve structure and discussed how each sleeve impacted Fund performance, noting that exposure to U.S.
| | |
| 47 | | Invesco Multi-Asset Income Fund |
master limited partnerships and equity real estate investment trusts detracted from performance. The Board further noted that the Fund’s reduced equity exposure in a period of rising equity markets also led to short-term underperformance. The Board recognized that the performance data reflects a snapshot in time as of a particular date and that selecting a different performance period could produce different results. The Board also reviewed more recent Fund performance as well as other performance metrics, which did not change its conclusions.
| C. | Advisory and Sub-Advisory Fees and Fund Expenses |
The Board compared the Fund’s contractual management fee rate to the contractual management fee rates of funds in the Fund’s Broadridge expense group. The Board noted that the contractual management fee rate for Class A shares of the Fund was below the median contractual management fee rate of funds in its expense group. The Board noted that the term “contractual management fee” for funds in the expense group may include both advisory and certain non-portfolio management administrative services fees, but that Broadridge is not able to provide information on a fund by fund basis as to what is included. The Board also reviewed the methodology used by Broadridge in calculating expense group information, which includes using each fund’s contractual management fee schedule (including any applicable breakpoints) as reported in the most recent prospectus or statement of additional information for each fund in the expense group. The Board also considered comparative information regarding the Fund’s total expense ratio and its various components.
The Board noted that Invesco Advisers has contractually agreed to waive fees and/or limit expenses of the Fund for the term disclosed in the Fund’s registration statement in an amount necessary to limit total annual operating expenses to a specified percentage of average daily net assets for each class of the Fund.
The Board noted that Invesco Advisers and the Affiliated Sub-Advisers do not manage other similarly managed mutual funds or client accounts.
The Board also considered the services that may be provided by the Affiliated Sub-Advisers pursuant to the sub-advisory contracts, as well as the fees payable by Invesco Advisers to the Affiliated Sub-Advisers pursuant to the sub-advisory contracts. The Board noted that Invesco Advisers retains overall responsibility for, and provides services to, sub-advised Invesco Funds, including oversight of the Affiliated Sub-Advisers as well as the additional services described herein other than day-to-day portfolio management.
| D. | Economies of Scale and Breakpoints |
The Board considered the extent to which there may be economies of scale in the provision of advisory services to the Fund and the Invesco Funds, and the extent to which such economies of scale are shared with the Fund and the Invesco Funds. The Board considered that the Fund benefits from economies of scale through contractual breakpoints in the Fund’s advisory fee schedule, which generally operate to reduce the Fund’s expense ratio as it grows in size. The Board considered additional information from Invesco Advisers regarding the levels of the Fund’s breakpoints in light of current assets. The Board noted that the Fund also shares in economies of scale through Invesco Advisers’ ability to negotiate lower
fee arrangements with third party service providers. The Board noted that the Fund may also benefit from economies of scale through initial fee setting, fee waivers and expense reimbursements, as well as Invesco Advisers’ investment in its business, including investments in business infrastructure, technology and cybersecurity.
| E. | Profitability and Financial Resources |
The Board reviewed information from Invesco Advisers concerning the costs of the advisory and other services that Invesco Advisers and its affiliates provide to the Fund and the Invesco Funds and the profitability of Invesco Advisers and its affiliates in providing these services in the aggregate and on an individual Fund-by-Fund basis. The Board considered the methodology used for calculating profitability and the periodic review and enhancement of such methodology. The Board noted that Invesco Advisers continues to operate at a net profit from services Invesco Advisers and its affiliates provide to the Invesco Funds in the aggregate and to most Funds individually. The Board did not deem the level of profits realized by Invesco Advisers and its affiliates from providing such services to be excessive, given the nature, extent and quality of the services provided. The Board noted that Invesco Advisers provided information demonstrating that Invesco Advisers is financially sound and has the resources necessary to perform its obligations under the investment advisory agreement, and provided representations indicating that the Affiliated Sub-Advisers are financially sound and have the resources necessary to perform their obligations under the sub-advisory contracts.
| F. | Collateral Benefits to Invesco Advisers and its Affiliates |
The Board considered various other benefits received by Invesco Advisers and its affiliates from the relationship with the Fund, including the fees received for providing administrative, transfer agency and distribution services to the Fund. The Board received comparative information regarding fees charged for these services, including information provided by Broadridge and other independent sources. The Board reviewed the performance of Invesco Advisers and its affiliates in providing these services and the organizational structure employed to provide these services. The Board noted that these services are provided to the Fund pursuant to written contracts that are reviewed and subject to approval on an annual basis by the Board based on its determination that the services are required for the operation of the Fund.
The Board considered the benefits realized by Invesco Advisers and the Affiliated Sub-Advisers as a result of portfolio brokerage transactions executed through “soft dollar” arrangements. The Board noted that soft dollar arrangements may result in the Fund bearing costs to purchase research that may be used by Invesco Advisers or the Affiliated Sub-Advisers with other clients and may reduce Invesco Advisers’ or the Affiliated Sub-Advisers’ expenses. The Board also considered that it receives from Invesco Advisers periodic reports that include a representation to the effect that these arrangements are consistent with regulatory requirements. The Board did not deem the soft dollar arrangements to be inappropriate.
The Board considered that the Fund’s uninvested cash and cash collateral from any securities lending arrangements may be invested in registered money market funds or, with regard to securities lending cash collateral, unregistered funds that comply with
Rule 2a-7 (collectively referred to as “affiliated money market funds”) advised by Invesco Advisers. The Board considered information regarding the returns of the affiliated money market funds relative to comparable overnight investments, as well as the fees paid by the affiliated money market funds to Invesco Advisers and its affiliates. In this regard, the Board noted that Invesco Advisers receives advisory fees from these affiliated money market funds attributable to the Fund’s investments. The Board also noted that Invesco Advisers has contractually agreed to waive through varying periods an amount equal to 100% of the net advisory fee Invesco Advisers receives from the affiliated money market funds with respect to the Fund’s investment in the affiliated money market funds of uninvested cash, but not cash collateral. The Board concluded that the advisory fees payable to Invesco Advisers from the Fund’s investment of cash collateral from any securities lending arrangements in the affiliated money market funds are for services that are not duplicative of services provided by Invesco Advisers to the Fund.
The Board considered that Invesco Advisers may serve as the Fund’s affiliated securities lending agent and evaluated the benefits realized by Invesco Advisers when serving in such role, including the compensation received. The Board considered Invesco Advisers’ securities lending platform and corporate governance structure for securities lending, including Invesco Advisers’ Securities Lending Governance Committee and its related responsibilities. The Board noted that to the extent the Fund utilizes Invesco Advisers as an affiliated securities lending agent, the Fund conducts its securities lending in accordance with, and in reliance upon, no-action letters issued by the SEC staff that provide guidance on how an affiliate may act as a direct agent lender and receive compensation for those services without obtaining exemptive relief. The Board considered information provided by Invesco Advisers related to the performance of Invesco Advisers as securities lending agent, including a summary of the securities lending services provided to the Fund by Invesco Advisers and the compensation paid to Invesco Advisers for such services, as well as any revenues generated for the Fund in connection with such securities lending activity and the allocation of such revenue between the Fund and Invesco Advisers.
The Board also received information about commissions that an affiliated broker may receive for executing certain trades for the Fund. Invesco Advisers and the Affiliated Sub-Advisers advised the Board of the benefits to the Fund of executing trades through the affiliated broker and that such trades were executed in compliance with rules under the federal securities laws and consistent with best execution obligations.
| | |
| 48 | | Invesco Multi-Asset Income Fund |
Tax Information
Form 1099-DIV, Form 1042-S and other year-end tax information provide shareholders with actual calendar year amounts that should be included in their tax returns. Shareholders should consult their tax advisers.
The following distribution information is being provided as required by the Internal Revenue Code or to meet a specific state’s requirement.
The Fund designates the following amounts or, if subsequently determined to be different, the maximum amount allowable for their fiscal year ended October 31, 2022:
| | | | | | | | |
Federal and State Income Tax | | | | | | |
Qualified Dividend Income* | | | 6.98 | % | | | | |
Corporate Dividends Received Deduction* | | | 6.82 | % | | | | |
U.S. Treasury Obligations* | | | 6.44 | % | | | | |
Qualified Business Income* | | | 0.00 | % | | | | |
Business Interest Income* | | | 56.86 | % | | | | |
|
| * The above percentages are based on ordinary income dividends paid to shareholders during the Fund’s fiscal year. | |
| | |
| 49 | | Invesco Multi-Asset Income Fund |
Trustees and Officers
The address of each trustee and officer is AIM Investment Funds (Invesco Investment Funds) (the “Trust”), 11 Greenway Plaza, Suite 1000, Houston, Texas 77046-1173. The trustees serve for the life of the Trust, subject to their earlier death, incapacitation, resignation, retirement or removal as more specifically provided in the Trust’s organizational documents. Each officer serves for a one year term or until their successors are elected and qualified. Column two below includes length of time served with predecessor entities, if any.
| | | | | | | | |
Name, Year of Birth and Position(s) Held with the Trust | | Trustee and/or Officer Since | | Principal Occupation(s) During Past 5 Years | | Number of Funds in Fund Complex Overseen by Trustee | | Other Directorship(s) Held by Trustee During Past 5 Years |
| Interested Trustee | | | | | | | | |
Martin L. Flanagan1 - 1960 Trustee and Vice Chair | | 2007 | | Executive Director, Chief Executive Officer and President, Invesco Ltd. (ultimate parent of Invesco and a global investment management firm); Trustee and Vice Chair, The Invesco Funds; Vice Chair, Investment Company Institute; and Member of Executive Board, SMU Cox School of Business Formerly: Advisor to the Board, Invesco Advisers, Inc. (formerly known as Invesco Institutional (N.A.), Inc.); Chairman and Chief Executive Officer, Invesco Advisers, Inc. (registered investment adviser); Director, Chairman, Chief Executive Officer and President, Invesco Holding Company (US), Inc. (formerly IVZ Inc.) (holding company), Invesco Group Services, Inc. (service provider) and Invesco North American Holdings, Inc. (holding company); Director, Chief Executive Officer and President, Invesco Holding Company Limited (parent of Invesco and a global investment management firm); Director, Invesco Ltd.; Chairman, Investment Company Institute and President, Co-Chief Executive Officer, Co-President, Chief Operating Officer and Chief Financial Officer, Franklin Resources, Inc. (global investment management organization) | | 189 | | None |
| 1 | Mr. Flanagan is considered an interested person (within the meaning of Section 2(a)(19) of the 1940 Act) of the Trust because he is an officer of the Adviser to the Trust, and an officer and a director of Invesco Ltd., ultimate parent of the Adviser. |
| | |
| T-1 | | Invesco Multi-Asset Income Fund |
Trustees and Officers–(continued)
| | | | | | | | |
Name, Year of Birth and Position(s) Held with the Trust | | Trustee and/or Officer Since | | Principal Occupation(s) During Past 5 Years | | Number of Funds in
Fund Complex
Overseen by
Trustee | | Other Directorship(s) Held by Trustee During Past 5 Years |
| Independent Trustees | | | | | | | | |
Beth Ann Brown - 1968 Trustee (2019) and Chair (August 2022) | | 2019 | | Independent Consultant Formerly: Head of Intermediary Distribution, Managing Director, Strategic Relations, Managing Director, Head of National Accounts, Senior Vice President, National Account Manager and Senior Vice President, Key Account Manager, Columbia Management Investment Advisers LLC; Vice President, Key Account Manager, Liberty Funds Distributor, Inc.; and Trustee of certain Oppenheimer Funds | | 189 | | Director, Board of Directors of Caron Engineering Inc.; Advisor, Board of Advisors of Caron Engineering Inc.; President and Director, Acton Shapleigh Youth Conservation Corps (non-profit) Formerly: President and Director Director of Grahamtastic Connection (non-profit) |
Cynthia Hostetler - 1962 Trustee | | 2017 | | Non-Executive Director and Trustee of a number of public and private business corporations Formerly: Director, Aberdeen Investment Funds (4 portfolios); Director, Artio Global Investment LLC (mutual fund complex); Director, Edgen Group, Inc. (specialized energy and infrastructure products distributor); Director, Genesee & Wyoming, Inc. (railroads); Head of Investment Funds and Private Equity, Overseas Private Investment Corporation; President, First Manhattan Bancorporation, Inc.; and Attorney, Simpson Thacher & Bartlett LLP | | 189 | | Resideo Technologies, Inc. (smart home technology); Vulcan Materials Company (construction materials company); Trilinc Global Impact Fund; Textainer Group Holdings, (shipping container leasing company); Investment Company Institute (professional organization); and Independent Directors Council (professional organization) |
Eli Jones - 1961 Trustee | | 2016 | | Professor and Dean Emeritus, Mays Business School - Texas A&M University Formerly: Dean of Mays Business School-Texas A&M University; Professor and Dean, Walton College of Business, University of Arkansas and E.J. Ourso College of Business, Louisiana State University; and Director, Arvest Bank | | 189 | | Insperity, Inc. (formerly known as Administaff) (human resources provider); and Member of Regional Board of Directors and Board of Directors, First Financial Bancorp (regional bank) |
Elizabeth Krentzman - 1959 Trustee | | 2019 | | Formerly: Principal and Chief Regulatory Advisor for Asset Management Services and U.S. Mutual Fund Leader of Deloitte & Touche LLP; General Counsel of the Investment Company Institute (trade association); National Director of the Investment Management Regulatory Consulting Practice, Principal, Director and Senior Manager of Deloitte & Touche LLP; Assistant Director of the Division of Investment Management - Office of Disclosure and Investment Adviser Regulation of the U.S. Securities and Exchange Commission and various positions with the Division of Investment Management – Office of Regulatory Policy of the U.S. Securities and Exchange Commission; Associate at Ropes & Gray LLP; and Trustee of certain Oppenheimer Funds | | 189 | | Formerly: Member of the Cartica Funds Board of Directors (private investment fund); Trustee of the University of Florida National Board Foundation; and Member of the University of Florida Law Center Association, Inc. Board of Trustees, Audit Committee and Membership Committee |
Anthony J. LaCava, Jr. - 1956 Trustee | | 2019 | | Formerly: Director and Member of the Audit Committee, Blue Hills Bank (publicly traded financial institution) and Managing Partner, KPMG LLP | | 189 | | Blue Hills Bank; Chairman, Bentley University; Member, Business School Advisory Council; and Nominating Committee, KPMG LLP |
Prema Mathai-Davis - 1950 Trustee | | 2001 | | Retired Formerly: Co-Founder & Partner of Quantalytics Research, LLC, (a FinTech Investment Research Platform for the Self-Directed Investor); Trustee of YWCA Retirement Fund; CEO of YWCA of the USA; Board member of the NY Metropolitan Transportation Authority; Commissioner of the NYC Department of Aging; and Board member of Johns Hopkins Bioethics Institute | | 189 | | Member of Board of Positive Planet US (non-profit) and HealthCare Chaplaincy Network (non-profit) |
| | |
| T-2 | | Invesco Multi-Asset Income Fund |
Trustees and Officers–(continued)
| | | | | | | | |
Name, Year of Birth and Position(s) Held with the Trust | | Trustee and/or Officer Since | | Principal Occupation(s) During Past 5 Years | | Number of Funds in
Fund Complex
Overseen by
Trustee | | Other Directorship(s) Held by Trustee During Past 5 Years |
| Independent Trustees–(continued) | | | | | | |
Joel W. Motley - 1952 Trustee | | 2019 | | Director of Office of Finance, Federal Home Loan Bank System; Managing Director of Carmona Motley Inc. (privately held financial advisor); Member of the Council on Foreign Relations and its Finance and Budget Committee; Chairman Emeritus of Board of Human Rights Watch and Member of its Investment Committee; and Member of Investment Committee Board of Historic Hudson Valley (non-profit cultural organization); Member of the Board, Blue Ocean Acquisition Corp.; and Member of the Vestry and the Investment Committee of Trinity Church Wall Street. Formerly: Managing Director of Public Capital Advisors, LLC (privately held financial advisor); Managing Director of Carmona Motley Hoffman, Inc. (privately held financial advisor); Trustee of certain Oppenheimer Funds; and Director of Columbia Equity Financial Corp. (privately held financial advisor) | | 189 | | Member of Board of Trust for Mutual Understanding (non-profit promoting the arts and environment); Member of Board of Greenwall Foundation (bioethics research foundation) and its Investment Committee; Member of Board of Friends of the LRC (non-profit legal advocacy); and Board Member and Investment Committee Member of Pulitzer Center for Crisis Reporting (non-profit journalism) |
Teresa M. Ressel - 1962 Trustee | | 2017 | | Non-executive director and trustee of a number of public and private business corporations Formerly: Chief Executive Officer, UBS Securities LLC (investment banking); Chief Operating Officer, UBS AG Americas (investment banking); Sr. Management Team Olayan America, The Olayan Group (international investor/commercial/industrial); Assistant Secretary for Management & Budget and Designated Chief Financial Officer, U.S. Department of Treasury and Director, ON Semiconductor Corporation (semiconductor manufacturing) | | 189 | | None |
Robert C. Troccoli - 1949 Trustee | | 2016 | | Retired Formerly: Adjunct Professor, University of Denver - Daniels College of Business; and Managing Partner, KPMG LLP | | 189 | | None |
Daniel S. Vandivort - 1954 Trustee | | 2019 | | President, Flyway Advisory Services LLC (consulting and property management) Formerly: President and Chief Investment Officer, previously Head of Fixed Income, Weiss Peck and Greer/Robeco Investment Management; Trustee and Chair, Weiss Peck and Greer Funds Board; and various capacities at CS First Boston including Head of Fixed Income at First Boston Asset Management. | | 189 | | Formerly: Trustee and Governance Chair, Oppenheimer Funds; Treasurer, Chairman of the Audit and Finance Committee, Huntington Disease Foundation of America |
| | |
| T-3 | | Invesco Multi-Asset Income Fund |
Trustees and Officers–(continued)
| | | | | | | | |
Name, Year of Birth and
Position(s) Held with the Trust | | Trustee and/or Officer Since | | Principal Occupation(s) During Past 5 Years | | Number of
Funds in
Fund Complex
Overseen by
Trustee | | Other Directorship(s) Held by Trustee During Past 5 Years |
| Officers | | | | | | | | |
Sheri Morris - 1964 President and Principal Executive Officer | | 1999 | | Director, Invesco Trust Company; Head of Global Fund Services, Invesco Ltd.; President and Principal Executive Officer, The Invesco Funds; Vice President, Invesco Exchange-Traded Fund Trust, Invesco Exchange-Traded Fund Trust II, Invesco India Exchange-Traded Fund Trust, Invesco Actively Managed Exchange-Traded Fund Trust, Invesco Actively Managed Exchange-Traded Commodity Fund Trust and Invesco Exchange-Traded Self-Indexed Fund Trust; and Vice President, OppenheimerFunds, Inc. Formerly: Vice President, Treasurer and Principal Financial Officer, The Invesco Funds; Vice President, Invesco AIM Advisers, Inc., Invesco AIM Capital Management, Inc. and Invesco AIM Private Asset Management, Inc.; Assistant Vice President and Assistant Treasurer, The Invesco Funds; Vice President and Assistant Vice President, Invesco Advisers, Inc.; Assistant Vice President, Invesco AIM Capital Management, Inc. and Invesco AIM Private Asset Management, Inc.; Treasurer, Invesco Exchange-Traded Fund Trust, Invesco Exchange-Traded Fund Trust II, Invesco India Exchange-Traded Fund Trust and Invesco Actively Managed Exchange-Traded Fund Trust; and Senior Vice President, Invesco Advisers, Inc. (formerly known as Invesco Institutional (N.A.), Inc.) (registered investment adviser) | | N/A | | N/A |
Jeffrey H. Kupor - 1968 Senior Vice President, Chief Legal Officer and Secretary | | 2018 | | Head of Legal of the Americas, Invesco Ltd.; Senior Vice President and Secretary, Invesco Advisers, Inc. (formerly known as Invesco Institutional (N.A.), Inc.) (registered investment adviser); Secretary, Invesco Distributors, Inc. (formerly known as Invesco AIM Distributors, Inc.); Vice President and Secretary, Invesco Investment Services, Inc. (formerly known as Invesco AIM Investment Services, Inc.); Senior Vice President, Chief Legal Officer and Secretary, The Invesco Funds; Secretary and General Counsel, Invesco Investment Advisers LLC (formerly known as Van Kampen Asset Management); Secretary and General Counsel, Invesco Capital Markets, Inc. (formerly known as Van Kampen Funds Inc.); Chief Legal Officer, Invesco Exchange-Traded Fund Trust, Invesco Exchange-Traded Fund Trust II, Invesco India Exchange-Traded Fund Trust, Invesco Actively Managed Exchange-Traded Fund Trust, Invesco Actively Managed Exchange-Traded Commodity Fund Trust and Invesco Exchange-Traded Self-Indexed Fund Trust;; Secretary and Vice President, Harbourview Asset Management Corporation; Secretary and Vice President, OppenheimerFunds, Inc. and Invesco Managed Accounts, LLC; Secretary and Senior Vice President, OFI Global Institutional, Inc.; Secretary and Vice President, OFI SteelPath, Inc.; Secretary and Vice President, Oppenheimer Acquisition Corp.; Secretary and Vice President, Shareholder Services, Inc.; and Secretary and Vice President, Trinity Investment Management Corporation Formerly: Senior Vice President, Invesco Distributors, Inc.; Secretary and Vice President, Jemstep, Inc.; Head of Legal, Worldwide Institutional, Invesco Ltd.; Secretary and General Counsel, INVESCO Private Capital Investments, Inc.; Senior Vice President, Secretary and General Counsel, Invesco Management Group, Inc. (formerly known as Invesco AIM Management Group, Inc.); Assistant Secretary, INVESCO Asset Management (Bermuda) Ltd.; Secretary and General Counsel, Invesco Private Capital, Inc.;Assistant Secretary and General Counsel, INVESCO Realty, Inc.; Secretary and General Counsel, Invesco Senior Secured Management, Inc.; Secretary, Sovereign G./P. Holdings Inc.; Secretary, Invesco Indexing LLC; and Secretary, W.L. Ross & Co., LLC | | N/A | | N/A |
Andrew R. Schlossberg - 1974 Senior Vice President | | 2019 | | Senior Vice President, Invesco Group Services, Inc.; Head of the Americas and Senior Managing Director, Invesco Ltd.; Director and Senior Vice President, Invesco Advisers, Inc. (formerly known as Invesco Institutional (N.A.), Inc.) (registered investment adviser); Director and Chairman, Invesco Investment Services, Inc. (formerly known as Invesco AIM Investment Services, Inc.) (registered transfer agent); Senior Vice President, The Invesco Funds; and Director, Invesco Investment Advisers LLC (formerly known as Van Kampen Asset Management) Formerly: Director, President and Chairman, Invesco Insurance Agency, Inc.; Director, Invesco UK Limited; Director and Chief Executive, Invesco Asset Management Limited and Invesco Fund Managers Limited; Assistant Vice President, The Invesco Funds; Senior Vice President, Invesco Advisers, Inc. (formerly known as Invesco Institutional (N.A.), Inc.) (registered investment adviser); Director and Chief Executive, Invesco Administration Services Limited and Invesco Global Investment Funds Limited; Director, Invesco Distributors, Inc.; Head of EMEA, Invesco Ltd.; President, Invesco Actively Managed Exchange-Traded Commodity Fund Trust, Invesco Actively Managed Exchange-Traded Fund Trust, Invesco Exchange-Traded Fund Trust, Invesco Exchange-Traded Fund Trust II and Invesco India Exchange-Traded Fund Trust; and Managing Director and Principal Executive Officer, Invesco Capital Management LLC | | N/A | | N/A |
| | |
| T-4 | | Invesco Multi-Asset Income Fund |
Trustees and Officers–(continued)
| | | | | | | | |
Name, Year of Birth and Position(s) Held with the Trust | | Trustee and/or Officer Since | | Principal Occupation(s) During Past 5 Years | | Number of
Funds in
Fund Complex
Overseen by
Trustee | | Other Directorship(s) Held by Trustee During Past 5 Years |
| Officers–(continued) | | | | | | | | |
John M. Zerr - 1962 Senior Vice President | | 2006 | | Chief Operating Officer of the Americas; Senior Vice President, Invesco Advisers, Inc. (formerly known as Invesco Institutional (N.A.), Inc.) (registered investment adviser); Senior Vice President, Invesco Distributors, Inc. (formerly known as Invesco AIM Distributors, Inc.); Director and Vice President, Invesco Investment Services, Inc. (formerly known as Invesco AIM Investment Services, Inc.) Senior Vice President, The Invesco Funds; Managing Director, Invesco Capital Management LLC; Director, Invesco Investment Advisers LLC (formerly known as Van Kampen Asset Management); Senior Vice President, Invesco Capital Markets, Inc. (formerly known as Van Kampen Funds Inc.); Manager, Invesco Indexing LLC; Manager, Invesco Specialized Products, LLC; Member, Invesco Canada Funds Advisory Board; Director, President and Chief Executive Officer, Invesco Corporate Class Inc. (corporate mutual fund company); and Director, Chairman, President and Chief Executive Officer, Invesco Canada Ltd. (formerly known as Invesco Trimark Ltd./Invesco Trimark Ltèe) (registered investment adviser and registered transfer agent); President, Invesco, Inc.; President, Invesco Global Direct Real Estate Feeder GP Ltd.; President, Invesco IP Holdings (Canada) Ltd; President, Invesco Global Direct Real Estate GP Ltd.; President, Invesco Financial Services Ltd. / Services Financiers Invesco Ltée; and Director and Chairman, Invesco Trust Company Formerly: President, Trimark Investments Ltd/Services Financiers Invesco Ltee; Director and Senior Vice President, Invesco Insurance Agency, Inc.; Director and Senior Vice President, Invesco Management Group, Inc. (formerly known as Invesco AIM Management Group, Inc.); Secretary and General Counsel, Invesco Management Group, Inc. (formerly known as Invesco AIM Management Group, Inc.); Secretary, Invesco Investment Services, Inc. (formerly known as Invesco AIM Investment Services, Inc.); Chief Legal Officer and Secretary, The Invesco Funds; Secretary and General Counsel, Invesco Investment Advisers LLC (formerly known as Van Kampen Asset Management); Secretary and General Counsel, Invesco Capital Markets, Inc. (formerly known as Van Kampen Funds Inc.); Chief Legal Officer, Invesco Exchange-Traded Fund Trust, Invesco Exchange-Traded Fund Trust II, Invesco India Exchange-Traded Fund Trust, Invesco Actively Managed Exchange-Traded Fund Trust, Invesco Actively Managed Exchange-Traded Commodity Fund Trust and Invesco Exchange-Traded Self-Indexed Fund Trust; Secretary, Invesco Indexing LLC; Director, Secretary, General Counsel and Senior Vice President, Van Kampen Exchange Corp.; Director, Vice President and Secretary, IVZ Distributors, Inc. (formerly known as INVESCO Distributors, Inc.); Director and Vice President, INVESCO Funds Group, Inc.; Director and Vice President, Van Kampen Advisors Inc.; Director, Vice President, Secretary and General Counsel, Van Kampen Investor Services Inc.;Director and Secretary, Invesco Distributors, Inc. (formerly known as Invesco AIM Distributors, Inc.); Director, Senior Vice President, General Counsel and Secretary, Invesco AIM Advisers, Inc. and Van Kampen Investments Inc.; Director, Vice President and Secretary, Fund Management Company; Director, Senior Vice President, Secretary, General Counsel and Vice President, Invesco AIM Capital Management, Inc.; and Chief Operating Officer and General Counsel, Liberty Ridge Capital, Inc. (an investment adviser) | | N/A | | N/A |
Gregory G. McGreevey - 1962 Senior Vice President | | 2012 | | Senior Managing Director, Invesco Ltd.; Director, Chairman, President, and Chief Executive Officer, Invesco Advisers, Inc. (formerly known as Invesco Institutional (N.A.), Inc.) (registered investment adviser); Director, Invesco Mortgage Capital, Inc. and Invesco Senior Secured Management, Inc.; Senior Vice President, The Invesco Funds; President, SNW Asset Management Corporation and Invesco Managed Accounts, LLC; Chairman and Director, Invesco Private Capital, Inc.; Chairman and Director, INVESCO Private Capital Investments, Inc.; Chairman and Director, INVESCO Realty, Inc.; and Senior Vice President, Invesco Group Services, Inc. Formerly: Senior Vice President, Invesco Management Group, Inc. and Invesco Advisers, Inc.; Assistant Vice President, The Invesco Funds | | N/A | | N/A |
Adrien Deberghes - 1967 Principal Financial Officer, Treasurer and Vice President | | 2020 | | Head of the Fund Office of the CFO and Fund Administration; Vice President, Invesco Advisers, Inc.; Principal Financial Officer, Treasurer and Vice President, The Invesco Funds; Vice President, Invesco Exchange-Traded Fund Trust, Invesco Exchange-Traded Fund Trust II, Invesco India Exchange-Traded Fund Trust, Invesco Actively Managed Exchange-Traded Fund Trust, Invesco Actively Managed Exchange-Traded Commodity Fund Trust and Invesco Exchange-Traded Self-Indexed Fund Trust Formerly: Senior Vice President and Treasurer, Fidelity Investments | | N/A | | N/A |
Crissie M. Wisdom - 1969 Anti-Money Laundering Compliance Officer | | 2013 | | Anti-Money Laundering and OFAC Compliance Officer for Invesco U.S. entities including: Invesco Advisers, Inc. and its affiliates, Invesco Capital Markets, Inc., Invesco Distributors, Inc., Invesco Investment Services, Inc., The Invesco Funds, Invesco Capital Management, LLC, Invesco Trust Company; and Fraud Prevention Manager for Invesco Investment Services, Inc. | | N/A | | N/A |
| | |
| T-5 | | Invesco Multi-Asset Income Fund |
Trustees and Officers–(continued)
| | | | | | | | |
Name, Year of Birth and Position(s) Held with the Trust | | Trustee and/or Officer Since | | Principal Occupation(s) During Past 5 Years | | Number of
Funds in
Fund Complex
Overseen by
Trustee | | Other Directorship(s) Held by Trustee During Past 5 Years |
| Officers–(continued) | | | | | | | | |
Todd F. Kuehl - 1969 Chief Compliance Officer and Senior Vice President | | 2020 | | Chief Compliance Officer, Invesco Advisers, Inc. (registered investment adviser); and Chief Compliance Officer and Senior Vice President, The Invesco Funds Formerly: Managing Director and Chief Compliance Officer, Legg Mason (Mutual Funds); Chief Compliance Officer, Legg Mason Private Portfolio Group (registered investment adviser) | | N/A | | N/A |
James Bordewick, Jr. - 1959 Senior Vice President and Senior Officer | | 2022 | | Senior Vice President and Senior Officer, The Invesco Funds; and Chief Legal Officer, KingsCrowd, Inc. (research and analytical platform for investment in private capital markets) Formerly, Chief Operating Officer and Head of Legal and Regulatory, Netcapital (private capital investment platform); Managing Director, General Counsel of asset management and Chief Compliance Officer for asset management and private banking, Bank of America Corporation; Chief Legal Officer, Columbia Funds and BofA Funds; Senior Vice President and Associate General Counsel, MFS Investment Management; Chief Legal Officer, MFS Funds; Associate, Ropes & Gray; Associate, Gaston Snow & Ely Bartlett | | N/A | | N/A |
The Statement of Additional Information of the Trust includes additional information about the Fund’s Trustees and is available upon request, without charge, by calling 1.800.959.4246. Please refer to the Fund’s Statement of Additional Information for information on the Fund’s sub-advisers.
Office of the Fund
11 Greenway Plaza, Suite 1000
Houston, TX 77046-1173
Counsel to the Fund
Stradley Ronon Stevens & Young, LLP
2005 Market Street, Suite 2600
Philadelphia, PA 19103-7018
Investment Adviser
Invesco Advisers, Inc.
1555 Peachtree Street, N.E.
Atlanta, GA 30309
Counsel to the Independent Trustees
Goodwin Procter LLP
901 New York Avenue, N.W.
Washington, D.C. 20001
Distributor
Invesco Distributors, Inc.
11 Greenway Plaza, Suite 1000
Houston, TX 77046-1173
Transfer Agent
Invesco Investment Services, Inc.
11 Greenway Plaza, Suite 1000
Houston, TX 77046-1173
Auditors
PricewaterhouseCoopers LLP
1000 Louisiana Street, Suite 5800
Houston, TX 77002-5021
Custodian
State Street Bank and Trust Company
225 Franklin Street
Boston, MA 02110-2801
| | |
| T-6 | | Invesco Multi-Asset Income Fund |

Go paperless with eDelivery
Visit invesco.com/edelivery to enjoy the convenience and security of anytime electronic access to your investment documents.
With eDelivery, you can elect to have any or all of the following materials delivered straight to your inbox to download, save and print from your own computer:
∎ Fund reports and prospectuses
∎ Quarterly statements
∎ Daily confirmations
∎ Tax forms
Invesco mailing information
Send general correspondence to Invesco Investment Services, Inc., P.O. Box 219078, Kansas City, MO 64121-9078.
Important notice regarding delivery of security holder documents
To reduce Fund expenses, only one copy of most shareholder documents may be mailed to shareholders with multiple accounts at the same address (Householding). Mailing of your shareholder documents may be householded indefinitely unless you instruct us otherwise. If you do not want the mailing of these documents to be combined with those for other members of your household, please contact Invesco Investment Services, Inc. at 800 959 4246 or contact your financial institution. We will begin sending you individual copies for each account within 30 days after receiving your request.
Fund holdings and proxy voting information
The Fund provides a complete list of its portfolio holdings four times each year, at the end of each fiscal quarter. For the second and fourth quarters, the list appears, respectively, in the Fund’s semiannual and annual reports to shareholders. For the first and third quarters, the Fund files the list with the Securities and Exchange Commission (SEC) as an exhibit to its reports on Form N-PORT. The most recent list of portfolio holdings is available at invesco.com/completeqtrholdings. Shareholders can also look up the Fund’s Form N-PORT filings on the SEC website, sec.gov. The SEC file numbers for the Fund are shown below.
A description of the policies and procedures that the Fund uses to determine how to vote proxies relating to portfolio securities is available without charge, upon request, from our Client Services department at 800 959 4246, or at invesco.com/corporate/about-us/esg. The information is also available on the SEC website, sec.gov.
Information regarding how the Fund voted proxies related to its portfolio securities during the most recent 12-month period ended June 30 is available at invesco.com/proxysearch. This information is also available on the SEC website, sec.gov.
Invesco Advisers, Inc. is an investment adviser; it provides investment advisory services to individual and institutional clients and does not sell securities. Invesco Distributors, Inc. is the US distributor for Invesco Ltd.’s retail mutual funds, exchange-traded funds and institutional money market funds. Both are wholly owned, indirect subsidiaries of Invesco Ltd.
| | | | |
| SEC file number(s): 811-05426 and 033-19338 | | Invesco Distributors, Inc. | | MAIN-AR-1 |

| | |
| | |
| Annual Report to Shareholders | | October 31, 2022 |
Invesco U.S. Managed Volatility Fund
Nasdaq:
R6: USMVX
Management’s Discussion of Fund Performance
| | | | |
| |
Performance summary | |
For the fiscal year ended October 31, 2022, Class R6 shares of Invesco U.S. Managed Volatility Fund (the Fund), at net asset value (NAV), outperformed the Invesco US Large Cap Index, the Fund’s style-specific benchmark. | |
Your Fund’s long-term performance appears later in this report. | |
| |
Fund vs. Indexes | |
Total returns, 10/31/21 to 10/31/22, at net asset value (NAV). Performance shown does not include applicable contingent deferred sales charges (CDSC) or front-end sales charges, which would have reduced performance. | |
Class R6 Shares | | | -13.25 | % |
S&P 500 Index▼ (Broad Market Index) | | | -14.61 | |
Invesco US Large Cap Index▼ (Style-Specific Index) | | | -15.99 | |
| |
Source(s): ▼RIMES Technologies Corp. | | | | |
Market conditions and your Fund
The fiscal year began with continued volatility in equity markets in the fourth quarter of 2021 amid record inflation and the emergence of a new COVID-19 variant. Pandemic-related supply chain disruption and labor shortages intensified during the quarter, resulting in broadly higher input costs for companies and consumers alike. Additionally, the price of oil rose,1 causing higher gas prices for consumers, and the Consumer Price Index (CPI) reported for November 2021 increased 0.8%, resulting in a 6.8% increase over the prior 12 months, the highest since 1982.2 To combat inflation, the US Federal Reserve (the Fed) announced the potential for three or more interest rate increases in 2022. With solid corporate earnings and optimism about the COVID-19 Omicron variant reporting milder symptoms, stocks rallied at the 2021 year-end.
Equity markets declined in the first quarter of 2022 amid volatility sparked by Russia’s invasion of Ukraine, rising commodity prices, rampant global inflation and the Fed’s shift toward tighter monetary policy. Russia’s invasion exacerbated inflation pressures, disrupting already strained supply chains and increasing shortages of oil, gas and raw materials. The price of oil rose sharply, with crude prices reaching their highest price per barrel since 2008.1 Inflation continued to be a top concern for consumers, investors and the Fed. To combat inflation, the Fed raised the federal funds rate by one-quarter percentage point in March and the Fed indicated it would “taper” its asset purchase program quickly.3
As the war in Ukraine continued and corporate earnings in high-profile names like Netflix reported slowing growth and profits, the equity markets sold off for much of April 2022. The downward direction of the equity markets continued into second quarter of 2022 amid record inflation, rising interest rates and an increasing likelihood of a US recession. Driven by higher food and energy prices, the CPI rose by yet another 40-year high to 8.6% for the twelve months ended May 2022.2 Oil prices peaked near $122 per barrel in early
June, resulting in skyrocketing gasoline prices; the national average price reached a record high above $5 per gallon in early June.1 To tame inflation, the Fed raised the benchmark federal funds rate three more times, by 0.50% in May, by 0.75% in June and another 0.75% in July, which were the largest increases in nearly 30 years.3 US equity markets rose in July and August until Fed chairman Jerome Powell’s hawkish comments at an economic policy symposium held in Jackson Hole, which sparked a sharp selloff at month-end. The Fed reiterated that it would continue taking aggressive action to curb inflation, even though such measures could “bring pain to households and businesses,” and the Fed raised the benchmark federal funds rate by another 0.75% in September.3
After experiencing a sharp drop in September 2022, US equity markets rebounded in October with strong gains, despite mixed data on the economy and corporate earnings. Inflation data reported in October came in higher than expected, and the labor market remained strong, with payroll employment gains and a decline in the unemployment rate to a near record low of 3.5% in September.2 The initial estimate of third quarter real gross domestic product showed an increase of 2.6% (annualized) after falling in the prior two quarters, but the headline number masked a drop in demand and investment. Corporate earnings were generally in line with expectations, but many companies’ forward earnings guidance was weaker than expected.
In this environment, US stocks had negative double-digit returns for the fiscal year of -14.61%, as measured by the S&P 500 Index.4
Invesco U.S. Managed Volatility Fund is a domestic large cap core equity strategy focused on providing capital appreciation while managing portfolio volatility. The strategy seeks equity-like exposure during periods of economic strength and downside protection during economic stress. The Fund seeks to accomplish this by investing in the Invesco US Large Cap Index with futures overlay component designed to manage volatility. The futures overlay component is designed to
manage the Fund’s overall risk by selling short exchange-traded equity index futures in periods of high market volatility. This risk management overlay is implemented when the forecasted annualized volatility level of the Fund’s returns exceeds 16%.
The Fund posted negative double-digit returns during the fiscal year but outperformed the Fund’s style-specific benchmark, the Invesco US Large Cap Index. The Fund’s relative outperformance can primarily be attributed to the Fund’s volatility overlay. Due to increased market volatility experienced during most of 2022, the overlay was enacted throughout much of the fiscal year and helped to keep the Fund’s overall volatility significantly lower than the Invesco US Large Cap Index. The lower level of volatility, protected to the downside and came with a performance boost as the large cap equity markets saw negative performance.
Outside of the volatility overlay, from an individual holdings perspective, holdings in the energy sector were the leading contributors to absolute Fund performance. Oil firms Exxon Mobil and Chevron were the leading contributors to absolute Fund performance in the sector, benefiting from a rise in the price of oil throughout the fiscal year. In contrast, Fund holdings in the information technology and communication services sectors were the leading detractors from absolute Fund performance. Microsoft and Alphabet were the largest individual detractors as each company released weaker than expected quarterly guidance in the most recent earnings calls as investors assess the continued recession concerns in the broader economy.
Looking ahead, our base case continues to anticipate that economies will accelerate as they reopen, but that any accompanying rise in inflation will be largely temporary. We continue to believe that in the short run, emerging-market countries will generally lag behind because of the obstacles they face vaccinating their respective populations. As economies reopen and spending increases, we believe inflation should remain elevated, especially in the US. However, we anticipate it will then moderate to a rate faster than precrisis trends but not sufficient to induce aggressive action from central banks. Over the longer term, we expect demographics and innovation to place downward pressure on inflation.
The Fund’s strategy is principally implemented through equity investments, but we may also use futures contracts, a derivative instrument, to manage volatility. Derivatives can be a cost-effective way to gain exposure to asset classes. However, derivatives may amplify traditional investment risks through the creation of leverage and may be less liquid than traditional securities.
Please note, after careful consideration, the Board of Trustees approved the liquidation and termination of Invesco U.S. Managed
| | |
| 2 | | Invesco U.S. Managed Volatility Fund |
Volatility Fund to occur on or about January 23, 2023.
Thank you for your investment in Invesco U.S. Managed Volatility Fund.
| 2 | Source: US Bureau of Labor Statistics |
| 3 | Source: US Federal Reserve |
Portfolio manager(s):
Jacob Borbidge
David Hemming
Alessio de Longis
Duy Nguyen
Theodore Samulowitz
The views and opinions expressed in management’s discussion of Fund performance are those of Invesco Advisers, Inc. and its affiliates. These views and opinions are subject to change at any time based on factors such as market and economic conditions. These views and opinions may not be relied upon as investment advice or recommendations, or as an offer for a particular security. The information is not a complete analysis of every aspect of any market, country, industry, security or the Fund. Statements of fact are from sources considered reliable, but Invesco Advisers, Inc. makes no representation or warranty as to their completeness or accuracy. Although historical performance is no guarantee of future results, these insights may help you understand our investment management philosophy.
See important Fund and, if applicable, index disclosures later in this report.
| | |
| 3 | | Invesco U.S. Managed Volatility Fund |
Your Fund’s Long-Term Performance
Results of a $10,000 Investment – Oldest Share Class(es)
Fund and index data from 12/18/17
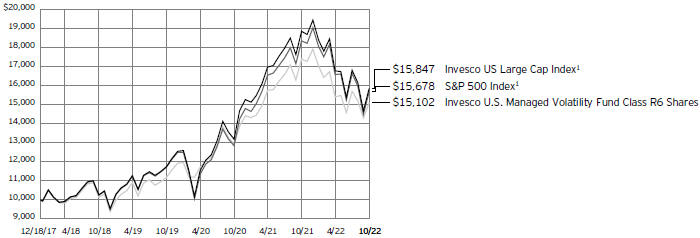
1 Source: RIMES Technologies Corp.
Past performance cannot guarantee future results.
The data shown in the chart include reinvested distributions, applicable sales charges and Fund expenses including management
fees. Index results include reinvested dividends, but they do not reflect sales charges. Performance of the peer group, if applicable, reflects fund expenses and management fees;
performance of a market index does not. Performance shown in the chart does not reflect deduction of taxes a shareholder would pay on Fund distributions or sale of Fund shares.
| | |
| 4 | | Invesco U.S. Managed Volatility Fund |
| | | | |
| |
Average Annual Total Returns | |
As of 10/31/22, including maximum applicable sales charges | |
| |
Class R6 Shares | | | | |
Inception (12/18/17) | | | 8.84 | % |
1 Year | | | -13.25 | |
The performance data quoted represent past performance and cannot guarantee future results; current performance may be lower or higher. Performance figures reflect reinvested distributions and changes in net asset value. Shares of the Fund are sold at net asset value without a sales charge. Performance figures do not reflect deduction of taxes a shareholder would pay on Fund distributions or sale of Fund shares. Investment return and principal value will fluctuate so that you may have a gain or loss when you sell shares.
Class R6 shares do not have a front-end sales charge or a CDSC; therefore, performance is at net asset value.
The performance of the Fund’s share classes will differ primarily due to different sales charge structures and class expenses.
Fund performance reflects any applicable fee waivers and/or expense reimbursements. Had the adviser not waived fees and/or reimbursed expenses currently or in the past, returns would have been lower. See current prospectus for more information.
| | |
| 5 | | Invesco U.S. Managed Volatility Fund |
Supplemental Information
Invesco U.S. Managed Volatility Fund’s investment objective is to seek to provide capital appreciation while managing portfolio volatility.
| ∎ | Unless otherwise stated, information presented in this report is as of October 31, 2022, and is based on total net assets. |
| ∎ | Unless otherwise noted, all data is provided by Invesco. |
| ∎ | To access your Fund’s reports/prospectus, visit invesco.com/fundreports. |
About indexes used in this report
| ∎ | The S&P 500® Index is an unmanaged index considered representative of the US stock market. |
| ∎ | The Invesco US Large Cap Index is a broad-based benchmark measuring the aggregate performance of US large-cap equities. |
| ∎ | A direct investment cannot be made in an index. Unless otherwise indicated, index results include reinvested dividends, and they do not reflect sales charges. Performance of the peer group, if applicable, reflects fund expenses; performance of a market index does not. |
|
|
This report must be accompanied or preceded by a currently effective Fund prospectus, which contains more complete information, including sales charges and expenses. Investors should read it carefully before investing. |
|
| NOT FDIC INSURED | MAY LOSE VALUE | NO BANK GUARANTEE |
| | |
| 6 | | Invesco U.S. Managed Volatility Fund |
Fund Information
Portfolio Composition
| | | | | |
| By sector | | % of total net assets |
| |
Information Technology | | | | 26.61 | % |
| |
Health Care | | | | 15.31 | |
| |
Financials | | | | 11.19 | |
| |
Consumer Discretionary | | | | 10.49 | |
| |
Industrials | | | | 7.51 | |
| |
Communication Services | | | | 7.38 | |
| |
Consumer Staples | | | | 7.07 | |
| |
Energy | | | | 5.38 | |
| |
Utilities | | | | 2.59 | |
| |
Real Estate | | | | 2.27 | |
| |
Materials | | | | 2.19 | |
| |
Money Market Funds Plus Other Assets Less Liabilities | | | | 2.01 | |
Top 10 Equity Holdings*
| | | | | | | |
| | | | | % of total net assets |
| | |
| 1. | | Apple, Inc. | | | | 7.45 | % |
| | |
| 2. | | Microsoft Corp. | | | | 5.18 | |
| | |
| 3. | | Alphabet, Inc., Class A | | | | 3.25 | |
| | |
| 4. | | Amazon.com, Inc. | | | | 2.74 | |
| | |
| 5. | | Tesla, Inc. | | | | 1.80 | |
| | |
| 6. | | Berkshire Hathaway, Inc., Class B | | | | 1.62 | |
| | |
| 7. | | UnitedHealth Group, Inc. | | | | 1.60 | |
| | |
| 8. | | Johnson & Johnson | | | | 1.43 | |
| | |
| 9. | | Exxon Mobil Corp. | | | | 1.41 | |
| | |
| 10. | | JPMorgan Chase & Co. | | | | 1.10 | |
The Fund’s holdings are subject to change, and there is no assurance that the Fund will continue to hold any particular security.
| * | Excluding money market fund holdings, if any. |
Data presented here are as of October 31, 2022.
| | |
| 7 | | Invesco U.S. Managed Volatility Fund |
Schedule of Investments(a)
October 31, 2022
| | | | | | | | |
| | | Shares | | | Value | |
|
| |
Common Stocks & Other Equity Interests–97.99% | |
Advertising–0.11% | |
Omnicom Group, Inc. | | | 164 | | | $ | 11,931 | |
|
| |
Trade Desk, Inc. (The), Class A(b) | | | 343 | | | | 18,261 | |
|
| |
| | | | | | | 30,192 | |
|
| |
| | |
Aerospace & Defense–1.78% | | | | | | | | |
Boeing Co. (The)(b) | | | 471 | | | | 67,122 | |
|
| |
General Dynamics Corp. | | | 219 | | | | 54,706 | |
|
| |
L3Harris Technologies, Inc. | | | 155 | | | | 38,203 | |
|
| |
Lockheed Martin Corp. | | | 216 | | | | 105,123 | |
|
| |
Northrop Grumman Corp. | | | 125 | | | | 68,626 | |
|
| |
Raytheon Technologies Corp. | | | 1,178 | | | | 111,698 | |
|
| |
TransDigm Group, Inc. | | | 42 | | | | 24,182 | |
|
| |
| | | | | | | 469,660 | |
|
| |
| | |
Agricultural & Farm Machinery–0.35% | | | | | | | | |
Deere & Co. | | | 232 | | | | 91,830 | |
|
| |
| | |
Agricultural Products–0.17% | | | | | | | | |
Archer-Daniels-Midland Co. | | | 452 | | | | 43,835 | |
|
| |
| | |
Air Freight & Logistics–0.58% | | | | | | | | |
C.H. Robinson Worldwide, Inc. | | | 97 | | | | 9,479 | |
|
| |
Expeditors International of Washington, Inc. | | | 130 | | | | 12,720 | |
|
| |
FedEx Corp. | | | 193 | | | | 30,934 | |
|
| |
United Parcel Service, Inc., Class B | | | 596 | | | | 99,991 | |
|
| |
| | | | | | | 153,124 | |
|
| |
| | |
Airlines–0.03% | | | | | | | | |
Delta Air Lines, Inc.(b) | | | 126 | | | | 4,275 | |
|
| |
Southwest Airlines Co.(b) | | | 116 | | | | 4,217 | |
|
| |
| | | | | | | 8,492 | |
|
| |
| | |
Alternative Carriers–0.02% | | | | | | | | |
Liberty Global PLC, Class C (United Kingdom)(b) | | | 319 | | | | 5,634 | |
|
| |
| | |
Apparel Retail–0.35% | | | | | | | | |
Ross Stores, Inc. | | | 276 | | | | 26,410 | |
|
| |
TJX Cos., Inc. (The) | | | 926 | | | | 66,765 | |
|
| |
| | | | | | | 93,175 | |
|
| |
| |
Apparel, Accessories & Luxury Goods–0.14% | | | | | |
lululemon athletica, inc.(b) | | | 88 | | | | 28,955 | |
|
| |
VF Corp.(c) | | | 295 | | | | 8,334 | |
|
| |
| | | | | | | 37,289 | |
|
| |
| | |
Application Software–2.23% | | | | | | | | |
Adobe, Inc.(b) | | | 363 | | | | 115,615 | |
|
| |
ANSYS, Inc.(b) | | | 69 | | | | 15,260 | |
|
| |
Autodesk, Inc.(b) | | | 172 | | | | 36,860 | |
|
| |
Cadence Design Systems, Inc.(b) | | | 217 | | | | 32,852 | |
|
| |
Datadog, Inc., Class A(b) | | | 208 | | | | 16,746 | |
|
| |
DocuSign, Inc.(b) | | | 154 | | | | 7,438 | |
|
| |
HubSpot, Inc.(b) | | | 36 | | | | 10,676 | |
|
| |
Intuit, Inc. | | | 218 | | | | 93,195 | |
|
| |
Palantir Technologies, Inc., Class A(b) | | | 1,330 | | | | 11,691 | |
|
| |
Roper Technologies, Inc. | | | 86 | | | | 35,650 | |
|
| |
| | | | | | | | |
| | | Shares | | | Value | |
|
| |
Application Software–(continued) | | | | | | | | |
salesforce.com, inc.(b) | | | 768 | | | $ | 124,869 | |
|
| |
Splunk, Inc.(b) | | | 119 | | | | 9,890 | |
|
| |
Synopsys, Inc.(b) | | | 121 | | | | 35,399 | |
|
| |
Unity Software, Inc.(b)(c) | | | 146 | | | | 4,307 | |
|
| |
Workday, Inc., Class A(b) | | | 158 | | | | 24,620 | |
|
| |
Zoom Video Communications, Inc., Class A(b) | | | 166 | | | | 13,851 | |
|
| |
| | | | | | | 588,919 | |
|
| |
| |
Asset Management & Custody Banks–1.04% | | | | | |
Ameriprise Financial, Inc. | | | 85 | | | | 26,275 | |
|
| |
Bank of New York Mellon Corp. (The) | | | 650 | | | | 27,372 | |
|
| |
BlackRock, Inc. | | | 116 | | | | 74,926 | |
|
| |
Blackstone, Inc., Class A | | | 550 | | | | 50,127 | |
|
| |
Franklin Resources, Inc. | | | 221 | | | | 5,182 | |
|
| |
KKR & Co., Inc., Class A | | | 790 | | | | 38,418 | |
|
| |
Northern Trust Corp. | | | 164 | | | | 13,833 | |
|
| |
State Street Corp. | | | 293 | | | | 21,682 | |
|
| |
T. Rowe Price Group, Inc.(c) | | | 174 | | | | 18,472 | |
|
| |
| | | | | | | 276,287 | |
|
| |
| | |
Auto Parts & Equipment–0.07% | | | | | | | | |
Aptiv PLC(b) | | | 216 | | | | 19,671 | |
|
| |
| | |
Automobile Manufacturers–2.22% | | | | | | | | |
Ford Motor Co. | | | 3,176 | | | | 42,463 | |
|
| |
General Motors Co. | | | 1,223 | | | | 48,003 | |
|
| |
Lucid Group, Inc.(b) | | | 402 | | | | 5,744 | |
|
| |
Rivian Automotive, Inc., Class A(b) | | | 404 | | | | 14,128 | |
|
| |
Tesla, Inc.(b) | | | 2,090 | | | | 475,559 | |
|
| |
| | | | | | | 585,897 | |
|
| |
| | |
Automotive Retail–0.34% | | | | | | | | |
AutoZone, Inc.(b) | | | 16 | | | | 40,526 | |
|
| |
CarMax, Inc.(b) | | | 120 | | | | 7,561 | |
|
| |
O’Reilly Automotive, Inc.(b) | | | 49 | | | | 41,022 | |
|
| |
| | | | | | | 89,109 | |
|
| |
| | |
Biotechnology–2.59% | | | | | | | | |
AbbVie, Inc. | | | 1,450 | | | | 212,280 | |
|
| |
Amgen, Inc. | | | 438 | | | | 118,413 | |
|
| |
Biogen, Inc.(b) | | | 116 | | | | 32,879 | |
|
| |
BioMarin Pharmaceutical, Inc.(b) | | | 151 | | | | 13,081 | |
|
| |
BioNTech SE, ADR (Germany) | | | 196 | | | | 26,977 | |
|
| |
Gilead Sciences, Inc. | | | 1,028 | | | | 80,657 | |
|
| |
Incyte Corp.(b) | | | 184 | | | | 13,679 | |
|
| |
Moderna, Inc.(b) | | | 265 | | | | 39,837 | |
|
| |
Regeneron Pharmaceuticals, Inc.(b) | | | 82 | | | | 61,398 | |
|
| |
Seagen, Inc.(b) | | | 149 | | | | 18,947 | |
|
| |
Vertex Pharmaceuticals, Inc.(b) | | | 213 | | | | 66,456 | |
|
| |
| | | | | | | 684,604 | |
|
| |
| | |
Broadcasting–0.08% | | | | | | | | |
Fox Corp., Class A | | | 420 | | | | 12,126 | |
|
| |
Paramount Global, Class B | | | 532 | | | | 9,746 | |
|
| |
| | | | | | | 21,872 | |
|
| |
| | |
Building Products–0.32% | | | | | | | | |
Carrier Global Corp. | | | 644 | | | | 25,605 | |
|
| |
See accompanying Notes to Financial Statements which are an integral part of the financial statements.
| | |
| 8 | | Invesco U.S. Managed Volatility Fund |
| | | | | | | | |
| | | Shares | | | Value | |
|
| |
Building Products–(continued) | | | | | | | | |
Johnson Controls International PLC | | | 540 | | | $ | 31,234 | |
|
| |
Trane Technologies PLC | | | 181 | | | | 28,893 | |
|
| |
| | | | | | | 85,732 | |
|
| |
| | |
Cable & Satellite–0.59% | | | | | | | | |
Charter Communications, Inc., Class A(b) | | | 86 | | | | 31,615 | |
|
| |
Comcast Corp., Class A | | | 3,518 | | | | 111,661 | |
|
| |
Liberty Broadband Corp., Class C(b) | | | 111 | | | | 9,372 | |
|
| |
Sirius XM Holdings, Inc. | | | 569 | | | | 3,437 | |
|
| |
| | | | | | | 156,085 | |
|
| |
| | |
Casinos & Gaming–0.09% | | | | | | | | |
Las Vegas Sands Corp.(b) | | | 621 | | | | 23,604 | |
|
| |
| | |
Commodity Chemicals–0.16% | | | | | | | | |
Dow, Inc. | | | 566 | | | | 26,455 | |
|
| |
LyondellBasell Industries N.V., Class A | | | 204 | | | | 15,596 | |
|
| |
| | | | | | | 42,051 | |
|
| |
| | |
Communications Equipment–0.79% | | | | | | | | |
Arista Networks, Inc.(b) | | | 195 | | | | 23,568 | |
|
| |
Cisco Systems, Inc. | | | 3,318 | | | | 150,737 | |
|
| |
Motorola Solutions, Inc. | | | 134 | | | | 33,461 | |
|
| |
| | | | | | | 207,766 | |
|
| |
| | |
Computer & Electronics Retail–0.04% | | | | | | | | |
Best Buy Co., Inc. | | | 159 | | | | 10,877 | |
|
| |
| |
Construction Machinery & Heavy Trucks–0.55% | | | | | |
Caterpillar, Inc. | | | 422 | | | | 91,346 | |
|
| |
Cummins, Inc. | | | 113 | | | | 27,629 | |
|
| |
PACCAR, Inc. | | | 272 | | | | 26,338 | |
|
| |
| | | | | | | 145,313 | |
|
| |
| | |
Construction Materials–0.13% | | | | | | | | |
Martin Marietta Materials, Inc. | | | 50 | | | | 16,799 | |
|
| |
Vulcan Materials Co. | | | 108 | | | | 17,680 | |
|
| |
| | | | | | | 34,479 | |
|
| |
| | |
Consumer Electronics–0.04% | | | | | | | | |
Garmin Ltd. | | | 125 | | | | 11,005 | |
|
| |
| | |
Consumer Finance–0.59% | | | | | | | | |
American Express Co. | | | 602 | | | | 89,367 | |
|
| |
Capital One Financial Corp. | | | 299 | | | | 31,700 | |
|
| |
Discover Financial Services | | | 214 | | | | 22,354 | |
|
| |
Synchrony Financial | | | 366 | | | | 13,015 | |
|
| |
| | | | | | | 156,436 | |
|
| |
| | |
Copper–0.14% | | | | | | | | |
Freeport-McMoRan, Inc. | | | 1,110 | | | | 35,176 | |
|
| |
Southern Copper Corp. (Peru) | | | 67 | | | | 3,147 | |
|
| |
| | | | | | | 38,323 | |
|
| |
| |
Data Processing & Outsourced Services–3.26% | | | | | |
Automatic Data Processing, Inc. | | | 334 | | | | 80,728 | |
|
| |
Block, Inc., Class A(b) | | | 409 | | | | 24,568 | |
|
| |
Fidelity National Information Services, Inc. | | | 490 | | | | 40,665 | |
|
| |
Fiserv, Inc.(b) | | | 486 | | | | 49,932 | |
|
| |
FleetCor Technologies, Inc.(b) | | | 56 | | | | 10,423 | |
|
| |
Global Payments, Inc. | | | 222 | | | | 25,366 | |
|
| |
Mastercard, Inc., Class A | | | 771 | | | | 253,027 | |
|
| |
| | | | | | | | |
| | | Shares | | | Value | |
|
| |
Data Processing & Outsourced Services–(continued) | |
Paychex, Inc. | | | 261 | | | $ | 30,879 | |
|
| |
PayPal Holdings, Inc.(b) | | | 902 | | | | 75,389 | |
|
| |
Visa, Inc., Class A | | | 1,308 | | | | 270,965 | |
|
| |
| | | | | | | 861,942 | |
|
| |
| | |
Distillers & Vintners–0.20% | | | | | | | | |
Brown-Forman Corp., Class B | | | 323 | | | | 21,964 | |
|
| |
Constellation Brands, Inc., Class A | | | 123 | | | | 30,391 | |
|
| |
| | | | | | | 52,355 | |
|
| |
| | |
Distributors–0.08% | | | | | | | | |
Genuine Parts Co. | | | 116 | | | | 20,632 | |
|
| |
| | |
Diversified Banks–2.99% | | | | | | | | |
Bank of America Corp. | | | 6,388 | | | | 230,223 | |
|
| |
Citigroup, Inc. | | | 1,556 | | | | 71,358 | |
|
| |
JPMorgan Chase & Co. | | | 2,310 | | | | 290,783 | |
|
| |
NU Holdings Ltd., Class A (Brazil)(b) | | | 1,377 | | | | 6,885 | |
|
| |
U.S. Bancorp | | | 1,195 | | | | 50,728 | |
|
| |
Wells Fargo & Co. | | | 3,043 | | | | 139,948 | |
|
| |
| | | | | | | 789,925 | |
|
| |
| | |
Diversified Support Services–0.19% | | | | | | | | |
Cintas Corp. | | | 69 | | | | 29,501 | |
|
| |
Copart, Inc.(b) | | | 173 | | | | 19,898 | |
|
| |
| | | | | | | 49,399 | |
|
| |
| | |
Drug Retail–0.08% | | | | | | | | |
Walgreens Boots Alliance, Inc. | | | 574 | | | | 20,951 | |
|
| |
| | |
Electric Utilities–1.72% | | | | | | | | |
American Electric Power Co., Inc. | | | 423 | | | | 37,190 | |
|
| |
Avangrid, Inc. | | | 55 | | | | 2,237 | |
|
| |
Duke Energy Corp. | | | 634 | | | | 59,076 | |
|
| |
Edison International | | | 311 | | | | 18,672 | |
|
| |
Entergy Corp. | | | 167 | | | | 17,892 | |
|
| |
Eversource Energy | | | 283 | | | | 21,587 | |
|
| |
Exelon Corp. | | | 806 | | | | 31,104 | |
|
| |
FirstEnergy Corp. | | | 469 | | | | 17,686 | |
|
| |
NextEra Energy, Inc. | | | 1,587 | | | | 122,993 | |
|
| |
PG&E Corp.(b) | | | 1,573 | | | | 23,485 | |
|
| |
PPL Corp. | | | 607 | | | | 16,079 | |
|
| |
Southern Co. (The) | | | 895 | | | | 58,605 | |
|
| |
Xcel Energy, Inc. | | | 450 | | | | 29,300 | |
|
| |
| | | | | | | 455,906 | |
|
| |
| |
Electrical Components & Equipment–0.52% | | | | | |
AMETEK, Inc. | | | 185 | | | | 23,987 | |
|
| |
Eaton Corp. PLC | | | 319 | | | | 47,872 | |
|
| |
Emerson Electric Co. | | | 473 | | | | 40,962 | |
|
| |
Rockwell Automation, Inc. | | | 92 | | | | 23,488 | |
|
| |
| | | | | | | 136,309 | |
|
| |
| | |
Electronic Components–0.21% | | | | | | | | |
Amphenol Corp., Class A | | | 472 | | | | 35,792 | |
|
| |
Corning, Inc. | | | 615 | | | | 19,784 | |
|
| |
| | | | | | | 55,576 | |
|
| |
| |
Electronic Equipment & Instruments–0.14% | | | | | |
Keysight Technologies, Inc.(b) | | | 140 | | | | 24,381 | |
|
| |
Zebra Technologies Corp., Class A(b) | | | 40 | | | | 11,329 | |
|
| |
| | | | | | | 35,710 | |
|
| |
See accompanying Notes to Financial Statements which are an integral part of the financial statements.
| | |
| 9 | | Invesco U.S. Managed Volatility Fund |
| | | | | | | | |
| | | Shares | | | Value | |
|
| |
Electronic Manufacturing Services–0.12% | | | | | |
TE Connectivity Ltd. (Switzerland) | | | 256 | | | $ | 31,291 | |
|
| |
| |
Environmental & Facilities Services–0.38% | | | | | |
Republic Services, Inc. | | | 165 | | | | 21,883 | |
|
| |
Waste Connections, Inc. | | | 209 | | | | 27,569 | |
|
| |
Waste Management, Inc. | | | 319 | | | | 50,520 | |
|
| |
| | | | | | | 99,972 | |
|
| |
| |
Fertilizers & Agricultural Chemicals–0.14% | | | | | |
Corteva, Inc. | | | 578 | | | | 37,767 | |
|
| |
| | |
Financial Exchanges & Data–0.97% | | | | | | | | |
CME Group, Inc., Class A | | | 283 | | | | 49,044 | |
|
| |
Intercontinental Exchange, Inc. | | | 434 | | | | 41,477 | |
|
| |
Moody’s Corp. | | | 145 | | | | 38,406 | |
|
| |
MSCI, Inc. | | | 61 | | | | 28,601 | |
|
| |
Nasdaq, Inc. | | | 265 | | | | 16,494 | |
|
| |
S&P Global, Inc. | | | 261 | | | | 83,846 | |
|
| |
| | | | | | | 257,868 | |
|
| |
| | |
Food Distributors–0.14% | | | | | | | | |
Sysco Corp. | | | 413 | | | | 35,749 | |
|
| |
| | |
Food Retail–0.10% | | | | | | | | |
Kroger Co. (The) | | | 576 | | | | 27,239 | |
|
| |
| | |
Footwear–0.34% | | | | | | | | |
NIKE, Inc., Class B | | | 969 | | | | 89,807 | |
|
| |
| | |
General Merchandise Stores–0.51% | | | | | | | | |
Dollar General Corp. | | | 181 | | | | 46,164 | |
|
| |
Dollar Tree, Inc.(b) | | | 178 | | | | 28,213 | |
|
| |
Target Corp. | | | 367 | | | | 60,280 | |
|
| |
| | | | | | | 134,657 | |
|
| |
| | |
Gold–0.10% | | | | | | | | |
Newmont Corp. | | | 634 | | | | 26,831 | |
|
| |
| | |
Health Care Distributors–0.31% | | | | | | | | |
AmerisourceBergen Corp. | | | 127 | | | | 19,967 | |
|
| |
Cardinal Health, Inc. | | | 219 | | | | 16,622 | |
|
| |
McKesson Corp. | | | 117 | | | | 45,556 | |
|
| |
| | | | | | | 82,145 | |
|
| |
| | |
Health Care Equipment–2.47% | | | | | | | | |
Abbott Laboratories | | | 1,419 | | | | 140,396 | |
|
| |
Baxter International, Inc. | | | 413 | | | | 22,447 | |
|
| |
Becton, Dickinson and Co. | | | 234 | | | | 55,217 | |
|
| |
Boston Scientific Corp.(b) | | | 1,149 | | | | 49,533 | |
|
| |
DexCom, Inc.(b) | | | 309 | | | | 37,321 | |
|
| |
Edwards Lifesciences Corp.(b) | | | 495 | | | | 35,853 | |
|
| |
IDEXX Laboratories, Inc.(b) | | | 67 | | | | 24,099 | |
|
| |
Intuitive Surgical, Inc.(b) | | | 283 | | | | 69,751 | |
|
| |
Medtronic PLC | | | 1,067 | | | | 93,192 | |
|
| |
ResMed, Inc. | | | 118 | | | | 26,395 | |
|
| |
STERIS PLC | | | 80 | | | | 13,806 | |
|
| |
Stryker Corp. | | | 284 | | | | 65,104 | |
|
| |
Zimmer Biomet Holdings, Inc. | | | 171 | | | | 19,383 | |
|
| |
| | | | | | | 652,497 | |
|
| |
| | |
Health Care Facilities–0.14% | | | | | | | | |
HCA Healthcare, Inc. | | | 172 | | | | 37,405 | |
|
| |
| | | | | | | | |
| | | Shares | | | Value | |
|
| |
Health Care REITs–0.17% | | | | | | | | |
Healthpeak Properties, Inc. | | | 434 | | | $ | 10,299 | |
|
| |
Ventas, Inc. | | | 325 | | | | 12,717 | |
|
| |
Welltower, Inc. | | | 379 | | | | 23,134 | |
|
| |
| | | | | | | 46,150 | |
|
| |
| | |
Health Care Services–0.79% | | | | | | | | |
Cigna Corp. | | | 241 | | | | 77,858 | |
|
| |
CVS Health Corp. | | | 1,072 | | | | 101,518 | |
|
| |
Laboratory Corp. of America Holdings | | | 72 | | | | 15,974 | |
|
| |
Quest Diagnostics, Inc. | | | 95 | | | | 13,647 | |
|
| |
| | | | | | | 208,997 | |
|
| |
| | |
Health Care Supplies–0.04% | | | | | | | | |
Align Technology, Inc.(b) | | | 57 | | | | 11,075 | |
|
| |
| | |
Health Care Technology–0.07% | | | | | | | | |
Veeva Systems, Inc., Class A(b) | | | 110 | | | | 18,473 | |
|
| |
| | |
Home Improvement Retail–1.28% | | | | | | | | |
Home Depot, Inc. (The) | | | 823 | | | | 243,715 | |
|
| |
Lowe’s Cos., Inc. | | | 491 | | | | 95,720 | |
|
| |
| | | | | | | 339,435 | |
|
| |
| | |
Homebuilding–0.13% | | | | | | | | |
D.R. Horton, Inc. | | | 243 | | | | 18,682 | |
|
| |
Lennar Corp., Class A | | | 209 | | | | 16,866 | |
|
| |
| | | | | | | 35,548 | |
|
| |
| | |
Hotels, Resorts & Cruise Lines–0.65% | | | | | | | | |
Airbnb, Inc., Class A(b) | | | 304 | | | | 32,501 | |
|
| |
Booking Holdings, Inc.(b) | | | 31 | | | | 57,954 | |
|
| |
Carnival Corp.(b) | | | 746 | | | | 6,759 | |
|
| |
Expedia Group, Inc.(b) | | | 120 | | | | 11,216 | |
|
| |
Hilton Worldwide Holdings, Inc. | | | 213 | | | | 28,810 | |
|
| |
Marriott International, Inc., Class A | | | 221 | | | | 35,384 | |
|
| |
| | | | | | | 172,624 | |
|
| |
| | |
Household Products–1.42% | | | | | | | | |
Church & Dwight Co., Inc. | | | 193 | | | | 14,307 | |
|
| |
Clorox Co. (The) | | | 101 | | | | 14,750 | |
|
| |
Colgate-Palmolive Co. | | | 686 | | | | 50,654 | |
|
| |
Kimberly-Clark Corp. | | | 277 | | | | 34,476 | |
|
| |
Procter & Gamble Co. (The) | | | 1,943 | | | | 261,664 | |
|
| |
| | | | | | | 375,851 | |
|
| |
| | |
Hypermarkets & Super Centers–1.29% | | | | | | | | |
Costco Wholesale Corp. | | | 356 | | | | 178,534 | |
|
| |
Walmart, Inc. | | | 1,139 | | | | 162,114 | |
|
| |
| | | | | | | 340,648 | |
|
| |
| | |
Industrial Conglomerates–0.88% | | | | | | | | |
3M Co. | | | 449 | | | | 56,480 | |
|
| |
General Electric Co. | | | 873 | | | | 67,928 | |
|
| |
Honeywell International, Inc. | | | 537 | | | | 109,559 | |
|
| |
| | | | | | | 233,967 | |
|
| |
| | |
Industrial Gases–0.61% | | | | | | | | |
Air Products and Chemicals, Inc. | | | 176 | | | | 44,070 | |
|
| |
Linde PLC (United Kingdom) | | | 393 | | | | 116,859 | |
|
| |
| | | | | | | 160,929 | |
|
| |
See accompanying Notes to Financial Statements which are an integral part of the financial statements.
| | |
| 10 | | Invesco U.S. Managed Volatility Fund |
| | | | | | | | |
| | | Shares | | | Value | |
|
| |
Industrial Machinery–0.56% | | | | | | | | |
Dover Corp. | | | 115 | | | $ | 15,029 | |
|
| |
Fortive Corp. | | | 276 | | | | 17,636 | |
|
| |
Illinois Tool Works, Inc. | | | 248 | | | | 52,955 | |
|
| |
Otis Worldwide Corp. | | | 340 | | | | 24,018 | |
|
| |
Parker-Hannifin Corp. | | | 103 | | | | 29,934 | |
|
| |
Stanley Black & Decker, Inc. | | | 114 | | | | 8,948 | |
|
| |
| | | | | | | 148,520 | |
|
| |
| | |
Industrial REITs–0.31% | | | | | | | | |
Prologis, Inc. | | | 734 | | | | 81,290 | |
|
| |
| | |
Insurance Brokers–0.61% | | | | | | | | |
Aon PLC, Class A | | | 168 | | | | 47,290 | |
|
| |
Arthur J. Gallagher & Co. | | | 168 | | | | 31,429 | |
|
| |
Marsh & McLennan Cos., Inc. | | | 399 | | | | 64,435 | |
|
| |
Willis Towers Watson PLC | | | 85 | | | | 18,548 | |
|
| |
| | | | | | | 161,702 | |
|
| |
| | |
Integrated Oil & Gas–2.71% | | | | | | | | |
Chevron Corp. | | | 1,580 | | | | 285,822 | |
|
| |
Exxon Mobil Corp. | | | 3,356 | | | | 371,879 | |
|
| |
Occidental Petroleum Corp. | | | 832 | | | | 60,403 | |
|
| |
| | | | | | | 718,104 | |
|
| |
| |
Integrated Telecommunication Services–0.89% | | | | | |
AT&T, Inc. | | | 5,777 | | | | 105,315 | |
|
| |
Verizon Communications, Inc. | | | 3,446 | | | | 128,777 | |
|
| |
| | | | | | | 234,092 | |
|
| |
| | |
Interactive Home Entertainment–0.31% | | | | | | | | |
Activision Blizzard, Inc. | | | 594 | | | | 43,243 | |
|
| |
Electronic Arts, Inc. | | | 209 | | | | 26,326 | |
|
| |
ROBLOX Corp., Class A(b)(c) | | | 287 | | | | 12,840 | |
|
| |
| | | | | | | 82,409 | |
|
| |
| | |
Interactive Media & Services–3.98% | | | | | | | | |
Alphabet, Inc., Class A(b) | | | 9,098 | | | | 859,852 | |
|
| |
Match Group, Inc.(b) | | | 218 | | | | 9,418 | |
|
| |
Meta Platforms, Inc., Class A(b) | | | 1,771 | | | | 164,986 | |
|
| |
Pinterest, Inc., Class A(b) | | | 461 | | | | 11,341 | |
|
| |
Snap, Inc., Class A(b) | | | 751 | | | | 7,442 | |
|
| |
| | | | | | | 1,053,039 | |
|
| |
|
Internet & Direct Marketing Retail–3.02% | |
Amazon.com, Inc.(b) | | | 7,062 | | | | 723,431 | |
|
| |
Coupang, Inc. (South Korea)(b) | | | 811 | | | | 14,006 | |
|
| |
DoorDash, Inc., Class A(b) | | | 225 | | | | 9,794 | |
|
| |
eBay, Inc. | | | 429 | | | | 17,092 | |
|
| |
MercadoLibre, Inc. (Brazil)(b) | | | 37 | | | | 33,360 | |
|
| |
| | | | | | | 797,683 | |
|
| |
|
Internet Services & Infrastructure–0.30% | |
Akamai Technologies, Inc.(b) | | | 128 | | | | 11,307 | |
|
| |
Okta, Inc.(b) | | | 115 | | | | 6,454 | |
|
| |
Snowflake, Inc., Class A(b) | | | 214 | | | | 34,304 | |
|
| |
Twilio, Inc., Class A(b) | | | 133 | | | | 9,891 | |
|
| |
VeriSign, Inc.(b) | | | 83 | | | | 16,638 | |
|
| |
| | | | | | | 78,594 | |
|
| |
| |
Investment Banking & Brokerage–1.09% | | | | | |
Charles Schwab Corp. (The) | | | 1,350 | | | | 107,554 | |
|
| |
Goldman Sachs Group, Inc. (The) | | | 274 | | | | 94,396 | |
|
| |
| | | | | | | | |
| | | Shares | | | Value | |
|
| |
Investment Banking & Brokerage–(continued) | | | | | |
Morgan Stanley | | | 1,052 | | | $ | 86,443 | |
|
| |
| | | | | | | 288,393 | |
|
| |
| | |
IT Consulting & Other Services–1.08% | | | | | | | | |
Accenture PLC, Class A | | | 508 | | | | 144,221 | |
|
| |
Cognizant Technology Solutions Corp., Class A | | | 378 | | | | 23,531 | |
|
| |
EPAM Systems, Inc.(b) | | | 45 | | | | 15,750 | |
|
| |
International Business Machines Corp. | | | 735 | | | | 101,643 | |
|
| |
| | | | | | | 285,145 | |
|
| |
| | |
Life & Health Insurance–0.47% | | | | | | | | |
Aflac, Inc. | | | 456 | | | | 29,690 | |
|
| |
MetLife, Inc. | | | 634 | | | | 46,415 | |
|
| |
Principal Financial Group, Inc. | | | 197 | | | | 17,362 | |
|
| |
Prudential Financial, Inc. | | | 296 | | | | 31,136 | |
|
| |
| | | | | | | 124,603 | |
|
| |
| | |
Life Sciences Tools & Services–1.66% | | | | | | | | |
Agilent Technologies, Inc. | | | 236 | | | | 32,651 | |
|
| |
Danaher Corp. | | | 533 | | | | 134,140 | |
|
| |
Illumina, Inc.(b) | | | 124 | | | | 28,374 | |
|
| |
IQVIA Holdings, Inc.(b) | | | 150 | | | | 31,450 | |
|
| |
Mettler-Toledo International, Inc.(b) | | | 18 | | | | 22,769 | |
|
| |
Thermo Fisher Scientific, Inc. | | | 316 | | | | 162,414 | |
|
| |
Waters Corp.(b) | | | 48 | | | | 14,360 | |
|
| |
West Pharmaceutical Services, Inc. | | | 60 | | | | 13,806 | |
|
| |
| | | | | | | 439,964 | |
|
| |
| | |
Managed Health Care–2.38% | | | | | | | | |
Centene Corp.(b) | | | 462 | | | | 39,330 | |
|
| |
Elevance Health, Inc. | | | 199 | | | | 108,807 | |
|
| |
Humana, Inc. | | | 104 | | | | 58,040 | |
|
| |
UnitedHealth Group, Inc. | | | 763 | | | | 423,580 | |
|
| |
| | | | | | | 629,757 | |
|
| |
| | |
Metal & Glass Containers–0.05% | | | | | | | | |
Ball Corp. | | | 252 | | | | 12,446 | |
|
| |
| | |
Movies & Entertainment–1.14% | | | | | | | | |
Liberty Media Corp.-Liberty Formula One, Class C(b) | | | 351 | | | | 20,263 | |
|
| |
Netflix, Inc.(b) | | | 351 | | | | 102,450 | |
|
| |
Walt Disney Co. (The)(b) | | | 1,458 | | | | 155,335 | |
|
| |
Warner Bros Discovery, Inc.(b) | | | 1,888 | | | | 24,544 | |
|
| |
| | | | | | | 302,592 | |
|
| |
| | |
Multi-line Insurance–0.20% | | | | | | | | |
American International Group, Inc. | | | 586 | | | | 33,402 | |
|
| |
Hartford Financial Services Group, Inc. (The) | | | 257 | | | | 18,609 | |
|
| |
| | | | | | | 52,011 | |
|
| |
| | |
Multi-Sector Holdings–1.62% | | | | | | | | |
Berkshire Hathaway, Inc., Class B(b) | | | 1,452 | | | | 428,471 | |
|
| |
| | |
Multi-Utilities–0.79% | | | | | | | | |
Ameren Corp. | | | 207 | | | | 16,875 | |
|
| |
CMS Energy Corp. | | | 238 | | | | 13,578 | |
|
| |
Consolidated Edison, Inc. | | | 289 | | | | 25,420 | |
|
| |
Dominion Energy, Inc. | | | 697 | | | | 48,769 | |
|
| |
DTE Energy Co. | | | 158 | | | | 17,713 | |
|
| |
Public Service Enterprise Group, Inc. | | | 408 | | | | 22,876 | |
|
| |
Sempra Energy | | | 257 | | | | 38,792 | |
|
| |
See accompanying Notes to Financial Statements which are an integral part of the financial statements.
| | |
| 11 | | Invesco U.S. Managed Volatility Fund |
| | | | | | | | |
| | | Shares | | | Value | |
|
| |
Multi-Utilities–(continued) | | | | | | | | |
WEC Energy Group, Inc. | | | 260 | | | $ | 23,746 | |
|
| |
| | | | | | | 207,769 | |
|
| |
| | |
Office REITs–0.11% | | | | | | | | |
Alexandria Real Estate Equities, Inc. | | | 130 | | | | 18,889 | |
|
| |
Boston Properties, Inc. | | | 127 | | | | 9,233 | |
|
| |
| | | | | | | 28,122 | |
|
| |
| | |
Oil & Gas Equipment & Services–0.42% | | | | | | | | |
Baker Hughes Co., Class A | | | 854 | | | | 23,622 | |
|
| |
Halliburton Co. | | | 734 | | | | 26,732 | |
|
| |
Schlumberger Ltd. | | | 1,158 | | | | 60,251 | |
|
| |
| | | | | | | 110,605 | |
|
| |
| |
Oil & Gas Exploration & Production–1.35% | | | | | |
ConocoPhillips | | | 1,023 | | | | 128,990 | |
|
| |
Coterra Energy, Inc. | | | 624 | | | | 19,425 | |
|
| |
Devon Energy Corp. | | | 530 | | | | 40,995 | |
|
| |
Diamondback Energy, Inc. | | | 136 | | | | 21,367 | |
|
| |
EOG Resources, Inc. | | | 477 | | | | 65,120 | |
|
| |
Hess Corp. | | | 227 | | | | 32,025 | |
|
| |
Pioneer Natural Resources Co. | | | 187 | | | | 47,949 | |
|
| |
| | | | | | | 355,871 | |
|
| |
| | |
Oil & Gas Refining & Marketing–0.46% | | | | | | | | |
Marathon Petroleum Corp. | | | 374 | | | | 42,494 | |
|
| |
Phillips 66 | | | 391 | | | | 40,777 | |
|
| |
Valero Energy Corp. | | | 310 | | | | 38,921 | |
|
| |
| | | | | | | 122,192 | |
|
| |
| |
Oil & Gas Storage & Transportation–0.44% | | | | | |
Cheniere Energy, Inc. | | | 197 | | | | 34,753 | |
|
| |
Kinder Morgan, Inc. | | | 1,590 | | | | 28,811 | |
|
| |
ONEOK, Inc. | | | 362 | | | | 21,474 | |
|
| |
Williams Cos., Inc. (The) | | | 988 | | | | 32,337 | |
|
| |
| | | | | | | 117,375 | |
|
| |
| |
Other Diversified Financial Services–0.07% | | | | | |
Apollo Global Management, Inc. | | | 342 | | | | 18,933 | |
|
| |
| | |
Packaged Foods & Meats–1.07% | | | | | | | | |
Campbell Soup Co. | | | 164 | | | | 8,677 | |
|
| |
Conagra Brands, Inc. | | | 397 | | | | 14,570 | |
|
| |
General Mills, Inc. | | | 481 | | | | 39,240 | |
|
| |
Hershey Co. (The) | | | 122 | | | | 29,130 | |
|
| |
Hormel Foods Corp. | | | 449 | | | | 20,856 | |
|
| |
JM Smucker Co. (The) | | | 84 | | | | 12,655 | |
|
| |
Kellogg Co. | | | 283 | | | | 21,740 | |
|
| |
Kraft Heinz Co. (The) | | | 913 | | | | 35,123 | |
|
| |
McCormick & Co., Inc. | | | 206 | | | | 16,200 | |
|
| |
Mondelez International, Inc., Class A | | | 1,108 | | | | 68,120 | |
|
| |
Tyson Foods, Inc., Class A | | | 234 | | | | 15,994 | |
|
| |
| | | | | | | 282,305 | |
|
| |
| | |
Paper Packaging–0.09% | | | | | | | | |
Amcor PLC | | | 1,206 | | | | 13,966 | |
|
| |
International Paper Co. | | | 284 | | | | 9,545 | |
|
| |
| | | | | | | 23,511 | |
|
| |
| | |
Personal Products–0.14% | | | | | | | | |
Estee Lauder Cos., Inc. (The), Class A | | | 184 | | | | 36,890 | |
|
| |
| | | | | | | | |
| | | Shares | | | Value | |
|
| |
Pharmaceuticals–4.86% | | | | | | | | |
Bristol-Myers Squibb Co. | | | 1,772 | | | $ | 137,277 | |
|
| |
Eli Lilly and Co. | | | 747 | | | | 270,481 | |
|
| |
Johnson & Johnson | | | 2,176 | | | | 378,559 | |
|
| |
Merck & Co., Inc. | | | 2,086 | | | | 211,103 | |
|
| |
Pfizer, Inc. | | | 4,638 | | | | 215,899 | |
|
| |
Royalty Pharma PLC, Class A | | | 338 | | | | 14,304 | |
|
| |
Zoetis, Inc. | | | 377 | | | | 56,844 | |
|
| |
| | | | | | | 1,284,467 | |
|
| |
| | |
Property & Casualty Insurance–0.78% | | | | | | | | |
Allstate Corp. (The) | | | 212 | | | | 26,765 | |
|
| |
Chubb Ltd. | | | 332 | | | | 71,344 | |
|
| |
Markel Corp.(b) | | | 11 | | | | 13,267 | |
|
| |
Progressive Corp. (The) | | | 475 | | | | 60,990 | |
|
| |
Travelers Cos., Inc. (The) | | | 190 | | | | 35,047 | |
|
| |
| | | | | | | 207,413 | |
|
| |
| | |
Railroads–0.72% | | | | | | | | |
CSX Corp. | | | 1,700 | | | | 49,402 | |
|
| |
Norfolk Southern Corp. | | | 187 | | | | 42,649 | |
|
| |
Union Pacific Corp. | | | 500 | | | | 98,570 | |
|
| |
| | | | | | | 190,621 | |
|
| |
| | |
Real Estate Services–0.07% | | | | | | | | |
CBRE Group, Inc., Class A(b) | | | 252 | | | | 17,877 | |
|
| |
| | |
Regional Banks–0.76% | | | | | | | | |
Fifth Third Bancorp | | | 548 | | | | 19,558 | |
|
| |
First Republic Bank | | | 144 | | | | 17,294 | |
|
| |
KeyCorp | | | 748 | | | | 13,367 | |
|
| |
M&T Bank Corp. | | | 139 | | | | 23,404 | |
|
| |
PNC Financial Services Group, Inc. (The) | | | 327 | | | | 52,918 | |
|
| |
Regions Financial Corp. | | | 754 | | | | 16,550 | |
|
| |
SVB Financial Group(b) | | | 46 | | | | 10,624 | |
|
| |
Truist Financial Corp. | | | 1,063 | | | | 47,612 | |
|
| |
| | | | | | | 201,327 | |
|
| |
| | |
Research & Consulting Services–0.25% | | | | | | | | |
CoStar Group, Inc.(b) | | | 313 | | | | 25,891 | |
|
| |
Equifax, Inc. | | | 98 | | | | 16,615 | |
|
| |
Verisk Analytics, Inc. | | | 123 | | | | 22,488 | |
|
| |
| | | | | | | 64,994 | |
|
| |
| | |
Residential REITs–0.19% | | | | | | | | |
AvalonBay Communities, Inc. | | | 114 | | | | 19,964 | |
|
| |
Equity Residential | | | 300 | | | | 18,906 | |
|
| |
Essex Property Trust, Inc. | | | 52 | | | | 11,556 | |
|
| |
| | | | | | | 50,426 | |
|
| |
| | |
Restaurants–1.13% | | | | | | | | |
Chipotle Mexican Grill, Inc.(b) | | | 22 | | | | 32,963 | |
|
| |
McDonald’s Corp. | | | 597 | | | | 162,778 | |
|
| |
Starbucks Corp. | | | 892 | | | | 77,238 | |
|
| |
Yum! Brands, Inc. | | | 230 | | | | 27,198 | |
|
| |
| | | | | | | 300,177 | |
|
| |
| | |
Retail REITs–0.23% | | | | | | | | |
Realty Income Corp. | | | 520 | | | | 32,380 | |
|
| |
Simon Property Group, Inc. | | | 262 | | | | 28,553 | |
|
| |
| | | | | | | 60,933 | |
|
| |
See accompanying Notes to Financial Statements which are an integral part of the financial statements.
| | |
| 12 | | Invesco U.S. Managed Volatility Fund |
| | | | | | | | |
| | | Shares | | | Value | |
|
| |
Semiconductor Equipment–0.63% | | | | | | | | |
Applied Materials, Inc. | | | 669 | | | $ | 59,066 | |
|
| |
Enphase Energy, Inc.(b) | | | 103 | | | | 31,621 | |
|
| |
KLA Corp. | | | 107 | | | | 33,860 | |
|
| |
Lam Research Corp. | | | 104 | | | | 42,097 | |
|
| |
| | | | | | | 166,644 | |
|
| |
| | |
Semiconductors–3.80% | | | | | | | | |
Advanced Micro Devices, Inc.(b) | | | 1,254 | | | | 75,315 | |
|
| |
Analog Devices, Inc. | | | 412 | | | | 58,759 | |
|
| |
Broadcom, Inc. | | | 313 | | | | 147,148 | |
|
| |
GLOBALFOUNDRIES, Inc.(b) | | | 420 | | | | 23,814 | |
|
| |
Intel Corp. | | | 3,282 | | | | 93,307 | |
|
| |
Marvell Technology, Inc. | | | 675 | | | | 26,784 | |
|
| |
Microchip Technology, Inc. | | | 430 | | | | 26,548 | |
|
| |
Micron Technology, Inc. | | | 856 | | | | 46,310 | |
|
| |
NVIDIA Corp. | | | 1,865 | | | | 251,719 | |
|
| |
ON Semiconductor Corp.(b) | | | 348 | | | | 21,378 | |
|
| |
QUALCOMM, Inc. | | | 894 | | | | 105,188 | |
|
| |
Skyworks Solutions, Inc. | | | 128 | | | | 11,009 | |
|
| |
Texas Instruments, Inc. | | | 728 | | | | 116,939 | |
|
| |
| | | | | | | 1,004,218 | |
|
| |
| | |
Soft Drinks–1.77% | | | | | | | | |
Coca-Cola Co. (The) | | | 3,501 | | | | 209,535 | |
|
| |
Keurig Dr Pepper, Inc. | | | 693 | | | | 26,916 | |
|
| |
Monster Beverage Corp.(b) | | | 296 | | | | 27,741 | |
|
| |
PepsiCo, Inc. | | | 1,121 | | | | 203,551 | |
|
| |
| | | | | | | 467,743 | |
|
| |
| | |
Specialized REITs–1.19% | | | | | | | | |
American Tower Corp. | | | 378 | | | | 78,318 | |
|
| |
Crown Castle, Inc. | | | 351 | | | | 46,774 | |
|
| |
Digital Realty Trust, Inc. | | | 235 | | | | 23,559 | |
|
| |
Equinix, Inc. | | | 66 | | | | 37,385 | |
|
| |
Extra Space Storage, Inc. | | | 105 | | | | 18,631 | |
|
| |
Public Storage | | | 143 | | | | 44,294 | |
|
| |
SBA Communications Corp., Class A | | | 87 | | | | 23,481 | |
|
| |
VICI Properties, Inc. | | | 778 | | | | 24,912 | |
|
| |
Weyerhaeuser Co. | | | 597 | | | | 18,465 | |
|
| |
| | | | | | | 315,819 | |
|
| |
| | |
Specialty Chemicals–0.67% | | | | | | | | |
Albemarle Corp. | | | 93 | | | | 26,028 | |
|
| |
Celanese Corp. | | | 88 | | | | 8,459 | |
|
| |
DuPont de Nemours, Inc. | | | 395 | | | | 22,594 | |
|
| |
Ecolab, Inc. | | | 196 | | | | 30,786 | |
|
| |
International Flavors & Fragrances, Inc. | | | 205 | | | | 20,010 | |
|
| |
PPG Industries, Inc. | | | 190 | | | | 21,694 | |
|
| |
Sherwin-Williams Co. (The) | | | 207 | | | | 46,581 | |
|
| |
| | | | | | | 176,152 | |
|
| |
| | |
Specialty Stores–0.06% | | | | | | | | |
Ulta Beauty, Inc.(b) | | | 41 | | | | 17,194 | |
|
| |
| | |
Steel–0.10% | | | | | | | | |
Nucor Corp. | | | 204 | | | | 26,802 | |
|
| |
| | |
Systems Software–6.29% | | | | | | | | |
Crowdstrike Holdings, Inc., Class A(b) | | | 164 | | | | 26,437 | |
|
| |
Fortinet, Inc.(b) | | | 529 | | | | 30,238 | |
|
| |
Microsoft Corp. | | | 5,904 | | | | 1,370,496 | |
|
| |
| | | | | | | | |
| | | Shares | | | Value | |
|
| |
Systems Software–(continued) | | | | | | | | |
NortonLifeLock, Inc. | | | 516 | | | $ | 11,625 | |
|
| |
Oracle Corp. | | | 1,221 | | | | 95,323 | |
|
| |
Palo Alto Networks, Inc.(b) | | | 240 | | | | 41,182 | |
|
| |
ServiceNow, Inc.(b) | | | 161 | | | | 67,739 | |
|
| |
VMware, Inc., Class A | | | 181 | | | | 20,368 | |
|
| |
| | | | | | | 1,663,408 | |
|
| |
| | |
Technology Distributors–0.07% | | | | | | | | |
CDW Corp. | | | 112 | | | | 19,355 | |
|
| |
|
Technology Hardware, Storage & Peripherals–7.69% | |
Apple, Inc. | | | 12,838 | | | | 1,968,580 | |
|
| |
Hewlett Packard Enterprise Co. | | | 1,050 | | | | 14,984 | |
|
| |
HP, Inc. | | | 808 | | | | 22,317 | |
|
| |
NetApp, Inc. | | | 175 | | | | 12,122 | |
|
| |
Seagate Technology Holdings PLC | | | 165 | | | | 8,194 | |
|
| |
Western Digital Corp.(b) | | | 247 | | | | 8,489 | |
|
| |
| | | | | | | 2,034,686 | |
|
| |
| | |
Tobacco–0.69% | | | | | | | | |
Altria Group, Inc. | | | 1,462 | | | | 67,647 | |
|
| |
Philip Morris International, Inc. | | | 1,258 | | | | 115,547 | |
|
| |
| | | | | | | 183,194 | |
|
| |
|
Trading Companies & Distributors–0.17% | |
Fastenal Co. | | | 466 | | | | 22,522 | |
|
| |
W.W. Grainger, Inc. | | | 37 | | | | 21,621 | |
|
| |
| | | | | | | 44,143 | |
|
| |
| | |
Trucking–0.23% | | | | | | | | |
Old Dominion Freight Line, Inc. | | | 77 | | | | 21,144 | |
|
| |
Uber Technologies, Inc.(b) | | | 1,483 | | | | 39,403 | |
|
| |
| | | | | | | 60,547 | |
|
| |
| | |
Water Utilities–0.08% | | | | | | | | |
American Water Works Co., Inc. | | | 148 | | | | 21,510 | |
|
| |
| |
Wireless Telecommunication Services–0.26% | | | | | |
T-Mobile US, Inc.(b) | | | 450 | | | | 68,202 | |
|
| |
Total Common Stocks & Other Equity Interests
(Cost $20,563,729) | | | | 25,917,131 | |
|
| |
| | |
Money Market Funds–0.00% | | | | | | | | |
Invesco Government & Agency Portfolio, Institutional Class, 3.07%(d)(e) | | | 2 | | | | 2 | |
|
| |
Invesco Treasury Portfolio, Institutional Class, 3.08%(d)(e) | | | 2 | | | | 2 | |
|
| |
Total Money Market Funds (Cost $4) | | | | 4 | |
|
| |
TOTAL INVESTMENTS IN SECURITIES (excluding investments purchased with cash collateral from securities on loan)-97.99%
(Cost $20,563,733) | | | | 25,917,135 | |
|
| |
|
Investments Purchased with Cash Collateral from Securities on Loan | |
Money Market Funds–0.15% | |
Invesco Private Government Fund,
3.18%(d)(e)(f) | | | 11,397 | | | | 11,397 | |
|
| |
See accompanying Notes to Financial Statements which are an integral part of the financial statements.
| | |
| 13 | | Invesco U.S. Managed Volatility Fund |
| | | | | | | | |
| | | Shares | | | Value | |
|
| |
Money Market Funds–(continued) | |
Invesco Private Prime Fund, 3.28%(d)(e)(f) | | | 29,292 | | | $ | 29,292 | |
|
| |
Total Investments Purchased with Cash Collateral from Securities on Loan
(Cost $40,689) | | | | 40,689 | |
|
| |
TOTAL INVESTMENTS IN SECURITIES–98.14%
(Cost $20,604,422) | | | | 25,957,824 | |
|
| |
OTHER ASSETS LESS LIABILITIES–1.86% | | | | 491,651 | |
|
| |
NET ASSETS–100.00% | | | | | | $ | 26,449,475 | |
|
| |
Investment Abbreviations:
ADR - American Depositary Receipt
REIT - Real Estate Investment Trust
Notes to Schedule of Investments:
| (a) | Industry and/or sector classifications used in this report are generally according to the Global Industry Classification Standard, which was developed by and is the exclusive property and a service mark of MSCI Inc. and Standard & Poor’s. |
| (b) | Non-income producing security. |
| (c) | All or a portion of this security was out on loan at October 31, 2022. |
| (d) | Affiliated issuer. The issuer and/or the Fund is a wholly-owned subsidiary of Invesco Ltd., or is affiliated by having an investment adviser that is under common control of Invesco Ltd. The table below shows the Fund’s transactions in, and earnings from, its investments in affiliates for the fiscal year ended October 31, 2022. |
| | | | | | | | | | | | | | | | | | | | | | | | | | | | | | | | | | | | | | | | | | | | | | | | | | | | | | | | | | | | | | | | | | | | |
| | | Value
October 31, 2021 | | | Purchases at Cost | | | Proceeds from Sales | | | Change in Unrealized Appreciation (Depreciation) | | | Realized Gain (Loss) | | | Value October 31, 2022 | | | Dividend Income | |
| Investments in Affiliated Money Market Funds: | | | | | | | | | | | | | | | | | | | | | | | | | | | | | | | | | | | | | | | | | | | | | | | | | | | | | | | | | | | | | | | | | | | | |
Invesco Government & Agency Portfolio, Institutional Class | | | | | | $ | 32,778 | | | | | | | $ | 3,872,017 | | | $ | (3,904,793 | ) | | | | | | $ | - | | | | | | | | | | | $ | - | | | | | | | | | | | $ | 2 | | | | | | | | | | | $ | 348 | | | | | |
Invesco Liquid Assets Portfolio, Institutional Class | | | | | | | 33,013 | | | | | | | | 2,765,727 | | | | (2,798,743 | ) | | | | | | | (2 | ) | | | | | | | | | | | 5 | | | | | | | | | | | | - | | | | | | | | | | | | 316 | | | | | |
Invesco Treasury Portfolio, Institutional Class | | | | | | | 37,461 | | | | | | | | 4,425,162 | | | | (4,462,621 | ) | | | | | | | - | | | | | | | | | | | | - | | | | | | | | | | | | 2 | | | | | | | | | | | | 472 | | | | | |
| Investments Purchased with Cash Collateral from Securities on Loan: | | | | | | | | | | | | | | | | | | | | | | | | | | | | | | | | | | | | | | | | | | | | | | | | | | | | | | | | | | | | | | | | | | | | |
Invesco Private Government Fund | | | | | | | - | | | | | | | | 558,957 | | | | (547,560 | ) | | | | | | | - | | | | | | | | | | | | - | | | | | | | | | | | | 11,397 | | | | | | | | | | | | 467* | | | | | |
Invesco Private Prime Fund | | | | | | | - | | | | | | | | 1,187,287 | | | | (1,157,985 | ) | | | | | | | - | | | | | | | | | | | | (10) | | | | | | | | | | | | 29,292 | | | | | | | | | | | | 1,297* | | | | | |
Total | | | | | | $ | 103,252 | | | | | | | $ | 12,809,150 | | | $ | (12,871,702 | ) | | | | | | $ | (2 | ) | | | | | | | | | | $ | (5) | | | | | | | | | | | $ | 40,693 | | | | | | | | | | | $ | 2,900 | | | | | |
| | * | Represents the income earned on the investment of cash collateral, which is included in securities lending income on the Statement of Operations. Does not include rebates and fees paid to lending agent or premiums received from borrowers, if any. |
| (e) | The rate shown is the 7-day SEC standardized yield as of October 31, 2022. |
| (f) | The security has been segregated to satisfy the commitment to return the cash collateral received in securities lending transactions upon the borrower’s return of the securities loaned. See Note 1H. |
Open Futures Contracts(a)
| | | | | | | | | | | | | | | | | | | | |
|
| |
| Short Futures Contracts | | Number of
Contracts | | | Expiration
Month | | | Notional
Value | | | Value | | | Unrealized
Appreciation
(Depreciation) | |
|
| |
Equity Risk | | | | | | | | | | | | | | | | | | | | |
|
| |
E-Mini S&P 500 Index | | | 51 | | | | December-2022 | | | $ | (9,901,650 | ) | | $ | (373,254 | ) | | | $(373,254) | |
|
| |
| (a) | Futures contracts collateralized by $638,000 cash held with Goldman Sachs International, the futures commission merchant. |
See accompanying Notes to Financial Statements which are an integral part of the financial statements.
| | |
| 14 | | Invesco U.S. Managed Volatility Fund |
Statement of Assets and Liabilities
October 31, 2022
| | | | |
Assets: | | | | |
| |
Investments in unaffiliated securities, at value
(Cost $20,563,729)* | | $ | 25,917,131 | |
|
| |
Investments in affiliated money market funds, at value (Cost $40,693) | | | 40,693 | |
|
| |
Other investments: | | | | |
Variation margin receivable – futures contracts | | | 62,482 | |
|
| |
Deposits with brokers: | | | | |
Cash collateral – exchange-traded futures contracts | | | 638,000 | |
|
| |
Receivable for: | | | | |
Investments sold | | | 81,309 | |
|
| |
Dividends | | | 19,595 | |
|
| |
Investment for trustee deferred compensation and retirement plans | | | 14,960 | |
|
| |
Other assets | | | 6,265 | |
|
| |
Total assets | | | 26,780,435 | |
|
| |
| |
Liabilities: | | | | |
| |
Payable for: | | | | |
Fund shares reacquired | | | 162,848 | |
|
| |
Amount due custodian | | | 62,606 | |
|
| |
Collateral upon return of securities loaned | | | 40,689 | |
|
| |
Accrued fees to affiliates | | | 1,401 | |
|
| |
Accrued trustees’ and officers’ fees and benefits | | | 808 | |
|
| |
Accrued other operating expenses | | | 47,648 | |
|
| |
Trustee deferred compensation and retirement plans | | | 14,960 | |
|
| |
Total liabilities | | | 330,960 | |
|
| |
Net assets applicable to shares outstanding | | $ | 26,449,475 | |
|
| |
| | | | |
Net assets consist of: | | | | |
Shares of beneficial interest | | $ | 23,912,042 | |
|
| |
Distributable earnings | | | 2,537,433 | |
|
| |
| | $ | 26,449,475 | |
|
| |
| |
Net Assets: | | | | |
Class R6 | | $ | 26,449,475 | |
|
| |
|
Shares outstanding, no par value, with an unlimited number of shares authorized: | |
Class R6 | | | 2,112,828 | |
|
| |
Class R6: | | | | |
Net asset value and offering price per share | | $ | 12.52 | |
|
| |
| * | At October 31, 2022, securities with an aggregate value of $39,196 were on loan to brokers. |
See accompanying Notes to Financial Statements which are an integral part of the financial statements.
| | |
| 15 | | Invesco U.S. Managed Volatility Fund |
Statement of Operations
For the year ended October 31, 2022
| | | | |
Investment income: | | | | |
| |
Interest | | $ | 2,763 | |
|
| |
Dividends (net of foreign withholding taxes of $124) | | | 385,767 | |
|
| |
Dividends from affiliated money market funds (includes net securities lending income of $474) | | | 1,610 | |
|
| |
Total investment income | | | 390,140 | |
|
| |
| |
Expenses: | | | | |
| |
Advisory fees | | | 26,031 | |
|
| |
Administrative services fees | | | 3,677 | |
|
| |
Custodian fees | | | 31,004 | |
|
| |
Transfer agent fees | | | 8,435 | |
|
| |
Trustees’ and officers’ fees and benefits | | | 19,184 | |
|
| |
Registration and filing fees | | | 20,819 | |
|
| |
Professional services fees | | | 44,923 | |
|
| |
Other | | | (2,437 | ) |
|
| |
Total expenses | | | 151,636 | |
|
| |
Less: Fees waived and/or expenses reimbursed | | | (112,699 | ) |
|
| |
Net expenses | | | 38,937 | |
|
| |
Net investment income | | | 351,203 | |
|
| |
| |
Realized and unrealized gain (loss) from: | | | | |
| |
Net realized gain (loss) from: | | | | |
Unaffiliated investment securities | | | (563,005 | ) |
|
| |
Affiliated investment securities | | | (5 | ) |
|
| |
Futures contracts | | | 1,155,983 | |
|
| |
Option contracts written | | | 80,839 | |
|
| |
| | | 673,812 | |
|
| |
Change in net unrealized appreciation (depreciation) of: | | | | |
Unaffiliated investment securities | | | (4,281,767 | ) |
|
| |
Affiliated investment securities | | | (2 | ) |
|
| |
Futures contracts | | | (373,254 | ) |
|
| |
| | | (4,655,023 | ) |
|
| |
Net realized and unrealized gain (loss) | | | (3,981,211 | ) |
|
| |
Net increase (decrease) in net assets resulting from operations | | $ | (3,630,008 | ) |
|
| |
See accompanying Notes to Financial Statements which are an integral part of the financial statements.
| | |
| 16 | | Invesco U.S. Managed Volatility Fund |
Statement of Changes in Net Assets
For the years ended October 31, 2022 and 2021
| | | | | | | | |
| | | 2022 | | | 2021 | |
|
| |
Operations: | | | | | | | | |
| | |
Net investment income | | $ | 351,203 | | | $ | 292,297 | |
|
| |
| | |
Net realized gain (loss) | | | 673,812 | | | | (951,906 | ) |
|
| |
| | |
Change in net unrealized appreciation (depreciation) | | | (4,655,023 | ) | | | 7,203,216 | |
|
| |
Net increase (decrease) in net assets resulting from operations | | | (3,630,008 | ) | | | 6,543,607 | |
|
| |
| | |
Distributions to shareholders from distributable earnings: | | | | | | | | |
| | |
Class R6 | | | (350,184 | ) | | | (1,821,222 | ) |
|
| |
Share transactions–net: | | | | | | | | |
| | |
Class R6 | | | 1,876,539 | | | | 10,166,162 | |
|
| |
Net increase (decrease) in net assets | | | (2,103,653 | ) | | | 14,888,547 | |
|
| |
| | |
Net assets: | | | | | | | | |
| | |
Beginning of year | | | 28,553,128 | | | | 13,664,581 | |
|
| |
| | |
End of year | | $ | 26,449,475 | | | $ | 28,553,128 | |
|
| |
See accompanying Notes to Financial Statements which are an integral part of the financial statements.
| | |
| 17 | | Invesco U.S. Managed Volatility Fund |
Financial Highlights
The following schedule presents financial highlights for a share of the Fund outstanding throughout the periods indicated.
| | | | | | | | | | | | | | | | | | | | | | | | | | | | | | | | | | | | | | | | | | | | | | | | | | | | | | | | |
| | | Net asset value, beginning of period | | Net investment income(a) | | Net gains (losses) on securities (both realized and unrealized) | | Total from investment operations | | Dividends from net investment income | | Distributions from net realized gains | | Total distributions | | Net asset value, end of period | | Total return (b) | | Net assets, end of period (000’s omitted) | | Ratio of expenses to average net assets with fee waivers and/or expenses absorbed | | Ratio of expenses to average net assets without fee waivers and/or expenses absorbed | | Ratio of net investment income to average net assets | | Portfolio turnover (c) |
Class R6 | | | | | | | | | | | | | | | | | | | | | | | | | | | | | | | | | | | | | | | | | | | | | | | | | | | | | | | | |
Year ended 10/31/22 | | | $14.63 | | | | $0.18 | | | | $(2.09 | ) | | | $(1.91 | ) | | | $(0.18 | ) | | | $(0.02 | ) | | | $(0.20 | ) | | | $12.52 | | | | (13.25 | )% | | | $26,449 | | | | 0.15 | % | | | 0.58 | % | | | 1.35 | % | | | 35 | % |
Year ended 10/31/21 | | | 12.27 | | | | 0.16 | | | | 3.72 | | | | 3.88 | | | | (0.16 | ) | | | (1.36 | ) | | | (1.52 | ) | | | 14.63 | | | | 34.64 | | | | 28,553 | | | | 0.15 | | | | 0.59 | | | | 1.22 | | | | 33 | |
Year ended 10/31/20 | | | 10.90 | | | | 0.19 | | | | 1.50 | | | | 1.69 | | | | (0.17 | ) | | | (0.15 | ) | | | (0.32 | ) | | | 12.27 | | | | 15.78 | | | | 13,665 | | | | 0.15 | | | | 1.12 | | | | 1.63 | | | | 23 | |
Year ended 10/31/19 | | | 10.14 | | | | 0.19 | | | | 0.81 | | | | 1.00 | | | | (0.19 | ) | | | (0.05 | ) | | | (0.24 | ) | | | 10.90 | | | | 10.13 | | | | 8,203 | | | | 0.15 | | | | 2.10 | | | | 1.89 | | | | 7 | |
Period ended 10/31/18(d) | | | 10.00 | | | | 0.16 | | | | (0.02 | ) | | | 0.14 | | | | – | | | | – | | | | – | | | | 10.14 | | | | 1.40 | | | | 5,910 | | | | 0.15 | (e) | | | 3.40 | (e) | | | 1.74 | (e) | | | 9 | |
| (a) | Calculated using average shares outstanding. |
| (b) | Includes adjustments in accordance with accounting principles generally accepted in the United States of America and as such, the net asset value for financial reporting purposes and the returns based upon those net asset values may differ from the net asset value and returns for shareholder transactions. Not annualized for periods less than one year, if applicable. |
| (c) | Portfolio turnover is not annualized for periods less than one year, if applicable. |
| (d) | Commencement date of December 18, 2017. |
See accompanying Notes to Financial Statements which are an integral part of the financial statements.
| | |
| 18 | | Invesco U.S. Managed Volatility Fund |
Notes to Financial Statements
October 31, 2022
NOTE 1–Significant Accounting Policies
Invesco U.S. Managed Volatility Fund (the “Fund”) is a series portfolio of AIM Investment Funds (Invesco Investment Funds) (the “Trust”). The Trust is organized as a Delaware statutory trust and is registered under the Investment Company Act of 1940, as amended (the “1940 Act”), as an open-end series management investment company authorized to issue an unlimited number of shares of beneficial interest. Information presented in these financial statements pertains only to the Fund. Matters affecting the Fund or each class will be voted on exclusively by the shareholders of the Fund or each class.
The Fund’s investment objective is to seek to provide capital appreciation while managing portfolio volatility.
The Fund currently consists of one class of shares, Class R6. Class R6 shares are sold at net asset value.
The Fund is an investment company and accordingly follows the investment company accounting and reporting guidance in accordance with Financial Accounting Standards Board Accounting Standards Codification Topic 946, Financial Services – Investment Companies.
The following is a summary of the significant accounting policies followed by the Fund in the preparation of its financial statements.
| A. | Security Valuations – Securities, including restricted securities, are valued according to the following policy. |
A security listed or traded on an exchange is generally valued at its trade price or official closing price that day as of the close of the exchange where the security is principally traded, or lacking any trades or official closing price on a particular day, the security may be valued at the closing bid price on that day. Securities traded in the over-the-counter market are valued based on prices furnished by independent pricing services or market makers. When such securities are valued using prices provided by an independent pricing service they may be considered fair valued. Futures contracts are valued at the daily settlement price set by an exchange on which they are principally traded. U.S. exchange-traded options are valued at the mean between the last bid and asked prices from the exchange on which they are principally traded. Non-U.S. exchange-traded options are valued at the final settlement price set by the exchange on which they trade. Options not listed on an exchange and swaps generally are valued using pricing provided from independent pricing services.
Securities of investment companies that are not exchange-traded (e.g., open-end mutual funds) are valued using such company’s end-of-business-day net asset value per share.
Deposits, other obligations of U.S. and non-U.S. banks and financial institutions are valued at their daily account value.
Fixed income securities (including convertible debt securities) generally are valued on the basis of prices provided by independent pricing services. Prices provided by the pricing service may be determined without exclusive reliance on quoted prices, and may reflect appropriate factors such as institution-size trading in similar groups of securities, developments related to specific securities, dividend rate (for unlisted equities), yield (for debt obligations), quality, type of issue, coupon rate (for debt obligations), maturity (for debt obligations), individual trading characteristics and other market data. Pricing services generally value debt obligations assuming orderly transactions of institutional round lot size, but a fund may hold or transact in the same securities in smaller, odd lot sizes. Odd lots often trade at lower prices than institutional round lots, and their value may be adjusted accordingly. Debt obligations are subject to interest rate and credit risks. In addition, all debt obligations involve some risk of default with respect to interest and/or principal payments.
Foreign securities’ (including foreign exchange contracts) prices are converted into U.S. dollar amounts using the applicable exchange rates as of the close of the New York Stock Exchange (“NYSE”). If market quotations are available and reliable for foreign exchange-traded equity securities, the securities will be valued at the market quotations. Invesco Advisers, Inc. (the “Adviser” or “Invesco”) may use various pricing services to obtain market quotations as well as fair value prices. Because trading hours for certain foreign securities end before the close of the NYSE, closing market quotations may become not representative of market value in the Adviser’s judgment (“unreliable”). If, between the time trading ends on a particular security and the close of the customary trading session on the NYSE, a significant event occurs that makes the closing price of the security unreliable, the Adviser may fair value the security. If the event is likely to have affected the closing price of the security, the security will be valued at fair value in good faith in accordance with Board- approved policies and related Adviser procedures (“Valuation Procedures”). Adjustments to closing prices to reflect fair value may also be based on a screening process of an independent pricing service to indicate the degree of certainty, based on historical data, that the closing price in the principal market where a foreign security trades is not the current value as of the close of the NYSE. Foreign securities’ prices meeting the degree of certainty that the price is not reflective of current value will be priced at the indication of fair value from the independent pricing service. Multiple factors may be considered by the independent pricing service in determining adjustments to reflect fair value and may include information relating to sector indices, American Depositary Receipts and domestic and foreign index futures. Foreign securities may have additional risks including exchange rate changes, potential for sharply devalued currencies and high inflation, political and economic upheaval, the relative lack of issuer information, relatively low market liquidity and the potential lack of strict financial and accounting controls and standards.
Unlisted securities will be valued using prices provided by independent pricing services or by another method that the Adviser, in its judgment, believes better reflects the security’s fair value in accordance with the Valuation Procedures.
Securities for which market prices are not provided by any of the above methods may be valued based upon quotes furnished by independent sources. The last bid price may be used to value equity securities. The mean between the last bid and asked prices may be used to value debt obligations, including corporate loans.
Securities for which market quotations are not readily available are fair valued by the Adviser in accordance with the Valuation Procedures. If a fair value price provided by a pricing service is unreliable, the Adviser will fair value the security using the Valuation Procedures. Issuer specific events, market trends, bid/asked quotes of brokers and information providers and other market data may be reviewed in the course of making a good faith determination of a security’s fair value.
The Fund may invest in securities that are subject to interest rate risk, meaning the risk that the prices will generally fall as interest rates rise and, conversely, the prices will generally rise as interest rates fall. Specific securities differ in their sensitivity to changes in interest rates depending on their individual characteristics. Changes in interest rates may result in increased market volatility, which may affect the value and/or liquidity of certain Fund investments.
Valuations change in response to many factors including the historical and prospective earnings of the issuer, the value of the issuer’s assets, general market conditions which are not specifically related to the particular issuer, such as real or perceived adverse economic conditions, changes in the general outlook for revenues or corporate earnings, changes in interest or currency rates, regional or global instability, natural or environmental disasters, widespread disease or other public health issues, war, acts of terrorism, significant governmental actions or adverse investor sentiment generally and market liquidity. Because of the inherent uncertainties of valuation, the values reflected in the financial statements may materially differ from the value received upon actual sale of those investments.
The price the Fund could receive upon the sale of any investment may differ from the Adviser’s valuation of the investment, particularly for securities that are valued using a fair valuation technique. When fair valuation techniques are applied, the Adviser uses available information, including both observable and unobservable inputs and assumptions, to determine a methodology that will result in a valuation that the Adviser believes approximates market value. Fund securities that are fair valued may be subject to greater fluctuation in their value from one day to the next than would be the case if market quotations were used. Because of the inherent uncertainties of valuation, and the degree of subjectivity in such decisions, the Fund could realize a greater or lesser than expected gain or loss upon the sale of the investment.
| B. | Securities Transactions and Investment Income – Securities transactions are accounted for on a trade date basis. Realized gains or losses on sales are computed on the basis of specific identification of the securities sold. Interest income (net of withholding tax, if any) is recorded on an accrual basis from |
| | |
| 19 | | Invesco U.S. Managed Volatility Fund |
| | settlement date and includes coupon interest and amortization of premium and accretion of discount on debt securities as applicable. Dividend income (net of withholding tax, if any) is recorded on the ex-dividend date. |
The Fund may periodically participate in litigation related to Fund investments. As such, the Fund may receive proceeds from litigation settlements.Any proceeds received are included in the Statement of Operations as realized gain (loss) for investments no longer held and as unrealized gain (loss) for investments still held.
Brokerage commissions and mark ups are considered transaction costs and are recorded as an increase to the cost basis of securities purchased and/or a reduction of proceeds on a sale of securities. Such transaction costs are included in the determination of net realized and unrealized gain (loss) from investment securities reported in the Statement of Operations and the Statement of Changes in Net Assets and the net realized and unrealized gains (losses) on securities per share in the Financial Highlights. Transaction costs are included in the calculation of the Fund’s net asset value and, accordingly, they reduce the Fund’s total returns. These transaction costs are not considered operating expenses and are not reflected in net investment income reported in the Statement of Operations and the Statement of Changes in Net Assets, or the net investment income per share and the ratios of expenses and net investment income reported in the Financial Highlights, nor are they limited by any expense limitation arrangements between the Fund and the investment adviser.
| C. | Country Determination – For the purposes of making investment selection decisions and presentation in the Schedule of Investments, the investment adviser may determine the country in which an issuer is located and/or credit risk exposure based on various factors. These factors include the laws of the country under which the issuer is organized, where the issuer maintains a principal office, the country in which the issuer derives 50% or more of its total revenues, the country that has the primary market for the issuer’s securities and its “country of risk” as determined by a third party service provider, as well as other criteria. Among the other criteria that may be evaluated for making this determination are the country in which the issuer maintains 50% or more of its assets, the type of security, financial guarantees and enhancements, the nature of the collateral and the sponsor organization. Country of issuer and/or credit risk exposure has been determined to be the United States of America, unless otherwise noted. |
| D. | Distributions – Distributions from net investment income and net realized capital gain, if any, are generally declared and paid annually and recorded on the ex-dividend date. The Fund may elect to treat a portion of the proceeds from redemptions as distributions for federal income tax purposes. |
| E. | Federal Income Taxes – The Fund intends to comply with the requirements of Subchapter M of the Internal Revenue Code of 1986, as amended (the “Internal Revenue Code”), necessary to qualify as a regulated investment company and to distribute substantially all of the Fund’s taxable earnings to shareholders. As such, the Fund will not be subject to federal income taxes on otherwise taxable income (including net realized capital gain) that is distributed to shareholders. Therefore, no provision for federal income taxes is recorded in the financial statements. |
The Fund recognizes the tax benefits of uncertain tax positions only when the position is more likely than not to be sustained. Management has analyzed the Fund’s uncertain tax positions and concluded that no liability for unrecognized tax benefits should be recorded related to uncertain tax positions. Management is not aware of any tax positions for which it is reasonably possible that the total amounts of unrecognized tax benefits will change materially in the next 12 months.
The Fund files tax returns in the U.S. Federal jurisdiction and certain other jurisdictions. Generally, the Fund is subject to examinations by such taxing authorities for up to three years after the filing of the return for the tax period.
| F. | Accounting Estimates – The preparation of financial statements in conformity with accounting principles generally accepted in the United States of America (“GAAP”) requires management to make estimates and assumptions that affect the reported amounts of assets and liabilities at the date of the financial statements and the reported amounts of revenues and expenses during the reporting period including estimates and assumptions related to taxation. Actual results could differ from those estimates by a significant amount. In addition, the Fund monitors for material events or transactions that may occur or become known after the period-end date and before the date the financial statements are released to print. |
| G. | Indemnifications – Under the Trust’s organizational documents, each Trustee, officer, employee or other agent of the Trust is indemnified against certain liabilities that may arise out of the performance of their duties to the Fund. Additionally, in the normal course of business, the Fund enters into contracts, including the Fund’s servicing agreements, that contain a variety of indemnification clauses. The Fund’s maximum exposure under these arrangements is unknown as this would involve future claims that may be made against the Fund that have not yet occurred. The risk of material loss as a result of such indemnification claims is considered remote. |
| H. | Securities Lending – The Fund may lend portfolio securities having a market value up to one-third of the Fund’s total assets. Such loans are secured by collateral equal to no less than the market value of the loaned securities determined daily by the securities lending provider. Such collateral will be cash or debt securities issued or guaranteed by the U.S. Government or any of its sponsored agencies. Cash collateral received in connection with these loans is invested in short-term money market instruments or affiliated, unregistered investment companies that comply with Rule 2a-7 under the 1940 Act and money market funds (collectively, “affiliated money market funds”) and is shown as such on the Schedule of Investments. The Fund bears the risk of loss with respect to the investment of collateral. It is the Fund’s policy to obtain additional collateral from or return excess collateral to the borrower by the end of the next business day, following the valuation date of the securities loaned. Therefore, the value of the collateral held may be temporarily less than the value of the securities on loan. When loaning securities, the Fund retains certain benefits of owning the securities, including the economic equivalent of dividends or interest generated by the security. Lending securities entails a risk of loss to the Fund if, and to the extent that, the market value of the securities loaned were to increase and the borrower did not increase the collateral accordingly, and the borrower failed to return the securities. The securities loaned are subject to termination at the option of the borrower or the Fund. Upon termination, the borrower will return to the Fund the securities loaned and the Fund will return the collateral. Upon the failure of the borrower to return the securities, collateral may be liquidated and the securities may be purchased on the open market to replace the loaned securities. The Fund could experience delays and costs in gaining access to the collateral and the securities may lose value during the delay which could result in potential losses to the Fund. Some of these losses may be indemnified by the lending agent. The Fund bears the risk of any deficiency in the amount of the collateral available for return to the borrower due to any loss on the collateral invested. Dividends received on cash collateral investments for securities lending transactions, which are net of compensation to counterparties, are included in Dividends from affiliated money market funds on the Statement of Operations. The aggregate value of securities out on loan, if any, is shown as a footnote on the Statement of Assets and Liabilities. |
The Adviser serves as an affiliated securities lending agent for the Fund. The Bank of New York Mellon also serves as a lending agent. To the extent the Fund utilizes the Adviser as an affiliated securities lending agent, the Fund conducts its securities lending in accordance with, and in reliance upon, no-action letters issued by the SEC staff that provide guidance on how an affiliate may act as a direct agent lender and receive compensation for those services in a manner consistent with the federal securities laws. For the year ended October 31, 2022, fees paid to the Adviser were less than $500. Fees paid to the Adviser for securities lending agent services are included in Dividends from affiliated money market funds on the Statement of Operations.
| I. | Futures Contracts – The Fund may enter into futures contracts to manage exposure to interest rate, equity and market price movements and/or currency risks. A futures contract is an agreement between two parties (“Counterparties”) to purchase or sell a specified underlying security, currency or commodity (or delivery of a cash settlement price, in the case of an index future) for a fixed price at a future date. The Fund currently invests only in exchange-traded futures and they are standardized as to maturity date and underlying financial instrument or asset. Initial margin deposits required upon entering into futures contracts are satisfied by the segregation of specific securities or cash as collateral at the futures commission merchant (broker). During the period the futures contracts are open, changes in the value of the contracts are recognized as unrealized gains or losses by recalculating the value of the contracts on a daily basis. Subsequent or variation margin payments are received or made depending upon whether unrealized gains or losses are incurred. These amounts are reflected as receivables or payables on the Statement of Assets and Liabilities. When the contracts are closed or expire, the Fund recognizes a realized gain or loss equal to the difference between the proceeds from, or cost of, the closing transaction and the Fund’s basis in the contract. The net realized gain (loss) and the change in unrealized gain (loss) on futures contracts held during the period is included on the Statement of Operations. The primary risks associated with futures contracts are market risk |
| | |
| 20 | | Invesco U.S. Managed Volatility Fund |
and the absence of a liquid secondary market. If the Fund were unable to liquidate a futures contract and/or enter into an offsetting closing transaction, the Fund would continue to be subject to market risk with respect to the value of the contracts and continue to be required to maintain the margin deposits on the futures contracts. Futures contracts have minimal Counterparty risk since the exchange’s clearinghouse, as Counterparty to all exchange-traded futures, guarantees the futures against default. Risks may exceed amounts recognized in the Statement of Assets and Liabilities.
| J. | Call Options Purchased and Written – The Fund may write covered call options and/or buy call options. A covered call option gives the purchaser of such option the right to buy, and the writer the obligation to sell, the underlying security or foreign currency at the stated exercise price during the option period. Options written by the Fund normally will have expiration dates between three and nine months from the date written. The exercise price of a call option may be below, equal to, or above the current market value of the underlying security at the time the option is written. |
When the Fund writes a covered call option, an amount equal to the premium received by the Fund is recorded as an asset and an equivalent liability in the Statement of Assets and Liabilities. The amount of the liability is subsequently “marked-to-market” to reflect the current market value of the option written. If a written covered call option expires on the stipulated expiration date, or if the Fund enters into a closing purchase transaction, the Fund realizes a gain (or a loss if the closing purchase transaction exceeds the premium received when the option was written) without regard to any unrealized gain or loss on the underlying security, and the liability related to such option is extinguished. If a written covered call option is exercised, the Fund realizes a gain or a loss from the sale of the underlying security and the proceeds of the sale are increased by the premium originally received. Realized and unrealized gains and losses on call options written are included in the Statement of Operations as Net realized gain (loss) from and Change in net unrealized appreciation (depreciation) of Option contracts written. A risk in writing a covered call option is that the Fund gives up the opportunity for profit if the market price of the security increases and the option is exercised.
When the Fund buys a call option, an amount equal to the premium paid by the Fund is recorded as an investment on the Statement of Assets and Liabilities. The amount of the investment is subsequently “marked-to-market” to reflect the current value of the option purchased. Realized and unrealized gains and losses on call options purchased are included in the Statement of Operations as Net realized gain (loss) from and Change in net unrealized appreciation (depreciation) of Investment securities. A risk in buying an option is that the Fund pays a premium whether or not the option is exercised. In addition, there can be no assurance that a liquid secondary market will exist for any option purchased.
| K. | Collateral – To the extent the Fund has designated or segregated a security as collateral and that security is subsequently sold, it is the Fund’s practice to replace such collateral no later than the next business day. |
| L. | COVID-19 Risk – The COVID-19 strain of coronavirus has resulted in instances of market closures and dislocations, extreme volatility, liquidity constraints and increased trading costs. Efforts to contain its spread have resulted in travel restrictions, disruptions of healthcare systems, business operations (including business closures) and supply chains, layoffs, lower consumer demand and employee availability, and defaults and credit downgrades, among other significant economic impacts that have disrupted global economic activity across many industries. Such economic impacts may exacerbate other pre-existing political, social and economic risks locally or globally and cause general concern and uncertainty. The full economic impact and ongoing effects of COVID-19 (or other future epidemics or pandemics) at the macro-level and on individual businesses are unpredictable and may result in significant and prolonged effects on the Fund’s performance. |
NOTE 2–Advisory Fees and Other Fees Paid to Affiliates
The Trust has entered into a master investment advisory agreement with the Adviser. Under the terms of the investment advisory agreement, the Fund accrues daily and pays monthly an advisory fee to the Adviser at the annual rate of 0.10% of the Fund’s average daily net assets.
Under the terms of a master sub-advisory agreement between the Adviser and each of Invesco Asset Management Deutschland GmbH, Invesco Asset Management Limited, Invesco Asset Management (Japan) Limited, Invesco Hong Kong Limited, Invesco Senior Secured Management, Inc. and Invesco Canada Ltd. and separate sub-advisory agreements with Invesco Capital Management LLC and Invesco Asset Management (India) Private Limited (collectively, the “Affiliated Sub-Advisers”) the Adviser, not the Fund, will pay 40% of the fees paid to the Adviser to any such Affiliated Sub-Adviser(s) that provide(s) discretionary investment management services to the Fund based on the percentage of assets allocated to such Affiliated Sub-Adviser(s).
The Adviser has contractually agreed, through at least February 28, 2023, to waive advisory fees and/or reimburse expenses to the extent necessary to limit total annual fund operating expenses after fee waiver and/or reimbursement (excluding certain items discussed below) of Class R6 shares to 0.15% of the Fund’s average daily net assets (the “expense limit”). In determining the Adviser’s obligation to waive advisory fees and/or reimburse expenses, the following expenses are not taken into account, and could cause the total annual fund operating expenses after fee waiver and/or expense reimbursement to exceed the numbers reflected above: (1) interest; (2) taxes; (3) dividend expense on short sales; (4) extraordinary or non-routine items, including litigation expenses; and (5) expenses that the Fund has incurred but did not actually pay because of an expense offset arrangement. Unless Invesco continues the fee waiver agreement, it will terminate on February 28, 2023. During its term, the fee waiver agreement cannot be terminated or amended to increase the expense limits or reduce the advisory fee waiver without approval of the Board of Trustees.
Further, the Adviser has contractually agreed, through at least June 30, 2024, to waive the advisory fee payable by the Fund in an amount equal to 100% of the net advisory fees the Adviser receives from the affiliated money market funds on investments by the Fund of uninvested cash (excluding investments of cash collateral from securities lending) in such affiliated money market funds.
For the year ended October 31, 2022, the Adviser waived advisory fees of $26,031 and reimbursed Fund expenses of $86,668.
The Trust has entered into a master administrative services agreement with Invesco pursuant to which the Fund has agreed to pay Invesco for certain administrative costs incurred in providing accounting services to the Fund. For the year ended October 31, 2022, expenses incurred under the agreement are shown in the Statement of Operations as Administrative services fees. Invesco has entered into a sub-administration agreement whereby State Street Bank and Trust Company (“SSB”) serves as fund accountant and provides certain administrative services to the Fund. Pursuant to a custody agreement with the Trust on behalf of the Fund, SSB also serves as the Fund’s custodian.
The Trust has entered into a transfer agency and service agreement with Invesco Investment Services, Inc. (“IIS”) pursuant to which the Fund has agreed to pay IIS a fee for providing transfer agency and shareholder services to the Fund and reimburse IIS for certain expenses incurred by IIS in the course of providing such services. IIS may make payments to intermediaries that provide omnibus account services, sub-accounting services and/or networking services. All fees payable by IIS to intermediaries that provide omnibus account services or sub-accounting services are charged back to the Fund, subject to certain limitations approved by the Trust’s Board of Trustees. For the year ended October 31, 2022, expenses incurred under the agreement are shown in the Statement of Operations as Transfer agent fees.
The Trust has entered into a master distribution agreement with Invesco Distributors, Inc. (“IDI”) to serve as the distributor for the Fund’s shares. The Fund does not pay a distribution fee to IDI under the agreement.
For the year ended October 31, 2022, the Fund incurred $112 in brokerage commissions with Invesco Capital Markets, Inc., an affiliate of the Adviser and IDI, for portfolio transactions executed on behalf of the Fund.
Certain officers and trustees of the Trust are officers and directors of the Adviser, IIS and/or IDI.
NOTE 3–Additional Valuation Information
GAAP defines fair value as the price that would be received to sell an asset or paid to transfer a liability in an orderly transaction between market participants at the measurement date, under current market conditions. GAAP establishes a hierarchy that prioritizes the inputs to valuation methods, giving the highest priority to readily available unadjusted quoted prices in an active market for identical assets (Level 1) and the lowest priority to significant unobservable inputs (Level 3), generally when
| | |
| 21 | | Invesco U.S. Managed Volatility Fund |
market prices are not readily available. Based on the valuation inputs, the securities or other investments are tiered into one of three levels. Changes in valuation methods may result in transfers in or out of an investment’s assigned level:
| | |
| Level 1 - | | Prices are determined using quoted prices in an active market for identical assets. |
| Level 2 - | | Prices are determined using other significant observable inputs. Observable inputs are inputs that other market participants may use in pricing a security. These may include quoted prices for similar securities, interest rates, prepayment speeds, credit risk, yield curves, loss severities, default rates, discount rates, volatilities and others. |
| Level 3 - | | Prices are determined using significant unobservable inputs. In situations where quoted prices or observable inputs are unavailable (for example, when there is little or no market activity for an investment at the end of the period), unobservable inputs may be used. Unobservable inputs reflect the Adviser’s assumptions about the factors market participants would use in determining fair value of the securities or instruments and would be based on the best available information. |
The following is a summary of the tiered valuation input levels, as of October 31, 2022. The level assigned to the securities valuations may not be an indication of the risk or liquidity associated with investing in those securities. Because of the inherent uncertainties of valuation, the values reflected in the financial statements may materially differ from the value received upon actual sale of those investments.
| | | | | | | | | | | | | | | | |
| | | Level 1 | | | Level 2 | | | Level 3 | | | Total | |
|
| |
Investments in Securities | | | | | | | | | | | | | | | | |
|
| |
Common Stocks & Other Equity Interests | | $ | 25,917,131 | | | $ | – | | | | $– | | | $ | 25,917,131 | |
|
| |
Money Market Funds | | | 4 | | | | 40,689 | | | | – | | | | 40,693 | |
|
| |
Total Investments in Securities | | | 25,917,135 | | | | 40,689 | | | | – | | | | 25,957,824 | |
|
| |
| | | | |
Other Investments – Liabilities* | | | | | | | | | | | | | | | | |
|
| |
Futures Contracts | | | (373,254 | ) | | | – | | | | – | | | | (373,254 | ) |
|
| |
Total Investments | | $ | 25,543,881 | | | $ | 40,689 | | | | $– | | | $ | 25,584,570 | |
|
| |
| * | Unrealized appreciation (depreciation). |
NOTE 4–Derivative Investments
The Fund may enter into an International Swaps and Derivatives Association Master Agreement (“ISDA Master Agreement”) under which a fund may trade OTC derivatives. An OTC transaction entered into under an ISDA Master Agreement typically involves a collateral posting arrangement, payment netting provisions and close-out netting provisions. These netting provisions allow for reduction of credit risk through netting of contractual obligations. The enforceability of the netting provisions of the ISDA Master Agreement depends on the governing law of the ISDA Master Agreement, among other factors.
For financial reporting purposes, the Fund does not offset OTC derivative assets or liabilities that are subject to ISDA Master Agreements in the Statement of Assets and Liabilities.
| | | | |
| | | Value | |
| | | Equity | |
| Derivative Liabilities | | Risk | |
|
| |
Unrealized depreciation on futures contracts – Exchange-Traded(a) | | $ | (373,254 | ) |
|
| |
Derivatives not subject to master netting agreements | | | 373,254 | |
|
| |
Total Derivative Liabilities subject to master netting agreements | | $ | – | |
|
| |
| (a) | The daily variation margin receivable (payable) at period-end is recorded in the Statement of Assets and Liabilities. |
Effect of Derivative Investments for the year ended October 31, 2022
The table below summarizes the gains (losses) on derivative investments, detailed by primary risk exposure, recognized in earnings during the period:
| | | | | | | | | | | | | | | |
| | | Location of Gain (Loss) on
Statement of Operations |
| | | | | Equity | | |
| | | | | Risk | | |
|
| |
Realized Gain (Loss): | | | | | | | | | | | | | | | |
Futures contracts | | | | | | | | $ | 1,155,983 | | | | | | |
|
| |
Options purchased(a) | | | | | | | | | (270,955 | ) | | | | | |
|
| |
Options written | | | | | | | | | 80,839 | | | | | | |
|
| |
Change in Net Unrealized Appreciation (Depreciation): | | | | | | | | | | | | | | | |
Futures contracts | | | | | | | | | (373,254 | ) | | | | | |
|
| |
Total | | | | | | | | $ | 592,613 | | | | | | |
|
| |
| (a) | Options purchased are included in the net realized gain (loss) from investment securities and the change in net unrealized appreciation (depreciation) of investment securities. |
The table below summarizes the average notional value of derivatives held during the period.
| | | | | | | | | | | | | | | | | | | | |
| | | Futures
Contracts | | | | | | Options
Purchased | | | | | | Options
Written | |
|
| |
Average notional value | | $ | 8,007,915 | | | | | | | $ | 5,000,000 | | | | | | | $ | 5,559,000 | |
|
| |
Average contracts | | | – | | | | | | | | 12 | | | | | | | | 12 | |
|
| |
| | |
| 22 | | Invesco U.S. Managed Volatility Fund |
NOTE 5–Trustees’ and Officers’ Fees and Benefits
Trustees’ and Officers’ Fees and Benefits include amounts accrued by the Fund to pay remuneration to certain Trustees and Officers of the Fund. Trustees have the option to defer compensation payable by the Fund, and Trustees’ and Officers’ Fees and Benefits also include amounts accrued by the Fund to fund such deferred compensation amounts. Those Trustees who defer compensation have the option to select various Invesco Funds in which their deferral accounts shall be deemed to be invested. Finally, certain current Trustees were eligible to participate in a retirement plan that provided for benefits to be paid upon retirement to Trustees over a period of time based on the number of years of service. The Fund may have certain former Trustees who also participate in a retirement plan and receive benefits under such plan. Trustees’ and Officers’ Fees and Benefits include amounts accrued by the Fund to fund such retirement benefits. Obligations under the deferred compensation and retirement plans represent unsecured claims against the general assets of the Fund.
NOTE 6–Cash Balances
The Fund is permitted to temporarily carry a negative or overdrawn balance in its account with SSB, the custodian bank. Such balances, if any at period-end, are shown in the Statement of Assets and Liabilities under the payable caption Amount due custodian. To compensate the custodian bank for such overdrafts, the overdrawn Fund may either (1) leave funds as a compensating balance in the account so the custodian bank can be compensated by earning the additional interest; or (2) compensate by paying the custodian bank at a rate agreed upon by the custodian bank and Invesco, not to exceed the contractually agreed upon rate. The Fund may not purchase additional securities when any borrowings from banks or broker-dealers exceed 5% of the Fund’s total assets, or when any borrowings from an Invesco Fund are outstanding.
NOTE 7–Distributions to Shareholders and Tax Components of Net Assets
Tax Character of Distributions to Shareholders Paid During the Fiscal Years Ended October 31, 2022 and 2021:
| | | | | | | | | | | | |
| | | 2022 | | | | | | 2021 | |
|
| |
Ordinary income* | | $ | 350,184 | | | | | | | $ | 683,750 | |
|
| |
Long-term capital gain | | | – | | | | | | | | 1,137,472 | |
|
| |
Total distributions | | $ | 350,184 | | | | | | | $ | 1,821,222 | |
|
| |
| * | Includes short-term capital gain distributions, if any. |
Tax Components of Net Assets at Period-End:
| | | | |
| | | 2022 | |
|
| |
Undistributed ordinary income | | $ | 715,254 | |
|
| |
Undistributed long-term capital gain | | | 875,481 | |
|
| |
Net unrealized appreciation – investments | | | 959,546 | |
|
| |
Temporary book/tax differences | | | (12,848 | ) |
|
| |
Shares of beneficial interest | | | 23,912,042 | |
|
| |
Total net assets | | $ | 26,449,475 | |
|
| |
The difference between book-basis and tax-basis unrealized appreciation (depreciation) is due to differences in the timing of recognition of gains and losses on investments for tax and book purposes. The Fund’s net unrealized appreciation (depreciation) difference is attributable primarily to wash sales, derivative instruments and straddles.
The temporary book/tax differences are a result of timing differences between book and tax recognition of income and/or expenses. The Fund’s temporary book/tax differences are the result of the trustee deferral of compensation and retirement plan benefits.
Capital loss carryforward is calculated and reported as of a specific date. Results of transactions and other activity after that date may affect the amount of capital loss carryforward actually available for the Fund to utilize. The ability to utilize capital loss carryforward in the future may be limited under the Internal Revenue Code and related regulations based on the results of future transactions.
The Fund does not have a capital loss carryforward as of October 31, 2022.
NOTE 8–Investment Transactions
The aggregate amount of investment securities (other than short-term securities, U.S. Government obligations and money market funds, if any) purchased and sold by the Fund during the year ended October 31, 2022 was $10,889,147 and $8,882,799, respectively. Cost of investments, including any derivatives, on a tax basis includes the adjustments for financial reporting purposes as of the most recently completed federal income tax reporting period-end.
| | | | |
Unrealized Appreciation (Depreciation) of Investments on a Tax Basis | |
Aggregate unrealized appreciation of investments | | | $ 2,230,994 | |
|
| |
Aggregate unrealized (depreciation) of investments | | | (1,271,448 | ) |
|
| |
Net unrealized appreciation of investments | | | $ 959,546 | |
|
| |
Cost of investments for tax purposes is $24,625,024.
NOTE 9–Reclassification of Permanent Differences
Primarily as a result of differing book/tax treatment of foreign currency transactions, on October 31, 2022, undistributed net investment income was decreased by $768 and undistributed net realized gain (loss) was increased by $768. This reclassification had no effect on the net assets or the distributable earnings of the Fund.
| | |
| 23 | | Invesco U.S. Managed Volatility Fund |
NOTE 10–Share Information
| | | | | | | | | | | | | | | | |
| | | Summary of Share Activity | |
|
| |
| | |
| | | Year ended | | | Year ended | |
| | | October 31, 2022(a) | | | October 31, 2021 | |
| | | Shares | | | Amount | | | Shares | | | Amount | |
|
| |
Sold: | | | | | | | | | | | | | | | | |
Class R6 | | | 535,019 | | | $ | 7,201,073 | | | | 1,256,654 | | | $ | 15,960,141 | |
|
| |
| | | | |
Issued as reinvestment of dividends: | | | | | | | | | | | | | | | | |
Class R6 | | | 24,153 | | | | 349,981 | | | | 89,748 | | | | 1,059,021 | |
|
| |
| | | | |
Reacquired: | | | | | | | | | | | | | | | | |
Class R6 | | | (397,633 | ) | | | (5,674,515 | ) | | | (509,006 | ) | | | (6,853,000 | ) |
|
| |
Net increase in share activity | | | 161,539 | | | $ | 1,876,539 | | | | 837,396 | | | $ | 10,166,162 | |
|
| |
| (a) | 98% of the outstanding shares of the Fund are owned by the Adviser or an affiliate of the Adviser. |
NOTE 11–Significant Event
The Board of Trustees approved a Plan of Liquidation and Dissolution, which authorizes the termination, liquidation and dissolution of the Fund. In order to effect such liquidation, the Fund closed to investments by new accounts after the close of business on October 24, 2022. The Fund will be liquidated on or about January 23, 2023.
| | |
| 24 | | Invesco U.S. Managed Volatility Fund |
Report of Independent Registered Public Accounting Firm
To the Board of Trustees of AIM Investment Funds (Invesco Investment Funds) and Shareholders of Invesco U.S. Managed Volatility Fund
Opinion on the Financial Statements
We have audited the accompanying statement of assets and liabilities, including the schedule of investments, of Invesco U.S. Managed Volatility Fund (one of the funds constituting AIM Investment Funds (Invesco Investment Funds), referred to hereafter as the “Fund”) as of October 31, 2022, the related statement of operations for the year ended October 31, 2022, the statement of changes in net assets for each of the two years in the period ended October 31, 2022, including the related notes, and the financial highlights for each of the four years in the period ended October 31, 2022 and for the period December 18, 2017 (commencement of operations) through October 31, 2018 (collectively referred to as the “financial statements”). In our opinion, the financial statements present fairly, in all material respects, the financial position of the Fund as of October 31, 2022, the results of its operations for the year then ended, the changes in its net assets for each of the two years in the period ended October 31, 2022 and the financial highlights for each of the four years in the period ended October 31, 2022 and for the period December 18, 2017 (commencement of operations) through October 31, 2018 in conformity with accounting principles generally accepted in the United States of America.
Basis for Opinion
These financial statements are the responsibility of the Fund’s management. Our responsibility is to express an opinion on the Fund’s financial statements based on our audits. We are a public accounting firm registered with the Public Company Accounting Oversight Board (United States) (PCAOB) and are required to be independent with respect to the Fund in accordance with the U.S. federal securities laws and the applicable rules and regulations of the Securities and Exchange Commission and the PCAOB.
We conducted our audits of these financial statements in accordance with the standards of the PCAOB. Those standards require that we plan and perform the audit to obtain reasonable assurance about whether the financial statements are free of material misstatement, whether due to error or fraud.
Our audits included performing procedures to assess the risks of material misstatement of the financial statements, whether due to error or fraud, and performing procedures that respond to those risks. Such procedures included examining, on a test basis, evidence regarding the amounts and disclosures in the financial statements. Our audits also included evaluating the accounting principles used and significant estimates made by management, as well as evaluating the overall presentation of the financial statements. Our procedures included confirmation of securities owned as of October 31, 2022 by correspondence with the custodian, transfer agent and brokers; when replies were not received from brokers, we performed other auditing procedures. We believe that our audits provide a reasonable basis for our opinion.
|
| /s/PricewaterhouseCoopers LLP |
|
| Houston, Texas |
| December 23, 2022 |
We have served as the auditor of one or more of the investment companies in the Invesco group of investment companies since at least 1995. We have not been able to determine the specific year we began serving as auditor.
| | |
| 25 | | Invesco U.S. Managed Volatility Fund |
Calculating your ongoing Fund expenses
Example
As a shareholder of the Fund, you incur two types of costs: (1) transaction costs, which may include sales charges (loads) on purchase payments or contingent deferred sales charges on redemptions, if any; and (2) ongoing costs, including management fees, distribution and/or service (12b-1) fees, and other Fund expenses. This example is intended to help you understand your ongoing costs (in dollars) of investing in the Fund and to compare these costs with ongoing costs of investing in other mutual funds. The example is based on an investment of $1,000 invested at the beginning of the period and held for the entire period May 1, 2022 through October 31, 2022.
Actual expenses
The table below provides information about actual account values and actual expenses. You may use the information in this table, together with the amount you invested, to estimate the expenses that you paid over the period. Simply divide your account value by $1,000 (for example, an $8,600 account value divided by $1,000 = 8.6), then multiply the result by the number in the table under the heading entitled “Actual Expenses Paid During Period” to estimate the expenses you paid on your account during this period.
Hypothetical example for comparison purposes
The table below also provides information about hypothetical account values and hypothetical expenses based on the Fund’s actual expense ratio and an assumed rate of return of 5% per year before expenses, which is not the Fund’s actual return.
The hypothetical account values and expenses may not be used to estimate the actual ending account balance or expenses you paid for the period. You may use this information to compare the ongoing costs of investing in the Fund and other funds. To do so, compare this 5% hypothetical example with the 5% hypothetical examples that appear in the shareholder reports of the other funds.
Please note that the expenses shown in the table are meant to highlight your ongoing costs only and do not reflect any transaction costs, such as sales charges (loads) on purchase payments or contingent deferred sales charges on redemptions, if any. Therefore, the hypothetical information is useful in comparing ongoing costs only, and will not help you determine the relative total costs of owning different funds. In addition, if these transaction costs were included, your costs would have been higher.
| | | | | | | | | | | | |
| | | | | ACTUAL | | HYPOTHETICAL (5% annual return before expenses) | | |
| | | Beginning
Account Value
(05/01/22) | | Ending
Account Value
(10/31/22)1 | | Expenses
Paid During
Period2 | | Ending
Account Value
(10/31/22) | | Expenses
Paid During
Period2 | | Annualized Expense Ratio |
Class R6 | | $1,000.00 | | $979.70 | | $0.75 | | $1,024.45 | | $0.77 | | 0.15% |
| 1 | The actual ending account value is based on the actual total return of the Fund for the period May 1, 2022 through October 31, 2022, after actual expenses and will differ from the hypothetical ending account value which is based on the Fund’s expense ratio and a hypothetical annual return of 5% before expenses. |
| 2 | Expenses are equal to the Fund’s annualized expense ratio as indicated above multiplied by the average account value over the period, multiplied by 184/365 to reflect the most recent fiscal half year. |
| | |
| 26 | | Invesco U.S. Managed Volatility Fund |
Approval of Investment Advisory and Sub-Advisory Contracts
At meetings held on June 13, 2022, the Board of Trustees (the Board or the Trustees) of AIM Investment Funds (Invesco Investment Funds) as a whole, and the independent Trustees, who comprise over 75% of the Board, voting separately, approved the continuance of the Invesco U.S. Managed Volatility Fund’s (the Fund) Master Investment Advisory Agreement with Invesco Advisers, Inc. (Invesco Advisers and the investment advisory agreement) and the Master Intergroup Sub-Advisory Contract for Mutual Funds with Invesco Asset Management Deutschland GmbH, Invesco Asset Management Limited, Invesco Asset Management (Japan) Limited, Invesco Hong Kong Limited, Invesco Senior Secured Management, Inc. and Invesco Canada Ltd. and separate sub-advisory contracts with Invesco Capital Management LLC and Invesco Asset Management (India) Private Limited (collectively, the Affiliated Sub-Advisers and the sub-advisory contracts) for another year, effective July 1, 2022. After evaluating the factors discussed below, among others, the Board approved the renewal of the Fund’s investment advisory agreement and the sub-advisory contracts and determined that the compensation payable thereunder by the Fund to Invesco Advisers and by Invesco Advisers to the Affiliated Sub-Advisers is fair and reasonable.
The Board’s Evaluation Process
The Board has established an Investments Committee, which in turn has established Sub-Committees that meet throughout the year to review the performance of funds advised by Invesco Advisers (the Invesco Funds). The Sub-Committees meet regularly with portfolio managers for their assigned Invesco Funds and other members of management to review detailed information about investment performance and portfolio attributes of these funds. The Board has established additional standing and ad hoc committees that meet regularly throughout the year to review matters within their purview. The Board took into account evaluations and reports that it received from its committees and sub-committees, as well as the information provided to the Board and its committees and sub-committees throughout the year, in considering whether to approve each Invesco Fund’s investment advisory agreement and sub-advisory contracts.
As part of the contract renewal process, the Board reviews and considers information provided in response to detailed requests for information submitted to management by the independent Trustees with assistance from legal counsel to the independent Trustees and the Senior Officer, an officer of the Invesco Funds who reports directly to the independent Trustees. The Board receives comparative investment performance and fee and expense data regarding the Invesco Funds prepared by Broadridge Financial Solutions, Inc. (Broadridge), an independent mutual fund data provider, as well as information on the composition of the peer groups provided by Broadridge and its methodology for determining peer groups. The Board also receives an independent written evaluation from the Senior Officer. The Senior Officer’s evaluation is prepared as part of his responsibility to manage the process by which the Invesco Funds’ proposed management fees are negotiated during the annual contract renewal
process to ensure they are negotiated in a manner that is at arms’ length and reasonable in accordance with certain negotiated regulatory requirements. In addition to meetings with Invesco Advisers and fund counsel throughout the year and as part of meetings convened on May 2, 2022 and June 13, 2022, the independent Trustees also discussed the continuance of the investment advisory agreement and sub-advisory contracts in separate sessions with the Senior Officer and with independent legal counsel.
The discussion below is a summary of the Senior Officer’s independent written evaluation with respect to the Fund’s investment advisory agreement and sub-advisory contracts, as well as a discussion of the material factors and related conclusions that formed the basis for the Board’s approval of the Fund’s investment advisory agreement and sub-advisory contracts. The Trustees’ review and conclusions are based on the comprehensive consideration of all information presented to them during the course of the year and in prior years and are not the result of any single determinative factor. Moreover, one Trustee may have weighed a particular piece of information or factor differently than another Trustee. The information received and considered by the Board was current as of various dates prior to the Board’s approval on June 13, 2022.
Factors and Conclusions and Summary of Independent Written Fee Evaluation
| A. | Nature, Extent and Quality of Services Provided by Invesco Advisers and the Affiliated Sub-Advisers |
The Board reviewed the nature, extent and quality of the advisory services provided to the Fund by Invesco Advisers under the Fund’s investment advisory agreement, and the credentials and experience of the officers and employees of Invesco Advisers who provide these services, including the Fund’s portfolio manager(s). The Board’s review included consideration of Invesco Advisers’ investment process and oversight, credit analysis, and research capabilities. The Board considered information regarding Invesco Advisers’ programs for and resources devoted to risk management, including management of investment, enterprise, operational, liquidity, valuation and compliance risks, and technology used to manage such risks. The Board also received and reviewed information about Invesco Advisers’ role as administrator of the Invesco Funds’ liquidity risk management program. The Board received a description of, and reports related to, Invesco Advisers’ global security program and business continuity plans and of its approach to data privacy and cybersecurity, including related testing. The Board considered how the cybersecurity and business continuity plans of Invesco Advisers and its key service providers operated in the remote and hybrid working environment resulting from the novel coronavirus (“COVID-19”) pandemic and paved the way for a hybrid working framework in a normalized environment as employees return to the office. The Board also considered non-advisory services that Invesco Advisers and its affiliates provide to the Invesco Funds, such as various back office support functions, third party oversight, internal audit, valuation, portfolio trading and legal and compliance. The Board observed that Invesco Advisers’ systems preparedness and ongoing investment enabled
Invesco Advisers to manage, operate and oversee the Invesco Funds with minimal impact or disruption through challenging environments. The Board reviewed and considered the benefits to shareholders of investing in a Fund that is part of the family of funds under the umbrella of Invesco Ltd., Invesco Advisers’ parent company, and noted Invesco Ltd.’s depth and experience in running an investment management business, as well as its commitment of financial and other resources to such business. The Board concluded that the nature, extent and quality of the services provided to the Fund by Invesco Advisers are appropriate and satisfactory.
The Board reviewed the services that may be provided by the Affiliated Sub-Advisers under the sub-advisory contracts and the credentials and experience of the officers and employees of the Affiliated Sub-Advisers who provide these services. The Board noted the Affiliated Sub-Advisers’ expertise with respect to certain asset classes and that the Affiliated Sub-Advisers have offices and personnel that are located in financial centers around the world. As a result, the Board noted that the Affiliated Sub-Advisers can provide research and investment analysis on the markets and economies of various countries in which the Fund may invest, make recommendations regarding securities and assist with security trades. The Board concluded that the sub-advisory contracts may benefit the Fund and its shareholders by permitting Invesco Advisers to use the resources and talents of the Affiliated Sub-Advisers in managing the Fund. The Board concluded that the nature, extent and quality of the services that may be provided to the Fund by the Affiliated Sub-Advisers are appropriate and satisfactory.
| B. | Fund Investment Performance |
The Board considered Fund investment performance as a relevant factor in considering whether to approve the investment advisory agreement as well as the sub-advisory contracts for the Fund, as Invesco Capital Management LLC currently manages assets of the Fund.
The Board noted that the Fund only had four full years of performance history and compared the Fund’s investment performance during the past three years ending December 31, 2021 to the performance of funds in the Broadridge performance universe and against the Invesco U.S. Large Cap Index (Index). The Board noted that performance of Class R6 shares of the Fund was in the fifth quintile of its performance universe for the one year period, the third quintile for the two year period and the fourth quintile for the three and four year periods (the first quintile being the best performing funds and the fifth quintile being the worst performing funds). The Board noted that performance of Class R6 shares of the Fund was below the performance of the Index for the one, two, three and four year periods. The Board noted that, unlike certain of the peer funds and the Index, managing portfolio volatility is a component of the Fund’s investment objective. The Board also noted that the Fund’s volatility overlay impacted relative performance in a period of rising equity markets. The Board recognized that the performance data reflects a snapshot in time as of a particular date and that selecting a different performance period could produce different results. The Board also
| | |
| 27 | | Invesco U.S. Managed Volatility Fund |
reviewed more recent Fund performance as well as other performance metrics, which did not change its conclusions.
| C. | Advisory and Sub-Advisory Fees and Fund Expenses |
The Board compared the Fund’s contractual management fee rate to the contractual management fee rates of funds in the Fund’s Broadridge expense group. The Board noted that the contractual management fee rate for shares of the Fund was below the median contractual management fee rate of funds in its expense group. The Board noted that the term “contractual management fee” for funds in the expense group may include both advisory and certain non-portfolio management administrative services fees, but that Broadridge is not able to provide information on a fund by fund basis as to what is included. The Board also reviewed the methodology used by Broadridge in calculating expense group information, which includes using each fund’s contractual management fee schedule (including any applicable breakpoints) as reported in the most recent prospectus or statement of additional information for each fund in the expense group. The Board also considered comparative information regarding the Fund’s total expense ratio and its various components.
The Board noted that Invesco Advisers has contractually agreed to waive fees and/or limit expenses of the Fund for the term disclosed in the Fund’s registration statement in an amount necessary to limit total annual operating expenses to a specified percentage of average daily net assets for each class of the Fund.
The Board noted that Invesco Advisers and the Affiliated Sub-Advisers do not manage other similarly managed mutual funds or client accounts.
The Board also considered the services that may be provided by the Affiliated Sub-Advisers pursuant to the sub-advisory contracts, as well as the fees payable by Invesco Advisers to the Affiliated Sub-Advisers pursuant to the sub-advisory contracts. The Board noted that Invesco Advisers retains overall responsibility for, and provides services to, sub-advised Invesco Funds, including oversight of the Affiliated Sub-Advisers as well as the additional services described herein other than day-to-day portfolio management.
| D. | Economies of Scale and Breakpoints |
The Board considered the extent to which there may be economies of scale in the provision of advisory services to the Fund and the Invesco Funds, and the extent to which such economies of scale are shared with the Fund and the Invesco Funds. The Board noted that the Fund does not benefit from economies of scale through contractual breakpoints, but does share in economies of scale through Invesco Advisers’ ability to negotiate lower fee arrangements with third party service providers. The Board noted that the Fund may also benefit from economies of scale through initial fee setting, fee waivers and expense reimbursements, as well as Invesco Advisers’ investment in its business, including investments in business infrastructure, technology and cybersecurity.
| E. | Profitability and Financial Resources |
The Board reviewed information from Invesco Advisers concerning the costs of the advisory and other services that Invesco Advisers and its affiliates provide to the Fund and the Invesco Funds and the profitability of Invesco Advisers and its affiliates in providing these services in the aggregate and on an
individual Fund-by-Fund basis. The Board considered the methodology used for calculating profitability and the periodic review and enhancement of such methodology. The Board noted that Invesco Advisers continues to operate at a net profit from services Invesco Advisers and its affiliates provide to the Invesco Funds in the aggregate and to most Funds individually. The Board did not deem the level of profits realized by Invesco Advisers and its affiliates from providing such services to be excessive, given the nature, extent and quality of the services provided. The Board noted that Invesco Advisers provided information demonstrating that Invesco Advisers is financially sound and has the resources necessary to perform its obligations under the investment advisory agreement, and provided representations indicating that the Affiliated Sub-Advisers are financially sound and have the resources necessary to perform their obligations under the sub-advisory contracts.
| F. | Collateral Benefits to Invesco Advisers and its Affiliates |
The Board considered various other benefits received by Invesco Advisers and its affiliates from the relationship with the Fund, including the fees received for providing administrative, transfer agency and distribution services to the Fund. The Board received comparative information regarding fees charged for these services, including information provided by Broadridge and other independent sources. The Board reviewed the performance of Invesco Advisers and its affiliates in providing these services and the organizational structure employed to provide these services. The Board noted that these services are provided to the Fund pursuant to written contracts that are reviewed and subject to approval on an annual basis by the Board based on its determination that the services are required for the operation of the Fund.
The Board considered the benefits realized by Invesco Advisers and the Affiliated Sub-Advisers as a result of portfolio brokerage transactions executed through “soft dollar” arrangements. The Board noted that soft dollar arrangements may result in the Fund bearing costs to purchase research that may be used by Invesco Advisers or the Affiliated Sub-Advisers with other clients and may reduce Invesco Advisers’ or the Affiliated Sub-Advisers’ expenses. The Board also considered that it receives from Invesco Advisers periodic reports that include a representation to the effect that these arrangements are consistent with regulatory requirements. The Board did not deem the soft dollar arrangements to be inappropriate.
The Board considered that the Fund’s uninvested cash and cash collateral from any securities lending arrangements may be invested in registered money market funds or, with regard to securities lending cash collateral, unregistered funds that comply with Rule 2a-7 (collectively referred to as “affiliated money market funds”) advised by Invesco Advisers. The Board considered information regarding the returns of the affiliated money market funds relative to comparable overnight investments, as well as the fees paid by the affiliated money market funds to Invesco Advisers and its affiliates. In this regard, the Board noted that Invesco Advisers receives advisory fees from these affiliated money market funds attributable to the Fund’s investments. The Board also noted that Invesco Advisers has contractually agreed to waive through varying periods an amount equal to 100% of the net advisory fee Invesco Advisers receives from the affiliated money market
funds with respect to the Fund’s investment in the affiliated money market funds of uninvested cash, but not cash collateral. The Board concluded that the advisory fees payable to Invesco Advisers from the Fund’s investment of cash collateral from any securities lending arrangements in the affiliated money market funds are for services that are not duplicative of services provided by Invesco Advisers to the Fund.
The Board considered that Invesco Advisers may serve as the Fund’s affiliated securities lending agent and evaluated the benefits realized by Invesco Advisers when serving in such role, including the compensation received. The Board considered Invesco Advisers’ securities lending platform and corporate governance structure for securities lending, including Invesco Advisers’ Securities Lending Governance Committee and its related responsibilities. The Board noted that to the extent the Fund utilizes Invesco Advisers as an affiliated securities lending agent, the Fund conducts its securities lending in accordance with, and in reliance upon, no-action letters issued by the SEC staff that provide guidance on how an affiliate may act as a direct agent lender and receive compensation for those services without obtaining exemptive relief. The Board considered information provided by Invesco Advisers related to the performance of Invesco Advisers as securities lending agent, including a summary of the securities lending services provided to the Fund by Invesco Advisers and the compensation paid to Invesco Advisers for such services, as well as any revenues generated for the Fund in connection with such securities lending activity and the allocation of such revenue between the Fund and Invesco Advisers.
The Board also received information about commissions that an affiliated broker may receive for executing certain trades for the Fund. Invesco Advisers and the Affiliated Sub-Advisers advised the Board of the benefits to the Fund of executing trades through the affiliated broker and that such trades were executed in compliance with rules under the federal securities laws and consistent with best execution obligations.
| | |
| 28 | | Invesco U.S. Managed Volatility Fund |
Tax Information
Form 1099-DIV, Form 1042-S and other year–end tax information provide shareholders with actual calendar year amounts that should be included in their tax returns. Shareholders should consult their tax advisers.
The following distribution information is being provided as required by the Internal Revenue Code or to meet a specific state’s requirement.
The Fund designates the following amounts or, if subsequently determined to be different, the maximum amount allowable for its fiscal year ended October 31, 2022:
| | | | | | | | |
Federal and State Income Tax | | | | | | |
Qualified Dividend Income* | | | 0.00% | | | | | |
Corporate Dividends Received Deduction* | | | 0.00% | | | | | |
U.S. Treasury Obligations* | | | 0.00% | | | | | |
Qualified Business Income* | | | 0.00% | | | | | |
Business Interest Income* | | | 0.00% | | | | | |
|
| * The above percentages are based on ordinary income dividends paid to shareholders during the Fund’s fiscal year. | |
| | |
Non-Resident Alien Shareholders | | | | | | |
Short-Term Capital Gain Distributions | | | $34,105 | | | | | |
| | |
| 29 | | Invesco U.S. Managed Volatility Fund |
Trustees and Officers
The address of each trustee and officer is AIM Investment Funds (Invesco Investment Funds) (the “Trust”), 11 Greenway Plaza, Suite 1000, Houston, Texas 77046-1173. The trustees serve for the life of the Trust, subject to their earlier death, incapacitation, resignation, retirement or removal as more specifically provided in the Trust’s organizational documents. Each officer serves for a one year term or until their successors are elected and qualified. Column two below includes length of time served with predecessor entities, if any.
| | | | | | | | |
Name, Year of Birth and Position(s) Held with the Trust | | Trustee and/or Officer Since | | Principal Occupation(s) During Past 5 Years | | Number of Funds in Fund Complex Overseen by Trustee | | Other Directorship(s) Held by Trustee During Past 5 Years |
| Interested Trustee | | | | | | | | |
Martin L. Flanagan1 - 1960 Trustee and Vice Chair | | 2007 | | Executive Director, Chief Executive Officer and President, Invesco Ltd. (ultimate parent of Invesco and a global investment management firm); Trustee and Vice Chair, The Invesco Funds; Vice Chair, Investment Company Institute; and Member of Executive Board, SMU Cox School of Business Formerly: Advisor to the Board, Invesco Advisers, Inc. (formerly known as Invesco Institutional (N.A.), Inc.); Chairman and Chief Executive Officer, Invesco Advisers, Inc. (registered investment adviser); Director, Chairman, Chief Executive Officer and President, Invesco Holding Company (US), Inc. (formerly IVZ Inc.) (holding company), Invesco Group Services, Inc. (service provider) and Invesco North American Holdings, Inc. (holding company); Director, Chief Executive Officer and President, Invesco Holding Company Limited (parent of Invesco and a global investment management firm); Director, Invesco Ltd.; Chairman, Investment Company Institute and President, Co-Chief Executive Officer, Co-President, Chief Operating Officer and Chief Financial Officer, Franklin Resources, Inc. (global investment management organization) | | 189 | | None |
| 1 | Mr. Flanagan is considered an interested person (within the meaning of Section 2(a)(19) of the 1940 Act) of the Trust because he is an officer of the Adviser to the Trust, and an officer and a director of Invesco Ltd., ultimate parent of the Adviser. |
| | |
| T-1 | | Invesco U.S. Managed Volatility Fund |
Trustees and Officers–(continued)
| | | | | | | | |
Name, Year of Birth and Position(s) Held with the Trust | | Trustee and/or Officer Since | | Principal Occupation(s) During Past 5 Years | | Number of Funds in Fund Complex
Overseen by Trustee | | Other Directorship(s) Held by Trustee During Past 5 Years |
| Independent Trustees | | | | | | | | |
Beth Ann Brown - 1968 Trustee (2019) and Chair (August 2022) | | 2019 | | Independent Consultant Formerly: Head of Intermediary Distribution, Managing Director, Strategic Relations, Managing Director, Head of National Accounts, Senior Vice President, National Account Manager and Senior Vice President, Key Account Manager, Columbia Management Investment Advisers LLC; Vice President, Key Account Manager, Liberty Funds Distributor, Inc.; and Trustee of certain Oppenheimer Funds | | 189 | | Director, Board of Directors of Caron Engineering Inc.; Advisor, Board of Advisors of Caron Engineering Inc.; President and Director, Acton Shapleigh Youth Conservation Corps (non-profit) Formerly: President and Director Director of Grahamtastic Connection (non-profit) |
Cynthia Hostetler - 1962 Trustee | | 2017 | | Non-Executive Director and Trustee of a number of public and private business corporations Formerly: Director, Aberdeen Investment Funds (4 portfolios); Director, Artio Global Investment LLC (mutual fund complex); Director, Edgen Group, Inc. (specialized energy and infrastructure products distributor); Director, Genesee & Wyoming, Inc. (railroads); Head of Investment Funds and Private Equity, Overseas Private Investment Corporation; President, First Manhattan Bancorporation, Inc.; and Attorney, Simpson Thacher & Bartlett LLP | | 189 | | Resideo Technologies, Inc. (smart home technology); Vulcan Materials Company (construction materials company); Trilinc Global Impact Fund; Textainer Group Holdings, (shipping container leasing company); Investment Company Institute (professional organization); and Independent Directors Council (professional organization) |
Eli Jones - 1961 Trustee | | 2016 | | Professor and Dean Emeritus, Mays Business School - Texas A&M University Formerly: Dean of Mays Business School-Texas A&M University; Professor and Dean, Walton College of Business, University of Arkansas and E.J. Ourso College of Business, Louisiana State University; and Director, Arvest Bank | | 189 | | Insperity, Inc. (formerly known as Administaff) (human resources provider); and Member of Regional Board of Directors and Board of Directors, First Financial Bancorp (regional bank) |
Elizabeth Krentzman - 1959 Trustee | | 2019 | | Formerly: Principal and Chief Regulatory Advisor for Asset Management Services and U.S. Mutual Fund Leader of Deloitte & Touche LLP; General Counsel of the Investment Company Institute (trade association); National Director of the Investment Management Regulatory Consulting Practice, Principal, Director and Senior Manager of Deloitte & Touche LLP; Assistant Director of the Division of Investment Management - Office of Disclosure and Investment Adviser Regulation of the U.S. Securities and Exchange Commission and various positions with the Division of Investment Management – Office of Regulatory Policy of the U.S. Securities and Exchange Commission; Associate at Ropes & Gray LLP; and Trustee of certain Oppenheimer Funds | | 189 | | Formerly: Member of the Cartica Funds Board of Directors (private investment fund); Trustee of the University of Florida National Board Foundation; and Member of the University of Florida Law Center Association, Inc. Board of Trustees, Audit Committee and Membership Committee |
Anthony J. LaCava, Jr. - 1956 Trustee | | 2019 | | Formerly: Director and Member of the Audit Committee, Blue Hills Bank (publicly traded financial institution) and Managing Partner, KPMG LLP | | 189 | | Blue Hills Bank; Chairman, Bentley University; Member, Business School Advisory Council; and Nominating Committee, KPMG LLP |
Prema Mathai-Davis - 1950 Trustee | | 2001 | | Retired Formerly: Co-Founder & Partner of Quantalytics Research, LLC, (a FinTech Investment Research Platform for the Self-Directed Investor); Trustee of YWCA Retirement Fund; CEO of YWCA of the USA; Board member of the NY Metropolitan Transportation Authority; Commissioner of the NYC Department of Aging; and Board member of Johns Hopkins Bioethics Institute | | 189 | | Member of Board of Positive Planet US (non-profit) and HealthCare Chaplaincy Network (non-profit) |
| | |
| T-2 | | Invesco U.S. Managed Volatility Fund |
Trustees and Officers–(continued)
| | | | | | | | |
Name, Year of Birth and Position(s) Held with the Trust | | Trustee and/or Officer Since | | Principal Occupation(s) During Past 5 Years | | Number of Funds in Fund Complex
Overseen by Trustee | | Other Directorship(s) Held by Trustee During Past 5 Years |
| Independent Trustees–(continued) | | | | | | |
Joel W. Motley - 1952 Trustee | | 2019 | | Director of Office of Finance, Federal Home Loan Bank System; Managing Director of Carmona Motley Inc. (privately held financial advisor); Member of the Council on Foreign Relations and its Finance and Budget Committee; Chairman Emeritus of Board of Human Rights Watch and Member of its Investment Committee; and Member of Investment Committee Board of Historic Hudson Valley (non-profit cultural organization); Member of the Board, Blue Ocean Acquisition Corp.; and Member of the Vestry and the Investment Committee of Trinity Church Wall Street. Formerly: Managing Director of Public Capital Advisors, LLC (privately held financial advisor); Managing Director of Carmona Motley Hoffman, Inc. (privately held financial advisor); Trustee of certain Oppenheimer Funds; and Director of Columbia Equity Financial Corp. (privately held financial advisor) | | 189 | | Member of Board of Trust for Mutual Understanding (non-profit promoting the arts and environment); Member of Board of Greenwall Foundation (bioethics research foundation) and its Investment Committee; Member of Board of Friends of the LRC (non-profit legal advocacy); and Board Member and Investment Committee Member of Pulitzer Center for Crisis Reporting (non-profit journalism) |
Teresa M. Ressel - 1962 Trustee | | 2017 | | Non-executive director and trustee of a number of public and private business corporations Formerly: Chief Executive Officer, UBS Securities LLC (investment banking); Chief Operating Officer, UBS AG Americas (investment banking); Sr. Management Team Olayan America, The Olayan Group (international investor/commercial/industrial); Assistant Secretary for Management & Budget and Designated Chief Financial Officer, U.S. Department of Treasury and Director, ON Semiconductor Corporation (semiconductor manufacturing) | | 189 | | None |
Robert C. Troccoli - 1949 Trustee | | 2016 | | Retired Formerly: Adjunct Professor, University of Denver – Daniels College of Business; and Managing Partner, KPMG LLP | | 189 | | None |
Daniel S. Vandivort - 1954 Trustee | | 2019 | | President, Flyway Advisory Services LLC (consulting and property management) Formerly: President and Chief Investment Officer, previously Head of Fixed Income, Weiss Peck and Greer/Robeco Investment Management; Trustee and Chair, Weiss Peck and Greer Funds Board; and various capacities at CS First Boston including Head of Fixed Income at First Boston Asset Management. | | 189 | | Formerly: Trustee and Governance Chair, Oppenheimer Funds; Treasurer, Chairman of the Audit and Finance Committee, Huntington Disease Foundation of America |
| | |
| T-3 | | Invesco U.S. Managed Volatility Fund |
Trustees and Officers–(continued)
| | | | | | | | |
Name, Year of Birth and Position(s) Held with the Trust | | Trustee and/or Officer Since | | Principal Occupation(s) During Past 5 Years | | Number of Funds in Fund Complex
Overseen by Trustee | | Other Directorship(s) Held by Trustee During Past 5 Years |
| Officers | | | | | | |
Sheri Morris - 1964 President and Principal Executive Officer | | 1999 | | Director, Invesco Trust Company; Head of Global Fund Services, Invesco Ltd.; President and Principal Executive Officer, The Invesco Funds; Vice President, Invesco Exchange-Traded Fund Trust, Invesco Exchange-Traded Fund Trust II, Invesco India Exchange-Traded Fund Trust, Invesco Actively Managed Exchange-Traded Fund Trust, Invesco Actively Managed Exchange-Traded Commodity Fund Trust and Invesco Exchange-Traded Self-Indexed Fund Trust; and Vice President, OppenheimerFunds, Inc. Formerly: Vice President, Treasurer and Principal Financial Officer, The Invesco Funds; Vice President, Invesco AIM Advisers, Inc., Invesco AIM Capital Management, Inc. and Invesco AIM Private Asset Management, Inc.; Assistant Vice President and Assistant Treasurer, The Invesco Funds; Vice President and Assistant Vice President, Invesco Advisers, Inc.; Assistant Vice President, Invesco AIM Capital Management, Inc. and Invesco AIM Private Asset Management, Inc.; Treasurer, Invesco Exchange-Traded Fund Trust, Invesco Exchange-Traded Fund Trust II, Invesco India Exchange-Traded Fund Trust and Invesco Actively Managed Exchange-Traded Fund Trust; and Senior Vice President, Invesco Advisers, Inc. (formerly known as Invesco Institutional (N.A.), Inc.) (registered investment adviser) | | N/A | | N/A |
Jeffrey H. Kupor - 1968 Senior Vice President, Chief Legal Officer and Secretary | | 2018 | | Head of Legal of the Americas, Invesco Ltd.; Senior Vice President and Secretary, Invesco Advisers, Inc. (formerly known as Invesco Institutional (N.A.), Inc.) (registered investment adviser); Secretary, Invesco Distributors, Inc. (formerly known as Invesco AIM Distributors, Inc.); Vice President and Secretary, Invesco Investment Services, Inc. (formerly known as Invesco AIM Investment Services, Inc.); Senior Vice President, Chief Legal Officer and Secretary, The Invesco Funds; Secretary and General Counsel, Invesco Investment Advisers LLC (formerly known as Van Kampen Asset Management); Secretary and General Counsel, Invesco Capital Markets, Inc. (formerly known as Van Kampen Funds Inc.); Chief Legal Officer, Invesco Exchange-Traded Fund Trust, Invesco Exchange-Traded Fund Trust II, Invesco India Exchange-Traded Fund Trust, Invesco Actively Managed Exchange-Traded Fund Trust, Invesco Actively Managed Exchange-Traded Commodity Fund Trust and Invesco Exchange-Traded Self-Indexed Fund Trust;; Secretary and Vice President, Harbourview Asset Management Corporation; Secretary and Vice President, OppenheimerFunds, Inc. and Invesco Managed Accounts, LLC; Secretary and Senior Vice President, OFI Global Institutional, Inc.; Secretary and Vice President, OFI SteelPath, Inc.; Secretary and Vice President, Oppenheimer Acquisition Corp.; Secretary and Vice President, Shareholder Services, Inc.; and Secretary and Vice President, Trinity Investment Management Corporation Formerly: Senior Vice President, Invesco Distributors, Inc.; Secretary and Vice President, Jemstep, Inc.; Head of Legal, Worldwide Institutional, Invesco Ltd.; Secretary and General Counsel, INVESCO Private Capital Investments, Inc.; Senior Vice President, Secretary and General Counsel, Invesco Management Group, Inc. (formerly known as Invesco AIM Management Group, Inc.); Assistant Secretary, INVESCO Asset Management (Bermuda) Ltd.; Secretary and General Counsel, Invesco Private Capital, Inc.;Assistant Secretary and General Counsel, INVESCO Realty, Inc.; Secretary and General Counsel, Invesco Senior Secured Management, Inc.; Secretary, Sovereign G./P. Holdings Inc.; Secretary, Invesco Indexing LLC; and Secretary, W.L. Ross & Co., LLC | | N/A | | N/A |
Andrew R. Schlossberg - 1974 Senior Vice President | | 2019 | | Senior Vice President, Invesco Group Services, Inc.; Head of the Americas and Senior Managing Director, Invesco Ltd.; Director and Senior Vice President, Invesco Advisers, Inc. (formerly known as Invesco Institutional (N.A.), Inc.) (registered investment adviser); Director and Chairman, Invesco Investment Services, Inc. (formerly known as Invesco AIM Investment Services, Inc.) (registered transfer agent); Senior Vice President, The Invesco Funds; and Director, Invesco Investment Advisers LLC (formerly known as Van Kampen Asset Management) Formerly: Director, President and Chairman, Invesco Insurance Agency, Inc.; Director, Invesco UK Limited; Director and Chief Executive, Invesco Asset Management Limited and Invesco Fund Managers Limited; Assistant Vice President, The Invesco Funds; Senior Vice President, Invesco Advisers, Inc. (formerly known as Invesco Institutional (N.A.), Inc.) (registered investment adviser); Director and Chief Executive, Invesco Administration Services Limited and Invesco Global Investment Funds Limited; Director, Invesco Distributors, Inc.; Head of EMEA, Invesco Ltd.; President, Invesco Actively Managed Exchange-Traded Commodity Fund Trust, Invesco Actively Managed Exchange-Traded Fund Trust, Invesco Exchange-Traded Fund Trust, Invesco Exchange-Traded Fund Trust II and Invesco India Exchange-Traded Fund Trust; and Managing Director and Principal Executive Officer, Invesco Capital Management LLC | | N/A | | N/A |
| | |
| T-4 | | Invesco U.S. Managed Volatility Fund |
Trustees and Officers–(continued)
| | | | | | | | |
Name, Year of Birth and Position(s) Held with the Trust | | Trustee and/or Officer Since | | Principal Occupation(s) During Past 5 Years | | Number of Funds in Fund Complex
Overseen by Trustee | | Other Directorship(s) Held by Trustee During Past 5 Years |
| Officers–(continued) | | | | | | |
John M. Zerr - 1962 Senior Vice President | | 2006 | | Chief Operating Officer of the Americas; Senior Vice President, Invesco Advisers, Inc. (formerly known as Invesco Institutional (N.A.), Inc.) (registered investment adviser); Senior Vice President, Invesco Distributors, Inc. (formerly known as Invesco AIM Distributors, Inc.); Director and Vice President, Invesco Investment Services, Inc. (formerly known as Invesco AIM Investment Services, Inc.) Senior Vice President, The Invesco Funds; Managing Director, Invesco Capital Management LLC; Director, Invesco Investment Advisers LLC (formerly known as Van Kampen Asset Management); Senior Vice President, Invesco Capital Markets, Inc. (formerly known as Van Kampen Funds Inc.); Manager, Invesco Indexing LLC; Manager, Invesco Specialized Products, LLC; Member, Invesco Canada Funds Advisory Board; Director, President and Chief Executive Officer, Invesco Corporate Class Inc. (corporate mutual fund company); and Director, Chairman, President and Chief Executive Officer, Invesco Canada Ltd. (formerly known as Invesco Trimark Ltd./Invesco Trimark Ltèe) (registered investment adviser and registered transfer agent); President, Invesco, Inc.; President, Invesco Global Direct Real Estate Feeder GP Ltd.; President, Invesco IP Holdings (Canada) Ltd; President, Invesco Global Direct Real Estate GP Ltd.; President, Invesco Financial Services Ltd. / Services Financiers Invesco Ltée; and Director and Chairman, Invesco Trust Company Formerly: President, Trimark Investments Ltd/Services Financiers Invesco Ltee; Director and Senior Vice President, Invesco Insurance Agency, Inc.; Director and Senior Vice President, Invesco Management Group, Inc. (formerly known as Invesco AIM Management Group, Inc.); Secretary and General Counsel, Invesco Management Group, Inc. (formerly known as Invesco AIM Management Group, Inc.); Secretary, Invesco Investment Services, Inc. (formerly known as Invesco AIM Investment Services, Inc.); Chief Legal Officer and Secretary, The Invesco Funds; Secretary and General Counsel, Invesco Investment Advisers LLC (formerly known as Van Kampen Asset Management); Secretary and General Counsel, Invesco Capital Markets, Inc. (formerly known as Van Kampen Funds Inc.); Chief Legal Officer, Invesco Exchange-Traded Fund Trust, Invesco Exchange-Traded Fund Trust II, Invesco India Exchange-Traded Fund Trust, Invesco Actively Managed Exchange-Traded Fund Trust, Invesco Actively Managed Exchange-Traded Commodity Fund Trust and Invesco Exchange-Traded Self-Indexed Fund Trust; Secretary, Invesco Indexing LLC; Director, Secretary, General Counsel and Senior Vice President, Van Kampen Exchange Corp.; Director, Vice President and Secretary, IVZ Distributors, Inc. (formerly known as INVESCO Distributors, Inc.); Director and Vice President, INVESCO Funds Group, Inc.; Director and Vice President, Van Kampen Advisors Inc.; Director, Vice President, Secretary and General Counsel, Van Kampen Investor Services Inc.;Director and Secretary, Invesco Distributors, Inc. (formerly known as Invesco AIM Distributors, Inc.); Director, Senior Vice President, General Counsel and Secretary, Invesco AIM Advisers, Inc. and Van Kampen Investments Inc.; Director, Vice President and Secretary, Fund Management Company; Director, Senior Vice President, Secretary, General Counsel and Vice President, Invesco AIM Capital Management, Inc.; and Chief Operating Officer and General Counsel, Liberty Ridge Capital, Inc. (an investment adviser) | | N/A | | N/A |
Gregory G. McGreevey - 1962 Senior Vice President | | 2012 | | Senior Managing Director, Invesco Ltd.; Director, Chairman, President, and Chief Executive Officer, Invesco Advisers, Inc. (formerly known as Invesco Institutional (N.A.), Inc.) (registered investment adviser); Director, Invesco Mortgage Capital, Inc. and Invesco Senior Secured Management, Inc.; Senior Vice President, The Invesco Funds; President, SNW Asset Management Corporation and Invesco Managed Accounts, LLC; Chairman and Director, Invesco Private Capital, Inc.; Chairman and Director, INVESCO Private Capital Investments, Inc.; Chairman and Director, INVESCO Realty, Inc.; and Senior Vice President, Invesco Group Services, Inc. Formerly: Senior Vice President, Invesco Management Group, Inc. and Invesco Advisers, Inc.; Assistant Vice President, The Invesco Funds | | N/A | | N/A |
Adrien Deberghes - 1967 Principal Financial Officer, Treasurer and Vice President | | 2020 | | Head of the Fund Office of the CFO and Fund Administration; Vice President, Invesco Advisers, Inc.; Principal Financial Officer, Treasurer and Vice President, The Invesco Funds; Vice President, Invesco Exchange-Traded Fund Trust, Invesco Exchange-Traded Fund Trust II, Invesco India Exchange-Traded Fund Trust, Invesco Actively Managed Exchange-Traded Fund Trust, Invesco Actively Managed Exchange-Traded Commodity Fund Trust and Invesco Exchange-Traded Self-Indexed Fund Trust Formerly: Senior Vice President and Treasurer, Fidelity Investments | | N/A | | N/A |
Crissie M. Wisdom - 1969 Anti-Money Laundering Compliance Officer | | 2013 | | Anti-Money Laundering and OFAC Compliance Officer for Invesco U.S. entities including: Invesco Advisers, Inc. and its affiliates, Invesco Capital Markets, Inc., Invesco Distributors, Inc., Invesco Investment Services, Inc., The Invesco Funds, Invesco Capital Management, LLC, Invesco Trust Company; and Fraud Prevention Manager for Invesco Investment Services, Inc. | | N/A | | N/A |
| | |
| T-5 | | Invesco U.S. Managed Volatility Fund |
Trustees and Officers–(continued)
| | | | | | | | |
Name, Year of Birth and Position(s) Held with the Trust | | Trustee and/or Officer Since | | Principal Occupation(s) During Past 5 Years | | Number of Funds in Fund Complex
Overseen by Trustee | | Other Directorship(s) Held by Trustee During Past 5 Years |
| Officers–(continued) | | | | | | | | |
Todd F. Kuehl - 1969 Chief Compliance Officer and Senior Vice President | | 2020 | | Chief Compliance Officer, Invesco Advisers, Inc. (registered investment adviser); and Chief Compliance Officer and Senior Vice President, The Invesco Funds Formerly: Managing Director and Chief Compliance Officer, Legg Mason (Mutual Funds); Chief Compliance Officer, Legg Mason Private Portfolio Group (registered investment adviser) | | N/A | | N/A |
James Bordewick, Jr. - 1959 Senior Vice President and Senior Officer | | 2022 | | Senior Vice President and Senior Officer, The Invesco Funds; and Chief Legal Officer, KingsCrowd, Inc. (research and analytical platform for investment in private capital markets) Formerly, Chief Operating Officer and Head of Legal and Regulatory, Netcapital (private capital investment platform); Managing Director, General Counsel of asset management and Chief Compliance Officer for asset management and private banking, Bank of America Corporation; Chief Legal Officer, Columbia Funds and BofA Funds; Senior Vice President and Associate General Counsel, MFS Investment Management; Chief Legal Officer, MFS Funds; Associate, Ropes & Gray; Associate, Gaston Snow & Ely Bartlett | | N/A | | N/A |
The Statement of Additional Information of the Trust includes additional information about the Fund’s Trustees and is available upon request, without charge, by calling 1.800.959.4246. Please refer to the Fund’s Statement of Additional Information for information on the Fund’s sub-advisers.
| | | | | | |
| Office of the Fund | | Investment Adviser | | Distributor | | Auditors |
| 11 Greenway Plaza, Suite 1000 | | Invesco Advisers, Inc. | | Invesco Distributors, Inc. | | PricewaterhouseCoopers LLP |
| Houston, TX 77046-1173 | | 1555 Peachtree Street, N.E. | | 11 Greenway Plaza, Suite 1000 | | 1000 Louisiana Street, Suite 5800 |
| | Atlanta, GA 30309 | | Houston, TX 77046-1173 | | Houston, TX 77002-5021 |
| | | |
| Counsel to the Fund | | Counsel to the Independent Trustees | | Transfer Agent | | Custodian |
| Stradley Ronon Stevens & Young, LLP | | Goodwin Procter LLP | | Invesco Investment Services, Inc. | | State Street Bank and Trust Company |
| 2005 Market Street, Suite 2600 | | 901 New York Avenue, N.W. | | 11 Greenway Plaza, Suite 1000 | | 225 Franklin Street |
| Philadelphia, PA 19103-7018 | | Washington, D.C. 20001 | | Houston, TX 77046-1173 | | Boston, MA 02110-2801 |
| | |
| T-6 | | Invesco U.S. Managed Volatility Fund |

Go paperless with eDelivery
Visit invesco.com/edelivery to enjoy the convenience and security of anytime electronic access to your investment documents.
With eDelivery, you can elect to have any or all of the following materials delivered straight to your inbox to download, save and print from your own computer:
∎ Fund reports and prospectuses
∎ Quarterly statements
∎ Daily confirmations
∎ Tax forms
Invesco mailing information
Send general correspondence to Invesco Investment Services, Inc., P.O. Box 219078, Kansas City, MO 64121-9078.
Important notice regarding delivery of security holder documents
To reduce Fund expenses, only one copy of most shareholder documents may be mailed to shareholders with multiple accounts at the same address (Householding). Mailing of your shareholder documents may be householded indefinitely unless you instruct us otherwise. If you do not want the mailing of these documents to be combined with those for other members of your household, please contact Invesco Investment Services, Inc. at 800 959 4246 or contact your financial institution. We will begin sending you individual copies for each account within 30 days after receiving your request.
Fund holdings and proxy voting information
The Fund provides a complete list of its portfolio holdings four times each year, at the end of each fiscal quarter. For the second and fourth quarters, the list appears, respectively, in the Fund’s semiannual and annual reports to shareholders. For the first and third quarters, the Fund files the list with the Securities and Exchange Commission (SEC) as an exhibit to its reports on Form N-PORT. The most recent list of portfolio holdings is available at invesco.com/completeqtrholdings. Shareholders can also look up the Fund’s Form N-PORT filings on the SEC website, sec.gov. The SEC file numbers for the Fund are shown below.
A description of the policies and procedures that the Fund uses to determine how to vote proxies relating to portfolio securities is available without charge, upon request, from our Client Services department at 800 959 4246, or at invesco.com/corporate/about-us/esg. The information is also available on the SEC website, sec.gov.
Information regarding how the Fund voted proxies related to its portfolio securities during the most recent 12-month period ended June 30 is available at invesco.com/proxysearch. This information is also available on the SEC website, sec.gov.
Invesco Advisers, Inc. is an investment adviser; it provides investment advisory services to individual and institutional clients and does not sell securities. Invesco Distributors, Inc. is the US distributor for Invesco Ltd.’s retail mutual funds, exchange-traded funds and institutional money market funds. Both are wholly owned, indirect subsidiaries of Invesco Ltd.
| | | | |
| SEC file number(s): 811-05426 and 033-19338 | | Invesco Distributors, Inc. | | USMGV-AR-1 |

| | |
| | |
| Annual Report to Shareholders | | October 31, 2022 |
Invesco World Bond Factor Fund
Nasdaq:
A: AUBAX ∎ C: AUBCX ∎ Y: AUBYX ∎ R5: AUBIX ∎ R6: AUBFX
Management’s Discussion of Fund Performance
| | | | |
| |
Performance summary | |
For the fiscal year ended October 31, 2022, Class A shares of Invesco World Bond Factor Fund (the Fund), at net asset value (NAV), underperformed the Bloomberg Global Aggregate Index, the Fund’s broad market/style-specific benchmark. | |
Your Fund’s long-term performance appears later in this report. | |
| |
Fund vs. Indexes | |
Total returns, 10/31/21 to 10/31/22, at net asset value (NAV). Performance shown does not include applicable contingent deferred sales charges (CDSC) or front-end sales charges, which would have reduced performance. | |
Class A Shares | | | -21.52 | % |
Class C Shares | | | -22.09 | |
Class Y Shares | | | -21.35 | |
Class R5 Shares | | | -21.31 | |
Class R6 Shares | | | -21.32 | |
Bloomberg Global Aggregate Index▼ (Broad Market/Style-Specific Index) | | | -20.79 | |
Lipper Global Income Funds Index∎ (Peer Group Index) | | | -15.29 | |
| |
Source(s): ▼RIMES Technologies Corp.; ∎Lipper Inc. | | | | |
Market conditions and your Fund
In the fourth quarter of 2021, concerns about inflation heightened as US inflation rose 7%,1 its highest level in nearly 40 years. Though the US Federal Reserve (the Fed) left policy rates unchanged during the quarter, the Fed indicated its accommodative policies were coming to an end in 2022 through a willingness to raise interest rates to combat inflation and the announced reduction of its monthly bond purchase program. Additionally, US interest rate moves and inflation risk significantly affected fixed income valuations during the quarter. The two-year Treasury yield rose moderately from 0.27% to 0.73%, while the 10-year increased slightly from
1.48% to 1.52% during the quarter.2 The yield curve, as measured by the yield differential between two- and 10-year Treasuries, flattened during the quarter.
At the beginning of 2022, geopolitical and economic tensions between Ukraine and Russia culminated with the latter invading Ukrainian territory. World leaders levied sanctions against Russia that had material effects on its fixed income markets, particularly sovereign debt and corporates, and levels of liquidity. The Russia-Ukraine war exacerbated inflationary pressures while also exerting downward pressure on economic growth through a surge in commodity/energy prices. Additionally, surges of COVID-19 in China exacerbated supply chain issues and aggravated inflation. During the second quarter of 2022, the two-year Treasury yield rose significantly from 0.78% to 2.28%, while the 10-year increased slightly from 1.63% to 2.32%.2
In the second quarter of 2022, the macro backdrop of tightening financial conditions and slowing economic growth was negative for credit asset classes. Inflation, as measured by the Consumer Price Index, increased further to 9.1% and fixed income markets experienced significant negative performance as all bond sectors felt the impact of rising
interest rates with negative performance ranging from -0.9% (Bloomberg Asset-Backed Securities) to -9.8% (Bloomberg US Corporate High Yield).3 Credit spreads increased across all major credit-sensitive sectors, reflecting anticipation of an economic slowdown and increasing concerns about recession risk, with corporate spreads ending the second quarter above their long-term historical average. The Fed continued its rapid tightening of monetary policy in an effort to combat inflation via higher interest rates while simultaneously engineering a soft landing so as to not push the economy into a recession. The Fed aggressively raised its key Fed funds rate during the fiscal year, including a 0.50% hike in May, and three 0.75% hikes in June, July and November, the largest hikes since 1994, to a target Fed funds rate of 3.75-4.00%, the highest since 2008.4 At their November 2022 meeting, the Fed signaled that its hawkish policies would continue, though a slowing of the pace of rate increases was likely. While rates remained elevated across all maturities on the yield curve, the two-year Treasury rates increased from 2.92% to 4.51% during the fiscal year, while 10-year Treasury rates increased from 2.98% to 4.10%.2 At the end of the fiscal year, the yield curve remained inverted, which historically has been an indicator of a potential recession.
The Invesco World Bond Factor Fund changed strategies on February 28, 2020 to utilize a systematic, quantitative, factor-based approach to investing. The Fund generated positive returns since the strategy change and Class A shares at NAV outperformed the Bloomberg Global Aggregate Index (un-hedged).
The Fund attempts to meet its investment objective by overweighting the higher yielding component of the fixed-income market (corporate bonds). Within corporates, the investment team targets bonds from the Bloomberg Global Aggregate Corporate Bond Index
that it believes tend to have higher returns than other fixed-income securities with comparable characteristics over a market cycle. These bonds have the following positive factor characteristics:
∎ High carry bonds are the highest spread bonds in a universe.
∎ Value bonds are those with the highest spread relative to other securities with similar credit rating and sector.
∎ Low volatility bonds are those with lower duration and higher credit quality in a universe.
Since the strategy change, value and low volatility bonds outperformed the Bloomberg Global Aggregate Index. Overall, bonds with attractive factor characteristics positively impacted the Fund’s relative performance. During the year ended on October 2022, the Fund slightly underperformed the index, due to the overweight positions in high carry and to a lesser degree value bonds. The Fund’s overweight to low volatility bonds did help offset some of the losses, as these bonds tend to outperform in a risk off environment.
Please note that we implemented our strategy using derivative instruments, including futures, forwards and swaps. Therefore, a portion of the performance of the strategy, both positive and negative, can be attributed to these instruments. Derivatives can be a cost-effective way to gain or hedge exposure to certain risks. However, derivatives may amplify traditional investment risks through the creation of leverage and may be less liquid than traditional securities.
Part of the Fund’s strategy to manage credit and currency risk in the portfolio during the fiscal year entailed purchasing and selling credit and currency derivatives. We sought to manage credit market risk by purchasing and selling protection through credit default swaps at various points throughout the fiscal year. The currency management was carried out via currency forwards and options on an as-needed basis and we believe this strategy was effective in managing the currency positioning within the Fund. The investment team does not attempt to time the credit market, interest rates, sectors or factors and therefore maintains its allocations. Over time, we believe this has the potential to deliver positive relative performance over a market cycle.
We wish to remind you that the Fund is subject to interest rate risk, meaning when interest rates rise, the value of fixed-income securities tends to fall. The risk may be greater in the current market environment because interest rates are near historic lows. The degree to which the value of fixed-income securities may decline due to rising interest rates may vary depending on the speed and magnitude of the increase in interest rates, as well as individual security characteristics such as price, maturity, duration and coupon and market forces such as supply and demand for similar securities. We monitor interest rates
| | |
| 2 | | Invesco World Bond Factor Fund |
and the market, economic and geopolitical factors that may impact the direction, speed and magnitude of changes to interest rates across the maturity spectrum, including the potential impact of monetary policy changes by the Fed and certain foreign central banks. If interest rates rise or fall faster than expected, markets may experience increased volatility, which may affect the value and/or liquidity of certain investments held by the Fund.
Thank you for investing in Invesco World Bond Factor Fund and for sharing our long-term investment horizon.
1 Source: US Bureau of Labor Statistics
2 Source: US Dept of the Treasury
3 Source: Bloomberg
4 Source: Federal Reserve of Economic Data
Portfolio manager(s):
Noelle Corum
James Ong
Jay Raol
The views and opinions expressed in management’s discussion of Fund performance are those of Invesco Advisers, Inc. and its affiliates. These views and opinions are subject to change at any time based on factors such as market and economic conditions. These views and opinions may not be relied upon as investment advice or recommendations, or as an offer for a particular security. The information is not a complete analysis of every aspect of any market, country, industry, security or the Fund. Statements of fact are from sources considered reliable, but Invesco Advisers, Inc. makes no representation or warranty as to their completeness or accuracy. Although historical performance is no guarantee of future results, these insights may help you understand our investment management philosophy.
See important Fund and, if applicable, index disclosures later in this report.
| | |
| 3 | | Invesco World Bond Factor Fund |
Your Fund’s Long-Term Performance
Results of a $10,000 Investment – Oldest Share Class(es)
Fund and index data from 10/31/12
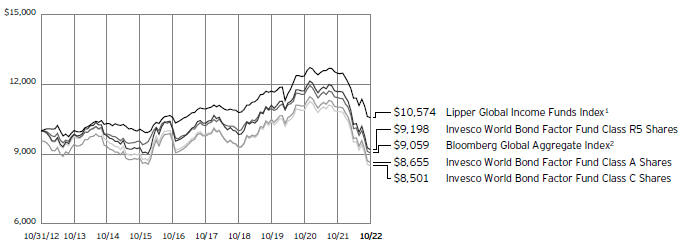
1 Source: Lipper Inc.
2 Source: RIMES Technologies Corp.
Past performance cannot guarantee future results.
The data shown in the chart include reinvested distributions, applicable sales charges and Fund expenses including management
fees. Index results include reinvested dividends, but they do not reflect sales charges. Performance of the peer group, if applicable, reflects fund expenses and management fees;
performance of a market index does not. Performance shown in the chart does not reflect deduction of taxes a shareholder would pay on Fund distributions or sale of Fund shares.
| | |
| 4 | | Invesco World Bond Factor Fund |
| | | | |
| |
Average Annual Total Returns | |
As of 10/31/22, including maximum applicable sales charges | |
| |
Class A Shares | | | | |
Inception (3/31/06) | | | 1.45 | % |
10 Years | | | -1.43 | |
5 Years | | | -3.26 | |
1 Year | | | -24.89 | |
| |
Class C Shares | | | | |
Inception (3/31/06) | | | 1.33 | % |
10 Years | | | -1.61 | |
5 Years | | | -3.15 | |
1 Year | | | -22.86 | |
| |
Class Y Shares | | | | |
Inception (10/3/08) | | | 1.25 | % |
10 Years | | | -0.77 | |
5 Years | | | -2.18 | |
1 Year | | | -21.35 | |
Class R5 Shares | | | | |
Inception (3/31/06) | | | 1.92 | % |
10 Years | | | -0.83 | |
5 Years | | | -2.30 | |
1 Year | | | -21.31 | |
| |
Class R6 Shares | | | | |
Inception (9/24/12) | | | -0.78 | % |
10 Years | | | -0.76 | |
5 Years | | | -2.18 | |
1 Year | | | -21.32 | |
The performance data quoted represent past performance and cannot guarantee future results; current performance may be lower or higher. Please visit invesco.com/performance for the most recent month-end performance. Performance figures reflect reinvested distributions, changes in net asset value and the effect of the maximum sales charge unless otherwise stated. Performance figures do not reflect deduction of taxes a shareholder would pay on Fund distributions or sale of Fund shares. Investment return and principal value will fluctuate so that you may have a gain or loss when you sell shares.
Class A share performance reflects the maximum 4.25% sales charge, and Class C share performance reflects the applicable contingent deferred sales charge (CDSC) for the period involved. The CDSC on Class C shares is 1% for the first year after purchase. Class Y, Class R5 and Class R6 shares do not have a front-end sales charge or a CDSC; therefore, performance is at net asset value.
The performance of the Fund’s share classes will differ primarily due to different sales charge structures and class expenses.
Fund performance reflects any applicable fee waivers and/or expense reimbursements. Had the adviser not waived fees and/or reimbursed expenses currently or in the past, returns would have been lower. See current prospectus for more information.
| | |
| 5 | | Invesco World Bond Factor Fund |
Supplemental Information
Invesco World Bond Factor Fund’s investment objective is total return.
| ∎ | Unless otherwise stated, information presented in this report is as of October 31, 2022, and is based on total net assets. |
| ∎ | Unless otherwise noted, all data is provided by Invesco. |
| ∎ | To access your Fund’s reports/prospectus, visit invesco.com/fundreports. |
About indexes used in this report
| ∎ | The Bloomberg Global Aggregate Index is an unmanaged index considered representative of global investment-grade, fixed-income markets. |
| ∎ | The Lipper Global Income Funds Index is an unmanaged index considered representative of global income funds tracked by Lipper. |
| ∎ | The Fund is not managed to track the performance of any particular index, including the index(es) described here, and consequently, the performance of the Fund may deviate significantly from the performance of the index(es). |
| ∎ | A direct investment cannot be made in an index. Unless otherwise indicated, index results include reinvested dividends, and they do not reflect sales charges. Performance of the peer group, if applicable, reflects fund expenses; performance of a market index does not. |
|
|
This report must be accompanied or preceded by a currently effective Fund prospectus, which contains more complete information, including sales charges and expenses. Investors should read it carefully before investing. |
|
| NOT FDIC INSURED | MAY LOSE VALUE | NO BANK GUARANTEE |
| | |
| 6 | | Invesco World Bond Factor Fund |
Fund Information
Portfolio Composition
| | | | | |
| By sector | | % of total net assets |
| |
Sovereign Debt | | | | 34.99 | % |
| |
Financials | | | | 15.11 | |
| |
U.S. Treasury Securities | | | | 13.09 | |
| |
Collateralized Mortgage Obligations | | | | 11.33 | |
| |
Consumer Discretionary | | | | 3.81 | |
| |
Consumer Staples | | | | 3.17 | |
| |
Utilities | | | | 3.07 | |
| |
Communication Services | | | | 2.92 | |
| |
Industrials | | | | 2.87 | |
| |
Information Technology | | | | 2.46 | |
| |
Energy | | | | 2.46 | |
| |
Real Estate | | | | 2.43 | |
| |
Health Care | | | | 2.35 | |
| |
Other Sectors, Each Less than 2% of Net Assets | | | | 2.74 | |
| |
Money Market Funds Plus Other Assets Less Liabilities | | | | (2.80 | ) |
Top Five Debt Issuers*
| | | | | | | |
| | | | | % of total net assets |
| | |
| 1. | | U.S. Treasury | | | | 13.09 | % |
| | |
| 2. | | Japan Government Bond | | | | 8.29 | |
| | |
| 3. | | Federal National Mortgage Association | | | | 7.46 | |
| | |
| 4. | | Swiss Confederation Government Bond | | | | 6.10 | |
| | |
5. | | Norway Government Bond | | | | 4.17 | |
The Fund’s holdings are subject to change, and there is no assurance that the Fund will continue to hold any particular security.
| * | Excluding money market fund holdings, if any. |
Data presented here are as of October 31, 2022.
| | |
| 7 | | Invesco World Bond Factor Fund |
Schedule of Investments
October 31, 2022
| | | | | | | | | | | | |
| | | Principal
Amount | | | Value | |
|
| |
Non-U.S. Dollar Denominated Bonds & Notes–51.35%(a) | |
Australia–1.56% | | | | | | | | | | | | |
Australia Government Bond, | | | | | | | | | | | | |
Series 148, 2.75%,
11/21/2027(b) | | | AUD | | | | 60,000 | | | $ | 37,143 | |
|
| |
Series 157, 1.50%,
06/21/2031(b) | | | AUD | | | | 181,000 | | | | 96,985 | |
|
| |
Series 162, 1.75%,
06/21/2051(b) | | | AUD | | | | 34,000 | | | | 13,262 | |
|
| |
BHP Billiton Finance Ltd.,
Series 13, 3.13%,
04/29/2033(b) | | | EUR | | | | 100,000 | | | | 88,905 | |
|
| |
Glencore Capital Finance DAC,
0.75%, 03/01/2029(b) | | | EUR | | | | 100,000 | | | | 74,515 | |
|
| |
Macquarie Group Ltd.,
0.95%, 05/21/2031(b) | | | EUR | | | | 100,000 | | | | 71,471 | |
|
| |
Scentre Group Trust 1/Scentre Group Trust 2, 1.75%,
04/11/2028(b) | | | EUR | | | | 100,000 | | | | 83,417 | |
|
| |
| | | | | | | | | | | 465,698 | |
|
| |
| | | |
Austria–0.12% | | | | | | | | | | | | |
OMV AG, 1.00%, 07/03/2034(b) | | | EUR | | | | 50,000 | | | | 35,052 | |
|
| |
| | | |
Belgium–0.22% | | | | | | | | | | | | |
Anheuser-Busch InBev S.A./N.V., 2.88%, 09/25/2024(b) | | | EUR | | | | 65,000 | | | | 64,185 | |
|
| |
| | | |
Canada–1.41% | | | | | | | | | | | | |
Canadian Government Bond, | | | | | | | | | | | | |
2.75%, 09/01/2027 | | | CAD | | | | 283,000 | | | | 201,494 | |
|
| |
2.00%, 12/01/2051 | | | CAD | | | | 227,000 | | | | 125,931 | |
|
| |
Canadian Imperial Bank of Commerce, 0.38%, 05/03/2024(b) | | | EUR | | | | 100,000 | | | | 94,268 | |
|
| |
| | | | | | | | | | | 421,693 | |
|
| |
| | | |
France–6.52% | | | | | | | | | | | | |
Banque Federative du Credit Mutuel S.A., 3.00%,
05/21/2024(b) | | | EUR | | | | 100,000 | | | | 97,877 | |
|
| |
BNP Paribas S.A., | | | | | | | | | | | | |
2.75%, 07/25/2028(b)(c) | | | EUR | | | | 100,000 | | | | 90,786 | |
|
| |
1.13%, 01/15/2032(b)(c) | | | EUR | | | | 100,000 | | | | 82,004 | |
|
| |
BPCE S.A., 1.00%,
01/14/2032(b) | | | EUR | | | | 100,000 | | | | 72,557 | |
|
| |
Caisse Nationale de Reassurance Mutuelle Agricole Groupama,
6.38%(b)(c)(d) | | | EUR | | | | 100,000 | | | | 100,269 | |
|
| |
Credit Agricole S.A.,
1.00%, 07/03/2029(b) | | | EUR | | | | 100,000 | | | | 83,036 | |
|
| |
Danone S.A.,
1.25%, 05/30/2024(b) | | | EUR | | | | 100,000 | | | | 96,311 | |
|
| |
Dassault Systemes SE,
0.13%, 09/16/2026(b) | | | EUR | | | | 100,000 | | | | 88,319 | |
|
| |
French Republic Government Bond OAT, 0.01%,
11/25/2030(b) | | | EUR | | | | 1,000,000 | | | | 811,991 | |
|
| |
Holding d’Infrastructures de Transport S.A.S.U., 1.63%,
09/18/2029(b) | | | EUR | | | | 100,000 | | | | 79,831 | |
|
| |
| | | | | | | | | | | | |
| | | Principal
Amount | | | Value | |
|
| |
France–(continued) | | | | | | | | | | | | |
Imerys S.A., 1.00%,
07/15/2031(b) | | | EUR | | | | 100,000 | | | $ | 61,675 | |
|
| |
La Mondiale SAM,
5.05%(b)(c)(d) | | | EUR | | | | 100,000 | | | | 95,719 | |
|
| |
Mercialys S.A., 4.63%,
07/07/2027(b) | | | EUR | | | | 100,000 | | | | 87,991 | |
|
| |
Societe Generale S.A., 1.25%, 02/15/2024(b) | | | EUR | | | | 100,000 | | | | 95,775 | |
|
| |
| | | | | | | | | | | 1,944,141 | |
|
| |
| | | |
Germany–9.37% | | | | | | | | | | | | |
Bayer AG, 3.13%, 11/12/2079(b)(c) | | | EUR | | | | 100,000 | | | | 82,829 | |
|
| |
BMW Finance N.V., 0.75%, 07/12/2024(b) | | | EUR | | | | 50,000 | | | | 47,772 | |
|
| |
Bundesobligation, Series 183, 0.01%, 04/10/2026(b) | | | EUR | | | | 1,031,785 | | | | 955,565 | |
|
| |
Bundesrepublik Deutschland Bundesanleihe, | | | | | | | | | | | | |
0.01%, 08/15/2030(b) | | | EUR | | | | 568,193 | | | | 479,512 | |
|
| |
0.01%, 08/15/2050(b) | | | EUR | | | | 249,697 | | | | 136,339 | |
|
| |
Commerzbank AG, 0.63%, 08/28/2024(b) | | | EUR | | | | 70,000 | | | | 65,640 | |
|
| |
Deutsche Telekom International Finance B.V., | | | | | | | | | | | | |
2.75%, 10/24/2024(b) | | | EUR | | | | 50,000 | | | | 49,451 | |
|
| |
0.63%, 12/13/2024(b) | | | EUR | | | | 80,000 | | | | 75,689 | |
|
| |
E.ON SE, 0.88%, 05/22/2024(b) | | | EUR | | | | 75,000 | | | | 71,436 | |
|
| |
Fresenius SE & Co. KGaA, Series 10, 2.88%, 02/15/2029(b) | | | EUR | | | | 35,000 | | | | 31,263 | |
|
| |
Grenke Finance PLC, 1.50%, 10/05/2023(b) | | | EUR | | | | 60,000 | | | | 57,801 | |
|
| |
Hella GmbH & Co. KGaA, 1.00%, 05/17/2024 | | | EUR | | | | 50,000 | | | | 47,307 | |
|
| |
HOCHTIEF AG, 0.63%, 04/26/2029(b) | | | EUR | | | | 50,000 | | | | 34,746 | |
|
| |
LANXESS AG, 0.01%, 09/08/2027(b) | | | EUR | | | | 37,000 | | | | 29,716 | |
|
| |
Mercedes-Benz International Finance B.V., | | | | | | | | | | | | |
0.25%, 11/06/2023(b) | | | EUR | | | | 101,000 | | | | 97,387 | |
|
| |
0.01%, 02/08/2024(b) | | | EUR | | | | 38,000 | | | | 36,256 | |
|
| |
Merck Financial Services GmbH, 0.13%, 07/16/2025(b) | | | EUR | | | | 100,000 | | | | 91,922 | |
|
| |
Roadster Finance DAC, 2.38%, 12/08/2027(b) | | | EUR | | | | 100,000 | | | | 84,270 | |
|
| |
Volkswagen Bank GmbH, 1.25%, 06/10/2024(b) | | | EUR | | | | 100,000 | | | | 95,286 | |
|
| |
Volkswagen Financial Services AG, 1.50%, 10/01/2024(b) | | | EUR | | | | 60,000 | | | | 57,061 | |
|
| |
Vonovia Finance B.V., 1.25%, 12/06/2024(b) | | | EUR | | | | 100,000 | | | | 92,547 | |
|
| |
Wintershall Dea Finance B.V., 1.82%, 09/25/2031(b) | | | EUR | | | | 100,000 | | | | 73,854 | |
|
| |
| | | | | | | | | | | 2,793,649 | |
|
| |
| | | |
Indonesia–0.54% | | | | | | | | | | | | |
Indonesia Treasury Bond, Series FR81, 6.50%, 06/15/2025 | | | IDR | | | | 2,546,000,000 | | | | 161,617 | |
|
| |
See accompanying Notes to Financial Statements which are an integral part of the financial statements.
| | |
| 8 | | Invesco World Bond Factor Fund |
| | | | | | | | | | | | |
| | | Principal
Amount | | | Value | |
|
| |
Italy–0.60% | | | | | | | | | | | | |
2i Rete Gas S.p.A., 1.61%, 10/31/2027(b) | | | EUR | | | | 100,000 | | | $ | 85,153 | |
|
| |
Enel Finance International N.V., 1.00%, 09/16/2024(b) | | | EUR | | | | 100,000 | | | | 94,665 | |
|
| |
| | | | | | | | | | | 179,818 | |
|
| |
| | | |
Japan–8.59% | | | | | | | | | | | | |
Japan Government Bond, | | | | | | | | | | | | |
Series 146, 0.10%, 12/20/2025 | | | JPY | | | | 177,550,000 | | | | 1,199,425 | |
|
| |
Series 361, 0.10%, 12/20/2030 | | | JPY | | | | 110,400,000 | | | | 734,084 | |
|
| |
Series 69, 0.70%, 12/20/2050 | | | JPY | | | | 94,500,000 | | | | 536,972 | |
|
| |
Nissan Motor Co. Ltd., 2.65%, 03/17/2026(b) | | | EUR | | | | 100,000 | | | | 90,058 | |
|
| |
| | | | | | | | | | | 2,560,539 | |
|
| |
| | | |
Luxembourg–0.23% | | | | | | | | | | | | |
AXA Logistics Europe Master S.C.A., 0.88%, 11/15/2029(b) | | | EUR | | | | 100,000 | | | | 68,190 | |
|
| |
| | | |
Malaysia–0.14% | | | | | | | | | | | | |
Malaysia Government Bond, Series 120, 4.07%, 06/15/2050 | | | MYR | | | | 222,000 | | | | 40,669 | |
|
| |
| | | |
Mexico–1.24% | | | | | | | | | | | | |
America Movil S.A.B. de C.V., 0.75%, 06/26/2027 | | | EUR | | | | 100,000 | | | | 86,939 | |
|
| |
Mexican Bonos, Series M 20, 10.00%, 12/05/2024 | | | MXN | | | | 5,600,000 | | | | 281,455 | |
|
| |
| | | | | | | | | | | 368,394 | |
|
| |
| | | |
Netherlands–0.15% | | | | | | | | | | | | |
Heineken N.V., 3.50%, 03/19/2024(b) | | | EUR | | | | 45,000 | | | | 44,728 | |
|
| |
| | | |
New Zealand–1.62% | | | | | | | | | | | | |
New Zealand Government Bond, | | | | | | | | | | | | |
Series 0526, 0.50%, 05/15/2026 | | | NZD | | | | 736,000 | | | | 375,239 | |
|
| |
Series 0532, 2.00%, 05/15/2032 | | | NZD | | | | 224,000 | | | | 108,244 | |
|
| |
| | | | | | | | | | | 483,483 | |
|
| |
| | | |
Norway–4.17% | | | | | | | | | | | | |
Norway Government Bond, | | | | | | | | | | | | |
Series 477, 1.75%, 03/13/2025(b) | | | NOK | | | | 3,722,000 | | | | 343,795 | |
|
| |
Series 479, 1.75%, 02/17/2027(b) | | | NOK | | | | 6,574,000 | | | | 588,321 | |
|
| |
Series 484, 2.13%, 05/18/2032(b) | | | NOK | | | | 3,621,000 | | | | 309,646 | |
|
| |
| | | | | | | | | | | 1,241,762 | |
|
| |
| | | |
Poland–0.48% | | | | | | | | | | | | |
Republic of Poland Government Bond, Series 725, 3.25%, 07/25/2025 | | | PLN | | | | 775,000 | | | | 141,645 | |
|
| |
| | | | | | | | | | | | |
| | | Principal
Amount | | | Value | |
|
| |
South Korea–0.80% | | | | | | | | | | | | |
Korea Treasury Bond, | | | | | | | | | | | | |
Series 2512, 2.25%, 12/10/2025 | | | KRW | | | | 176,130,000 | | | $ | 116,710 | |
|
| |
Series 3012, 1.50%, 12/10/2030 | | | KRW | | | | 112,340,000 | | | | 64,457 | |
|
| |
Series 5003, 1.50%, 03/10/2050 | | | KRW | | | | 140,830,000 | | | | 57,010 | |
|
| |
| | | | | | | | | | | 238,177 | |
|
| |
| | | |
Spain–0.63% | | | | | | | | | | | | |
Banco Bilbao Vizcaya Argentaria S.A.,
0.38%, 10/02/2024(b) | | | EUR | | | | 100,000 | | | | 93,382 | |
|
| |
Banco Santander S.A., 3.25%, 04/04/2026(b) | | | EUR | | | | 100,000 | | | | 94,857 | |
|
| |
| | | | | | | | | | | 188,239 | |
|
| |
| | | |
Sweden–2.18% | | | | | | | | | | | | |
Balder Finland OYJ, 1.00%, 01/20/2029(b) | | | EUR | | | | 100,000 | | | | 59,569 | |
|
| |
Swedbank AB, 0.75%, 05/05/2025(b) | | | EUR | | | | 100,000 | | | | 92,598 | |
|
| |
Sweden Government Bond, | | | | | | | | | | | | |
Series 1056, 2.25%, 06/01/2032(b) | | | SEK | | | | 3,300,000 | | | | 300,808 | |
|
| |
Series 1057, 1.50%, 11/13/2023(b) | | | SEK | | | | 1,645,000 | | | | 147,830 | |
|
| |
Telia Co. AB, 3.88%, 10/01/2025(b) | | | EUR | | | | 50,000 | | | | 50,179 | |
|
| |
| | | | | | | | | | | 650,984 | |
|
| |
| | | |
Switzerland–6.68% | | | | | | | | | | | | |
Cloverie PLC for Zurich Insurance Co. Ltd., 1.50%, 12/15/2028(b) | | | EUR | | | | 100,000 | | | | 86,752 | |
|
| |
Credit Suisse AG, 0.25%, 01/05/2026(b) | | | EUR | | | | 100,000 | | | | 86,133 | |
|
| |
Swiss Confederation Government Bond, | | | | | | | | | |
1.25%, 06/11/2024(b) | | | CHF | | | | 152,000 | | | | 153,706 | |
|
| |
3.25%, 06/27/2027(b) | | | CHF | | | | 948,000 | | | | 1,052,073 | |
|
| |
2.25%, 06/22/2031(b) | | | CHF | | | | 369,000 | | | | 402,963 | |
|
| |
0.50%, 06/27/2032(b) | | | CHF | | | | 199,000 | | | | 187,736 | |
|
| |
4.00%, 01/06/2049(b) | | | CHF | | | | 14,000 | | | | 23,223 | |
|
| |
| | | | | | | | | | | 1,992,586 | |
|
| |
| | | |
Thailand–0.11% | | | | | | | | | | | | |
Thailand Government Bond, 1.88%, 06/17/2049 | | | THB | | | | 1,949,000 | | | | 32,234 | |
|
| |
| | | |
United Kingdom–2.51% | | | | | | | | | | | | |
B.A.T. International Finance PLC, 2.25%, 01/16/2030(b) | | | EUR | | | | 100,000 | | | | 76,778 | |
|
| |
BP Capital Markets PLC, 0.90%, 07/03/2024(b) | | | EUR | | | | 100,000 | | | | 95,093 | |
|
| |
CNH Industrial Finance Europe S.A., 1.63%, 07/03/2029(b) | | | EUR | | | | 100,000 | | | | 84,066 | |
|
| |
Global Switch Holdings Ltd., 2.25%, 05/31/2027(b) | | | EUR | | | | 100,000 | | | | 89,388 | |
|
| |
Lloyds Banking Group PLC, 0.50%, 11/12/2025(b)(c) | | | EUR | | | | 100,000 | | | | 91,581 | |
|
| |
NatWest Markets PLC, 1.00%, 05/28/2024(b) | | | EUR | | | | 100,000 | | | | 94,660 | |
|
| |
United Kingdom Gilt, 0.63%, 10/22/2050(b) | | | GBP | | | | 392,442 | | | | 215,796 | |
|
| |
| | | | | | | | | | | 747,362 | |
|
| |
See accompanying Notes to Financial Statements which are an integral part of the financial statements.
| | |
| 9 | | Invesco World Bond Factor Fund |
| | | | | | | | | | | | |
| | | Principal
Amount | | | Value | |
|
| |
United States–1.48% | | | | | | | | | | | | |
Abbott Ireland Financing DAC, 0.88%, 09/27/2023(b) | | | EUR | | | | 100,000 | | | $ | 97,322 | |
|
| |
AGCO International Holdings B.V., 0.80%, 10/06/2028(b) | | | EUR | | | | 100,000 | | | | 76,048 | |
|
| |
Altria Group, Inc., 3.13%, 06/15/2031 | | | EUR | | | | 100,000 | | | | 81,138 | |
|
| |
Goldman Sachs Group, Inc. (The), | | | | | | | | | | | | |
0.13%, 08/19/2024(b) | | | EUR | | | | 60,000 | | | | 55,792 | |
|
| |
0.25%, 01/26/2028(b) | | | EUR | | | | 47,000 | | | | 37,721 | |
|
| |
Wells Fargo & Co., 0.50%, 04/26/2024(b) | | | EUR | | | | 100,000 | | | | 94,419 | |
|
| |
| | | | | | | | | | | 442,440 | |
|
| |
Total Non-U.S. Dollar Denominated Bonds & Notes
(Cost $19,794,806) | | | | 15,307,285 | |
|
| |
|
U.S. Dollar Denominated Bonds & Notes–25.80% | |
Australia–0.31% | | | | | | | | | | | | |
Westpac Banking Corp., | | | | | | | | | | | | |
2.35%, 02/19/2025 | | | $ | | | | 65,000 | | | | 61,156 | |
|
| |
3.35%, 03/08/2027 | | | | | | | 35,000 | | | | 32,418 | |
|
| |
| | | | | | | | | | | 93,574 | |
|
| |
| | | |
Brazil–0.07% | | | | | | | | | | | | |
Suzano Austria GmbH, 3.75%, 01/15/2031 | | | | | | | 25,000 | | | | 20,062 | |
|
| |
| | | |
Canada–0.65% | | | | | | | | | | | | |
Brookfield Finance, Inc., 4.85%, 03/29/2029 | | | | | | | 90,000 | | | | 83,205 | |
|
| |
Magna International, Inc., 3.63%, 06/15/2024 | | | | | | | 52,000 | | | | 50,755 | |
|
| |
TransCanada PipeLines Ltd., 4.88%, 01/15/2026 | | | | | | | 60,000 | | | | 58,645 | |
|
| |
| | | | | | | | | | | 192,605 | |
|
| |
| | | |
Chile–0.08% | | | | | | | | | | | | |
Enel Generacion Chile S.A., 4.25%, 04/15/2024 | | | | | | | 25,000 | | | | 24,527 | |
|
| |
| | | |
China–0.48% | | | | | | | | | | | | |
Alibaba Group Holding Ltd., 2.13%, 02/09/2031 | | | | | | | 200,000 | | | | 144,022 | |
|
| |
| | | |
France–0.08% | | | | | | | | | | | | |
AXA S.A., 8.60%, 12/15/2030 | | | | | | | 20,000 | | | | 23,144 | |
|
| |
| | | |
Japan–0.14% | | | | | | | | | | | | |
Mitsubishi UFJ Financial Group, Inc., 3.74%, 03/07/2029 | | | | | | | 25,000 | | | | 21,987 | |
|
| |
Sumitomo Mitsui Financial Group, Inc., 2.14%, 09/23/2030 | | | | | | | 25,000 | | | | 18,371 | |
|
| |
| | | | | | | | | | | 40,358 | |
|
| |
| | | |
Luxembourg–0.11% | | | | | | | | | | | | |
ArcelorMittal S.A., 6.75%, 03/01/2041 | | | | | | | 35,000 | | | | 31,706 | |
|
| |
| | | |
Mexico–0.44% | | | | | | | | | | | | |
America Movil S.A.B. de C.V., | | | | | | | | | | | | |
6.38%, 03/01/2035 | | | | | | | 35,000 | | | | 35,159 | |
|
| |
6.13%, 03/30/2040 | | | | | | | 100,000 | | | | 96,171 | |
|
| |
| | | | | | | | | | | 131,330 | |
|
| |
| | | | | | | | | | | | |
| | | Principal
Amount | | | Value | |
|
| |
Netherlands–0.63% | | | | | | | | | | | | |
Cooperatieve Rabobank U.A.,
5.25%, 05/24/2041 | | | $ | | | | 85,000 | | | $ | 78,834 | |
|
| |
Koninklijke KPN N.V., 8.38%, 10/01/2030 | | | | | | | 30,000 | | | | 32,774 | |
|
| |
Shell International Finance B.V., | | | | | | | | | | | | |
2.38%, 11/07/2029 | | | | | | | 35,000 | | | | 29,538 | |
|
| |
6.38%, 12/15/2038 | | | | | | | 45,000 | | | | 47,545 | |
|
| |
| | | | | | | | | | | 188,691 | |
|
| |
| | | |
Switzerland–0.31% | | | | | | | | | | | | |
Credit Suisse USA, Inc., 7.13%, 07/15/2032 | | | | | | | 35,000 | | | | 34,394 | |
|
| |
Tyco Electronics Group S.A., 3.45%, 08/01/2024 | | | | | | | 60,000 | | | | 58,244 | |
|
| |
| | | | | | | | | | | 92,638 | |
|
| |
| | | |
United Kingdom–2.59% | | | | | | | | | | | | |
B.A.T Capital Corp., | | | | | | | | | | | | |
3.56%, 08/15/2027 | | | | | | | 35,000 | | | | 30,498 | |
|
| |
2.26%, 03/25/2028 | | | | | | | 30,000 | | | | 23,798 | |
|
| |
4.74%, 03/16/2032 | | | | | | | 25,000 | | | | 20,995 | |
|
| |
4.54%, 08/15/2047 | | | | | | | 60,000 | | | | 38,855 | |
|
| |
5.28%, 04/02/2050 | | | | | | | 75,000 | | | | 53,691 | |
|
| |
Barclays PLC, 4.84%, 05/09/2028 | | | | | | | 200,000 | | | | 169,675 | |
|
| |
BP Capital Markets PLC, 3.72%, 11/28/2028 | | | | | | | 35,000 | | | | 31,948 | |
|
| |
British Airways Pass-Through Trust, Series 2019-1, Class A, 3.35%, 06/15/2029(b) | | | | | | | 45,342 | | | | 38,615 | |
|
| |
British Telecommunications PLC, 9.63%, 12/15/2030 | | | | | | | 20,000 | | | | 22,843 | |
|
| |
HSBC Holdings PLC, | | | | | | | | | | | | |
4.58%, 06/19/2029(c) | | | | | | | 200,000 | | | | 173,850 | |
|
| |
6.10%, 01/14/2042 | | | | | | | 40,000 | | | | 37,198 | |
|
| |
Mead Johnson Nutrition Co., 4.13%, 11/15/2025 | | | | | | | 95,000 | | | | 91,705 | |
|
| |
nVent Finance S.a.r.l., 4.55%, 04/15/2028 | | | | | | | 25,000 | | | | 22,357 | |
|
| |
Reynolds American, Inc., 5.70%, 08/15/2035 | | | | | | | 18,000 | | | | 15,232 | |
|
| |
| | | | | | | | | | | 771,260 | |
|
| |
| | | |
United States–19.91% | | | | | | | | | | | | |
3M Co., 5.70%, 03/15/2037 | | | | | | | 65,000 | | | | 63,137 | |
|
| |
Adventist Health System,
2.95%, 03/01/2029 | | | | | | | 40,000 | | | | 34,060 | |
|
| |
Aflac, Inc., 1.13%, 03/15/2026 | | | | | | | 50,000 | | | | 43,781 | |
|
| |
Allstate Corp. (The), 3.28%, 12/15/2026 | | | | | | | 20,000 | | | | 18,647 | |
|
| |
Altria Group, Inc., | | | | | | | | | | | | |
4.40%, 02/14/2026 | | | | | | | 21,000 | | | | 20,166 | |
|
| |
2.63%, 09/16/2026 | | | | | | | 25,000 | | | | 22,312 | |
|
| |
4.80%, 02/14/2029 | | | | | | | 74,000 | | | | 68,197 | |
|
| |
3.40%, 05/06/2030 | | | | | | | 40,000 | | | | 32,453 | |
|
| |
2.45%, 02/04/2032 | | | | | | | 45,000 | | | | 32,030 | |
|
| |
5.95%, 02/14/2049 | | | | | | | 10,000 | | | | 8,187 | |
|
| |
Amazon.com, Inc., | | | | | | | | | | | | |
4.25%, 08/22/2057 | | | | | | | 40,000 | | | | 32,282 | |
|
| |
3.25%, 05/12/2061 | | | | | | | 45,000 | | | | 29,087 | |
|
| |
4.10%, 04/13/2062 | | | | | | | 40,000 | | | | 30,792 | |
|
| |
See accompanying Notes to Financial Statements which are an integral part of the financial statements.
| | |
| 10 | | Invesco World Bond Factor Fund |
| | | | | | | | | | | | |
| | | Principal
Amount | | | Value | |
|
| |
United States–(continued) | | | | | | | | | | | | |
American Express Co., | | | | | | | | | | | | |
2.50%, 07/30/2024 | | | $ | | | | 90,000 | | | $ | 85,588 | |
|
| |
3.00%, 10/30/2024 | | | | | | | 50,000 | | | | 47,774 | |
|
| |
American Honda Finance Corp.,
2.15%, 09/10/2024 | | | | | | | 65,000 | | | | 61,680 | |
|
| |
AmerisourceBergen Corp.,
3.40%, 05/15/2024 | | | | | | | 50,000 | | | | 48,660 | |
|
| |
Appalachian Power Co.,
7.00%, 04/01/2038 | | | | | | | 25,000 | | | | 26,442 | |
|
| |
Apple, Inc., | | | | | | | | | | | | |
3.25%, 02/23/2026 | | | | | | | 35,000 | | | | 33,400 | |
|
| |
1.70%, 08/05/2031(e) | | | | | | | 40,000 | | | | 31,059 | |
|
| |
4.45%, 05/06/2044 | | | | | | | 35,000 | | | | 31,382 | |
|
| |
2.85%, 08/05/2061 | | | | | | | 45,000 | | | | 27,037 | |
|
| |
Ares Capital Corp., 3.20%, 11/15/2031 | | | | | | | 35,000 | | | | 24,540 | |
|
| |
Assured Guaranty US Holdings, Inc., 3.15%, 06/15/2031 | | | | | | | 30,000 | | | | 23,880 | |
|
| |
Athene Holding Ltd., 4.13%, 01/12/2028 | | | | | | | 20,000 | | | | 17,829 | |
|
| |
Bank of America Corp., | | | | | | | | | | | | |
4.20%, 08/26/2024 | | | | | | | 188,000 | | | | 183,922 | |
|
| |
4.00%, 01/22/2025 | | | | | | | 30,000 | | | | 28,928 | |
|
| |
4.45%, 03/03/2026 | | | | | | | 35,000 | | | | 33,600 | |
|
| |
3.85%, 03/08/2037(c) | | | | | | | 40,000 | | | | 32,096 | |
|
| |
BGC Partners, Inc., 3.75%, 10/01/2024 | | | | | | | 36,000 | | | | 34,231 | |
|
| |
BlackRock, Inc., 2.10%, 02/25/2032 | | | | | | | 25,000 | | | | 19,110 | |
|
| |
Boeing Co. (The), | | | | | | | | | | | | |
2.70%, 02/01/2027 | | | | | | | 29,000 | | | | 25,172 | |
|
| |
6.63%, 02/15/2038 | | | | | | | 92,000 | | | | 87,412 | |
|
| |
Booking Holdings, Inc.,
4.63%, 04/13/2030 | | | | | | | 65,000 | | | | 61,222 | |
|
| |
Boston Properties L.P.,
3.40%, 06/21/2029 | | | | | | | 35,000 | | | | 28,972 | |
|
| |
Bristol-Myers Squibb Co.,
3.40%, 07/26/2029 | | | | | | | 25,000 | | | | 22,730 | |
|
| |
Broadcom, Inc., 4.93%, 05/15/2037(b) | | | | | | | 25,000 | | | | 20,654 | |
|
| |
California Institute of Technology, 4.70%, 11/01/2111 | | | | | | | 22,000 | | | | 17,058 | |
|
| |
Capital One Financial Corp., 3.20%, 02/05/2025 | | | | | | | 75,000 | | | | 70,943 | |
|
| |
CDW LLC/CDW Finance Corp.,
3.25%, 02/15/2029 | | | | | | | 30,000 | | | | 24,593 | |
|
| |
Celanese US Holdings LLC,
6.38%, 07/15/2032 | | | | | | | 25,000 | | | | 22,780 | |
|
| |
Charter Communications Operating LLC/Charter Communications Operating Capital Corp., 5.05%, 03/30/2029 | | | | | | | 59,000 | | | | 54,289 | |
|
| |
Chevron USA, Inc., 3.85%, 01/15/2028 | | | | | | | 30,000 | | | | 28,430 | |
|
| |
Cigna Corp., 4.50%, 02/25/2026 | | | | | | | 55,000 | | | | 53,746 | |
|
| |
Cintas Corp. No. 2, 3.70%, 04/01/2027 | | | | | | | 25,000 | | | | 23,587 | |
|
| |
Citigroup, Inc., | | | | | | | | | | | | |
3.75%, 06/16/2024 | | | | | | | 45,000 | | | | 44,028 | |
|
| |
8.13%, 07/15/2039 | | | | | | | 20,000 | | | | 23,114 | |
|
| |
| | | | | | | | | | | | |
| | | Principal
Amount | | | Value | |
|
| |
United States–(continued) | | | | | | | | | | | | |
CNA Financial Corp., 3.45%, 08/15/2027 | | | $ | | | | 25,000 | | | $ | 22,562 | |
|
| |
Collins Aerospace, 3.20%, 03/15/2024 | | | | | | | 51,000 | | | | 49,663 | |
|
| |
Comcast Corp., 3.70%, 04/15/2024 | | | | | | | 87,000 | | | | 85,417 | |
|
| |
CommonSpirit Health, | | | | | | | | | | | | |
2.76%, 10/01/2024 | | | | | | | 65,000 | | | | 61,765 | |
|
| |
1.55%, 10/01/2025 | | | | | | | 82,000 | | | | 72,940 | |
|
| |
ConocoPhillips Co., 6.95%, 04/15/2029 | | | | | | | 20,000 | | | | 21,732 | |
|
| |
Constellation Energy Generation LLC, 6.25%, 10/01/2039 | | | | | | | 60,000 | | | | 57,735 | |
|
| |
Corning, Inc., 5.85%, 11/15/2068 | | | | | | | 13,000 | | | | 11,090 | |
|
| |
Dell International LLC/EMC Corp., | | | | | | | | | | | | |
8.10%, 07/15/2036 | | | | | | | 20,000 | | | | 21,221 | |
|
| |
8.35%, 07/15/2046 | | | | | | | 25,000 | | | | 26,594 | |
|
| |
Dignity Health, 5.27%, 11/01/2064 | | | | | | | 25,000 | | | | 20,085 | |
|
| |
Duke Energy Carolinas LLC, 6.10%, 06/01/2037 | | | | | | | 65,000 | | | | 63,318 | |
|
| |
DuPont de Nemours, Inc., 4.49%, 11/15/2025 | | | | | | | 65,000 | | | | 63,719 | |
|
| |
Eli Lilly and Co., 5.50%, 03/15/2027 | | | | | | | 75,000 | | | | 77,145 | |
|
| |
Energy Transfer L.P., 4.95%, 05/15/2028 | | | | | | | 35,000 | | | | 32,477 | |
|
| |
Enstar Group Ltd., 3.10%, 09/01/2031 | | | | | | | 25,000 | | | | 17,346 | |
|
| |
Enterprise Products Operating LLC, 4.15%, 10/16/2028 | | | | | | | 25,000 | | | | 23,037 | |
|
| |
ERP Operating L.P., 4.15%, 12/01/2028 | | | | | | | 40,000 | | | | 36,440 | |
|
| |
Eversource Energy, Series M, 3.30%, 01/15/2028 | | | | | | | 50,000 | | | | 44,871 | |
|
| |
Exxon Mobil Corp., | | | | | | | | | | | | |
2.44%, 08/16/2029 | | | | | | | 45,000 | | | | 38,590 | |
|
| |
3.48%, 03/19/2030(e) | | | | | | | 45,000 | | | | 40,822 | |
|
| |
Federal Realty Investment Trust, 3.95%, 01/15/2024 | | | | | | | 45,000 | | | | 44,261 | |
|
| |
FedEx Corp., 5.25%, 05/15/2050(e) | | | | | | | 30,000 | | | | 25,438 | |
|
| |
Fifth Third Bancorp, 2.38%, 01/28/2025 | | | | | | | 50,000 | | | | 46,483 | |
|
| |
General Motors Co., 6.75%, 04/01/2046 | | | | | | | 93,000 | | | | 86,128 | |
|
| |
Georgia-Pacific LLC, 8.88%, 05/15/2031 | | | | | | | 15,000 | | | | 17,879 | |
|
| |
Gilead Sciences, Inc., 3.70%, 04/01/2024 | | | | | | | 84,000 | | | | 82,478 | |
|
| |
GLP Capital L.P./GLP Financing II, Inc., 5.30%, 01/15/2029 | | | | | | | 20,000 | | | | 18,057 | |
|
| |
Goldman Sachs Group, Inc. (The), 4.00%, 03/03/2024 | | | | | | | 186,000 | | | | 182,651 | |
|
| |
Harley-Davidson, Inc., 4.63%, 07/28/2045 | | | | | | | 26,000 | | | | 18,245 | |
|
| |
Hasbro, Inc., 6.35%, 03/15/2040 | | | | | | | 50,000 | | | | 45,906 | |
|
| |
Hewlett Packard Enterprise Co., 6.35%, 10/15/2045 | | | | | | | 30,000 | | | | 27,191 | |
|
| |
See accompanying Notes to Financial Statements which are an integral part of the financial statements.
| | |
| 11 | | Invesco World Bond Factor Fund |
| | | | | | | | | | | | |
| | | Principal
Amount | | | Value | |
|
| |
United States–(continued) | | | | | | | | | | | | |
Host Hotels & Resorts L.P., Series I, 3.50%, 09/15/2030 | | | $ | | | | 15,000 | | | $ | 11,780 | |
|
| |
HP, Inc., | | | | | | | | | | | | |
5.50%, 01/15/2033 | | | | | | | 15,000 | | | | 13,359 | |
|
| |
6.00%, 09/15/2041 | | | | | | | 31,000 | | | | 27,526 | |
|
| |
Intel Corp., | | | | | | | | | | | | |
4.95%, 03/25/2060 | | | | | | | 41,000 | | | | 33,300 | |
|
| |
5.05%, 08/05/2062 | | | | | | | 75,000 | | | | 61,155 | |
|
| |
International Business Machines Corp., 7.13%, 12/01/2096 | | | | | | | 43,000 | | | | 48,604 | |
|
| |
IPALCO Enterprises, Inc., 4.25%, 05/01/2030 | | | | | | | 68,000 | | | | 58,530 | |
|
| |
JPMorgan Chase & Co., | | | | | | | | | | | | |
3.88%, 09/10/2024 | | | | | | | 115,000 | | | | 112,069 | |
|
| |
4.13%, 12/15/2026 | | | | | | | 40,000 | | | | 37,924 | |
|
| |
Kemper Corp., 3.80%, 02/23/2032 | | | | | | | 25,000 | | | | 20,413 | |
|
| |
KLA Corp., 4.65%, 11/01/2024 | | | | | | | 14,000 | | | | 13,939 | |
|
| |
Kohl’s Corp., 5.55%, 07/17/2045 | | | | | | | 68,000 | | | | 40,521 | |
|
| |
Kyndryl Holdings, Inc., 4.10%, 10/15/2041 | | | | | | | 30,000 | | | | 16,474 | |
|
| |
McKesson Corp., 1.30%, 08/15/2026(e) | | | | | | | 25,000 | | | | 21,493 | |
|
| |
Microsoft Corp., 3.04%, 03/17/2062 | | | | | | | 50,000 | | | | 32,676 | |
|
| |
Mid-America Apartments L.P., 1.10%, 09/15/2026 | | | | | | | 25,000 | | | | 21,156 | |
|
| |
MidAmerican Energy Co., | | | | | | | | | | | | |
3.65%, 04/15/2029 | | | | | | | 20,000 | | | | 18,267 | |
|
| |
6.75%, 12/30/2031 | | | | | | | 20,000 | | | | 21,583 | |
|
| |
Morgan Stanley, | | | | | | | | | | | | |
3.70%, 10/23/2024 | | | | | | | 85,000 | | | | 82,451 | |
|
| |
4.35%, 09/08/2026 | | | | | | | 35,000 | | | | 33,356 | |
|
| |
Nordstrom, Inc., 5.00%, 01/15/2044 | | | | | | | 88,000 | | | | 55,881 | |
|
| |
Omega Healthcare Investors, Inc., 3.38%, 02/01/2031 | | | | | | | 110,000 | | | | 82,664 | |
|
| |
Oracle Corp., | | | | | | | | | | | | |
3.85%, 04/01/2060 | | | | | | | 50,000 | | | | 30,288 | |
|
| |
4.10%, 03/25/2061 | | | | | | | 45,000 | | | | 28,035 | |
|
| |
Pacific Gas and Electric Co., | | | | | | | | | | | | |
4.20%, 03/01/2029 | | | | | | | 25,000 | | | | 21,716 | |
|
| |
4.55%, 07/01/2030 | | | | | | | 25,000 | | | | 21,926 | |
|
| |
4.40%, 03/01/2032 | | | | | | | 25,000 | | | | 20,956 | |
|
| |
Paramount Global, 7.88%, 07/30/2030 | | | | | | | 35,000 | | | | 36,420 | |
|
| |
Parker-Hannifin Corp., 3.30%, 11/21/2024 | | | | | | | 55,000 | | | | 53,085 | |
|
| |
Patterson-UTI Energy, Inc., 5.15%, 11/15/2029 | | | | | | | 99,000 | | | | 87,509 | |
|
| |
Philip Morris International, Inc., | | | | | | | | | | | | |
3.13%, 03/02/2028 | | | | | | | 20,000 | | | | 17,483 | |
|
| |
2.10%, 05/01/2030 | | | | | | | 25,000 | | | | 19,077 | |
|
| |
1.75%, 11/01/2030 | | | | | | | 20,000 | | | | 14,686 | |
|
| |
6.38%, 05/16/2038 | | | | | | | 30,000 | | | | 28,003 | |
|
| |
4.50%, 03/20/2042 | | | | | | | 35,000 | | | | 25,636 | |
|
| |
PNC Financial Services Group, Inc. (The), 3.90%, 04/29/2024 | | | | | | | 50,000 | | | | 48,943 | |
|
| |
| | | | | | | | | | | | |
| | | Principal
Amount | | | Value | |
|
| |
United States–(continued) | | | | | | | | | | | | |
PPG Industries, Inc., 1.20%, 03/15/2026 | | | $ | | | | 40,000 | | | $ | 34,676 | |
|
| |
Progress Energy, Inc., 7.75%, 03/01/2031 | | | | | | | 20,000 | | | | 21,973 | |
|
| |
Prudential Financial, Inc., 3.70%, 10/01/2050(c) | | | | | | | 50,000 | | | | 38,977 | |
|
| |
Ralph Lauren Corp., 2.95%, 06/15/2030 | | | | | | | 44,000 | | | | 36,911 | |
|
| |
Realty Income Corp., 3.95%, 08/15/2027 | | | | | | | 25,000 | | | | 23,217 | |
|
| |
Simon Property Group L.P., 6.75%, 02/01/2040 | | | | | | | 38,000 | | | | 37,827 | |
|
| |
Southern California Edison Co., | | | | | | | | | | | | |
6.65%, 04/01/2029 | | | | | | | 75,000 | | | | 75,265 | |
|
| |
6.00%, 01/15/2034 | | | | | | | 47,000 | | | | 46,076 | |
|
| |
Series 2004-G, 5.75%, 04/01/2035 | | | | | | | 30,000 | | | | 28,520 | |
|
| |
Southern California Gas Co., 3.20%, 06/15/2025 | | | | | | | 25,000 | | | | 23,754 | |
|
| |
Southwest Airlines Co., 3.00%, 11/15/2026 | | | | | | | 100,000 | | | | 90,020 | |
|
| |
Southwest Gas Corp., 4.05%, 03/15/2032 | | | | | | | 45,000 | | | | 37,652 | |
|
| |
Spectra Energy Partners L.P., 4.75%, 03/15/2024 | | | | | | | 30,000 | | | | 29,732 | |
|
| |
Spirit Realty L.P., 3.20%, 02/15/2031 | | | | | | | 30,000 | | | | 22,941 | |
|
| |
Stewart Information Services Corp., 3.60%, 11/15/2031 | | | | | | | 25,000 | | | | 18,822 | |
|
| |
Swiss Re America Holding Corp., 7.00%, 02/15/2026 | | | | | | | 47,000 | | | | 49,307 | |
|
| |
Time Warner Cable LLC, 7.30%, 07/01/2038 | | | | | | | 30,000 | | | | 28,059 | |
|
| |
Transcontinental Gas Pipe Line Co. LLC, 7.85%, 02/01/2026 | | | | | | | 50,000 | | | | 52,720 | |
|
| |
Truist Financial Corp., 2.50%, 08/01/2024 | | | | | | | 60,000 | | | | 57,197 | |
|
| |
Union Electric Co., 8.45%, 03/15/2039 | | | | | | | 48,000 | | | | 57,157 | |
|
| |
United Parcel Service, Inc., 2.20%, 09/01/2024 | | | | | | | 25,000 | | | | 23,887 | |
|
| |
US Airways Pass-Through Trust, Series 2013-1A, Class PTT, 3.95%, 11/15/2025 | | | | | | | 33,338 | | | | 29,548 | |
|
| |
Verizon Communications, Inc., | | | | | | | | | | | | |
4.13%, 03/16/2027 | | | | | | | 45,000 | | | | 42,830 | |
|
| |
4.33%, 09/21/2028 | | | | | | | 26,000 | | | | 24,400 | |
|
| |
Wachovia Corp., 7.57%, 08/01/2016(f) | | | | | | | 82,000 | | | | 86,944 | |
|
| |
Walmart, Inc., 3.95%, 06/28/2038 | | | | | | | 20,000 | | | | 17,520 | |
|
| |
Walt Disney Co. (The), 3.70%, 03/23/2027 | | | | | | | 25,000 | | | | 23,604 | |
|
| |
Warnermedia Holdings, Inc., 4.05%, 03/15/2029(b) | | | | | | | 46,000 | | | | 39,129 | |
|
| |
Waste Management, Inc., 3.13%, 03/01/2025 | | | | | | | 50,000 | | | | 48,263 | |
|
| |
Wells Fargo & Co., 4.10%, 06/03/2026 | | | | | | | 76,000 | | | | 71,939 | |
|
| |
Western Digital Corp., 2.85%, 02/01/2029 | | | | | | | 30,000 | | | | 23,234 | |
|
| |
Western Union Co. (The), 6.20%, 11/17/2036 | | | | | | | 20,000 | | | | 18,801 | |
|
| |
See accompanying Notes to Financial Statements which are an integral part of the financial statements.
| | |
| 12 | | Invesco World Bond Factor Fund |
| | | | | | | | | | | | |
| | | Principal
Amount | | | Value | |
|
| |
United States–(continued) | | | | | | | | | | | | |
Xilinx, Inc., 2.95%, 06/01/2024 | | | $ | | | | 40,000 | | | $ | 38,750 | |
|
| |
| | | | | | | | | | | 5,936,841 | |
|
| |
Total U.S. Dollar Denominated Bonds & Notes (Cost $9,036,282) | | | | 7,690,758 | |
|
| |
| |
U.S. Treasury Securities–13.09% | | | | | |
U.S. Treasury Bills–0.36% | | | | | | | | | | | | |
1.45 - 2.51%, 11/17/2022(g)(h) | | | | | | | 81,942 | | | | 81,942 | |
|
| |
3.71 - 4.16%, 03/09/2023(g)(h) | | | | | | | 23,676 | | | | 23,644 | |
|
| |
| | | | | | | | | | | 105,586 | |
|
| |
| | | |
U.S. Treasury Bonds–2.68% | | | | | | | | | | | | |
7.50%, 11/15/2024 | | | | | | | 150,726 | | | | 145,997 | |
|
| |
1.63%, 11/15/2050 | | | | | | | 1,000,730 | | | | 653,356 | |
|
| |
| | | | | | | | | | | 799,353 | |
|
| |
| | | |
U.S. Treasury Notes–10.05% | | | | | | | | | | | | |
3.25%, 08/31/2024 | | | | | | | 645,238 | | | | 638,180 | |
|
| |
4.25%, 09/30/2024 | | | | | | | 747,468 | | | | 746,250 | |
|
| |
0.38%, 12/31/2025 | | | | | | | 497,958 | | | | 472,365 | |
|
| |
0.38%, 09/30/2027 | | | | | | | 899,352 | | | | 873,084 | |
|
| |
2.75%, 08/15/2032 | | | | | | | 268,504 | | | | 266,710 | |
|
| |
| | | | | | | | | | | 2,996,589 | |
|
| |
Total U.S. Treasury Securities
(Cost $4,315,594) | | | | 3,901,528 | |
|
| |
|
U.S. Government Sponsored Agency Mortgage-Backed Securities–11.33% | |
Federal Home Loan Mortgage Corp., | | | | | | | | | | | | |
2.50%, 07/01/2035 - 08/01/2050 | | | | | | | 592,773 | | | | 500,192 | |
|
| |
4.50%, 09/01/2049 - 01/01/2050 | | | | | | | 33,454 | | | | 31,735 | |
|
| |
3.00%, 01/01/2050 - 05/01/2050 | | | | | | | 210,222 | | | | 183,518 | |
|
| |
2.00%, 01/01/2051 - 10/01/2051 | | | | | | | 531,064 | | | | 420,564 | |
|
| |
Federal National Mortgage Association, | | | | | | | | | | | | |
4.50%, 06/01/2049 | | | | | | | 14,742 | | | | 14,138 | |
|
| |
3.00%, 10/01/2049 - 03/01/2050 | | | | | | | 166,635 | | | | 143,005 | |
|
| |
2.50%, 01/01/2050 - 08/01/2050 | | | | | | | 436,524 | | | | 363,958 | |
|
| |
2.00%, 03/01/2051 - 08/01/2051 | | | | | | | 475,345 | | | | 376,726 | |
|
| |
| | | | | | | | | | | | |
| | | Principal
Amount | | | Value | |
|
| |
Freddie Mac Multifamily Structured Pass-Through Ctfs., Series K038, Class X1, IO, 1.08%, 03/25/2024(i) | | | $ | | | | 1,448,600 | | | $ | 15,995 | |
|
| |
Uniform Mortgage-Backed Securities, TBA, | | | | | | | | | | | | |
2.00%, 11/01/2037(j) | | | | | | | 420,000 | | | | 367,897 | |
|
| |
2.50%, 11/01/2052(j) | | | | | | | 579,000 | | | | 474,060 | |
|
| |
3.00%, 11/01/2052(j) | | | | | | | 278,000 | | | | 236,365 | |
|
| |
3.50%, 11/01/2052(j) | | | | | | | 285,000 | | | | 250,552 | |
|
| |
Total U.S. Government Sponsored Agency Mortgage-Backed Securities
(Cost $3,933,603) | | | | 3,378,705 | |
|
| |
| | | |
| | | | | | Shares | | | | |
Exchange-Traded Funds–1.23% | | | | | | | | | | | | |
United States–1.23% | | | | | | | | | | | | |
Invesco High Yield Bond Factor ETF(k)
(Cost $446,307) | | | | | | | 17,500 | | | | 368,287 | |
|
| |
TOTAL INVESTMENTS IN SECURITIES (excluding Investments purchased with cash collateral from securities on loan)–102.80%
(Cost $37,526,592) | | | | | | | | | | | 30,646,563 | |
|
| |
|
Investments Purchased with Cash Collateral from Securities on Loan | |
| Money Market Funds–0.41% | | | | | | | | | | | | |
Invesco Private Government Fund, 3.18%(k)(l)(m) | | | | | | | 33,265 | | | | 33,265 | |
|
| |
Invesco Private Prime Fund,
3.28%(k)(l)(m) | | | | | | | 88,347 | | | | 88,347 | |
|
| |
Total Investments Purchased with Cash Collateral from Securities on Loan
(Cost $121,612) | | | | 121,612 | |
|
| |
TOTAL INVESTMENTS IN SECURITIES–103.21%
(Cost $37,648,204) | | | | 30,768,175 | |
|
| |
OTHER ASSETS LESS LIABILITIES–(3.21)% | | | | (957,408 | ) |
|
| |
NET ASSETS–100.00% | | | $ | 29,810,767 | |
|
| |
See accompanying Notes to Financial Statements which are an integral part of the financial statements.
| | |
| 13 | | Invesco World Bond Factor Fund |
| | |
| Investment Abbreviations: |
| |
| AUD | | – Australian Dollar |
| CAD | | – Canadian Dollar |
| CHF | | – Swiss Franc |
| Ctfs. | | – Certificates |
| ETF | | – Exchange-Traded Fund |
| EUR | | – Euro |
| GBP | | – British Pound Sterling |
| IDR | | – Indonesian Rupiah |
| IO | | – Interest Only |
| JPY | | – Japanese Yen |
| KRW | | – South Korean Won |
| MXN | | – Mexican Peso |
| MYR | | – Malaysian Ringgit |
| NOK | | – Norwegian Krone |
| NZD | | – New Zealand Dollar |
| PLN | | – Polish Zloty |
| SEK | | – Swedish Krona |
| TBA | | – To Be Announced |
| THB | | – Thai Baht |
Notes to Schedule of Investments:
| (a) | Foreign denominated security. Principal amount is denominated in the currency indicated. |
| (b) | Security purchased or received in a transaction exempt from registration under the Securities Act of 1933, as amended (the “1933 Act”). The security may be resold pursuant to an exemption from registration under the 1933 Act, typically to qualified institutional buyers. The aggregate value of these securities at October 31, 2022 was $11,013,113, which represented 36.94% of the Fund’s Net Assets. |
| (c) | Security issued at a fixed rate for a specific period of time, after which it will convert to a variable rate. |
| (d) | Perpetual bond with no specified maturity date. |
| (e) | All or a portion of this security was out on loan at October 31, 2022. |
| (f) | Step coupon bond. The interest rate represents the coupon rate at which the bond will accrue at a specified future date. |
| (g) | All or a portion of the value was pledged as collateral to cover margin requirements for open futures contracts. See Note 1L. |
| (h) | Security traded on a discount basis. The interest rate shown represents the discount rate at the time of purchase by the Fund. |
| (i) | Interest only security. Principal amount shown is the notional principal and does not reflect the maturity value of the security. Interest rate is redetermined periodically based on the cash flows generated by the pool of assets backing the security, less any applicable fees. The rate shown is the rate in effect on October 31, 2022. |
| (j) | Security purchased on a forward commitment basis. This security is subject to dollar roll transactions. See Note 1N. |
| (k) | Affiliated issuer. The issuer and/or the Fund is a wholly-owned subsidiary of Invesco Ltd., or is affiliated by having an investment adviser that is under common control of Invesco Ltd. The table below shows the Fund’s transactions in, and earnings from, its investments in affiliates for the fiscal year ended October 31, 2022. |
| | | | | | | | | | | | | | | | | | | | | | | | | | | | | | | | | | | |
| | | Value
October 31, 2021 | | Purchases at Cost | | Proceeds
from Sales | | Change in
Unrealized
Appreciation
(Depreciation) | | Realized
Gain
(Loss) | | Value
October 31, 2022 | | Dividend Income |
Invesco High Yield Bond Factor ETF | | | $ | 446,425 | | | | $ | - | | | | $ | - | | | | $ | (78,138 | ) | | | $ | - | | | | $ | 368,287 | | | | $ | 23,290 | |
| Investments in Affiliated Money Market Funds: | | | | | | | | | | | | | | | | | | | | | | | | | | | | | | | | | | | |
| Invesco Government & Agency Portfolio, Institutional Class | | | | 349,902 | | | | | 5,029,633 | | | | | (5,379,535 | ) | | | | - | | | | | - | | | | | - | | | | | 570 | |
Invesco Liquid Assets Portfolio, Institutional Class | | | | 240,290 | | | | | 3,592,596 | | | | | (3,832,771 | ) | | | | - | | | | | (115 | ) | | | | - | | | | | 759 | |
Invesco Treasury Portfolio, Institutional Class | | | | 399,888 | | | | | 5,748,152 | | | | | (6,148,040 | ) | | | | - | | | | | - | | | | | - | | | | | 1,143 | |
| Investments Purchased with Cash Collateral from Securities on Loan: | | | | | | | | | | | | | | | | | | | | | | | | | | | | | | | | | | | |
Invesco Private Government Fund | | | | - | | | | | 183,702 | | | | | (150,437 | ) | | | | - | | | | | - | | | | | 33,265 | | | | | 113 | * |
Invesco Private Prime Fund | | | | - | | | | | 407,339 | | | | | (318,982 | ) | | | | - | | | | | (10 | ) | | | | 88,347 | | | | | 308 | * |
Total | | | $ | 1,436,505 | | | | $ | 14,961,422 | | | | $ | (15,829,765 | ) | | | $ | (78,138 | ) | | | $ | (125 | ) | | | $ | 489,899 | | | | $ | 26,183 | |
| | * | Represents the income earned on the investment of cash collateral, which is included in securities lending income on the Statement of Operations. Does not include rebates and fees paid to lending agent or premiums received from borrowers, if any. |
| (l) | The rate shown is the 7-day SEC standardized yield as of October 31, 2022. |
| (m) | The security has been segregated to satisfy the commitment to return the cash collateral received in securities lending transactions upon the borrower’s return of the securities loaned. See Note 1I. |
See accompanying Notes to Financial Statements which are an integral part of the financial statements.
| | |
| 14 | | Invesco World Bond Factor Fund |
| | | | | | | | | | | | | | | | | | | | | | | | | |
| Open Futures Contracts |
| Long Futures Contracts | | Number of
Contracts | | Expiration
Month | | Notional
Value | | Value | | Unrealized
Appreciation
(Depreciation) |
Interest Rate Risk | | | | | | | | | | | | | | | | | | | | | | | | | |
Canada 10 Year Bonds | | | | 2 | | | | | December-2022 | | | | $ | 180,614 | | | | $ | (2,540 | ) | | | $ | (2,540 | ) |
Euro-Bund | | | | 2 | | | | | December-2022 | | | | | 273,627 | | | | | (3,745 | ) | | | | (3,745 | ) |
Euro-Buxl 30 Year Bonds | | | | 2 | | | | | December-2022 | | | | | 285,051 | | | | | (30,296 | ) | | | | (30,296 | ) |
Japan 10 Year Bonds | | | | 1 | | | | | December-2022 | | | | | 1,000,504 | | | | | 2,488 | | | | | 2,488 | |
Long Gilt | | | | 3 | | | | | December-2022 | | | | | 351,368 | | | | | (27,007 | ) | | | | (27,007 | ) |
Subtotal–Long Futures Contracts | | | | | | | | | | | | | | | | | | | (61,100 | ) | | | | (61,100 | ) |
| | | | | |
Short Futures Contracts | | | | | | | | | | | | | | | | | | | | | | | | | |
Interest Rate Risk | | | | | | | | | | | | | | | | | | | | | | | | | |
U.S. Treasury 2 Year Notes | | | | 3 | | | | | December-2022 | | | | | (613,148 | ) | | | | 594 | | | | | 594 | |
U.S. Treasury 5 Year Notes | | | | 8 | | | | | December-2022 | | | | | (852,750 | ) | | | | 6,000 | | | | | 6,000 | |
U.S. Treasury 10 Year Ultra Notes | | | | 5 | | | | | December-2022 | | | | | (579,922 | ) | | | | 29,437 | | | | | 29,437 | |
Subtotal–Short Futures Contracts | | | | | | | | | | | | | | | | | | | 36,031 | | | | | 36,031 | |
Total Futures Contracts | | | | | | | | | | | | | | | | | | $ | (25,069 | ) | | | $ | (25,069 | ) |
| | | | | | | | | | | | | | | | | | | | | | |
| Open Forward Foreign Currency Contracts | |
Settlement
Date | | | | Contract to | | | Unrealized
Appreciation
(Depreciation) | |
| | Counterparty | | Deliver | | | Receive | |
Currency Risk | | | | | | | | | | | | | | | | | | | | | | |
11/03/2022 | | Bank of America, N.A. | | | USD | | | | 26,855 | | | | BRL | | | | 145,947 | | | | $ 1,399 | |
12/21/2022 | | Bank of America, N.A. | | | AUD | | | | 612,000 | | | | USD | | | | 396,862 | | | | 4,774 | |
12/21/2022 | | Bank of America, N.A. | | | JPY | | | | 11,416,000 | | | | USD | | | | 80,467 | | | | 3,213 | |
12/21/2022 | | Bank of America, N.A. | | | NZD | | | | 1,892,121 | | | | USD | | | | 1,135,075 | | | | 34,170 | |
12/21/2022 | | Bank of America, N.A. | | | USD | | | | 3,014 | | | | CHF | | | | 3,000 | | | | 0 | |
12/21/2022 | | Bank of America, N.A. | | | USD | | | | 163,159 | | | | EUR | | | | 166,000 | | | | 1,561 | |
12/21/2022 | | Bank of America, N.A. | | | USD | | | | 105,538 | | | | GBP | | | | 94,190 | | | | 2,664 | |
12/21/2022 | | Bank of America, N.A. | | | USD | | | | 2,839 | | | | IDR | | | | 44,510,000 | | | | 5 | |
12/21/2022 | | Bank of America, N.A. | | | USD | | | | 190,369 | | | | NOK | | | | 2,070,125 | | | | 9,096 | |
12/21/2022 | | Bank of America, N.A. | | | USD | | | | 318,579 | | | | SEK | | | | 3,522,351 | | | | 1,765 | |
12/02/2022 | | Barclays Bank PLC | | | USD | | | | 7,782 | | | | BRL | | | | 41,470 | | | | 196 | |
12/21/2022 | | Barclays Bank PLC | | | CZK | | | | 247,000 | | | | USD | | | | 9,955 | | | | 14 | |
12/21/2022 | | BNP Paribas S.A. | | | SEK | | | | 14,129,722 | | | | USD | | | | 1,329,052 | | | | 44,011 | |
11/03/2022 | | Citibank, N.A. | | | USD | | | | 27,752 | | | | BRL | | | | 145,947 | | | | 503 | |
12/02/2022 | | Citibank, N.A. | | | USD | | | | 26,200 | | | | BRL | | | | 139,950 | | | | 726 | |
12/21/2022 | | Citibank, N.A. | | | CAD | | | | 587,000 | | | | USD | | | | 446,614 | | | | 15,494 | |
12/21/2022 | | Citibank, N.A. | | | IDR | | | | 81,607,000 | | | | USD | | | | 5,331 | | | | 116 | |
12/21/2022 | | Citibank, N.A. | | | INR | | | | 1,808,450 | | | | USD | | | | 22,014 | | | | 296 | |
12/21/2022 | | Citibank, N.A. | | | KRW | | | | 52,370,300 | | | | USD | | | | 37,680 | | | | 956 | |
12/21/2022 | | Citibank, N.A. | | | USD | | | | 11,363 | | | | KRW | | | | 16,214,000 | | | | 7 | |
12/21/2022 | | Citibank, N.A. | | | ZAR | | | | 2,079,000 | | | | USD | | | | 118,220 | | | | 5,466 | |
12/21/2022 | | Deutsche Bank AG | | | USD | | | | 297,888 | | | | EUR | | | | 305,000 | | | | 4,759 | |
12/21/2022 | | Deutsche Bank AG | | | USD | | | | 125,166 | | | | GBP | | | | 112,186 | | | | 3,708 | |
12/21/2022 | | Deutsche Bank AG | | | USD | | | | 13,025 | | | | MXN | | | | 266,000 | | | | 286 | |
12/21/2022 | | Goldman Sachs International | | | CLP | | | | 4,808,000 | | | | USD | | | | 5,116 | | | | 62 | |
12/21/2022 | | Goldman Sachs International | | | HUF | | | | 4,025,714 | | | | USD | | | | 9,844 | | | | 260 | |
12/21/2022 | | Goldman Sachs International | | | IDR | | | | 1,774,108,002 | | | | USD | | | | 118,614 | | | | 5,259 | |
12/21/2022 | | Goldman Sachs International | | | SGD | | | | 25,340 | | | | USD | | | | 18,033 | | | | 128 | |
12/21/2022 | | Goldman Sachs International | | | THB | | | | 556,501 | | | | USD | | | | 15,184 | | | | 497 | |
12/21/2022 | | Goldman Sachs International | | | USD | | | | 23,887 | | | | HUF | | | | 10,547,000 | | | | 1,221 | |
See accompanying Notes to Financial Statements which are an integral part of the financial statements.
| | |
| 15 | | Invesco World Bond Factor Fund |
| | | | | | | | | | | | | | | | | | | | | | |
| Open Forward Foreign Currency Contracts–(continued) | |
Settlement
Date | | | | Contract to | | | Unrealized
Appreciation
(Depreciation) | |
| | Counterparty | | Deliver | | | Receive | |
12/21/2022 | | Goldman Sachs International | | | USD | | | | 92,765 | | | | JPY | | | | 13,800,000 | | | | $ 622 | |
12/21/2022 | | J.P. Morgan Chase Bank, N.A. | | | EUR | | | | 270,000 | | | | USD | | | | 269,947 | | | | 2,028 | |
12/21/2022 | | J.P. Morgan Chase Bank, N.A. | | | GBP | | | | 305,520 | | | | USD | | | | 351,033 | | | | 64 | |
12/21/2022 | | J.P. Morgan Chase Bank, N.A. | | | JPY | | | | 17,684,000 | | | | USD | | | | 123,304 | | | | 3,634 | |
12/21/2022 | | J.P. Morgan Chase Bank, N.A. | | | NOK | | | | 19,651,016 | | | | USD | | | | 1,950,882 | | | | 57,429 | |
12/21/2022 | | J.P. Morgan Chase Bank, N.A. | | | USD | | | | 65,431 | | | | CAD | | | | 90,000 | | | | 669 | |
12/21/2022 | | J.P. Morgan Chase Bank, N.A. | | | USD | | | | 861,652 | | | | EUR | | | | 875,835 | | | | 7,430 | |
12/21/2022 | | J.P. Morgan Chase Bank, N.A. | | | USD | | | | 266,987 | | | | NOK | | | | 2,902,820 | | | | 12,711 | |
12/21/2022 | | J.P. Morgan Chase Bank, N.A. | | | USD | | | | 92,636 | | | | TRY | | | | 1,840,980 | | | | 2,549 | |
12/21/2022 | | Morgan Stanley and Co. International PLC | | | AUD | | | | 3,395,330 | | | | USD | | | | 2,294,420 | | | | 119,142 | |
12/21/2022 | | Morgan Stanley and Co. International PLC | | | CHF | | | | 1,796,010 | | | | USD | | | | 1,876,218 | | | | 71,858 | |
12/21/2022 | | Morgan Stanley and Co. International PLC | | | EUR | | | | 8,246,508 | | | | USD | | | | 8,290,335 | | | | 107,413 | |
12/21/2022 | | Morgan Stanley and Co. International PLC | | | JPY | | | | 8,553,360 | | | | USD | | | | 57,904 | | | | 22 | |
12/21/2022 | | Morgan Stanley and Co. International PLC | | | USD | | | | 20,795 | | | | TRY | | | | 424,180 | | | | 1,137 | |
12/21/2022 | | Royal Bank of Canada | | | COP | | | | 38,163,356 | | | | USD | | | | 8,468 | | | | 806 | |
12/21/2022 | | State Street Bank & Trust Co. | | | USD | | | | 103,650 | | | | EUR | | | | 105,000 | | | | 540 | |
12/21/2022 | | UBS AG | | | PLN | | | | 540,000 | | | | USD | | | | 112,764 | | | | 602 | |
12/21/2022 | | UBS AG | | | USD | | | | 2,850 | | | | THB | | | | 108,000 | | | | 1 | |
Subtotal–Appreciation | | | | | | | | | | | | | | | | | | | 531,269 | |
| | | | | | |
Currency Risk | | | | | | | | | | | | | | | | | | | | | | |
11/03/2022 | | Bank of America, N.A. | | | BRL | | | | 145,947 | | | | USD | | | | 27,724 | | | | (531 | ) |
12/21/2022 | | Bank of America, N.A. | | | GBP | | | | 197,000 | | | | USD | | | | 218,398 | | | | (7,907 | ) |
12/21/2022 | | Bank of America, N.A. | | | NZD | | | | 290,810 | | | | USD | | | | 165,243 | | | | (3,961 | ) |
12/21/2022 | | Bank of America, N.A. | | | SEK | | | | 62,000 | | | | USD | | | | 5,636 | | | | (3 | ) |
12/21/2022 | | Bank of America, N.A. | | | USD | | | | 40,451 | | | | AUD | | | | 62,380 | | | | (487 | ) |
12/21/2022 | | Bank of America, N.A. | | | USD | | | | 195,003 | | | | CHF | | | | 194,100 | | | | (0 | ) |
12/21/2022 | | Bank of America, N.A. | | | USD | | | | 114,580 | | | | NZD | | | | 191,000 | | | | (3,449 | ) |
12/02/2022 | | Barclays Bank PLC | | | BRL | | | | 111,450 | | | | USD | | | | 21,381 | | | | (61 | ) |
12/21/2022 | | Barclays Bank PLC | | | CLP | | | | 37,211,260 | | | | USD | | | | 38,290 | | | | (828 | ) |
12/21/2022 | | Barclays Bank PLC | | | SGD | | | | 58,190 | | | | USD | | | | 40,555 | | | | (564 | ) |
12/21/2022 | | Barclays Bank PLC | | | USD | | | | 64,095 | | | | CNY | | | | 465,000 | | | | (96 | ) |
12/21/2022 | | Barclays Bank PLC | | | USD | | | | 46,190 | | | | CZK | | | | 1,146,000 | | | | (66 | ) |
12/21/2022 | | Barclays Bank PLC | | | USD | | | | 28,441 | | | | NZD | | | | 48,880 | | | | (1 | ) |
12/21/2022 | | BNP Paribas S.A. | | | MXN | | | | 201,960 | | | | USD | | | | 9,903 | | | | (203 | ) |
12/21/2022 | | BNP Paribas S.A. | | | USD | | | | 101,021 | | | | SEK | | | | 1,074,000 | | | | (3,345 | ) |
11/03/2022 | | Citibank, N.A. | | | BRL | | | | 145,947 | | | | USD | | | | 27,507 | | | | (747 | ) |
12/02/2022 | | Citibank, N.A. | | | BRL | | | | 5,997 | | | | USD | | | | 1,123 | | | | (31 | ) |
12/21/2022 | | Citibank, N.A. | | | KRW | | | | 26,686,000 | | | | USD | | | | 18,611 | | | | (103 | ) |
12/21/2022 | | Citibank, N.A. | | | USD | | | | 1,841,409 | | | | CAD | | | | 2,420,224 | | | | (63,884 | ) |
12/21/2022 | | Citibank, N.A. | | | USD | | | | 6,508 | | | | INR | | | | 541,910 | | | | (0 | ) |
12/21/2022 | | Citibank, N.A. | | | USD | | | | 107,483 | | | | KRW | | | | 149,385,000 | | | | (2,726 | ) |
12/21/2022 | | Citibank, N.A. | | | USD | | | | 117,275 | | | | ZAR | | | | 2,062,380 | | | | (5,422 | ) |
12/21/2022 | | Deutsche Bank AG | | | MXN | | | | 4,787,910 | | | | USD | | | | 234,438 | | | | (5,153 | ) |
12/21/2022 | | Deutsche Bank AG | | | USD | | | | 2,637,706 | | | | CNY | | | | 18,307,000 | | | | (118,076 | ) |
12/21/2022 | | Deutsche Bank AG | | | USD | | | | 1,144,976 | | | | GBP | | | | 992,627 | | | | (4,685 | ) |
12/21/2022 | | Goldman Sachs International | | | USD | | | | 76,544 | | | | CLP | | | | 71,929,590 | | | | (931 | ) |
12/21/2022 | | Goldman Sachs International | | | USD | | | | 982 | | | | COP | | | | 4,890,240 | | | | (0 | ) |
12/21/2022 | | Goldman Sachs International | | | USD | | | | 60,590 | | | | HUF | | | | 24,779,190 | | | | (1,602 | ) |
12/21/2022 | | Goldman Sachs International | | | USD | | | | 86,392 | | | | IDR | | | | 1,292,160,000 | | | | (3,830 | ) |
12/21/2022 | | Goldman Sachs International | | | USD | | | | 131,621 | | | | SGD | | | | 184,950 | | | | (931 | ) |
See accompanying Notes to Financial Statements which are an integral part of the financial statements.
| | |
| 16 | | Invesco World Bond Factor Fund |
| | | | | | | | | | | | | | | | | | | | | | |
| Open Forward Foreign Currency Contracts–(continued) | |
Settlement
Date | | | | Contract to | | | Unrealized
Appreciation
(Depreciation) | |
| | Counterparty | | Deliver | | | Receive | |
12/21/2022 | | Goldman Sachs International | | | USD | | | | 66,524 | | | | THB | | | | 2,424,000 | | | | $ (2,555) | |
12/21/2022 | | J.P. Morgan Chase Bank, N.A. | | | CAD | | | | 440,110 | | | | USD | | | | 321,699 | | | | (1,537 | ) |
12/21/2022 | | J.P. Morgan Chase Bank, N.A. | | | EUR | | | | 431,000 | | | | USD | | | | 422,110 | | | | (5,566 | ) |
12/21/2022 | | J.P. Morgan Chase Bank, N.A. | | | NOK | | | | 129,000 | | | | USD | | | | 11,865 | | | | (565 | ) |
12/21/2022 | | J.P. Morgan Chase Bank, N.A. | | | SEK | | | | 290,200 | | | | USD | | | | 26,080 | | | | (312 | ) |
12/21/2022 | | J.P. Morgan Chase Bank, N.A. | | | USD | | | | 16,153 | | | | EUR | | | | 16,270 | | | | (9 | ) |
12/21/2022 | | J.P. Morgan Chase Bank, N.A. | | | USD | | | | 80,428 | | | | GBP | | | | 70,000 | | | | (15 | ) |
12/21/2022 | | J.P. Morgan Chase Bank, N.A. | | | USD | | | | 88,109 | | | | INR | | | | 7,063,570 | | | | (3,280 | ) |
12/21/2022 | | J.P. Morgan Chase Bank, N.A. | | | USD | | | | 1,337,019 | | | | JPY | | | | 191,469,992 | | | | (41,310 | ) |
12/21/2022 | | J.P. Morgan Chase Bank, N.A. | | | USD | | | | 590,611 | | | | NOK | | | | 6,077,880 | | | | (4,984 | ) |
12/21/2022 | | Morgan Stanley and Co. International PLC | | | CAD | | | | 53,012 | | | | USD | | | | 38,909 | | | | (26 | ) |
12/21/2022 | | Morgan Stanley and Co. International PLC | | | HUF | | | | 8,220,340 | | | | USD | | | | 19,562 | | | | (7 | ) |
12/21/2022 | | Morgan Stanley and Co. International PLC | | | PLN | | | | 13,000 | | | | USD | | | | 2,583 | | | | (118 | ) |
12/21/2022 | | Morgan Stanley and Co. International PLC | | | USD | | | | 3,034,628 | | | | AUD | | | | 4,490,705 | | | | (157,578 | ) |
12/21/2022 | | Morgan Stanley and Co. International PLC | | | USD | | | | 20,536 | | | | CHF | | | | 20,000 | | | | (443 | ) |
12/21/2022 | | Morgan Stanley and Co. International PLC | | | USD | | | | 6,260,093 | | | | EUR | | | | 6,227,000 | | | | (81,109 | ) |
12/21/2022 | | Morgan Stanley and Co. International PLC | | | USD | | | | 24,490 | | | | SGD | | | | 34,650 | | | | (5 | ) |
12/02/2022 | | Royal Bank of Canada | | | BRL | | | | 39,520 | | | | USD | | | | 7,228 | | | | (375 | ) |
12/21/2022 | | Royal Bank of Canada | | | USD | | | | 48,751 | | | | COP | | | | 221,516,240 | | | | (4,279 | ) |
12/21/2022 | | Royal Bank of Canada | | | USD | | | | 64,985 | | | | JPY | | | | 9,329,610 | | | | (1,850 | ) |
12/21/2022 | | State Street Bank & Trust Co. | | | CZK | | | | 71,000 | | | | USD | | | | 2,856 | | | | (1 | ) |
12/21/2022 | | State Street Bank & Trust Co. | | | EUR | | | | 133,000 | | | | USD | | | | 131,290 | | | | (684 | ) |
12/21/2022 | | UBS AG | | | USD | | | | 392 | | | | PLN | | | | 1,879 | | | | (2 | ) |
12/21/2022 | | UBS AG | | | USD | | | | 8,996 | | | | TRY | | | | 173,630 | | | | (19 | ) |
Subtotal–Depreciation | | | | | | | | | | | | | | | | | | | (536,252 | ) |
Total Forward Foreign Currency Contracts | | | | | | | | | | | | | | | | | | | $ (4,983) | |
| | | | | | | | | | | | | | | | | | | | | | | | | | | | | | |
| | | | | Open Centrally Cleared Interest Rate Swap Agreements(a) | | | | | | | | | | |
Pay/ Receive Floating Rate | | Floating Rate Index | | Payment
Frequency | | (Pay)/
Receive
Fixed
Rate | | Payment
Frequency | | Maturity
Date | | | Notional Value | | | Upfront
Payments
Paid
(Received) | | | Value | | | Unrealized
Appreciation
(Depreciation) | |
| Interest Rate Risk | | | | | | | | | | | | | | | | | | | | | | | | | | | | |
Receive | | 3 Month CDOR | | Semi-Annually | | (3.66)% | | Semi-Annually | | | 06/30/2032 | | | CAD | | | 143,000 | | | $ | (266 | ) | | $ | 927 | | | | $ 1,193 | |
Pay | | 3 Month CNRR007 | | Quarterly | | 2.47 | | Quarterly | | | 07/29/2027 | | | CNY | | | 4,000,000 | | | | – | | | | 2,508 | | | | 2,508 | |
Receive | | SONIA | | Annually | | (1.25) | | Annually | | | 09/30/2051 | | | GBP | | | 6,000 | | | | (550 | ) | | | 2,539 | | | | 3,089 | |
Receive | | 6 Month NIBOR | | Semi-Annually | | (1.27) | | Annually | | | 08/31/2031 | | | NOK | | | 302,000 | | | | 887 | | | | 5,375 | | | | 4,488 | |
Receive | | 3 Month STIBOR | | Quarterly | | (2.60) | | Annually | | | 07/05/2032 | | | SEK | | | 1,573,000 | | | | – | | | | 5,809 | | | | 5,809 | |
Receive | | 6 Month EURIBOR | | Semi-Annually | | (0.49) | | Annually | | | 08/31/2023 | | | EUR | | | 383,000 | | | | 377 | | | | 7,999 | | | | 7,622 | |
Receive | | 6 Month EURIBOR | | Semi-Annually | | (0.26) | | Annually | | | 07/29/2024 | | | EUR | | | 330,000 | | | | 4,883 | | | | 12,939 | | | | 8,056 | |
Receive | | SONIA | | Annually | | (3.41) | | Annually | | | 09/01/2027 | | | GBP | | | 187,000 | | | | – | | | | 8,083 | | | | 8,083 | |
Receive | | 6 Month NIBOR | | Semi-Annually | | (1.94) | | Annually | | | 01/06/2032 | | | NOK | | | 654,000 | | | | 5 | | | | 8,675 | | | | 8,670 | |
Receive | | 6 Month SARON | | Semi-Annually | | (0.33) | | Annually | | | 12/02/2026 | | | CHF | | | 132,000 | | | | 48 | | | | 10,306 | | | | 10,258 | |
Receive | | 3 Month USD LIBOR | | Quarterly | | (1.81) | | Semi-Annually | | | 10/08/2051 | | | USD | | | 31,000 | | | | – | | | | 10,678 | | | | 10,678 | |
Pay | | 3 Month CNRR007 | | Quarterly | | 2.83 | | Quarterly | | | 04/08/2026 | | | CNY | | | 7,065,538 | | | | – | | | | 18,323 | | | | 18,323 | |
Receive | | 3 Month USD LIBOR | | Quarterly | | (0.67) | | Semi-Annually | | | 10/08/2024 | | | USD | | | 317,000 | | | | – | | | | 24,505 | | | | 24,505 | |
Receive | | 3 Month STIBOR | | Quarterly | | (1.15) | | Annually | | | 02/02/2032 | | | SEK | | | 1,956,000 | | | | 549 | | | | 27,570 | | | | 27,021 | |
Pay | | 3 Month CNRR007 | | Quarterly | | 2.59 | | Quarterly | | | 10/29/2025 | | | CNY | | | 20,000,000 | | | | – | | | | 30,492 | | | | 30,492 | |
Receive | | 6 Month EUR LIBOR | | Semi-Annually | | (0.37) | | Annually | | | 11/30/2023 | | | EUR | | | 568,000 | | | | (14,671 | ) | | | 16,961 | | | | 31,632 | |
Receive | | SONIA | | Annually | | (1.18) | | Annually | | | 09/30/2031 | | | GBP | | | 192,000 | | | | (7,381 | ) | | | 43,578 | | | | 50,959 | |
See accompanying Notes to Financial Statements which are an integral part of the financial statements.
| | |
| 17 | | Invesco World Bond Factor Fund |
| | | | | | | | | | | | | | | | | | | | | | | | | | | | | | | | | | | | | | |
| Open Centrally Cleared Interest Rate Swap Agreements(a)–(continued) | |
Pay/ Receive Floating Rate | | Floating Rate Index | | Payment
Frequency | | | (Pay)/
Receive
Fixed
Rate | | Payment
Frequency | | | Maturity
Date | | | Notional Value | | | Upfront
Payments
Paid
(Received) | | | Value | | | Unrealized
Appreciation
(Depreciation) |
Receive | | 3 Month NDBB | | | Quarterly | | | | (1.46 | )% | | | Semi-Annually | | | | 08/03/2026 | | | | NZD | | | | 1,018,000 | | | | $ (2,406 | ) | | $ | 67,611 | | | | $ 70,017 | |
Receive | | 3 Month NDBB | | | Quarterly | | | | (1.81 | ) | | | Semi-Annually | | | | 08/03/2031 | | | | NZD | | | | 772,000 | | | | 4,510 | | | | 90,087 | | | | 85,577 | |
Subtotal – Appreciation | | | | | | | | | | | | | | | | | | | | | | | | | | | (14,015 | ) | | | 394,965 | | | | 408,980 | |
| Interest Rate Risk | | | | | | | | | | | | | | | | | | | | | | | |
Receive | | 3 Month STIBOR | | | Quarterly | | | | (3.28 | ) | | | Annually | | | | 10/04/2027 | | | | SEK | | | | 1,271,000 | | | | – | | | | (634 | ) | | | (634 | ) |
Pay | | TONAR | | | Annually | | | | 0.06 | | | | Annually | | | | 03/01/2024 | | | | JPY | | | | 51,556,000 | | | | 431 | | | | (2 | ) | | | (433 | ) |
Pay | | 3 Month STIBOR | | | Quarterly | | | | 0.49 | | | | Annually | | | | 02/08/2031 | | | | SEK | | | | 171 | | | | (1 | ) | | | (3 | ) | | | (2 | ) |
Subtotal – Depreciation | | | | | | | | | | | | | | | | | | | | | | | | | | | 430 | | | | (639 | ) | | | (1,069 | ) |
Total Centrally Cleared Interest Rate Swap Agreements | | | | | | | | | | | | | | | | $(13,585 | ) | | $ | 394,326 | | | | $407,911 | |
| (a) | Centrally cleared swap agreements collateralized by $70,907 cash held with Merrill Lynch International. |
| | |
| Abbreviations: |
| |
| AUD | | –Australian Dollar |
| BRL | | –Brazilian Real |
| CAD | | –Canadian Dollar |
| CDOR | | –Canadian Dealer Offered Rate |
| CHF | | –Swiss Franc |
| CLP | | –Chile Peso |
| CNRR007 | | –China 7-Day Reverse Repo Rate |
| CNY | | –Chinese Yuan Renminbi |
| COP | | –Colombia Peso |
| CZK | | –Czech Koruna |
| EUR | | –Euro |
| EURIBOR | | –Euro Interbank Offered Rate |
| GBP | | –British Pound Sterling |
| HUF | | –Hungarian Forint |
| IDR | | –Indonesian Rupiah |
| INR | | –Indian Rupee |
| JPY | | –Japanese Yen |
| KRW | | –South Korean Won |
| LIBOR | | –London Interbank Offered Rate |
| MXN | | –Mexican Peso |
| NDBB | | –New Zealand Dollar Bank Bill |
| NIBOR | | –Norwegian Interbank Offered Rate |
| NOK | | –Norwegian Krone |
| NZD | | –New Zealand Dollar |
| PLN | | –Polish Zloty |
| SARON | | –Swiss Average Rate Overnight |
| SEK | | –Swedish Krona |
| SGD | | –Singapore Dollar |
| SONIA | | –Sterling Overnight Index Average |
| STIBOR | | –Stockholm Interbank Offered Rate |
| THB | | –Thai Baht |
| TONAR | | –Tokyo Overnight Average Rate |
| TRY | | –Turkish Lira |
| USD | | –U.S. Dollar |
| ZAR | | –South African Rand |
See accompanying Notes to Financial Statements which are an integral part of the financial statements.
| | |
| 18 | | Invesco World Bond Factor Fund |
Statement of Assets and Liabilities
October 31, 2022
| | | | |
Assets: | | | | |
Investments in unaffiliated securities, at value
(Cost $37,080,285)* | | $ | 30,278,276 | |
|
| |
Investments in affiliates, at value
(Cost $567,919) | | | 489,899 | |
|
| |
Other investments: | | | | |
Variation margin receivable - futures contracts | | | 1,161 | |
|
| |
Variation margin receivable-centrally cleared swap agreements | | | 45,994 | |
|
| |
Unrealized appreciation on forward foreign currency contracts outstanding | | | 531,269 | |
|
| |
Deposits with brokers: | | | | |
Cash collateral - centrally cleared swap agreements | | | 70,907 | |
|
| |
Cash | | | 165,673 | |
|
| |
Foreign currencies, at value (Cost $192,098) | | | 209,214 | |
|
| |
Receivable for: | | | | |
Investments sold | | | 278,031 | |
|
| |
Fund shares sold | | | 4,933 | |
|
| |
Dividends | | | 1,005 | |
|
| |
Interest | | | 259,036 | |
|
| |
Investment for trustee deferred compensation and retirement plans | | | 21,287 | |
|
| |
Other assets | | | 36,535 | |
|
| |
Total assets | | | 32,393,220 | |
|
| |
| |
Liabilities: | | | | |
Other investments: | | | | |
Unrealized depreciation on forward foreign currency contracts outstanding | | | 536,252 | |
|
| |
Payable for: | | | | |
Investments purchased | | | 327,708 | |
|
| |
TBA sales commitment | | | 1,363,613 | |
|
| |
Fund shares reacquired | | | 464 | |
|
| |
Collateral upon return of securities loaned | | | 121,612 | |
|
| |
Accrued fees to affiliates | | | 14,035 | |
|
| |
Accrued trustees’ and officers’ fees and benefits | | | 828 | |
|
| |
Accrued other operating expenses | | | 194,307 | |
|
| |
Trustee deferred compensation and retirement plans | | | 23,634 | |
|
| |
Total liabilities | | | 2,582,453 | |
|
| |
Net assets applicable to shares outstanding | | $ | 29,810,767 | |
|
| |
| | | | |
Net assets consist of: | | | | |
Shares of beneficial interest | | $ | 38,501,672 | |
|
| |
Distributable earnings (loss) | | | (8,690,905 | ) |
|
| |
| | $ | 29,810,767 | |
|
| |
| |
Net Assets: | | | | |
Class A | | $ | 16,081,134 | |
|
| |
Class C | | $ | 1,300,866 | |
|
| |
Class Y | | $ | 11,167,074 | |
|
| |
Class R5 | | $ | 665 | |
|
| |
Class R6 | | $ | 1,261,028 | |
|
| |
|
Shares outstanding, no par value, with an unlimited number of shares authorized: | |
Class A | | | 1,953,217 | |
|
| |
Class C | | | 158,365 | |
|
| |
Class Y | | | 1,357,144 | |
|
| |
Class R5 | | | 81.25 | |
|
| |
Class R6 | | | 153,076 | |
|
| |
Class A: | | | | |
Net asset value per share | | $ | 8.23 | |
|
| |
Maximum offering price per share
(Net asset value of $8.23 ÷ 95.75%) | | $ | 8.60 | |
|
| |
Class C: | | | | |
Net asset value and offering price per share | | $ | 8.21 | |
|
| |
Class Y: | | | | |
Net asset value and offering price per share | | $ | 8.23 | |
|
| |
Class R5: | | | | |
Net asset value and offering price per share | | $ | 8.18 | |
|
| |
Class R6: | | | | |
Net asset value and offering price per share | | $ | 8.24 | |
|
| |
| * | At October 31, 2022, securities with an aggregate value of $118,406 were on loan to brokers. |
See accompanying Notes to Financial Statements which are an integral part of the financial statements.
| | |
| 19 | | Invesco World Bond Factor Fund |
Statement of Operations
For the year ended October 31, 2022
| | | | |
Investment income: | | | | |
Interest (net of foreign withholding taxes of $2,158) | | $ | 493,330 | |
|
| |
Dividends from affiliates (includes net securities lending income of $83) | | | 25,845 | |
|
| |
Total investment income | | | 519,175 | |
|
| |
| |
Expenses: | | | | |
Advisory fees | | | 100,801 | |
|
| |
Administrative services fees | | | 5,458 | |
|
| |
Custodian fees | | | 80,399 | |
|
| |
Distribution fees: | | | | |
Class A | | | 51,094 | |
|
| |
Class C | | | 16,660 | |
|
| |
Transfer agent fees – A, C and Y | | | 74,319 | |
|
| |
Transfer agent fees – R6 | | | 418 | |
|
| |
Trustees’ and officers’ fees and benefits | | | 19,310 | |
|
| |
Registration and filing fees | | | 66,190 | |
|
| |
Reports to shareholders | | | 7,163 | |
|
| |
Professional services fees | | | 62,850 | |
|
| |
Other | | | 16,827 | |
|
| |
Total expenses | | | 501,489 | |
|
| |
Less: Fees waived, expenses reimbursed and/or expense offset arrangement(s) | | | (318,828 | ) |
|
| |
Net expenses | | | 182,661 | |
|
| |
Net investment income | | | 336,514 | |
|
| |
| |
Realized and unrealized gain (loss) from: | | | | |
Net realized gain (loss) from: | | | | |
Unaffiliated investment securities | | | (3,229,738 | ) |
|
| |
Affiliated investment securities | | | (125 | ) |
|
| |
Foreign currencies | | | 48,139 | |
|
| |
Forward foreign currency contracts | | | 15,335 | |
|
| |
Futures contracts | | | (412,732 | ) |
|
| |
Swap agreements | | | 208,513 | |
|
| |
| | | (3,370,608 | ) |
|
| |
Change in net unrealized appreciation (depreciation) of: | | | | |
Unaffiliated investment securities (net of foreign taxes of $813) | | | (6,150,271 | ) |
|
| |
Affiliated investment securities | | | (78,138 | ) |
|
| |
Foreign currencies | | | 13,050 | |
|
| |
Forward foreign currency contracts | | | 226,424 | |
|
| |
Futures contracts | | | 30,775 | |
|
| |
Swap agreements | | | 252,454 | |
|
| |
| | | (5,705,706 | ) |
|
| |
Net realized and unrealized gain (loss) | | | (9,076,314 | ) |
|
| |
Net increase (decrease) in net assets resulting from operations | | $ | (8,739,800 | ) |
|
| |
See accompanying Notes to Financial Statements which are an integral part of the financial statements.
| | |
| 20 | | Invesco World Bond Factor Fund |
Statement of Changes in Net Assets
For the years ended October 31, 2022 and 2021
| | | | | | | | |
| | | 2022 | | | 2021 | |
|
| |
Operations: | | | | | | | | |
Net investment income | | $ | 336,514 | | | $ | 240,062 | |
|
| |
Net realized gain (loss) | | | (3,370,608 | ) | | | 1,250,504 | |
|
| |
Change in net unrealized appreciation (depreciation) | | | (5,705,706 | ) | | | (1,776,023 | ) |
|
| |
Net increase (decrease) in net assets resulting from operations | | | (8,739,800 | ) | | | (285,457 | ) |
|
| |
| | |
Distributions to shareholders from distributable earnings: | | | | | | | | |
Class A | | | (405,867 | ) | | | (598,985 | ) |
|
| |
Class C | | | (22,570 | ) | | | (38,984 | ) |
|
| |
Class Y | | | (308,318 | ) | | | (362,187 | ) |
|
| |
Class R5 | | | (17 | ) | | | (23 | ) |
|
| |
Class R6 | | | (28,190 | ) | | | (16,326 | ) |
|
| |
Total distributions from distributable earnings | | | (764,962 | ) | | | (1,016,505 | ) |
|
| |
| | |
Return of capital: | | | | | | | | |
Class A | | | (49,271 | ) | | | – | |
|
| |
Class C | | | (2,604 | ) | | | – | |
|
| |
Class Y | | | (37,742 | ) | | | – | |
|
| |
Class R5 | | | (2 | ) | | | – | |
|
| |
Class R6 | | | (3,502 | ) | | | – | |
|
| |
Total return of capital | | | (93,121 | ) | | | – | |
|
| |
Total distributions | | | (858,083 | ) | | | (1,016,505 | ) |
|
| |
| | |
Share transactions–net: | | | | | | | | |
Class A | | | (2,795,234 | ) | | | (1,284,998 | ) |
|
| |
Class C | | | (352,050 | ) | | | (346,200 | ) |
|
| |
Class Y | | | (1,667,541 | ) | | | 5,128,819 | |
|
| |
Class R6 | | | 405,699 | | | | 971,470 | |
|
| |
Net increase (decrease) in net assets resulting from share transactions | | | (4,409,126 | ) | | | 4,469,091 | |
|
| |
Net increase (decrease) in net assets | | | (14,007,009 | ) | | | 3,167,129 | |
|
| |
| | |
Net assets: | | | | | | | | |
Beginning of year | | | 43,817,776 | | | | 40,650,647 | |
|
| |
End of year | | $ | 29,810,767 | | | $ | 43,817,776 | |
|
| |
See accompanying Notes to Financial Statements which are an integral part of the financial statements.
| | |
| 21 | | Invesco World Bond Factor Fund |
Financial Highlights
The following schedule presents financial highlights for a share of the Fund outstanding throughout the periods indicated.
| | | | | | | | | | | | | | | | | | | | | | | | | | | | | | | | | | | | | | | | | | | | | | | | | | | | | | | | | | | | |
| | | Net asset
value,
beginning
of period | | Net
investment
income
(loss)(a) | | Net gains
(losses) on securities
(both
realized and
unrealized) | | Total from
investment
operations | | Dividends
from net
investment
income | | Distributions
from net
realized
gains | | Return of
capital | | Total
distributions | | Net asset
value, end
of period | | Total
return (b) | | Net assets,
end of period
(000’s omitted) | | Ratio of expenses to average net assets with fee waivers and/or
expenses
absorbed | | Ratio of expenses to average net assets without fee waivers and/or
expenses
absorbed | | Ratio of net
investment
income
(loss) to average
net assets | | Portfolio
turnover (c) |
Class A | | | | | | | | | | | | | | | | | | | | | | | | | | | | | | | | | | | | | | | | | | | | | | | | | | | | | | | | | | | | |
Year ended 10/31/22 | | | $10.71 | | | | $0.08 | | | | $(2.35 | ) | | | $(2.27 | ) | | | $(0.17 | ) | | | $(0.02 | ) | | | $(0.02 | ) | | | $(0.21 | ) | | | $8.23 | | | | (21.52 | )% | | | $16,081 | | | | 0.56 | % | | | 1.42 | % | | | 0.83 | % | | | 123 | % |
Year ended 10/31/21 | | | 11.01 | | | | 0.05 | | | | (0.10 | ) | | | (0.05 | ) | | | (0.12 | ) | | | (0.13 | ) | | | – | | | | (0.25 | ) | | | 10.71 | | | | (0.49 | ) | | | 24,150 | | | | 0.54 | | | | 1.25 | | | | 0.49 | | | | 165 | |
Year ended 10/31/20 | | | 10.61 | | | | 0.13 | | | | 0.45 | | | | 0.58 | | | | (0.18 | ) | | | – | | | | – | | | | (0.18 | ) | | | 11.01 | | | | 5.56 | | | | 26,165 | | | | 0.64 | | | | 1.49 | | | | 1.21 | | | | 191 | |
Year ended 10/31/19 | | | 9.66 | | | | 0.30 | | | | 0.92 | | | | 1.22 | | | | (0.11 | ) | | | – | | | | (0.16 | ) | | | (0.27 | ) | | | 10.61 | | | | 12.83 | | | | 20,458 | | | | 0.94 | | | | 2.08 | | | | 2.97 | | | | 177 | |
Year ended 10/31/18 | | | 10.43 | | | | 0.33 | | | | (0.83 | ) | | | (0.50 | ) | | | (0.21 | ) | | | – | | | | (0.06 | ) | | | (0.27 | ) | | | 9.66 | | | | (4.89 | ) | | | 18,347 | | | | 0.93 | | | | 2.21 | | | | 3.25 | | | | 131 | |
Class C | | | | | | | | | | | | | | | | | | | | | | | | | | | | | | | | | | | | | | | | | | | | | | | | | | | | | | | | | | | | |
Year ended 10/31/22 | | | 10.68 | | | | 0.01 | | | | (2.34 | ) | | | (2.33 | ) | | | (0.11 | ) | | | (0.02 | ) | | | (0.01 | ) | | | (0.14 | ) | | | 8.21 | | | | (22.09 | ) | | | 1,301 | | | | 1.31 | | | | 2.17 | | | | 0.08 | | | | 123 | |
Year ended 10/31/21 | | | 10.98 | | | | (0.03 | ) | | | (0.10 | ) | | | (0.13 | ) | | | (0.04 | ) | | | (0.13 | ) | | | – | | | | (0.17 | ) | | | 10.68 | | | | (1.24 | ) | | | 2,079 | | | | 1.29 | | | | 2.00 | | | | (0.26 | ) | | | 165 | |
Year ended 10/31/20 | | | 10.59 | | | | 0.05 | | | | 0.45 | | | | 0.50 | | | | (0.11 | ) | | | – | | | | – | | | | (0.11 | ) | | | 10.98 | | | | 4.74 | | | | 2,482 | | | | 1.39 | | | | 2.24 | | | | 0.46 | | | | 191 | |
Year ended 10/31/19 | | | 9.64 | | | | 0.22 | | | | 0.93 | | | | 1.15 | | | | (0.08 | ) | | | – | | | | (0.12 | ) | | | (0.20 | ) | | | 10.59 | | | | 12.01 | | | | 2,046 | | | | 1.69 | | | | 2.83 | | | | 2.22 | | | | 177 | |
Year ended 10/31/18 | | | 10.41 | | | | 0.26 | | | | (0.84 | ) | | | (0.58 | ) | | | (0.15 | ) | | | – | | | | (0.04 | ) | | | (0.19 | ) | | | 9.64 | | | | (5.62 | ) | | | 3,591 | | | | 1.68 | | | | 2.96 | | | | 2.50 | | | | 131 | |
Class Y | | | | | | | | | | | | | | | | | | | | | | | | | | | | | | | | | | | | | | | | | | | | | | | | | | | | | | | | | | | | |
Year ended 10/31/22 | | | 10.70 | | | | 0.10 | | | | (2.33 | ) | | | (2.23 | ) | | | (0.19 | ) | | | (0.02 | ) | | | (0.03 | ) | | | (0.24 | ) | | | 8.23 | | | | (21.25 | ) | | | 11,167 | | | | 0.31 | | | | 1.17 | | | | 1.08 | | | | 123 | |
Year ended 10/31/21 | | | 11.01 | | | | 0.08 | | | | (0.11 | ) | | | (0.03 | ) | | | (0.15 | ) | | | (0.13 | ) | | | – | | | | (0.28 | ) | | | 10.70 | | | | (0.33 | ) | | | 16,365 | | | | 0.29 | | | | 1.00 | | | | 0.74 | | | | 165 | |
Year ended 10/31/20 | | | 10.61 | | | | 0.16 | | | | 0.44 | | | | 0.60 | | | | (0.20 | ) | | | – | | | | – | | | | (0.20 | ) | | | 11.01 | | | | 5.81 | | | | 11,717 | | | | 0.39 | | | | 1.24 | | | | 1.46 | | | | 191 | |
Year ended 10/31/19 | | | 9.65 | | | | 0.33 | | | | 0.93 | | | | 1.26 | | | | (0.12 | ) | | | – | | | | (0.18 | ) | | | (0.30 | ) | | | 10.61 | | | | 13.23 | | | | 2,783 | | | | 0.69 | | | | 1.83 | | | | 3.22 | | | | 177 | |
Year ended 10/31/18 | | | 10.42 | | | | 0.36 | | | | (0.83 | ) | | | (0.47 | ) | | | (0.23 | ) | | | – | | | | (0.07 | ) | | | (0.30 | ) | | | 9.65 | | | | (4.66 | ) | | | 2,903 | | | | 0.68 | | | | 1.96 | | | | 3.50 | | | | 131 | |
Class R5 | | | | | | | | | | | | | | | | | | | | | | | | | | | | | | | | | | | | | | | | | | | | | | | | | | | | | | | | | | | | |
Year ended 10/31/22 | | | 10.63 | | | | 0.10 | | | | (2.31 | ) | | | (2.21 | ) | | | (0.19 | ) | | | (0.02 | ) | | | (0.03 | ) | | | (0.24 | ) | | | 8.18 | | | | (21.21 | ) | | | 1 | | | | 0.31 | | | | 0.99 | | | | 1.08 | | | | 123 | |
Year ended 10/31/21 | | | 10.94 | | | | 0.08 | | | | (0.11 | ) | | | (0.03 | ) | | | (0.15 | ) | | | (0.13 | ) | | | – | | | | (0.28 | ) | | | 10.63 | | | | (0.34 | ) | | | 1 | | | | 0.29 | | | | 0.85 | | | | 0.74 | | | | 165 | |
Year ended 10/31/20 | | | 10.56 | | | | 0.15 | | | | 0.43 | | | | 0.58 | | | | (0.20 | ) | | | – | | | | – | | | | (0.20 | ) | | | 10.94 | | | | 5.64 | | | | 1 | | | | 0.39 | | | | 1.11 | | | | 1.46 | | | | 191 | |
Year ended 10/31/19 | | | 9.64 | | | | 0.33 | | | | 0.89 | | | | 1.22 | | | | (0.12 | ) | | | – | | | | (0.18 | ) | | | (0.30 | ) | | | 10.56 | | | | 12.81 | | | | 1 | | | | 0.69 | | | | 1.60 | | | | 3.22 | | | | 177 | |
Year ended 10/31/18 | | | 10.42 | | | | 0.36 | | | | (0.84 | ) | | | (0.48 | ) | | | (0.23 | ) | | | – | | | | (0.07 | ) | | | (0.30 | ) | | | 9.64 | | | | (4.75 | ) | | | 1 | | | | 0.68 | | | | 1.73 | | | | 3.50 | | | | 131 | |
Class R6 | | | | | | | | | | | | | | | | | | | | | | | | | | | | | | | | | | | | | | | | | | | | | | | | | | | | | | | | | | | | |
Year ended 10/31/22 | | | 10.71 | | | | 0.10 | | | | (2.33 | ) | | | (2.23 | ) | | | (0.19 | ) | | | (0.02 | ) | | | (0.03 | ) | | | (0.24 | ) | | | 8.24 | | | | (21.23 | ) | | | 1,261 | | | | 0.31 | | | | 0.99 | | | | 1.08 | | | | 123 | |
Year ended 10/31/21 | | | 11.02 | | | | 0.08 | | | | (0.11 | ) | | | (0.03 | ) | | | (0.15 | ) | | | (0.13 | ) | | | – | | | | (0.28 | ) | | | 10.71 | | | | (0.33 | ) | | | 1,224 | | | | 0.29 | | | | 0.85 | | | | 0.74 | | | | 165 | |
Year ended 10/31/20 | | | 10.62 | | | | 0.15 | | | | 0.46 | | | | 0.61 | | | | (0.21 | ) | | | – | | | | – | | | | (0.21 | ) | | | 11.02 | | | | 5.81 | | | | 286 | | | | 0.39 | | | | 1.11 | | | | 1.46 | | | | 191 | |
Year ended 10/31/19 | | | 9.66 | | | | 0.33 | | | | 0.93 | | | | 1.26 | | | | (0.12 | ) | | | – | | | | (0.18 | ) | | | (0.30 | ) | | | 10.62 | | | | 13.21 | | | | 138 | | | | 0.69 | | | | 1.60 | | | | 3.22 | | | | 177 | |
Year ended 10/31/18 | | | 10.43 | | | | 0.35 | | | | (0.82 | ) | | | (0.47 | ) | | | (0.23 | ) | | | – | | | | (0.07 | ) | | | (0.30 | ) | | | 9.66 | | | | (4.65 | ) | | | 106 | | | | 0.68 | | | | 1.73 | | | | 3.50 | | | | 131 | |
| (a) | Calculated using average shares outstanding. |
| (b) | Includes adjustments in accordance with accounting principles generally accepted in the United States of America and as such, the net asset value for financial reporting purposes and the returns based upon those net asset values may differ from the net asset value and returns for shareholder transactions. Does not include sales charges and is not annualized for periods less than one year, if applicable. |
| (c) | Portfolio turnover is calculated at the fund level and is not annualized for periods less than one year, if applicable. |
See accompanying Notes to Financial Statements which are an integral part of the financial statements.
| | |
| 22 | | Invesco World Bond Factor Fund |
Notes to Financial Statements
October 31, 2022
NOTE 1—Significant Accounting Policies
Invesco World Bond Factor Fund (the “Fund”) is a series portfolio of AIM Investment Funds (Invesco Investment Funds) (the “Trust”). The Trust is organized as a Delaware statutory trust and is registered under the Investment Company Act of 1940, as amended (the “1940 Act”), as an open-end series management investment company authorized to issue an unlimited number of shares of beneficial interest. Information presented in these financial statements pertains only to the Fund. Matters affecting the Fund or each class will be voted on exclusively by the shareholders of the Fund or each class.
The Fund’s investment objective is total return.
The Fund currently consists of five different classes of shares: Class A, Class C, Class Y, Class R5 and Class R6. Class Y shares are available only to certain investors. Class A shares are sold with a front-end sales charge unless certain waiver criteria are met. Under certain circumstances, load waived shares may be subject to contingent deferred sales charges (“CDSC”). Class C shares are sold with a CDSC. Class Y, Class R5 and Class R6 shares are sold at net asset value. Class C shares held for eight years after purchase are eligible for automatic conversion into Class A shares of the same Fund (the “Conversion Feature”). The automatic conversion pursuant to the Conversion Feature will generally occur at the end of the month following the eighth anniversary after a purchase of Class C shares.
The Fund is an investment company and accordingly follows the investment company accounting and reporting guidance in accordance with Financial Accounting Standards Board Accounting Standards Codification Topic 946, Financial Services – Investment Companies.
The following is a summary of the significant accounting policies followed by the Fund in the preparation of its financial statements.
| A. | Security Valuations – Securities, including restricted securities, are valued according to the following policy. |
Fixed income securities (including convertible debt securities) generally are valued on the basis of prices provided by independent pricing services. Prices provided by the pricing service may be determined without exclusive reliance on quoted prices, and may reflect appropriate factors such as institution-size trading in similar groups of securities, developments related to specific securities, dividend rate (for unlisted equities), yield (for debt obligations), quality, type of issue, coupon rate (for debt obligations), maturity (for debt obligations), individual trading characteristics and other market data. Pricing services generally value debt obligations assuming orderly transactions of institutional round lot size, but a fund may hold or transact in the same securities in smaller, odd lot sizes. Odd lots often trade at lower prices than institutional round lots, and their value may be adjusted accordingly. Debt obligations are subject to interest rate and credit risks. In addition, all debt obligations involve some risk of default with respect to interest and/or principal payments.
A security listed or traded on an exchange is generally valued at its trade price or official closing price that day as of the close of the exchange where the security is principally traded, or lacking any trades or official closing price on a particular day, the security may be valued at the closing bid price on that day. Securities traded in the over-the-counter market are valued based on prices furnished by independent pricing services or market makers. When such securities are valued using prices provided by an independent pricing service they may be considered fair valued. Futures contracts are valued at the daily settlement price set by an exchange on which they are principally traded. U.S. exchange-traded options are valued at the mean between the last bid and asked prices from the exchange on which they are principally traded. Non-U.S. exchange-traded options are valued at the final settlement price set by the exchange on which they trade. Options not listed on an exchange and swaps generally are valued using pricing provided from independent pricing services.
Securities of investment companies that are not exchange-traded (e.g., open-end mutual funds) are valued using such company’s end-of-business-day net asset value per share.
Deposits, other obligations of U.S. and non-U.S. banks and financial institutions are valued at their daily account value.
Swap agreements are fair valued using an evaluated quote, if available, provided by an independent pricing service. Evaluated quotes provided by the pricing service are valued based on a model which may include end-of-day net present values, spreads, ratings, industry, company performance and returns of referenced assets. Centrally cleared swap agreements are valued at the daily settlement price determined by the relevant exchange or clearinghouse.
Foreign securities’ (including foreign exchange contracts) prices are converted into U.S. dollar amounts using the applicable exchange rates as of the close of the New York Stock Exchange (“NYSE”). If market quotations are available and reliable for foreign exchange-traded equity securities, the securities will be valued at the market quotations. Invesco Advisers, Inc. (the “Adviser” or “Invesco”) may use various pricing services to obtain market quotations as well as fair value prices. Because trading hours for certain foreign securities end before the close of the NYSE, closing market quotations may become not representative of market value in the Adviser’s judgment (“unreliable”). If, between the time trading ends on a particular security and the close of the customary trading session on the NYSE, a significant event occurs that makes the closing price of the security unreliable, the Adviser may fair value the security. If the event is likely to have affected the closing price of the security, the security will be valued at fair value in good faith in accordance with Board-approved policies and related Adviser procedures (“Valuation Procedures”). Adjustments to closing prices to reflect fair value may also be based on a screening process of an independent pricing service to indicate the degree of certainty, based on historical data, that the closing price in the principal market where a foreign security trades is not the current value as of the close of the NYSE. Foreign securities’ prices meeting the degree of certainty that the price is not reflective of current value will be priced at the indication of fair value from the independent pricing service. Multiple factors may be considered by the independent pricing service in determining adjustments to reflect fair value and may include information relating to sector indices, American Depositary Receipts and domestic and foreign index futures. Foreign securities may have additional risks including exchange rate changes, potential for sharply devalued currencies and high inflation, political and economic upheaval, the relative lack of issuer information, relatively low market liquidity and the potential lack of strict financial and accounting controls and standards.
Unlisted securities will be valued using prices provided by independent pricing services or by another method that the Adviser, in its judgment, believes better reflects the security’s fair value in accordance with the Valuation Procedures.
Securities for which market prices are not provided by any of the above methods may be valued based upon quotes furnished by independent sources. The last bid price may be used to value equity securities. The mean between the last bid and asked prices may be used to value debt obligations, including corporate loans.
Securities for which market quotations are not readily available are fair valued by the Adviser in accordance with the Valuation Procedures. If a fair value price provided by a pricing service is unreliable, the Adviser will fair value the security using the Valuation Procedures. Issuer specific events, market trends, bid/asked quotes of brokers and information providers and other market data may be reviewed in the course of making a good faith determination of a security’s fair value.
The Fund may invest in securities that are subject to interest rate risk, meaning the risk that the prices will generally fall as interest rates rise and, conversely, the prices will generally rise as interest rates fall. Specific securities differ in their sensitivity to changes in interest rates depending on their individual characteristics. Changes in interest rates may result in increased market volatility, which may affect the value and/or liquidity of certain Fund investments.
Valuations change in response to many factors including the historical and prospective earnings of the issuer, the value of the issuer’s assets, general market conditions which are not specifically related to the particular issuer, such as real or perceived adverse economic conditions, changes in the general outlook for revenues or corporate earnings, changes in interest or currency rates, regional or global instability, natural or environmental disasters, widespread disease or other public health issues, war, acts of terrorism, significant governmental actions or adverse investor sentiment generally and market liquidity. Because of the inherent uncertainties of valuation, the values reflected in the financial statements may materially differ from the value received upon actual sale of those investments.
The price the Fund could receive upon the sale of any investment may differ from the Adviser’s valuation of the investment, particularly for securities that are valued using a fair valuation technique. When fair valuation techniques are applied, the Adviser uses available information, including both observable and unobservable inputs and assumptions, to determine a methodology that will result in a valuation that the Adviser believes approximates market value. Fund
| | |
| 23 | | Invesco World Bond Factor Fund |
| | securities that are fair valued may be subject to greater fluctuation in their value from one day to the next than would be the case if market quotations were used. Because of the inherent uncertainties of valuation, and the degree of subjectivity in such decisions, the Fund could realize a greater or lesser than expected gain or loss upon the sale of the investment. |
| B. | Securities Transactions and Investment Income – Securities transactions are accounted for on a trade date basis. Realized gains or losses on sales are computed on the basis of specific identification of the securities sold. Interest income (net of withholding tax, if any) is recorded on an accrual basis from settlement date and includes coupon interest and amortization of premium and accretion of discount on debt securities as applicable. Pay-in-kind interest income and non-cash dividend income received in the form of securities in-lieu of cash are recorded at the fair value of the securities received. Paydown gains and losses on mortgage and asset-backed securities are recorded as adjustments to interest income. Dividend income (net of withholding tax, if any) is recorded on the ex-dividend date. |
The Fund may periodically participate in litigation related to Fund investments. As such, the Fund may receive proceeds from litigation settlements.Any proceeds received are included in the Statement of Operations as realized gain (loss) for investments no longer held and as unrealized gain (loss) for investments still held.
Brokerage commissions and mark ups are considered transaction costs and are recorded as an increase to the cost basis of securities purchased and/or a reduction of proceeds on a sale of securities. Such transaction costs are included in the determination of net realized and unrealized gain (loss) from investment securities reported in the Statement of Operations and the Statement of Changes in Net Assets and the net realized and unrealized gains (losses) on securities per share in the Financial Highlights. Transaction costs are included in the calculation of the Fund’s net asset value and, accordingly, they reduce the Fund’s total returns. These transaction costs are not considered operating expenses and are not reflected in net investment income reported in the Statement of Operations and the Statement of Changes in Net Assets, or the net investment income per share and the ratios of expenses and net investment income reported in the Financial Highlights, nor are they limited by any expense limitation arrangements between the Fund and the investment adviser.
The Fund allocates income and realized and unrealized capital gains and losses to a class based on the relative net assets of each class.
| C. | Country Determination – For the purposes of making investment selection decisions and presentation in the Schedule of Investments, the investment adviser may determine the country in which an issuer is located and/or credit risk exposure based on various factors. These factors include the laws of the country under which the issuer is organized, where the issuer maintains a principal office, the country in which the issuer derives 50% or more of its total revenues, the country that has the primary market for the issuer’s securities and its “country of risk” as determined by a third party service provider, as well as other criteria. Among the other criteria that may be evaluated for making this determination are the country in which the issuer maintains 50% or more of its assets, the type of security, financial guarantees and enhancements, the nature of the collateral and the sponsor organization. Country of issuer and/or credit risk exposure has been determined to be the United States of America, unless otherwise noted. |
| D. | Distributions – Distributions from net investment income, if any, are declared and paid monthly. Distributions from net realized capital gain, if any, are generally declared and paid annually and recorded on the ex-dividend date. The Fund may elect to treat a portion of the proceeds from redemptions as distributions for federal income tax purposes. |
| E. | Federal Income Taxes – The Fund intends to comply with the requirements of Subchapter M of the Internal Revenue Code of 1986, as amended (the “Internal Revenue Code”), necessary to qualify as a regulated investment company and to distribute substantially all of the Fund’s taxable earnings to shareholders. As such, the Fund will not be subject to federal income taxes on otherwise taxable income (including net realized capital gain) that is distributed to shareholders. Therefore, no provision for federal income taxes is recorded in the financial statements. |
The Fund recognizes the tax benefits of uncertain tax positions only when the position is more likely than not to be sustained. Management has analyzed the Fund’s uncertain tax positions and concluded that no liability for unrecognized tax benefits should be recorded related to uncertain tax positions. Management is not aware of any tax positions for which it is reasonably possible that the total amounts of unrecognized tax benefits will change materially in the next 12 months.
The Fund files tax returns in the U.S. Federal jurisdiction and certain other jurisdictions. Generally, the Fund is subject to examinations by such taxing authorities for up to three years after the filing of the return for the tax period.
| F. | Expenses – Fees provided for under the Rule 12b-1 plan of a particular class of the Fund are charged to the operations of such class. Transfer agency fees and expenses and other shareholder recordkeeping fees and expenses attributable to Class R5 and Class R6 are allocated based on relative net assets of Class R5 and Class R6. Sub-accounting fees attributable to Class R5 are charged to the operations of the class. Transfer agency fees and expenses and other shareholder recordkeeping fees and expenses relating to all other classes are allocated among those classes based on relative net assets. All other expenses are allocated among the classes based on relative net assets. |
| G. | Accounting Estimates – The preparation of financial statements in conformity with accounting principles generally accepted in the United States of America (“GAAP”) requires management to make estimates and assumptions that affect the reported amounts of assets and liabilities at the date of the financial statements and the reported amounts of revenues and expenses during the reporting period including estimates and assumptions related to taxation. Actual results could differ from those estimates by a significant amount. In addition, the Fund monitors for material events or transactions that may occur or become known after the period-end date and before the date the financial statements are released to print. |
| H. | Indemnifications – Under the Trust’s organizational documents, each Trustee, officer, employee or other agent of the Trust is indemnified against certain liabilities that may arise out of the performance of their duties to the Fund. Additionally, in the normal course of business, the Fund enters into contracts, including the Fund’s servicing agreements, that contain a variety of indemnification clauses. The Fund’s maximum exposure under these arrangements is unknown as this would involve future claims that may be made against the Fund that have not yet occurred. The risk of material loss as a result of such indemnification claims is considered remote. |
| I. | Securities Lending – The Fund may lend portfolio securities having a market value up to one-third of the Fund’s total assets. Such loans are secured by collateral equal to no less than the market value of the loaned securities determined daily by the securities lending provider. Such collateral will be cash or debt securities issued or guaranteed by the U.S. Government or any of its sponsored agencies. Cash collateral received in connection with these loans is invested in short-term money market instruments or affiliated, unregistered investment companies that comply with Rule 2a-7 under the 1940 Act and money market funds (collectively, “affiliated money market funds”) and is shown as such on the Schedule of Investments. The Fund bears the risk of loss with respect to the investment of collateral. It is the Fund’s policy to obtain additional collateral from or return excess collateral to the borrower by the end of the next business day, following the valuation date of the securities loaned. Therefore, the value of the collateral held may be temporarily less than the value of the securities on loan. When loaning securities, the Fund retains certain benefits of owning the securities, including the economic equivalent of dividends or interest generated by the security. Lending securities entails a risk of loss to the Fund if, and to the extent that, the market value of the securities loaned were to increase and the borrower did not increase the collateral accordingly, and the borrower failed to return the securities. The securities loaned are subject to termination at the option of the borrower or the Fund. Upon termination, the borrower will return to the Fund the securities loaned and the Fund will return the collateral. Upon the failure of the borrower to return the securities, collateral may be liquidated and the securities may be purchased on the open market to replace the loaned securities. The Fund could experience delays and costs in gaining access to the collateral and the securities may lose value during the delay which could result in potential losses to the Fund. Some of these losses may be indemnified by the lending agent. The Fund bears the risk of any deficiency in the amount of the collateral available for return to the borrower due to any loss on the collateral invested. Dividends received on cash collateral investments for securities lending transactions, which are |
| | |
| 24 | | Invesco World Bond Factor Fund |
| | net of compensation to counterparties, are included in Dividends from affiliates on the Statement of Operations. The aggregate value of securities out on loan, if any, is shown as a footnote on the Statement of Assets and Liabilities. |
The Adviser serves as an affiliated securities lending agent for the Fund. The Bank of New York Mellon also serves as a lending agent. To the extent the Fund utilizes the Adviser as an affiliated securities lending agent, the Fund conducts its securities lending in accordance with, and in reliance upon, no-action letters issued by the SEC staff that provide guidance on how an affiliate may act as a direct agent lender and receive compensation for those services in a manner consistent with the federal securities laws. For the year ended October 31, 2022, Fees paid to the Adviser for securities lending agent services are included in Dividends from affiliates on the Statement of Operations.
| J. | Foreign Currency Translations – Foreign currency is valued at the close of the NYSE based on quotations posted by banks and major currency dealers. Portfolio securities and other assets and liabilities denominated in foreign currencies are translated into U.S. dollar amounts at the date of valuation. Purchases and sales of portfolio securities (net of foreign taxes withheld on disposition) and income items denominated in foreign currencies are translated into U.S. dollar amounts on the respective dates of such transactions. The Fund does not separately account for the portion of the results of operations resulting from changes in foreign exchange rates on investments and the fluctuations arising from changes in market prices of securities held. The combined results of changes in foreign exchange rates and the fluctuation of market prices on investments (net of estimated foreign tax withholding) are included with the net realized and unrealized gain or loss from investments in the Statement of Operations. Reported net realized foreign currency gains or losses arise from (1) sales of foreign currencies, (2) currency gains or losses realized between the trade and settlement dates on securities transactions, and (3) the difference between the amounts of dividends, interest, and foreign withholding taxes recorded on the Fund’s books and the U.S. dollar equivalent of the amounts actually received or paid. Net unrealized foreign currency gains and losses arise from changes in the fair values of assets and liabilities, other than investments in securities at fiscal period end, resulting from changes in exchange rates. |
The Fund may invest in foreign securities, which may be subject to foreign taxes on income, gains on investments or currency repatriation, a portion of which may be recoverable. Foreign taxes, if any, are recorded based on the tax regulations and rates that exist in the foreign markets in which the Fund invests and are shown in the Statement of Operations.
| K. | Forward Foreign Currency Contracts – The Fund may engage in foreign currency transactions either on a spot (i.e. for prompt delivery and settlement) basis, or through forward foreign currency contracts, to manage or minimize currency or exchange rate risk. |
The Fund may also enter into forward foreign currency contracts for the purchase or sale of a security denominated in a foreign currency in order to “lock in” the U.S. dollar price of that security, or the Fund may also enter into forward foreign currency contracts that do not provide for physical exchange of the two currencies on the settlement date, but instead are settled by a single cash payment calculated as the difference between the agreed upon exchange rate and the spot rate at settlement based upon an agreed upon notional amount (non-deliverable forwards).
A forward foreign currency contract is an obligation between two parties (“Counterparties”) to purchase or sell a specific currency for an agreed-upon price at a future date. The use of forward foreign currency contracts for hedging does not eliminate fluctuations in the price of the underlying securities the Fund owns or intends to acquire but establishes a rate of exchange in advance. Fluctuations in the value of these contracts are measured by the difference in the contract date and reporting date exchange rates and are recorded as unrealized appreciation (depreciation) until the contracts are closed. When the contracts are closed, realized gains (losses) are recorded. Realized and unrealized gains (losses) on the contracts are included in the Statement of Operations. The primary risks associated with forward foreign currency contracts include failure of the Counterparty to meet the terms of the contract and the value of the foreign currency changing unfavorably. These risks may be in excess of the amounts reflected in the Statement of Assets and Liabilities.
| L. | Futures Contracts – The Fund may enter into futures contracts to manage exposure to interest rate, equity and market price movements and/or currency risks. A futures contract is an agreement between Counterparties to purchase or sell a specified underlying security, currency or commodity (or delivery of a cash settlement price, in the case of an index future) for a fixed price at a future date. The Fund currently invests only in exchange-traded futures and they are standardized as to maturity date and underlying financial instrument or asset. Initial margin deposits required upon entering into futures contracts are satisfied by the segregation of specific securities or cash as collateral at the futures commission merchant (broker). During the period the futures contracts are open, changes in the value of the contracts are recognized as unrealized gains or losses by recalculating the value of the contracts on a daily basis. Subsequent or variation margin payments are received or made depending upon whether unrealized gains or losses are incurred. These amounts are reflected as receivables or payables on the Statement of Assets and Liabilities. When the contracts are closed or expire, the Fund recognizes a realized gain or loss equal to the difference between the proceeds from, or cost of, the closing transaction and the Fund’s basis in the contract. The net realized gain (loss) and the change in unrealized gain (loss) on futures contracts held during the period is included on the Statement of Operations. The primary risks associated with futures contracts are market risk and the absence of a liquid secondary market. If the Fund were unable to liquidate a futures contract and/or enter into an offsetting closing transaction, the Fund would continue to be subject to market risk with respect to the value of the contracts and continue to be required to maintain the margin deposits on the futures contracts. Futures contracts have minimal Counterparty risk since the exchange’s clearinghouse, as Counterparty to all exchange-traded futures, guarantees the futures against default. Risks may exceed amounts recognized in the Statement of Assets and Liabilities. |
| M. | Swap Agreements – The Fund may enter into various swap transactions, including interest rate, total return, index, currency and credit default swap contracts (“CDS”) for investment purposes or to manage interest rate, currency or credit risk. Such transactions are agreements between Counterparties. A swap agreement may be negotiated bilaterally and traded over-the-counter (“OTC”) between two parties (“uncleared/OTC”) or, in some instances, must be transacted through a future commission merchant (“FCM”) and cleared through a clearinghouse that serves as a central Counterparty (“centrally cleared swap”). These agreements may contain among other conditions, events of default and termination events, and various covenants and representations such as provisions that require the Fund to maintain a pre-determined level of net assets, and/or provide limits regarding the decline of the Fund’s net asset value (“NAV”) per share over specific periods of time. If the Fund were to trigger such provisions and have open derivative positions at that time, the Counterparty may be able to terminate such agreement and request immediate payment in an amount equal to the net liability positions, if any. |
Interest rate, total return, index, and currency swap agreements are two-party contracts entered into primarily to exchange the returns (or differentials in rates of returns) earned or realized on particular predetermined investments or instruments. The gross returns to be exchanged or “swapped” between the parties are calculated with respect to a notional amount, i.e., the return on or increase in value of a particular dollar amount invested at a particular interest rate or return of an underlying asset, in a particular foreign currency, or in a “basket” of securities representing a particular index.
In a centrally cleared swap, the Fund’s ultimate Counterparty is a central clearinghouse. The Fund initially will enter into centrally cleared swaps through an executing broker. When a fund enters into a centrally cleared swap, it must deliver to the central Counterparty (via the FCM) an amount referred to as “initial margin.” Initial margin requirements are determined by the central Counterparty, but an FCM may require additional initial margin above the amount required by the central Counterparty. Initial margin deposits required upon entering into centrally cleared swaps are satisfied by cash or securities as collateral at the FCM. Securities deposited as initial margin are designated on the Schedule of Investments and cash deposited is recorded on the Statement of Assets and Liabilities. During the term of a cleared swap agreement, a “variation margin” amount may be required to be paid by the Fund or may be received by the Fund, based on the daily change in price of the underlying reference instrument subject to the swap agreement and is recorded as a receivable or payable for variation margin in the Statement of Assets and Liabilities until the centrally cleared swap is terminated at which time a realized gain or loss is recorded.
A CDS is an agreement between Counterparties to exchange the credit risk of an issuer. A buyer of a CDS is said to buy protection by paying a fixed payment over the life of the agreement and in some situations an upfront payment to the seller of the CDS. If a defined credit event occurs (such as payment default or bankruptcy), the Fund as a protection buyer would cease paying its fixed payment, the Fund would deliver eligible bonds issued by the reference entity to the seller, and the seller would pay the full notional value, or the “par value”, of the referenced obligation to the Fund. A seller of a CDS is said to sell protection and
| | |
| 25 | | Invesco World Bond Factor Fund |
| | thus would receive a fixed payment over the life of the agreement and an upfront payment, if applicable. If a credit event occurs, the Fund as a protection seller would cease to receive the fixed payment stream, the Fund would pay the buyer “par value” or the full notional value of the referenced obligation, and the Fund would receive the eligible bonds issued by the reference entity. In turn, these bonds may be sold in order to realize a recovery value. Alternatively, the seller of the CDS and its Counterparty may agree to net the notional amount and the market value of the bonds and make a cash payment equal to the difference to the buyer of protection. If no credit event occurs, the Fund receives the fixed payment over the life of the agreement. As the seller, the Fund would effectively add leverage to its portfolio because, in addition to its total net assets, the Fund would be subject to investment exposure on the notional amount of the CDS. In connection with these agreements, cash and securities may be identified as collateral in accordance with the terms of the respective swap agreements to provide assets of value and recourse in the event of default under the swap agreement or bankruptcy/insolvency of a party to the swap agreement. If a Counterparty becomes bankrupt or otherwise fails to perform its obligations due to financial difficulties, the Fund may experience significant delays in obtaining any recovery in a bankruptcy or other reorganization proceeding. The Fund may obtain only limited recovery or may obtain no recovery in such circumstances. The Fund’s maximum risk of loss from Counterparty risk, either as the protection seller or as the protection buyer, is the value of the contract. The risk may be mitigated by having a master netting arrangement between the Fund and the Counterparty and by the designation of collateral by the Counterparty to cover the Fund’s exposure to the Counterparty. |
Implied credit spreads represent the current level at which protection could be bought or sold given the terms of the existing CDS contract and serve as an indicator of the current status of the payment/performance risk of the CDS. An implied spread that has widened or increased since entry into the initial contract may indicate a deteriorating credit profile and increased risk of default for the reference entity. A declining or narrowing spread may indicate an improving credit profile or decreased risk of default for the reference entity. Alternatively, credit spreads may increase or decrease reflecting the general tolerance for risk in the credit markets.
An interest rate swap is an agreement between Counterparties pursuant to which the parties exchange a floating rate payment for a fixed rate payment based on a specified notional amount.
Changes in the value of centrally cleared and OTC swap agreements are recognized as unrealized gains (losses) in the Statement of Operations by “marking to market” on a daily basis to reflect the value of the swap agreement at the end of each trading day. Payments received or paid at the beginning of the agreement are reflected as such on the Statement of Assets and Liabilities and may be referred to as upfront payments. The Fund accrues for the fixed payment stream and amortizes upfront payments, if any, on swap agreements on a daily basis with the net amount, recorded as a component of realized gain (loss) on the Statement of Operations. A liquidation payment received or made at the termination of a swap agreement is recorded as realized gain (loss) on the Statement of Operations. Cash held as collateral is recorded as deposits with brokers on the Statement of Assets and Liabilities. Entering into these agreements involves, to varying degrees, lack of liquidity and elements of credit, market, and Counterparty risk in excess of amounts recognized on the Statement of Assets and Liabilities. Such risks involve the possibility that a swap is difficult to sell or liquidate; the Counterparty does not honor its obligations under the agreement and unfavorable interest rates and market fluctuations. It is possible that developments in the swaps market, including potential government regulation, could adversely affect the Fund’s ability to terminate existing swap agreements or to realize amounts to be received under such agreements. Additionally, an International Swaps and Derivatives Association Master Agreement (“ISDA Master Agreement”) includes credit related contingent features which allow Counterparties to OTC derivatives to terminate derivative contracts prior to maturity in the event that, for example, the Fund’s net assets decline by a stated percentage or the Fund fails to meet the terms of its ISDA Master Agreement, which would cause the Fund to accelerate payment of any net liability owed to the Counterparty. A short position in a security poses more risk than holding the same security long. As there is no limit on how much the price of the security can increase, the Fund’s exposure is unlimited.
Notional amounts of each individual credit default swap agreement outstanding as of October 31, 2022, if any, for which the Fund is the seller of protection are disclosed in the open swap agreements table. These potential amounts would be partially offset by any recovery values of the respective referenced obligations, upfront payments received upon entering into the agreement, or net amounts received from the settlement of buy protection credit default swap agreements entered into by the Fund for the same referenced entity or entities.
| N. | Dollar Rolls and Forward Commitment Transactions – The Fund may enter into dollar roll transactions to enhance the Fund’s performance. The Fund executes its dollar roll transactions in the to be announced (“TBA”) market whereby the Fund makes a forward commitment to purchase a security and, instead of accepting delivery, the position is offset by the sale of the security with a simultaneous agreement to repurchase at a future date. |
The Fund accounts for dollar roll transactions as purchases and sales and realizes gains and losses on these transactions. These transactions increase the Fund’s portfolio turnover rate.
Dollar roll transactions involve the risk that a Counterparty to the transaction may fail to complete the transaction. If this occurs, the Fund may lose the opportunity to purchase or sell the security at the agreed upon price. Dollar roll transactions also involve the risk that the value of the securities retained by the Fund may decline below the price of the securities that the Fund has sold but is obligated to purchase under the agreement.
| O. | LIBOR Risk – The Fund may have investments in financial instruments that utilize the London Interbank Offered Rate (“LIBOR”) as the reference or benchmark rate for variable interest rate calculations. LIBOR is intended to measure the rate generally at which banks can lend and borrow from one another in the relevant currency on an unsecured basis. The UK Financial Conduct Authority (“FCA”), the regulator that oversees LIBOR, announced that the majority of LIBOR rates would cease to be published or would no longer be representative on January 1, 2022. Although the publication of most LIBOR rates ceased at the end of 2021, a selection of widely used USD LIBOR rates continues to be published until June 2023 to allow for an orderly transition away from these rates. |
There remains uncertainty and risks relating to the continuing LIBOR transition and its effects on the Fund and the instruments in which the Fund invests. There can be no assurance that the composition or characteristics of any alternative reference rates (“ARRs”) or financial instruments in which the Fund invests that utilize ARRs will be similar to or produce the same value or economic equivalence as LIBOR or that these instruments will have the same volume or liquidity. Additionally, there remains uncertainty and risks relating to certain “legacy” USD LIBOR instruments that were issued or entered into before December 31, 2021 and the process by which a replacement interest rate will be identified and implemented into these instruments when USD LIBOR is ultimately discontinued. The effects of such uncertainty and risks in “legacy” USD LIBOR instruments held by the Fund could result in losses to the Fund.
| P. | Leverage Risk – Leverage exists when the Fund can lose more than it originally invests because it purchases or sells an instrument or enters into a transaction without investing an amount equal to the full economic exposure of the instrument or transaction. |
| Q. | Collateral – To the extent the Fund has designated or segregated a security as collateral and that security is subsequently sold, it is the Fund’s practice to replace such collateral no later than the next business day. |
| R. | Other Risks – Active trading of portfolio securities may result in added expenses, a lower return and increased tax liability. |
Mortgage- and asset-backed securities, including collateralized debt obligations and collateralized mortgage obligations, are subject to prepayment or call risk, which is the risk that a borrower’s payments may be received earlier or later than expected due to changes in prepayment rates on underlying loans. This could result in the Fund reinvesting these early payments at lower interest rates, thereby reducing the Fund’s income. Mortgage- and asset-backed securities also are subject to extension risk, which is the risk that an unexpected rise in interest rates could reduce the rate of prepayments, causing the price of the mortgage- and asset-backed securities and the Fund’s share price to fall. An unexpectedly high rate of defaults on the mortgages held by a mortgage pool may adversely affect the value of mortgage-backed securities and could result in losses to the Fund. Privately-issued mortgage-backed securities and asset-backed securities may be less liquid than other types of securities and the Fund may be unable to sell these securities at the time or price it desires.
During the period, the Fund experienced a low interest rate environment created in part by the Federal Reserve Board (FRB) and certain foreign central banks keeping the federal funds and equivalent foreign rates near historical lows. Increases in the federal funds and equivalent foreign rates may expose fixed income markets to heightened volatility and reduced liquidity for certain fixed income investments, particularly those with longer maturities. In addition, decreases in
| | |
| 26 | | Invesco World Bond Factor Fund |
| | fixed income dealer market-making capacity may also potentially lead to heightened volatility and reduced liquidity in the fixed income markets. As a result, the value of the Fund’s investments and share price may decline. Changes in central bank policies could also result in higher than normal shareholder redemptions, which could potentially increase portfolio turnover and the Fund’s transaction costs. |
Policy changes by the U.S. government or its regulatory agencies and political events within the U.S. and abroad may, among other things, affect investor and consumer confidence and increase volatility in the financial markets, perhaps suddenly and to a significant degree, which may adversely impact the Fund’s operations, universe of potential investment options, and return potential.
| S. | COVID-19 Risk – The COVID-19 strain of coronavirus has resulted in instances of market closures and dislocations, extreme volatility, liquidity constraints and increased trading costs. Efforts to contain its spread have resulted in travel restrictions, disruptions of healthcare systems, business operations (including business closures) and supply chains, layoffs, lower consumer demand and employee availability, and defaults and credit downgrades, among other significant economic impacts that have disrupted global economic activity across many industries. Such economic impacts may exacerbate other pre-existing political, social and economic risks locally or globally and cause general concern and uncertainty. The full economic impact and ongoing effects of COVID-19 (or other future epidemics or pandemics) at the macro-level and on individual businesses are unpredictable and may result in significant and prolonged effects on the Fund’s performance. |
NOTE 2–Advisory Fees and Other Fees Paid to Affiliates
The Trust has entered into a master investment advisory agreement with the Adviser. Under the terms of the investment advisory agreement, the Fund accrues daily and pays monthly an advisory fee to the Adviser based on the annual rate of the Fund’s average daily net assets as follows:
| | | | | | |
| Average Daily Net Assets | | Rate | |
|
| |
First $2 billion | | | 0.270% | |
|
| |
Over $ 2 billion | | | 0.250% | |
|
| |
For the year ended October 31, 2022, the effective advisory fee rate incurred by the Fund was 0.27%.
Under the terms of a master sub-advisory agreement between the Adviser and each of Invesco Asset Management Deutschland GmbH, Invesco Asset Management Limited, Invesco Asset Management (Japan) Limited, Invesco Hong Kong Limited, Invesco Senior Secured Management, Inc. and Invesco Canada Ltd. (collectively, the “Affiliated Sub-Advisers”) the Adviser, not the Fund, will pay 40% of the fees paid to the Adviser to any such Affiliated Sub-Adviser(s) that provide(s) discretionary investment management services to the Fund based on the percentage of assets allocated to such Affiliated Sub-Adviser(s).
The Adviser has contractually agreed, through at least February 29, 2024, to waive advisory fees and/or reimburse expenses to the extent necessary to limit total annual fund operating expenses after fee waiver and/or expense reimbursement (excluding certain items discussed below) of Class A, Class C, Class Y, Class R5 and Class R6 shares to 0.54%, 1.29%, 0.29%, 0.29% and 0.29%, respectively, of the Fund’s average daily net assets (the “expense limits”). In determining the Adviser’s obligation to waive advisory fees and/or reimburse expenses, the following expenses are not taken into account, and could cause total annual fund operating expenses after fee waiver and/or expense reimbursement to exceed the numbers reflected above: (1) interest; (2) taxes; (3) dividend expense on short sales; (4) extraordinary or non-routine items, including litigation expenses; and (5) expenses that the Fund has incurred but did not actually pay because of an expense offset arrangement. Unless Invesco continues the fee waiver agreement, it will terminate on February 29, 2024. During its term, the fee waiver agreement cannot be terminated or amended to increase the expense limits or reduce the advisory fee waiver without approval of the Board of Trustees.
Further, the Adviser has contractually agreed, through at least June 30, 2024, to waive the advisory fee payable by the Fund in an amount equal to 100% of the net advisory fees the Adviser receives from the affiliated money market funds on investments by the Fund of uninvested cash (excluding investments of cash collateral from securities lending) in such affiliated money market funds.
For the year ended October 31, 2022, the Adviser waived advisory fees of $100,800 and reimbursed fund level expenses of $143,002 and reimbursed class level expenses of $42,269, $3,446, $28,605, $0 and $417 of Class A, Class C, Class Y, Class R5 and Class R6 shares, respectively.
The Trust has entered into a master administrative services agreement with Invesco pursuant to which the Fund has agreed to pay Invesco for certain administrative costs incurred in providing accounting services to the Fund. For the year ended October 31, 2022, expenses incurred under the agreement are shown in the Statement of Operations as Administrative services fees. Invesco has entered into a sub-administration agreement whereby State Street Bank and Trust Company (“SSB”) serves as fund accountant and provides certain administrative services to the Fund. Pursuant to a custody agreement with the Trust on behalf of the Fund, SSB also serves as the Fund’s custodian.
The Trust has entered into a transfer agency and service agreement with Invesco Investment Services, Inc. (“IIS”) pursuant to which the Fund has agreed to pay IIS a fee for providing transfer agency and shareholder services to the Fund and reimburse IIS for certain expenses incurred by IIS in the course of providing such services. IIS may make payments to intermediaries that provide omnibus account services, sub-accounting services and/or networking services. All fees payable by IIS to intermediaries that provide omnibus account services or sub-accounting services are charged back to the Fund, subject to certain limitations approved by the Trust’s Board of Trustees. For the year ended October 31, 2022, expenses incurred under the agreement are shown in the Statement of Operations as Transfer agent fees.
The Trust has entered into master distribution agreements with Invesco Distributors, Inc. (“IDI”) to serve as the distributor for the Class A, Class C, Class Y, Class R5 and Class R6 shares of the Fund. The Trust has adopted plans pursuant to Rule 12b-1 under the 1940 Act with respect to the Fund’s Class A and Class C shares (collectively, the “Plans”). The Fund, pursuant to the Plans, pays IDI compensation at the annual rate of 0.25% of the Fund’s average daily net assets of Class A shares and 1.00% of the average daily net assets of Class C shares. The fees are accrued daily and paid monthly. Of the Plan payments, up to 0.25% of the average daily net assets of each class of shares may be paid to furnish continuing personal shareholder services to customers who purchase and own shares of such classes. Any amounts not paid as a service fee under the Plans would constitute an asset-based sales charge. Rules of the Financial Industry Regulatory Authority (“FINRA”) impose a cap on the total sales charges, including asset-based sales charges, that may be paid by any class of shares of the Fund. For the year ended October 31, 2022, expenses incurred under the Plans are shown in the Statement of Operations as Distribution fees.
Front-end sales commissions and CDSC (collectively, the “sales charges”) are not recorded as expenses of the Fund. Front-end sales commissions are deducted from proceeds from the sales of Fund shares prior to investment in Class A shares of the Fund. CDSC are deducted from redemption proceeds prior to remittance to the shareholder. During the year ended October 31, 2022, IDI advised the Fund that IDI retained $1,127 in front-end sales commissions from the sale of Class A shares and $30 and $132 from Class A and Class C shares, respectively, for CDSC imposed upon redemptions by shareholders.
Certain officers and trustees of the Trust are officers and directors of the Adviser, IIS and/or IDI.
NOTE 3–Additional Valuation Information
GAAP defines fair value as the price that would be received to sell an asset or paid to transfer a liability in an orderly transaction between market participants at the measurement date, under current market conditions. GAAP establishes a hierarchy that prioritizes the inputs to valuation methods, giving the highest priority to readily available unadjusted quoted prices in an active market for identical assets (Level 1) and the lowest priority to significant unobservable inputs (Level 3), generally when market prices are not readily available. Based on the valuation inputs, the securities or other investments are tiered into one of three levels. Changes in valuation methods may result in transfers in or out of an investment’s assigned level:
| | |
| Level 1 - | | Prices are determined using quoted prices in an active market for identical assets. |
| | |
| 27 | | Invesco World Bond Factor Fund |
| | |
| Level 2 - | | Prices are determined using other significant observable inputs. Observable inputs are inputs that other market participants may use in pricing a security. These may include quoted prices for similar securities, interest rates, prepayment speeds, credit risk, yield curves, loss severities, default rates, discount rates, volatilities and others. |
| Level 3 - | | Prices are determined using significant unobservable inputs. In situations where quoted prices or observable inputs are unavailable (for example, when there is little or no market activity for an investment at the end of the period), unobservable inputs may be used. Unobservable inputs reflect the Adviser’s assumptions about the factors market participants would use in determining fair value of the securities or instruments and would be based on the best available information. |
The following is a summary of the tiered valuation input levels, as of October 31, 2022. The level assigned to the securities valuations may not be an indication of the risk or liquidity associated with investing in those securities. Because of the inherent uncertainties of valuation, the values reflected in the financial statements may materially differ from the value received upon actual sale of those investments.
| | | | | | | | | | | | | | | | |
| | | Level 1 | | | Level 2 | | | Level 3 | | | Total | |
|
| |
Investments in Securities | | | | | | | | | | | | | | | | |
|
| |
Non-U.S. Dollar Denominated Bonds & Notes | | $ | – | | | $ | 15,307,285 | | | | $– | | | $ | 15,307,285 | |
|
| |
U.S. Dollar Denominated Bonds & Notes | | | – | | | | 7,690,758 | | | | – | | | | 7,690,758 | |
|
| |
U.S. Treasury Securities | | | – | | | | 3,901,528 | | | | – | | | | 3,901,528 | |
|
| |
U.S. Government Sponsored Agency Mortgage-Backed Securities | | | – | | | | 3,378,705 | | | | – | | | | 3,378,705 | |
|
| |
Exchange-Traded Funds | | | 368,287 | | | | – | | | | – | | | | 368,287 | |
|
| |
Money Market Funds | | | – | | | | 121,612 | | | | – | | | | 121,612 | |
|
| |
Total Investments in Securities | | | 368,287 | | | | 30,399,888 | | | | – | | | | 30,768,175 | |
|
| |
| | | | |
Other Investments - Assets* | | | | | | | | | | | | | | | | |
|
| |
Futures Contracts | | | 38,519 | | | | – | | | | – | | | | 38,519 | |
|
| |
Forward Foreign Currency Contracts | | | – | | | | 531,269 | | | | – | | | | 531,269 | |
|
| |
Swap Agreements | | | – | | | | 408,980 | | | | – | | | | 408,980 | |
|
| |
| | | 38,519 | | | | 940,249 | | | | – | | | | 978,768 | |
|
| |
| | | | |
Other Investments - Liabilities* | | | | | | | | | | | | | | | | |
|
| |
Futures Contracts | | | (63,588 | ) | | | – | | | | – | | | | (63,588 | ) |
|
| |
Forward Foreign Currency Contracts | | | – | | | | (536,252 | ) | | | – | | | | (536,252 | ) |
|
| |
Swap Agreements | | | – | | | | (1,069 | ) | | | – | | | | (1,069 | ) |
|
| |
| | | (63,588 | ) | | | (537,321 | ) | | | – | | | | (600,909 | ) |
|
| |
Total Other Investments | | | (25,069 | ) | | | 402,928 | | | | – | | | | 377,859 | |
|
| |
Total Investments | | $ | 343,218 | | | $ | 30,802,816 | | | | $– | | | $ | 31,146,034 | |
|
| |
| * | Unrealized appreciation (depreciation). |
NOTE 4–Derivative Investments
The Fund may enter into an International Swaps and Derivatives Association Master Agreement (“ISDA Master Agreement”) under which a fund may trade OTC derivatives. An OTC transaction entered into under an ISDA Master Agreement typically involves a collateral posting arrangement, payment netting provisions and close-out netting provisions. These netting provisions allow for reduction of credit risk through netting of contractual obligations. The enforceability of the netting provisions of the ISDA Master Agreement depends on the governing law of the ISDA Master Agreement, among other factors.
For financial reporting purposes, the Fund does not offset OTC derivative assets or liabilities that are subject to ISDA Master Agreements in the Statement of Assets and Liabilities.
Value of Derivative Investments at Period-End
The table below summarizes the value of the Fund’s derivative investments, detailed by primary risk exposure, held as of October 31, 2022:
| | | | | | | | | | | | |
| | | Value | |
| Derivative Assets | | Currency
Risk | | | Interest
Rate Risk | | | Total | |
|
| |
Unrealized appreciation on futures contracts – Exchange-Traded(a) | | $ | – | | | $ | 38,519 | | | $ | 38,519 | |
|
| |
Unrealized appreciation on swap agreements – Centrally Cleared(a) | | | – | | | | 408,980 | | | | 408,980 | |
|
| |
Unrealized appreciation on forward foreign currency contracts outstanding | | | 531,269 | | | | – | | | | 531,269 | |
|
| |
Total Derivative Assets | | | 531,269 | | | | 447,499 | | | | 978,768 | |
|
| |
Derivatives not subject to master netting agreements | | | – | | | | (447,499 | ) | | | (447,499 | ) |
|
| |
Total Derivative Assets subject to master netting agreements | | $ | 531,269 | | | $ | – | | | $ | 531,269 | |
|
| |
| | |
| 28 | | Invesco World Bond Factor Fund |
| | | | | | | | | | | | |
| | | Value | |
| Derivative Liabilities | | Currency
Risk | | | Interest
Rate Risk | | | Total | |
|
| |
Unrealized depreciation on futures contracts – Exchange-Traded(a) | | $ | – | | | $ | (63,588 | ) | | $ | (63,588 | ) |
|
| |
Unrealized depreciation on swap agreements – Centrally Cleared(a) | | | – | | | | (1,069 | ) | | | (1,069 | ) |
|
| |
Unrealized depreciation on forward foreign currency contracts outstanding | | | (536,252 | ) | | | – | | | | (536,252 | ) |
|
| |
Total Derivative Liabilities | | | (536,252 | ) | | | (64,657 | ) | | | (600,909 | ) |
|
| |
Derivatives not subject to master netting agreements | | | – | | | | 64,657 | | | | 64,657 | |
|
| |
Total Derivative Liabilities subject to master netting agreements | | $ | (536,252 | ) | | $ | – | | | $ | (536,252 | ) |
|
| |
| (a) | The daily variation margin receivable (payable) at period-end is recorded in the Statement of Assets and Liabilities. |
Offsetting Assets and Liabilities
The table below reflects the Fund’s exposure to Counterparties subject to either an ISDA Master Agreement or other agreement for OTC derivative transactions as of October 31, 2022.
| | | | | | | | | | | | | | | | | | | | |
| | | Financial
Derivative
Assets | | Financial
Derivative
Liabilities | | | | Collateral
(Received)/Pledged | | | |
| Counterparty | | Forward Foreign
Currency Contracts | | Forward Foreign
Currency Contracts | | Net Value of
Derivatives | | Non-Cash | | Cash | | Net
Amount | |
|
| |
Bank of America, N.A. | | | $ 58,647 | | | | $ (16,338 | ) | | | $ 42,309 | | | $– | | $– | | | $ 42,309 | |
|
| |
Barclays Bank PLC | | | 210 | | | | (1,616 | ) | | | (1,406 | ) | | – | | – | | | (1,406 | ) |
|
| |
BNP Paribas S.A. | | | 44,011 | | | | (3,548 | ) | | | 40,463 | | | – | | – | | | 40,463 | |
|
| |
Citibank, N.A. | | | 23,564 | | | | (72,913 | ) | | | (49,349 | ) | | – | | – | | | (49,349 | ) |
|
| |
Deutsche Bank AG | | | 8,753 | | | | (127,914 | ) | | | (119,161 | ) | | – | | – | | | (119,161 | ) |
|
| |
Goldman Sachs International | | | 8,049 | | | | (9,849 | ) | | | (1,800 | ) | | – | | – | | | (1,800 | ) |
|
| |
J.P. Morgan Chase Bank, N.A. | | | 86,514 | | | | (57,578 | ) | | | 28,936 | | | – | | – | | | 28,936 | |
|
| |
Morgan Stanley and Co. International PLC | | | 299,572 | | | | (239,286 | ) | | | 60,286 | | | – | | – | | | 60,286 | |
|
| |
Royal Bank of Canada | | | 806 | | | | (6,504 | ) | | | (5,698 | ) | | – | | – | | | (5,698 | ) |
|
| |
State Street Bank & Trust Co. | | | 540 | | | | (685 | ) | | | (145 | ) | | – | | – | | | (145 | ) |
|
| |
UBS AG | | | 603 | | | | (21 | ) | | | 582 | | | – | | – | | | 582 | |
|
| |
Total | | | $531,269 | | | | $(536,252 | ) | | | $(4,983 | ) | | $– | | $– | | | $(4,983 | ) |
|
| |
Effect of Derivative Investments for the year ended October 31, 2022
The table below summarizes the gains (losses) on derivative investments, detailed by primary risk exposure, recognized in earnings during the period:
| | | | | | | | | | | | |
| | | Location of Gain (Loss) on
Statement of Operations | |
| | | Currency
Risk | | | Interest
Rate Risk | | | Total | |
|
| |
Realized Gain (Loss): | | | | | | | | | | | | |
Forward foreign currency contracts | | $ | 15,335 | | | $ | - | | | $ | 15,335 | |
|
| |
Futures contracts | | | - | | | | (412,732 | ) | | | (412,732 | ) |
|
| |
Swap agreements | | | - | | | | 208,513 | | | | 208,513 | |
|
| |
Change in Net Unrealized Appreciation: | | | | | | | | | | | | |
Forward foreign currency contracts | | | 226,424 | | | | - | | | | 226,424 | |
|
| |
Futures contracts | | | - | | | | 30,775 | | | | 30,775 | |
|
| |
Swap agreements | | | - | | | | 252,454 | | | | 252,454 | |
|
| |
Total | | $ | 241,759 | | | $ | 79,010 | | | $ | 320,769 | |
|
| |
The table below summarizes the average notional value of derivatives held during the period.
| | | | | | |
| | | Forward
Foreign Currency
Contracts | | Futures
Contracts | | Swap
Agreements |
|
|
Average notional value | | $48,813,817 | | $3,569,003 | | $11,480,754 |
|
|
NOTE 5–Expense Offset Arrangement(s)
The expense offset arrangement is comprised of transfer agency credits which result from balances in demand deposit accounts used by the transfer agent for clearing shareholder transactions. For the year ended October 31, 2022, the Fund received credits from this arrangement, which resulted in the reduction of the Fund’s total expenses of $289.
| | |
| 29 | | Invesco World Bond Factor Fund |
NOTE 6–Trustees’ and Officers’ Fees and Benefits
Trustees’ and Officers’ Fees and Benefits include amounts accrued by the Fund to pay remuneration to certain Trustees and Officers of the Fund. Trustees have the option to defer compensation payable by the Fund, and Trustees’ and Officers’ Fees and Benefits also include amounts accrued by the Fund to fund such deferred compensation amounts. Those Trustees who defer compensation have the option to select various Invesco Funds in which their deferral accounts shall be deemed to be invested. Finally, certain current Trustees were eligible to participate in a retirement plan that provided for benefits to be paid upon retirement to Trustees over a period of time based on the number of years of service. The Fund may have certain former Trustees who also participate in a retirement plan and receive benefits under such plan. Trustees’ and Officers’ Fees and Benefits include amounts accrued by the Fund to fund such retirement benefits. Obligations under the deferred compensation and retirement plans represent unsecured claims against the general assets of the Fund.
NOTE 7–Cash Balances
The Fund may borrow for leveraging in an amount up to 5% of the Fund’s total assets (excluding the amount borrowed) at the time the borrowing is made. In doing so, the Fund is permitted to temporarily carry a negative or overdrawn balance in its account with SSB, the custodian bank. Such balances, if any at period end, are shown in the Statement of Assets and Liabilities under the payable caption Amount due custodian. To compensate the custodian bank for such overdrafts, the overdrawn Fund may either (1) leave funds as a compensating balance in the account so the custodian bank can be compensated by earning the additional interest; or (2) compensate by paying the custodian bank at a rate agreed upon by the custodian bank and Invesco, not to exceed the contractually agreed upon rate. The Fund may not purchase additional securities when any borrowings from banks or broker-dealers exceed 5% of the Fund’s total assets, or when any borrowings from an Invesco Fund are outstanding.
NOTE 8–Distributions to Shareholders and Tax Components of Net Assets
Tax Character of Distributions to Shareholders Paid During the Fiscal Years Ended October 31, 2022 and 2021:
| | | | | | | | | | | | |
| | | 2022 | | | | | | 2021 | |
Ordinary income* | | $ | 705,757 | | | | | | | $ | 779,487 | |
Long-term capital gain | | | 59,205 | | | | | | | | 237,018 | |
Return of capital | | | 93,121 | | | | | | | | – | |
Total distributions | | $ | 858,083 | | | | | | | $ | 1,016,505 | |
| * | Includes short-term capital gain distributions, if any. |
Tax Components of Net Assets at Period-End:
| | | | |
| | | 2022 | |
|
| |
Net unrealized appreciation (depreciation) – investments | | $ | (6,798,197 | ) |
|
| |
Net unrealized appreciation – foreign currencies | | | 12,860 | |
|
| |
Temporary book/tax differences | | | (19,585 | ) |
|
| |
Capital loss carryforward | | | (1,885,983 | ) |
|
| |
Shares of beneficial interest | | | 38,501,672 | |
|
| |
Total net assets | | $ | 29,810,767 | |
|
| |
The difference between book-basis and tax-basis unrealized appreciation (depreciation) is due to differences in the timing of recognition of gains and losses on investments for tax and book purposes. The Fund’s net unrealized appreciation (depreciation) difference is attributable primarily to wash sales.
The temporary book/tax differences are a result of timing differences between book and tax recognition of income and/or expenses. The Fund’s temporary book/tax differences are the result of the trustee deferral of compensation and retirement plan benefits.
Capital loss carryforward is calculated and reported as of a specific date. Results of transactions and other activity after that date may affect the amount of capital loss carryforward actually available for the Fund to utilize. The ability to utilize capital loss carryforward in the future may be limited under the Internal Revenue Code and related regulations based on the results of future transactions.
The Fund does not have a capital loss carryforward as of October 31, 2022.
| | | | | | |
| Capital Loss Carryforward* |
|
|
| Expiration | | Short-Term | | Long-Term | | Total |
|
|
Not subject to expiration | | $1,234,188 | | $651,795 | | $1,885,983 |
|
|
| * | Capital loss carryforward is reduced for limitations, if any, to the extent required by the Internal Revenue Code and may be further limited depending upon a variety of factors, including the realization of net unrealized gains or losses as of the date of any reorganization. |
NOTE 9–Investment Transactions
The aggregate amount of investment securities (other than short-term securities, U.S. Government obligations and money market funds, if any) purchased and sold by the Fund during the year ended October 31, 2022 was $25,459,572 and $28,719,753, respectively. Cost of investments, including any derivatives, on a tax basis includes the adjustments for financial reporting purposes as of the most recently completed federal income tax reporting period-end.
| | | | |
| Unrealized Appreciation (Depreciation) of Investments on a Tax Basis | | | |
|
| |
Aggregate unrealized appreciation of investments | | $ | 1,019,523 | |
|
| |
Aggregate unrealized (depreciation) of investments | | | (7,817,720 | ) |
|
| |
Net unrealized appreciation (depreciation) of investments | | $ | (6,798,197 | ) |
|
| |
Cost of investments for tax purposes is $37,944,231.
| | |
| 30 | | Invesco World Bond Factor Fund |
NOTE 10–Reclassification of Permanent Differences
Primarily as a result of differing book/tax treatment of foreign currency transactions and net operating losses, on October 31, 2022, undistributed net investment income was decreased by $593,407, undistributed net realized gain (loss) was increased by $1,398,625 and shares of beneficial interest was decreased by $805,218. This reclassification had no effect on the net assets of the Fund.
NOTE 11–Share Information
| | | | | | | | | | | | | | | | |
| | | Summary of Share Activity | |
|
| |
| | | Year ended | | | Year ended | |
| | | October 31, 2022(a) | | | October 31, 2021 | |
| | | Shares | | | Amount | | | Shares | | | Amount | |
|
| |
Sold: | | | | | | | | | | | | | | | | |
Class A | | | 203,072 | | | | $ 1,968,814 | | | | 445,039 | | | $ | 4,926,597 | |
|
| |
Class C | | | 31,200 | | | | 297,438 | | | | 57,595 | | | | 632,108 | |
|
| |
Class Y | | | 659,898 | | | | 6,099,328 | | | | 936,589 | | | | 10,306,720 | |
|
| |
Class R6 | | | 66,597 | | | | 654,707 | | | | 94,190 | | | | 1,036,295 | |
|
| |
| | | | |
Issued as reinvestment of dividends: | | | | | | | | | | | | | | | | |
Class A | | | 41,630 | | | | 413,687 | | | | 49,932 | | | | 553,308 | |
|
| |
Class C | | | 1,991 | | | | 20,177 | | | | 3,097 | | | | 34,438 | |
|
| |
Class Y | | | 25,459 | | | | 251,987 | | | | 26,094 | | | | 288,436 | |
|
| |
Class R6 | | | 3,230 | | | | 31,454 | | | | 1,459 | | | | 16,039 | |
|
| |
| | | | |
Automatic conversion of Class C shares to Class A shares: | | | | | | | | | | | | | | | | |
Class A | | | 5,671 | | | | 53,819 | | | | 39,260 | | | | 435,539 | |
|
| |
Class C | | | (5,685 | ) | | | (53,819 | ) | | | (39,358 | ) | | | (435,539 | ) |
|
| |
| | | | |
Reacquired: | | | | | | | | | | | | | | | | |
Class A | | | (552,300 | ) | | | (5,231,554 | ) | | | (655,265 | ) | | | (7,200,442 | ) |
|
| |
Class C | | | (63,739 | ) | | | (615,846 | ) | | | (52,733 | ) | | | (577,207 | ) |
|
| |
Class Y | | | (857,201 | ) | | | (8,018,856 | ) | | | (498,338 | ) | | | (5,466,337 | ) |
|
| |
Class R6 | | | (30,991 | ) | | | (280,462 | ) | | | (7,390 | ) | | | (80,864 | ) |
|
| |
Net increase (decrease) in share activity | | | (471,168 | ) | | | $(4,409,126 | ) | | | 400,171 | | | $ | 4,469,091 | |
|
| |
| (a) | There are entities that are record owners of more than 5% of the outstanding shares of the Fund and in the aggregate own 45% of the outstanding shares of the Fund. IDI has an agreement with these entities to sell Fund shares. The Fund, Invesco and/or Invesco affiliates may make payments to these entities, which are considered to be related to the Fund, for providing services to the Fund, Invesco and/or Invesco affiliates including but not limited to services such as securities brokerage, distribution, third party record keeping and account servicing. The Fund has no knowledge as to whether all or any portion of the shares owned of record by these entities are also owned beneficially. |
| | |
| 31 | | Invesco World Bond Factor Fund |
Report of Independent Registered Public Accounting Firm
To the Board of Trustees of AIM Investment Funds (Invesco Investment Funds) and Shareholders of Invesco World Bond Factor Fund
Opinion on the Financial Statements
We have audited the accompanying statement of assets and liabilities, including the schedule of investments, of Invesco World Bond Factor Fund (one of the funds constituting AIM Investment Funds (Invesco Investment Funds), referred to hereafter as the “Fund”) as of October 31, 2022, the related statement of operations for the year ended October 31, 2022, the statement of changes in net assets for each of the two years in the period ended October 31, 2022, including the related notes, and the financial highlights for each of the five years in the period ended October 31, 2022 (collectively referred to as the “financial statements”). In our opinion, the financial statements present fairly, in all material respects, the financial position of the Fund as of October 31, 2022, the results of its operations for the year then ended, the changes in its net assets for each of the two years in the period ended October 31, 2022 and the financial highlights for each of the five years in the period ended October 31, 2022 in conformity with accounting principles generally accepted in the United States of America.
Basis for Opinion
These financial statements are the responsibility of the Fund’s management. Our responsibility is to express an opinion on the Fund’s financial statements based on our audits. We are a public accounting firm registered with the Public Company Accounting Oversight Board (United States) (PCAOB) and are required to be independent with respect to the Fund in accordance with the U.S. federal securities laws and the applicable rules and regulations of the Securities and Exchange Commission and the PCAOB.
We conducted our audits of these financial statements in accordance with the standards of the PCAOB. Those standards require that we plan and perform the audit to obtain reasonable assurance about whether the financial statements are free of material misstatement, whether due to error or fraud.
Our audits included performing procedures to assess the risks of material misstatement of the financial statements, whether due to error or fraud, and performing procedures that respond to those risks. Such procedures included examining, on a test basis, evidence regarding the amounts and disclosures in the financial statements. Our audits also included evaluating the accounting principles used and significant estimates made by management, as well as evaluating the overall presentation of the financial statements. Our procedures included confirmation of securities owned as of October 31, 2022 by correspondence with the custodian, transfer agent and brokers; when replies were not received from brokers, we performed other auditing procedures. We believe that our audits provide a reasonable basis for our opinion.
/s/PricewaterhouseCoopers LLP
Houston, Texas
December 23, 2022
We have served as the auditor of one or more of the investment companies in the Invesco group of investment companies since at least 1995. We have not been able to determine the specific year we began serving as auditor.
| | |
| 32 | | Invesco World Bond Factor Fund |
Calculating your ongoing Fund expenses
Example
As a shareholder of the Fund, you incur two types of costs: (1) transaction costs, which may include sales charges (loads) on purchase payments or contingent deferred sales charges on redemptions, if any; and (2) ongoing costs, including management fees, distribution and/or service (12b-1) fees, and other Fund expenses. This example is intended to help you understand your ongoing costs (in dollars) of investing in the Fund and to compare these costs with ongoing costs of investing in other mutual funds. The example is based on an investment of $1,000 invested at the beginning of the period and held for the entire period May 1, 2022 through October 31, 2022.
Actual expenses
The table below provides information about actual account values and actual expenses. You may use the information in this table, together with the amount you invested, to estimate the expenses that you paid over the period. Simply divide your account value by $1,000 (for example, an $8,600 account value divided by $1,000 = 8.6), then multiply the result by the number in the table under the heading entitled “Actual Expenses Paid During Period” to estimate the expenses you paid on your account during this period.
Hypothetical example for comparison purposes
The table below also provides information about hypothetical account values and hypothetical expenses based on the Fund’s actual expense ratio and an assumed rate of return of 5% per year before expenses, which is not the Fund’s actual return.
The hypothetical account values and expenses may not be used to estimate the actual ending account balance or expenses you paid for the period. You may use this information to compare the ongoing costs of investing in the Fund and other funds. To do so, compare this 5% hypothetical example with the 5% hypothetical examples that appear in the shareholder reports of the other funds.
Please note that the expenses shown in the table are meant to highlight your ongoing costs only and do not reflect any transaction costs, such as sales charges (loads) on purchase payments or contingent deferred sales charges on redemptions, if any. Therefore, the hypothetical information is useful in comparing ongoing costs only, and will not help you determine the relative total costs of owning different funds. In addition, if these transaction costs were included, your costs would have been higher.
| | | | | | | | | | | | |
| | | | | ACTUAL | | HYPOTHETICAL (5% annual return before
expenses) | | |
| | | Beginning
Account Value
(05/01/22) | | Ending
Account Value
(10/31/22)1 | | Expenses
Paid During
Period2 | | Ending
Account Value
(10/31/22) | | Expenses
Paid During
Period2 | | Annualized
Expense
Ratio |
Class A | | $1,000.00 | | $894.10 | | $2.77 | | $1,022.28 | | $2.96 | | 0.58% |
Class C | | 1,000.00 | | 890.40 | | 6.34 | | 1,018.50 | | 6.77 | | 1.33 |
Class Y | | 1,000.00 | | 894.10 | | 1.58 | | 1,023.54 | | 1.68 | | 0.33 |
Class R5 | | 1,000.00 | | 894.40 | | 1.58 | | 1,023.54 | | 1.68 | | 0.33 |
Class R6 | | 1,000.00 | | 894.20 | | 1.58 | | 1,023.54 | | 1.68 | | 0.33 |
| 1 | The actual ending account value is based on the actual total return of the Fund for the period May 1, 2022 through October 31, 2022, after actual expenses and will differ from the hypothetical ending account value which is based on the Fund’s expense ratio and a hypothetical annual return of 5% before expenses. |
| 2 | Expenses are equal to the Fund’s annualized expense ratio as indicated above multiplied by the average account value over the period, multiplied by 184/365 to reflect the most recent fiscal half year. |
| | |
| 33 | | Invesco World Bond Factor Fund |
Approval of Investment Advisory and Sub-Advisory Contracts
At meetings held on June 13, 2022, the Board of Trustees (the Board or the Trustees) of AIM Investment Funds (Invesco Investment Funds) as a whole, and the independent Trustees, who comprise over 75% of the Board, voting separately, approved the continuance of the Invesco World Bond Factor Fund’s (the Fund) Master Investment Advisory Agreement with Invesco Advisers, Inc. (Invesco Advisers and the investment advisory agreement) and the Master Intergroup Sub-Advisory Contract for Mutual Funds with Invesco Asset Management Deutschland GmbH, Invesco Asset Management Limited, Invesco Asset Management (Japan) Limited, Invesco Hong Kong Limited, Invesco Senior Secured Management, Inc. and Invesco Canada Ltd. (collectively, the Affiliated Sub-Advisers and the sub-advisory contracts) for another year, effective July 1, 2022. After evaluating the factors discussed below, among others, the Board approved the renewal of the Fund’s investment advisory agreement and the sub-advisory contracts and determined that the compensation payable thereunder by the Fund to Invesco Advisers and by Invesco Advisers to the Affiliated Sub-Advisers is fair and reasonable.
The Board’s Evaluation Process
The Board has established an Investments Committee, which in turn has established Sub-Committees that meet throughout the year to review the performance of funds advised by Invesco Advisers (the Invesco Funds). The Sub-Committees meet regularly with portfolio managers for their assigned Invesco Funds and other members of management to review detailed information about investment performance and portfolio attributes of these funds. The Board has established additional standing and ad hoc committees that meet regularly throughout the year to review matters within their purview. The Board took into account evaluations and reports that it received from its committees and sub-committees, as well as the information provided to the Board and its committees and sub-committees throughout the year, in considering whether to approve each Invesco Fund’s investment advisory agreement and sub-advisory contracts.
As part of the contract renewal process, the Board reviews and considers information provided in response to detailed requests for information submitted to management by the independent Trustees with assistance from legal counsel to the independent Trustees and the Senior Officer, an officer of the Invesco Funds who reports directly to the independent Trustees. The Board receives comparative investment performance and fee and expense data regarding the Invesco Funds prepared by Broadridge Financial Solutions, Inc. (Broadridge), an independent mutual fund data provider, as well as information on the composition of the peer groups provided by Broadridge and its methodology for determining peer groups. The Board also receives an independent written evaluation from the Senior Officer. The Senior Officer’s evaluation is prepared as part of his responsibility to manage the process by which the Invesco Funds’ proposed management fees are negotiated during the annual contract renewal process to ensure they are negotiated in a manner that is at arms’ length and reasonable in accordance with certain negotiated regulatory requirements. In
addition to meetings with Invesco Advisers and fund counsel throughout the year and as part of meetings convened on May 2, 2022 and June 13, 2022, the independent Trustees also discussed the continuance of the investment advisory agreement and sub-advisory contracts in separate sessions with the Senior Officer and with independent legal counsel.
The discussion below is a summary of the Senior Officer’s independent written evaluation with respect to the Fund’s investment advisory agreement and sub-advisory contracts, as well as a discussion of the material factors and related conclusions that formed the basis for the Board’s approval of the Fund’s investment advisory agreement and sub-advisory contracts. The Trustees’ review and conclusions are based on the comprehensive consideration of all information presented to them during the course of the year and in prior years and are not the result of any single determinative factor. Moreover, one Trustee may have weighed a particular piece of information or factor differently than another Trustee. The information received and considered by the Board was current as of various dates prior to the Board’s approval on June 13, 2022.
Factors and Conclusions and Summary of Independent Written Fee Evaluation
| A. | Nature, Extent and Quality of Services Provided by Invesco Advisers and the Affiliated Sub-Advisers |
The Board reviewed the nature, extent and quality of the advisory services provided to the Fund by Invesco Advisers under the Fund’s investment advisory agreement, and the credentials and experience of the officers and employees of Invesco Advisers who provide these services, including the Fund’s portfolio manager(s). The Board’s review included consideration of Invesco Advisers’ investment process and oversight, credit analysis, and research capabilities. The Board considered information regarding Invesco Advisers’ programs for and resources devoted to risk management, including management of investment, enterprise, operational, liquidity, valuation and compliance risks, and technology used to manage such risks. The Board also received and reviewed information about Invesco Advisers’ role as administrator of the Invesco Funds’ liquidity risk management program. The Board received a description of, and reports related to, Invesco Advisers’ global security program and business continuity plans and of its approach to data privacy and cybersecurity, including related testing. The Board considered how the cybersecurity and business continuity plans of Invesco Advisers and its key service providers operated in the remote and hybrid working environment resulting from the novel coronavirus (“COVID-19”) pandemic and paved the way for a hybrid working framework in a normalized environment as employees return to the office. The Board also considered non-advisory services that Invesco Advisers and its affiliates provide to the Invesco Funds, such as various back office support functions, third party oversight, internal audit, valuation, portfolio trading and legal and compliance. The Board observed that Invesco Advisers’ systems preparedness and ongoing investment enabled Invesco Advisers to manage, operate and oversee the Invesco Funds with minimal impact or disruption through challenging environments. The Board
reviewed and considered the benefits to shareholders of investing in a Fund that is part of the family of funds under the umbrella of Invesco Ltd., Invesco Advisers’ parent company, and noted Invesco Ltd.’s depth and experience in running an investment management business, as well as its commitment of financial and other resources to such business. The Board concluded that the nature, extent and quality of the services provided to the Fund by Invesco Advisers are appropriate and satisfactory.
The Board reviewed the services that may be provided by the Affiliated Sub-Advisers under the sub-advisory contracts and the credentials and experience of the officers and employees of the Affiliated Sub-Advisers who provide these services. The Board noted the Affiliated Sub-Advisers’ expertise with respect to certain asset classes and that the Affiliated Sub-Advisers have offices and personnel that are located in financial centers around the world. As a result, the Board noted that the Affiliated Sub-Advisers can provide research and investment analysis on the markets and economies of various countries in which the Fund may invest, make recommendations regarding securities and assist with security trades. The Board concluded that the sub-advisory contracts may benefit the Fund and its shareholders by permitting Invesco Advisers to use the resources and talents of the Affiliated Sub-Advisers in managing the Fund. The Board concluded that the nature, extent and quality of the services that may be provided to the Fund by the Affiliated Sub-Advisers are appropriate and satisfactory.
| B. | Fund Investment Performance |
The Board considered Fund investment performance as a relevant factor in considering whether to approve the investment advisory agreement. The Board did not view Fund investment performance as a relevant factor in considering whether to approve the sub-advisory contracts for the Fund, as no Affiliated Sub-Adviser currently manages assets of the Fund.
The Board compared the Fund’s investment performance for the one, three and five year periods ending December 31, 2021 to the performance of funds in the Broadridge performance universe and against the Bloomberg Global Aggregate Index (Index). The Board noted that performance of Class A shares of the Fund was in the fourth quintile of its performance universe for the one year period, the first quintile for the three year period and the second quintile for the five year period (the first quintile being the best performing funds and the fifth quintile being the worst performing funds). The Board noted that performance of Class A shares of the Fund was above the performance of the Index for the one, three and five year periods. The Board recognized that the performance data reflects a snapshot in time as of a particular date and that selecting a different performance period could produce different results. The Board further considered that the Fund had changed its name, investment strategy and index against which future performance will be compared in 2020 in connection with its repositioning as a factor-based fund, and that performance results prior to such date reflected that of the Fund’s former strategy. As a result, the Board did not consider performance of the Fund prior to such date to be particularly relevant. The Board also reviewed more
| | |
| 34 | | Invesco World Bond Factor Fund |
recent Fund performance as well as other performance metrics, which did not change its conclusions.
| C. | Advisory and Sub-Advisory Fees and Fund Expenses |
The Board compared the Fund’s contractual management fee rate to the contractual management fee rates of funds in the Fund’s Broadridge expense group. The Board noted that the contractual management fee rate for Class A shares of the Fund was below the median contractual management fee rate of funds in its expense group. The Board noted that the Fund’s contractual management fee schedule was reduced at certain breakpoint levels effective in 2020 in connection with its repositioning as a factor-based fund. The Board noted that the term “contractual management fee” for funds in the expense group may include both advisory and certain non-portfolio management administrative services fees, but that Broadridge is not able to provide information on a fund by fund basis as to what is included. The Board also reviewed the methodology used by Broadridge in calculating expense group information, which includes using each fund’s contractual management fee schedule (including any applicable breakpoints) as reported in the most recent prospectus or statement of additional information for each fund in the expense group. The Board also considered comparative information regarding the Fund’s total expense ratio and its various components.
The Board noted that Invesco Advisers has contractually agreed to waive fees and/or limit expenses of the Fund for the term disclosed in the Fund’s registration statement in an amount necessary to limit total annual operating expenses to a specified percentage of average daily net assets for each class of the Fund.
The Board noted that Invesco Advisers and the Affiliated Sub-Advisers do not manage other similarly managed mutual funds or client accounts.
The Board also considered the services that may be provided by the Affiliated Sub-Advisers pursuant to the sub-advisory contracts, as well as the fees payable by Invesco Advisers to the Affiliated Sub-Advisers pursuant to the sub-advisory contracts.
| D. | Economies of Scale and Breakpoints |
The Board considered the extent to which there may be economies of scale in the provision of advisory services to the Fund and the Invesco Funds, and the extent to which such economies of scale are shared with the Fund and the Invesco Funds. The Board considered that the Fund may benefit from economies of scale through contractual breakpoints in the Fund’s advisory fee schedule, which generally operate to reduce the Fund’s expense ratio as it grows in size. The Board noted that the Fund also shares in economies of scale through Invesco Advisers’ ability to negotiate lower fee arrangements with third party service providers. The Board noted that the Fund may also benefit from economies of scale through initial fee setting, fee waivers and expense reimbursements, as well as Invesco Advisers’ investment in its business, including investments in business infrastructure, technology and cybersecurity.
| E. | Profitability and Financial Resources |
The Board reviewed information from Invesco Advisers concerning the costs of the advisory and other services that Invesco Advisers and its affiliates provide to the Fund and the Invesco Funds and the profitability of Invesco Advisers and its affiliates in
providing these services in the aggregate and on an individual Fund-by-Fund basis. The Board considered the methodology used for calculating profitability and the periodic review and enhancement of such methodology. The Board noted that Invesco Advisers continues to operate at a net profit from services Invesco Advisers and its affiliates provide to the Invesco Funds in the aggregate and to most Funds individually. The Board did not deem the level of profits realized by Invesco Advisers and its affiliates from providing such services to be excessive, given the nature, extent and quality of the services provided. The Board noted that Invesco Advisers provided information demonstrating that Invesco Advisers is financially sound and has the resources necessary to perform its obligations under the investment advisory agreement, and provided representations indicating that the Affiliated Sub-Advisers are financially sound and have the resources necessary to perform their obligations under the sub-advisory contracts.
| F. | Collateral Benefits to Invesco Advisers and its Affiliates |
The Board considered various other benefits received by Invesco Advisers and its affiliates from the relationship with the Fund, including the fees received for providing administrative, transfer agency and distribution services to the Fund. The Board received comparative information regarding fees charged for these services, including information provided by Broadridge and other independent sources. The Board reviewed the performance of Invesco Advisers and its affiliates in providing these services and the organizational structure employed to provide these services. The Board noted that these services are provided to the Fund pursuant to written contracts that are reviewed and subject to approval on an annual basis by the Board based on its determination that the services are required for the operation of the Fund.
The Board considered the benefits realized by Invesco Advisers and the Affiliated Sub-Advisers as a result of portfolio brokerage transactions executed through “soft dollar” arrangements. Invesco Advisers noted that the Fund does not execute brokerage transactions through “soft dollar” arrangements to any significant degree.
The Board considered that the Fund’s uninvested cash and cash collateral from any securities lending arrangements may be invested in registered money market funds or, with regard to securities lending cash collateral, unregistered funds that comply with Rule 2a-7 (collectively referred to as “affiliated money market funds”) advised by Invesco Advisers. The Board considered information regarding the returns of the affiliated money market funds relative to comparable overnight investments, as well as the fees paid by the affiliated money market funds to Invesco Advisers and its affiliates. In this regard, the Board noted that Invesco Advisers receives advisory fees from these affiliated money market funds attributable to the Fund’s investments. The Board also noted that Invesco Advisers has contractually agreed to waive through varying periods an amount equal to 100% of the net advisory fee Invesco Advisers receives from the affiliated money market funds with respect to the Fund’s investment in the affiliated money market funds of uninvested cash, but not cash collateral. The Board concluded that the advisory fees payable to Invesco Advisers from the Fund’s investment of cash collateral from any securities lending arrangements in the affiliated
money market funds are for services that are not duplicative of services provided by Invesco Advisers to the Fund.
The Board considered that Invesco Advisers may serve as the Fund’s affiliated securities lending agent and evaluated the benefits realized by Invesco Advisers when serving in such role, including the compensation received. The Board considered Invesco Advisers’ securities lending platform and corporate governance structure for securities lending, including Invesco Advisers’ Securities Lending Governance Committee and its related responsibilities. The Board noted that to the extent the Fund utilizes Invesco Advisers as an affiliated securities lending agent, the Fund conducts its securities lending in accordance with, and in reliance upon, no-action letters issued by the SEC staff that provide guidance on how an affiliate may act as a direct agent lender and receive compensation for those services without obtaining exemptive relief. The Board considered information provided by Invesco Advisers related to the performance of Invesco Advisers as securities lending agent, including a summary of the securities lending services provided to the Fund by Invesco Advisers and the compensation paid to Invesco Advisers for such services, as well as any revenues generated for the Fund in connection with such securities lending activity and the allocation of such revenue between the Fund and Invesco Advisers.
| | |
| 35 | | Invesco World Bond Factor Fund |
Tax Information
Form 1099-DIV, Form 1042-S and other year-end tax information provide shareholders with actual calendar year amounts that should be included in their tax returns. Shareholders should consult their tax advisers.
The following distribution information is being provided as required by the Internal Revenue Code or to meet a specific state’s requirement.
The Fund designates the following amounts or, if subsequently determined to be different, the maximum amount allowable for its fiscal year ended October 31, 2022:
| | | | | | | | |
Federal and State Income Tax | | | | | | |
Long-Term Capital Gain Distributions | | | $59,205 | | | | | |
Qualified Dividend Income* | | | 0.00 | % | | | | |
Corporate Dividends Received Deduction* | | | 0.00 | % | | | | |
U.S. Treasury Obligations* | | | 2.35 | % | | | | |
Qualified Business Income* | | | 0.00 | % | | | | |
Business Interest Income* | | | 44.98 | % | | | | |
|
| * The above percentages are based on ordinary income dividends paid to shareholders during the Fund’s fiscal year. | |
| | |
| 36 | | Invesco World Bond Factor Fund |
Trustees and Officers
The address of each trustee and officer is AIM Investment Funds (Invesco Investment Funds) (the “Trust”), 11 Greenway Plaza, Suite 1000, Houston, Texas 77046-1173. The trustees serve for the life of the Trust, subject to their earlier death, incapacitation, resignation, retirement or removal as more specifically provided in the Trust’s organizational documents. Each officer serves for a one year term or until their successors are elected and qualified. Column two below includes length of time served with predecessor entities, if any.
| | | | | | | | |
Name, Year of Birth and
Position(s) Held with the Trust | | Trustee and/or Officer Since | | Principal Occupation(s) During Past 5 Years | | Number of Funds in Fund Complex
Overseen by
Trustee | | Other Directorship(s) Held by Trustee During Past 5 Years |
| Interested Trustee | | | | | | | | |
| Martin L. Flanagan1 - 1960 Trustee and Vice Chair | | 2007 | | Executive Director, Chief Executive Officer and President, Invesco Ltd. (ultimate parent of Invesco and a global investment management firm); Trustee and Vice Chair, The Invesco Funds; Vice Chair, Investment Company Institute; and Member of Executive Board, SMU Cox School of Business Formerly: Advisor to the Board, Invesco Advisers, Inc. (formerly known as Invesco Institutional (N.A.), Inc.); Chairman and Chief Executive Officer, Invesco Advisers, Inc. (registered investment adviser); Director, Chairman, Chief Executive Officer and President, Invesco Holding Company (US), Inc. (formerly IVZ Inc.) (holding company), Invesco Group Services, Inc. (service provider) and Invesco North American Holdings, Inc. (holding company); Director, Chief Executive Officer and President, Invesco Holding Company Limited (parent of Invesco and a global investment management firm); Director, Invesco Ltd.; Chairman, Investment Company Institute and President, Co-Chief Executive Officer, Co-President, Chief Operating Officer and Chief Financial Officer, Franklin Resources, Inc. (global investment management organization) | | 189 | | None |
| 1 | Mr. Flanagan is considered an interested person (within the meaning of Section 2(a)(19) of the 1940 Act) of the Trust because he is an officer of the Adviser to the Trust, and an officer and a director of Invesco Ltd., ultimate parent of the Adviser. |
| | | | | | | | |
Name, Year of Birth and Position(s) Held with the Trust | | Trustee and/or Officer Since | | Principal Occupation(s) During Past 5 Years | | Number of Funds in Fund Complex
Overseen by
Trustee | | Other Directorship(s) Held by Trustee During Past 5 Years |
| Independent Trustees | | | | | | | | |
| Beth Ann Brown - 1968 Trustee (2019) and Chair (August 2022) | | 2019 | | Independent Consultant Formerly: Head of Intermediary Distribution, Managing Director, Strategic Relations, Managing Director, Head of National Accounts, Senior Vice President, National Account Manager and Senior Vice President, Key Account Manager, Columbia Management Investment Advisers LLC; Vice President, Key Account Manager, Liberty Funds Distributor, Inc.; and Trustee of certain Oppenheimer Funds | | 189 | | Director, Board of Directors of Caron Engineering Inc.; Advisor, Board of Advisors of Caron Engineering Inc.; President and Director, Acton Shapleigh Youth Conservation Corps (non-profit) Formerly: President and Director Director of Grahamtastic Connection (non-profit) |
| Cynthia Hostetler -1962 Trustee | | 2017 | | Non-Executive Director and Trustee of a number of public and private business corporations Formerly: Director, Aberdeen Investment Funds (4 portfolios); Director, Artio Global Investment LLC (mutual fund complex); Director, Edgen Group, Inc. (specialized energy and infrastructure products distributor); Director, Genesee & Wyoming, Inc. (railroads); Head of Investment Funds and Private Equity, Overseas Private Investment Corporation; President, First Manhattan Bancorporation, Inc.; and Attorney, Simpson Thacher & Bartlett LLP | | 189 | | Resideo Technologies, Inc. (smart home technology); Vulcan Materials Company (construction materials company); Trilinc Global Impact Fund; Textainer Group Holdings, (shipping container leasing company); Investment Company Institute (professional organization); and Independent Directors Council (professional organization) |
| Eli Jones - 1961 Trustee | | 2016 | | Professor and Dean Emeritus, Mays Business School - Texas A&M University Formerly: Dean of Mays Business School-Texas A&M University; Professor and Dean, Walton College of Business, University of Arkansas and E.J. Ourso College of Business, Louisiana State University; and Director, Arvest Bank | | 189 | | Insperity, Inc. (formerly known as Administaff) (human resources provider); and Member of Regional Board of Directors and Board of Directors, First Financial Bancorp (regional bank) |
| | |
| T-1 | | Invesco World Bond Factor Fund |
Trustees and Officers–(continued)
| | | | | | | | |
Name, Year of Birth and Position(s) Held with the Trust | | Trustee and/or Officer Since | | Principal Occupation(s) During Past 5 Years | | Number of Funds in Fund Complex
Overseen by
Trustee | | Other Directorship(s) Held by Trustee During Past 5 Years |
| Independent Trustees–(continued) | | | | | | |
Elizabeth Krentzman -1959 Trustee | | 2019 | | Formerly: Principal and Chief Regulatory Advisor for Asset Management Services and U.S. Mutual Fund Leader of Deloitte & Touche LLP; General Counsel of the Investment Company Institute (trade association); National Director of the Investment Management Regulatory Consulting Practice, Principal, Director and Senior Manager of Deloitte & Touche LLP; Assistant Director of the Division of Investment Management - Office of Disclosure and Investment Adviser Regulation of the U.S. Securities and Exchange Commission and various positions with the Division of Investment Management - Office of Regulatory Policy of the U.S. Securities and Exchange Commission; Associate at Ropes & Gray LLP; and Trustee of certain Oppenheimer Funds | | 189 | | Formerly: Member of the Cartica Funds Board of Directors (private investment fund); Trustee of the University of Florida National Board Foundation; and Member of the University of Florida Law Center Association, Inc. Board of Trustees, Audit Committee and Membership Committee |
Anthony J. LaCava, Jr. - 1956 Trustee | | 2019 | | Formerly: Director and Member of the Audit Committee, Blue Hills Bank (publicly traded financial institution) and Managing Partner, KPMG LLP | | 189 | | Blue Hills Bank; Chairman, Bentley University; Member, Business School Advisory Council; and Nominating Committee, KPMG LLP |
Prema Mathai-Davis - 1950 Trustee | | 2001 | | Retired Formerly: Co-Founder & Partner of Quantalytics Research, LLC, (a FinTech Investment Research Platform for the Self-Directed Investor); Trustee of YWCA Retirement Fund; CEO of YWCA of the USA; Board member of the NY Metropolitan Transportation Authority; Commissioner of the NYC Department of Aging; and Board member of Johns Hopkins Bioethics Institute | | 189 | | Member of Board of Positive Planet US (non-profit) and HealthCare Chaplaincy Network (non-profit) |
Joel W. Motley - 1952 Trustee | | 2019 | | Director of Office of Finance, Federal Home Loan Bank System; Managing Director of Carmona Motley Inc. (privately held financial advisor); Member of the Council on Foreign Relations and its Finance and Budget Committee; Chairman Emeritus of Board of Human Rights Watch and Member of its Investment Committee; and Member of Investment Committee Board of Historic Hudson Valley (non-profit cultural organization); Member of the Board, Blue Ocean Acquisition Corp.; and Member of the Vestry and the Investment Committee of Trinity Church Wall Street. Formerly: Managing Director of Public Capital Advisors, LLC (privately held financial advisor); Managing Director of Carmona Motley Hoffman, Inc. (privately held financial advisor); Trustee of certain Oppenheimer Funds; and Director of Columbia Equity Financial Corp. (privately held financial advisor) | | 189 | | Member of Board of Trust for Mutual Understanding (non-profit promoting the arts and environment); Member of Board of Greenwall Foundation (bioethics research foundation) and its Investment Committee; Member of Board of Friends of the LRC (non-profit legal advocacy); and Board Member and Investment Committee Member of Pulitzer Center for Crisis Reporting (non-profit journalism) |
Teresa M. Ressel - 1962 Trustee | | 2017 | | Non-executive director and trustee of a number of public and private business corporations Formerly: Chief Executive Officer, UBS Securities LLC (investment banking); Chief Operating Officer, UBS AG Americas (investment banking); Sr. Management Team Olayan America, The Olayan Group (international investor/commercial/industrial); Assistant Secretary for Management & Budget and Designated Chief Financial Officer, U.S. Department of Treasury and Director, ON Semiconductor Corporation (semiconductor manufacturing) | | 189 | | None |
| Robert C. Troccoli - 1949 Trustee | | 2016 | | Retired Formerly: Adjunct Professor, University of Denver - Daniels College of Business; and Managing Partner, KPMG LLP | | 189 | | None |
| Daniel S. Vandivort - 1954 Trustee | | 2019 | | President, Flyway Advisory Services LLC (consulting and property management) Formerly: President and Chief Investment Officer, previously Head of Fixed Income, Weiss Peck and Greer/Robeco Investment Management; Trustee and Chair, Weiss Peck and Greer Funds Board; and various capacities at CS First Boston including Head of Fixed Income at First Boston Asset Management. | | 189 | | Formerly: Trustee and Governance Chair, Oppenheimer Funds; Treasurer, Chairman of the Audit and Finance Committee, Huntington Disease Foundation of America |
| | |
| T-2 | | Invesco World Bond Factor Fund |
Trustees and Officers–(continued)
| | | | | | | | |
Name, Year of Birth and Position(s) Held with the Trust | | Trustee and/or Officer Since | | Principal Occupation(s) During Past 5 Years | | Number of Funds in
Fund Complex
Overseen by
Trustee | | Other Directorship(s) Held by Trustee During Past 5 Years |
| Officers | | | | | | |
| Sheri Morris - 1964 President and Principal Executive Officer | | 1999 | | Director, Invesco Trust Company; Head of Global Fund Services, Invesco Ltd.; President and Principal Executive Officer, The Invesco Funds; Vice President, Invesco Exchange-Traded Fund Trust, Invesco Exchange-Traded Fund Trust II, Invesco India Exchange-Traded Fund Trust, Invesco Actively Managed Exchange-Traded Fund Trust, Invesco Actively Managed Exchange-Traded Commodity Fund Trust and Invesco Exchange-Traded Self-Indexed Fund Trust; and Vice President, OppenheimerFunds, Inc. Formerly: Vice President, Treasurer and Principal Financial Officer, The Invesco Funds; Vice President, Invesco AIM Advisers, Inc., Invesco AIM Capital Management, Inc. and Invesco AIM Private Asset Management, Inc.; Assistant Vice President and Assistant Treasurer, The Invesco Funds; Vice President and Assistant Vice President, Invesco Advisers, Inc.; Assistant Vice President, Invesco AIM Capital Management, Inc. and Invesco AIM Private Asset Management, Inc.; Treasurer, Invesco Exchange-Traded Fund Trust, Invesco Exchange-Traded Fund Trust II, Invesco India Exchange-Traded Fund Trust and Invesco Actively Managed Exchange-Traded Fund Trust; and Senior Vice President, Invesco Advisers, Inc. (formerly known as Invesco Institutional (N.A.), Inc.) (registered investment adviser) | | N/A | | N/A |
| Jeffrey H. Kupor - 1968 Senior Vice President, Chief Legal Officer and Secretary | | 2018 | | Head of Legal of the Americas, Invesco Ltd.; Senior Vice President and Secretary, Invesco Advisers, Inc. (formerly known as Invesco Institutional (N.A.), Inc.) (registered investment adviser); Secretary, Invesco Distributors, Inc. (formerly known as Invesco AIM Distributors, Inc.); Vice President and Secretary, Invesco Investment Services, Inc. (formerly known as Invesco AIM Investment Services, Inc.); Senior Vice President, Chief Legal Officer and Secretary, The Invesco Funds; Secretary and General Counsel, Invesco Investment Advisers LLC (formerly known as Van Kampen Asset Management); Secretary and General Counsel, Invesco Capital Markets, Inc. (formerly known as Van Kampen Funds Inc.); Chief Legal Officer, Invesco Exchange-Traded Fund Trust, Invesco Exchange-Traded Fund Trust II, Invesco India Exchange-Traded Fund Trust, Invesco Actively Managed Exchange-Traded Fund Trust, Invesco Actively Managed Exchange-Traded Commodity Fund Trust and Invesco Exchange-Traded Self-Indexed Fund Trust;; Secretary and Vice President, Harbourview Asset Management Corporation; Secretary and Vice President, OppenheimerFunds, Inc. and Invesco Managed Accounts, LLC; Secretary and Senior Vice President, OFI Global Institutional, Inc.; Secretary and Vice President, OFI SteelPath, Inc.; Secretary and Vice President, Oppenheimer Acquisition Corp.; Secretary and Vice President, Shareholder Services, Inc.; and Secretary and Vice President, Trinity Investment Management Corporation Formerly: Senior Vice President, Invesco Distributors, Inc.; Secretary and Vice President, Jemstep, Inc.; Head of Legal, Worldwide Institutional, Invesco Ltd.; Secretary and General Counsel, INVESCO Private Capital Investments, Inc.; Senior Vice President, Secretary and General Counsel, Invesco Management Group, Inc. (formerly known as Invesco AIM Management Group, Inc.); Assistant Secretary, INVESCO Asset Management (Bermuda) Ltd.; Secretary and General Counsel, Invesco Private Capital, Inc.; Assistant Secretary and General Counsel, INVESCO Realty, Inc.; Secretary and General Counsel, Invesco Senior Secured Management, Inc.; Secretary, Sovereign G./P. Holdings Inc.; Secretary, Invesco Indexing LLC; and Secretary, W.L. Ross & Co., LLC | | N/A | | N/A |
Andrew R. Schlossberg - 1974 Senior Vice President | | 2019 | | Senior Vice President, Invesco Group Services, Inc.; Head of the Americas and Senior Managing Director, Invesco Ltd.; Director and Senior Vice President, Invesco Advisers, Inc. (formerly known as Invesco Institutional (N.A.), Inc.) (registered investment adviser); Director and Chairman, Invesco Investment Services, Inc. (formerly known as Invesco AIM Investment Services, Inc.) (registered transfer agent); Senior Vice President, The Invesco Funds; and Director, Invesco Investment Advisers LLC (formerly known as Van Kampen Asset Management) | | N/A | | N/A |
| | | | | Formerly: Director, President and Chairman, Invesco Insurance Agency, Inc.; Director, Invesco UK Limited; Director and Chief Executive, Invesco Asset Management Limited and Invesco Fund Managers Limited; Assistant Vice President, The Invesco Funds; Senior Vice President, Invesco Advisers, Inc. (formerly known as Invesco Institutional (N.A.), Inc.) (registered investment adviser); Director and Chief Executive, Invesco Administration Services Limited and Invesco Global Investment Funds Limited; Director, Invesco Distributors, Inc.; Head of EMEA, Invesco Ltd.; President, Invesco Actively Managed Exchange-Traded Commodity Fund Trust, Invesco Actively Managed Exchange-Traded Fund Trust, Invesco Exchange-Traded Fund Trust, Invesco Exchange-Traded Fund Trust II and Invesco India Exchange-Traded Fund Trust; and Managing Director and Principal Executive Officer, Invesco Capital Management LLC | | | | |
| | |
| T-3 | | Invesco World Bond Factor Fund |
Trustees and Officers–(continued)
| | | | | | | | |
Name, Year of Birth and Position(s) Held with the Trust | | Trustee and/or Officer Since | | Principal Occupation(s) During Past 5 Years | | Number of Funds in
Fund Complex
Overseen by
Trustee | | Other Directorship(s) Held by Trustee During Past 5 Years |
| Officers–(continued) | | | | | | |
John M. Zerr - 1962 Senior Vice President | | 2006 | | Chief Operating Officer of the Americas; Senior Vice President, Invesco Advisers, Inc. (formerly known as Invesco Institutional (N.A.), Inc.) (registered investment adviser); Senior Vice President, Invesco Distributors, Inc. (formerly known as Invesco AIM Distributors, Inc.); Director and Vice President, Invesco Investment Services, Inc. (formerly known as Invesco AIM Investment Services, Inc.) Senior Vice President, The Invesco Funds; Managing Director, Invesco Capital Management LLC; Director, Invesco Investment Advisers LLC (formerly known as Van Kampen Asset Management); Senior Vice President, Invesco Capital Markets, Inc. (formerly known as Van Kampen Funds Inc.); Manager, Invesco Indexing LLC; Manager, Invesco Specialized Products, LLC; Member, Invesco Canada Funds Advisory Board; Director, President and Chief Executive Officer, Invesco Corporate Class Inc. (corporate mutual fund company); and Director, Chairman, President and Chief Executive Officer, Invesco Canada Ltd. (formerly known as Invesco Trimark Ltd./Invesco Trimark Ltèe) (registered investment adviser and registered transfer agent); President, Invesco, Inc.; President, Invesco Global Direct Real Estate Feeder GP Ltd.; President, Invesco IP Holdings (Canada) Ltd; President, Invesco Global Direct Real Estate GP Ltd.; President, Invesco Financial Services Ltd. / Services Financiers Invesco Ltée; and Director and Chairman, Invesco Trust Company Formerly: President, Trimark Investments Ltd/Services Financiers Invesco Ltee; Director and Senior Vice President, Invesco Insurance Agency, Inc.; Director and Senior Vice President, Invesco Management Group, Inc. (formerly known as Invesco AIM Management Group, Inc.); Secretary and General Counsel, Invesco Management Group, Inc. (formerly known as Invesco AIM Management Group, Inc.); Secretary, Invesco Investment Services, Inc. (formerly known as Invesco AIM Investment Services, Inc.); Chief Legal Officer and Secretary, The Invesco Funds; Secretary and General Counsel, Invesco Investment Advisers LLC (formerly known as Van Kampen Asset Management); Secretary and General Counsel, Invesco Capital Markets, Inc. (formerly known as Van Kampen Funds Inc.); Chief Legal Officer, Invesco Exchange-Traded Fund Trust, Invesco Exchange-Traded Fund Trust II, Invesco India Exchange-Traded Fund Trust, Invesco Actively Managed Exchange-Traded Fund Trust, Invesco Actively Managed Exchange-Traded Commodity Fund Trust and Invesco Exchange-Traded Self-Indexed Fund Trust; Secretary, Invesco Indexing LLC; Director, Secretary, General Counsel and Senior Vice President, Van Kampen Exchange Corp.; Director, Vice President and Secretary, IVZ Distributors, Inc. (formerly known as INVESCO Distributors, Inc.); Director and Vice President, INVESCO Funds Group, Inc.; Director and Vice President, Van Kampen Advisors Inc.; Director, Vice President, Secretary and General Counsel, Van Kampen Investor Services Inc.; Director and Secretary, Invesco Distributors, Inc. (formerly known as Invesco AIM Distributors, Inc.); Director, Senior Vice President, General Counsel and Secretary, Invesco AIM Advisers, Inc. and Van Kampen Investments Inc.; Director, Vice President and Secretary, Fund Management Company; Director, Senior Vice President, Secretary, General Counsel and Vice President, Invesco AIM Capital Management, Inc.; and Chief Operating Officer and General Counsel, Liberty Ridge Capital, Inc. (an investment adviser) | | N/A | | N/A |
Gregory G. McGreevey - 1962 Senior Vice President | | 2012 | | Senior Managing Director, Invesco Ltd.; Director, Chairman, President, and Chief Executive Officer, Invesco Advisers, Inc. (formerly known as Invesco Institutional (N.A.), Inc.) (registered investment adviser); Director, Invesco Mortgage Capital, Inc. and Invesco Senior Secured Management, Inc.; Senior Vice President, The Invesco Funds; President, SNW Asset Management Corporation and Invesco Managed Accounts, LLC; Chairman and Director, Invesco Private Capital, Inc.; Chairman and Director, INVESCO Private Capital Investments, Inc.; Chairman and Director, INVESCO Realty, Inc.; and Senior Vice President, Invesco Group Services, Inc. | | N/A | | N/A |
| | | | | Formerly: Senior Vice President, Invesco Management Group, Inc. and Invesco Advisers, Inc.; Assistant Vice President, The Invesco Funds | | | | |
| Adrien Deberghes - 1967 Principal Financial Officer, Treasurer and Vice President | | 2020 | | Head of the Fund Office of the CFO and Fund Administration; Vice President, Invesco Advisers, Inc.; Principal Financial Officer, Treasurer and Vice President, The Invesco Funds; Vice President, Invesco Exchange-Traded Fund Trust, Invesco Exchange-Traded Fund Trust II, Invesco India Exchange-Traded Fund Trust, Invesco Actively Managed Exchange-Traded Fund Trust, Invesco Actively Managed Exchange-Traded Commodity Fund Trust and Invesco Exchange-Traded Self-Indexed Fund Trust Formerly: Senior Vice President and Treasurer, Fidelity Investments | | N/A | | N/A |
| Crissie M. Wisdom - 1969 Anti-Money Laundering Compliance Officer | | 2013 | | Anti-Money Laundering and OFAC Compliance Officer for Invesco U.S. entities including: Invesco Advisers, Inc. and its affiliates, Invesco Capital Markets, Inc., Invesco Distributors, Inc., Invesco Investment Services, Inc., The Invesco Funds, Invesco Capital Management, LLC, Invesco Trust Company; and Fraud Prevention Manager for Invesco Investment Services, Inc. | | N/A | | N/A |
| | |
| T-4 | | Invesco World Bond Factor Fund |
Trustees and Officers–(continued)
| | | | | | | | |
Name, Year of Birth and Position(s) Held with the Trust | | Trustee and/or Officer Since | | Principal Occupation(s) During Past 5 Years | | Number of Funds in
Fund Complex
Overseen by
Trustee | | Other Directorship(s) Held by Trustee During Past 5 Years |
| Officers–(continued) | | | | | | |
Todd F. Kuehl - 1969 Chief Compliance Officer and Senior Vice President | | 2020 | | Chief Compliance Officer, Invesco Advisers, Inc. (registered investment adviser); and Chief Compliance Officer and Senior Vice President, The Invesco Funds Formerly: Managing Director and Chief Compliance Officer, Legg Mason (Mutual Funds); Chief Compliance Officer, Legg Mason Private Portfolio Group (registered investment adviser) | | N/A | | N/A |
| James Bordewick, Jr. - 1959 Senior Vice President and Senior Officer | | 2022 | | Senior Vice President and Senior Officer, The Invesco Funds; and Chief Legal Officer, KingsCrowd, Inc. (research and analytical platform for investment in private capital markets) Formerly, Chief Operating Officer and Head of Legal and Regulatory, Netcapital (private capital investment platform); Managing Director, General Counsel of asset management and Chief Compliance Officer for asset management and private banking, Bank of America Corporation; Chief Legal Officer, Columbia Funds and BofA Funds; Senior Vice President and Associate General Counsel, MFS Investment Management; Chief Legal Officer, MFS Funds; Associate, Ropes & Gray; Associate, Gaston Snow & Ely Bartlett | | N/A | | N/A |
The Statement of Additional Information of the Trust includes additional information about the Fund’s Trustees and is available upon request, without charge, by calling 1.800.959.4246. Please refer to the Fund’s Statement of Additional Information for information on the Fund’s sub-advisers.
Office of the Fund
11 Greenway Plaza, Suite 1000
Houston, TX 77046-1173
Counsel to the Fund
Stradley Ronon Stevens & Young, LLP
2005 Market Street, Suite 2600 Philadelphia, PA 19103-7018
Investment Adviser
Invesco Advisers, Inc.
1555 Peachtree Street, N.E.
Atlanta, GA 30309
Counsel to the Independent Trustees
Goodwin Procter LLP
901 New York Avenue, N.W.
Washington, D.C. 20001
Distributor
Invesco Distributors, Inc.
11 Greenway Plaza, Suite 1000
Houston, TX 77046-1173
Transfer Agent
Invesco Investment Services, Inc.
11 Greenway Plaza, Suite 1000
Houston, TX 77046-1173
Auditors
PricewaterhouseCoopers LLP
1000 Louisiana Street, Suite 5800
Houston, TX 77002-5021
Custodian
State Street Bank and Trust Company
225 Franklin Street
Boston, MA 02110-2801
| | |
| T-5 | | Invesco World Bond Factor Fund |
(This page intentionally left blank)
(This page intentionally left blank)

Go paperless with eDelivery
Visit invesco.com/edelivery to enjoy the convenience and security of anytime electronic access to your investment documents.
With eDelivery, you can elect to have any or all of the following materials delivered straight to your inbox to download, save and print from your own computer:
∎ Fund reports and prospectuses
∎ Quarterly statements
∎ Daily confirmations
∎ Tax forms
Invesco mailing information
Send general correspondence to Invesco Investment Services, Inc., P.O. Box 219078, Kansas City, MO 64121-9078.
Important notice regarding delivery of security holder documents
To reduce Fund expenses, only one copy of most shareholder documents may be mailed to shareholders with multiple accounts at the same address (Householding). Mailing of your shareholder documents may be householded indefinitely unless you instruct us otherwise. If you do not want the mailing of these documents to be combined with those for other members of your household, please contact Invesco Investment Services, Inc. at 800 959 4246 or contact your financial institution. We will begin sending you individual copies for each account within 30 days after receiving your request.
Fund holdings and proxy voting information
The Fund provides a complete list of its portfolio holdings four times each year, at the end of each fiscal quarter. For the second and fourth quarters, the list appears, respectively, in the Fund’s semiannual and annual reports to shareholders. For the first and third quarters, the Fund files the list with the Securities and Exchange Commission (SEC) as an exhibit to its reports on Form N-PORT. The most recent list of portfolio holdings is available at invesco.com/completeqtrholdings. Shareholders can also look up the Fund’s Form N-PORT filings on the SEC website, sec.gov. The SEC file numbers for the Fund are shown below.
A description of the policies and procedures that the Fund uses to determine how to vote proxies relating to portfolio securities is available without charge, upon request, from our Client Services department at 800 959 4246, or at invesco.com/corporate/about-us/esg. The information is also available on the SEC website, sec.gov.
Information regarding how the Fund voted proxies related to its portfolio securities during the most recent 12-month period ended June 30 is available at invesco.com/proxysearch. This information is also available on the SEC website, sec.gov.
Invesco Advisers, Inc. is an investment adviser; it provides investment advisory services to individual and institutional clients and does not sell securities. Invesco Distributors, Inc. is the US distributor for Invesco Ltd.’s retail mutual funds, exchange-traded funds and institutional money market funds. Both are wholly owned, indirect subsidiaries of Invesco Ltd.
| | | | |
| SEC file number(s): 811-05426 and 033-19338 Invesco Distributors, Inc. | | WBD-AR-1 |
There were no amendments to the Code of Ethics (the “Code”) that applies to the Registrant’s Principal Executive Officer (“PEO”) and Principal Financial Officer (“PFO”) during the period covered by the report. The Registrant did not grant any waivers, including implicit waivers, from any provisions of the Code to the PEO or PFO during the period covered by this report.
| ITEM 3. | AUDIT COMMITTEE FINANCIAL EXPERT. |
The Board of Trustees has determined that the Registrant has at least one audit committee financial expert serving on its Audit Committee. The Audit Committee financial experts are Cynthia Hostetler, Anthony J. LaCava, Jr., and Robert C. Troccoli. Cynthia Hostetler, Anthony J. LaCava, Jr., and Robert C. Troccoli are “independent” within the meaning of that term as used in Form N-CSR.
| ITEM 4. | PRINCIPAL ACCOUNTANT FEES AND SERVICES. |
Pursuant to PCAOB Rule 3526, Communication with Audit Committees Concerning Independence, PricewaterhouseCoopers LLC (“PwC”) advised the Registrant’s Audit Committee of the following two matters identified since the previous annual Form N-CSR filing that may be reasonably thought to bear on PwC’s independence. PwC advised the Audit Committee that one PwC Senior Associate and one PwC Partner each held financial interests directly in an investment company within the complex that includes the Funds as well as all registered investment companies advised by the Adviser and its affiliates, including other subsidiaries of the Adviser’s parent company, Invesco Ltd. (collectively the “Invesco Funds Investment Company Complex”) that were inconsistent with the requirements of Rule 2-01(c)(1) of SEC Regulation S-X. In reporting each matter to the Audit Committee, PwC noted, among other things, that the impermissible holdings were disposed of by the individuals, the individuals were not in the chain of command of the audit or the audit partners of the Funds, the financial interests were not material to the net worth of each individual or his or her respective immediate family members and the Funds’ audit engagement team was unaware of the impermissible holdings until after the matters were confirmed to be independence exceptions . In addition, PwC considered that the audit services performed by the PwC Senior Associate were reviewed by team members at least two levels higher than the individual and the individual did not have any decision making responsibility for matters that materially affected the audit and that the PwC Partner provided non-audit services that were not relied upon by the audit engagement team in the audits of the financial statements of the Funds. Based on the mitigating factors noted above, PwC advised the Audit Committee that it concluded, individually for each matter and in the aggregate, that its objectivity and impartiality with respect to all issues encompassed within the audit engagement has not been impaired and it believes that a reasonable investor with knowledge of all relevant facts and circumstances for the violations would conclude PwC is capable of exercising objective and impartial judgment on all issues encompassed within the audits of the financial statements of the Funds in the Registrant for the impacted periods.
(a) to (d)
Fees Billed by PwC Related to the Registrant
PwC billed the Registrant aggregate fees for services rendered to the Registrant for the last two fiscal years as shown in the following table. The Audit Committee pre-approved all audit and non-audit services provided to the Registrant.
| | | | | | | | | | | | | | | | | | | | |
| | | | | |
| | | Fees Billed for
Services Rendered
to the Registrant for
fiscal year end 2022 | | | | Fees Billed for
Services Rendered
to the Registrant for
fiscal year end 2021 | | |
| | | | | | | | | |
Audit Fees | | $ 925,264 | | | | $ 999,325 | | |
Audit-Related Fees | | $ 0 | | | | $ 0 | | |
Tax Fees(1) | | $ 403,564 | | | | $ 538,211 | | |
All Other Fees | | $ 0 | | | | $ 0 | | |
Total Fees | | $ 1,328,828 | | | | $ 1,537,536 | | |
| | (1) | Tax Fees for the fiscal years ended October 31, 2022 and October 31, 2021 includes fees billed for preparation of U.S. Tax Returns and Taxable Income calculations, including excise tax and year-to-date estimates for various book-to-tax differences. |
Fees Billed by PwC Related to Invesco and Invesco Affiliates
PwC billed Invesco Advisers, Inc. (“Invesco”), the Registrant’s adviser, and any entity controlling, controlled by or under common control with Invesco that provides ongoing services to the Registrant (“Invesco Affiliates”) aggregate fees for pre-approved non-audit services rendered to Invesco and Invesco Affiliates for the last two fiscal years as shown in the following table. The Audit Committee pre-approved all non-audit services provided to Invesco and Invesco Affiliates that were required to be pre-approved.
| | | | | | | | |
| | | Fees Billed for Non- Audit Services
Rendered to Invesco and
Invesco Affiliates for
fiscal year end 2022
That Were Required to be Pre-Approved by the Registrant’s Audit Committee | | | | Fees Billed for Non-Audit
Services Rendered to
Invesco and Invesco
Affiliates for fiscal year end
2021 That Were Required to be Pre-Approved by the Registrant’s Audit Committee | | |
| | | | | | | | |
Audit-Related Fees(1) | | $ 760,000 | | | | $ 760,000 | | |
Tax Fees | | $ 0 | | | | $ 0 | | |
All Other Fees | | $ 0 | | | | $ 0 | | |
Total Fees | | $ 760,000 | | | | $ 760,000 | | |
| (1) | Audit-Related Fees for the fiscal years ended 2022 and 2021 include fees billed related to reviewing controls at a service organization. |
(e)(1)
PRE-APPROVAL OF AUDIT AND NON-AUDIT SERVICES
POLICIES AND PROCEDURES
As adopted by the Audit Committees
of the Invesco Funds (the “Funds”)
Last Amended March 29, 2017
| | I. | Statement of Principles |
The Audit Committees (the “Audit Committee”) of the Boards of Trustees of the Funds (the “Board”) have adopted these policies and procedures (the “Procedures”) with respect to the pre-approval of audit and non-audit services to be provided by the Funds’ independent auditor (the “Auditor”) to the Funds, and to the Funds’ investment adviser(s) and any entity controlling, controlled by, or under common control with the investment adviser(s) that provides ongoing services to the Funds (collectively, “Service Affiliates”).
Under Section 202 of the Sarbanes-Oxley Act of 2002, all audit and non-audit services provided to the Funds by the Auditor must be preapproved by the Audit Committee. Rule 2-01 of Regulation S-X requires that the Audit Committee also pre-approve a Service Affiliate’s engagement of the Auditor for non-audit services if the engagement relates directly to the operations and financial reporting of the Funds (a “Service Affiliate’s Covered Engagement”).
These Procedures set forth the procedures and the conditions pursuant to which the Audit Committee may pre-approve audit and non-audit services for the Funds and a Service Affiliate’s Covered Engagement pursuant to rules and regulations of the Securities and Exchange Commission (“SEC”) and other organizations and regulatory bodies applicable to the Funds (“Applicable Rules”).1 They address both general pre-approvals without consideration of specific case-by-case services (“general pre-approvals”) and pre-approvals on a case-by-case basis (“specific pre-approvals”). Any services requiring pre-approval that are not within the scope of general pre-approvals hereunder are subject to specific pre-approval. These Procedures also address the delegation by the Audit Committee of pre-approval authority to the Audit Committee Chair or Vice Chair.
| | II. | Pre-Approval of Fund Audit Services |
The annual Fund audit services engagement, including terms and fees, is subject to specific pre-approval by the Audit Committee. Audit services include the annual financial statement audit and other procedures required to be performed by an independent auditor to be able to form an opinion on the Funds’ financial statements. The Audit Committee will receive, review and consider sufficient information concerning a proposed Fund audit engagement to make a reasonable evaluation of the Auditor’s qualifications and independence. The Audit Committee will oversee the Fund audit services engagement as necessary, including approving any changes in terms, audit scope, conditions and fees.
In addition to approving the Fund audit services engagement at least annually and specifically approving any changes, the Audit Committee may generally or specifically pre-approve engagements for other audit services, which are those services that only an independent auditor reasonably can provide. Other audit
1 Applicable Rules include, for example, New York Stock Exchange (“NYSE”) rules applicable to closed-end funds managed by Invesco and listed on NYSE.
services may include services associated with SEC registration statements, periodic reports and other documents filed with the SEC.
| | III. | General and Specific Pre-Approval of Non-Audit Fund Services |
The Audit Committee will consider, at least annually, the list of General Pre-Approved Non-Audit Services which list may be terminated or modified at any time by the Audit Committee. To inform the Audit Committee’s review and approval of General Pre-Approved Non-Audit Services, the Funds’ Treasurer (or his or her designee) and Auditor shall provide such information regarding independence or other matters as the Audit Committee may request.
Any services or fee ranges that are not within the scope of General Pre-Approved Non-Audit Services have not received general pre-approval and require specific pre-approval. Each request for specific pre-approval by the Audit Committee for services to be provided by the Auditor to the Funds must be submitted to the Audit Committee by the Funds’ Treasurer (or his or her designee) and must include detailed information about the services to be provided, the fees or fee ranges to be charged, and other relevant information sufficient to allow the Audit Committee to consider whether to pre-approve such engagement, including evaluating whether the provision of such services will impair the independence of the Auditor and is otherwise consistent with Applicable Rules.
| | IV. | Non-Audit Service Types |
The Audit Committee may provide either general or specific pre-approval of audit-related, tax or other services, each as described in more detail below.
“Audit-related services” are assurance and related services that are reasonably related to the performance of the audit or review of the Fund’s financial statements or that are traditionally performed by an independent auditor. Audit-related services include, among others, accounting consultations related to accounting, financial reporting or disclosure matters not classified as “Audit services”; assistance with understanding and implementing new accounting and financial reporting guidance from rulemaking authorities; services related to mergers, acquisitions or dispositions; compliance with ratings agency requirements and interfund lending activities; and assistance with internal control reporting requirements.
“Tax services” include, but are not limited to, the review and signing of the Funds’ federal tax returns, the review of required distributions by the Funds and consultations regarding tax matters such as the tax treatment of new investments or the impact of new regulations. The Audit Committee will not approve proposed services of the Auditor which the Audit Committee believes are to be provided in connection with a service or transaction initially recommended by the Auditor, the sole business purpose of which may be tax avoidance and the tax treatment of which may not be supported in the Internal Revenue Code and related regulations. The Audit Committee will consult with the Funds’ Treasurer (or his or her designee) and may consult with outside counsel or advisers as necessary to ensure the consistency of tax services rendered by the Auditor with the foregoing policy. The Auditor shall not represent any Fund or any Service Affiliate before a tax court, district court or federal court of claims.
Each request to provide tax services under either the general or specific pre-approval of the Audit Committee will include a description from the Auditor in writing of (i) the scope of the service, the fee structure for the engagement, and any side letter or other amendment to the engagement letter, or any other
agreement (whether oral, written, or otherwise) between the Auditor and the Funds, relating to the service; and (ii) any compensation arrangement or other agreement, such as a referral agreement, a referral fee or fee-sharing arrangement, between the Auditor (or an affiliate of the Auditor) and any person (other than the Funds or Service Affiliates receiving the services) with respect to the promoting, marketing, or recommending of a transaction covered by the service. The Auditor will also discuss with the Audit Committee the potential effects of the services on the independence of the Auditor, and document the substance of its discussion with the Audit Committee.
The Audit Committee may pre-approve other non-audit services so long as the Audit Committee believes that the service will not impair the independence of the Auditor. Appendix I includes a list of services that the Auditor is prohibited from performing by the SEC rules. Appendix I also includes a list of services that would impair the Auditor’s independence unless the Audit Committee reasonably concludes that the results of the services will not be subject to audit procedures during an audit of the Funds’ financial statements.
| | V. | Pre-Approval of Service Affiliate’s Covered Engagements |
Rule 2-01 of Regulation S-X requires that the Audit Committee pre-approve a Service Affiliate’s engagement of the Auditor for non-audit services if the engagement relates directly to the operations and financial reporting of the Funds, defined above as a “Service Affiliate’s Covered Engagement”.
The Audit Committee may provide either general or specific pre-approval of any Service Affiliate’s Covered Engagement, including for audit-related, tax or other services, as described above, if the Audit Committee believes that the provision of the services to a Service Affiliate will not impair the independence of the Auditor with respect to the Funds. Any Service Affiliate’s Covered Engagements that are not within the scope of General Pre-Approved Non-Audit Services have not received general pre-approval and require specific pre-approval.
Each request for specific pre-approval by the Audit Committee of a Service Affiliate’s Covered Engagement must be submitted to the Audit Committee by the Funds’ Treasurer (or his or her designee) and must include detailed information about the services to be provided, the fees or fee ranges to be charged, a description of the current status of the pre-approval process involving other audit committees in the Invesco investment company complex (as defined in Rule 2-201 of Regulation S-X) with respect to the proposed engagement, and other relevant information sufficient to allow the Audit Committee to consider whether the provision of such services will impair the independence of the Auditor from the Funds. Additionally, the Funds’ Treasurer (or his or her designee) and the Auditor will provide the Audit Committee with a statement that the proposed engagement requires pre-approval by the Audit Committee, the proposed engagement, in their view, will not impair the independence of the Auditor and is consistent with Applicable Rules, and the description of the proposed engagement provided to the Audit Committee is consistent with that presented to or approved by the Invesco audit committee.
Information about all Service Affiliate engagements of the Auditor for non-audit services, whether or not subject to pre-approval by the Audit Committee, shall be provided to the Audit Committee at least quarterly, to allow the Audit Committee to consider whether the provision of such services is compatible with maintaining the Auditor’s independence from the Funds. The Funds’ Treasurer and Auditor shall provide the Audit Committee with sufficiently detailed information about the scope of services provided and the fees for such services, to ensure that the Audit Committee can adequately consider whether the provision of such services is compatible with maintaining the Auditor’s independence from the Funds.
| | VI. | Pre-Approved Fee Levels or Established Amounts |
Pre-approved fee levels or ranges for audit and non-audit services to be provided by the Auditor to the Funds, and for a Service Affiliate’s Covered Engagement, under general pre-approval or specific pre-approval will be set periodically by the Audit Committee. Any proposed fees exceeding 110% of the maximum pre-approved fee levels or ranges for such services or engagements will be promptly presented to the Audit Committee and will require specific pre-approval by the Audit Committee before payment of any additional fees is made.
The Audit Committee hereby delegates, subject to the dollar limitations set forth below, specific authority to its Chair, or in his or her absence, Vice Chair, to pre-approve audit and non-audit services proposed to be provided by the Auditor to the Funds and/or a Service Affiliate’s Covered Engagement, between Audit Committee meetings. Such delegation does not preclude the Chair or Vice Chair from declining, on a case by case basis, to exercise his or her delegated authority and instead convening the Audit Committee to consider and pre-approve any proposed services or engagements.
Notwithstanding the foregoing, the Audit Committee must pre-approve: (a) any non-audit services to be provided to the Funds for which the fees are estimated to exceed $500,000; (b) any Service Affiliate’s Covered Engagement for which the fees are estimated to exceed $500,000; or (c) any cost increase to any previously approved service or engagement that exceeds the greater of $250,000 or 50% of the previously approved fees up to a maximum increase of $500,000.
| | VIII. | Compliance with Procedures |
Notwithstanding anything herein to the contrary, failure to pre-approve any services or engagements that are not required to be pre-approved pursuant to the de minimis exception provided for in Rule 2-01(c)(7)(i)(C) of Regulation S-X shall not constitute a violation of these Procedures. The Audit Committee has designated the Funds’ Treasurer to ensure services and engagements are pre-approved in compliance with these Procedures. The Funds’ Treasurer will immediately report to the Chair of the Audit Committee, or the Vice Chair in his or her absence, any breach of these Procedures that comes to the attention of the Funds’ Treasurer or any services or engagements that are not required to be pre-approved pursuant to the de minimis exception provided for in Rule 2-01(c)(7)(i)(C) of Regulation S-X.
On at least an annual basis, the Auditor will provide the Audit Committee with a summary of all non-audit services provided to any entity in the investment company complex (as defined in section 2-01(f)(14) of Regulation S-X, including the Funds and Service Affiliates) that were not pre-approved, including the nature of services provided and the associated fees.
| | IX. | Amendments to Procedures |
All material amendments to these Procedures must be approved in advance by the Audit Committee. Non-material amendments to these Procedures may be made by the Legal and Compliance Departments and will be reported to the Audit Committee at the next regularly scheduled meeting of the Audit Committee.
Appendix I
Non-Audit Services That May Impair the Auditor’s Independence
The Auditor is not independent if, at any point during the audit and professional engagement, the Auditor provides the following non-audit services:
| | ● | | Broker-dealer, investment adviser, or investment banking services ; |
| | ● | | Expert services unrelated to the audit; |
| | ● | | Any service or product provided for a contingent fee or a commission; |
| | ● | | Services related to marketing, planning, or opining in favor of the tax treatment of confidential transactions or aggressive tax position transactions, a significant purpose of which is tax avoidance; |
| | ● | | Tax services for persons in financial reporting oversight roles at the Fund; and |
| | ● | | Any other service that the Public Company Oversight Board determines by regulation is impermissible. |
An Auditor is not independent if, at any point during the audit and professional engagement, the Auditor provides the following non-audit services unless it is reasonable to conclude that the results of the services will not be subject to audit procedures during an audit of the Funds’ financial statements:
| | ● | | Bookkeeping or other services related to the accounting records or financial statements of the audit client; |
| | ● | | Financial information systems design and implementation; |
| | ● | | Appraisal or valuation services, fairness opinions, or contribution-in-kind reports; |
| | ● | | Actuarial services; and |
| | ● | | Internal audit outsourcing services. |
(e)(2) There were no amounts that were pre-approved by the Audit Committee pursuant to the de minimus exception under Rule 2-01 of Regulation S-X.
(f) Not applicable.
(g) In addition to the amounts shown in the tables above, PwC billed Invesco and Invesco Affiliates aggregate fees of $7,434,000 for the fiscal year ended October 31, 2022 and $5,910,000 for the fiscal year ended October 31, 2021. In total, PwC billed the Registrant, Invesco and Invesco Affiliates aggregate non-audit fees of $8,597,564 for the fiscal year ended October 31, 2022 and $7,208,211 for the fiscal year ended October 31, 2021.
PwC provided audit services to the Investment Company complex of approximately $31 million.
(h) The Audit Committee also has considered whether the provision of non-audit services that were rendered to Invesco and Invesco Affiliates that were not required to be pre-approved pursuant to SEC regulations, if any, is compatible with maintaining PwC’s independence.
| ITEM 5. | AUDIT COMMITTEE OF LISTED REGISTRANTS. |
Not applicable.
| ITEM 6. | SCHEDULE OF INVESTMENTS. |
Investments in securities of unaffiliated issuers is included as part of the reports to stockholders filed under Item 1 of this Form.
| ITEM 7. | DISCLOSURE OF PROXY VOTING POLICIES AND PROCEDURES FOR CLOSED-END MANAGEMENT INVESTMENT COMPANIES. |
Not applicable.
| ITEM 8. | PORTFOLIO MANAGERS OF CLOSED-END MANAGEMENT COMPANIES. |
Not applicable.
| ITEM 9. | PURCHASES OF EQUITY SECURITIES BY CLOSED-END MANAGEMENT INVESTMENT COMPANY AND AFFILIATED PURCHASERS. |
Not applicable.
| ITEM 10. | SUBMISSION OF MATTERS TO A VOTE OF SECURITY HOLDERS. |
None.
| ITEM 11. | CONTROLS AND PROCEDURES. |
| | (a) | As of December 20, 2022, an evaluation was performed under the supervision and with the participation of the officers of the Registrant, including the PEO and PFO, to assess the effectiveness of the Registrant’s disclosure controls and procedures, as that term is defined in Rule 30a-3(c) under the Investment Company Act of 1940 (the “Act”), as amended. Based on that evaluation, the Registrant’s officers, including the PEO and PFO, concluded that, as of December 20, 2022, the Registrant’s disclosure controls and procedures were reasonably designed to ensure: (1) that information required to be disclosed by the Registrant on Form N-CSR is recorded, processed, summarized and reported within the time periods specified by the rules and forms of the Securities and Exchange Commission; and (2) that material |
| | information relating to the Registrant is made known to the PEO and PFO as appropriate to allow timely decisions regarding required disclosure. |
| | (b) | There have been no changes in the Registrant’s internal control over financial reporting (as defined in Rule 30a-3(d) under the Act) that occurred during the period covered by this report that have materially affected, or are reasonably likely to materially affect, the Registrant’s internal control over financial reporting. |
| ITEM 12. | DISCLOSURE OF SECURITIES LENDING ACTIVITIES FOR CLOSED-END MANAGEMENT INVESTMENT COMPANIES. |
Not applicable.
SIGNATURES
Pursuant to the requirements of the Securities Exchange Act of 1934 and the Investment Company Act of 1940, the Registrant has duly caused this report to be signed on its behalf by the undersigned, thereunto duly authorized.
Registrant: AIM Investment Funds (Invesco Investment Funds)
| | |
By: | | /s/ Sheri Morris |
| | Sheri Morris |
| | Principal Executive Officer |
| |
Date: | | January 5, 2023 |
Pursuant to the requirements of the Securities and Exchange Act of 1934 and the Investment Company Act of 1940, this report has been signed below by the following persons on behalf of the Registrant and in the capacities and on the dates indicated.
| | |
By: | | /s/ Sheri Morris |
| | Sheri Morris |
| | Principal Executive Officer |
| |
Date: | | January 5, 2023 |
| |
By: | | /s/ Adrien Deberghes |
| | Adrien Deberghes |
| | Principal Financial Officer |
| |
Date: | | January 5, 2023 |