UNITED STATES
SECURITIES AND EXCHANGE COMMISSION
Washington, D.C. 20549
FORM N-CSR
CERTIFIED SHAREHOLDER REPORT OF REGISTERED
MANAGEMENT INVESTMENT COMPANIES
| | |
| Investment Company Act file number | | 811-05426 |
|
AIM Investment Funds (Invesco Investment Funds) |
| (Exact name of registrant as specified in charter) |
|
11 Greenway Plaza, Suite 1000 Houston, Texas 77046 |
| (Address of principal executive offices) (Zip code) |
|
Glenn Brightman 11 Greenway Plaza, Suite 1000 Houston, Texas 77046 |
| (Name and address of agent for service) |
| | | | |
| Registrant’s telephone number, including area code: | | (713) 626-1919 | | |
| | | | |
| Date of fiscal year end: | | 11/30 | | |
| | | | |
| Date of reporting period: | | 11/30/2023 | | |
ITEM 1. REPORTS TO STOCKHOLDERS.
(a) The Registrant’s annual report transmitted to shareholders pursuant to Rule 30e-1 under the Investment Company Act of 1940 is as follows:

| | | | |
| Annual Report to Shareholders | | | November 30, 2023 | |
| | | | |
| Invesco SteelPath MLP Alpha Fund | |
| |
| | | | |
| Nasdaq: | |
| A: MLPAX ∎ C: MLPGX ∎ R: SPMGX ∎ Y: MLPOX ∎ R5: SPMHX ∎ R6: OSPAX | |
Beginning in July 2024, amendments adopted by the Securities and Exchange Commission will substantially impact the design, content, and delivery of shareholder reports. These newly designed shareholder reports will highlight key fund information in a clear and concise format and must be mailed to each shareholder that has not elected to receive the reports electronically. Other information, including financial statements, will no longer be included in the shareholder report but will be available at invesco.com/reports, delivered upon request, and filed on a semi-annual basis on Form N-CSR.
If you would like to receive shareholder reports and other communications electronically instead of by mail, you may make that request by contacting your financial intermediary (such as a broker-dealer or bank) or, if you are a direct investor, by enrolling at invesco.com/edelivery. If you do not make this request or enroll in e-delivery, you will receive future shareholder reports and other communications by mail.
Management’s Discussion of Fund Performance
| | | | |
| Performance summary | | | | |
For the fiscal year ended November 30, 2023, Class A shares of Invesco SteelPath MLP Alpha Fund (the Fund), at net asset value (NAV), outperformed the S&P 500® Index. Your Fund’s long-term performance appears later in this report. | |
| |
| | | | |
| | | | |
| Fund vs. Indexes | | | | |
| Total returns, 11/30/22 to 11/30/23, at net asset value (NAV). Performance shown does not include applicable contingent deferred sales charges (CDSC) or front-end sales charges, which would have reduced performance. | |
Class A Shares | | | 18.65 | % |
Class C Shares | | | 17.84 | |
Class R Shares | | | 18.39 | |
Class Y Shares | | | 18.92 | |
Class R5 Shares | | | 18.98 | |
Class R6 Shares | | | 19.06 | |
S&P 500 Index | | | 13.84 | |
Alerian MLP Index | | | 23.29 | |
| |
Source(s): RIMES Technologies Corp. | | | | |
Fund Performance Discussion
The Fund’s Class A shares (without sales charge) produced a total return of 18.65% during the fiscal year ended November 30, 2023. In comparison, master limited partnerships (MLPs), as measured by the Alerian MLP Index (AMZ), generated a total return of 23.29%. Please note that the returns for the Alerian MLP Index are calculated pre-tax, while the Fund’s returns are calculated post corporate tax. Over the same period, the S&P 500 Index produced a total return of 13.84%.
Over the fiscal year, global equity markets were choppy as market participants weighed continued inflation concerns, rising interest rates, worry over Chinese economic conditions, and the ongoing war between Russia and Ukraine. Commodity prices were mostly lower, but energy stocks generally traded higher, midstream equities included.
Midstream sector participants benefitted from record U.S. production of crude oil and natural gas during the period, with crude oil volumes in September 2023 finally exceeding the 2019 highs. Natural gas production volumes continued to benefit from robust exports driven by higher international pricing relative to domestic prices. Despite continued volume growth, midstream equities still traded at discounted valuations relative to history.
Over the fiscal year, we estimate a de minimis amount of equity supply entered the market through secondary offerings, initial public offerings, preferred offerings, or “at-the-market” programs in which primary units trade into the market anonymously throughout the normal trading day. Most midstream MLPs pay out substantial distributions to investors and, therefore, have historically raised external capital to fund larger growth projects or acquisitions. However, in recent years most sector
participants have adjusted their business models to self-fund the equity portion of their investment plans and repurchase discounted equity. Wells Fargo estimates that during the first three quarters of 2023 midstream companies collectively repurchased over $3 billion of stock.
Macro Review
West Texas Intermediate (WTI) crude oil prices ended the period at $75.96 per barrel, down 6% over the year, while global crude prices, as measured by Brent crude oil, traded 3% lower over the fiscal year. During the period, crude prices approached $100 per barrel before drifting lower. Henry Hub natural gas prices exited November 2023 at $2.80 per million British thermal units (mmbtu), down 60% over the fiscal year driven by softening export demand as Europe normalized after the initial escalation associated with the onset of the Russia-Ukraine war in the prior period. Regional price differentials improved in most basins, including the Permian basin where new takeaway capacity was added via pipeline expansions.
Mont Belvieu natural gas liquids (NGL) prices ended the fiscal year at $28.35 per barrel, a 14% decrease over the fiscal year. Pricing for NGL purity products was mixed, with isobutane ending the period 25% higher than the start of the fiscal year while ethane, butane, propane, and natural gasoline all traded lower. Frac spreads, a measure of natural gas processing economics, ended the period at $0.43 per gallon, more than doubling over the fiscal year. Generally, the greater the frac spread, the greater the incentive for producers to seek natural gas processing capacity.
The yield curve remained inverted, and generally steepened, over the period as short rates rose more than the yields on medium-dated maturities. The 10-year
Treasury yield rose by 72 basis points to end the period at 4.33%. The MLP yield spread at fiscal year-end, as measured by the AMZ and the 10-year Treasury bond, narrowed by 15 basis points to 3.27%.
Over the fiscal year, real estate investment trusts (REITs) and utilities, two competing yield-oriented equity asset classes, posted total returns of -2.78% (as measured by the Dow Jones Equity REIT Total Return Index) and -8.16% (as measured by the Dow Jones Utility Average Index), respectively, as compared to the AMZ’s +23.29% total return.
Subsector Reviews
Performance for all subsectors in the midstream, or energy infrastructure, asset class was positive over the fiscal year. On average, sector participants in the Compression subsector provided the strongest performance over the period supported by rising natural gas production volumes and increased utilization. The Diversified subsector also outperformed, also benefitting from increasing production volumes and generally improving demand.
The Natural Gas Pipeline subsector experienced the weakest, albeit positive, performance over the fiscal year driven by idiosyncratic factors from one subsector member. Similarly, average performance for the Propane subsector was weighed down by very weak performance of a single subsector participant.
Fund Review
Key contributors to the Invesco SteelPath MLP Alpha Fund for the fiscal year ended November 30, 2023 were Magellan Midstream Partners, LP (NYSE: MMP) and Plains All American Pipeline, LP (NYSE: PAA).
MMP units outperformed over the period due the closing of the merger between MMP and ONEOK, Inc. (OKE) in September 2023. The consideration consisted of $25.00 in cash and 0.667 shares of OKE common stock for each outstanding MMP common unit, representing an implied value to each Magellan unitholder of $67.50 per unit, for a 22% premium, based on May 12, 2023 closing prices, the day before the merger announcement.
PAA outperformed over the period after reporting better than expected financial and operating results and as market participants appeared to place increased scarcity value in Plains’ crude oil-focused business. We believe that PAA maintains a leading position in crude oil gathering and transportation from the Permian Basin, a natural gas liquids focused position in Canada, strong distribution coverage, and an improved balance sheet.
Key detractors from the Invesco SteelPath MLP Alpha Fund for the fiscal year ended November 30, 2023 were Holly Energy Partners (NYSE: HEP) and DT Midstream Inc. (NYSE: DTM).
2 Invesco SteelPath MLP Alpha Fund
HEP units underperformed over the period despite HEP and its sponsor, HF Sinclair Corporation (NYSE: DINO), agreeing to a merger where HEP would receive a combination of 0.315 DINO common shares plus $4/share in cash per each publicly held HEP common unit. HEP provides petroleum product and crude oil transportation, terminalling, storage and throughput services to the petroleum industry, including its sponsor, HF Sinclair Corporation. We sold our position in HEP before the end of the fiscal year.
DTM underperformed over the reporting period after announcing higher than expected capital expenditure guidance for 2023 and as investor sentiment was likely impacted by commodity price weakness over the period, particularly for natural gas. DTM owns, operates, and develops natural gas midstream interstate pipelines. The company focuses on intrastate and gathering lateral pipelines, storage, gathering systems and compression, treatment, and surface facilities located in the Appalachian Basin and the Haynesville shale.
Outlook
Despite midstream equities outperforming the S&P 500 Index for several years, we believe the sector remains well positioned to continue providing investors with an attractive yield and total return experience over the coming years. In our view, valuations remain attractive and fundamentals support expectations for modest cash flow growth for most sector participants, particularly those with business segments focused on key producing basins and those that support activities to export crude oil, refined products, liquified petroleum gases (LPGs), and/or liquified natural gas (LNG).
All data, unless otherwise noted, sourced from Bloomberg LP as of November 30, 2023.
Portfolio managers:
Stuart Cartner
Brian Watson
The views and opinions expressed in management’s discussion of Fund performance are those of Invesco Advisers, Inc. and its affiliates. These views and opinions are subject to change at any time based on factors such as market and economic conditions. These views and opinions may not be relied upon as investment advice or recommendations, or as an offer for a particular security. The information is not a complete analysis of every aspect of any market, country, industry, security or the Fund. Statements of fact are from sources considered reliable, but Invesco Advisers, Inc. makes no representation or warranty as to their completeness or accuracy. Although historical performance is no guarantee of future results, these insights may help you understand our investment management philosophy.
See important Fund and, if applicable, index disclosures later in this report.
3 Invesco SteelPath MLP Alpha Fund
Your Fund’s Long-Term Performance
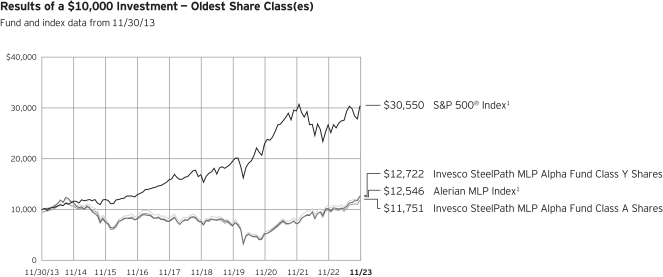
1 Source: RIMES Technologies Corp.
Past performance cannot guarantee future results.
The data shown in the chart include reinvested distributions, applicable sales charges and Fund expenses including
management fees. Index results include reinvested dividends, but they do not reflect sales charges. Performance of the peer group, if applicable, reflects fund expenses and management fees;
performance of a market index does not. Performance shown in the chart does not reflect deduction of taxes a shareholder would pay on Fund distributions or sale of Fund shares.
4 Invesco SteelPath MLP Alpha Fund
| | | | |
| Average Annual Total Returns | | | | |
| As of 11/30/23, including maximum applicable sales charges | |
| Class A Shares | | | | |
Inception (3/31/10) | | | 4.34 | % |
10 Years | | | 1.63 | |
5 Years | | | 8.28 | |
1 Year | | | 12.18 | |
| Class C Shares | | | | |
Inception (8/25/11) | | | 4.00 | % |
10 Years | | | 1.59 | |
5 Years | | | 8.69 | |
1 Year | | | 16.84 | |
| Class R Shares | | | | |
10 Years | | | 1.92 | % |
5 Years | | | 9.18 | |
1 Year | | | 18.39 | |
| Class Y Shares | | | | |
Inception (3/31/10) | | | 5.03 | % |
10 Years | | | 2.44 | |
5 Years | | | 9.77 | |
1 Year | | | 18.92 | |
| Class R5 Shares | | | | |
10 Years | | | 2.32 | % |
5 Years | | | 9.76 | |
1 Year | | | 18.98 | |
| Class R6 Shares | | | | |
Inception (6/28/13) | | | 2.71 | % |
10 Years | | | 2.52 | |
5 Years | | | 9.82 | |
1 Year | | | 19.06 | |
Effective after the close of business on May 24, 2019, Class A, Class C, Class Y and Class I shares of the Oppenheimer SteelPath MLP Alpha Fund (the predecessor fund), were reorganized into Class A, Class C, Class Y and Class R6 shares, respectively, of the Invesco Oppenheimer SteelPath MLP Alpha Fund. The Fund was subsequently renamed the Invesco SteelPath MLP Alpha Fund (the Fund). Returns shown above, for periods ending on or prior to May 24, 2019, for Class A, Class C, Class Y and Class R6 shares are those for Class A, Class C, Class Y and Class I shares of the predecessor fund. Share class returns will differ from the predecessor fund because of different expenses.
Class R and R5 shares incepted after the close of business on May 24, 2019. Performance shown on and prior to that date is that of the predecessor fund’s Class A shares at net asset value and includes the 12b-1 fees applicable to Class A shares.
The performance data quoted represent past performance and cannot guarantee future results; current performance may be lower or higher. Please visit invesco.com/performance for the most recent month-end performance. Performance figures reflect reinvested distributions, changes in net asset value
and the effect of the maximum sales charge unless otherwise stated. Performance figures do not reflect deduction of taxes a shareholder would pay on Fund distributions or sale of Fund shares. Investment return and principal value will fluctuate so that you may have a gain or loss when you sell shares.
Class A share performance reflects the maximum 5.50% sales charge, and Class C share performance reflects the applicable contingent deferred sales charge (CDSC) for the period involved. The CDSC on Class C shares is 1% for the first year after purchase. Class R, Class Y, Class R5 and Class R6 shares do not have a front-end sales charge or a CDSC; therefore, performance is at net asset value.
The performance of the Fund’s share classes will differ primarily due to different sales charge structures and class expenses.
Fund performance reflects any applicable fee waivers and/or expense reimbursements. Had the adviser not waived fees and/or reimbursed expenses currently or in the past, returns would have been lower.
See current prospectus for more information.
5 Invesco SteelPath MLP Alpha Fund
Supplemental Information
Invesco SteelPath MLP Alpha Fund’s investment objective is to seek total return.
| • | | Unless otherwise stated, information presented in this report is as of November 30, 2023, and is based on total net assets. |
| • | | Unless otherwise noted, all data is provided by Invesco. |
| • | | To access your Fund’s reports/prospectus, visit invesco.com/fundreports. |
About indexes used in this report
| • | | The S&P 500® Index is an unmanaged index considered representative of the US stock market. |
| • | | The Alerian MLP Index is designed to capture the performance of energy master limited partnerships (MLPs). |
| • | | The Fund is not managed to track the performance of any particular index, including the index(es) described here, and consequently, the performance of the Fund may deviate significantly from the performance of the index(es). |
| • | | A direct investment cannot be made in an index. Unless otherwise indicated, index results include reinvested dividends, and they do not reflect sales charges. Performance of the peer group, if applicable, reflects fund expenses; performance of a market index does not. |
This report must be accompanied or preceded by a currently effective Fund prospectus, which contains more complete information, including sales charges and expenses. Investors should read it carefully before investing.
NOT FDIC INSURED | MAY LOSE VALUE | NO BANK GUARANTEE
6 Invesco SteelPath MLP Alpha Fund
Fund Information
| | | | |
| Portfolio Composition | | | |
| |
| By Sector | | % of total net assets | |
Diversified | | | 46.98 | % |
Gathering & Processing | | | 28.03 | |
Petroleum Pipeline Transportation | | | 12.08 | |
Other Energy | | | 7.32 | |
Natural Gas Pipeline Transportation | | | 4.21 | |
Money Market Funds Plus Other Assets Less Liabilities | | | 1.38 | |
| |
| | | | |
Top 10 Master Limited Partnership and Related Entity
Holdings* | |
| |
| | | % of total net assets | |
1. Energy Transfer L.P. | | | 13.62 | % |
2. MPLX L.P. | | | 12.69 | |
3. Targa Resources Corp. | | | 12.01 | |
4. Western Midstream Partners L.P. | | | 10.92 | |
5. Enterprise Products Partners L.P. | | | 9.33 | |
6. ONEOK, Inc. | | | 6.77 | |
7. Plains All American Pipeline L.P. | | | 6.61 | |
8. Williams Cos., Inc. | | | 4.57 | |
9. EnLink Midstream LLC | | | 2.95 | |
10. Hess Midstream L.P., Class A | | | 2.15 | |
The Fund’s holdings are subject to change, and there is no assurance that the Fund will continue to hold any particular security. * Excluding money market fund holdings, if any. Data presented here are as of November 30, 2023. | |
7 Invesco SteelPath MLP Alpha Fund
Schedule of Investments
November 30, 2023
| | | | | | | | |
| | | Units | | | Value | |
Master Limited Partnerships And Related
Entities–98.62% | |
| Diversified–46.98% | |
Energy Transfer L.P. | | | 8,528,504 | | | $ | 118,460,926 | |
Enterprise Products Partners L.P. | | | 3,029,145 | | | | 81,120,503 | |
MPLX L.P. | | | 3,028,251 | | | | 110,410,031 | |
ONEOK, Inc. | | | 855,610 | | | | 58,908,749 | |
Williams Cos., Inc. | | | 1,080,798 | | | | 39,762,558 | |
| | | | | | | | 408,662,767 | |
| Gathering & Processing–28.03% | |
EnLink Midstream LLC | | | 1,874,145 | | | | 25,619,562 | |
Hess Midstream L.P., Class A | | | 573,651 | | | | 18,666,604 | |
Targa Resources Corp. | | | 1,155,414 | | | | 104,507,196 | |
Western Midstream Partners L.P. | | | 3,186,779 | | | | 95,029,747 | |
| | | | | | | | 243,823,109 | |
| Natural Gas Pipeline Transportation–4.21% | |
DT Midstream, Inc. | | | 153,311 | | | | 8,783,187 | |
Enbridge, Inc.(b) | | | 382,134 | | | | 13,325,013 | |
Equitrans Midstream Corp. | | | 1,544,640 | | | | 14,488,723 | |
| | | | | | | | 36,596,923 | |
| Other Energy–7.32% | |
Cheniere Energy, Inc. | | | 175,054 | | | | 31,886,086 | |
Cheniere Energy Partners LP | | | 192,568 | | | | 11,889,148 | |
Global Partners L.P. | | | 123,509 | | | | 4,499,433 | |
Sunoco L.P. | | | 104,185 | | | | 5,694,752 | |
| | | | | | | | |
| | | Units | | | Value | |
| Other Energy–(continued) | |
Westlake Chemical Partners L.P. | | | 427,065 | | | $ | 9,673,022 | |
| | | | | | | | 63,642,441 | |
| Petroleum Pipeline Transportation–12.08% | |
Genesis Energy L.P. | | | 1,220,963 | | | | 15,335,295 | |
NuStar Energy L.P. | | | 841,766 | | | | 16,027,225 | |
Plains All American Pipeline L.P. | | | 3,622,140 | | | | 57,519,583 | |
Plains GP Holdings L.P., Class A | | | 1,004,599 | | | | 16,234,320 | |
| | | | | | | | 105,116,423 | |
Total Master Limited Partnerships And Related Entities
(Cost $514,619,495) | | | | 857,841,663 | |
| | |
| | | Shares | | | | |
Money Market Funds–2.88% | |
Fidelity Treasury Portfolio, Institutional Class, 5.17%
(Cost $25,044,105)(a) | | | 25,044,105 | | | | 25,044,105 | |
TOTAL INVESTMENTS IN SECURITIES–101.50%
(Cost $539,663,600) | | | | 882,885,768 | |
OTHER ASSETS LESS LIABILITIES–(1.50)% | | | | (12,996,224 | ) |
NET ASSETS–100% | | | | | | $ | 869,889,544 | |
Notes to Schedule of Investments:
| (a) | The rate shown is the 7-day SEC standardized yield as of November 30, 2023. |
| (b) | Foreign security denominated in U.S. dollars. |
See accompanying Notes to Financial Statements which are an integral part of the financial statements.
8 Invesco SteelPath MLP Alpha Fund
Statement of Assets and Liabilities
November 30, 2023
| | | | |
Assets: | | | | |
Investments in unaffiliated securities, at value (Cost $539,663,600) | | $ | 882,885,768 | |
Receivable for: | | | | |
Fund shares sold | | | 795,936 | |
Dividends | | | 316,446 | |
Investment for trustee deferred compensation and retirement plans | | | 81,511 | |
Prepaid state income tax | | | 280,699 | |
Cash | | | 158,024 | |
Other assets | | | 85,474 | |
Total assets | | | 884,603,858 | |
| |
| | | | |
Liabilities: | | | | |
Payable for: | | | | |
Fund shares reacquired | | | 620,518 | |
Accrued fees to affiliates | | | 1,058,123 | |
Accrued interest expense | | | 10,431 | |
Accrued trustees’ and officers’ fees and benefits | | | 4,727 | |
Accrued other operating expenses | | | 276,087 | |
Current tax expense | | | 4,406,719 | |
Deferred tax liability, net | | | 8,256,198 | |
Trustee deferred compensation and retirement plans | | | 81,511 | |
Total liabilities | | | 14,714,314 | |
Net assets applicable to shares outstanding | | $ | 869,889,544 | |
| |
| | | | |
Net assets consist of: | | | | |
Shares of beneficial interest | | $ | 1,660,651,263 | |
Distributable earnings (loss), net of taxes | | | (790,761,719 | ) |
| | | $ | 869,889,544 | |
| | | | |
Net Assets: | | | | |
Class A | | $ | 401,810,884 | |
Class C | | $ | 96,411,363 | |
Class R | | $ | 1,534,066 | |
Class Y | | $ | 352,339,294 | |
Class R5 | | $ | 69,421 | |
Class R6 | | $ | 17,724,516 | |
| |
| | | | |
Shares outstanding, no par value, with an unlimited number of shares authorized: | |
Class A | | | 61,295,418 | |
Class C | | | 17,130,179 | |
Class R | | | 238,019 | |
Class Y | | | 50,488,123 | |
Class R5 | | | 10,449 | |
Class R6 | | | 2,509,936 | |
Class A: | | | | |
Net asset value per share | | $ | 6.56 | |
Maximum offering price per share
(net asset value $6.56 ÷ 94.50%) | | $ | 6.94 | |
Class C: | | | | |
Net asset value and offering price per share | | $ | 5.63 | |
Class R: | | | | |
Net asset value and offering price per share | | $ | 6.45 | |
Class Y: | | | | |
Net asset value and offering price per share | | $ | 6.98 | |
Class R5: | | | | |
Net asset value and offering price per share | | $ | 6.64 | |
Class R6: | | | | |
Net asset value and offering price per share | | $ | 7.06 | |
See accompanying Notes to Financial Statements which are an integral part of the financial statements.
9 Invesco SteelPath MLP Alpha Fund
Statement of Operations
For the year ended November 30, 2023
| | | | |
Investment income: | | | | |
Distributions and dividends (net of return of capital distributions of $49,037,358) | | $ | 8,618,057 | |
Less: return of capital on distributions and dividends in excess of cost basis | | | (589,364 | ) |
Total investment income | | | 8,028,693 | |
| |
| | | | |
Expenses: | | | | |
Advisory fees | | | 8,929,545 | |
Administrative services fees | | | 294,549 | |
Custodian fees | | | 40,903 | |
Distribution fees: | | | | |
Class A | | | 924,090 | |
Class C | | | 1,003,994 | |
Class R | | | 5,217 | |
Transfer agent fees — A, C, R and Y | | | 988,501 | |
Transfer agent fees — R5 | | | 5 | |
Transfer agent fees — R6 | | | 4,992 | |
Interest, facilities and maintenance fees | | | 175,637 | |
State income tax expense | | | 107,068 | |
Trustees’ and officers’ fees and benefits | | | 23,212 | |
Registration and filing fees | | | 104,581 | |
Reports to shareholders | | | 88,870 | |
Professional services fees | | | 147,415 | |
Other | | | 18,276 | |
Total expenses, before waivers and deferred taxes | | | 12,856,855 | |
Less: Expenses reimbursed | | | (501,009 | ) |
Net expenses, before deferred taxes | | | 12,355,846 | |
Net investment income (loss), before deferred taxes | | | (4,327,153 | ) |
Net deferred tax benefit | | | 13,919,148 | |
Current tax (expense)/benefit | | | (11,467,543 | ) |
Net investment income (loss), net of deferred taxes | | | (1,875,548 | ) |
| |
| | | | |
| |
Realized and unrealized gain (loss) from: | | | | |
Net realized gain (loss) from: | | | | |
Unaffiliated investment securities (includes net gain from securities sold to affiliates of $6,970,249) | | | 144,435,389 | |
Net deferred tax (expense) benefit | | | (10,281,270 | ) |
Net realized gain, net of deferred taxes | | | 134,154,119 | |
Change in net unrealized appreciation (depreciation) of: | | | | |
Unaffiliated investment securities | | | 18,859,066 | |
Net deferred tax (expense) benefit | | | (4,526,693 | ) |
Net change in net unrealized appreciation of investment securities, net of deferred taxes | | | 14,332,373 | |
Net realized and unrealized gain, net of deferred taxes | | | 148,486,492 | |
Net increase in net assets resulting from operations | | $ | 146,610,944 | |
See accompanying Notes to Financial Statements which are an integral part of the financial statements.
10 Invesco SteelPath MLP Alpha Fund
Statement of Changes in Net Assets
For the years ended November 30, 2023 and 2022
| | | | | | | | |
| | | 2023 | | | 2022 | |
Operations: | | | | | | | | |
Net investment income (loss), net of deferred taxes | | $ | (1,875,548 | ) | | $ | (2,497,970 | ) |
Net realized gain, net of deferred taxes | | | 134,154,119 | | | | 120,324,676 | |
Change in net unrealized appreciation, net of deferred taxes | | | 14,332,373 | | | | 118,019,558 | |
Net increase in net assets resulting from operations | | | 146,610,944 | | | | 235,846,264 | |
| | |
| | | | | | | | |
Distributions to shareholders from distributable earnings: | | | | | | | | |
Class A | | | (23,476,914 | ) | | | (22,522,216 | ) |
Class C | | | (7,237,564 | ) | | | (9,396,553 | ) |
Class R | | | (68,912 | ) | | | (35,595 | ) |
Class Y | | | (19,352,650 | ) | | | (19,510,530 | ) |
Class R5 | | | (1,137 | ) | | | (538 | ) |
Class R6 | | | (984,124 | ) | | | (1,002,385 | ) |
Total distributions from distributable earnings | | | (51,121,301 | ) | | | (52,467,817 | ) |
| | |
| | | | | | | | |
Share transactions–net: | | | | | | | | |
Class A | | | (8,534,434 | ) | | | 13,095,644 | |
Class C | | | (25,710,731 | ) | | | (37,009,644 | ) |
Class R | | | 662,738 | | | | 225,855 | |
Class Y | | | (10,554,146 | ) | | | (14,886,204 | ) |
Class R5 | | | 56,685 | | | | — | |
Class R6 | | | (1,101,370 | ) | | | (1,773,421 | ) |
Net increase (decrease) in net assets resulting from share transactions | | | (45,181,258 | ) | | | (40,347,770 | ) |
Net increase in net assets | | | 50,308,385 | | | | 143,030,677 | |
| | |
| | | | | | | | |
Net assets: | | | | | | | | |
Beginning of year | | | 819,581,159 | | | | 676,550,482 | |
End of year | | $ | 869,889,544 | | | $ | 819,581,159 | |
See accompanying Notes to Financial Statements which are an integral part of the financial statements.
11 Invesco SteelPath MLP Alpha Fund
Financial Highlights
| | | | | | | | | | | | | | | | | | | | |
| | | Years Ended November 30, | |
| Class A | | 2023 | | | 2022 | | | 2021 | | | 2020 | | | 2019 | |
Per share operating data | | | | | | | | | | | | | | | | | | | | |
Net asset value, beginning of period | | $ | 5.84 | | | $ | 4.56 | | | $ | 3.58 | | | $ | 5.28 | | | $ | 6.56 | |
Net investment income (loss)(a) | | | (0.01 | ) | | | (0.02 | ) | | | (0.11 | ) | | | (0.06 | ) | | | (0.03 | ) |
Return of capital(a) | | | 0.28 | | | | 0.25 | | | | 0.24 | | | | 0.29 | | | | 0.34 | |
Net realized and unrealized gain (loss) | | | 0.83 | | | | 1.42 | | | | 1.22 | | | | (1.42 | ) | | | (0.93 | ) |
Total from investment operations | | | 1.10 | | | | 1.65 | | | | 1.35 | | | | (1.19 | ) | | | (0.62 | ) |
Less: | | | | | | | | | | | | | | | | | | | | |
Return of capital | | | — | | | | — | | | | (0.37 | ) | | | (0.51 | ) | | | (0.62 | ) |
Dividends from net investment income | | | (0.38 | ) | | | (0.37 | ) | | | — | | | | — | | | | (0.04 | ) |
Total distributions | | | (0.38 | ) | | | (0.37 | ) | | | (0.37 | ) | | | (0.51 | ) | | | (0.66 | ) |
Net asset value, end of period | | $ | 6.56 | | | $ | 5.84 | | | $ | 4.56 | | | $ | 3.58 | | | $ | 5.28 | |
Total return(b) | | | 19.67 | % | | | 37.02 | % | | | 38.26 | % | | | (22.24 | )% | | | (10.69 | )% |
Net assets, end of period (000’s omitted) | | $ | 401,811 | | | $ | 366,201 | | | $ | 274,904 | | | $ | 203,978 | | | $ | 321,237 | |
Portfolio turnover rate | | | 32 | % | | | 25 | % | | | 31 | % | | | 88 | % | | | 32 | % |
| | | |
Ratios/supplemental data based on average net assets: | | | | | | | | | | | | | |
Ratio of expenses: | | | | | | | | | | | | | | | | |
Without fee waivers and/or expense reimbursements, before taxes | | | 1.60 | % | | | 1.62 | % | | | 1.65 | % | | | 1.87 | % | | | 1.67 | % |
Expense (waivers) | | | (0.06 | )% | | | (0.08 | )% | | | (0.10 | )% | | | (0.13 | )% | | | (0.08 | )% |
With fee waivers and/or expense reimbursements, before taxes(c) | | | 1.54 | % | | | 1.54 | % | | | 1.55 | % | | | 1.74 | % | | | 1.59 | % |
Deferred/current tax expense (benefit)(d) | | | 1.52 | % | | | 0.85 | % | | | 1.28 | % | | | 0.77 | % | | | — | % |
With fee waivers and/or expense reimbursements, after taxes | | | 3.06 | % | | | 2.39 | % | | | 2.83 | % | | | 2.51 | % | | | 1.59 | % |
| |
Ratio of investment income (loss): | | | | | |
Ratio of net investment income (loss), before taxes | | | (0.61 | )% | | | (0.88 | )% | | | (0.92 | )% | | | (1.57 | )% | | | (0.56 | )% |
Net of expense (waivers) and before deferred tax benefit (expense) | | | (0.55 | )% | | | (0.80 | )% | | | (0.82 | )% | | | (1.44 | )% | | | (0.48 | )% |
Deferred tax benefit (expense)(e) | | | 0.30 | % | | | 0.49 | % | | | (1.55 | )% | | | — | % | | | — | % |
Ratio of net investment income (loss), after taxes | | | (0.25 | )% | | | (0.31 | )% | | | (2.37 | )% | | | (1.44 | )% | | | (0.48 | )% |
| (a) | Per share net investment income (loss) is calculated based on average shares outstanding during the period net of deferred tax expense (benefit). Per share return of capital is calculated based on average shares during the period net of deferred tax expense (benefit) estimated at the combined Federal and State statutory income tax rate. |
| (b) | Includes adjustments in accordance with accounting principles generally accepted in the United States of America and as such, the net asset value for financial reporting purposes and returns based upon those net asset values may differ from the net asset value and returns for shareholder transactions. Does not include sales charges and is not annualized for periods less than one year, if applicable. |
| (c) | Includes borrowing, federal income tax, state income tax and franchise tax expense. Without borrowing, state income tax and franchise tax expense, the net expense ratio would be 1.50%, 1.50%, 1.50%, 1.52% and 1.55%, for the years ended November 30, 2023, 2022, 2021, 2020 and 2019, respectively. |
| (d) | Deferred tax expense (benefit) estimate for the ratio calculation is derived from the net investment income (loss), and realized and unrealized gains (losses). |
| (e) | Deferred tax benefit (expense) for the ratio calculation, when applicable, is derived from net investment income (loss) only. |
See accompanying Notes to Financial Statements which are an integral part of the financial statements.
12 Invesco SteelPath MLP Alpha Fund
Financial Highlights—(continued)
| | | | | | | | | | | | | | | | | | | | |
| | | Years Ended November 30, | |
| Class C | | 2023 | | | 2022 | | | 2021 | | | 2020 | | | 2019 | |
Per share operating data | | | | | | | | | | | | | | | | | | | | |
Net asset value, beginning of period | | $ | 5.11 | | | $ | 4.05 | | | $ | 3.23 | | | $ | 4.87 | | | $ | 6.14 | |
Net investment income (loss)(a) | | | (0.05 | ) | | | (0.05 | ) | | | (0.12 | ) | | | (0.08 | ) | | | (0.07 | ) |
Return of capital(a) | | | 0.24 | | | | 0.22 | | | | 0.21 | | | | 0.27 | | | | 0.31 | |
Net realized and unrealized gain (loss) | | | 0.71 | | | | 1.26 | | | | 1.10 | | | | (1.32 | ) | | | (0.85 | ) |
Total from investment operations | | | 0.90 | | | | 1.43 | | | | 1.19 | | | | (1.13 | ) | | | (0.61 | ) |
Less: | | | | | | | | | | | | | | | | | | | | |
Return of capital | | | — | | | | — | | | | (0.37 | ) | | | (0.51 | ) | | | (0.62 | ) |
Dividends from net investment income | | | (0.38 | ) | | | (0.37 | ) | | | — | | | | — | | | | (0.04 | ) |
Total distributions | | | (0.38 | ) | | | (0.37 | ) | | | (0.37 | ) | | | (0.51 | ) | | | (0.66 | ) |
Net asset value, end of period | | $ | 5.63 | | | $ | 5.11 | | | $ | 4.05 | | | $ | 3.23 | | | $ | 4.87 | |
Total return(b) | | | 18.53 | % | | | 36.24 | % | | | 37.41 | % | | | (22.94 | )% | | | (11.29 | )% |
Net assets, end of period (000’s omitted) | | $ | 96,411 | | | $ | 113,059 | | | $ | 122,076 | | | $ | 143,085 | | | $ | 266,485 | |
Portfolio turnover rate | | | 32 | % | | | 25 | % | | | 31 | % | | | 88 | % | | | 32 | % |
| | | |
Ratios/supplemental data based on average net assets: | | | | | | | | | | | | | |
Ratio of expenses: | | | | | | | | | | | | | | | | |
Without fee waivers and/or expense reimbursements, before taxes | | | 2.35 | % | | | 2.37 | % | | | 2.40 | % | | | 2.62 | % | | | 2.44 | % |
Expense (waivers) | | | (0.06 | )% | | | (0.08 | )% | | | (0.10 | )% | | | (0.13 | )% | | | (0.08 | )% |
With fee waivers and/or expense reimbursements, before taxes(c) | | | 2.29 | % | | | 2.29 | % | | | 2.30 | % | | | 2.49 | % | | | 2.36 | % |
Deferred/current tax expense (benefit)(d) | | | 1.52 | % | | | 0.85 | % | | | 1.28 | % | | | 0.77 | % | | | — | % |
With fee waivers and/or expense reimbursements, after taxes | | | 3.81 | % | | | 3.14 | % | | | 3.58 | % | | | 3.26 | % | | | 2.36 | % |
| |
Ratio of investment income (loss): | | | | | |
Ratio of net investment income (loss), before taxes | | | (1.36 | )% | | | (1.63 | )% | | | (1.67 | )% | | | (2.32 | )% | | | 1.33 | % |
Net of expense (waivers) and before deferred tax benefit (expense) | | | (1.30 | )% | | | (1.55 | )% | | | (1.57 | )% | | | (2.19 | )% | | | (1.25 | )% |
Deferred tax benefit (expense)(e) | | | 0.30 | % | | | 0.49 | % | | | (1.55 | )% | | | — | % | | | — | % |
Ratio of net investment income (loss), after taxes | | | (1.00 | )% | | | (1.06 | )% | | | (3.12 | )% | | | (2.19 | )% | | | (1.25 | )% |
| (a) | Per share net investment income (loss) is calculated based on average shares outstanding during the period net of deferred tax expense (benefit). Per share return of capital is calculated based on average shares during the period net of deferred tax expense (benefit) estimated at the combined Federal and State statutory income tax rate. |
| (b) | Includes adjustments in accordance with accounting principles generally accepted in the United States of America and as such, the net asset value for financial reporting purposes and returns based upon those net asset values may differ from the net asset value and returns for shareholder transactions. Does not include sales charges and is not annualized for periods less than one year, if applicable. |
| (c) | Includes borrowing, federal income tax, state income tax and franchise tax expense. Without borrowing, federal income tax, state income tax and franchise tax expense, the net expense ratio would be 2.25%, 2.25%, 2.25%, 2.28%, and 2.32%, for the years ended November 30, 2023, 2022, 2021, 2020 and 2019, respectively. |
| (d) | Deferred tax expense (benefit) estimate for the ratio calculation is derived from the net investment income (loss), and realized and unrealized gains (losses). |
| (e) | Deferred tax benefit (expense) for the ratio calculation, when applicable, is derived from net investment income (loss) only. |
See accompanying Notes to Financial Statements which are an integral part of the financial statements.
13 Invesco SteelPath MLP Alpha Fund
Financial Highlights—(continued)
| | | | | | | | | | | | | | | | | | | | |
| | | Years Ended November 30, | | | Period ended
November 30,
2019(a) | |
| Class R | | 2023 | | | 2022 | | | 2021 | | | 2020 | |
Per share operating data | | | | | | | | | | | | | | | | | | | | |
Net asset value, beginning of period | | $ | 5.77 | | | $ | 4.51 | | | $ | 3.55 | | | $ | 5.27 | | | $ | 6.80 | |
Net investment income (loss)(b) | | | (0.03 | ) | | | (0.03 | ) | | | (0.12 | ) | | | (0.06 | ) | | | (0.02 | ) |
Return of capital(b) | | | 0.28 | | | | 0.25 | | | | 0.24 | | | | 0.28 | | | | 0.16 | |
Net realized and unrealized gain (loss) | | | 0.81 | | | | 1.41 | | | | 1.21 | | | | (1.43 | ) | | | (1.29 | ) |
Total from investment operations | | | 1.06 | | | | 1.63 | | | | 1.33 | | | | (1.21 | ) | | | (1.15 | ) |
Less: | | | | | | | | | | | | | | | | | | | | |
Return of capital | | | — | | | | — | | | | (0.37 | ) | | | (0.51 | ) | | | (0.36 | ) |
Dividends from net investment income | | | (0.38 | ) | | | (0.37 | ) | | | — | | | | — | | | | (0.02 | ) |
Total distributions | | | (0.38 | ) | | | (0.37 | ) | | | (0.37 | ) | | | (0.51 | ) | | | (0.38 | ) |
Net asset value, end of period | | $ | 6.45 | | | $ | 5.77 | | | $ | 4.51 | | | $ | 3.55 | | | $ | 5.27 | |
Total return(c) | | | 19.21 | % | | | 36.99 | % | | | 38 | % | | | (22.69 | )% | | | (17.44 | )% |
Net assets, end of period (000’s omitted) | | $ | 1,534 | | | $ | 724 | | | $ | 374 | | | $ | 200 | | | $ | 87 | |
Portfolio turnover rate | | | 32 | % | | | 25 | % | | | 31 | % | | | 88 | % | | | 32 | % |
| | | | | |
Ratios/supplemental data based on average net assets: | | | | | | | | | | | | | | | | | | | | |
Ratio of expenses: | | | | | | | | | | | | | | | | | | | | |
Without fee waivers and/or expense reimbursements, before taxes | | | 1.85 | % | | | 1.87 | % | | | 1.90 | % | | | 2.12 | % | | | 1.93 | %(d) |
Expense (waivers) | | | (0.06 | )% | | | (0.08 | )% | | | (0.10 | )% | | | (0.13 | )% | | | (0.09 | )%(d) |
With fee waivers and/or expense reimbursements, before taxes(e) | | | 1.79 | % | | | 1.79 | % | | | 1.80 | % | | | 1.99 | % | | | 1.84 | %(d) |
Deferred/current tax expense (benefit)(f) | | | 1.52 | % | | | 0.85 | % | | | 1.28 | % | | | 0.77 | % | | | — | %(d) |
With fee waivers and/or expense reimbursements, after taxes | | | 3.31 | % | | | 2.64 | % | | | 3.08 | % | | | 2.76 | % | | | 1.84 | %(d) |
|
Ratio of investment income (loss): | |
Ratio of net investment income (loss), before taxes | | | (0.86 | )% | | | (1.13 | )% | | | (1.17 | )% | | | (1.82 | )% | | | (0.82 | )%(d) |
Net of expense (waivers) and before deferred tax benefit (expense) | | | (0.80 | )% | | | (1.05 | )% | | | (1.07 | )% | | | (1.69 | )% | | | (0.73 | )%(d) |
Deferred tax benefit (expense)(g) | | | 0.30 | % | | | 0.49 | % | | | (1.55 | )% | | | — | % | | | — | %(d) |
Ratio of net investment income (loss), after taxes | | | (0.50 | )% | | | (0.56 | )% | | | (2.62 | )% | | | (1.69 | )% | | | (0.73 | )%(d) |
| (a) | Commencement date after the close of business on May 24, 2019. |
| (b) | Per share net investment income (loss) is calculated based on average shares outstanding during the period net of deferred tax expense (benefit). Per share return of capital is calculated based on average shares during the period net of deferred tax expense (benefit) estimated at the combined Federal and State statutory income tax rate. |
| (c) | Includes adjustments in accordance with accounting principles generally accepted in the United States of America and as such, the net asset value for financial reporting purposes and returns based upon those net asset values may differ from the net asset value and returns for shareholder transactions. Does not include sales charges and is not annualized for periods less than one year, if applicable. |
| (e) | Includes borrowing, federal income tax, state income tax and franchise tax expense. Without borrowing, federal income tax, state income tax and franchise tax expense, the net expense ratio would be 1.75%, 1.75%, 1.75%, 1.76% and 1.80%, for the years ended November 30, 2023, 2022, 2021 and 2020 and the period ended November 30, 2019, respectively. |
| (f) | Deferred tax expense (benefit) estimate for the ratio calculation is derived from the net investment income (loss), and realized and unrealized gains (losses). |
| (g) | Deferred tax benefit (expense) for the ratio calculation, when applicable, is derived from net investment income (loss) only. |
See accompanying Notes to Financial Statements which are an integral part of the financial statements.
14 Invesco SteelPath MLP Alpha Fund
Financial Highlights—(continued)
| | | | | | | | | | | | | | | | | | | | |
| | | Years Ended November 30, | |
| Class Y | | 2023 | | | 2022 | | | 2021 | | | 2020 | | | 2019 | |
Per share operating data | | | | | | | | | | | | | | | | | | | | |
Net asset value, beginning of period | | $ | 6.18 | | | $ | 4.79 | | | $ | 3.74 | | | $ | 5.48 | | | $ | 6.76 | |
Net investment income (loss)(a) | | | 0.00 | | | | 0.00 | | | | (0.10 | ) | | | (0.05 | ) | | | (0.01 | ) |
Return of capital(a) | | | 0.30 | | | | 0.26 | | | | 0.25 | | | | 0.31 | | | | 0.35 | |
Net realized and unrealized gain (loss) | | | 0.88 | | | | 1.50 | | | | 1.27 | | | | (1.49 | ) | | | (0.96 | ) |
Total from investment operations | | | 1.18 | | | | 1.76 | | | | 1.42 | | | | (1.23 | ) | | | (0.62 | ) |
Less: | | | | | | | | | | | | | | | | | | | | |
Return of capital | | | — | | | | — | | | | (0.37 | ) | | | (0.51 | ) | | | (0.62 | ) |
Dividends from net investment income | | | (0.38 | ) | | | (0.37 | ) | | | — | | | | — | | | | (0.04 | ) |
Total distributions | | | (0.38 | ) | | | (0.37 | ) | | | (0.37 | ) | | | (0.51 | ) | | | (0.66 | ) |
Net asset value, end of period | | $ | 6.98 | | | $ | 6.18 | | | $ | 4.79 | | | $ | 3.74 | | | $ | 5.48 | |
Total return(b) | | | 19.88 | % | | | 37.55 | % | | | 38.50 | % | | | (22.15 | )% | | | (10.36 | )% |
Net assets, end of period (000’s omitted) | | $ | 352,339 | | | $ | 322,851 | | | $ | 264,856 | | | $ | 239,896 | | | $ | 555,814 | |
Portfolio turnover rate | | | 32 | % | | | 25 | % | | | 31 | % | | | 88 | % | | | 32 | % |
| | | |
Ratios/supplemental data based on average net assets: | | | | | | | | | | | | | |
Ratio of expenses: | | | | | | | | | | | | | | | | |
Without fee waivers and/or expense reimbursements, before taxes | | | 1.35 | % | | | 1.37 | % | | | 1.40 | % | | | 1.62 | % | | | 1.42 | % |
Expense (waivers) | | | (0.06 | )% | | | (0.08 | )% | | | (0.10 | )% | | | (0.13 | )% | | | (0.09 | )% |
With fee waivers and/or expense reimbursements, before taxes(c) | | | 1.29 | % | | | 1.29 | % | | | 1.30 | % | | | 1.49 | % | | | 1.33 | % |
Deferred/current tax expense (benefit)(d) | | | 1.52 | % | | | 0.85 | % | | | 1.28 | % | | | 0.77 | % | | | — | % |
With fee waivers and/or expense reimbursements, after taxes | | | 2.81 | % | | | 2.14 | % | | | 2.58 | % | | | 2.26 | % | | | 1.33 | % |
| |
Ratio of investment income (loss): | | | | | |
Ratio of net investment income (loss), before taxes | | | (0.36 | )% | | | (0.63 | )% | | | (0.67 | )% | | | (1.32 | )% | | | (0.31 | )% |
Net of expense (waivers) and before deferred tax benefit (expense) | | | (0.30 | )% | | | (0.55 | )% | | | (0.57 | )% | | | (1.19 | )% | | | (0.22 | )% |
Deferred tax benefit (expense)(e) | | | 0.30 | % | | | 0.49 | % | | | (1.55 | )% | | | — | % | | | — | % |
Ratio of net investment income (loss), after taxes | | | 0.00 | % | | | (0.06 | )% | | | (2.12 | )% | | | (1.19 | )% | | | (0.22 | )% |
| (a) | Per share net investment income (loss) is calculated based on average shares outstanding during the period net of deferred tax expense (benefit). Per share return of capital is calculated based on average shares during the period net of deferred tax expense (benefit) estimated at the combined Federal and State statutory income tax rate. |
| (b) | Includes adjustments in accordance with accounting principles generally accepted in the United States of America and as such, the net asset value for financial reporting purposes and returns based upon those net asset values may differ from the net asset value and returns for shareholder transactions. Does not include sales charges and is not annualized for periods less than one year, if applicable. |
| (c) | Includes borrowing, federal income tax, state income tax and franchise tax expense. Without borrowing and franchise tax expense, the net expense ratio would be 1.25%, 1.25%, 1.25%, 1.27% and 1.29%, for the years ended November 30, 2023, 2022, 2021, 2020 and 2019, respectively. |
| (d) | Deferred tax expense (benefit) estimate for the ratio calculation is derived from the net investment income (loss), and realized and unrealized gains (losses). |
| (e) | Deferred tax benefit (expense) for the ratio calculation, when applicable, is derived from net investment income (loss) only. |
See accompanying Notes to Financial Statements which are an integral part of the financial statements.
15 Invesco SteelPath MLP Alpha Fund
Financial Highlights—(continued)
| | | | | | | | | | | | | | | | | | | | |
| | | Years Ended November 30, | | | Period ended
November 30,
2019(a) | |
| Class R5 | | 2023 | | | 2022 | | | 2021 | | | 2020 | |
Per share operating data | | | | | | | | | | | | | | | | | | | | |
Net asset value, beginning of period | | $ | 5.90 | | | $ | 4.59 | | | $ | 3.59 | | | $ | 5.29 | | | $ | 6.80 | |
Net investment income (loss)(b) | | | 0.00 | | | | 0.00 | | | | (0.10 | ) | | | (0.05 | ) | | | (0.01 | ) |
Return of capital(b) | | | 0.29 | | | | 0.25 | | | | 0.24 | | | | 0.29 | | | | 0.17 | |
Net realized and unrealized gain (loss) | | | 0.83 | | | | 1.43 | | | | 1.23 | | | | (1.43 | ) | | | (1.29 | ) |
Total from investment operations | | | 1.12 | | | | 1.68 | | | | 1.37 | | | | (1.19 | ) | | | (1.13 | ) |
Less: | | | | | | | | | | | | | | | | | | | | |
Return of capital | | | — | | | | — | | | | (0.37 | ) | | | (0.51 | ) | | | (0.36 | ) |
Dividends from net investment income | | | (0.38 | ) | | | (0.37 | ) | | | — | | | | — | | | | (0.02 | ) |
Total distributions | | | (0.38 | ) | | | (0.37 | ) | | | (0.37 | ) | | | (0.51 | ) | | | (0.38 | ) |
Net asset value, end of period | | $ | 6.64 | | | $ | 5.90 | | | $ | 4.59 | | | $ | 3.59 | | | $ | 5.29 | |
Total return(c) | | | 19.81 | % | | | 37.45 | % | | | 38.72 | % | | | (22.20 | )% | | | (17.13 | )% |
Net assets, end of period (000’s omitted) | | $ | 69 | | | $ | 9 | | | $ | 7 | | | $ | 5 | | | $ | 8 | |
Portfolio turnover rate | | | 32 | % | | | 25 | % | | | 31 | % | | | 88 | % | | | 32 | % |
| | | | | |
Ratios/supplemental data based on average net assets: | | | | | | | | | | | | | | | | | | | | |
Ratio of expenses: | | | | | | | | | | | | | | | | | | | | |
Without fee waivers and/or expense reimbursements, before taxes | | | 1.25 | % | | | 1.26 | % | | | 1.29 | % | | | 1.49 | % | | | 1.30 | %(d) |
Expense (waivers) | | | (0.01 | )% | | | — | %(e) | | | — | %(e) | | | (0.01 | )% | | | — | %(d) |
With fee waivers and/or expense reimbursements, before taxes(f) | | | 1.24 | % | | | 1.26 | % | | | 1.29 | % | | | 1.48 | % | | | 1.30 | %(d) |
Deferred/current tax expense (benefit)(g) | | | 1.52 | % | | | 0.85 | % | | | 1.28 | % | | | 0.77 | % | | | — | %(d) |
With fee waivers and/or expense reimbursements, after taxes | | | 2.76 | % | | | 2.11 | % | | | 2.57 | % | | | 2.25 | % | | | 1.30 | %(d) |
|
Ratio of investment income (loss): | |
Ratio of net investment income (loss), before taxes | | | (0.26 | )% | | | (0.52 | )% | | | (0.56 | )% | | | (1.19 | )% | | | (0.19 | )%(d) |
Net of expense (waivers) and before deferred tax benefit (expense) | | | (0.25 | )% | | | (0.52 | )% | | | (0.56 | )% | | | (1.18 | )% | | | (0.19 | )%(d) |
Deferred tax benefit (expense)(h) | | | 0.30 | % | | | 0.49 | % | | | (1.55 | )% | | | — | % | | | — | %(d) |
Ratio of net investment income (loss), after taxes | | | 0.05 | % | | | (0.03 | )% | | | (2.11 | )% | | | (1.18 | )% | | | (0.19 | )%(d) |
| (a) | Commencement date after the close of business on May 24, 2019. |
| (b) | Per share net investment income (loss) is calculated based on average shares outstanding during the period net of deferred tax expense (benefit). Per share return of capital is calculated based on average shares during the period net of deferred tax expense (benefit) estimated at the combined Federal and State statutory income tax rate. |
| (c) | Includes adjustments in accordance with accounting principles generally accepted in the United States of America and as such, the net asset value for financial reporting purposes and returns based upon those net asset values may differ from the net asset value and returns for shareholder transactions. Does not include sales charges and is not annualized for periods less than one year, if applicable. |
| (e) | Rounds to less than (0.01)%. |
| (f) | Includes borrowing, state income tax and franchise tax expense. Without borrowing, state income tax and franchise tax expense, the net expense ratio would be 1.21%, 1.22%, 1.24%, 1.26% and 1.26%, for the years ended November 30, 2023, 2022, 2021 and 2020 and the period ended November 30, 2019, respectively. |
| (g) | Deferred tax expense (benefit) estimate for the ratio calculation is derived from the net investment income (loss), and realized and unrealized gains (losses). |
| (h) | Deferred tax benefit (expense) for the ratio calculation, when applicable, is derived from net investment income (loss) only. |
See accompanying Notes to Financial Statements which are an integral part of the financial statements.
16 Invesco SteelPath MLP Alpha Fund
Financial Highlights—(continued)
| | | | | | | | | | | | | | | | | | | | |
| | | Years Ended November 30, | |
| Class R6 | | 2023 | | | 2022 | | | 2021 | | | 2020 | | | 2019 | |
Per share operating data | | | | | | | | | | | | | | | | | | | | |
Net asset value, beginning of period | | $ | 6.25 | | | $ | 4.84 | | | $ | 3.77 | | | $ | 5.51 | | | $ | 6.80 | |
Net investment income (loss)(a) | | | 0.00 | | | | 0.00 | | | | (0.10 | ) | | | (0.05 | ) | | | (0.01 | ) |
Return of capital(a) | | | 0.30 | | | | 0.26 | | | | 0.25 | | | | 0.32 | | | | 0.36 | |
Net realized and unrealized gain (loss) | | | 0.89 | | | | 1.52 | | | | 1.29 | | | | (1.50 | ) | | | (0.98 | ) |
Total from investment operations | | | 1.19 | | | | 1.78 | | | | 1.44 | | | | (1.23 | ) | | | (0.63 | ) |
Less: | | | | | | | | | | | | | | | | | | | | |
Return of capital | | | — | | | | — | | | | (0.37 | ) | | | (0.51 | ) | | | (0.62 | ) |
Dividends from net investment income | | | (0.38 | ) | | | (0.37 | ) | | | — | | | | — | | | | (0.04 | ) |
Total distributions | | | (0.38 | ) | | | (0.37 | ) | | | (0.37 | ) | | | (0.51 | ) | | | (0.66 | ) |
Net asset value, end of period | | $ | 7.06 | | | $ | 6.25 | | | $ | 4.84 | | | $ | 3.77 | | | $ | 5.51 | |
Total return(b) | | | 19.83 | % | | | 37.59 | % | | | 38.74 | % | | | (22.03 | )% | | | (10.45 | )% |
Net assets, end of period (000’s omitted) | | $ | 17,725 | | | $ | 16,738 | | | $ | 14,333 | | | $ | 13,194 | | | $ | 38,414 | |
Portfolio turnover rate | | | 32 | % | | | 25 | % | | | 31 | % | | | 88 | % | | | 32 | % |
| | | |
Ratios/supplemental data based on average net assets: | | | | | | | | | | | | | |
Ratio of expenses: | | | | | | | | | | | | | | | | |
Without fee waivers and/or expense reimbursements, before taxes | | | 1.25 | % | | | 1.26 | % | | | 1.29 | % | | | 1.49 | % | | | 1.27 | % |
Expense (waivers) | | | (0.03 | )% | | | (0.03 | )% | | | (0.05 | )% | | | (0.06 | )% | | | — | % |
With fee waivers and/or expense reimbursements, before taxes(c) | | | 1.22 | % | | | 1.23 | % | | | 1.24 | % | | | 1.43 | % | | | 1.27 | % |
Deferred/current tax expense (benefit)(d) | | | 1.52 | % | | | 0.85 | % | | | 1.28 | % | | | 0.77 | % | | | — | % |
With fee waivers and/or expense reimbursements, after taxes | | | 2.74 | % | | | 2.08 | % | | | 2.52 | % | | | 2.20 | % | | | 1.27 | % |
| |
Ratio of investment income (loss): | | | | | |
Ratio of net investment income (loss), before taxes | | | (0.26 | )% | | | (0.52 | )% | | | (0.56 | )% | | | (1.19 | )% | | | (0.16 | )% |
Net of expense (waivers) and before deferred tax benefit (expense) | | | (0.23 | )% | | | (0.49 | )% | | | (0.51 | )% | | | (1.13 | )% | | | (0.16 | )% |
Deferred tax benefit (expense)(e) | | | 0.30 | % | | | 0.49 | % | | | (1.55 | )% | | | — | % | | | — | % |
Ratio of net investment income (loss), after taxes | | | 0.07 | % | | | 0.00 | % | | | (2.06 | )% | | | (1.13 | )% | | | (0.16 | )% |
| (a) | Per share net investment income (loss) is calculated based on average shares outstanding during the period net of deferred tax expense (benefit). Per share return of capital is calculated based on average shares during the period net of deferred tax expense (benefit) estimated at the combined Federal and State statutory income tax rate. |
| (b) | Includes adjustments in accordance with accounting principles generally accepted in the United States of America and as such, the net asset value for financial reporting purposes and returns based upon those net asset values may differ from the net asset value and returns for shareholder transactions. Does not include sales charges and is not annualized for periods less than one year, if applicable. |
| (c) | Includes borrowing, state income tax and franchise tax expense. Without borrowing, state income tax and franchise tax expense, the net expense ratio would be 1.19%, 1.19%, 1.19%, 1.21% and 1.23%, for the years ended November 30, 2023, 2022, 2021, 2020 and 2019, respectively. |
| (d) | Deferred tax expense (benefit) estimate for the ratio calculation is derived from the net investment income (loss), and realized and unrealized gains (losses). |
| (e) | Deferred tax benefit (expense) for the ratio calculation, when applicable, is derived from net investment income (loss) only. |
See accompanying Notes to Financial Statements which are an integral part of the financial statements.
17 Invesco SteelPath MLP Alpha Fund
Notes to Financial Statements
November 30, 2023
NOTE 1—Significant Accounting Policies
Invesco SteelPath MLP Alpha Fund (the “Fund”) is a series portfolio of AIM Investment Funds (Invesco Investment Funds) (the “Trust”). The Trust is organized as a Delaware statutory trust and is registered under the Investment Company Act of 1940, as amended (the “1940 Act”), as an open-end series management investment company authorized to issue an unlimited number of shares of beneficial interest. Information presented in these financial statements pertains only to the Fund. Matters affecting the Fund or each class will be voted on exclusively by the shareholders of the Fund or each class.
The Fund’s investment objective is to seek total return.
The Fund currently consists of six different classes of shares: Class A, Class C, Class R, Class Y, Class R5 and Class R6. Class Y shares are available only to certain investors. Class A shares are sold with a front-end sales charge unless certain waiver criteria are met. Under certain circumstances, load waived shares may be subject to contingent deferred sales charges (“CDSC”). Class C shares are sold with a CDSC. Class R, Class Y, Class R5 and Class R6 shares are sold at net asset value. Class C shares held for eight years after purchase are eligible for automatic conversion into Class A shares of the same Fund (the “Conversion Feature”). The automatic conversion pursuant to the Conversion Feature will generally occur at the end of the month following the eighth anniversary after a purchase of Class C shares.
The Fund is an investment company and accordingly follows the investment company accounting and reporting guidance in accordance with Financial Accounting Standards Board Accounting Standards Codification Topic 946, Financial Services – Investment Companies.
The following is a summary of the significant accounting policies followed by the Fund in the preparation of its financial statements.
| A. | Security Valuations – Securities, including restricted securities, are valued according to the following policy. |
A security listed or traded on an exchange is generally valued at its trade price or official closing price that day as of the close of the exchange where the security is principally traded, or lacking any trades or official closing price on a particular day, the security may be valued at the closing bid or ask price on that day. Securities traded in the over-the-counter market are valued based on prices furnished by independent pricing services or market makers. When such securities are valued using prices provided by an independent pricing service they may be considered fair valued. Futures contracts are valued at the daily settlement price set by an exchange on which they are principally traded. Where a final settlement price exists, exchange-traded options are valued at the final settlement price from the exchange where the option principally trades. Where a final settlement price does not exist, exchange-traded options are valued at the mean between the last bid and ask price generally from the exchange where the option principally trades.
Securities of investment companies that are not exchange-traded (e.g., open end mutual funds) are valued using such company’s end-of-business-day net asset value per share.
Deposits, other obligations of U.S. and non-U.S. banks and financial institutions are valued at their daily account value.
Fixed income securities (including convertible debt securities) generally are valued on the basis of prices provided by independent pricing services. Prices provided by the pricing service may be determined without exclusive reliance on quoted prices, and may reflect appropriate factors such as institution-size trading in similar groups of securities, developments related to specific securities, dividend rate (for unlisted equities), yield (for debt obligations), quality, type of issue, coupon rate (for debt obligations), maturity (for debt obligations), individual trading characteristics and other market data. Pricing services generally value debt obligations assuming orderly transactions of institutional round lot size, but a fund may hold or transact in the same securities in smaller, odd lot sizes. Odd lots often trade at lower prices than institutional round lots, and their value may be adjusted accordingly. Debt obligations are subject to interest rate and credit risks. In addition, all debt obligations involve some risk of default with respect to interest and/or principal payments.
Foreign securities’ (including foreign exchange contracts) prices are converted into U.S. dollar amounts using the applicable exchange rates as of the close of the New York Stock Exchange (“NYSE”). If market quotations are available and reliable for foreign exchange-traded equity securities, the securities will be valued at the market quotations. Invesco Advisers, Inc. (the “Adviser” or “Invesco”) may use various pricing services to obtain market quotations as well as fair value prices. Because trading hours for certain foreign securities end before the close of the NYSE, closing market quotations may become not representative of market value in the Adviser’s judgment (“unreliable”). If, between the time trading ends on a particular security and the close of the customary trading session on the NYSE, a significant event occurs that makes the closing price of the security unreliable, the Adviser may fair value the security. If the event is likely to have affected the closing price of the security, the security will be valued at fair value in good faith in accordance with Board-approved policies and related Adviser procedures (“Valuation Procedures”). Adjustments to closing prices to reflect fair value may also be based on a screening process of an independent pricing service to indicate the degree of certainty, based on historical data, that the closing price in the principal market where a foreign security trades is not the current value as of the close of the NYSE. Foreign securities’ prices meeting the degree of certainty that the price is not reflective of current value will be priced at the indication of fair value from the independent pricing service. Multiple factors may be considered by the independent pricing service in determining adjustments to reflect fair value and may include information relating to sector indices, American Depositary Receipts and domestic and foreign index futures. Foreign securities may have additional risks including exchange rate changes, potential for sharply devalued currencies and high inflation, political and economic upheaval, the relative lack of issuer information, relatively low market liquidity and the potential lack of strict financial and accounting controls and standards.
Unlisted securities will be valued using prices provided by independent pricing services or by another method that the Adviser, in its judgment, believes better reflects the security’s fair value in accordance with the Valuation Procedures.
Securities for which market prices are not provided by any of the above methods may be valued based upon quotes furnished by independent sources. The mean between the last bid and ask prices may be used to value debt obligations, including corporate loans.
Securities for which market quotations are not readily available are fair valued by the Adviser in accordance with the Valuation Procedures. If a fair value price provided by a pricing service is unreliable, the Adviser will fair value the security using the Valuation Procedures. Issuer specific events, market trends, bid/ask quotes of brokers and information providers and other market data may be reviewed in the course of making a good faith determination of a security’s fair value.
The Fund may invest in securities that are subject to interest rate risk, meaning the risk that the prices will generally fall as interest rates rise and, conversely, the prices will generally rise as interest rates fall. Specific securities differ in their sensitivity to changes in interest rates depending on their individual characteristics. Changes in interest rates may result in increased market volatility, which may affect the value and/or liquidity of certain Fund investments.
Valuations change in response to many factors including the historical and prospective earnings of the issuer, the value of the issuer’s assets, general market conditions which are not specifically related to the particular issuer, such as real or perceived adverse economic conditions, changes in the general outlook for revenues or corporate earnings, changes in interest or currency rates, regional or global instability, natural or environmental disasters, widespread disease or other public health issues, war, acts of terrorism, significant governmental actions or adverse investor sentiment generally and market liquidity. Because of the inherent uncertainties of valuation, the values reflected in the financial statements may materially differ from the value received upon actual sale of those investments.
The price the Fund could receive upon the sale of any investment may differ from the Adviser’s valuation of the investment, particularly for securities that are valued using a fair valuation technique. When fair valuation techniques are applied, the Adviser uses available information, including both observable and
18 Invesco SteelPath MLP Alpha Fund
unobservable inputs and assumptions, to determine a methodology that will result in a valuation that the Adviser believes approximates market value. Fund securities that are fair valued may be subject to greater fluctuation in their value from one day to the next than would be the case if market quotations were used. Because of the inherent uncertainties of valuation, and the degree of subjectivity in such decisions, the Fund could realize a greater or lesser than expected gain or loss upon the sale of the investment.
| B. | Securities Transactions and Investment Income – Securities transactions are accounted for on a trade date basis. Realized gains or losses on sales are computed on the basis of specific identification of the securities sold. Interest income (net of withholding tax, if any) is recorded on an accrual basis from settlement date and includes coupon interest and amortization of premium and accretion of discount on debt securities as applicable. Dividend income (net of withholding tax, if any) is recorded on the ex-dividend date. |
The Fund may periodically participate in litigation related to Fund investments. As such, the Fund may receive proceeds from litigation settlements. Any proceeds received are included in the Statement of Operations as realized gain (loss) for investments no longer held and as unrealized gain (loss) for investments still held.
Brokerage commissions and mark ups are considered transaction costs and are recorded as an increase to the cost basis of securities purchased and/or a reduction of proceeds on a sale of securities. Such transaction costs are included in the determination of net realized and unrealized gain (loss) from investment securities reported in the Statement of Operations and the Statement of Changes in Net Assets and the net realized and unrealized gains (losses) on securities per share in the Financial Highlights. Transaction costs are included in the calculation of the Fund’s net asset value and, accordingly, they reduce the Fund’s total returns. These transaction costs are not considered operating expenses and are not reflected in net investment income reported in the Statement of Operations and the Statement of Changes in Net Assets, or the net investment income per share and the ratios of expenses and net investment income reported in the Financial Highlights, nor are they limited by any expense limitation arrangements between the Fund and the investment adviser.
The Fund allocates income and realized and unrealized capital gains and losses to a class based on the relative net assets of each class.
| C. | Country Determination – For the purposes of making investment selection decisions and presentation in the Schedule of Investments, the investment adviser may determine the country in which an issuer is located and/or credit risk exposure based on various factors. These factors include the laws of the country under which the issuer is organized, where the issuer maintains a principal office, the country in which the issuer derives 50% or more of its total revenues, the country that has the primary market for the issuer’s securities and its “country of risk” as determined by a third party service provider, as well as other criteria. Among the other criteria that may be evaluated for making this determination are the country in which the issuer maintains 50% or more of its assets, the type of security, financial guarantees and enhancements, the nature of the collateral and the sponsor organization. Country of issuer and/or credit risk exposure has been determined to be the United States of America, unless otherwise noted. |
| D. | Dividends and Distributions to Shareholders – Dividends and distributions to shareholders, which are determined in accordance with income tax regulations and may differ from accounting principles generally accepted in the United States of America (“GAAP”), are recorded on the ex-dividend date. The Fund’s dividend distribution policy is intended to provide monthly distributions to its shareholders at a rate that over time is similar to the distribution rate the Fund receives from the master limited partnerships (”MLPs”) in which it invests. The Fund generally pays out dividends that over time approximate the distributions received from the Fund’s portfolio investments based on, among other considerations, distributions the Fund actually received from portfolio investments, distributions it would have received if it had been fully invested at all times, and estimated future cash flows. Such dividends are not tied to the Fund’s investment income and may not represent yield or investment return on the Fund’s portfolio. To the extent that the dividends paid exceed the distributions the Fund receives from its underlying investments, the Fund’s assets will be reduced. The Fund’s tendency to pay out a consistent dividend may change, and the Fund’s level of distributions may increase or decrease. |
The estimated characterization of the distributions paid will be either a qualified dividend or distribution (return of capital). This estimate is based on the Fund’s operating results during the period. The actual characterization of the distributions made during the period will not be determined until after the end of the fiscal year.
| E. | Master Limited Partnerships – The Fund primarily invests in MLPs. MLPs are publicly traded partnerships and limited liability companies taxed as partnerships under the Internal Revenue Code of 1986, as amended (the “Internal Revenue Code”). The Fund principally invests in MLPs that derive their revenue primarily from businesses involved in the gathering, transporting, processing, treating, storing, refining, distributing, mining or marketing of natural gas, natural gas liquids, crude oil, refined products or coal (“energy infrastructure MLPs”). The Fund is a partner in each MLP; accordingly, the Fund is required to take into account the Fund’s allocable share of income, gains, losses, deductions, expenses, and tax credits recognized by each MLP. |
The Fund is non-diversified and may invest in securities of fewer issuers than if it were diversified. Thus, the value of the Fund’s shares may vary more widely and the Fund may be subject to greater market and credit risk than if the Fund invested more broadly. The Fund also will concentrate its investments in the energy sector. Energy infrastructure MLPs are subject to a variety of industry specific risk factors that may adversely affect their business or operations, including a decrease in production or reduced volumes of natural gas or other energy commodities available for transporting, processing, storing or distributing; changes in energy commodity prices; a sustained reduced demand for crude oil, natural gas and refined petroleum products; depletion of natural gas reserves or other commodities if not replaced; natural disasters, extreme weather and environmental hazards; rising interest rates, how facilities are constructed, maintained and operated, environmental and safety controls, and the prices they may charge for products and services. In addition, taxes, government regulation, international politics, price, and supply fluctuations, volatile interest rates and energy conservation may cause difficulties for energy infrastructure MLPs.
MLP’s may be less liquid and subject to more abrupt or erratic price movements than conventional publicly traded securities.
| F. | Return of Capital – Distributions received from the Fund’s investments in MLPs generally are comprised of income and return of capital. The Fund records investment income and return of capital based on estimates made at the time such distributions are received. The return of capital portion of the distribution is a reduction to investment income that results in an equivalent reduction in the cost basis of the associated investments and increases net realized gains (losses) and change in unrealized appreciation (depreciation). Such estimates are based on historical information available from each MLP and other industry sources. These estimates will subsequently be revised and may materially differ primarily based on information received from the MLPs after their tax reporting periods are concluded. |
| G. | Federal Income Taxes – The Fund does not intend to qualify as a regulated investment company pursuant to Subchapter M of the Internal Revenue Code, but will rather be taxed as a corporation. The Fund is treated as a regular corporation, or “C” corporation, for U.S. federal income tax purposes and generally is subject to U.S. federal income tax on its taxable income at the graduated rates applicable to corporations. In addition, as a regular corporation, the Fund may be subject to state and local taxes in jurisdictions in which the MLPs operate. |
The Fund intends to invest its assets primarily in MLPs, which generally are treated as partnerships for federal income tax purposes. As a limited partner in the MLPs, the Fund reports its allocable share of the MLPs’ taxable income in computing its own taxable income. The Fund’s tax expense or benefit is included in the Statement of Operations based on the component of income or gains (losses) to which such expense or benefit relates.
Taxes include current and deferred taxes. Current taxes reflect the estimated tax liability of the Fund as of a measurement date based on taxable income. Deferred income taxes reflect the net tax effects of temporary differences between the carrying amounts of assets and liabilities for financial reporting purposes and the amounts used for income tax purposes. Such temporary differences are principally: (i) taxes on unrealized gains (losses), which are attributable to the temporary difference between fair market value and tax basis, (ii) the net tax effects of temporary differences between the carrying amounts of assets and liabilities for financial reporting and income tax purposes and (iii) the net tax benefit of accumulated net operating losses (“NOL”) and capital loss carryforwards.
19 Invesco SteelPath MLP Alpha Fund
Deferred tax assets and liabilities are measured using effective tax rates expected to apply to taxable income in the years such temporary differences are realized or otherwise settled. To the extent the Fund has a deferred tax asset, consideration is given to whether or not a valuation allowance is required. A valuation allowance is required if, based on the evaluation criterion provided by ASC 740, Income Taxes, it is more-likely-than-not some portion or all of the deferred tax asset will not be realized.
In determining a valuation allowance, the Fund’s assessment considers, among other matters, the nature, frequency and severity of current and cumulative losses, the duration of statutory carryforward periods and the associated risk that operating loss and capital loss carryforwards were limited as a result of shareholder transactions or were likely to expire unused, and unrealized gains and losses on investments. Consideration was also given to market cycles, the severity and duration of historical deferred tax assets, the impact of redemptions, and the level of MLP distributions.
Through the consideration of these factors, the Fund may determine that it is more likely than not that the Fund’s deferred tax assets will not be realized through future taxable income of the appropriate character. As a result, the Fund may be required to record a valuation allowance with respect to its deferred tax assets that are not considered to be realizable.
From time to time, the Fund may modify its estimates or assumptions regarding its deferred tax liability and/or asset balances and any applicable valuation allowance as new information becomes available. Modifications of the Fund’s estimates or assumptions regarding its deferred tax liability and/or asset balances and any applicable valuation allowance, changes in generally accepted accounting principles or related guidance or interpretations thereof, limitations imposed on or expirations of the Fund’s NOL and capital loss carryovers (if any) and changes in applicable tax law could result in increases or decreases in the Fund’s NAV per share, which could be material.
The Fund may rely, to some extent, on information provided by the MLPs, which may not necessarily be timely, to estimate taxable income allocable to MLP units held in its portfolio, and to estimate its associated deferred tax liability or asset. Such estimates are made in good faith. From time to time, as new information becomes available, the Fund will modify its estimates or assumptions regarding its tax liability or asset.
The Fund’s policy is to classify interest and penalties associated with underpayment of federal and state income taxes, if any, as income tax expense on its Statement of Operations.
The Fund files income tax returns in the U.S. federal jurisdiction and various states. The Fund has reviewed all major jurisdictions and concluded that there is no significant impact on the Fund’s net assets and no tax liability resulting from unrecognized tax benefits relating to uncertain tax positions expected to be taken on its tax returns. Furthermore, management of the Fund is not aware of any uncertain tax positions for which it is reasonably possible that the total amount of unrecognized tax benefit will significantly change in the next 12 months. Generally, the Fund is subject to examinations by taxing authorities for up to three years after the filing of the return for the tax period. All relevant periods are still open for examination.
| H. | Expenses – Fees provided for under the Rule 12b-1 plan of a particular class of the Fund are charged to the operations of such class. Transfer agency fees and expenses and other shareholder recordkeeping fees and expenses attributable to Class R5 and Class R6 are allocated based on relative net assets of Class R5 and Class R6. Sub-accounting fees attributable to Class R5 are charged to the operations of the class. Transfer agency fees and expenses and other shareholder recordkeeping fees and expenses relating to all other classes are allocated among those classes based on relative net assets. All other expenses are allocated among the classes based on relative net assets. |
| I. | Interest, Facilities and Maintenance Fees – Interest, Facilities and Maintenance Fees include interest and related borrowing costs such as commitment fees, administrative expenses and other expenses associated with establishing and maintaining the line of credit. |
| J. | Accounting Estimates – The preparation of financial statements in conformity with GAAP requires management to make estimates and assumptions that affect the reported amounts of assets and liabilities at the date of the financial statements and the reported amounts of revenues and expenses during the reporting period including estimates and assumptions related to taxation. Actual results could differ from those estimates by a significant amount. In addition, the Fund monitors for material events or transactions that may occur or become known after the period-end date and before the date the financial statements are released to print. |
| K. | Indemnifications – Under the Trust’s organizational documents, each Trustee, officer, employee or other agent of the Trust is indemnified against certain liabilities that may arise out of the performance of their duties to the Fund. Additionally, in the normal course of business, the Fund enters into contracts, including the Fund’s servicing agreements, that contain a variety of indemnification clauses. The Fund’s maximum exposure under these arrangements is unknown as this would involve future claims that may be made against the Fund that have not yet occurred. The risk of material loss as a result of such indemnification claims is considered remote. |
NOTE 2—Advisory Fees and Other Fees Paid to Affiliates
The Trust has entered into a master investment advisory agreement with the Adviser. Under the terms of the investment advisory agreement, the Fund accrues daily and pays monthly an advisory fee to the Adviser based on the annual rate of the Fund’s average daily net assets as follows:
| | | | |
| Average Daily Net Assets | | Rate* | |
First $3 billion | | | 1.10% | |
Next $2 billion | | | 1.08% | |
Over $5 billion | | | 1.05% | |
| * | The advisory fee paid by the Fund shall be reduced by any amounts paid by the Fund under the administrative services agreement with the Adviser. |
For the year ended November 30, 2023, the effective advisory fee rate incurred by the Fund was 1.10%.
Under the terms of a master sub-advisory agreement between the Adviser and each of Invesco Asset Management Deutschland GmbH, Invesco Asset Management Limited, Invesco Asset Management (Japan) Limited, Invesco Hong Kong Limited, Invesco Senior Secured Management, Inc. and Invesco Canada Ltd. and separate sub-advisory agreements with Invesco Capital Management LLC and Invesco Asset Management (India) Private Limited (collectively, the “Affiliated Sub-Advisers”) the Adviser, not the Fund, will pay 40% of the fees paid to the Adviser to any such Affiliated Sub-Adviser(s) that provide(s) discretionary investment management services to the Fund based on the percentage of assets allocated to such Affiliated Sub-Adviser(s). Invesco has also entered into a Sub-Advisory Agreement with OppenheimerFunds, Inc. to provide discretionary management services to the Fund.
The Adviser has contractually agreed, through March 31, 2024, to waive advisory fees and/or reimburse expenses of all shares to the extent necessary to limit total annual fund operating expenses after fee waiver and/or expense reimbursement (excluding certain items discussed below) of Class A, Class C, Class R, Class Y, Class R5 and Class R6 shares to 1.50%, 2.25%, 1.75%, 1.25%, 1.24% and 1.19%, respectively, of the Fund’s average daily net assets (the “expense limits”). Effective April 1, 2024, the Adviser has contractually agreed, through at least March 31, 2025, to waive advisory fees and/or reimburse expenses of all shares to the extent necessary to limit total annual fund operating expenses after fee waiver and/or expense reimbursement (excluding certain items discussed below) of Class A, Class C, Class R, Class Y, Class R5 and Class R6 shares to 1.57%, 2.32%, 1.82%, 1.32%, 1.32% and 1.32%, respectively, of the Fund’s average daily net assets. In determining the Adviser’s obligation to waive advisory fees and/or reimburse expenses, the following expenses are not taken into account, and could cause the total annual fund operating expenses after fee waiver and/or expense reimbursement to exceed the numbers reflected above: (1) interest, facilities and maintenance fees; (2) taxes; (3) dividend expense on short sales; (4) extraordinary or non-routine items, including litigation expenses; and (5) expenses that the Fund has incurred but did not actually pay because of an expense offset arrangement. Unless Invesco continues the fee waiver agreement, it will terminate on March 31, 2025. During its term, the fee waiver agreement cannot be terminated or amended to increase the expense limits or reduce the advisory fee waiver without approval of the Board of Trustees.
20 Invesco SteelPath MLP Alpha Fund
For the year ended November 30, 2023, the Adviser contractually reimbursed class level expenses of $230,711, $62,719, $649, $202,253, $2, and $4,675 for Class A, Class C, Class R, Class Y, Class R5 and Class R6 shares, respectively.
The Trust has entered into an administration and fund accounting agreement with UMB Fund Services, Inc. (“UMB”) pursuant to which UMB shall provide administration and fund accounting services to the Fund. The Trust and the Adviser have entered into a Master Administrative Services Agreement (“Administrative Services Agreement”) pursuant to which the Adviser may perform or arrange for the provision of certain accounting and other administrative services to the Fund which are not required to be performed by the Adviser under the Investment Advisory Agreement. The Adviser may only receive fees for administrative services under the Administrative Services Agreement to the extent that those fees assessed under the agreement are in excess of the fees paid to UMB. For the year ended November 30, 2023, expenses incurred under the agreement are shown in the Statement of Operations as Administrative services fees. Additionally, Invesco has entered into service agreements whereby UMB Bank, n.a., serves as custodian to the Fund.
The Trust has entered into a transfer agency and service agreement with Invesco Investment Services, Inc. (“IIS”) pursuant to which the Fund has agreed to pay IIS a fee for providing transfer agency and shareholder services to the Fund and reimburse IIS for certain expenses incurred by IIS in the course of providing such services. IIS may make payments to intermediaries that provide omnibus account services, sub-accounting services and/or networking services. All fees payable by IIS to intermediaries that provide omnibus account services or sub-accounting services are charged back to the Fund, subject to certain limitations approved by the Trust’s Board of Trustees. For the year ended November 30, 2023, expenses incurred under the agreement are shown in the Statement of Operations as Transfer agent fees.
The Trust has entered into master distribution agreements with Invesco Distributors, Inc. (“IDI”) to serve as the distributor for the Class A, Class C, Class R, Class Y, Class R5 and Class R6 shares of the Fund. The Trust has adopted plans pursuant to Rule 12b-1 under the 1940 Act with respect to the Fund’s Class A, Class C and Class R shares (collectively, the “Plans”). The Fund, pursuant to the Plans, pays IDI compensation at the annual rate of 0.25% of the Fund’s average daily net assets of Class A shares, 1.00% of the average daily net assets of Class C shares and 0.50% of the average daily net assets of Class R shares. The fees are accrued daily and paid monthly. Of the Plans payments, up to 0.25% of the average daily net assets of each class of shares may be paid to furnish continuing personal shareholder services to customers who purchase and own shares of such classes. Any amounts not paid as a service fee under the Plans would constitute an asset-based sales charge. Rules of the Financial Industry Regulatory Authority (“FINRA”) impose a cap on the total sales charges, including asset-based sales charges, that may be paid by any class of shares of the Fund. For the year ended November 30, 2023, expenses incurred under the Plans are shown in the Statement of Operations as Distribution fees.
Front-end sales commissions and CDSC (collectively, the “sales charges”) are not recorded as expenses of the Fund. Front-end sales commissions are deducted from proceeds from the sales of Fund shares prior to investment in Class A shares of the Fund. CDSC are deducted from redemption proceeds prior to remittance to the shareholder. During the year ended November 30, 2023, IDI advised the Fund that IDI retained $41,613 in front-end sales commissions from the sale of Class A shares and $166 and $5,516 from Class A and Class C shares, respectively, for CDSC imposed upon redemptions by shareholders.
For the year ended November 30, 2023, the Fund incurred $1,655 in brokerage commissions with Invesco Capital Markets, Inc., an affiliate of the Adviser and IDI, for portfolio transactions executed on behalf of the Fund.
Certain officers and trustees of the Trust are officers and directors of the Adviser, IIS and/or IDI.
NOTE 3—Additional Valuation Information
GAAP defines fair value as the price that would be received to sell an asset or paid to transfer a liability in an orderly transaction between market participants at the measurement date, under current market conditions. GAAP establishes a hierarchy that prioritizes the inputs to valuation methods, giving the highest priority to readily available unadjusted quoted prices in an active market for identical assets (Level 1) and the lowest priority to significant unobservable inputs (Level 3), generally when market prices are not readily available. Based on the valuation inputs, the securities or other investments are tiered into one of three levels. Changes in valuation methods may result in transfers in or out of an investment’s assigned level:
| | |
| Level 1 – | | Prices are determined using quoted prices in an active market for identical assets. |
| Level 2 – | | Prices are determined using other significant observable inputs. Observable inputs are inputs that other market participants may use in pricing a security. These may include quoted prices for similar securities, interest rates, prepayment speeds, credit risk, yield curves, loss severities, default rates, discount rates, volatilities and others. |
| Level 3 – | | Prices are determined using significant unobservable inputs. In situations where quoted prices or observable inputs are unavailable (for example, when there is little or no market activity for an investment at the end of the period), unobservable inputs may be used. Unobservable inputs reflect the Adviser’s assumptions about the factors market participants would use in determining fair value of the securities or instruments and would be based on the best available information. |
As of November 30, 2023, all of the securities in this Fund were valued based on Level 1 inputs (see the Schedule of Investments for security categories). The level assigned to the securities valuations may not be an indication of the risk or liquidity associated with investing in those securities. Because of the inherent uncertainties of valuation, the values reflected in the financial statements may materially differ from the value received upon actual sale of those investments.
NOTE 4—Security Transactions with Affiliated Funds
The Fund is permitted to purchase securities from or sell securities to certain other affiliated funds under specified conditions outlined in procedures adopted by the Board of Trustees of the Trust. The procedures have been designed to ensure that any purchase or sale of securities by the Fund from or to another fund that is or could be considered an “affiliated person” by virtue of having a common investment adviser (or affiliated investment advisers), common Trustees and/or common officers is made in reliance on Rule 17a-7 of the 1940 Act and, to the extent applicable, related SEC staff positions. Each such transaction is effected at the security’s “current market price”, as provided for in these procedures and Rule 17a-7. Pursuant to these procedures, for the year ended November 30, 2023, the Fund engaged in securities purchases of $27,985,428 and securities sales of $16,646,373, which resulted in net realized gains of $6,970,249.
NOTE 5—Trustees’ and Officers’ Fees and Benefits
Trustees’ and Officers’ Fees and Benefits include amounts accrued by the Fund to pay remuneration to certain Trustees and Officers of the Fund. Trustees have the option to defer compensation payable by the Fund, and Trustees’ and Officers’ Fees and Benefits also include amounts accrued by the Fund to fund such deferred compensation amounts. Those Trustees who defer compensation have the option to select various Invesco Funds in which their deferral accounts shall be deemed to be invested. Finally, certain current Trustees were eligible to participate in a retirement plan that provided for benefits to be paid upon retirement to Trustees over a period of time based on the number of years of service. The Fund may have certain former Trustees who also participate in a retirement plan and receive benefits under such plan. Trustees’ and Officers’ Fees and Benefits include amounts accrued by the Fund to fund such retirement benefits. Obligations under the deferred compensation and retirement plans represent unsecured claims against the general assets of the Fund.
NOTE 6—Cash Balances and Borrowings
The Fund has entered into a revolving credit and security agreement, which enables the Fund to participate with certain other Invesco Funds in a committed secured borrowing facility that permits borrowings up to $400 million, collectively by certain Invesco Funds, and which will expire on September 25, 2024. The Fund is permitted to borrow up to the lesser of one-third of the Fund’s total assets, or the maximum amount permitted pursuant to the Fund’s investment limitations. The
21 Invesco SteelPath MLP Alpha Fund
revolving credit and security agreement is secured by the assets of the Fund. The Fund is subject to certain covenants relating to the revolving credit and security agreement. Failure to comply with these restrictions could cause the acceleration of the repayment of the amount outstanding under the revolving credit and security agreement. During the year ended November 30, 2023, the Fund did not borrow under this agreement.
Additionally, the Fund is permitted to temporarily carry a negative or overdrawn balance in its account with UMB Bank, n.a., the custodian bank. Such balances, if any at period-end, are shown in the Statement of Assets and Liabilities under the payable caption Amount due custodian. To compensate the custodian bank for such overdrafts, the overdrawn Fund may either (1) leave funds as a compensating balance in the account so the custodian bank can be compensated by earning the additional interest; or (2) compensate by paying the custodian bank at a rate agreed upon by the custodian bank and Invesco, not to exceed the contractually agreed upon rate.
NOTE 7—Distributions and Tax Information
Tax Character of Distributions to Shareholders Paid During the Fiscal Years Ended November 30, 2023 and 2022:
| | | | | | | | |
| | | November 30,
2023 | | | November 30,
2022 | |
Ordinary income | | $ | 51,121,301 | | | $ | 52,467,817 | |
Total distributions | | $ | 51,121,301 | | | $ | 52,467,817 | |
For the year ended November 30, 2023, the federal income tax rate is 21%. The Fund is currently using an estimated rate of 1.0% for state and local tax, net of federal tax expense.
The Fund’s income tax provision consists of the following as of November 30, 2023:
| | | | |
| Current tax (expense) benefit | | | |
Federal | | $ | (11,467,543 | ) |
State | | | — | |
Total current tax (expense) benefit | | $ | (11,467,543 | ) |
| |
| Deferred tax (expense) benefit | | | |
Federal | | $ | (21,422,691 | ) |
State | | | (1,059,786 | ) |
Valuation allowance | | | 21,593,662 | |
Total deferred tax (expense) benefit | | $ | (888,815 | ) |
The reconciliation between the federal statutory income tax rate of 21% and the tax effect on net investment income (loss) and realized and unrealized gain (loss) follows:
| | | | | | | | |
| | | Amount | | | % Effect | |
Application of federal statutory income tax rate | | $ | (33,383,133 | ) | | | (21.00 | )% |
State income taxes net of federal benefit | | | (1,589,673 | ) | | | (1.00 | )% |
Effect of state tax rate change | | | (329,510 | ) | | | (0.21 | )% |
Effect of permanent differences | | | 1,019,565 | | | | 0.64 | % |
Return to provision adjustments | | | 332,731 | | | | 0.21 | % |
Change in valuation allowance | | | 21,593,662 | | | | 13.58 | % |
Total income tax (expense) benefit | | $ | (12,356,358 | ) | | | (7.78 | )% |
For the year ended November 30, 2023 the Fund’s tax effect on net investment income (loss) and realized and unrealized gain (loss) of (7.78)% differed from the combined federal and state statutory tax rate of (22.00)% due in large part to the change in valuation allowance primarily as a result of the change in unrealized appreciation.
Components of the Fund’s deferred tax assets and liabilities as of November 30, 2023 are as follows:
| | | | |
| Deferred tax assets: | | | |
Net operating loss carryforward (tax basis) — Federal | | $ | — | |
Net operating loss carryforward (tax basis) — State | | | 3,606,128 | |
Excess Business Interest expense carryforward | | | 1,003,205 | |
Capital loss carryforward (tax basis) | | | 111,696,894 | |
Book to tax differences — Income recognized from MLPs | | | 3,857,285 | |
Valuation allowance | | | (46,527,248 | ) |
Total deferred tax asset | | $ | 73,636,264 | |
| |
| Deferred tax liabilities: | | | |
Net unrealized gains on investment securities (tax basis) | | $ | (81,892,462 | ) |
Total deferred tax liability | | | (81,892,462 | ) |
Total net deferred tax asset (liability) | | $ | (8,256,198 | ) |
22 Invesco SteelPath MLP Alpha Fund
As of November 30, 2023, the Fund does not have net operating loss carryforwards for federal income tax purposes.
As of November 30, 2023, the Fund has net capital loss carryforwards for federal income tax purposes, which may be carried forward for 5 years, as follows:
| | | | |
| Expiration Date | | | |
11/30/2025 | | $ | 468,436,184 | |
11/30/2026 | | | 39,276,969 | |
Total | | $ | 507,713,153 | |
During the year ended November 30, 2023, the Fund estimates that it will utilize $95,005,592 of capital loss carryforward.
NOTE 8—Investment Transactions
The aggregate amount of investment securities (other than short-term securities, U.S. Government obligations and money market funds, if any) purchased and sold by the Fund during the year ended November 30, 2023 was $255,613,555 and $305,267,470 respectively.
As of November 30, 2023, gross unrealized appreciation and depreciation of investments, based on cost for federal income tax purposes were as follows:
| | | | |
Gross Unrealized Appreciation | | $ | 366,185,838 | |
Gross Unrealized Depreciation | | | (4,884,793 | ) |
Net Unrealized Appreciation on Investments | | $ | 361,301,045 | |
Cost of investments for tax purposes is $521,584,723.
The difference between cost amounts for financial statement and federal income tax purposes is due primarily to timing differences in recognizing certain gains and losses in security transactions.
NOTE 9—Share Information
| | | | | | | | | | | | | | | | |
| | | Summary of Share Activity | |
| | | Year ended
November 30, 2023(a) | | | Year ended
November 30, 2022 | |
| | | Shares | | | Amount | | | Shares | | | Amount | |
Sold: | | | | | | | | | | | | | | | | |
Class A | | | 3,806,076 | | | $ | 22,514,803 | | | | 7,810,274 | | | $ | 42,141,256 | |
Class C | | | 1,106,071 | | | | 5,800,706 | | | | 2,596,713 | | | | 12,442,725 | |
Class R | | | 114,059 | | | | 672,409 | | | | 62,676 | | | | 333,578 | |
Class Y | | | 9,191,836 | | | | 58,087,195 | | | | 12,949,009 | | | | 74,256,379 | |
Class R5 | | | 8,918 | | | | 56,126 | | | | — | | | | — | |
Class R6 | | | 202,600 | | | | 1,284,125 | | | | 645,769 | | | | 3,556,209 | |
Issued as reinvestment of dividends: | | | | | | | | | | | | | | | | |
Class A | | | 2,576,908 | | | | 15,430,483 | | | | 2,680,954 | | | | 14,720,021 | |
Class C | | | 839,370 | | | | 4,340,757 | | | | 1,228,186 | | | | 5,921,504 | |
Class R | | | 11,640 | | | | 68,879 | | | | 6,458 | | | | 35,102 | |
Class Y | | | 1,845,819 | | | | 11,746,705 | | | | 2,091,732 | | | | 12,106,523 | |
Class R5 | | | 90 | | | | 589 | | | | — | | | | — | |
Class R6 | | | 78,383 | | | | 505,545 | | | | 86,080 | | | | 502,092 | |
Automatic Conversion of Class C shares to Class A shares: | | | | | | | | | | | | | | | | |
Class A | | | 3,765,081 | | | | 22,335,894 | | | | 5,963,371 | | | | 31,976,088 | |
Class C | | | (4,342,618 | ) | | | (22,335,894 | ) | | | (6,767,527 | ) | | | (31,976,088 | ) |
Reacquired: | | | | | | | | | | | | | | | | |
Class A | | | (11,525,047 | ) | | | (68,815,614 | ) | | | (14,116,037 | ) | | | (75,741,721 | ) |
Class C | | | (2,618,696 | ) | | | (13,516,300 | ) | | | (5,062,354 | ) | | | (23,397,785 | ) |
Class R | | | (13,225 | ) | | | (78,550 | ) | | | (26,483 | ) | | | (142,825 | ) |
Class Y | | | (12,769,673 | ) | | | (80,388,046 | ) | | | (18,072,861 | ) | | | (101,249,106 | ) |
Class R5 | | | (4 | ) | | | (30 | ) | | | — | | | | — | |
Class R6 | | | (450,069 | ) | | | (2,891,040 | ) | | | (1,015,431 | ) | | | (5,831,722 | ) |
Net Increase (decrease) in share activity | | | (8,172,481 | ) | | $ | (45,181,258 | ) | | | (8,939,471 | ) | | $ | (40,347,770 | ) |
| (a) | There are entities that are record owners of more than 5% of the outstanding shares of the Fund and in the aggregate own 62% of the outstanding shares of the Fund. IDI has an agreement with these entities to sell Fund shares. The Fund, Invesco and/or Invesco affiliates may make payments to these entities, which are considered to be related to the Fund, for providing services to the Fund, Invesco and/or Invesco affiliates including but not limited to services such as securities brokerage, distribution, third party record keeping and account servicing. The Fund has no knowledge as to whether all or any portion of the shares owned of record by these entities are also owned beneficially. |
23 Invesco SteelPath MLP Alpha Fund
Report of Independent Registered Public Accounting Firm
To the Board of Trustees of AIM Investment Funds (Invesco Investment Funds) and Shareholders of Invesco SteelPath MLP Alpha Fund
Opinion on the Financial Statements
We have audited the accompanying statement of assets and liabilities, including the schedule of investments, of Invesco SteelPath MLP Alpha Fund (one of the funds constituting AIM Investment Funds (Invesco Investment Funds), hereafter referred to as the "Fund") as of November 30, 2023, the related statement of operations for the year ended November 30, 2023, the statement of changes in net assets for each of the two years in the period ended November 30, 2023, including the related notes, and the financial highlights for each of the periods indicated therein (collectively referred to as the "financial statements"). In our opinion, the financial statements present fairly, in all material respects, the financial position of the Fund as of November 30, 2023, the results of its operations for the year then ended, the changes in its net assets for each of the two years in the period ended November 30, 2023 and the financial highlights for each of the periods indicated therein, in conformity with accounting principles generally accepted in the United States of America.
Basis for Opinion
These financial statements are the responsibility of the Fund’s management. Our responsibility is to express an opinion on the Fund’s financial statements based on our audits. We are a public accounting firm registered with the Public Company Accounting Oversight Board (United States) (PCAOB) and are required to be independent with respect to the Fund in accordance with the U.S. federal securities laws and the applicable rules and regulations of the Securities and Exchange Commission and the PCAOB.
We conducted our audits of these financial statements in accordance with the standards of the PCAOB. Those standards require that we plan and perform the audit to obtain reasonable assurance about whether the financial statements are free of material misstatement, whether due to error or fraud.
Our audits included performing procedures to assess the risks of material misstatement of the financial statements, whether due to error or fraud, and performing procedures that respond to those risks. Such procedures included examining, on a test basis, evidence regarding the amounts and disclosures in the financial statements. Our audits also included evaluating the accounting principles used and significant estimates made by management, as well as evaluating the overall presentation of the financial statements. Our procedures included confirmation of securities owned as of November 30, 2023 by correspondence with the custodian. We believe that our audits provide a reasonable basis for our opinion.

Houston, Texas
January 22, 2024
We have served as the auditor of one or more investment companies in the Invesco group of investment companies since at least 1995. We have not been able to determine the specific year we began serving as auditor.
PricewaterhouseCoopers LLP, 1000 Louisiana Street, Suite 5800, Houston, TX 77002
T: (713) 356 4000, www.pwc.com/us
24 Invesco SteelPath MLP Alpha Fund
Calculating your ongoing Fund expenses
Example
As a shareholder of the Fund, you incur two types of costs: (1) transaction costs, which may include sales charges (loads) on purchase payments or contingent deferred sales charges on redemptions, if any; and (2) ongoing costs, including management fees, distribution and/or service (12b-1) fees, and other Fund expenses. This example is intended to help you understand your ongoing costs (in dollars) of investing in the Fund and to compare these costs with ongoing costs of investing in other mutual funds. The example is based on an investment of $1,000 invested at the beginning of the period and held for the entire period June 1, 2023 through November 30, 2023.
Actual expenses
The table below provides information about actual account values and actual expenses. You may use the information in this table, together with the amount you invested, to estimate the expenses that you paid over the period. Simply divide your account value by $1,000 (for example, an $8,600 account value divided by $1,000 = 8.6), then multiply the result by the number in the table under the heading entitled “Actual Expenses Paid During Period” to estimate the expenses you paid on your account during this period.
Hypothetical example for comparison purposes
The table below also provides information about hypothetical account values and hypothetical expenses based on the Fund’s actual expense ratio and an assumed rate of return of 5% per year before expenses, which is not the Fund’s actual return.
The hypothetical account values and expenses may not be used to estimate the actual ending account balance or expenses you paid for the period. You may use this information to compare the ongoing costs of investing in the Fund and other funds. To do so, compare this 5% hypothetical example with the 5% hypothetical examples that appear in the shareholder reports of the other funds.
Please note that the expenses shown in the table are meant to highlight your ongoing costs only and do not reflect any transaction costs, such as sales charges (loads) on purchase payments or contingent deferred sales charges on redemptions, if any. Therefore, the hypothetical information is useful in comparing ongoing costs only, and will not help you determine the relative total costs of owning different funds. In addition, if these transaction costs were included, your costs would have been higher.
| | | | | | | | | | | | | | | | | | | | | | | | |
| | | | | | ACTUAL | | | HYPOTHETICAL
(5% annual return before
expenses) | | | | |
| | | Beginning
Account Value
(06/1/2023) | | | Ending
Account Value
(11/30/2023)¹ | | | Expenses
Paid During
Period2 | | | Ending
Account Value
(11/30/2023)¹ | | | Expenses
Paid During
Period2 | | | Annualized
Expense
Ratio* | |
| CLASS A | | $ | 1,000.00 | | | $ | 1,219.40 | | | $ | 25.09 | | | $ | 1,002.30 | | | $ | 22.64 | | | | 4.51 | % |
| CLASS C | | | 1,000.00 | | | | 1,216.10 | | | | 29.22 | | | | 998.60 | | | | 26.35 | | | | 5.26 | |
| CLASS R | | | 1,000.00 | | | | 1,219.30 | | | | 26.48 | | | | 1,001.10 | | | | 23.88 | | | | 4.76 | |
| CLASS Y | | | 1,000.00 | | | | 1,220.30 | | | | 23.71 | | | | 1,003.60 | | | | 21.40 | | | | 4.26 | |
| CLASS R5 | | | 1,000.00 | | | | 1,222.40 | | | | 23.45 | | | | 1,003.80 | | | | 21.15 | | | | 4.21 | |
| CLASS R6 | | | 1,000.00 | | | | 1,221.40 | | | | 23.33 | | | | 1,003.90 | | | | 21.05 | | | | 4.19 | |
| * | For the 6-month period ended November 30, 2023 the Fund’s deferred tax liability decreased resulting in a deferred tax benefit for the period. This benefit was excluded from this example. |
| 1. | The actual ending account value is based on the actual total return of the Fund for the period June 1, 2023 through November 30, 2023, after actual expenses and will differ from the hypothetical ending account value which is based on the Fund’s expense ratio and a hypothetical annual return of 5% before expenses. |
| 2. | Expenses are equal to the Fund’s annualized expense ratio as indicated above multiplied by the average account value over the period, multiplied by 183/365 to reflect the most recent fiscal half year. |
25 Invesco SteelPath MLP Alpha Fund
Approval of Investment Advisory and Sub-Advisory Contracts
At meetings held on June 13, 2023, the Board of Trustees (the Board or the Trustees) of AIM Investment Funds (Invesco Investment Funds) as a whole, and the independent Trustees, who comprise over 75% of the Board, voting separately, approved the continuance of the Invesco SteelPath MLP Alpha Fund’s (the Fund) Master Investment Advisory Agreement with Invesco Advisers, Inc. (Invesco Advisers and the investment advisory agreement) and the Master Intergroup Sub-Advisory Contract for Mutual Funds with Invesco Asset Management Deutschland GmbH, Invesco Asset Management Limited, Invesco Asset Management (Japan) Limited, Invesco Hong Kong Limited, Invesco Senior Secured Management, Inc. and Invesco Canada Ltd. and separate sub-advisory contracts with Invesco Capital Management LLC, Invesco Asset Management (India) Private Limited and OppenheimerFunds, Inc. (collectively, the Affiliated sub-Advisers and the sub-advisory contracts) for another year, effective July 1, 2023. After evaluating the factors discussed below, among others, the Board approved the renewal of the Fund’s investment advisory agreement and the sub-advisory contracts and determined that the compensation payable thereunder by the Fund to Invesco Advisers and by Invesco Advisers to the Affiliated Sub-Advisers is fair and reasonable.
The Board’s Evaluation Process
The Board has established an Investments Committee, which in turn has established Sub-Committees, that meet throughout the year to review the performance of funds advised by Invesco Advisers (the Invesco Funds). The Sub-Committees meet regularly with portfolio managers for their assigned Invesco Funds and other members of management to review information about investment performance and portfolio attributes of these funds. The Board has established additional standing and ad hoc committees that meet regularly throughout the year to review matters within their purview, including a working group focused on opportunities to make ongoing and continuous improvements to the annual review process for the Invesco Funds’ investment advisory and sub-advisory contracts. The Board took into account evaluations and reports that it received from its committees and sub-committees, as well as the information provided to the Board and its committees and sub-committees throughout the year, in considering whether to approve each Invesco Fund’s investment advisory agreement and sub-advisory contracts.
As part of the contract renewal process, the Board reviews and considers information provided in response to requests for information submitted to management by the independent Trustees with assistance from legal counsel to the independent Trustees and the Senior Officer, an officer of the Invesco Funds who reports directly to the independent Trustees. The Board receives comparative investment performance and fee and expense data regarding the Invesco Funds prepared by Broadridge Financial Solutions, Inc. (Broadridge), an independent mutual fund data provider, as well as information on the composition of the peer groups provided by Broadridge and its methodology for determining peer groups. The Board also receives an independent written evaluation from the Senior Officer. The Senior Officer’s evaluation is prepared as part of his responsibility to manage the process by which the Invesco Funds’ proposed management fees are negotiated during the annual contract renewal process to ensure they are negotiated in a manner that is at arms’ length and reasonable in accordance with certain negotiated regulatory requirements. In addition to meetings with Invesco Advisers and fund counsel throughout the year and as part of meetings convened on May 2, 2023 and June 13, 2023, the independent Trustees also discussed the continuance of the investment advisory agreement and sub-advisory contracts in separate sessions with the Senior Officer and with independent legal counsel. Also, as part of the contract renewal process, the independent Trustees reviewed and considered information provided in response to follow-up requests for information submitted by the independent Trustees to management. The independent Trustees met and discussed those follow-up responses with legal counsel to the independent Trustees and the Senior Officer.
The discussion below is a summary of the Senior Officer’s independent written evaluation with respect to the Fund’s investment advisory agreement and sub-advisory contracts, as well as a discussion of the material factors and related conclusions that formed the basis for the Board’s approval of the Fund’s investment advisory agreement and sub-advisory contracts. The Trustees’ review and conclusions are based on the comprehensive consideration of all information presented to them during the course of the year and in prior years and are not the result of any single determinative factor. Moreover, one Trustee may have
weighed a particular piece of information or factor differently than another Trustee. The information received and considered by the Board was current as of various dates prior to the Board’s approval on June 13, 2023.
Factors and Conclusions and Summary of Independent Written Fee Evaluation
| A. | Nature, Extent and Quality of Services Provided by Invesco Advisers and the Affiliated Sub-Advisers |
The Board reviewed the nature, extent and quality of the advisory services provided to the Fund by Invesco Advisers under the Fund’s investment advisory agreement, and the credentials and experience of the officers and employees of Invesco Advisers who provide these services, including the Fund’s portfolio manager(s). The Board considered recent senior management changes at Invesco and Invesco Advisers, including the appointment of new Co-Heads of Investments, that had been presented to and discussed with the Board. The Board’s review included consideration of Invesco Advisers’ investment process and oversight, credit analysis and research capabilities. The Board considered information regarding Invesco Advisers’ programs for and resources devoted to risk management, including management of investment, enterprise, operational, liquidity, derivatives, valuation and compliance risks, and technology used to manage such risks. The Board noted an accounting matter that required that certain historical financial statements for the Fund be restated in 2020 and that certain shareholders be reimbursed for transactions made at incorrect net asset values, and considered the steps that Invesco Advisers took to remediate the matter, with such remediation steps concluding at the end of 2022. The Board received information regarding Invesco’s methodology for compensating its investment professionals and the incentives and accountability it creates, as well as how it impacts Invesco’s ability to attract and retain talent. The Board received a description of, and reports related to, Invesco Advisers’ global security program and business continuity plans and of its approach to data privacy and cybersecurity, including related testing. The Board also considered non-advisory services that Invesco Advisers and its affiliates provide to the Invesco Funds, such as various middle office and back office support functions, third party oversight, internal audit, valuation, portfolio trading and legal and compliance. The Board observed that Invesco Advisers’ systems preparedness and ongoing investment enabled Invesco Advisers to manage, operate and oversee
26 Invesco SteelPath MLP Alpha Fund
the Invesco Funds with minimal impact or disruption through challenging environments. The Board reviewed and considered the benefits to shareholders of investing in a Fund that is part of the family of funds under the umbrella of Invesco Ltd., Invesco Advisers’ parent company, and noted Invesco Ltd.’s depth and experience in running an investment management business, as well as its commitment of financial and other resources to such business. The Board concluded that the nature, extent and quality of the services provided to the Fund by Invesco Advisers are appropriate and satisfactory.
The Board reviewed the services that may be provided to the Fund by the Affiliated Sub-Advisers under the sub-advisory contracts and the credentials and experience of the officers and employees of the Affiliated Sub-Advisers who provide these services. The Board noted the Affiliated Sub-Advisers’ expertise with respect to certain asset classes and that the Affiliated Sub-Advisers have offices and personnel that are located in financial centers around the world. As a result, the Board noted that the Affiliated Sub-Advisers can provide research and investment analysis on the markets and economies of various countries and territories in which the Fund may invest, make recommendations regarding securities and assist with portfolio trading. The Board concluded that the sub-advisory contracts may benefit the Fund and its shareholders by permitting Invesco Advisers to use the resources and talents of the Affiliated Sub-Advisers in managing the Fund. The Board concluded that the nature, extent and quality of the services that may be provided to the Fund by the Affiliated Sub-Advisers are appropriate and satisfactory.
| B. | Fund Investment Performance |
The Board considered Fund investment performance as a relevant factor in considering whether to approve the investment advisory agreement. The Board did not view Fund investment performance as a relevant factor in considering whether to approve the sub-advisory contracts for the Fund, as no Affiliated Sub-Adviser currently manages assets of the Fund.
The Board compared the Fund’s investment performance over multiple time periods ending December 31, 2022 to the performance of funds in the Broadridge performance universe and against the Alerian MLP Infrastructure Index (Index). The Board noted that performance of Class A shares of the Fund was in the second quintile of its performance universe for the one and three year periods and the third quintile for the five year period (the first quintile being the best performing funds and the fifth quintile being the worst performing funds). The Board noted that performance of Class A shares of the Fund was below the performance of the Index for
the one and five year periods and above the performance of the Index for the three year period. The Board acknowledged limitations regarding the Broadridge data, in particular that the Lipper category includes funds taxed as traditional mutual funds as well as those taxed as C-corporations (such as the Fund) and discussed how such taxation status impacted relative Fund performance. The Board considered that the Fund was created in connection with Invesco Ltd.’s acquisition of OppenheimerFunds, Inc. and its subsidiaries (the “Transaction”) and that the Fund’s performance prior to the closing of the Transaction on May 24, 2019 is that of its predecessor fund. The Board recognized that the performance data reflects a snapshot in time as of a particular date and that selecting a different performance period could produce different results. The Board also reviewed more recent Fund performance as well as other performance metrics, which did not change its conclusions.
| C. | Advisory and Sub-Advisory Fees and Fund Expenses |
The Board compared the Fund’s contractual management fee rate to the contractual management fee rates of funds in the Fund’s Broadridge expense group. The Board noted that the contractual management fee rate for Class A shares of the Fund was above the median contractual management fee rate of funds in its expense group. The Board noted that the term “contractual management fee” for funds in the expense group may include both advisory and certain non-portfolio management administrative services fees, but that Broadridge is not able to provide information on a fund-by-fund basis as to what is included. The Board also reviewed the methodology used by Broadridge in calculating expense group information, which includes using each fund’s contractual management fee schedule (including any applicable breakpoints) as reported in the most recent prospectus or statement of additional information for each fund in the expense group. The Board also considered comparative information regarding the Fund’s total expense ratio and its various components.
The Board noted that Invesco Advisers has contractually agreed to waive fees and/or limit expenses of the Fund for the term disclosed in the Fund’s registration statement in an amount necessary to limit total annual operating expenses to a specified percentage of average daily net assets for each class of the Fund.
The Board noted that Invesco Advisers and the Affiliated Sub-Advisers do not manage other similarly managed mutual funds or client accounts.
The Board also considered the services that may be provided by the Affiliated Sub-Advisers pursuant to the sub-advisory contracts, as well as the fees payable by
Invesco Advisers to the Affiliated Sub-Advisers pursuant to the sub-advisory contracts.
| D. | Economies of Scale and Breakpoints |
The Board considered the extent to which there may be economies of scale in the provision of advisory services to the Fund and the Invesco Funds, and the extent to which such economies of scale are shared with the Fund and the Invesco Funds. The Board acknowledged the difficulty in calculating and measuring economies of scale at the individual fund level; noting that only indicative and estimated measures are available at the individual fund level and that such measures are subject to uncertainty. The Board considered that the Fund may benefit from economies of scale through contractual breakpoints in the Fund’s advisory fee schedule, which generally operate to reduce the Fund’s expense ratio as it grows in size. The Board noted that the Fund also shares in economies of scale through Invesco Advisers’ ability to negotiate lower fee arrangements with third party service providers. The Board noted that the Fund may also benefit from economies of scale through initial fee setting, fee waivers and expense reimbursements, as well as Invesco Advisers’ investment in its business, including investments in business infrastructure, technology and cybersecurity.
| E. | Profitability and Financial Resources |
The Board reviewed information from Invesco Advisers concerning the costs of the advisory and other services that Invesco Advisers and its affiliates provide to the Fund and the Invesco Funds and the profitability of Invesco Advisers and its affiliates in providing these services in the aggregate and on an individual fund-by-fund basis. The Board considered the methodology used for calculating profitability and the periodic review and enhancement of such methodology. The Board noted that Invesco Advisers continues to operate at a net profit from services Invesco Advisers and its affiliates provide to the Invesco Funds in the aggregate and to most Invesco Funds individually. The Board considered that profits to Invesco Advisers can vary significantly depending on the particular Invesco Fund, with some Invesco Funds showing indicative losses to Invesco Advisers and others showing indicative profits at healthy levels, and that Invesco Advisers’ support for and commitment to an Invesco Fund are not, however, solely dependent on the profits realized as to that Fund. The Board did not deem the level of profits realized by Invesco Advisers and its affiliates from providing such services to be excessive, given the nature, extent and quality of the services provided. The Board noted that Invesco Advisers provided information demonstrating that Invesco Advisers is financially sound and has the
27 Invesco SteelPath MLP Alpha Fund
resources necessary to perform its obligations under the investment advisory agreement, and provided representations indicating that the Affiliated Sub-Advisers are financially sound and have the resources necessary to perform their obligations under the sub-advisory contracts. The Board noted the cyclical and competitive nature of the global asset management industry.
| F. | Collateral Benefits to Invesco Advisers and its Affiliates |
The Board considered various other benefits received by Invesco Advisers and its affiliates from the relationship with the Fund, including the fees received for providing administrative, transfer agency and distribution services to the Fund. The Board received comparative information regarding fees charged for these services, including information provided by Broadridge and other independent sources. The Board reviewed the performance of Invesco Advisers and its affiliates in providing these services and the organizational structure employed to provide these services. The Board noted that these services are provided to the Fund pursuant to written contracts that are reviewed and subject to approval on an annual basis by the Board based on its determination that the services are required for the operation of the Fund.
The Board considered the benefits realized by Invesco Advisers and the Affiliated Sub-Advisers as a result of portfolio brokerage transactions executed through “soft dollar” arrangements. The Board noted that soft dollar arrangements may result in the Fund bearing costs to purchase research that may be used by Invesco Advisers or the Affiliated Sub-Advisers with other clients and may reduce Invesco Advisers’ or the Affiliated Sub-Advisers’ expenses. The Board also considered that it receives from Invesco Advisers periodic reports that include a representation to the effect that these arrangements are consistent with regulatory requirements. The Board did not deem the soft dollar arrangements to be inappropriate.
The Board considered that the Fund’s uninvested cash and cash collateral from any securities lending arrangements may be invested in registered money market funds or, with regard to securities lending cash collateral, unregistered funds that comply with Rule 2a-7 (collectively referred to as “affiliated money market funds”) advised by Invesco Advisers. The Board considered information regarding the returns of the affiliated money market funds relative to comparable overnight investments, as well as the fees paid by the affiliated money market funds to Invesco Advisers and its affiliates. In this regard, the Board noted that Invesco Advisers receives advisory fees from these affiliated money market funds
attributable to the Fund’s investments. The Board also noted that Invesco Advisers has contractually agreed to waive through varying periods an amount equal to 100% of the net advisory fee Invesco Advisers receives from the affiliated money market funds with respect to the Fund’s investment in the affiliated money market funds of uninvested cash, but not cash collateral. The Board concluded that the advisory fees payable to Invesco Advisers from the Fund’s investment of cash collateral from any securities lending arrangements in the affiliated money market funds are for services that are not duplicative of services provided by Invesco Advisers to the Fund.
The Board considered that Invesco Advisers may serve as the Fund’s affiliated securities lending agent and evaluated the benefits realized by Invesco Advisers when serving in such role, including the compensation received. The Board considered Invesco Advisers’ securities lending platform and corporate governance structure for securities lending, including Invesco Advisers’ Securities Lending Governance Committee and its related responsibilities. The Board noted that to the extent the Fund utilizes Invesco Advisers as an affiliated securities lending agent, the Fund conducts its securities lending in accordance with, and in reliance upon, no-action letters issued by the SEC staff that provide guidance on how an affiliate may act as a direct agent lender and receive compensation for those services without obtaining exemptive relief. The Board considered information provided by Invesco Advisers related to the performance of Invesco Advisers as securities lending agent, including a summary of the securities lending services provided to the Fund by Invesco Advisers and the compensation paid to Invesco Advisers for such services, as well as any revenues generated for the Fund in connection with such securities lending activity and the allocation of such revenue between the Fund and Invesco Advisers.
The Board also received information about commissions that an affiliated broker may receive for executing certain trades for the Fund. Invesco Advisers and the Affiliated Sub-Advisers advised the Board of the benefits to the Fund of executing trades through the affiliated broker and that such trades were executed in compliance with rules under the federal securities laws and consistent with best execution obligations.
28 Invesco SteelPath MLP Alpha Fund
Trustees and Officers
The address of each trustee and officer is AIM Investment Funds (Invesco Investment Funds) (the “Trust”), 11 Greenway Plaza, Houston, Texas 77046-1173. The trustees serve for the life of the Trust, subject to their earlier death, incapacitation, resignation, retirement or removal as more specifically provided in the Trust’s organizational documents. Each officer serves for a one year term or until their successors are elected and qualified. Column two below includes length of time served with predecessor entities, if any.
| | | | | | | | |
Name, Year of Birth and
Position(s)
Held with the Trust | | Trustee
and/or
Officer
Since | | Principal Occupation(s)
During Past 5 Years | | Number of
Funds in
Fund Complex
Overseen by
Trustee | | Other
Directorship(s)
Held by Trustee
During Past 5
Years |
| Interested Trustee | | | | | | | | |
| Martin L. Flanagan1 — 1960 Trustee and Vice Chair | | 2007 | | Chairman Emeritus, Invesco Ltd.; Trustee and Vice Chair, The Invesco Funds;; and Member of Executive Board, SMU Cox School of Business Formerly: Executive Director, Chief Executive Officer and President, Invesco Ltd. (ultimate parent of Invesco and a global investment management firm); Vice Chair, Investment Company Institute; Advisor to the Board, Invesco Advisers, Inc. (formerly known as Invesco Institutional (N.A.), Inc.); Chairman and Chief Executive Officer, Invesco Advisers, Inc. (registered investment adviser); Director, Chairman, Chief Executive Officer and President, Invesco Holding Company (US), Inc. (formerly IVZ Inc.) (holding company), Invesco Group Services, Inc. (service provider) and Invesco North American Holdings, Inc. (holding company); Director, Chief Executive Officer and President, Invesco Holding Company Limited (parent of Invesco and a global investment management firm); Director, Invesco Ltd.; Chairman, Investment Company Institute and President, Co-Chief Executive Officer, Co-President, Chief Operating Officer and Chief Financial Officer, Franklin Resources, Inc. (global investment management organization) | | 169 | | None |
| 1 | Mr. Flanagan is considered an interested person (within the meaning of Section 2(a)(19) of the 1940 Act) of the Trust because he is an officer of the Adviser to the Trust, and an officer and a director of Invesco Ltd., ultimate parent of the Adviser. |
T-1 Invesco SteelPath MLP Alpha Fund
Trustees and Officers—(continued)
| | | | | | | | |
Name, Year of Birth and
Position(s)
Held with the Trust | | Trustee
and/or
Officer
Since | | Principal Occupation(s)
During Past 5 Years | | Number of
Funds in
Fund Complex
Overseen by
Trustee | | Other
Directorship(s)
Held by Trustee
During Past 5
Years |
| Independent Trustees | | | | | | | | |
Beth Ann Brown – 1968 Trustee (2019) and Chair (August 2022) | | 2019 | | Independent Consultant Formerly: Head of Intermediary Distribution, Managing Director, Strategic Relations, Managing Director, Head of National Accounts, Senior Vice President, National Account Manager and Senior Vice President, Key Account Manager, Columbia Management Investment Advisers LLC; Vice President, Key Account Manager, Liberty Funds Distributor, Inc.; and Trustee of certain Oppenheimer Funds | | 169 | | Director, Board of Directors of Caron Engineering Inc.; Advisor, Board of Advisors of Caron Engineering Inc.; President and Director, Acton Shapleigh Youth Conservation Corps (non-profit); Formerly: President and Director of Grahamtastic Connection (non-profit) |
Cynthia Hostetler – 1962 Trustee | | 2017 | | Non-Executive Director and Trustee of a number of public and private business corporations Formerly: Director, Aberdeen Investment Funds (4 portfolios); Director, Artio Global Investment LLC (mutual fund complex); Director, Edgen Group, Inc. (specialized energy and infrastructure products distributor); Director, Genesee & Wyoming, Inc. (railroads): Head of Investment Funds and Private Equity, Overseas Private Investment Corporation; President, First Manhattan Bancorporation, Inc.; and Attorney, Simpson Thacher & Bartlett LLP | | 169 | | Resideo Technologies (smart home technology); Vulcan Materials Company (construction materials company); Trilinc Global Impact Fund; Textainer Group Holdings, (shipping container leasing company); Investment Company Institute (professional organization); and Independent Directors Council (professional organization) |
Eli Jones – 1961 Trustee | | 2016 | | Professor and Dean Emeritus, Mays Business School—Texas A&M University Formerly: Dean of Mays Business School—Texas A&M University; Professor and Dean, Walton College of Business, University of Arkansas and E.J. Ourso College of Business, Louisiana State University; and Director, Arvest Bank | | 169 | | Insperity, Inc. (formerly known as Administaff) (human resources provider); Board Member of the regional board, First Financial Bank Texas; and Board Member, First Financial Bankshares, Inc. Texas |
Elizabeth Krentzman – 1959 Trustee | | 2019 | | Formerly: Principal and Chief Regulatory Advisor for Asset Management Services and U.S. Mutual Fund Leader of Deloitte & Touche LLP; General Counsel of the Investment Company Institute (trade association); National Director of the Investment Management Regulatory Consulting Practice, Principal, Director and Senior Manager of Deloitte & Touche LLP; Assistant Director of the Division of Investment Management—Office of Disclosure and Investment Adviser Regulation of the U.S. Securities and Exchange Commission and various positions with the Division of Investment Management – Office of Regulatory Policy of the U.S. Securities and Exchange Commission; Associate at Ropes & Gray LLP; and Trustee of certain Oppenheimer Funds | | 169 | | Formerly: Member of the Cartica Funds Board of Directors (private investment funds); Trustee of the University of Florida National Board Foundation; and Member of the University of Florida Law Center Association, Inc. Board of Trustees, Audit Committee and Membership Committee |
Anthony J. LaCava, Jr. – 1956 Trustee | | 2019 | | Formerly: Director and Member of the Audit Committee, Blue Hills Bank (publicly traded financial institution) and Managing Partner, KPMG LLP | | 169 | | Blue Hills Bank; Member and Chairman, Bentley University, Business School Advisory Council; and Nominating Committee, KPMG LLP |
Prema Mathai-Davis – 1950 Trustee | | 2001 | | Retired Formerly: Co-Founder & Partner of Quantalytics Research, LLC, (a FinTech Investment Research Platform for the Self-Directed Investor); Trustee of YWCA Retirement Fund; CEO of YWCA of the USA; Board member of the NY Metropolitan Transportation Authority; Commissioner of the NYC Department of Aging; and Board member of Johns Hopkins Bioethics Institute | | 169 | | Member of Board of Positive Planet US (non-profit) and HealthCare Chaplaincy Network (non-profit) |
T-2 Invesco SteelPath MLP Alpha Fund
Trustees and Officers—(continued)
| | | | | | | | |
Name, Year of Birth and
Position(s)
Held with the Trust | | Trustee
and/or
Officer
Since | | Principal Occupation(s)
During Past 5 Years | | Number of
Funds in
Fund Complex
Overseen by
Trustee | | Other
Directorship(s)
Held by Trustee
During Past 5
Years |
| Independent Trustees—(continued) | | | | |
Joel W. Motley – 1952 Trustee | | 2019 | | Director of Office of Finance, Federal Home Loan Bank System; Managing Director of Carmona Motley Inc. (privately held financial advisor); Member of the Council on Foreign Relations and its Finance and Budget Committee; Chairman Emeritus of Board of Human Rights Watch and Member of its Investment Committee; Member of Investment Committee and Board of Historic Hudson Valley (non-profit cultural organization); Member of the Board, Blue Ocean Acquisition Corp; and Member of the Vestry and the Investment Committee of Trinity Church Wall Street Formerly: Managing Director of Public Capital Advisors, LLC (privately held financial advisor); Managing Director of Carmona Motley Hoffman, Inc. (privately held financial advisor); Trustee of certain Oppenheimer Funds; and Director of Columbia Equity Financial Corp. (privately held financial advisor) | | 169 | | Member of Board of Trust for Mutual Understanding (non-profit promoting the arts and environment); Member of Board of Greenwall Foundation (bioethics research foundation) and its Investment Committee; Member of Board of Friends of the LRC (non-profit legal advocacy); and Board Member and Investment Committee Member of Pulitzer Center for Crisis Reporting (non-profit journalism) |
Teresa M. Ressel – 1962 Trustee | | 2017 | | Non-executive director and trustee of a number of public and private business corporations Formerly: Chief Executive Officer, UBS Securities LLC (investment banking); Chief Operating Officer, UBS AG Americas (investment banking); Sr. Management Team Olayan America, The Olayan Group (international investor/commercial/industrial); and Assistant Secretary for Management & Budget and Designated Chief Financial Officer, U.S. Department of Treasury | | 169 | | None |
Robert C. Troccoli – 1949 Trustee | | 2016 | | Retired Formerly: Adjunct Professor, University of Denver – Daniels College of Business; and Managing Partner, KPMG LLP | | 169 | | None |
Daniel S. Vandivort – 1954 Trustee | | 2019 | | President, Flyway Advisory Services LLC (consulting and property management) Formerly: President and Chief Investment Officer, previously Head of Fixed Income, Weiss Peck and Greer/Robeco Investment Management; Trustee and Chair, Weiss Peck and Greer Funds Board; and various capacities at CS First Boston including Head of Fixed Income at First Boston Asset Management. | | 169 | | Formerly: Trustee and Governance Chair, Oppenheimer Funds; Treasurer, Chairman of the Audit and Finance Committee, Huntington Disease Foundation of America. |
T-3 Invesco SteelPath MLP Alpha Fund
Trustees and Officers—(continued)
| | | | | | | | |
Name, Year of Birth and
Position(s)
Held with the Trust | | Trustee
and/or Officer Since | | Principal Occupation(s)
During Past 5 Years | | Number of
Funds in
Fund Complex
Overseen by
Trustee | | Other
Directorship(s)
Held by Trustee
During Past 5
Years |
| Officers | | | | | | | | |
Glenn Brightman – 1972 President and Principal Executive Officer | | 2023 | | Chief Operating Officer, Americas, Invesco Ltd.; President and Principal Executive Officer, The Invesco Funds. Formerly: Global Head of Finance, Invesco Ltd; Executive Vice President and Chief Financial Officer, Nuveen | | N/A | | N/A |
Melanie Ringold – 1975 Senior Vice President, Chief Legal Officer and Secretary | | 2023 | | Head of Legal of the Americas, Invesco Ltd.; Senior Vice President and Secretary, Invesco Advisers, Inc. (formerly known as Invesco Institutional (N.A.), Inc.) (registered investment adviser); Secretary, Invesco Distributors, Inc. (formerly known as Invesco AIM Distributors, Inc.); Secretary, Invesco Investment Services, Inc. (formerly known as Invesco AIM Investment Services, Inc.); Senior Vice President, Chief Legal Officer and Secretary, The Invesco Funds; Secretary, Invesco Investment Advisers LLC; Invesco Capital Markets, Inc.; Chief Legal Officer, Invesco Exchange-Traded Fund Trust, Invesco Exchange-Traded Fund Trust II, Invesco India Exchange-Traded Fund Trust, Invesco Actively Managed Exchange-Traded Fund Trust, Invesco Actively Managed Exchange-Traded Commodity Fund Trust and Invesco Exchange-Traded Self-Indexed Fund Trust; Secretary and Vice President, Harbourview Asset Management Corporation; Secretary and Senior Vice President, OppenheimerFunds, Inc. and Invesco Managed Accounts, LLC; Secretary and Senior Vice President, OFI SteelPath, Inc.; Secretary and Senior Vice President, Oppenheimer Acquisition Corp.; Secretary, SteelPath Funds Remediation LLC; and Secretary and Senior Vice President, Trinity Investment Management Corporation Formerly: Assistant Secretary, Invesco Distributors, Inc., Invesco Advisers, Inc., Invesco Investment Services, Inc., Invesco Capital Markets, Inc., Invesco Capital Management LLC and Invesco Investment Advisers LLC; and Assistant Secretary and Investment Vice President, Invesco Funds | | N/A | | N/A |
Andrew R. Schlossberg – 1974 Senior Vice President | | 2019 | | Chief Executive Officer, President and Executive Director, Invesco Ltd.; Senior Vice President, The Invesco Funds; and Trustee, Invesco Foundation, Inc. Formerly: Senior Vice President, Invesco Group Services, Inc. Director and Senior Vice President, Invesco Advisers, Inc. (formerly known as Invesco Institutional (N.A.), Inc.) (registered investment adviser); Director and Chairman, Invesco Investment Services, Inc. (formerly known as Invesco AIM Investment Services, Inc.) (registered transfer agent); Head of the Americas and Senior Managing Director, Invesco Ltd.; Director, Invesco Investment Advisers LLC (formerly known as Van Kampen Asset Management); Director, President and Chairman, Invesco Insurance Agency, Inc.; Director, Invesco UK Limited; Director and Chief Executive, Invesco Asset Management Limited and Invesco Fund Managers Limited; Assistant Vice President, The Invesco Funds; Senior Vice President, Invesco Advisers, Inc. (formerly known as Invesco Institutional (N.A.), Inc.) (registered investment adviser); Director and Chief Executive, Invesco Administration Services Limited and Invesco Global Investment Funds Limited; Director, Invesco Distributors, Inc.; Head of EMEA, Invesco Ltd.; President, Invesco Actively Managed Exchange-Traded Commodity Fund Trust, Invesco Actively Managed Exchange-Traded Fund Trust, Invesco Exchange-Traded Fund Trust, Invesco Exchange-Traded Fund Trust II and Invesco India Exchange-Traded Fund Trust; and Managing Director and Principal Executive Officer, Invesco Capital Management LLC | | N/A | | N/A |
T-4 Invesco SteelPath MLP Alpha Fund
Trustees and Officers—(continued)
| | | | | | | | |
Name, Year of Birth and
Position(s)
Held with the Trust | | Trustee
and/or Officer Since | | Principal Occupation(s)
During Past 5 Years | | Number of
Funds in
Fund Complex
Overseen by
Trustee | | Other
Directorship(s)
Held by Trustee
During Past 5
Years |
| Officers—(continued) | | | | | | | | |
John M. Zerr – 1962 Senior Vice President | | 2006 | | Chief Operating Officer of the Americas; Senior Vice President, Invesco Advisers, Inc. (formerly known as Invesco Institutional (N.A.), Inc.) (registered investment adviser); Senior Vice President, Invesco Distributors, Inc. (formerly known as Invesco AIM Distributors, Inc.); Director and Vice President, Invesco Investment Services, Inc. (formerly known as Invesco AIM Investment Services, Inc.) Senior Vice President, The Invesco Funds; Managing Director, Invesco Capital Management LLC; Senior Vice President, Invesco Capital Markets, Inc. (formerly known as Van Kampen Funds Inc.); Manager, Invesco Specialized Products, LLC; Member, Invesco Canada Funds Advisory Board; Director, President and Chief Executive Officer, Invesco Corporate Class Inc. (corporate mutual fund company); Director, Chairman, President and Chief Executive Officer, Invesco Canada Ltd. (formerly known as Invesco Trimark Ltd./Invesco Trimark Ltèe) (registered investment adviser and registered transfer agent); President, Invesco, Inc.; President, Invesco Global Direct Real Estate Feeder GP Ltd.; President, Invesco IP Holdings (Canada) Ltd; President, Invesco Global Direct Real Estate GP Ltd.; President, Invesco Financial Services Ltd./Services Financiers Invesco Ltée; and Director and Chairman, Invesco Trust Company Formerly: Manager, Invesco Indexing LLC; Director, Invesco Investment Advisers LLC (formerly known as Van Kampen Asset Management); President, Trimark Investments Ltd/Services Financiers Invesco Ltee; Director and Senior Vice President, Invesco Insurance Agency, Inc.; Director and Senior Vice President, Invesco Management Group, Inc. (formerly known as Invesco AIM Management Group, Inc.); Secretary and General Counsel, Invesco Management Group, Inc. (formerly known as Invesco AIM Management Group, Inc.); Secretary, Invesco Investment Services, Inc. (formerly known as Invesco AIM Investment Services, Inc.); Chief Legal Officer and Secretary, The Invesco Funds; Secretary and General Counsel, Invesco Investment Advisers LLC (formerly known as Van Kampen Asset Management); Secretary and General Counsel, Invesco Capital Markets, Inc. (formerly known as Van Kampen Funds Inc.); Chief Legal Officer, Invesco Exchange-Traded Fund Trust, Invesco Exchange-Traded Fund Trust II, Invesco India Exchange-Traded Fund Trust, Invesco Actively Managed Exchange-Traded Fund Trust, Invesco Actively Managed Exchange-Traded Commodity Fund Trust and Invesco Exchange-Traded Self-Indexed Fund Trust; Secretary, Invesco Indexing LLC; Director, Secretary, General Counsel and Senior Vice President, Van Kampen Exchange Corp.; Director, Vice President and Secretary, IVZ Distributors, Inc. (formerly known as INVESCO Distributors, Inc.); Director and Vice President, INVESCO Funds Group, Inc.; Director and Vice President, Van Kampen Advisors Inc.; Director, Vice President, Secretary and General Counsel, Van Kampen Investor Services Inc.; Director and Secretary, Invesco Distributors, Inc. (formerly known as Invesco AIM Distributors, Inc.); Director, Senior Vice President, General Counsel and Secretary, Invesco AIM Advisers, Inc. and Van Kampen Investments Inc.; Director, Vice President and Secretary, Fund Management Company; Director, Senior Vice President, Secretary, General Counsel and Vice President, Invesco AIM Capital Management, Inc.; and Chief Operating Officer and General Counsel, Liberty Ridge Capital, Inc. (an investment adviser) | | N/A | | N/A |
T-5 Invesco SteelPath MLP Alpha Fund
Trustees and Officers—(continued)
| | | | | | | | |
Name, Year of Birth and
Position(s)
Held with the Trust | | Trustee
and/or Officer Since | | Principal Occupation(s)
During Past 5 Years | | Number of
Funds in
Fund Complex
Overseen by
Trustee | | Other
Directorship(s)
Held by Trustee
During Past 5
Years |
| Officers—(continued) | | | | | | | | |
Tony Wong – 1973 Senior Vice President | | 2023 | | Senior Managing Director, Invesco Ltd.; Director, Chairman, Chief Executive Officer and President, Invesco Advisers, Inc.; Director and Chairman, Invesco Private Capital, Inc., INVESCO Private Capital Investments, Inc. and INVESCO Realty, Inc.; Director, Invesco Senior Secured Management, Inc.; President, Invesco Managed Accounts, LLC and SNW Asset Management Corporation; and Senior Vice President, The Invesco Funds Formerly: Assistant Vice President, The Invesco Funds; and Vice President, Invesco Advisers, Inc. | | N/A | | N/A |
Stephanie C. Butcher – 1971 Senior Vice President | | 2023 | | Senior Managing Director, Invesco Ltd.; Senior Vice President, The Invesco Funds; Director and Chief Executive Officer, Invesco Asset Management Limited | | N/A | | N/A |
Adrien Deberghes – 1967 Principal Financial Officer, Treasurer and Senior Vice President | | 2020 | | Head of the Fund Office of the CFO and Fund Administration; Vice President, Invesco Advisers, Inc.; Principal Financial Officer, Treasurer and Senior Vice President, The Invesco Funds; and Vice President, Invesco Exchange-Traded Fund Trust, Invesco Exchange-Traded Fund Trust II, Invesco India Exchange-Traded Fund Trust, Invesco Actively Managed Exchange-Traded Fund Trust, Invesco Actively Managed Exchange-Traded Commodity Fund Trust and Invesco Exchange-Traded Self-Indexed Fund Trust Formerly: Vice President, The Invesco Funds; Senior Vice President and Treasurer, Fidelity Investments | | N/A | | N/A |
Crissie M. Wisdom – 1969 Anti-Money Laundering Compliance Officer | | 2013 | | Anti-Money Laundering and OFAC Compliance Officer for Invesco U.S. entities including: Invesco Advisers, Inc. and its affiliates, Invesco Capital Markets, Inc., Invesco Distributors, Inc., Invesco Investment Services, Inc., The Invesco Funds, Invesco Capital Management, LLC, Invesco Trust Company; and Fraud Prevention Manager for Invesco Investment Services, Inc. | | N/A | | N/A |
Todd F. Kuehl – 1969 Chief Compliance Officer and Senior Vice President | | 2020 | | Chief Compliance Officer, Invesco Advisers, Inc. (registered investment adviser); and Chief Compliance Officer and Senior Vice President, The Invesco Funds Formerly: Managing Director and Chief Compliance Officer, Legg Mason (Mutual Funds); Chief Compliance Officer, Legg Mason Private Portfolio Group (registered investment adviser) | | N/A | | N/A |
James Bordewick, Jr. – 1959 Senior Vice President and Senior Officer | | 2022 | | Senior Vice President and Senior Officer, The Invesco Funds Formerly: Chief Legal Officer, KingsCrowd, Inc. (research and analytical platform for investment in private capital markets); Chief Operating Officer and Head of Legal and Regulatory, Netcapital (private capital investment platform); Managing Director, General Counsel of asset management and Chief Compliance Officer for asset management and private banking, Bank of America Corporation; Chief Legal Officer, Columbia Funds and BofA Funds; Senior Vice President and Associate General Counsel, MFS Investment Management; Chief Legal Officer, MFS Funds; Associate, Ropes & Gray; and Associate, Gaston Snow & Ely Bartlett. | | N/A | | N/A |
The Statement of Additional Information of the Trust includes additional information about the Fund’s Trustees and is available upon request, without charge, by calling 1.800.959.4246. Please refer to the Fund’s Statement of Additional Information for information on the Fund’s sub-advisers.
Office of the Fund
11 Greenway Plaza
Houston, TX 77046-1173
Counsel to the Fund
Stradley Ronon Stevens & Young, LLP
2005 Market Street, Suite 2600
Philadelphia, PA 19103-7018
Investment Adviser
Invesco Advisers, Inc.
1331 Spring Street NW, Suite 2500
Atlanta, GA 30309
Counsel to the Independent Trustees
Sidley Austin
787 Seventh Avenue
New York, NY 10019
Distributor
Invesco Distributors, Inc.
11 Greenway Plaza
Houston, TX 77046-1173
Transfer Agent
Invesco Investment Services, Inc.
11 Greenway Plaza,
Houston, TX 77046-1173
Auditors
PricewaterhouseCoopers LLP
1000 Louisiana Street, Suite 5800
Houston, TX 77002-5021
Custodian
UMB Bank, n.a.
1010 Grand Boulevard
Kansas City, MO 64106
T-6 Invesco SteelPath MLP Alpha Fund

Go paperless with eDelivery
Visit invesco.com/edelivery to enjoy the convenience and security of anytime electronic access to your investment documents.
With eDelivery, you can elect to have any or all of the following materials delivered straight to your inbox to download, save and print from your own computer:
| • | | Fund reports and prospectuses |
Invesco mailing information
Send general correspondence to Invesco Investment Services, Inc., P.O. Box 219078, Kansas City, MO 64121-9078.
Important notice regarding delivery of security holder documents
To reduce Fund expenses, only one copy of most shareholder documents may be mailed to shareholders with multiple accounts at the same address (Householding). Mailing of your shareholder documents may be householded indefinitely unless you instruct us otherwise. If you do not want the mailing of these documents to be combined with those for other members of your household, please contact Invesco Investment Services, Inc. at 800 959 4246 or contact your financial institution. We will begin sending you individual copies for each account within 30 days after receiving your request.
Fund holdings and proxy voting information
The Fund provides a complete list of its portfolio holdings four times each year, at the end of each fiscal quarter. For the second and fourth quarters, the list appears, respectively, in the Fund’s semiannual and annual reports to shareholders. For the first and third quarters, the Fund files the list with the Securities and Exchange Commission (SEC) as an exhibit to its reports on Form N-PORT. The most recent list of portfolio holdings is available at invesco.com/completeqtrholdings. Shareholders can also look up the Fund’s Form N-PORT filings on the SEC website, sec.gov. The SEC file numbers for the Fund are shown below.
A description of the policies and procedures that the Fund uses to determine how to vote proxies relating to portfolio securities is available without charge, upon request, from our Client Services department at 800 959 4246, or at invesco.com/corporate/about-us/esg. The information is also available on the SEC website, sec.gov.
Information regarding how the Fund voted proxies related to its portfolio securities during the most recent 12-month period ended June 30 is available at invesco.com/proxysearch. This information is also available on the SEC website, sec.gov.
Invesco Advisers, Inc. is an investment adviser; it provides investment advisory services to individual and institutional clients and does not sell securities. Invesco Distributors, Inc. is the US distributor for Invesco Ltd.’s retail mutual funds, exchange-traded funds and institutional money market funds. Both are wholly owned, indirect subsidiaries of Invesco Ltd.

| | | | | | |
SEC file numbers: 811-05426 and 033-19338 | | Invesco Distributors, Inc. | | | O-SPMA-AR-1 | |

| | | | |
| Annual Report to Shareholders | | | November 30, 2023 | |
| | | | |
| Invesco SteelPath MLP Alpha Plus Fund | |
| |
| | | | |
| Nasdaq: | |
| A: MLPLX ∎ C: MLPMX ∎ R: SPMJX ∎ Y: MLPNX ∎ R5: SPMPX ∎ R6: OSPPX | |
Beginning in July 2024, amendments adopted by the Securities and Exchange Commission will substantially impact the design, content, and delivery of shareholder reports. These newly designed shareholder reports will highlight key fund information in a clear and concise format and must be mailed to each shareholder that has not elected to receive the reports electronically. Other information, including financial statements, will no longer be included in the shareholder report but will be available at invesco.com/reports, delivered upon request, and filed on a semi-annual basis on Form N-CSR.
If you would like to receive shareholder reports and other communications electronically instead of by mail, you may make that request by contacting your financial intermediary (such as a broker-dealer or bank) or, if you are a direct investor, by enrolling at invesco.com/ edelivery. If you do not make this request or enroll in e-delivery, you will receive future shareholder reports and other communications by mail.
Management’s Discussion of Fund Performance
| | | | |
| Performance summary | | | | |
For the fiscal year ended November 30, 2023, Class A shares of Invesco SteelPath MLP Alpha Plus Fund (the Fund), at net asset value (NAV), outperformed the S&P 500® Index. Your Fund’s long-term performance appears later in this report. | |
| | | | |
| |
| | | | |
| Fund vs. Indexes | |
| Total returns, 11/30/22 to 11/30/23, at net asset value (NAV). Performance shown does not include applicable contingent deferred sales charges (CDSC) or front-end sales charges, which would have reduced performance. | |
Class A Shares | | | 21.90 | % |
Class C Shares | | | 21.15 | |
Class R Shares | | | 21.87 | |
Class Y Shares | | | 22.00 | |
Class R5 Shares | | | 22.08 | |
Class R6 Shares | | | 22.50 | |
S&P 500 Index | | | 13.84 | |
Alerian MLP Index | | | 23.29 | |
| |
Source(s): RIMES Technologies Corp. | | | | |
Fund Performance Discussion
The Fund’s Class A shares (without sales charge) produced a total return of 21.90% during the fiscal year ended November 30, 2023. In comparison, master limited partnerships (MLPs), as measured by the Alerian MLP Index (AMZ), generated a total return of 23.29%. Please note that the returns for the Alerian MLP Index are calculated pre-tax, while the Fund’s returns are calculated post corporate tax. Over the same period, the S&P 500 Index produced a total return of 13.84%.
Over the fiscal year, global equity markets were choppy as market participants weighed continued inflation concerns, rising interest rates, worry over Chinese economic conditions, and the ongoing war between Russia and Ukraine. Commodity prices were mostly lower, but energy stocks generally traded higher, midstream equities included.
Midstream sector participants benefitted from record U.S. production of crude oil and natural gas during the period, with crude oil volumes in September 2023 finally exceeding the 2019 highs. Natural gas production volumes continued to benefit from robust exports driven by higher international pricing relative to domestic prices. Despite continued volume growth, midstream equities still traded at discounted valuations relative to history.
Over the fiscal year, we estimate a de minimis amount of equity supply entered the market through secondary offerings, initial public offerings, preferred offerings, or “at-the-market” programs in which primary units trade into the market anonymously throughout the normal trading day. Most midstream MLPs pay out substantial distributions to investors and, therefore, have historically raised external capital to fund larger growth projects or acquisitions. However, in recent years most sector participants have adjusted their business models to self-fund the equity portion of
their investment plans and repurchase discounted equity. Wells Fargo estimates that during the first three quarters of 2023 midstream companies collectively repurchased over $3 billion of stock.
Macro Review
West Texas Intermediate (WTI) crude oil prices ended the period at $75.96 per barrel, down 6% over the year, while global crude prices, as measured by Brent crude oil, traded 3% lower over the fiscal year. During the period, crude prices approached $100 per barrel before drifting lower. Henry Hub natural gas prices exited November 2023 at $2.80 per million British thermal units (mmbtu), down 60% over the fiscal year driven by softening export demand as Europe normalized after the initial escalation associated with the onset of the Russia-Ukraine war in the prior period. Regional price differentials improved in most basins, including the Permian basin where new takeaway capacity was added via pipeline expansions.
Mont Belvieu natural gas liquids (NGL) prices ended the fiscal year at $28.35 per barrel, a 14% decrease over the fiscal year. Pricing for NGL purity products was mixed, with isobutane ending the period 25% higher than the start of the fiscal year while ethane, butane, propane, and natural gasoline all traded lower. Frac spreads, a measure of natural gas processing economics, ended the period at $0.43 per gallon, more than doubling over the fiscal year. Generally, the greater the frac spread, the greater the incentive for producers to seek natural gas processing capacity.
The yield curve remained inverted, and generally steepened, over the period as short rates rose more than the yields on medium-dated maturities. The 10-year Treasury yield rose by 72 basis points to end the period at 4.33%. The MLP yield spread at fiscal year-end, as measured by the AMZ
and the 10-year Treasury bond, narrowed by 15 basis points to 3.27%.
Over the fiscal year, real estate investment trusts (REITs) and utilities, two competing yield-oriented equity asset classes, posted total returns of -2.78% (as measured by the Dow Jones Equity REIT Total Return Index) and -8.16% (as measured by the Dow Jones Utility Average Index), respectively, as compared to the AMZ’s +23.29% total return.
Subsector Reviews
Performance for all subsectors in the midstream, or energy infrastructure, asset class was positive over the fiscal year. On average, sector participants in the Compression subsector provided the strongest performance over the period supported by rising natural gas production volumes and increased utilization. The Diversified subsector also outperformed, also benefitting from increasing production volumes and generally improving demand.
The Natural Gas Pipeline subsector experienced the weakest, albeit positive, performance over the fiscal year driven by idiosyncratic factors from one subsector member. Similarly, average performance for the Propane subsector was weighed down by very weak performance of a single subsector participant.
Fund Review
Key contributors to the Invesco SteelPath MLP Alpha Plus Fund for the fiscal year ended November 30, 2023 were Magellan Midstream Partners, LP (NYSE: MMP) and Plains All American Pipeline, LP (NYSE: PAA).
MMP units outperformed over the period due the closing of the merger between MMP and ONEOK, Inc. (OKE) in September 2023. The consideration consisted of $25.00 in cash and 0.667 shares of OKE common stock for each outstanding MMP common unit, representing an implied value to each Magellan unitholder of $67.50 per unit, for a 22% premium, based on May 12, 2023 closing prices, the day before the merger announcement.
PAA outperformed over the period after reporting better than expected financial and operating results and as market participants appeared to place increased scarcity value in Plains’ crude oil-focused business. We believe that PAA maintains a leading position in crude oil gathering and transportation from the Permian Basin, a natural gas liquids focused position in Canada, strong distribution coverage, and an improved balance sheet.
Key detractors from the Invesco SteelPath MLP Alpha Plus Fund for the fiscal year ended November 30, 2023 were Holly Energy Partners (NYSE: HEP) and DT Midstream Inc. (NYSE: DTM).
HEP units underperformed over the period despite HEP and its sponsor, HF Sinclair
2 Invesco SteelPath MLP Alpha Plus Fund
Corporation (NYSE: DINO), agreeing to a merger where HEP would receive a combination of 0.315 DINO common shares plus $4/share in cash per each publicly held HEP common unit. HEP provides petroleum product and crude oil transportation, terminalling, storage and throughput services to the petroleum industry, including its sponsor, HF Sinclair Corporation. We sold our position in HEP before the end of the fiscal year.
DTM underperformed over the reporting period after announcing higher than expected capital expenditure guidance for 2023 and as investor sentiment was likely impacted by commodity price weakness over the period, particularly for natural gas. DTM owns, operates, and develops natural gas midstream interstate pipelines. The company focuses on intrastate and gathering lateral pipelines, storage, gathering systems and compression, treatment, and surface facilities located in the Appalachian Basin and the Haynesville shale.
Separately, the Fund also obtains leverage through borrowing, which had a positive impact on performance this fiscal year. Please note that to the extent the Fund obtains leverage through borrowing, there will be the potential for greater gains and the risk of magnified losses.
Outlook
Despite midstream equities outperforming the S&P 500 Index for several years, we believe the sector remains well positioned to continue providing investors with an attractive yield and total return experience over the coming years. In our view, valuations remain attractive and fundamentals support expectations for modest cash flow growth for most sector participants, particularly those with business segments focused on key producing basins and those that support activities to export crude oil, refined products, liquified petroleum gases (LPGs), and/or liquified natural gas (LNG).
All data, unless otherwise noted, sourced from Bloomberg LP as of November 30, 2023.
Portfolio managers:
Stuart Cartner
Brian Watson
The views and opinions expressed in management’s discussion of Fund performance are those of Invesco Advisers, Inc. and its affiliates. These views and opinions are subject to change at any time based on factors such as market and economic conditions. These views and opinions may not be relied upon as investment advice or recommendations, or as an offer for a particular security. The information is not a complete analysis of every aspect of any market, country, industry, security or the Fund.
Statements of fact are from sources considered reliable, but Invesco Advisers, Inc. makes no representation or warranty as to their completeness or accuracy. Although historical performance is no guarantee of future results, these insights may help you understand our investment management philosophy.
See important Fund and, if applicable, index disclosures later in this report.
3 Invesco SteelPath MLP Alpha Plus Fund
Your Fund’s Long-Term Performance
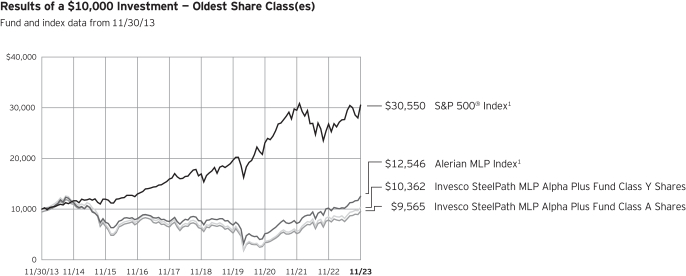
1 Source: RIMES Technologies Corp.
Past performance cannot guarantee future results.
The data shown in the chart include reinvested distributions, applicable sales charges and Fund expenses including
management fees. Index results include reinvested dividends, but they do not reflect sales charges. Performance of the peer group, if applicable, reflects fund expenses and management fees;
performance of a market index does not. Performance shown in the chart does not reflect deduction of taxes a shareholder would pay on Fund distributions or sale of Fund shares.
4 Invesco SteelPath MLP Alpha Plus Fund
| | | | |
Average Annual Total Returns | | | | |
As of 11/30/23, including maximum applicable sales charges | |
Class A Shares | | | | |
Inception (2/6/12) | | | 1.95 | % |
10 Years | | | -0.44 | |
5 Years | | | 7.98 | |
1 Year | | | 15.31 | |
Class C Shares | | | | |
Inception (5/22/12) | | | 2.30 | % |
10 Years | | | -0.46 | |
5 Years | | | 8.38 | |
1 Year | | | 20.15 | |
Class R Shares | | | | |
10 Years | | | -0.12 | % |
5 Years | | | 8.93 | |
1 Year | | | 21.59 | |
Class Y Shares | | | | |
Inception (12/30/11) | | | 2.79 | % |
10 Years | | | 0.36 | |
5 Years | | | 9.42 | |
1 Year | | | 22.00 | |
Class R5 Shares | | | | |
10 Years | | | 0.27 | % |
5 Years | | | 9.52 | |
1 Year | | | 22.08 | |
Class R6 Shares | | | | |
Inception (6/28/13) | | | 0.88 | % |
10 Years | | | 0.55 | |
5 Years | | | 9.66 | |
1 Year | | | 22.50 | |
Effective after the close of business on May 24, 2019, Class A, Class C, Class Y and Class I shares of the Oppenheimer SteelPath MLP Alpha Plus Fund (the predecessor fund), were reorganized into Class A, Class C, Class Y and Class R6 shares, respectively, of the Invesco Oppenheimer SteelPath MLP Alpha Plus Fund. The Fund was subsequently renamed the Invesco SteelPath MLP Alpha Plus Fund (the Fund). Returns shown above, for periods ending on or prior to May 24, 2019, for Class A, Class C, Class Y and Class R6 shares are those for Class A, Class C, Class Y and Class I shares of the predecessor fund. Share class returns will differ from the predecessor fund because of different expenses.
Class R and R5 shares incepted after the close of business on May 24, 2019. Performance shown on and prior to that date is that of the predecessor fund’s Class A shares at net asset value and includes the 12b-1 fees applicable to Class A shares.
The performance data quoted represent past performance and cannot guarantee future results; current performance may be lower or higher. Please visit invesco.com/performance for the most recent month-end performance.
Performance figures reflect reinvested distributions, changes in net asset value and the effect of the maximum sales charge unless otherwise stated. Performance figures do not reflect deduction of taxes a shareholder would pay on Fund distributions or sale of Fund shares. Investment return and principal value will fluctuate so that you may have a gain or loss when you sell shares.
Class A share performance reflects the maximum 5.50% sales charge, and Class C share performance reflects the applicable contingent deferred sales charge (CDSC) for the period involved. The CDSC on Class C shares is 1% for the first year after purchase. Class R, Class Y, Class R5 and Class R6 shares do not have a front-end sales charge or a CDSC; therefore, performance is at net asset value.
The performance of the Fund’s share classes will differ primarily due to different sales charge structures and class expenses.
Fund performance reflects any applicable fee waivers and/or expense reimbursements. Had the adviser not waived fees and/or reimbursed expenses currently or in the past, returns would have been lower.
See current prospectus for more information.
5 Invesco SteelPath MLP Alpha Plus Fund
Supplemental Information
Invesco SteelPath MLP Alpha Plus Fund’s investment objective is to seek total return.
| • | | Unless otherwise stated, information presented in this report is as of November 30, 2023, and is based on total net assets. |
| • | | Unless otherwise noted, all data is provided by Invesco. |
| • | | To access your Fund’s reports/prospectus, visit invesco.com/fundreports. |
About indexes used in this report
| • | | The S&P 500® Index is an unmanaged index considered representative of the US stock market. |
| • | | The Alerian MLP Index is designed to capture the performance of energy master limited partnerships (MLPs). |
| • | | The Fund is not managed to track the performance of any particular index, including the index(es) described here, and consequently, the performance of the Fund may deviate significantly from the performance of the index(es). |
| • | | A direct investment cannot be made in an index. Unless otherwise indicated, index results include reinvested dividends, and they do not reflect sales charges. Performance of the peer group, if applicable, reflects fund expenses; performance of a market index does not. |
This report must be accompanied or preceded by a currently effective Fund prospectus, which contains more complete information, including sales charges and expenses. Investors should read it carefully before investing.
NOT FDIC INSURED | MAY LOSE VALUE | NO BANK GUARANTEE
6 Invesco SteelPath MLP Alpha Plus Fund
Fund Information
| | | | |
| Portfolio Composition | | | |
| |
| By Sector | | % of total investments | |
Diversified | | | 46.84 | % |
Gathering & Processing | | | 28.08 | |
Petroleum Pipeline Transportation | | | 12.09 | |
Other Energy | | | 7.25 | |
Natural Gas Pipeline Transportation | | | 4.14 | |
Money Market Funds | | | 1.60 | |
| |
| | | | |
Top 10 Master Limited Partnership and Related Entity
Holdings* | |
| |
| | | % of total net assets | |
1. Energy Transfer L.P. | | | 18.34 | % |
2. MPLX L.P. | | | 17.05 | |
3. Targa Resources Corp. | | | 16.25 | |
4. Western Midstream Partners L.P. | | | 14.71 | |
5. Enterprise Products Partners L.P. | | | 12.57 | |
6. Plains All American Pipeline L.P. | | | 8.90 | |
7. ONEOK, Inc. | | | 8.89 | |
8. Williams Cos., Inc. | | | 6.15 | |
9. Cheniere Energy, Inc. | | | 4.86 | |
10. EnLink Midstream LLC | | | 3.92 | |
The Fund’s holdings are subject to change, and there is no assurance that the Fund will continue to hold any particular security. * Excluding money market fund holdings, if any. Data presented here are as of November 30, 2023. | |
7 Invesco SteelPath MLP Alpha Plus Fund
Schedule of Investments
November 30, 2023
| | | | | | | | |
| | | Units | | | Value | |
Master Limited Partnerships And Related
Entities–132.35% | |
| Diversified–63.00% | | | | | | |
Energy Transfer L.P.(a) | | | 2,601,619 | | | $ | 36,136,485 | |
Enterprise Products Partners L.P.(a) | | | 924,351 | | | | 24,754,120 | |
MPLX L.P.(a) | | | 921,088 | | | | 33,582,868 | |
ONEOK, Inc.(a) | | | 254,467 | | | | 17,520,053 | |
Williams Cos., Inc.(a) | | | 329,448 | | | | 12,120,392 | |
| | | | | | | | 124,113,918 | |
| Gathering & Processing–37.76% | | | | | | |
EnLink Midstream LLC(a) | | | 564,402 | | | | 7,715,375 | |
Hess Midstream L.P., Class A(a) | | | 174,829 | | | | 5,688,936 | |
Targa Resources Corp.(a) | | | 354,019 | | | | 32,021,019 | |
Western Midstream Partners L.P.(a) | | | 971,510 | | | | 28,970,431 | |
| | | | | | | | 74,395,761 | |
| Natural Gas Pipeline Transportation–5.56% | |
DT Midstream, Inc.(a) | | | 46,162 | | | | 2,644,621 | |
Enbridge, Inc.(b) | | | 113,404 | | | | 3,954,397 | |
Equitrans Midstream Corp. | | | 464,778 | | | | 4,359,618 | |
| | | | | | | | 10,958,636 | |
| Other Energy–9.76% | | | | | | |
Cheniere Energy Partners LP(a) | | | 59,943 | | | | 3,700,881 | |
Cheniere Energy, Inc.(a) | | | 52,514 | | | | 9,565,425 | |
Global Partners L.P. | | | 37,953 | | | | 1,382,628 | |
Sunoco L.P.(a) | | | 31,500 | | | | 1,721,790 | |
Westlake Chemical Partners L.P.(a) | | | 126,293 | | | | 2,860,536 | |
| | | | | | | | 19,231,260 | |
| | | | | | | | |
| | | Units | | | Value | |
| Petroleum Pipeline Transportation–16.27% | |
Genesis Energy L.P.(a) | | | 371,410 | | | $ | 4,664,910 | |
NuStar Energy L.P.(a) | | | 256,679 | | | | 4,887,168 | |
Plains All American Pipeline L.P.(a) | | | 1,104,229 | | | | 17,535,156 | |
Plains GP Holdings L.P., Class A(a) | | | 306,505 | | | | 4,953,121 | |
| | | | | | | | 32,040,355 | |
Total Master Limited Partnerships And Related Entities
(Cost $193,299,720) | | | | | | | 260,739,930 | |
| | |
| | | | | | | | |
| | | Shares | | | | |
Money Market Funds–2.15% | |
Fidelity Treasury Portfolio, Institutional
Class, 5.17%
(Cost $4,244,866)(c) | | | 4,244,866 | | | | 4,244,866 | |
TOTAL INVESTMENTS IN SECURITIES–134.50% (Cost $197,544,586) | | | | | | | 264,984,796 | |
OTHER ASSETS LESS LIABILITIES–(3.54)% | | | | (6,977,130 | ) |
BORROWINGS–(30.96)% | | | | | | | (61,000,000 | ) |
NET ASSETS–100% | | | | | | $ | 197,007,666 | |
Notes to Schedule of Investments:
| (a) | As of November 30, 2023, all or a portion of the security has been pledged as collateral for a Fund loan. The market value of the securities in the pledged account totaled $156,911,378 as of November 30, 2023. The loan agreement requires continuous collateral whether the loan has a balance or not. See Note 6 of the Notes to Financial Statements for additional information. |
| (b) | Foreign security denominated in U.S. dollars. |
| (c) | The rate shown is the 7-day SEC standardized yield as of November 30, 2023. |
See accompanying Notes to Financial Statements which are an integral part of the financial statements.
8 Invesco SteelPath MLP Alpha Plus Fund
Statement of Assets and Liabilities
November 30, 2023
| | | | |
Assets: | | | | |
Investments in unaffiliated securities, at value (cost $197,544,586) | | $ | 264,984,796 | |
Cash segregated as collateral | | | 810,665 | |
Cash | | | 38,508 | |
Receivable for: | | | | |
Fund shares sold | | | 221,151 | |
Dividends | | | 91,394 | |
Investment for trustee deferred compensation and retirement plans | | | 24,883 | |
Prepaid state income taxes | | | 16,096 | |
Other Assets | | | 123,488 | |
Total assets | | | 266,310,981 | |
| |
| | | | |
Liabilities: | | | | |
Payables for: | | | | |
Borrowings | | | 61,000,000 | |
Fund shares reacquired | | | 221,165 | |
Accrued fees to affiliates | | | 279,927 | |
Accrued interest expense | | | 328,130 | |
Accrued trustees’ and officers’ fees and benefits | | | 2,737 | |
Accrued other operating expenses | | | 178,769 | |
Current tax expense | | | 846,497 | |
Deferred tax liability, net | | | 6,421,207 | |
Trustee deferred compensation and retirement plans | | | 24,883 | |
Total liabilities | | | 69,303,315 | |
Net Assets applicable to shares outstanding | | $ | 197,007,666 | |
| |
| | | | |
Net assets consist of: | | | | |
Shares of beneficial interest | | $ | 279,062,633 | |
Distributable earnings (loss), net of taxes | | | (82,054,967 | ) |
| | | $ | 197,007,666 | |
| | | | |
Net Assets: | | | | |
Class A | | $ | 102,689,406 | |
Class C | | $ | 37,268,940 | |
Class R | | $ | 3,381,166 | |
Class Y | | $ | 53,283,630 | |
Class R5 | | $ | 15,068 | |
Class R6 | | $ | 369,456 | |
| |
| | | | |
Shares outstanding, no par value, with an unlimited number of shares authorized: | |
Class A | | | 23,341,101 | |
Class C | | | 9,991,660 | |
Class R | | | 778,006 | |
Class Y | | | 11,424,930 | |
Class R5 | | | 3,361 | |
Class R6 | | | 77,120 | |
Class A: | | | | |
Net asset value per share | | $ | 4.40 | |
Maximum offering price per share
(net asset value of $4.40 ÷ 94.50%) | | $ | 4.66 | |
Class C: | | | | |
Net asset value and offering price per share | | $ | 3.73 | |
Class R: | | | | |
Net asset value and offering price per share | | $ | 4.35 | |
Class Y: | | | | |
Net asset value and offering price per share | | $ | 4.66 | |
Class R5: | | | | |
Net asset value and offering price per share | | $ | 4.48 | |
Class R6: | | | | |
Net asset value and offering price per share | | $ | 4.79 | |
See accompanying Notes to Financial Statements which are an integral part of the financial statements.
9 Invesco SteelPath MLP Alpha Plus Fund
Statement of Operations
For the year ended November 30, 2023
| | | | |
Investment Income: | | | | |
Distributions and dividends | | $ | 17,070,415 | |
Less: return of capital on distributions and dividends | | | (14,718,877 | ) |
Total investment income | | | 2,351,538 | |
| |
Expenses: | | | | |
Advisory fees | | | 2,276,568 | |
Administrative services fees | | | 98,794 | |
Custodian fees | | | 27,138 | |
Distribution Fees: | | | | |
Class A | | | 220,143 | |
Class C | | | 346,363 | |
Class R | | | 12,538 | |
Transfer agent fees — A, C, R and Y | | | 200,928 | |
Transfer agent fees — R5 | | | 2 | |
Transfer agent fees — R6 | | | 180 | |
Interest, facilities and maintenance fees | | | 3,867,070 | |
State income tax expense | | | 30,665 | |
Trustees’ and officers’ fees and benefits | | | 16,811 | |
Registration and filing fees | | | 81,476 | |
Professional services fees | | | 135,647 | |
Other | | | 38,249 | |
Total expenses, before waivers and deferred taxes | | | 7,352,572 | |
Less: Fees waived and expenses reimbursed | | | (262,165 | ) |
Net expenses, before deferred taxes | | | 7,090,407 | |
Net investment income (loss), before deferred taxes | | | (4,738,869 | ) |
Net deferred tax benefit | | | 2,522,652 | |
Current tax (expense) benefit | | | (1,032,787 | ) |
Net investment income (loss), net of deferred taxes | | | (3,249,004 | ) |
| |
| | | | |
Realized and unrealized gain (loss) from: | | | | |
Net realized gain (loss) from: | | | | |
Unaffiliated investment securities (includes net losses from securities sold to affiliates of $1,187,319) | | | 49,973,549 | |
Net deferred tax (expense) benefit | | | (9,586,820 | ) |
Net realized gain, net of deferred taxes | | | 40,386,729 | |
Change in net unrealized appreciation (depreciation) of: | | | | |
Unaffiliated investment securities | | | (2,604,158 | ) |
Net deferred tax (expense) benefit | | | 642,959 | |
Net change in unrealized appreciation (depreciation) of investment securities, net of deferred taxes | | | (1,961,199 | ) |
Net realized and unrealized gain, net of deferred taxes | | | 38,425,530 | |
Net increase in net assets resulting from operations | | $ | 35,176,526 | |
See accompanying Notes to Financial Statements which are an integral part of the financial statements.
10 Invesco SteelPath MLP Alpha Plus Fund
Statement of Changes in Net Assets
For the year ended November 30, 2023 and 2022
| | | | | | | | |
| | | November 30,
2023 | | | November 30,
2022 | |
Operations: | | | | | | | | |
Net investment income (loss), net of deferred taxes | | $ | (3,249,004 | ) | | $ | (1,095,307 | ) |
Net realized gain, net of deferred taxes | | | 40,386,729 | | | | 44,626,778 | |
Change in net unrealized appreciation (depreciation), net of deferred taxes | | | (1,961,199 | ) | | | 25,093,918 | |
Net increase in net assets resulting from operations | | | 35,176,526 | | | | 68,625,389 | |
| | |
Distribution to shareholders from distributable earnings: | | | | | | | | |
Class A | | | (5,734,229 | ) | | | (5,356,482 | ) |
Class C | | | (2,577,039 | ) | | | (3,780,309 | ) |
Class R | | | (168,892 | ) | | | (81,528 | ) |
Class Y | | | (3,381,395 | ) | | | (3,706,337 | ) |
Class R5 | | | (504 | ) | | | (452 | ) |
Class R6 | | | (36,922 | ) | | | (12,671 | ) |
Total distributions from distributable earnings | | | (11,898,981 | ) | | | (12,937,779 | ) |
| | |
Share transactions–net: | | | | | | | | |
Class A | | | 2,233,328 | | | | 9,366,068 | |
Class C | | | (15,398,128 | ) | | | 1,149,747 | |
Class R | | | 1,093,058 | | | | 1,128,637 | |
Class Y | | | (20,770,361 | ) | | | 3,492,305 | |
Class R5 | | | 6,507 | | | | — | |
Class R6 | | | 126,579 | | | | (61,527 | ) |
Net increase (decrease) in net assets resulting from share transactions | | | (32,709,017 | ) | | | 15,075,230 | |
Net increase (decrease) in net assets | | | (9,431,472 | ) | | | 70,762,840 | |
| | |
Net Assets: | | | | | | | | |
Beginning of year | | | 206,439,138 | | | | 135,676,298 | |
End of year | | $ | 197,007,666 | | | $ | 206,439,138 | |
See accompanying Notes to Financial Statements which are an integral part of the financial statements.
11 Invesco SteelPath MLP Alpha Plus Fund
Statement of Cash Flows
For the year ended November 30, 2023
| | | | |
Cash flows from operating activities: | | | | |
Net increase in net assets resulting from operations | | $ | 35,176,526 | |
Adjustments to reconcile the change in net assets from operations to net cash provided by (used in) operating activities: | | | | |
Purchases of investments | | | (101,033,067 | ) |
Proceeds from sales of investments | | | 131,498,307 | |
Distributions from Master Limited Partnerships | | | 14,718,877 | |
Net realized gain on investment securities | | | (49,973,549 | ) |
Net change in unrealized depreciation on investment securities | | | 2,604,158 | |
Change in operating assets and liabilities: | | | | |
Increase in receivable prepaid taxes | | | (9,470 | ) |
Increase in receivables and other assets | | | (79,635 | ) |
Increase in current tax liability | | | 7,267,704 | |
Increase in accrued expenses and other payables | | | 93,941 | |
Net cash provided by operating activities | | | 40,263,792 | |
| |
Cash provided by (used in) financing activities: | | | | |
Dividends paid to shareholders from distributable earnings | | | (3,587,008 | ) |
Proceeds from shares of beneficial interest sold | | | 44,914,200 | |
Disbursements from shares of beneficial interest reacquired | | | (85,593,159 | ) |
Proceeds from borrowing | | | 2,000,000 | |
Net cash provided by (used in) financing activities | | | (42,265,967 | ) |
Net decrease in cash and cash equivalents | | | (2,002,175 | ) |
Cash and cash equivalents at beginning of period | | | 7,096,214 | |
Cash and cash equivalents at end of period | | | 5,094,039 | |
| |
Non-cash financing activities: | | | | |
Value of shares of beneficial interest issued in reinvestment of dividends paid to shareholders | | $ | 8,311,973 | |
| |
Supplemental disclosure of cash flow information: | | | | |
Cash paid during the period for taxes | | $ | 40,537 | |
Cash paid during the period for interest, facilities and maintenance fees | | $ | 3,654,791 | |
See accompanying Notes to Financial Statements which are an integral part of the financial statements.
12 Invesco SteelPath MLP Alpha Plus Fund
Financial Highlights
| | | | | | | | | | | | | | | | | | | | |
| | | Years Ended November 30, | |
| Class A | | 2023 | | | 2022 | | | 2021 | | | 2020 | | | 2019 | |
Per share operating data | | | | | | | | | | | | | | | | | | | | |
Net asset value, beginning of period | | $ | 3.85 | | | $ | 2.73 | | | $ | 1.95 | | | $ | 3.77 | | | $ | 5.04 | |
Net investment income (loss)(a) | | | (0.07 | ) | | | (0.02 | ) | | | (0.03 | ) | | | (0.05 | ) | | | (0.07 | ) |
Return of capital(a) | | | 0.25 | | | | 0.22 | | | | 0.19 | | | | 0.23 | | | | 0.35 | |
Net realized and unrealized gains (losses) | | | 0.62 | | | | 1.17 | | | | 0.87 | | | | (1.55 | ) | | | (0.89 | ) |
Total from investment operations | | | 0.80 | | | | 1.37 | | | | 1.03 | | | | (1.37 | ) | | | (0.61 | ) |
Less: | | | | | | | | | | | | | | | | | | | | |
Return of capital | | | — | | | | — | | | | (0.22 | ) | | | (0.45 | ) | | | (0.44 | ) |
Dividends from net investment income | | | (0.25 | ) | | | (0.25 | ) | | | (0.03 | ) | | | — | | | | (0.22 | ) |
Total distributions | | | (0.25 | ) | | | (0.25 | ) | | | (0.25 | ) | | | (0.45 | ) | | | (0.66 | ) |
Net asset value, end of period | | $ | 4.40 | | | $ | 3.85 | | | $ | 2.73 | | | $ | 1.95 | | | $ | 3.77 | |
Total return(b) | | | 21.90 | % | | | 51.36 | % | | | 53.66 | % | | | (36.31 | )% | | | (14.18 | )% |
Net assets, end of period (000’s omitted) | | $ | 102,689 | | | $ | 88,038 | | | $ | 55,512 | | | $ | 31,002 | | | $ | 42,952 | |
Portfolio turnover rate | | | 42 | % | | | 43 | % | | | 42 | % | | | 148 | % | | | 52 | % |
| | | | | |
Ratios/supplemental data based on average net assets: | | | | | | | | | | | | | | | | | | | | |
Ratio of expenses: | | | | | | | | | | | | | | | | | | | | |
Without fee waivers and/or expense reimbursements, before taxes | | | 3.97 | % | | | 2.64 | % | | | 2.56 | % | | | 3.36 | % | | | 3.28 | % |
Expense (waivers)(c) | | | (0.14 | )% | | | (0.25 | )% | | | (0.40 | )% | | | (0.63 | )% | | | (0.26 | )% |
With fee waiver and/or expense reimbursement, before taxes(d) | | | 3.83 | % | | | 2.39 | % | | | 2.16 | % | | | 2.73 | % | | | 3.02 | % |
Deferred/current tax expense (benefit)(e) | | | 4.09 | % | | | 0.00 | % | | | — | % | | | — | % | | | — | % |
With fee waivers and/or expense reimbursements, after taxes | | | 7.92 | % | | | 2.39 | % | | | 2.16 | % | | | 2.73 | % | | | 3.02 | % |
| | | | | |
Ratio of investment income (loss): | | | | | | | | | | | | | | | | | | | | |
Ratio of net investment income (loss) before taxes | | | (2.68 | )% | | | (1.68 | )% | | | (1.67 | )% | | | (3.01 | )% | | | (1.76 | )% |
Net of expense (waivers) and before deferred tax benefit (expense) | | | (2.54 | )% | | | (1.43 | )% | | | (1.27 | )% | | | (2.38 | )% | | | (1.50 | )% |
Deferred tax benefit (expense)(f) | | | 0.82 | % | | | 0.93 | % | | | — | % | | | — | % | | | — | % |
Ratio of net investment income (loss), after taxes | | | (1.72 | )% | | | (0.50 | )% | | | (1.27 | )% | | | (2.38 | )% | | | (1.50 | )% |
| (a) | Per share net investment income (loss) is calculated based on average shares outstanding during the period net of deferred tax expense (benefit). Per share return of capital is calculated based on average shares during the period net of deferred tax expense (benefit) estimated at the combined Federal and State statutory income tax rate. |
| (b) | Includes adjustments in accordance with accounting principles generally accepted in the United States of America and as such, the net asset value for financial reporting purposes and the returns based upon those net asset values may differ from the net asset value and returns for shareholder transactions. Does not include sales charges and is not annualized for periods less than one year, if applicable. |
| (c) | Includes voluntary Management waiver of 0.25% effective November 1, 2018. |
| (d) | Includes interest, borrowing and franchise tax expense. Without interest, borrowing and franchise tax expense, the net expense ratio would be 1.69%, 1.59%, 1.58%, 1.61% and 1.70%, for the years ended November 30, 2023, 2022, 2021, 2020 and 2019, respectively. |
| (e) | Deferred tax expense (benefit) estimate for the ratio calculation is derived from the net investment income (loss), and realized and unrealized gains (losses). |
| (f) | Deferred tax benefit (expense) for the ratio calculation, when applicable, is derived from net investment income (loss) only. |
See accompanying Notes to Financial Statements which are an integral part of the financial statements.
13 Invesco SteelPath MLP Alpha Plus Fund
Financial Highlights—(continued)
| | | | | | | | | | | | | | | | | | | | |
| | | Years Ended November 30, | |
| Class C | | 2023 | | | 2022 | | | 2021 | | | 2020 | | | 2019 | |
Per share operating data | | | | | | | | | | | | | | | | | | | | |
Net asset value, beginning of period | | $ | 3.32 | | | $ | 2.40 | | | $ | 1.75 | | | $ | 3.47 | | | $ | 4.72 | |
Net investment income (loss)(a) | | | (0.08 | ) | | | (0.04 | ) | | | (0.05 | ) | | | (0.06 | ) | | | (0.10 | ) |
Return of capital(a) | | | 0.21 | | | | 0.19 | | | | 0.17 | | | | 0.21 | | | | 0.33 | |
Net realized and unrealized gains (losses) | | | 0.53 | | | | 1.02 | | | | 0.78 | | | | (1.42 | ) | | | (0.82 | ) |
Total from investment operations | | | 0.66 | | | | 1.17 | | | | 0.90 | | | | (1.27 | ) | | | (0.59 | ) |
Less: | | | | | | | | | | | | | | | | | | | | |
Return of capital | | | — | | | | — | | | | (0.22 | ) | | | (0.45 | ) | | | (0.44 | ) |
Dividends from net investment income | | | (0.25 | ) | | | (0.25 | ) | | | (0.03 | ) | | | — | | | | (0.22 | ) |
Total distributions | | | (0.25 | ) | | | (0.25 | ) | | | (0.25 | ) | | | (0.45 | ) | | | (0.66 | ) |
Net asset value, end of period | | $ | 3.73 | | | $ | 3.32 | | | $ | 2.40 | | | $ | 1.75 | | | $ | 3.47 | |
Total return(b) | | | 21.15 | % | | | 50.03 | % | | | 52.31 | % | | | (36.61 | )% | | | (14.77 | )% |
Net assets, end of period (000’s omitted) | | $ | 37,269 | | | $ | 49,469 | | | $ | 34,598 | | | $ | 23,236 | | | $ | 23,037 | |
Portfolio turnover rate | | | 42 | % | | | 43 | % | | | 42 | % | | | 148 | % | | | 52 | % |
| | | | | |
Ratios/supplemental data based on average net assets: | | | | | | | | | | | | | | | | | | | | |
Ratio of expenses: | | | | | | | | | | | | | | | | | | | | |
Without fee waivers and/or expense reimbursements, before taxes | | | 4.72 | % | | | 3.39 | % | | | 3.31 | % | | | 4.12 | % | | | 4.07 | % |
Expense (waivers)(c) | | | (0.14 | )% | | | (0.25 | )% | | | (0.38 | )% | | | (0.61 | )% | | | (0.26 | )% |
With fee waiver and/or expense reimbursement, before taxes (d) | | | 4.58 | % | | | 3.14 | % | | | 2.93 | % | | | 3.51 | % | | | 3.81 | % |
Deferred/current tax expense (benefit)(e) | | | 4.09 | % | | | 0.00 | % | | | — | % | | | — | % | | | — | % |
With fee waivers and/or expense reimbursements, after taxes | | | 8.67 | % | | | 3.14 | % | | | 2.93 | % | | | 3.51 | % | | | 3.81 | % |
| | | | | |
Ratio of investment income (loss): | | | | | | | | | | | | | | | | | | | | |
Ratio of net investment income (loss) before taxes | | | (3.43 | )% | | | (2.43 | )% | | | (2.42 | )% | | | (3.77 | )% | | | (2.56 | )% |
Net of expense (waivers) and before deferred tax benefit (expense) | | | (3.29 | )% | | | (2.18 | )% | | | (2.04 | )% | | | (3.16 | )% | | | (2.30 | )% |
Deferred tax benefit (expense)(f) | | | 0.82 | % | | | 0.93 | % | | | — | % | | | — | % | | | — | % |
Ratio of net investment income (loss), after taxes | | | (2.47 | )% | | | (1.25 | )% | | | (2.04 | )% | | | (3.16 | )% | | | (2.30 | )% |
| (a) | Per share net investment income (loss) is calculated based on average shares outstanding during the period net of deferred tax expense (benefit). Per share return of capital is calculated based on average shares during the period net of deferred tax expense (benefit) estimated at the combined Federal and State statutory income tax rate. |
| (b) | Includes adjustments in accordance with accounting principles generally accepted in the United States of America and as such, the net asset value for financial reporting purposes and the returns based upon those net asset values may differ from the net asset value and returns for shareholder transactions. Does not include sales charges and is not annualized for periods less than one year, if applicable. |
| (c) | Includes voluntary Management waiver of 0.25% effective November 1, 2018. |
| (d) | Includes interest, borrowing and franchise tax expense. Without interest, borrowing and franchise tax expense, the net expense ratio would be 2.44%, 2.34%, 2.35%, 2.39% and 2.49%, for the years ended November 30, 2023, 2022, 2021, 2020 and 2019, respectively. |
| (e) | Deferred tax expense (benefit) estimate for the ratio calculation is derived from the net investment income (loss), and realized and unrealized gains (losses). |
| (f) | Deferred tax benefit (expense) for the ratio calculation, when applicable, is derived from net investment income (loss) only. |
See accompanying Notes to Financial Statements which are an integral part of the financial statements.
14 Invesco SteelPath MLP Alpha Plus Fund
Financial Highlights—(continued)
| | | | | | | | | | | | | | | | | | | | |
| | | Years Ended November 30, | | | Period ended
November 30,
2019(a) | |
| Class R | | 2023 | | | 2022 | | | 2021 | | | 2020 | |
Per share operating data | | | | | | | | | | | | | | | | | | | | |
Net asset value, beginning of period | | $ | 3.81 | | | $ | 2.71 | | | $ | 1.95 | | | $ | 3.76 | | | $ | 5.31 | |
Net investment income (loss)(b) | | | (0.08 | ) | | | (0.03 | ) | | | (0.04 | ) | | | (0.05 | ) | | | (0.04 | ) |
Return of capital(b) | | | 0.25 | | | | 0.22 | | | | 0.19 | | | | 0.19 | | | | 0.17 | |
Net realized and unrealized gains (losses) | | | 0.62 | | | | 1.16 | | | | 0.86 | | | | (1.50 | ) | | | (1.30 | ) |
Total from investment operations | | | 0.79 | | | | 1.35 | | | | 1.01 | | | | (1.36 | ) | | | (1.17 | ) |
Less: | | | | | | | | | | | | | | | | | | | | |
Return of capital | | | — | | | | — | | | | (0.22 | ) | | | (0.45 | ) | | | (0.25 | ) |
Dividends from net investment income | | | (0.25 | ) | | | (0.25 | ) | | | (0.03 | ) | | | — | | | | (0.13 | ) |
Total distributions | | | (0.25 | ) | | | (0.25 | ) | | | (0.25 | ) | | | (0.45 | ) | | | (0.38 | ) |
Net asset value, end of period | | $ | 4.35 | | | $ | 3.81 | | | $ | 2.71 | | | $ | 1.95 | | | $ | 3.76 | |
Total return(c) | | | 21.87 | % | | | 50.98 | % | | | 52.60 | % | | | (36.09 | )% | | | (22.96 | )% |
Net assets, end of period (000’s omitted) | | $ | 3,381 | | | $ | 1,878 | | | $ | 448 | | | $ | 159 | | | $ | 7 | |
Portfolio turnover rate | | | 42 | % | | | 43 | % | | | 42 | % | | | 148 | % | | | 52 | % |
| | | | | |
Ratios/supplemental data based on average net assets: | | | | | | | | | | | | | | | | | | | | |
Ratio of expenses: | | | | | | | | | | | | | | | | | | | | |
Without fee waivers and/or expense reimbursements, before taxes | | | 4.22 | % | | | 2.89 | % | | | 2.81 | % | | | 3.56 | % | | | 3.54 | %(d) |
Expense (waivers)(e) | | | (0.14 | )% | | | (0.25 | )% | | | (0.40 | )% | | | (0.63 | )% | | | (0.26 | )%(d) |
With fee waiver and/or expense reimbursement, before taxes(f) | | | 4.08 | % | | | 2.64 | % | | | 2.41 | % | | | 2.93 | % | | | 3.28 | %(d) |
Deferred/current tax expense (benefit)(g) | | | 4.09 | % | | | 0.00 | % | | | — | % | | | — | % | | | — | %(d) |
With fee waivers and/or expense reimbursements, after taxes | | | 8.17 | % | | | 2.64 | % | | | 2.41 | % | | | 2.93 | % | | | 3.28 | %(d) |
| | | | | |
Ratio of investment income (loss): | | | | | | | | | | | | | | | | | | | | |
Ratio of net investment income (loss) before taxes | | | (2.93 | )% | | | (1.93 | )% | | | (1.92 | )% | | | (3.21 | )% | | | (2.02 | )%(d) |
Net of expense (waivers) and before deferred tax benefit (expense) | | | (2.79 | )% | | | (1.68 | )% | | | (1.52 | )% | | | (2.58 | )% | | | (1.76 | )%(d) |
Deferred tax benefit (expense)(h) | | | 0.82 | % | | | 0.93 | % | | | — | % | | | — | % | | | — | %(d) |
Ratio of net investment income (loss), after taxes | | | (1.97 | )% | | | (0.75 | )% | | | (1.52 | )% | | | (2.58 | )% | | | (1.76 | )%(d) |
| (a) | Commencement date after the close of business on May 24, 2019. |
| (b) | Per share net investment income (loss) is calculated based on average shares outstanding during the period net of deferred tax expense (benefit). Per share return of capital is calculated based on average shares during the period net of deferred tax expense (benefit) estimated at the combined Federal and State statutory income tax rate. |
| (c) | Includes adjustments in accordance with accounting principles generally accepted in the United States of America and as such, the net asset value for financial reporting purposes and the returns based upon those net asset values may differ from the net asset value and returns for shareholder transactions. Does not include sales charges and is not annualized for periods less than one year, if applicable. |
| (e) | Includes voluntary Management waiver of 0.25% effective November 1, 2018. |
| (f) | Includes borrowing and franchise tax expense. Without borrowing and franchise tax expense, the net expense ratio would be 1.94%, 1.84%, 1.83%, 1.81% and 1.96%, for the years ended November 30, 2023, 2022, 2021 and 2020, and the period ended November 30, 2019, respectively. |
| (g) | Deferred tax expense (benefit) estimate for the ratio calculation is derived from the net investment income (loss), and realized and unrealized gains (losses). |
| (h) | Deferred tax benefit (expense) for the ratio calculation, when applicable, is derived from net investment income (loss) only. |
See accompanying Notes to Financial Statements which are an integral part of the financial statements.
15 Invesco SteelPath MLP Alpha Plus Fund
Financial Highlights—(continued)
| | | | | | | | | | | | | | | | | | | | |
| | | Years Ended November 30, | |
| Class Y | | 2023 | | | 2022 | | | 2021 | | | 2020 | | | 2019 | |
Per share operating data | | | | | | | | | | | | | | | | | | | | |
Net asset value, beginning of period | | $ | 4.06 | | | $ | 2.86 | | | $ | 2.03 | | | $ | 3.88 | | | $ | 5.15 | |
Net investment income(loss)(a) | | | (0.06 | ) | | | (0.01 | ) | | | (0.03 | ) | | | (0.05 | ) | | | (0.06 | ) |
Return of capital(a) | | | 0.26 | | | | 0.23 | | | | 0.20 | | | | 0.24 | | | | 0.36 | |
Net realized and unrealized gains (losses) | | | 0.65 | | | | 1.23 | | | | 0.91 | | | | (1.59 | ) | | | (0.91 | ) |
Total from investment operations | | | 0.85 | | | | 1.45 | | | | 1.08 | | | | (1.40 | ) | | | (0.61 | ) |
Less: | | | | | | | | | | | | | | | | | | | | |
Return of capital | | | — | | | | — | | | | (0.22 | ) | | | (0.45 | ) | | | (0.44 | ) |
Dividends from net investment income | | | (0.25 | ) | | | (0.25 | ) | | | (0.03 | ) | | | — | | | | (0.22 | ) |
Total distributions | | | (0.25 | ) | | | (0.25 | ) | | | (0.25 | ) | | | (0.45 | ) | | | (0.66 | ) |
Net asset value, end of period | | $ | 4.66 | | | $ | 4.06 | | | $ | 2.86 | | | $ | 2.03 | | | | 3.88 | |
Total return(b) | | | 22.00 | % | | | 51.84 | % | | | 54.02 | % | | | (36.03 | )% | | | (13.89 | )% |
Net assets, end of period (000’s omitted) | | $ | 53,284 | | | $ | 66,849 | | | $ | 44,921 | | | $ | 27,930 | | | | 42,164 | |
Portfolio turnover rate | | | 42 | % | | | 43 | % | | | 42 | % | | | 148 | % | | | 52 | % |
| | | | | |
Ratios/supplemental data based on average net assets: | | | | | | | | | | | | | | | | | | | | |
Ratio of expenses: | | | | | | | | | | | | | | | | | | | | |
Without fee waivers and/or expense reimbursements, before taxes | | | 3.72 | % | | | 2.39 | % | | | 2.31 | % | | | 3.10 | % | | | 3.02 | % |
Expense (waivers)(c) | | | (0.14 | )% | | | (0.25 | )% | | | (0.37 | )% | | | (0.59 | )% | | | (0.26 | )% |
With fee waiver and/or expense reimbursement, before taxes(d) | | | 3.58 | % | | | 2.14 | % | | | 1.94 | % | | | 2.51 | % | | | 2.76 | % |
Deferred/current tax expense (benefit)(e) | | | 4.09 | % | | | 0.00 | % | | | — | % | | | — | % | | | — | % |
With fee waivers and/or expense reimbursements, after taxes | | | 7.67 | % | | | 2.14 | % | | | 1.94 | % | | | 2.51 | % | | | 2.76 | % |
| | | | | |
Ratio of investment income (loss): | | | | | | | | | | | | | | | | | | | | |
Ratio of net investment income (loss) before taxes | | | (2.43 | )% | | | (1.43 | )% | | | (1.42 | )% | | | (2.75 | )% | | | (1.50 | )% |
Net of expense (waivers) and before deferred tax benefit (expense) | | | (2.29 | )% | | | (1.18 | )% | | | (1.05 | )% | | | (2.16 | )% | | | (1.24 | )% |
Deferred tax benefit (expense)(f) | | | 0.82 | % | | | 0.93 | % | | | — | % | | | — | % | | | — | % |
Ratio of net investment income (loss), after taxes | | | (1.47 | )% | | | (0.25 | )% | | | (1.05 | )% | | | (2.16 | )% | | | (1.24 | )% |
| (a) | Per share net investment income (loss) is calculated based on average shares outstanding during the period net of deferred tax expense (benefit). Per share return of capital is calculated based on average shares during the period net of deferred tax expense (benefit) estimated at the combined Federal and State statutory income tax rate. |
| (b) | Includes adjustments in accordance with accounting principles generally accepted in the United States of America and as such, the net asset value for financial reporting purposes and the returns based upon those net asset values may differ from the net asset value and returns for shareholder transactions. Does not include sales charges and is not annualized for periods less than one year, if applicable. |
| (c) | Includes voluntary Management waiver of 0.25% effective November 1, 2018. |
| (d) | Includes interest, borrowing and franchise tax expense. Without interest, borrowing and franchise tax expense, the net expense ratio would be 1.44%, 1.34%, 1.36%, 1.39% and 1.44%, for the years ended November 30, 2023, 2022, 2021, 2020 and 2019, respectively. |
| (e) | Deferred tax expense (benefit) estimate for the ratio calculation is derived from the net investment income (loss), and realized and unrealized gains (losses). |
| (f) | Deferred tax benefit (expense) for the ratio calculation, when applicable, is derived from net investment income (loss) only. |
See accompanying Notes to Financial Statements which are an integral part of the financial statements.
16 Invesco SteelPath MLP Alpha Plus Fund
Financial Highlights—(continued)
| | | | | | | | | | | | | | | | | | | | |
| | | Years Ended November 30, | | | Period ended
November 30,
2019(a) | |
| Class R5 | | 2023 | | | 2022 | | | 2021 | | | 2020 | |
Per share operating data | | | | | | | | | | | | | | | | | | | | |
Net asset value, beginning of period | | $ | 3.91 | | | $ | 2.76 | | | $ | 1.97 | | | $ | 3.78 | | | $ | 5.31 | |
Net investment income (loss)(b) | | | (0.06 | ) | | | (0.01 | ) | | | (0.03 | ) | | | (0.05 | ) | | | (0.03 | ) |
Return of capital(b) | | | 0.25 | | | | 0.22 | | | | 0.19 | | | | 0.24 | | | | 0.17 | |
Net realized and unrealized gains (losses) | | | 0.63 | | | | 1.19 | | | | 0.88 | | | | (1.55 | ) | | | (1.29 | ) |
Total from investment operations | | | 0.82 | | | | 1.40 | | | | 1.04 | | | | (1.36 | ) | | | (1.15 | ) |
Less: | | | | | | | | | | | | | | | | | | | | |
Return of capital | | | — | | | | — | | | | (0.22 | ) | | | (0.45 | ) | | | (0.25 | ) |
Dividends from net investment income | | | (0.25 | ) | | | (0.25 | ) | | | (0.03 | ) | | | — | | | | (0.13 | ) |
Total distributions | | | (0.25 | ) | | | (0.25 | ) | | | (0.25 | ) | | | (0.45 | ) | | | (0.38 | ) |
Net asset value, end of period | | $ | 4.48 | | | $ | 3.91 | | | $ | 2.76 | | | $ | 1.97 | | | $ | 3.78 | |
Total return(c) | | | 22.08 | % | | | 51.91 | % | | | 53.65 | % | | | (35.87 | )% | | | (22.55 | )% |
Net assets, end of period (000’s omitted) | | $ | 15 | | | $ | 7 | | | $ | 5 | | | $ | 4 | | | $ | 7 | |
Portfolio turnover rate | | | 42 | % | | | 43 | % | | | 42 | % | | | 148 | % | | | 52 | % |
| | | | | |
Ratios/supplemental data based on average net assets: | | | | | | | | | | | | | | | | | | | | |
Ratio of expenses: | | | | | | | | | | | | | | | | | | | | |
Without fee waivers and/or expense reimbursements, before taxes | | | 3.64 | % | | | 2.31 | % | | | 2.23 | % | | | 3.03 | % | | | 2.94 | %(d) |
Expense (waivers)(e) | | | (0.14 | )% | | | (0.25 | )% | | | (0.40 | )% | | | (0.62 | )% | | | (0.26 | )%(d) |
With fee waiver and/or expense reimbursement, before taxes(f) | | | 3.50 | % | | | 2.06 | % | | | 1.83 | % | | | 2.41 | % | | | 2.68 | %(d) |
Deferred/current tax expense (benefit)(g) | | | 4.09 | % | | | 0.00 | % | | | — | % | | | — | % | | | — | %(d) |
With fee waivers and/or expense reimbursements, after taxes | | | 7.59 | % | | | 2.06 | % | | | 1.83 | % | | | 2.41 | % | | | 2.68 | %(d) |
| | | | | |
Ratio of investment income (loss): | | | | | | | | | | | | | | | | | | | | |
Ratio of net investment income (loss) before taxes | | | (2.35 | )% | | | (1.35 | )% | | | (1.34 | )% | | | (2.68 | )% | | | (1.42 | )%(d) |
Net of expense (waivers) and before deferred tax benefit (expense) | | | (2.21 | )% | | | (1.10 | )% | | | (0.94 | )% | | | (2.06 | )% | | | (1.16 | )%(d) |
Deferred tax benefit (expense)(h) | | | 0.82 | % | | | 0.93 | % | | | — | % | | | — | % | | | — | %(d) |
Ratio of net investment income (loss), after taxes | | | (1.39 | )% | | | (0.17 | )% | | | (0.94 | )% | | | (2.06 | )% | | | (1.16 | )%(d) |
| (a) | Commencement date after the close of business on May 24, 2019. |
| (b) | Per share net investment income (loss) is calculated based on average shares outstanding during the period net of deferred tax expense (benefit). Per share return of capital is calculated based on average shares during the period net of deferred tax expense (benefit) estimated at the combined Federal and State statutory income tax rate. |
| (c) | Includes adjustments in accordance with accounting principles generally accepted in the United States of America and as such, the net asset value for financial reporting purposes and the returns based upon those net asset values may differ from the net asset value and returns for shareholder transactions. Does not include sales charges and is not annualized for periods less than one year, if applicable. |
| (e) | Includes voluntary Management waiver of 0.25% effective November 1, 2018. |
| (f) | Includes borrowing and franchise tax expense. Without borrowing and franchise tax expense, the net expense ratio would be 1.36%, 1.26%, 1.25%, 1.29% and 1.36%, for the years ended November 30, 2023, 2022, 2021 and 2020, and the period ended November 30, 2019, respectively. |
| (g) | Deferred tax expense (benefit) estimate for the ratio calculation is derived from the net investment income (loss), and realized and unrealized gains (losses). |
| (h) | Deferred tax benefit (expense) for the ratio calculation, when applicable, is derived from net investment income (loss) only. |
See accompanying Notes to Financial Statements which are an integral part of the financial statements.
17 Invesco SteelPath MLP Alpha Plus Fund
Financial Highlights—(continued)
| | | | | | | | | | | | | | | | | | | | |
| | | Years Ended November 30, | |
| Class R6 | | 2023 | | | 2022 | | | 2021 | | | 2020 | | | 2019(a) | |
Per share operating data | | | | | | | | | | | | | | | | | | | | |
Net asset value, beginning of period | | $ | 4.15 | | | $ | 2.92 | | | $ | 2.06 | | | $ | 3.93 | | | $ | 5.20 | |
Net investment income (loss)(b) | | | (0.06 | ) | | | (0.00 | ) | | | (0.03 | ) | | | (0.05 | ) | | | (0.06 | ) |
Return of capital(b) | | | 0.27 | | | | 0.23 | | | | 0.21 | | | | 0.27 | | | | 0.39 | |
Net realized and unrealized gains (losses) | | | 0.68 | | | | 1.25 | | | | 0.93 | | | | (1.64 | ) | | | (0.94 | ) |
Total from investment operations | | | 0.89 | | | | 1.48 | | | | 1.11 | | | | (1.42 | ) | | | (0.61 | ) |
Less: | | | | | | | | | | | | | | | | | | | | |
Return of capital | | | — | | | | — | | | | (0.22 | ) | | | (0.45 | ) | | | (0.44 | ) |
Dividends from net investment income | | | (0.25 | ) | | | (0.25 | ) | | | (0.03 | ) | | | — | | | | (0.22 | ) |
Total distributions | | | (0.25 | ) | | | (0.25 | ) | | | (0.25 | ) | | | (0.45 | ) | | | (0.66 | ) |
Net asset value, end of period | | $ | 4.79 | | | $ | 4.15 | | | $ | 2.92 | | | $ | 2.06 | | | $ | 3.93 | |
Total return(c) | | | 22.50 | % | | | 51.79 | % | | | 54.72 | % | | | (36.09 | )% | | | (13.73 | )% |
Net assets, end of period (000’s omitted) | | $ | 369 | | | $ | 198 | | | $ | 192 | | | $ | 67 | | | $ | 299 | |
Portfolio turnover rate | | | 42 | % | | | 43 | % | | | 42 | % | | | 148 | % | | | 52 | % |
| | | | | |
Ratios/supplemental data based on average net assets: | | | | | | | | | | | | | | | | | | | | |
Ratio of expenses: | | | | | | | | | | | | | | | | | | | | |
Without fee waivers and/or expense reimbursements, before taxes | | | 3.64 | % | | | 2.31 | % | | | 2.23 | % | | | 3.03 | % | | | 2.88 | % |
Expense (waivers)(d) | | | (0.14 | )% | | | (0.29 | )% | | | (0.44 | )% | | | (0.66 | )% | | | (0.26 | )% |
With fee waiver and/or expense reimbursement, before taxes(e) | | | 3.50 | % | | | 2.02 | % | | | 1.79 | % | | | 2.37 | % | | | 2.62 | % |
Deferred/current tax expense (benefit)(f) | | | 4.09 | % | | | 0.00 | % | | | — | % | | | — | % | | | — | % |
With fee waivers and/or expense reimbursements, after taxes | | | 7.59 | % | | | 2.02 | % | | | 1.79 | % | | | 2.37 | % | | | 2.62 | % |
| | | | | |
Ratio of investment income (loss): | | | | | | | | | | | | | | | | | | | | |
Ratio of net investment income (loss) before taxes | | | (2.35 | )%(d) | | | (1.35 | )% | | | (1.34 | )% | | | (2.68 | )% | | | (1.36 | )% |
Net of expense (waivers) and before deferred tax benefit (expense) | | | (2.21 | )%(d) | | | (1.06 | )% | | | (0.90 | )% | | | (2.02 | )% | | | (1.10 | )% |
Deferred tax benefit (expense)(g) | | | 0.82 | %(d) | | | 0.93 | % | | | — | % | | | — | % | | | — | % |
Ratio of net investment income (loss), after taxes | | | (1.39 | )%(d) | | | (0.13 | )% | | | (0.90 | )% | | | (2.02 | )% | | | (1.10 | )% |
| (a) | SteelPath Fund Class I shares automatically converted to Class R6 shares effective close of business May 24, 2019. |
| (b) | Per share net investment income (loss) is calculated based on average shares outstanding during the period net of deferred tax expense (benefit). Per share return of capital is calculated based on average shares during the period net of deferred tax expense (benefit) estimated at the combined Federal and State statutory income tax rate. |
| (c) | Includes adjustments in accordance with accounting principles generally accepted in the United States of America and as such, the net asset value for financial reporting purposes and the returns based upon those net asset values may differ from the net asset value and returns for shareholder transactions. Does not include sales charges and is not annualized for periods less than one year, if applicable. |
| (d) | Includes voluntary Management waiver of 0.25% effective November 1, 2018. |
| (e) | Includes interest, borrowing and franchise tax expense. Without interest, borrowing and franchise tax expense, the net expense ratio would be 1.36%, 1.22%, 1.21%, 1.25% and 1.30%, for the years ended November 30, 2023, 2022, 2021, 2020 and 2019, respectively. |
| (f) | Deferred tax expense (benefit) estimate for the ratio calculation is derived from the net investment income (loss), and realized and unrealized gains (losses). |
| (g) | Deferred tax benefit (expense) for the ratio calculation, when applicable, is derived from net investment income (loss) only. |
See accompanying Notes to Financial Statements which are an integral part of the financial statements.
18 Invesco SteelPath MLP Alpha Plus Fund
Notes to Financial Statements
November 30, 2023
NOTE 1—Significant Accounting Policies
Invesco SteelPath MLP Alpha Plus Fund (the “Fund”) is a series portfolio of AIM Investment Funds (Invesco Investment Funds) (the “Trust”). The Trust is organized as a Delaware statutory trust and is registered under the Investment Company Act of 1940, as amended (the “1940 Act”), as an open-end series management investment company authorized to issue an unlimited number of shares of beneficial interest. Information presented in these financial statements pertains only to the Fund. Matters affecting the Fund or each class will be voted on exclusively by the shareholders of the Fund or each class.
The Fund’s investment objective is to seek total return.
The Fund currently consists of six different classes of shares: Class A, Class C, Class R, Class Y, Class R5 and Class R6. Class Y shares are available only to certain investors. Class A shares are sold with a front-end sales charge unless certain waiver criteria are met. Under certain circumstances, load waived shares may be subject to contingent deferred sales charges (“CDSC”). Class C shares are sold with a CDSC. Class R, Class Y, Class R5 and Class R6 shares are sold at net asset value. Class C shares held for eight years after purchase are eligible for automatic conversion into Class A shares of the same Fund (the “Conversion Feature”). The automatic conversion pursuant to the Conversion Feature will generally occur at the end of the month following the eighth anniversary after a purchase of Class C shares.
The Fund is an investment company and accordingly follows the investment company accounting and reporting guidance in accordance with Financial Accounting Standards Board Accounting Standards Codification Topic 946, Financial Services – Investment Companies.
The following is a summary of the significant accounting policies followed by the Fund in the preparation of its financial statements.
| A. | Security Valuations – Securities, including restricted securities, are valued according to the following policy. |
A security listed or traded on an exchange is generally valued at its trade price or official closing price that day as of the close of the exchange where the security is principally traded, or lacking any trades or official closing price on a particular day, the security may be valued at the closing bid or ask price on that day. Securities traded in the over-the-counter market are valued based on prices furnished by independent pricing services or market makers. When such securities are valued using prices provided by an independent pricing service they may be considered fair valued. Futures contracts are valued at the daily settlement price set by an exchange on which they are principally traded. Where a final settlement price exists, exchange-traded options are valued at the final settlement price from the exchange where the option principally trades. Where a final settlement price does not exist, exchange-traded options are valued at the mean between the last bid and ask price generally from the exchange where the option principally trades.
Securities of investment companies that are not exchange-traded (e.g., open end mutual funds) are valued using such company’s end-of-business-day net asset value per share.
Deposits, other obligations of U.S. and non-U.S. banks and financial institutions are valued at their daily account value.
Fixed income securities (including convertible debt securities) generally are valued on the basis of prices provided by independent pricing services. Prices provided by the pricing service may be determined without exclusive reliance on quoted prices, and may reflect appropriate factors such as institution-size trading in similar groups of securities, developments related to specific securities, dividend rate (for unlisted equities), yield (for debt obligations), quality, type of issue, coupon rate (for debt obligations), maturity (for debt obligations), individual trading characteristics and other market data. Pricing services generally value debt obligations assuming orderly transactions of institutional round lot size, but a fund may hold or transact in the same securities in smaller, odd lot sizes. Odd lots often trade at lower prices than institutional round lots, and their value may be adjusted accordingly. Debt obligations are subject to interest rate and credit risks. In addition, all debt obligations involve some risk of default with respect to interest and/or principal payments.
Foreign securities’ (including foreign exchange contracts) prices are converted into U.S. dollar amounts using the applicable exchange rates as of the close of the New York Stock Exchange (“NYSE”). If market quotations are available and reliable for foreign exchange-traded equity securities, the securities will be valued at the market quotations. Invesco Advisers, Inc. (the “Adviser” or “Invesco”) may use various pricing services to obtain market quotations as well as fair value prices. Because trading hours for certain foreign securities end before the close of the NYSE, closing market quotations may become not representative of market value in the Adviser’s judgment (“unreliable”). If, between the time trading ends on a particular security and the close of the customary trading session on the NYSE, a significant event occurs that makes the closing price of the security unreliable, the Adviser may fair value the security. If the event is likely to have affected the closing price of the security, the security will be valued at fair value in good faith in accordance with Board-approved policies and related Adviser procedures (“Valuation Procedures”). Adjustments to closing prices to reflect fair value may also be based on a screening process of an independent pricing service to indicate the degree of certainty, based on historical data, that the closing price in the principal market where a foreign security trades is not the current value as of the close of the NYSE. Foreign securities’ prices meeting the degree of certainty that the price is not reflective of current value will be priced at the indication of fair value from the independent pricing service. Multiple factors may be considered by the independent pricing service in determining adjustments to reflect fair value and may include information relating to sector indices, American Depositary Receipts and domestic and foreign index futures. Foreign securities may have additional risks including exchange rate changes, potential for sharply devalued currencies and high inflation, political and economic upheaval, the relative lack of issuer information, relatively low market liquidity and the potential lack of strict financial and accounting controls and standards.
Unlisted securities will be valued using prices provided by independent pricing services or by another method that the Adviser, in its judgment, believes better reflects the security’s fair value in accordance with the Valuation Procedures.
Securities for which market prices are not provided by any of the above methods may be valued based upon quotes furnished by independent sources. The mean between the last bid and ask prices may be used to value debt obligations, including corporate loans.
Securities for which market quotations are not readily available are fair valued by the Adviser in accordance with the Valuation Procedures. If a fair value price provided by a pricing service is unreliable, the Adviser will fair value the security using the Valuation Procedures. Issuer specific events, market trends, bid/ask quotes of brokers and information providers and other market data may be reviewed in the course of making a good faith determination of a security’s fair value.
The Fund may invest in securities that are subject to interest rate risk, meaning the risk that the prices will generally fall as interest rates rise and, conversely, the prices will generally rise as interest rates fall. Specific securities differ in their sensitivity to changes in interest rates depending on their individual characteristics. Changes in interest rates may result in increased market volatility, which may affect the value and/or liquidity of certain Fund investments.
Valuations change in response to many factors including the historical and prospective earnings of the issuer, the value of the issuer’s assets, general market conditions which are not specifically related to the particular issuer, such as real or perceived adverse economic conditions, changes in the general outlook for revenues or corporate earnings, changes in interest or currency rates, regional or global instability, natural or environmental disasters, widespread disease or other public health issues, war, acts of terrorism, significant governmental actions or adverse investor sentiment generally and market liquidity. Because of the inherent uncertainties of valuation, the values reflected in the financial statements may materially differ from the value received upon actual sale of those investments.
The price the Fund could receive upon the sale of any investment may differ from the Adviser’s valuation of the investment, particularly for securities that are valued using a fair valuation technique. When fair valuation techniques are applied, the Adviser uses available information, including both observable and
19 Invesco SteelPath MLP Alpha Plus Fund
unobservable inputs and assumptions, to determine a methodology that will result in a valuation that the Adviser believes approximates market value. Fund securities that are fair valued may be subject to greater fluctuation in their value from one day to the next than would be the case if market quotations were used. Because of the inherent uncertainties of valuation, and the degree of subjectivity in such decisions, the Fund could realize a greater or lesser than expected gain or loss upon the sale of the investment.
| B. | Securities Transactions and Investment Income – Securities transactions are accounted for on a trade date basis. Realized gains or losses on sales are computed on the basis of specific identification of the securities sold. Interest income (net of withholding tax, if any) is recorded on an accrual basis from settlement date and includes coupon interest and amortization of premium and accretion of discount on debt securities as applicable. Dividend income (net of withholding tax, if any) is recorded on the ex-dividend date. |
The Fund may periodically participate in litigation related to Fund investments. As such, the Fund may receive proceeds from litigation settlements. Any proceeds received are included in the Statement of Operations as realized gain (loss) for investments no longer held and as unrealized gain (loss) for investments still held.
Brokerage commissions and mark ups are considered transaction costs and are recorded as an increase to the cost basis of securities purchased and/or a reduction of proceeds on a sale of securities. Such transaction costs are included in the determination of net realized and unrealized gain (loss) from investment securities reported in the Statement of Operations and the Statement of Changes in Net Assets and the net realized and unrealized gains (losses) on securities per share in the Financial Highlights. Transaction costs are included in the calculation of the Fund’s net asset value and, accordingly, they reduce the Fund’s total returns. These transaction costs are not considered operating expenses and are not reflected in net investment income reported in the Statement of Operations and the Statement of Changes in Net Assets, or the net investment income per share and the ratios of expenses and net investment income reported in the Financial Highlights, nor are they limited by any expense limitation arrangements between the Fund and the investment adviser.
The Fund allocates income and realized and unrealized capital gains and losses to a class based on the relative net assets of each class.
| C. | Country Determination – For the purposes of making investment selection decisions and presentation in the Schedule of Investments, the investment adviser may determine the country in which an issuer is located and/or credit risk exposure based on various factors. These factors include the laws of the country under which the issuer is organized, where the issuer maintains a principal office, the country in which the issuer derives 50% or more of its total revenues, the country that has the primary market for the issuer’s securities and its “country of risk” as determined by a third party service provider, as well as other criteria. Among the other criteria that may be evaluated for making this determination are the country in which the issuer maintains 50% or more of its assets, the type of security, financial guarantees and enhancements, the nature of the collateral and the sponsor organization. Country of issuer and/or credit risk exposure has been determined to be the United States of America, unless otherwise noted. |
| D. | Dividends and Distributions to Shareholders – Dividends and distributions to shareholders, which are determined in accordance with income tax regulations and may differ from accounting principles generally accepted in the United States of America (“GAAP”), are recorded on the ex-dividend date. The Fund’s dividend distribution policy is intended to provide monthly distributions to its shareholders at a rate that over time is similar to the distribution rate the Fund receives from the master limited partnerships (“MLPs”) in which it invests. The Fund generally pays out dividends that over time approximate the distributions received from the Fund’s portfolio investments based on, among other considerations, distributions the Fund actually received from portfolio investments, distributions it would have received if it had been fully invested at all times, and estimated future cash flows. Such dividends are not tied to the Fund’s investment income and may not represent yield or investment return on the Fund’s portfolio. To the extent that the dividends paid exceed the distributions the Fund receives from its underlying investments, the Fund’s assets will be reduced. The Fund’s tendency to pay out a consistent dividend may change, and the Fund’s level of distributions may increase or decrease. |
The estimated characterization of the distributions paid will be either a qualified dividend or distribution (return of capital). This estimate is based on the Fund’s operating results during the period. The actual characterization of the distributions made during the period will not be determined until after the end of the fiscal year.
| E. | Master Limited Partnerships – The Fund primarily invests in MLPs. MLPs are publicly traded partnerships and limited liability companies taxed as partnerships under the Internal Revenue Code of 1986, as amended (the “Internal Revenue Code”). The Fund principally invests in MLPs that derive their revenue primarily from businesses involved in the gathering, transporting, processing, treating, storing, refining, distributing, mining or marketing of natural gas, natural gas liquids, crude oil, refined products or coal (“energy infrastructure MLPs”). The Fund is a partner in each MLP; accordingly, the Fund is required to take into account the Fund’s allocable share of income, gains, losses, deductions, expenses, and tax credits recognized by each MLP. |
The Fund is non-diversified and may invest in securities of fewer issuers than if it were diversified. Thus, the value of the Fund’s shares may vary more widely and the Fund may be subject to greater market and credit risk than if the Fund invested more broadly. The Fund also will concentrate its investments in the energy sector. Energy infrastructure MLPs are subject to a variety of industry specific risk factors that may adversely affect their business or operations, including a decrease in production or reduced volumes of natural gas or other energy commodities available for transporting, processing, storing or distributing; changes in energy commodity prices; a sustained reduced demand for crude oil, natural gas and refined petroleum products; depletion of natural gas reserves or other commodities if not replaced; natural disasters, extreme weather and environmental hazards; rising interest rates, how facilities are constructed, maintained and operated, environmental and safety controls, and the prices they may charge for products and services. In addition, taxes, government regulation, international politics, price, and supply fluctuations, volatile interest rates and energy conservation may cause difficulties for energy infrastructure MLPs.
MLP’s may be less liquid and subject to more abrupt or erratic price movements than conventional publicly traded securities.
| F. | Return of Capital – Distributions received from the Fund’s investments in MLPs generally are comprised of income and return of capital. The Fund records investment income and return of capital based on estimates made at the time such distributions are received. The return of capital portion of the distribution is a reduction to investment income that results in an equivalent reduction in the cost basis of the associated investments and increases net realized gains (losses) and change in unrealized appreciation (depreciation). Such estimates are based on historical information available from each MLP and other industry sources. These estimates will subsequently be revised and may materially differ primarily based on information received from the MLPs after their tax reporting periods are concluded. |
| G. | Federal Income Taxes – The Fund does not intend to qualify as a regulated investment company pursuant to Subchapter M of the Internal Revenue Code, but will rather be taxed as a corporation. The Fund is treated as a regular corporation, or “C” corporation, for U.S. federal income tax purposes and generally is subject to U.S. federal income tax on its taxable income at the graduated rates applicable to corporations. In addition, as a regular corporation, the Fund may be subject to state and local taxes in jurisdictions in which the MLPs operate. |
The Fund intends to invest its assets primarily in MLPs, which generally are treated as partnerships for federal income tax purposes. As a limited partner in the MLPs, the Fund reports its allocable share of the MLPs’ taxable income in computing its own taxable income. The Fund’s tax expense or benefit is included in the Statement of Operations based on the component of income or gains (losses) to which such expense or benefit relates.
Taxes include current and deferred taxes. Current taxes reflect the estimated tax liability of the Fund as of a measurement date based on taxable income. Deferred income taxes reflect the net tax effects of temporary differences between the carrying amounts of assets and liabilities for financial reporting purposes and the amounts used for income tax purposes. Such temporary differences are principally: (i) taxes on unrealized gains (losses), which are attributable to the temporary difference between fair market value and tax basis, (ii) the net tax effects of temporary differences between the carrying amounts of assets and liabilities for financial reporting and income tax purposes and (iii) the net tax benefit of accumulated net operating losses (“NOL”) and capital loss carryforwards.
20 Invesco SteelPath MLP Alpha Plus Fund
Deferred tax assets and liabilities are measured using effective tax rates expected to apply to taxable income in the years such temporary differences are realized or otherwise settled. To the extent the Fund has a deferred tax asset, consideration is given to whether or not a valuation allowance is required. A valuation allowance is required if, based on the evaluation criterion provided by ASC 740, Income Taxes, it is more-likely-than-not some portion or all of the deferred tax asset will not be realized.
In determining a valuation allowance, the Fund’s assessment considers, among other matters, the nature, frequency and severity of current and cumulative losses, the duration of statutory carryforward periods and the associated risk that operating loss and capital loss carryforwards were limited as a result of shareholder transactions or were likely to expire unused, and unrealized gains and losses on investments. Consideration was also given to market cycles, the severity and duration of historical deferred tax assets, the impact of redemptions, and the level of MLP distributions.
Through the consideration of these factors, the Fund may determine that it is more likely than not that the Fund’s deferred tax assets will not be realized through future taxable income of the appropriate character. As a result, the Fund may be required to record a valuation allowance with respect to its deferred tax assets that are not considered to be realizable.
From time to time, the Fund may modify its estimates or assumptions regarding its deferred tax liability and/or asset balances and any applicable valuation allowance as new information becomes available. Modifications of the Fund’s estimates or assumptions regarding its deferred tax liability and/or asset balances and any applicable valuation allowance, changes in generally accepted accounting principles or related guidance or interpretations thereof, limitations imposed on or expirations of the Fund’s NOL and capital loss carryovers (if any) and changes in applicable tax law could result in increases or decreases in the Fund’s NAV per share, which could be material.
The Fund may rely, to some extent, on information provided by the MLPs, which may not necessarily be timely, to estimate taxable income allocable to MLP units held in its portfolio, and to estimate its associated deferred tax liability or asset. Such estimates are made in good faith. From time to time, as new information becomes available, the Fund will modify its estimates or assumptions regarding its tax liability or asset.
The Fund’s policy is to classify interest and penalties associated with underpayment of federal and state income taxes, if any, as income tax expense on its Statement of Operations.
The Fund files income tax returns in the U.S. federal jurisdiction and various states. The Fund has reviewed all major jurisdictions and concluded that there is no significant impact on the Fund’s net assets and no tax liability resulting from unrecognized tax benefits relating to uncertain tax positions expected to be taken on its tax returns. Furthermore, management of the Fund is not aware of any uncertain tax positions for which it is reasonably possible that the total amount of unrecognized tax benefit will significantly change in the next 12 months. Generally, the Fund is subject to examinations by taxing authorities for up to three years after the filing of the return for the tax period. All relevant periods are still open for examination.
| H. | Expenses – Fees provided for under the Rule 12b-1 plan of a particular class of the Fund are charged to the operations of such class. Transfer agency fees and expenses and other shareholder recordkeeping fees and expenses attributable to Class R5 and Class R6 are allocated based on relative net assets of Class R5 and Class R6. Sub-accounting fees attributable to Class R5 are charged to the operations of the class. Transfer agency fees and expenses and other shareholder recordkeeping fees and expenses relating to all other classes are allocated among those classes based on relative net assets. All other expenses are allocated among the classes based on relative net assets. |
| I. | Interest, Facilities and Maintenance Fees – Interest, Facilities and Maintenance Fees include interest and related borrowing costs such as commitment fees, administrative expenses and other expenses associated with establishing and maintaining the line of credit. |
| J. | Accounting Estimates – The preparation of financial statements in conformity with GAAP requires management to make estimates and assumptions that affect the reported amounts of assets and liabilities at the date of the financial statements and the reported amounts of revenues and expenses during the reporting period including estimates and assumptions related to taxation. Actual results could differ from those estimates by a significant amount. In addition, the Fund monitors for material events or transactions that may occur or become known after the period-end date and before the date the financial statements are released to print. |
| K. | Indemnifications – Under the Trust’s organizational documents, each Trustee, officer, employee or other agent of the Trust is indemnified against certain liabilities that may arise out of the performance of their duties to the Fund. Additionally, in the normal course of business, the Fund enters into contracts, including the Fund’s servicing agreements, that contain a variety of indemnification clauses. The Fund’s maximum exposure under these arrangements is unknown as this would involve future claims that may be made against the Fund that have not yet occurred. The risk of material loss as a result of such indemnification claims is considered remote. |
| L. | Cash and Cash Equivalents – For the purposes of the Statement of Cash Flows, the Fund defines Cash and Cash Equivalents as cash (including foreign currency), money market funds, cash pledged as collateral and other investments held in lieu of cash and excludes investments made with cash collateral received. The cash pledged as collateral included in Cash and Cash Equivalents is restricted cash. |
NOTE 2—Advisory Fees and Other Fees Paid to Affiliates
The Trust has entered into a master investment advisory agreement with the Adviser. Under the terms of the investment advisory agreement, the Fund accrues daily and pays monthly an advisory fee to the Adviser based on the annual rate of the Fund’s average daily net assets as follows:
| | | | |
| Average Daily Net Assets | | Rate* | |
First $3 billion | | | 1.25% | |
Next $2 billion | | | 1.23% | |
Over $5 billion | | | 1.20% | |
| * | The advisory fee paid by the Fund shall be reduced by any amounts paid by the Fund under the administrative services agreement with the Adviser. |
For the year ended November 30, 2023, the effective advisory fee rate incurred by the Fund was 1.25%.
Under the terms of a master sub-advisory agreement between the Adviser and each of Invesco Asset Management Deutschland GmbH, Invesco Asset Management Limited, Invesco Asset Management (Japan) Limited, Invesco Hong Kong Limited, Invesco Senior Secured Management, Inc. and Invesco Canada Ltd. and separate sub-advisory agreements with Invesco Capital Management LLC and Invesco Asset Management (India) Private Limited (collectively, the “Affiliated Sub-Advisers”) the Adviser, not the Fund, will pay 40% of the fees paid to the Adviser to any such Affiliated Sub-Adviser(s) that provide(s) discretionary investment management services to the Fund based on the percentage of assets allocated to such Affiliated Sub-Adviser(s). Invesco has also entered into a Sub-Advisory Agreement with Oppenheimer Funds, Inc. to provide discretionary management services to the Fund.
The Adviser has contractually agreed, through March 31, 2024, to waive advisory fees and/or reimburse expenses of all shares to the extent necessary to limit total annual fund operating expenses after fee waiver and/or expense reimbursement (excluding certain items discussed below) of Class A, Class C, Class R, Class Y, Class R5 and Class R6 shares to 1.83%, 2.60%, 2.08%, 1.61%, 1.51% and 1.46%, respectively, of the Fund’s average daily net assets (the “expense limits”). Effective April 1, 2024, the Adviser has contractually agreed, through at least March 31, 2025, to waive advisory fees and/or reimburse expenses of all shares to the extent necessary to limit total annual fund operating expenses after fee waiver and/or expense reimbursement (excluding certain items discussed below) of Class A, Class C, Class R, Class Y, Class R5 and Class R6 shares to 1.83%, 2.58%, 2.08%, 1.58%, 1.58% and 1.58%, respectively, of the Fund’s average daily net assets. In determining the Adviser’s obligation to waive advisory fees and/or reimburse expenses, the following expenses are not taken into account, and could cause
21 Invesco SteelPath MLP Alpha Plus Fund
the total annual fund operating expenses after fee waiver and/or expense reimbursement to exceed the numbers reflected above: (1) interest, facilities and maintenance fees; (2) taxes; (3) dividend expense on short sales; (4) extraordinary or non-routine items, including litigation expenses; and (5) expenses that the Fund has incurred but did not actually pay because of an expense offset arrangement. Unless Invesco continues the fee waiver agreement, it will terminate on March 31, 2025. During its term, the fee waiver agreement cannot be terminated or amended to increase the expense limits or reduce the advisory fee waiver without approval of the Board of Trustees.
The Adviser had voluntarily agreed to reduce its advisory fee by 0.25% of the Fund’s daily net assets. The advisory fee reduction was a voluntary undertaking and was terminated effective July 1, 2023. The Adviser voluntarily reimbursed expenses of $126,872, $49,852, $3,621, $80,943, $11 and $866 of Class A, Class C, Class R, Class Y, Class R5 and Class R6 shares, respectively.
For the year ended November 30, 2023, the Adviser contractually reimbursed no class level expenses for the Fund.
The Trust has entered into an administration and fund accounting agreement with UMB Fund Services, Inc. (“UMB”) pursuant to which UMB shall provide administration and fund accounting services to the Fund. The Trust and the Adviser have entered into a Master Administrative Services Agreement (“Administrative Services Agreement”) pursuant to which the Adviser may perform or arrange for the provision of certain accounting and other administrative services to the Fund which are not required to be performed by the Adviser under the Investment Advisory Agreement. The Adviser may only receive fees for administrative services under the Administrative Services Agreement to the extent that those fees assessed under the agreement are in excess of the fees paid to UMB. For the year ended November 30, 2023, expenses incurred under the agreement are shown in the Statement of Operations as Administrative services fees. Additionally, Invesco has entered into service agreements whereby UMB Bank, n.a., serves as custodian to the Fund.
The Trust has entered into a transfer agency and service agreement with Invesco Investment Services, Inc. (“IIS”) pursuant to which the Fund has agreed to pay IIS a fee for providing transfer agency and shareholder services to the Fund and reimburse IIS for certain expenses incurred by IIS in the course of providing such services. IIS may make payments to intermediaries that provide omnibus account services, sub-accounting services and/or networking services. All fees payable by IIS to intermediaries that provide omnibus account services or sub-accounting services are charged back to the Fund, subject to certain limitations approved by the Trust’s Board of Trustees. For the year ended November 30, 2023, expenses incurred under the agreement are shown in the Statement of Operations as Transfer agent fees.
The Trust has entered into master distribution agreements with Invesco Distributors, Inc. (“IDI”) to serve as the distributor for the Class A, Class C, Class R, Class Y, Class R5 and Class R6 shares of the Fund. The Trust has adopted plans pursuant to Rule 12b-1 under the 1940 Act with respect to the Fund’s Class A, Class C and Class R shares (collectively, the “Plans”). The Fund, pursuant to the Plans, pays IDI compensation at the annual rate of 0.25% of the Fund’s average daily net assets of Class A shares, 1.00% of the average daily net assets of Class C shares and 0.50% of the average daily net assets of Class R shares. The fees are accrued daily and paid monthly. Of the Plans payments, up to 0.25% of the average daily net assets of each class of shares may be paid to furnish continuing personal shareholder services to customers who purchase and own shares of such classes. Any amounts not paid as a service fee under the Plans would constitute an asset-based sales charge. Rules of the Financial Industry Regulatory Authority (“FINRA”) impose a cap on the total sales charges, including asset-based sales charges, that may be paid by any class of shares of the Fund. For the year ended November 30, 2023, expenses incurred under the Plans are shown in the Statement of Operations as Distribution fees.
Front-end sales commissions and CDSC (collectively, the “sales charges”) are not recorded as expenses of the Fund. Front-end sales commissions are deducted from proceeds from the sales of Fund shares prior to investment in Class A shares of the Fund. CDSC are deducted from redemption proceeds prior to remittance to the shareholder. During the year ended November 30, 2023, IDI advised the Fund that IDI retained $8,514 in front-end sales commissions from the sale of Class A shares and $1,924 and $19,132 from Class A and Class C shares, respectively, for CDSC imposed upon redemptions by shareholders.
For the year ended November 30, 2023, the Fund incurred $47,079 in brokerage commissions with Invesco Capital Markets, Inc., an affiliate of the Adviser and IDI, for portfolio transactions executed on behalf of the Fund.
Certain officers and trustees of the Trust are officers and directors of the Adviser, IIS and/or IDI.
NOTE 3—Additional Valuation Information
GAAP defines fair value as the price that would be received to sell an asset or paid to transfer a liability in an orderly transaction between market participants at the measurement date, under current market conditions. GAAP establishes a hierarchy that prioritizes the inputs to valuation methods, giving the highest priority to readily available unadjusted quoted prices in an active market for identical assets (Level 1) and the lowest priority to significant unobservable inputs (Level 3), generally when market prices are not readily available. Based on the valuation inputs, the securities or other investments are tiered into one of three levels. Changes in valuation methods may result in transfers in or out of an investment’s assigned level:
| | |
| Level 1 – | | Prices are determined using quoted prices in an active market for identical assets. |
| Level 2 – | | Prices are determined using other significant observable inputs. Observable inputs are inputs that other market participants may use in pricing a security. These may include quoted prices for similar securities, interest rates, prepayment speeds, credit risk, yield curves, loss severities, default rates, discount rates, volatilities and others. |
| Level 3 – | | Prices are determined using significant unobservable inputs. In situations where quoted prices or observable inputs are unavailable (for example, when there is little or no market activity for an investment at the end of the period), unobservable inputs may be used. Unobservable inputs reflect the Adviser’s assumptions about the factors market participants would use in determining fair value of the securities or instruments and would be based on the best available information. |
As of November 30, 2023, all of the securities in this Fund were valued based on Level 1 inputs (see the Schedule of Investments for security categories). The level assigned to the securities valuations may not be an indication of the risk or liquidity associated with investing in those securities. Because of the inherent uncertainties of valuation, the values reflected in the financial statements may materially differ from the value received upon actual sale of those investments.
NOTE 4—Security Transactions with Affiliated Funds
The Fund is permitted to purchase securities from or sell securities to certain other affiliated funds under specified conditions outlined in procedures adopted by the Board of Trustees of the Trust. The procedures have been designed to ensure that any purchase or sale of securities by the Fund from or to another fund that is or could be considered an “affiliated person” by virtue of having a common investment adviser (or affiliated investment advisers), common Trustees and/or common officers is made in reliance on Rule 17a-7 of the 1940 Act and, to the extent applicable, related SEC staff positions. Each such transaction is effected at the security’s “current market price”, as provided for in these procedures and Rule 17a-7. Pursuant to these procedures, for the year ended November 30, 2023, the Fund engaged in securities purchases of $8,372,772 and securities sales of $4,962,127, which resulted in net realized gains of $1,187,319.
NOTE 5—Trustees’ and Officers’ Fees and Benefits
Trustees’ and Officers’ Fees and Benefits include amounts accrued by the Fund to pay remuneration to certain Trustees and Officers of the Fund. Trustees have the option to defer compensation payable by the Fund, and Trustees’ and Officers’ Fees and Benefits also include amounts accrued by the Fund to fund such deferred compensation amounts. Those Trustees who defer compensation have the option to select various Invesco Funds in which their deferral accounts shall be deemed to be invested. Finally, certain current Trustees were eligible to participate in a retirement plan that provided for benefits to be paid upon retirement to Trustees over a period of time based on the number of years of service. The Fund may have certain former Trustees who also participate in a retirement plan and receive benefits under such plan. Trustees’ and Officers’ Fees and Benefits include amounts accrued by the Fund to fund such retirement benefits. Obligations under the deferred compensation and retirement plans represent unsecured claims against the general assets of the Fund.
22 Invesco SteelPath MLP Alpha Plus Fund
NOTE 6—Cash Balances and Borrowings
The Fund has entered into a revolving credit and security agreement, which enables the Fund to participate with certain other Invesco Funds in a committed secured borrowing facility that permits borrowings up to $120 million, collectively by certain Invesco Funds, and which will expire on September 25, 2024. The Fund is permitted to borrow up to the lesser of (1) $120 million, (2) one-third of the Fund’s total assets, or (3) the maximum amount permitted pursuant to the Fund’s investment limitations. The revolving credit and security agreement is secured by the assets of the Fund. The Fund is subject to certain covenants relating to the revolving credit and security agreement. Failure to comply with these restrictions could cause the acceleration of the repayment of the amount outstanding under the revolving credit and security agreement.
During the year ended November 30, 2023, the average daily balance of borrowing under the revolving credit and security agreement was $60,578,082 with an average interest rate of 6.00%. The carrying amount of the Fund’s payable for borrowings as reported on the Statement of Assets and Liabilities approximates its fair value. Expenses under the revolving credit and security agreement are shown in the Statement of Operations as Interest, facilities and maintenance fees.
Additionally, the Fund is permitted to temporarily carry a negative or overdrawn balance in its account with UMB Bank, n.a., the custodian bank. Such balances, if any at period-end, are shown in the Statement of Assets and Liabilities under the payable caption Amount due custodian. To compensate the custodian bank for such overdrafts, the overdrawn Fund may either (1) leave funds as a compensating balance in the account so the custodian bank can be compensated by earning the additional interest; or (2) compensate by paying the custodian bank at a rate agreed upon by the custodian bank and Invesco, not to exceed the contractually agreed upon rate.
NOTE 7—Distributions and Tax Information
Tax Character of Distributions to Shareholders Paid During the Fiscal Years Ended November 30, 2023 and 2022:
| | | | | | | | |
| | | November 30,
2023 | | | November 30,
2022 | |
Ordinary income | | $ | 11,898,981 | | | $ | 12,937,779 | |
For the year ended November 30, 2023, the federal income tax rate is 21%. The Fund is currently using an estimated rate of 1.0% for state and local tax, net of federal tax expense.
The Fund’s income tax provision consists of the following as of November 30, 2023:
| | | | |
| Current tax (expense) benefit | | | |
Federal | | $ | (1,032,787 | ) |
State | | | — | |
Total current tax (expense) benefit | | $ | (1,032,787 | ) |
| |
| Deferred tax (expense) benefit | | | |
Federal | | $ | (7,577,267 | ) |
State | | | (418,346 | ) |
Valuation allowance | | | 1,574,404 | |
Total deferred tax (expense) benefit | | $ | (6,421,209 | ) |
The reconciliation between the federal statutory income tax rate of 21% and the tax effect on net investment income (loss) and realized and unrealized gain (loss) follows:
| | | | | | | | |
| | | Amount | | | % Effect | |
Application of federal statutory income tax rate | | $ | (8,952,409 | ) | | | (21.00 | )% |
State income taxes net of federal benefit | | | (426,306 | ) | | | (1.00 | )% |
Effect of state tax rate change | | | (12,043 | ) | | | (0.03 | )% |
Effect of permanent differences | | | 207,557 | | | | 0.49 | % |
Return to provision adjustments | | | 154,801 | | | | 0.36 | % |
Change in valuation allowance | | | 1,574,404 | | | | 3.70 | % |
Total income tax (expense) benefit | | $ | (7,453,996 | ) | | | (17.48 | )% |
For the year months ended November 30, 2023, the Fund’s tax effect on net investment income (loss) and realized and unrealized gain (loss) of (17.48)% differed from the combined federal and state statutory tax rate of (22.00)% due in large part to the change in valuation allowance primarily as a result of the change in unrealized appreciation.
Components of the Fund’s deferred tax assets and liabilities as of November 30, 2023 are as follows:
| | | | |
| Deferred tax assets: | | | |
Net operating loss carryforward (tax basis) — State | | $ | 415,997 | |
Excess business interest expense carryforward | | | 295,140 | |
Capital loss carryforward (tax basis) | | | 7,646,048 | |
Book to tax differences — Income recognized from MLPs | | | 1,637,434 | |
Valuation allowance | | | — | |
Total deferred tax asset | | $ | 9,994,619 | |
23 Invesco SteelPath MLP Alpha Plus Fund
| | | | |
| Deferred tax liabilities: | | | |
Net unrealized gain on investment securities (tax basis) | | $ | (16,473,714 | ) |
Book to tax difference — Income Carryforward Adjustment | | | 57,888 | |
Total deferred tax liability | | | (16,415,826 | ) |
Total net deferred tax asset (liability) | | $ | (6,421,207 | ) |
As of November 30, 2023, the Fund does not have a net operating loss carryforwards for federal income tax purposes.
During the year ended November 30, 2023, the Fund estimates that it will utilize $3,967,694 of net operating (loss) carryforward.
As of November 30, 2023, the Fund has net capital loss carryforwards for federal income tax purposes, which may be carried forward for 5 years, as follows:
| | |
| Expiration Date | | |
11/30/2025 | | $28,084,305 |
11/30/2026 | | 6,670,459 |
Total | | $34,754,764 |
During the year ended November 30, 2023, the Fund estimates that it will utilize $32,460,083 of capital loss carryforward.
NOTE 8—Investment Transactions
The aggregate amount of investment securities (other than short-term securities, U.S. Government obligations and money market funds, if any) purchased and sold by the Fund during the year ended November 30, 2023 was $101,033,067 and $129,677,573, respectively.
As of November 30, 2023, gross unrealized appreciation and depreciation of investments, based on cost for federal income tax purposes were as follows:
| | | | |
Gross Unrealized Appreciation | | $ | 72,414,603 | |
Gross Unrealized Depreciation | | | (1,481,284 | ) |
Net Unrealized Appreciation on Investments | | $ | 70,933,319 | |
Cost of investments for tax purposes is $194,051,477.
The difference between cost amounts for financial statement and federal income tax purposes is due primarily to timing differences in recognizing certain gains and losses in security transactions.
24 Invesco SteelPath MLP Alpha Plus Fund
NOTE 9—Share Information
| | | | | | | | | | | | | | | | |
| | | Summary of Share Activity | |
| | | Year ended
November 30, 2023 | | | Year ended
November 30, 2022 | |
| | | Shares | | | Amount | | | Shares | | | Amount | |
Sold: | | | | | | | | | | | | | | | | |
Class A | | | 3,496,929 | | | $ | 13,833,611 | | | | 5,597,002 | | | $ | 19,436,016 | |
Class C | | | 1,332,120 | | | | 4,510,849 | | | | 3,729,751 | | | | 11,037,073 | |
Class R | | | 378,032 | | | | 1,456,251 | | | | 379,725 | | | | 1,325,301 | |
Class Y | | | 4,629,640 | | | | 19,148,276 | | | | 9,343,927 | | | | 33,622,944 | |
Class R5 | | | 1,535 | | | | 6,472 | | | | - | | | | - | |
Class R6 | | | 256,721 | | | | 1,083,077 | | | | 9,990 | | | | 35,904 | |
Issued as reinvestment of dividends: | | | | | | | | | | | | | | | | |
Class A | | | 1,078,742 | | | | 4,246,743 | | | | 1,168,506 | | | | 4,100,584 | |
Class C | | | 564,042 | | | | 1,896,965 | | | | 794,557 | | | | 2,424,773 | |
Class R | | | 43,260 | | | | 168,892 | | | | 22,172 | | | | 78,038 | |
Class Y | | | 471,746 | | | | 1,965,899 | | | | 668,629 | | | | 2,461,720 | |
Class R5 | | | 10 | | | | 42 | | | | - | | | | - | |
Class R6 | | | 7,896 | | | | 33,432 | | | | 2,702 | | | | 10,147 | |
Automatic conversion of Class C shares to Class A shares: | | | | | | | | | | | | | |
Class A | | | 1,022,132 | | | | 3,992,798 | | | | 984,817 | | | | 3,354,020 | |
Class C | | | (1,194,636 | ) | | | (3,992,798 | ) | | | (1,130,131 | ) | | | (3,354,020 | ) |
Reacquired: | | | | | | | | | | | | | | | | |
Class A | | | (5,135,650 | ) | | | (19,839,824 | ) | | | (5,206,445 | ) | | | (17,524,552 | ) |
Class C | | | (5,596,544 | ) | | | (17,813,144 | ) | | | (2,920,559 | ) | | | (8,958,079 | ) |
Class R | | | (135,783 | ) | | | (532,085 | ) | | | (74,573 | ) | | | (274,702 | ) |
Class Y | | | (10,159,677 | ) | | | (41,884,536 | ) | | | (9,233,782 | ) | | | (32,592,359 | ) |
Class R5 | | | (2 | ) | | | (7 | ) | | | - | | | | - | |
Class R6 | | | (235,109 | ) | | | (989,930 | ) | | | (30,895 | ) | | | (107,578 | ) |
Net Increase (decrease) in share activity | | | (9,174,596 | ) | | $ | (32,709,017 | ) | | | 4,105,393 | | | $ | 15,075,230 | |
| (a) | There are entities that are record owners of more than 5% of the outstanding shares of the Fund and in the aggregate own 33% of the outstanding shares of the Fund. IDI has an agreement with these entities to sell Fund shares. The Fund, Invesco and/or Invesco affiliates may make payments to these entities, which are considered to be related to the Fund, for providing services to the Fund, Invesco and/or Invesco affiliates including but not limited to services such as securities brokerage, distribution, third party record keeping and account servicing. The Fund has no knowledge as to whether all or any portion of the shares owned of record by these entities are also owned beneficially. |
25 Invesco SteelPath MLP Alpha Plus Fund
Report of Independent Registered Public Accounting Firm
To the Board of Trustees of AIM Investment Funds (Invesco Investment Funds) and Shareholders of Invesco SteelPath MLP Alpha Plus Fund
Opinion on the Financial Statements
We have audited the accompanying statement of assets and liabilities, including the schedule of investments, of Invesco SteelPath MLP Alpha Plus Fund (one of the funds constituting AIM Investment Funds (Invesco Investment Funds), hereafter referred to as the “Fund”) as of November 30, 2023, the related statements of operations and cash flows for the year ended November 30, 2023, the statement of changes in net assets for each of the two years in the period ended November 30, 2023, including the related notes, and the financial highlights for each of the periods indicated therein (collectively referred to as the “financial statements”). In our opinion, the financial statements present fairly, in all material respects, the financial position of the Fund as of November 30, 2023, the results of its operations and its cash flows for the year then ended, the changes in its net assets for each of the two years in the period ended November 30, 2023 and the financial highlights for each of the periods indicated therein, in conformity with accounting principles generally accepted in the United States of America.
Basis for Opinion
These financial statements are the responsibility of the Fund’s management. Our responsibility is to express an opinion on the Fund’s financial statements based on our audits. We are a public accounting firm registered with the Public Company Accounting Oversight Board (United States) (PCAOB) and are required to be independent with respect to the Fund in accordance with the U.S. federal securities laws and the applicable rules and regulations of the Securities and Exchange Commission and the PCAOB.
We conducted our audits of these financial statements in accordance with the standards of the PCAOB. Those standards require that we plan and perform the audit to obtain reasonable assurance about whether the financial statements are free of material misstatement, whether due to error or fraud.
Our audits included performing procedures to assess the risks of material misstatement of the financial statements, whether due to error or fraud, and performing procedures that respond to those risks. Such procedures included examining, on a test basis, evidence regarding the amounts and disclosures in the financial statements. Our audits also included evaluating the accounting principles used and significant estimates made by management, as well as evaluating the overall presentation of the financial statements. Our procedures included confirmation of securities owned as of November 30, 2023 by correspondence with the custodian. We believe that our audits provide a reasonable basis for our opinion.

Houston, Texas
January 22, 2024
We have served as the auditor of one or more investment companies in the Invesco group of investment companies since at least 1995. We have not been able to determine the specific year we began serving as auditor.
PricewaterhouseCoopers LLP, 1000 Louisiana Street, Suite 5800, Houston, TX 77002
T: (713) 356 4000, www.pwc.com/us
26 Invesco SteelPath MLP Alpha Plus Fund
Calculating your ongoing Fund expenses
Example
As a shareholder of the Fund, you incur two types of costs: (1) transaction costs, which may include sales charges (loads) on purchase payments or contingent deferred sales charges on redemptions, if any; and (2) ongoing costs, including management fees, distribution and/or service (12b-1) fees, and other Fund expenses. This example is intended to help you understand your ongoing costs (in dollars) of investing in the Fund and to compare these costs with ongoing costs of investing in other mutual funds. The example is based on an investment of $1,000 invested at the beginning of the period and held for the entire period June 1, 2023 through November 30, 2023.
Actual expenses
The table below provides information about actual account values and actual expenses. You may use the information in this table, together with the amount you invested, to estimate the expenses that you paid over the period. Simply divide your account value by $1,000 (for example, an $8,600 account value divided by $1,000 = 8.6), then multiply the result by the number in the table under the heading entitled “Actual Expenses Paid During Period” to estimate the expenses you paid on your account during this period.
Hypothetical example for comparison purposes
The table below also provides information about hypothetical account values and hypothetical expenses based on the Fund’s actual expense ratio and an assumed rate of return of 5% per year before expenses, which is not the Fund’s actual return.
The hypothetical account values and expenses may not be used to estimate the actual ending account balance or expenses you paid for the period. You may use this information to compare the ongoing costs of investing in the Fund and other funds. To do so, compare this 5% hypothetical example with the 5% hypothetical examples that appear in the shareholder reports of the other funds.
Please note that the expenses shown in the table are meant to highlight your ongoing costs only and do not reflect any transaction costs, such as sales charges (loads) on purchase payments or contingent deferred sales charges on redemptions, if any. Therefore, the hypothetical information is useful in comparing ongoing costs only, and will not help you determine the relative total costs of owning different funds. In addition, if these transaction costs were included, your costs would have been higher.
| | | | | | | | | | | | | | | | | | | | | | | | |
| | | | | | ACTUAL | | | HYPOTHETICAL
(5% annual return before
expenses) | | | | |
| | | Beginning
Account Value
(06/1/2023) | | | Ending
Account Value
(11/30/2023)¹ | | | Expenses
Paid During
Period2 | | | Ending
Account Value
(11/30/2023)¹ | | | Expenses
Paid During
Period2 | | | Annualized
Expense
Ratio | |
| Class A | | $ | 1,000.00 | | | $ | 1,265.00 | | | $ | 70.46 | | | $ | 962.73 | | | $ | 61.06 | | | | 12.41 | % |
| Class C | | | 1,000.00 | | | | 1,261.00 | | | | 73.97 | | | | 959.53 | | | | 64.11 | | | | 13.05 | |
| Class R | | | 1,000.00 | | | | 1,262.30 | | | | 71.57 | | | | 961.63 | | | | 62.06 | | | | 12.62 | |
| Class Y | | | 1,000.00 | | | | 1,266.80 | | | | 69.10 | | | | 963.97 | | | | 59.87 | | | | 12.16 | |
| Class R5 | | | 1,000.00 | | | | 1,266.10 | | | | 68.40 | | | | 964.57 | | | | 59.30 | | | | 12.04 | |
| Class R6 | | | 1,000.00 | | | | 1,267.70 | | | | 69.41 | | | | 963.73 | | | | 60.11 | | | | 12.21 | |
| 1. | The actual ending account value is based on the actual total return of the Fund for the period June 1, 2023 through November 30, 2023, after actual expenses and will differ from the hypothetical ending account value which is based on the Fund’s expense ratio and a hypothetical annual return of 5% before expenses. |
| 2. | Expenses are equal to the Fund’s annualized expense ratio as indicated above multiplied by the average account value over the period, multiplied by 183/365 to reflect the most recent fiscal half year. |
27 Invesco SteelPath MLP Alpha Plus Fund
Approval of Investment Advisory and Sub-Advisory Contracts
At meetings held on June 13, 2023, the Board of Trustees (the Board or the Trustees) of AIM Investment Funds (Invesco Investment Funds) as a whole, and the independent Trustees, who comprise over 75% of the Board, voting separately, approved the continuance of the Invesco SteelPath MLP Alpha Plus Fund’s (the Fund) Master Investment Advisory Agreement with Invesco Advisers, Inc. (Invesco Advisers and the investment advisory agreement) and the Master Intergroup Sub-Advisory Contract for Mutual Funds with Invesco Asset Management Deutschland GmbH, Invesco Asset Management Limited, Invesco Asset Management (Japan) Limited, Invesco Hong Kong Limited, Invesco Senior Secured Management, Inc. and Invesco Canada Ltd. and separate sub-advisory contracts with Invesco Capital Management LLC, Invesco Asset Management (India) Private Limited and OppenheimerFunds, Inc. (collectively, the Affiliated Sub-Advisers and the sub-advisory contracts) for another year, effective July 1, 2023. After evaluating the factors discussed below, among others, the Board approved the renewal of the Fund’s investment advisory agreement and the sub-advisory contracts and determined that the compensation payable thereunder by the Fund to Invesco Advisers and by Invesco Advisers to the Affiliated Sub-Advisers is fair and reasonable.
The Board’s Evaluation Process
The Board has established an Investments Committee, which in turn has established Sub-Committees, that meet throughout the year to review the performance of funds advised by Invesco Advisers (the Invesco Funds). The Sub-Committees meet regularly with portfolio managers for their assigned Invesco Funds and other members of management to review information about investment performance and portfolio attributes of these funds. The Board has established additional standing and ad hoc committees that meet regularly throughout the year to review matters within their purview, including a working group focused on opportunities to make ongoing and continuous improvements to the annual review process for the Invesco Funds’ investment advisory and sub-advisory contracts. The Board took into account evaluations and reports that it received from its committees and sub-committees, as well as the information provided to the Board and its committees and sub-committees throughout the year, in considering whether to approve each Invesco Fund’s investment advisory agreement and sub-advisory contracts.
As part of the contract renewal process, the Board reviews and considers information
provided in response to requests for information submitted to management by the independent Trustees with assistance from legal counsel to the independent Trustees and the Senior Officer, an officer of the Invesco Funds who reports directly to the independent Trustees. The Board receives comparative investment performance and fee and expense data regarding the Invesco Funds prepared by Broadridge Financial Solutions, Inc. (Broadridge), an independent mutual fund data provider, as well as information on the composition of the peer groups provided by Broadridge and its methodology for determining peer groups. The Board also receives an independent written evaluation from the Senior Officer. The Senior Officer’s evaluation is prepared as part of his responsibility to manage the process by which the Invesco Funds’ proposed management fees are negotiated during the annual contract renewal process to ensure they are negotiated in a manner that is at arms’ length and reasonable in accordance with certain negotiated regulatory requirements. In addition to meetings with Invesco Advisers and fund counsel throughout the year and as part of meetings convened on May 2, 2023 and June 13, 2023, the independent Trustees also discussed the continuance of the investment advisory agreement and sub-advisory contracts in separate sessions with the Senior Officer and with independent legal counsel. Also, as part of the contract renewal process, the independent Trustees reviewed and considered information provided in response to follow-up requests for information submitted by the independent Trustees to management. The independent Trustees met and discussed those follow-up responses with legal counsel to the independent Trustees and the Senior Officer.
The discussion below is a summary of the Senior Officer’s independent written evaluation with respect to the Fund’s investment advisory agreement and sub-advisory contracts, as well as a discussion of the material factors and related conclusions that formed the basis for the Board’s approval of the Fund’s investment advisory agreement and sub-advisory contracts. The Trustees’ review and conclusions are based on the comprehensive consideration of all information presented to them during the course of the year and in prior years and are not the result of any single determinative factor. Moreover, one Trustee may have weighed a particular piece of information or factor differently than another Trustee. The information received and considered by the
Board was current as of various dates prior to the Board’s approval on June 13, 2023.
Factors and Conclusions and Summary of Independent Written Fee Evaluation
| A. | Nature, Extent and Quality of Services Provided by Invesco Advisers and the Affiliated Sub-Advisers |
The Board reviewed the nature, extent and quality of the advisory services provided to the Fund by Invesco Advisers under the Fund’s investment advisory agreement, and the credentials and experience of the officers and employees of Invesco Advisers who provide these services, including the Fund’s portfolio manager(s). The Board considered recent senior management changes at Invesco and Invesco Advisers, including the appointment of new Co-Heads of Investments, that had been presented to and discussed with the Board. The Board’s review included consideration of Invesco Advisers’ investment process and oversight, credit analysis and research capabilities. The Board considered information regarding Invesco Advisers’ programs for and resources devoted to risk management, including management of investment, enterprise, operational, liquidity, derivatives, valuation and compliance risks, and technology used to manage such risks. The Board noted an accounting matter that required that certain historical financial statements for the Fund be restated in 2020 and that certain shareholders be reimbursed for transactions made at incorrect net asset values, and considered the steps that Invesco Advisers took to remediate the matter, with such remediation steps concluding at the end of 2022. The Board received information regarding Invesco’s methodology for compensating its investment professionals and the incentives and accountability it creates, as well as how it impacts Invesco’s ability to attract and retain talent. The Board received a description of, and reports related to, Invesco Advisers’ global security program and business continuity plans and of its approach to data privacy and cybersecurity, including related testing. The Board also considered non-advisory services that Invesco Advisers and its affiliates provide to the Invesco Funds, such as various middle office and back office support functions, third party oversight, internal audit, valuation, portfolio trading and legal and compliance. The Board observed that Invesco Advisers’ systems preparedness and ongoing investment enabled Invesco Advisers to manage, operate and oversee the Invesco Funds with minimal impact or disruption through challenging environments. The Board reviewed and
28 Invesco SteelPath MLP Alpha Plus Fund
considered the benefits to shareholders of investing in a Fund that is part of the family of funds under the umbrella of Invesco Ltd., Invesco Advisers’ parent company, and noted Invesco Ltd.’s depth and experience in running an investment management business, as well as its commitment of financial and other resources to such business. The Board concluded that the nature, extent and quality of the services provided to the Fund by Invesco Advisers are appropriate and satisfactory.
The Board reviewed the services that may be provided to the Fund by the Affiliated Sub-Advisers under the sub-advisory contracts and the credentials and experience of the officers and employees of the Affiliated Sub-Advisers who provide these services. The Board noted the Affiliated Sub-Advisers’ expertise with respect to certain asset classes and that the Affiliated Sub-Advisers have offices and personnel that are located in financial centers around the world. As a result, the Board noted that the Affiliated Sub-Advisers can provide research and investment analysis on the markets and economies of various countries and territories in which the Fund may invest, make recommendations regarding securities and assist with portfolio trading. The Board concluded that the sub-advisory contracts may benefit the Fund and its shareholders by permitting Invesco Advisers to use the resources and talents of the Affiliated Sub-Advisers in managing the Fund. The Board concluded that the nature, extent and quality of the services that may be provided to the Fund by the Affiliated Sub-Advisers are appropriate and satisfactory.
| B. | Fund Investment Performance |
The Board considered Fund investment performance as a relevant factor in considering whether to approve the investment advisory agreement. The Board did not view Fund investment performance as a relevant factor in considering whether to approve the sub-advisory contracts for the Fund, as no Affiliated Sub-Adviser currently manages assets of the Fund.
The Board compared the Fund’s investment performance over multiple time periods ending December 31, 2022 to the performance of funds in the Broadridge performance universe and against the Alerian MLP Infrastructure Index (Index). The Board noted that performance of Class Y shares of the Fund was in the first quintile of its performance universe for the one year period, the fourth quintile for the three year period and the fifth quintile for the five year period (the first quintile being the best performing funds and the fifth quintile being the worst performing funds). The Board noted that performance of Class Y shares of the Fund was above the performance of the Index for the one year period and below the performance of the
Index for the three and five year periods. The Board acknowledged limitations regarding the Broadridge data, in particular that the Lipper category includes funds taxed as traditional mutual funds as well as those taxed as C-corporations (such as the Fund) and discussed how such taxation status can impact relative performance. The Board considered that the Fund was created in connection with Invesco Ltd.’s acquisition of OppenheimerFunds, Inc. and its subsidiaries (the “Transaction”) and that the Fund’s performance prior to the closing of the Transaction on May 24, 2019 is that of its predecessor fund. The Board considered that headwinds impacting certain holdings detracted from Fund performance. The Board recognized that the performance data reflects a snapshot in time as of a particular date and that selecting a different performance period could produce different results. The Board also reviewed more recent Fund performance as well as other performance metrics, which did not change its conclusions.
| C. | Advisory and Sub-Advisory Fees and Fund Expenses |
The Board compared the Fund’s contractual management fee rate to the contractual management fee rates of funds in the Fund’s Broadridge expense group. The Board noted that the contractual management fee rate for Class Y shares of the Fund was above the median contractual management fee rate of funds in its expense group. The Board noted that the term “contractual management fee” for funds in the expense group may include both advisory and certain non-portfolio management administrative services fees, but that Broadridge is not able to provide information on a fund-by-fund basis as to what is included. The Board also reviewed the methodology used by Broadridge in calculating expense group information, which includes using each fund’s contractual management fee schedule (including any applicable breakpoints) as reported in the most recent prospectus or statement of additional information for each fund in the expense group. The Board also considered comparative information regarding the Fund’s total expense ratio and its various components. The Board noted that the Fund’s total expense ratio was in the fifth quintile of its expense group and discussed with management reasons for such relative total expenses. As previously noted, the independent Trustees reviewed and considered information provided in response to follow-up requests for information submitted by the independent Trustees to management, including with respect to the fees comprising the Fund’s total expense ratio relative to those of peers. The independent Trustees met and discussed those follow-up responses with legal counsel to the independent Trustees
and the Senior Officer, and subsequently with representatives of management.
The Board noted that Invesco Advisers has contractually agreed to waive fees and/or limit expenses of the Fund for the term disclosed in the Fund’s registration statement in an amount necessary to limit total annual operating expenses to a specified percentage of average daily net assets for each class of the Fund.
The Board noted that Invesco Advisers and the Affiliated Sub-Advisers do not manage other similarly managed mutual funds or client accounts.
The Board also considered the services that may be provided by the Affiliated Sub-Advisers pursuant to the sub-advisory contracts, as well as the fees payable by Invesco Advisers to the Affiliated Sub-Advisers pursuant to the sub-advisory contracts.
| D. | Economies of Scale and Breakpoints |
The Board considered the extent to which there may be economies of scale in the provision of advisory services to the Fund and the Invesco Funds, and the extent to which such economies of scale are shared with the Fund and the Invesco Funds. The Board acknowledged the difficulty in calculating and measuring economies of scale at the individual fund level; noting that only indicative and estimated measures are available at the individual fund level and that such measures are subject to uncertainty. The Board considered that the Fund may benefit from economies of scale through contractual breakpoints in the Fund’s advisory fee schedule, which generally operate to reduce the Fund’s expense ratio as it grows in size. The Board noted that the Fund also shares in economies of scale through Invesco Advisers’ ability to negotiate lower fee arrangements with third party service providers. The Board noted that the Fund may also benefit from economies of scale through initial fee setting, fee waivers and expense reimbursements, as well as Invesco Advisers’ investment in its business, including investments in business infrastructure, technology and cybersecurity.
| E. | Profitability and Financial Resources |
The Board reviewed information from Invesco Advisers concerning the costs of the advisory and other services that Invesco Advisers and its affiliates provide to the Fund and the Invesco Funds and the profitability of Invesco Advisers and its affiliates in providing these services in the aggregate and on an individual fund-by-fund basis. The Board considered the methodology used for calculating profitability and the periodic review and enhancement of such methodology. The Board noted that Invesco Advisers continues to operate at a net profit from services Invesco Advisers and its affiliates provide to the Invesco Funds in the aggregate and to
29 Invesco SteelPath MLP Alpha Plus Fund
most Invesco Funds individually. The Board considered that profits to Invesco Advisers can vary significantly depending on the particular Invesco Fund, with some Invesco Funds showing indicative losses to Invesco Advisers and others showing indicative profits at healthy levels, and that Invesco Advisers’ support for and commitment to an Invesco Fund are not, however, solely dependent on the profits realized as to that Fund. The Board did not deem the level of profits realized by Invesco Advisers and its affiliates from providing such services to be excessive, given the nature, extent and quality of the services provided. The Board noted that Invesco Advisers provided information demonstrating that Invesco Advisers is financially sound and has the resources necessary to perform its obligations under the investment advisory agreement, and provided representations indicating that the Affiliated Sub-Advisers are financially sound and have the resources necessary to perform their obligations under the sub-advisory contracts. The Board noted the cyclical and competitive nature of the global asset management industry.
| F. | Collateral Benefits to Invesco Advisers and its Affiliates |
The Board considered various other benefits received by Invesco Advisers and its affiliates from the relationship with the Fund, including the fees received for providing administrative, transfer agency and distribution services to the Fund. The Board received comparative information regarding fees charged for these services, including information provided by Broadridge and other independent sources. The Board reviewed the performance of Invesco Advisers and its affiliates in providing these services and the organizational structure employed to provide these services. The Board noted that these services are provided to the Fund pursuant to written contracts that are reviewed and subject to approval on an annual basis by the Board based on its determination that the services are required for the operation of the Fund.
The Board considered the benefits realized by Invesco Advisers and the Affiliated Sub-Advisers as a result of portfolio brokerage transactions executed through “soft dollar” arrangements. The Board noted that soft dollar arrangements may result in the Fund bearing costs to purchase research that may be used by Invesco Advisers or the Affiliated Sub-Advisers with other clients and may reduce Invesco Advisers’ or the Affiliated Sub-Advisers’ expenses. The Board also considered that it receives from Invesco Advisers periodic reports that include a representation to the effect that these arrangements are consistent with regulatory requirements. The Board did not deem the soft dollar arrangements to be inappropriate.
The Board considered that the Fund’s uninvested cash and cash collateral from any securities lending arrangements may be invested in registered money market funds or, with regard to securities lending cash collateral, unregistered funds that comply with Rule 2a-7 (collectively referred to as “affiliated money market funds”) advised by Invesco Advisers. The Board considered information regarding the returns of the affiliated money market funds relative to comparable overnight investments, as well as the fees paid by the affiliated money market funds to Invesco Advisers and its affiliates. In this regard, the Board noted that Invesco Advisers receives advisory fees from these affiliated money market funds attributable to the Fund’s investments. The Board also noted that Invesco Advisers has contractually agreed to waive through varying periods an amount equal to 100% of the net advisory fee Invesco Advisers receives from the affiliated money market funds with respect to the Fund’s investment in the affiliated money market funds of uninvested cash, but not cash collateral. The Board concluded that the advisory fees payable to Invesco Advisers from the Fund’s investment of cash collateral from any securities lending arrangements in the affiliated money market funds are for services that are not duplicative of services provided by Invesco Advisers to the Fund.
The Board considered that Invesco Advisers may serve as the Fund’s affiliated securities lending agent and evaluated the benefits realized by Invesco Advisers when serving in such role, including the compensation received. The Board considered Invesco Advisers’ securities lending platform and corporate governance structure for securities lending, including Invesco Advisers’ Securities Lending Governance Committee and its related responsibilities. The Board noted that to the extent the Fund utilizes Invesco Advisers as an affiliated securities lending agent, the Fund conducts its securities lending in accordance with, and in reliance upon, no-action letters issued by the SEC staff that provide guidance on how an affiliate may act as a direct agent lender and receive compensation for those services without obtaining exemptive relief. The Board considered information provided by Invesco Advisers related to the performance of Invesco Advisers as securities lending agent, including a summary of the securities lending services provided to the Fund by Invesco Advisers and the compensation paid to Invesco Advisers for such services, as well as any revenues generated for the Fund in connection with such securities lending activity and the allocation of such revenue between the Fund and Invesco Advisers.
The Board also received information about commissions that an affiliated broker may receive for executing certain trades for
the Fund. Invesco Advisers and the Affiliated Sub-Advisers advised the Board of the benefits to the Fund of executing trades through the affiliated broker and that such trades were executed in compliance with rules under the federal securities laws and consistent with best execution obligations.
30 Invesco SteelPath MLP Alpha Plus Fund
Trustees and Officers
The address of each trustee and officer is AIM Investment Funds (Invesco Investment Funds) (the “Trust”), 11 Greenway Plaza, Houston, Texas 77046-1173. The trustees serve for the life of the Trust, subject to their earlier death, incapacitation, resignation, retirement or removal as more specifically provided in the Trust’s organizational documents. Each officer serves for a one year term or until their successors are elected and qualified. Column two below includes length of time served with predecessor entities, if any.
| | | | | | | | |
Name, Year of Birth and
Position(s) Held with the Trust | | Trustee
and/or
Officer
Since | | Principal Occupation(s)
During Past 5 Years | | Number of
Funds in
Fund Complex
Overseen by
Trustee | | Other Directorship(s)
Held by Trustee During Past 5 Years |
| Interested Trustee | | | | | | | | |
Martin L. Flanagan1 — 1960
Trustee and Vice Chair | | 2007 | | Chairman Emeritus, Invesco Ltd.; Trustee and Vice Chair, The Invesco Funds;; and Member of Executive Board, SMU Cox School of Business Formerly: Executive Director, Chief Executive Officer and President, Invesco Ltd. (ultimate parent of Invesco and a global investment management firm); Vice Chair, Investment Company Institute; Advisor to the Board, Invesco Advisers, Inc. (formerly known as Invesco Institutional (N.A.), Inc.); Chairman and Chief Executive Officer, Invesco Advisers, Inc. (registered investment adviser); Director, Chairman, Chief Executive Officer and President, Invesco Holding Company (US), Inc. (formerly IVZ Inc.) (holding company), Invesco Group Services, Inc. (service provider) and Invesco North American Holdings, Inc. (holding company); Director, Chief Executive Officer and President, Invesco Holding Company Limited (parent of Invesco and a global investment management firm); Director, Invesco Ltd.; Chairman, Investment Company Institute and President, Co-Chief Executive Officer, Co-President, Chief Operating Officer and Chief Financial Officer, Franklin Resources, Inc. (global investment management organization) | | 169 | | None |
| 1 | Mr. Flanagan is considered an interested person (within the meaning of Section 2(a)(19) of the 1940 Act) of the Trust because he is an officer of the Adviser to the Trust, and an officer and a director of Invesco Ltd., ultimate parent of the Adviser. |
T-1 Invesco SteelPath MLP Alpha Plus Fund
Trustees and Officers—(continued)
| | | | | | | | |
Name, Year of Birth and
Position(s) Held with the Trust | | Trustee
and/or
Officer
Since | | Principal Occupation(s)
During Past 5 Years | | Number of
Funds in
Fund Complex
Overseen by
Trustee | | Other Directorship(s)
Held by Trustee During Past 5 Years |
| Independent Trustees | | | | | | | | |
Beth Ann Brown – 1968 Trustee (2019) and Chair (August 2022) | | 2019 | | Independent Consultant Formerly: Head of Intermediary Distribution, Managing Director, Strategic Relations, Managing Director, Head of National Accounts, Senior Vice President, National Account Manager and Senior Vice President, Key Account Manager, Columbia Management Investment Advisers LLC; Vice President, Key Account Manager, Liberty Funds Distributor, Inc.; and Trustee of certain Oppenheimer Funds | | 169 | | Director, Board of Directors of Caron Engineering Inc.; Advisor, Board of Advisors of Caron Engineering Inc.; President and Director, Acton Shapleigh Youth Conservation Corps (non-profit); Formerly: President and Director of Grahamtastic Connection (non-profit) |
Cynthia Hostetler – 1962 Trustee | | 2017 | | Non-Executive Director and Trustee of a number of public and private business corporations Formerly: Director, Aberdeen Investment Funds (4 portfolios); Director, Artio Global Investment LLC (mutual fund complex); Director, Edgen Group, Inc. (specialized energy and infrastructure products distributor); Director, Genesee & Wyoming, Inc. (railroads): Head of Investment Funds and Private Equity, Overseas Private Investment Corporation; President, First Manhattan Bancorporation, Inc.; and Attorney, Simpson Thacher & Bartlett LLP | | 169 | | Resideo Technologies (smart home technology); Vulcan Materials Company (construction materials company); Trilinc Global Impact Fund; Textainer Group Holdings, (shipping container leasing company); Investment Company Institute (professional organization); and Independent Directors Council (professional organization) |
Eli Jones – 1961 Trustee | | 2016 | | Professor and Dean Emeritus, Mays Business School—Texas A&M University Formerly: Dean of Mays Business School—Texas A&M University; Professor and Dean, Walton College of Business, University of Arkansas and E.J. Ourso College of Business, Louisiana State University; and Director, Arvest Bank | | 169 | | Insperity, Inc. (formerly known as Administaff) (human resources provider); Board Member of the regional board, First Financial Bank Texas; and Board Member, First Financial Bankshares, Inc. Texas |
Elizabeth Krentzman – 1959 Trustee | | 2019 | | Formerly: Principal and Chief Regulatory Advisor for Asset Management Services and U.S. Mutual Fund Leader of Deloitte & Touche LLP; General Counsel of the Investment Company Institute (trade association); National Director of the Investment Management Regulatory Consulting Practice, Principal, Director and Senior Manager of Deloitte & Touche LLP; Assistant Director of the Division of Investment Management—Office of Disclosure and Investment Adviser Regulation of the U.S. Securities and Exchange Commission and various positions with the Division of Investment Management – Office of Regulatory Policy of the U.S. Securities and Exchange Commission; Associate at Ropes & Gray LLP; and Trustee of certain Oppenheimer Funds | | 169 | | Formerly: Member of the Cartica Funds Board of Directors (private investment funds); Trustee of the University of Florida National Board Foundation; and Member of the University of Florida Law Center Association, Inc. Board of Trustees, Audit Committee and Membership Committee |
Anthony J. LaCava, Jr. – 1956 Trustee | | 2019 | | Formerly: Director and Member of the Audit Committee, Blue Hills Bank (publicly traded financial institution) and Managing Partner, KPMG LLP | | 169 | | Blue Hills Bank; Member and Chairman, Bentley University, Business School Advisory Council; and Nominating Committee, KPMG LLP |
Prema Mathai-Davis – 1950 Trustee | | 2001 | | Retired Formerly: Co-Founder & Partner of Quantalytics Research, LLC, (a FinTech Investment Research Platform for the Self-Directed Investor); Trustee of YWCA Retirement Fund; CEO of YWCA of the USA; Board member of the NY Metropolitan Transportation Authority; Commissioner of the NYC Department of Aging; and Board member of Johns Hopkins Bioethics Institute | | 169 | | Member of Board of Positive Planet US (non-profit) and HealthCare Chaplaincy Network (non-profit) |
T-2 Invesco SteelPath MLP Alpha Plus Fund
Trustees and Officers—(continued)
| | | | | | | | |
Name, Year of Birth and
Position(s) Held with the Trust | | Trustee
and/or
Officer
Since | | Principal Occupation(s)
During Past 5 Years | | Number of
Funds in
Fund Complex
Overseen by
Trustee | | Other Directorship(s)
Held by Trustee During Past 5 Years |
| Independent Trustees—(continued) | | | | | | |
Joel W. Motley – 1952 Trustee | | 2019 | | Director of Office of Finance, Federal Home Loan Bank System; Managing Director of Carmona Motley Inc. (privately held financial advisor); Member of the Council on Foreign Relations and its Finance and Budget Committee; Chairman Emeritus of Board of Human Rights Watch and Member of its Investment Committee; Member of Investment Committee and Board of Historic Hudson Valley (non-profit cultural organization); Member of the Board, Blue Ocean Acquisition Corp; and Member of the Vestry and the Investment Committee of Trinity Church Wall Street Formerly: Managing Director of Public Capital Advisors, LLC (privately held financial advisor); Managing Director of Carmona Motley Hoffman, Inc. (privately held financial advisor); Trustee of certain Oppenheimer Funds; and Director of Columbia Equity Financial Corp. (privately held financial advisor) | | 169 | | Member of Board of Trust for Mutual Understanding (non-profit promoting the arts and environment); Member of Board of Greenwall Foundation (bioethics research foundation) and its Investment Committee; Member of Board of Friends of the LRC (non-profit legal advocacy); and Board Member and Investment Committee Member of Pulitzer Center for Crisis Reporting (non-profit journalism) |
Teresa M. Ressel – 1962 Trustee | | 2017 | | Non-executive director and trustee of a number of public and private business corporations Formerly: Chief Executive Officer, UBS Securities LLC (investment banking); Chief Operating Officer, UBS AG Americas (investment banking); Sr. Management Team Olayan America, The Olayan Group (international investor/commercial/industrial); and Assistant Secretary for Management & Budget and Designated Chief Financial Officer, U.S. Department of Treasury | | 169 | | None |
Robert C. Troccoli – 1949 Trustee | | 2016 | | Retired Formerly: Adjunct Professor, University of Denver – Daniels College of Business; and Managing Partner, KPMG LLP | | 169 | | None |
Daniel S. Vandivort – 1954 Trustee | | 2019 | | President, Flyway Advisory Services LLC (consulting and property management) Formerly: President and Chief Investment Officer, previously Head of Fixed Income, Weiss Peck and Greer/Robeco Investment Management; Trustee and Chair, Weiss Peck and Greer Funds Board; and various capacities at CS First Boston including Head of Fixed Income at First Boston Asset Management. | | 169 | | Formerly: Trustee and Governance Chair, Oppenheimer Funds; Treasurer, Chairman of the Audit and Finance Committee, Huntington Disease Foundation of America. |
T-3 Invesco SteelPath MLP Alpha Plus Fund
Trustees and Officers—(continued)
| | | | | | | | |
Name, Year of Birth and
Position(s) Held with the Trust | | Trustee
and/or
Officer
Since | | Principal Occupation(s)
During Past 5 Years | | Number of
Funds in
Fund Complex
Overseen by
Trustee | | Other Directorship(s)
Held by Trustee During Past 5 Years |
| Officers | | | | | | | | |
Glenn Brightman – 1972 President and Principal Executive Officer | | 2023 | | Chief Operating Officer, Americas, Invesco Ltd.; President and Principal Executive Officer, The Invesco Funds. Formerly: Global Head of Finance, Invesco Ltd; Executive Vice President and Chief Financial Officer, Nuveen | | N/A | | N/A |
Melanie Ringold – 1975 Senior Vice President, Chief Legal Officer and Secretary | | 2023 | | Head of Legal of the Americas, Invesco Ltd.; Senior Vice President and Secretary, Invesco Advisers, Inc. (formerly known as Invesco Institutional (N.A.), Inc.) (registered investment adviser); Secretary, Invesco Distributors, Inc. (formerly known as Invesco AIM Distributors, Inc.); Secretary, Invesco Investment Services, Inc. (formerly known as Invesco AIM Investment Services, Inc.); Senior Vice President, Chief Legal Officer and Secretary, The Invesco Funds; Secretary, Invesco Investment Advisers LLC; Invesco Capital Markets, Inc.; Chief Legal Officer, Invesco Exchange-Traded Fund Trust, Invesco Exchange-Traded Fund Trust II, Invesco India Exchange-Traded Fund Trust, Invesco Actively Managed Exchange-Traded Fund Trust, Invesco Actively Managed Exchange-Traded Commodity Fund Trust and Invesco Exchange-Traded Self-Indexed Fund Trust; Secretary and Vice President, Harbourview Asset Management Corporation; Secretary and Senior Vice President, OppenheimerFunds, Inc. and Invesco Managed Accounts, LLC; Secretary and Senior Vice President, OFI SteelPath, Inc.; Secretary and Senior Vice President, Oppenheimer Acquisition Corp.; Secretary, SteelPath Funds Remediation LLC; and Secretary and Senior Vice President, Trinity Investment Management Corporation Formerly: Assistant Secretary, Invesco Distributors, Inc., Invesco Advisers, Inc., Invesco Investment Services, Inc., Invesco Capital Markets, Inc., Invesco Capital Management LLC and Invesco Investment Advisers LLC; and Assistant Secretary and Investment Vice President, Invesco Funds | | N/A | | N/A |
Andrew R. Schlossberg – 1974 Senior Vice President | | 2019 | | Chief Executive Officer, President and Executive Director, Invesco Ltd.; Senior Vice President, The Invesco Funds; and Trustee, Invesco Foundation, Inc. Formerly: Senior Vice President, Invesco Group Services, Inc. Director and Senior Vice President, Invesco Advisers, Inc. (formerly known as Invesco Institutional (N.A.), Inc.) (registered investment adviser); Director and Chairman, Invesco Investment Services, Inc. (formerly known as Invesco AIM Investment Services, Inc.) (registered transfer agent); Head of the Americas and Senior Managing Director, Invesco Ltd.; Director, Invesco Investment Advisers LLC (formerly known as Van Kampen Asset Management); Director, President and Chairman, Invesco Insurance Agency, Inc.; Director, Invesco UK Limited; Director and Chief Executive, Invesco Asset Management Limited and Invesco Fund Managers Limited; Assistant Vice President, The Invesco Funds; Senior Vice President, Invesco Advisers, Inc. (formerly known as Invesco Institutional (N.A.), Inc.) (registered investment adviser); Director and Chief Executive, Invesco Administration Services Limited and Invesco Global Investment Funds Limited; Director, Invesco Distributors, Inc.; Head of EMEA, Invesco Ltd.; President, Invesco Actively Managed Exchange-Traded Commodity Fund Trust, Invesco Actively Managed Exchange-Traded Fund Trust, Invesco Exchange-Traded Fund Trust, Invesco Exchange-Traded Fund Trust II and Invesco India Exchange-Traded Fund Trust; and Managing Director and Principal Executive Officer, Invesco Capital Management LLC | | N/A | | N/A |
T-4 Invesco SteelPath MLP Alpha Plus Fund
Trustees and Officers—(continued)
| | | | | | | | |
Name, Year of Birth and
Position(s) Held with the Trust | | Trustee
and/or
Officer
Since | | Principal Occupation(s)
During Past 5 Years | | Number of
Funds in
Fund Complex
Overseen by
Trustee | | Other Directorship(s)
Held by Trustee During Past 5 Years |
| Officers—(continued) | | | | | | | | |
John M. Zerr – 1962
Senior Vice President | | 2006 | | Chief Operating Officer of the Americas; Senior Vice President, Invesco Advisers, Inc. (formerly known as Invesco Institutional (N.A.), Inc.) (registered investment adviser); Senior Vice President, Invesco Distributors, Inc. (formerly known as Invesco AIM Distributors, Inc.); Director and Vice President, Invesco Investment Services, Inc. (formerly known as Invesco AIM Investment Services, Inc.) Senior Vice President, The Invesco Funds; Managing Director, Invesco Capital Management LLC; Senior Vice President, Invesco Capital Markets, Inc. (formerly known as Van Kampen Funds Inc.); Manager, Invesco Specialized Products, LLC; Member, Invesco Canada Funds Advisory Board; Director, President and Chief Executive Officer, Invesco Corporate Class Inc. (corporate mutual fund company); Director, Chairman, President and Chief Executive Officer, Invesco Canada Ltd. (formerly known as Invesco Trimark Ltd./Invesco Trimark Ltèe) (registered investment adviser and registered transfer agent); President, Invesco, Inc.; President, Invesco Global Direct Real Estate Feeder GP Ltd.; President, Invesco IP Holdings (Canada) Ltd; President, Invesco Global Direct Real Estate GP Ltd.; President, Invesco Financial Services Ltd./Services Financiers Invesco Ltée; and Director and Chairman, Invesco Trust Company Formerly: Manager, Invesco Indexing LLC; Director, Invesco Investment Advisers LLC (formerly known as Van Kampen Asset Management); President, Trimark Investments Ltd/Services Financiers Invesco Ltee; Director and Senior Vice President, Invesco Insurance Agency, Inc.; Director and Senior Vice President, Invesco Management Group, Inc. (formerly known as Invesco AIM Management Group, Inc.); Secretary and General Counsel, Invesco Management Group, Inc. (formerly known as Invesco AIM Management Group, Inc.); Secretary, Invesco Investment Services, Inc. (formerly known as Invesco AIM Investment Services, Inc.); Chief Legal Officer and Secretary, The Invesco Funds; Secretary and General Counsel, Invesco Investment Advisers LLC (formerly known as Van Kampen Asset Management); Secretary and General Counsel, Invesco Capital Markets, Inc. (formerly known as Van Kampen Funds Inc.); Chief Legal Officer, Invesco Exchange-Traded Fund Trust, Invesco Exchange-Traded Fund Trust II, Invesco India Exchange-Traded Fund Trust, Invesco Actively Managed Exchange-Traded Fund Trust, Invesco Actively Managed Exchange-Traded Commodity Fund Trust and Invesco Exchange-Traded Self-Indexed Fund Trust; Secretary, Invesco Indexing LLC; Director, Secretary, General Counsel and Senior Vice President, Van Kampen Exchange Corp.; Director, Vice President and Secretary, IVZ Distributors, Inc. (formerly known as INVESCO Distributors, Inc.); Director and Vice President, INVESCO Funds Group, Inc.; Director and Vice President, Van Kampen Advisors Inc.; Director, Vice President, Secretary and General Counsel, Van Kampen Investor Services Inc.; Director and Secretary, Invesco Distributors, Inc. (formerly known as Invesco AIM Distributors, Inc.); Director, Senior Vice President, General Counsel and Secretary, Invesco AIM Advisers, Inc. and Van Kampen Investments Inc.; Director, Vice President and Secretary, Fund Management Company; Director, Senior Vice President, Secretary, General Counsel and Vice President, Invesco AIM Capital Management, Inc.; and Chief Operating Officer and General Counsel, Liberty Ridge Capital, Inc. (an investment adviser) | | N/A | | N/A |
Tony Wong – 1973 Senior Vice President | | 2023 | | Senior Managing Director, Invesco Ltd.; Director, Chairman, Chief Executive Officer and President, Invesco Advisers, Inc.; Director and Chairman, Invesco Private Capital, Inc., INVESCO Private Capital Investments, Inc. and INVESCO Realty, Inc.; Director, Invesco Senior Secured Management, Inc.; President, Invesco Managed Accounts, LLC and SNW Asset Management Corporation; and Senior Vice President, The Invesco Funds Formerly: Assistant Vice President, The Invesco Funds; and Vice President, Invesco Advisers, Inc. | | N/A | | N/A |
| Stephanie C. Butcher – 1971 Senior Vice President | | 2023 | | Senior Managing Director, Invesco Ltd.; Senior Vice President, The Invesco Funds; Director and Chief Executive Officer, Invesco Asset Management Limited | | N/A | | N/A |
Adrien Deberghes – 1967 Principal Financial Officer, Treasurer and Senior Vice President | | 2020 | | Head of the Fund Office of the CFO and Fund Administration; Vice President, Invesco Advisers, Inc.; Principal Financial Officer, Treasurer and Senior Vice President, The Invesco Funds; and Vice President, Invesco Exchange-Traded Fund Trust, Invesco Exchange-Traded Fund Trust II, Invesco India Exchange-Traded Fund Trust, Invesco Actively Managed Exchange-Traded Fund Trust, Invesco Actively Managed Exchange-Traded Commodity Fund Trust and Invesco Exchange-Traded Self-Indexed Fund Trust Formerly: Vice President, The Invesco Funds; Senior Vice President and Treasurer, Fidelity Investments | | N/A | | N/A |
Crissie M. Wisdom – 1969 Anti-Money Laundering Compliance Officer | | 2013 | | Anti-Money Laundering and OFAC Compliance Officer for Invesco U.S. entities including: Invesco Advisers, Inc. and its affiliates, Invesco Capital Markets, Inc., Invesco Distributors, Inc., Invesco Investment Services, Inc., The Invesco Funds, Invesco Capital Management, LLC, Invesco Trust Company; and Fraud Prevention Manager for Invesco Investment Services, Inc. | | N/A | | N/A |
Todd F. Kuehl – 1969 Chief Compliance Officer and Senior Vice President | | 2020 | | Chief Compliance Officer, Invesco Advisers, Inc. (registered investment adviser); and Chief Compliance Officer and Senior Vice President, The Invesco Funds Formerly: Managing Director and Chief Compliance Officer, Legg Mason (Mutual Funds); Chief Compliance Officer, Legg Mason Private Portfolio Group (registered investment adviser) | | N/A | | N/A |
T-5 Invesco SteelPath MLP Alpha Plus Fund
Trustees and Officers—(continued)
| | | | | | | | |
Name, Year of Birth and
Position(s) Held with the Trust | | Trustee
and/or
Officer
Since | | Principal Occupation(s)
During Past 5 Years | | Number of
Funds in
Fund Complex
Overseen by
Trustee | | Other Directorship(s)
Held by Trustee During Past 5 Years |
| Officers—(continued) | | | | | | | | |
James Bordewick, Jr. – 1959 Senior Vice President and Senior Officer | | 2022 | | Senior Vice President and Senior Officer, The Invesco Funds Formerly: Chief Legal Officer, KingsCrowd, Inc. (research and analytical platform for investment in private capital markets); Chief Operating Officer and Head of Legal and Regulatory, Netcapital (private capital investment platform); Managing Director, General Counsel of asset management and Chief Compliance Officer for asset management and private banking, Bank of America Corporation; Chief Legal Officer, Columbia Funds and BofA Funds; Senior Vice President and Associate General Counsel, MFS Investment Management; Chief Legal Officer, MFS Funds; Associate, Ropes & Gray; and Associate, Gaston Snow & Ely Bartlett. | | N/A | | N/A |
The Statement of Additional Information of the Trust includes additional information about the Fund’s Trustees and is available upon request, without charge, by calling 1.800.959.4246. Please refer to the Fund’s Statement of Additional Information for information on the Fund’s sub-advisers.
Office of the Fund
11 Greenway Plaza
Houston, TX 77046-1173
Counsel to the Fund
Stradley Ronon Stevens & Young, LLP
2005 Market Street, Suite 2600
Philadelphia, PA 19103-7018
Investment Adviser
Invesco Advisers, Inc.
1331 Spring Street NW, Suite 2500
Atlanta, GA 30309
Counsel to the Independent Trustees
Sidley Austin
787 Seventh Avenue
New York, NY 10019
Distributor
Invesco Distributors, Inc.
11 Greenway Plaza
Houston, TX 77046-1173
Transfer Agent
Invesco Investment Services, Inc.
11 Greenway Plaza,
Houston, TX 77046-1173
Auditors
PricewaterhouseCoopers LLP
1000 Louisiana Street, Suite 5800
Houston, TX 77002-5021
Custodian
UMB Bank, n.a.
1010 Grand Boulevard
Kansas City, MO 64106
T-6 Invesco SteelPath MLP Alpha Plus Fund

Go paperless with eDelivery
Visit invesco.com/edelivery to enjoy the convenience and security of anytime electronic access to your investment documents.
With eDelivery, you can elect to have any or all of the following materials delivered straight to your inbox to download, save and print from your own computer:
| • | | Fund reports and prospectuses |
Invesco mailing information
Send general correspondence to Invesco Investment Services, Inc., P.O. Box 219078, Kansas City, MO 64121-9078.
Important notice regarding delivery of security holder documents
To reduce Fund expenses, only one copy of most shareholder documents may be mailed to shareholders with multiple accounts at the same address (Householding). Mailing of your shareholder documents may be householded indefinitely unless you instruct us otherwise. If you do not want the mailing of these documents to be combined with those for other members of your household, please contact Invesco Investment Services, Inc. at 800 959 4246 or contact your financial institution. We will begin sending you individual copies for each account within 30 days after receiving your request.
Fund holdings and proxy voting information
The Fund provides a complete list of its portfolio holdings four times each year, at the end of each fiscal quarter. For the second and fourth quarters, the list appears, respectively, in the Fund’s semiannual and annual reports to shareholders. For the first and third quarters, the Fund files the list with the Securities and Exchange Commission (SEC) as an exhibit to its reports on Form N-PORT. The most recent list of portfolio holdings is available at invesco.com/completeqtrholdings. Shareholders can also look up the Fund’s Form N-PORT filings on the SEC website, sec.gov. The SEC file numbers for the Fund are shown below.
A description of the policies and procedures that the Fund uses to determine how to vote proxies relating to portfolio securities is available without charge, upon request, from our Client Services department at 800 959 4246, or at invesco.com/corporate/about-us/esg. The information is also available on the SEC website, sec.gov.
Information regarding how the Fund voted proxies related to its portfolio securities during the most recent 12-month period ended June 30 is available at invesco.com/proxysearch. This information is also available on the SEC website, sec.gov.
Invesco Advisers, Inc. is an investment adviser; it provides investment advisory services to individual and institutional clients and does not sell securities. Invesco Distributors, Inc. is the US distributor for Invesco Ltd.’s retail mutual funds, exchange-traded funds and institutional money market funds. Both are wholly owned, indirect subsidiaries of Invesco Ltd.
| | | | | | |
SEC file numbers: 811-05426 and 033-19338 | | Invesco Distributors, Inc. | | | 0-SPMAP-AR-1 | |

| | | | |
| Annual Report to Shareholders | | | November 30, 2023 | |
| | | | |
| Invesco SteelPath MLP Income Fund | |
| |
| | | | |
| Nasdaq: | |
| A: MLPDX ∎ C: MLPRX ∎ R: SPNNX ∎ Y: MLPZX ∎ R5: SPMQX ∎ R6: OSPMX | |
Beginning in July 2024, amendments adopted by the Securities and Exchange Commission will substantially impact the design, content, and delivery of shareholder reports. These newly designed shareholder reports will highlight key fund information in a clear and concise format and must be mailed to each shareholder that has not elected to receive the reports electronically. Other information, including financial statements, will no longer be included in the shareholder report but will be available at invesco.com/reports, delivered upon request, and filed on a semi-annual basis on Form N-CSR.
If you would like to receive shareholder reports and other communications electronically instead of by mail, you may make that request by contacting your financial intermediary (such as a broker-dealer or bank) or, if you are a direct investor, by enrolling at invesco.com/edelivery. If you do not make this request or enroll in e-delivery, you will receive future shareholder reports and other communications by mail.
Management’s Discussion of Fund Performance
| | | | |
| Performance summary | | | | |
For the fiscal year ended November 30, 2023, Class A shares of Invesco SteelPath MLP Income Fund (the Fund), at net asset value (NAV), outperformed the S&P 500® Index. Your Fund’s long-term performance appears later in this report. | | | | |
| | | | |
| |
| | | | |
| Fund vs. Indexes | | | | |
| Total returns, 11/30/22 to 11/30/23, at net asset value (NAV). Performance shown does not include applicable contingent deferred sales charges (CDSC) or front-end sales charges, which would have reduced performance. | |
| Class A Shares | | | 19.13 | % |
| Class C Shares | | | 18.38 | |
| Class R Shares | | | 18.94 | |
| Class Y Shares | | | 19.56 | |
| Class R5 Shares | | | 19.54 | |
| Class R6 Shares | | | 19.48 | |
| S&P 500 Index | | | 13.84 | |
| Alerian MLP Index | | | 23.29 | |
| |
| Source(s): RIMES Technologies Corp. | | | | |
Fund Performance Discussion
The Fund’s Class A shares (without sales charge) produced a total return of 19.13% during the fiscal year ended November 30, 2023. In comparison, master limited partnerships (MLPs), as measured by the Alerian MLP Index (AMZ), generated a total return of 23.29%. Please note that the returns for the Alerian MLP Index are calculated pre-tax, while the Fund’s returns are calculated post corporate tax. Over the same period, the S&P 500 Index produced a total return of 13.84%.
Over the fiscal year, global equity markets were choppy as market participants weighed continued inflation concerns, rising interest rates, worry over Chinese economic conditions, and the ongoing war between Russia and Ukraine. Commodity prices were mostly lower, but energy stocks generally traded higher, midstream equities included.
Midstream sector participants benefitted from record U.S. production of crude oil and natural gas during the period, with crude oil volumes in September 2023 finally exceeding the 2019 highs. Natural gas production volumes continued to benefit from robust exports driven by higher international pricing relative to domestic prices. Despite continued volume growth, midstream equities still traded at discounted valuations relative to history.
Over the fiscal year, we estimate a de minimis amount of equity supply entered the market through secondary offerings, initial public offerings, preferred offerings, or “at-the-market” programs in which primary units trade into the market anonymously throughout the normal trading day. Most midstream MLPs pay out substantial distributions to investors and, therefore, have historically raised external capital to fund larger growth projects or acquisitions. However, in recent years most sector participants have adjusted their business models to self-fund the equity portion of their investment plans and repurchase
discounted equity. Wells Fargo estimates that during the first three quarters of 2023 midstream companies collectively repurchased over $3 billion of stock.
Macro Review
West Texas Intermediate (WTI) crude oil prices ended the period at $75.96 per barrel, down 6% over the year, while global crude prices, as measured by Brent crude oil, traded 3% lower over the fiscal year. During the period, crude prices approached $100 per barrel before drifting lower. Henry Hub natural gas prices exited November 2023 at $2.80 per million British thermal units (mmbtu), down 60% over the fiscal year driven by softening export demand as Europe normalized after the initial escalation associated with the onset of the Russia-Ukraine war in the prior period. Regional price differentials improved in most basins, including the Permian basin where new takeaway capacity was added via pipeline expansions.
Mont Belvieu natural gas liquids (NGL) prices ended the fiscal year at $28.35 per barrel, a 14% decrease over the fiscal year. Pricing for NGL purity products was mixed, with isobutane ending the period 25% higher than the start of the fiscal year while ethane, butane, propane, and natural gasoline all traded lower. Frac spreads, a measure of natural gas processing economics, ended the period at $0.43 per gallon, more than doubling over the fiscal year. Generally, the greater the frac spread, the greater the incentive for producers to seek natural gas processing capacity.
The yield curve remained inverted, and generally steepened, over the period as short rates rose more than the yields on medium-dated maturities. The 10-year Treasury yield rose by 72 basis points to end the period at 4.33%. The MLP yield spread at fiscal year-end, as measured by the AMZ and the 10-year Treasury bond, narrowed by 15 basis points to 3.27%.
Over the fiscal year, real estate investment trusts (REITs) and utilities, two competing yield-oriented equity asset classes, posted total returns of -2.78% (as measured by the Dow Jones Equity REIT Total Return Index) and -8.16% (as measured by the Dow Jones Utility Average Index), respectively, as compared to the AMZ’s +23.29% total return.
Subsector Reviews
Performance for all subsectors in the midstream, or energy infrastructure, asset class was positive over the fiscal year. On average, sector participants in the Compression subsector provided the strongest performance over the period supported by rising natural gas production volumes and increased utilization. The Diversified subsector also outperformed, also benefitting from increasing production volumes and generally improving demand.
The Natural Gas Pipeline subsector experienced the weakest, albeit positive, performance over the fiscal year driven by idiosyncratic factors from one subsector member. Similarly, average performance for the Propane subsector was weighed down by very weak performance of a single subsector participant.
Fund Review
Key contributors to the Invesco SteelPath MLP Income Fund for the fiscal year ended November 30, 2023 were USA Compression Partners L.P. (NYSE: USAC) and Plains All American Pipeline L.P. (NYSE: PAA).
USAC units outperformed over the period after reporting better than expected financial and operating results. Additionally, compression names are benefitting from strong utilization factors driving improved pricing power. Late in the reporting period USAC was added as a qualifying business activity for inclusion in the Alerian MLP Infrastructure Index, making USAC eligible for index inclusion at the next rebalancing. USAC is one of the largest operators of compression units in the industry with operations in the most active basins in the U.S. including the Permian, Marcellus, and Eagle Ford.
PAA outperformed over the period after reporting better than expected financial and operating results and as market participants appeared to place increased scarcity value in Plains’ crude oil-focused business. We believe that PAA maintains a leading position in crude oil gathering and transportation from the Permian Basin, a natural gas liquids focused position in Canada, strong distribution coverage, and an improved balance sheet.
Key detractors from the Invesco SteelPath MLP Income Fund for the fiscal year ended November 30, 2023 were KNOT Offshore Partners L.P. (NYSE: KNOP) and Martin Midstream Partners L.P. (NYSE: MMLP).
SteelPath MLP Income Fund
KNOP units underperformed over the period after reducing its dividend to fund a leverage reduction plan and to improve operational flexibility during a period of soft charter rates. KNOP operates shuttle tankers under long-term charters predominately in offshore Brazil and in the North Sea.
MMLP units underperformed over the period after reporting weak financial and operating results and reducing guidance. Despite the weaker than expected results, we believe the company has continued to work to right size the balance sheet. MMLP is a diversified specialty services midstream business operating four key business segments: Terminalling and Storage, Sulfur Services, Transportation, and Natural Gas Liquids.
Outlook
Despite midstream equities outperforming the S&P 500 Index for several years, we believe the sector remains well positioned to continue providing investors with an attractive yield and total return experience over the coming years. In our view, valuations remain attractive and fundamentals support expectations for modest cash flow growth for most sector participants, particularly those with business segments focused on key producing basins and those that support activities to export crude oil, refined products, liquified petroleum gases (LGPs), and/or liquified natural gas (LNG).
All data, unless otherwise noted, sourced from Bloomberg LP as of November 30, 2023.
Portfolio managers:
Stuart Cartner
Brian Watson
The views and opinions expressed in management’s discussion of Fund performance are those of Invesco Advisers, Inc. and its affiliates. These views and opinions are subject to change at any time based on factors such as market and economic conditions. These views and opinions may not be relied upon as investment advice or recommendations, or as an offer for a particular security. The information is not a complete analysis of every aspect of any market, country, industry, security or the Fund. Statements of fact are from sources considered reliable, but Invesco Advisers, Inc. makes no representation or warranty as to their completeness or accuracy. Although historical performance is no guarantee of future results, these insights may help you understand our investment management philosophy.
See important Fund and, if applicable, index disclosures later in this report.
3 Invesco SteelPath MLP Income Fund
Your Fund’s Long-Term Performance
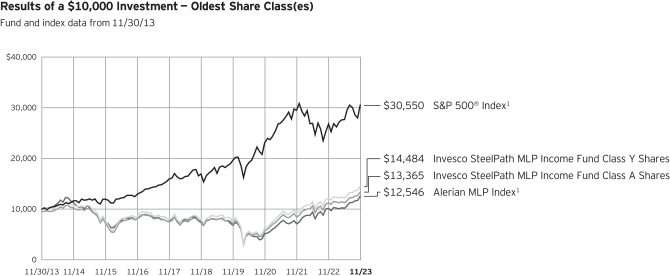
1 Source: RIMES Technologies Corp.
Past performance cannot guarantee future results.
The data shown in the chart include reinvested distributions, applicable sales charges and Fund expenses including
management fees. Index results include reinvested dividends, but they do not reflect sales charges. Performance of the peer group, if applicable, reflects fund expenses and management fees;
performance of a market index does not. Performance shown in the chart does not reflect deduction of taxes a shareholder would pay on Fund distributions or sale of Fund shares.
4 Invesco SteelPath MLP Income Fund
| | | | |
| Average Annual Total Returns | | | | |
| As of 11/30/23, including maximum applicable sales charges | |
Class A Shares | | | | |
Inception (3/31/10) | | | 4.82 | % |
10 Years | | | 2.94 | |
5 Years | | | 11.48 | |
1 Year | | | 12.47 | |
Class C Shares | | | | |
Inception (6/10/11) | | | 4.05 | % |
10 Years | | | 2.93 | |
5 Years | | | 11.94 | |
1 Year | | | 17.38 | |
Class R Shares | | | | |
10 Years | | | 3.26 | % |
5 Years | | | 12.47 | |
1 Year | | | 18.94 | |
Class Y Shares | | | | |
Inception (3/31/10) | | | 5.50 | % |
10 Years | | | 3.77 | |
5 Years | | | 13.02 | |
1 Year | | | 19.56 | |
Class R5 Shares | | | | |
10 Years | | | 3.67 | % |
5 Years | | | 13.07 | |
1 Year | | | 19.54 | |
Class R6 Shares | | | | |
Inception (6/28/13) | | | 3.88 | % |
10 Years | | | 3.85 | |
5 Years | | | 13.09 | |
1 Year | | | 19.48 | |
Effective after the close of business on May 24, 2019, Class A, Class C, Class Y and Class I shares of the Oppenheimer SteelPath MLP Income Fund (the predecessor fund), were reorganized into Class A, Class C, Class Y and Class R6 shares, respectively, of the Invesco Oppenheimer SteelPath MLP Income Fund. The Fund was subsequently renamed the Invesco SteelPath MLP Income Fund (the Fund). Returns shown above, for periods ending on or prior to May 24, 2019, for Class A, Class C, Class Y and Class R6 shares are those for Class A, Class C, Class Y and Class I shares of the predecessor fund. Share class returns will differ from the predecessor fund because of different expenses.
Class R and R5 shares incepted after the close of business on May 24, 2019. Performance shown on and prior to that date is that of the predecessor fund’s Class A shares at net asset value and includes the 12b-1 fees applicable to Class A shares.
The performance data quoted represent past performance and cannot guarantee future results; current performance may be lower or higher. Please visit invesco.com/performance for the most recent month-end performance.
Performance figures reflect reinvested distributions, changes in net asset value and the effect of the maximum sales charge unless otherwise stated. Performance figures do not reflect deduction of taxes a shareholder would pay on Fund distributions or sale of Fund shares. Investment return and principal value will fluctuate so that you may have a gain or loss when you sell shares.
Class A share performance reflects the maximum 5.50% sales charge, and Class C share performance reflects the applicable contingent deferred sales charge (CDSC) for the period involved. The CDSC on Class C shares is 1% for the first year after purchase. Class R, Class Y, Class R5 and Class R6 shares do not have a front-end sales charge or a CDSC; therefore, performance is at net asset value.
The performance of the Fund’s share classes will differ primarily due to different sales charge structures and class expenses.
Fund performance reflects any applicable fee waivers and/or expense reimbursements. Had the adviser not waived fees and/or reimbursed expenses currently or in the past, returns would have been lower.
See current prospectus for more information.
5 Invesco SteelPath MLP Income Fund
Supplemental Information
Invesco SteelPath MLP Income Fund’s investment objective is to seek total return.
| • | | Unless otherwise stated, information presented in this report is as of November 30, 2023, and is based on total net assets. |
| • | | Unless otherwise noted, all data is provided by Invesco. |
| • | | To access your Fund’s reports/prospectus, visit invesco.com/fundreports. |
About indexes used in this report
| • | | The S&P 500® Index is an unmanaged index considered representative of the US stock market. |
| • | | The Alerian MLP Index is designed to capture the performance of energy master limited partnerships (MLPs). |
| • | | The Fund is not managed to track the performance of any particular index, including the index(es) described here, and consequently, the performance of the Fund may deviate significantly from the performance of the index(es). |
| • | | A direct investment cannot be made in an index. Unless otherwise indicated, index results include reinvested dividends, and they do not reflect sales charges. Performance of the peer group, if applicable, reflects fund expenses; performance of a market index does not. |
This report must be accompanied or preceded by a currently effective Fund prospectus, which contains more complete information, including sales charges and expenses. Investors should read it carefully before investing.
NOT FDIC INSURED | MAY LOSE VALUE | NO BANK GUARANTEE
6 Invesco SteelPath MLP Income Fund
Fund Information
| | | | |
| Portfolio Composition | | | |
| |
| By Sector | | % of total net assets | |
Diversified | | | 36.41 | % |
Gathering & Processing | | | 28.84 | |
Petroleum Pipeline Transportation | | | 22.96 | |
Other Energy | | | 18.15 | |
Terminalling & Storage | | | 0.53 | |
Natural Gas Pipeline Transportation | | | 0.05 | |
Money Market Funds Plus Other Assets Less Liabilities | | | (6.94 | ) |
| |
| | | | |
Top 10 Master Limited Partnership and Related Entity
Holdings* | |
| |
| | | % of total net assets | |
1. Energy Transfer L.P. | | | 14.52 | % |
2. MPLX L.P. | | | 13.75 | |
3. Western Midstream Partners L.P. | | | 12.27 | |
4. Plains All American Pipeline L.P. | | | 8.98 | |
5. Antero Midstream Corp. | | | 8.89 | |
6. NuStar Energy L.P. | | | 8.21 | |
7. Enterprise Products Partners L.P. | | | 8.13 | |
8. USA Compression Partners L.P. | | | 6.93 | |
9. EnLink Midstream LLC | | | 5.70 | |
10. Sunoco L.P. | | | 3.76 | |
The Fund’s holdings are subject to change, and there is no assurance that the Fund will continue to hold any particular security. * Excluding money market fund holdings, if any. Data presented here are as of November 30, 2023. | |
7 Invesco SteelPath MLP Income Fund
Schedule of Investments
November 30, 2023
| | | | | | | | |
| | | Units | | | Value | |
Master Limited Partnerships And Related Entities–106.81% | |
| Diversified–36.41% | |
Energy Transfer L.P. | | | 35,565,345 | | | $ | 494,002,634 | |
Enterprise Products Partners L.P. | | | 10,325,000 | | | | 276,503,500 | |
MPLX L.P. | | | 12,829,596 | | | | 467,767,070 | |
| | | | | | | | 1,238,273,204 | |
| Gathering & Processing–28.84% | |
Antero Midstream Corp. | | | 22,694,063 | | | | 302,284,919 | |
EnLink Midstream LLC | | | 14,182,821 | | | | 193,879,163 | |
Evolve Transition Infrastructure L.P.(a) | | | 58,251 | | | | 93,202 | |
Hess Midstream L.P., Class A | | | 1,600,000 | | | | 52,064,000 | |
Summit Midstream Partners L.P.(a)(b) | | | 738,629 | | | | 15,289,620 | |
Western Midstream Partners L.P. | | | 13,990,090 | | | | 417,184,484 | |
| | | | | | | | 980,795,388 | |
| Other Energy–18.07% | |
Arko Corp. | | | 1,626,925 | | | | 12,169,399 | |
CrossAmerica Partners L.P.(b) | | | 3,748,183 | | | | 88,944,383 | |
Enviva, Inc. | | | 100,000 | | | | 122,000 | |
Global Partners L.P.(b) | | | 2,587,261 | | | | 94,253,918 | |
KNOT Offshore Partners L.P.(b) | | | 1,776,804 | | | | 9,541,438 | |
Kodiak Gas Services, Inc.(a) | | | 1,000,000 | | | | 17,630,000 | |
Suburban Propane Partners L.P. | | | 619,626 | | | | 10,626,586 | |
Sunoco L.P. | | | 2,337,543 | | | | 127,770,100 | |
USA Compression Partners L.P.(b) | | | 9,895,746 | | | | 235,617,712 | |
Westlake Chemical Partners L.P. | | | 800,000 | | | | 18,120,000 | |
| | | | | | | | 614,795,536 | |
| Petroleum Pipeline Transportation–22.96% | |
Delek Logistics Partners L.P. | | | 941,387 | | | | 48,161,359 | |
Genesis Energy L.P.(b) | | | 7,495,932 | | | | 94,148,906 | |
NGL Energy Partners L.P.(a)(b) | | | 12,412,037 | | | | 53,744,120 | |
NuStar Energy L.P.(b) | | | 14,668,026 | | | | 279,279,215 | |
Phillips 66 Partners L.P. | | | 500 | | | | 64,445 | |
Plains All American Pipeline L.P. | | | 19,233,333 | | | | 305,425,328 | |
| | | | | | | | 780,823,373 | |
| | | | | | | | |
| | | Units | | | Value | |
| Terminalling & Storage–0.53% | |
Martin Midstream Partners L.P.(b) | | | 7,026,434 | | | $ | 18,128,200 | |
Total Master Limited Partnerships And Related Entities
(Cost $2,291,476,895) | | | | 3,632,815,701 | |
Common Stocks–0.05% | |
| Natural Gas Pipeline Transportation–0.05% | |
Kinetik Holdings, Inc. | | | 50,000 | | | | 1,818,000 | |
Total Common Stocks
(Cost $1,803,264) | | | | 1,818,000 | |
Preferred Master Limited Partnerships And Related Entities–0.08% | |
| Other Energy–0.08% | |
Global Partners L.P., 9.50%
(Cost $2,500,000) | | | 100,000 | | | | 2,565,000 | |
| | |
| | | Shares | | | | |
Money Market Funds–0.64% | |
Fidelity Treasury Portfolio, Institutional Class, 5.17%
(Cost $21,710,513)(c) | | | 21,710,513 | | | | 21,710,513 | |
TOTAL INVESTMENTS IN SECURITIES–107.58%
(Cost $2,317,490,672) | | | | 3,658,909,214 | |
OTHER ASSETS LESS LIABILITIES–(7.58)% | | | | (257,834,514 | ) |
NET ASSETS–100% | | | | | | $ | 3,401,074,700 | |
See accompanying Notes to Financial Statements which are an integral part of the financial statements.
8 Invesco SteelPath MLP Income Fund
Notes to Schedule of Investments:
| (a) | Non-income producing. |
| (b) | Affiliated holding. Affiliated holdings are investments in entities which are under common ownership or control of Invesco Ltd. or are investments in entities in which the Fund owns 5% or more of the outstanding voting securities. The table below shows the Fund’s transactions in, and earnings from, its investments in affiliates for the fiscal year ended November 30, 2023. |
| | | | | | | | | | | | | | | | | | | | | | | | | | | | | | | | | | | | |
| | | | | | | | | | | | | | | | | | | | | Dividends and Distributions | |
| Investments in Other Affiliates: | | Value
November 30,
2022 | | | Purchases
at Cost | | | Proceeds
from Sales | | | Change in
Unrealized
Appreciation
(Depreciation) | | | Realized
Gain (Loss) | | | Value
November 30,
2023 | | | Return of
Capital | | | Capital
Gains | | | Income | |
MLP Investments and Related Entities | | | | | | | | | | | | | | | | | | | | | | | | | | | | | | | | | | | | |
Antero Midstream Corp.i,ii | | $ | 265,054,734 | | | $ | 9,248,680 | | | $ | (19,657,389 | ) | | $ | 51,960,290 | | | $ | 14,331,541 | | | $ | 302,284,919 | | | $ | (18,652,937 | ) | | $ | — | | | $ | 2,728,928 | |
CrossAmerica Partners L.P. | | | 75,001,142 | | | | — | | | | — | | | | 21,814,425 | | | | — | | | | 88,944,383 | | | | (7,871,184 | ) | | | — | | | | — | |
Genesis Energy L.P. | | | 81,346,001 | | | | 1,098,810 | | | | (2,966,780 | ) | | | 19,777,623 | | | | (4,343,057 | ) | | | 94,148,906 | | | | (763,691 | ) | | | 3,808,869 | | | | — | |
Global Partners L.P. | | | 127,503,020 | | | | 1,604,542 | | | | (44,385,230 | ) | | | (13,783,405 | ) | | | 32,707,665 | | | | 94,253,918 | | | | (9,392,674 | ) | | | — | | | | — | |
KNOT Offshore Partners L.P. | | | 20,362,174 | | | | — | | | | — | | | | (10,635,948 | ) | | | — | | | | 9,541,438 | | | | (184,788 | ) | | | — | | | | — | |
Martin Midstream Partners L.P. | | | 22,976,439 | | | | — | | | | — | | | | (4,709,105 | ) | | | — | | | | 18,128,200 | | | | (139,134 | ) | | | 1,394 | | | | — | |
NGL Energy Partners L.P. | | | 14,522,083 | | | | — | | | | — | | | | 39,222,037 | | | | — | | | | 53,744,120 | | | | — | | | | — | | | | — | |
NuStar Energy L.P. | | | 231,363,865 | | | | 20,728,126 | | | | (12,552,000 | ) | | | 69,972,617 | | | | (7,219,502 | ) | | | 279,279,215 | | | | (23,013,891 | ) | | | 1,314,950 | | | | — | |
Summit Midstream Partners L.P. | | | 15,289,620 | | | | — | | | | — | | | | — | | | | — | | | | 15,289,620 | | | | — | | | | — | | | | — | |
Sunoco L.P.ii | | | 235,377,456 | | | | — | | | | (151,200,117 | ) | | | (75,237,295 | ) | | | 123,305,222 | | | | 127,770,100 | | | | (4,475,166 | ) | | | 7,781,686 | | | | — | |
USA Compression Partners L.P. | | | 231,948,217 | | | | — | | | | (63,203,046 | ) | | | 33,369,873 | | | | 40,062,841 | | | | 235,617,712 | | | | (6,560,173 | ) | | | 17,142,658 | | | | — | |
| | $ | 1,320,744,751 | | | $ | 32,680,158 | | | $ | (293,964,562 | ) | | $ | 131,751,112 | | | $ | 198,844,710 | | | $ | 1,319,002,531 | | | $ | (71,053,638 | ) | | $ | 30,049,557 | | | $ | 2,728,928 | |
| i. | As of November 30, 2022, the security was not considered as an affiliate of the Fund. |
| ii. | As of November 30, 2023, the security was not considered as an affiliate of the Fund. |
| (c) | The rate shown is the 7-day SEC standardized yield as of November 30, 2023. |
See accompanying Notes to Financial Statements which are an integral part of the financial statements.
9 Invesco SteelPath MLP Income Fund
Statement of Assets and Liabilities
November 30, 2023
| | | | |
Assets: | | | | |
Investments in unaffiliated securities, at value (cost $1,345,922,172) | | $ | 2,769,961,702 | |
Investments in affiliates, at value (cost $971,568,500) | | | 888,947,512 | |
Receivable for: | | | | |
Investments sold | | | 3,099,065 | |
Fund shares sold | | | 1,730,096 | |
Dividends | | | 172,612 | |
Cash | | | 522,029 | |
Investment for trustee deferred compensation and retirement plans | | | 95,633 | |
Prepaid state income tax | | | 199,044 | |
Other assets | | | 219,725 | |
Total assets | | | 3,664,947,418 | |
| |
| | | | |
Liabilities: | | | | |
Payables for: | | | | |
Fund shares reacquired | | | 1,858,742 | |
Accrued fees to affiliates | | | 3,867,086 | |
Accrued interest expense | | | 41,018 | |
Accrued trustees’ and officers’ fees and benefits | | | 10,488 | |
Accrued other operating expenses | | | 582,988 | |
Deferred tax liability, net | | | 257,416,763 | |
Trustee deferred compensation and retirement plans | | | 95,633 | |
Total liabilities | | | 263,872,718 | |
Net assets applicable to shares outstanding | | $ | 3,401,074,700 | |
| |
| | | | |
Net assets consist of: | | | | |
Shares of beneficial interest | | $ | 3,183,046,395 | |
Distributable earnings, net of taxes | | | 218,028,305 | |
| | | $ | 3,401,074,700 | |
| | | | |
Net Assets: | | | | |
Class A | | $ | 1,727,857,748 | |
Class C | | $ | 524,670,516 | |
Class R | | $ | 3,538,737 | |
Class Y | | $ | 1,099,958,123 | |
Class R5 | | $ | 732,355 | |
Class R6 | | $ | 44,317,221 | |
| |
| | | | |
Shares outstanding, no par value, with an unlimited number of shares authorized: | |
Class A | | | 332,849,261 | |
Class C | | | 122,575,676 | |
Class R | | | 692,404 | |
Class Y | | | 197,108,723 | |
Class R5 | | | 138,671 | |
Class R6 | | | 7,825,952 | |
Class A: | | | | |
Net asset value per share | | $ | 5.19 | |
Maximum offering price per share
(net asset value $5.19 ÷ 94.50%) | | $ | 5.49 | |
Class C: | | | | |
Net asset value and offering price per share | | $ | 4.28 | |
Class R: | | | | |
Net asset value and offering price per share | | $ | 5.11 | |
Class Y: | | | | |
Net asset value and offering price per share | | $ | 5.58 | |
Class R5: | | | | |
Net asset value and offering price per share | | $ | 5.28 | |
Class R6: | | | | |
Net asset value and offering price per share | | $ | 5.66 | |
See accompanying Notes to Financial Statements which are an integral part of the financial statements.
10 Invesco SteelPath MLP Income Fund
Statement of Operations
For the year ended November 30, 2023
| | | | |
Investment income: | | | | |
Distributions and dividends ($2,728,928 income from affiliates) | | $ | 271,425,694 | |
Less: return of capital on distributions and dividends ($71,053,638 from affiliates) | | | (220,747,078 | ) |
Less: return of capital on distributions and dividends in excess of cost basis ($30,049,557 from affiliates) | | | (43,452,185 | ) |
Total investment income | | | 7,226,431 | |
| |
| | | | |
Expenses: | | | | |
Advisory fees | | | 29,408,156 | |
Administrative services fees | | | 1,004,771 | |
Custodian fees | | | 153,746 | |
Distribution fees: | | | | |
Class A | | | 3,958,789 | |
Class C | | | 4,906,619 | |
Class R | | | 15,234 | |
Transfer agent fees — A, C, R and Y | | | 3,283,762 | |
Transfer agent fees — R5 | | | 31 | |
Transfer agent fees — R6 | | | 11,531 | |
Interest, facilities and maintenance fees | | | 665,179 | |
State income tax expense | | | 686,771 | |
Trustees’ and officers’ fees and benefits | | | 44,927 | |
Registration and filing fees | | | 154,942 | |
Reports to shareholders | | | 189,439 | |
Professional services fees | | | 188,187 | |
Other | | | 42,421 | |
Total expenses, before waivers and deferred taxes | | | 44,714,505 | |
Less: Expenses reimbursed | | | (433,863 | ) |
Net expenses, before deferred taxes | | | 44,280,642 | |
Net investment income (loss), before deferred taxes | | | (37,054,211 | ) |
Net deferred tax benefit | | | 9,223,626 | |
Net investment income (loss), net of deferred taxes | | | (27,830,585 | ) |
| |
| | | | |
| |
Realized and unrealized gain (loss) from: | | | | |
Net realized gain (loss) from: | | | | |
Unaffiliated investment securities (net return of capital in excess of cost basis of $13,402,628)
(includes net gain from securities sold to affiliates of $6,806,168) | | | 233,600,382 | |
Affiliated investment securities (net return of capital in excess of cost basis of $30,049,557) | | | 198,844,710 | |
Net deferred tax (expense)/benefit | | | (97,300,146 | ) |
Net realized gain, net of taxes | | | 335,144,946 | |
Change in net unrealized appreciation (depreciation) of: | | | | |
Unaffiliated investment securities | | | 188,011,742 | |
Affiliated investment securities | |
| 131,751,112
|
|
Net deferred tax (expense)/benefit | | | (71,946,642 | ) |
Net change in net unrealized appreciation of investment securities, net of deferred taxes | | | 247,816,212 | |
Net realized and unrealized gain, net of deferred tax | | | 582,961,158 | |
Net increase in net assets resulting from operations | | $ | 555,130,573 | |
See accompanying Notes to Financial Statements which are an integral part of the financial statements.
11 Invesco SteelPath MLP Income Fund
Statement of Changes in Net Assets
For the years ended November 30, 2023 and 2022
| | | | | | | | |
| | | 2023 | | | 2022 | |
Operations: | | | | | | | | |
Net investment income (loss), net of deferred taxes | | $ | (27,830,585 | ) | | $ | (4,396,154 | ) |
Net realized gain, net of deferred taxes | | | 335,144,946 | | | | 156,639,784 | |
Change in net unrealized appreciation, net of deferred taxes | | | 247,816,212 | | | | 599,414,310 | |
Net increase in net assets resulting from operations | |
| 555,130,573
|
| | | 751,657,940 | |
| | |
| | | | | | | | |
Distributions to shareholders from distributable earnings: | | | | | | | | |
Class A | | | (130,925,202 | ) | | | (39,965,900 | ) |
Class C | | | (48,484,514 | ) | | | (15,884,962 | ) |
Class R | | | (257,181 | ) | | | (58,531 | ) |
Class Y | | | (75,930,244 | ) | | | (22,309,002 | ) |
Class R5 | | | (11,318 | ) | | | (220 | ) |
Class R6 | | | (2,939,974 | ) | | | (894,192 | ) |
Total distributions from distributable earnings | | | (258,548,433 | ) | | | (79,112,807 | ) |
| | |
| | | | | | | | |
Return of capital: | | | | | | | | |
Class A | | | — | | | | (86,185,444 | ) |
Class C | | | — | | | | (34,255,515 | ) |
Class R | | | — | | | | (126,221 | ) |
Class Y | | | — | | | | (48,108,792 | ) |
Class R5 | | | — | | | | (476 | ) |
Class R6 | | | — | | | | (1,928,302 | ) |
Total return of capital | | | — | | | | (170,604,750 | ) |
Total distributions | | | (258,548,433 | ) | | | (249,717,557 | ) |
| | |
| | | | | | | | |
Share transactions–net: | | | | | | | | |
Class A | | | 16,755,863 | | | | 43,360,652 | |
Class C | | | (600,705 | ) | | | (46,982,083 | ) |
Class R | | | 645,461 | | | | 687,130 | |
Class Y | | | 53,192,751 | | | | 152,665,233 | |
Class R5 | | | 690,111 | | | | — | |
Class R6 | | | 3,735,860 | | | | (3,360,276 | ) |
Net increase in net assets resulting from share transactions | | | 74,419,341 | | | | 146,370,656 | |
Net increase in net assets | | | 371,001,481 | | | | 648,311,039 | |
| | |
| | | | | | | | |
Net assets: | | | | | | | | |
Beginning of year | | | 3,030,073,219 | | | | 2,381,762,180 | |
End of year | | $ | 3,401,074,700 | | | $ | 3,030,073,219 | |
See accompanying Notes to Financial Statements which are an integral part of the financial statements.
12 Invesco SteelPath MLP Income Fund
Financial Highlights
| | | | | | | | | | | | | | | | | | | | |
| | | Years Ended November 30, | |
| Class A | | 2023 | | | 2022 | | | 2021 | | | 2020 | | | 2019 | |
Per share operating data | | | | | | | | | | | | | | | | | | | | |
Net asset value, beginning of period | | $ | 4.73 | | | $ | 3.90 | | | $ | 2.95 | | | $ | 4.32 | | | $ | 5.14 | |
Net investment income (loss)(a) | | | (0.04 | ) | | | (0.00 | ) | | | (0.04 | ) | | | (0.03 | ) | | | (0.06 | ) |
Return of capital(a) | | | 0.26 | | | | 0.24 | | | | 0.25 | | | | 0.31 | | | | 0.40 | |
Net realized and unrealized gain (loss) | | | 0.64 | | | | 0.98 | | | | 1.13 | | | | (1.11 | ) | | | (0.48 | ) |
Total from investment operations | | | 0.86 | | | | 1.22 | | | | 1.34 | | | | (0.83 | ) | | | (0.14 | ) |
Less: | | | | | | | | | | | | | | | | | | | | |
Return of capital | | | — | | | | (0.27 | ) | | | (0.39 | ) | | | (0.54 | ) | | | (0.68 | ) |
Dividends from net investment income | | | (0.40 | ) | | | (0.12 | ) | | | — | | | | — | | | | — | |
Total distributions | | | (0.40 | ) | | | (0.39 | ) | | | (0.39 | ) | | | (0.54 | ) | | | (0.68 | ) |
Net asset value, end of period | | $ | 5.19 | | | $ | 4.73 | | | $ | 3.90 | | | $ | 2.95 | | | $ | 4.32 | |
Total return(b) | | | 19.13 | % | | | 32.37 | % | | | 46.12 | % | | | (17.70 | )% | | | (3.89 | )% |
Net assets, end of period (000’s omitted) | | $ | 1,727,858 | | | $ | 1,557,504 | | | $ | 1,247,416 | | | $ | 861,681 | | | $ | 1,162,368 | |
Portfolio turnover rate | | | 24 | % | | | 12 | % | | | 22 | % | | | 44 | % | | | 35 | % |
| | | |
Ratios/supplemental data based on average net assets: | | | | | | | | | | | | | |
Ratio of expenses: | | | | | | | | | | | | |
Without fee waivers and/or expense reimbursements, before taxes | | | 1.41 | % | | | 1.40 | % | | | 1.43 | % | | | 1.51 | % | | | 1.50 | % |
Expense (waivers) | | | (0.01 | )% | | | (0.02 | )% | | | (0.04 | )% | | | (0.05 | )% | | | (0.05 | )% |
With fee waivers and/or expense reimbursements, before taxes(c) | | | 1.40 | % | | | 1.38 | % | | | 1.39 | % | | | 1.46 | % | | | 1.45 | % |
Deferred/current tax expense (benefit)(d) | | | 5.16 | % | | | 3.51 | % | | | — | % | | | — | % | | | — | % |
With fee waivers and/or expense reimbursements, after taxes | | | 6.56 | % | | | 4.89 | % | | | 1.39 | % | | | 1.46 | % | | | 1.45 | % |
| |
Ratio of investment income (loss): | | | | | |
Ratio of net investment income (loss), before taxes | | | (1.17 | )% | | | (1.27 | )% | | | (1.14 | )% | | | (1.18 | )% | | | (1.22 | )% |
Net of expense (waivers) and before deferred tax benefit (expense) | | | (1.16 | )% | | | (1.25 | )% | | | (1.10 | )% | | | (1.13 | )% | | | (1.17 | )% |
Deferred tax benefit (expense)(e) | | | 0.30 | % | | | 1.14 | % | | | — | % | | | — | % | | | — | % |
Ratio of net investment income (loss), after taxes | | | (0.86 | )% | | | (0.11 | )% | | | (1.10 | )% | | | (1.13 | )% | | | (1.17 | )% |
| (a) | Per share net investment income (loss) is calculated based on average shares outstanding during the period net of deferred tax expense (benefit). Per share return of capital is calculated based on average shares during the period net of deferred tax expense (benefit) estimated at the combined Federal and State statutory income tax rate. |
| (b) | Includes adjustments in accordance with accounting principles generally accepted in the United States of America and as such, the net asset value for financial reporting purposes and returns based upon those net asset values may differ from the net asset value and returns for shareholder transactions. Does not include sales charges and is not annualized for periods less than one year, if applicable. |
| (c) | Includes borrowing, state income tax and franchise tax expense. Without borrowing, state income tax and franchise tax expense, the net expense ratio would be 1.35%, 1.35%, 1.35% 1.37% and 1.41%, for the years ended November 30, 2023, 2022, 2021, 2020 and 2019, respectively. |
| (d) | Deferred tax expense (benefit) estimate for the ratio calculation is derived from the net investment income (loss), and realized and unrealized gains (losses). |
| (e) | Deferred tax benefit (expense) for the ratio calculation, when applicable, is derived from net investment income (loss) only. |
See accompanying Notes to Financial Statements which are an integral part of the financial statements.
13 Invesco SteelPath MLP Income Fund
Financial Highlights—(continued)
| | | | | | | | | | | | | | | | | | | | |
| | | Years Ended November 30, | |
| Class C | | 2023 | | | 2022 | | | 2021 | | | 2020 | | | 2019 | |
Per share operating data | | | | | | | | | | | | | | | | | | | | |
Net asset value, beginning of period | | $ | 3.99 | | | $ | 3.37 | | | $ | 2.61 | | | $ | 3.92 | | | $ | 4.76 | |
Net investment income (loss)(a) | | | (0.06 | ) | | | (0.03 | ) | | | (0.06 | ) | | | (0.05 | ) | | | (0.09 | ) |
Return of capital(a) | | | 0.22 | | | | 0.21 | | | | 0.21 | | | | 0.28 | | | | 0.37 | |
Net realized and unrealized gain (loss) | | | 0.53 | | | | 0.83 | | | | 1.00 | | | | (1.00 | ) | | | (0.44 | ) |
Total from investment operations | | | 0.69 | | | | 1.01 | | | | 1.15 | | | | (0.77 | ) | | | (0.16 | ) |
Less: | | | | | | | | | | | | | | | | | | | | |
Return of capital | | | — | | | | (0.27 | ) | | | (0.39 | ) | | | (0.54 | ) | | | (0.68 | ) |
Dividends from net investment income | | | (0.40 | ) | | | (0.12 | ) | | | — | | | | — | | | | — | |
Total distributions | | | (0.40 | ) | | | (0.39 | ) | | | (0.39 | ) | | | (0.54 | ) | | | (0.68 | ) |
Net asset value, end of period | | $ | 4.28 | | | $ | 3.99 | | | $ | 3.37 | | | $ | 2.61 | | | $ | 3.92 | |
Total return(b) | | | 18.38 | % | | | 31.17 | % | | | 44.81 | % | | | (17.99 | )% | | | (4.68 | )% |
Net assets, end of period (000’s omitted) | | $ | 524,671 | | | $ | 490,026 | | | $ | 456,811 | | | $ | 436,611 | | | $ | 690,751 | |
Portfolio turnover rate | | | 24 | % | | | 12 | % | | | 22 | % | | | 44 | % | | | 35 | % |
| | | |
Ratios/supplemental data based on average net assets: | | | | | | | | | | | | | |
Ratio of expenses: | | | | | | | | | | | | |
Without fee waivers and/or expense reimbursements, before taxes | | | 2.16 | % | | | 2.15 | % | | | 2.18 | % | | | 2.26 | % | | | 2.29 | % |
Expense (waivers) | | | (0.01 | )% | | | (0.02 | )% | | | (0.04 | )% | | | (0.05 | )% | | | (0.05 | )% |
With fee waivers and/or expense reimbursements, before taxes(c) | | | 2.15 | % | | | 2.13 | % | | | 2.14 | % | | | 2.21 | % | | | 2.24 | % |
Deferred/current tax expense (benefit)(d) | | | 5.16 | % | | | 3.51 | % | | | — | % | | | — | % | | | — | % |
With fee waivers and/or expense reimbursements, after taxes | | | 7.31 | % | | | 5.64 | % | | | 2.14 | % | | | 2.21 | % | | | 2.24 | % |
| |
Ratio of investment income (loss): | | | | | |
Ratio of net investment income (loss), before taxes | | | (1.92 | )% | | | (2.02 | )% | | | (1.89 | )% | | | (1.93 | )% | | | (2.01 | )% |
Net of expense (waivers) and before deferred tax benefit (expense) | | | (1.91 | )% | | | (2.00 | )% | | | (1.85 | )% | | | (1.88 | )% | | | (1.96 | )% |
Deferred tax benefit (expense)(e) | | | 0.30 | % | | | 1.14 | % | | | — | % | | | — | % | | | — | % |
Ratio of net investment income (loss), after taxes | | | (1.61 | )% | | | (0.86 | )% | | | (1.85 | )% | | | (1.88 | )% | | | (1.96 | )% |
| (a) | Per share net investment income (loss) is calculated based on average shares outstanding during the period net of deferred tax expense (benefit). Per share return of capital is calculated based on average shares during the period net of deferred tax expense (benefit) estimated at the combined Federal and State statutory income tax rate. |
| (b) | Includes adjustments in accordance with accounting principles generally accepted in the United States of America and as such, the net asset value for financial reporting purposes and returns based upon those net asset values may differ from the net asset value and returns for shareholder transactions. Does not include sales charges and is not annualized for periods less than one year, if applicable. |
| (c) | Includes borrowing, state income tax and franchise tax expense. Without borrowing, state income tax and franchise tax expense, the net expense ratio would be 2.10%, 2.10%, 2.10%, 2.12%, and 2.20% for years ended November 30, 2023, 2022, 2021, 2020 and 2019, respectively. |
| (d) | Deferred tax expense (benefit) estimate for the ratio calculation is derived from the net investment income (loss), and realized and unrealized gains (losses). |
| (e) | Deferred tax benefit (expense) for the ratio calculation, when applicable, is derived from net investment income (loss) only. |
See accompanying Notes to Financial Statements which are an integral part of the financial statements.
14 Invesco SteelPath MLP Income Fund
Financial Highlights—(continued)
| | | | | | | | | | | | | | | | | | | | |
| | | Years Ended November 30, | | | Period ended
November 30,
2019(a) | |
| Class R | | 2023 | | | 2022 | | | 2021 | | | 2020 | |
Per share operating data | | | | | | | | | | | | | | | | | | | | |
Net asset value, beginning of period | | $ | 4.67 | | | $ | 3.87 | | | $ | 2.94 | | | $ | 4.31 | | | $ | 5.46 | |
Net investment income (loss)(b) | | | (0.05 | ) | | | (0.02 | ) | | | (0.05 | ) | | | (0.04 | ) | | | (0.03 | ) |
Return of capital(b) | | | 0.26 | | | | 0.24 | | | | 0.25 | | | | 0.29 | | | | 0.19 | |
Net realized and unrealized gain (loss) | | | 0.63 | | | | 0.97 | | | | 1.12 | | | | (1.08 | ) | | | (0.91 | ) |
Total from investment operations | | | 0.84 | | | | 1.19 | | | | 1.32 | | | | (0.83 | ) | | | (0.75 | ) |
Less: | | | | | | | | | | | | | | | | | | | | |
Return of capital | | | — | | | | (0.27 | ) | | | (0.39 | ) | | | (0.54 | ) | | | (0.40 | ) |
Dividends from net investment income | | | (0.40 | ) | | | (0.12 | ) | | | — | | | | — | | | | — | |
Total distributions | | | (0.40 | ) | | | (0.39 | ) | | | (0.39 | ) | | | (0.54 | ) | | | (0.40 | ) |
Net asset value, end of period | | $ | 5.11 | | | $ | 4.67 | | | $ | 3.87 | | | $ | 2.94 | | | $ | 4.31 | |
Total return(c) | | | 18.94 | % | | | 31.82 | % | | | 45.59 | % | | | (17.71 | )% | | | (14.41 | )% |
Net assets, end of period (000’s omitted) | | $ | 3,539 | | | $ | 2,583 | | | $ | 1,512 | | | $ | 693 | | | $ | 166 | |
Portfolio turnover rate | | | 24 | % | | | 12 | % | | | 22 | % | | | 44 | % | | | 35 | % |
| | | | | |
Ratios/supplemental data based on average net assets: | | | | | | | | | | | | | | | | | | | | |
Ratio of expenses: | | | | | | | | | | | | | | | | | | | | |
Without fee waivers and/or expense reimbursements, before taxes | | | 1.66 | % | | | 1.65 | % | | | 1.68 | % | | | 1.76 | % | | | 1.71 | %(d) |
Expense (waivers) | | | (0.01 | )% | | | (0.02 | )% | | | (0.04 | )% | | | (0.05 | )% | | | (0.05 | )%(d) |
With fee waivers and/or expense reimbursements, before taxes(e) | | | 1.65 | % | | | 1.63 | % | | | 1.64 | % | | | 1.71 | % | | | 1.66 | %(d) |
Deferred/current tax expense (benefit)(f) | | | 5.16 | % | | | 3.51 | % | | | — | % | | | — | % | | | — | %(d) |
With fee waivers and/or expense reimbursements, after taxes | | | 6.81 | % | | | 5.14 | % | | | 1.64 | % | | | 1.71 | % | | | 1.66 | %(d) |
|
Ratio of investment income (loss): | |
Ratio of net investment income (loss), before taxes | | | (1.42 | )% | | | (1.52 | )% | | | (1.39 | )% | | | (1.43 | )% | | | (1.43 | )%(d) |
Net of expense (waivers) and before deferred tax benefit (expense) | | | (1.41 | )% | | | (1.50 | )% | | | (1.35 | )% | | | (1.38 | )% | | | (1.38 | )%(d) |
Deferred tax benefit (expense)(g) | | | 0.30 | % | | | 1.14 | % | | | — | % | | | — | % | | | — | %(d) |
Ratio of net investment income (loss), after taxes | | | (1.11 | )% | | | (0.36 | )% | | | (1.35 | )% | | | (1.38 | )% | | | (1.38 | )%(d) |
| (a) | Commencement date after the close of business on May 24, 2019. |
| (b) | Per share net investment income (loss) is calculated based on average shares outstanding during the period net of deferred tax expense (benefit). Per share return of capital is calculated based on average shares during the period net of deferred tax expense (benefit) estimated at the combined Federal and State statutory income tax rate. |
| (c) | Includes adjustments in accordance with accounting principles generally accepted in the United States of America and as such, the net asset value for financial reporting purposes and returns based upon those net asset values may differ from the net asset value and returns for shareholder transactions. Does not include sales charges and is not annualized for periods less than one year, if applicable. |
| (e) | Includes interest, borrowing, state income tax and franchise tax expense. Without interest, borrowing, state income tax and franchise tax expense, the net expense ratio would be 1.60%, 1.60%, 1.60%, 1.62% and 1.62%, for the years ended November 30, 2023, 2022, 2021 and 2020, and the period ended November 30, 2019, respectively. |
| (f) | Deferred tax expense (benefit) estimate for the ratio calculation is derived from the net investment income (loss), and realized and unrealized gains (losses). |
| (g) | Deferred tax benefit (expense) for the ratio calculation, when applicable, is derived from net investment income (loss) only. |
See accompanying Notes to Financial Statements which are an integral part of the financial statements.
15 Invesco SteelPath MLP Income Fund
Financial Highlights—(continued)
| | | | | | | | | | | | | | | | | | | | |
| | | Years Ended November 30, | |
| Class Y | | 2023 | | | 2022 | | | 2021 | | | 2020 | | | 2019 | |
Per share operating data | | | | | | | | | | | | | | | | | | | | |
Net asset value, beginning of period | | $ | 5.04 | | | $ | 4.13 | | | $ | 3.10 | | | $ | 4.49 | | | $ | 5.31 | |
Net investment income (loss)(a) | | | (0.03 | ) | | | 0.01 | | | | (0.03 | ) | | | (0.03 | ) | | | (0.05 | ) |
Return of capital(a) | | | 0.28 | | | | 0.26 | | | | 0.26 | | | | 0.32 | | | | 0.41 | |
Net realized and unrealized gain (loss) | | | 0.69 | | | | 1.03 | | | | 1.19 | | | | (1.14 | ) | | | (0.50 | ) |
Total from investment operations | | | 0.94 | | | | 1.30 | | | | 1.42 | | | | (0.85 | ) | | | (0.14 | ) |
Less: | | | | | | | | | | | | | | | | | | | | |
Return of capital | | | — | | | | (0.27 | ) | | | (0.39 | ) | | | (0.54 | ) | | | (0.68 | ) |
Dividends from net investment income | | | (0.40 | ) | | | (0.12 | ) | | | — | | | | — | | | | — | |
Total distributions | | | (0.40 | ) | | | (0.39 | ) | | | (0.39 | ) | | | (0.54 | ) | | | (0.68 | ) |
Net asset value, end of period | | $ | 5.58 | | | $ | 5.04 | | | $ | 4.13 | | | $ | 3.10 | | | $ | 4.49 | |
Total return(b) | | | 19.56 | % | | | 32.51 | % | | | 46.50 | % | | | (17.43 | )% | | | (3.76 | )% |
Net assets, end of period (000’s omitted) | | $ | 1,099,958 | | | $ | 943,591 | | | $ | 643,291 | | | $ | 476,921 | | | $ | 714,214 | |
Portfolio turnover rate | | | 24 | % | | | 12 | % | | | 22 | % | | | 44 | % | | | 35 | % |
| | | |
Ratios/supplemental data based on average net assets: | | | | | | | | | | | | | |
Ratio of expenses: | | | | | | | | | | | | |
Without fee waivers and/or expense reimbursements, before taxes | | | 1.16 | % | | | 1.15 | % | | | 1.18 | % | | | 1.26 | % | | | 1.24 | % |
Expense (waivers) | | | (0.01 | )% | | | (0.02 | )% | | | (0.04 | )% | | | (0.05 | )% | | | (0.05 | )% |
With fee waivers and/or expense reimbursements, before taxes(c) | | | 1.15 | % | | | 1.13 | % | | | 1.14 | % | | | 1.21 | % | | | 1.19 | % |
Deferred/current tax expense (benefit)(d) | | | 5.16 | % | | | 3.51 | % | | | — | % | | | — | % | | | — | % |
With fee waivers and/or expense reimbursements, after taxes | | | 6.31 | % | | | 4.64 | % | | | 1.14 | % | | | 1.21 | % | | | 1.19 | % |
| |
Ratio of investment income (loss): | | | | | |
Ratio of net investment income (loss), before taxes | | | (0.92 | )% | | | (1.02 | )% | | | (0.89 | )% | | | (0.93 | )% | | | (0.96 | )% |
Net of expense (waivers) and before deferred tax benefit (expense) | | | (0.91 | )% | | | (1.00 | )% | | | (0.85 | )% | | | (0.88 | )% | | | (0.91 | )% |
Deferred tax benefit (expense)(e) | | | 0.30 | % | | | 1.14 | % | | | — | % | | | — | % | | | — | % |
Ratio of net investment income (loss), after taxes | | | (0.61 | )% | | | 0.14 | % | | | (0.85 | )% | | | (0.88 | )% | | | (0.91 | )% |
| (a) | Per share net investment income (loss) is calculated based on average shares outstanding during the period net of deferred tax expense (benefit). Per share return of capital is calculated based on average shares during the period net of deferred tax expense (benefit) estimated at the combined Federal and State statutory income tax rate. |
| (b) | Includes adjustments in accordance with accounting principles generally accepted in the United States of America and as such, the net asset value for financial reporting purposes and returns based upon those net asset values may differ from the net asset value and returns for shareholder transactions. Does not include sales charges and is not annualized for periods less than one year, if applicable. |
| (c) | Includes borrowing, state income tax and franchise tax expense. Without borrowing, state income tax and franchise tax expense, the net expense ratio would be 1.10%, 1.10%, 1.10%, 1.12%, and 1.15%, for the years ended November 30, 2023, 2022, 2021, 2020 and 2019, respectively. |
| (d) | Deferred tax expense (benefit) estimate for the ratio calculation is derived from the net investment income (loss), and realized and unrealized gains (losses). |
| (e) | Deferred tax benefit (expense) for the ratio calculation, when applicable, is derived from net investment income (loss) only. |
See accompanying Notes to Financial Statements which are an integral part of the financial statements.
16 Invesco SteelPath MLP Income Fund
Financial Highlights—(continued)
| | | | | | | | | | | | | | | | | | | | |
| | | Years Ended November 30, | | | Period ended
November 30,
2019(a) | |
| Class R5 | | 2023 | | | 2022 | | | 2021 | | | 2020 | |
Per share operating data | | | | | | | | | | | | | | | | | | | | |
Net asset value, beginning of period | | $ | 4.79 | | | $ | 3.94 | | | $ | 2.97 | | | $ | 4.32 | | | $ | 5.46 | |
Net investment income (loss)(b) | | | (0.03 | ) | | | 0.01 | | | | (0.03 | ) | | | (0.02 | ) | | | (0.02 | ) |
Return of capital(b) | | | 0.28 | | | | 0.25 | | | | 0.25 | | | | 0.31 | | | | 0.20 | |
Net realized and unrealized gain (loss) | | | 0.64 | | | | 0.98 | | | | 1.14 | | | | (1.10 | ) | | | (0.92 | ) |
Total from investment operations | | | 0.89 | | | | 1.24 | | | | 1.36 | | | | (0.81 | ) | | | (0.74 | ) |
Less: | | | | | | | | | | | | | | | | | | | | |
Return of capital | | | — | | | | (0.27 | ) | | | (0.39 | ) | | | (0.54 | ) | | | (0.40 | ) |
Dividends from net investment income | | | (0.40 | ) | | | (0.12 | ) | | | — | | | | — | | | | — | |
Total distributions | | | (0.40 | ) | | | (0.39 | ) | | | (0.39 | ) | | | (0.54 | ) | | | (0.40 | ) |
Net asset value, end of period | | $ | 5.28 | | | $ | 4.79 | | | $ | 3.94 | | | $ | 2.97 | | | $ | 4.32 | |
Total return(c) | | | 19.54 | % | | | 32.57 | % | | | 46.54 | % | | | (17.17 | )% | | | (14.23 | )% |
Net assets, end of period (000’s omitted) | | $ | 732 | | | $ | 8 | | | $ | 7 | | | $ | 5 | | | $ | 8 | |
Portfolio turnover rate | | | 24 | % | | | 12 | % | | | 22 | % | | | 44 | % | | | 35 | % |
| | | | | |
Ratios/supplemental data based on average net assets: | | | | | | | | | | | | | | | | | | | | |
Ratio of expenses: | | | | | | | | | | | | | | | | | | | | |
Without fee waivers and/or expense reimbursements, before taxes | | | 1.08 | % | | | 1.07 | % | | | 1.07 | % | | | 1.14 | % | | | 1.12 | %(d) |
Expense (waivers) | | | — | % | | | — | % | | | — | % | | | — | % | | | — | %(d) |
With fee waivers and/or expense reimbursements, before taxes(e) | | | 1.08 | % | | | 1.07 | % | | | 1.07 | % | | | 1.14 | % | | | 1.12 | %(d) |
Deferred/current tax expense (benefit)(f) | | | 5.16 | % | | | 3.51 | % | | | — | % | | | — | % | | | — | %(d) |
With fee waivers and/or expense reimbursements, after taxes | | | 6.24 | % | | | 4.58 | % | | | 1.07 | % | | | 1.14 | % | | | 1.12 | %(d) |
|
Ratio of investment income (loss): | |
Ratio of net investment income (loss), before taxes | | | (0.85 | )% | | | (0.94 | )% | | | (0.78 | )% | | | (0.81 | )% | | | (0.84 | )%(d) |
Net of expense (waivers) and before deferred tax benefit (expense) | | | (0.85 | )% | | | (0.94 | )% | | | (0.78 | )% | | | (0.81 | )% | | | (0.84 | )%(d) |
Deferred tax benefit (expense)(g) | | | 0.30 | % | | | 1.14 | % | | | — | % | | | — | % | | | — | %(d) |
Ratio of net investment income (loss), after taxes | | | (0.55 | )% | | | 0.20 | % | | | (0.78 | )% | | | (0.81 | )% | | | (0.84 | )%(d) |
| (a) | Commencement date after the close of business on May 24, 2019. |
| (b) | Per share net investment income (loss) is calculated based on average shares outstanding during the period net of deferred tax expense (benefit). Per share return of capital is calculated based on average shares during the period net of deferred tax expense (benefit) estimated at the combined Federal and State statutory income tax rate. |
| (c) | Includes adjustments in accordance with accounting principles generally accepted in the United States of America and as such, the net asset value for financial reporting purposes and returns based upon those net asset values may differ from the net asset value and returns for shareholder transactions. Does not include sales charges and is not annualized for periods less than one year, if applicable. |
| (e) | Includes interest, borrowing, state income tax and franchise tax expense. Without interest, borrowing, state income tax and franchise tax expense, the net expense ratio would be 1.04%, 1.04%, 1.03%, 1.05% and 1.08%, for the years ended November 30, 2023, 2022, 2021 and 2020, and the period ended November 30, 2019, respectively. |
| (f) | Deferred tax expense (benefit) estimate for the ratio calculation is derived from the net investment income (loss), and realized and unrealized gains (losses). |
| (g) | Deferred tax benefit (expense) for the ratio calculation, when applicable, is derived from net investment income (loss) only. |
See accompanying Notes to Financial Statements which are an integral part of the financial statements.
17 Invesco SteelPath MLP Income Fund
Financial Highlights—(continued)
| | | | | | | | | | | | | | | | | | | | |
| | | Years Ended November 30, | |
| Class R6 | | 2023 | | | 2022 | | | 2021 | | | 2020 | | | 2019 | |
Per share operating data | | | | | | | | | | | | | | | | | | | | |
Net asset value, beginning of period | | $ | 5.11 | | | $ | 4.18 | | | $ | 3.13 | | | $ | 4.52 | | | $ | 5.34 | |
Net investment income (loss)(a) | | | (0.03 | ) | | | 0.01 | | | | (0.03 | ) | | | (0.03 | ) | | | (0.04 | ) |
Return of capital(a) | | | 0.28 | | | | 0.26 | | | | 0.26 | | | | 0.32 | | | | 0.42 | |
Net realized and unrealized gain (loss) | | | 0.70 | | | | 1.05 | | | | 1.21 | | | | (1.14 | ) | | | (0.52 | ) |
Total from investment operations | | | 0.95 | | | | 1.32 | | | | 1.44 | | | | (0.85 | ) | | | (0.14 | ) |
Less: | | | | | | | | | | | | | | | | | | | | |
Return of capital | | | — | | | | (0.27 | ) | | | (0.39 | ) | | | (0.54 | ) | | | (0.68 | ) |
Dividends from net investment income | | | (0.40 | ) | | | (0.12 | ) | | | — | | | | — | | | | — | |
Total distributions | | | (0.40 | ) | | | (0.39 | ) | | | (0.39 | ) | | | (0.54 | ) | | | (0.68 | ) |
Net asset value, end of period | | $ | 5.66 | | | $ | 5.11 | | | $ | 4.18 | | | $ | 3.13 | | | $ | 4.52 | |
Total return(b) | | | 19.48 | % | | | 32.61 | % | | | 46.70 | % | | | (17.33 | )% | | | (3.75 | )% |
Net assets, end of period (000’s omitted) | | $ | 44,317 | | | $ | 36,360 | | | $ | 32,725 | | | $ | 26,777 | | | $ | 24,245 | |
Portfolio turnover rate | | | 24 | % | | | 12 | % | | | 22 | % | | | 44 | % | | | 35 | % |
| | | |
Ratios/supplemental data based on average net assets: | | | | | | | | | | | | | |
Ratio of expenses: | | | | | | | | | | | | |
Without fee waivers and/or expense reimbursements, before taxes | | | 1.08 | % | | | 1.07 | % | | | 1.07 | % | | | 1.14 | % | | | 1.10 | % |
Expense (waivers) | | | (0.01 | )% | | | (0.01 | )% | | | — | % | | | — | % | | | — | % |
With fee waivers and/or expense reimbursements, before taxes(c) | | | 1.07 | % | | | 1.06 | % | | | 1.07 | % | | | 1.14 | % | | | 1.10 | % |
Deferred/current tax expense (benefit)(d) | | | 5.16 | % | | | 3.51 | % | | | — | % | | | — | % | | | — | % |
With fee waivers and/or expense reimbursements, after taxes | | | 6.23 | % | | | 4.57 | % | | | 1.07 | % | | | 1.14 | % | | | 1.10 | % |
| |
Ratio of investment income (loss): | | | | | |
Ratio of net investment income (loss), before taxes | | | (0.85 | )% | | | (0.94 | )% | | | (0.78 | )% | | | (0.81 | )% | | | (0.82 | )% |
Net of expense (waivers) and before deferred tax benefit (expense) | | | (0.84 | )% | | | (0.93 | )% | | | (0.78 | )% | | | (0.81 | )% | | | (0.82 | )% |
Deferred tax benefit (expense)(e) | | | 0.30 | % | | | 1.14 | % | | | — | % | | | — | % | | | — | % |
Ratio of net investment income (loss), after taxes | | | (0.54 | )% | | | 0.21 | % | | | (0.78 | )% | | | (0.81 | )% | | | (0.82 | )% |
| (a) | Per share net investment income (loss) is calculated based on average shares outstanding during the period net of deferred tax expense (benefit). Per share return of capital is calculated based on average shares during the period net of deferred tax expense (benefit) estimated at the combined Federal and State statutory income tax rate. |
| (b) | Includes adjustments in accordance with accounting principles generally accepted in the United States of America and as such, the net asset value for financial reporting purposes and returns based upon those net asset values may differ from the net asset value and returns for shareholder transactions. Does not include sales charges and is not annualized for periods less than one year, if applicable. |
| (c) | Includes borrowing, state income tax and franchise tax expense. Without borrowing, state income tax and franchise tax expense, the net expense ratio would be 1.03%, 1.03%, 1.03%, 1.05% and 1.06%, for the years ended November 30, 2023, 2022, 2021, 2020 and 2019, respectively. |
| (d) | Deferred tax expense (benefit) estimate for the ratio calculation is derived from the net investment income (loss), and realized and unrealized gains (losses). |
| (e) | Deferred tax benefit (expense) for the ratio calculation, when applicable, is derived from net investment income (loss) only. |
See accompanying Notes to Financial Statements which are an integral part of the financial statements.
18 Invesco SteelPath MLP Income Fund
Notes to Financial Statements
November 30, 2023
NOTE 1—Significant Accounting Policies
Invesco SteelPath MLP Income Fund (the “Fund”) is a series portfolio of AIM Investment Funds (Invesco Investment Funds) (the “Trust”). The Trust is organized as a Delaware statutory trust and is registered under the Investment Company Act of 1940, as amended (the “1940 Act”), as an open-end series management investment company authorized to issue an unlimited number of shares of beneficial interest. Information presented in these financial statements pertains only to the Fund. Matters affecting the Fund or each class will be voted on exclusively by the shareholders of the Fund or each class.
The Fund’s investment objective is to seek total return.
The Fund currently consists of six different classes of shares: Class A, Class C, Class R, Class Y, Class R5 and Class R6. Class Y shares are available only to certain investors. Class A shares are sold with a front-end sales charge unless certain waiver criteria are met. Under certain circumstances, load waived shares may be subject to contingent deferred sales charges (“CDSC”). Class C shares are sold with a CDSC. Class R, Class Y, Class R5 and Class R6 shares are sold at net asset value. Class C shares held for eight years after purchase are eligible for automatic conversion into Class A shares of the same Fund (the “Conversion Feature”). The automatic conversion pursuant to the Conversion Feature will generally occur at the end of the month following the eighth anniversary after a purchase of Class C shares.
The Fund is an investment company and accordingly follows the investment company accounting and reporting guidance in accordance with Financial Accounting Standards Board Accounting Standards Codification Topic 946, Financial Services – Investment Companies.
The following is a summary of the significant accounting policies followed by the Fund in the preparation of its financial statements.
| A. | Security Valuations – Securities, including restricted securities, are valued according to the following policy. |
A security listed or traded on an exchange is generally valued at its trade price or official closing price that day as of the close of the exchange where the security is principally traded, or lacking any trades or official closing price on a particular day, the security may be valued at the closing bid or ask price on that day. Securities traded in the over-the-counter market are valued based on prices furnished by independent pricing services or market makers. When such securities are valued using prices provided by an independent pricing service they may be considered fair valued. Futures contracts are valued at the daily settlement price set by an exchange on which they are principally traded. Where a final settlement price exists, exchange-traded options are valued at the final settlement price from the exchange where the option principally trades. Where a final settlement price does not exist, exchange-traded options are valued at the mean between the last bid and ask price generally from the exchange where the option principally trades.
Securities of investment companies that are not exchange-traded (e.g., open end mutual funds) are valued using such company’s end-of-business-day net asset value per share.
Deposits, other obligations of U.S. and non-U.S. banks and financial institutions are valued at their daily account value.
Fixed income securities (including convertible debt securities) generally are valued on the basis of prices provided by independent pricing services. Prices provided by the pricing service may be determined without exclusive reliance on quoted prices, and may reflect appropriate factors such as institution-size trading in similar groups of securities, developments related to specific securities, dividend rate (for unlisted equities), yield (for debt obligations), quality, type of issue, coupon rate (for debt obligations), maturity (for debt obligations), individual trading characteristics and other market data. Pricing services generally value debt obligations assuming orderly transactions of institutional round lot size, but a fund may hold or transact in the same securities in smaller, odd lot sizes. Odd lots often trade at lower prices than institutional round lots, and their value may be adjusted accordingly. Debt obligations are subject to interest rate and credit risks. In addition, all debt obligations involve some risk of default with respect to interest and/or principal payments.
Foreign securities’ (including foreign exchange contracts) prices are converted into U.S. dollar amounts using the applicable exchange rates as of the close of the New York Stock Exchange (“NYSE”). If market quotations are available and reliable for foreign exchange-traded equity securities, the securities will be valued at the market quotations. Invesco Advisers, Inc. (the “Adviser” or “Invesco”) may use various pricing services to obtain market quotations as well as fair value prices. Because trading hours for certain foreign securities end before the close of the NYSE, closing market quotations may become not representative of market value in the Adviser’s judgment (“unreliable”). If, between the time trading ends on a particular security and the close of the customary trading session on the NYSE, a significant event occurs that makes the closing price of the security unreliable, the Adviser may fair value the security. If the event is likely to have affected the closing price of the security, the security will be valued at fair value in good faith in accordance with Board-approved policies and related Adviser procedures (“Valuation Procedures”). Adjustments to closing prices to reflect fair value may also be based on a screening process of an independent pricing service to indicate the degree of certainty, based on historical data, that the closing price in the principal market where a foreign security trades is not the current value as of the close of the NYSE. Foreign securities’ prices meeting the degree of certainty that the price is not reflective of current value will be priced at the indication of fair value from the independent pricing service. Multiple factors may be considered by the independent pricing service in determining adjustments to reflect fair value and may include information relating to sector indices, American Depositary Receipts and domestic and foreign index futures. Foreign securities may have additional risks including exchange rate changes, potential for sharply devalued currencies and high inflation, political and economic upheaval, the relative lack of issuer information, relatively low market liquidity and the potential lack of strict financial and accounting controls and standards.
Unlisted securities will be valued using prices provided by independent pricing services or by another method that the Adviser, in its judgment, believes better reflects the security’s fair value in accordance with the Valuation Procedures.
Securities for which market prices are not provided by any of the above methods may be valued based upon quotes furnished by independent sources. The mean between the last bid and ask prices may be used to value debt obligations, including corporate loans.
Securities for which market quotations are not readily available are fair valued by the Adviser in accordance with the Valuation Procedures. If a fair value price provided by a pricing service is unreliable, the Adviser will fair value the security using the Valuation Procedures. Issuer specific events, market trends, bid/ask quotes of brokers and information providers and other market data may be reviewed in the course of making a good faith determination of a security’s fair value.
The Fund may invest in securities that are subject to interest rate risk, meaning the risk that the prices will generally fall as interest rates rise and, conversely, the prices will generally rise as interest rates fall. Specific securities differ in their sensitivity to changes in interest rates depending on their individual characteristics. Changes in interest rates may result in increased market volatility, which may affect the value and/or liquidity of certain Fund investments.
Valuations change in response to many factors including the historical and prospective earnings of the issuer, the value of the issuer’s assets, general market conditions which are not specifically related to the particular issuer, such as real or perceived adverse economic conditions, changes in the general outlook for revenues or corporate earnings, changes in interest or currency rates, regional or global instability, natural or environmental disasters, widespread disease or other public health issues, war, acts of terrorism, significant governmental actions or adverse investor sentiment generally and market liquidity. Because of the inherent uncertainties of valuation, the values reflected in the financial statements may materially differ from the value received upon actual sale of those investments.
The price the Fund could receive upon the sale of any investment may differ from the Adviser’s valuation of the investment, particularly for securities that are valued using a fair valuation technique. When fair valuation techniques are applied, the Adviser uses available information, including both observable and
19 Invesco SteelPath MLP Income Fund
unobservable inputs and assumptions, to determine a methodology that will result in a valuation that the Adviser believes approximates market value. Fund securities that are fair valued may be subject to greater fluctuation in their value from one day to the next than would be the case if market quotations were used. Because of the inherent uncertainties of valuation, and the degree of subjectivity in such decisions, the Fund could realize a greater or lesser than expected gain or loss upon the sale of the investment.
| B. | Securities Transactions and Investment Income – Securities transactions are accounted for on a trade date basis. Realized gains or losses on sales are computed on the basis of specific identification of the securities sold. Interest income (net of withholding tax, if any) is recorded on an accrual basis from settlement date and includes coupon interest and amortization of premium and accretion of discount on debt securities as applicable. Dividend income (net of withholding tax, if any) is recorded on the ex-dividend date. |
The Fund may periodically participate in litigation related to Fund investments. As such, the Fund may receive proceeds from litigation settlements. Any proceeds received are included in the Statement of Operations as realized gain (loss) for investments no longer held and as unrealized gain (loss) for investments still held.
Brokerage commissions and mark ups are considered transaction costs and are recorded as an increase to the cost basis of securities purchased and/or a reduction of proceeds on a sale of securities. Such transaction costs are included in the determination of net realized and unrealized gain (loss) from investment securities reported in the Statement of Operations and the Statement of Changes in Net Assets and the net realized and unrealized gains (losses) on securities per share in the Financial Highlights. Transaction costs are included in the calculation of the Fund’s net asset value and, accordingly, they reduce the Fund’s total returns. These transaction costs are not considered operating expenses and are not reflected in net investment income reported in the Statement of Operations and the Statement of Changes in Net Assets, or the net investment income per share and the ratios of expenses and net investment income reported in the Financial Highlights, nor are they limited by any expense limitation arrangements between the Fund and the investment adviser.
The Fund allocates income and realized and unrealized capital gains and losses to a class based on the relative net assets of each class.
| C. | Country Determination – For the purposes of making investment selection decisions and presentation in the Schedule of Investments, the investment adviser may determine the country in which an issuer is located and/or credit risk exposure based on various factors. These factors include the laws of the country under which the issuer is organized, where the issuer maintains a principal office, the country in which the issuer derives 50% or more of its total revenues, the country that has the primary market for the issuer’s securities and its “country of risk” as determined by a third party service provider, as well as other criteria. Among the other criteria that may be evaluated for making this determination are the country in which the issuer maintains 50% or more of its assets, the type of security, financial guarantees and enhancements, the nature of the collateral and the sponsor organization. Country of issuer and/or credit risk exposure has been determined to be the United States of America, unless otherwise noted. |
| D. | Dividends and Distributions to Shareholders – Dividends and distributions to shareholders, which are determined in accordance with income tax regulations and may differ from accounting principles generally accepted in the United States of America (“GAAP”), are recorded on the ex-dividend date. The Fund’s dividend distribution policy is intended to provide monthly distributions to its shareholders at a rate that over time is similar to the distribution rate the Fund receives from the master limited partnerships (”MLPs”) in which it invests. The Fund generally pays out dividends that over time approximate the distributions received from the Fund’s portfolio investments based on, among other considerations, distributions the Fund actually received from portfolio investments, distributions it would have received if it had been fully invested at all times, and estimated future cash flows. Such dividends are not tied to the Fund’s investment income and may not represent yield or investment return on the Fund’s portfolio. To the extent that the dividends paid exceed the distributions the Fund receives from its underlying investments, the Fund’s assets will be reduced. The Fund’s tendency to pay out a consistent dividend may change, and the Fund’s level of distributions may increase or decrease. |
The estimated characterization of the distributions paid will be either a qualified dividend or distribution (return of capital). This estimate is based on the Fund’s operating results during the period. The actual characterization of the distributions made during the period will not be determined until after the end of the fiscal year.
| E. | Master Limited Partnerships – The Fund primarily invests in MLPs. MLPs are publicly traded partnerships and limited liability companies taxed as partnerships under the Internal Revenue Code of 1986, as amended (the “Internal Revenue Code”). The Fund principally invests in MLPs that derive their revenue primarily from businesses involved in the gathering, transporting, processing, treating, storing, refining, distributing, mining or marketing of natural gas, natural gas liquids, crude oil, refined products or coal (“energy infrastructure MLPs”). The Fund is a partner in each MLP; accordingly, the Fund is required to take into account the Fund’s allocable share of income, gains, losses, deductions, expenses, and tax credits recognized by each MLP. |
The Fund is non-diversified and may invest in securities of fewer issuers than if it were diversified. Thus, the value of the Fund’s shares may vary more widely and the Fund may be subject to greater market and credit risk than if the Fund invested more broadly. The Fund also will concentrate its investments in the energy sector. Energy infrastructure MLPs are subject to a variety of industry specific risk factors that may adversely affect their business or operations, including a decrease in production or reduced volumes of natural gas or other energy commodities available for transporting, processing, storing or distributing; changes in energy commodity prices; a sustained reduced demand for crude oil, natural gas and refined petroleum products; depletion of natural gas reserves or other commodities if not replaced; natural disasters, extreme weather and environmental hazards; rising interest rates, how facilities are constructed, maintained and operated, environmental and safety controls, and the prices they may charge for products and services. In addition, taxes, government regulation, international politics, price, and supply fluctuations, volatile interest rates and energy conservation may cause difficulties for energy infrastructure MLPs.
MLP’s may be less liquid and subject to more abrupt or erratic price movements than conventional publicly traded securities.
| F. | Return of Capital – Distributions received from the Fund’s investments in MLPs generally are comprised of income and return of capital. The Fund records investment income and return of capital based on estimates made at the time such distributions are received. The return of capital portion of the distribution is a reduction to investment income that results in an equivalent reduction in the cost basis of the associated investments and increases net realized gains (losses) and change in unrealized appreciation (depreciation). Such estimates are based on historical information available from each MLP and other industry sources. These estimates will subsequently be revised and may materially differ primarily based on information received from the MLPs after their tax reporting periods are concluded. |
| G. | Federal Income Taxes – The Fund does not intend to qualify as a regulated investment company pursuant to Subchapter M of the Internal Revenue Code, but will rather be taxed as a corporation. The Fund is treated as a regular corporation, or “C” corporation, for U.S. federal income tax purposes and generally is subject to U.S. federal income tax on its taxable income at the graduated rates applicable to corporations. In addition, as a regular corporation, the Fund may be subject to state and local taxes in jurisdictions in which the MLPs operate. |
The Fund intends to invest its assets primarily in MLPs, which generally are treated as partnerships for federal income tax purposes. As a limited partner in the MLPs, the Fund reports its allocable share of the MLPs’ taxable income in computing its own taxable income. The Fund’s tax expense or benefit is included in the Statement of Operations based on the component of income or gains (losses) to which such expense or benefit relates.
Taxes include current and deferred taxes. Current taxes reflect the estimated tax liability of the Fund as of a measurement date based on taxable income. Deferred income taxes reflect the net tax effects of temporary differences between the carrying amounts of assets and liabilities for financial reporting purposes and the amounts used for income tax purposes. Such temporary differences are principally: (i) taxes on unrealized gains (losses), which are attributable to the temporary difference between fair market value and tax basis, (ii) the net tax effects of temporary differences between the carrying amounts of assets and liabilities for financial reporting and income tax purposes and (iii) the net tax benefit of accumulated net operating losses (“NOL”) and capital loss carryforwards.
20 Invesco SteelPath MLP Income Fund
Deferred tax assets and liabilities are measured using effective tax rates expected to apply to taxable income in the years such temporary differences are realized or otherwise settled. To the extent the Fund has a deferred tax asset, consideration is given to whether or not a valuation allowance is required. A valuation allowance is required if, based on the evaluation criterion provided by ASC 740, Income Taxes, it is more-likely-than-not some portion or all of the deferred tax asset will not be realized.
In determining a valuation allowance, the Fund’s assessment considers, among other matters, the nature, frequency and severity of current and cumulative losses, the duration of statutory carryforward periods and the associated risk that operating loss and capital loss carryforwards were limited as a result of shareholder transactions or were likely to expire unused, and unrealized gains and losses on investments. Consideration was also given to market cycles, the severity and duration of historical deferred tax assets, the impact of redemptions, and the level of MLP distributions.
Through the consideration of these factors, the Fund may determine that it is more likely than not that the Fund’s deferred tax assets will not be realized through future taxable income of the appropriate character. As a result, the Fund may be required to record a valuation allowance with respect to its deferred tax assets that are not considered to be realizable.
From time to time, the Fund may modify its estimates or assumptions regarding its deferred tax liability and/or asset balances and any applicable valuation allowance as new information becomes available. Modifications of the Fund’s estimates or assumptions regarding its deferred tax liability and/or asset balances and any applicable valuation allowance, changes in generally accepted accounting principles or related guidance or interpretations thereof, limitations imposed on or expirations of the Fund’s NOL and capital loss carryovers (if any) and changes in applicable tax law could result in increases or decreases in the Fund’s NAV per share, which could be material.
The Fund may rely, to some extent, on information provided by the MLPs, which may not necessarily be timely, to estimate taxable income allocable to MLP units held in its portfolio, and to estimate its associated deferred tax liability or asset. Such estimates are made in good faith. From time to time, as new information becomes available, the Fund will modify its estimates or assumptions regarding its tax liability or asset.
The Fund’s policy is to classify interest and penalties associated with underpayment of federal and state income taxes, if any, as income tax expense on its Statement of Operations.
The Fund files income tax returns in the U.S. federal jurisdiction and various states. The Fund has reviewed all major jurisdictions and concluded that there is no significant impact on the Fund’s net assets and no tax liability resulting from unrecognized tax benefits relating to uncertain tax positions expected to be taken on its tax returns. Furthermore, management of the Fund is not aware of any uncertain tax positions for which it is reasonably possible that the total amount of unrecognized tax benefit will significantly change in the next 12 months. Generally, the Fund is subject to examinations by taxing authorities for up to three years after the filing of the return for the tax period. All relevant periods are still open for examination.
| H. | Expenses – Fees provided for under the Rule 12b-1 plan of a particular class of the Fund are charged to the operations of such class. Transfer agency fees and expenses and other shareholder recordkeeping fees and expenses attributable to Class R5 and Class R6 are allocated based on relative net assets of Class R5 and Class R6. Sub-accounting fees attributable to Class R5 are charged to the operations of the class. Transfer agency fees and expenses and other shareholder recordkeeping fees and expenses relating to all other classes are allocated among those classes based on relative net assets. All other expenses are allocated among the classes based on relative net assets. |
| I. | Interest, Facilities and Maintenance Fees – Interest, Facilities and Maintenance Fees include interest and related borrowing costs such as commitment fees, administrative expenses and other expenses associated with establishing and maintaining the line of credit. |
| J. | Accounting Estimates – The preparation of financial statements in conformity with GAAP requires management to make estimates and assumptions that affect the reported amounts of assets and liabilities at the date of the financial statements and the reported amounts of revenues and expenses during the reporting period including estimates and assumptions related to taxation. Actual results could differ from those estimates by a significant amount. In addition, the Fund monitors for material events or transactions that may occur or become known after the period-end date and before the date the financial statements are released to print. |
| K. | Indemnifications – Under the Trust’s organizational documents, each Trustee, officer, employee or other agent of the Trust is indemnified against certain liabilities that may arise out of the performance of their duties to the Fund. Additionally, in the normal course of business, the Fund enters into contracts, including the Fund’s servicing agreements, that contain a variety of indemnification clauses. The Fund’s maximum exposure under these arrangements is unknown as this would involve future claims that may be made against the Fund that have not yet occurred. The risk of material loss as a result of such indemnification claims is considered remote. |
NOTE 2—Advisory Fees and Other Fees Paid to Affiliates
The Trust has entered into a master investment advisory agreement with the Adviser. Under the terms of the investment advisory agreement, the Fund accrues daily and pays monthly an advisory fee to the Adviser based on the annual rate of the Fund’s average daily net assets as follows:
| | | | |
| Average Daily Net Assets | | Rate* | |
First $3 billion | | | 0.95% | |
Next $2 billion | | | 0.93% | |
Over $5 billion | | | 0.90% | |
| * | The advisory fee paid by the Fund shall be reduced by any amounts paid by the Fund under the administrative services agreement with the Adviser. |
For the year ended November 30, 2023, the effective advisory fee rate incurred by the Fund was 0.95%.
Under the terms of a master sub-advisory agreement between the Adviser and each of Invesco Asset Management Deutschland GmbH, Invesco Asset Management Limited, Invesco Asset Management (Japan) Limited, Invesco Hong Kong Limited, Invesco Senior Secured Management, Inc. and Invesco Canada Ltd. and separate sub-advisory agreements with Invesco Capital Management LLC and Invesco Asset Management (India) Private Limited (collectively, the “Affiliated Sub-Advisers”) the Adviser, not the Fund, will pay 40% of the fees paid to the Adviser to any such Affiliated Sub-Adviser(s) that provide(s) discretionary investment management services to the Fund based on the percentage of assets allocated to such Affiliated Sub-Adviser(s). Invesco has also entered into a Sub-Advisory Agreement with OppenheimerFunds, Inc. to provide discretionary management services to the Fund.
The Adviser has contractually agreed, through March 31, 2024, to waive advisory fees and/or reimburse expenses of all shares to the extent necessary to limit total annual fund operating expenses after fee waiver and/or expense reimbursement (excluding certain items discussed below) of Class A, Class C, Class R, Class Y, Class R5 and Class R6 shares to 1.35%, 2.10%, 1.60%, 1.10%, 1.08% and 1.03%, respectively, of the Fund’s average daily net assets (the “expense limits”). Effective April 1, 2024, the Adviser has contractually agreed, through at least March 31, 2025, to waive advisory fees and/or reimburse expenses of all shares to the extent necessary to limit total annual fund operating expenses after fee waiver and/or expense reimbursement (excluding certain items discussed below) of Class A, Class C, Class R, Class Y, Class R5 and Class R6 shares to 1.42%, 2.17%, 1.67%, 1.17%, 1.17% and 1.17%, respectively, of the Fund’s average daily net assets. In determining the Adviser’s obligation to waive advisory fees and/or reimburse expenses, the following expenses are not taken into account, and could cause the total annual fund operating expenses after fee waiver and/or expense reimbursement to exceed the numbers reflected above: (1) interest, facilities and maintenance fees; (2) taxes; (3) dividend expense on short sales; (4) extraordinary or non-routine items, including litigation expenses; and (5) expenses that the Fund has incurred but did not actually pay because of an expense offset arrangement. Unless Invesco continues the fee waiver agreement, it will terminate on March 31, 2025. During its term, the fee waiver agreement cannot be terminated or amended to increase the expense limits or reduce the advisory fee waiver without approval of the Board of Trustees.
21 Invesco SteelPath MLP Income Fund
For the year ended November 30, 2023, the Adviser contractually reimbursed class level expenses of $223,348, $69,227, $429, $138,404, $0, and $2,455 for Class A, Class C, Class R, Class Y, Class R5 and Class R6 shares, respectively.
The Trust has entered into an administration and fund accounting agreement with UMB Fund Services, Inc. (“UMB”) pursuant to which UMB shall provide administration and fund accounting services to the Fund. The Trust and the Adviser have entered into a Master Administrative Services Agreement (“Administrative Services Agreement”) pursuant to which the Adviser may perform or arrange for the provision of certain accounting and other administrative services to the Fund which are not required to be performed by the Adviser under the Investment Advisory Agreement. The Adviser may only receive fees for administrative services under the Administrative Services Agreement to the extent that those fees assessed under the agreement are in excess of the fees paid to UMB. For the year ended November 30, 2023, expenses incurred under the agreement are shown in the Statement of Operations as Administrative services fees. Additionally, Invesco has entered into service agreements whereby UMB Bank, n.a., serves as custodian to the Fund.
The Trust has entered into a transfer agency and service agreement with Invesco Investment Services, Inc. (“IIS”) pursuant to which the Fund has agreed to pay IIS a fee for providing transfer agency and shareholder services to the Fund and reimburse IIS for certain expenses incurred by IIS in the course of providing such services. IIS may make payments to intermediaries that provide omnibus account services, sub-accounting services and/or networking services. All fees payable by IIS to intermediaries that provide omnibus account services or sub-accounting services are charged back to the Fund, subject to certain limitations approved by the Trust’s Board of Trustees. For the year ended November 30, 2023, expenses incurred under the agreement are shown in the Statement of Operations as Transfer agent fees.
The Trust has entered into master distribution agreements with Invesco Distributors, Inc. (“IDI”) to serve as the distributor for the Class A, Class C, Class R, Class Y, Class R5 and Class R6 shares of the Fund. The Trust has adopted plans pursuant to Rule 12b-1 under the 1940 Act with respect to the Fund’s Class A, Class C and Class R shares (collectively, the “Plans”). The Fund, pursuant to the Plans, pays IDI compensation at the annual rate of 0.25% of the Fund’s average daily net assets of Class A shares, 1.00% of the average daily net assets of Class C shares and 0.50% of the average daily net assets of Class R shares. The fees are accrued daily and paid monthly. Of the Plans payments, up to 0.25% of the average daily net assets of each class of shares may be paid to furnish continuing personal shareholder services to customers who purchase and own shares of such classes. Any amounts not paid as a service fee under the Plans would constitute an asset-based sales charge. Rules of the Financial Industry Regulatory Authority (“FINRA”) impose a cap on the total sales charges, including asset-based sales charges, that may be paid by any class of shares of the Fund. For the year ended November 30, 2023, expenses incurred under the Plans are shown in the Statement of Operations as Distribution fees.
Front-end sales commissions and CDSC (collectively, the “sales charges”) are not recorded as expenses of the Fund. Front-end sales commissions are deducted from proceeds from the sales of Fund shares prior to investment in Class A shares of the Fund. CDSC are deducted from redemption proceeds prior to remittance to the shareholder. During the year ended November 30, 2023, IDI advised the Fund that IDI retained $192,775 in front-end sales commissions from the sale of Class A shares and $23,632 and $22,860 from Class A and Class C shares, respectively, for CDSC imposed upon redemptions by shareholders.
For the year ended November 30, 2023, the Fund incurred $67,095 in brokerage commissions with Invesco Capital Markets, Inc., an affiliate of the Adviser and IDI, for portfolio transactions executed on behalf of the Fund.
Certain officers and trustees of the Trust are officers and directors of the Adviser, IIS and/or IDI.
NOTE 3—Additional Valuation Information
GAAP defines fair value as the price that would be received to sell an asset or paid to transfer a liability in an orderly transaction between market participants at the measurement date, under current market conditions. GAAP establishes a hierarchy that prioritizes the inputs to valuation methods, giving the highest priority to readily available unadjusted quoted prices in an active market for identical assets (Level 1) and the lowest priority to significant unobservable inputs (Level 3), generally when market prices are not readily available. Based on the valuation inputs, the securities or other investments are tiered into one of three levels. Changes in valuation methods may result in transfers in or out of an investment’s assigned level:
| | |
| Level 1 – | | Prices are determined using quoted prices in an active market for identical assets. |
| Level 2 – | | Prices are determined using other significant observable inputs. Observable inputs are inputs that other market participants may use in pricing a security. These may include quoted prices for similar securities, interest rates, prepayment speeds, credit risk, yield curves, loss severities, default rates, discount rates, volatilities and others. |
| Level 3 – | | Prices are determined using significant unobservable inputs. In situations where quoted prices or observable inputs are unavailable (for example, when there is little or no market activity for an investment at the end of the period), unobservable inputs may be used. Unobservable inputs reflect the Adviser’s assumptions about the factors market participants would use in determining fair value of the securities or instruments and would be based on the best available information. |
As of November 30, 2023, all of the securities in this Fund were valued based on Level 1 inputs (see the Schedule of Investments for security categories). The level assigned to the securities valuations may not be an indication of the risk or liquidity associated with investing in those securities. Because of the inherent uncertainties of valuation, the values reflected in the financial statements may materially differ from the value received upon actual sale of those investments.
NOTE 4—Security Transactions with Affiliated Funds
The Fund is permitted to purchase securities from or sell securities to certain other affiliated funds under specified conditions outlined in procedures adopted by the Board of Trustees of the Trust. The procedures have been designed to ensure that any purchase or sale of securities by the Fund from or to another fund that is or could be considered an “affiliated person” by virtue of having a common investment adviser (or affiliated investment advisers), common Trustees and/or common officers is made in reliance on Rule 17a-7 of the 1940 Act and, to the extent applicable, related SEC staff positions. Each such transaction is effected at the security’s “current market price”, as provided for in these procedures and Rule 17a-7. Pursuant to these procedures, for the year ended November 30, 2023, the Fund engaged in securities purchases of $30,029,500 and securities sales of $46,682,420, which resulted in net realized gains of $6,806,168.
NOTE 5—Trustees’ and Officers’ Fees and Benefits
Trustees’ and Officers’ Fees and Benefits include amounts accrued by the Fund to pay remuneration to certain Trustees and Officers of the Fund. Trustees have the option to defer compensation payable by the Fund, and Trustees’ and Officers’ Fees and Benefits also include amounts accrued by the Fund to fund such deferred compensation amounts. Those Trustees who defer compensation have the option to select various Invesco Funds in which their deferral accounts shall be deemed to be invested. Finally, certain current Trustees were eligible to participate in a retirement plan that provided for benefits to be paid upon retirement to Trustees over a period of time based on the number of years of service. The Fund may have certain former Trustees who also participate in a retirement plan and receive benefits under such plan. Trustees’ and Officers’ Fees and Benefits include amounts accrued by the Fund to fund such retirement benefits. Obligations under the deferred compensation and retirement plans represent unsecured claims against the general assets of the Fund.
NOTE 6—Cash Balances and Borrowings
The Fund has entered into a revolving credit and security agreement, which enables the Fund to participate with certain other Invesco Funds in a committed secured borrowing facility that permits borrowings up to $400 million, collectively by certain Invesco Funds, and which will expire on September 25, 2024. The Fund is permitted to borrow up to the lesser of one-third of the Fund’s total assets, or the maximum amount permitted pursuant to the Fund’s investment limitations. The
22 Invesco SteelPath MLP Income Fund
revolving credit and security agreement is secured by the assets of the Fund. The Fund is subject to certain covenants relating to the revolving credit and security agreement. Failure to comply with these restrictions could cause the acceleration of the repayment of the amount outstanding under the revolving credit and security agreement. During the year ended November 30, 2023, the Fund did not borrow under this agreement.
Additionally, the Fund is permitted to temporarily carry a negative or overdrawn balance in its account with UMB Bank n.a., the custodian bank. Such balances, if any at period-end, are shown in the Statement of Assets and Liabilities under the payable caption Amount due custodian. To compensate the custodian bank for such overdrafts, the overdrawn Fund may either (1) leave funds as a compensating balance in the account so the custodian bank can be compensated by earning the additional interest; or (2) compensate by paying the custodian bank at a rate agreed upon by the custodian bank and Invesco, not to exceed the contractually agreed upon rate.
NOTE 7—Distributions and Tax Information
Tax Character of Distributions to Shareholders Paid During the Fiscal Years Ended November 30, 2023 and 2022:
| | | | | | | | |
| | | November 30, 2023 | | | November 30, 2022 | |
Ordinary income | | $ | 258,548,433 | | | $ | 79,112,807 | |
Return of Capital | | | — | | | | 170,604,750 | |
Total distributions | | $ | 258,548,433 | | | $ | 249,717,557 | |
For the year ended November 30, 2023, the federal income tax rate is 21%. The Fund is currently using an estimated rate of 1.50% for state and local tax, net of federal tax expense.
The Fund’s income tax provision consists of the following as of November 30, 2023:
| | | | |
| Current tax (expense) benefit | | | |
Federal | | $ | — | |
State | | | — | |
Total current tax (expense) benefit | | $ | — | |
| |
| Deferred tax (expense) benefit | | | |
Federal | | $ | (149,354,951 | ) |
State | | | (10,668,211 | ) |
Total deferred tax (expense) benefit | | $ | (160,023,162 | ) |
The reconciliation between the federal statutory income tax rate of 21% and the tax effect on net investment income (loss) and realized and unrealized gain (loss) follows:
| | | | | | | | |
| | | Amount | | | % Effect | |
Application of federal statutory income tax rate | | $ | (150,182,284 | ) | | | (21.00 | )% |
State income taxes net of federal benefit | | | (10,727,306 | ) | | | (1.50 | )% |
Effect of permanent differences | | | 965,008 | | | | 0.13 | % |
Return to provision adjustments | | | (78,580 | ) | | | (0.01 | )% |
Total income tax (expense) benefit | | $ | (160,023,162 | ) | | | (22.38 | )% |
For the year ended November 30, 2023, the Fund’s tax effect on net investment income (loss) and realized and unrealized gain (loss) of (22.38)% differed from the combined federal and state statutory tax rate of (22.50)% due in large part to the change in valuation allowance primarily as a result of the change in unrealized appreciation.
Components of the Fund’s deferred tax assets and liabilities as of November 30, 2023 are as follows:
| | | | |
| Deferred tax assets: | | | |
Net operating loss carryforward (tax basis) — Federal | | $ | 153,975,651 | |
Net operating loss carryforward (tax basis) — State | | | 17,269,533 | |
Excess business interest expense carryforward | | | 24,575,029 | |
Capital loss carryforward (tax basis) | | | 18,307,638 | |
Book to tax differences — Income recognized from MLPs | | | (1,215,907 | ) |
Total deferred tax asset | | $ | 212,911,944 | |
| |
| Deferred tax liabilities: | | | |
Net unrealized gain (loss) on investment securities (tax basis) | | $ | (470,328,707 | ) |
Total deferred tax liability | | | (470,328,707 | ) |
Total net deferred tax asset (liability) | | $ | (257,416,763 | ) |
23 Invesco SteelPath MLP Income Fund
As of November 30, 2023, the Fund has net operating loss carryforwards for federal income tax purposes, as follows:
| | | | |
| Expiration date for expiring net operating loss carryforwards | | | |
11/30/2035 | | $ | 208,301,374 | |
11/30/2036 | | | 144,223,600 | |
11/30/2037 | | | 63,826,450 | |
11/30/2038 | | | 120,263,557 | |
Total expiring net operating loss carryforwards | | $ | 536,614,981 | |
Total non-expiring net operating loss carryforwards | | $ | 196,602,405 | |
Total net operating loss carryforwards | | $ | 733,217,386 | |
During the year ended November 30, 2023, the Fund estimates that it will utilize $162,235,476 of net operating loss carryforward.
As of November 30, 2023, the Fund has net capital loss carryforwards for federal income tax purposes, which may be carried forward for 5 years, as follows:
| | | | |
| Expiration Date | | | |
11/30/2026 | | $ | 81,367,279 | |
Total | | $ | 81,367,279 | |
During the year ended November 30, 2023, the Fund estimates that it will utilize $292,875,967 of capital loss carryforward.
NOTE 8—Investment Transactions
The aggregate amount of investment securities (other than short-term securities, U.S. Government obligations and money market funds, if any) purchased and sold by the Fund during the year ended November 30, 2023 was $825,732,266 and $777,686,352 respectively.
As of November 30, 2023, gross unrealized appreciation and depreciation of investments, based on cost for federal income tax purposes were as follows:
| | | | |
Gross Unrealized Appreciation | | $ | 2,141,876,623 | |
Gross Unrealized Depreciation | | | (48,911,308 | ) |
Net Unrealized Appreciation on Investments | | $ | 2,092,965,315 | |
Cost of investments for tax purposes is $1,565,943,899.
The difference between cost amounts for financial statement and federal income tax purposes is due primarily to timing differences in recognizing certain gains and losses in security transactions.
24 Invesco SteelPath MLP Income Fund
Note 9—Share Information
| | | | | | | | | | | | | | | | |
| | | Summary of Share Activity | |
| | | Year Ended
November 30, 2023(a) | | | Year ended
November 30, 2022 | |
| | | Shares | | | Amount | | | Shares | | | Amount | |
Sold: | | | | | | | | | | | | | | | | |
Class A | | | 22,083,742 | | | $ | 105,335,772 | | | | 31,998,946 | | | $ | 140,675,449 | |
Class C | | | 16,157,243 | | | | 64,500,977 | | | | 18,694,360 | | | | 70,457,392 | |
Class R | | | 179,461 | | | | 836,392 | | | | 159,009 | | | | 675,831 | |
Class Y | | | 41,779,833 | | | | 214,381,267 | | | | 87,901,637 | | | | 413,641,682 | |
Class R5 | | | 136,131 | | | | 686,203 | | | | — | | | | — | |
Class R6 | | | 1,704,501 | | | | 8,966,201 | | | | 1,267,839 | | | | 5,971,094 | |
Issued as reinvestment of dividends: | | | | | | | | | | | | | | | | |
Class A | | | 13,375,344 | | | | 64,459,110 | | | | 13,906,805 | | | | 62,169,785 | |
Class C | | | 5,595,420 | | | | 22,475,690 | | | | 6,203,455 | | | | 23,655,956 | |
Class R | | | 51,518 | | | | 243,659 | | | | 38,397 | | | | 170,163 | |
Class Y | | | 7,909,302 | | | | 40,862,005 | | | | 7,967,443 | | | | 37,925,248 | |
Class R5 | | | 1,449 | | | | 7,467 | | | | — | | | | — | |
Class R6 | | | 206,487 | | | | 1,091,519 | | | | 227,965 | | | | 1,093,505 | |
Automatic Conversion of Class C shares to Class A shares: | | | | | | | | | | | | | | | | |
Class A | | | 8,632,481 | | | | 41,413,376 | | | | 18,411,439 | | | | 80,663,521 | |
Class C | | | (10,339,291 | ) | | | (41,413,376 | ) | | | (21,548,848 | ) | | | (80,663,521 | ) |
Reacquired: | | | | | | | | | | | | | | | | |
Class A | | | (40,522,624 | ) | | | (194,452,395 | ) | | | (54,712,683 | ) | | | (240,148,103 | ) |
Class C | | | (11,520,051 | ) | | | (46,163,996 | ) | | | (16,223,482 | ) | | | (60,431,910 | ) |
Class R | | | (91,301 | ) | | | (434,590 | ) | | | (35,554 | ) | | | (158,864 | ) |
Class Y | | | (39,632,786 | ) | | | (202,050,521 | ) | | | (64,579,678 | ) | | | (298,901,697 | ) |
Class R5 | | | (682 | ) | | | (3,559 | ) | | | — | | | | — | |
Class R6 | | | (1,200,779 | ) | | | (6,321,860 | ) | | | (2,214,804 | ) | | | (10,424,875 | ) |
Net Increase in share activity | | | 14,505,398 | | | $ | 74,419,341 | | | | 27,462,246 | | | $ | 146,370,656 | |
| (a) | There are entities that are record owners of more than 5% of the outstanding shares of the Fund and in the aggregate own 57% of the outstanding shares of the Fund. IDI has an agreement with these entities to sell Fund shares. The Fund, Invesco and/or Invesco affiliates may make payments to these entities, which are considered to be related to the Fund, for providing services to the Fund, Invesco and/or Invesco affiliates including but not limited to services such as securities brokerage, distribution, third party record keeping and account servicing. The Fund has no knowledge as to whether all or any portion of the shares owned of record by these entities are also owned beneficially. |
25 Invesco SteelPath MLP Income Fund
Report of Independent Registered Public Accounting Firm
To the Board of Trustees of AIM Investment Funds (Invesco Investment Funds) and Shareholders of Invesco SteelPath MLP Income Fund
Opinion on the Financial Statements
We have audited the accompanying statement of assets and liabilities, including the schedule of investments, of Invesco SteelPath MLP Income Fund (one of the funds constituting AIM Investment Funds (Invesco Investment Funds), hereafter referred to as the “Fund”) as of November 30, 2023, the related statement of operations for the year ended November 30, 2023, the statement of changes in net assets for each of the two years in the period ended November 30, 2023, including the related notes, and the financial highlights for each of the periods indicated therein (collectively referred to as the “financial statements”). In our opinion, the financial statements present fairly, in all material respects, the financial position of the Fund as of November 30, 2023, the results of its operations for the year then ended, the changes in its net assets for each of the two years in the period ended November 30, 2023 and the financial highlights for each of the periods indicated therein, in conformity with accounting principles generally accepted in the United States of America.
Basis for Opinion
These financial statements are the responsibility of the Fund’s management. Our responsibility is to express an opinion on the Fund’s financial statements based on our audits. We are a public accounting firm registered with the Public Company Accounting Oversight Board (United States) (PCAOB) and are required to be independent with respect to the Fund in accordance with the U.S. federal securities laws and the applicable rules and regulations of the Securities and Exchange Commission and the PCAOB.
We conducted our audits of these financial statements in accordance with the standards of the PCAOB. Those standards require that we plan and perform the audit to obtain reasonable assurance about whether the financial statements are free of material misstatement, whether due to error or fraud.
Our audits included performing procedures to assess the risks of material misstatement of the financial statements, whether due to error or fraud, and performing procedures that respond to those risks. Such procedures included examining, on a test basis, evidence regarding the amounts and disclosures in the financial statements. Our audits also included evaluating the accounting principles used and significant estimates made by management, as well as evaluating the overall presentation of the financial statements. Our procedures included confirmation of securities owned as of November 30, 2023 by correspondence with the custodian. We believe that our audits provide a reasonable basis for our opinion.

Houston, Texas
January 22, 2024
We have served as the auditor of one or more investment companies in the Invesco group of investment companies since at least 1995. We have not been able to determine the specific year we began serving as auditor.
PricewaterhouseCoopers LLP, 1000 Louisiana Street, Suite 5800, Houston, TX 77002
T: (713) 356 4000, www.pwc.com/us
26 Invesco SteelPath MLP Income Fund
Calculating your ongoing Fund expenses
Example
As a shareholder of the Fund, you incur two types of costs: (1) transaction costs, which may include sales charges (loads) on purchase payments or contingent deferred sales charges on redemptions, if any; and (2) ongoing costs, including management fees, distribution and/or service (12b-1) fees, and other Fund expenses. This example is intended to help you understand your ongoing costs (in dollars) of investing in the Fund and to compare these costs with ongoing costs of investing in other mutual funds. The example is based on an investment of $1,000 invested at the beginning of the period and held for the entire period June 1, 2023 through November 30, 2023.
Actual expenses
The table below provides information about actual account values and actual expenses. You may use the information in this table, together with the amount you invested, to estimate the expenses that you paid over the period. Simply divide your account value by $1,000 (for example, an $8,600 account value divided by $1,000 = 8.6), then multiply the result by the number in the table under the heading entitled “Actual Expenses Paid During Period” to estimate the expenses you paid on your account during this period.
Hypothetical example for comparison purposes
The table below also provides information about hypothetical account values and hypothetical expenses based on the Fund’s actual expense ratio and an assumed rate of return of 5% per year before expenses, which is not the Fund’s actual return.
The hypothetical account values and expenses may not be used to estimate the actual ending account balance or expenses you paid for the period. You may use this information to compare the ongoing costs of investing in the Fund and other funds. To do so, compare this 5% hypothetical example with the 5% hypothetical examples that appear in the shareholder reports of the other funds.
Please note that the expenses shown in the table are meant to highlight your ongoing costs only and do not reflect any transaction costs, such as sales charges (loads) on purchase payments or contingent deferred sales charges on redemptions, if any. Therefore, the hypothetical information is useful in comparing ongoing costs only, and will not help you determine the relative total costs of owning different funds. In addition, if these transaction costs were included, your costs would have been higher.
| | | | | | | | | | | | | | | | | | | | | | | | |
| | | Beginning
Account Value
(06/1/2023) | | | ACTUAL | | | HYPOTHETICAL
(5% annual return before
expenses) | | | Annualized
Expense
Ratio | |
| | | Ending
Account Value
(11/30/2023)¹ | | | Expenses
Paid During
Period2 | | | Ending
Account Value
(11/30/2023)¹ | | | Expenses
Paid During
Period2 | |
| CLASS A | | $ | 1,000.00 | | | $ | 1,185.70 | | | $ | 62.63 | | | $ | 967.70 | | | $ | 56.38 | | | | 11.43 | % |
| CLASS C | | | 1,000.00 | | | | 1,183.20 | | | | 66.66 | | | | 963.90 | | | | 59.96 | | | | 12.18 | |
| CLASS R | | | 1,000.00 | | | | 1,186.30 | | | | 64.01 | | | | 966.40 | | | | 57.58 | | | | 11.68 | |
| CLASS Y | | | 1,000.00 | | | | 1,187.90 | | | | 61.32 | | | | 968.90 | | | | 55.18 | | | | 11.18 | |
| CLASS R5 | | | 1,000.00 | | | | 1,189.80 | | | | 60.99 | | | | 969.30 | | | | 54.85 | | | | 11.11 | |
| CLASS R6 | | | 1,000.00 | | | | 1,187.20 | | | | 60.86 | | | | 969.30 | | | | 54.80 | | | | 11.10 | |
| 1. | The actual ending account value is based on the actual total return of the Fund for the period June 1, 2023 through November 30, 2023, after actual expenses and will differ from the hypothetical ending account value which is based on the Fund’s expense ratio and a hypothetical annual return of 5% before expenses. |
| 2. | Expenses are equal to the Fund’s annualized expense ratio as indicated above multiplied by the average account value over the period, multiplied by 183/365 to reflect the most recent fiscal half year. |
27 Invesco SteelPath MLP Income Fund
Approval of Investment Advisory and Sub-Advisory Contracts
At meetings held on June 13, 2023, the Board of Trustees (the Board or the Trustees) of AIM Investment Funds (Invesco Investment Funds) as a whole, and the independent Trustees, who comprise over 75% of the Board, voting separately, approved the continuance of the Invesco SteelPath MLP Income Fund’s (the Fund) Master Investment Advisory Agreement with Invesco Advisers, Inc. (Invesco Advisers and the investment advisory agreement) and the Master Intergroup Sub-Advisory Contract for Mutual Funds with Invesco Asset Management Deutschland GmbH, Invesco Asset Management Limited, Invesco Asset Management (Japan) Limited, Invesco Hong Kong Limited, Invesco Senior Secured Management, Inc. and Invesco Canada Ltd. and separate sub-advisory contracts with Invesco Capital Management LLC, Invesco Asset Management (India) Private Limited and OppenheimerFunds, Inc. (collectively, the Affiliated Sub-Advisers and the sub-advisory contracts) for another year, effective July 1, 2023. After evaluating the factors discussed below, among others, the Board approved the renewal of the Fund’s investment advisory agreement and the sub-advisory contracts and determined that the compensation payable thereunder by the Fund to Invesco Advisers and by Invesco Advisers to the Affiliated Sub-Advisers is fair and reasonable.
The Board’s Evaluation Process
The Board has established an Investments Committee, which in turn has established Sub-Committees, that meet throughout the year to review the performance of funds advised by Invesco Advisers (the Invesco Funds). The Sub-Committees meet regularly with portfolio managers for their assigned Invesco Funds and other members of management to review information about investment performance and portfolio attributes of these funds. The Board has established additional standing and ad hoc committees that meet regularly throughout the year to review matters within their purview, including a working group focused on opportunities to make ongoing and continuous improvements to the annual review process for the Invesco Funds’ investment advisory and sub-advisory contracts. The Board took into account evaluations and reports that it received from its committees and sub-committees, as well as the information provided to the Board and its committees and sub-committees throughout the year, in considering whether to approve each Invesco Fund’s investment advisory agreement and sub-advisory contracts.
As part of the contract renewal process, the Board reviews and considers information provided in response to requests for information submitted to management by the independent Trustees with assistance from legal counsel to the independent Trustees and the Senior Officer, an officer of the Invesco Funds who reports directly to the independent Trustees. The Board receives comparative investment performance and fee and expense data regarding the Invesco Funds prepared by Broadridge Financial Solutions, Inc. (Broadridge), an independent mutual fund data provider, as well as information on the composition of the peer groups provided by Broadridge and its methodology for determining peer groups. The Board also receives an independent written evaluation from the Senior Officer. The Senior Officer’s evaluation is prepared as part of his responsibility to manage the process by which the Invesco Funds’ proposed management fees are negotiated during the annual contract renewal process to ensure they are negotiated in a manner that is at arms’ length and reasonable in accordance with certain negotiated regulatory requirements. In addition to meetings with Invesco Advisers and fund counsel throughout the year and as part of meetings convened on May 2, 2023 and June 13, 2023, the independent Trustees also discussed the continuance of the investment advisory agreement and sub-advisory contracts in separate sessions with the Senior Officer and with independent legal counsel. Also, as part of the contract renewal process, the independent Trustees reviewed and considered information provided in response to follow-up requests for information submitted by the independent Trustees to management. The independent Trustees met and discussed those follow-up responses with legal counsel to the independent Trustees and the Senior Officer.
The discussion below is a summary of the Senior Officer’s independent written evaluation with respect to the Fund’s investment advisory agreement and sub-advisory contracts, as well as a discussion of the material factors and related conclusions that formed the basis for the Board’s approval of the Fund’s investment advisory agreement and sub-advisory contracts. The Trustees’ review and conclusions are based on the comprehensive consideration of all information presented to them during the course of the year and in prior years and are not the result of any single determinative factor. Moreover, one Trustee may have
weighed a particular piece of information or factor differently than another Trustee. The information received and considered by the Board was current as of various dates prior to the Board’s approval on June 13, 2023.
Factors and Conclusions and Summary of Independent Written Fee Evaluation
| A. | Nature, Extent and Quality of Services Provided by Invesco Advisers and the Affiliated Sub-Advisers |
The Board reviewed the nature, extent and quality of the advisory services provided to the Fund by Invesco Advisers under the Fund’s investment advisory agreement, and the credentials and experience of the officers and employees of Invesco Advisers who provide these services, including the Fund’s portfolio manager(s). The Board considered recent senior management changes at Invesco and Invesco Advisers, including the appointment of new Co-Heads of Investments, that had been presented to and discussed with the Board. The Board’s review included consideration of Invesco Advisers’ investment process and oversight, credit analysis and research capabilities. The Board considered information regarding Invesco Advisers’ programs for and resources devoted to risk management, including management of investment, enterprise, operational, liquidity, derivatives, valuation and compliance risks, and technology used to manage such risks. The Board noted an accounting matter that required that certain historical financial statements for the Fund be restated in 2020 and that certain shareholders be reimbursed for transactions made at incorrect net asset values, and considered the steps that Invesco Advisers took to remediate the matter, with such remediation steps concluding at the end of 2022. The Board received information regarding Invesco’s methodology for compensating its investment professionals and the incentives and accountability it creates, as well as how it impacts Invesco’s ability to attract and retain talent. The Board received a description of, and reports related to, Invesco Advisers’ global security program and business continuity plans and of its approach to data privacy and cybersecurity, including related testing. The Board also considered non-advisory services that Invesco Advisers and its affiliates provide to the Invesco Funds, such as various middle office and back office support functions, third party oversight, internal audit, valuation, portfolio trading and legal and compliance. The Board observed that Invesco Advisers’ systems preparedness and ongoing investment enabled Invesco Advisers to manage, operate and oversee
28 Invesco SteelPath MLP Income Fund
the Invesco Funds with minimal impact or disruption through challenging environments. The Board reviewed and considered the benefits to shareholders of investing in a Fund that is part of the family of funds under the umbrella of Invesco Ltd., Invesco Advisers’ parent company, and noted Invesco Ltd.’s depth and experience in running an investment management business, as well as its commitment of financial and other resources to such business. The Board concluded that the nature, extent and quality of the services provided to the Fund by Invesco Advisers are appropriate and satisfactory.
The Board reviewed the services that may be provided to the Fund by the Affiliated Sub-Advisers under the sub-advisory contracts and the credentials and experience of the officers and employees of the Affiliated Sub-Advisers who provide these services. The Board noted the Affiliated Sub-Advisers’ expertise with respect to certain asset classes and that the Affiliated Sub-Advisers have offices and personnel that are located in financial centers around the world. As a result, the Board noted that the Affiliated Sub-Advisers can provide research and investment analysis on the markets and economies of various countries and territories in which the Fund may invest, make recommendations regarding securities and assist with portfolio trading. The Board concluded that the sub-advisory contracts may benefit the Fund and its shareholders by permitting Invesco Advisers to use the resources and talents of the Affiliated Sub-Advisers in managing the Fund. The Board concluded that the nature, extent and quality of the services that may be provided to the Fund by the Affiliated Sub-Advisers are appropriate and satisfactory.
| B. | Fund Investment Performance |
The Board considered Fund investment performance as a relevant factor in considering whether to approve the investment advisory agreement. The Board did not view Fund investment performance as a relevant factor in considering whether to approve the sub-advisory contracts for the Fund, as no Affiliated Sub-Adviser currently manages assets of the Fund.
The Board compared the Fund’s investment performance over multiple time periods ending December 31, 2022 to the performance of funds in the Broadridge performance universe and against the Alerian MLP Infrastructure Index (Index). The Board noted that performance of Class A shares of the Fund was in the third quintile of its performance universe for the one year period and the first quintile for the three and five year periods (the first quintile being the best performing funds and the fifth quintile being the worst performing funds). The Board noted that performance of Class A shares of the Fund was below the performance of the Index for the one year
period and above the performance of the Index for the three and five year periods. The Board acknowledged limitations regarding the Broadridge data, in particular that the Lipper category includes funds taxed as traditional mutual funds as well as those taxed as C-corporations (such as the Fund) and discussed how such taxation status can impact relative performance. The Board considered that the Fund was created in connection with Invesco Ltd.’s acquisition of OppenheimerFunds, Inc. and its subsidiaries (the “Transaction”) and that the Fund’s performance prior to the closing of the Transaction on May 24, 2019 is that of its predecessor fund. The Board recognized that the performance data reflects a snapshot in time as of a particular date and that selecting a different performance period could produce different results. The Board also reviewed more recent Fund performance as well as other performance metrics, which did not change its conclusions.
| C. | Advisory and Sub-Advisory Fees and Fund Expenses |
The Board compared the Fund’s contractual management fee rate to the contractual management fee rates of funds in the Fund’s Broadridge expense group. The Board noted that the contractual management fee rate for Class A shares of the Fund was reasonably comparable to the median contractual management fee rate of funds in its expense group. The Board noted that the term “contractual management fee” for funds in the expense group may include both advisory and certain non-portfolio management administrative services fees, but that Broadridge is not able to provide information on a fund-by-fund basis as to what is included. The Board also reviewed the methodology used by Broadridge in calculating expense group information, which includes using each fund’s contractual management fee schedule (including any applicable breakpoints) as reported in the most recent prospectus or statement of additional information for each fund in the expense group. The Board also considered comparative information regarding the Fund’s total expense ratio and its various components.
The Board noted that Invesco Advisers has contractually agreed to waive fees and/or limit expenses of the Fund for the term disclosed in the Fund’s registration statement in an amount necessary to limit total annual operating expenses to a specified percentage of average daily net assets for each class of the Fund.
The Board noted that Invesco Advisers and the Affiliated Sub-Advisers do not manage other similarly managed mutual funds or client accounts.
The Board also considered the services that may be provided by the Affiliated Sub-Advisers pursuant to the sub-advisory
contracts, as well as the fees payable by Invesco Advisers to the Affiliated Sub-Advisers pursuant to the sub-advisory contracts.
| D. | Economies of Scale and Breakpoints |
The Board considered the extent to which there may be economies of scale in the provision of advisory services to the Fund and the Invesco Funds, and the extent to which such economies of scale are shared with the Fund and the Invesco Funds. The Board acknowledged the difficulty in calculating and measuring economies of scale at the individual fund level; noting that only indicative and estimated measures are available at the individual fund level and that such measures are subject to uncertainty. The Board considered that the Fund benefits from economies of scale through contractual breakpoints in the Fund’s advisory fee schedule, which generally operate to reduce the Fund’s expense ratio as it grows in size. The Board noted that the Fund also shares in economies of scale through Invesco Advisers’ ability to negotiate lower fee arrangements with third party service providers. The Board noted that the Fund may also benefit from economies of scale through initial fee setting, fee waivers and expense reimbursements, as well as Invesco Advisers’ investment in its business, including investments in business infrastructure, technology and cybersecurity.
| E. | Profitability and Financial Resources |
The Board reviewed information from Invesco Advisers concerning the costs of the advisory and other services that Invesco Advisers and its affiliates provide to the Fund and the Invesco Funds and the profitability of Invesco Advisers and its affiliates in providing these services in the aggregate and on an individual fund-by-fund basis. The Board considered the methodology used for calculating profitability and the periodic review and enhancement of such methodology. The Board noted that Invesco Advisers continues to operate at a net profit from services Invesco Advisers and its affiliates provide to the Invesco Funds in the aggregate and to most Invesco Funds individually. The Board considered that profits to Invesco Advisers can vary significantly depending on the particular Invesco Fund, with some Invesco Funds showing indicative losses to Invesco Advisers and others showing indicative profits at healthy levels, and that Invesco Advisers’ support for and commitment to an Invesco Fund are not, however, solely dependent on the profits realized as to that Fund. The Board did not deem the level of profits realized by Invesco Advisers and its affiliates from providing such services to be excessive, given the nature, extent and quality of the services provided. The Board noted that Invesco Advisers provided information demonstrating that Invesco
29 Invesco SteelPath MLP Income Fund
Advisers is financially sound and has the resources necessary to perform its obligations under the investment advisory agreement, and provided representations indicating that the Affiliated Sub-Advisers are financially sound and have the resources necessary to perform their obligations under the sub-advisory contracts. The Board noted the cyclical and competitive nature of the global asset management industry.
| F. | Collateral Benefits to Invesco Advisers and its Affiliates |
The Board considered various other benefits received by Invesco Advisers and its affiliates from the relationship with the Fund, including the fees received for providing administrative, transfer agency and distribution services to the Fund. The Board received comparative information regarding fees charged for these services, including information provided by Broadridge and other independent sources. The Board reviewed the performance of Invesco Advisers and its affiliates in providing these services and the organizational structure employed to provide these services. The Board noted that these services are provided to the Fund pursuant to written contracts that are reviewed and subject to approval on an annual basis by the Board based on its determination that the services are required for the operation of the Fund.
The Board considered the benefits realized by Invesco Advisers and the Affiliated Sub-Advisers as a result of portfolio brokerage transactions executed through “soft dollar” arrangements. The Board noted that soft dollar arrangements may result in the Fund bearing costs to purchase research that may be used by Invesco Advisers or the Affiliated Sub-Advisers with other clients and may reduce Invesco Advisers’ or the Affiliated Sub-Advisers’ expenses. The Board also considered that it receives from Invesco Advisers periodic reports that include a representation to the effect that these arrangements are consistent with regulatory requirements. The Board did not deem the soft dollar arrangements to be inappropriate.
The Board considered that the Fund’s uninvested cash and cash collateral from any securities lending arrangements may be invested in registered money market funds or, with regard to securities lending cash collateral, unregistered funds that comply with Rule 2a-7 (collectively referred to as “affiliated money market funds”) advised by Invesco Advisers. The Board considered information regarding the returns of the affiliated money market funds relative to comparable overnight investments, as well as the fees paid by the affiliated money market funds to Invesco Advisers and its affiliates. In this regard, the Board noted that Invesco Advisers receives advisory fees
from these affiliated money market funds attributable to the Fund’s investments. The Board also noted that Invesco Advisers has contractually agreed to waive through varying periods an amount equal to 100% of the net advisory fee Invesco Advisers receives from the affiliated money market funds with respect to the Fund’s investment in the affiliated money market funds of uninvested cash, but not cash collateral. The Board concluded that the advisory fees payable to Invesco Advisers from the Fund’s investment of cash collateral from any securities lending arrangements in the affiliated money market funds are for services that are not duplicative of services provided by Invesco Advisers to the Fund.
The Board considered that Invesco Advisers may serve as the Fund’s affiliated securities lending agent and evaluated the benefits realized by Invesco Advisers when serving in such role, including the compensation received. The Board considered Invesco Advisers’ securities lending platform and corporate governance structure for securities lending, including Invesco Advisers’ Securities Lending Governance Committee and its related responsibilities. The Board noted that to the extent the Fund utilizes Invesco Advisers as an affiliated securities lending agent, the Fund conducts its securities lending in accordance with, and in reliance upon, no-action letters issued by the SEC staff that provide guidance on how an affiliate may act as a direct agent lender and receive compensation for those services without obtaining exemptive relief. The Board considered information provided by Invesco Advisers related to the performance of Invesco Advisers as securities lending agent, including a summary of the securities lending services provided to the Fund by Invesco Advisers and the compensation paid to Invesco Advisers for such services, as well as any revenues generated for the Fund in connection with such securities lending activity and the allocation of such revenue between the Fund and Invesco Advisers.
The Board also received information about commissions that an affiliated broker may receive for executing certain trades for the Fund. Invesco Advisers and the Affiliated Sub-Advisers advised the Board of the benefits to the Fund of executing trades through the affiliated broker and that such trades were executed in compliance with rules under the federal securities laws and consistent with best execution obligations.
30 Invesco SteelPath MLP Income Fund
Trustees and Officers
The address of each trustee and officer is AIM Investment Funds (Invesco Investment Funds) (the “Trust”), 11 Greenway Plaza, Houston, Texas 77046-1173. The trustees serve for the life of the Trust, subject to their earlier death, incapacitation, resignation, retirement or removal as more specifically provided in the Trust’s organizational documents. Each officer serves for a one year term or until their successors are elected and qualified. Column two below includes length of time served with predecessor entities, if any.
| | | | | | | | |
Name, Year of Birth and
Position(s)
Held with the Trust | | Trustee and/or Officer Since | | Principal Occupation(s)
During Past 5 Years | | Number of
Funds in
Fund Complex
Overseen by
Trustee | | Other
Directorship(s)
Held by Trustee During Past 5
Years |
| Interested Trustee | | | | | | | | |
| Martin L. Flanagan1 – 1960 Trustee and Vice Chair | | 2007 | | Chairman Emeritus, Invesco Ltd.; Trustee and Vice Chair, The Invesco Funds; and Member of Executive Board, SMU Cox School of Business Formerly: Executive Director, Chief Executive Officer and President, Invesco Ltd. (ultimate parent of Invesco and a global investment management firm); Vice Chair, Investment Company Institute; Advisor to the Board, Invesco Advisers, Inc. (formerly known as Invesco Institutional (N.A.), Inc.); Chairman and Chief Executive Officer, Invesco Advisers, Inc. (registered investment adviser); Director, Chairman, Chief Executive Officer and President, Invesco Holding Company (US), Inc. (formerly IVZ Inc.) (holding company), Invesco Group Services, Inc. (service provider) and Invesco North American Holdings, Inc. (holding company); Director, Chief Executive Officer and President, Invesco Holding Company Limited (parent of Invesco and a global investment management firm); Director, Invesco Ltd.; Chairman, Investment Company Institute and President, Co-Chief Executive Officer, Co-President, Chief Operating Officer and Chief Financial Officer, Franklin Resources, Inc. (global investment management organization) | | 169 | | None |
| 1 | Mr. Flanagan is considered an interested person (within the meaning of Section 2(a)(19) of the 1940 Act) of the Trust because he is an officer of the Adviser to the Trust, and an officer and a director of Invesco Ltd., ultimate parent of the Adviser. |
T-1 Invesco SteelPath MLP Income Fund
Trustees and Officers—(continued)
| | | | | | | | |
Name, Year of Birth and
Position(s)
Held with the Trust | | Trustee and/or Officer Since | | Principal Occupation(s) During Past 5 Years | | Number of Funds in
Fund Complex Overseen by Trustee | | Other Directorship(s)
Held by Trustee During Past 5 Years |
| Independent Trustees | | | | | | | | |
Beth Ann Brown – 1968 Trustee (2019) and Chair (August 2022) | | 2019 | | Independent Consultant Formerly: Head of Intermediary Distribution, Managing Director, Strategic Relations, Managing Director, Head of National Accounts, Senior Vice President, National Account Manager and Senior Vice President, Key Account Manager, Columbia Management Investment Advisers LLC; Vice President, Key Account Manager, Liberty Funds Distributor, Inc.; and Trustee of certain Oppenheimer Funds | | 169 | | Director, Board of Directors of Caron Engineering Inc.; Advisor, Board of Advisors of Caron Engineering Inc.; President and Director, Acton Shapleigh Youth Conservation Corps (non-profit); Formerly: President and Director of Grahamtastic Connection (non-profit) |
Cynthia Hostetler –1962 Trustee | | 2017 | | Non-Executive Director and Trustee of a number of public and private business corporations Formerly: Director, Aberdeen Investment Funds (4 portfolios); Director, Artio Global Investment LLC (mutual fund complex); Director, Edgen Group, Inc. (specialized energy and infrastructure products distributor); Director, Genesee & Wyoming, Inc. (railroads): Head of Investment Funds and Private Equity, Overseas Private Investment Corporation; President, First Manhattan Bancorporation, Inc.; and Attorney, Simpson Thacher & Bartlett LLP | | 169 | | Resideo Technologies (smart home technology); Vulcan Materials Company (construction materials company); Trilinc Global Impact Fund; Textainer Group Holdings, (shipping container leasing company); Investment Company Institute (professional organization); and Independent Directors Council (professional organization) |
Eli Jones – 1961 Trustee | | 2016 | | Professor and Dean Emeritus, Mays Business School — Texas A&M University Formerly: Dean of Mays Business School — Texas A&M University; Professor and Dean, Walton College of Business, University of Arkansas and E.J. Ourso College of Business, Louisiana State University; and Director, Arvest Bank | | 169 | | Insperity, Inc. (formerly known as Administaff) (human resources provider); Board Member of the regional board, First Financial Bank Texas; and Board Member, First Financial Bankshares, Inc. Texas |
Elizabeth Krentzman – 1959 Trustee | | 2019 | | Formerly: Principal and Chief Regulatory Advisor for Asset Management Services and U.S. Mutual Fund Leader of Deloitte & Touche LLP; General Counsel of the Investment Company Institute (trade association); National Director of the Investment Management Regulatory Consulting Practice, Principal, Director and Senior Manager of Deloitte & Touche LLP; Assistant Director of the Division of Investment Management—Office of Disclosure and Investment Adviser Regulation of the U.S. Securities and Exchange Commission and various positions with the Division of Investment Management — Office of Regulatory Policy of the U.S. Securities and Exchange Commission; Associate at Ropes & Gray LLP; and Trustee of certain Oppenheimer Funds | | 169 | | Formerly: Member of the Cartica Funds Board of Directors (private investment funds); Trustee of the University of Florida National Board Foundation; and Member of the University of Florida Law Center Association, Inc. Board of Trustees, Audit Committee and Membership Committee |
Anthony J. LaCava, Jr. – 1956 Trustee | | 2019 | | Formerly: Director and Member of the Audit Committee, Blue Hills Bank (publicly traded financial institution) and Managing Partner, KPMG LLP | | 169 | | Blue Hills Bank; Member and Chairman, Bentley University, Business School Advisory Council; and Nominating Committee, KPMG LLP |
Prema Mathai-Davis – 1950 Trustee | | 2001 | | Retired Formerly: Co-Founder & Partner of Quantalytics Research, LLC, (a FinTech Investment Research Platform for the Self-Directed Investor); Trustee of YWCA Retirement Fund; CEO of YWCA of the USA; Board member of the NY Metropolitan Transportation Authority; Commissioner of the NYC Department of Aging; and Board member of Johns Hopkins Bioethics Institute | | 169 | | Member of Board of Positive Planet US (non-profit) and HealthCare Chaplaincy Network (non-profit) |
T-2 Invesco SteelPath MLP Income Fund
Trustees and Officers—(continued)
| | | | | | | | |
Name, Year of Birth and
Position(s)
Held with the Trust | | Trustee and/or Officer Since | | Principal Occupation(s) During Past 5 Years | | Number of Funds in
Fund Complex Overseen by Trustee | | Other Directorship(s)
Held by Trustee During Past 5 Years |
| Independent Trustees—(continued) | | | | |
Joel W. Motley – 1952 Trustee | | 2019 | | Director of Office of Finance, Federal Home Loan Bank System; Managing Director of Carmona Motley Inc. (privately held financial advisor); Member of the Council on Foreign Relations and its Finance and Budget Committee; Chairman Emeritus of Board of Human Rights Watch and Member of its Investment Committee; Member of Investment Committee and Board of Historic Hudson Valley (non-profit cultural organization); Member of the Board, Blue Ocean Acquisition Corp; and Member of the Vestry and the Investment Committee of Trinity Church Wall Street Formerly: Managing Director of Public Capital Advisors, LLC (privately held financial advisor); Managing Director of Carmona Motley Hoffman, Inc. (privately held financial advisor); Trustee of certain Oppenheimer Funds; and Director of Columbia Equity Financial Corp. (privately held financial advisor) | | 169 | | Member of Board of Trust for Mutual Understanding (non-profit promoting the arts and environment); Member of Board of Greenwall Foundation (bioethics research foundation) and its Investment Committee; Member of Board of Friends of the LRC (non-profit legal advocacy); and Board Member and Investment Committee Member of Pulitzer Center for Crisis Reporting (non-profit journalism) |
Teresa M. Ressel – 1962 Trustee | | 2017 | | Non-executive director and trustee of a number of public and private business corporations Formerly: Chief Executive Officer, UBS Securities LLC (investment banking); Chief Operating Officer, UBS AG Americas (investment banking); Sr. Management Team Olayan America, The Olayan Group (international investor/commercial/industrial); and Assistant Secretary for Management & Budget and Designated Chief Financial Officer, U.S. Department of Treasury | | 169 | | None |
Robert C. Troccoli – 1949 Trustee | | 2016 | | Retired Formerly: Adjunct Professor, University of Denver – Daniels College of Business; and Managing Partner, KPMG LLP | | 169 | | None |
Daniel S. Vandivort – 1954 Trustee | | 2019 | | President, Flyway Advisory Services LLC (consulting and property management) Formerly: President and Chief Investment Officer, previously Head of Fixed Income, Weiss Peck and Greer/Robeco Investment Management; Trustee and Chair, Weiss Peck and Greer Funds Board; and various capacities at CS First Boston including Head of Fixed Income at First Boston Asset Management. | | 169 | | Formerly: Trustee and Governance Chair, Oppenheimer Funds; Treasurer, Chairman of the Audit and Finance Committee, Huntington Disease Foundation of America. |
T-3 Invesco SteelPath MLP Income Fund
Trustees and Officers—(continued)
| | | | | | | | |
Name, Year of Birth and
Position(s)
Held with the Trust | | Trustee and/or Officer Since | | Principal Occupation(s) During Past 5 Years | | Number of Funds in
Fund Complex Overseen by Trustee | | Other Directorship(s)
Held by Trustee During Past 5 Years |
| Officers | | | | | | | | |
Glenn Brightman – 1972 President and Principal Executive Officer | | 2023 | | Chief Operating Officer, Americas, Invesco Ltd.; President and Principal Executive Officer, The Invesco Funds. Formerly: Global Head of Finance, Invesco Ltd; Executive Vice President and Chief Financial Officer, Nuveen | | N/A | | N/A |
Melanie Ringold – 1975 Senior Vice President, Chief Legal Officer and Secretary | | 2023 | | Head of Legal of the Americas, Invesco Ltd.; Senior Vice President and Secretary, Invesco Advisers, Inc. (formerly known as Invesco Institutional (N.A.), Inc.) (registered investment adviser); Secretary, Invesco Distributors, Inc. (formerly known as Invesco AIM Distributors, Inc.); Secretary, Invesco Investment Services, Inc. (formerly known as Invesco AIM Investment Services, Inc.); Senior Vice President, Chief Legal Officer and Secretary, The Invesco Funds; Secretary, Invesco Investment Advisers LLC; Invesco Capital Markets, Inc.; Chief Legal Officer, Invesco Exchange-Traded Fund Trust, Invesco Exchange-Traded Fund Trust II, Invesco India Exchange-Traded Fund Trust, Invesco Actively Managed Exchange-Traded Fund Trust, Invesco Actively Managed Exchange-Traded Commodity Fund Trust and Invesco Exchange-Traded Self-Indexed Fund Trust; Secretary and Vice President, Harbourview Asset Management Corporation; Secretary and Senior Vice President, OppenheimerFunds, Inc. and Invesco Managed Accounts, LLC; Secretary and Senior Vice President, OFI SteelPath, Inc.; Secretary and Senior Vice President, Oppenheimer Acquisition Corp.; Secretary, SteelPath Funds Remediation LLC; and Secretary and Senior Vice President, Trinity Investment Management Corporation Formerly: Assistant Secretary, Invesco Distributors, Inc., Invesco Advisers, Inc., Invesco Investment Services, Inc., Invesco Capital Markets, Inc., Invesco Capital Management LLC and Invesco Investment Advisers LLC; and Assistant Secretary and Investment Vice President, Invesco Funds | | N/A | | N/A |
Andrew R. Schlossberg – 1974 Senior Vice President | | 2019 | | Chief Executive Officer, President and Executive Director, Invesco Ltd.; Senior Vice President, The Invesco Funds; and Trustee, Invesco Foundation, Inc. Formerly: Senior Vice President, Invesco Group Services, Inc. Director and Senior Vice President, Invesco Advisers, Inc. (formerly known as Invesco Institutional (N.A.), Inc.) (registered investment adviser); Director and Chairman, Invesco Investment Services, Inc. (formerly known as Invesco AIM Investment Services, Inc.) (registered transfer agent); Head of the Americas and Senior Managing Director, Invesco Ltd.; Director, Invesco Investment Advisers LLC (formerly known as Van Kampen Asset Management); Director, President and Chairman, Invesco Insurance Agency, Inc.; Director, Invesco UK Limited; Director and Chief Executive, Invesco Asset Management Limited and Invesco Fund Managers Limited; Assistant Vice President, The Invesco Funds; Senior Vice President, Invesco Advisers, Inc. (formerly known as Invesco Institutional (N.A.), Inc.) (registered investment adviser); Director and Chief Executive, Invesco Administration Services Limited and Invesco Global Investment Funds Limited; Director, Invesco Distributors, Inc.; Head of EMEA, Invesco Ltd.; President, Invesco Actively Managed Exchange-Traded Commodity Fund Trust, Invesco Actively Managed Exchange-Traded Fund Trust, Invesco Exchange-Traded Fund Trust, Invesco Exchange-Traded Fund Trust II and Invesco India Exchange-Traded Fund Trust; and Managing Director and Principal Executive Officer, Invesco Capital Management LLC | | N/A | | N/A |
T-4 Invesco SteelPath MLP Income Fund
Trustees and Officers—(continued)
| | | | | | | | |
Name, Year of Birth and
Position(s)
Held with the Trust | | Trustee and/or Officer Since | | Principal Occupation(s) During Past 5 Years | | Number of Funds in
Fund Complex Overseen by Trustee | | Other Directorship(s)
Held by Trustee During Past 5 Years |
| Officers—(continued) | | | | | | | | |
John M. Zerr – 1962 Senior Vice President | | 2006 | | Chief Operating Officer of the Americas; Senior Vice President, Invesco Advisers, Inc. (formerly known as Invesco Institutional (N.A.), Inc.) (registered investment adviser); Senior Vice President, Invesco Distributors, Inc. (formerly known as Invesco AIM Distributors, Inc.); Director and Vice President, Invesco Investment Services, Inc. (formerly known as Invesco AIM Investment Services, Inc.) Senior Vice President, The Invesco Funds; Managing Director, Invesco Capital Management LLC; Senior Vice President, Invesco Capital Markets, Inc. (formerly known as Van Kampen Funds Inc.); Manager, Invesco Specialized Products, LLC; Member, Invesco Canada Funds Advisory Board; Director, President and Chief Executive Officer, Invesco Corporate Class Inc. (corporate mutual fund company); Director, Chairman, President and Chief Executive Officer, Invesco Canada Ltd. (formerly known as Invesco Trimark Ltd./Invesco Trimark Ltèe) (registered investment adviser and registered transfer agent); President, Invesco, Inc.; President, Invesco Global Direct Real Estate Feeder GP Ltd.; President, Invesco IP Holdings (Canada) Ltd; President, Invesco Global Direct Real Estate GP Ltd.; President, Invesco Financial Services Ltd./Services Financiers Invesco Ltée; and Director and Chairman, Invesco Trust Company Formerly: Manager, Invesco Indexing LLC; Director, Invesco Investment Advisers LLC (formerly known as Van Kampen Asset Management); President, Trimark Investments Ltd/Services Financiers Invesco Ltee; Director and Senior Vice President, Invesco Insurance Agency, Inc.; Director and Senior Vice President, Invesco Management Group, Inc. (formerly known as Invesco AIM Management Group, Inc.); Secretary and General Counsel, Invesco Management Group, Inc. (formerly known as Invesco AIM Management Group, Inc.); Secretary, Invesco Investment Services, Inc. (formerly known as Invesco AIM Investment Services, Inc.); Chief Legal Officer and Secretary, The Invesco Funds; Secretary and General Counsel, Invesco Investment Advisers LLC (formerly known as Van Kampen Asset Management); Secretary and General Counsel, Invesco Capital Markets, Inc. (formerly known as Van Kampen Funds Inc.); Chief Legal Officer, Invesco Exchange-Traded Fund Trust, Invesco Exchange-Traded Fund Trust II, Invesco India Exchange-Traded Fund Trust, Invesco Actively Managed Exchange-Traded Fund Trust, Invesco Actively Managed Exchange-Traded Commodity Fund Trust and Invesco Exchange-Traded Self-Indexed Fund Trust; Secretary, Invesco Indexing LLC; Director, Secretary, General Counsel and Senior Vice President, Van Kampen Exchange Corp.; Director, Vice President and Secretary, IVZ Distributors, Inc. (formerly known as INVESCO Distributors, Inc.); Director and Vice President, INVESCO Funds Group, Inc.; Director and Vice President, Van Kampen Advisors Inc.; Director, Vice President, Secretary and General Counsel, Van Kampen Investor Services Inc.; Director and Secretary, Invesco Distributors, Inc. (formerly known as Invesco AIM Distributors, Inc.); Director, Senior Vice President, General Counsel and Secretary, Invesco AIM Advisers, Inc. and Van Kampen Investments Inc.; Director, Vice President and Secretary, Fund Management Company; Director, Senior Vice President, Secretary, General Counsel and Vice President, Invesco AIM Capital Management, Inc.; and Chief Operating Officer and General Counsel, Liberty Ridge Capital, Inc. (an investment adviser) | | N/A | | N/A |
Tony Wong – 1973 Senior Vice President | | 2023 | | Senior Managing Director, Invesco Ltd.; Director, Chairman, Chief Executive Officer and President, Invesco Advisers, Inc.; Director and Chairman, Invesco Private Capital, Inc., INVESCO Private Capital Investments, Inc. and INVESCO Realty, Inc.; Director, Invesco Senior Secured Management, Inc.; President, Invesco Managed Accounts, LLC and SNW Asset Management Corporation; and Senior Vice President, The Invesco Funds Formerly: Assistant Vice President, The Invesco Funds; and Vice President, Invesco Advisers, Inc. | | N/A | | N/A |
| Stephanie C. Butcher – 1971 Senior Vice President | | 2023 | | Senior Managing Director, Invesco Ltd.; Senior Vice President, The Invesco Funds; Director and Chief Executive Officer, Invesco Asset Management Limited | | N/A | | N/A |
Adrien Deberghes – 1967 Principal Financial Officer, Treasurer and Senior Vice President | | 2020 | | Head of the Fund Office of the CFO and Fund Administration; Vice President, Invesco Advisers, Inc.; Principal Financial Officer, Treasurer and Senior Vice President, The Invesco Funds; and Vice President, Invesco Exchange-Traded Fund Trust, Invesco Exchange-Traded Fund Trust II, Invesco India Exchange-Traded Fund Trust, Invesco Actively Managed Exchange-Traded Fund Trust, Invesco Actively Managed Exchange-Traded Commodity Fund Trust and Invesco Exchange-Traded Self-Indexed Fund Trust Formerly: Vice President, The Invesco Funds; Senior Vice President and Treasurer, Fidelity Investments | | N/A | | N/A |
Crissie M. Wisdom – 1969 Anti-Money Laundering Compliance Officer | | 2013 | | Anti-Money Laundering and OFAC Compliance Officer for Invesco U.S. entities including: Invesco Advisers, Inc. and its affiliates, Invesco Capital Markets, Inc., Invesco Distributors, Inc., Invesco Investment Services, Inc., The Invesco Funds, Invesco Capital Management, LLC, Invesco Trust Company; and Fraud Prevention Manager for Invesco Investment Services, Inc. | | N/A | | N/A |
T-5 Invesco SteelPath MLP Income Fund
Trustees and Officers—(continued)
| | | | | | | | |
Name, Year of Birth and
Position(s)
Held with the Trust | | Trustee and/or Officer Since | | Principal Occupation(s) During Past 5 Years | | Number of Funds in
Fund Complex Overseen by Trustee | | Other Directorship(s)
Held by Trustee During Past 5 Years |
| Officers—(continued) | | | | | | | | |
Todd F. Kuehl – 1969 Chief Compliance Officer and Senior Vice President | | 2020 | | Chief Compliance Officer, Invesco Advisers, Inc. (registered investment adviser); and Chief Compliance Officer and Senior Vice President, The Invesco Funds Formerly: Managing Director and Chief Compliance Officer, Legg Mason (Mutual Funds); Chief Compliance Officer, Legg Mason Private Portfolio Group (registered investment adviser) | | N/A | | N/A |
James Bordewick, Jr. – 1959 Senior Vice President and Senior Officer | | 2022 | | Senior Vice President and Senior Officer, The Invesco Funds Formerly: Chief Legal Officer, KingsCrowd, Inc. (research and analytical platform for investment in private capital markets); Chief Operating Officer and Head of Legal and Regulatory, Netcapital (private capital investment platform); Managing Director, General Counsel of asset management and Chief Compliance Officer for asset management and private banking, Bank of America Corporation; Chief Legal Officer, Columbia Funds and BofA Funds; Senior Vice President and Associate General Counsel, MFS Investment Management; Chief Legal Officer, MFS Funds; Associate, Ropes & Gray; and Associate, Gaston Snow & Ely Bartlett. | | N/A | | N/A |
The Statement of Additional Information of the Trust includes additional information about the Fund’s Trustees and is available upon request, without charge, by calling 1.800.959.4246. Please refer to the Fund’s Statement of Additional Information for information on the Fund’s sub-advisers.
Office of the Fund
11 Greenway Plaza
Houston, TX 77046-1173
Counsel to the Fund
Stradley Ronon Stevens & Young, LLP
2005 Market Street, Suite 2600
Philadelphia, PA 19103-7018
Investment Adviser
Invesco Advisers, Inc.
1331 Spring Street NW, Suite 2500
Atlanta, GA 30309
Counsel to the Independent Trustees
Sidley Austin
787 Seventh Avenue
New York, NY 10019
Distributor
Invesco Distributors, Inc.
11 Greenway Plaza
Houston, TX 77046-1173
Transfer Agent
Invesco Investment Services, Inc.
11 Greenway Plaza,
Houston, TX 77046-1173
Auditors
PricewaterhouseCoopers LLP
1000 Louisiana Street, Suite 5800
Houston, TX 77002-5021
Custodian
UMB Bank, n.a.
1010 Grand Boulevard
Kansas City, MO 64106
T-6 Invesco SteelPath MLP Income Fund

Go paperless with eDelivery
Visit invesco.com/edelivery to enjoy the convenience and security of anytime electronic access to your investment documents.
With eDelivery, you can elect to have any or all of the following materials delivered straight to your inbox to download, save and print from your own computer:
| • | | Fund reports and prospectuses |
Invesco mailing information
Send general correspondence to Invesco Investment Services, Inc., P.O. Box 219078, Kansas City, MO 64121-9078.
Important notice regarding delivery of security holder documents
To reduce Fund expenses, only one copy of most shareholder documents may be mailed to shareholders with multiple accounts at the same address (Householding). Mailing of your shareholder documents may be householded indefinitely unless you instruct us otherwise. If you do not want the mailing of these documents to be combined with those for other members of your household, please contact Invesco Investment Services, Inc. at 800 959 4246 or contact your financial institution. We will begin sending you individual copies for each account within 30 days after receiving your request.
Fund holdings and proxy voting information
The Fund provides a complete list of its portfolio holdings four times each year, at the end of each fiscal quarter. For the second and fourth quarters, the list appears, respectively, in the Fund’s semiannual and annual reports to shareholders. For the first and third quarters, the Fund files the list with the Securities and Exchange Commission (SEC) as an exhibit to its reports on Form N-PORT. The most recent list of portfolio holdings is available at invesco.com/completeqtrholdings. Shareholders can also look up the Fund’s Form N-PORT filings on the SEC website, sec.gov. The SEC file numbers for the Fund are shown below.
A description of the policies and procedures that the Fund uses to determine how to vote proxies relating to portfolio securities is available without charge, upon request, from our Client Services department at 800 959 4246, or at invesco.com/corporate/about-us/esg. The information is also available on the SEC website, sec.gov.
Information regarding how the Fund voted proxies related to its portfolio securities during the most recent 12-month period ended June 30 is available at invesco.com/proxysearch. This information is also available on the SEC website, sec.gov.
Invesco Advisers, Inc. is an investment adviser; it provides investment advisory services to individual and institutional clients and does not sell securities. Invesco Distributors, Inc. is the US distributor for Invesco Ltd.’s retail mutual funds, exchange-traded funds and institutional money market funds. Both are wholly owned, indirect subsidiaries of Invesco Ltd.
| | | | | | |
SEC file numbers: 811-05426 and 033-19338 | | Invesco Distributors, Inc. | | | O-SPMI-AR-1 | |

| | | | |
| Annual Report to Shareholders | | | November 30, 2023 | |
| | | | |
| Invesco SteelPath MLP Select 40 Fund | |
| |
| | | | |
| Nasdaq: | |
| A: MLPFX ∎ C: MLPEX ∎ R: SPMWX ∎ Y: MLPTX ∎ R5: SPMVX ∎ R6: OSPSX | |
Beginning in July 2024, amendments adopted by the Securities and Exchange Commission will substantially impact the design, content, and delivery of shareholder reports. These newly designed shareholder reports will highlight key fund information in a clear and concise format and must be mailed to each shareholder that has not elected to receive the reports electronically. Other information, including financial statements, will no longer be included in the shareholder report but will be available at invesco.com/reports, delivered upon request, and filed on a semi-annual basis on Form N-CSR.
If you would like to receive shareholder reports and other communications electronically instead of by mail, you may make that request by contacting your financial intermediary (such as a broker-dealer or bank) or, if you are a direct investor, by enrolling at invesco.com/edelivery. If you do not make this request or enroll in e-delivery, you will receive future shareholder reports and other communications by mail.
Management’s Discussion of Fund Performance
| | | | |
| Performance summary | | | | |
For the fiscal year ended November 30, 2023, Class A shares of Invesco SteelPath MLP Select 40 Fund (the Fund), at net asset value (NAV), outperformed the S&P 500® Index. Your Fund’s long-term performance appears later in this report. | |
| | | | |
| |
| | | | |
| Fund vs. Indexes | | | | |
| Total returns, 11/30/22 to 11/30/23, at net asset value (NAV). Performance shown does not include applicable contingent deferred sales charges (CDSC) or front-end sales charges, which would have reduced performance. | |
Class A Shares | | | 20.66 | % |
Class C Shares | | | 19.85 | |
Class R Shares | | | 20.38 | |
Class Y Shares | | | 21.22 | |
Class R5 Shares | | | 21.00 | |
Class R6 Shares | | | 21.30 | |
S&P 500 Index | | | 13.84 | |
Alerian MLP Index | | | 23.29 | |
| |
Source(s): RIMES Technologies Corp. | | | | |
Fund Performance Discussion
The Fund’s Class A shares (without sales charge) produced a total return of 20.66% during the fiscal year ended November 30, 2023. In comparison, master limited partnerships (MLPs), as measured by the Alerian MLP Index (AMZ), generated a total return of 23.29%. Please note that the returns for the Alerian MLP Index are calculated pre-tax, while the Fund’s returns are calculated post corporate tax. Over the same period, the S&P 500 Index produced a total return of 13.84%.
Over the fiscal year, global equity markets were choppy as market participants weighed continued inflation concerns, rising interest rates, worry over Chinese economic conditions, and the ongoing war between Russia and Ukraine. Commodity prices were mostly lower, but energy stocks generally traded higher, midstream equities included.
Midstream sector participants benefitted from record U.S. production of crude oil and natural gas during the period, with crude oil volumes in September 2023 finally exceeding the 2019 highs. Natural gas production volumes continued to benefit from robust exports driven by higher international pricing relative to domestic prices. Despite continued volume growth, midstream equities still traded at discounted valuations relative to history.
Over the fiscal year, we estimate a de minimis amount of equity supply entered the market through secondary offerings, initial public offerings, preferred offerings, or “at-the-market” programs in which primary units trade into the market anonymously throughout the normal trading day. Most midstream MLPs pay out substantial distributions to investors and, therefore, have historically raised external capital to fund larger growth projects or acquisitions. However, in recent years most sector
participants have adjusted their business models to self-fund the equity portion of their investment plans and repurchase discounted equity. Wells Fargo estimates that during the first three quarters of 2023 midstream companies collectively repurchased over $3 billion of stock.
Macro Review
West Texas Intermediate (WTI) crude oil prices ended the period at $75.96 per barrel, down 6% over the year, while global crude prices, as measured by Brent crude oil, traded 3% lower over the fiscal year. During the period, crude prices approached $100 per barrel before drifting lower. Henry Hub natural gas prices exited November 2023 at $2.80 per million British thermal units (mmbtu), down 60% over the fiscal year driven by softening export demand as Europe normalized after the initial escalation associated with the onset of the Russia-Ukraine war in the prior period. Regional price differentials improved in most basins, including the Permian basin where new takeaway capacity was added via pipeline expansions.
Mont Belvieu natural gas liquids (NGL) prices ended the fiscal year at $28.35 per barrel, a 14% decrease over the fiscal year. Pricing for NGL purity products was mixed, with isobutane ending the period 25% higher than the start of the fiscal year while ethane, butane, propane, and natural gasoline all traded lower. Frac spreads, a measure of natural gas processing economics, ended the period at $0.43 per gallon, more than doubling over the fiscal year. Generally, the greater the frac spread, the greater the incentive for producers to seek natural gas processing capacity.
The yield curve remained inverted, and generally steepened, over the period as short rates rose more than the yields on medium-dated maturities. The 10-year
Treasury yield rose by 72 basis points to end the period at 4.33%. The MLP yield spread at fiscal year-end, as measured by the AMZ and the 10-year Treasury bond, narrowed by 15 basis points to 3.27%.
Over the fiscal year, real estate investment trusts (REITs) and utilities, two competing yield-oriented equity asset classes, posted total returns of -2.78% (as measured by the Dow Jones Equity REIT Total Return Index) and -8.16% (as measured by the Dow Jones Utility Average Index), respectively, as compared to the AMZ’s +23.29% total return.
Subsector Reviews
Performance for all subsectors in the midstream, or energy infrastructure, asset class was positive over the fiscal year. On average, sector participants in the Compression subsector provided the strongest performance over the period supported by rising natural gas production volumes and increased utilization. The Diversified subsector also outperformed, also benefitting from increasing production volumes and generally improving demand.
The Natural Gas Pipeline subsector experienced the weakest, albeit positive, performance over the fiscal year driven by idiosyncratic factors from one subsector member. Similarly, average performance for the Propane subsector was weighed down by very weak performance of a single subsector participant.
Fund Review
Key contributors to the Invesco SteelPath MLP Select 40 Fund for the fiscal year ended November 30, 2023 were Archrock, Inc (NYSE: AROC) and NGL Energy Partners, LP (NYSE: NGL).
AROC shares outperformed over the period after reporting better than expected second quarter results, guided to 5% dividend growth in 2024, and instituted a share repurchase program. Additionally, compression names have benefitted from strong utilization factors driving improved pricing power. AROC is one of the largest operators of compression units in the industry with operations in the most active basins in the U.S. including the Permian, Eagle Ford, SCOOP/STACK, and Niobrara.
NGL outperformed over the period as it reduced leverage faster than had been expected. Once balance sheet metrics reach management targets, the partnership is expected to enhance its common unit distribution payout. NGL operates across a diversified set of operating segments comprised of liquids, crude logistics, and water services. NGL’s largest segment, water services, transports, treats, and disposes of produced water from the oil and natural gas production process. Its network of water pipeline and disposal assets in the
2 Invesco SteelPath MLP Select 40 Fund
Delaware basin has been particularly meaningful in generating incremental volumes and cash flow for the partnership.
Key detractors from the Invesco SteelPath MLP Select 40 Fund for the fiscal year ended November 30, 2023 were ARKO Corp (NASDAQ: ARKO) and Westlake Chemical Partners, LP (NYSE: WLKP).
ARKO underperformed over the period after announcing first quarter financial and operating results that were slightly below expectations driven by lower fuel demand that was mostly offset by higher fuel margins. Despite the weaker than expected results, we believe that ARKO management has continued to focus on growing its business through accretive acquisitions. ARKO is the sixth-largest convenience store operator in the United States with more than 1,400+ retail locations. The company also operates a Wholesale fuel distribution segment and a fleet selling segment.
WLKP underperformed over the period due to weakness in ethylene demand that negatively impacted margins on the 5% of volumes that are associated with third-party sales. WLKP is a downstream entity that owns a 22.8% equity stake in Westlake Corporation’s (WLK) ethylene production, providing feedstock for polyolefins and PVC production. We maintain that WLKP has a robust contract structure with 95% fee-based cash flow and multiple levers for growth including additional asset drop downs from WLK, organic growth around its current asset footprint, M&A with or without the parent, and options to increase the current fixed ethylene margin.
Outlook
Despite midstream equities outperforming the S&P 500 Index for several years, we believe the sector remains well positioned to continue providing investors with an attractive yield and total return experience over the coming years. In our view, valuations remain attractive and fundamentals support expectations for modest cash flow growth for most sector participants, particularly those with business segments focused on key producing basins and those that support activities to export crude oil, refined products, liquified petroleum gases (LPGs), and/or liquified natural gas (LNG).
All data, unless otherwise noted, sourced from Bloomberg LP as of November 30, 2023.
Portfolio managers:
Stuart Cartner
Brian Watson
The views and opinions expressed in management’s discussion of Fund performance are those of Invesco Advisers, Inc. and its affiliates. These views and opinions are subject to change at any time based on factors such as
market and economic conditions. These views and opinions may not be relied upon as investment advice or recommendations, or as an offer for a particular security. The information is not a complete analysis of every aspect of any market, country, industry, security or the Fund. Statements of fact are from sources considered reliable, but Invesco Advisers, Inc. makes no representation or warranty as to their completeness or accuracy. Although historical performance is no guarantee of future results, these insights may help you understand our investment management philosophy.
See important Fund and, if applicable, index disclosures later in this report.
3 Invesco SteelPath MLP Select 40 Fund
Your Fund’s Long-Term Performance
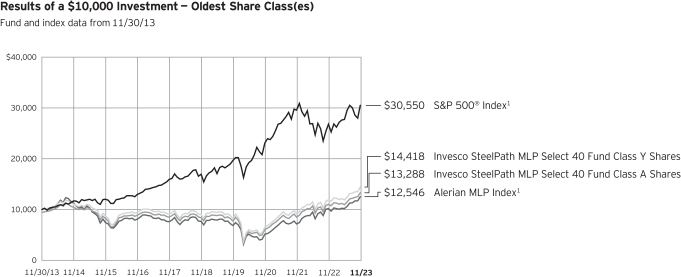
1 Source: RIMES Technologies Corp.
Past performance cannot guarantee future results.
The data shown in the chart include reinvested distributions, applicable sales charges and Fund expenses including
management fees. Index results include reinvested dividends, but they do not reflect sales charges. Performance of the peer group, if applicable, reflects fund expenses and management fees;
performance of a market index does not. Performance shown in the chart does not reflect deduction of taxes a shareholder would pay on Fund distributions or sale of Fund shares.
4 Invesco SteelPath MLP Select 40 Fund
| | | | |
| Average Annual Total Returns | | | | |
| As of 11/30/23, including maximum applicable sales charges | |
| Class A Shares | | | | |
Inception (3/31/10) | | | 5.28 | % |
10 Years | | | 2.88 | |
5 Years | | | 8.41 | |
1 Year | | | 13.97 | |
| Class C Shares | | | | |
Inception (7/14/11) | | | 4.48 | % |
10 Years | | | 2.84 | |
5 Years | | | 8.82 | |
1 Year | | | 18.85 | |
| Class R Shares | | | | |
10 Years | | | 3.22 | % |
5 Years | | | 9.39 | |
1 Year | | | 20.38 | |
| Class Y Shares | | | | |
Inception (3/31/10) | | | 6.00 | % |
10 Years | | | 3.73 | |
5 Years | | | 9.93 | |
1 Year | | | 21.22 | |
| Class R5 Shares | | | | |
10 Years | | | 3.62 | % |
5 Years | | | 9.96 | |
1 Year | | | 21.00 | |
| Class R6 Shares | | | | |
Inception (6/28/13) | | | 3.89 | % |
10 Years | | | 3.81 | |
5 Years | | | 10.02 | |
1 Year | | | 21.30 | |
Effective after the close of business on May 24, 2019, Class A, Class C, Class Y and Class I shares of the Oppenheimer SteelPath MLP Select 40 Fund (the predecessor fund), were reorganized into Class A, Class C, Class Y and Class R6 shares, respectively, of the Invesco Oppenheimer SteelPath MLP Select 40 Fund. The Fund was subsequently renamed the Invesco SteelPath MLP Select 40 Fund (the Fund). Returns shown above, for periods ending on or prior to May 24, 2019, for Class A, Class C, Class Y and Class R6 shares are those for Class A, Class C, Class Y and Class I shares of the predecessor fund. Share class returns will differ from the predecessor fund because of different expenses.
Class R and R5 shares incepted after the close of business on May 24, 2019. Performance shown on and prior to that date is that of the predecessor fund’s Class A shares at net asset value and includes the 12b-1 fees applicable to Class A shares.
The performance data quoted represent past performance and cannot guarantee future results; current performance may
be lower or higher. Please visit invesco.com/performance for the most recent month-end performance. Performance figures reflect reinvested distributions, changes in net asset value and the effect of the maximum sales charge unless otherwise stated. Performance figures do not reflect deduction of taxes a shareholder would pay on Fund distributions or sale of Fund shares. Investment return and principal value will fluctuate so that you may have a gain or loss when you sell shares.
Class A share performance reflects the maximum 5.50% sales charge, and Class C share performance reflects the applicable contingent deferred sales charge (CDSC) for the period involved. The CDSC on Class C shares is 1% for the first year after purchase. Class R, Class Y, Class R5 and Class R6 shares do not have a front-end sales charge or a CDSC; therefore, performance is at net asset value.
The performance of the Fund’s share classes will differ primarily due to different sales charge structures and class expenses.
Fund performance reflects any applicable fee waivers and/or expense reimbursements. Had the adviser not waived fees and/or reimbursed expenses currently or in the past, returns would have been lower.
See current prospectus for more information.
5 Invesco SteelPath MLP Select 40 Fund
Supplemental Information
Invesco SteelPath MLP Select 40 Fund’s investment objective is to seek total return.
| • | | Unless otherwise stated, information presented in this report is as of November 30, 2023, and is based on total net assets. |
| • | | Unless otherwise noted, all data is provided by Invesco. |
| • | | To access your Fund’s reports/prospectus, visit invesco.com/fundreports. |
About indexes used in this report
| • | | The S&P 500® Index is an unmanaged index considered representative of the US stock market. |
| • | | The Alerian MLP Index is designed to capture the performance of energy master limited partnerships (MLPs). |
| • | | The Fund is not managed to track the performance of any particular index, including the index(es) described here, and consequently, the performance of the Fund may deviate significantly from the performance of the index(es). |
| • | | A direct investment cannot be made in an index. Unless otherwise indicated, index results include reinvested dividends, and they do not reflect sales charges. Performance of the peer group, if applicable, reflects fund expenses; performance of a market index does not. |
This report must be accompanied or preceded by a currently effective Fund prospectus, which contains more complete information, including sales charges and expenses. Investors should read it carefully before investing.
NOT FDIC INSURED | MAY LOSE VALUE | NO BANK GUARANTEE
6 Invesco SteelPath MLP Select 40 Fund
Fund Information
| | | | |
| Portfolio Composition | | | |
| |
| By Sector | | % of total net assets | |
Gathering & Processing | | | 28.92 | % |
Diversified | | | 28.58 | |
Other Energy | | | 23.78 | |
Petroleum Pipeline Transportation | | | 21.42 | |
Natural Gas Pipeline Transportation | | | 3.38 | |
Production & Mining | | | 0.45 | |
Terminalling & Storage | | | 0.03 | |
Money Market Funds Plus Other Assets Less Liabilities | | | (6.56) | |
| |
| | | | |
Top 10 Master Limited Partnership and Related Entity
Holdings* | |
| |
| | | % of total net assets | |
1. Energy Transfer L.P. | | | 7.99 | % |
2. MPLX L.P. | | | 7.13 | |
3. Genesis Energy L.P. | | | 5.92 | |
4. EnLink Midstream LLC | | | 5.39 | |
5. Targa Resources Corp. | | | 5.24 | |
6. Antero Midstream Corp. | | | 5.19 | |
7. NuStar Energy L.P. | | | 5.15 | |
8. Archrock, Inc. | | | 5.11 | |
9. Plains All American Pipeline L.P. | | | 5.07 | |
10. Western Midstream Partners L.P. | | | 5.07 | |
The Fund’s holdings are subject to change, and there is no assurance that the Fund will continue to hold any particular security. *Excluding money market fund holdings, if any. Data presented here are as of November 30, 2023. | |
7 Invesco SteelPath MLP Select 40 Fund
Schedule of Investments
November 30, 2023
| | | | | | | | |
| | | Units | | | Value | |
Common Stocks And Other Equity Interests–0.12% | |
| Natural Gas Pipeline Transportation–0.12% | |
Kinetik Holdings, Inc. | | | 50,000 | | | $ | 1,818,000 | |
Pembina Pipeline Corp.(c) | | | 10,000 | | | | 334,300 | |
| | | | | | | | 2,152,300 | |
Total Common Stocks & Other Equity Interests
(Cost $2,051,984) | | | | 2,152,300 | |
|
Master Limited Partnerships And Related
Entities–105.62% | |
| Diversified–28.58% | |
Energy Transfer L.P. | | | 10,106,327 | | | | 140,376,885 | |
Enterprise Products Partners L.P. | | | 3,044,474 | | | | 81,531,014 | |
MPLX L.P. | | | 3,435,428 | | | | 125,255,705 | |
ONEOK, Inc. | | | 993,196 | | | | 68,381,545 | |
Williams Cos., Inc. | | | 2,358,555 | | | | 86,771,238 | |
| | | | | | | | 502,316,387 | |
| Gathering & Processing–28.92% | |
Antero Midstream Corp. | | | 6,850,954 | | | | 91,254,707 | |
Archrock, Inc.(a) | | | 6,200,839 | | | | 89,850,157 | |
EnLink Midstream LLC | | | 6,930,586 | | | | 94,741,111 | |
Hess Midstream L.P., Class A | | | 1,469,355 | | | | 47,812,812 | |
Summit Midstream Partners L.P.(b) | | | 171,723 | | | | 3,554,656 | |
Targa Resources Corp. | | | 1,018,828 | | | | 92,152,993 | |
Western Midstream Partners L.P. | | | 2,986,498 | | | | 89,057,381 | |
| | | | | | | | 508,423,817 | |
| Natural Gas Pipeline Transportation–3.26% | |
DT Midstream, Inc. | | | 196,819 | | | | 11,275,761 | |
Enbridge, Inc.(c) | | | 354,167 | | | | 12,349,803 | |
Equitrans Midstream Corp. | | | 3,415,838 | | | | 32,040,557 | |
Kinder Morgan, Inc. | | | 97,880 | | | | 1,719,752 | |
| | | | | | | | 57,385,873 | |
| Other Energy–22.96% | |
Arko Corp. | | | 1,829,604 | | | | 13,685,438 | |
Cheniere Energy Partners LP | | | 141,925 | | | | 8,762,450 | |
CrossAmerica Partners L.P.(a) | | | 1,971,946 | | | | 46,794,279 | |
CSI Compressco L.P.(a)(d) | | | 10,234,420 | | | | 18,933,677 | |
Global Partners L.P.(a) | | | 1,679,319 | | | | 61,177,591 | |
Kodiak Gas Services, Inc.(b) | | | 170,000 | | | | 2,997,100 | |
Suburban Propane Partners L.P. | | | 637,962 | | | | 10,941,048 | |
Sunoco L.P. | | | 1,478,500 | | | | 80,814,810 | |
| | | | | | | | |
| | | Units | | | Value | |
| Other Energy–(continued) | |
USA Compression Partners L.P. | | | 3,000,277 | | | $ | 71,436,595 | |
Westlake Chemical Partners L.P.(a) | | | 3,886,522 | | | | 88,029,723 | |
| | | | | | | | 403,572,711 | |
| Petroleum Pipeline Transportation–21.42% | |
Chevron Corp. | | | 137 | | | | 19,673 | |
Delek Logistics Partners L.P. | | | 140,163 | | | | 7,170,739 | |
Genesis Energy L.P.(a) | | | 8,291,977 | | | | 104,147,231 | |
Holly Energy Partners L.P. | | | 1,237,167 | | | | 25,300,065 | |
NGL Energy Partners L.P.(a)(b) | | | 7,150,096 | | | | 30,959,916 | |
NuStar Energy L.P.(a) | | | 4,753,382 | | | | 90,504,393 | |
Phillips 66 Partners L.P. | | | 491 | | | | 63,285 | |
Plains All American Pipeline L.P. | | | 5,609,426 | | | | 89,077,685 | |
Plains GP Holdings L.P., Class A | | | 1,811,755 | | | | 29,277,961 | |
| | | | | | | | 376,520,948 | |
| Production & Mining–0.45% | |
Alliance Resource Partners L.P. | | | 378,734 | | | | 7,945,839 | |
| Terminalling & Storage–0.03% | |
Martin Midstream Partners L.P. | | | 186,311 | | | | 480,683 | |
Total Master Limited Partnerships And Related Entities
(Cost $1,142,573,157) | | | | 1,856,646,258 | |
|
Preferred Master Limited Partnerships And Related Entities–0.82% | |
| Other Energy–0.82% | |
Global Partners L.P., 9.50% | | | 97,881 | | | | 2,510,648 | |
Global Partners L.P., 12.40%(a) | | | 464,884 | | | | 11,840,595 | |
| | | | | | | | 14,351,243 | |
Total Preferred Master Limited Partnerships And Related Entities
(Cost $14,069,125) | | | | 14,351,243 | |
| | |
| | | Shares | | | | |
Money Market Funds–0.83% | |
Fidelity Treasury Portfolio, Institutional Class, 5.17%
(Cost $14,566,991)(e) | | | 14,566,991 | | | | 14,566,991 | |
TOTAL INVESTMENTS IN SECURITIES–107.39%
(Cost $1,173,261,257) | | | | 1,887,716,792 | |
OTHER ASSETS LESS LIABILITIES–(7.39)% | | | | (129,950,787 | ) |
NET ASSETS–100% | | | $ | 1,757,766,005 | |
Notes to Schedule of Investments:
| (a) | Affiliated holding. Affiliated holdings are investments in entities which are under common ownership or control of Invesco Ltd. or are investments in entities in which the Fund owns 5% or more of the outstanding voting securities. The table below shows the Fund’s transactions in, and earnings from, its investments in affiliates for the fiscal year ended November 30, 2023. |
See accompanying Notes to Financial Statements which are an integral part of the financial statements.
8 Invesco SteelPath MLP Select 40 Fund
| | | | | | | | | | | | | | | | | | | | | | | | | | | | | | | | | | | | |
Investments in Other
Affiliates: | | Value
November 30,
2022 | | | Purchases
at Cost | | | Proceeds
from Sales | | | Change in
Unrealized
Appreciation
(Depreciation) | | | Realized
Gain (Loss) | | | Value
November 30,
2023 | | | Dividends and Distributions | |
| | Return of
Capital | | | Capital
Gains | | | Income | |
MLP Investments and Related Entities | | | | | | | | | | | | | | | | | | | | | | | | | | | | | | | | | | | | |
Archrock, Inc.i,ii | | $ | 66,017,976 | | | $ | 7,796,310 | | | $ | (28,311,580 | ) | | $ | 40,697,969 | | | $ | 8,305,360 | | | $ | 89,850,157 | | | $ | (4,655,878 | ) | | $ | — | | | $ | — | |
CrossAmerica Partners L.P. | | | 40,313,347 | | | | — | | | | (816,821 | ) | | | 11,055,136 | | | | 428,553 | | | | 46,794,279 | | | | (4,185,936 | ) | | | — | | | | — | |
CSI Compressco L.P. | | | 14,004,092 | | | | — | | | | (595,268 | ) | | | 11,979,901 | | | | (6,232,825 | ) | | | 18,933,677 | | | | (222,223 | ) | | | 191,588 | | | | — | |
Genesis Energy L.P. | | | 78,682,721 | | | | 14,338,266 | | | | (6,506,897 | ) | | | 30,135,327 | | | | (9,244,027 | ) | | | 104,147,231 | | | | (3,258,159 | ) | | | 1,454,462 | | | | — | |
Global Partners L.P.ii | | | 60,494,002 | | | | — | | | | (5,147,687 | ) | | | 8,442,134 | | | | 3,671,772 | | | | 61,177,591 | | | | (6,282,630 | ) | | | — | | | | — | |
NGL Energy Partners L.P. | | | 8,546,817 | | | | — | | | | (605,437 | ) | | | 25,110,264 | | | | (2,091,728 | ) | | | 30,959,916 | | | | — | | | | — | | | | — | |
Nustar Energy L.P.ii | | | 91,443,215 | | | | — | | | | (14,083,570 | ) | | | 33,802,357 | | | | (14,120,289 | ) | | | 90,504,393 | | | | (6,537,320 | ) | | | 1,497,806 | | | | — | |
Westlake Chemical Partners | | | 94,377,202 | | | | — | | | | (4,308,430 | ) | | | 2,772,074 | | | | 1,575,399 | | | | 88,029,723 | | | | (6,386,522 | ) | | | 1,121,552 | | | | — | |
Preferred MLP Investments and Related Entities | | | | | | | | | | | | | | | | | | | | | | | | | | | | | | | | | | | | |
Global Partners L.P.—Preferred | | | 12,700,270 | | | | — | | | | (262,319 | ) | | | (607,925 | ) | | | 10,569 | | | | 11,840,595 | | | | — | | | | — | | | | 1,222,429 | |
| | $ | 466,579,642 | | | $ | 22,134,576 | | | $ | (60,638,009 | ) | | $ | 163,387,237 | | | $ | (17,697,216 | ) | | $ | 542,237,562 | | | $ | (31,528,668 | ) | | $ | 4,265,408 | | | $ | 1,222,429 | |
| i. | As of November 30, 2022, the security was not considered as an affiliate of the Fund. |
| ii. | As of November 30, 2023, the security was not considered as an affiliate of the Fund. |
| (b) | Non-income producing. |
| (c) | Foreign security denominated in U.S. dollars. |
| (d) | Security purchased or received in a transaction exempt from registration under the Securities Act of 1933, as amended (the “1933 Act”). The security may be resold pursuant to an exemption from registration under the 1933 Act, typically to qualified institutional buyers. The value of this security at November 30, 2023 represented 1% of the Fund’s Net Assets. |
| (e) | The rate shown is the 7-day SEC standardized yield as of November 30, 2023. |
See accompanying Notes to Financial Statements which are an integral part of the financial statements.
9 Invesco SteelPath MLP Select 40 Fund
Statement of Assets and Liabilities
November 30, 2023
| | | | |
Assets: | | | | |
Investments in unaffiliated securities, at value (cost $837,528,519) | | $ | 1,587,011,371 | |
Investments in affiliates (cost $335,732,738) | | | 300,705,421 | |
Cash | | | 286,471 | |
Receivable For: | | | | |
Fund shares sold | | | 766,889 | |
Dividends | | | 324,513 | |
Investment for trustee deferred compensation and retirement plans | | | 83,592 | |
Prepaid state income tax | | | 120,448 | |
AMT credit carryforward | | | 26,932 | |
Other assets | | | 131,734 | |
Total assets | | | 1,889,457,371 | |
| |
| | | | |
Liabilities: | | | | |
Payables for: | | | | |
Fund shares reacquired | | | 2,748,182 | |
Accrued fees to affiliates | | | 1,483,121 | |
Accrued interest expense | | | 21,136 | |
Accrued trustees’ and officers’ fees and benefits | | | 7,262 | |
Accrued other operating expenses | | | 403,281 | |
Deferred tax liability, net | | | 126,944,792 | |
Trustee deferred compensation and retirement plans | | | 83,592 | |
Total liabilities | | | 131,691,366 | |
Net assets applicable to shares outstanding | | $ | 1,757,766,005 | |
| |
| | | | |
Net Assets consist of: | | | | |
Shares of beneficial | | $ | 1,572,172,464 | |
Distributable earnings, net of taxes | | | 185,593,541 | |
| | | $ | 1,757,766,005 | |
| | | | |
Net Assets: | | | | |
Class A | | $ | 438,851,604 | |
Class C | | $ | 167,649,846 | |
Class R | | $ | 19,775,844 | |
Class Y | | $ | 850,541,977 | |
Class R5 | | $ | 9,857 | |
Class R6 | | $ | 280,936,877 | |
| |
| | | | |
Shares outstanding, no par value, with an unlimited number of shares authorized: | |
Class A | | | 60,353,804 | |
Class C | | | 26,776,532 | |
Class R | | | 2,754,064 | |
Class Y | | | 109,237,829 | |
Class R5 | | | 1,332 | |
Class R6 | | | 35,673,479 | |
Class A: | | | | |
Net asset value per share | | $ | 7.27 | |
Maximum offering price per share
(net asset value $7.27 ÷ 94.50%) | | $ | 7.69 | |
Class C: | | | | |
Net asset value and offering price per share | | $ | 6.26 | |
Class R: | | | | |
Net asset value and offering price per share | | $ | 7.18 | |
Class Y: | | | | |
Net asset value and offering price per share | | $ | 7.79 | |
Class R5: | | | | |
Net asset value and offering price per share | | $ | 7.40 | |
Class R6: | | | | |
Net asset value and offering price per share | | $ | 7.88 | |
See accompanying Notes to Financial Statements which are an integral part of the financial statements.
10 Invesco SteelPath MLP Select 40 Fund
Statement of Operations
For the year endeded November 30, 2023
| | | | |
Investment Income: | | | | |
Distributions and dividends ($1,222,429 income from affiliates) | | $ | 134,533,733 | |
Less: return of capital on distributions and dividends ($31,528,668 from affiliates) | | | (108,082,607 | ) |
Less: return of capital on distributions and dividends in excess of cost basis ($4,265,408 from affiliates) | | | (10,637,013 | ) |
Total investment income | | | 15,814,113 | |
| |
| | | | |
Expenses: | | | | |
Advisory fees | | | 11,888,233 | |
Administrative services fees | | | 556,467 | |
Custodian fees | | | 162,318 | |
Distribution Fees: | | | | |
Class A | | | 964,282 | |
Class C | | | 1,724,673 | |
Class R | | | 89,422 | |
Transfer agent fees — A, C, R and Y | | | 1,800,487 | |
Transfer agent fees — R5 | | | 3 | |
Transfer agent fees — R6 | | | 76,435 | |
Interest, facilities and maintenance fees | | | 371,495 | |
State income tax expense | | | 358,292 | |
Trustees’ and officers’ fees and benefits | | | 32,151 | |
Registration and filing fees | | | 115,128 | |
Reports to shareholders | | | 123,531 | |
Professional services fees | | | 166,873 | |
Other | | | 28,620 | |
Total expenses, before waivers and deferred taxes | | | 18,458,410 | |
Less: Fees waived, expenses reimbursed and expense offset arrangement(s) | | | (660,410 | ) |
Net expenses, before deferred taxes | | | 17,798,000 | |
Net investment income (loss), before taxes | | | (1,983,887 | ) |
Net deferred tax benefit | | | 2,275,732 | |
Net investment income, net of deferred taxes | | | 291,845 | |
| |
| | | | |
| |
Realized and unrealized gain (loss) from: | | | | |
Net realized gain from: | | | | |
Unaffiliated investment securities (net return of capital in excess of cost basis of $6,371,605)
(includes net losses from securities sold to affiliates of ($2,758,865)) | | | 135,987,522 | |
Affiliated investment securities (net return of capital in excess of cost basis of $4,265,408) | | | (17,697,216 | ) |
Net deferred tax (expense) benefit | | | (26,719,124 | ) |
Net realized gain, net of deferred taxes | | | 91,571,182 | |
Change in net unrealized appreciation (depreciation) of: | | | | |
Unaffiliated investment securities | | | 133,777,141 | |
Affiliated investment securities | | | 163,387,237 | |
Net deferred tax (expense) benefit | | | (67,993,731 | ) |
Net change in unrealized appreciation,net of deferred taxes | | | 229,170,647 | |
Net realized and unrealized gain, net of deferred taxes | | | 320,741,829 | |
Net increase in net assets resulting from operations | | $ | 321,033,674 | |
See accompanying Notes to Financial Statements which are an integral part of the financial statements.
11 Invesco SteelPath MLP Select 40 Fund
Statement of Changes in Net Assets
For the year ended November 30, 2023 and 2022
| | | | | | | | |
| | | 2023 | | | 2022 | |
Operations: | | | | | | | | |
Net investment income (loss), net of deferred taxes | | $ | 291,845 | | | $ | 933,780 | |
Net realized gain, net of deferred taxes | | | 91,571,182 | | | | 135,370,861 | |
Change in net unrealized appreciation, net of deferred taxes | | | 229,170,647 | | | | 318,966,856 | |
Net increase in net assets resulting from operations | | | 321,033,674 | | | | 455,271,497 | |
| | |
| | | | | | | | |
Distribution to shareholders from distributable earnings: | | | | | | | | |
Class A | | | (27,691,291 | ) | | | (10,346,409 | ) |
Class C | | | (14,003,808 | ) | | | (6,676,290 | ) |
Class R | | | (1,303,274 | ) | | | (294,917 | ) |
Class Y | | | (57,587,076 | ) | | | (28,115,820 | ) |
Class R5 | | | (629 | ) | | | (249 | ) |
Class R6 | | | (16,929,090 | ) | | | (6,993,958 | ) |
Total distributions to shareholders from distributable earnings: | | | (117,515,168 | ) | | | (52,427,643 | ) |
| | |
| | | | | | | | |
Return of Capital: | | | | | | | | |
Class A | | | - | | | | (15,305,634 | ) |
Class C | | | - | | | | (9,876,358 | ) |
Class R | | | - | | | | (436,276 | ) |
Class Y | | | - | | | | (41,592,248 | ) |
Class R5 | | | - | | | | (369 | ) |
Class R6 | | | - | | | | (10,346,291 | ) |
Total return of capital | | | - | | | | (77,557,176 | ) |
Total distributions | | | - | | | | (129,984,819 | ) |
| | |
| | | | | | | | |
Share transactions–net: | | | | | | | | |
Class A | | | 21,601,996 | | | | 21,465,394 | |
Class C | | | (39,020,008 | ) | | | (28,537,002 | ) |
Class R | | | 1,660,434 | | | | 13,387,111 | |
Class Y | | | (205,393,655 | ) | | | (156,023,014 | ) |
Class R6 | | | (2,892,796 | ) | | | (36,249,147 | ) |
Net increase (decrease) in net assets resulting from share transactions | | | (224,044,029 | ) | | | (185,956,658 | ) |
Net increase (decrease) in net assets | | | (20,525,523 | ) | | | 139,330,020 | |
| | |
| | | | | | | | |
Net assets: | | | | | | | | |
Beginning of year | | | 1,778,291,528 | | | | 1,638,961,508 | |
End of year | | $ | 1,757,766,005 | | | $ | 1,778,291,528 | |
See accompanying Notes to Financial Statements which are an integral part of the financial statements.
12 Invesco SteelPath MLP Select 40 Fund
Financial Highlights
| | | | | | | | | | | | | | | | | | | | |
| | | Years Ended November 30, | |
| Class A | | 2023 | | | 2022 | | | 2021 | | | 2020 | | | 2019 | |
Per share operating data | | | | | | | | | | | | | | | | | | | | |
Net asset value, beginning of period | | $ | 6.47 | | | $ | 5.37 | | | $ | 4.18 | | | $ | 6.14 | | | $ | 7.36 | |
Net investment income (loss)(a) | | | (0.00 | ) | | | (0.00 | ) | | | (0.01 | ) | | | (0.03 | ) | | | (0.03 | ) |
Return of capital(a) | | | 0.32 | | | | 0.31 | | | | 0.28 | | | | 0.35 | | | | 0.43 | |
Net realized and unrealized gains (losses) | | | 0.95 | | | | 1.25 | | | | 1.38 | | | | (1.69 | ) | | | (0.91 | ) |
Total from investment operations | | | 1.27 | | | | 1.56 | | | | 1.65 | | | | (1.37 | ) | | | (0.51 | ) |
Less: | | | | | | | | | | | | | | | | | | | | |
Return of capital | |
| —
|
| | | (0.28 | ) | | | (0.46 | ) | | | (0.59 | ) | | | (0.59 | ) |
Dividends from net investment income | | | (0.47 | ) | | | (0.18 | ) | | | — | | | | — | | | | (0.12 | ) |
Total distributions | | | (0.47 | ) | | | (0.46 | ) | | | (0.46 | ) | | | (0.59 | ) | | | (0.71 | ) |
Net asset value, end of period | | $ | 7.27 | | | $ | 6.47 | | | $ | 5.37 | | | $ | 4.18 | | | $ | 6.14 | |
Total return(b) | | | 20.66 | % | | | 29.87 | % | | | 40.08 | % | | | (21.63 | )% | | | (7.89 | )% |
Net assets, end of period (000’s omitted) | | $ | 438,852 | | | $ | 369,159 | | | $ | 287,740 | | | $ | 205,529 | | | $ | 304,235 | |
Portfolio turnover rate | | | 13 | % | | | 11 | % | | | 18 | % | | | 30 | % | | | 23 | % |
| | | | | |
Ratios/supplemental data based on average net assets: | | | | | | | | | | | | | | | | | | | | |
Ratio of expenses: | | | | | | | | | | | | | | | | | | | | |
Without fee waivers and/or expense reimbursements, before taxes | | | 1.18 | % | | | 1.20 | % | | | 1.25 | % | | | 1.26 | % | | | 1.20 | % |
Expense (waivers) | | | (0.04 | )% | | | (0.05 | )% | | | (0.07 | )% | | | (0.07 | )% | | | (0.06 | )% |
With fee waiver and/or expense reimbursement, before taxes(c) | | | 1.14 | % | | | 1.15 | % | | | 1.18 | % | | | 1.19 | % | | | 1 .14 | % |
Deferred tax expense (benefit)(d) | | | 5.44 | % | | | 1.96 | % | | | — | % | | | — | % | | | — | % |
With fee waivers and/or expense reimbursements, after taxes | | | 6.58 | % | | | 3.11 | % | | | 1.18 | % | | | 1.19 | % | | | 1.14 | % |
| | | | | |
Ratio of investment income (loss): | | | | | | | | | | | | | | | | | | | | |
Ratio of net investment income (loss) before taxes | | | (0.25 | )% | | | (0.71 | )% | | | (0.21 | )% | | | (0.65 | )% | | | (0.45 | )% |
Net of expense (waivers) and before deferred tax benefit (expense) | | | (0.21 | )% | | | (0.66 | )% | | | (0.15 | )% | | | (0.58 | )% | | | (0.39 | )% |
Deferred tax benefit (expense)(e) | | | 0.13 | % | | | 0.62 | % | | | — | % | | | — | % | | | — | % |
Ratio of net investment income (loss), after taxes | | | (0.08 | )% | | | (0.04 | )% | | | (0.15 | )% | | | (0.58 | )% | | | (0.39 | )% |
| (a) | Per share net investment income (loss) is calculated based on average shares outstanding during the period net of deferred tax expense (benefit). Per share return of capital is calculated based on average shares during the period net of deferred tax expense (benefit) estimated at the combined Federal and State statutory income tax rate. |
| (b) | Includes adjustments in accordance with accounting principles generally accepted in the United States of America and as such, the net asset value for financial reporting purposes and returns based upon those net asset values may differ from the net asset value and returns for shareholder transactions. Does not include sales charges and is not annualized for periods less than one year, if applicable. |
| (c) | Includes borrowing and franchise tax expense. Without borrowing and franchise tax expense, the net expense ratio would be 1.10%, 1.10%, 1.10%, 1.10% and 1.10%, for the years ended November 30, 2023, 2022, 2021, 2020 and 2019, respectively. |
| (d) | Deferred tax expense (benefit) estimate for the ratio calculation is derived from the net investment income (loss), and realized and unrealized gains (losses). |
| (e) | Deferred tax benefit (expense) for the ratio calculation, when applicable, is derived from net investment income (loss) only. |
See accompanying Notes to Financial Statements which are an integral part of the financial statements.
13 Invesco SteelPath MLP Select 40 Fund
Financial Highlights—(continued)
| | | | | | | | | | | | | | | | | | | | |
| | | Years Ended November 30, | |
| Class C | | 2023 | | | 2022 | | | 2021 | | | 2020 | | | 2019 | |
Per share operating data | | | | | | | | | | | | | | | | | | | | |
Net asset value, beginning of period | | $ | 5.67 | | | $ | 4.79 | | | $ | 3.80 | | | $ | 5.69 | | | $ | 6.92 | |
Net investment income (loss)(a) | | | (0.05 | ) | | | (0.04 | ) | | | (0.04 | ) | | | (0.05 | ) | | | (0.08 | ) |
Return of capital(a) | | | 0.28 | | | | 0.27 | | | | 0.25 | | | | 0.32 | | | | 0.40 | |
Net realized and unrealized gains (losses) | | | 0.83 | | | | 1.11 | | | | 1.24 | | | | (1.57 | ) | | | (0.84 | ) |
Total from investment operations | | | 1.06 | | | | 1.34 | | | | 1.45 | | | | (1.30 | ) | | | (0.52 | ) |
Less: | | | | | | | | | | | | | | | | | | | | |
Return of capital | | | — | | | | (0.28 | ) | | | (0.46 | ) | | | (0.59 | ) | | | (0.59 | ) |
Dividends from net investment income | | | (0.47 | ) | | | (0.18 | ) | | | — | | | | — | | | | (0.12 | ) |
Total distributions | | | (0.47 | ) | | | (0.46 | ) | | | (0.46 | ) | | | (0.59 | ) | | | (0.71 | ) |
Net asset value, end of period | | $ | 6.26 | | | $ | 5.67 | | | $ | 4.79 | | | $ | 3.80 | | | $ | 5.69 | |
Total return(b) | | | 19.85 | % | | | 28.85 | % | | | 38.77 | % | | | (22.13 | )% | | | (8.56 | )% |
Net assets, end of period (000’s omitted) | | $ | 167,650 | | | $ | 190,471 | | | $ | 187,341 | | | $ | 186,444 | | | $ | 324,931 | |
Portfolio turnover rate | | | 13 | % | | | 11 | % | | | 18 | % | | | 30 | % | | | 23 | % |
| | | | | |
Ratios/supplemental data based on average net assets: | | | | | | | | | | | | | | | | | | | | |
Ratio of expenses: | | | | | | | | | | | | | | | | | | | | |
Without fee waivers and/or expense reimbursements, before taxes | | | 1.93 | % | | | 1.95 | % | | | 2.00 | % | | | 2.01 | % | | | 1.96 | % |
Expense (waivers) | | | (0.04 | )% | | | (0.05 | )% | | | (0.07 | )% | | | (0.07 | )% | | | (0.06 | )% |
With fee waiver and/or expense reimbursement, before taxes(c) | | | 1.89 | % | | | 1.90 | % | | | 1.93 | % | | | 1.94 | % | | | 1.90 | % |
Deferred tax expense (benefit)(d) | | | 5.44 | % | | | 1.96 | % | | | — | % | | | — | % | | | — | % |
With fee waivers and/or expense reimbursements, after taxes | | | 7.33 | % | | | 3.86 | % | | | 1.93 | % | | | 1.94 | % | | | 1.90 | % |
| | | | | |
Ratio of investment income (loss): | | | | | | | | | | | | | | | | | | | | |
Ratio of net investment income (loss) before taxes | | | (1.00 | )% | | | (1.46 | )% | | | (0.96 | )% | | | (1.40 | )% | | | (1.21 | )% |
Net of expense (waivers) and before deferred tax benefit (expense) | | | (0.96 | )% | | | (1.41 | )% | | | (0.90 | )% | | | (1.33 | )% | | | (1.15 | )% |
Deferred tax benefit (expense)(e) | | | 0.13 | % | | | 0.62 | % | | | — | % | | | — | % | | | — | % |
Ratio of net investment income (loss), after taxes | | | (0.83 | )% | | | (0.79 | )% | | | (0.90 | )% | | | (1.33 | )% | | | (1.15 | )% |
| (a) | Per share net investment income (loss) is calculated based on average shares outstanding during the period net of deferred tax expense (benefit). Per share return of capital is calculated based on average shares during the period net of deferred tax expense (benefit) estimated at the combined Federal and State statutory income tax rate. |
| (b) | Includes adjustments in accordance with accounting principles generally accepted in the United States of America and as such, the net asset value for financial reporting purposes and returns based upon those net asset values may differ from the net asset value and returns for shareholder transactions. Does not include sales charges and is not annualized for periods less than one year, if applicable. |
| (c) | Includes borrowing and franchise tax expense. Without borrowing and franchise tax expense, the net expense ratio would be 1.85%, 1.85%, 1.85%, 1.85% and 1.86%, for the years ended November 30, 2023, 2022, 2021, 2020 and 2019, respectively. |
| (d) | Deferred tax expense (benefit) estimate for the ratio calculation is derived from the net investment income (loss), and realized and unrealized gains (losses). |
| (e) | Deferred tax benefit (expense) for the ratio calculation, when applicable, is derived from net investment income (loss) only. |
See accompanying Notes to Financial Statements which are an integral part of the financial statements.
14 Invesco SteelPath MLP Select 40 Fund
Financial Highlights—(continued)
| | | | | | | | | | | | | | | | | | | | |
| | | Years Ended Novemver 30, | | | Period ended
November 30,
2019(a) | |
| Class R | | 2023 | | | 2022 | | | 2021 | | | 2020 | |
Per share operating data | | | | | | | | | | | | | | | | | | | | |
Net asset value, beginning of period | | $ | 6.41 | | | $ | 5.34 | | | $ | 4.17 | | | $ | 6.13 | | | $ | 7.56 | |
Net investment income (loss)(b) | | | (0.02 | ) | | | (0.02 | ) | | | (0.02 | ) | | | (0.04 | ) | | | (0.02 | ) |
Return of capital(b) | | | 0.32 | | | | 0.31 | | | | 0.29 | | | | 0.35 | | | | 0.20 | |
Net realized and unrealized gains (losses) | | | 0.94 | | | | 1.24 | | | | 1.36 | | | | (1.68 | ) | | | (1.20 | ) |
Total from investment operations | | | 1.24 | | | | 1.53 | | | | 1.63 | | | | (1.37 | ) | | | (1.02 | ) |
Less: | | | | | | | | | | | | | | | | | | | | |
Return of capital | | | — | | | | (0.28 | ) | | | (0.46 | ) | | | (0.59 | ) | | | (0.34 | ) |
Dividends from net investment income | | | (0.47 | ) | | | (0.18 | ) | | | — | | | | — | | | | (0.07 | ) |
Total distributions | | | (0.47 | ) | | | (0.46 | ) | | | (0.46 | ) | | | (0.59 | ) | | | (0.41 | ) |
Net asset value, end of period | | $ | 7.18 | | | $ | 6.41 | | | $ | 5.34 | | | $ | 4.17 | | | $ | 6.13 | |
Total return(c) | | | 20.38 | % | | | 29.47 | % | | | 39.69 | % | | | (21.66 | )% | | | (13.94 | )% |
Net assets, end of period (000’s omitted) | | $ | 19,776 | | | $ | 16,100 | | | $ | 1,681 | | | $ | 248 | | | $ | 419 | |
Portfolio turnover rate | | | 13 | % | | | 11 | % | | | 18 | % | | | 30 | % | | | 23 | % |
| | | | | |
Ratios/supplemental data based on average net assets: | | | | | | | | | | | | | | | | | | | | |
Ratio of expenses: | | | | | | | | | | | | | | | | | | | | |
Without fee waivers and/or expense reimbursements, before taxes | | | 1.43 | % | | | 1.45 | % | | | 1.50 | % | | | 1.51 | % | | | 1.46 | %(d) |
Expense (waivers) | | | (0.04 | )% | | | (0.05 | )% | | | (0.07 | )% | | | (0.07 | )% | | | (0.06 | )%(d) |
With fee waiver and/or expense reimbursement, before taxes(e) | | | 1.39 | % | | | 1.40 | % | | | 1.43 | % | | | 1.44 | % | | | 1.40 | %(d) |
Deferred tax expense (benefit)(f) | | | 5.44 | % | | | 1.96 | % | | | — | % | | | — | % | | | — | %(d) |
With fee waivers and/or expense reimbursements, after taxes | | | 6.83 | % | | | 3.36 | % | | | 1.43 | % | | | 1.44 | % | | | 1.40 | %(d) |
| | | | | |
Ratio of investment income (loss): | | | | | | | | | | | | | | | | | | | | |
Ratio of net investment income (loss) before taxes | | | (0.50 | )% | | | (0.96 | )% | | | (0.46 | )% | | | (0.90 | )% | | | (0.71 | )%(d) |
Net of expense (waivers) and before deferred tax benefit (expense) | | | (0.46 | )% | | | (0.91 | )% | | | (0.40 | )% | | | (0.83 | )% | | | (0.65 | )%(d) |
Deferred tax benefit (expense)(g) | | | 0.13 | % | | | 0.62 | % | | | — | % | | | — | % | | | — | %(d) |
Ratio of net investment income (loss), after taxes | | | (0.33 | )% | | | (0.29 | )% | | | (0.40 | )% | | | (0.83 | )% | | | (0.65 | )%(d) |
| (a) | Commencement date after the close of business on May 24, 2019. |
| (b) | Per share net investment income (loss) is calculated based on average shares outstanding during the period net of deferred tax expense (benefit). Per share return of capital is calculated based on average shares during the period net of deferred tax expense (benefit) estimated at the combined Federal and State statutory income tax rate. |
| (c) | Includes adjustments in accordance with accounting principles generally accepted in the United States of America and as such, the net asset value for financial reporting purposes and returns based upon those net asset values may differ from the net asset value and returns for shareholder transactions. Does not include sales charges and is not annualized for periods less than one year, if applicable. |
| (e) | Includes borrowing and franchise tax expense. Without borrowing and franchise tax expense, the net expense ratio would be 1.35%, 1.35%, 1.35%, 1.35% and 1.36%, for the years ended November 30, 2023, 2022, 2021 and 2020, and the period ended November 30, 2019, respectively. |
| (f) | Deferred tax expense (benefit) estimate for the ratio calculation is derived from the net investment income (loss), and realized and unrealized gains (losses). |
| (g) | Deferred tax benefit (expense) for the ratio calculation, when applicable, is derived from net investment income (loss) only. |
See accompanying Notes to Financial Statements which are an integral part of the financial statements.
15 Invesco SteelPath MLP Select 40 Fund
Financial Highlights—(continued)
| | | | | | | | | | | | | | | | | | | | |
| | | Years Ended November 30, | |
| Class Y | | 2023 | | | 2022 | | | 2021 | | | 2020 | | | 2019 | |
Per share operating data | | | | | | | | | | | | | | | | | | | | |
Net asset value, beginning of period | | $ | 6.87 | | | $ | 5.68 | | | $ | 4.39 | | | $ | 6.38 | | | $ | 7.61 | |
Net investment income (loss)(a) | | | 0.01 | | | | 0.01 | | | | 0.01 | | | | (0.02 | ) | | | (0.01 | ) |
Return of capital(a) | | | 0.34 | | | | 0.32 | | | | 0.30 | | | | 0.37 | | | | 0.45 | |
Net realized and unrealized gains (losses) | | | 1.04 | | | | 1.32 | | | | 1.44 | | | | (1.75 | ) | | | (0.96 | ) |
Total from investment operations | | | 1.39 | | | | 1.65 | | | | 1.75 | | | | (1.40 | ) | | | (0.52 | ) |
Less: | | | | | | | | | | | | | | | | | | | | |
Return of capital | | | — | | | | (0.28 | ) | | | (0.46 | ) | | | (0.59 | ) | | | (0.59 | ) |
Dividends from net investment income | | | (0.47 | ) | | | (0.18 | ) | | | — | | | | — | | | | (0.12 | ) |
Total distributions | | | (0.47 | ) | | | (0.46 | ) | | | (0.46 | ) | | | (0.59 | ) | | | (0.71 | ) |
Net asset value, end of period | | $ | 7.79 | | | $ | 6.87 | | | $ | 5.68 | | | $ | 4.39 | | | $ | 6.38 | |
Total return(b) | | | 21.22 | % | | | 29.83 | % | | | 40.47 | % | | | (21.26 | )% | | | (7.76 | )% |
Net assets, end of period (000’s omitted) | | $ | 850,542 | | | $ | 952,242 | | | $ | 923,220 | | | $ | 936,181 | | | $ | 1,540,550 | |
Portfolio turnover rate | | | 13 | % | | | 11 | % | | | 18 | % | | | 30 | % | | | 23 | % |
| | | | | |
Ratios/supplemental data based on average net assets: | | | | | | | | | | | | | | | | | | | | |
Ratio of expenses: | | | | | | | | | | | | | | | | | | | | |
Without fee waivers and/or expense reimbursements, before taxes | | | 0.93 | % | | | 0.95 | % | | | 1.00 | % | | | 1.01 | % | | | 0.95 | % |
Expense (waivers) | | | (0.04 | )% | | | (0.05 | )% | | | (0.07 | )% | | | (0.07 | )% | | | (0.06 | )% |
With fee waiver and/or expense reimbursement, before taxes(c) | | | 0.89 | % | | | 0.90 | % | | | 0.93 | % | | | 0.94 | % | | | 0.89 | % |
Deferred tax expense (benefit)(d) | | | 5.44 | % | | | 1.96 | % | | | — | % | | | — | % | | | — | % |
With fee waivers and/or expense reimbursements, after taxes | | | 6.33 | % | | | 2.86 | % | | | 0.93 | % | | | 0.94 | % | | | 0.89 | % |
| | | | | |
Ratio of investment income (loss): | | | | | | | | | | | | | | | | | | | | |
Ratio of net investment income (loss) before taxes | | | 0.00 | % | | | (0.46 | )% | | | 0.04 | % | | | (0.40 | )% | | | (0.20 | )% |
Net of expense (waivers) and before deferred tax benefit (expense) | | | 0.04 | % | | | (0.41 | )% | | | 0.10 | % | | | (0.33 | )% | | | (0.14 | )% |
Deferred tax benefit (expense)(e) | | | 0.13 | % | | | 0.62 | % | | | — | % | | | — | % | | | — | % |
Ratio of net investment income (loss), after taxes | | | 0.17 | % | | | 0.21 | % | | | 0.10 | % | | | (0.33 | )% | | | (0.14 | )% |
| (a) | Per share net investment income (loss) is calculated based on average shares outstanding during the period net of deferred tax expense (benefit). Per share return of capital is calculated based on average shares during the period net of deferred tax expense (benefit) estimated at the combined Federal and State statutory income tax rate. |
| (b) | Includes adjustments in accordance with accounting principles generally accepted in the United States of America and as such, the net asset value for financial reporting purposes and returns based upon those net asset values may differ from the net asset value and returns for shareholder transactions. Does not include sales charges and is not annualized for periods less than one year, if applicable. |
| (c) | Includes borrowing and franchise tax expense. Without borrowing and franchise tax expense, the net expense ratio would be 0.85%, 0.85%, 0.85%, 0.85% and 0.85%, for the years ended November 30, 2023, 2022, 2021, 2020 and 2019, respectively. |
| (d) | Deferred tax expense (benefit) estimate for the ratio calculation is derived from the net investment income (loss), and realized and unrealized gains (losses). |
| (e) | Deferred tax benefit (expense) for the ratio calculation, when applicable, is derived from net investment income (loss) only. |
See accompanying Notes to Financial Statements which are an integral part of the financial statements.
16 Invesco SteelPath MLP Select 40 Fund
Financial Highlights—(continued)
| | | | | | | | | | | | | | | | | | | | |
| | | Years Ended Novemver 30, | | | Period ended
November 30,
2019(a) | |
| Class R5 | | 2023 | | | 2022 | | | 2021 | | | 2020 | |
Per share operating data | | | | | | | | | | | | | | | | | | | | |
Net asset value, beginning of period | | $ | 6.56 | | | $ | 5.43 | | | $ | 4.21 | | | $ | 6.15 | | | $ | 7.56 | |
Net investment income (loss)(b) | | | 0.02 | | | | 0.02 | | | | 0.01 | | | | (0.01 | ) | | | (0.00 | )(c) |
Return of capital(b) | | | 0.33 | | | | 0.31 | | | | 0.29 | | | | 0.35 | | | | 0.22 | |
Net realized and unrealized gains (losses) | | | 0.96 | | | | 1.26 | | | | 1.38 | | | | (1.69 | ) | | | (1.22 | ) |
Total from investment operations | | | 1.31 | | | | 1.59 | | | | 1.68 | | | | (1.35 | ) | | | (1.00 | ) |
Less: | | | | | | | | | | | | | | | | | | | | |
Return of capital | | | — | | | | (0.28 | ) | | | (0.46 | ) | | | (0.59 | ) | | | (0.34 | ) |
Dividends from net investment income | | | (0.47 | ) | | | (0.18 | ) | | | — | | | | — | | | | (0.07 | ) |
Total distributions | | | (0.47 | ) | | | (0.46 | ) | | | (0.46 | ) | | | (0.59 | ) | | | (0.41 | ) |
Net asset value, end of period | | $ | 7.40 | | | $ | 6.56 | | | $ | 5.43 | | | $ | 4.21 | | | $ | 6.15 | |
Total return(d) | | | 21.00 | % | | | 30.11 | % | | | 40.53 | % | | | (21.24 | )% | | | (13.67 | )% |
Net assets, end of period (000’s omitted) | | $ | 10 | | | $ | 9 | | | $ | 7 | | | $ | 6 | | | $ | 8 | |
Portfolio turnover rate | | | 13 | % | | | 11 | % | | | 18 | % | | | 30 | % | | | 23 | % |
| | | | | |
Ratios/supplemental data based on average net assets: | | | | | | | | | | | | | | | | | | | | |
Ratio of expenses: | | | | | | | | | | | | | | | | | | | | |
Without fee waivers and/or expense reimbursements, before taxes(e) | | | 0.84 | % | | | 0.84 | % | | | 0.86 | % | | | 0.87 | % | | | 0.84 | %(f) |
Deferred tax expense (benefit)(g) | | | 5.44 | % | | | 1.96 | % | | | — | % | | | — | % | | | — | %(f) |
With fee waivers and/or expense reimbursements, after taxes | | | 6.28 | % | | | 2.80 | % | | | 0.86 | % | | | 0.87 | % | | | 0.84 | %(f) |
| | | | | |
Ratio of investment income (loss): | | | | | | | | | | | | | | | | | | | | |
Ratio of net investment income (loss) before taxes | | | 0.09 | % | | | (0.36 | )% | | | 0.17 | % | | | (0.26 | )% | | | (0.09 | )%(f) |
Deferred tax benefit (expense)(h) | | | 0.13 | % | | | 0.62 | % | | | — | % | | | — | % | | | — | %(f) |
Ratio of net investment income (loss), after taxes | | | 0.22 | % | | | 0.26 | % | | | 0.17 | % | | | (0.26 | )% | | | (0.09 | )%(f) |
| (a) | Commencement date after the close of business on May 24, 2019. |
| (b) | Per share net investment income (loss) is calculated based on average shares outstanding during the period net of deferred tax expense (benefit). Per share return of capital is calculated based on average shares during the period net of deferred tax expense (benefit) estimated at the combined Federal and State statutory income tax rate. |
| (c) | Rounds to less than (0.005). |
| (d) | Includes adjustments in accordance with accounting principles generally accepted in the United States of America and as such, the net asset value for financial reporting purposes and returns based upon those net asset values may differ from the net asset value and returns for shareholder transactions. Does not include sales charges and is not annualized for periods less than one year, if applicable. |
| (e) | Includes borrowing and franchise tax expense. Without borrowing and franchise tax expense, the net expense ratio would be 0.80%, 0.79%, 0.78%, 0.78%, and 0.80%, for the years ended, November 30, 2023, 2022, 2021 and 2020, and the period ended November 30, 2019, respectively. |
| (g) | Deferred tax expense (benefit) estimate for the ratio calculation is derived from the net investment income (loss), and realized and unrealized gains (losses). |
| (h) | Deferred tax benefit (expense) for the ratio calculation, when applicable, is derived from net investment income (loss) only. |
See accompanying Notes to Financial Statements which are an integral part of the financial statements.
17 Invesco SteelPath MLP Select 40 Fund
Financial Highlights—(continued)
| | | | | | | | | | | | | | | | | | | | |
| | | Years Ended November 30, | |
| Class R6 | | 2023 | | | 2022 | | | 2021 | | | 2020 | | | 2019 | |
Per share operating data | | | | | | | | | | | | | | | | | | | | |
Net asset value, beginning of period | | $ | 6.94 | | | $ | 5.73 | | | $ | 4.42 | | | $ | 6.42 | | | $ | 7.64 | |
Net investment income (loss)(a) | | | 0.02 | | | | 0.02 | | | | 0.01 | | | | (0.01 | ) | | | (0.00 | )(b) |
Return of capital(a) | | | 0.35 | | | | 0.33 | | | | 0.29 | | | | 0.37 | | | | 0.42 | |
Net realized and unrealized gains (losses) | | | 1.04 | | | | 1.32 | | | | 1.47 | | | | (1.77 | ) | | | (0.93 | ) |
Total from investment operations | | | 1.41 | | | | 1.67 | | | | 1.77 | | | | (1.41 | ) | | | (0.51 | ) |
Less: | | | | | | | | | | | | | | | | | | | | |
Return of capital | | | — | | | | (0.28 | ) | | | (0.46 | ) | | | (0.59 | ) | | | (0.59 | ) |
Dividends from net investment income | | | (0.47 | ) | | | (0.18 | ) | | | — | | | | — | | | | (0.12 | ) |
Total distributions | | | (0.47 | ) | | | (0.46 | ) | | | (0.46 | ) | | | (0.59 | ) | | | (0.71 | ) |
Net asset value, end of period | | $ | 7.88 | | | $ | 6.94 | | | $ | 5.73 | | | $ | 4.42 | | | $ | 6.42 | |
Total return(c) | | | 21.30 | % | | | 29.92 | % | | | 40.65 | % | | | (21.29 | )% | | | (7.59 | )% |
Net assets, end of period (000’s omitted) | | $ | 280,937 | | | $ | 250,311 | | | $ | 238,973 | | | $ | 424,900 | | | $ | 810,225 | |
Portfolio turnover rate | | | 13 | % | | | 11 | % | | | 18 | % | | | 30 | % | | | 23 | % |
| | | | | |
Ratios/supplemental data based on average net assets: | | | | | | | | | | | | | | | | | | | | |
Ratio of expenses: | | | | | | | | | | | | | | | | | | | | |
Without fee waivers and/or expense reimbursements, before taxes | | | 0.84 | % | | | 0.84 | % | | | 0.86 | % | | | 0.88 | % | | | 0.81 | % |
Expense (waivers) | | | (0.01 | )% | | | — | % | | | — | % | | | — | % | | | — | % |
With fee waiver and/or expense reimbursement, before taxes(d) | | | 0.83 | % | | | 0.84 | % | | | 0.86 | % | | | 0.88 | % | | | 0.81 | % |
Deferred tax expense (benefit)(e) | | | 5.44 | % | | | 1.96 | % | | | — | % | | | — | % | | | — | % |
With fee waivers and/or expense reimbursements, after taxes | | | 6.27 | % | | | 2.80 | % | | | 0.86 | % | | | 0.88 | % | | | 0.81 | % |
| | | | | |
Ratio of investment income (loss): | | | | | | | | | | | | | | | | | | | | |
Ratio of net investment income (loss) before taxes | | | 0.09 | % | | | (0.36 | )% | | | 0.17 | % | | | (0.27 | )% | | | (0.06 | )% |
Expense (waivers) | | | (0.01 | )% | | | — | % | | | — | % | | | — | % | | | — | % |
Net of expense (waivers) and before deferred tax benefit/(expense) | | | 0.10 | % | | | (0.36 | )% | | | 0.17 | % | | | (0.27 | )% | | | (0.06 | )% |
Deferred tax benefit (expense)(f) | | | 0.13 | % | | | 0.62 | % | | | — | % | | | — | % | | | — | % |
Ratio of net investment income (loss), after taxes | | | 0.23 | % | | | 0.26 | % | | | 0.17 | % | | | (0.27 | )% | | | (0.06 | )% |
| (a) | Per share net investment income (loss) is calculated based on average shares outstanding during the period net of deferred tax expense (benefit). Per share return of capital is calculated based on average shares during the period net of deferred tax expense (benefit) estimated at the combined Federal and State statutory income tax rate. |
| (b) | Rounds to less than (0.005). |
| (c) | Includes adjustments in accordance with accounting principles generally accepted in the United States of America and as such, the net asset value for financial reporting purposes and returns based upon those net asset values may differ from the net asset value and returns for shareholder transactions. Does not include sales charges and is not annualized for periods less than one year, if applicable. |
| (d) | Includes borrowing and franchise tax expense. Without borrowing and franchise tax expense, the net expense ratio would be 0.79%, 0.79%, 0.78%, 0.79% and 0.77%, for the years ended November 30, 2023, 2022, 2021, 2020 and 2019, respectively. |
| (e) | Deferred tax expense (benefit) estimate for the ratio calculation is derived from the net investment income (loss), and realized and unrealized gains (losses). |
| (f) | Deferred tax benefit (expense) for the ratio calculation, when applicable, is derived from net investment income (loss) only. |
See accompanying Notes to Financial Statements which are an integral part of the financial statements.
18 Invesco SteelPath MLP Select 40 Fund
Notes to Financial Statements
November 30, 2023
NOTE 1—Significant Accounting Policies
Invesco SteelPath MLP Select 40 Fund (the “Fund”) is a series portfolio of AIM Investment Funds (Invesco Investment Funds) (the “Trust”). The Trust is organized as a Delaware statutory trust and is registered under the Investment Company Act of 1940, as amended (the “1940 Act”), as an open-end series management investment company authorized to issue an unlimited number of shares of beneficial interest. Information presented in these financial statements pertains only to the Fund. Matters affecting the Fund or each class will be voted on exclusively by the shareholders of the Fund or each class.
The Fund’s investment objective is to seek total return.
The Fund currently consists of six different classes of shares: Class A, Class C, Class R, Class Y, Class R5 and Class R6. Class Y shares are available only to certain investors. Class A shares are sold with a front-end sales charge unless certain waiver criteria are met. Under certain circumstances, load waived shares may be subject to contingent deferred sales charges (“CDSC”). Class C shares are sold with a CDSC. Class R, Class Y, Class R5 and Class R6 shares are sold at net asset value. Class C shares held for eight years after purchase are eligible for automatic conversion into Class A shares of the same Fund (the “Conversion Feature”). The automatic conversion pursuant to the Conversion Feature will generally occur at the end of the month following the eighth anniversary after a purchase of Class C shares.
The Fund is an investment company and accordingly follows the investment company accounting and reporting guidance in accordance with Financial Accounting Standards Board Accounting Standards Codification Topic 946, Financial Services – Investment Companies.
The following is a summary of the significant accounting policies followed by the Fund in the preparation of its financial statements.
| A. | Security Valuations – Securities, including restricted securities, are valued according to the following policy. |
A security listed or traded on an exchange is generally valued at its trade price or official closing price that day as of the close of the exchange where the security is principally traded, or lacking any trades or official closing price on a particular day, the security may be valued at the closing bid or ask price on that day. Securities traded in the over-the-counter market are valued based on prices furnished by independent pricing services or market makers. When such securities are valued using prices provided by an independent pricing service they may be considered fair valued. Futures contracts are valued at the daily settlement price set by an exchange on which they are principally traded. Where a final settlement price exists, exchange-traded options are valued at the final settlement price from the exchange where the option principally trades. Where a final settlement price does not exist, exchange-traded options are valued at the mean between the last bid and ask price generally from the exchange where the option principally trades.
Securities of investment companies that are not exchange-traded (e.g., open end mutual funds) are valued using such company’s end-of-business-day net asset value per share.
Deposits, other obligations of U.S. and non-U.S. banks and financial institutions are valued at their daily account value.
Fixed income securities (including convertible debt securities) generally are valued on the basis of prices provided by independent pricing services. Prices provided by the pricing service may be determined without exclusive reliance on quoted prices, and may reflect appropriate factors such as institution-size trading in similar groups of securities, developments related to specific securities, dividend rate (for unlisted equities), yield (for debt obligations), quality, type of issue, coupon rate (for debt obligations), maturity (for debt obligations), individual trading characteristics and other market data. Pricing services generally value debt obligations assuming orderly transactions of institutional round lot size, but a fund may hold or transact in the same securities in smaller, odd lot sizes. Odd lots often trade at lower prices than institutional round lots, and their value may be adjusted accordingly. Debt obligations are subject to interest rate and credit risks. In addition, all debt obligations involve some risk of default with respect to interest and/or principal payments.
Foreign securities’ (including foreign exchange contracts) prices are converted into U.S. dollar amounts using the applicable exchange rates as of the close of the New York Stock Exchange (“NYSE”). If market quotations are available and reliable for foreign exchange-traded equity securities, the securities will be valued at the market quotations. Invesco Advisers, Inc. (the “Adviser” or “Invesco”) may use various pricing services to obtain market quotations as well as fair value prices. Because trading hours for certain foreign securities end before the close of the NYSE, closing market quotations may become not representative of market value in the Adviser’s judgment (“unreliable”). If, between the time trading ends on a particular security and the close of the customary trading session on the NYSE, a significant event occurs that makes the closing price of the security unreliable, the Adviser may fair value the security. If the event is likely to have affected the closing price of the security, the security will be valued at fair value in good faith in accordance with Board-approved policies and related Adviser procedures (“Valuation Procedures”). Adjustments to closing prices to reflect fair value may also be based on a screening process of an independent pricing service to indicate the degree of certainty, based on historical data, that the closing price in the principal market where a foreign security trades is not the current value as of the close of the NYSE. Foreign securities’ prices meeting the degree of certainty that the price is not reflective of current value will be priced at the indication of fair value from the independent pricing service. Multiple factors may be considered by the independent pricing service in determining adjustments to reflect fair value and may include information relating to sector indices, American Depositary Receipts and domestic and foreign index futures. Foreign securities may have additional risks including exchange rate changes, potential for sharply devalued currencies and high inflation, political and economic upheaval, the relative lack of issuer information, relatively low market liquidity and the potential lack of strict financial and accounting controls and standards.
Unlisted securities will be valued using prices provided by independent pricing services or by another method that the Adviser, in its judgment, believes better reflects the security’s fair value in accordance with the Valuation Procedures.
Securities for which market prices are not provided by any of the above methods may be valued based upon quotes furnished by independent sources. The mean between the last bid and ask prices may be used to value debt obligations, including corporate loans.
Securities for which market quotations are not readily available are fair valued by the Adviser in accordance with the Valuation Procedures. If a fair value price provided by a pricing service is unreliable, the Adviser will fair value the security using the Valuation Procedures. Issuer specific events, market trends, bid/ask quotes of brokers and information providers and other market data may be reviewed in the course of making a good faith determination of a security’s fair value.
The Fund may invest in securities that are subject to interest rate risk, meaning the risk that the prices will generally fall as interest rates rise and, conversely, the prices will generally rise as interest rates fall. Specific securities differ in their sensitivity to changes in interest rates depending on their individual characteristics. Changes in interest rates may result in increased market volatility, which may affect the value and/or liquidity of certain Fund investments.
Valuations change in response to many factors including the historical and prospective earnings of the issuer, the value of the issuer’s assets, general market conditions which are not specifically related to the particular issuer, such as real or perceived adverse economic conditions, changes in the general outlook for revenues or corporate earnings, changes in interest or currency rates, regional or global instability, natural or environmental disasters, widespread disease or other public health issues, war, acts of terrorism, significant governmental actions or adverse investor sentiment generally and market liquidity. Because of the inherent uncertainties of valuation, the values reflected in the financial statements may materially differ from the value received upon actual sale of those investments.
The price the Fund could receive upon the sale of any investment may differ from the Adviser’s valuation of the investment, particularly for securities that are valued using a fair valuation technique. When fair valuation techniques are applied, the Adviser uses available information, including both observable and unobservable inputs and assumptions, to determine a methodology that will result in a valuation that the Adviser believes approximates market value. Fund
19 Invesco SteelPath MLP Select 40 Fund
securities that are fair valued may be subject to greater fluctuation in their value from one day to the next than would be the case if market quotations were used. Because of the inherent uncertainties of valuation, and the degree of subjectivity in such decisions, the Fund could realize a greater or lesser than expected gain or loss upon the sale of the investment.
| B. | Securities Transactions and Investment Income – Securities transactions are accounted for on a trade date basis. Realized gains or losses on sales are computed on the basis of specific identification of the securities sold. Interest income (net of withholding tax, if any) is recorded on an accrual basis from settlement date and includes coupon interest and amortization of premium and accretion of discount on debt securities as applicable. Dividend income (net of withholding tax, if any) is recorded on the ex-dividend date. |
The Fund may periodically participate in litigation related to Fund investments. As such, the Fund may receive proceeds from litigation settlements. Any proceeds received are included in the Statement of Operations as realized gain (loss) for investments no longer held and as unrealized gain (loss) for investments still held.
Brokerage commissions and mark ups are considered transaction costs and are recorded as an increase to the cost basis of securities purchased and/or a reduction of proceeds on a sale of securities. Such transaction costs are included in the determination of net realized and unrealized gain (loss) from investment securities reported in the Statement of Operations and the Statement of Changes in Net Assets and the net realized and unrealized gains (losses) on securities per share in the Financial Highlights. Transaction costs are included in the calculation of the Fund’s net asset value and, accordingly, they reduce the Fund’s total returns. These transaction costs are not considered operating expenses and are not reflected in net investment income reported in the Statement of Operations and the Statement of Changes in Net Assets, or the net investment income per share and the ratios of expenses and net investment income reported in the Financial Highlights, nor are they limited by any expense limitation arrangements between the Fund and the investment adviser.
The Fund allocates income and realized and unrealized capital gains and losses to a class based on the relative net assets of each class.
| C. | Country Determination – For the purposes of making investment selection decisions and presentation in the Schedule of Investments, the investment adviser may determine the country in which an issuer is located and/or credit risk exposure based on various factors. These factors include the laws of the country under which the issuer is organized, where the issuer maintains a principal office, the country in which the issuer derives 50% or more of its total revenues, the country that has the primary market for the issuer’s securities and its “country of risk” as determined by a third party service provider, as well as other criteria. Among the other criteria that may be evaluated for making this determination are the country in which the issuer maintains 50% or more of its assets, the type of security, financial guarantees and enhancements, the nature of the collateral and the sponsor organization. Country of issuer and/or credit risk exposure has been determined to be the United States of America, unless otherwise noted. |
| D. | Dividends and Distributions to Shareholders – Dividends and distributions to shareholders, which are determined in accordance with income tax regulations and may differ from accounting principles generally accepted in the United States of America (“GAAP”), are recorded on the ex-dividend date. The Fund’s dividend distribution policy is intended to provide monthly distributions to its shareholders at a rate that over time is similar to the distribution rate the Fund receives from the master limited partnerships (”MLPs”) in which it invests. The Fund generally pays out dividends that over time approximate the distributions received from the Fund’s portfolio investments based on, among other considerations, distributions the Fund actually received from portfolio investments, distributions it would have received if it had been fully invested at all times, and estimated future cash flows. Such dividends are not tied to the Fund’s investment income and may not represent yield or investment return on the Fund’s portfolio. To the extent that the dividends paid exceed the distributions the Fund receives from its underlying investments, the Fund’s assets will be reduced. The Fund’s tendency to pay out a consistent dividend may change, and the Fund’s level of distributions may increase or decrease. |
The estimated characterization of the distributions paid will be either a qualified dividend or distribution (return of capital). This estimate is based on the Fund’s operating results during the period. The actual characterization of the distributions made during the period will not be determined until after the end of the fiscal year.
| E. | Master Limited Partnerships – The Fund primarily invests in MLPs. MLPs are publicly traded partnerships and limited liability companies taxed as partnerships under the Internal Revenue Code of 1986, as amended (the “Internal Revenue Code”). The Fund principally invests in MLPs that derive their revenue primarily from businesses involved in the gathering, transporting, processing, treating, storing, refining, distributing, mining or marketing of natural gas, natural gas liquids, crude oil, refined products or coal (“energy infrastructure MLPs”). The Fund is a partner in each MLP; accordingly, the Fund is required to take into account the Fund’s allocable share of income, gains, losses, deductions, expenses, and tax credits recognized by each MLP. |
MLP’s may be less liquid and subject to more abrupt or erratic price movements than conventional publicly traded securities.
| F. | Return of Capital – Distributions received from the Fund’s investments in MLPs generally are comprised of income and return of capital. The Fund records investment income and return of capital based on estimates made at the time such distributions are received. The return of capital portion of the distribution is a reduction to investment income that results in an equivalent reduction in the cost basis of the associated investments and increases net realized gains (losses) and change in unrealized appreciation (depreciation). Such estimates are based on historical information available from each MLP and other industry sources. These estimates will subsequently be revised and may materially differ primarily based on information received from the MLPs after their tax reporting periods are concluded. |
| G. | Federal Income Taxes – The Fund does not intend to qualify as a regulated investment company pursuant to Subchapter M of the Internal Revenue Code, but will rather be taxed as a corporation. The Fund is treated as a regular corporation, or “C” corporation, for U.S. federal income tax purposes and generally is subject to U.S. federal income tax on its taxable income at the graduated rates applicable to corporations. In addition, as a regular corporation, the Fund may be subject to state and local taxes in jurisdictions in which the MLPs operate. |
The Fund intends to invest its assets primarily in MLPs, which generally are treated as partnerships for federal income tax purposes. As a limited partner in the MLPs, the Fund reports its allocable share of the MLP’s taxable income in computing its own taxable income. The Fund’s tax expense or benefit is included in the Statement of Operations based on the component of income or gains (losses) to which such expense or benefit relates.
Taxes include current and deferred taxes. Current taxes reflect the estimated tax liability of the Fund as of a measurement date based on taxable income. Deferred income taxes reflect the net tax effects of temporary differences between the carrying amounts of assets and liabilities for financial reporting purposes and the amounts used for income tax purposes. Such temporary differences are principally: (i) taxes on unrealized gains (losses), which are attributable to the temporary difference between fair market value and tax basis, (ii) the net tax effects of temporary differences between the carrying amounts of assets and liabilities for financial reporting and income tax purposes and (iii) the net tax benefit of accumulated net operating losses (“NOL”) and capital loss carryforwards. Deferred tax assets and liabilities are measured using effective tax rates expected to apply to taxable income in the years such temporary differences are realized or otherwise settled. To the extent the Fund has a deferred tax asset, consideration is given to whether or not a valuation allowance is required. A valuation allowance is required if, based on the evaluation criterion provided by ASC 740, Income Taxes, it is more-likely-than-not some portion or all of the deferred tax asset will not be realized.
In determining a valuation allowance, the Fund’s assessment considers, among other matters, the nature, frequency and severity of current and cumulative losses, the duration of statutory carryforward periods and the associated risk that operating loss and capital loss carryforwards were limited as a result of shareholder transactions or were likely to expire unused, and unrealized gains and losses on investments. Consideration was also given to market cycles, the severity and duration of historical deferred tax assets, the impact of redemptions, and the level of MLP distributions.
20 Invesco SteelPath MLP Select 40 Fund
Through the consideration of these factors, the Fund may determine that it is more likely than not that the Fund’s deferred tax assets will not be realized through future taxable income of the appropriate character. As a result, the Fund may be required to record a valuation allowance with respect to its deferred tax assets that are not considered to be realizable.
From time to time, the Fund may modify its estimates or assumptions regarding its deferred tax liability and/or asset balances and any applicable valuation allowance as new information becomes available. Modifications of the Fund’s estimates or assumptions regarding its deferred tax liability and/or asset balances and any applicable valuation allowance, changes in generally accepted accounting principles or related guidance or interpretations thereof, limitations imposed on or expirations of the Fund’s NOL and capital loss carryovers (if any) and changes in applicable tax law could result in increases or decreases in the Fund’s NAV per share, which could be material.
The Fund may rely, to some extent, on information provided by the MLPs, which may not necessarily be timely, to estimate taxable income allocable to MLP units held in its portfolio, and to estimate its associated deferred tax liability or asset. Such estimates are made in good faith. From time to time, as new information becomes available, the Fund will modify its estimates or assumptions regarding its tax liability or asset.
The Fund’s policy is to classify interest and penalties associated with underpayment of federal and state income taxes, if any, as income tax expense on its Statement of Operations.
The Fund files income tax returns in the U.S. federal jurisdiction and various states. The Fund has reviewed all major jurisdictions and concluded that there is no significant impact on the Fund’s net assets and no tax liability resulting from unrecognized tax benefits relating to uncertain tax positions expected to be taken on its tax returns. Furthermore, management of the Fund is not aware of any uncertain tax positions for which it is reasonably possible that the total amount of unrecognized tax benefit will significantly change in the next 12 months. Generally, the Fund is subject to examinations by taxing authorities for up to three years after the filing of the return for the tax period. All relevant periods are still open for examination.
| H. | Expenses – Fees provided for under the Rule 12b-1 plan of a particular class of the Fund are charged to the operations of such class. Transfer agency fees and expenses and other shareholder recordkeeping fees and expenses attributable to Class R5 and Class R6 are allocated based on relative net assets of Class R5 and Class R6. Sub-accounting fees attributable to Class R5 are charged to the operations of the class. Transfer agency fees and expenses and other shareholder recordkeeping fees and expenses relating to all other classes are allocated among those classes based on relative net assets. All other expenses are allocated among the classes based on relative net assets. |
| I. | Interest, Facilities and Maintenance Fees – Interest, Facilities and Maintenance Fees include interest and related borrowing costs such as commitment fees, administrative expenses and other expenses associated with establishing and maintaining the line of credit. |
| J. | Accounting Estimates – The preparation of financial statements in conformity with GAAP requires management to make estimates and assumptions that affect the reported amounts of assets and liabilities at the date of the financial statements and the reported amounts of revenues and expenses during the reporting period including estimates and assumptions related to taxation. Actual results could differ from those estimates by a significant amount. In addition, the Fund monitors for material events or transactions that may occur or become known after the period-end date and before the date the financial statements are released to print. |
| K. | Indemnifications – Under the Trust’s organizational documents, each Trustee, officer, employee or other agent of the Trust is indemnified against certain liabilities that may arise out of the performance of their duties to the Fund. Additionally, in the normal course of business, the Fund enters into contracts, including the Fund’s servicing agreements, that contain a variety of indemnification clauses. The Fund’s maximum exposure under these arrangements is unknown as this would involve future claims that may be made against the Fund that have not yet occurred. The risk of material loss as a result of such indemnification claims is considered remote. |
NOTE 2—Advisory Fees and Other Fees Paid to Affiliates
The Trust has entered into a master investment advisory agreement with the Adviser. Under the terms of the investment advisory agreement, the Fund accrues daily and pays monthly an advisory fee to the Adviser based on the annual rate of the Fund’s average daily net assets as follows:
| | | | |
| Average Daily Net Assets | | Rate* | |
First $3 billion | | | 0.70% | |
Next $2 billion | | | 0.68% | |
Over $5 billion | | | 0.65% | |
| * | The advisory fee paid by the Fund shall be reduced by any amounts paid by the Fund under the administrative services agreement with the Adviser. |
For the year ended November 30, 2023, the effective advisory fee rate incurred by the Fund was 0.70%.
Under the terms of a master sub-advisory agreement between the Adviser and each of Invesco Asset Management Deutschland GmbH, Invesco Asset Management Limited, Invesco Asset Management (Japan) Limited, Invesco Hong Kong Limited, Invesco Senior Secured Management, Inc. and Invesco Canada Ltd. and separate sub-advisory agreements with Invesco Capital Management LLC and Invesco Asset Management (India) Private Limited (collectively, the “Affiliated Sub-Advisers”) the Adviser, not the Fund, will pay 40% of the fees paid to the Adviser to any such Affiliated Sub-Adviser(s) that provide(s) discretionary investment management services to the Fund based on the percentage of assets allocated to such Affiliated Sub-Adviser(s). Invesco has also entered into a Sub-Advisory Agreement with OppenheimerFunds, Inc. to provide discretionary management services to the Fund.
The Adviser has contractually agreed, through March 31, 2024, to waive advisory fees and/or reimburse expenses of all shares to the extent necessary to limit total annual fund operating expenses after fee waiver and/or expense reimbursement (excluding certain items discussed below) of Class A, Class C, Class R, Class Y, Class R5 and Class R6 shares to 1.10%, 1.85%, 1.35%, 0.85%, 0.84% and 0.79%, respectively, of the Fund’s average daily net assets (the “expense limits”). Effective April 1, 2024, the Adviser has contractually agreed, through at least March 31, 2025, to waive advisory fees and/or reimburse expenses of all shares to the extent necessary to limit total annual fund operating expenses after fee waiver and/or expense reimbursement (excluding certain items discussed below) of Class A, Class C, Class R, Class Y, Class R5 and Class R6 shares to 1.11%, 1.86%, 1.36%, 0.86%, 0.86% and 0.86%, respectively, of the Fund’s average daily net assets. In determining the Adviser’s obligation to waive advisory fees and/or reimburse expenses, the following expenses are not taken into account, and could cause the total annual fund operating expenses after fee waiver and/or expense reimbursement to exceed the numbers reflected above: (1) interest, facilities and maintenance fees; (2) taxes; (3) dividend expense on short sales; (4) extraordinary or non-routine items, including litigation expenses; and (5) expenses that the Fund has incurred but did not actually pay because of an expense offset arrangement. Unless Invesco continues the fee waiver agreement, it will terminate on March 31, 2025. During its term, the fee waiver agreement cannot be terminated or amended to increase the expense limits or reduce the advisory fee waiver without approval of the Board of Trustees.
For the year ended November 30, 2023, the Adviser contractually reimbursed class level expenses of $170,022, $76,052, $7,880, $382,583 and $23,873 for Class A, Class C, Class R, Class Y and Class R6, respectively.
The Trust has entered into an administration and fund accounting agreement with UMB Fund Services, Inc. (“UMB”) pursuant to which UMB shall provide administration and fund accounting services to the Fund. The Trust and the Adviser have entered into a Master Administrative Services Agreement (“Administrative Services Agreement”) pursuant to which the Adviser may perform or arrange for the provision of certain accounting and other administrative services to the Fund which are not required to be performed by the Adviser under the Investment Advisory Agreement. The Adviser may only receive fees for administrative services under
21 Invesco SteelPath MLP Select 40 Fund
the Administrative Services Agreement to the extent that those fees assessed under the agreement are in excess of the fees paid to UMB. For the year ended November 30, 2023, expenses incurred under the agreement are shown in the Statement of Operations as Administrative services fees. Additionally, Invesco has entered into service agreements whereby UMB Bank, n.a., serves as custodian to the Fund.
The Trust has entered into a transfer agency and service agreement with Invesco Investment Services, Inc. (“IIS”) pursuant to which the Fund has agreed to pay IIS a fee for providing transfer agency and shareholder services to the Fund and reimburse IIS for certain expenses incurred by IIS in the course of providing such services. IIS may make payments to intermediaries that provide omnibus account services, sub-accounting services and/or networking services. All fees payable by IIS to intermediaries that provide omnibus account services or sub-accounting services are charged back to the Fund, subject to certain limitations approved by the Trust’s Board of Trustees. For the year ended November 30, 2023, expenses incurred under the agreement are shown in the Statement of Operations as Transfer agent fees.
The Trust has entered into master distribution agreements with Invesco Distributors, Inc. (“IDI”) to serve as the distributor for the Class A, Class C, Class R, Class Y, Class R5 and Class R6 shares of the Fund. The Trust has adopted plans pursuant to Rule 12b-1 under the 1940 Act with respect to the Fund’s Class A, Class C and Class R shares (collectively, the “Plans”). The Fund, pursuant to the Plans, pays IDI compensation at the annual rate of 0.25% of the Fund’s average daily net assets of Class A shares, 1.00% of the average daily net assets of Class C shares and 0.50% of the average daily net assets of Class R shares. The fees are accrued daily and paid monthly. Of the Plans payments, up to 0.25% of the average daily net assets of each class of shares may be paid to furnish continuing personal shareholder services to customers who purchase and own shares of such classes. Any amounts not paid as a service fee under the Plans would constitute an asset-based sales charge. Rules of the Financial Industry Regulatory Authority (“FINRA”) impose a cap on the total sales charges, including asset-based sales charges, that may be paid by any class of shares of the Fund. For the year ended November 30, 2023, expenses incurred under the Plans are shown in the Statement of Operations as Distribution fees.
Front-end sales commissions and CDSC (collectively, the “sales charges”) are not recorded as expenses of the Fund. Front-end sales commissions are deducted from proceeds from the sales of Fund shares prior to investment in Class A shares of the Fund. CDSC are deducted from redemption proceeds prior to remittance to the shareholder. During the year ended November 30, 2023, IDI advised the Fund that IDI retained $64,556 in front-end sales commissions from the sale of Class A shares and $1,062 and $4,810 from Class A and Class C shares, respectively, for CDSC imposed upon redemptions by shareholders.
For the year ended November 30, 2023, the Fund incurred $81,200 in brokerage commissions with Invesco Capital Markets, Inc., an affiliate of the Adviser and IDI, for portfolio transactions executed on behalf of the Fund.
Certain officers and trustees of the Trust are officers and directors of the Adviser, IIS and/or IDI.
NOTE 3—Additional Valuation Information
GAAP defines fair value as the price that would be received to sell an asset or paid to transfer a liability in an orderly transaction between market participants at the measurement date, under current market conditions. GAAP establishes a hierarchy that prioritizes the inputs to valuation methods, giving the highest priority to readily available unadjusted quoted prices in an active market for identical assets (Level 1) and the lowest priority to significant unobservable inputs (Level 3), generally when market prices are not readily available. Based on the valuation inputs, the securities or other investments are tiered into one of three levels. Changes in valuation methods may result in transfers in or out of an investment’s assigned level:
| | |
| Level 1 – | | Prices are determined using quoted prices in an active market for identical assets. |
| Level 2 – | | Prices are determined using other significant observable inputs. Observable inputs are inputs that other market participants may use in pricing a security. These may include quoted prices for similar securities, interest rates, prepayment speeds, credit risk, yield curves, loss severities, default rates, discount rates, volatilities and others. |
| Level 3 – | | Prices are determined using significant unobservable inputs. In situations where quoted prices or observable inputs are unavailable (for example, when there is little or no market activity for an investment at the end of the period), unobservable inputs may be used. Unobservable inputs reflect the Adviser’s assumptions about the factors market participants would use in determining fair value of the securities or instruments and would be based on the best available information. |
As of November 30, 2023, all of the securities in this Fund were valued based on Level 1 inputs (see the Schedule of Investments for security categories). The level assigned to the securities valuations may not be an indication of the risk or liquidity associated with investing in those securities. Because of the inherent uncertainties of valuation, the values reflected in the financial statements may materially differ from the value received upon actual sale of those investments.
NOTE 4—Security Transactions with Affiliated Funds
The Fund is permitted to purchase securities from or sell securities to certain other affiliated funds under specified conditions outlined in procedures adopted by the Board of Trustees of the Trust. The procedures have been designed to ensure that any purchase or sale of securities by the Fund from or to another fund that is or could be considered an “affiliated person” by virtue of having a common investment adviser (or affiliated investment advisers), common Trustees and/or common officers is made in reliance on Rule 17a-7 of the 1940 Act and, to the extent applicable, related SEC staff positions. Each such transaction is effected at the security’s “current market price”, as provided for in these procedures and Rule 17a-7. Pursuant to these procedures, for the year ended November 30, 2023, the Fund engaged in securities purchases of $19,878,420 and securities sales of $17,975,200, which resulted in net realized gains (loss) of $(2,758,865).
NOTE 5—Trustees’ and Officers’ Fees and Benefit
Trustees’ and Officers’ Fees and Benefits include amounts accrued by the Fund to pay remuneration to certain Trustees and Officers of the Fund. Trustees have the option to defer compensation payable by the Fund, and Trustees’ and Officers’ Fees and Benefits also include amounts accrued by the Fund to fund such deferred compensation amounts. Those Trustees who defer compensation have the option to select various Invesco Funds in which their deferral accounts shall be deemed to be invested. Finally, certain current Trustees were eligible to participate in a retirement plan that provided for benefits to be paid upon retirement to Trustees over a period of time based on the number of years of service. The Fund may have certain former Trustees who also participate in a retirement plan and receive benefits under such plan. Trustees’ and Officers’ Fees and Benefits include amounts accrued by the Fund to fund such retirement benefits. Obligations under the deferred compensation and retirement plans represent unsecured claims against the general assets of the Fund.
NOTE 6—Cash Balances and Borrowings
The Fund has entered into a revolving credit and security agreement, which enables the Fund to participate with certain other Invesco Funds in a committed secured borrowing facility that permits borrowings up to $400 million, collectively by certain Invesco Funds, and which will expire on September 25, 2024. The Fund is permitted to borrow up to the lesser of one-third of the Fund’s total assets, or the maximum amount permitted pursuant to the Fund’s investment limitations. The revolving credit and security agreement is secured by the assets of the Fund. The Fund is subject to certain covenants relating to the revolving credit and security agreement. Failure to comply with these restrictions could cause the acceleration of the repayment of the amount outstanding under the revolving credit and security agreement. During the year ended November 30, 2023, the Fund did not borrow under this agreement.
Additionally, the Fund is permitted to temporarily carry a negative or overdrawn balance in its account with UMB Bank, n.a., the custodian bank. Such balances, if any at period-end, are shown in the Statement of Assets and Liabilities under the payable caption Amount due custodian. To compensate the custodian bank for such overdrafts, the overdrawn Fund may either (1) leave funds as a compensating balance in the account so the custodian bank can be compensated by earning the additional interest; or (2) compensate by paying the custodian bank at a rate agreed upon by the custodian bank and Invesco, not to exceed the contractually agreed upon rate.
22 Invesco SteelPath MLP Select 40 Fund
NOTE 7—Distributions and Tax Information
Tax Character of Distributions to Shareholders Paid During the Fiscal Years Ended November 30, 2023 and 2022:
| | | | | | | | |
| | | November 30,
2023 | | | November 30,
2022 | |
Ordinary income | | $ | 117,515,168 | | | $ | 52,427,643 | |
Return of Capital | | | — | | | | 77,557,176 | |
Total distributions | | $ | 117,515,168 | | | $ | 129,984,819 | |
For the year ended November 30, 2023, the federal income tax rate is 21%. The Fund is currently using an estimated rate of 1.6% for state and local tax, net of federal tax expense.
The Fund’s income tax provision consists of the following as of November 31, 2023:
| | | | |
| Current tax (expense) benefit | | | |
Federal | | $ | — | |
State | | | — | |
Total current tax (expense) benefit | | $ | — | |
| | | | |
| Deferred tax (expense) benefit | | | |
Federal | | $ | (85,472,585 | ) |
State | | | (6,964,538 | ) |
Valuation allowance | | | — | |
Total deferred tax (expense) benefit | | $ | (92,437,123 | ) |
The reconciliation between the federal statutory income tax rate of 21% and the tax effect on net investment income (loss) and realized and unrealized gain (loss) follows:
| | | | | | | | |
| | | Amount | | | % Effect | |
Application of federal statutory income tax rate | | $ | (86,828,869 | ) | | | (21.00 | )% |
State income taxes net of federal benefit | | | (6,615,533 | ) | | | (1.60 | )% |
Effect of state tax rate change | | | (452,341 | ) | | | (0.11 | )% |
Effect of permanent differences | | | 1,901,224 | | | | 0.46 | % |
Return to provision adjustments | | | (441,604 | ) | | | (0.11 | )% |
Change in valuation allowance | | | - | | | | 0.00 | % |
Total income tax (expense) benefit | | $ | (92,437,123 | ) | | | (22.36 | )% |
For the year ended November, 2023, the Fund’s tax effect on net investment income (loss) and realized and unrealized gain (loss) of (22.36)% differed from the combined federal and state statutory tax rate of (22.60)% due in large part to the change in valuation allowance primarily as a result of the change in unrealized appreciation. As of November 30, 2023, the Fund does not have any interest or penalties associated with the underpayment of any income taxes.
Components of the Fund’s deferred tax assets and liabilities as of November 30, 2023 are as follows:
| | | | |
| Deferred tax assets: | | | |
Net operating loss carryforward (tax basis) — Federal | | $ | 28,324,988 | |
Net operating loss carryforward (tax basis) — State | | | 5,591,178 | |
Excess business interest expense carryforward | | | 11,897,911 | |
Capital loss carryforward (tax basis) | | | 78,963,359 | |
Book to tax differences — Income recognized from MLPs | | | 1,506,413 | |
Organizational Costs | | | 723 | |
Valuation allowance | | | — | |
Total deferred tax asset | | | 126,284,572 | |
| | | | |
| Deferred tax liabilities: | | | |
Net unrealized gain (loss) on investment securities (tax basis) | | $ | (253,229,364 | ) |
Total deferred tax liability | | | (253,229,364 | ) |
Total net deferred tax asset (liability) | | $ | (126,944,792 | ) |
As of November 30, 2023, the Fund has net operating loss carryforwards for federal income tax purposes, as follows:
| | | | |
| Expiration date for expiring net operating loss carryforwards | | | |
11/30/2036 | | $ | 109,159,754 | |
11/30/2037 | | | 10,613,012 | |
11/30/2038 | | | 52,935 | |
Total expiring net operating loss carryforwards | | $ | 119,825,701 | |
Total non-expiring net operating loss carryforwards | | $ | 15,055,205 | |
Total net operating loss carryforwards | | $ | 134,880,906 | |
23 Invesco SteelPath MLP Select 40 Fund
During the year ended November 30, 2023, the Fund estimates that it will utilize $110,570,128 of net operating (loss) carryforward.
As of November 30, 2023, the Fund has net capital loss carryforwards for federal income tax purposes, which may be carried forward for 5 years, as follows:
| | | | |
| Expiration Date | | | |
11/30/2025 | | $ | 218,298,554 | |
11/30/2026 | | | 131,096,842 | |
Total | | $ | 349,395,396 | |
During the year ended November 30, 2023, the Fund estimates that it will utilize $81,122,822 of capital loss carryforward.
NOTE 8—Investment Transactions
The aggregate amount of investment securities (other than short-term securities, U.S. Government obligations and money market funds, if any) purchased and sold by the Fund during the year ended November 30, 2023 was $231,960,049 and $451,304,802 respectively.
As of November 30, 2023, gross unrealized appreciation and depreciation of investments, based on cost for federal income tax purposes were as follows:
| | | | |
Gross Unrealized Appreciation | | $ | 1,135,988,314 | |
Gross Unrealized Depreciation | | | (11,980,334 | ) |
Net Unrealized Appreciation on Investments | | $ | 1,124,007,980 | |
Cost of investments for tax purposes is $763,708,812.
The difference between cost amounts for financial statement and federal income tax purposes is due primarily to timing differences in recognizing certain gains and losses in security transactions.
NOTE 9—Share Information
| | | | | | | | | | | | | | | | |
| | | Summary of Share Activity | |
| | | Year ended
November 30, 2023(a) | | | Year ended
November 30, 2022 | |
| |
| | | Shares | | | Amount | | | Shares | | | Amount | |
Sold: | | | | | | | | | | | | | | | | |
Class A | | | 7,592,708 | | | $ | 50,031,383 | | | | 9,630,818 | | | $ | 58,468,077 | |
Class C | | | 1,580,704 | | | | 9,075,537 | | | | 3,414,178 | | | | 18,339,010 | |
Class R | | | 1,333,433 | | | | 8,752,138 | | | | 2,529,072 | | | | 15,367,818 | |
Class Y | | | 18,525,973 | | | | 130,727,271 | | | | 29,257,818 | | | | 188,112,534 | |
Class R6 | | | 4,686,610 | | | | 33,024,470 | | | | 6,836,101 | | | | 44,162,841 | |
Issued as reinvestment of dividends: | | | | | | | | | | | | | | | | |
Class A | | | 2,425,681 | | | | 16,147,647 | | | | 2,461,843 | | | | 15,192,287 | |
Class C | | | 1,428,017 | | | | 8,226,330 | | | | 1,825,821 | | | | 9,955,316 | |
Class R | | | 199,008 | | | | 1,302,001 | | | | 118,496 | | | | 729,627 | |
Class Y | | | 3,628,930 | | | | 25,807,131 | | | | 5,322,758 | | | | 34,774,125 | |
Class R6 | | | 1,007,382 | | | | 7,273,381 | | | | 1,344,789 | | | | 8,862,621 | |
Automatic Conversion of Class C shares to Class A shares: | | | | | | | | | | | | | | | | |
Class A | | | 5,130,845 | | | | 33,915,681 | | | | 4,872,755 | | | | 29,166,862 | |
Class C | | | (5,903,294 | ) | | | (33,915,681 | ) | | | (5,504,038 | ) | | | (29,166,862 | ) |
Reacquired: | | | | | | | | | | | | | | | | |
Class A | | | (11,893,474 | ) | | | (78,492,715 | ) | | | (13,415,028 | ) | | | (81,361,832 | ) |
Class C | | | (3,924,686 | ) | | | (22,406,194 | ) | | | (5,216,621 | ) | | | (27,664,466 | ) |
Class R | | | (1,291,920 | ) | | | (8,393,705 | ) | | | (448,909 | ) | | | (2,710,334 | ) |
Class Y | | | (51,427,178 | ) | | | (361,928,057 | ) | | | (58,739,734 | ) | | | (378,909,673 | ) |
Class R6 | | | (6,065,472 | ) | | | (43,190,647 | ) | | | (13,870,209 | ) | | | (89,274,609 | ) |
Net Increase (decrease) in share activity | | | (32,966,733 | ) | | $ | (224,044,029 | ) | | | (29,580,090 | ) | | $ | (185,956,658 | ) |
| (a) | There are entities that are record owners of more than 5% of the outstanding shares of the Fund and in the aggregate own 61% of the outstanding shares of the Fund. IDI has an agreement with these entities to sell Fund shares. The Fund, Invesco and/or Invesco affiliates may make payments to these entities, which are considered to be related to the Fund, for providing services to the Fund, Invesco and/or Invesco affiliates including but not limited to services such as securities brokerage, distribution, third party record keeping and account servicing. The Fund has no knowledge as to whether all or any portion of the shares owned of record by these entities are also owned beneficially. |
24 Invesco SteelPath MLP Select 40 Fund
Report of Independent Registered Public Accounting Firm
To the Board of Trustees of AIM Investment Funds (Invesco Investment Funds) and Shareholders of Invesco SteelPath MLP Select 40 Fund
Opinion on the Financial Statements
We have audited the accompanying statement of assets and liabilities, including the schedule of investments, of Invesco SteelPath MLP Select 40 Fund (one of the funds constituting AIM Investment Funds (Invesco Investment Funds), hereafter referred to as the “Fund”) as of November 30, 2023, the related statement of operations for the year ended November 30, 2023, the statement of changes in net assets for each of the two years in the period ended November 30, 2023, including the related notes, and the financial highlights for each of the periods indicated therein (collectively referred to as the “financial statements”). In our opinion, the financial statements present fairly, in all material respects, the financial position of the Fund as of November 30, 2023, the results of its operations for the year then ended, the changes in its net assets for each of the two years in the period ended November 30, 2023 and the financial highlights for each of the periods indicated therein, in conformity with accounting principles generally accepted in the United States of America.
Basis for Opinion
These financial statements are the responsibility of the Fund’s management. Our responsibility is to express an opinion on the Fund’s financial statements based on our audits. We are a public accounting firm registered with the Public Company Accounting Oversight Board (United States) (PCAOB) and are required to be independent with respect to the Fund in accordance with the U.S. federal securities laws and the applicable rules and regulations of the Securities and Exchange Commission and the PCAOB.
We conducted our audits of these financial statements in accordance with the standards of the PCAOB. Those standards require that we plan and perform the audit to obtain reasonable assurance about whether the financial statements are free of material misstatement, whether due to error or fraud.
Our audits included performing procedures to assess the risks of material misstatement of the financial statements, whether due to error or fraud, and performing procedures that respond to those risks. Such procedures included examining, on a test basis, evidence regarding the amounts and disclosures in the financial statements. Our audits also included evaluating the accounting principles used and significant estimates made by management, as well as evaluating the overall presentation of the financial statements. Our procedures included confirmation of securities owned as of November 30, 2023 by correspondence with the custodian. We believe that our audits provide a reasonable basis for our opinion.

Houston, Texas
January 22, 2024
We have served as the auditor of one or more investment companies in the Invesco group of investment companies since at least 1995. We have not been able to determine the specific year we began serving as auditor.
PricewaterhouseCoopers LLP, 1000 Louisiana Street, Suite 5800, Houston, TX 77002
T: (713) 356 4000, www.pwc.com/us
25 Invesco SteelPath MLP Select 40 Fund
Calculating your ongoing Fund expenses
Example
As a shareholder of the Fund, you incur two types of costs: (1) transaction costs, which may include sales charges (loads) on purchase payments or contingent deferred sales charges on redemptions, if any; and (2) ongoing costs, including management fees, distribution and/or service (12b-1) fees, and other Fund expenses. This example is intended to help you understand your ongoing costs (in dollars) of investing in the Fund and to compare these costs with ongoing costs of investing in other mutual funds. The example is based on an investment of $1,000 invested at the beginning of the period and held for the entire period June 1, 2023 through November 30, 2023.
Actual expenses
The table below provides information about actual account values and actual expenses. You may use the information in this table, together with the amount you invested, to estimate the expenses that you paid over the period. Simply divide your account value by $1,000 (for example, an $8,600 account value divided by $1,000 = 8.6), then multiply the result by the number in the table under the heading entitled “Actual Expenses Paid During Period” to estimate the expenses you paid on your account during this period.
Hypothetical example for comparison purposes
The table below also provides information about hypothetical account values and hypothetical expenses based on the Fund’s actual expense ratio and an assumed rate of return of 5% per year before expenses, which is not the Fund’s actual return.
The hypothetical account values and expenses may not be used to estimate the actual ending account balance or expenses you paid for the period. You may use this information to compare the ongoing costs of investing in the Fund and other funds. To do so, compare this 5% hypothetical example with the 5% hypothetical examples that appear in the shareholder reports of the other funds.
Please note that the expenses shown in the table are meant to highlight your ongoing costs only and do not reflect any transaction costs, such as sales charges (loads) on purchase payments or contingent deferred sales charges on redemptions, if any. Therefore, the hypothetical information is useful in comparing ongoing costs only, and will not help you determine the relative total costs of owning different funds. In addition, if these transaction costs were included, your costs would have been higher.
| | | | | | | | | | | | | | | | | | | | | | | | |
| | | Beginning
Account Value
(06/1/2023) | | | ACTUAL | | | HYPOTHETICAL | | | Annualized
Expense
Ratio | |
| | Ending Account Value
(11/30/2023)¹ | | | Expenses
Paid During
Period2 | | | Ending Account Value
(11/30/2023)¹ | | | Expenses
Paid During
Period2 | |
| CLASS A | | $ | 1,000.00 | | | $ | 1,210.10 | | | $ | 67.03 | | | $ | 964.30 | | | $ | 59.58 | | | | 12.10 | % |
| CLASS C | | | 1,000.00 | | | | 1,204.60 | | | | 71.01 | | | | 960.60 | | | | 63.15 | | | | 12.85 | |
| CLASS R | | | 1,000.00 | | | | 1,209.20 | | | | 68.39 | | | | 963.10 | | | | 60.77 | | | | 12.35 | |
| CLASS Y | | | 1,000.00 | | | | 1,212.00 | | | | 65.70 | | | | 965.60 | | | | 58.38 | | | | 11.85 | |
| CLASS R5 | | | 1,000.00 | | | | 1,211.60 | | | | 65.42 | | | | 965.90 | | | | 58.15 | | | | 11.80 | |
| CLASS R6 | | | 1,000.00 | | | | 1,212.70 | | | | 65.40 | | | | 965.90 | | | | 58.10 | | | | 11.79 | |
| 1 | The actual ending account value is based on the actual total return of the Fund for the period June 1, 2023 through November 30, 2023, after actual expenses and will differ from the hypothetical ending account value which is based on the Fund’s expense ratio and a hypothetical annual return of 5% before expenses. |
| 2 | Expenses are equal to the Fund’s annualized expense ratio as indicated above multiplied by the average account value over the period, multiplied by 183/365 to reflect the most recent fiscal half year. |
26 Invesco SteelPath MLP Select 40 Fund
Approval of Investment Advisory and Sub-Advisory Contracts
At meetings held on June 13, 2023, the Board of Trustees (the Board or the Trustees) of AIM Investment Funds (Invesco Investment Funds) as a whole, and the independent Trustees, who comprise over 75% of the Board, voting separately, approved the continuance of the Invesco SteelPath MLP Select 40 Fund’s (the Fund) Master Investment Advisory Agreement with Invesco Advisers, Inc. (Invesco Advisers and the investment advisory agreement) and the Master Intergroup Sub-Advisory Contract for Mutual Funds with Invesco Asset Management Deutschland GmbH, Invesco Asset Management Limited, Invesco Asset Management (Japan) Limited, Invesco Hong Kong Limited, Invesco Senior Secured Management, Inc. and Invesco Canada Ltd. and separate sub-advisory contracts with Invesco Capital Management LLC, Invesco Asset Management (India) Private Limited and OppenheimerFunds, Inc. (collectively, the Affiliated Sub-Advisers and the sub-advisory contracts) for another year, effective July 1, 2023. After evaluating the factors discussed below, among others, the Board approved the renewal of the Fund’s investment advisory agreement and the sub-advisory contracts and determined that the compensation payable thereunder by the Fund to Invesco Advisers and by Invesco Advisers to the Affiliated Sub-Advisers is fair and reasonable.
The Board’s Evaluation Process
The Board has established an Investments Committee, which in turn has established Sub-Committees, that meet throughout the year to review the performance of funds advised by Invesco Advisers (the Invesco Funds). The Sub-Committees meet regularly with portfolio managers for their assigned Invesco Funds and other members of management to review information about investment performance and portfolio attributes of these funds. The Board has established additional standing and ad hoc committees that meet regularly throughout the year to review matters within their purview, including a working group focused on opportunities to make ongoing and continuous improvements to the annual review process for the Invesco Funds’ investment advisory and sub-advisory contracts. The Board took into account evaluations and reports that it received from its committees and sub-committees, as well as the information provided to the Board and its committees and sub-committees throughout the year, in considering whether to approve each Invesco Fund’s investment advisory agreement and sub-advisory contracts.
As part of the contract renewal process, the Board reviews and considers information provided in response to requests for information submitted to management by the independent Trustees with assistance from legal counsel to the independent Trustees and the Senior Officer, an officer of the Invesco Funds who reports directly to the independent Trustees. The Board receives comparative investment performance and fee and expense data regarding the Invesco Funds prepared by Broadridge Financial Solutions, Inc. (Broadridge), an independent mutual fund data provider, as well as information on the composition of the peer groups provided by Broadridge and its methodology for determining peer groups. The Board also receives an independent written evaluation from the Senior Officer. The Senior Officer’s evaluation is prepared as part of his responsibility to manage the process by which the Invesco Funds’ proposed management fees are negotiated during the annual contract renewal process to ensure they are negotiated in a manner that is at arms’ length and reasonable in accordance with certain negotiated regulatory requirements. In addition to meetings with Invesco Advisers and fund counsel throughout the year and as part of meetings convened on May 2, 2023 and June 13, 2023, the independent Trustees also discussed the continuance of the investment advisory agreement and sub-advisory contracts in separate sessions with the Senior Officer and with independent legal counsel. Also, as part of the contract renewal process, the independent Trustees reviewed and considered information provided in response to follow-up requests for information submitted by the independent Trustees to management. The independent Trustees met and discussed those follow-up responses with legal counsel to the independent Trustees and the Senior Officer.
The discussion below is a summary of the Senior Officer’s independent written evaluation with respect to the Fund’s investment advisory agreement and sub-advisory contracts, as well as a discussion of the material factors and related conclusions that formed the basis for the Board’s approval of the Fund’s investment advisory agreement and sub-advisory contracts. The Trustees’ review and conclusions are based on the comprehensive consideration of all information presented to them during the course of the year and in prior years and are not the result of any single determinative factor. Moreover, one Trustee may have weighed a particular piece of information or
factor differently than another Trustee. The information received and considered by the Board was current as of various dates prior to the Board’s approval on June 13, 2023.
Factors and Conclusions and Summary of Independent Written Fee Evaluation
| A. | Nature, Extent and Quality of Services Provided by Invesco Advisers and the Affiliated Sub-Advisers |
The Board reviewed the nature, extent and quality of the advisory services provided to the Fund by Invesco Advisers under the Fund’s investment advisory agreement, and the credentials and experience of the officers and employees of Invesco Advisers who provide these services, including the Fund’s portfolio manager(s). The Board considered recent senior management changes at Invesco and Invesco Advisers, including the appointment of new Co-Heads of Investments, that had been presented to and discussed with the Board. The Board’s review included consideration of Invesco Advisers’ investment process and oversight, credit analysis and research capabilities. The Board considered information regarding Invesco Advisers’ programs for and resources devoted to risk management, including management of investment, enterprise, operational, liquidity, derivatives, valuation and compliance risks, and technology used to manage such risks. The Board noted an accounting matter that required that certain historical financial statements for the Fund be restated in 2020 and that certain shareholders be reimbursed for transactions made at incorrect net asset values, and considered the steps that Invesco Advisers took to remediate the matter, with such remediation steps concluding at the end of 2022. The Board received information regarding Invesco’s methodology for compensating its investment professionals and the incentives and accountability it creates, as well as how it impacts Invesco’s ability to attract and retain talent. The Board received a description of, and reports related to, Invesco Advisers’ global security program and business continuity plans and of its approach to data privacy and cybersecurity, including related testing. The Board also considered non-advisory services that Invesco Advisers and its affiliates provide to the Invesco Funds, such as various middle office and back office support functions, third party oversight, internal audit, valuation, portfolio trading and legal and compliance. The Board observed that Invesco Advisers’ systems preparedness and ongoing investment enabled Invesco Advisers to manage, operate and oversee the Invesco Funds with minimal impact or
27 Invesco SteelPath MLP Select 40 Fund
disruption through challenging environments. The Board reviewed and considered the benefits to shareholders of investing in a Fund that is part of the family of funds under the umbrella of Invesco Ltd., Invesco Advisers’ parent company, and noted Invesco Ltd.’s depth and experience in running an investment management business, as well as its commitment of financial and other resources to such business. The Board concluded that the nature, extent and quality of the services provided to the Fund by Invesco Advisers are appropriate and satisfactory.
The Board reviewed the services that may be provided to the Fund by the Affiliated Sub-Advisers under the sub-advisory contracts and the credentials and experience of the officers and employees of the Affiliated Sub-Advisers who provide these services. The Board noted the Affiliated Sub-Advisers’ expertise with respect to certain asset classes and that the Affiliated Sub-Advisers have offices and personnel that are located in financial centers around the world. As a result, the Board noted that the Affiliated Sub-Advisers can provide research and investment analysis on the markets and economies of various countries and territories in which the Fund may invest, make recommendations regarding securities and assist with portfolio trading. The Board concluded that the sub-advisory contracts may benefit the Fund and its shareholders by permitting Invesco Advisers to use the resources and talents of the Affiliated Sub-Advisers in managing the Fund. The Board concluded that the nature, extent and quality of the services that may be provided to the Fund by the Affiliated Sub-Advisers are appropriate and satisfactory.
| B. | Fund Investment Performance |
The Board considered Fund investment performance as a relevant factor in considering whether to approve the investment advisory agreement. The Board did not view Fund investment performance as a relevant factor in considering whether to approve the sub-advisory contracts for the Fund, as no Affiliated Sub-Adviser currently manages assets of the Fund.
The Board compared the Fund’s investment performance over multiple time periods ending December 31, 2022 to the performance of funds in the Broadridge performance universe and against the Alerian MLP Infrastructure Index (Index). The Board noted that performance of Class A shares of the Fund was in the third quintile of its performance universe for the one and three year periods and the second quintile for the five year period (the first quintile being the best performing funds and the fifth quintile being the worst performing funds). The Board noted that performance of Class A shares of the Fund was below the performance of the Index for the one year period, reasonably comparable to the
performance of the Index for the three year period and above the performance of the Index for the five year period. The Board acknowledged limitations regarding the Broadridge data, in particular that the Lipper category includes funds taxed as traditional mutual funds as well as those taxed as C-corporations (such as the Fund) and discussed how such taxation status can impact relative performance. The Board considered that the Fund was created in connection with Invesco Ltd.’s acquisition of OppenheimerFunds, Inc. and its subsidiaries (the “Transaction”) and that the Fund’s performance prior to the closing of the Transaction on May 24, 2019 is that of its predecessor fund. The Board recognized that the performance data reflects a snapshot in time as of a particular date and that selecting a different performance period could produce different results. The Board also reviewed more recent Fund performance as well as other performance metrics, which did not change its conclusions.
| C. | Advisory and Sub-Advisory Fees and Fund Expenses |
The Board compared the Fund’s contractual management fee rate to the contractual management fee rates of funds in the Fund’s Broadridge expense group. The Board noted that the contractual management fee rate for Class A shares of the Fund was below the median contractual management fee rate of funds in its expense group. The Board noted that the term “contractual management fee” for funds in the expense group may include both advisory and certain non-portfolio management administrative services fees, but that Broadridge is not able to provide information on a fund-by-fund basis as to what is included. The Board also reviewed the methodology used by Broadridge in calculating expense group information, which includes using each fund’s contractual management fee schedule (including any applicable breakpoints) as reported in the most recent prospectus or statement of additional information for each fund in the expense group. The Board also considered comparative information regarding the Fund’s total expense ratio and its various components.
The Board noted that Invesco Advisers has contractually agreed to waive fees and/or limit expenses of the Fund for the term disclosed in the Fund’s registration statement in an amount necessary to limit total annual operating expenses to a specified percentage of average daily net assets for each class of the Fund.
The Board noted that Invesco Advisers and the Affiliated Sub-Advisers do not manage other similarly managed mutual funds or client accounts.
The Board also considered the services that may be provided by the Affiliated Sub-Advisers pursuant to the sub-advisory
contracts, as well as the fees payable by Invesco Advisers to the Affiliated Sub-Advisers pursuant to the sub-advisory contracts.
| D. | Economies of Scale and Breakpoints |
The Board considered the extent to which there may be economies of scale in the provision of advisory services to the Fund and the Invesco Funds, and the extent to which such economies of scale are shared with the Fund and the Invesco Funds. The Board acknowledged the difficulty in calculating and measuring economies of scale at the individual fund level; noting that only indicative and estimated measures are available at the individual fund level and that such measures are subject to uncertainty. The Board considered that the Fund may benefit from economies of scale through contractual breakpoints in the Fund’s advisory fee schedule, which generally operate to reduce the Fund’s expense ratio as it grows in size. The Board noted that the Fund also shares in economies of scale through Invesco Advisers’ ability to negotiate lower fee arrangements with third party service providers. The Board noted that the Fund may also benefit from economies of scale through initial fee setting, fee waivers and expense reimbursements, as well as Invesco Advisers’ investment in its business, including investments in business infrastructure, technology and cybersecurity.
| E. | Profitability and Financial Resources |
The Board reviewed information from Invesco Advisers concerning the costs of the advisory and other services that Invesco Advisers and its affiliates provide to the Fund and the Invesco Funds and the profitability of Invesco Advisers and its affiliates in providing these services in the aggregate and on an individual fund-by-fund basis. The Board considered the methodology used for calculating profitability and the periodic review and enhancement of such methodology. The Board noted that Invesco Advisers continues to operate at a net profit from services Invesco Advisers and its affiliates provide to the Invesco Funds in the aggregate and to most Invesco Funds individually. The Board considered that profits to Invesco Advisers can vary significantly depending on the particular Invesco Fund, with some Invesco Funds showing indicative losses to Invesco Advisers and others showing indicative profits at healthy levels, and that Invesco Advisers’ support for and commitment to an Invesco Fund are not, however, solely dependent on the profits realized as to that Fund. The Board did not deem the level of profits realized by Invesco Advisers and its affiliates from providing such services to be excessive, given the nature, extent and quality of the services provided. The Board noted that Invesco Advisers provided information demonstrating that Invesco
28 Invesco SteelPath MLP Select 40 Fund
Advisers is financially sound and has the resources necessary to perform its obligations under the investment advisory agreement, and provided representations indicating that the Affiliated Sub-Advisers are financially sound and have the resources necessary to perform their obligations under the sub-advisory contracts. The Board noted the cyclical and competitive nature of the global asset management industry.
| F. | Collateral Benefits to Invesco Advisers and its Affiliates |
The Board considered various other benefits received by Invesco Advisers and its affiliates from the relationship with the Fund, including the fees received for providing administrative, transfer agency and distribution services to the Fund. The Board received comparative information regarding fees charged for these services, including information provided by Broadridge and other independent sources. The Board reviewed the performance of Invesco Advisers and its affiliates in providing these services and the organizational structure employed to provide these services. The Board noted that these services are provided to the Fund pursuant to written contracts that are reviewed and subject to approval on an annual basis by the Board based on its determination that the services are required for the operation of the Fund.
The Board considered the benefits realized by Invesco Advisers and the Affiliated Sub-Advisers as a result of portfolio brokerage transactions executed through “soft dollar” arrangements. The Board noted that soft dollar arrangements may result in the Fund bearing costs to purchase research that may be used by Invesco Advisers or the Affiliated Sub-Advisers with other clients and may reduce Invesco Advisers’ or the Affiliated Sub-Advisers’ expenses. The Board also considered that it receives from Invesco Advisers periodic reports that include a representation to the effect that these arrangements are consistent with regulatory requirements. The Board did not deem the soft dollar arrangements to be inappropriate.
The Board considered that the Fund’s uninvested cash and cash collateral from any securities lending arrangements may be invested in registered money market funds or, with regard to securities lending cash collateral, unregistered funds that comply with Rule 2a-7 (collectively referred to as “affiliated money market funds”) advised by Invesco Advisers. The Board considered information regarding the returns of the affiliated money market funds relative to comparable overnight investments, as well as the fees paid by the affiliated money market funds to Invesco Advisers and its affiliates. In this regard, the Board noted that Invesco Advisers receives advisory fees
from these affiliated money market funds attributable to the Fund’s investments. The Board also noted that Invesco Advisers has contractually agreed to waive through varying periods an amount equal to 100% of the net advisory fee Invesco Advisers receives from the affiliated money market funds with respect to the Fund’s investment in the affiliated money market funds of uninvested cash, but not cash collateral. The Board concluded that the advisory fees payable to Invesco Advisers from the Fund’s investment of cash collateral from any securities lending arrangements in the affiliated money market funds are for services that are not duplicative of services provided by Invesco Advisers to the Fund.
The Board considered that Invesco Advisers may serve as the Fund’s affiliated securities lending agent and evaluated the benefits realized by Invesco Advisers when serving in such role, including the compensation received. The Board considered Invesco Advisers’ securities lending platform and corporate governance structure for securities lending, including Invesco Advisers’ Securities Lending Governance Committee and its related responsibilities. The Board noted that to the extent the Fund utilizes Invesco Advisers as an affiliated securities lending agent, the Fund conducts its securities lending in accordance with, and in reliance upon, no-action letters issued by the SEC staff that provide guidance on how an affiliate may act as a direct agent lender and receive compensation for those services without obtaining exemptive relief. The Board considered information provided by Invesco Advisers related to the performance of Invesco Advisers as securities lending agent, including a summary of the securities lending services provided to the Fund by Invesco Advisers and the compensation paid to Invesco Advisers for such services, as well as any revenues generated for the Fund in connection with such securities lending activity and the allocation of such revenue between the Fund and Invesco Advisers.
The Board also received information about commissions that an affiliated broker may receive for executing certain trades for the Fund. Invesco Advisers and the Affiliated Sub-Advisers advised the Board of the benefits to the Fund of executing trades through the affiliated broker and that such trades were executed in compliance with rules under the federal securities laws and consistent with best execution obligations.
29 Invesco SteelPath MLP Select 40 Fund
Trustees and Officers
The address of each trustee and officer is AIM Investment Funds (Invesco Investment Funds) (the “Trust”), 11 Greenway Plaza, Houston, Texas 77046-1173. The trustees serve for the life of the Trust, subject to their earlier death, incapacitation, resignation, retirement or removal as more specifically provided in the Trust’s organizational documents. Each officer serves for a one year term or until their successors are elected and qualified. Column two below includes length of time served with predecessor entities, if any.
| | | | | | | | |
Name, Year of Birth and
Position(s)
Held with the Trust | | Trustee
and/or
Officer
Since | | Principal Occupation(s)
During Past 5 Years | | Number of
Funds in
Fund Complex
Overseen by
Trustee | | Other
Directorship(s)
Held by Trustee
During Past 5
Years |
| Interested Trustee | | | | | | | | |
Martin L. Flanagan1 – 1960
Trustee and Vice Chair | | 2007 | | Chairman Emeritus, Invesco Ltd.; Trustee and Vice Chair, The Invesco Funds;; and Member of Executive Board, SMU Cox School of Business Formerly: Executive Director, Chief Executive Officer and President, Invesco Ltd. (ultimate parent of Invesco and a global investment management firm); Vice Chair, Investment Company Institute; Advisor to the Board, Invesco Advisers, Inc. (formerly known as Invesco Institutional (N.A.), Inc.); Chairman and Chief Executive Officer, Invesco Advisers, Inc. (registered investment adviser); Director, Chairman, Chief Executive Officer and President, Invesco Holding Company (US), Inc. (formerly IVZ Inc.) (holding company), Invesco Group Services, Inc. (service provider) and Invesco North American Holdings, Inc. (holding company); Director, Chief Executive Officer and President, Invesco Holding Company Limited (parent of Invesco and a global investment management firm); Director, Invesco Ltd.; Chairman, Investment Company Institute and President, Co-Chief Executive Officer, Co-President, Chief Operating Officer and Chief Financial Officer, Franklin Resources, Inc. (global investment management organization) | | 169 | | None |
| 1 | Mr. Flanagan is considered an interested person (within the meaning of Section 2(a)(19) of the 1940 Act) of the Trust because he is an officer of the Adviser to the Trust, and an officer and a director of Invesco Ltd., ultimate parent of the Adviser. |
T-1 Invesco SteelPath MLP Select 40 Fund
Trustees and Officers—(continued)
| | | | | | | | |
Name, Year of Birth and
Position(s)
Held with the Trust | | Trustee
and/or
Officer
Since | | Principal Occupation(s)
During Past 5 Years | | Number of
Funds in
Fund Complex
Overseen by
Trustee | | Other
Directorship(s)
Held by Trustee During Past 5
Years |
| Independent Trustees | | | | | | | | |
Beth Ann Brown – 1968 Trustee (2019) and Chair (August 2022) | | 2019 | | Independent Consultant Formerly: Head of Intermediary Distribution, Managing Director, Strategic Relations, Managing Director, Head of National Accounts, Senior Vice President, National Account Manager and Senior Vice President, Key Account Manager, Columbia Management Investment Advisers LLC; Vice President, Key Account Manager, Liberty Funds Distributor, Inc.; and Trustee of certain Oppenheimer Funds | | 169 | | Director, Board of Directors of Caron Engineering Inc.; Advisor, Board of Advisors of Caron Engineering Inc.; President and Director, Acton Shapleigh Youth Conservation Corps (non-profit); Formerly: President and Director of Grahamtastic Connection (non-profit) |
Cynthia Hostetler –1962 Trustee | | 2017 | | Non-Executive Director and Trustee of a number of public and private business corporations Formerly: Director, Aberdeen Investment Funds (4 portfolios); Director, Artio Global Investment LLC (mutual fund complex); Director, Edgen Group, Inc. (specialized energy and infrastructure products distributor); Director, Genesee & Wyoming, Inc. (railroads): Head of Investment Funds and Private Equity, Overseas Private Investment Corporation; President, First Manhattan Bancorporation, Inc.; and Attorney, Simpson Thacher & Bartlett LLP | | 169 | | Resideo Technologies (smart home technology); Vulcan Materials Company (construction materials company); Trilinc Global Impact Fund; Textainer Group Holdings, (shipping container leasing company); Investment Company Institute (professional organization); and Independent Directors Council (professional organization) |
Eli Jones – 1961 Trustee | | 2016 | | Professor and Dean Emeritus, Mays Business School—Texas A&M University Formerly: Dean of Mays Business School—Texas A&M University; Professor and Dean, Walton College of Business, University of Arkansas and E.J. Ourso College of Business, Louisiana State University; and Director, Arvest Bank | | 169 | | Insperity, Inc. (formerly known as Administaff) (human resources provider); Board Member of the regional board, First Financial Bank Texas; and Board Member, First Financial Bankshares, Inc. Texas |
Elizabeth Krentzman – 1959 Trustee | | 2019 | | Formerly: Principal and Chief Regulatory Advisor for Asset Management Services and U.S. Mutual Fund Leader of Deloitte & Touche LLP; General Counsel of the Investment Company Institute (trade association); National Director of the Investment Management Regulatory Consulting Practice, Principal, Director and Senior Manager of Deloitte & Touche LLP; Assistant Director of the Division of Investment Management—Office of Disclosure and Investment Adviser Regulation of the U.S. Securities and Exchange Commission and various positions with the Division of Investment Management – Office of Regulatory Policy of the U.S. Securities and Exchange Commission; Associate at Ropes & Gray LLP; and Trustee of certain Oppenheimer Funds | | 169 | | Formerly: Member of the Cartica Funds Board of Directors (private investment funds); Trustee of the University of Florida National Board Foundation; and Member of the University of Florida Law Center Association, Inc. Board of Trustees, Audit Committee and Membership Committee |
Anthony J. LaCava, Jr. – 1956 Trustee | | 2019 | | Formerly: Director and Member of the Audit Committee, Blue Hills Bank (publicly traded financial institution) and Managing Partner, KPMG LLP | | 169 | | Blue Hills Bank; Member and Chairman, Bentley University, Business School Advisory Council; and Nominating Committee, KPMG LLP |
Prema Mathai-Davis – 1950 Trustee | | 2001 | | Retired Formerly: Co-Founder & Partner of Quantalytics Research, LLC, (a FinTech Investment Research Platform for the Self-Directed Investor); Trustee of YWCA Retirement Fund; CEO of YWCA of the USA; Board member of the NY Metropolitan Transportation Authority; Commissioner of the NYC Department of Aging; and Board member of Johns Hopkins Bioethics Institute | | 169 | | Member of Board of Positive Planet US (non-profit) and HealthCare Chaplaincy Network (non-profit) |
T-2 Invesco SteelPath MLP Select 40 Fund
Trustees and Officers—(continued)
| | | | | | | | |
Name, Year of Birth and
Position(s)
Held with the Trust | | Trustee
and/or
Officer
Since | | Principal Occupation(s)
During Past 5 Years | | Number of
Funds in
Fund Complex
Overseen by
Trustee | | Other
Directorship(s)
Held by Trustee During Past 5
Years |
| Independent Trustees—(continued) | | | | |
Joel W. Motley – 1952 Trustee | | 2019 | | Director of Office of Finance, Federal Home Loan Bank System; Managing Director of Carmona Motley Inc. (privately held financial advisor); Member of the Council on Foreign Relations and its Finance and Budget Committee; Chairman Emeritus of Board of Human Rights Watch and Member of its Investment Committee; Member of Investment Committee and Board of Historic Hudson Valley (non-profit cultural organization); Member of the Board, Blue Ocean Acquisition Corp; and Member of the Vestry and the Investment Committee of Trinity Church Wall Street Formerly: Managing Director of Public Capital Advisors, LLC (privately held financial advisor); Managing Director of Carmona Motley Hoffman, Inc. (privately held financial advisor); Trustee of certain Oppenheimer Funds; and Director of Columbia Equity Financial Corp. (privately held financial advisor) | | 169 | | Member of Board of Trust for Mutual Understanding (non-profit promoting the arts and environment); Member of Board of Greenwall Foundation (bioethics research foundation) and its Investment Committee; Member of Board of Friends of the LRC (non-profit legal advocacy); and Board Member and Investment Committee Member of Pulitzer Center for Crisis Reporting (non-profit journalism) |
Teresa M. Ressel – 1962 Trustee | | 2017 | | Non-executive director and trustee of a number of public and private business corporations Formerly: Chief Executive Officer, UBS Securities LLC (investment banking); Chief Operating Officer, UBS AG Americas (investment banking); Sr. Management Team Olayan America, The Olayan Group (international investor/commercial/industrial); and Assistant Secretary for Management & Budget and Designated Chief Financial Officer, U.S. Department of Treasury | | 169 | | None |
Robert C. Troccoli – 1949 Trustee | | 2016 | | Retired Formerly: Adjunct Professor, University of Denver – Daniels College of Business; and Managing Partner, KPMG LLP | | 169 | | None |
Daniel S. Vandivort –1954 Trustee | | 2019 | | President, Flyway Advisory Services LLC (consulting and property management) Formerly: President and Chief Investment Officer, previously Head of Fixed Income, Weiss Peck and Greer/Robeco Investment Management; Trustee and Chair, Weiss Peck and Greer Funds Board; and various capacities at CS First Boston including Head of Fixed Income at First Boston Asset Management. | | 169 | | Formerly: Trustee and Governance Chair, Oppenheimer Funds; Treasurer, Chairman of the Audit and Finance Committee, Huntington Disease Foundation of America. |
T-3 Invesco SteelPath MLP Select 40 Fund
Trustees and Officers—(continued)
| | | | | | | | |
Name, Year of Birth and
Position(s)
Held with the Trust | | Trustee
and/or
Officer
Since | | Principal Occupation(s)
During Past 5 Years | | Number of
Funds in
Fund Complex
Overseen by
Trustee | | Other
Directorship(s)
Held by Trustee During Past 5
Years |
| Officers | | | | | | | | |
Glenn Brightman – 1972 President and Principal Executive Officer | | 2023 | | Chief Operating Officer, Americas, Invesco Ltd.; President and Principal Executive Officer, The Invesco Funds. Formerly: Global Head of Finance, Invesco Ltd; Executive Vice President and Chief Financial Officer, Nuveen | | N/A | | N/A |
Melanie Ringold – 1975 Senior Vice President, Chief Legal Officer and Secretary | | 2023 | | Head of Legal of the Americas, Invesco Ltd.; Senior Vice President and Secretary, Invesco Advisers, Inc. (formerly known as Invesco Institutional (N.A.), Inc.) (registered investment adviser); Secretary, Invesco Distributors, Inc. (formerly known as Invesco AIM Distributors, Inc.); Secretary, Invesco Investment Services, Inc. (formerly known as Invesco AIM Investment Services, Inc.); Senior Vice President, Chief Legal Officer and Secretary, The Invesco Funds; Secretary, Invesco Investment Advisers LLC; Invesco Capital Markets, Inc.; Chief Legal Officer, Invesco Exchange-Traded Fund Trust, Invesco Exchange-Traded Fund Trust II, Invesco India Exchange-Traded Fund Trust, Invesco Actively Managed Exchange-Traded Fund Trust, Invesco Actively Managed Exchange-Traded Commodity Fund Trust and Invesco Exchange-Traded Self-Indexed Fund Trust; Secretary and Vice President, Harbourview Asset Management Corporation; Secretary and Senior Vice President, OppenheimerFunds, Inc. and Invesco Managed Accounts, LLC; Secretary and Senior Vice President, OFI SteelPath, Inc.; Secretary and Senior Vice President, Oppenheimer Acquisition Corp.; Secretary, SteelPath Funds Remediation LLC; and Secretary and Senior Vice President, Trinity Investment Management Corporation Formerly: Assistant Secretary, Invesco Distributors, Inc., Invesco Advisers, Inc., Invesco Investment Services, Inc., Invesco Capital Markets, Inc., Invesco Capital Management LLC and Invesco Investment Advisers LLC; and Assistant Secretary and Investment Vice President, Invesco Funds | | N/A | | N/A |
Andrew R. Schlossberg – 1974 Senior Vice President | | 2019 | | Chief Executive Officer, President and Executive Director, Invesco Ltd.; Senior Vice President, The Invesco Funds; and Trustee, Invesco Foundation, Inc. Formerly: Senior Vice President, Invesco Group Services, Inc. Director and Senior Vice President, Invesco Advisers, Inc. (formerly known as Invesco Institutional (N.A.), Inc.) (registered investment adviser); Director and Chairman, Invesco Investment Services, Inc. (formerly known as Invesco AIM Investment Services, Inc.) (registered transfer agent); Head of the Americas and Senior Managing Director, Invesco Ltd.; Director, Invesco Investment Advisers LLC (formerly known as Van Kampen Asset Management); Director, President and Chairman, Invesco Insurance Agency, Inc.; Director, Invesco UK Limited; Director and Chief Executive, Invesco Asset Management Limited and Invesco Fund Managers Limited; Assistant Vice President, The Invesco Funds; Senior Vice President, Invesco Advisers, Inc. (formerly known as Invesco Institutional (N.A.), Inc.) (registered investment adviser); Director and Chief Executive, Invesco Administration Services Limited and Invesco Global Investment Funds Limited; Director, Invesco Distributors, Inc.; Head of EMEA, Invesco Ltd.; President, Invesco Actively Managed Exchange-Traded Commodity Fund Trust, Invesco Actively Managed Exchange-Traded Fund Trust, Invesco Exchange-Traded Fund Trust, Invesco Exchange-Traded Fund Trust II and Invesco India Exchange-Traded Fund Trust; and Managing Director and Principal Executive Officer, Invesco Capital Management LLC | | N/A | | N/A |
T-4 Invesco SteelPath MLP Select 40 Fund
Trustees and Officers—(continued)
| | | | | | | | |
Name, Year of Birth and
Position(s)
Held with the Trust | | Trustee
and/or
Officer
Since | | Principal Occupation(s)
During Past 5 Years | | Number of
Funds in
Fund Complex
Overseen by
Trustee | | Other
Directorship(s)
Held by Trustee During Past 5
Years |
| Officers—(continued) | | | | | | | | |
John M. Zerr – 1962
Senior Vice President | | 2006 | | Chief Operating Officer of the Americas; Senior Vice President, Invesco Advisers, Inc. (formerly known as Invesco Institutional (N.A.), Inc.) (registered investment adviser); Senior Vice President, Invesco Distributors, Inc. (formerly known as Invesco AIM Distributors, Inc.); Director and Vice President, Invesco Investment Services, Inc. (formerly known as Invesco AIM Investment Services, Inc.) Senior Vice President, The Invesco Funds; Managing Director, Invesco Capital Management LLC; Senior Vice President, Invesco Capital Markets, Inc. (formerly known as Van Kampen Funds Inc.); Manager, Invesco Specialized Products, LLC; Member, Invesco Canada Funds Advisory Board; Director, President and Chief Executive Officer, Invesco Corporate Class Inc. (corporate mutual fund company); Director, Chairman, President and Chief Executive Officer, Invesco Canada Ltd. (formerly known as Invesco Trimark Ltd./Invesco Trimark Ltèe) (registered investment adviser and registered transfer agent); President, Invesco, Inc.; President, Invesco Global Direct Real Estate Feeder GP Ltd.; President, Invesco IP Holdings (Canada) Ltd; President, Invesco Global Direct Real Estate GP Ltd.; President, Invesco Financial Services Ltd./Services Financiers Invesco Ltée; and Director and Chairman, Invesco Trust Company Formerly: Manager, Invesco Indexing LLC; Director, Invesco Investment Advisers LLC (formerly known as Van Kampen Asset Management); President, Trimark Investments Ltd/Services Financiers Invesco Ltee; Director and Senior Vice President, Invesco Insurance Agency, Inc.; Director and Senior Vice President, Invesco Management Group, Inc. (formerly known as Invesco AIM Management Group, Inc.); Secretary and General Counsel, Invesco Management Group, Inc. (formerly known as Invesco AIM Management Group, Inc.); Secretary, Invesco Investment Services, Inc. (formerly known as Invesco AIM Investment Services, Inc.); Chief Legal Officer and Secretary, The Invesco Funds; Secretary and General Counsel, Invesco Investment Advisers LLC (formerly known as Van Kampen Asset Management); Secretary and General Counsel, Invesco Capital Markets, Inc. (formerly known as Van Kampen Funds Inc.); Chief Legal Officer, Invesco Exchange-Traded Fund Trust, Invesco Exchange-Traded Fund Trust II, Invesco India Exchange-Traded Fund Trust, Invesco Actively Managed Exchange-Traded Fund Trust, Invesco Actively Managed Exchange-Traded Commodity Fund Trust and Invesco Exchange-Traded Self-Indexed Fund Trust; Secretary, Invesco Indexing LLC; Director, Secretary, General Counsel and Senior Vice President, Van Kampen Exchange Corp.; Director, Vice President and Secretary, IVZ Distributors, Inc. (formerly known as INVESCO Distributors, Inc.); Director and Vice President, INVESCO Funds Group, Inc.; Director and Vice President, Van Kampen Advisors Inc.; Director, Vice President, Secretary and General Counsel, Van Kampen Investor Services Inc.; Director and Secretary, Invesco Distributors, Inc. (formerly known as Invesco AIM Distributors, Inc.); Director, Senior Vice President, General Counsel and Secretary, Invesco AIM Advisers, Inc. and Van Kampen Investments Inc.; Director, Vice President and Secretary, Fund Management Company; Director, Senior Vice President, Secretary, General Counsel and Vice President, Invesco AIM Capital Management, Inc.; and Chief Operating Officer and General Counsel, Liberty Ridge Capital, Inc. (an investment adviser) | | N/A | | N/A |
Tony Wong – 1973 Senior Vice President | | 2023 | | Senior Managing Director, Invesco Ltd.; Director, Chairman, Chief Executive Officer and President, Invesco Advisers, Inc.; Director and Chairman, Invesco Private Capital, Inc., INVESCO Private Capital Investments, Inc. and INVESCO Realty, Inc.; Director, Invesco Senior Secured Management, Inc.; President, Invesco Managed Accounts, LLC and SNW Asset Management Corporation; and Senior Vice President, The Invesco Funds Formerly: Assistant Vice President, The Invesco Funds; and Vice President, Invesco Advisers, Inc. | | N/A | | N/A |
| Stephanie C. Butcher – 1971 Senior Vice President | | 2023 | | Senior Managing Director, Invesco Ltd.; Senior Vice President, The Invesco Funds; Director and Chief Executive Officer, Invesco Asset Management Limited | | N/A | | N/A |
Adrien Deberghes – 1967 Principal Financial Officer, Treasurer and Senior Vice President | | 2020 | | Head of the Fund Office of the CFO and Fund Administration; Vice President, Invesco Advisers, Inc.; Principal Financial Officer, Treasurer and Senior Vice President, The Invesco Funds; and Vice President, Invesco Exchange-Traded Fund Trust, Invesco Exchange-Traded Fund Trust II, Invesco India Exchange-Traded Fund Trust, Invesco Actively Managed Exchange-Traded Fund Trust, Invesco Actively Managed Exchange-Traded Commodity Fund Trust and Invesco Exchange-Traded Self-Indexed Fund Trust Formerly: Vice President, The Invesco Funds; Senior Vice President and Treasurer, Fidelity Investments | | N/A | | N/A |
Crissie M. Wisdom – 1969 Anti-Money Laundering Compliance Officer | | 2013 | | Anti-Money Laundering and OFAC Compliance Officer for Invesco U.S. entities including: Invesco Advisers, Inc. and its affiliates, Invesco Capital Markets, Inc., Invesco Distributors, Inc., Invesco Investment Services, Inc., The Invesco Funds, Invesco Capital Management, LLC, Invesco Trust Company; and Fraud Prevention Manager for Invesco Investment Services, Inc. | | N/A | | N/A |
T-5 Invesco SteelPath MLP Select 40 Fund
Trustees and Officers—(continued)
| | | | | | | | |
Name, Year of Birth and
Position(s)
Held with the Trust | | Trustee
and/or
Officer
Since | | Principal Occupation(s)
During Past 5 Years | | Number of
Funds in
Fund Complex
Overseen by
Trustee | | Other
Directorship(s)
Held by Trustee During Past 5
Years |
| Officers—(continued) | | | | | | | | |
Todd F. Kuehl – 1969 Chief Compliance Officer and Senior Vice President | | 2020 | | Chief Compliance Officer, Invesco Advisers, Inc. (registered investment adviser); and Chief Compliance Officer and Senior Vice President, The Invesco Funds Formerly: Managing Director and Chief Compliance Officer, Legg Mason (Mutual Funds); Chief Compliance Officer, Legg Mason Private Portfolio Group (registered investment adviser) | | N/A | | N/A |
James Bordewick, Jr. – 1959 Senior Vice President and Senior Officer | | 2022 | | Senior Vice President and Senior Officer, The Invesco Funds Formerly: Chief Legal Officer, KingsCrowd, Inc. (research and analytical platform for investment in private capital markets); Chief Operating Officer and Head of Legal and Regulatory, Netcapital (private capital investment platform); Managing Director, General Counsel of asset management and Chief Compliance Officer for asset management and private banking, Bank of America Corporation; Chief Legal Officer, Columbia Funds and BofA Funds; Senior Vice President and Associate General Counsel, MFS Investment Management; Chief Legal Officer, MFS Funds; Associate, Ropes & Gray; and Associate, Gaston Snow & Ely Bartlett. | | N/A | | N/A |
The Statement of Additional Information of the Trust includes additional information about the Fund’s Trustees and is available upon request, without charge, by calling 1.800.959.4246. Please refer to the Fund’s Statement of Additional Information for information on the Fund’s sub-advisers.
Office of the Fund
11 Greenway Plaza
Houston, TX 77046-1173
Counsel to the Fund
Stradley Ronon Stevens & Young, LLP 2005 Market Street, Suite 2600 Philadelphia, PA 19103-7018
Investment Adviser
Invesco Advisers, Inc. 1331 Spring Street NW, Suite 2500 Atlanta, GA 30309
Counsel to the Independent Trustees
Sidley Austin
787 Seventh Avenue
New York, NY 10019
Distributor
Invesco Distributors, Inc. 11 Greenway Plaza Houston, TX 77046-1173
Transfer Agent
Invesco Investment Services, Inc. 11 Greenway Plaza, Houston, TX 77046-1173
Auditors
PricewaterhouseCoopers LLP 1000 Louisiana Street, Suite 5800
Houston, TX 77002-5021
Custodian
UMB Bank, n.a. 1010 Grand Boulevard Kansas City, MO 64106
T-6 Invesco SteelPath MLP Select 40 Fund

Go paperless with eDelivery
Visit invesco.com/edelivery to enjoy the convenience and security of anytime electronic access to your investment documents.
With eDelivery, you can elect to have any or all of the following materials delivered straight to your inbox to download, save and print from your own computer:
| • | | Fund reports and prospectuses |
Invesco mailing information
Send general correspondence to Invesco Investment Services, Inc., P.O. Box 219078, Kansas City, MO 64121-9078.
Important notice regarding delivery of security holder documents
To reduce Fund expenses, only one copy of most shareholder documents may be mailed to shareholders with multiple accounts at the same address (Householding). Mailing of your shareholder documents may be householded indefinitely unless you instruct us otherwise. If you do not want the mailing of these documents to be combined with those for other members of your household, please contact Invesco Investment Services, Inc. at 800 959 4246 or contact your financial institution. We will begin sending you individual copies for each account within 30 days after receiving your request.
Fund holdings and proxy voting information
The Fund provides a complete list of its portfolio holdings four times each year, at the end of each fiscal quarter. For the second and fourth quarters, the list appears, respectively, in the Fund’s semiannual and annual reports to shareholders. For the first and third quarters, the Fund files the list with the Securities and Exchange Commission (SEC) as an exhibit to its reports on Form N-PORT. The most recent list of portfolio holdings is available at invesco.com/completeqtrholdings. Shareholders can also look up the Fund’s Form N-PORT filings on the SEC website, sec.gov. The SEC file numbers for the Fund are shown below.
A description of the policies and procedures that the Fund uses to determine how to vote proxies relating to portfolio securities is available without charge, upon request, from our Client Services department at 800 959 4246, or at invesco.com/corporate/about-us/esg. The information is also available on the SEC website, sec.gov.
Information regarding how the Fund voted proxies related to its portfolio securities during the most recent 12-month period ended June 30 is available at invesco.com/proxysearch. This information is also available on the SEC website, sec.gov.
Invesco Advisers, Inc. is an investment adviser; it provides investment advisory services to individual and institutional clients and does not sell securities. Invesco Distributors, Inc. is the US distributor for Invesco Ltd.’s retail mutual funds, exchange-traded funds and institutional money market funds. Both are wholly owned, indirect subsidiaries of Invesco Ltd.
| | | | | | |
SEC file numbers: 811-05426 and 033-19338 | | Invesco Distributors, Inc. | | | O-SPMS40-AR-1 | |
(b) Not applicable.
ITEM 2. CODE OF ETHICS.
There were no amendments to the Code of Ethics (the “Code”) that applies to the Registrant’s Principal Executive Officer (“PEO”) and Principal Financial Officer (“PFO”) during the period covered by the report. The Registrant did not grant any waivers, including implicit waivers, from any provisions of the Code to the PEO or PFO during the period covered by this report.
ITEM 3. AUDIT COMMITTEE FINANCIAL EXPERT.
The Board of Trustees has determined that the Registrant has at least one audit committee financial expert serving on its Audit Committee. The Audit Committee financial experts are Cynthia Hostetler, Anthony J. LaCava, Jr., and Robert C. Troccoli. Cynthia Hostetler, Anthony J. LaCava, Jr., and Robert C. Troccoli are “independent” within the meaning of that term as used in Form N-CSR.
ITEM 4. PRINCIPAL ACCOUNTANT FEES AND SERVICES.
(a) to (d)
Fees Billed by PwC Related to the Registrant
PricewaterhouseCoopers LLP (“PwC”), the Registrant’s independent registered public accounting firm, billed the Registrant aggregate fees for services rendered to the Registrant for the last two fiscal years as shown in the following table. The Audit Committee pre-approved all audit and non-audit services provided to the Registrant.
| | | | | | | | |
| | |
| Fees Billed for
Services Rendered
to the Registrant for
fiscal year end 2023 |
| |
| Fees Billed for
Services Rendered
to the Registrant for
fiscal year end 2022 |
|
| | | | | | | | |
Audit Fees | | | $ 223,101 | | | | $ 153,491 | |
Audit-Related Fees | | | $ 0 | | | | $ 0 | |
Tax Fees(1) | | | $ 304,300 | | | | $ 314,700 | |
All Other Fees | | | $ 0 | | | | $ 0 | |
Total Fees | | | $ 527,401 | | | | $ 468,191 | |
| | (1) | Tax Fees for the fiscal years ended 2023 and 2022 includes fees billed for preparation of U.S. Tax Returns and Taxable Income calculations, including excise tax and year-to-date estimates for various book-to-tax differences. |
Fees Billed by PwC Related to Invesco and Affiliates
PwC billed Invesco Advisers, Inc. (“Invesco”), the Registrant’s investment adviser, and any entity controlling, controlled by or under common control with Invesco that provides ongoing services to the Registrant (“Affiliates”) aggregate fees for pre-approved non-audit services rendered to Invesco and Affiliates for the last two fiscal years as shown in the following table. The Audit Committee pre-approved all non-audit services provided to Invesco and Affiliates that were required to be pre-approved.
| | | | |
| | | Fees Billed for Non- Audit Services Rendered to Invesco and Invesco Affiliates for fiscal year end 2023 That Were Required to be Pre-Approved by the Registrant’s Audit Committee | | Fees Billed for Non-Audit Services Rendered to Invesco and Invesco Affiliates for fiscal year end 2022 That Were Required to be Pre-Approved by the Registrant’s Audit Committee |
Audit-Related Fees(1) | | $ 1,067,000 | | $ 760,000 |
Tax Fees | | $ 0 | | $ 0 |
All Other Fees | | $ 0 | | $ 0 |
Total Fees | | $ 1,067,000 | | $ 760,000 |
(1) Audit-Related Fees for the fiscal years ended 2023 and 2022 include fees billed related to reviewing controls at a service organization.
(e)(1)
PRE-APPROVAL OF AUDIT AND NON-AUDIT SERVICES
POLICIES AND PROCEDURES
As adopted by the Audit Committees
of the Invesco Funds (the “Funds”)
Last Amended March 29, 2017
| | I. | Statement of Principles |
The Audit Committees (the “Audit Committee”) of the Boards of Trustees of the Funds (the “Board”) have adopted these policies and procedures (the “Procedures”) with respect to the pre-approval of audit and non-audit services to be provided by the Funds’ independent auditor (the “Auditor”) to the Funds, and to the Funds’ investment adviser(s) and any entity controlling, controlled by, or under common control with the investment adviser(s) that provides ongoing services to the Funds (collectively, “Service Affiliates”).
Under Section 202 of the Sarbanes-Oxley Act of 2002, all audit and non-audit services provided to the Funds by the Auditor must be preapproved by the Audit Committee. Rule 2-01 of Regulation S-X requires that the Audit Committee also pre-approve a Service Affiliate’s engagement of the Auditor for non-audit services if the engagement relates directly to the operations and financial reporting of the Funds (a “Service Affiliate’s Covered Engagement”).
These Procedures set forth the procedures and the conditions pursuant to which the Audit Committee may pre-approve audit and non-audit services for the Funds and a Service Affiliate’s Covered Engagement pursuant to rules and regulations of the Securities and Exchange Commission (“SEC”) and other
organizations and regulatory bodies applicable to the Funds (“Applicable Rules”).1 They address both general pre-approvals without consideration of specific case-by-case services (“general pre-approvals”) and pre-approvals on a case-by-case basis (“specific pre-approvals”). Any services requiring pre-approval that are not within the scope of general pre-approvals hereunder are subject to specific pre-approval. These Procedures also address the delegation by the Audit Committee of pre-approval authority to the Audit Committee Chair or Vice Chair.
| | II. | Pre-Approval of Fund Audit Services |
The annual Fund audit services engagement, including terms and fees, is subject to specific pre-approval by the Audit Committee. Audit services include the annual financial statement audit and other procedures required to be performed by an independent auditor to be able to form an opinion on the Funds’ financial statements. The Audit Committee will receive, review and consider sufficient information concerning a proposed Fund audit engagement to make a reasonable evaluation of the Auditor’s qualifications and independence. The Audit Committee will oversee the Fund audit services engagement as necessary, including approving any changes in terms, audit scope, conditions and fees.
In addition to approving the Fund audit services engagement at least annually and specifically approving any changes, the Audit Committee may generally or specifically pre-approve engagements for other audit services, which are those services that only an independent auditor reasonably can provide. Other audit services may include services associated with SEC registration statements, periodic reports and other documents filed with the SEC.
| | III. | General and Specific Pre-Approval of Non-Audit Fund Services |
The Audit Committee will consider, at least annually, the list of General Pre-Approved Non-Audit Services which list may be terminated or modified at any time by the Audit Committee. To inform the Audit Committee’s review and approval of General Pre-Approved Non-Audit Services, the Funds’ Treasurer (or his or her designee) and Auditor shall provide such information regarding independence or other matters as the Audit Committee may request.
Any services or fee ranges that are not within the scope of General Pre-Approved Non-Audit Services have not received general pre-approval and require specific pre-approval. Each request for specific pre-approval by the Audit Committee for services to be provided by the Auditor to the Funds must be submitted to the Audit Committee by the Funds’ Treasurer (or his or her designee) and must include detailed information about the services to be provided, the fees or fee ranges to be charged, and other relevant information sufficient to allow the Audit Committee to consider whether to pre-approve such engagement, including evaluating whether the provision of such services will impair the independence of the Auditor and is otherwise consistent with Applicable Rules.
| | IV. | Non-Audit Service Types |
The Audit Committee may provide either general or specific pre-approval of audit-related, tax or other services, each as described in more detail below.
| | (a) | Audit-Related Services |
1 Applicable Rules include, for example, New York Stock Exchange (“NYSE”) rules applicable to closed-end funds managed by Invesco and listed on NYSE.
“Audit-related services” are assurance and related services that are reasonably related to the performance of the audit or review of the Fund’s financial statements or that are traditionally performed by an independent auditor. Audit-related services include, among others, accounting consultations related to accounting, financial reporting or disclosure matters not classified as “Audit services”; assistance with understanding and implementing new accounting and financial reporting guidance from rulemaking authorities; services related to mergers, acquisitions or dispositions; compliance with ratings agency requirements and interfund lending activities; and assistance with internal control reporting requirements.
“Tax services” include, but are not limited to, the review and signing of the Funds’ federal tax returns, the review of required distributions by the Funds and consultations regarding tax matters such as the tax treatment of new investments or the impact of new regulations. The Audit Committee will not approve proposed services of the Auditor which the Audit Committee believes are to be provided in connection with a service or transaction initially recommended by the Auditor, the sole business purpose of which may be tax avoidance and the tax treatment of which may not be supported in the Internal Revenue Code and related regulations. The Audit Committee will consult with the Funds’ Treasurer (or his or her designee) and may consult with outside counsel or advisers as necessary to ensure the consistency of tax services rendered by the Auditor with the foregoing policy. The Auditor shall not represent any Fund or any Service Affiliate before a tax court, district court or federal court of claims.
Each request to provide tax services under either the general or specific pre-approval of the Audit Committee will include a description from the Auditor in writing of (i) the scope of the service, the fee structure for the engagement, and any side letter or other amendment to the engagement letter, or any other agreement (whether oral, written, or otherwise) between the Auditor and the Funds, relating to the service; and (ii) any compensation arrangement or other agreement, such as a referral agreement, a referral fee or fee-sharing arrangement, between the Auditor (or an affiliate of the Auditor) and any person (other than the Funds or Service Affiliates receiving the services) with respect to the promoting, marketing, or recommending of a transaction covered by the service. The Auditor will also discuss with the Audit Committee the potential effects of the services on the independence of the Auditor, and document the substance of its discussion with the Audit Committee.
The Audit Committee may pre-approve other non-audit services so long as the Audit Committee believes that the service will not impair the independence of the Auditor. Appendix I includes a list of services that the Auditor is prohibited from performing by the SEC rules. Appendix I also includes a list of services that would impair the Auditor’s independence unless the Audit Committee reasonably concludes that the results of the services will not be subject to audit procedures during an audit of the Funds’ financial statements.
| | V. | Pre-Approval of Service Affiliate’s Covered Engagements |
Rule 2-01 of Regulation S-X requires that the Audit Committee pre-approve a Service Affiliate’s engagement of the Auditor for non-audit services if the engagement relates directly to the operations and financial reporting of the Funds, defined above as a “Service Affiliate’s Covered Engagement”.
The Audit Committee may provide either general or specific pre-approval of any Service Affiliate’s Covered Engagement, including for audit-related, tax or other services, as described above, if the Audit Committee believes that the provision of the services to a Service Affiliate will not impair the independence of the Auditor with respect to the Funds. Any Service Affiliate’s Covered Engagements that are not within
the scope of General Pre-Approved Non-Audit Services have not received general pre-approval and require specific pre-approval.
Each request for specific pre-approval by the Audit Committee of a Service Affiliate’s Covered Engagement must be submitted to the Audit Committee by the Funds’ Treasurer (or his or her designee) and must include detailed information about the services to be provided, the fees or fee ranges to be charged, a description of the current status of the pre-approval process involving other audit committees in the Invesco investment company complex (as defined in Rule 2-201 of Regulation S-X) with respect to the proposed engagement, and other relevant information sufficient to allow the Audit Committee to consider whether the provision of such services will impair the independence of the Auditor from the Funds. Additionally, the Funds’ Treasurer (or his or her designee) and the Auditor will provide the Audit Committee with a statement that the proposed engagement requires pre-approval by the Audit Committee, the proposed engagement, in their view, will not impair the independence of the Auditor and is consistent with Applicable Rules, and the description of the proposed engagement provided to the Audit Committee is consistent with that presented to or approved by the Invesco audit committee.
Information about all Service Affiliate engagements of the Auditor for non-audit services, whether or not subject to pre-approval by the Audit Committee, shall be provided to the Audit Committee at least quarterly, to allow the Audit Committee to consider whether the provision of such services is compatible with maintaining the Auditor’s independence from the Funds. The Funds’ Treasurer and Auditor shall provide the Audit Committee with sufficiently detailed information about the scope of services provided and the fees for such services, to ensure that the Audit Committee can adequately consider whether the provision of such services is compatible with maintaining the Auditor’s independence from the Fund.
| | VI. | Pre-Approved Fee Levels or Established Amounts |
Pre-approved fee levels or ranges for audit and non-audit services to be provided by the Auditor to the Funds, and for a Service Affiliate’s Covered Engagement, under general pre-approval or specific pre-approval will be set periodically by the Audit Committee. Any proposed fees exceeding 110% of the maximum pre-approved fee levels or ranges for such services or engagements will be promptly presented to the Audit Committee and will require specific pre-approval by the Audit Committee before payment of any additional fees is made.
The Audit Committee hereby delegates, subject to the dollar limitations set forth below, specific authority to its Chair, or in his or her absence, Vice Chair, to pre-approve audit and non-audit services proposed to be provided by the Auditor to the Funds and/or a Service Affiliate’s Covered Engagement, between Audit Committee meetings. Such delegation does not preclude the Chair or Vice Chair from declining, on a case-by-case basis, to exercise his or her delegated authority and instead convening the Audit Committee to consider and pre-approve any proposed services or engagements.
Notwithstanding the foregoing, the Audit Committee must pre-approve: (a) any non-audit services to be provided to the Funds for which the fees are estimated to exceed $500,000; (b) any Service Affiliate’s Covered Engagement for which the fees are estimated to exceed $500,000; or (c) any cost increase to any previously approved service or engagement that exceeds the greater of $250,000 or 50% of the previously approved fees up to a maximum increase of $500,000.
| | VIII. | Compliance with Procedures |
Notwithstanding anything herein to the contrary, failure to pre-approve any services or engagements that are not required to be pre-approved pursuant to the de minimis exception provided for in Rule 2-01(c)(7)(i)(C) of Regulation S-X shall not constitute a violation of these Procedures. The Audit Committee has designated the Funds’ Treasurer to ensure services and engagements are pre-approved in compliance with these Procedures. The Funds’ Treasurer will immediately report to the Chair of the Audit Committee, or the Vice Chair in his or her absence, any breach of these Procedures that comes to the attention of the Funds’ Treasurer or any services or engagements that are not required to be pre-approved pursuant to the de minimis exception provided for in Rule 2-01(c)(7)(i)(C) of Regulation S-X.
On at least an annual basis, the Auditor will provide the Audit Committee with a summary of all non-audit services provided to any entity in the investment company complex (as defined in section 2-01(f)(14) of Regulation S-X, including the Funds and Service Affiliates) that were not pre-approved, including the nature of services provided and the associated fees.
| | IX. | Amendments to Procedures |
All material amendments to these Procedures must be approved in advance by the Audit Committee. Non-material amendments to these Procedures may be made by the Legal and Compliance Departments and will be reported to the Audit Committee at the next regularly scheduled meeting of the Audit Committee.
Appendix I
Non-Audit Services That May Impair the Auditor’s Independence
The Auditor is not independent if, at any point during the audit and professional engagement, the Auditor provides the following non-audit services:
| | • | | Broker-dealer, investment adviser, or investment banking services ; |
| | • | | Expert services unrelated to the audit; |
| | • | | Any service or product provided for a contingent fee or a commission; |
| | • | | Services related to marketing, planning, or opining in favor of the tax treatment of confidential transactions or aggressive tax position transactions, a significant purpose of which is tax avoidance; |
| | • | | Tax services for persons in financial reporting oversight roles at the Fund; and |
| | • | | Any other service that the Public Company Oversight Board determines by regulation is impermissible. |
An Auditor is not independent if, at any point during the audit and professional engagement, the Auditor provides the following non-audit services unless it is reasonable to conclude that the results of the services will not be subject to audit procedures during an audit of the Funds’ financial statements:
| | • | | Bookkeeping or other services related to the accounting records or financial statements of the audit client; |
| | • | | Financial information systems design and implementation; |
| | • | | Appraisal or valuation services, fairness opinions, or contribution-in-kind reports; |
| | • | | Actuarial services; and |
| | • | | Internal audit outsourcing services. |
(e)(2) There were no amounts that were pre-approved by the Audit Committee pursuant to the de minimis exception under Rule 2-01 of Regulation S-X.
(f) Not applicable.
(g) In addition to the amounts shown in the tables above, PwC billed Invesco and Invesco Affiliates aggregate fees of $6,507,000 for the fiscal year ended November 30, 2023 and $7,434,000 for the fiscal year ended November 30, 2022. In total, PwC billed the Registrant, Invesco and Invesco Affiliates aggregate non-audit fees of $7,878,300 for the fiscal year ended November 30, 2023 and $8,508,700 for the fiscal year ended November 30, 2022.
PwC provided audit services to the Investment Company complex of approximately $33 million.
(h) The Audit Committee also has considered whether the provision of non-audit services that were rendered to Invesco and Invesco Affiliates that were not required to be pre-approved pursuant to SEC regulations, if any, is compatible with maintaining PwC’s independence.
(i) Not applicable.
(j) Not applicable.
| ITEM 5. | AUDIT COMMITTEE OF LISTED REGISTRANTS. |
Not applicable.
| ITEM 6. | SCHEDULE OF INVESTMENTS. |
Investments in securities of unaffiliated issuers is included as part of the reports to stockholders filed under Item 1 of this Form.
| ITEM 7. | DISCLOSURE OF PROXY VOTING POLICIES AND PROCEDURES FOR CLOSED-END MANAGEMENT INVESTMENT COMPANIES. |
Not applicable.
| ITEM 8. | PORTFOLIO MANAGERS OF CLOSED-END MANAGEMENT COMPANIES. |
Not applicable.
| ITEM 9. | PURCHASES OF EQUITY SECURITIES BY CLOSED-END MANAGEMENT INVESTMENT COMPANY AND AFFILIATED PURCHASERS. |
Not applicable.
| ITEM 10. | SUBMISSION OF MATTERS TO A VOTE OF SECURITY HOLDERS. |
None.
| ITEM 11. | CONTROLS AND PROCEDURES. |
| | (d) | As of January 16, 2024, an evaluation was performed under the supervision and with the participation of the officers of the Registrant, including the PEO and PFO, to assess the effectiveness of the Registrant’s disclosure controls and procedures, as that term is defined in Rule 30a-3(c) under the Investment Company Act of 1940 (the “Act”), as amended. Based on that evaluation, the Registrant’s officers, including the PEO and PFO, concluded that, as of January 16, 2024, the Registrant’s disclosure controls and procedures were reasonably designed to ensure: (1) that information required to be disclosed by the Registrant on Form N-CSR is recorded, processed, summarized and reported within the time periods specified by the rules and forms of the Securities and Exchange Commission; and (2) that material information relating to the Registrant is made known to the PEO and PFO as appropriate to allow timely decisions regarding required disclosure. |
| | (e) | There have been no changes in the Registrant’s internal control over financial reporting (as defined in Rule 30a-3(d) under the Act) that occurred during the period covered by this report that have materially affected, or are reasonably likely to materially affect, the Registrant’s internal control over financial reporting. |
| ITEM 12. | DISCLOSURE OF SECURITIES LENDING ACTIVITIES FOR CLOSED-END MANAGEMENT INVESTMENT COMPANIES. |
Not applicable.
SIGNATURES
Pursuant to the requirements of the Securities Exchange Act of 1934 and the Investment Company Act of 1940, the Registrant has duly caused this report to be signed on its behalf by the undersigned, thereunto duly authorized.
Registrant: AIM Investment Funds (Invesco Investment Funds)
| | |
| By: | | /s/ Glenn Brightman |
| | Glenn Brightman |
| | Principal Executive Officer |
| |
Date: | | January 25, 2024 |
Pursuant to the requirements of the Securities and Exchange Act of 1934 and the Investment Company Act of 1940, this report has been signed below by the following persons on behalf of the Registrant and in the capacities and on the dates indicated.
| | |
| By: | | /s/ Glenn Brightman |
| | Glenn Brightman |
| | Principal Executive Officer |
| |
Date: | | January 25, 2024 |
| | |
| By: | | /s/ Adrien Deberghes |
| | Adrien Deberghes |
| | Principal Financial Officer |
| |
Date: | | January 25, 2024 |