UNITED STATES
SECURITIES AND EXCHANGE COMMISSION
Washington, D.C. 20549
FORM N-CSR
CERTIFIED SHAREHOLDER REPORT OF REGISTERED MANAGEMENT
INVESTMENT COMPANIES
Investment Company Act file number | 811- 5454 |
| |
| Dreyfus New Jersey Municipal Bond Fund, Inc. | |
| (Exact name of Registrant as specified in charter) | |
| | |
| c/o The Dreyfus Corporation 200 Park Avenue New York, New York 10166 | |
| (Address of principal executive offices) (Zip code) | |
| | |
| John Pak, Esq. 200 Park Avenue New York, New York 10166 | |
| (Name and address of agent for service) | |
|
Registrant's telephone number, including area code: | (212) 922-6000 |
| |
Date of fiscal year end: | 12/31 | |
Date of reporting period: | 12/31/14 | |
| | | | | | | |
FORM N-CSR
Item 1. Reports to Stockholders.
|
| Dreyfus |
| New Jersey Municipal |
| Bond Fund, Inc. |

Save time. Save paper. View your next shareholder report online as soon as it’s available. Log into www.dreyfus.com and sign up for Dreyfus eCommunications. It’s simple and only takes a few minutes.
The views expressed in this report reflect those of the portfolio manager only through the end of the period covered and do not necessarily represent the views of Dreyfus or any other person in the Dreyfus organization. Any such views are subject to change at any time based upon market or other conditions and Dreyfus disclaims any responsibility to update such views.These views may not be relied on as investment advice and, because investment decisions for a Dreyfus fund are based on numerous factors, may not be relied on as an indication of trading intent on behalf of any Dreyfus fund.
| | Contents |
| | THE FUND |
| 2 | A Letter from the President |
| 3 | Discussion of Fund Performance |
| 6 | Fund Performance |
| 8 | Understanding Your Fund’s Expenses |
| 8 | Comparing Your Fund’s Expenses With Those of Other Funds |
| 9 | Statement of Investments |
| 22 | Statement of Assets and Liabilities |
| 23 | Statement of Operations |
| 24 | Statement of Changes in Net Assets |
| 27 | Financial Highlights |
| 32 | Notes to Financial Statements |
| 43 | Report of Independent Registered Public Accounting Firm |
| 44 | Important Tax Information |
| 45 | Board Members Information |
| 47 | Officers of the Fund |
| | FOR MORE INFORMATION |
| | Back Cover |
Dreyfus
New Jersey Municipal
Bond Fund, Inc.
The Fund
A LETTER FROM THE PRESIDENT
Dear Shareholder:
We are pleased to present this annual report for Dreyfus New Jersey Municipal Bond Fund, covering the 12-month period from January 1, 2014, through December 31, 2014. For information about how the fund performed during the reporting period, as well as general market perspectives, we provide a Discussion of Fund Performance on the pages that follow.
Municipal bonds generally fared well during 2014 when supply-and-demand dynamics proved favorable and long-term interest rates fell unexpectedly in the midst of a sustained economic recovery. Although yields of 10-year U.S. Treasury securities had climbed to just over 3% by the beginning of the year, they ended 2014 at just 2.173%. Long-term municipal bond yields also were driven downward and prices higher by robust demand for a relatively limited supply of securities, particularly from investors seeking relatively safe havens in the midst of disappointing global growth and intensifying geopolitical conflicts.
Many economists appear to be optimistic about the prospects for 2015. Our own analysts agree and, in light of the ongoing benefits of low interest rates and depressed energy prices, see the potential for a somewhat faster pace of global growth in 2015 than in 2014. U.S. economic growth also seems poised to accelerate, largely due to the fading of drags from tight fiscal policies adopted in the wake of the Great Recession. Of course, stronger economic growth could create risks for fixed-income markets, including the possibility of higher short-term interest rates from the Federal Reserve Board.That’s why we urge you to talk regularly with your financial advisor about the potential impact of macroeconomic developments on your investments.
Thank you for your continued confidence and support.

J. Charles Cardona
President
The Dreyfus Corporation
January 15, 2015
2
DISCUSSION OF FUND PERFORMANCE
For the period of January 1, 2014, through December 31, 2014, as provided by Daniel Barton and Jeffrey Burger, Portfolio Managers
Fund and Market Performance Overview
For the 12-month period ended December 31, 2014, Dreyfus New Jersey Municipal Bond Fund’s Class A shares produced a total return of 10.11%, Class C shares returned 9.29%, Class I shares returned 10.38%, Class Y shares returned 10.37%, and Class Z shares returned 10.31%.1 In comparison, the Barclays Municipal Bond Index, the fund’s benchmark, achieved a total return of 9.05% for the same period.2
Municipal bonds rallied during 2014 amid moderating long-term interest rates and favorable supply-and-demand dynamics. The fund outperformed its benchmark, mainly due to its focus on longer maturities as interest rates fell.
The Fund’s Investment Approach
The fund seeks as high a level of current income exempt from federal and New Jersey state income taxes as is consistent with the preservation of capital.To pursue its goal the fund normally invests at least 80% of its assets in municipal bonds that provide income exempt from federal and New Jersey state income taxes. The fund invests at least 80% of its assets in investment-grade municipal bonds or the unrated equivalent as determined by Dreyfus.The fund may invest up to 20% of its assets in municipal bonds rated below investment grade (“high yield” or “junk” bonds) or the unrated equivalent as determined by Dreyfus.The dollar-weighted average maturity of the fund’s portfolio normally exceeds 10 years.
We focus on identifying undervalued sectors and securities and minimizing the use of interest rate forecasting. We select municipal bonds for the fund’s portfolio by using fundamental credit analysis to estimate the relative value and attractiveness of various sectors and securities, and to exploit pricing inefficiencies in the municipal bond market.We actively trade among various sectors, such as pre-refunded, general obligation and revenue, based on their apparent relative values. The fund seeks to invest in several of these sectors.
The Fund 3
DISCUSSION OF FUND PERFORMANCE (continued)
Economic and Technical Forces Buoyed Municipal Bonds
By the start of 2014, falling unemployment, intensifying manufacturing activity, and the Federal Reserve Board’s (the “Fed”) decision to gradually reduce its quantitative easing program drove long-term interest rates higher. However, economic and geopolitical concerns in the world’s emerging markets soon caused rates to moderate, and the Fed made clear that short-term interest rates were likely to remain near historically low levels. Meanwhile, harsh winter weather dampened domestic economic activity: U.S. GDP contracted at a 2.1% annualized rate over the first quarter of 2014.
The domestic downturn proved short-lived, as economic growth rebounded at a 4.6% annualized rate during the second quarter and an estimated 5.0% annualized rate over the third quarter. Labor markets continued to strengthen, and the Fed gradually tapered its bond purchases until the quantitative easing program ended in October.
While an improving economy typically sends long-term interest rates higher, low inflation and robust investor demand for a relatively limited supply of U.S.Treasury securities generally put downward pressure on rates throughout the year. Municipal bonds also benefited from favorable supply-and-demand dynamics, due to strong demand from individual investors for competitive levels of tax-exempt income. Meanwhile, the supply of newly issued municipal securities remained stable in 2014 compared to the previous year.
The economic rebound resulted in better underlying credit conditions for most states, but New Jersey’s fiscal condition has continued to struggle with unrealistic budget assumptions and public pension shortfalls.
Fund Strategies Produced Positive Results
The fund produced higher returns than its benchmark in this constructive market environment, as a relatively long average duration and a focus on longer maturities captured more of the benefits of falling long-term interest rates and narrowing yield differences along the market’s maturity spectrum. Our security selection strategy also proved effective, including overweighted exposure to higher yielding revenue-backed bonds. The fund achieved especially strong results from investment-grade bonds backed by revenues from hospitals, industrial business districts, and airports. Lower rated bonds from airlines and the state’s settlement of litigation with U.S. tobacco companies also fared well.
4
The fund encountered relatively few disappointments during 2014. Most notably, the fund’s holdings of higher quality revenue bonds backed by electric utilities and special tax districts gained less value than broad market averages.
Maintaining a Constructive Investment Posture
The U.S. economic recovery has gained momentum, but disappointing global growth has kept interest rates low. Meanwhile, municipal bond market fundamentals have remained strong in the recovering economy. Although the supply of newly issued municipal bonds recently began to increase, we expect any additional issuance to be absorbed by robust investor demand. In addition, municipal bonds historically have tended to be less sensitive than U.S. Treasury securities to rising interest rates. Therefore, we have maintained the fund’s generally constructive investment posture, including a focus on fundamentals, a bias toward higher quality securities, a relatively long average duration, and overweighted exposure to revenue bonds.
January 15, 2015
Bond funds are subject generally to interest rate, credit, liquidity, and market risks, to varying degrees, all of which are more fully described in the fund’s prospectus. Generally, all other factors being equal, bond prices are inversely related to interest-rate changes, and rate increases can cause price declines.
High yield bonds are subject to increased credit risk and are considered speculative in terms of the issuer’s perceived ability to continue making interest payments on a timely basis and to repay principal upon maturity.
|
| 1 Total return includes reinvestment of dividends and any capital gains paid and does not take into consideration the |
| maximum initial sales charge in the case of Class A shares or the applicable contingent deferred sales charge imposed on |
| redemptions in the case of Class C shares. Had these charges been reflected, returns would have been lower. Class I, |
| ClassY, and Class Z shares are not subject to any initial or deferred sales charge. Past performance is no guarantee of |
| future results. Share price, yield, and investment return fluctuate such that upon redemption, fund shares may be worth |
| more or less than their original cost. Income may be subject to state and local taxes for non-New Jersey residents, and |
| some income may be subject to the federal alternative minimum tax (AMT) for certain investors. Capital gains, if any, |
| are fully taxable. Return figures reflect the absorption of certain fund expenses pursuant to an agreement by The |
| Dreyfus Corporation which may be terminated after May 1, 2015. Had these expenses not been absorbed, the returns |
| would have been lower. |
| 2 SOURCE: LIPPER INC. — Reflects reinvestment of dividends and, where applicable, capital gain distributions. |
| The Barclays Municipal Bond Index is a widely accepted, unmanaged total return performance benchmark for the |
| long-term, investment-grade, tax-exempt bond market. Index returns do not reflect fees and expenses associated with |
| operating a mutual fund. Investors cannot invest directly in any index. |
The Fund 5
FUND PERFORMANCE
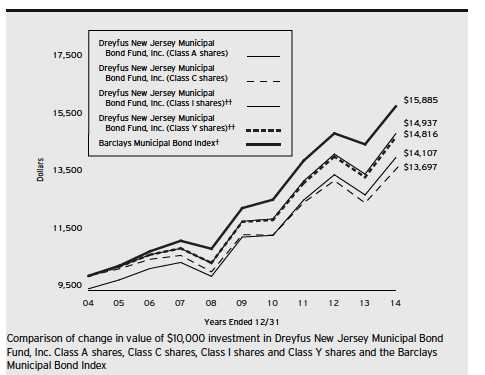
| |
| † | Source: Lipper Inc. |
| †† | The total return figures presented for Class I shares of the fund reflect the performance of the fund’s Class A shares |
| | for the period prior to 12/15/08 (the inception date for Class I shares), not reflecting the applicable sales charges for |
| | Class A shares. |
| | The total return figures presented for ClassY shares of the fund reflect the performance of the fund’s Class A shares |
| | for the period prior to 7/1/13 (the inception date for ClassY shares), not reflecting the applicable sales charges for |
| | Class A shares. |
Past performance is not predictive of future performance.
The above graph compares a $10,000 investment made in each of the Class A, Class C, Class I and Class Y shares of Dreyfus New Jersey Municipal Bond Fund, Inc. on 12/31/04 to a $10,000 investment made in the Barclays Municipal Bond Index (the “Index”) on that date. All dividends and capital gain distributions are reinvested.
The fund invests primarily in New Jersey municipal securities and its performance shown in the line graph above takes into account the maximum initial sales charge on Class A shares and all other applicable fees and expenses on all classes. Performance for Class Z shares will vary from the performance of Class A, Class C, Class I and Class Y shares shown above due to differences in charges and expenses.The Index is not limited to investments in New Jersey municipal obligations.The Index is an unmanaged total return performance benchmark for the long-term, investment-grade, geographically unrestricted tax-exempt bond market, calculated by using municipal bonds selected to be representative of the municipal market overall. Unlike a mutual fund, the Index is not subject to charges, fees and other expenses. Investors cannot invest directly in any index.These factors can contribute to the Index potentially outperforming or underperforming the fund. Further information relating to fund performance, including expense reimbursements, if applicable, is contained in the Financial Highlights section of the prospectus and elsewhere in this report.
6
| | | | | | | | | |
| Average Annual Total Returns as of 12/31/14 | | | | | | | |
| | Inception | | | | | | | From | |
| | Date | 1 | Year | 5 Years | | 10 Years | | Inception | |
| Class A shares | | | | | | | | | |
| with maximum sales charge (4.5%) | 11/6/87 | 5.14 | % | 3.49 | % | 3.50 | % | — | |
| without sales charge | 11/6/87 | 10.11 | % | 4.45 | % | 3.98 | % | — | |
| Class C shares | | | | | | | | | |
| with applicable redemption charge † | 1/7/03 | 8.29 | % | 3.69 | % | 3.20 | % | — | |
| without redemption | 1/7/03 | 9.29 | % | 3.69 | % | 3.20 | % | — | |
| Class I shares | 12/15/08 | 10.38 | % | 4.66 | % | 4.09 | %†† | — | |
| Class Y shares | 7/1/13 | 10.37 | % | 4.52 | %†† | 4.01 | %†† | — | |
| Class Z shares | 6/7/07 | 10.31 | % | 4.60 | % | — | | 4.41% | |
| Barclays Municipal | | | | | | | | | |
| Bond Index | 5/31/07 | 9.05 | % | 5.16 | % | 4.74 | % | 5.06%††† | |
Past performance is not predictive of future performance.The fund’s performance shown in the graph and table does not reflect the deduction of taxes that a shareholder would pay on fund distributions or the redemption of fund shares. In addition to the performance of Class A shares shown with and without a maximum sales charge, the fund’s performance shown in the table takes into account all other applicable fees and expenses on all classes.
| |
| † | The maximum contingent deferred sales charge for Class C shares is 1% for shares redeemed within one year of the |
| | date of purchase. |
| †† | The total return performance figures presented for Class I shares of the fund reflect the performance of the fund’s |
| | Class A shares for the period prior to 12/15/08 (the inception date for Class I shares), not reflecting the applicable |
| | sales charges for Class A shares. |
| | The total return performance figures presented for ClassY shares of the fund reflect the performance of the fund’s |
| | Class A shares for the period prior to 7/1/13 (the inception date for ClassY shares), not reflecting the applicable |
| | sales charges for Class A shares. |
| ††† | The Index date is based on the life of Class Z shares. For comparative purposes, the value of the Index as of |
| | 5/31/07 is used as the beginning value on 6/7/07 (the inception date for Class Z shares). |
The Fund 7
UNDERSTANDING YOUR FUND’S EXPENSES (Unaudited)
As a mutual fund investor, you pay ongoing expenses, such as management fees and other expenses. Using the information below, you can estimate how these expenses affect your investment and compare them with the expenses of other funds.You also may pay one-time transaction expenses, including sales charges (loads) and redemption fees, which are not shown in this section and would have resulted in higher total expenses. For more information, see your fund’s prospectus or talk to your financial adviser.
Review your fund’s expenses
The table below shows the expenses you would have paid on a $1,000 investment in Dreyfus New Jersey Municipal Bond Fund, Inc. from July 1, 2014 to December 31, 2014. It also shows how much a $1,000 investment would be worth at the close of the period, assuming actual returns and expenses.
Expenses and Value of a $1,000 Investment
assuming actual returns for the six months ended December 31, 2014
| | | | | | | | | | |
| | | Class A | | Class C | | Class I | | Class Y | | Class Z |
| Expenses paid per $1,000† | $ | 4.35 | $ | 8.17 | $ | 3.07 | $ | 3.58 | $ | 3.38 |
| Ending value (after expenses) | $ | 1,029.10 | $ | 1,025.20 | $ | 1,031.20 | $ | 1,030.90 | $ | 1,030.80 |
COMPARING YOUR FUND’S EXPENSES
WITH THOSE OF OTHER FUNDS (Unaudited)
Using the SEC’s method to compare expenses
The Securities and Exchange Commission (SEC) has established guidelines to help investors assess fund expenses. Per these guidelines, the table below shows your fund’s expenses based on a $1,000 investment, assuming a hypothetical 5% annualized return. You can use this information to compare the ongoing expenses (but not transaction expenses or total cost) of investing in the fund with those of other funds. All mutual fund shareholder reports will provide this information to help you make this comparison. Please note that you cannot use this information to estimate your actual ending account balance and expenses paid during the period.
Expenses and Value of a $1,000 Investment
assuming a hypothetical 5% annualized return for the six months ended December 31, 2014
| | | | | | | | | | |
| | | Class A | | Class C | | Class I | | Class Y | | Class Z |
| Expenses paid per $1,000† | $ | 4.33 | $ | 8.13 | $ | 3.06 | $ | 3.57 | $ | 3.36 |
| Ending value (after expenses) | $ | 1,020.92 | $ | 1,017.14 | $ | 1,022.18 | $ | 1,021.68 | $ | 1,021.88 |
|
| † Expenses are equal to the fund’s annualized expense ratio of .85% for Class A, 1.60% for Class C, .60% for |
| Class I, .70% for ClassY and .66% for Class Z, multiplied by the average account value over the period, multiplied |
| by 184/365 (to reflect the one-half year period). |
8
STATEMENT OF INVESTMENTS
December 31, 2014
| | | | | |
| Long-Term Municipal | Coupon | Maturity | Principal | | |
| Investments—98.8% | Rate (%) | Date | Amount ($) | | Value ($) |
| New Jersey—96.7% | | | | | |
| Burlington County Bridge | | | | | |
| Commission, EDR (The | | | | | |
| Evergreens Project) | 5.63 | 1/1/38 | 7,275,000 | | 7,496,160 |
| Camden County Improvement | | | | | |
| Authority, Health Care | | | | | |
| Redevelopment Project Revenue | | | | | |
| (The Cooper Health System | | | | | |
| Obligated Group Issue) | 5.00 | 2/15/34 | 1,000,000 | | 1,114,580 |
| Camden County Improvement | | | | | |
| Authority, Health Care | | | | | |
| Redevelopment Project Revenue | | | | | |
| (The Cooper Health System | | | | | |
| Obligated Group Issue) | 5.75 | 2/15/42 | 5,000,000 | | 5,777,700 |
| Camden County Improvement | | | | | |
| Authority, Health Care | | | | | |
| Redevelopment Project Revenue | | | | | |
| (The Cooper Health System | | | | | |
| Obligated Group Issue) | | | | | |
| (Prerefunded) | 5.25 | 2/15/15 | 4,545,000 | a | 4,571,861 |
| Camden County Improvement | | | | | |
| Authority, Health Care | | | | | |
| Redevelopment Project Revenue | | | | | |
| (The Cooper Health System | | | | | |
| Obligated Group Issue) | | | | | |
| (Prerefunded) | 5.25 | 2/15/15 | 2,000,000 | a | 2,011,820 |
| Delaware River Port Authority, | | | | | |
| Revenue | 5.00 | 1/1/30 | 3,500,000 | b | 3,942,715 |
| East Orange Board of Education, | | | | | |
| COP, LR (Insured; Assured | | | | | |
| Guaranty Municipal Corp.) | 0.00 | 2/1/21 | 685,000 | c | 588,668 |
| East Orange Board of Education, | | | | | |
| COP, LR (Insured; Assured | | | | | |
| Guaranty Municipal Corp.) | 0.00 | 2/1/26 | 745,000 | c | 513,692 |
| East Orange Board of Education, | | | | | |
| COP, LR (Insured; Assured | | | | | |
| Guaranty Municipal Corp.) | 0.00 | 2/1/28 | 2,345,000 | c | 1,414,738 |
The Fund 9
STATEMENT OF INVESTMENTS (continued)
| | | | | |
| Long-Term Municipal | Coupon | Maturity | Principal | | |
| Investments (continued) | Rate (%) | Date | Amount ($) | | Value ($) |
| New Jersey (continued) | | | | | |
| Essex County, | | | | | |
| General Improvement GO | 5.00 | 8/1/23 | 11,000,000 | | 13,003,760 |
| Garden State Preservation Trust, | | | | | |
| Revenue (Open Space and | | | | | |
| Farmland Preservation Bonds) | | | | | |
| (Insured; Assured Guaranty | | | | | |
| Municipal Corp.) | 5.75 | 11/1/28 | 10,000,000 | | 12,733,700 |
| Gloucester County Improvement | | | | | |
| Authority, County Guaranteed Loan | | | | | |
| Revenue (County Capital Program) | 5.00 | 4/1/38 | 7,000,000 | | 7,649,390 |
| Gloucester County Pollution | | | | | |
| Control Financing Authority, | | | | | |
| PCR (Logan Project) | 5.00 | 12/1/24 | 1,000,000 | | 1,128,230 |
| Gloucester Township Municipal | | | | | |
| Utilities Authority, Sewer | | | | | |
| Revenue (Insured; AMBAC) | 5.65 | 3/1/18 | 1,280,000 | | 1,367,488 |
| Hudson County Improvement | | | | | |
| Authority, Harrison Stadium | | | | | |
| Land Acquisition Special Obligation | | | | | |
| Revenue (Harrison Redevelopment | | | | | |
| Project) (Insured; National Public | | | | | |
| Finance Guarantee Corp.) | 0.00 | 12/15/34 | 3,000,000 | c | 1,374,450 |
| Irvington Township, | | | | | |
| GO (Fiscal Year Adjustment | | | | | |
| Bonds and General Improvement | | | | | |
| Bonds) (Insured; Assured | | | | | |
| Guaranty Municipal Corp.) | 5.00 | 7/15/32 | 2,000,000 | | 2,278,900 |
| Mercer County Improvement | | | | | |
| Authority, County Secured Open | | | | | |
| Space Revenue (Insured; | | | | | |
| National Public Finance | | | | | |
| Guarantee Corp.) | 5.00 | 8/1/40 | 3,290,000 | | 3,366,394 |
| Middletown Township Board of | | | | | |
| Education, GO | 5.00 | 8/1/25 | 4,140,000 | | 4,767,997 |
| Middletown Township Board of | | | | | |
| Education, GO | 5.00 | 8/1/26 | 2,935,000 | | 3,368,118 |
10
| | | | | |
| Long-Term Municipal | Coupon | Maturity | Principal | | |
| Investments (continued) | Rate (%) | Date | Amount ($) | | Value ($) |
| New Jersey (continued) | | | | | |
| New Jersey Economic Development | | | | | |
| Authority, Cigarette Tax Revenue | 5.00 | 6/15/24 | 3,000,000 | | 3,385,200 |
| New Jersey Economic Development | | | | | |
| Authority, Cigarette Tax Revenue | 5.00 | 6/15/28 | 3,625,000 | | 4,022,989 |
| New Jersey Economic Development | | | | | |
| Authority, Department of | | | | | |
| Human Services Composite | | | | | |
| Revenue (Division of | | | | | |
| Developmental Disabilities) | 6.25 | 7/1/24 | 1,010,000 | | 1,012,626 |
| New Jersey Economic Development | | | | | |
| Authority, Department of | | | | | |
| Human Services Composite | | | | | |
| Revenue (Division of | | | | | |
| Mental Health Services) | 6.10 | 7/1/17 | 575,000 | | 577,087 |
| New Jersey Economic Development | | | | | |
| Authority, Motor Vehicle | | | | | |
| Surcharge Revenue (Insured; | | | | | |
| National Public Finance | | | | | |
| Guarantee Corp.) | 0.00 | 7/1/20 | 3,350,000 | c | 2,907,901 |
| New Jersey Economic Development | | | | | |
| Authority, Motor Vehicle | | | | | |
| Surcharge Revenue (Insured; | | | | | |
| National Public Finance | | | | | |
| Guarantee Corp.) | 0.00 | 7/1/21 | 2,620,000 | c | 2,193,150 |
| New Jersey Economic Development | | | | | |
| Authority, Private Activity | | | | | |
| Revenue (The Goethals Bridge | | | | | |
| Replacement Project) | 5.38 | 1/1/43 | 3,500,000 | | 3,852,415 |
| New Jersey Economic Development | | | | | |
| Authority, Revenue (Hillcrest | | | | | |
| Health Service System Project) | | | | | |
| (Insured; AMBAC) | 0.00 | 1/1/17 | 5,000,000 | c | 4,803,950 |
| New Jersey Economic Development | | | | | |
| Authority, Revenue (Hillcrest | | | | | |
| Health Service System Project) | | | | | |
| (Insured; AMBAC) | 0.00 | 1/1/18 | 2,500,000 | c | 2,335,625 |
The Fund 11
STATEMENT OF INVESTMENTS (continued)
| | | | | |
| Long-Term Municipal | Coupon | Maturity | Principal | | |
| Investments (continued) | Rate (%) | Date | Amount ($) | | Value ($) |
| New Jersey (continued) | | | | | |
| New Jersey Economic Development | | | | | |
| Authority, Revenue (Hillcrest | | | | | |
| Health Service System Project) | | | | | |
| (Insured; AMBAC) | 0.00 | 1/1/20 | 6,500,000 | c | 5,650,775 |
| New Jersey Economic Development | | | | | |
| Authority, Revenue (Hillcrest | | | | | |
| Health Service System Project) | | | | | |
| (Insured; AMBAC) | 0.00 | 1/1/22 | 6,000,000 | c | 4,807,740 |
| New Jersey Economic Development | | | | | |
| Authority, School Facilities | | | | | |
| Construction Revenue | 5.75 | 9/1/23 | 3,765,000 | | 4,374,817 |
| New Jersey Economic Development | | | | | |
| Authority, School Facilities | | | | | |
| Construction Revenue | | | | | |
| (Insured; AMBAC) | 5.50 | 9/1/24 | 10,000,000 | | 11,970,800 |
| New Jersey Economic Development | | | | | |
| Authority, School Facilities | | | | | |
| Construction Revenue (Insured; | | | | | |
| National Public Finance | | | | | |
| Guarantee Corp.) | 5.50 | 9/1/27 | 10,000,000 | | 12,495,900 |
| New Jersey Economic Development | | | | | |
| Authority, Special Facility | | | | | |
| Revenue (Continental | | | | | |
| Airlines, Inc. Project) | 5.25 | 9/15/29 | 8,050,000 | b | 8,595,629 |
| New Jersey Economic Development | | | | | |
| Authority, Water Facilities | | | | | |
| Revenue (New Jersey—American | | | | | |
| Water Company, Inc. Project) | 5.10 | 6/1/23 | 3,000,000 | | 3,382,680 |
| New Jersey Economic Development | | | | | |
| Authority, Water Facilities | | | | | |
| Revenue (New Jersey—American | | | | | |
| Water Company, Inc. Project) | 5.60 | 11/1/34 | 6,600,000 | | 7,456,284 |
| New Jersey Economic Development | | | | | |
| Authority, Water Facilities | | | | | |
| Revenue (New Jersey—American | | | | | |
| Water Company, Inc. Project) | 5.70 | 10/1/39 | 5,000,000 | | 5,750,400 |
| New Jersey Educational Facilities | | | | | |
| Authority, Revenue (Fairleigh | | | | | |
| Dickenson University Issue) | 6.00 | 7/1/20 | 4,535,000 | | 4,553,276 |
12
| | | | |
| Long-Term Municipal | Coupon | Maturity | Principal | |
| Investments (continued) | Rate (%) | Date | Amount ($) | Value ($) |
| New Jersey (continued) | | | | |
| New Jersey Educational Facilities | | | | |
| Authority, Revenue (Kean | | | | |
| University Issue) | 5.00 | 9/1/21 | 1,500,000 | 1,695,705 |
| New Jersey Educational Facilities | | | | |
| Authority, Revenue (Montclair | | | | |
| State University Issue) | 5.25 | 7/1/38 | 2,000,000 | 2,211,920 |
| New Jersey Educational Facilities | | | | |
| Authority, Revenue | | | | |
| (New Jersey City University | | | | |
| Issue) (Insured; Assured | | | | |
| Guaranty Corp.) | 5.00 | 7/1/35 | 12,165,000 | 13,360,455 |
| New Jersey Educational Facilities | | | | |
| Authority, Revenue (New Jersey | | | | |
| Institute of Technology Issue) | 5.00 | 7/1/31 | 2,000,000 | 2,245,100 |
| New Jersey Educational Facilities | | | | |
| Authority, Revenue (Princeton | | | | |
| Theological Seminary Issue) | 5.00 | 7/1/29 | 5,000,000 | 5,835,700 |
| New Jersey Educational Facilities | | | | |
| Authority, Revenue (Public | | | | |
| Library Project Grant Program | | | | |
| Issue) (Insured; AMBAC) | 5.50 | 9/1/17 | 1,500,000 | 1,506,525 |
| New Jersey Educational Facilities | | | | |
| Authority, Revenue (Ramapo | | | | |
| College of New Jersey Issue) | 5.00 | 7/1/42 | 3,000,000 | 3,322,740 |
| New Jersey Educational Facilities | | | | |
| Authority, Revenue (Seton Hall | | | | |
| University Issue) | 6.25 | 7/1/37 | 5,000,000 | 5,791,150 |
| New Jersey Educational Facilities | | | | |
| Authority, Revenue (Stevens | | | | |
| Institute of Technology Issue) | 5.00 | 7/1/27 | 5,000,000 | 5,351,000 |
| New Jersey Educational Facilities | | | | |
| Authority, Revenue (Stevens | | | | |
| Institute of Technology Issue) | 5.00 | 7/1/34 | 7,455,000 | 7,975,210 |
| New Jersey Educational Facilities | | | | |
| Authority, Revenue (The | | | | |
| College of New Jersey Issue) | | | | |
| (Insured; Assured Guaranty | | | | |
| Municipal Corp.) | 5.00 | 7/1/35 | 5,000,000 | 5,509,150 |
The Fund 13
STATEMENT OF INVESTMENTS (continued)
| | | | |
| Long-Term Municipal | Coupon | Maturity | Principal | |
| Investments (continued) | Rate (%) | Date | Amount ($) | Value ($) |
| New Jersey (continued) | | | | |
| New Jersey Educational Facilities | | | | |
| Authority, Revenue (The | | | | |
| William Paterson University of | | | | |
| New Jersey Issue) | 5.00 | 7/1/22 | 2,165,000 | 2,568,101 |
| New Jersey Educational Facilities | | | | |
| Authority, Revenue (The | | | | |
| William Paterson University of | | | | |
| New Jersey Issue) (Insured; | | | | |
| Assured Guaranty Corp.) | 5.00 | 7/1/38 | 3,745,000 | 4,110,362 |
| New Jersey Health Care Facilities | | | | |
| Financing Authority, Revenue | | | | |
| (AHS Hospital Corporation Issue) | 5.00 | 7/1/27 | 5,400,000 | 5,969,106 |
| New Jersey Health Care Facilities | | | | |
| Financing Authority, Revenue | | | | |
| (AtlantiCare Regional Medical | | | | |
| Center Issue) | 5.00 | 7/1/22 | 3,975,000 | 4,287,157 |
| New Jersey Health Care Facilities | | | | |
| Financing Authority, Revenue | | | | |
| (Barnabas Health Issue) | 5.63 | 7/1/32 | 3,000,000 | 3,461,940 |
| New Jersey Health Care Facilities | | | | |
| Financing Authority, Revenue | | | | |
| (Barnabas Health Obligated | | | | |
| Group Issue) | 4.25 | 7/1/44 | 2,000,000 | 2,014,000 |
| New Jersey Health Care Facilities | | | | |
| Financing Authority, Revenue | | | | |
| (General Hospital Center at | | | | |
| Passaic, Inc. Obligated Group | | | | |
| Issue) (Insured; Assured | | | | |
| Guaranty Municipal Corp.) | | | | |
| (Escrowed to Maturity) | 6.75 | 7/1/19 | 550,000 | 629,046 |
| New Jersey Health Care Facilities | | | | |
| Financing Authority, Revenue | | | | |
| (Hackensack University Medical | | | | |
| Center Issue) | 5.00 | 1/1/28 | 2,780,000 | 3,010,851 |
| New Jersey Health Care Facilities | | | | |
| Financing Authority, Revenue | | | | |
| (Hackensack University Medical | | | | |
| Center Issue) (Insured; | | | | |
| Assured Guaranty Corp.) | 5.25 | 1/1/36 | 2,900,000 | 3,176,225 |
14
| | | | | |
| Long-Term Municipal | Coupon | Maturity | Principal | | |
| Investments (continued) | Rate (%) | Date | Amount ($) | | Value ($) |
| New Jersey (continued) | | | | | |
| New Jersey Health Care Facilities | | | | | |
| Financing Authority, Revenue | | | | | |
| (Holy Name Medical Center Issue) | 5.00 | 7/1/15 | 2,000,000 | | 2,047,040 |
| New Jersey Health Care Facilities | | | | | |
| Financing Authority, Revenue | | | | | |
| (Kennedy Health System | | | | | |
| Obligated Group Issue) | 5.00 | 7/1/31 | 1,525,000 | | 1,701,366 |
| New Jersey Health Care Facilities | | | | | |
| Financing Authority, Revenue | | | | | |
| (Meridian Health System | | | | | |
| Obligated Group Issue) | 5.00 | 7/1/23 | 2,500,000 | | 2,899,125 |
| New Jersey Health Care Facilities | | | | | |
| Financing Authority, Revenue | | | | | |
| (Meridian Health System | | | | | |
| Obligated Group Issue) | 5.00 | 7/1/26 | 1,000,000 | | 1,141,740 |
| New Jersey Health Care Facilities | | | | | |
| Financing Authority, Revenue | | | | | |
| (Meridian Health System | | | | | |
| Obligated Group Issue) | | | | | |
| (Insured; Assured Guaranty Corp.) | 5.00 | 7/1/38 | 4,775,000 | | 5,090,866 |
| New Jersey Health Care Facilities | | | | | |
| Financing Authority, Revenue | | | | | |
| (Robert Wood Johnson | | | | | |
| University Hospital Issue) | 5.00 | 7/1/31 | 4,950,000 | | 5,413,716 |
| New Jersey Health Care Facilities | | | | | |
| Financing Authority, Revenue | | | | | |
| (Saint Barnabas Health Care | | | | | |
| System Issue) (Insured; National | | | | | |
| Public Finance Guarantee Corp.) | | | | | |
| (Escrowed to Maturity) | 0.00 | 7/1/23 | 2,280,000 | c | 1,919,555 |
| New Jersey Health Care Facilities | | | | | |
| Financing Authority, Revenue | | | | | |
| (Virtua Health Issue) (Insured; | | | | | |
| Assured Guaranty Corp.) | 5.50 | 7/1/38 | 5,000,000 | | 5,568,200 |
| New Jersey Health Care Facilities | | | | | |
| Financing Authority, | | | | | |
| State Contract Revenue | | | | | |
| (Hospital Asset | | | | | |
| Transformation Program) | 5.25 | 10/1/38 | 13,595,000 | | 14,596,680 |
The Fund 15
STATEMENT OF INVESTMENTS (continued)
| | | | | |
| Long-Term Municipal | Coupon | Maturity | Principal | | |
| Investments (continued) | Rate (%) | Date | Amount ($) | | Value ($) |
| New Jersey (continued) | | | | | |
| New Jersey Higher Education | | | | | |
| Student Assistance Authority, | | | | | |
| Senior Student Loan Revenue | 5.00 | 12/1/21 | 1,800,000 | | 2,031,588 |
| New Jersey Higher Education | | | | | |
| Student Assistance Authority, | | | | | |
| Student Loan Revenue | 5.00 | 12/1/25 | 790,000 | | 835,172 |
| New Jersey Higher Education | | | | | |
| Student Assistance Authority, | | | | | |
| Student Loan Revenue | 5.00 | 12/1/26 | 1,910,000 | | 2,015,451 |
| New Jersey Highway Authority, | | | | | |
| Revenue (Garden State Parkway) | | | | | |
| (Escrowed to Maturity) | 6.00 | 1/1/19 | 5,645,000 | | 6,596,747 |
| New Jersey Housing and Mortgage | | | | | |
| Finance Agency, Multi-Family | | | | | |
| Revenue | 4.95 | 5/1/41 | 7,000,000 | | 7,210,140 |
| New Jersey Housing and Mortgage | | | | | |
| Finance Agency, SFHR | 5.20 | 10/1/25 | 4,840,000 | | 5,199,660 |
| New Jersey Housing and Mortgage | | | | | |
| Finance Agency, SFHR | 6.38 | 10/1/28 | 2,100,000 | | 2,185,638 |
| New Jersey Housing and Mortgage | | | | | |
| Finance Agency, SFHR | 5.25 | 10/1/37 | 420,000 | | 435,019 |
| New Jersey Institute of | | | | | |
| Technology, GO | 5.00 | 7/1/32 | 1,000,000 | | 1,150,450 |
| New Jersey Transportation Trust | | | | | |
| Fund Authority | | | | | |
| (Transportation System) | 5.50 | 12/15/23 | 7,000,000 | b | 8,297,940 |
| New Jersey Transportation Trust | | | | | |
| Fund Authority | | | | | |
| (Transportation System) | 5.50 | 6/15/31 | 2,500,000 | b | 2,908,100 |
| New Jersey Transportation Trust | | | | | |
| Fund Authority | | | | | |
| (Transportation System) | 6.00 | 12/15/38 | 6,565,000 | b | 7,616,385 |
| New Jersey Transportation Trust | | | | | |
| Fund Authority (Transportation | | | | | |
| System) (Insured; AMBAC) | 5.25 | 12/15/22 | 5,000,000 | b | 5,825,450 |
| New Jersey Transportation Trust | | | | | |
| Fund Authority (Transportation | | | | | |
| System) (Insured; AMBAC) | 0.00 | 12/15/24 | 1,000,000 | b,c | 689,650 |
16
| | | | | |
| Long-Term Municipal | Coupon | Maturity | Principal | | |
| Investments (continued) | Rate (%) | Date | Amount ($) | | Value ($) |
| New Jersey (continued) | | | | | |
| New Jersey Transportation | | | | | |
| Trust Fund Authority | | | | | |
| (Transportation System) | | | | | |
| (Insured; AMBAC) | 5.00 | 12/15/32 | 8,000,000 | b | 8,584,240 |
| New Jersey Transportation Trust | | | | | |
| Fund Authority (Transportation | | | | | |
| System) (Prerefunded) | 6.00 | 12/15/18 | 1,435,000 | a,b | 1,711,639 |
| New Jersey Turnpike Authority, | | | | | |
| Turnpike Revenue | 6.50 | 1/1/16 | 35,000 | b | 37,150 |
| New Jersey Turnpike Authority, | | | | | |
| Turnpike Revenue | 5.00 | 1/1/23 | 3,000,000 | b | 3,585,180 |
| New Jersey Turnpike Authority, | | | | | |
| Turnpike Revenue | 5.00 | 1/1/25 | 4,000,000 | b | 4,866,120 |
| New Jersey Turnpike Authority, | | | | | |
| Turnpike Revenue | 5.00 | 1/1/26 | 2,000,000 | b | 2,339,180 |
| New Jersey Turnpike Authority, | | | | | |
| Turnpike Revenue | 5.00 | 1/1/34 | 2,000,000 | b | 2,306,180 |
| New Jersey Turnpike Authority, | | | | | |
| Turnpike Revenue | 5.00 | 1/1/35 | 3,000,000 | b | 3,361,230 |
| New Jersey Turnpike Authority, | | | | | |
| Turnpike Revenue | 5.25 | 1/1/40 | 5,420,000 | b | 6,035,387 |
| New Jersey Turnpike Authority, | | | | | |
| Turnpike Revenue | | | | | |
| (Escrowed to Maturity) | 6.50 | 1/1/16 | 45,000 | b | 45,380 |
| New Jersey Turnpike Authority, | | | | | |
| Turnpike Revenue (Insured; | | | | | |
| Assured Guaranty Municipal Corp.) | 6.50 | 1/1/16 | 165,000 | b | 175,268 |
| New Jersey Turnpike Authority, | | | | | |
| Turnpike Revenue (Insured; | | | | | |
| Assured Guaranty Municipal Corp.) | 5.25 | 1/1/27 | 3,000,000 | b | 3,746,490 |
| New Jersey Turnpike Authority, | | | | | |
| Turnpike Revenue (Insured; | | | | | |
| National Public Finance | | | | | |
| Guarantee Corp.) | 6.50 | 1/1/16 | 2,310,000 | b | 2,451,926 |
| New Jersey Turnpike Authority, | | | | | |
| Turnpike Revenue (Insured; | | | | | |
| National Public Finance | | | | | |
| Guarantee Corp.) | 0.11 | 1/1/30 | 5,500,000 | b,d | 5,115,000 |
The Fund 17
STATEMENT OF INVESTMENTS (continued)
| | | | | |
| Long-Term Municipal | Coupon | Maturity | Principal | | |
| Investments (continued) | Rate (%) | Date | Amount ($) | | Value ($) |
| New Jersey (continued) | | | | | |
| North Hudson Sewerage Authority, | | | | | |
| Gross Revenue Senior Lien | | | | | |
| Lease Certificates (Master | | | | | |
| Lease Agreeement) | 5.00 | 6/1/24 | 1,000,000 | | 1,165,870 |
| North Hudson Sewerage Authority, | | | | | |
| Gross Revenue Senior Lien | | | | | |
| Lease Certificates (Master | | | | | |
| Lease Agreement) | 5.00 | 6/1/42 | 10,320,000 | | 11,397,718 |
| North Jersey District Water Supply | | | | | |
| Commission, Sewer Revenue | | | | | |
| (Wanaque South Project) | | | | | |
| (Insured; National Public | | | | | |
| Finance Guarantee Corp.) | | | | | |
| (Escrowed to Maturity) | 6.00 | 7/1/19 | 1,145,000 | | 1,280,156 |
| Port Authority of New York and New | | | | | |
| Jersey (Consolidated Bonds, | | | | | |
| 93rd Series) | 6.13 | 6/1/94 | 3,000,000 | b | 3,577,860 |
| Port Authority of New York and New | | | | | |
| Jersey (Consolidated Bonds, | | | | | |
| 139th Series) (Insured; | | | | | |
| National Public Finance | | | | | |
| Guarantee Corp.) | 5.00 | 10/1/18 | 11,235,000 | b | 11,479,698 |
| Port Authority of New York and New | | | | | |
| Jersey (Consolidated Bonds, | | | | | |
| 167th Series) | 5.00 | 9/15/24 | 3,675,000 | b | 4,186,009 |
| Port Authority of New York and New | | | | | |
| Jersey (Consolidated Bonds, | | | | | |
| 167th Series) | 5.50 | 9/15/26 | 7,600,000 | b | 8,818,660 |
| Port Authority of New York and New | | | | | |
| Jersey (Consolidated Bonds, | | | | | |
| 172nd Series) | 5.00 | 10/1/33 | 5,000,000 | b | 5,596,850 |
| Port Authority of New York and New | | | | | |
| Jersey (Consolidated Bonds, | | | | | |
| 178th Series) | 5.00 | 12/1/24 | 2,000,000 | b | 2,380,060 |
| Port Authority of New York and New | | | | | |
| Jersey, Special Project | | | | | |
| Revenue (JFK International Air | | | | | |
| Terminal LLC Project) | 5.00 | 12/1/20 | 2,500,000 | b | 2,885,400 |
18
| | | | | |
| Long-Term Municipal | Coupon | Maturity | Principal | | |
| Investments (continued) | Rate (%) | Date | Amount ($) | | Value ($) |
| New Jersey (continued) | | | | | |
| Port Authority of New York | | | | | |
| and New Jersey, | | | | | |
| Special Project Revenue | | | | | |
| (JFK International Air | | | | | |
| Terminal LLC Project) | | | | | |
| (Insured; National Public | | | | | |
| Finance Guarantee Corp.) | 6.25 | 12/1/15 | 5,000,000 | b | 5,160,100 |
| Rahway Valley Sewerage Authority, | | | | | |
| Sewer Revenue (Insured; | | | | | |
| National Public Finance | | | | | |
| Guarantee Corp.) | 0.00 | 9/1/30 | 7,550,000 | c | 4,225,056 |
| Rutgers, The State University, | | | | | |
| GO | 5.00 | 5/1/26 | 5,000,000 | | 5,998,100 |
| Rutgers, The State University, | | | | | |
| GO | 5.00 | 5/1/39 | 3,450,000 | | 3,879,836 |
| Salem County Pollution Control | | | | | |
| Financing Authority, PCR | | | | | |
| (Chambers Project) | 5.00 | 12/1/23 | 1,000,000 | | 1,129,620 |
| South Jersey Port Corporation, | | | | | |
| Marine Terminal Revenue | 5.75 | 1/1/23 | 4,000,000 | b | 4,624,760 |
| South Jersey Port Corporation, | | | | | |
| Marine Terminal Revenue | | | | | |
| (Insured; Assured Guaranty Corp.) | 5.75 | 1/1/34 | 2,900,000 | b | 3,263,109 |
| South Jersey Port Corporation, | | | | | |
| Marine Terminal Revenue | | | | | |
| (Insured; Assured Guaranty Corp.) | 5.88 | 1/1/39 | 6,000,000 | b | 6,779,700 |
| South Jersey Transportation | | | | | |
| Authority, Transportation | | | | | |
| System Revenue | 5.00 | 11/1/23 | 4,250,000 | b | 4,845,085 |
| Tobacco Settlement Financing | | | | | |
| Corporation of New Jersey, | | | | | |
| Tobacco Settlement | | | | | |
| Asset-Backed Bonds | 4.63 | 6/1/26 | 4,000,000 | | 3,717,240 |
| Tobacco Settlement Financing | | | | | |
| Corporation of New Jersey, | | | | | |
| Tobacco Settlement | | | | | |
| Asset-Backed Bonds | 4.75 | 6/1/34 | 2,800,000 | | 2,108,848 |
The Fund 19
STATEMENT OF INVESTMENTS (continued)
| | | | | |
| Long-Term Municipal | Coupon | Maturity | Principal | | |
| Investments (continued) | Rate (%) | Date | Amount ($) | | Value ($) |
| New Jersey (continued) | | | | | |
| Tobacco Settlement Financing | | | | | |
| Corporation of New Jersey, | | | | | |
| Tobacco Settlement | | | | | |
| Asset-Backed Bonds | 5.00 | 6/1/41 | 13,050,000 | | 9,907,299 |
| U.S. Related—2.1% | | | | | |
| Guam, | | | | | |
| Business Privilege Tax Revenue | 5.00 | 1/1/42 | 2,000,000 | | 2,181,580 |
| Guam Waterworks Authority, | | | | | |
| Water and Wastewater System | | | | | |
| Revenue (Prerefunded) | 6.00 | 7/1/15 | 1,000,000 | a | 1,028,330 |
| Virgin Islands Public Finance | | | | | |
| Authority, Revenue (Virgin | | | | | |
| Islands Matching Fund Loan Note) | 5.00 | 10/1/25 | 5,000,000 | | 5,612,750 |
| Virgin Islands Public Finance | | | | | |
| Authority, Revenue (Virgin | | | | | |
| Islands Matching Fund Loan Notes) | 5.00 | 10/1/25 | 2,000,000 | | 2,190,140 |
| |
| Total Investments (cost $470,186,323) | | 98.8 | % | 513,786,930 |
| Cash and Receivables (Net) | | | 1.2 | % | 6,481,763 |
| Net Assets | | | 100.0 | % | 520,268,693 |
|
| a These securities are prerefunded; the date shown represents the prerefunded date. Bonds which are prerefunded are |
| collateralized by U.S. Government securities which are held in escrow and are used to pay principal and interest on |
| the municipal issue and to retire the bonds in full at the earliest refunding date. |
| b At December 31, 2014, the fund had $145,833,530 or 28.0% of net assets invested in securities whose payment |
| of principal and interest is dependent upon revenues generated from transportation. |
| c Security issued with a zero coupon. Income is recognized through the accretion of discount. |
| d Variable rate security—interest rate subject to periodic change. |
| | | |
| Portfolio Summary (Unaudited)† | | |
| |
| | Value (%) | | Value (%) |
| Transportation Services | 28.0 | Housing | 2.9 |
| Education | 20.5 | County | 2.6 |
| Health Care | 17.9 | Industrial | 1.0 |
| Special Tax | 5.5 | Utility-Electric | .3 |
| Utility-Water and Sewer | 4.2 | Resource Recovery | .2 |
| Prerefunded | 3.5 | Other | 6.2 |
| Asset-Backed | 3.0 | | |
| Lease | 3.0 | | 98.8 |
20
| | | |
| Summary of Abbreviations | | |
| |
| ABAG | Association of Bay Area | ACA | American Capital Access |
| | Governments | | |
| AGC | ACE Guaranty Corporation | AGIC | Asset Guaranty Insurance Company |
| AMBAC | American Municipal Bond | ARRN | Adjustable Rate |
| | Assurance Corporation | | Receipt Notes |
| BAN | Bond Anticipation Notes | BPA | Bond Purchase Agreement |
| CIFG | CDC Ixis Financial Guaranty | COP | Certificate of Participation |
| CP | Commercial Paper | DRIVERS | Derivative Inverse |
| | | | Tax-Exempt Receipts |
| EDR | Economic Development | EIR | Environmental Improvement |
| | Revenue | | Revenue |
| FGIC | Financial Guaranty | FHA | Federal Housing |
| | Insurance Company | | Administration |
| FHLB | Federal Home | FHLMC | Federal Home Loan Mortgage |
| | Loan Bank | | Corporation |
| FNMA | Federal National | GAN | Grant Anticipation Notes |
| | Mortgage Association | | |
| GIC | Guaranteed Investment | GNMA | Government National Mortgage |
| | Contract | | Association |
| GO | General Obligation | HR | Hospital Revenue |
| IDB | Industrial Development Board | IDC | Industrial Development Corporation |
| IDR | Industrial Development | LIFERS | Long Inverse Floating |
| | Revenue | | Exempt Receipts |
| LOC | Letter of Credit | LOR | Limited Obligation Revenue |
| LR | Lease Revenue | MERLOTS | Municipal Exempt Receipts |
| | | | Liquidity Option Tender |
| MFHR | Multi-Family Housing Revenue | MFMR | Multi-Family Mortgage Revenue |
| PCR | Pollution Control Revenue | PILOT | Payment in Lieu of Taxes |
| P-FLOATS | Puttable Floating Option | PUTTERS | Puttable Tax-Exempt Receipts |
| | Tax-Exempt Receipts | | |
| RAC | Revenue Anticipation Certificates | RAN | Revenue Anticipation Notes |
| RAW | Revenue Anticipation Warrants | RIB | Residual Interest Bonds |
| ROCS | Reset Options Certificates | RRR | Resources Recovery Revenue |
| SAAN | State Aid Anticipation Notes | SBPA | Standby Bond Purchase Agreement |
| SFHR | Single Family Housing Revenue | SFMR | Single Family Mortgage Revenue |
| SONYMA | State of New York | SPEARS | Short Puttable Exempt |
| | Mortgage Agency | | Adjustable Receipts |
| SWDR | Solid Waste Disposal Revenue | TAN | Tax Anticipation Notes |
| TAW | Tax Anticipation Warrants | TRAN | Tax and Revenue Anticipation Notes |
| XLCA | XL Capital Assurance | | |
| |
| See notes to financial statements. | | |
The Fund 21
STATEMENT OF ASSETS AND LIABILITIES
December 31, 2014
| | | |
| | Cost | Value | |
| Assets ($): | | | |
| Investments in securities—See Statement of Investments | 470,186,323 | 513,786,930 | |
| Cash | | 28,690 | |
| Interest receivable | | 7,193,802 | |
| Receivable for shares of Common Stock subscribed | | 14,300 | |
| Prepaid expenses | | 39,585 | |
| | | 521,063,307 | |
| Liabilities ($): | | | |
| Due to The Dreyfus Corporation and affiliates—Note 3(c) | | 368,742 | |
| Payable for shares of Common Stock redeemed | | 342,477 | |
| Accrued expenses | | 83,395 | |
| | | 794,614 | |
| Net Assets ($) | | 520,268,693 | |
| Composition of Net Assets ($): | | | |
| Paid-in capital | | 493,652,808 | |
| Accumulated net realized gain (loss) on investments | | (16,984,722 | ) |
| Accumulated net unrealized appreciation | | | |
| (depreciation) on investments | | 43,600,607 | |
| Net Assets ($) | | 520,268,693 | |
| | | | | |
| Net Asset Value Per Share | | | | |
| | Class A | Class C | Class I | Class Y | Class Z |
| Net Assets ($) | 383,670,456 | 10,807,817 | 4,836,939 | 613,852 | 120,339,629 |
| Shares Outstanding | 29,416,543 | 829,404 | 370,740 | 47,056 | 9,224,665 |
| Net Asset Value | | | | | |
| Per Share ($) | 13.04 | 13.03 | 13.05 | 13.05 | 13.05 |
| |
| See notes to financial statements. | | | | |
22
STATEMENT OF OPERATIONS
Year Ended December 31, 2014
| | |
| Investment Income ($): | | |
| Interest Income | 22,986,320 | |
| Expenses: | | |
| Management fee—Note 3(a) | 3,106,730 | |
| Shareholder servicing costs—Note 3(c) | 1,253,148 | |
| Professional fees | 85,006 | |
| Distribution fees—Note 3(b) | 73,874 | |
| Registration fees | 69,064 | |
| Custodian fees—Note 3(c) | 42,439 | |
| Directors’ fees and expenses—Note 3(d) | 38,627 | |
| Prospectus and shareholders’ reports | 36,774 | |
| Loan commitment fees—Note 2 | 4,679 | |
| Interest and expense related to floating rate notes issued—Note 4 | 4,629 | |
| Miscellaneous | 45,286 | |
| Total Expenses | 4,760,256 | |
| Less—reduction in expenses due to undertaking—Note 3(a) | (511,095 | ) |
| Less—reduction in fees due to earnings credits—Note 3(c) | (373 | ) |
| Net Expenses | 4,248,788 | |
| Investment Income—Net | 18,737,532 | |
| Realized and Unrealized Gain (Loss) on Investments—Note 4 ($): | | |
| Net realized gain (loss) on investments | (8,749,621 | ) |
| Net unrealized appreciation (depreciation) on investments | 39,906,546 | |
| Net Realized and Unrealized Gain (Loss) on Investments | 31,156,925 | |
| Net Increase in Net Assets Resulting from Operations | 49,894,457 | |
| |
| See notes to financial statements. | | |
The Fund 23
STATEMENT OF CHANGES IN NET ASSETS
| | | | |
| | Year Ended December 31, | |
| | 2014 | | 2013 | |
| Operations ($): | | | | |
| Investment income—net | 18,737,532 | | 20,721,274 | |
| Net realized gain (loss) on investments | (8,749,621 | ) | 488,975 | |
| Net unrealized appreciation | | | | |
| (depreciation) on investments | 39,906,546 | | (51,330,960 | ) |
| Net Increase (Decrease) in Net Assets | | | | |
| Resulting from Operations | 49,894,457 | | (30,120,711 | ) |
| Dividends to Shareholders from ($): | | | | |
| Investment income—net: | | | | |
| Class A | (13,577,522 | ) | (15,176,674 | ) |
| Class C | (272,706 | ) | (280,957 | ) |
| Class I | (155,793 | ) | (160,301 | ) |
| Class Y | (3,803 | ) | (20 | ) |
| Class Z | (4,461,805 | ) | (4,853,058 | ) |
| Net realized gain on investments: | | | | |
| Class A | (84,446 | ) | (192,927 | ) |
| Class C | (2,064 | ) | (4,657 | ) |
| Class I | (894 | ) | (1,962 | ) |
| Class Z | (26,277 | ) | (59,327 | ) |
| Total Dividends | (18,585,310 | ) | (20,729,883 | ) |
| Capital Stock Transactions ($): | | | | |
| Net proceeds from shares sold: | | | | |
| Class A | 13,646,742 | | 18,885,725 | |
| Class C | 2,187,556 | | 2,313,143 | |
| Class I | 2,689,152 | | 1,125,868 | |
| Class Y | 609,416 | | 1,000 | |
| Class Z | 3,600,368 | | 4,609,952 | |
24
| | | | |
| | Year Ended December 31, | |
| | 2014 | | 2013 | |
| Capital Stock Transactions ($) (continued): | | | | |
| Dividends reinvested: | | | | |
| Class A | 10,399,320 | | 11,799,844 | |
| Class C | 129,642 | | 152,637 | |
| Class I | 130,273 | | 121,442 | |
| Class Y | 179 | | — | |
| Class Z | 3,674,335 | | 4,001,142 | |
| Cost of shares redeemed: | | | | |
| Class A | (41,647,160 | ) | (72,242,840 | ) |
| Class C | (1,079,336 | ) | (3,008,557 | ) |
| Class I | (1,658,087 | ) | (1,937,258 | ) |
| Class Z | (10,205,664 | ) | (20,370,190 | ) |
| Increase (Decrease) in Net Assets | | | | |
| from Capital Stock Transactions | (17,523,264 | ) | (54,548,092 | ) |
| Total Increase (Decrease) in Net Assets | 13,785,883 | | (105,398,686 | ) |
| Net Assets ($): | | | | |
| Beginning of Period | 506,482,810 | | 611,881,496 | |
| End of Period | 520,268,693 | | 506,482,810 | |
The Fund 25
STATEMENT OF CHANGES IN NET ASSETS (continued)
| | | | |
| | Year Ended December 31, | |
| | 2014 | | 2013 | |
| Capital Share Transactions: | | | | |
| Class Aa | | | | |
| Shares sold | 1,065,459 | | 1,439,918 | |
| Shares issued for dividends reinvested | 808,651 | | 919,520 | |
| Shares redeemed | (3,257,090 | ) | (5,671,478 | ) |
| Net Increase (Decrease) in Shares Outstanding | (1,382,980 | ) | (3,312,040 | ) |
| Class Ca | | | | |
| Shares sold | 170,033 | | 178,935 | |
| Shares issued for dividends reinvested | 10,092 | | 11,902 | |
| Shares redeemed | (84,446 | ) | (233,308 | ) |
| Net Increase (Decrease) in Shares Outstanding | 95,679 | | (42,471 | ) |
| Class Ib | | | | |
| Shares sold | 208,589 | | 84,834 | |
| Shares issued for dividends reinvested | 10,117 | | 9,466 | |
| Shares redeemed | (128,994 | ) | (150,631 | ) |
| Net Increase (Decrease) in Shares Outstanding | 89,712 | | (56,331 | ) |
| Class Yb | | | | |
| Shares sold | 46,964 | | 78.31 | |
| Shares issued for dividends reinvested | 14 | | — | |
| Net Increase (Decrease) in Shares Outstanding | 46,978 | | 78.31 | |
| Class Z | | | | |
| Shares sold | 280,190 | | 353,568 | |
| Shares issued for dividends reinvested | 285,623 | | 311,897 | |
| Shares redeemed | (795,245 | ) | (1,595,462 | ) |
| Net Increase (Decrease) in Shares Outstanding | (229,432 | ) | (929,997 | ) |
|
| a During the period ended December 31, 2013, 73,889 Class C shares representing $993,345, were exchanged for |
| 73,910 Class A shares. |
| b During the period ended December 31, 2014, 8,723 Class I shares representing $111,919, were exchanged for |
| 8,723 ClassY shares. |
See notes to financial statements.
26
FINANCIAL HIGHLIGHTS
The following tables describe the performance for each share class for the fiscal periods indicated. All information (except portfolio turnover rate) reflects financial results for a single fund share.Total return shows how much your investment in the fund would have increased (or decreased) during each period, assuming you had reinvested all dividends and distributions.These figures have been derived from the fund’s financial statements.
| | | | | | | | | | |
| | | | Year Ended December 31, | | | |
| Class A Shares | 2014 | | 2013 | | 2012 | | 2011 | | 2010 | |
| Per Share Data ($): | | | | | | | | | | |
| Net asset value, beginning of period | 12.27 | | 13.42 | | 13.01 | | 12.25 | | 12.70 | |
| Investment Operations: | | | | | | | | | | |
| Investment income—neta | .46 | | .47 | | .49 | | .53 | | .54 | |
| Net realized and unrealized | | | | | | | | | | |
| gain (loss) on investments | .76 | | (1.15 | ) | .41 | | .75 | | (.46 | ) |
| Total from Investment Operations | 1.22 | | (.68 | ) | .90 | | 1.28 | | .08 | |
| Distributions: | | | | | | | | | | |
| Dividends from investment income—net | (.45 | ) | (.46 | ) | (.49 | ) | (.52 | ) | (.53 | ) |
| Dividends from net realized | | | | | | | | | | |
| gain on investments | (.00 | )b | (.01 | ) | — | | — | | — | |
| Total Distributions | (.45 | ) | (.47 | ) | (.49 | ) | (.52 | ) | (.53 | ) |
| Net asset value, end of period | 13.04 | | 12.27 | | 13.42 | | 13.01 | | 12.25 | |
| Total Return (%)c | 10.11 | | (5.18 | ) | 6.96 | | 10.72 | | .56 | |
| Ratios/Supplemental Data (%): | | | | | | | | | | |
| Ratio of total expenses | | | | | | | | | | |
| to average net assets | .95 | | .94 | | .96 | | .96 | | .95 | |
| Ratio of net expenses | | | | | | | | | | |
| to average net assets | .85 | | .85 | | .85 | | .85 | | .85 | |
| Ratio of interest and expense related | | | | | | | | | | |
| to floating rate notes issued to | | | | | | | | | | |
| average net assets | .00 | d | .00 | d | — | | — | | — | |
| Ratio of net investment income | | | | | | | | | | |
| to average net assets | 3.59 | | 3.62 | | 3.68 | | 4.23 | | 4.22 | |
| Portfolio Turnover Rate | 10.18 | | 11.31 | | 12.10 | | 9.58 | | 18.88 | |
| Net Assets, end of period ($ x 1,000) | 383,670 | | 377,986 | | 457,618 | | 443,882 | | 435,549 | |
| |
| a | Based on average shares outstanding. |
| b | Amount represents less than $.01 per share. |
| c | Exclusive of sales charge. |
| d | Amount represents less than .01%. |
See notes to financial statements.
The Fund 27
FINANCIAL HIGHLIGHTS (continued)
| | | | | | | | | | |
| | | | Year Ended December 31, | | | |
| Class C Shares | 2014 | | 2013 | | 2012 | | 2011 | | 2010 | |
| Per Share Data ($): | | | | | | | | | | |
| Net asset value, beginning of period | 12.26 | | 13.40 | | 13.00 | | 12.24 | | 12.68 | |
| Investment Operations: | | | | | | | | | | |
| Investment income—neta | .36 | | .37 | | .39 | | .43 | | .45 | |
| Net realized and unrealized | | | | | | | | | | |
| gain (loss) on investments | .77 | | (1.13 | ) | .40 | | .76 | | (.45 | ) |
| Total from Investment Operations | 1.13 | | (.76 | ) | .79 | | 1.19 | | — | |
| Distributions: | | | | | | | | | | |
| Dividends from investment income—net | (.36 | ) | (.37 | ) | (.39 | ) | (.43 | ) | (.44 | ) |
| Dividends from net realized | | | | | | | | | | |
| gain on investments | (.00 | )b | (.01 | ) | — | | — | | — | |
| Total Distributions | (.36 | ) | (.38 | ) | (.39 | ) | (.43 | ) | (.44 | ) |
| Net asset value, end of period | 13.03 | | 12.26 | | 13.40 | | 13.00 | | 12.24 | |
| Total Return (%)c | 9.29 | | (5.82 | ) | 6.09 | | 9.90 | | (.13 | ) |
| Ratios/Supplemental Data (%): | | | | | | | | | | |
| Ratio of total expenses | | | | | | | | | | |
| to average net assets | 1.72 | | 1.72 | | 1.74 | | 1.73 | | 1.72 | |
| Ratio of net expenses | | | | | | | | | | |
| to average net assets | 1.60 | | 1.60 | | 1.60 | | 1.60 | | 1.60 | |
| Ratio of interest and expense related | | | | | | | | | | |
| to floating rate notes issued | | | | | | | | | | |
| to average net assets | .00 | d | .00 | d | — | | — | | — | |
| Ratio of net investment income | | | | | | | | | | |
| to average net assets | 2.82 | | 2.87 | | 2.92 | | 3.48 | | 3.45 | |
| Portfolio Turnover Rate | 10.18 | | 11.31 | | 12.10 | | 9.58 | | 18.88 | |
| Net Assets, end of period ($ x 1,000) | 10,808 | | 8,997 | | 10,403 | | 9,035 | | 9,080 | |
| |
| a | Based on average shares outstanding. |
| b | Amount represents less than $.01 per share. |
| c | Exclusive of sales charge. |
| d | Amount represents less than .01%. |
See notes to financial statements.
28
| | | | | | | | | | |
| | | | Year Ended December 31, | | | |
| Class I Shares | 2014 | | 2013 | | 2012 | | 2011 | | 2010 | |
| Per Share Data ($): | | | | | | | | | | |
| Net asset value, beginning of period | 12.28 | | 13.42 | | 13.02 | | 12.25 | | 12.70 | |
| Investment Operations: | | | | | | | | | | |
| Investment income—neta | .49 | | .50 | | .50 | | .54 | | .57 | |
| Net realized and unrealized | | | | | | | | | | |
| gain (loss) on investments | .77 | | (1.14 | ) | .41 | | .77 | | (.47 | ) |
| Total from Investment Operations | 1.26 | | (.64 | ) | .91 | | 1.31 | | .10 | |
| Distributions: | | | | | | | | | | |
| Dividends from investment income—net | (.49 | ) | (.49 | ) | (.51 | ) | (.54 | ) | (.55 | ) |
| Dividends from net realized | | | | | | | | | | |
| gain on investments | (.00 | )b | (.01 | ) | — | | — | | — | |
| Total Distributions | (.49 | ) | (.50 | ) | (.51 | ) | (.54 | ) | (.55 | ) |
| Net asset value, end of period | 13.05 | | 12.28 | | 13.42 | | 13.02 | | 12.25 | |
| Total Return (%) | 10.38 | | (4.88 | ) | 7.04 | | 10.97 | | .70 | |
| Ratios/Supplemental Data (%): | | | | | | | | | | |
| Ratio of total expenses | | | | | | | | | | |
| to average net assets | .72 | | .72 | | .74 | | .76 | | .72 | |
| Ratio of net expenses | | | | | | | | | | |
| to average net assets | .60 | | .62 | | .70 | | .70 | | .70 | |
| Ratio of interest and expense related | | | | | | | | | | |
| to floating rate notes issued | | | | | | | | | | |
| to average net assets | .00 | c | .00 | c | — | | — | | — | |
| Ratio of net investment income | | | | | | | | | | |
| to average net assets | 3.82 | | 3.84 | | 3.82 | | 4.36 | | 4.34 | |
| Portfolio Turnover Rate | 10.18 | | 11.31 | | 12.10 | | 9.58 | | 18.88 | |
| Net Assets, end of period ($ x 1,000) | 4,837 | | 3,450 | | 4,527 | | 2,586 | | 2,252 | |
| |
| a | Based on average shares outstanding. |
| b | Amount represents less than $.01 per share. |
| c | Amount represents less than .01%. |
See notes to financial statements.
The Fund 29
FINANCIAL HIGHLIGHTS (continued)
| | | | |
| | Year Ended December 31, | |
| Class Y Shares | 2014 | | 2013 | a |
| Per Share Data ($): | | | | |
| Net asset value, beginning of period | 12.27 | | 12.77 | |
| Investment Operations: | | | | |
| Investment income—netb | .38 | | .26 | |
| Net realized and unrealized | | | | |
| gain (loss) on investments | .87 | | (.51 | ) |
| Total from Investment Operations | 1.25 | | (.25 | ) |
| Distributions: | | | | |
| Dividends from investment income—net | (.47 | ) | (.25 | ) |
| Dividends from net realized gain on investments | (.00 | )c | — | |
| Total Distributions | (.47 | ) | (.25 | ) |
| Net asset value, end of period | 13.05 | | 12.27 | |
| Total Return (%) | 10.37 | | (1.96 | )d |
| Ratios/Supplemental Data (%): | | | | |
| Ratio of total expenses to average net assets | .76 | | .68 | e |
| Ratio of net expenses to average net assets | .63 | | .60 | e |
| Ratio of interest and expense related to | | | | |
| floating rate notes issued to average net assets | .00 | f | .00 | e,f |
| Ratio of net investment income to average net assets | 3.59 | | 4.11 | e |
| Portfolio Turnover Rate | 10.18 | | 11.31 | |
| Net Assets, end of period ($ x 1,000) | 614 | | 1 | |
| |
| a | From July 1, 2013 (commencement of initial offering) to December 31, 2013. |
| b | Based on average shares outstanding. |
| c | Amount represents less than $.01 per share. |
| d | Not annualized. |
| e | Annualized. |
| f | Amount represents less than .01%. |
See notes to financial statements.
30
| | | | | | | | | | |
| | | | Year Ended December 31, | | | |
| Class Z Shares | 2014 | | 2013 | | 2012 | | 2011 | | 2010 | |
| Per Share Data ($): | | | | | | | | | | |
| Net asset value, beginning of period | 12.28 | | 13.42 | | 13.01 | | 12.25 | | 12.70 | |
| Investment Operations: | | | | | | | | | | |
| Investment income—neta | .48 | | .49 | | .50 | | .54 | | .55 | |
| Net realized and unrealized | | | | | | | | | | |
| gain (loss) on investments | .77 | | (1.13 | ) | .41 | | .75 | | (.46 | ) |
| Total from Investment Operations | 1.25 | | (.64 | ) | .91 | | 1.29 | | .09 | |
| Distributions: | | | | | | | | | | |
| Dividends from investment income—net | (.48 | ) | (.49 | ) | (.50 | ) | (.53 | ) | (.54 | ) |
| Dividends from net realized | | | | | | | | | | |
| gain on investments | (.00 | )b | (.01 | ) | — | | — | | — | |
| Total Distributions | (.48 | ) | (.50 | ) | (.50 | ) | (.53 | ) | (.54 | ) |
| Net asset value, end of period | 13.05 | | 12.28 | | 13.42 | | 13.01 | | 12.25 | |
| Total Return (%) | 10.31 | | (4.93 | ) | 7.04 | | 10.80 | | .65 | |
| Ratios/Supplemental Data (%): | | | | | | | | | | |
| Ratio of total expenses | | | | | | | | | | |
| to average net assets | .77 | | .74 | | .78 | | .78 | | .77 | |
| Ratio of net expenses | | | | | | | | | | |
| to average net assets | .66 | | .67 | | .78 | | .78 | | .77 | |
| Ratio of interest and expense related | | | | | | | | | | |
| to floating rate notes issued | | | | | | | | | | |
| to average net assets | .00 | c | .00 | c | — | | — | | — | |
| Ratio of net investment income | | | | | | | | | | |
| to average net assets | 3.78 | | 3.80 | | 3.75 | | 4.30 | | 4.31 | |
| Portfolio Turnover Rate | 10.18 | | 11.31 | | 12.10 | | 9.58 | | 18.88 | |
| Net Assets, end of period ($ x 1,000) | 120,340 | | 116,050 | | 139,334 | | 137,552 | | 135,981 | |
| |
| a | Based on average shares outstanding. |
| b | Amount represents less than $.01 per share. |
| c | Amount represents less than .01%. |
See notes to financial statements.
The Fund 31
NOTES TO FINANCIAL STATEMENTS
NOTE 1—Significant Accounting Policies:
Dreyfus New Jersey Municipal Bond Fund, Inc. (the “fund”) is registered under the Investment Company Act of 1940, as amended (the “Act”), as a non-diversified open-end management investment company. The fund’s investment objective is to seek as high a level of current income exempt from federal and New Jersey income taxes as is consistent with the preservation of capital. The Dreyfus Corporation (the “Manager” or “Dreyfus”), a wholly-owned subsidiary of The Bank of New York Mellon Corporation (“BNY Mellon”), serves as the fund’s investment adviser.
MBSC Securities Corporation (the “Distributor”), a wholly-owned subsidiary of the Manager, is the distributor of the fund’s shares. The fund is authorized to issue 675 million shares of $.001 par value Common Stock. The fund currently offers five classes of shares: Class A (200 million shares authorized), Class C (150 million shares authorized), Class I (150 million shares authorized), Class Y (150 million shares authorized) and Class Z (25 million shares authorized). Class A shares generally are subject to a sales charge imposed at the time of purchase. Class C shares are subject to a contingent deferred sales charge (“CDSC”) imposed on Class C shares redeemed within one year of purchase. Class I and Class Y shares are sold at net asset value per share generally to institutional investors. Class Z shares generally are not available for new accounts. Other differences between the classes include the services offered to and the expenses borne by each class, the allocation of certain transfer agency costs, and certain voting rights. Income, expenses (other than expenses attributable to a specific class), and realized and unrealized gains or losses on investments are allocated to each class of shares based on its relative net assets.
The Financial Accounting Standards Board (“FASB”) Accounting Standards Codification (“ASC”) is the exclusive reference of authoritative U.S. generally accepted accounting principles (“GAAP”) recognized by the FASB to be applied by nongovernmental entities. Rules and interpretive releases of the Securities and Exchange Commission (“SEC”)
32
under authority of federal laws are also sources of authoritative GAAP for SEC registrants. The fund’s financial statements are prepared in accordance with GAAP, which may require the use of management estimates and assumptions. Actual results could differ from those estimates.
The fund enters into contracts that contain a variety of indemnifications. The fund’s maximum exposure under these arrangements is unknown.The fund does not anticipate recognizing any loss related to these arrangements.
(a) Portfolio valuation: The fair value of a financial instrument is the amount that would be received to sell an asset or paid to transfer a liability in an orderly transaction between market participants at the measurement date (i.e., the exit price). GAAP establishes a fair value hierarchy that prioritizes the inputs of valuation techniques used to measure fair value. This hierarchy gives the highest priority to unadjusted quoted prices in active markets for identical assets or liabilities (Level 1 measurements) and the lowest priority to unobservable inputs (Level 3 measurements).
Additionally, GAAP provides guidance on determining whether the volume and activity in a market has decreased significantly and whether such a decrease in activity results in transactions that are not orderly. GAAP requires enhanced disclosures around valuation inputs and techniques used during annual and interim periods.
Various inputs are used in determining the value of the fund’s investments relating to fair value measurements.These inputs are summarized in the three broad levels listed below:
Level 1—unadjusted quoted prices in active markets for identical investments.
Level 2—other significant observable inputs (including quoted prices for similar investments, interest rates, prepayment speeds, credit risk, etc.).
Level 3—significant unobservable inputs (including the fund’s own assumptions in determining the fair value of investments).
The Fund 33
NOTES TO FINANCIAL STATEMENTS (continued)
The inputs or methodology used for valuing securities are not necessarily an indication of the risk associated with investing in those securities.
Changes in valuation techniques may result in transfers in or out of an assigned level within the disclosure hierarchy. Valuation techniques used to value the fund’s investments are as follows:
Investments in securities are valued each business day by an independent pricing service (the “Service”) approved by the fund’s Board of Directors (the “Board”). Investments for which quoted bid prices are readily available and are representative of the bid side of the market in the judgment of the Service are valued at the mean between the quoted bid prices (as obtained by the Service from dealers in such securities) and asked prices (as calculated by the Service based upon its evaluation of the market for such securities). Other investments (which constitute a majority of the portfolio securities) are carried at fair value as determined by the Service, based on methods which include consideration of the following: yields or prices of municipal securities of comparable quality, coupon, maturity and type; indications as to values from dealers; and general market conditions. All of the preceding securities are generally categorized within Level 2 of the fair value hierarchy.
The Service’s procedures are reviewed by Dreyfus under the general supervision of the Board.
When market quotations or official closing prices are not readily available, or are determined not to reflect accurately fair value, such as when the value of a security has been significantly affected by events after the close of the exchange or market on which the security is principally traded, but before the fund calculates its net asset value, the fund may value these investments at fair value as determined in accordance with the procedures approved by the Board. Certain factors may be considered when fair valuing investments such as: fundamental analytical data, the nature and duration of restrictions on disposition, an evaluation of the forces that influence the market in which the securities are purchased and sold, and public trading in similar securities of the issuer or
34
comparable issuers.These securities are either categorized within Level 2 or 3 of the fair value hierarchy depending on the relevant inputs used.
For restricted securities where observable inputs are limited, assumptions about market activity and risk are used and are generally categorized within Level 3 of the fair value hierarchy.
The following is a summary of the inputs used as of December 31, 2014 in valuing the fund’s investments:
| | | | |
| | | Level 2—Other | Level 3— | |
| | Level 1— | Significant | Significant | |
| | Unadjusted | Observable | Unobservable | |
| | Quoted Prices | Inputs | Inputs | Total |
| Assets ($) | | | | |
| Investments in Securities: | | | |
| Municipal Bonds† | — | 513,786,930 | — | 513,786,930 |
| |
| † | See Statement of Investments for additional detailed categorizations. |
At December 31, 2014, there were no transfers between Level 1 and Level 2 of the fair value hierarchy.
(b) Securities transactions and investment income: Securities transactions are recorded on a trade date basis. Realized gains and losses from securities transactions are recorded on the identified cost basis. Interest income, adjusted for accretion of discount and amortization of premium on investments, is earned from settlement date and recognized on the accrual basis. Securities purchased or sold on a when issued or delayed delivery basis may be settled a month or more after the trade date.
The fund follows an investment policy of investing primarily in municipal obligations of one state. Economic changes affecting the state and certain of its public bodies or municipalities may affect the ability of issuers within the state to pay interest on, or repay principal of, municipal obligations held by the fund.
(c) Dividends to shareholders: It is the policy of the fund to declare dividends daily from investment income-net. Such dividends are paid monthly. Dividends from net realized capital gains, if any, are normally
The Fund 35
NOTES TO FINANCIAL STATEMENTS (continued)
declared and paid annually, but the fund may make distributions on a more frequent basis to comply with the distribution requirements of the Internal Revenue Code of 1986, as amended (the “Code”).To the extent that net realized capital gains can be offset by capital loss carryovers, it is the policy of the fund not to distribute such gains. Income and capital gain distributions are determined in accordance with income tax regulations, which may differ from GAAP.
(d) Federal income taxes: It is the policy of the fund to continue to qualify as a regulated investment company, which can distribute tax-exempt dividends, by complying with the applicable provisions of the Code, and to make distributions of income and net realized capital gains sufficient to relieve it from substantially all federal income and excise taxes.
As of and during the period ended December 31, 2014, the fund did not have any liabilities for any uncertain tax positions.The fund recognizes interest and penalties, if any, related to uncertain tax positions as income tax expense in the Statement of Operations. During the period ended December 31, 2014, the fund did not incur any interest or penalties.
Each tax year in the four-year period ended December 31, 2014 remains subject to examination by the Internal Revenue Service and state taxing authorities.
At December 31, 2014, the components of accumulated earnings on a tax basis were as follows: undistributed tax-exempt income $827,803, accumulated capital losses $17,709,204 and unrealized appreciation $44,325,089.
Under the Regulated Investment Company Modernization Act of 2010 (the “2010 Act”), the fund is permitted to carry forward capital losses incurred in taxable years beginning after December 22, 2010 (“post-enactment losses”) for an unlimited period. Furthermore, post-enactment capital loss carryovers retain their character as either short-term or long-term capital losses rather than short-term as they were under previous statute.The 2010 Act requires post-enactment losses to
36
be utilized before the utilization of losses incurred in taxable years prior to the effective date of the 2010 Act (“pre-enactment losses”).As a result of this ordering rule, pre-enactment losses may be more likely to expire unused.
The accumulated capital loss carryover is available for federal income tax purposes to be applied against future net realized capital gains, if any, realized subsequent to December 31, 2014. If not applied, $822,282 of the carryover expires in fiscal year 2015, $1,125,950 expires in fiscal year 2016 and $6,969,933 expires in fiscal year 2017. The fund has $953,557 of post-enactment short-term capital losses and $7,837,482 of post-enactment long-term capital losses which can be carried forward for an unlimited period.
The tax character of distributions paid to shareholders during the fiscal periods ended December 31, 2014 and December 31, 2013 were as follows: tax-exempt income $18,383,527 and $20,471,010, and ordinary income $201,783 and $258,873, respectively.
During the period ended December 31, 2014, as a result of permanent book to tax differences, primarily due to the tax treatment for amortization adjustments and capital loss carryover expiration, the fund decreased accumulated undistributed investment income-net by $265,903, increased accumulated net realized gain (loss) on investments by $256,349 and increased paid-in capital by $9,554. Net assets and net asset value per share were not affected by this reclassification.
NOTE 2—Bank Lines of Credit:
The fund participates with other Dreyfus-managed funds in a $430 million unsecured credit facility led by Citibank, N.A. and a $300 million unsecured credit facility provided by The Bank of New York Mellon, a subsidiary of BNY Mellon and an affiliate of Dreyfus (each, a “Facility”), each to be utilized primarily for temporary or emergency purposes, including the financing of redemptions. Prior to October 8, 2014, the unsecured credit facility with Citibank, N.A. was $265 mil-
The Fund 37
NOTES TO FINANCIAL STATEMENTS (continued)
lion. In connection therewith, the fund has agreed to pay its pro rata portion of commitment fees for each Facility. Interest is charged to the fund based on rates determined pursuant to the terms of the respective Facility at the time of borrowing. During the period ended December 31, 2014, the fund did not borrow under the Facilities.
NOTE 3—Management Fee and Other Transactions with Affiliates:
(a) Pursuant to a management agreement with the Manager, the management fee is computed at the annual rate of .60% of the value of the fund’s average daily net assets and is payable monthly.The Manager has contractually agreed, from January 1, 2014 through May 1, 2015, to waive receipt of its fees and/or assume the direct expenses of the fund, so that the expenses of none of the classes (excluding Rule 12b-1 Distribution Plan fees, Shareholder Services Plan fees, taxes, interest expense, brokerage commissions, commitment fees on borrowings and extraordinary expenses) exceed .60% of the value of the fund’s average daily net assets.The reduction in expenses, pursuant to the undertaking, amounted to $511,095 during the period ended December 31, 2014.
During the period ended December 31, 2014, the Distributor retained $3,074 from commissions earned on sales of the fund’s Class A shares and $418 from CDSCs on redemptions of the fund’s Class C shares.
(b) Under the Distribution Plan adopted pursuant to Rule 12b-1 under the Act, Class C shares pay the Distributor for distributing its shares at an annual rate of .75% of the value of its average daily net assets. During the period ended December 31, 2014, Class C shares were charged $73,874 pursuant to the Distribution Plan.
(c) Under the Shareholder Services Plan, Class A and Class C shares pay the Distributor at an annual rate of .25% of the value of their average daily net assets for the provision of certain services.The services provided may include personal services relating to shareholder accounts, such as answering shareholder inquiries regarding the fund and providing reports and other information, and services related to the maintenance of share-
38
holder accounts.The Distributor may make payments to Service Agents (securities dealers, financial institutions or other industry professionals) with respect to these services.The Distributor determines the amounts to be paid to Service Agents. During the period ended December 31, 2014, Class A and Class C shares were charged $959,778 and $24,625, respectively, pursuant to the Shareholder Services Plan.
Under the Shareholder Services Plan, Class Z shares reimburse the Distributor an amount not to exceed an annual rate of .25% of the value of Class Z shares’ average daily net assets for certain allocated expenses of providing personal services and/or maintaining shareholder accounts. The services provided may include personal services relating to shareholder accounts, such as answering shareholder inquiries regarding Class Z shares and providing reports and other information, and services related to the maintenance of shareholder accounts. During the period ended December 31, 2014, Class Z shares were charged $74,645 pursuant to the Shareholder Services Plan.
The fund has arrangements with the transfer agent and the custodian whereby the fund may receive earnings credits when positive cash balances are maintained, which are used to offset transfer agency and custody fees. For financial reporting purposes, the fund includes net earnings credits as an expense offset in the Statement of Operations.
The fund compensates Dreyfus Transfer, Inc., a wholly-owned subsidiary of the Manager, under a transfer agency agreement for providing transfer agency and cash management services for the fund. The majority of transfer agency fees are comprised of amounts paid on a per account basis, while cash management fees are related to fund subscriptions and redemptions. During the period ended December 31, 2014, the fund was charged $134,562 for transfer agency services and $6,398 for cash management services. These fees are included in Shareholder servicing costs in the Statement of Operations. Cash management fees were partially offset by earnings credits of $373.
The Fund 39
NOTES TO FINANCIAL STATEMENTS (continued)
The fund compensates The Bank of New York Mellon under a custody agreement for providing custodial services for the fund. These fees are determined based on net assets, geographic region and transaction activity. During the period ended December 31, 2014, the fund was charged $42,439 pursuant to the custody agreement.
The fund compensates The Bank of New York Mellon for performing certain cash management services related to fund subscriptions and redemptions, including shareholder redemption draft processing, under a cash management agreement. During the period ended December 31, 2014, the fund was charged $4,594 pursuant to the agreement, which is included in Shareholder servicing costs in the Statement of Operations.
During the period ended December 31, 2014, the fund was charged $7,771 for services performed by the Chief Compliance Officer and his staff.
The components of “Due to The Dreyfus Corporation and affiliates” in the Statement of Assets and Liabilities consist of: management fees $264,845, Distribution Plan fees $6,905, Shareholder Services Plan fees $89,434, custodian fees $20,746, Chief Compliance Officer fees $1,851 and transfer agency fees $24,247, which are offset against an expense reimbursement currently in effect in the amount of $39,286.
(d) Each Board member also serves as a Board member of other funds within the Dreyfus complex. Annual retainer fees and attendance fees are allocated to each fund based on net assets.
NOTE 4—Securities Transactions:
The aggregate amount of purchases and sales of investment securities, excluding short-term securities, during the period ended December 31, 2014, amounted to $51,854,910 and $68,046,839, respectively.
Inverse Floater Securities: The fund participates in secondary inverse floater structures in which fixed-rate, tax-exempt municipal bonds are transferred to a trust (the “Trust”).The Trust typically issues two variable rate securities that are collateralized by the cash flows of the fixed-rate,
40
tax-exempt municipal bonds. One of these variable rate securities pays interest based on a short-term floating rate set by a remarketing agent at predetermined intervals (“Trust Certificates”). A residual interest tax-exempt security is also created by the Trust, which is transferred to the fund, and is paid interest based on the remaining cash flows of the Trust, after payment of interest on the other securities and various expenses of the Trust.An inverse floater security may be collapsed without the consent of the fund due to certain termination events such as bankruptcy, default or other credit event.
The fund accounts for the transfer of bonds to the Trust as secured borrowings, with the securities transferred remaining in the fund’s investments, and the related floating rate certificate securities reflected as fund liabilities in the Statement of Assets and Liabilities.
The fund may invest in inverse floater securities on either a non-recourse or recourse basis. These securities are typically supported by a liquidity facility provided by a bank or other financial institution (the “Liquidity Provider”) that allows the holders of the Trust Certificates to tender their certificates in exchange for payment from the Liquidity Provider of par plus accrued interest on any business day prior to a termination event. When the fund invests in inverse floater securities on a non-recourse basis, the Liquidity Provider is required to make a payment under the liquidity facility due to a termination event to the holders of the Trust Certificates.When this occurs, the Liquidity Provider typically liquidates all or a portion of the municipal securities held in the Trust.A liquidation shortfall occurs if the Trust Certificates exceed the proceeds of the sale of the bonds in the Trust (“Liquidation Shortfall”).When a fund invests in inverse floater securities on a recourse basis, the fund typically enters into a reimbursement agreement with the Liquidity Provider where the fund is required to repay the Liquidity Provider the amount of any Liquidation Shortfall.As a result, a fund investing in a recourse inverse floater security bears the risk of loss with respect to any Liquidation Shortfall. At December 31, 2014, there were no floating rate notes outstanding.
The Fund 41
NOTES TO FINANCIAL STATEMENTS (continued)
The average amount of borrowings outstanding under the inverse floater structure during the period ended December 31, 2014, was approximately $333,300 with a related weighted average annualized interest rate of 1.39%.
At December 31, 2014, the cost of investments for federal income tax purposes was $469,461,841; accordingly, accumulated net unrealized appreciation on investments was $44,325,089, consisting of $44,941,478 gross unrealized appreciation and $616,389 gross unrealized depreciation.
42
REPORT OF INDEPENDENT REGISTERED
PUBLIC ACCOUNTING FIRM
Shareholders and Board of Directors
Dreyfus New Jersey Municipal Bond Fund, Inc.
We have audited the accompanying statement of assets and liabilities of Dreyfus New Jersey Municipal Bond Fund, Inc., including the statement of investments, as of December 31, 2014 and the related statement of operations for the year then ended, the statement of changes in net assets for each of the two years in the period then ended, and the financial highlights for each of the periods indicated therein.These financial statements and financial highlights are the responsibility of the Fund’s management. Our responsibility is to express an opinion on these financial statements and financial highlights based on our audits.
We conducted our audits in accordance with the standards of the Public Company Accounting Oversight Board (United States).Those standards require that we plan and perform the audit to obtain reasonable assurance about whether the financial statements and financial highlights are free of material misstatement. We were not engaged to perform an audit of the Fund’s internal control over financial reporting. Our audits included consideration of internal control over financial reporting as a basis for designing audit procedures that are appropriate in the circumstances, but not for the purpose of expressing an opinion on the effectiveness of the Fund’s internal control over financial reporting. Accordingly, we express no such opinion. An audit also includes examining, on a test basis, evidence supporting the amounts and disclosures in the financial statements and financial highlights, assessing the accounting principles used and significant estimates made by management, and evaluating the overall financial statement presentation. Our procedures included confirmation of securities owned as of December 31, 2014 by correspondence with the custodian and others.We believe that our audits provide a reasonable basis for our opinion.
In our opinion, the financial statements and financial highlights referred to above present fairly, in all material respects, the financial position of Dreyfus New Jersey Municipal Bond Fund, Inc. at December 31, 2014, the results of its operations for the year then ended, the changes in its net assets for each of the two years in the period then ended, and the financial highlights for each of the indicated periods, in conformity with U. S. generally accepted accounting principles.

New York, New York
February 26, 2015
The Fund 43
IMPORTANT TAX INFORMATION (Unaudited)
In accordance with federal tax law, the fund hereby reports all the dividends paid from investment income-net during the fiscal year ended December 31, 2014 as “exempt-interest dividends” (not subject to regular federal and, for individuals who are New Jersey residents, New Jersey personal income taxes), except $88,102 that is being reported as an ordinary income distribution for reporting purposes. Also, the fund hereby reports $.0028 per share as a short-term capital gain distribution paid on March 20, 2014.Where required by federal tax law rules, shareholders will receive notification of their portion of the fund’s taxable ordinary dividends (if any), capital gains distributions (if any) and tax-exempt dividends paid for the 2014 calendar year on Form 1099-DIV, which will be mailed in early 2015.
44
BOARD MEMBERS INFORMATION (Unaudited)
INDEPENDENT BOARD MEMBERS
|
| Joseph S. DiMartino (71) |
| Chairman of the Board (1995) |
| Principal Occupation During Past 5Years: |
| • Corporate Director and Trustee (1995-present) |
| Other Public Company Board Memberships During Past 5Years: |
| • CBIZ (formerly, Century Business Services, Inc.), a provider of outsourcing functions for small |
| and medium size companies, Director (1997-present) |
| • The Newark Group, a provider of a national market of paper recovery facilities, paperboard |
| mills and paperboard converting plants, Director (2000-2010) |
| • Sunair Services Corporation, a provider of certain outdoor-related services to homes and |
| businesses, Director (2005-2009) |
| No. of Portfolios for which Board Member Serves: 146 |
| ——————— |
| Peggy C. Davis (71) |
| Board Member (2006) |
| Principal Occupation During Past 5Years: |
| • Shad Professor of Law, New York University School of Law (1983-present) |
| No. of Portfolios for which Board Member Serves: 52 |
| ——————— |
| David P. Feldman (75) |
| Board Member (1994) |
| Principal Occupation During Past 5Years: |
| • Corporate Director and Trustee (1985-present) |
| Other Public Company Board Membership During Past 5Years: |
| • BBH Mutual Funds Group (5 registered mutual funds), Director (1992-present) |
| No. of Portfolios for which Board Member Serves: 38 |
| ——————— |
| Ehud Houminer (74) |
| Board Member (2006) |
| Principal Occupation During Past 5Years: |
| • Executive-in-Residence at the Columbia Business School, Columbia University (1992-present) |
| Other Public Company Board Membership During Past 5Years: |
| • Avnet, Inc., an electronics distributor, Director (1993-2012) |
| No. of Portfolios for which Board Member Serves: 62 |
The Fund 45
BOARD MEMBERS INFORMATION (Unaudited) (continued)
INDEPENDENT BOARD MEMBERS (continued)
|
| Lynn Martin (75) |
| Board Member (2012) |
| Principal Occupation During Past 5Years: |
| • President of The Martin Hall Group LLC, a human resources consulting firm (2005-2012) |
| Other Public Company Board Memberships During Past 5Years: |
| • AT&T, Inc., a telecommunications company, Director (1999-2012) |
| • Ryder System, Inc., a supply chain and transportation management company, Director (1993-2012) |
| • The Proctor & Gamble Co., a consumer products company, Director (1994-2009) |
| • Constellation Energy Group Inc., Director (2003-2009) |
| No. of Portfolios for which Board Member Serves: 38 |
| |
| ——————— |
| Robin A. Melvin (51) |
| Board Member (2012) |
| Principal Occupation During Past 5Years: |
| • Board Member, Illinois Mentoring Partnership, non-profit organization dedicated to increasing |
| the quantity and quality of mentoring services in Illinois (2013-present) |
| • Director, Boisi Family Foundation, a private family foundation that supports youth-serving orga- |
| nizations that promote the self sufficiency of youth from disadvantaged circumstances (1995-2012) |
| No. of Portfolios for which Board Member Serves: 114 |
| |
| ——————— |
| Dr. Martin Peretz (75) |
| Board Member (1990) |
| Principal Occupation During Past 5Years: |
| • Editor-in-Chief Emeritus of The New Republic Magazine (2010-2011) (previously, |
| Editor-in-Chief, 1974-2010) |
| • Director of TheStreet.com, a financial information service on the web (1996-2010) |
| No. of Portfolios for which Board Member Serves: 38 |
| |
| ——————— |
| Once elected all Board Members serve for an indefinite term, but achieve Emeritus status upon reaching age 80.The |
| address of the Board Members and Officers is c/o The Dreyfus Corporation, 200 Park Avenue, NewYork, NewYork |
| 10166.Additional information about the Board Members is available in the fund’s Statement of Additional Information |
| which can be obtained from Dreyfus free of charge by calling this toll free number: 1-800-DREYFUS. |
| James F. Henry, Emeritus Board Member |
| Rosalind G. Jacobs, Emeritus Board Member |
| Dr. Paul A. Marks, Emeritus Board Member |
| Daniel Rose, Emeritus Board Member |
| Philip L.Toia, Emeritus Board Member |
| Sander Vanocur, Emeritus Board Member |
46
OFFICERS OF THE FUND (Unaudited)
The Fund 47
OFFICERS OF THE FUND (Unaudited) (continued)
48
For More Information
Telephone Call your financial representative or 1-800-DREYFUS
Mail The Dreyfus Family of Funds, 144 Glenn Curtiss Boulevard, Uniondale, NY 11556-0144
The fund files its complete schedule of portfolio holdings with the Securities and Exchange Commission (“SEC”) for the first and third quarters of each fiscal year on Form N-Q. The fund's Forms N-Q are available on the SEC’s website at http://www.sec.gov and may be reviewed and copied at the SEC’s Public Reference Room in Washington, DC. Information on the operation of the Public Reference Room may be obtained by calling 1-800-SEC-0330.
Information regarding how the fund voted proxies relating to portfolio securities for the most recent 12-month period ended June 30 is available on the SEC’s website at http://www.sec.gov and without charge, upon request, by calling 1-800-DREYFUS.

Item 2. Code of Ethics.
The Registrant has adopted a code of ethics that applies to the Registrant's principal executive officer, principal financial officer, principal accounting officer or controller, or persons performing similar functions. There have been no amendments to, or waivers in connection with, the Code of Ethics during the period covered by this Report.
Item 3. Audit Committee Financial Expert.
The Registrant's Board has determined that David P. Feldman, a member of the Audit Committee of the Board, is an audit committee financial expert as defined by the Securities and Exchange Commission (the "SEC"). David P. Feldman is "independent" as defined by the SEC for purposes of audit committee financial expert determinations.
Item 4. Principal Accountant Fees and Services.
(a) Audit Fees. The aggregate fees billed for each of the last two fiscal years (the "Reporting Periods") for professional services rendered by the Registrant's principal accountant (the "Auditor") for the audit of the Registrant's annual financial statements or services that are normally provided by the Auditor in connection with the statutory and regulatory filings or engagements for the Reporting Periods, were $32,149 in 2013 and $32,792 in 2014.
(b) Audit-Related Fees. The aggregate fees billed in the Reporting Periods for assurance and related services by the Auditor that are reasonably related to the performance of the audit of the Registrant's financial statements and are not reported under paragraph (a) of this Item 4 were $8,409 in 2013 and $7,515 in 2014. These services consisted of one or more of the following: (i) agreed upon procedures related to compliance with Internal Revenue Code section 817(h), (ii) security counts required by Rule 17f-2 under the Investment Company Act of 1940, as amended, (iii) advisory services as to the accounting or disclosure treatment of Registrant transactions or events and (iv) advisory services to the accounting or disclosure treatment of the actual or potential impact to the Registrant of final or proposed rules, standards or interpretations by the Securities and Exchange Commission, the Financial Accounting Standards Boards or other regulatory or standard-setting bodies.
The aggregate fees billed in the Reporting Periods for non-audit assurance and related services by the Auditor to the Registrant's investment adviser (not including any sub-investment adviser whose role is primarily portfolio management and is subcontracted with or overseen by another investment adviser), and any entity controlling, controlled by or under common control with the investment adviser that provides ongoing services to the Registrant ("Service Affiliates"), that were reasonably related to the performance of the annual audit of the Service Affiliate, which required pre-approval by the Audit Committee were $-0- in 2013 and $-0- in 2014.
(c) Tax Fees. The aggregate fees billed in the Reporting Periods for professional services rendered by the Auditor for tax compliance, tax advice, and tax planning ("Tax Services") were $3,841 in 2013 and $2,957 in 2014. These services consisted of: (i) review or preparation of U.S. federal, state, local and excise tax returns; (ii) U.S. federal, state and local tax planning, advice and assistance regarding statutory, regulatory or administrative developments; and (iii) tax advice regarding tax qualification matters and/or treatment of various financial instruments held or proposed to be acquired or held. The aggregate fees billed in the Reporting Periods for Tax Services by the Auditor to Service Affiliates, which required pre-approval by the Audit Committee were $-0- in 2013 and $-0- in 2014.
(d) All Other Fees. The aggregate fees billed in the Reporting Periods for products and services provided by the Auditor, other than the services reported in paragraphs (a) through (c) of this Item, were $689 in 2013 and $2,078 in 2014. These services consisted of a review of the Registrant's anti-money laundering program.
The aggregate fees billed in the Reporting Periods for Non-Audit Services by the Auditor to Service Affiliates, other than the services reported in paragraphs (b) through (c) of this Item, which required pre-approval by the Audit Committee, were $-0- in 2013 and $-0- in 2014.
(e)(1) Audit Committee Pre-Approval Policies and Procedures. The Registrant's Audit Committee has established policies and procedures (the "Policy") for pre-approval (within specified fee limits) of the Auditor's engagements for non-audit services to the Registrant and Service Affiliates without specific case-by-case consideration. The pre-approved services in the Policy can include pre-approved audit services, pre-approved audit-related services, pre-approved tax services and pre-approved all other services. Pre-approval considerations include whether the proposed services are compatible with maintaining the Auditor's independence. Pre-approvals pursuant to the Policy are considered annually.
(e)(2) Note: None of the services described in paragraphs (b) through (d) of this Item 4 were approved by the Audit Committee pursuant to paragraph (c)(7)(i)(C) of Rule 2-01 of Regulation S-X.
(f) None of the hours expended on the principal accountant's engagement to audit the registrant's financial statements for the most recent fiscal year were attributed to work performed by persons other than the principal account's full-time, permanent employees.
Non-Audit Fees. The aggregate non-audit fees billed by the Auditor for services rendered to the Registrant, and rendered to Service Affiliates, for the Reporting Periods were $50,384,343 in 2013 and $23,307,177 in 2014.
Auditor Independence. The Registrant's Audit Committee has considered whether the provision of non-audit services that were rendered to Service Affiliates, which were not pre-approved (not requiring pre-approval), is compatible with maintaining the Auditor's independence.
Item 5. Audit Committee of Listed Registrants.
Not applicable. [CLOSED-END FUNDS ONLY]
Item 6. Investments.
(a) Not applicable.
Item 7. Disclosure of Proxy Voting Policies and Procedures for Closed-End Management Investment Companies.
Not applicable. [CLOSED-END FUNDS ONLY]
Item 8. Portfolio Managers of Closed-End Management Investment Companies.
Not applicable. [CLOSED-END FUNDS ONLY, beginning with reports for periods ended on and after December 31, 2005]
Item 9. Purchases of Equity Securities by Closed-End Management Investment Companies and Affiliated Purchasers.
Not applicable. [CLOSED-END FUNDS ONLY]
Item 10. Submission of Matters to a Vote of Security Holders.
There have been no material changes to the procedures applicable to Item 10.
Item 11. Controls and Procedures.
(a) The Registrant's principal executive and principal financial officers have concluded, based on their evaluation of the Registrant's disclosure controls and procedures as of a date within 90 days of the filing date of this report, that the Registrant's disclosure controls and procedures are reasonably designed to ensure that information required to be disclosed by the Registrant on Form N-CSR is recorded, processed, summarized and reported within the required time periods and that information required to be disclosed by the Registrant in the reports that it files or submits on Form N-CSR is accumulated and communicated to the Registrant's management, including its principal executive and principal financial officers, as appropriate to allow timely decisions regarding required disclosure.
(b) There were no changes to the Registrant's internal control over financial reporting that occurred during the second fiscal quarter of the period covered by this report that have materially affected, or are reasonably likely to materially affect, the Registrant's internal control over financial reporting.
Item 12. Exhibits.
(a)(1) Code of ethics referred to in Item 2.
(a)(2) Certifications of principal executive and principal financial officers as required by Rule 30a-2(a) under the Investment Company Act of 1940.
(a)(3) Not applicable.
(b) Certification of principal executive and principal financial officers as required by Rule 30a-2(b) under the Investment Company Act of 1940.
SIGNATURES
Pursuant to the requirements of the Securities Exchange Act of 1934 and the Investment Company Act of 1940, the Registrant has duly caused this Report to be signed on its behalf by the undersigned, thereunto duly authorized.
Dreyfus New Jersey Municipal Bond Fund, Inc.
By: /s/ Bradley J. Skapyak
Bradley J. Skapyak,
President
Date: February 24, 2015
Pursuant to the requirements of the Securities Exchange Act of 1934 and the Investment Company Act of 1940, this Report has been signed below by the following persons on behalf of the Registrant and in the capacities and on the dates indicated.
By: /s/ Bradley J. Skapyak
Bradley J. Skapyak,
President
Date: February 24, 2015
By: /s/ James Windels
James Windels,
Treasurer
Date: February 24, 2015
EXHIBIT INDEX
(a)(1) Code of ethics referred to in Item 2.
(a)(2) Certifications of principal executive and principal financial officers as required by Rule 30a-2(a) under the Investment Company Act of 1940. (EX-99.CERT)
(b) Certification of principal executive and principal financial officers as required by Rule 30a-2(b) under the Investment Company Act of 1940. (EX-99.906CERT)