UNITED STATES
SECURITIES AND EXCHANGE COMMISSION
Washington, D.C. 20549
FORM N-CSR
CERTIFIED SHAREHOLDER REPORT OF REGISTERED MANAGEMENT
INVESTMENT COMPANIES
Investment Company Act file number | 811- 5454 |
| |
| Dreyfus New Jersey Municipal Bond Fund, Inc. | |
| (Exact name of Registrant as specified in charter) | |
| | |
| c/o The Dreyfus Corporation 200 Park Avenue New York, New York 10166 | |
| (Address of principal executive offices) (Zip code) | |
| | |
| Janette E. Farragher, Esq. 200 Park Avenue New York, New York 10166 | |
| (Name and address of agent for service) | |
|
Registrant's telephone number, including area code: | (212) 922-6000 |
| |
Date of fiscal year end: | 12/31 | |
Date of reporting period: | 12/31/12 | |
| | | | | | | |
FORM N-CSR
Item 1. Reports to Stockholders.
Save time. Save paper. View your next shareholder report online as soon as it’s available. Log into www.dreyfus.com and sign up for Dreyfus eCommunications. It’s simple and only takes a few minutes.
The views expressed in this report reflect those of the portfolio manager only through the end of the period covered and do not necessarily represent the views of Dreyfus or any other person in the Dreyfus organization. Any such views are subject to change at any time based upon market or other conditions and Dreyfus disclaims any responsibility to update such views.These views may not be relied on as investment advice and, because investment decisions for a Dreyfus fund are based on numerous factors, may not be relied on as an indication of trading intent on behalf of any Dreyfus fund.

| | Contents |
| | THE FUND |
| 2 | A Letter from the President |
| 3 | Discussion of Fund Performance |
| 6 | Fund Performance |
| 8 | Understanding Your Fund’s Expenses |
| 8 | Comparing Your Fund’s Expenses With Those of Other Funds |
| 9 | Statement of Investments |
| 24 | Statement of Assets and Liabilities |
| 25 | Statement of Operations |
| 26 | Statement of Changes in Net Assets |
| 28 | Financial Highlights |
| 32 | Notes to Financial Statements |
| 45 | Report of Independent Registered Public Accounting Firm |
| 46 | Important Tax Information |
| 47 | Proxy Results |
| 48 | Board Members Information |
| 50 | Officers of the Fund |
| | FOR MORE INFORMATION |
| | Back Cover |
Dreyfus
New Jersey Municipal
Bond Fund, Inc.
The Fund
A LETTER FROM THE PRESIDENT
Dear Shareholder:
We are pleased to present this annual report for Dreyfus New Jersey Municipal Bond Fund, Inc., covering the 12-month period from January 1, 2012, through December 31, 2012. For information about how the fund performed during the reporting period, as well as general market perspectives, we provide a Discussion of Fund Performance on the pages that follow.
The search for higher nominal and tax-exempt yields amid historically low interest rates proved to be a major force in the solid performance of the municipal bond market in 2012, as the Federal Reserve Board’s efforts to infuse liquidity into the domestic financial system kept taxable bond yield spreads relatively moderate versus municipals. Robust investor demand in the municipal market, however, was met with a relatively meager supply of newly issued securities stemming from political pressure to reduce government spending and borrowing.The market also was buoyed by improvements in the fiscal condition of most states and many municipalities as tax revenues increased in a gradually recovering U.S. economy.
We currently expect the U.S. economy to be modestly stronger in 2013 than in 2012, especially during the second half of the year. Economic activity seems likely to benefit from greater certainty regarding U.S. tax and fiscal policies, the resumption of postponed spending by businesses, and a continued housing recovery. We encourage you to discuss the implications of our economic analysis with your financial advisor, who can help you align your investments with the year’s challenges and opportunities.
Thank you for your continued confidence and support.
Sincerely,

J. Charles Cardona
President
The Dreyfus Corporation
January 15, 2013
2
DISCUSSION OF FUND PERFORMANCE
For the period of January 1, 2012, through December 31, 2012, as provided by Daniel Barton and Jeffrey Burger, Portfolio Managers
Fund and Market Performance Overview
For the 12-month period ended December 31, 2012, Dreyfus New Jersey Municipal Bond Fund’s Class A shares produced a total return of 6.96%, Class C shares returned 6.09%, Class I shares returned 7.04% and Class Z shares returned 7.04%.1 In comparison, the Barclays Municipal Bond Index, the fund’s benchmark, achieved a total return of 6.78% for the same period.2
Falling long-term interest rates and favorable supply-and-demand dynamics supported municipal bond prices during 2012.The fund’s Class A, Class I, and Class Z shares produced higher returns than their benchmark, due primarily to overweighted exposure to revenue bonds.
The Fund’s Investment Approach
The fund seeks as high a level of current income exempt from federal and New Jersey state income taxes as is consistent with the preservation of capital.To pursue its goal the fund normally invests at least 80% of its assets in municipal bonds that provide income exempt from federal and New Jersey personal income taxes. The fund invests at least 80% of its assets in investment-grade municipal bonds or the unrated equivalent as determined by Dreyfus.The fund may invest up to 20% of its assets in municipal bonds rated below investment grade (“high yield” or “junk” bonds) or the unrated equivalent as determined by Dreyfus. The dollar-weighted average maturity of the fund’s portfolio normally exceeds 10 years.
We focus on identifying undervalued sectors and securities and minimize the use of interest rate forecasting.We select municipal bonds for the fund’s portfolio by using fundamental credit analysis to estimate the relative value and attractiveness of various sectors and securities and to exploit pricing inefficiencies in the municipal bond market; and actively trading among various sectors, such as pre-refunded, general obligation and revenue, based on their apparent relative values. The fund seeks to invest in several of these sectors.
The Fund 3
DISCUSSION OF FUND PERFORMANCE (continued)
Supply-and-Demand Dynamics Buoyed Municipal Bonds
Most U.S. financial markets were rallying at the start of 2012 amid domestic employment gains and a quantitative easing program in Europe. Investors grew more tolerant of risks, focusing more on underlying fundamentals and less on macroeconomic developments.These positive influences were called into question during the spring, when the U.S. labor market’s rebound slowed and measures designed to relieve fiscal pressures in Europe encountered resistance. Although these headwinds temporarily sparked a flight to perceived safe havens, markets resumed their rallies over the summer and fall.
Municipal bonds across the credit-quality range generally remained strong throughout the year, in part due to robust demand from investors seeking higher levels of after-tax income. Municipal bonds also responded positively to falling long-term interest rates amid quantitative easing and other stimulative measures by the Federal Reserve Board over the summer. Meanwhile, new issuance volumes remained muted when political pressure led to less borrowing for capital projects. Instead, municipalities mainly issued new bonds to refinance older debt, resulting in a net decrease in the national supply of tax-exempt securities. In this environment, lower-rated and longer maturity municipal bonds led the market higher, while highly rated and shorter-term securities generally lagged market averages.
From a credit quality perspective, New Jersey’s tax revenues have fallen short of budget projections, and the state has continued to struggle with rising retiree benefits costs, a relatively slow economic recovery, and depleted reserve fund balances.
New Jersey Bonds Beat National Market Averages
The fund’s relative performance was enhanced by relatively strong results from New Jersey municipal bonds compared to national averages, as investors reached for higher yields from lower rated securities.The fund also benefited from an emphasis on higher yielding, revenue-backed municipal bonds, particularly those with credit ratings in the BBB and A tiers. The fund received especially robust contributions from municipal bonds backed by revenues from hospitals, industrial development projects, and the state’s settlement of litigation with U.S. tobacco companies.
On the other hand, the fund’s relative performance was hindered to a degree by higher quality revenue bonds issued to finance essential municipal services, such as
4
water and sewer facilities. Our ongoing efforts to upgrade the fund’s overall credit quality also proved mildly counterproductive in 2012, when investors favored lower-rated securities.
The fund employed Municipal Market Data rate locks, a derivative instrument, at times during the year to implement certain interest rate strategies.
Adjusting to Changing Market Conditions
We have been encouraged by recently improved data, but the U.S. economy remains vulnerable to fiscal uncertainty. Therefore, while we have continued to favor income-oriented municipal bonds over their lower yielding counterparts, we have reduced the fund’s average duration toward a market-neutral position, and we have maintained a higher quality bias in our security selection strategy. In addition, we have continued to monitor the market for more attractive relative values among New Jersey municipal bonds.
January 15, 2013
Bond funds are subject generally to interest rate, credit, liquidity and market risks, to varying degrees, all of which are more fully described in the fund’s prospectus. Generally, all other factors being equal, bond prices are inversely related to interest-rate changes, and rate increases can cause price declines.
High yield bonds are subject to increased credit risk and are considered speculative in terms of the issuer’s perceived ability to continue making interest payments on a timely basis and to repay principal upon maturity.
|
| 1 Total return includes reinvestment of dividends and any capital gains paid and does not take into consideration the |
| maximum initial sales charge in the case of Class A shares or the applicable contingent deferred sales charges imposed |
| on redemptions in the case of Class C shares. Had these charges been reflected, returns would have been lower. Class I |
| and Class Z shares are not subject to any initial or deferred sales charge. Past performance is no guarantee of future |
| results. Share price, yield and investment return fluctuate such that upon redemption, fund shares may be worth more |
| or less than their original cost. Income may be subject to state and local taxes for non-New Jersey residents, and some |
| income may be subject to the federal alternative minimum tax (AMT) for certain investors. Capital gains, if any, are |
| fully taxable. Return figures provided for Class A and C shares reflect the absorption of certain fund expenses |
| pursuant to an agreement by The Dreyfus Corporation which may be terminated after May 1, 2013, upon 90 days’ |
| notice to shareholders. Return figures for Class I shares reflect the absorption of certain fund expenses by The Dreyfus |
| Corporation and may be terminated at any time. Had these expenses not been absorbed, the fund’s returns would |
| have been lower. |
| 2 SOURCE: LIPPER INC. — Reflects reinvestment of dividends and, where applicable, capital gain distributions. |
| The Barclays Municipal Bond Index is a widely accepted, unmanaged total return performance benchmark for the |
| long-term, investment-grade, tax-exempt bond market. Index returns do not reflect fees and expenses associated with |
| operating a mutual fund. Investors cannot invest directly in any index. |
The Fund 5
FUND PERFORMANCE
| |
| † | Source: Lipper Inc. |
| †† | The total return figures presented for Class C shares of the fund reflect the performance of the fund’s Class A shares |
| | for the period prior to 1/7/03 (the inception date for Class C shares), adjusted to reflect the applicable sales load for |
| | this share class. |
| | The total return figures presented for Class I shares of the fund reflect the performance of the fund’s Class A shares |
| | for the period prior to 12/15/08 (the inception date for Class I shares). |
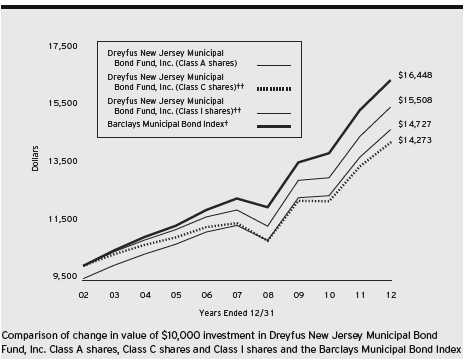
Past performance is not predictive of future performance.
The above graph compares a $10,000 investment made in each of the Class A, Class C and Class I shares of Dreyfus New Jersey Municipal Bond Fund, Inc. on 12/31/02 to a $10,000 investment made in the Barclays Municipal Bond Index (the “Index”) on that date.All dividends and capital gain distributions are reinvested.
The fund invests primarily in New Jersey municipal securities and its performance shown in the line graph above takes into account the maximum initial sales charge on Class A shares and all other applicable fees and expenses on all classes. Performance for Class Z shares will vary from the performance of Class A, Class C and Class I shares shown above due to differences in charges and expenses.The Index is not limited to investments in New Jersey municipal obligations.The Index is an unmanaged total return performance benchmark for the long-term, investment-grade, geographically unrestricted tax-exempt bond market, calculated by using municipal bonds selected to be representative of the municipal market overall. Unlike a mutual fund, the Index is not subject to charges, fees and other expenses. Investors cannot invest directly in any index.These factors can contribute to the Index potentially outperforming or underperforming the fund. Further information relating to fund performance, including expense reimbursements, if applicable, is contained in the Financial Highlights section of the prospectus and elsewhere in this report.
6
| | | | | | | | | |
| Average Annual Total Returns as of 12/31/12 | | | | | | | |
| |
| | Inception | | | | | | | From | |
| | Date | 1 | Year | 5 Years | | 10 Years | | Inception | |
| Class A shares | | | | | | | | | |
| with maximum sales charge (4.5%) | 11/6/87 | 2.17 | % | 4.28 | % | 3.95 | % | — | |
| without sales charge | 11/6/87 | 6.96 | % | 5.24 | % | 4.42 | % | — | |
| Class C shares | | | | | | | | | |
| with applicable redemption charge † | 1/7/03 | 5.09 | % | 4.44 | % | 3.62 | %†† | — | |
| without redemption | 1/7/03 | 6.09 | % | 4.44 | % | 3.62 | %†† | — | |
| Class I shares | 12/15/08 | 7.04 | % | 5.37 | %†† | 4.49 | %†† | — | |
| Class Z shares | 6/7/07 | 7.04 | % | 5.32 | % | — | | 5.14 | % |
| Barclays Municipal | | | | | | | | | |
| Bond Index | 5/31/07 | 6.78 | % | 5.91 | % | 5.10 | % | 5.78 | %††† |
Past performance is not predictive of future performance.The fund’s performance shown in the graph and table does not reflect the deduction of taxes that a shareholder would pay on fund distributions or the redemption of fund shares.
| |
| † | The maximum contingent deferred sales charge for Class C shares is 1% for shares redeemed within one year of the |
| | date of purchase. |
| †† | The total return performance figures presented for Class C shares of the fund reflect the performance of the fund’s |
| | Class A shares for the period prior to 1/7/03 (the inception date for Class C shares), adjusted to reflect the |
| | applicable sales load for this share class. |
| | The total return performance figures presented for Class I shares of the fund reflect the performance of the fund’s |
| | Class A shares for the period prior to 12/15/08 (the inception date for Class I shares). |
| ††† | The Index date is based on the life of Class Z shares. For comparative purposes, the value of the Index as of |
| | 5/31/07 is used as the beginning value on 6/7/07 (the inception date for Class Z shares). |
The Fund 7
UNDERSTANDING YOUR FUND’S EXPENSES (Unaudited)
As a mutual fund investor, you pay ongoing expenses, such as management fees and other expenses. Using the information below, you can estimate how these expenses affect your investment and compare them with the expenses of other funds.You also may pay one-time transaction expenses, including sales charges (loads) and redemption fees, which are not shown in this section and would have resulted in higher total expenses. For more information, see your fund’s prospectus or talk to your financial adviser.
Review your fund’s expenses
The table below shows the expenses you would have paid on a $1,000 investment in Dreyfus New Jersey Municipal Bond Fund, Inc. from July 1, 2012 to December 31, 2012. It also shows how much a $1,000 investment would be worth at the close of the period, assuming actual returns and expenses.
Expenses and Value of a $1,000 Investment
assuming actual returns for the six months ended December 31, 2012
| | | | | | | | |
| | | Class A | | Class C | | Class I | | Class Z |
| Expenses paid per $1,000† | $ | 4.39 | $ | 8.24 | $ | 3.62 | $ | 3.98 |
| Ending value (after expenses) | $ | 1,028.80 | $ | 1,024.20 | $ | 1,028.80 | $ | 1,028.40 |
COMPARING YOUR FUND’S EXPENSES
WITH THOSE OF OTHER FUNDS (Unaudited)
Using the SEC’s method to compare expenses
The Securities and Exchange Commission (SEC) has established guidelines to help investors assess fund expenses. Per these guidelines, the table below shows your fund’s expenses based on a $1,000 investment, assuming a hypothetical 5% annualized return. You can use this information to compare the ongoing expenses (but not transaction expenses or total cost) of investing in the fund with those of other funds.All mutual fund shareholder reports will provide this information to help you make this comparison. Please note that you cannot use this information to estimate your actual ending account balance and expenses paid during the period.
Expenses and Value of a $1,000 Investment
assuming a hypothetical 5% annualized return for the six months ended December 31, 2012
| | | | | | | | |
| | | Class A | | Class C | | Class I | | Class Z |
| Expenses paid per $1,000† | $ | 4.37 | $ | 8.21 | $ | 3.61 | $ | 3.96 |
| Ending value (after expenses) | $ | 1,020.81 | $ | 1,016.99 | $ | 1,021.57 | $ | 1,021.22 |
|
| † Expenses are equal to the fund’s annualized expense ratio of .86% for Class A, 1.62% for Class C, .71% for |
| Class I and .78% for Class Z, multiplied by the average account value over the period, multiplied by 184/366 (to |
| reflect the one-half year period). |
8
| | | | | |
| STATEMENT OF INVESTMENTS | | | | |
| December 31, 2012 | | | | | |
| |
| |
| |
| |
| Long-Term Municipal | Coupon | Maturity | Principal | | |
| Investments—97.3% | Rate (%) | Date | Amount ($) | | Value ($) |
| New Jersey—86.7% | | | | | |
| Burlington County Bridge | | | | | |
| Commission, EDR (The | | | | | |
| Evergreens Project) | 5.63 | 1/1/38 | 5,500,000 | | 5,724,345 |
| Camden County Improvement | | | | | |
| Authority, Health Care | | | | | |
| Redevelopment Project Revenue | | | | | |
| (The Cooper Health System | | | | | |
| Obligated Group Issue) | 5.25 | 2/15/20 | 2,000,000 | | 2,125,800 |
| Camden County Improvement | | | | | |
| Authority, Health Care | | | | | |
| Redevelopment Project Revenue | | | | | |
| (The Cooper Health System | | | | | |
| Obligated Group Issue) | 5.25 | 2/15/20 | 4,545,000 | | 4,830,880 |
| Delaware River and Bay Authority, | | | | | |
| Revenue | 5.00 | 1/1/42 | 1,000,000 | | 1,155,320 |
| Delaware River Port Authority, | | | | | |
| Revenue | 5.00 | 1/1/30 | 3,500,000 | | 4,009,145 |
| Delaware River Port Authority, | | | | | |
| Revenue | 5.00 | 1/1/35 | 3,500,000 | | 3,954,335 |
| East Orange Board of Education, | | | | | |
| COP, LR (Insured; Assured | | | | | |
| Guaranty Municipal Corp.) | 0.00 | 2/1/21 | 685,000 | a | 519,319 |
| East Orange Board of Education, | | | | | |
| COP, LR (Insured; Assured | | | | | |
| Guaranty Municipal Corp.) | 0.00 | 2/1/26 | 745,000 | a | 433,888 |
| East Orange Board of Education, | | | | | |
| COP, LR (Insured; Assured | | | | | |
| Guaranty Municipal Corp.) | 0.00 | 2/1/28 | 2,345,000 | a | 1,233,470 |
| Essex County, | | | | | |
| GO (General Improvement) | 5.00 | 8/1/23 | 15,200,000 | | 18,102,440 |
| Garden State Preservation Trust, | | | | | |
| Revenue (Open Space and | | | | | |
| Farmland Preservation Bonds) | 5.00 | 11/1/22 | 6,245,000 | | 7,989,915 |
| Garden State Preservation Trust, | | | | | |
| Revenue (Open Space and | | | | | |
| Farmland Preservation Bonds) | | | | | |
| (Insured; Assured Guaranty | | | | | |
| Municipal Corp.) | 5.75 | 11/1/28 | 5,000,000 | | 6,768,200 |
The Fund 9
STATEMENT OF INVESTMENTS (continued)
| | | | | |
| Long-Term Municipal | Coupon | Maturity | Principal | | |
| Investments (continued) | Rate (%) | Date | Amount ($) | | Value ($) |
| New Jersey (continued) | | | | | |
| Gloucester County Improvement | | | | | |
| Authority, County Guaranteed | | | | | |
| Loan Revenue (County | | | | | |
| Capital Program) | 5.00 | 4/1/38 | 7,000,000 | | 7,673,260 |
| Gloucester Township Municipal | | | | | |
| Utilities Authority, Sewer | | | | | |
| Revenue (Insured; AMBAC) | 5.65 | 3/1/18 | 1,825,000 | | 2,023,542 |
| Higher Education Student | | | | | |
| Assistance Authority of New | | | | | |
| Jersey, Student Loan Revenue | | | | | |
| (Insured; National Public | | | | | |
| Finance Guarantee Corp.) | 6.13 | 6/1/17 | 280,000 | | 280,000 |
| Hudson County Improvement | | | | | |
| Authority, Harrison Stadium | | | | | |
| Land Acquisition Special | | | | | |
| Obligation Revenue (Harrison | | | | | |
| Redevelopment Project) | | | | | |
| (Insured; National Public | | | | | |
| Finance Guarantee Corp.) | 0.00 | 12/15/34 | 3,000,000 | a | 1,147,590 |
| Mercer County Improvement | | | | | |
| Authority, County Secured | | | | | |
| Open Space Revenue (Insured; | | | | | |
| National Public Finance | | | | | |
| Guarantee Corp.) | 5.00 | 8/1/40 | 3,290,000 | | 3,525,630 |
| Middletown Township Board of | | | | | |
| Education, GO | 5.00 | 8/1/25 | 4,140,000 | | 4,989,114 |
| Middletown Township Board of | | | | | |
| Education, GO | 5.00 | 8/1/26 | 2,935,000 | | 3,520,797 |
| New Jersey Economic Development | | | | | |
| Authority, Cigarette Tax Revenue | 5.00 | 6/15/28 | 2,000,000 | | 2,266,400 |
| New Jersey Economic Development | | | | | |
| Authority, Cigarette Tax | | | | | |
| Revenue (Prerefunded) | 5.75 | 6/15/14 | 2,000,000 | b | 2,158,380 |
| New Jersey Economic Development | | | | | |
| Authority, Department of | | | | | |
| Human Services Composite | | | | | |
| Revenue (Division of | | | | | |
| Developmental Disabilities) | 6.25 | 7/1/24 | 1,240,000 | | 1,243,187 |
10
| | | | | |
| Long-Term Municipal | Coupon | Maturity | Principal | | |
| Investments (continued) | Rate (%) | Date | Amount ($) | | Value ($) |
| New Jersey (continued) | | | | | |
| New Jersey Economic Development | | | | | |
| Authority, Department of Human | | | | | |
| Services Composite Revenue | | | | | |
| (Division of Mental | | | | | |
| Health Services) | 6.10 | 7/1/17 | 1,215,000 | | 1,218,779 |
| New Jersey Economic Development | | | | | |
| Authority, EDR (Masonic | | | | | |
| Charity Foundation of New | | | | | |
| Jersey Project) | 5.00 | 6/1/18 | 1,365,000 | | 1,404,885 |
| New Jersey Economic Development | | | | | |
| Authority, Gas Facilities Revenue | | | | | |
| (NUI Corporation Project) | 5.25 | 11/1/33 | 2,780,000 | | 2,782,474 |
| New Jersey Economic Development | | | | | |
| Authority, Motor Vehicle | | | | | |
| Surcharge Revenue (Insured; | | | | | |
| National Public Finance | | | | | |
| Guarantee Corp.) | 0.00 | 7/1/20 | 3,350,000 | a | 2,665,696 |
| New Jersey Economic Development | | | | | |
| Authority, Motor Vehicle | | | | | |
| Surcharge Revenue (Insured; | | | | | |
| National Public Finance | | | | | |
| Guarantee Corp.) | 0.00 | 7/1/21 | 2,620,000 | a | 1,984,519 |
| New Jersey Economic Development | | | | | |
| Authority, Revenue (Hillcrest | | | | | |
| Health Service System Project) | | | | | |
| (Insured; AMBAC) | 0.00 | 1/1/15 | 3,250,000 | a | 3,030,918 |
| New Jersey Economic Development | | | | | |
| Authority, Revenue (Hillcrest | | | | | |
| Health Service System Project) | | | | | |
| (Insured; AMBAC) | 0.00 | 1/1/17 | 5,000,000 | a | 4,259,100 |
| New Jersey Economic Development | | | | | |
| Authority, Revenue (Hillcrest | | | | | |
| Health Service System Project) | | | | | |
| (Insured; AMBAC) | 0.00 | 1/1/18 | 2,500,000 | a | 2,034,850 |
| New Jersey Economic Development | | | | | |
| Authority, Revenue (Hillcrest | | | | | |
| Health Service System Project) | | | | | |
| (Insured; AMBAC) | 0.00 | 1/1/20 | 6,500,000 | a | 4,756,960 |
The Fund 11
STATEMENT OF INVESTMENTS (continued)
| | | | | |
| Long-Term Municipal | Coupon | Maturity | Principal | | |
| Investments (continued) | Rate (%) | Date | Amount ($) | | Value ($) |
| New Jersey (continued) | | | | | |
| New Jersey Economic Development | | | | | |
| Authority, Revenue (Hillcrest | | | | | |
| Health Service System Project) | | | | | |
| (Insured; AMBAC) | 0.00 | 1/1/22 | 6,000,000 | a | 3,894,600 |
| New Jersey Economic Development | | | | | |
| Authority, School Facilities | | | | | |
| Construction Revenue | 5.00 | 9/1/18 | 2,265,000 | | 2,690,276 |
| New Jersey Economic Development | | | | | |
| Authority, School Facilities | | | | | |
| Construction Revenue | 5.75 | 9/1/23 | 3,765,000 | | 4,652,712 |
| New Jersey Economic Development | | | | | |
| Authority, School Facilities | | | | | |
| Construction Revenue | | | | | |
| (Insured; AMBAC) | 5.50 | 9/1/24 | 10,000,000 | | 12,703,000 |
| New Jersey Economic Development | | | | | |
| Authority, School Facilities | | | | | |
| Construction Revenue (Insured; | | | | | |
| National Public Finance | | | | | |
| Guarantee Corp.) | 5.50 | 9/1/27 | 10,000,000 | | 13,038,700 |
| New Jersey Economic Development | | | | | |
| Authority, Water Facilities | | | | | |
| Revenue (New Jersey—American | | | | | |
| Water Company, Inc. Project) | 5.10 | 6/1/23 | 3,000,000 | | 3,408,570 |
| New Jersey Economic Development | | | | | |
| Authority, Water Facilities | | | | | |
| Revenue (New Jersey—American | | | | | |
| Water Company, Inc. Project) | 5.60 | 11/1/34 | 6,600,000 | | 7,505,256 |
| New Jersey Economic Development | | | | | |
| Authority, Water Facilities | | | | | |
| Revenue (New Jersey—American | | | | | |
| Water Company, Inc. Project) | 5.70 | 10/1/39 | 5,000,000 | | 5,594,400 |
| New Jersey Educational Facilities | | | | | |
| Authority, Revenue (Fairleigh | | | | | |
| Dickenson University Issue) | 6.00 | 7/1/20 | 4,535,000 | | 4,756,988 |
| New Jersey Educational Facilities | | | | | |
| Authority, Revenue (Kean | | | | | |
| University Issue) | 5.00 | 9/1/21 | 1,500,000 | | 1,793,475 |
| New Jersey Educational Facilities | | | | | |
| Authority, Revenue (Montclair | | | | | |
| State University Issue) | 5.25 | 7/1/38 | 2,000,000 | | 2,269,440 |
12
| | | | | |
| Long-Term Municipal | Coupon | Maturity | Principal | | |
| Investments (continued) | Rate (%) | Date | Amount ($) | | Value ($) |
| New Jersey (continued) | | | | | |
| New Jersey Educational Facilities | | | | | |
| Authority, Revenue (New Jersey | | | | | |
| City University Issue) | | | | | |
| (Insured; Assured Guaranty | | | | | |
| Municipal Corp.) | 5.00 | 7/1/35 | 12,165,000 | | 13,335,273 |
| New Jersey Educational Facilities | | | | | |
| Authority, Revenue (New Jersey | | | | | |
| Institute of Technology Issue) | 5.00 | 7/1/31 | 2,000,000 | | 2,266,140 |
| New Jersey Educational Facilities | | | | | |
| Authority, Revenue (Princeton | | | | | |
| Theological Seminary Issue) | 5.00 | 7/1/29 | 5,000,000 | | 6,007,100 |
| New Jersey Educational Facilities | | | | | |
| Authority, Revenue (Princeton | | | | | |
| University) (Prerefunded) | 5.00 | 7/1/15 | 120,000 | b | 133,606 |
| New Jersey Educational Facilities | | | | | |
| Authority, Revenue (Public | | | | | |
| Library Project Grant Program | | | | | |
| Issue) (Insured; AMBAC) | 5.50 | 9/1/17 | 1,500,000 | | 1,506,225 |
| New Jersey Educational Facilities | | | | | |
| Authority, Revenue (Ramapo | | | | | |
| College of New Jersey Issue) | 5.00 | 7/1/42 | 3,000,000 | | 3,409,080 |
| New Jersey Educational Facilities | | | | | |
| Authority, Revenue (Seton Hall | | | | | |
| University Issue) | 6.25 | 7/1/37 | 5,000,000 | | 5,962,950 |
| New Jersey Educational Facilities | | | | | |
| Authority, Revenue (Stevens | | | | | |
| Institute of Technology Issue) | 5.00 | 7/1/27 | 5,000,000 | | 5,366,800 |
| New Jersey Educational Facilities | | | | | |
| Authority, Revenue (Stevens | | | | | |
| Institute of Technology Issue) | 5.00 | 7/1/34 | 7,655,000 | | 8,108,023 |
| New Jersey Educational Facilities | | | | | |
| Authority, Revenue (Stevens | | | | | |
| Institute of Technology Issue) | | | | | |
| (Prerefunded) | 5.38 | 7/1/14 | 2,500,000 | b | 2,686,800 |
| New Jersey Educational Facilities | | | | | |
| Authority, Revenue (The | | | | | |
| College of New Jersey Issue) | | | | | |
| (Insured; Assured Guaranty | | | | | |
| Municipal Corp.) | 5.00 | 7/1/35 | 7,910,000 | | 8,774,800 |
The Fund 13
STATEMENT OF INVESTMENTS (continued)
| | | | | |
| Long-Term Municipal | Coupon | Maturity | Principal | | |
| Investments (continued) | Rate (%) | Date | Amount ($) | | Value ($) |
| New Jersey (continued) | | | | | |
| New Jersey Educational Facilities | | | | | |
| Authority, Revenue (The | | | | | |
| William Paterson University of | | | | | |
| New Jersey Issue) (Insured; | | | | | |
| Assured Guaranty Municipal Corp.) | 5.00 | 7/1/38 | 3,745,000 | | 4,077,556 |
| New Jersey Environmental | | | | | |
| Infrastructure Trust, | | | | | |
| Environmental | | | | | |
| Infrastructure Bonds | 5.00 | 9/1/17 | 4,165,000 | | 4,958,766 |
| New Jersey Environmental | | | | | |
| Infrastructure Trust, | | | | | |
| Environmental | | | | | |
| Infrastructure Bonds | 5.00 | 9/1/18 | 5,200,000 | | 6,354,296 |
| New Jersey Environmental | | | | | |
| Infrastructure Trust, | | | | | |
| Environmental | | | | | |
| Infrastructure Bonds | 5.00 | 9/1/22 | 3,550,000 | | 4,475,591 |
| New Jersey Health Care Facilities | | | | | |
| Financing Authority, Revenue | | | | | |
| (AHS Hospital Corporation Issue) | 5.00 | 7/1/27 | 5,400,000 | | 5,882,382 |
| New Jersey Health Care Facilities | | | | | |
| Financing Authority, Revenue | | | | | |
| (AtlantiCare Regional Medical | | | | | |
| Center Issue) | 5.00 | 7/1/22 | 3,975,000 | | 4,348,491 |
| New Jersey Health Care Facilities | | | | | |
| Financing Authority, Revenue | | | | | |
| (Barnabas Health Issue) | 5.63 | 7/1/32 | 3,000,000 | | 3,402,690 |
| New Jersey Health Care Facilities | | | | | |
| Financing Authority, Revenue | | | | | |
| (Capital Health System | | | | | |
| Obligated Group Issue) | | | | | |
| (Prerefunded) | 5.75 | 7/1/13 | 3,000,000 | b | 3,081,540 |
| New Jersey Health Care Facilities | | | | | |
| Financing Authority, Revenue | | | | | |
| (General Hospital Center at | | | | | |
| Passaic, Inc. Obligated Group | | | | | |
| Issue) (Insured; Assured | | | | | |
| Guaranty Municipal Corp.) | 6.75 | 7/1/19 | 550,000 | | 679,618 |
| New Jersey Health Care Facilities | | | | | |
| Financing Authority, Revenue | | | | | |
| (Hackensack University Medical | | | | | |
| Center Issue) | 5.00 | 1/1/28 | 2,780,000 | | 3,016,244 |
14
| | | | | |
| Long-Term Municipal | Coupon | Maturity | Principal | | |
| Investments (continued) | Rate (%) | Date | Amount ($) | | Value ($) |
| New Jersey (continued) | | | | | |
| New Jersey Health Care Facilities | | | | | |
| Financing Authority, Revenue | | | | | |
| (Hackensack University Medical | | | | | |
| Center Issue) (Insured; Assured | | | | | |
| Guaranty Municipal Corp.) | 5.25 | 1/1/36 | 2,900,000 | | 3,139,946 |
| New Jersey Health Care | | | | | |
| Facilities Financing Authority, | | | | | |
| Revenue (Holy Name | | | | | |
| Medical Center Issue) | 5.00 | 7/1/15 | 3,410,000 | | 3,638,027 |
| New Jersey Health Care Facilities | | | | | |
| Financing Authority, Revenue | | | | | |
| (Kennedy Health System | | | | | |
| Obligated Group Issue) | 5.00 | 7/1/31 | 1,525,000 | | 1,702,647 |
| New Jersey Health Care Facilities | | | | | |
| Financing Authority, Revenue | | | | | |
| (Meridian Health System | | | | | |
| Obligated Group Issue) | 5.00 | 7/1/23 | 2,500,000 | | 2,942,300 |
| New Jersey Health Care Facilities | | | | | |
| Financing Authority, Revenue | | | | | |
| (Meridian Health System | | | | | |
| Obligated Group Issue) | 5.00 | 7/1/26 | 1,000,000 | | 1,145,570 |
| New Jersey Health Care Facilities | | | | | |
| Financing Authority, Revenue | | | | | |
| (Meridian Health System | | | | | |
| Obligated Group Issue) | | | | | |
| (Insured; Assured Guaranty | | | | | |
| Municipal Corp.) | 5.00 | 7/1/38 | 4,915,000 | | 5,279,693 |
| New Jersey Health Care Facilities | | | | | |
| Financing Authority, Revenue | | | | | |
| (Robert Wood Johnson | | | | | |
| University Hospital Issue) | 5.00 | 7/1/31 | 4,950,000 | | 5,457,524 |
| New Jersey Health Care Facilities | | | | | |
| Financing Authority, Revenue | | | | | |
| (Saint Barnabas Health Care | | | | | |
| System Issue) (Insured; | | | | | |
| National Public Finance | | | | | |
| Guarantee Corp.) | 0.00 | 7/1/23 | 2,280,000 | a | 1,794,223 |
| New Jersey Health Care Facilities | | | | | |
| Financing Authority, Revenue | | | | | |
| (Virtua Health Issue) | | | | | |
| (Insured; Assured Guaranty | | | | | |
| Municipal Corp.) | 5.50 | 7/1/38 | 5,000,000 | | 5,581,500 |
The Fund 15
STATEMENT OF INVESTMENTS (continued)
| | | | |
| Long-Term Municipal | Coupon | Maturity | Principal | |
| Investments (continued) | Rate (%) | Date | Amount ($) | Value ($) |
| New Jersey (continued) | | | | |
| New Jersey Health Care Facilities | | | | |
| Financing Authority, State | | | | |
| Contract Revenue (Hospital | | | | |
| Asset Transformation Program) | 5.25 | 10/1/38 | 13,595,000 | 14,864,365 |
| New Jersey Higher Education | | | | |
| Student Assistance Authority, | | | | |
| Student Loan Revenue | 5.00 | 12/1/25 | 1,000,000 | 1,105,440 |
| New Jersey Higher Education | | | | |
| Student Assistance Authority, | | | | |
| Student Loan Revenue | 5.00 | 12/1/26 | 2,330,000 | 2,565,377 |
| New Jersey Higher Education | | | | |
| Student Assistance Authority, | | | | |
| Student Loan Revenue (Insured; | | | | |
| Assured Guaranty Municipal Corp.) | 5.88 | 6/1/21 | 4,670,000 | 5,289,849 |
| New Jersey Highway Authority, | | | | |
| Revenue (Garden State Parkway) | 6.00 | 1/1/19 | 6,645,000 | 8,225,978 |
| New Jersey Housing and Mortgage | | | | |
| Finance Agency, MFHR (Insured: | | | | |
| AMBAC and FHA) | 5.65 | 5/1/40 | 4,480,000 | 4,484,928 |
| New Jersey Housing and Mortgage | | | | |
| Finance Agency, MFHR (Insured; | | | | |
| Assured Guaranty Municipal Corp.) | 5.70 | 5/1/20 | 2,180,000 | 2,185,363 |
| New Jersey Housing and | | | | |
| Mortgage Finance Agency, | | | | |
| Multi-Family Revenue | 4.95 | 5/1/41 | 7,000,000 | 7,541,240 |
| New Jersey Housing and Mortgage | | | | |
| Finance Agency, SFHR | 5.20 | 10/1/25 | 5,740,000 | 6,318,764 |
| New Jersey Housing and Mortgage | | | | |
| Finance Agency, SFHR | 6.38 | 10/1/28 | 4,135,000 | 4,465,800 |
| New Jersey Housing and Mortgage | | | | |
| Finance Agency, SFHR | 5.25 | 10/1/37 | 840,000 | 886,259 |
| New Jersey Institute of | | | | |
| Technology, GO | 5.00 | 7/1/32 | 1,000,000 | 1,178,290 |
| New Jersey Transportation | | | | |
| Trust Fund Authority | | | | |
| (Transportation System) | 5.00 | 6/15/20 | 4,000,000 | 4,380,160 |
| New Jersey Transportation | | | | |
| Trust Fund Authority | | | | |
| (Transportation System) | 5.50 | 12/15/23 | 7,000,000 | 8,877,750 |
16
| | | | | |
| Long-Term Municipal | Coupon | Maturity | Principal | | |
| Investments (continued) | Rate (%) | Date | Amount ($) | | Value ($) |
| New Jersey (continued) | | | | | |
| New Jersey Transportation | | | | | |
| Trust Fund Authority | | | | | |
| (Transportation System) | 5.50 | 6/15/31 | 2,500,000 | | 2,985,325 |
| New Jersey Transportation | | | | | |
| Trust Fund Authority | | | | | |
| (Transportation System) | 6.00 | 12/15/38 | 6,565,000 | | 7,795,084 |
| New Jersey Transportation Trust | | | | | |
| Fund Authority (Transportation | | | | | |
| System) (Insured; AMBAC) | 0.00 | 12/15/24 | 1,000,000 | a | 613,830 |
| New Jersey Transportation Trust | | | | | |
| Fund Authority (Transportation | | | | | |
| System) (Insured; AMBAC) | 5.00 | 12/15/32 | 8,000,000 | | 8,946,000 |
| New Jersey Transportation Trust | | | | | |
| Fund Authority (Transportation | | | | | |
| System) (Prerefunded) | 6.00 | 12/15/18 | 3,435,000 | b | 4,457,393 |
| New Jersey Turnpike Authority, | | | | | |
| Turnpike Revenue | 6.50 | 1/1/16 | 35,000 | | 40,478 |
| New Jersey Turnpike Authority, | | | | | |
| Turnpike Revenue | 6.50 | 1/1/16 | 120,000 | | 129,222 |
| New Jersey Turnpike Authority, | | | | | |
| Turnpike Revenue | 5.00 | 1/1/23 | 5,000,000 | | 6,127,250 |
| New Jersey Turnpike Authority, | | | | | |
| Turnpike Revenue | 5.00 | 1/1/35 | 3,000,000 | | 3,453,570 |
| New Jersey Turnpike Authority, | | | | | |
| Turnpike Revenue | 5.25 | 1/1/40 | 5,420,000 | | 6,093,001 |
| New Jersey Turnpike Authority, | | | | | |
| Turnpike Revenue (Insured; | | | | | |
| Assured Guaranty Municipal Corp.) | 6.50 | 1/1/16 | 655,000 | | 705,337 |
| New Jersey Turnpike Authority, | | | | | |
| Turnpike Revenue (Insured; | | | | | |
| Assured Guaranty Municipal Corp.) | 6.50 | 1/1/16 | 165,000 | | 193,766 |
| New Jersey Turnpike Authority, | | | | | |
| Turnpike Revenue (Insured; | | | | | |
| Assured Guaranty Municipal Corp.) | 5.25 | 1/1/27 | 3,000,000 | | 3,868,650 |
| New Jersey Turnpike Authority, | | | | | |
| Turnpike Revenue (Insured; | | | | | |
| National Public Finance | | | | | |
| Guarantee Corp.) | 6.50 | 1/1/16 | 1,210,000 | | 1,424,521 |
The Fund 17
STATEMENT OF INVESTMENTS (continued)
| | | | |
| Long-Term Municipal | Coupon | Maturity | Principal | |
| Investments (continued) | Rate (%) | Date | Amount ($) | Value ($) |
| New Jersey (continued) | | | | |
| New Jersey Turnpike Authority, | | | | |
| Turnpike Revenue (Insured; | | | | |
| National Public Finance | | | | |
| Guarantee Corp.) | 6.50 | 1/1/16 | 2,310,000 | 2,671,561 |
| North Hudson Sewerage Authority, | | | | |
| Gross Revenue Senior Lien | | | | |
| Lease Certificates (Master | | | | |
| Lease Agreement) | 5.00 | 6/1/42 | 10,320,000 | 11,600,918 |
| North Jersey District Water Supply | | | | |
| Commission, Sewer Revenue | | | | |
| (Wanaque South Project) | | | | |
| (Insured; National Public | | | | |
| Finance Guarantee Corp.) | 6.00 | 7/1/19 | 1,520,000 | 1,788,265 |
| Port Authority of New York and New | | | | |
| Jersey (Consolidated Bonds, | | | | |
| 93rd Series) | 6.13 | 6/1/94 | 3,000,000 | 3,743,850 |
| Port Authority of New York and New | | | | |
| Jersey (Consolidated Bonds, | | | | |
| 139th Series) (Insured; National | | | | |
| Public Finance Guarantee Corp.) | 5.00 | 10/1/18 | 11,235,000 | 12,316,369 |
| Port Authority of New York and New | | | | |
| Jersey (Consolidated Bonds, | | | | |
| 167th Series) | 5.00 | 9/15/24 | 3,675,000 | 4,264,801 |
| Port Authority of New York and New | | | | |
| Jersey (Consolidated Bonds, | | | | |
| 167th Series) | 5.50 | 9/15/26 | 7,600,000 | 9,060,948 |
| Port Authority of New York and New | | | | |
| Jersey, Special Obligation | | | | |
| Revenue (JFK International Air | | | | |
| Terminal LLC Project) | | | | |
| (Insured; National Public | | | | |
| Finance Guarantee Corp.) | 6.25 | 12/1/15 | 5,000,000 | 5,483,900 |
| Port Authority of New York and New | | | | |
| Jersey, Special Project | | | | |
| Revenue (JFK International Air | | | | |
| Terminal LLC Project) | 5.00 | 12/1/20 | 2,500,000 | 2,889,975 |
18
| | | | | |
| Long-Term Municipal | Coupon | Maturity | Principal | | |
| Investments (continued) | Rate (%) | Date | Amount ($) | | Value ($) |
| New Jersey (continued) | | | | | |
| Rahway Valley Sewerage Authority, | | | | | |
| Sewer Revenue (Insured; | | | | | |
| National Public Finance | | | | | |
| Guarantee Corp.) | 0.00 | 9/1/30 | 7,550,000 | a | 3,651,029 |
| Rutgers, The State University, | | | | | |
| GO | 5.00 | 5/1/39 | 3,450,000 | | 3,839,919 |
| South Jersey Port Corporation, | | | | | |
| Marine Terminal Revenue | 5.75 | 1/1/23 | 4,000,000 | | 4,820,120 |
| South Jersey Port Corporation, | | | | | |
| Marine Terminal Revenue | | | | | |
| (Insured; Assured Guaranty | | | | | |
| Municipal Corp.) | 5.75 | 1/1/34 | 2,900,000 | | 3,344,396 |
| South Jersey Port Corporation, | | | | | |
| Marine Terminal Revenue | | | | | |
| (Insured; Assured Guaranty | | | | | |
| Municipal Corp.) | 5.88 | 1/1/39 | 6,000,000 | | 6,910,560 |
| South Jersey Transportation | | | | | |
| Authority, Transportation | | | | | |
| System Revenue | 5.00 | 11/1/23 | 4,250,000 | | 5,107,395 |
| Tobacco Settlement Financing | | | | | |
| Corporation of New Jersey, | | | | | |
| Tobacco Settlement | | | | | |
| Asset-Backed Bonds | 4.50 | 6/1/23 | 2,480,000 | | 2,475,834 |
| Tobacco Settlement Financing | | | | | |
| Corporation of New Jersey, | | | | | |
| Tobacco Settlement | | | | | |
| Asset-Backed Bonds | 4.63 | 6/1/26 | 3,000,000 | | 2,921,460 |
| Tobacco Settlement Financing | | | | | |
| Corporation of New Jersey, | | | | | |
| Tobacco Settlement | | | | | |
| Asset-Backed Bonds | 4.75 | 6/1/34 | 2,800,000 | | 2,505,104 |
| Tobacco Settlement Financing | | | | | |
| Corporation of New Jersey, | | | | | |
| Tobacco Settlement | | | | | |
| Asset-Backed Bonds | 5.00 | 6/1/41 | 4,000,000 | | 3,640,920 |
The Fund 19
STATEMENT OF INVESTMENTS (continued)
| | | | | |
| Long-Term Municipal | Coupon | Maturity | Principal | | |
| Investments (continued) | Rate (%) | Date | Amount ($) | | Value ($) |
| New Jersey (continued) | | | | | |
| Tobacco Settlement Financing | | | | | |
| Corporation of New Jersey, | | | | | |
| Tobacco Settlement | | | | | |
| Asset-Backed Bonds | | | | | |
| (Prerefunded) | 7.00 | 6/1/13 | 2,000,000 | b | 2,056,540 |
| University of Medicine and | | | | | |
| Dentistry of New Jersey, GO | | | | | |
| (Insured; AMBAC) | 5.50 | 12/1/27 | 15,425,000 | | 15,473,743 |
| U.S. Related—10.6% | | | | | |
| Guam, | | | | | |
| Business Privilege Tax Revenue | 5.00 | 1/1/42 | 2,000,000 | | 2,207,960 |
| Guam Power Authority, | | | | | |
| Revenue | 5.50 | 10/1/30 | 2,250,000 | | 2,548,125 |
| Guam Waterworks Authority, | | | | | |
| Water and Wastewater | | | | | |
| System Revenue | 6.00 | 7/1/25 | 1,000,000 | | 1,041,090 |
| Puerto Rico Aqueduct and Sewer | | | | | |
| Authority, Senior Lien Revenue | 5.13 | 7/1/37 | 2,000,000 | | 1,825,820 |
| Puerto Rico Commonwealth, | | | | | |
| Public Improvement GO | 5.50 | 7/1/39 | 6,000,000 | | 5,970,960 |
| Puerto Rico Electric Power | | | | | |
| Authority, Power Revenue | 5.25 | 7/1/22 | 5,000,000 | | 5,228,400 |
| Puerto Rico Electric Power | | | | | |
| Authority, Power Revenue | 5.50 | 7/1/38 | 10,445,000 | | 10,555,926 |
| Puerto Rico Infrastructure | | | | | |
| Financing Authority, Special | | | | | |
| Tax Revenue (Insured; AMBAC) | 5.50 | 7/1/27 | 4,715,000 | | 4,909,069 |
| Puerto Rico Public Buildings | | | | | |
| Authority, Government | | | | | |
| Facilities Revenue | 6.25 | 7/1/22 | 2,000,000 | | 2,228,060 |
| Puerto Rico Sales Tax Financing | | | | | |
| Corporation, Sales Tax Revenue | | | | | |
| (First Subordinate Series) | 5.75 | 8/1/37 | 2,990,000 | | 3,165,005 |
| Puerto Rico Sales Tax Financing | | | | | |
| Corporation, Sales Tax Revenue | | | | | |
| (First Subordinate Series) | 6.00 | 8/1/39 | 2,230,000 | | 2,406,393 |
| Puerto Rico Sales Tax Financing | | | | | |
| Corporation, Sales Tax Revenue | | | | | |
| (First Subordinate Series) | 6.00 | 8/1/42 | 9,000,000 | | 9,637,110 |
20
| | | | | | |
| Long-Term Municipal | Coupon | Maturity | Principal | | | |
| Investments (continued) | Rate (%) | Date | Amount ($) | | | Value ($) |
| U.S. Related (continued) | | | | | | |
| Puerto Rico Sales Tax Financing | | | | | | |
| Corporation, Sales Tax Revenue | | | | | | |
| (Insured; Berkshire Hathaway | | | | | | |
| Assurance Corporation) | 0.00 | 8/1/54 | 21,100,000 | | a | 2,249,049 |
| Puerto Rico Sales Tax Financing | | | | | | |
| Corporation, Sales Tax Revenue | | | | | | |
| (Insured; National Public | | | | | | |
| Finance Guarantee Corp.) | 0.00 | 8/1/43 | 18,000,000 | | a | 3,185,820 |
| Virgin Islands Public Finance | | | | | | |
| Authority, Revenue (Virgin Islands | | | | | | |
| Matching Fund Loan Note) | 5.00 | 10/1/25 | 5,000,000 | | | 5,439,500 |
| Virgin Islands Public Finance | | | | | | |
| Authority, Revenue (Virgin Islands | | | | | | |
| Matching Fund Loan Notes) | 5.00 | 10/1/25 | 2,000,000 | | | 2,155,800 |
| Total Long-Term Municipal Investments | | | | | |
| (cost $540,142,563) | | | | | | 595,160,640 |
| |
| Short-Term Investment—.0% | | | | | | |
| U.S. Treasury Bills; | | | | | | |
| 0.07%, 2/7/13 | | | | | | |
| (cost $289,980) | | | 290,000 | | c | 289,992 |
| |
| Total Investments (cost $540,432,543) | | | 97.3 | % | | 595,450,632 |
| Cash and Receivables (Net) | | | 2.7 | % | | 16,430,864 |
| Net Assets | | | 100.0 | % | | 611,881,496 |
|
| a Security issued with a zero coupon. Income is recognized through the accretion of discount. |
| b These securities are prerefunded; the date shown represents the prerefunded date. Bonds which are prerefunded are |
| collateralized by U.S. Government securities which are held in escrow and are used to pay principal and interest on |
| the municipal issue and to retire the bonds in full at the earliest refunding date. |
| c Held by or on behalf of a counterparty for open swap positions. |
The Fund 21
STATEMENT OF INVESTMENTS (continued)
| | | |
| Summary of Abbreviations | | |
| |
| ABAG | Association of Bay Area | ACA | American Capital Access |
| | Governments | | |
| AGC | ACE Guaranty Corporation | AGIC | Asset Guaranty Insurance Company |
| AMBAC | American Municipal Bond | ARRN | Adjustable Rate |
| | Assurance Corporation | | Receipt Notes |
| BAN | Bond Anticipation Notes | BPA | Bond Purchase Agreement |
| CIFG | CDC Ixis Financial Guaranty | COP | Certificate of Participation |
| CP | Commercial Paper | DRIVERS | Derivative Inverse |
| | | | Tax-Exempt Receipts |
| EDR | Economic Development | EIR | Environmental Improvement |
| | Revenue | | Revenue |
| FGIC | Financial Guaranty | FHA | Federal Housing |
| | Insurance Company | | Administration |
| FHLB | Federal Home | FHLMC | Federal Home Loan Mortgage |
| | Loan Bank | | Corporation |
| FNMA | Federal National | GAN | Grant Anticipation Notes |
| | Mortgage Association | | |
| GIC | Guaranteed Investment | GNMA | Government National Mortgage |
| | Contract | | Association |
| GO | General Obligation | HR | Hospital Revenue |
| IDB | Industrial Development Board | IDC | Industrial Development Corporation |
| IDR | Industrial Development | LIFERS | Long Inverse Floating |
| | Revenue | | Exempt Receipts |
| LOC | Letter of Credit | LOR | Limited Obligation Revenue |
| LR | Lease Revenue | MERLOTS | Municipal Exempt Receipt |
| | | | Liquidity Option Tender |
| MFHR | Multi-Family Housing Revenue | MFMR | Multi-Family Mortgage Revenue |
| PCR | Pollution Control Revenue | PILOT | Payment in Lieu of Taxes |
| P-FLOATS | Puttable Floating Option | PUTTERS | Puttable Tax-Exempt Receipts |
| | Tax-Exempt Receipts | | |
| RAC | Revenue Anticipation Certificates | RAN | Revenue Anticipation Notes |
| RAW | Revenue Anticipation Warrants | ROCS | Reset Options Certificates |
| RRR | Resources Recovery Revenue | SAAN | State Aid Anticipation Notes |
| SBPA | Standby Bond Purchase Agreement | SFHR | Single Family Housing Revenue |
| SFMR | Single Family Mortgage Revenue | SONYMA | State of New York Mortgage Agency |
| SPEARS | Short Puttable Exempt | SWDR | Solid Waste Disposal Revenue |
| | Adjustable Receipts | | |
| TAN | Tax Anticipation Notes | TAW | Tax Anticipation Warrants |
| TRAN | Tax and Revenue Anticipation Notes | XLCA | XL Capital Assurance |
22
| | | | | |
| Summary of Combined Ratings (Unaudited) | |
| |
| Fitch | or | Moody’s | or | Standard & Poor’s | Value (%)† |
| AAA | | Aaa | | AAA | 9.0 |
| AA | | Aa | | AA | 27.6 |
| A | | A | | A | 44.3 |
| BBB | | Baa | | BBB | 15.3 |
| BB | | Ba | | BB | .2 |
| B | | B | | B | 1.9 |
| F1 | | MIG1/P1 | | SP1/A1 | .1 |
| Not Ratedd | | Not Ratedd | | Not Ratedd | 1.6 |
| | | | | | 100.0 |
|
| † Based on total investments. |
| d Securities which, while not rated by Fitch, Moody’s and Standard & Poor’s, have been determined by the Manager to |
| be of comparable quality to those rated securities in which the fund may invest. |
See notes to financial statements.
The Fund 23
STATEMENT OF ASSETS AND LIABILITIES
December 31, 2012
| | | |
| | Cost | Value | |
| Assets ($): | | | |
| Investments in securities—See Statement of Investments | 540,432,543 | 595,450,632 | |
| Cash | | 8,281,744 | |
| Interest receivable | | 8,807,951 | |
| Unrealized appreciation on swap contracts—Note 4 | | 263,597 | |
| Receivable for shares of Common Stock subscribed | | 40,905 | |
| Prepaid expenses | | 43,613 | |
| | | 612,888,442 | |
| Liabilities ($): | | | |
| Due to The Dreyfus Corporation and affiliates—Note 3(c) | | 460,587 | |
| Unrealized depreciation on swap contracts—Note 4 | | 256,665 | |
| Payable for shares of Common Stock redeemed | | 195,308 | |
| Accrued expenses | | 94,386 | |
| | | 1,006,946 | |
| Net Assets ($) | | 611,881,496 | |
| Composition of Net Assets ($): | | | |
| Paid-in capital | | 565,691,974 | |
| Accumulated net realized gain (loss) on investments | | (8,835,499 | ) |
| Accumulated net unrealized appreciation (depreciation) | | | |
| on investments and swap transactions | | 55,025,021 | |
| Net Assets ($) | | 611,881,496 | |
| | | | |
| Net Asset Value Per Share | | | | |
| | Class A | Class C | Class I | Class Z |
| Net Assets ($) | 457,617,909 | 10,403,373 | 4,526,574 | 139,333,640 |
| Shares Outstanding | 34,111,563 | 776,196 | 337,359 | 10,384,094 |
| Net Asset Value Per Share ($) | 13.42 | 13.40 | 13.42 | 13.42 |
| |
| See notes to financial statements. | | | | |
24
STATEMENT OF OPERATIONS
Year Ended December 31, 2012
| | |
| Investment Income ($): | | |
| Interest Income | 27,762,243 | |
| Expenses: | | |
| Management fee—Note 3(a) | 3,676,707 | |
| Shareholder servicing costs—Note 3(c) | 1,521,560 | |
| Professional fees | 97,467 | |
| Directors’ fees and expenses—Note 3(d) | 94,175 | |
| Distribution fees—Note 3(b) | 74,047 | |
| Registration fees | 61,621 | |
| Custodian fees—Note 3(c) | 50,552 | |
| Prospectus and shareholders’ reports | 49,607 | |
| Loan commitment fees—Note 2 | 8,156 | |
| Miscellaneous | 53,356 | |
| Total Expenses | 5,687,248 | |
| Less—reduction in expenses due to undertaking—Note 3(a) | (506,058 | ) |
| Less—reduction in fees due to earnings credits—Note 3(c) | (655 | ) |
| Net Expenses | 5,180,535 | |
| Investment Income—Net | 22,581,708 | |
| Realized and Unrealized Gain (Loss) on Investments—Note 4 ($): | | |
| Net realized gain (loss) on investments | 2,109,276 | |
| Net realized gain (loss) on swap transactions | (190,000 | ) |
| Net Realized Gain (Loss) | 1,919,276 | |
| Net unrealized appreciation (depreciation) on investments | 16,269,633 | |
| Net unrealized appreciation (depreciation) on swap transactions | 6,932 | |
| Net Unrealized Appreciation (Depreciation) | 16,276,565 | |
| Net Realized and Unrealized Gain (Loss) on Investments | 18,195,841 | |
| Net Increase in Net Assets Resulting from Operations | 40,777,549 | |
| |
| See notes to financial statements. | | |
The Fund 25
STATEMENT OF CHANGES IN NET ASSETS
| | | | |
| | Year Ended December 31, | |
| | 2012 | a | 2011 | |
| Operations ($): | | | | |
| Investment income—net | 22,581,708 | | 24,238,697 | |
| Net realized gain (loss) on investments | 1,919,276 | | (2,528,365 | ) |
| Net unrealized appreciation | | | | |
| (depreciation) on investments | 16,276,565 | | 36,597,601 | |
| Net Increase (Decrease) in Net Assets | | | | |
| Resulting from Operations | 40,777,549 | | 58,307,933 | |
| Dividends to Shareholders from ($): | | | | |
| Investment income—net: | | | | |
| Class A Shares | (16,714,197 | ) | (17,916,454 | ) |
| Class B Shares | (412 | ) | (11,078 | ) |
| Class C Shares | (284,662 | ) | (291,501 | ) |
| Class I Shares | (133,127 | ) | (100,906 | ) |
| Class Z Shares | (5,222,345 | ) | (5,633,078 | ) |
| Total Dividends | (22,354,743 | ) | (23,953,017 | ) |
| Capital Stock Transactions ($): | | | | |
| Net proceeds from shares sold: | | | | |
| Class A Shares | 35,392,609 | | 28,763,272 | |
| Class B Shares | 138 | | 2,102 | |
| Class C Shares | 2,580,263 | | 1,591,464 | |
| Class I Shares | 3,229,352 | | 834,997 | |
| Class Z Shares | 6,384,263 | | 4,012,360 | |
| Dividends reinvested: | | | | |
| Class A Shares | 12,523,211 | | 13,306,484 | |
| Class B Shares | 262 | | 7,868 | |
| Class C Shares | 153,502 | | 150,423 | |
| Class I Shares | 92,334 | | 63,443 | |
| Class Z Shares | 4,237,919 | | 4,545,138 | |
| Cost of shares redeemed: | | | | |
| Class A Shares | (47,960,219 | ) | (59,475,244 | ) |
| Class B Shares | (217,906 | ) | (298,762 | ) |
| Class C Shares | (1,653,583 | ) | (2,287,276 | ) |
| Class I Shares | (1,472,678 | ) | (710,540 | ) |
| Class Z Shares | (13,101,340 | ) | (14,941,227 | ) |
| Increase (Decrease) in Net Assets | | | | |
| from Capital Stock Transactions | 188,127 | | (24,435,498 | ) |
| Total Increase (Decrease) in Net Assets | 18,610,933 | | 9,919,418 | |
| Net Assets ($): | | | | |
| Beginning of Period | 593,270,563 | | 583,351,145 | |
| End of Period | 611,881,496 | | 593,270,563 | |
26
| | | | |
| | Year Ended December 31, | |
| | 2012 | a | 2011 | |
| Capital Share Transactions: | | | | |
| Class Ab | | | | |
| Shares sold | 2,647,586 | | 2,296,610 | |
| Shares issued for dividends reinvested | 935,333 | | 1,064,904 | |
| Shares redeemed | (3,583,544 | ) | (4,801,204 | ) |
| Net Increase (Decrease) in Shares Outstanding | (625 | ) | (1,439,690 | ) |
| Class Bb | | | | |
| Shares sold | 10 | | 169 | |
| Shares issued for dividends reinvested | 20 | | 633 | |
| Shares redeemed | (16,545 | ) | (24,189 | ) |
| Net Increase (Decrease) in Shares Outstanding | (16,515 | ) | (23,387 | ) |
| Class C | | | | |
| Shares sold | 193,235 | | 127,862 | |
| Shares issued for dividends reinvested | 11,469 | | 12,066 | |
| Shares redeemed | (123,510 | ) | (186,803 | ) |
| Net Increase (Decrease) in Shares Outstanding | 81,194 | | (46,875 | ) |
| Class I | | | | |
| Shares sold | 242,671 | | 67,258 | |
| Shares issued for dividends reinvested | 6,882 | | 5,065 | |
| Shares redeemed | (110,898 | ) | (57,453 | ) |
| Net Increase (Decrease) in Shares Outstanding | 138,655 | | 14,870 | |
| Class Z | | | | |
| Shares sold | 477,197 | | 320,272 | |
| Shares issued for dividends reinvested | 316,519 | | 363,730 | |
| Shares redeemed | (978,508 | ) | (1,212,600 | ) |
| Net Increase (Decrease) in Shares Outstanding | (184,792 | ) | (528,598 | ) |
|
| a Effective as of the close of business on March 13, 2012, the fund no longer offers Class B shares. |
| b During the period ended December 31, 2012, 1,079 Class B shares representing $14,086 were automatically |
| converted to 1,078 Class A shares and during the period ended December 31, 2011, 7,796 Class B shares |
| representing $97,746 were automatically converted to 7,788 Class A shares. |
See notes to financial statements.
The Fund 27
FINANCIAL HIGHLIGHTS
The following tables describe the performance for each share class for the fiscal periods indicated.All information (except portfolio turnover rate) reflects financial results for a single fund share.Total return shows how much your investment in the fund would have increased (or decreased) during each period, assuming you had reinvested all dividends and distributions.These figures have been derived from the fund’s financial statements.
| | | | | | | | | | |
| | | | Year Ended December 31, | | | |
| Class A Shares | 2012 | | 2011 | | 2010 | | 2009 | | 2008 | |
| Per Share Data ($): | | | | | | | | | | |
| Net asset value, beginning of period | 13.01 | | 12.25 | | 12.70 | | 11.67 | | 12.79 | |
| Investment Operations: | | | | | | | | | | |
| Investment income—neta | .49 | | .53 | | .54 | | .55 | | .55 | |
| Net realized and unrealized | | | | | | | | | | |
| gain (loss) on investments | .41 | | .75 | | (.46 | ) | 1.02 | | (1.12 | ) |
| Total from Investment Operations | .90 | | 1.28 | | .08 | | 1.57 | | (.57 | ) |
| Distributions: | | | | | | | | | | |
| Dividends from investment income—net | (.49 | ) | (.52 | ) | (.53 | ) | (.54 | ) | (.55 | ) |
| Net asset value, end of period | 13.42 | | 13.01 | | 12.25 | | 12.70 | | 11.67 | |
| Total Return (%)b | 6.96 | | 10.72 | | .56 | | 13.65 | | (4.61 | ) |
| Ratios/Supplemental Data (%): | | | | | | | | | | |
| Ratio of total expenses | | | | | | | | | | |
| to average net assets | .96 | | .96 | | .95 | | .96 | | 1.00 | |
| Ratio of net expenses | | | | | | | | | | |
| to average net assets | .85 | | .85 | | .85 | | .85 | | .90 | |
| Ratio of interest and expense related | | | | | | | | | | |
| to floating rate notes issued | | | | | | | | | | |
| to average net assets | — | | — | | — | | — | | .05 | |
| Ratio of net investment income | | | | | | | | | | |
| to average net assets | 3.68 | | 4.23 | | 4.22 | | 4.40 | | 4.45 | |
| Portfolio Turnover Rate | 12.10 | | 9.58 | | 18.88 | | 17.17 | | 50.33 | |
| Net Assets, end of period ($ x 1,000) | 457,618 | | 443,882 | | 435,549 | | 458,014 | | 403,333 | |
| |
| a | Based on average shares outstanding at each month end. |
| b | Exclusive of sales charge. |
See notes to financial statements.
28
| | | | | | | | | | |
| | | | Year Ended December 31, | | | |
| Class C Shares | 2012 | | 2011 | | 2010 | | 2009 | | 2008 | |
| Per Share Data ($): | | | | | | | | | | |
| Net asset value, beginning of period | 13.00 | | 12.24 | | 12.68 | | 11.66 | | 12.78 | |
| Investment Operations: | | | | | | | | | | |
| Investment income—neta | .39 | | .43 | | .45 | | .45 | | .45 | |
| Net realized and unrealized | | | | | | | | | | |
| gain (loss) on investments | .40 | | .76 | | (.45 | ) | 1.02 | | (1.12 | ) |
| Total from Investment Operations | .79 | | 1.19 | | — | | 1.47 | | (.67 | ) |
| Distributions: | | | | | | | | | | |
| Dividends from investment income—net | (.39 | ) | (.43 | ) | (.44 | ) | (.45 | ) | (.45 | ) |
| Net asset value, end of period | 13.40 | | 13.00 | | 12.24 | | 12.68 | | 11.66 | |
| Total Return (%)b | 6.09 | | 9.90 | | (.13 | ) | 12.71 | | (5.34 | ) |
| Ratios/Supplemental Data (%): | | | | | | | | | | |
| Ratio of total expenses | | | | | | | | | | |
| to average net assets | 1.74 | | 1.73 | | 1.72 | | 1.72 | | 1.77 | |
| Ratio of net expenses | | | | | | | | | | |
| to average net assets | 1.60 | | 1.60 | | 1.60 | | 1.60 | | 1.64 | |
| Ratio of interest and expense related | | | | | | | | | | |
| to floating rate notes issued | | | | | | | | | | |
| to average net assets | — | | — | | — | | — | | .05 | |
| Ratio of net investment income | | | | | | | | | | |
| to average net assets | 2.92 | | 3.48 | | 3.45 | | 3.61 | | 3.69 | |
| Portfolio Turnover Rate | 12.10 | | 9.58 | | 18.88 | | 17.17 | | 50.33 | |
| Net Assets, end of period ($ x 1,000) | 10,403 | | 9,035 | | 9,080 | | 9,008 | | 4,714 | |
| |
| a | Based on average shares outstanding at each month end. |
| b | Exclusive of sales charge. |
See notes to financial statements.
The Fund 29
FINANCIAL HIGHLIGHTS (continued)
| | | | | | | | | | |
| | | | Year Ended December 31, | | | |
| Class I Shares | 2012 | | 2011 | | 2010 | | 2009 | | 2008 | a |
| Per Share Data ($): | | | | | | | | | | |
| Net asset value, beginning of period | 13.02 | | 12.25 | | 12.70 | | 11.66 | | 11.28 | |
| Investment Operations: | | | | | | | | | | |
| Investment income—netb | .50 | | .54 | | .57 | | .56 | | .03 | |
| Net realized and unrealized | | | | | | | | | | |
| gain (loss) on investments | .41 | | .77 | | (.47 | ) | 1.04 | | .38 | |
| Total from Investment Operations | .91 | | 1.31 | | .10 | | 1.60 | | .41 | |
| Distributions: | | | | | | | | | | |
| Dividends from investment income—net | (.51 | ) | (.54 | ) | (.55 | ) | (.56 | ) | (.03 | ) |
| Net asset value, end of period | 13.42 | | 13.02 | | 12.25 | | 12.70 | | 11.66 | |
| Total Return (%) | 7.04 | | 10.97 | | .70 | | 13.91 | | 3.61 | c |
| Ratios/Supplemental Data (%): | | | | | | | | | | |
| Ratio of total expenses | | | | | | | | | | |
| to average net assets | .74 | | .76 | | .72 | | .78 | | .76 | d |
| Ratio of net expenses | | | | | | | | | | |
| to average net assets | .70 | | .70 | | .70 | | .70 | | .70 | d |
| Ratio of net investment income | | | | | | | | | | |
| to average net assets | 3.82 | | 4.36 | | 4.34 | | 4.55 | | 5.03 | d |
| Portfolio Turnover Rate | 12.10 | | 9.58 | | 18.88 | | 17.17 | | 50.33 | |
| Net Assets, end of period ($ x 1,000) | 4,527 | | 2,586 | | 2,252 | | 958 | | 10 | |
| |
| a | From December 15, 2008 (commencement of initial offering) to December 31, 2008. |
| b | Based on average shares outstanding at each month end. |
| c | Not annualized. |
| d | Annualized. |
See notes to financial statements.
30
| | | | | | | | | | |
| | | | Year Ended December 31, | | | |
| Class Z Shares | 2012 | | 2011 | | 2010 | | 2009 | | 2008 | |
| Per Share Data ($): | | | | | | | | | | |
| Net asset value, beginning of period | 13.01 | | 12.25 | | 12.70 | | 11.67 | | 12.79 | |
| Investment Operations: | | | | | | | | | | |
| Investment income—neta | .50 | | .54 | | .55 | | .56 | | .56 | |
| Net realized and unrealized | | | | | | | | | | |
| gain (loss) on investments | .41 | | .75 | | (.46 | ) | 1.02 | | (1.12 | ) |
| Total from Investment Operations | .91 | | 1.29 | | .09 | | 1.58 | | (.56 | ) |
| Distributions: | | | | | | | | | | |
| Dividends from investment income—net | (.50 | ) | (.53 | ) | (.54 | ) | (.55 | ) | (.56 | ) |
| Net asset value, end of period | 13.42 | | 13.01 | | 12.25 | | 12.70 | | 11.67 | |
| Total Return (%) | 7.04 | | 10.80 | | .65 | | 13.72 | | (4.56 | ) |
| Ratios/Supplemental Data (%): | | | | | | | | | | |
| Ratio of total expenses | | | | | | | | | | |
| to average net assets | .78 | | .78 | | .77 | | .79 | | .85 | |
| Ratio of net expenses | | | | | | | | | | |
| to average net assets | .78 | | .78 | | .77 | | .78 | | .85 | |
| Ratio of interest and expense related | | | | | | | | | | |
| to floating rate notes issued | | | | | | | | | | |
| to average net assets | — | | — | | — | | — | | .05 | |
| Ratio of net investment income | | | | | | | | | | |
| to average net assets | 3.75 | | 4.30 | | 4.31 | | 4.47 | | 4.50 | |
| Portfolio Turnover Rate | 12.10 | | 9.58 | | 18.88 | | 17.17 | | 50.33 | |
| Net Assets, end of period ($ x 1,000) | 139,334 | | 137,552 | | 135,981 | | 148,768 | | 140,950 | |
| |
| a Based on average shares outstanding at each month end. | | | | | | | | | |
| See notes to financial statements. | | | | | | | | | | |
The Fund 31
NOTES TO FINANCIAL STATEMENTS
NOTE 1—Significant Accounting Policies:
Dreyfus New Jersey Municipal Bond Fund, Inc. (the “fund”) is registered under the Investment Company Act of 1940, as amended (the “Act”), as a non-diversified open-end management investment com-pany.The fund’s investment objective is to seek as high a level of current income exempt from federal and New Jersey income taxes as is consistent with the preservation of capital. The Dreyfus Corporation (the “Manager” or “Dreyfus”), a wholly-owned subsidiary of The Bank of New York Mellon Corporation (“BNY Mellon”), serves as the fund’s investment adviser.
MBSC Securities Corporation (the “Distributor”), a wholly-owned subsidiary of the Manager, is the distributor of the fund’s shares. The fund is authorized to issue 675 million shares of $.001 par value Common Stock.The fund currently offers four classes of shares: Class A (350 million shares authorized), Class C (150 million shares authorized), Class I (150 million shares authorized) and Class Z (25 million shares authorized). Class A shares are subject to a sales charge imposed at the time of purchase. Class C shares are subject to a contingent deferred sales charge (“CDSC”) imposed on Class C shares redeemed within one year of purchase. Class I shares are sold at net asset value per share only to institutional investors. Class Z shares generally are not available for new accounts.The fund’s Board of Directors (the “Board”) approved, effective as of the close of business on March 13, 2012, the transfer of shares authorized from Class B to Class A. Class B shares were subject to a CDSC imposed on Class B share redemptions made within six years of purchase and automatically converted to Class A shares after six years.The fund no longer offers Class B shares. Effective March 13, 2012, all outstanding Class B shares were automatically converted to Class A shares. Other differences between the classes include the services offered to and the expenses borne by each class, the allocation of certain transfer agency costs and certain voting rights.
32
Income, expenses (other than expenses attributable to a specific class), and realized and unrealized gains or losses on investments are allocated to each class of shares based on its relative net assets.
The Financial Accounting Standards Board (“FASB”) Accounting Standards Codification is the exclusive reference of authoritative U.S. generally accepted accounting principles (“GAAP”) recognized by the FASB to be applied by nongovernmental entities. Rules and interpretive releases of the Securities and Exchange Commission (“SEC”) under authority of federal laws are also sources of authoritative GAAP for SEC registrants. The fund’s financial statements are prepared in accordance with GAAP, which may require the use of management estimates and assumptions.Actual results could differ from those estimates.
The fund enters into contracts that contain a variety of indemnifications. The fund’s maximum exposure under these arrangements is unknown.The fund does not anticipate recognizing any loss related to these arrangements.
(a) Portfolio valuation: The fair value of a financial instrument is the amount that would be received to sell an asset or paid to transfer a liability in an orderly transaction between market participants at the measurement date (i.e., the exit price). GAAP establishes a fair value hierarchy that prioritizes the inputs of valuation techniques used to measure fair value.This hierarchy gives the highest priority to unadjusted quoted prices in active markets for identical assets or liabilities (Level 1 measurements) and the lowest priority to unobservable inputs (Level 3 measurements).
Additionally, GAAP provides guidance on determining whether the volume and activity in a market has decreased significantly and whether such a decrease in activity results in transactions that are not orderly. GAAP requires enhanced disclosures around valuation inputs and techniques used during annual and interim periods.
The Fund 33
NOTES TO FINANCIAL STATEMENTS (continued)
Various inputs are used in determining the value of the fund’s investments relating to fair value measurements.These inputs are summarized in the three broad levels listed below:
Level 1—unadjusted quoted prices in active markets for identical investments.
Level 2—other significant observable inputs (including quoted prices for similar investments, interest rates, prepayment speeds, credit risk, etc.).
Level 3—significant unobservable inputs (including the fund’s own assumptions in determining the fair value of investments).
The inputs or methodology used for valuing securities are not necessarily an indication of the risk associated with investing in those securities.
Changes in valuation techniques may result in transfers in or out of an assigned level within the disclosure hierarchy. Valuation techniques used to value the fund’s investments are as follows:
Investments in securities are valued each business day by an independent pricing service (the “Service”) approved by the Board. Investments for which quoted bid prices are readily available and are representative of the bid side of the market in the judgment of the Service are valued at the mean between the quoted bid prices (as obtained by the Service from dealers in such securities) and asked prices (as calculated by the Service based upon its evaluation of the market for such securities). Other investments (which constitute a majority of the portfolio securities) are carried at fair value as determined by the Service, based on methods which include consideration of the following: yields or prices of municipal securities of comparable quality, coupon, maturity and type; indications as to values from dealers; and general market conditions. All of the preceding securities are categorized within Level 2 of the fair value hierarchy. Swaps are valued by the Service by using a swap pricing model which incorporates among other factors, default probabilities, recovery rates, credit curves of the underlying issuer and swap spreads on interest rates.These securities are generally categorized within Level 2 of the fair value hierarchy.
34
The Service’s procedures are reviewed by Dreyfus under the general supervision of the Board.
When market quotations or official closing prices are not readily available, or are determined not to reflect accurately fair value, such as when the value of a security has been significantly affected by events after the close of the exchange or market on which the security is principally traded, but before the fund calculates its net asset value, the fund may value these investments at fair value as determined in accordance with the procedures approved by the Board. Certain factors may be considered when fair valuing investments such as: fundamental analytical data, the nature and duration of restrictions on disposition, an evaluation of the forces that influence the market in which the securities are purchased and sold, and public trading in similar securities of the issuer or comparable issuers.These securities are either categorized within Level 2 or 3 depending on the relevant inputs used.
For restricted securities where observable inputs are limited, assumptions about market activity and risk are used and are categorized within Level 3 of the fair value hierarchy.
The following is a summary of the inputs used as of December 31, 2012 in valuing the fund’s investments:
| | | | | | |
| | | Level 2—Other | | Level 3— | | |
| | Level 1— | Significant | | Significant | | |
| | Unadjusted | Observable | | Unobservable | | |
| | Quoted Prices | Inputs | | Inputs | Total | |
| Assets ($) | | | | | | |
| Investments in Securities: | | | | | |
| Municipal Bonds | — | 595,160,640 | | — | 595,160,640 | |
| U.S. Treasury | — | 289,992 | | — | 289,992 | |
| Other Financial | | | | | | |
| Instruments: | | | | | | |
| Swaps† | — | 263,597 | | — | 263,597 | |
| Liabilities ($) | | | | | | |
| Other Financial | | | | | | |
| Instruments: | | | | | | |
| Swaps† | — | (256,665 | ) | — | (256,665 | ) |
| |
| † Amount shown represents unrealized appreciation (depreciation) at period end. | | |
The Fund 35
NOTES TO FINANCIAL STATEMENTS (continued)
At December 31, 2012, there were no transfers between Level 1 and Level 2 of the fair value hierarchy.
(b) Securities transactions and investment income: Securities transactions are recorded on a trade date basis. Realized gains and losses from securities transactions are recorded on the identified cost basis. Interest income, adjusted for accretion of discount and amortization of premium on investments, is earned from settlement date and recognized on the accrual basis. Securities purchased or sold on a when issued or delayed delivery basis may be settled a month or more after the trade date.
The fund follows an investment policy of investing primarily in municipal obligations of one state. Economic changes affecting the state and certain of its public bodies or municipalities may affect the ability of issuers within the state to pay interest on, or repay principal of, municipal obligations held by the fund.
(c) Dividends to shareholders: It is the policy of the fund to declare dividends from investment income-net. Such dividends are paid monthly. Dividends from net realized capital gains, if any, are normally declared and paid annually, but the fund may make distributions on a more frequent basis to comply with the distribution requirements of the Internal Revenue Code of 1986, as amended (the “Code”).To the extent that net realized capital gains can be offset by capital loss carryovers, it is the policy of the fund not to distribute such gains. Income and capital gain distributions are determined in accordance with income tax regulations, which may differ from GAAP.
(d) Federal income taxes: It is the policy of the fund to continue to qualify as a regulated investment company, which can distribute tax-exempt dividends, by complying with the applicable provisions of the Code, and to make distributions of income and net realized capital gains sufficient to relieve it from substantially all federal income and excise taxes.
36
As of and during the period ended December 31, 2012, the fund did not have any liabilities for any uncertain tax positions.The fund recognizes interest and penalties, if any, related to uncertain tax positions as income tax expense in the Statement of Operations. During the period, the fund did not incur any interest or penalties.
Each of the tax years in the four-year period ended December 31, 2012 remains subject to examination by the Internal Revenue Service and state taxing authorities.
At December 31, 2012, the components of accumulated earnings on a tax basis were as follows: undistributed tax-exempt income $698,173, undistributed ordinary income $256,815, accumulated capital losses $9,794,302 and unrealized appreciation $55,727,009.
Under the Regulated Investment Company Modernization Act of 2010 (the “2010 Act”), the fund is permitted to carry forward capital losses incurred in taxable years beginning after December 22, 2010 (“post-enactment losses”) for an unlimited period. Furthermore, post-enactment capital loss carryovers retain their character as either short-term or long-term capital losses rather than short-term as they were under previous statute.The 2010 Act requires post-enactment losses to be utilized before the utilization of losses incurred in taxable years prior to the effective date of the 2010 Act (“pre-enactment losses”).As a result of this ordering rule, pre-enactment losses may be more likely to expire unused.
The accumulated capital loss carryover is available for federal income tax purposes to be applied against future net realized capital gains, if any, realized subsequent to December 31, 2012. If not applied, $97,441 of the carryover expires in fiscal year 2014, $822,282 expires in fiscal year 2015, $1,125,950 expires in fiscal year 2016 and $6,969,933 expires in fiscal year 2017.The fund has $778,696 of post enactment short-term capital losses which can be carried forward for an unlimited period.
The Fund 37
NOTES TO FINANCIAL STATEMENTS (continued)
The tax character of distributions paid to shareholders during the fiscal periods ended December 31, 2012 and December 31, 2011 were as follows: tax-exempt income $22,354,743 and $23,788,452 and ordinary income $0 and $164,565, respectively.
During the period ended December 31, 2012, as a result of permanent book to tax differences, primarily due to the tax treatment for amortization adjustments, the fund decreased accumulated undistributed investment income-net by $226,965, increased accumulated net realized gain (loss) on investments by $172,993 and increased paid-in capital by $53,972. Net assets and net asset value per share were not affected by this reclassification.
(e) New Accounting Pronouncement: In December 2011, FASB issued Accounting Standards Update No. 2011-11 “Disclosures about Offsetting Assets and Liabilities” (“ASU 2011-11”). These disclosure requirements are intended to help investors and other financial statement users to better assess the effect or potential effect of offsetting arrangements on a company’s financial position.They also improve transparency in the reporting of how companies mitigate credit risk, including disclosure of related collateral pledged or received. In addition,ASU 2011-11 facilitates comparison between those entities that prepare their financial statements on the basis of GAAP and those entities that prepare their financial statements on the basis of International Financial Reporting Standards (“IFRS”). ASU 2011-11 requires entities to: disclose both gross and net information about both instruments and transactions eligible for offset in the financial statements; and disclose instruments and transactions subject to an agreement similar to a master netting agreement. ASU 2011-11 is effective for fiscal years beginning on or after January 1, 2013, and interim periods within those annual periods.At this time, management is evaluating the implications of ASU 2011-11 and its impact on the fund’s financial statement disclosures.
38
NOTE 2—Bank Lines of Credit:
The fund participates with other Dreyfus-managed funds in a $210 million unsecured credit facility led by Citibank, N.A. and a $300 million unsecured credit facility provided by The Bank of New York Mellon, a subsidiary of BNY Mellon and an affiliate of Dreyfus (each, a “Facility”), each to be utilized primarily for temporary or emergency purposes, including the financing of redemptions. Prior to October 10, 2012, the unsecured credit facility with Citibank, N.A. was $225 million. In connection therewith, the fund has agreed to pay its pro rata portion of commitment fees for each Facility. Interest is charged to the fund based on rates determined pursuant to the terms of the respective Facility at the time of borrowing. During the period ended December 31, 2012, the fund did not borrow under the Facilities.
NOTE 3—Management Fee and Other Transactions With Affiliates:
(a) Pursuant to a management agreement with the Manager, the management fee is computed at the annual rate of .60% of the value of the fund’s average daily net assets and is payable monthly. The Manager has agreed from January 1, 2012 through May 1, 2013, to limit the fund’s Class A and Class C shares (and Class B shares from January 1, 2012 through March 13, 2012) expenses (excluding Rule 12b-1 Distribution Plan fees, Shareholder Services Plan fees, taxes, brokerage commissions, interest expense, commitment fees on borrowings and extraordinary expenses) to .60% of the value of the fund’s average daily net assets for Class A, Class B and Class C shares.The reduction in expenses, pursuant to the undertaking, for Class A, Class B and Class C shares amounted to $504,587 during the period ended December 31, 2012.This agreement may be terminated after May 1, 2013, upon 90 days notice to shareholders.
The Fund 39
NOTES TO FINANCIAL STATEMENTS (continued)
The Manager had undertaken from January 1, 2012 through December 31, 2012, to limit the fund’s operating expenses or assume all or part of the expenses of the fund, if the aggregate expenses of the fund (excluding taxes, brokerage commissions, interest expense, commitment fees on borrowings, and extraordinary expenses) exceeded .70% of the value of the fund’s average daily net assets for Class I shares. The reduction in expenses, pursuant to the undertaking for Class I shares, amounted to $1,471 during the period ended December 31, 2012.
During the period ended December 31, 2012, the Distributor retained $10,159 from commissions earned on sales of the fund’s Class A shares and $449 from CDSCs on redemptions of the fund’s Class C shares.
(b) Under the Distribution Plan adopted pursuant to Rule 12b-1 under the Act, Class B shares paid and Class C shares pay the Distributor for distributing their shares at an annual rate of .50% of the value of the average daily net assets of Class B shares and .75% of the value of the average daily net assets of Class C shares. During the period ended December 31, 2012, Class B and Class C shares were charged $57 and $73,990, respectively, pursuant to the Distribution Plan.
(c) Under the Shareholder Services Plan, Class A and Class C shares pay and Class B shares paid the Distributor at an annual rate of .25% of the value of their average daily net assets for the provision of certain services. The services provided may include personal services relating to shareholder accounts, such as answering shareholder inquiries regarding the fund and providing reports and other information, and services related to the maintenance of shareholder accounts. The Distributor may make payments to Service Agents (securities dealers, financial institutions or other industry professionals) with respect to these services. The Distributor determines the amounts to be paid to Service Agents. During the period ended December 31, 2012, Class A, Class B and Class C shares were charged $1,147,133, $29 and $24,663, respectively, pursuant to the Shareholder Services Plan.
40
Under the Shareholder Services Plan, Class Z shares reimburse the Distributor an amount not to exceed an annual rate of .25% of the value of Class Z shares’ average daily net assets for certain allocated expenses of providing personal services and/or maintaining shareholder accounts. The services provided may include personal services relating to shareholder accounts, such as answering shareholder inquiries regarding Class Z shares and providing reports and other information, and services related to the maintenance of shareholder accounts. During the period ended December 31, 2012, Class Z shares were charged $78,949 pursuant to the Shareholder Services Plan.
The fund has arrangements with the transfer agent and the custodian whereby the fund may receive earnings credits when positive cash balances are maintained, which are used to offset transfer agency and custody fees. For financial reporting purposes, the fund includes net earnings credits as an expense offset in the Statement of Operations.
The fund compensates Dreyfus Transfer, Inc., a wholly-owned subsidiary of the Manager, under a transfer agency agreement for providing transfer agency services for the fund and, since May 29, 2012, cash management services related to fund subscriptions and redemptions. During the period ended December 31, 2012, the fund was charged $152,317 for transfer agency services and $3,167 for cash management services. Cash management fees were partially offset by earnings credits of $368.These fees are included in Shareholder servicing costs in the Statement of Operations.
The fund compensatesThe Bank of NewYork Mellon under a custody agreement for providing custodial services for the fund. During the period ended December 31, 2012, the fund was charged $50,552 pursuant to the custody agreement.
Prior to May 29, 2012, the fund compensated The Bank of New York Mellon under a cash management agreement for performing cash management services related to fund subscriptions and redemptions. During
The Fund 41
NOTES TO FINANCIAL STATEMENTS (continued)
the period ended December 31, 2012, the fund was charged $7,405 pursuant to the cash management agreement, which is included in Shareholder servicing costs in the Statement of Operations.These fees were partially offset by earnings credits of $287.
During the period ended December 31, 2012, the fund was charged $8,783 for services performed by the Chief Compliance Officer and his staff.
The components of “Due toThe Dreyfus Corporation and affiliates” in the Statement of Assets and Liabilities consist of: management fees $314,966, Distribution Plan fees $6,669, Shareholder Services Plan fees $100,663, custodian fees $16,516, Chief Compliance Officer fees $3,981 and transfer agency fees $39,430, which are offset against an expense reimbursement currently in effect in the amount of $21,638.
(d) Each Board member also serves as a Board member of other funds within the Dreyfus complex. Annual retainer fees and attendance fees are allocated to each fund based on net assets.
NOTE 4—Securities Transactions:
The aggregate amount of purchases and sales of investment securities, excluding short-term securities and swap transactions, during the period ended December 31, 2012, amounted to $72,940,558 and $74,646,003, respectively.
Derivatives: A derivative is a financial instrument whose performance is derived from the performance of another asset. Each type of derivative instrument that was held by the fund during the period ended December 31, 2012 is discussed below.
Swap Transactions:The fund enters into swap agreements to exchange the interest rate on, or return generated by, one nominal instrument for the return generated by another nominal instrument.The fund enters into these agreements to hedge certain market or interest rate risks, to manage the interest rate sensitivity (sometimes called duration) of fixed income securities, to provide a substitute for purchasing or selling particular securities or to increase potential returns.
42
The fund accrues for the interim payments on swap contracts on a daily basis, with the net amount recorded within unrealized appreciation (depreciation) on swap contracts in the Statement of Assets and Liabilities. Once the interim payments are settled in cash, the net amount is recorded as a realized gain (loss) on swaps, in addition to realized gain (loss) recorded upon the termination of swap contracts in the Statement of Operations. Upfront payments made and/or received by the fund, are recorded as an asset and/or liability in the Statement of Assets and Liabilities and are recorded as a realized gain or loss ratably over the contract’s term/event with the exception of forward starting interest rate swaps which are recorded as realized gains or losses on the termination date. Fluctuations in the value of swap contracts are recorded for financial statement purposes as unrealized appreciation or depreciation on swap transactions.
Interest Rate Swaps: Interest rate swaps involve the exchange of commitments to pay and receive interest based on a notional principal amount.The fund may elect to pay a fixed rate and receive a floating rate, or receive a fixed rate and pay a floating rate on a notional principal amount. The net interest received or paid on interest rate swap agreements is included within realized gain (loss) on swap contracts in the Statement of Operations. Interest rate swap agreements are subject to general market risk, liquidity risk, counterparty risk and interest rate risk. For financial reporting purposes, forward rate agreements are classified as interest rate swaps.
The fund’s maximum risk of loss from counterparty risk is the discounted value of the cash flows to be received from the counterparty over the contract’s remaining life, to the extent that the amount is positive.This risk is mitigated by having a master netting arrangement between the fund and the counterparty and by the posting of collateral by the counterparty to the fund to cover the fund’s exposure to the counterparty.The following summarizes open interest rate swaps entered into by the fund at December 31, 2012:
The Fund 43
NOTES TO FINANCIAL STATEMENTS (continued)
| | | | | | |
| | | | | | Unrealized | |
| Notional | | Reference | Base Index | Determination | Appreciation | |
| Amount ($) | Counterparty | Index | Value | Date | (Depreciation) ($) | |
| |
| 15,000,000 | Citibank | Forward Rate | 1.69 | 2/13/2013 | (256,665 | ) |
| | | Agreement, | | | | |
| | | Municipal Market | | | | |
| | | Data General | | | | |
| | | Obligation, 2023, | | | | |
| | | AAA Indexa | | | | |
| 10,000,000 | Citibank | Forward Rate | 2.47 | 2/13/2013 | 263,597 | |
| | | Agreement, | | | | |
| | | Municipal Market | | | | |
| | | Data General | | | | |
| | | Obligation, 2033, | | | | |
| | | AAA Indexa | | | | |
| Gross Unrealized | | | | | |
| Appreciation | | | | | 263,597 | |
| Gross Unrealized | | | | | |
| Depreciation | | | | | (256,665 | ) |
|
| a The fund will receive a payment from the counterparty if the value of the reference index is less |
| than the base index value on the determination date.The fund will make a payment to the |
| counterparty if the value of the reference index is greater than the base index value on the |
| determination date. |
The following summarizes the average notional value of swap contracts outstanding during the period ended December 31, 2012:
| |
| | Average Notional Value ($) |
| Interest rate swap contracts | 12,230,769 |
At December 31, 2012, the cost of investments for federal income tax purposes was $539,730,555; accordingly, accumulated net unrealized appreciation on investments was $55,720,077, consisting of $55,970,004 gross unrealized appreciation and $249,927 gross unrealized depreciation.
44
REPORT OF INDEPENDENT REGISTERED
PUBLIC ACCOUNTING FIRM
Shareholders and Board of Directors
Dreyfus New Jersey Municipal Bond Fund, Inc.
We have audited the accompanying statement of assets and liabilities of Dreyfus New Jersey Municipal Bond Fund, Inc., including the statement of investments, as of December 31, 2012 and the related statement of operations for the year then ended, the statement of changes in net assets for each of the two years in the period then ended, and financial highlights for each of the periods indicated therein. These financial statements and financial highlights are the responsibility of the Fund’s management. Our responsibility is to express an opinion on these financial statements and financial highlights based on our audits.
We conducted our audits in accordance with the standards of the Public Company Accounting Oversight Board (United States).Those standards require that we plan and perform the audit to obtain reasonable assurance about whether the financial statements and financial highlights are free of material misstatement.We were not engaged to perform an audit of the Fund’s internal control over financial reporting. Our audits included consideration of internal control over financial reporting as a basis for designing audit procedures that are appropriate in the circumstances, but not for the purpose of expressing an opinion on the effectiveness of the Fund’s internal control over financial reporting. Accordingly, we express no such opinion. An audit also includes examining, on a test basis, evidence supporting the amounts and disclosures in the financial statements and financial highlights, assessing the accounting principles used and significant estimates made by management, and evaluating the overall financial statement presentation. Our procedures included confirmation of securities owned as of December 31, 2012 by correspondence with the custodian and others.We believe that our audits provide a reasonable basis for our opinion.
In our opinion, the financial statements and financial highlights referred to above present fairly, in all material respects, the financial position of Dreyfus New Jersey Municipal Bond Fund, Inc. at December 31, 2012, the results of its operations for the year then ended, the changes in its net assets for each of the two years in the period then ended, and the financial highlights for each of the indicated periods, in conformity with U. S. generally accepted accounting principles
New York, New York
February 27, 2013
The Fund 45
IMPORTANT TAX INFORMATION (Unaudited)
In accordance with federal tax law, the fund hereby reports all the dividends paid from investment income—net during the fiscal year ended December 31, 2012 as “exempt-interest dividends” (not subject to regular federal and, for individuals who are New Jersey residents, New Jersey personal income taxes).Where required by federal tax law rules, shareholders will receive notification of their portion of the fund’s taxable ordinary dividends (if any), capital gains distributions (if any) and tax-exempt dividends paid for the 2012 calendar year on Form 1099-DIV, which will be mailed in early 2013.
46
PROXY RESULTS (Unaudited)
The fund held a special meeting of shareholders on August 3, 2012. The proposal considered at the meeting, and the results, are as follows:
| | | |
| | | Shares | |
| | Votes For | | Authority Withheld |
| To elect additional Board Members: | | | |
| Peggy C. Davis† | 21,785,213 | | 1,410,887 |
| Ehud Houminer† | 21,748,602 | | 1,447,498 |
| Dr. Martin Peretz† | 21,806,684 | | 1,389,416 |
† Each new Board Member’s term commenced on September 1, 2012.
In addition Joseph S. DiMartino, David P. Feldman, Lynn Martin, Robin A. Melvin, and Philip L.Toia continue as Board Members of the fund.
The Fund 47
BOARD MEMBERS INFORMATION (Unaudited)
|
| Joseph S. DiMartino (69) |
| Chairman of the Board (1995) |
| Principal Occupation During Past 5Years: |
| • Corporate Director and Trustee |
| Other Public Company Board Memberships During Past 5Years: |
| • CBIZ (formerly, Century Business Services, Inc.), a provider of outsourcing functions for small |
| and medium size companies, Director (1997-present) |
| • Sunair Services Corporation, a provider of certain outdoor-related services to homes and |
| businesses, Director (2005-2009) |
| • The Newark Group, a provider of a national market of paper recovery facilities, paperboard |
| mills and paperboard converting plants, Director (2000-2010) |
| No. of Portfolios for which Board Member Serves: 151 |
| ——————— |
| Peggy C. Davis (69) |
| Board Member (2012) |
| Principal Occupation During Past 5Years: |
| • Shad Professor of Law, New York University School of Law (1983-present) |
| No. of Portfolios for which Board Member Serves: 63 |
| ——————— |
| David P. Feldman (73) |
| Board Member (1991) |
| Principal Occupation During Past 5Years: |
| • Corporate Director and Trustee |
| Other Public Company Board Memberships During Past 5Years: |
| • BBH Mutual Funds Group (4 registered mutual funds), Director (1992-present) |
| • QMed, Inc. a healthcare company, Director (1999-2007) |
| No. of Portfolios for which Board Member Serves: 46 |
| ——————— |
| Ehud Houminer (72) |
| Board Member (2012) |
| Principal Occupation During Past 5Years: |
| • Executive-in-Residence at the Columbia Business School, Columbia University (1992-present) |
| Other Public Company Board Memberships During Past 5Years: |
| • Avnet Inc., an electronics distributor, Director (1993-2012) |
| No. of Portfolios for which Board Member Serves: 70 |
48
|
| Lynn Martin (73) |
| Board Member (1994) |
| Principal Occupation During Past 5Years: |
| • President of The Martin Hall Group LLC, a human resources consulting firm, from January |
| 2005-present |
| Other Public Company Board Memberships During Past 5Years: |
| • AT&T Inc., a telecommunications company, Director (1999-2012) |
| • Ryder System, Inc., a supply chain and transportation management company, Director (1993-2012) |
| • The Proctor & Gamble Co., a consumer products company, Director (1994-2009) |
| • Constellation Energy Group Inc., Director (2003-2009) |
| No. of Portfolios for which Board Member Serves: 46 |
| ——————— |
| Robin A. Melvin (49) |
| Board Member (2011) |
| Principal Occupation During Past 5Years: |
| • Director, Boisi Family Foundation, a private family foundation that supports youth-serving orga- |
| nizations that promote the self sufficiency of youth from disadvantaged circumstances (1995-2012) |
| No. of Portfolios for which Board Member Serves: 97 |
| ——————— |
| Dr. Martin Peretz (73) |
| Board Member (2012) |
| Principal Occupation During Past 5Years: |
| • Editor-in-Chief Emeritus of The New Republic Magazine (2010-present) (previously, |
| Editor-in-Chief, 1974-2010) |
| • Director of TheStreet.com, a financial information service on the web (1996-present) |
| No. of Portfolios for which Board Member Serves: 46 |
| ——————— |
| Philip L. Toia (79) |
| Board Member (1997) |
| Principal Occupation During Past 5Years: |
| • Private Investor |
| No. of Portfolios for which Board Member Serves: 56 |
| ——————— |
| Once elected all Board Members serve for an indefinite term, but achieve Emeritus status upon reaching age 80.The |
| address of the Board Members and Officers is c/o The Dreyfus Corporation, 200 Park Avenue, NewYork, NewYork |
| 10166.Additional information about the Board Members is available in the fund’s Statement of Additional Information |
| which can be obtained from Dreyfus free of charge by calling this toll free number: 1-800-DREYFUS. |
| Daniel Rose, Emeritus Board Member |
| Sander Vanocur, Emeritus Board Member |
The Fund 49
OFFICERS OF THE FUND (Unaudited)

50

The Fund 51
Item 2. Code of Ethics.
The Registrant has adopted a code of ethics that applies to the Registrant's principal executive officer, principal financial officer, principal accounting officer or controller, or persons performing similar functions. There have been no amendments to, or waivers in connection with, the Code of Ethics during the period covered by this Report.
Item 3. Audit Committee Financial Expert.
The Registrant's Board has determined that David P. Feldman, a member of the Audit Committee of the Board, is an audit committee financial expert as defined by the Securities and Exchange Commission (the "SEC"). David P. Feldman is "independent" as defined by the SEC for purposes of audit committee financial expert determinations.
Item 4. Principal Accountant Fees and Services.
(a) Audit Fees. The aggregate fees billed for each of the last two fiscal years (the "Reporting Periods") for professional services rendered by the Registrant's principal accountant (the "Auditor") for the audit of the Registrant's annual financial statements or services that are normally provided by the Auditor in connection with the statutory and regulatory filings or engagements for the Reporting Periods, were $30,312 in 2011 and $31,401 in 2012.
(b) Audit-Related Fees. The aggregate fees billed in the Reporting Periods for assurance and related services by the Auditor that are reasonably related to the performance of the audit of the Registrant's financial statements and are not reported under paragraph (a) of this Item 4 were $12,000 in 2011 and $6,000 in 2012. These services consisted of one or more of the following: (i) agreed upon procedures related to compliance with Internal Revenue Code section 817(h), (ii) security counts required by Rule 17f-2 under the Investment Company Act of 1940, as amended, (iii) advisory services as to the accounting or disclosure treatment of Registrant transactions or events and (iv) advisory services to the accounting or disclosure treatment of the actual or potential impact to the Registrant of final or proposed rules, standards or interpretations by the Securities and Exchange Commission, the Financial Accounting Standards Boards or other regulatory or standard-setting bodies.
The aggregate fees billed in the Reporting Periods for non-audit assurance and related services by the Auditor to the Registrant's investment adviser (not including any sub-investment adviser whose role is primarily portfolio management and is subcontracted with or overseen by another investment adviser), and any entity controlling, controlled by or under common control with the investment adviser that provides ongoing services to the Registrant ("Service Affiliates"), that were reasonably related to the performance of the annual audit of the Service Affiliate, which required pre-approval by the Audit Committee were $0 in 2011 and $0 in 2012.
(c) Tax Fees. The aggregate fees billed in the Reporting Periods for professional services rendered by the Auditor for tax compliance, tax advice, and tax planning ("Tax Services") were $3,508 in 2011 and $3,334 in 2012. These services consisted of: (i) review or preparation of U.S. federal, state, local and excise tax returns; (ii) U.S. federal, state and local tax planning, advice and assistance regarding statutory, regulatory or administrative developments; and (iii) tax advice regarding tax qualification matters and/or treatment of various financial instruments held or proposed to be acquired or held. The aggregate fees billed in the Reporting Periods for Tax Services by the Auditor to Service Affiliates, which required pre-approval by the Audit Committee were $0 in 2011 and $0 in 2012.
(d) All Other Fees. The aggregate fees billed in the Reporting Periods for products and services provided by the Auditor, other than the services reported in paragraphs (a) through (c) of this Item, were $177 in 2011 and $678 in 2012. These services consisted of a review of the Registrant's anti-money laundering program.
The aggregate fees billed in the Reporting Periods for Non-Audit Services by the Auditor to Service Affiliates, other than the services reported in paragraphs (b) through (c) of this Item, which required pre-approval by the Audit Committee, were $0 in 2011 and $200,000 in 2012.
(e)(1) Audit Committee Pre-Approval Policies and Procedures. The Registrant's Audit Committee has established policies and procedures (the "Policy") for pre-approval (within specified fee limits) of the Auditor's engagements for non-audit services to the Registrant and Service Affiliates without specific case-by-case consideration. The pre-approved services in the Policy can include pre-approved audit services, pre-approved audit-related services, pre-approved tax services and pre-approved all other services. Pre-approval considerations include whether the proposed services are compatible with maintaining the Auditor's independence. Pre-approvals pursuant to the Policy are considered annually.
(e)(2) Note: None of the services described in paragraphs (b) through (d) of this Item 4 were approved by the Audit Committee pursuant to paragraph (c)(7)(i)(C) of Rule 2-01 of Regulation S-X.
(f) None of the hours expended on the principal accountant's engagement to audit the registrant's financial statements for the most recent fiscal year were attributed to work performed by persons other than the principal account's full-time, permanent employees.
Non-Audit Fees. The aggregate non-audit fees billed by the Auditor for services rendered to the Registrant, and rendered to Service Affiliates, for the Reporting Periods were $21,812,128 in 2011 and $49,204,697 in 2012.
Auditor Independence. The Registrant's Audit Committee has considered whether the provision of non-audit services that were rendered to Service Affiliates, which were not pre-approved (not requiring pre-approval), is compatible with maintaining the Auditor's independence.
Item 5. Audit Committee of Listed Registrants.
Not applicable. [CLOSED-END FUNDS ONLY]
Item 6. Investments.
(a) Not applicable.
Item 7. Disclosure of Proxy Voting Policies and Procedures for Closed-End Management Investment Companies.
Not applicable. [CLOSED-END FUNDS ONLY]
Item 8. Portfolio Managers of Closed-End Management Investment Companies.
Not applicable. [CLOSED-END FUNDS ONLY, beginning with reports for periods ended on and after December 31, 2005]
Item 9. Purchases of Equity Securities by Closed-End Management Investment Companies and Affiliated Purchasers.
Not applicable. [CLOSED-END FUNDS ONLY]
Item 10. Submission of Matters to a Vote of Security Holders.
There have been no material changes to the procedures applicable to Item 10.
Item 11. Controls and Procedures.
(a) The Registrant's principal executive and principal financial officers have concluded, based on their evaluation of the Registrant's disclosure controls and procedures as of a date within 90 days of the filing date of this report, that the Registrant's disclosure controls and procedures are reasonably designed to ensure that information required to be disclosed by the Registrant on Form N-CSR is recorded, processed, summarized and reported within the required time periods and that information required to be disclosed by the Registrant in the reports that it files or submits on Form N-CSR is accumulated and communicated to the Registrant's management, including its principal executive and principal financial officers, as appropriate to allow timely decisions regarding required disclosure.
(b) There were no changes to the Registrant's internal control over financial reporting that occurred during the second fiscal quarter of the period covered by this report that have materially affected, or are reasonably likely to materially affect, the Registrant's internal control over financial reporting.
Item 12. Exhibits.
(a)(1) Code of ethics referred to in Item 2.
(a)(2) Certifications of principal executive and principal financial officers as required by Rule 30a-2(a) under the Investment Company Act of 1940.
(a)(3) Not applicable.
(b) Certification of principal executive and principal financial officers as required by Rule 30a-2(b) under the Investment Company Act of 1940.
SIGNATURES
Pursuant to the requirements of the Securities Exchange Act of 1934 and the Investment Company Act of 1940, the Registrant has duly caused this Report to be signed on its behalf by the undersigned, thereunto duly authorized.
Dreyfus New Jersey Municipal Bond Fund, Inc.
By: /s/ Bradley J. Skapyak |
Bradley J. Skapyak, President |
Date: | February 26, 2013 |
|
Pursuant to the requirements of the Securities Exchange Act of 1934 and the Investment Company Act of 1940, this Report has been signed below by the following persons on behalf of the Registrant and in the capacities and on the dates indicated. |
|
By: /s/ Bradley J. Skapyak |
Bradley J. Skapyak, President |
Date: | February 26, 2013 |
|
By: /s/ James Windels |
James Windels, Treasurer |
Date: | February 26, 2013 |
|
EXHIBIT INDEX
(a)(1) Code of ethics referred to in Item 2.
(a)(2) Certifications of principal executive and principal financial officers as required by Rule 30a-2(a) under the Investment Company Act of 1940. (EX-99.CERT)
(b) Certification of principal executive and principal financial officers as required by Rule 30a-2(b) under the Investment Company Act of 1940. (EX-99.906CERT)