UNITED STATES
SECURITIES AND EXCHANGE COMMISSION
Washington, D.C. 20549
FORM N-CSR
CERTIFIED SHAREHOLDER REPORT OF REGISTERED MANAGEMENT
INVESTMENT COMPANIES
Investment Company Act file number | 811- 5454 |
| |
| Dreyfus New Jersey Municipal Bond Fund | |
| (Exact name of Registrant as specified in charter) | |
| | |
| c/o The Dreyfus Corporation 200 Park Avenue New York, New York 10166 | |
| (Address of principal executive offices) (Zip code) | |
| | |
| Janette E. Farragher, Esq. 200 Park Avenue New York, New York 10166 | |
| (Name and address of agent for service) | |
|
Registrant's telephone number, including area code: | (212) 922-6000 |
| |
Date of fiscal year end: | 12/31 | |
Date of reporting period: | 12/31/11 | |
| | | | | | | |
FORM N-CSR
Item 1. Reports to Stockholders.
Save time. Save paper. View your next shareholder report online as soon as it’s available. Log into www.dreyfus.com and sign up for Dreyfus eCommunications. It’s simple and only takes a few minutes.
The views expressed in this report reflect those of the portfolio manager only through the end of the period covered and do not necessarily represent the views of Dreyfus or any other person in the Dreyfus organization. Any such views are subject to change at any time based upon market or other conditions and Dreyfus disclaims any responsibility to update such views.These views may not be relied on as investment advice and, because investment decisions for a Dreyfus fund are based on numerous factors, may not be relied on as an indication of trading intent on behalf of any Dreyfus fund.
Not FDIC-Insured • Not Bank-Guaranteed • May Lose Value
| | Contents |
| | THE FUND |
| 2 | A Letter from the Chairman and CEO |
| 3 | Discussion of Fund Performance |
| 6 | Fund Performance |
| 8 | Understanding Your Fund’s Expenses |
| 8 | Comparing Your Fund’s Expenses With Those of Other Funds |
| 9 | Statement of Investments |
| 25 | Statement of Assets and Liabilities |
| 26 | Statement of Operations |
| 27 | Statement of Changes in Net Assets |
| 29 | Financial Highlights |
| 34 | Notes to Financial Statements |
| 45 | Report of Independent Registered Public Accounting Firm |
| 46 | Important Tax Information |
| 47 | Proxy Results |
| 48 | Information About the Renewal of the Fund’s Management Agreement |
| 53 | Board Members Information |
| 55 | Officers of the Fund |
| | FOR MORE INFORMATION |
| | Back Cover |
Dreyfus
New Jersey Municipal
Bond Fund, Inc.
The Fund

A LETTER FROM THE CHAIRMAN AND CEO
Dear Shareholder:
We are pleased to present this annual report for Dreyfus New Jersey Municipal Bond Fund, Inc., covering the 12-month period from January 1, 2011, through December 31, 2011. For information about how the fund performed during the reporting period, as well as general market perspectives, we provide a Discussion of Fund Performance on the pages that follow.
Municipal bonds proved to be one of the better-performing asset classes in 2011, mainly due to favorable supply-and-demand dynamics and improved credit fundamentals, including better-than-expected revenues in 13 states. State general obligation bonds performed particularly well, led by California, Ohio, Illinois and New Jersey. However, market conditions were volatile at times as investors reacted to global macroeconomic developments ranging from natural disasters in Japan to an unprecedented downgrade of long-term U.S. debt securities and the resurgence of a sovereign debt crisis in Europe.
Our economic forecast calls for a mild acceleration of the U.S. recovery as the domestic banking system gains strength, credit conditions loosen and housing markets begin a long-awaited convalescence. While gains in tax revenues have eased budgetary pressures, state and local governments also have enacted aggressive austerity measures, including cutting expenditures, delaying capital projects, reducing local aid and, in some cases, raising taxes and fees. In our judgment, improved credit conditions, relatively light bond issuance and robust investor demand for tax-exempt income could lend further support to municipal bond prices over the coming year. Of course, we encourage you to talk with your financial adviser to help ensure that your investment objectives are properly aligned with your risk tolerance in pursuing potential market opportunities in 2012.
Thank you for your continued confidence and support.

Jonathan R. Baum
Chairman and Chief Executive Officer
The Dreyfus Corporation
January 17, 2012
2

DISCUSSION OF FUND PERFORMANCE
For the period of January 1, 2011, through December 31, 2011, as provided by Daniel Barton, Portfolio Manager
Fund and Market Performance Overview
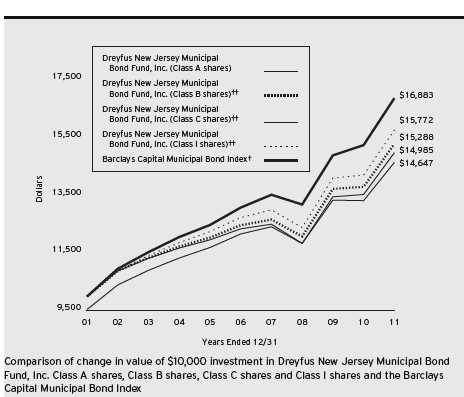
For the 12-month period ended December 31, 2011, Dreyfus New Jersey Municipal Bond Fund’s Class A shares produced a total return of 10.72%, Class B shares returned 10.10%, Class C shares returned 9.90%, Class I shares returned 10.97% and Class Z shares returned 10.80%.1 In comparison, the Barclays Capital Municipal Bond Index (the “Index”), the fund’s benchmark, achieved a total return of 10.70% for the same period.2
Despite bouts of economic uncertainty during 2011, New Jersey municipal bonds fared relatively well as credit conditions improved and a reduced supply of newly issued securities was met by robust investor demand.
The Fund’s Investment Approach
To pursue its goal, the fund seeks as high a level of current income exempt from federal and New Jersey state income taxes as is consistent with the preservation of capital.The fund normally invests at least 80% of its assets in municipal bonds that provide income exempt from federal and New Jersey personal income taxes. The fund invests at least 80% of its assets in investment-grade municipal bonds or the unrated equivalent as determined by Dreyfus.The fund may invest up to 20% of its assets in municipal bonds rated below investment grade (“high yield” or “junk” bonds) or the unrated equivalent as determined by Dreyfus.The dollar-weighted average maturity of the fund’s portfolio normally exceeds 10 years.
We focus on identifying undervalued sectors and securities and minimize the use of interest rate forecasting.We select municipal bonds for the fund’s portfolio by:
Using fundamental credit analysis to estimate the relative value and attractiveness of various sectors and securities and to exploit pricing inefficiencies in the municipal bond market; and
Actively trading among various sectors, such as pre-refunded, general obligation and revenue, based on their apparent relative values.The fund seeks to invest in several of these sectors.
DISCUSSION OF FUND PERFORMANCE (continued)
Municipal Bonds Gained Value Amid Volatility
Improved economic data and rising corporate earnings generally supported investor sentiment into the first quarter of 2011.While investor confidence was shaken by political unrest in the Middle East and natural disasters in Japan, most markets bounced back quickly from these unexpected shocks.
Investor confidence deteriorated in earnest in the spring, when Greece appeared headed for default on its sovereign debt and the crisis spread to other members of the European Union. Meanwhile, U.S. economic data disappointed and a contentious political debate regarding U.S. government spending and borrowing intensified. Investors shifted their focus to traditionally defensive investments, producing bouts of heightened volatility in many financial markets.Turbulence was particularly severe in August and September, after a major credit-rating agency downgraded its assessment of long-term U.S. debt securities. Securities that had been hard-hit in late summer rebounded to a degree from October through December as certain macroeconomic concerns eased.
The flight to quality and supply-and-demand forces helped municipal bonds gain value amid these developments. New issuance volumes fell sharply in 2011 after a flood of new supply in late 2010. Political pressure to reduce spending and borrowing also led to fewer capital projects requiring financing during the year. Yet, investor demand remained steadily robust from individual and institutional investors seeking competitive levels of tax-exempt income.
Although New Jersey has continued to struggle to bridge future budget shortfalls, the state has cut spending, and FY 2012 tax revenues will exceed 2011 figures, helping to relieve some fiscal pressures.
Duration and Credit Selection Strategies Buoyed Results
The fund benefited during 2011 from a relatively long average duration, which enabled it to participate more fully in market rallies. In addition, we had intensified the fund’s focus on A-rated municipal bonds, one of the stronger market segments during the year.The fund achieved especially favorable results from corporate-backed municipal bonds, which saw robust demand from traditional taxable fixed-income investors seeking competitive levels of current income in a low interest-rate environment.
4
Strength in these areas was offset by the fund’s relatively heavy exposure to revenue-backed bonds, which generally lagged New Jersey’s general obligation debt. In addition, municipal bonds backed by hospitals and the state’s settlement of litigation with U.S. tobacco companies weighed on relative results.
Adjusting to a Changing Market Environment
We expect the supply of newly issued municipal bonds to rise during 2012.To prepare for this likely development, we have reduced the fund’s average duration to the neutral range, and we have trimmed holdings of bonds rated at the lower end of the investment-grade spectrum. Instead, we have emphasized revenue bonds with strong income characteristics, particularly those backed by essential services facilities. In our judgment, these strategies position the fund well for an environment of continued subpar economic growth.
January 17, 2012
| |
| | Bond funds are subject generally to interest rate, credit, liquidity and market risks, to varying |
| | degrees, all of which are more fully described in the fund’s prospectus. Generally, all other factors |
| | being equal, bond prices are inversely related to interest-rate changes, and rate increases can cause |
| | price declines. |
| | High yield bonds are subject to increased credit risk and are considered speculative in terms of the |
| | issuer’s perceived ability to continue making interest payments on a timely basis and to repay |
| | principal upon maturity. |
| 1 | Total return includes reinvestment of dividends and any capital gains paid and does not take into |
| | consideration the maximum initial sales charge in the case of Class A shares or the applicable |
| | contingent deferred sales charges imposed on redemptions in the case of Class B and Class C |
| | shares. Had these charges been reflected, returns would have been lower. Class I and Class Z |
| | shares are not subject to any initial or deferred sales charge. Past performance is no guarantee of |
| | future results. Share price, yield and investment return fluctuate such that upon redemption, fund |
| | shares may be worth more or less than their original cost. Income may be subject to state and local |
| | taxes for non-New Jersey residents, and some income may be subject to the federal alternative |
| | minimum tax (AMT) for certain investors. Capital gains, if any, are fully taxable. Return figures |
| | provided for Class A, B and C shares reflect the absorption of certain fund expenses pursuant to |
| | an agreement by The Dreyfus Corporation which may be terminated after May 1, 2012, upon |
| | 90 days’ notice to shareholders. Return figures for Class I shares, reflect the absorption of certain |
| | fund expenses by The Dreyfus Corporation and may be terminated at any time. Had these |
| | expenses not been absorbed, the fund’s returns would have been lower. |
| 2 | SOURCE: LIPPER INC. — Reflects reinvestment of dividends and, where applicable, capital |
| | gain distributions.The Barclays Capital Municipal Bond Index is a widely accepted, unmanaged |
| | total return performance benchmark for the long-term, investment-grade, tax-exempt bond market. |
| | Index returns do not reflect fees and expenses associated with operating a mutual fund. Investors |
| | cannot invest directly in any index. |
| |
| † | Source: Lipper Inc. |
| †† | The total return figures presented for Class B and C shares of the fund reflect the performance of the fund’s Class A |
| | shares for the period prior to 1/7/03 (the inception date for Class B and C shares respectively), adjusted to reflect the |
| | applicable sales load for each share class. |
| | The total return figures presented for Class I shares of the fund reflect the performance of the fund’s Class A shares |
| | for the period prior to 12/15/08 (the inception date for Class I shares). |
| Past performance is not predictive of future performance. |
| The above graph compares a $10,000 investment made in each of the Class A, Class B, Class C and Class I shares of |
| Dreyfus New Jersey Municipal Bond Fund, Inc. on 12/31/01 to a $10,000 investment made in the Barclays Capital |
| Municipal Bond Index (the “Index”) on that date.All dividends and capital gain distributions are reinvested. |
| The fund invests primarily in New Jersey municipal securities and its performance shown in the line graph above takes |
| into account the maximum initial sales charge on Class A shares and all other applicable fees and expenses for Class A, |
| Class B, Class C and Class I shares. Performance for Class Z shares will vary from the performance of Class A, Class |
| B, Class C and Class I shares shown above due to differences in charges and expenses. Performance for Class B shares |
| assumes the conversion of Class B shares to Class A shares at the end of the sixth year following the date of purchase. |
| The Index is not limited to investments in New Jersey municipal obligations.The Index is an unmanaged total return |
| performance benchmark for the long-term, investment-grade, geographically unrestricted tax-exempt bond market, |
| calculated by using municipal bonds selected to be representative of the municipal market overall. Unlike a mutual fund, |
| the Index is not subject to charges, fees and other expenses. Investors cannot invest directly in any index.These factors can |
| contribute to the Index potentially outperforming or underperforming the fund. Further information relating to fund |
| performance, including expense reimbursements, if applicable, is contained in the Financial Highlights section of the |
| prospectus and elsewhere in this report. |
6
| | | | | | | | | |
| Average Annual Total Returns as of 12/31/11 | | | |
| |
| | Inception | | | | From |
| | Date | 1Year | 5 Years | 10 Years | Inception |
| Class A shares | | | | | |
| with maximum sales charge (4.5%) | 11/6/87 | 5.71% | 3.30% | 4.13% | — |
| without sales charge | 11/6/87 | 10.72% | 4.26% | 4.61% | — |
| Class B shares | | | | | |
| with applicable redemption charge † | 1/7/03 | 6.10% | 3.35% | 4.34%††† | — |
| without redemption | 1/7/03 | 10.10% | 3.70% | 4.34%††† | — |
| Class C shares | | | | | |
| with applicable redemption charge †† | 1/7/03 | 8.90% | 3.47% | 3.89%††† | — |
| without redemption | 1/7/03 | 9.90% | 3.47% | 3.89%††† | — |
| Class I shares | 12/15/08 | 10.97% | 4.36%††† | 4.66%††† | — |
| Class Z shares | 6/7/07 | 10.80% | — | — | 4.73% |
| Barclays Capital | | | | | |
| Municipal Bond Index | 5/31/07 | 10.70% | 5.22% | 5.38% | 5.56%†††† |
| |
| Past performance is not predictive of future performance.The fund’s performance shown in the graph and table does not |
| reflect the deduction of taxes that a shareholder would pay on fund distributions or the redemption of fund shares. |
| † | The maximum contingent deferred sales charge for Class B shares is 4%.After six years Class B shares convert to |
| | Class A shares. |
| †† | The maximum contingent deferred sales charge for Class C shares is 1% for shares redeemed within one year of the |
| | date of purchase. |
| ††† | The total return performance figures presented for Class B and C shares of the fund reflect the performance of the |
| | fund’s Class A shares for the period prior to 1/7/03 (the inception date for Class B and C shares respectively), |
| | adjusted to reflect the applicable sales load for each share class. |
| | The total return performance figures presented for Class I shares of the fund reflect the performance of the fund’s |
| | Class A shares for the period prior to 12/15/08 (the inception date for Class I shares). |
| †††† | The Index date is based on the life of Class Z shares. For comparative purposes, the value of the Index as of |
| | 5/31/07 is used as the beginning value on 6/7/07 (the inception date for Class Z shares). |
UNDERSTANDING YOUR FUND’S EXPENSES (Unaudited)
As a mutual fund investor, you pay ongoing expenses, such as management fees and other expenses. Using the information below, you can estimate how these expenses affect your investment and compare them with the expenses of other funds.You also may pay one-time transaction expenses, including sales charges (loads) and redemption fees, which are not shown in this section and would have resulted in higher total expenses. For more information, see your fund’s prospectus or talk to your financial adviser.
Review your fund’s expenses
The table below shows the expenses you would have paid on a $1,000 investment in Dreyfus New Jersey Municipal Bond Fund, Inc. from July 1, 2011 to December 31, 2011. It also shows how much a $1,000 investment would be worth at the close of the period, assuming actual returns and expenses.
| | | | | | | | | | |
| Expenses and Value of a $1,000 Investment | | | | | | |
| assuming actual returns for the six months ended December 31, 2011 | | | | |
| | | Class A | | Class B | | Class C | | Class I | | Class Z |
| Expenses paid per $1,000† | $ | 4.42 | $ | 7.02 | $ | 8.31 | $ | 3.65 | $ | 4.06 |
| Ending value (after expenses) | $ | 1,064.60 | $ | 1,062.50 | $ | 1,061.50 | $ | 1,066.10 | $ | 1,064.90 |
|
| COMPARING YOUR FUND’S EXPENSES |
| WITH THOSE OF OTHER FUNDS (Unaudited) |
Using the SEC’s method to compare expenses
The Securities and Exchange Commission (SEC) has established guidelines to help investors assess fund expenses. Per these guidelines, the table below shows your fund’s expenses based on a $1,000 investment, assuming a hypothetical 5% annualized return. You can use this information to compare the ongoing expenses (but not transaction expenses or total cost) of investing in the fund with those of other funds.All mutual fund shareholder reports will provide this information to help you make this comparison. Please note that you cannot use this information to estimate your actual ending account balance and expenses paid during the period.
| | | | | | | | | | |
| Expenses and Value of a $1,000 Investment | | | | | | |
| assuming a hypothetical 5% annualized return for the six months ended December 31, 2011 |
| | | Class A | | Class B | | Class C | | Class I | | Class Z |
| Expenses paid per $1,000† | $ | 4.33 | $ | 6.87 | $ | 8.13 | $ | 3.57 | $ | 3.97 |
| Ending value (after expenses) | $ | 1,020.92 | $ | 1,018.40 | $ | 1,017.14 | $ | 1,021.68 | $ | 1,021.27 |
† Expenses are equal to the fund’s annualized expense ratio of .85% for Class A, 1.35% for Class B, 1.60% for Class C, .70% for Class I and .78% for Class Z, multiplied by the average account value over the period, multiplied by 184/365 (to reflect the one-half year period).
8
|
| STATEMENT OF INVESTMENTS |
| December 31, 2011 |
| | | | | |
| Long-Term Municipal | Coupon | Maturity | Principal | | |
| Investments—97.4% | Rate (%) | Date | Amount ($) | | Value ($) |
| New Jersey—86.7% | | | | | |
| Atlantic County Utilities | | | | | |
| Authority, Solid Waste | | | | | |
| System Revenue | 7.13 | 3/1/16 | 9,120,000 | | 9,119,726 |
| Burlington County Bridge | | | | | |
| Commission, EDR (The | | | | | |
| Evergreens Project) | 5.63 | 1/1/38 | 5,500,000 | | 5,060,990 |
| Camden, | | | | | |
| GO (Insured; Assured Guaranty | | | | | |
| Municipal Corp.) | 0.00 | 2/15/12 | 4,385,000 | a | 4,381,667 |
| Camden County Improvement | | | | | |
| Authority, Health Care | | | | | |
| Redevelopment Project Revenue | | | | | |
| (The Cooper Health System | | | | | |
| Obligated Group Issue) | 5.25 | 2/15/20 | 4,545,000 | | 4,675,123 |
| Camden County Improvement | | | | | |
| Authority, Health Care | | | | | |
| Redevelopment Project Revenue | | | | | |
| (The Cooper Health System | | | | | |
| Obligated Group Issue) | 5.25 | 2/15/20 | 2,000,000 | | 2,057,260 |
| Delaware River Port Authority, | | | | | |
| Revenue | 5.00 | 1/1/30 | 3,500,000 | | 3,761,240 |
| Delaware River Port Authority, | | | | | |
| Revenue | 5.00 | 1/1/35 | 3,500,000 | | 3,697,155 |
| East Orange Board of Education, | | | | | |
| COP, LR (Insured; Assured | | | | | |
| Guaranty Municipal Corp.) | 0.00 | 2/1/21 | 685,000 | a | 460,649 |
| East Orange Board of Education, | | | | | |
| COP, LR (Insured; Assured | | | | | |
| Guaranty Municipal Corp.) | 0.00 | 2/1/26 | 745,000 | a | 354,866 |
| East Orange Board of Education, | | | | | |
| COP, LR (Insured; Assured | | | | | |
| Guaranty Municipal Corp.) | 0.00 | 2/1/28 | 2,345,000 | a | 978,944 |
| Essex County, | | | | | |
| GO (General Improvement) | 5.00 | 8/1/23 | 15,200,000 | | 17,944,512 |
| Garden State Preservation Trust, | | | | | |
| Revenue (Open Space and | | | | | |
| Farmland Preservation Bonds) | | | | | |
| (Insured; Assured Guaranty | | | | | |
| Municipal Corp.) | 5.75 | 11/1/28 | 5,000,000 | | 6,427,750 |
STATEMENT OF INVESTMENTS (continued)
| | | | | |
| Long-Term Municipal | Coupon | Maturity | Principal | | |
| Investments (continued) | Rate (%) | Date | Amount ($) | | Value ($) |
| New Jersey (continued) | | | | | |
| Gloucester County Improvement | | | | | |
| Authority, County Guaranteed | | | | | |
| Loan Revenue (County | | | | | |
| Capital Program) | 5.00 | 4/1/38 | 7,000,000 | | 7,461,160 |
| Gloucester Township Municipal | | | | | |
| Utilities Authority, Sewer | | | | | |
| Revenue (Insured; AMBAC) | 5.65 | 3/1/18 | 2,075,000 | | 2,346,804 |
| Higher Education Student | | | | | |
| Assistance Authority of New | | | | | |
| Jersey, Student Loan Revenue | | | | | |
| (Insured; National Public | | | | | |
| Finance Guarantee Corp.) | 6.13 | 6/1/17 | 280,000 | | 280,843 |
| Hudson County Improvement | | | | | |
| Authority, Harrison Stadium | | | | | |
| Land Acquisition Special | | | | | |
| Obligation Revenue (Harrison | | | | | |
| Redevelopment Project) | | | | | |
| (Insured; National Public | | | | | |
| Finance Guarantee Corp.) | 0.00 | 12/15/34 | 3,000,000 | a | 804,270 |
| Mercer County Improvement | | | | | |
| Authority, County Secured Open | | | | | |
| Space Revenue (Insured; National | | | | | |
| Public Finance Guarantee Corp.) | 5.00 | 8/1/40 | 3,290,000 | | 3,412,717 |
| Middletown Township Board of | | | | | |
| Education, GO | 5.00 | 8/1/25 | 4,140,000 | | 4,784,598 |
| Middletown Township Board of | | | | | |
| Education, GO | 5.00 | 8/1/26 | 2,935,000 | | 3,365,594 |
| New Jersey Economic Development | | | | | |
| Authority, Cigarette Tax Revenue | 5.50 | 6/15/24 | 2,300,000 | | 2,315,180 |
| New Jersey Economic Development | | | | | |
| Authority, Cigarette Tax Revenue | 5.75 | 6/15/29 | 2,000,000 | | 2,059,160 |
| New Jersey Economic Development | | | | | |
| Authority, Department of | | | | | |
| Human Services Composite | | | | | |
| Revenue (Division of | | | | | |
| Developmental Disabilities) | 6.25 | 7/1/24 | 1,240,000 | | 1,254,880 |
| New Jersey Economic Development | | | | | |
| Authority, Department of | | | | | |
| Human Services Composite | | | | | |
| Revenue (Division of Mental | | | | | |
| Health Services) | 6.10 | 7/1/17 | 1,540,000 | | 1,559,712 |
10
| | | | | |
| Long-Term Municipal | Coupon | Maturity | Principal | | |
| Investments (continued) | Rate (%) | Date | Amount ($) | | Value ($) |
| New Jersey (continued) | | | | | |
| New Jersey Economic Development | | | | | |
| Authority, EDR (Masonic | | | | | |
| Charity Foundation of | | | | | |
| New Jersey Project) | 5.00 | 6/1/18 | 1,365,000 | | 1,425,947 |
| New Jersey Economic Development | | | | | |
| Authority, Gas Facilities Revenue | | | | | |
| (NUI Corporation Project) | 5.25 | 11/1/33 | 2,780,000 | | 2,780,056 |
| New Jersey Economic Development | | | | | |
| Authority, Motor Vehicle | | | | | |
| Surcharge Revenue (Insured; | | | | | |
| National Public Finance | | | | | |
| Guarantee Corp.) | 0.00 | 7/1/21 | 2,620,000 | a | 1,739,811 |
| New Jersey Economic Development | | | | | |
| Authority, Motor Vehicle | | | | | |
| Surcharge Revenue (Insured; | | | | | |
| National Public Finance | | | | | |
| Guarantee Corp.) | 0.00 | 7/1/20 | 3,350,000 | a | 2,366,406 |
| New Jersey Economic Development | | | | | |
| Authority, Revenue (Hillcrest | | | | | |
| Health Service System Project) | | | | | |
| (Insured; AMBAC) | 0.00 | 1/1/12 | 1,000,000 | a | 999,900 |
| New Jersey Economic Development | | | | | |
| Authority, Revenue (Hillcrest | | | | | |
| Health Service System Project) | | | | | |
| (Insured; AMBAC) | 0.00 | 1/1/13 | 1,000,000 | a | 960,350 |
| New Jersey Economic Development | | | | | |
| Authority, Revenue (Hillcrest | | | | | |
| Health Service System Project) | | | | | |
| (Insured; AMBAC) | 0.00 | 1/1/15 | 3,250,000 | a | 2,858,147 |
| New Jersey Economic Development | | | | | |
| Authority, Revenue (Hillcrest | | | | | |
| Health Service System Project) | | | | | |
| (Insured; AMBAC) | 0.00 | 1/1/17 | 5,000,000 | a | 3,973,750 |
| New Jersey Economic Development | | | | | |
| Authority, Revenue (Hillcrest | | | | | |
| Health Service System Project) | | | | | |
| (Insured; AMBAC) | 0.00 | 1/1/18 | 2,500,000 | a | 1,880,000 |
| New Jersey Economic Development | | | | | |
| Authority, Revenue (Hillcrest | | | | | |
| Health Service System Project) | | | | | |
| (Insured; AMBAC) | 0.00 | 1/1/20 | 6,500,000 | a | 4,311,840 |
STATEMENT OF INVESTMENTS (continued)
| | | | | |
| Long-Term Municipal | Coupon | Maturity | Principal | | |
| Investments (continued) | Rate (%) | Date | Amount ($) | | Value ($) |
| New Jersey (continued) | | | | | |
| New Jersey Economic Development | | | | | |
| Authority, Revenue (Hillcrest | | | | | |
| Health Service System Project) | | | | | |
| (Insured; AMBAC) | 0.00 | 1/1/22 | 6,000,000 | a | 3,465,000 |
| New Jersey Economic Development | | | | | |
| Authority, School Facilities | | | | | |
| Construction Revenue | 5.00 | 9/1/18 | 2,265,000 | | 2,687,536 |
| New Jersey Economic Development | | | | | |
| Authority, School Facilities | | | | | |
| Construction Revenue | 5.75 | 9/1/23 | 3,765,000 | | 4,502,036 |
| New Jersey Economic Development | | | | | |
| Authority, School Facilities | | | | | |
| Construction Revenue | | | | | |
| (Insured; AMBAC) | 5.50 | 9/1/24 | 10,000,000 | | 12,026,400 |
| New Jersey Economic Development | | | | | |
| Authority, School Facilities | | | | | |
| Construction Revenue (Insured; | | | | | |
| National Public Finance | | | | | |
| Guarantee Corp.) | 5.50 | 9/1/27 | 10,000,000 | | 11,868,700 |
| New Jersey Economic Development | | | | | |
| Authority, Water Facilities | | | | | |
| Revenue (New Jersey—American | | | | | |
| Water Company, Inc. Project) | 5.10 | 6/1/23 | 3,000,000 | | 3,346,170 |
| New Jersey Economic Development | | | | | |
| Authority, Water Facilities | | | | | |
| Revenue (New Jersey—American | | | | | |
| Water Company, Inc. Project) | 5.60 | 11/1/34 | 6,600,000 | | 7,101,930 |
| New Jersey Economic Development | | | | | |
| Authority, Water Facilities | | | | | |
| Revenue (New Jersey—American | | | | | |
| Water Company, Inc. Project) | 5.70 | 10/1/39 | 5,000,000 | | 5,320,350 |
| New Jersey Educational Facilities | | | | | |
| Authority, Revenue (Fairleigh | | | | | |
| Dickenson University Issue) | 6.00 | 7/1/20 | 4,535,000 | | 4,784,380 |
| New Jersey Educational Facilities | | | | | |
| Authority, Revenue (Georgian | | | | | |
| Court University Project) | 5.00 | 7/1/27 | 1,000,000 | | 1,029,780 |
| New Jersey Educational Facilities | | | | | |
| Authority, Revenue (Georgian | | | | | |
| Court University Project) | 5.25 | 7/1/27 | 500,000 | | 520,945 |
12
| | | | | |
| Long-Term Municipal | Coupon | Maturity | Principal | | |
| Investments (continued) | Rate (%) | Date | Amount ($) | | Value ($) |
| New Jersey (continued) | | | | | |
| New Jersey Educational Facilities | | | | | |
| Authority, Revenue (Georgian | | | | | |
| Court University Project) | 5.00 | 7/1/33 | 1,880,000 | | 1,886,730 |
| New Jersey Educational Facilities | | | | | |
| Authority, Revenue (Kean | | | | | |
| University Issue) | 5.00 | 9/1/21 | 1,500,000 | | 1,732,440 |
| New Jersey Educational Facilities | | | | | |
| Authority, Revenue (Montclair | | | | | |
| State University Issue) | 5.25 | 7/1/38 | 2,000,000 | | 2,129,540 |
| New Jersey Educational Facilities | | | | | |
| Authority, Revenue (New Jersey | | | | | |
| City University Issue) (Insured; | | | | | |
| Assured Guaranty Municipal Corp.) | 5.00 | 7/1/35 | 12,165,000 | | 12,880,545 |
| New Jersey Educational Facilities | | | | | |
| Authority, Revenue (New Jersey | | | | | |
| Institute of Technology Issue) | 5.00 | 7/1/31 | 2,000,000 | | 2,131,820 |
| New Jersey Educational Facilities | | | | | |
| Authority, Revenue (Princeton | | | | | |
| Theological Seminary Issue) | 5.00 | 7/1/29 | 5,000,000 | | 5,776,050 |
| New Jersey Educational Facilities | | | | | |
| Authority, Revenue (Princeton | | | | | |
| University) (Prerefunded) | 5.00 | 7/1/15 | 120,000 | b | 138,523 |
| New Jersey Educational Facilities | | | | | |
| Authority, Revenue (Public | | | | | |
| Library Project Grant Program | | | | | |
| Issue) (Insured; AMBAC) | 5.50 | 9/1/17 | 1,500,000 | | 1,546,320 |
| New Jersey Educational Facilities | | | | | |
| Authority, Revenue (Seton Hall | | | | | |
| University Issue) | 6.25 | 7/1/37 | 5,000,000 | | 5,731,700 |
| New Jersey Educational Facilities | | | | | |
| Authority, Revenue (Stevens | | | | | |
| Institute of Technology Issue) | 5.00 | 7/1/27 | 5,000,000 | | 5,148,900 |
| New Jersey Educational Facilities | | | | | |
| Authority, Revenue (Stevens | | | | | |
| Institute of Technology Issue) | 5.00 | 7/1/34 | 7,655,000 | | 7,689,677 |
| New Jersey Educational Facilities | | | | | |
| Authority, Revenue (Stevens | | | | | |
| Institute of Technology Issue) | | | | | |
| (Prerefunded) | 5.38 | 7/1/14 | 2,500,000 | b | 2,800,425 |
STATEMENT OF INVESTMENTS (continued)
| | | | | |
| Long-Term Municipal | Coupon | Maturity | Principal | | |
| Investments (continued) | Rate (%) | Date | Amount ($) | | Value ($) |
| New Jersey (continued) | | | | | |
| New Jersey Educational Facilities | | | | | |
| Authority, Revenue (The | | | | | |
| College of New Jersey Issue) | | | | | |
| (Insured; Assured Guaranty | | | | | |
| Municipal Corp.) | 5.00 | 7/1/35 | 7,910,000 | | 8,352,011 |
| New Jersey Educational Facilities | | | | | |
| Authority, Revenue (The William | | | | | |
| Paterson University of New Jersey | | | | | |
| Issue) (Insured; Assured Guaranty | | | | | |
| Municipal Corp.) | 5.00 | 7/1/38 | 3,745,000 | | 3,952,099 |
| New Jersey Health Care Facilities | | | | | |
| Financing Authority, Revenue | | | | | |
| (AHS Hospital Corporation Issue) | 5.00 | 7/1/27 | 5,400,000 | | 5,614,002 |
| New Jersey Health Care Facilities | | | | | |
| Financing Authority, Revenue | | | | | |
| (Atlantic City Medical | | | | | |
| Center Issue) | 6.00 | 7/1/12 | 1,670,000 | | 1,704,318 |
| New Jersey Health Care Facilities | | | | | |
| Financing Authority, Revenue | | | | | |
| (Atlantic City Medical | | | | | |
| Center Issue) | 6.25 | 7/1/17 | 2,730,000 | | 2,844,796 |
| New Jersey Health Care Facilities | | | | | |
| Financing Authority, Revenue | | | | | |
| (Atlantic City Medical Center | | | | | |
| Issue) (Prerefunded) | 6.25 | 7/1/12 | 2,270,000 | b | 2,338,917 |
| New Jersey Health Care Facilities | | | | | |
| Financing Authority, Revenue | | | | | |
| (AtlantiCare Regional Medical | | | | | |
| Center Issue) | 5.00 | 7/1/22 | 3,975,000 | | 4,286,560 |
| New Jersey Health Care Facilities | | | | | |
| Financing Authority, Revenue | | | | | |
| (Barnabas Health Issue) | 5.63 | 7/1/32 | 3,000,000 | | 3,082,200 |
| New Jersey Health Care Facilities | | | | | |
| Financing Authority, Revenue | | | | | |
| (Capital Health System | | | | | |
| Obligated Group Issue) | | | | | |
| (Prerefunded) | 5.75 | 7/1/13 | 3,000,000 | b | 3,223,980 |
14
| | | | |
| Long-Term Municipal | Coupon | Maturity | Principal | |
| Investments (continued) | Rate (%) | Date | Amount ($) | Value ($) |
| New Jersey (continued) | | | | |
| New Jersey Health Care Facilities | | | | |
| Financing Authority, Revenue | | | | |
| (General Hospital Center at | | | | |
| Passaic, Inc. Obligated Group | | | | |
| Issue) (Insured; Assured | | | | |
| Guaranty Municipal Corp.) | 6.75 | 7/1/19 | 550,000 | 695,079 |
| New Jersey Health Care Facilities | | | | |
| Financing Authority, Revenue | | | | |
| (Hackensack University Medical | | | | |
| Center Issue) | 5.00 | 1/1/28 | 2,780,000 | 2,824,897 |
| New Jersey Health Care Facilities | | | | |
| Financing Authority, Revenue | | | | |
| (Hackensack University Medical | | | | |
| Center Issue) (Insured; Assured | | | | |
| Guaranty Municipal Corp.) | 5.25 | 1/1/36 | 2,900,000 | 3,018,726 |
| New Jersey Health Care Facilities | | | | |
| Financing Authority, Revenue | | | | |
| (Holy Name Medical Center Issue) | 5.00 | 7/1/15 | 3,410,000 | 3,633,423 |
| New Jersey Health Care Facilities | | | | |
| Financing Authority, Revenue | | | | |
| (Meridian Health System | | | | |
| Obligated Group Issue) | 5.00 | 7/1/23 | 2,500,000 | 2,788,775 |
| New Jersey Health Care Facilities | | | | |
| Financing Authority, Revenue | | | | |
| (Meridian Health System | | | | |
| Obligated Group Issue) | 5.00 | 7/1/26 | 1,000,000 | 1,075,740 |
| New Jersey Health Care Facilities | | | | |
| Financing Authority, Revenue | | | | |
| (Meridian Health System | | | | |
| Obligated Group Issue) | | | | |
| (Insured; Assured Guaranty | | | | |
| Municipal Corp.) | 5.00 | 7/1/38 | 4,965,000 | 5,096,572 |
| New Jersey Health Care Facilities | | | | |
| Financing Authority, Revenue | | | | |
| (Robert Wood Johnson | | | | |
| University Hospital Issue) | 5.00 | 7/1/31 | 4,950,000 | 5,191,065 |
STATEMENT OF INVESTMENTS (continued)
| | | | | |
| Long-Term Municipal | Coupon | Maturity | Principal | | |
| Investments (continued) | Rate (%) | Date | Amount ($) | | Value ($) |
| New Jersey (continued) | | | | | |
| New Jersey Health Care Facilities | | | | | |
| Financing Authority, Revenue | | | | | |
| (Saint Barnabas Health Care | | | | | |
| System Issue) (Insured; | | | | | |
| National Public Finance | | | | | |
| Guarantee Corp.) | 0.00 | 7/1/23 | 2,280,000 | a | 1,659,635 |
| New Jersey Health Care Facilities | | | | | |
| Financing Authority, Revenue | | | | | |
| (South Jersey Hospital Issue) | 6.00 | 7/1/12 | 655,000 | | 663,764 |
| New Jersey Health Care Facilities | | | | | |
| Financing Authority, Revenue | | | | | |
| (Virtua Health Issue) (Insured; | | | | | |
| Assured Guaranty Municipal Corp.) | 5.50 | 7/1/38 | 5,000,000 | | 5,307,200 |
| New Jersey Health Care Facilities | | | | | |
| Financing Authority, State | | | | | |
| Contract Revenue (Hospital | | | | | |
| Asset Transformation Program) | 5.25 | 10/1/38 | 13,595,000 | | 14,050,161 |
| New Jersey Higher Education | | | | | |
| Student Assistance Authority, | | | | | |
| Student Loan Revenue | 5.00 | 12/1/25 | 1,000,000 | | 1,059,960 |
| New Jersey Higher Education | | | | | |
| Student Assistance Authority, | | | | | |
| Student Loan Revenue | 5.00 | 12/1/26 | 1,500,000 | | 1,583,700 |
| New Jersey Higher Education | | | | | |
| Student Assistance Authority, | | | | | |
| Student Loan Revenue (Insured; | | | | | |
| Assured Guaranty Municipal Corp.) | 5.88 | 6/1/21 | 9,775,000 | | 10,951,812 |
| New Jersey Highway Authority, | | | | | |
| Revenue (Garden State Parkway) | 6.00 | 1/1/19 | 6,645,000 | | 8,294,090 |
| New Jersey Housing and Mortgage | | | | | |
| Finance Agency, MFHR (Insured: | | | | | |
| AMBAC and FHA) | 5.65 | 5/1/40 | 4,480,000 | | 4,481,434 |
| New Jersey Housing and Mortgage | | | | | |
| Finance Agency, MFHR (Insured; | | | | | |
| Assured Guaranty Municipal Corp.) | 5.70 | 5/1/20 | 2,180,000 | | 2,183,728 |
| New Jersey Housing and | | | | | |
| Mortgage Finance Agency, | | | | | |
| Multi-Family Revenue | 4.95 | 5/1/41 | 7,000,000 | | 7,136,150 |
| New Jersey Housing and Mortgage | | | | | |
| Finance Agency, SFHR | 5.20 | 10/1/25 | 5,865,000 | | 6,099,659 |
16
| | | | | |
| Long-Term Municipal | Coupon | Maturity | Principal | | |
| Investments (continued) | Rate (%) | Date | Amount ($) | | Value ($) |
| New Jersey (continued) | | | | | |
| New Jersey Housing and Mortgage | | | | | |
| Finance Agency, SFHR | 6.38 | 10/1/28 | 5,560,000 | | 6,169,376 |
| New Jersey Housing and Mortgage | | | | | |
| Finance Agency, SFHR | 5.25 | 10/1/37 | 1,260,000 | | 1,329,476 |
| New Jersey Transportation | | | | | |
| Trust Fund Authority | | | | | |
| (Transportation System) | 6.00 | 12/15/18 | 6,565,000 | | 7,400,068 |
| New Jersey Transportation | | | | | |
| Trust Fund Authority | | | | | |
| (Transportation System) | 5.00 | 6/15/20 | 4,000,000 | | 4,389,040 |
| New Jersey Transportation | | | | | |
| Trust Fund Authority | | | | | |
| (Transportation System) | 5.50 | 12/15/23 | 7,000,000 | | 8,550,990 |
| New Jersey Transportation | | | | | |
| Trust Fund Authority | | | | | |
| (Transportation System) | 5.50 | 6/15/31 | 2,500,000 | | 2,810,675 |
| New Jersey Transportation Trust | | | | | |
| Fund Authority (Transportation | | | | | |
| System) (Insured; AMBAC) | 0.00 | 12/15/24 | 1,000,000 | a | 539,320 |
| New Jersey Transportation Trust | | | | | |
| Fund Authority (Transportation | | | | | |
| System) (Insured; AMBAC) | 5.00 | 12/15/32 | 8,000,000 | | 8,392,160 |
| New Jersey Transportation Trust | | | | | |
| Fund Authority (Transportation | | | | | |
| System) (Insured; National | | | | | |
| Public Finance Guarantee Corp.) | 7.00 | 6/15/12 | 2,255,000 | | 2,325,131 |
| New Jersey Transportation Trust | | | | | |
| Fund Authority (Transportation | | | | | |
| System) (Insured; National | | | | | |
| Public Finance Guarantee Corp.) | 7.00 | 6/15/12 | 3,745,000 | | 3,856,114 |
| New Jersey Transportation Trust | | | | | |
| Fund Authority (Transportation | | | | | |
| System) (Prerefunded) | 6.00 | 12/15/18 | 3,435,000 | b | 4,561,920 |
| New Jersey Turnpike Authority, | | | | | |
| Turnpike Revenue | 6.50 | 1/1/16 | 60,000 | | 71,266 |
| New Jersey Turnpike Authority, | | | | | |
| Turnpike Revenue | 6.50 | 1/1/16 | 160,000 | | 176,301 |
| New Jersey Turnpike Authority, | | | | | |
| Turnpike Revenue | 5.25 | 1/1/40 | 5,420,000 | | 5,835,389 |
STATEMENT OF INVESTMENTS (continued)
| | | | |
| Long-Term Municipal | Coupon | Maturity | Principal | |
| Investments (continued) | Rate (%) | Date | Amount ($) | Value ($) |
| New Jersey (continued) | | | | |
| New Jersey Turnpike Authority, | | | | |
| Turnpike Revenue (Insured; | | | | |
| Assured Guaranty | | | | |
| Municipal Corp.) | 6.50 | 1/1/16 | 835,000 | 920,070 |
| New Jersey Turnpike Authority, | | | | |
| Turnpike Revenue (Insured; | | | | |
| Assured Guaranty | | | | |
| Municipal Corp.) | 6.50 | 1/1/16 | 165,000 | 197,325 |
| New Jersey Turnpike Authority, | | | | |
| Turnpike Revenue (Insured; | | | | |
| Assured Guaranty | | | | |
| Municipal Corp.) | 5.25 | 1/1/27 | 3,000,000 | 3,579,570 |
| New Jersey Turnpike Authority, | | | | |
| Turnpike Revenue (Insured; | | | | |
| National Public Finance | | | | |
| Guarantee Corp.) | 6.50 | 1/1/16 | 3,520,000 | 4,180,915 |
| North Jersey District Water Supply | | | | |
| Commission, Sewer Revenue | | | | |
| (Wanaque South Project) | | | | |
| (Insured; National Public | | | | |
| Finance Guarantee Corp.) | 6.00 | 7/1/19 | 1,690,000 | 2,014,598 |
| Port Authority of New York and | | | | |
| New Jersey (Consolidated | | | | |
| Bonds, 93rd Series) | 6.13 | 6/1/94 | 3,000,000 | 3,536,760 |
| Port Authority of New York and | | | | |
| New Jersey (Consolidated | | | | |
| Bonds, 139th Series) (Insured; | | | | |
| National Public Finance | | | | |
| Guarantee Corp.) | 5.00 | 10/1/18 | 11,235,000 | 12,349,512 |
| Port Authority of New York and | | | | |
| New Jersey (Consolidated | | | | |
| Bonds, 167th Series) | 5.00 | 9/15/24 | 3,675,000 | 4,180,901 |
| Port Authority of New York and | | | | |
| New Jersey (Consolidated | | | | |
| Bonds, 167th Series) | 5.50 | 9/15/26 | 7,600,000 | 8,822,992 |
| Port Authority of New York and | | | | |
| New Jersey, Special Obligation | | | | |
| Revenue (JFK International Air | | | | |
| Terminal LLC Project) | | | | |
| (Insured; National Public | | | | |
| Finance Guarantee Corp.) | 6.25 | 12/1/15 | 5,000,000 | 5,508,950 |
18
| | | | | |
| Long-Term Municipal | Coupon | Maturity | Principal | | |
| Investments (continued) | Rate (%) | Date | Amount ($) | | Value ($) |
| New Jersey (continued) | | | | | |
| Port Authority of New York and | | | | | |
| New Jersey, Special Project | | | | | |
| Revenue (JFK International Air | | | | | |
| Terminal LLC Project) | 5.00 | 12/1/20 | 2,500,000 | | 2,585,350 |
| Rahway Valley Sewerage Authority, | | | | | |
| Sewer Revenue (Insured; National | | | | | |
| Public Finance Guarantee Corp.) | 0.00 | 9/1/30 | 7,550,000 | a | 2,745,256 |
| Rutgers, The State University, | | | | | |
| GO | 5.00 | 5/1/39 | 3,450,000 | | 3,706,991 |
| Salem County Pollution Control | | | | | |
| Financing Authority, PCR (Public | | | | | |
| Service Electric and Gas Company | | | | | |
| Project) (Insured; National Public | | | | | |
| Finance Guarantee Corp.) | 5.45 | 2/1/32 | 1,590,000 | | 1,590,588 |
| South Jersey Port Corporation, | | | | | |
| Marine Terminal Revenue | 5.75 | 1/1/23 | 4,000,000 | | 4,779,040 |
| South Jersey Port Corporation, | | | | | |
| Marine Terminal Revenue | | | | | |
| (Insured; Assured Guaranty | | | | | |
| Municipal Corp.) | 5.75 | 1/1/34 | 2,900,000 | | 3,198,932 |
| South Jersey Port Corporation, | | | | | |
| Marine Terminal Revenue | | | | | |
| (Insured; Assured Guaranty | | | | | |
| Municipal Corp.) | 5.88 | 1/1/39 | 6,000,000 | | 6,629,160 |
| Tobacco Settlement Financing | | | | | |
| Corporation of New Jersey, | | | | | |
| Tobacco Settlement | | | | | |
| Asset-Backed Bonds | 4.50 | 6/1/23 | 2,525,000 | | 2,383,499 |
| Tobacco Settlement Financing | | | | | |
| Corporation of New Jersey, | | | | | |
| Tobacco Settlement | | | | | |
| Asset-Backed Bonds | 4.63 | 6/1/26 | 3,000,000 | | 2,534,670 |
| Tobacco Settlement Financing | | | | | |
| Corporation of New Jersey, | | | | | |
| Tobacco Settlement | | | | | |
| Asset-Backed Bonds | 5.00 | 6/1/29 | 3,950,000 | | 3,126,307 |
| Tobacco Settlement Financing | | | | | |
| Corporation of New Jersey, | | | | | |
| Tobacco Settlement | | | | | |
| Asset-Backed Bonds | 4.75 | 6/1/34 | 2,800,000 | | 2,016,560 |
STATEMENT OF INVESTMENTS (continued)
| | | | | |
| Long-Term Municipal | Coupon | Maturity | Principal | | |
| Investments (continued) | Rate (%) | Date | Amount ($) | | Value ($) |
| New Jersey (continued) | | | | | |
| Tobacco Settlement Financing | | | | | |
| Corporation of New Jersey, | | | | | |
| Tobacco Settlement | | | | | |
| Asset-Backed Bonds | | | | | |
| (Prerefunded) | 5.38 | 6/1/12 | 1,000,000 | b | 1,021,720 |
| Tobacco Settlement Financing | | | | | |
| Corporation of New Jersey, | | | | | |
| Tobacco Settlement | | | | | |
| Asset-Backed Bonds | | | | | |
| (Prerefunded) | 5.75 | 6/1/12 | 4,020,000 | b | 4,113,626 |
| Tobacco Settlement Financing | | | | | |
| Corporation of New Jersey, | | | | | |
| Tobacco Settlement | | | | | |
| Asset-Backed Bonds | | | | | |
| (Prerefunded) | 6.75 | 6/1/13 | 1,790,000 | b | 1,955,163 |
| Tobacco Settlement Financing | | | | | |
| Corporation of New Jersey, | | | | | |
| Tobacco Settlement | | | | | |
| Asset-Backed Bonds | | | | | |
| (Prerefunded) | 7.00 | 6/1/13 | 10,630,000 | b | 11,646,866 |
| Union County Improvement | | | | | |
| Authority, Revenue | | | | | |
| (Correctional Facility Project) | 5.00 | 6/15/22 | 1,780,000 | | 1,812,699 |
| University of Medicine and | | | | | |
| Dentistry of New Jersey, GO | | | | | |
| (Insured; AMBAC) | 5.50 | 12/1/27 | 15,425,000 | | 15,872,325 |
| U.S. Related—10.7% | | | | | |
| Guam, | | | | | |
| GO | 6.75 | 11/15/29 | 2,000,000 | | 2,083,320 |
| Guam Power Authority, | | | | | |
| Revenue | 5.50 | 10/1/30 | 2,250,000 | | 2,238,345 |
| Guam Waterworks Authority, | | | | | |
| Water and Wastewater | | | | | |
| System Revenue | 6.00 | 7/1/25 | 1,000,000 | | 1,015,890 |
| Puerto Rico Electric Power | | | | | |
| Authority, Power Revenue | 5.25 | 7/1/22 | 5,000,000 | | 5,568,700 |
| Puerto Rico Electric Power | | | | | |
| Authority, Power Revenue | 5.50 | 7/1/38 | 10,445,000 | | 10,840,448 |
20
| | | | | |
| Long-Term Municipal | Coupon | Maturity | Principal | | |
| Investments (continued) | Rate (%) | Date | Amount ($) | | Value ($) |
| U.S. Related (continued) | | | | | |
| Puerto Rico Electric Power | | | | | |
| Authority, Power Revenue | | | | | |
| (Insured; National Public | | | | | |
| Finance Guarantee Corp.) | 5.25 | 7/1/30 | 5,000,000 | | 5,385,700 |
| Puerto Rico Infrastructure | | | | | |
| Financing Authority, Special | | | | | |
| Tax Revenue (Insured; AMBAC) | 5.50 | 7/1/27 | 4,715,000 | | 5,059,619 |
| Puerto Rico Public Buildings | | | | | |
| Authority, Government | | | | | |
| Facilities Revenue | 6.25 | 7/1/22 | 2,000,000 | | 2,299,440 |
| Puerto Rico Sales Tax Financing | | | | | |
| Corporation, Sales Tax Revenue | | | | | |
| (First Subordinate Series) | 5.75 | 8/1/37 | 2,990,000 | | 3,268,997 |
| Puerto Rico Sales Tax Financing | | | | | |
| Corporation, Sales Tax Revenue | | | | | |
| (First Subordinate Series) | 6.00 | 8/1/39 | 2,230,000 | | 2,470,149 |
| Puerto Rico Sales Tax Financing | | | | | |
| Corporation, Sales Tax Revenue | | | | | |
| (First Subordinate Series) | 6.00 | 8/1/42 | 9,000,000 | | 9,874,260 |
| Puerto Rico Sales Tax Financing | | | | | |
| Corporation, Sales Tax Revenue | | | | | |
| (Insured; Berkshire Hathaway | | | | | |
| Assurance Corporation) | 0.00 | 8/1/54 | 21,100,000 | a | 1,689,899 |
| Puerto Rico Sales Tax Financing | | | | | |
| Corporation, Sales Tax Revenue | | | | | |
| (Insured; National Public | | | | | |
| Finance Guarantee Corp.) | 0.00 | 8/1/43 | 18,000,000 | a | 2,654,280 |
| Virgin Islands Public Finance | | | | | |
| Authority, Revenue (Virgin Islands | | | | | |
| Gross Receipts Taxes Loan Note) | 6.38 | 10/1/19 | 1,825,000 | | 1,829,453 |
| Virgin Islands Public Finance | | | | | |
| Authority, Revenue (Virgin Islands | | | | | |
| Matching Fund Loan Note) | 5.00 | 10/1/25 | 5,000,000 | | 5,221,200 |
| Virgin Islands Public Finance | | | | | |
| Authority, Revenue (Virgin Islands | | | | | |
| Matching Fund Loan Notes) | 5.00 | 10/1/25 | 2,000,000 | | 2,079,980 |
| Total Long-Term Municipal Investments | | | | |
| (cost $539,550,152) | | | | | 578,298,608 |
STATEMENT OF INVESTMENTS (continued)
| | | | | |
| Short-Term Municipal | Coupon | Maturity | Principal | |
| Investment—.2% | Rate (%) | Date | Amount ($) | Value ($) |
| New Jersey; | | | | |
| New Jersey Health Care Facilities | | | | |
| Financing Authority, Revenue | | | | |
| (Virtua Health Issue) (LOC; | | | | |
| JPMorgan Chase Bank) | | | | |
| (cost $1,000,000) | 0.05 | 1/1/12 | 1,000,000c | 1,000,000 |
| |
| Total Investments (cost $540,550,152) | | | 97.6% | 579,298,608 |
| Cash and Receivables (Net) | | | 2.4% | 13,971,955 |
| Net Assets | | | 100.0% | 593,270,563 |
|
| a Security issued with a zero coupon. Income is recognized through the accretion of discount. |
| b These securities are prerefunded; the date shown represents the prerefunded date. Bonds which are prerefunded are |
| collateralized by U.S. Government securities which are held in escrow and are used to pay principal and interest on |
| the municipal issue and to retire the bonds in full at the earliest refunding date. |
| c Variable rate demand note—rate shown is the interest rate in effect at December 31, 2011. Maturity date represents |
| the next demand date, or the ultimate maturity date if earlier. |
22
| | | |
| Summary of Abbreviations | | |
| |
| ABAG | Association of Bay Area Governments | ACA | American Capital Access |
| AGC | ACE Guaranty Corporation | AGIC | Asset Guaranty Insurance Company |
| AMBAC | American Municipal Bond | ARRN | Adjustable Rate Receipt Notes |
| | Assurance Corporation | | |
| BAN | Bond Anticipation Notes | BPA | Bond Purchase Agreement |
| CIFG | CDC Ixis Financial Guaranty | COP | Certificate of Participation |
| CP | Commercial Paper | EDR | Economic Development Revenue |
| EIR | Environmental Improvement Revenue | FGIC | Financial Guaranty Insurance |
| | | | Company |
| FHA | Federal Housing Administration | FHLB | Federal Home Loan Bank |
| FHLMC | Federal Home Loan Mortgage | FNMA | Federal National |
| | Corporation | | Mortgage Association |
| GAN | Grant Anticipation Notes | GIC | Guaranteed Investment Contract |
| GNMA | Government National | GO | General Obligation |
| | Mortgage Association | | |
| HR | Hospital Revenue | IDB | Industrial Development Board |
| IDC | Industrial Development Corporation | IDR | Industrial Development Revenue |
| LOC | Letter of Credit | LOR | Limited Obligation Revenue |
| LR | Lease Revenue | MFHR | Multi-Family Housing Revenue |
| MFMR | Multi-Family Mortgage Revenue | PCR | Pollution Control Revenue |
| PILOT | Payment in Lieu of Taxes | PUTTERS | Puttable Tax-Exempt Receipts |
| RAC | Revenue Anticipation Certificates | RAN | Revenue Anticipation Notes |
| RAW | Revenue Anticipation Warrants | RRR | Resources Recovery Revenue |
| SAAN | State Aid Anticipation Notes | SBPA | Standby Bond Purchase Agreement |
| SFHR | Single Family Housing Revenue | SFMR | Single Family Mortgage Revenue |
| SONYMA | State of New York Mortgage Agency | SWDR | Solid Waste Disposal Revenue |
| TAN | Tax Anticipation Notes | TAW | Tax Anticipation Warrants |
| TRAN | Tax and Revenue Anticipation Notes | XLCA | XL Capital Assurance |
STATEMENT OF INVESTMENTS (continued)
| | | | | |
| Summary of Combined Ratings (Unaudited) | |
| |
| Fitch | or | Moody’s | or | Standard & Poor’s | Value (%)† |
| AAA | | Aaa | | AAA | 24.9 |
| AA | | Aa | | AA | 25.0 |
| A | | A | | A | 31.8 |
| BBB | | Baa | | BBB | 15.1 |
| BB | | Ba | | BB | .5 |
| B | | B | | B | .3 |
| F1 | | MIG1/P1 | | SP1/A1 | .2 |
| Not Ratedd | | Not Ratedd | | Not Ratedd | 2.2 |
| | | | | | 100.0 |
| |
| † | Based on total investments. |
| d | Securities which, while not rated by Fitch, Moody’s and Standard & Poor’s, have been determined by the Manager to |
| | be of comparable quality to those rated securities in which the fund may invest. |
| See notes to financial statements. |
24
|
| STATEMENT OF ASSETS AND LIABILITIES |
| December 31, 2011 |
| | | | | | |
| | | | | Cost | Value |
| Assets ($): | | | | | |
| Investments in securities—See Statement of Investments | 540,550,152 | 579,298,608 |
| Cash | | | | | 5,816,391 |
| Interest receivable | | | | | 8,585,428 |
| Receivable for shares of Common Stock subscribed | | | 244,334 |
| Prepaid expenses | | | | | 47,325 |
| | | | | | 593,992,086 |
| Liabilities ($): | | | | | |
| Due to The Dreyfus Corporation and affiliates—Note 3(c) | | | 403,498 |
| Payable for shares of Common Stock redeemed | | | 275,527 |
| Accrued expenses | | | | | 42,498 |
| | | | | | 721,523 |
| Net Assets ($) | | | | | 593,270,563 |
| Composition of Net Assets ($): | | | | |
| Paid-in capital | | | | | 565,449,875 |
| Accumulated net realized gain (loss) on investments | | | (10,927,768) |
| Accumulated net unrealized appreciation | | | | |
| (depreciation) on investments | | | | 38,748,456 |
| Net Assets ($) | | | | | 593,270,563 |
| |
| |
| Net Asset Value Per Share | | | | |
| | Class A | Class B | Class C | Class I | Class Z |
| Net Assets ($) | 443,881,863 | 214,694 | 9,035,481 | 2,586,209 | 137,552,316 |
| Shares Outstanding | 34,112,188 | 16,515 | 695,002 | 198,704 | 10,568,886 |
| Net Asset Value | | | | | |
| Per Share ($) | 13.01 | 13.00 | 13.00 | 13.02 | 13.01 |
| |
| See notes to financial statements. | | | | |
|
| STATEMENT OF OPERATIONS |
| Year Ended December 31, 2011 |
| | |
| Investment Income ($): | |
| Interest Income | 29,076,579 |
| Expenses: | |
| Management fee—Note 3(a) | 3,433,011 |
| Shareholder servicing costs—Note 3(c) | 1,447,189 |
| Directors’ fees and expenses—Note 3(d) | 92,614 |
| Professional fees | 85,262 |
| Distribution fees—Note 3(b) | 65,242 |
| Registration fees | 63,422 |
| Custodian fees—Note 3(c) | 46,724 |
| Prospectus and shareholders’ reports | 31,316 |
| Loan commitment fees—Note 2 | 8,346 |
| Miscellaneous | 43,512 |
| Total Expenses | 5,316,638 |
| Less—reduction in expenses due to undertaking—Note 3(a) | (478,273) |
| Less—reduction in fees due to earnings credits—Note 3(c) | (483) |
| Net Expenses | 4,837,882 |
| Investment Income—Net | 24,238,697 |
| Realized and Unrealized Gain (Loss) on Investments—Note 4 ($): | |
| Net realized gain (loss) on investments | (2,528,365) |
| Net unrealized appreciation (depreciation) on investments | 36,597,601 |
| Net Realized and Unrealized Gain (Loss) on Investments | 34,069,236 |
| Net Increase in Net Assets Resulting from Operations | 58,307,933 |
| |
| See notes to financial statements. | |
26
STATEMENT OF CHANGES IN NET ASSETS
| | | | |
| | Year Ended December 31, |
| | 2011 | 2010 |
| Operations ($): | | |
| Investment income—net | 24,238,697 | 26,154,321 |
| Net realized gain (loss) on investments | (2,528,365) | 87,528 |
| Net unrealized appreciation | | |
| (depreciation) on investments | 36,597,601 | (21,884,911) |
| Net Increase (Decrease) in Net Assets | | |
| Resulting from Operations | 58,307,933 | 4,356,938 |
| Dividends to Shareholders from ($): | | |
| Investment income—net: | | |
| Class A Shares | (17,916,454) | (19,101,183) |
| Class B Shares | (11,078) | (21,018) |
| Class C Shares | (291,501) | (361,627) |
| Class I Shares | (100,906) | (93,888) |
| Class Z Shares | (5,633,078) | (6,254,785) |
| Total Dividends | (23,953,017) | (25,832,501) |
| Capital Stock Transactions ($): | | |
| Net proceeds from shares sold: | | |
| Class A Shares | 28,763,272 | 38,118,480 |
| Class B Shares | 2,102 | 3,610 |
| Class C Shares | 1,591,464 | 3,759,815 |
| Class I Shares | 834,997 | 2,067,872 |
| Class Z Shares | 4,012,360 | 8,849,851 |
| Dividends reinvested: | | |
| Class A Shares | 13,306,484 | 14,410,033 |
| Class B Shares | 7,868 | 16,166 |
| Class C Shares | 150,423 | 203,294 |
| Class I Shares | 63,443 | 49,838 |
| Class Z Shares | 4,545,138 | 5,044,869 |
| Cost of shares redeemed: | | |
| Class A Shares | (59,475,244) | (58,880,605) |
| Class B Shares | (298,762) | (288,885) |
| Class C Shares | (2,287,276) | (3,537,171) |
| Class I Shares | (710,540) | (726,093) |
| Class Z Shares | (14,941,227) | (21,786,800) |
| Increase (Decrease) in Net Assets | | |
| from Capital Stock Transactions | (24,435,498) | (12,695,726) |
| Total Increase (Decrease) in Net Assets | 9,919,418 | (34,171,289) |
| Net Assets ($): | | |
| Beginning of Period | 583,351,145 | 617,522,434 |
| End of Period | 593,270,563 | 583,351,145 |
STATEMENT OF CHANGES IN NET ASSETS (continued)
| | | | |
| | Year Ended December 31, |
| | 2011 | 2010 |
| Capital Share Transactions: | | |
| Class Aa | | |
| Shares sold | 2,296,610 | 2,993,337 |
| Shares issued for dividends reinvested | 1,064,904 | 1,128,425 |
| Shares redeemed | (4,801,204) | (4,644,497) |
| Net Increase (Decrease) in Shares Outstanding | (1,439,690) | (522,735) |
| Class Ba | | |
| Shares sold | 169 | 283 |
| Shares issued for dividends reinvested | 633 | 1,267 |
| Shares redeemed | (24,189) | (22,715) |
| Net Increase (Decrease) in Shares Outstanding | (23,387) | (21,165) |
| Class C | | |
| Shares sold | 127,862 | 294,183 |
| Shares issued for dividends reinvested | 12,066 | 15,931 |
| Shares redeemed | (186,803) | (278,417) |
| Net Increase (Decrease) in Shares Outstanding | (46,875) | 31,697 |
| Class I | | |
| Shares sold | 67,258 | 161,669 |
| Shares issued for dividends reinvested | 5,065 | 3,897 |
| Shares redeemed | (57,453) | (57,214) |
| Net Increase (Decrease) in Shares Outstanding | 14,870 | 108,352 |
| Class Z | | |
| Shares sold | 320,272 | 692,307 |
| Shares issued for dividends reinvested | 363,730 | 394,943 |
| Shares redeemed | (1,212,600) | (1,704,952) |
| Net Increase (Decrease) in Shares Outstanding | (528,598) | (617,702) |
| |
| a | During the period ended December 31, 2011, 7,796 Class B shares representing $97,746 were automatically |
| | converted to 7,788 Class A shares and during the period ended December 31, 2010, 16,046 Class B shares |
| | representing $204,088 were automatically converted to 16,024 Class A shares. |
| See notes to financial statements. |
28
FINANCIAL HIGHLIGHTS
The following tables describe the performance for each share class for the fiscal periods indicated.All information (except portfolio turnover rate) reflects financial results for a single fund share.Total return shows how much your investment in the fund would have increased (or decreased) during each period, assuming you had reinvested all dividends and distributions.These figures have been derived from the fund’s financial statements.
| | | | | | | | | | |
| | | Year Ended December 31, | |
| Class A Shares | 2011 | 2010 | 2009 | 2008 | 2007 |
| Per Share Data ($): | | | | | |
| Net asset value, beginning of period | 12.25 | 12.70 | 11.67 | 12.79 | 13.07 |
| Investment Operations: | | | | | |
| Investment income—neta | .53 | .54 | .55 | .55 | .54 |
| Net realized and unrealized | | | | | |
| gain (loss) on investments | .75 | (.46) | 1.02 | (1.12) | (.28) |
| Total from Investment Operations | 1.28 | .08 | 1.57 | (.57) | .26 |
| Distributions: | | | | | |
| Dividends from investment income—net | (.52) | (.53) | (.54) | (.55) | (.54) |
| Net asset value, end of period | 13.01 | 12.25 | 12.70 | 11.67 | 12.79 |
| Total Return (%)b | 10.72 | .56 | 13.65 | (4.61) | 2.05 |
| Ratios/Supplemental Data (%): | | | | | |
| Ratio of total expenses | | | | | |
| to average net assets | .96 | .95 | .96 | 1.00 | 1.10 |
| Ratio of net expenses | | | | | |
| to average net assets | .85 | .85 | .85 | .90 | 1.00 |
| Ratio of interest and expense related | | | | | |
| to floating rate notes issued | | | | | |
| to average net assets | — | — | — | .05 | .13 |
| Ratio of net investment income | | | | | |
| to average net assets | 4.23 | 4.22 | 4.40 | 4.45 | 4.21 |
| Portfolio Turnover Rate | 9.58 | 18.88 | 17.17 | 50.33 | 36.63 |
| Net Assets, end of period ($ x 1,000) | 443,882 | 435,549 | 458,014 | 403,333 | 439,752 |
| |
| a | Based on average shares outstanding at each month end. |
| b | Exclusive of sales charge. |
| See notes to financial statements. |
FINANCIAL HIGHLIGHTS (continued)
| | | | | | | | | | |
| | | Year Ended December 31, | |
| Class B Shares | 2011 | 2010 | 2009 | 2008 | 2007 |
| Per Share Data ($): | | | | | |
| Net asset value, beginning of period | 12.24 | 12.68 | 11.66 | 12.78 | 13.06 |
| Investment Operations: | | | | | |
| Investment income—neta | .44 | .45 | .48 | .49 | .47 |
| Net realized and unrealized | | | | | |
| gain (loss) on investments | .77 | (.43) | 1.02 | (1.12) | (.27) |
| Total from Investment Operations | 1.21 | .02 | 1.50 | (.63) | .20 |
| Distributions: | | | | | |
| Dividends from investment income—net | (.45) | (.46) | (.48) | (.49) | (.48) |
| Net asset value, end of period | 13.00 | 12.24 | 12.68 | 11.66 | 12.78 |
| Total Return (%)b | 10.10 | .05 | 12.98 | (5.09) | 1.53 |
| Ratios/Supplemental Data (%): | | | | | |
| Ratio of total expenses | | | | | |
| to average net assets | 1.63 | 1.59 | 1.53 | 1.57 | 1.67 |
| Ratio of net expenses | | | | | |
| to average net assets | 1.35 | 1.35 | 1.35 | 1.40 | 1.50 |
| Ratio of interest and expense related | | | | | |
| to floating rate notes issued | | | | | |
| to average net assets | — | — | — | .05 | .13 |
| Ratio of net investment income | | | | | |
| to average net assets | 3.70 | 3.63 | 3.90 | 3.95 | 3.71 |
| Portfolio Turnover Rate | 9.58 | 18.88 | 17.17 | 50.33 | 36.63 |
| Net Assets, end of period ($ x 1,000) | 215 | 488 | 774 | 1,441 | 1,621 |
| |
| a | Based on average shares outstanding at each month end. |
| b | Exclusive of sales charge. |
| See notes to financial statements. |
30
| | | | | | | | | | |
| | | Year Ended December 31, | |
| Class C Shares | 2011 | 2010 | 2009 | 2008 | 2007 |
| Per Share Data ($): | | | | | |
| Net asset value, beginning of period | 12.24 | 12.68 | 11.66 | 12.78 | 13.06 |
| Investment Operations: | | | | | |
| Investment income—neta | .43 | .45 | .45 | .45 | .45 |
| Net realized and unrealized | | | | | |
| gain (loss) on investments | .76 | (.45) | 1.02 | (1.12) | (.29) |
| Total from Investment Operations | 1.19 | — | 1.47 | (.67) | .16 |
| Distributions: | | | | | |
| Dividends from investment income—net | (.43) | (.44) | (.45) | (.45) | (.44) |
| Net asset value, end of period | 13.00 | 12.24 | 12.68 | 11.66 | 12.78 |
| Total Return (%)b | 9.90 | (.13) | 12.71 | (5.34) | 1.28 |
| Ratios/Supplemental Data (%): | | | | | |
| Ratio of total expenses | | | | | |
| to average net assets | 1.73 | 1.72 | 1.72 | 1.77 | 1.87 |
| Ratio of net expenses | | | | | |
| to average net assets | 1.60 | 1.60 | 1.60 | 1.64 | 1.75 |
| Ratio of interest and expense related | | | | | |
| to floating rate notes issued | | | | | |
| to average net assets | — | — | — | .05 | .13 |
| Ratio of net investment income | | | | | |
| to average net assets | 3.48 | 3.45 | 3.61 | 3.69 | 3.44 |
| Portfolio Turnover Rate | 9.58 | 18.88 | 17.17 | 50.33 | 36.63 |
| Net Assets, end of period ($ x 1,000) | 9,035 | 9,080 | 9,008 | 4,714 | 3,749 |
| |
| a | Based on average shares outstanding at each month end. |
| b | Exclusive of sales charge. |
| See notes to financial statements. |
FINANCIAL HIGHLIGHTS (continued)
| | | | | | | | |
| | | Year Ended December 31, | |
| Class I Shares | 2011 | 2010 | 2009 | 2008a |
| Per Share Data ($): | | | | |
| Net asset value, beginning of period | 12.25 | 12.70 | 11.66 | 11.28 |
| Investment Operations: | | | | |
| Investment income—netb | .54 | .57 | .56 | .03 |
| Net realized and unrealized | | | | |
| gain (loss) on investments | .77 | (.47) | 1.04 | .38 |
| Total from Investment Operations | 1.31 | .10 | 1.60 | .41 |
| Distributions: | | | | |
| Dividends from investment income—net | (.54) | (.55) | (.56) | (.03) |
| Net asset value, end of period | 13.02 | 12.25 | 12.70 | 11.66 |
| Total Return (%) | 10.97 | .70 | 13.91 | 3.61c |
| Ratios/Supplemental Data (%): | | | | |
| Ratio of total expenses | | | | |
| to average net assets | .76 | .72 | .78 | .76d |
| Ratio of net expenses | | | | |
| to average net assets | .70 | .70 | .70 | .70d |
| Ratio of net investment income | | | | |
| to average net assets | 4.36 | 4.34 | 4.55 | 5.03d |
| Portfolio Turnover Rate | 9.58 | 18.88 | 17.17 | 50.33 |
| Net Assets, end of period ($ x 1,000) | 2,586 | 2,252 | 958 | 10 |
| |
| a | From December 15, 2008 (commencement of initial offering) to December 31, 2008. |
| b | Based on average shares outstanding at each month end. |
| c | Not annualized. |
| d | Annualized. |
| See notes to financial statements. |
32
| | | | | | | | | | |
| | | Year Ended December 31, | |
| Class Z Shares | 2011 | 2010 | 2009 | 2008 | 2007a |
| Per Share Data ($): | | | | | |
| Net asset value, beginning of period | 12.25 | 12.70 | 11.67 | 12.79 | 12.84 |
| Investment Operations: | | | | | |
| Investment income—netb | .54 | .55 | .56 | .56 | .31 |
| Net realized and unrealized | | | | | |
| gain (loss) on investments | .75 | (.46) | 1.02 | (1.12) | (.05) |
| Total from Investment Operations | 1.29 | .09 | 1.58 | (.56) | .26 |
| Distributions: | | | | | |
| Dividends from investment income—net | (.53) | (.54) | (.55) | (.56) | (.31) |
| Net asset value, end of period | 13.01 | 12.25 | 12.70 | 11.67 | 12.79 |
| Total Return (%) | 10.80 | .65 | 13.72 | (4.56) | 2.03c |
| Ratios/Supplemental Data (%): | | | | | |
| Ratio of total expenses | | | | | |
| to average net assets | .78 | .77 | .79 | .85 | .91d |
| Ratio of net expenses | | | | | |
| to average net assets | .78 | .77 | .78 | .85 | .91d |
| Ratio of interest and expense related | | | | | |
| to floating rate notes issued | | | | | |
| to average net assets | — | — | — | .05 | .13d |
| Ratio of net investment income | | | | | |
| to average net assets | 4.30 | 4.31 | 4.47 | 4.50 | 4.26d |
| Portfolio Turnover Rate | 9.58 | 18.88 | 17.17 | 50.33 | 36.63 |
| Net Assets, end of period ($ x 1,000) | 137,552 | 135,981 | 148,768 | 140,950 | 163,869 |
| |
| a | From June 7, 2007 (commencement of initial offering) to December 31, 2007. |
| b | Based on average shares outstanding at each month end. |
| c | Not annualized. |
| d | Annualized. |
| See notes to financial statements. |
NOTES TO FINANCIAL STATEMENTS
NOTE 1—Significant Accounting Policies:
Dreyfus New Jersey Municipal Bond Fund, Inc. (the “fund”) is registered under the Investment Company Act of 1940, as amended (the “Act”), as a non-diversified open-end management investment com-pany.The fund’s investment objective is to seek as high a level of current income exempt from federal and New Jersey income taxes as is consistent with the preservation of capital. The Dreyfus Corporation (the “Manager” or “Dreyfus”), a wholly-owned subsidiary of The Bank of New York Mellon Corporation (“BNY Mellon”), serves as the fund’s investment adviser.
MBSC Securities Corporation (the “Distributor”), a wholly-owned subsidiary of the Manager, is the distributor of the fund’s shares.The fund is authorized to issue 675 million shares of $.001 par value Common Stock.The fund currently offers five classes of shares: Class A (200 million shares authorized), Class B (150 million shares authorized), Class C (150 million shares authorized), Class I (150 million shares authorized) and Class Z (25 million shares authorized). Class A shares are subject to a sales charge imposed at the time of purchase. Class B shares are subject to a contingent deferred sales charge (“CDSC”) imposed on Class B share redemptions made within six years of purchase and automatically convert to Class A shares after six years.The fund no longer offers Class B shares, except in connection with dividend reinvestment and permitted exchanges of Class B shares and, effective on or about March 13, 2012, all outstanding Class B shares will automatically convert to Class A shares. Class C shares are subject to a CDSC imposed on Class C shares redeemed within one year of purchase. Class I shares are sold at net asset value per share only to institutional investors. Class Z shares generally are offered only to shareholders of the fund who received Class Z shares of the fund in exchange for shares of certain other Dreyfus Funds as a result of the reorganization of such funds and to existing shareholders of the fund who have continuously maintained a fund account since the date the fund’s shares were classified as Class Z. Other differences between the
34
classes include the services offered to and the expenses borne by each class, the allocation of certain transfer agency costs and certain voting rights. Income, expenses (other than expenses attributable to a specific class), and realized and unrealized gains or losses on investments are allocated to each class of shares based on its relative net assets.
The Financial Accounting Standards Board (“FASB”) Accounting Standards Codification (“ASC”) is the exclusive reference of authoritative U.S. generally accepted accounting principles (“GAAP”) recognized by the FASB to be applied by nongovernmental entities. Rules and interpretive releases of the Securities and Exchange Commission (“SEC”) under authority of federal laws are also sources of authoritative GAAP for SEC registrants. The fund’s financial statements are prepared in accordance with GAAP, which may require the use of management estimates and assumptions.Actual results could differ from those estimates.
The fund enters into contracts that contain a variety of indemnifications. The fund’s maximum exposure under these arrangements is unknown.The fund does not anticipate recognizing any loss related to these arrangements.
(a) Portfolio valuation: The fair value of a financial instrument is the amount that would be received to sell an asset or paid to transfer a liability in an orderly transaction between market participants at the measurement date (i.e. the exit price). GAAP establishes a fair value hierarchy that prioritizes the inputs of valuation techniques used to measure fair value.This hierarchy gives the highest priority to unadjusted quoted prices in active markets for identical assets or liabilities (Level 1 measurements) and the lowest priority to unobservable inputs (Level 3 measurements).
Additionally, GAAP provides guidance on determining whether the volume and activity in a market has decreased significantly and whether such a decrease in activity results in transactions that are not orderly. GAAP requires enhanced disclosures around valuation inputs and techniques used during annual and interim periods.
NOTES TO FINANCIAL STATEMENTS (continued)
Various inputs are used in determining the value of the fund’s investments relating to fair value measurements.These inputs are summarized in the three broad levels listed below:
Level 1—unadjusted quoted prices in active markets for identical investments.
Level 2—other significant observable inputs (including quoted prices for similar investments, interest rates, prepayment speeds, credit risk, etc.).
Level 3—significant unobservable inputs (including the fund’s own assumptions in determining the fair value of investments).
The inputs or methodology used for valuing securities are not necessarily an indication of the risk associated with investing in those securities.
Changes in valuation techniques may result in transfers in or out of an assigned level within the disclosure hierarchy. Valuation techniques used to value the fund’s investments are as follows:
Investments in securities are valued each business day by an independent pricing service (the “Service”) approved by the Board of Directors. Investments for which quoted bid prices are readily available and are representative of the bid side of the market in the judgment of the Service are valued at the mean between the quoted bid prices (as obtained by the Service from dealers in such securities) and asked prices (as calculated by the Service based upon its evaluation of the market for such securities). Other investments (which constitute a majority of the portfolio securities) are carried at fair value as determined by the Service, based on methods which include consideration of: yields or prices of municipal securities of comparable quality, coupon, maturity and type; indications as to values from dealers; and general market conditions. All preceding securities are categorized within Level 2 of the fair value hierarchy.
The Service’s procedures are reviewed by Dreyfus under the general supervision of the Board of Directors.
36
When market quotations or official closing prices are not readily available, or are determined not to reflect accurately fair value, such as when the value of a security has been significantly affected by events after the close of the exchange or market on which the security is principally traded, but before the fund calculates its net asset value, the fund may value these investments at fair value as determined in accordance with the procedures approved by the Board of Directors. Certain factors may be considered when fair valuing investments such as: fundamental analytical data, the nature and duration of restrictions on disposition, an evaluation of the forces that influence the market in which the securities are purchased and sold, and public trading in similar securities of the issuer or comparable issuers. These securities are either categorized as Level 2 or 3 depending on the relevant inputs used.
For restricted securities where observable inputs are limited, assumptions about market activity and risk are used and are categorized within Level 3 of the fair value hierarchy.
The following is a summary of the inputs used as of December 31, 2011 in valuing the fund’s investments:
| | | | |
| | | Level 2—Other | Level 3— | |
| | Level 1— | Significant | Significant | |
| | Unadjusted | Observable | Unobservable | |
| | Quoted Prices | Inputs | Inputs | Total |
| Assets ($) | | | | |
| Investments in Securities: | | | |
| Municipal Bonds | — | 579,298,608 | — | 579,298,608 |
In May 2011, FASB issued Accounting Standards Update (“ASU”) No. 2011-04 “Amendments to Achieve Common FairValue Measurement and Disclosure Requirements in GAAP and International Financial Reporting Standards (“IFRS”)” (“ASU 2011-04”). ASU 2011-04 includes common requirements for measurement of and disclosure about fair value between GAAP and IFRS. ASU 2011-04 will require
NOTES TO FINANCIAL STATEMENTS (continued)
reporting entities to disclose the following information for fair value measurements categorized within Level 3 of the fair value hierarchy: quantitative information about the unobservable inputs used in the fair value measurement, the valuation processes used by the reporting entity and a narrative description of the sensitivity of the fair value measurement to changes in unobservable inputs and the interrelationships between those unobservable inputs. In addition, ASU 2011-04 will require reporting entities to make disclosures about amounts and reasons for all transfers in and out of Level 1 and Level 2 fair value measurements.The new and revised disclosures are effective for interim and annual reporting periods beginning after December 15, 2011. At this time, management is evaluating the implications of ASU 2011-04 and its impact on the financial statements.
(b) Securities transactions and investment income: Securities transactions are recorded on a trade date basis. Realized gains and losses from securities transactions are recorded on the identified cost basis.
Interest income, adjusted for accretion of discount and amortization of premium on investments, is earned from settlement date and recognized on the accrual basis. Securities purchased or sold on a when issued or delayed delivery basis may be settled a month or more after the trade date.
The fund follows an investment policy of investing primarily in municipal obligations of one state. Economic changes affecting the state and certain of its public bodies or municipalities may affect the ability of issuers within the state to pay interest on, or repay principal of, municipal obligations held by the fund.
(c) Dividends to shareholders: It is the policy of the fund to declare dividends from investment income-net on each business day. Such dividends are paid monthly. Dividends from net realized capital gains, if any, are normally declared and paid annually, but the fund may make distributions on a more frequent basis to comply with the distribution
38
requirements of the Internal Revenue Code of 1986, as amended (the “Code”).To the extent that net realized capital gains can be offset by capital loss carryovers, it is the policy of the fund not to distribute such gains. Income and capital gain distributions are determined in accordance with income tax regulations, which may differ from GAAP.
(d) Federal income taxes: It is the policy of the fund to continue to qualify as a regulated investment company, which can distribute tax exempt dividends, by complying with the applicable provisions of the Code, and to make distributions of income and net realized capital gains sufficient to relieve it from substantially all federal income and excise taxes.
As of and during the period ended December 31, 2011, the fund did not have any liabilities for any uncertain tax positions.The fund recognizes interest and penalties, if any, related to uncertain tax positions as income tax expense in the Statement of Operations. During the period, the fund did not incur any interest or penalties.
Each of the tax years in the four-year period ended December 31, 2011 remains subject to examination by the Internal Revenue Service and state taxing authorities.
At December 31, 2011, the components of accumulated earnings on a tax basis were as follows: undistributed tax-exempt income $644,201, accumulated capital losses $11,713,579 and unrealized appreciation $39,534,267.
Under the Regulated Investment Company Modernization Act of 2010 (the “2010 Act”), the fund will be permitted to carry forward capital losses incurred in taxable years beginning after December 22, 2010 (“post-enactment losses”) for an unlimited period. Furthermore, post-enactment capital loss carryovers will retain their character as either short-term or long-term capital losses rather than short-term as they were under previous statute. The 2010 Act requires post-enact-
NOTES TO FINANCIAL STATEMENTS (continued)
ment losses to be utilized before the utilization of losses incurred in taxable years prior to the effective date of the 2010 Act (“pre-enactment losses”). As a result of this ordering rule, pre-enactment losses may be more likely to expire unused.
The accumulated capital loss carryover is available for federal income tax purposes to be applied against future net securities profits, if any, realized subsequent to December 31, 2011. If not applied, $97,441 of the carryover expires in fiscal 2014, $822,282 expires in fiscal 2015, $1,125,950 expires in fiscal 2016, $6,969,933 expires in fiscal 2017 and $1,186,692 of post-enactment short-term losses and $1,511,281 of post-enactment long-term losses can be carried forward for an unlimited period.
The tax character of distributions paid to shareholders during the fiscal periods ended December 31, 2011 and December 31, 2010 were as follows: tax exempt income $23,788,452 and $25,741,743 and ordinary income $164,565 and $90,758, respectively.
During the period ended December 31, 2011, as a result of permanent book to tax differences, primarily due to the tax treatment for amortization adjustments and capital loss carryover expiration, the fund decreased accumulated undistributed investment income-net by $285,680, increased accumulated net realized gain (loss) on investments by $462,797 and decreased paid-in capital by $177,117. Net assets and net asset value per share were not affected by this reclassification.
NOTE 2—Bank Lines of Credit:
The fund participates with other Dreyfus-managed funds in a $225 million unsecured credit facility led by Citibank, N.A. and a $300 million unsecured credit facility provided by The Bank of New York Mellon, a subsidiary of BNY Mellon and an affiliate of Dreyfus (each, a “Facility”), each to be utilized primarily for temporary or emergency purposes, including the financing of redemptions. In connection therewith, the fund has agreed to pay its pro rata portion of commitment
40
fees for each Facility. Interest is charged to the fund based on rates determined pursuant to the terms of the respective Facility at the time of borrowing. During the period ended December 31, 2011, the fund did not borrow under the Facilities.
NOTE 3—Management Fee and Other Transactions With Affiliates:
(a) Pursuant to a management agreement with the Manager, the management fee is computed at the annual rate of .60% of the value of the fund’s average daily net assets and is payable monthly.The Manager has agreed until May 1, 2012, to limit the fund’s Class A, Class B and Class C expenses (exclusive of taxes, brokerage commissions, interest expense, commitment fees on borrowings, shareholder services fees, Rule 12b-1 distribution plan fees and extraordinary expenses) to .60% of the value of the fund’s average daily net assets for Class A, Class B and Class C shares.The reduction in expenses, pursuant to the undertaking, for Class A, Class B and Class C shares amounted to $477,008 during the period ended December 31, 2011.This agreement may be terminated after May 1, 2012, upon 90 days notice to shareholders.
The Manager had undertaken from January 1, 2011 through December 31, 2011, to limit the fund’s operating expenses or assume all or part of the expenses of the fund, if the aggregate expenses of the fund (exclusive of taxes, brokerage commissions, interest expense, commitment fees on borrowings, and extraordinary expenses) exceeded .70% of the value of the fund’s average daily net assets for Class I shares.The reduction in expenses, pursuant to the undertaking for Class I shares, amounted to $1,265 during the period ended December 31, 2011.
During the period ended December 31, 2011, the Distributor retained $5,210 from commissions earned on sales of the fund’s Class A shares and $7 and $608 from CDSCs on redemptions of the fund’s Class B and Class C shares, respectively.
NOTES TO FINANCIAL STATEMENTS (continued)
(b) Under the Distribution Plan (the “Plan”) adopted pursuant to Rule 12b-1 under the Act, Class B and Class C shares pay the Distributor for distributing their shares at an annual rate of .50% of the value of the average daily net assets of Class B shares and .75% of the value of the average daily net assets of Class C shares. During the period ended December 31, 2011, Class B and Class C shares were charged $1,517 and $63,725, respectively, pursuant to the Plan.
(c) Under the Shareholder Services Plan, Class A, Class B and Class C shares pay the Distributor at an annual rate of .25% of the value of their average daily net assets for the provision of certain services.The services provided may include personal services relating to shareholder accounts, such as answering shareholder inquiries regarding the fund and providing reports and other information, and services related to the maintenance of shareholder accounts. The Distributor may make payments to Service Agents (a securities dealer, financial institution or other industry professional) in respect of these services.The Distributor determines the amounts to be paid to Service Agents. During the period ended December 31, 2011, Class A, Class B and Class C shares were charged $1,071,423, $759 and $21,241, respectively, pursuant to the Shareholder Services Plan.
Under the Shareholder Services Plan, Class Z shares reimburse the Distributor an amount not to exceed an annual rate of .25% of the value of Class Z shares’ average daily net assets for certain allocated expenses of providing personal services and/or maintaining shareholder accounts. The services provided may include personal services relating to shareholder accounts, such as answering shareholder inquiries regarding Class Z shares and providing reports and other information, and services related to the maintenance of shareholder accounts. During the period ended December 31, 2011, Class Z shares were charged $77,827 pursuant to the Shareholder Services Plan.
42
The fund compensates Dreyfus Transfer, Inc., a wholly-owned subsidiary of the Manager, under a transfer agency agreement for providing personnel and facilities to perform transfer agency services for the fund. During the period ended December 31, 2011, the fund was charged $159,285 pursuant to the transfer agency agreement, which is included in Shareholder servicing costs in the Statement of Operations.
The fund has arrangements with the custodian and cash management bank whereby the fund may receive earnings credits when positive cash balances are maintained, which are used to offset custody and cash management fees. For financial reporting purposes, the fund includes net earnings credits as an expense offset in the Statement of Operations.
The fund compensates The Bank of New York Mellon under a cash management agreement for performing cash management services related to fund subscriptions and redemptions. During the period ended December 31, 2011, the fund was charged $15,884 pursuant to the cash management agreement, which is included in Shareholder servicing costs in the Statement of Operations.These fees were partially offset by earnings credits of $483.
The fund also compensates The Bank of New York Mellon under a custody agreement for providing custodial services for the fund. During the period ended December 31, 2011, the fund was charged $46,724 pursuant to the custody agreement.
During the period ended December 31, 2011, the fund was charged $6,402 for services performed by the Chief Compliance Officer.
The components of “Due toThe Dreyfus Corporation and affiliates” in the Statement of Assets and Liabilities consist of: management fees $300,274, Rule 12b-1 distribution plan fees $5,731, shareholder services plan fees $94,930, custodian fees $16,292, chief compliance
NOTES TO FINANCIAL STATEMENTS (continued)
officer fees $5,295 and transfer agency per account fees $25,792, which are offset against an expense reimbursement currently in effect in the amount of $44,816.
(d) Each Board member also serves as a Board member of other funds within the Dreyfus complex. Annual retainer fees and attendance fees are allocated to each fund based on net assets.
NOTE 4—Securities Transactions:
The aggregate amount of purchases and sales of investment securities, excluding short-term securities, during the period ended December 31, 2011, amounted to $54,046,633 and $87,193,622, respectively.
At December 31, 2011, the cost of investments for federal income tax purposes was $539,764,341; accordingly, accumulated net unrealized appreciation on investments was $39,534,267, consisting of $40,011,821 gross unrealized appreciation and $477,554 gross unrealized depreciation.
44
|
| REPORT OF INDEPENDENT REGISTERED |
| PUBLIC ACCOUNTING FIRM |
Shareholders and Board of Directors
Dreyfus New Jersey Municipal Bond Fund, Inc.
We have audited the accompanying statement of assets and liabilities of Dreyfus New Jersey Municipal Bond Fund, Inc., including the statement of investments, as of December 31, 2011 and the related statement of operations for the year then ended, the statement of changes in net assets for each of the two years in the period then ended, and financial highlights for each of the periods indicated therein. These financial statements and financial highlights are the responsibility of the Fund’s management. Our responsibility is to express an opinion on these financial statements and financial highlights based on our audits.
We conducted our audits in accordance with the standards of the Public Company Accounting Oversight Board (United States).Those standards require that we plan and perform the audit to obtain reasonable assurance about whether the financial statements and financial highlights are free of material misstatement.We were not engaged to perform an audit of the Fund’s internal control over financial reporting. Our audits included consideration of internal control over financial reporting as a basis for designing audit procedures that are appropriate in the circumstances, but not for the purpose of expressing an opinion on the effectiveness of the Fund’s internal control over financial reporting. Accordingly, we express no such opinion.An audit also includes examining, on a test basis, evidence supporting the amounts and disclosures in the financial statements and financial highlights, assessing the accounting principles used and significant estimates made by management, and evaluating the overall financial statement presentation. Our procedures included confirmation of securities owned as of December 31, 2011 by correspondence with the custodian and others.We believe that our audits provide a reasonable basis for our opinion.
In our opinion, the financial statements and financial highlights referred to above present fairly, in all material respects, the financial position of Dreyfus New Jersey Municipal Bond Fund, Inc. at December 31, 2011, the results of its operations for the year then ended, the changes in its net assets for each of the two years in the period then ended, and the financial highlights for each of the indicated periods, in conformity with U. S. generally accepted accounting principles.

|
| New York, New York |
| February 28, 2012 |
IMPORTANT TAX INFORMATION (Unaudited)
In accordance with federal tax law, the fund hereby designates all the dividends paid from investment income-net during the fiscal year ended December 31, 2011 as “exempt-interest dividends” (not subject to regular federal and, for individuals who are New Jersey residents, New Jersey personal income taxes), except $164,565 that is being designated as an ordinary income distribution for reporting purposes. Where required by federal tax law rules, shareholders will receive notification of their portion of the fund’s taxable ordinary dividends (if any) and capital gains (if any) distributions paid for the 2011 calendar year on Form 1099-DIV and their portion of the fund’s exempt-interest dividends paid for the 2011 calendar year on Form 1099-INT, both of which will be mailed in early 2012.
46
PROXY RESULTS (Unaudited)
The fund held a special meeting of shareholders on May 31, 2011.The proposal considered at the meeting, and the results, are as follows:
| | | |
| | | Shares | |
| | Votes For | | Authority Withheld |
| To elect Board Members: | | | |
| Joseph S. DiMartino† | 22,703,814 | | 1,190,003 |
| Philip L. Toia† | 22,636,636 | | 1,257,181 |
| Robin A. Melvin† | 22,706,387 | | 1,187,430 |
† Each new Board member’s term commenced on May 31, 2011.
In addition Gordon J. Davis, Esq., David P. Feldman and Lynn Martin continue as Board members of the fund.
|
| INFORMATION ABOUT THE RENEWAL OF THE |
| FUND’S MANAGEMENT AGREEMENT (Unaudited) |
At a meeting of the fund’s Board of Directors held on July 12, 2011, the Board considered the renewal of the fund’s Management Agreement pursuant to which Dreyfus provides the fund with investment advisory and administrative services (the “Agreement”). The Board members, none of whom are “interested persons” (as defined in the Investment Company Act of 1940, as amended) of the fund, were assisted in their review by independent legal counsel and met with counsel in executive session separate from Dreyfus representatives. In considering the renewal of the Agreement, the Board considered all factors that it believed to be relevant, including those discussed below.The Board did not identify any one factor as dispositive, and each Board member may have attributed different weights to the factors considered.
Analysis of Nature, Extent, and Quality of Services Provided to the Fund.The Board considered information previously provided to them in presentations from Dreyfus representatives regarding the nature, extent, and quality of the services provided to funds in the Dreyfus fund complex, and Dreyfus representatives confirmed that there had been no material changes in this information. Dreyfus provided the number of open accounts in the fund, the fund’s asset size and the allocation of fund assets among distribution channels. Dreyfus also had previously provided information regarding the diverse intermediary relationships and distribution channels of funds in the Dreyfus fund complex and Dreyfus’ corresponding need for broad, deep, and diverse resources to be able to provide ongoing shareholder services to each distribution channel, including the distribution channel(s) for the fund.
The Board also considered research support available to, and portfolio management capabilities of, the fund’s portfolio management personnel and that Dreyfus also provides oversight of day-to-day fund operations, including fund accounting and administration and assistance in meeting legal and regulatory requirements.The Board also considered Dreyfus’ extensive administrative, accounting, and compliance infrastructures.
48
Comparative Analysis of the Fund’s Performance and Management Fee and Expense Ratio.The Board reviewed reports prepared by Lipper, Inc. (“Lipper”), an independent provider of investment company data, which included information comparing (1) the fund’s performance with the performance of a group of comparable funds (the “Performance Group”) and with a broader group of funds (the “Performance Universe”), all for various periods ended May 31, 2011, and (2) the fund’s actual and contractual management fees and total expenses with those of a group of comparable funds (the “Expense Group”) and with a broader group of funds (the “Expense Universe”), the information for which was derived in part from fund financial statements available to Lipper as of December 31, 2010. Dreyfus previously had furnished the Board with a description of the methodology Lipper used to select the Performance Group and Performance Universe and the Expense Group and Expense Universe.
Dreyfus representatives stated that the usefulness of performance comparisons may be affected by a number of factors, including different investment limitations that may be applicable to the fund and comparison funds.They also noted that performance generally should be considered over longer periods of time, although it is possible that long-term performance can be adversely affected by even one period of significant underperformance so that a single investment decision or theme has the ability to affect disproportionately long-term performance. The Board discussed the results of the comparisons and noted that the fund’s total return performance was below the Performance Group and Performance Universe medians for all periods except the ten-year period when the fund’s total return performance was above the Performance Universe median.
The Board also noted that the fund’s yield performance was above, at and below the Performance Group medians for all periods ended May 31st but was above the Performance Universe medians for nine of the
|
| INFORMATION ABOUT THE RENEWAL OF THE FUND’S |
| MANAGEMENT AGREEMENT (Unaudited) (continued) |
ten periods. Dreyfus also provided a comparison of the fund’s calendar year total returns to the returns of the fund’s Lipper category average.
The Board also reviewed the range of actual and contractual management fees and total expenses of the Expense Group and Expense Universe funds and discussed the results of the comparisons.They noted that the fund’s contractual management fee was above the Expense Group median and the fund’s actual management fee and total expense ratio were above the Expense Group and the Expense Universe medians.
Dreyfus representatives noted that Dreyfus has contractually agreed to waive receipt of its fees and/or assume the expenses of the fund, until May 1, 2012, so that annual direct fund operating expenses (excluding Rule 12b-1 fees, shareholder services fees, taxes, interest expense, brokerage commissions, commitment fees on borrowings and extraordinary expenses) do not exceed .60% of the value of the fund’s average daily net assets for Class A, Class B and Class C shares.
Dreyfus representatives reviewed with the Board the management or investment advisory fees (1) paid by funds advised or administered by Dreyfus that are in the same Lipper category as the fund and (2) paid to Dreyfus or the Dreyfus-affiliated primary employer of the fund’s primary portfolio manager for advising any separate accounts and/or other types of client portfolios that are considered to have similar investment strategies and policies as the fund (the “Similar Clients”), and explained the nature of the Similar Clients.They discussed differences in fees paid and the relationship of the fees paid in light of any differences in the services provided and other relevant factors. The Board considered the relevance of the fee information provided for the Similar Clients to evaluate the appropriateness and reasonableness of the fund’s management fee.
Analysis of Profitability and Economies of Scale. Dreyfus representatives reviewed the expenses allocated and profit received by Dreyfus and the resulting profitability percentage for managing the fund, and the
50
method used to determine the expenses and profit. The Board concluded that the profitability results were not unreasonable, given the services rendered and service levels provided by Dreyfus.The Board also noted the expense limitation arrangement and its effect on Dreyfus’ profitability.The Board previously had been provided with information prepared by an independent consulting firm regarding Dreyfus’ approach to allocating costs to, and determining the profitability of, individual funds and the entire Dreyfus fund complex.The consulting firm also had analyzed where any economies of scale might emerge in connection with the management of a fund.
The Board’s counsel stated that the Board should consider the profitability analysis (1) as part of their evaluation of whether the fees under the Agreement bear a reasonable relationship to the mix of services provided by Dreyfus, including the nature, extent and quality of such services, and (2) in light of the relevant circumstances for the fund and the extent to which economies of scale would be realized if the fund grows and whether fee levels reflect these economies of scale for the benefit of fund shareholders. Dreyfus representatives noted that a discussion of economies of scale is predicated on a fund having achieved a substantial size with increasing assets and that, if a fund’s assets had been stable or decreasing, the possibility that Dreyfus may have realized any economies of scale would be less. Dreyfus representatives also noted that, as a result of shared and allocated costs among funds in the Dreyfus fund complex, the extent of economies of scale could depend substantially on the level of assets in the complex as a whole, so that increases and decreases in complex-wide assets can affect potential economies of scale in a manner that is disproportionate to, or even in the opposite direction from, changes in the fund’s asset level. The Board also considered potential benefits to Dreyfus from acting as investment adviser and noted that there were no soft dollar arrangements in effect for trading the fund’s investments.
|
| INFORMATION ABOUT THE RENEWAL OF THE FUND’S |
| MANAGEMENT AGREEMENT (Unaudited) (continued) |
At the conclusion of these discussions, the Board agreed that it had been furnished with sufficient information to make an informed business decision with respect to the renewal of the Agreement. Based on the discussions and considerations as described above, the Board concluded and determined as follows.
The Board concluded that the nature, extent and quality of the services provided by Dreyfus are adequate and appropriate.
The Board noted Dreyfus’ efforts to improve fund performance and agreed to closely monitor performance.
The Board concluded that the fee paid to Dreyfus was reasonable in light of the considerations described above.
The Board determined that the economies of scale which may accrue to Dreyfus and its affiliates in connection with the management of the fund had been adequately considered by Dreyfus in connection with the fee rate charged to the fund pursuant to the Agreement and that, to the extent in the future it were determined that material economies of scale had not been shared with the fund, the Board would seek to have those economies of scale shared with the fund.
The Board considered these conclusions and determinations, along with information received on a routine and regular basis throughout the year. In addition, it should be noted that the Board’s consideration of the contractual fee arrangements for this fund had the benefit of a number of years of reviews of prior or similar agreements during which lengthy discussions took place between the Board and Dreyfus representatives. Certain aspects of the arrangements may receive greater scrutiny in some years than in others, and the Board’s conclusions may be based, in part, on their consideration of the same or similar arrangements in prior years.The Board determined that renewal of the Agreement was in the best interests of the fund and its shareholders.
52
OFFICERS OF THE FUND (Unaudited)
BRADLEY J. SKAPYAK, President since January 2010.
Chief Operating Officer and a director of the Manager since June 2009. From April 2003 to June 2009, Mr. Skapyak was the head of the Investment Accounting and Support Department of the Manager. He is an officer of 75 investment companies (comprised of 163 portfolios) managed by the Manager. He is 53 years old and has been an employee of the Manager since February 1988.
JANETTE E. FARRAGHER, Vice President and Secretary since December 2011.
Assistant General Counsel of BNY Mellon, and an officer of 76 investment companies (comprised of 189 portfolios) managed by the Manager. She is 49 years old and has been an employee of the Manager since February 1984.
KIESHA ASTWOOD, Vice President and Assistant Secretary since January 2010.
Counsel of BNY Mellon, and an officer of 76 investment companies (comprised of 189 portfolios) managed by the Manager. She is 38 years old and has been an employee of the Manager since July 1995.
JAMES BITETTO, Vice President and Assistant Secretary since August 2005.
Senior Counsel of BNY Mellon and Secretary of the Manager, and an officer of 76 investment companies (comprised of 189 portfolios) managed by the Manager. He is 45 years old and has been an employee of the Manager since December 1996.
JONI LACKS CHARATAN, Vice President and Assistant Secretary since August 2005.
Senior Counsel of BNY Mellon, and an officer of 76 investment companies (comprised of 189 portfolios) managed by the Manager. She is 56 years old and has been an employee of the Manager since October 1988.
JOSEPH M. CHIOFFI, Vice President and Assistant Secretary since August 2005.
Senior Counsel of BNY Mellon, and an officer of 76 investment companies (comprised of 189 portfolios) managed by the Manager. He is 50 years old and has been an employee of the Manager since June 2000.
KATHLEEN DENICHOLAS, Vice President and Assistant Secretary since January 2010.
Managing Counsel of BNY Mellon, and an officer of 76 investment companies (comprised of 189 portfolios) managed by the Manager. She is 37 years old and has been an employee of the Manager since February 2001.
JOHN B. HAMMALIAN, Vice President and Assistant Secretary since August 2005.
Senior Managing Counsel of BNY Mellon, and an officer of 76 investment companies (comprised of 189 portfolios) managed by the Manager. He is 48 years old and has been an employee of the Manager since February 1991.
M. CRISTINA MEISER, Vice President and Assistant Secretary since January 2010.
Senior Counsel of BNY Mellon, and an officer of 76 investment companies (comprised of 189 portfolios) managed by the Manager. She is 41 years old and has been an employee of the Manager since August 2001.
ROBERT R. MULLERY, Vice President and Assistant Secretary since August 2005.
Managing Counsel of BNY Mellon, and an officer of 76 investment companies (comprised of 189 portfolios) managed by the Manager. He is 59 years old and has been an employee of the Manager since May 1986.
OFFICERS OF THE FUND (Unaudited) (continued)
JEFF PRUSNOFSKY, Vice President and Assistant Secretary since August 2005.
Senior Managing Counsel of BNY Mellon, and an officer of 76 investment companies (comprised of 189 portfolios) managed by the Manager. He is 46 years old and has been an employee of the Manager since October 1990.
JAMES WINDELS, Treasurer since November 2001.
Director – Mutual Fund Accounting of the Manager, and an officer of 76 investment companies (comprised of 189 portfolios) managed by the Manager. He is 53 years old and has been an employee of the Manager since April 1985.
RICHARD CASSARO, Assistant Treasurer since January 2008.
Senior Accounting Manager – Money Market and Municipal Bond Funds of the Manager, and an officer of 76 investment companies (comprised of 189 portfolios) managed by the Manager. He is 52 years old and has been an employee of the Manager since September 1982.
GAVIN C. REILLY, Assistant Treasurer since August 2005.
Tax Manager of the Investment Accounting and Support Department of the Manager, and an officer of 76 investment companies (comprised of 189 portfolios) managed by the Manager. He is 43 years old and has been an employee of the Manager since April 1991.
ROBERT S. ROBOL, Assistant Treasurer since August 2005.
Senior Accounting Manager – Fixed Income Funds of the Manager, and an officer of 76 investment companies (comprised of 189 portfolios) managed by the Manager. He is 47 years old and has been an employee of the Manager since October 1988.
ROBERT SALVIOLO, Assistant Treasurer since July 2007.
Senior Accounting Manager – Equity Funds of the Manager, and an officer of 76 investment companies (comprised of 189 portfolios) managed by the Manager. He is 44 years old and has been an employee of the Manager since June 1989.
ROBERT SVAGNA, Assistant Treasurer since August 2002.
Senior Accounting Manager – Equity Funds of the Manager, and an officer of 76 investment companies (comprised of 189 portfolios) managed by the Manager. He is 44 years old and has been an employee of the Manager since November 1990.
JOSEPH W. CONNOLLY, Chief Compliance Officer since October 2004.
Chief Compliance Officer of the Manager and The Dreyfus Family of Funds (76 investment companies, comprised of 189 portfolios). From November 2001 through March 2004, Mr. Connolly was first Vice-President, Mutual Fund Servicing for Mellon Global Securities Services. In that capacity, Mr. Connolly was responsible for managing Mellon’s Custody, Fund Accounting and Fund Administration services to third-party mutual fund clients. He is 54 years old and has served in various capacities with the Manager since 1980, including manager of the firm’s Fund Accounting Department from 1997 through October 2001.
STEPHEN J. STOREN, Anti-Money Laundering Compliance Officer since May 2011.
Chief Compliance Officer of the Distributor, and the Anti-Money Laundering Compliance Officer of 72 investment companies (comprised of 185 portfolios) managed by the Manager. He is 57 years old and has been an employee of the Distributor since October 1999.
56
Item 2. Code of Ethics.
The Registrant has adopted a code of ethics that applies to the Registrant's principal executive officer, principal financial officer, principal accounting officer or controller, or persons performing similar functions. There have been no amendments to, or waivers in connection with, the Code of Ethics during the period covered by this Report.
Item 3. Audit Committee Financial Expert.
The Registrant's Board has determined that David P. Feldman, a member of the Audit Committee of the Board, is an audit committee financial expert as defined by the Securities and Exchange Commission (the "SEC"). David P. Feldman is "independent" as defined by the SEC for purposes of audit committee financial expert determinations.
Item 4. Principal Accountant Fees and Services.
(a) Audit Fees. The aggregate fees billed for each of the last two fiscal years (the "Reporting Periods") for professional services rendered by the Registrant's principal accountant (the "Auditor") for the audit of the Registrant's annual financial statements or services that are normally provided by the Auditor in connection with the statutory and regulatory filings or engagements for the Reporting Periods, were $38,832 in 2010 and $30,312 in 2011.
(b) Audit-Related Fees. The aggregate fees billed in the Reporting Periods for assurance and related services by the Auditor that are reasonably related to the performance of the audit of the Registrant's financial statements and are not reported under paragraph (a) of this Item 4 were $ 5,382 in 2010 and $12,000 in 2011. These services consisted of one or more of the following: (i) agreed upon procedures related to compliance with Internal Revenue Code section 817(h), (ii) security counts required by Rule 17f-2 under the Investment Company Act of 1940, as amended, (iii) advisory services as to the accounting or disclosure treatment of Registrant transactions or events and (iv) advisory services to the accounting or disclosure treatment of the actual or potential impact to the Registrant of final or proposed rules, standards or interpretations by the Securities and Exchange Commission, the Financial Accounting Standards Boards or other regulatory or standard-setting bodies.
The aggregate fees billed in the Reporting Periods for non-audit assurance and related services by the Auditor to the Registrant's investment adviser (not including any sub-investment adviser whose role is primarily portfolio management and is subcontracted with or overseen by another investment adviser), and any entity controlling, controlled by or under common control with the investment adviser that provides ongoing services to the Registrant ("Service Affiliates"), that were reasonably related to the performance of the annual audit of the Service Affiliate, which required pre-approval by the Audit Committee were $ 0 in 2010 and $0 in 2011.
(c) Tax Fees. The aggregate fees billed in the Reporting Periods for professional services rendered by the Auditor for tax compliance, tax advice, and tax planning ("Tax Services") were $ 4,681 in 2010 and $3,508 in 2011. These services consisted of: (i) review or preparation of U.S. federal, state, local and excise tax returns; (ii) U.S. federal, state and local tax planning, advice and assistance regarding statutory, regulatory or administrative developments; (iii) tax advice regarding tax qualification matters and/or treatment of various financial instruments held or proposed to be acquired or held. The aggregate fees billed in the Reporting Periods for Tax Services by the Auditor to Service Affiliates, which required pre-approval by the Audit Committee were $0 in 2010 and $0 in 2011.
(d) All Other Fees. The aggregate fees billed in the Reporting Periods for products and services provided by the Auditor, other than the services reported in paragraphs (a) through (c) of this Item, were $ 207 in 2010 and $177 in 2011. [These services consisted of a review of the Registrant's anti-money laundering program].
-3-
SSL-DOCS2 70128344v15
The aggregate fees billed in the Reporting Periods for Non-Audit Services by the Auditor to Service Affiliates, other than the services reported in paragraphs (b) through (c) of this Item, which required pre-approval by the Audit Committee, were $0 in 2010 and $0 in 2011.
(e)(1) Audit Committee Pre-Approval Policies and Procedures. The Registrant's Audit Committee has established policies and procedures (the "Policy") for pre-approval (within specified fee limits) of the Auditor's engagements for non-audit services to the Registrant and Service Affiliates without specific case-by-case consideration. The pre-approved services in the Policy can include pre-approved audit services, pre-approved audit-related services, pre-approved tax services and pre-approved all other services. Pre-approval considerations include whether the proposed services are compatible with maintaining the Auditor's independence. Pre-approvals pursuant to the Policy are considered annually.
(e)(2) Note: None of the services described in paragraphs (b) through (d) of this Item 4 were approved by the Audit Committee pursuant to paragraph (c)(7)(i)(C) of Rule 2-01 of Regulation S-X.
(f) None of the hours expended on the principal accountant's engagement to audit the registrant's financial statements for the most recent fiscal year were attributed to work performed by persons other than the principal account's full-time, permanent employees.
Non-Audit Fees. The aggregate non-audit fees billed by the Auditor for services rendered to the Registrant, and rendered to Service Affiliates, for the Reporting Periods were $39,552,052 in 2010 and $20,226,638 in 2011.
Auditor Independence. The Registrant's Audit Committee has considered whether the provision of non-audit services that were rendered to Service Affiliates, which were not pre-approved (not requiring pre-approval), is compatible with maintaining the Auditor's independence.
Item 5. Audit Committee of Listed Registrants.
Not applicable. [CLOSED-END FUNDS ONLY]
Item 6. Investments.
(a) Not applicable.
Item 7. Disclosure of Proxy Voting Policies and Procedures for Closed-End Management Investment Companies.
Not applicable. [CLOSED-END FUNDS ONLY]
Item 8. Portfolio Managers of Closed-End Management Investment Companies.
Not applicable. [CLOSED-END FUNDS ONLY, beginning with reports for periods ended on and after December 31, 2005]
Item 9. Purchases of Equity Securities by Closed-End Management Investment Companies and Affiliated Purchasers.
Not applicable. [CLOSED-END FUNDS ONLY]
-4-
SSL-DOCS2 70128344v15
Item 10. Submission of Matters to a Vote of Security Holders.
There have been no material changes to the procedures applicable to Item 10.
Item 11. Controls and Procedures.
(a) The Registrant's principal executive and principal financial officers have concluded, based on their evaluation of the Registrant's disclosure controls and procedures as of a date within 90 days of the filing date of this report, that the Registrant's disclosure controls and procedures are reasonably designed to ensure that information required to be disclosed by the Registrant on Form N-CSR is recorded, processed, summarized and reported within the required time periods and that information required to be disclosed by the Registrant in the reports that it files or submits on Form N-CSR is accumulated and communicated to the Registrant's management, including its principal executive and principal financial officers, as appropriate to allow timely decisions regarding required disclosure.
(b) There were no changes to the Registrant's internal control over financial reporting that occurred during the second fiscal quarter of the period covered by this report that have materially affected, or are reasonably likely to materially affect, the Registrant's internal control over financial reporting.
Item 12. Exhibits.
(a)(1) Code of ethics referred to in Item 2.
(a)(2) Certifications of principal executive and principal financial officers as required by Rule 30a-2(a) under the Investment Company Act of 1940.
(a)(3) Not applicable.
(b) Certification of principal executive and principal financial officers as required by Rule 30a-2(b) under the Investment Company Act of 1940.
-5-
SSL-DOCS2 70128344v15
SIGNATURES
Pursuant to the requirements of the Securities Exchange Act of 1934 and the Investment Company Act of 1940, the Registrant has duly caused this Report to be signed on its behalf by the undersigned, thereunto duly authorized.
Dreyfus New Jersey Municipal Bond Fund
By: /s/Bradley J. Skapyak |
Bradley J. Skapyak, President |
Date: | February 23, 2012 |
|
Pursuant to the requirements of the Securities Exchange Act of 1934 and the Investment Company Act of 1940, this Report has been signed below by the following persons on behalf of the Registrant and in the capacities and on the dates indicated. |
|
By: /s/Bradley J. Skapyak |
Bradley J. Skapyak, President |
Date: | February 23, 2012 |
|
By: /s/James Windels |
James Windels, Treasurer |
Date: | February 23, 2012 |
|
EXHIBIT INDEX
(a)(1) Code of ethics referred to in Item 2.
(a)(2) Certifications of principal executive and principal financial officers as required by Rule 30a-2(a) under the Investment Company Act of 1940. (EX-99.CERT)
(b) Certification of principal executive and principal financial officers as required by Rule 30a-2(b) under the Investment Company Act of 1940. (EX-99.906CERT)