UNITED STATES
SECURITIES AND EXCHANGE COMMISSION
Washington, D.C. 20549
FORM N-CSR
CERTIFIED SHAREHOLDER REPORT OF REGISTERED
MANAGEMENT INVESTMENT COMPANIES
Investment Company Act File Number: 811-05476
LORD ABBETT GLOBAL FUND, INC.
(Exact name of Registrant as specified in charter)
90 Hudson Street, Jersey City, NJ 07302
(Address of principal executive offices) (Zip code)
Brooke A. Fapohunda, Esq., Vice President & Assistant Secretary
90 Hudson Street, Jersey City, NJ 07302
(Name and address of agent for service)
Registrant’s telephone number, including area code: (800) 201-6984
Date of fiscal year end: 12/31
Date of reporting period: 12/31/2015
| Item 1: | Report(s) to Shareholders. |

2015 LORD ABBETT
ANNUAL REPORT
Lord Abbett
Emerging Markets Corporate Debt Fund
Emerging Markets Currency Fund
Emerging Markets Local Bond Fund
Multi-Asset Global Opportunity Fund
For the fiscal year ended December 31, 2015
Table of Contents
Lord Abbett Emerging Markets Corporate Debt Fund,
Lord Abbett Emerging Markets Currency Fund,
Lord Abbett Emerging Markets Local Bond Fund, and
Lord Abbett Multi-Asset Global Opportunity Fund
Annual Report
For the fiscal year ended December 31, 2015

Daria L. Foster, Director, President and Chief Executive Officer of the Lord Abbett Funds, and E. Thayer Bigelow, Independent Chairman of the Lord Abbett Funds. | | Dear Shareholders: We are pleased to provide you with this overview of the performance of the Funds for the fiscal year ended December 31, 2015. On this page and the following pages, we discuss the major factors that influenced fiscal year performance. For detailed and more timely information about the Funds, please visit our website at www.lordabbett.com, where you also can access the quarterly commentaries that provide updates on the Fund’s performance and other portfolio related updates. Thank you for investing in Lord Abbett mutual funds. We value the trust that you place in us and look forward to serving your investment needs in the years to come. Best regards, 
Daria L. Foster Director, President and Chief Executive Officer |
Emerging Markets Corporate Debt Fund
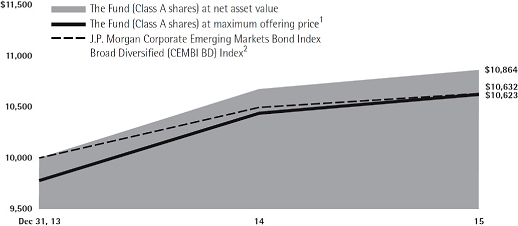
For the fiscal year ended December 31, 2015, the Fund returned 1.77%, reflecting performance at the net asset value (NAV) of Class A shares, with all distributions reinvested, compared to its benchmark, the J.P. Morgan Corporate Emerging Markets Bond Index Broad Diversified1, which returned 1.30% during the same period.
During the 12-month period, the U.S. dollar denominated emerging market corporate debt (as represented by the J.P. Morgan Corporate Emerging Markets Bond Index Broad Diversified1) generally outperformed emerging market currencies (as represented by the Barclays Global Emerging Markets Strategy Index2) and emerging market local bonds (as represented by the JP Morgan GBI-EM Global Diversified Index3). The asset class
1
benefited from lack of local currency exposure since the majority of emerging market currencies declined relative to the U.S. dollar in 2015. Emerging markets corporate debt also generally outperformed U.S. fixed-income markets (as represented by the Barclays U.S. Aggregate Bond Index4).
In terms of regional allocations, the Fund’s overweight to Russian debt in the first half of 2015 contributed to performance relative to the benchmark. Russian bonds rallied, as tensions in the Ukrainian conflict subsided to a degree. The Fund’s overweight to Brazilian debt in the first four months of 2015 also contributed to relative performance. During the last eight months of 2015, the Fund reduced its exposure to Brazilian bonds, which pared earlier gains following news of a massive corruption scandal at Brazil’s national oil company, Petrobras, and finished the year underperforming the Fund’s benchmark. In addition, the Fund’s underweight exposure to the oil and gas sector in the second half of the year benefited performance, as commodity prices suffered significant declines during that period.
The Fund’s overweight exposure to the industrial sector detracted from relative performance in the second quarter of 2015, as industrials underperformed. In terms of regional allocations, the Fund’s overweight to Mexican debt in the fourth quarter of 2015 hurt performance, as Mexican bonds underperformed during the period. Finally, the Fund’s exposure to U.S high-yield bonds at the end of 2015
detracted from performance, as investor concerns over liquidity and defaults in commodity-related sectors intensified.
Emerging Markets Currency Fund
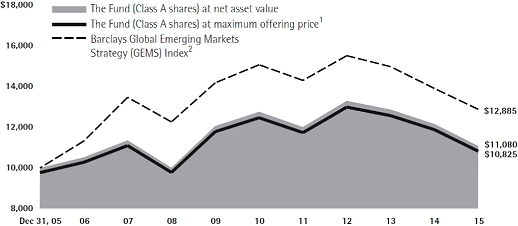
For the fiscal year ended December 31, 2015, the Fund returned -8.95%, reflecting performance at the net asset value (NAV) of Class A shares, with all distributions reinvested, compared to its benchmark, the Barclays Global Emerging Markets Strategy (GEMS) Index2, which returned -7.37% during the same period.
During 2015, emerging market currencies (as represented by Barclays Global Emerging Markets Strategy Index2) broadly underperformed emerging market corporate debt (as represented by the J.P. Morgan CEMBI Broad Diversified Index1) and outperformed emerging market local bonds (as represented by the J.P. Morgan GBI-EM Global Diversified Index3). Emerging market currencies also broadly underperformed domestic equity markets (as represented by the S&P 500® Index5) and underperformed U.S. fixed-income markets (as represented by the Barclays U.S. Aggregate Bond Index4).
Detracting from relative performance was the Fund’s overweight positioning to Latin American currencies in the first half of 2015. Idiosyncratic risks remained high in the region, and, subsequently, the currencies underperformed. In addition, the Fund’s overweight to currencies that are often driven by commodity prices, such as the Russian ruble, in the second part of
2
the year hurt performance due to the underlying weakness in commodities during the period.
In the beginning of the year, the Fund’s underweight position in the euro was a positive contributor to performance, relative to the benchmark, as the European Central Bank announced a quantitative easing program and the euro depreciated against the U.S. dollar. In the second part of the year, the Fund benefited from an underweight exposure to Asian currencies. The region’s currencies were adversely affected by the People’s Bank of China’s surprising decision to devalue the yuan in August 2015, and remained under pressure for the rest of the year.
Emerging Markets Local Bond Fund
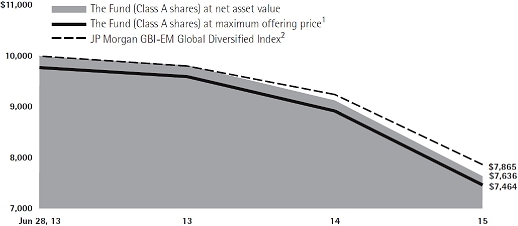
For the fiscal year ended December 31, 2015, the Fund returned -16.32%, reflecting performance at the net asset value (NAV) of Class A shares, with all distributions reinvested, compared to its benchmark, the JP Morgan GBI-EM Global Diversified Index3, which returned -14.92% during the same period.
During the 12-month period, emerging market local debt (as represented by the J.P. Morgan GBI-EM Global Diversified Index3) generally underperformed emerging market corporate debt (as represented by the J.P. Morgan CEMBI Broad Diversified Index1) and emerging market currencies (as represented by Barclays Global Emerging Markets Strategy Index2). Emerging market local bonds also
generally underperformed domestic equity markets (as represented by the S&P 500® Index5) and U.S. fixed-income markets (as represented by the Barclays U.S. Aggregate Bond Index4).
The Fund’s overweight positioning to Latin American currencies was the largest detractor to overall performance of the Fund in the first half of 2015. Idiosyncratic risks remained high in the region, and, subsequently, the currencies underperformed. In addition, the Fund’s overweight to Indonesian bonds in the third quarter of 2015 hurt performance, as the bonds were adversely affected by the People’s Bank of China’s surprising decision to devalue the yuan.
In the beginning of the year, the Fund’s exposure to the European currencies, such as Polish zloty and Romanian leu, was a positive contributor to performance, as the European Central Bank announced a quantitative easing program and both currencies depreciated against the U.S. dollar. The Fund’s exposure to Latin America was significantly reduced in the second part of the year, and an underweight to Brazilian bonds, in particular, helped performance, as political instability and economic woes continued to plague the country and the region.
Multi-Asset Global Opportunity Fund
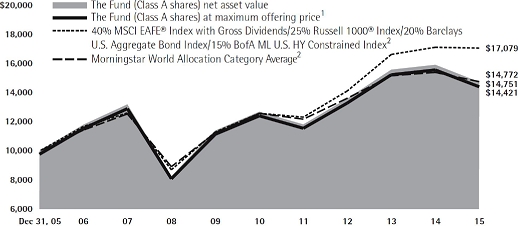
For the fiscal year ended December 31, 2015, the Fund returned -7.43%, reflecting performance at the net asset value (NAV) of Class A shares, with all distributions
3
reinvested, compared to its benchmark, 40% MSCI EAFE® Index with Gross Dividends6/25% Russell 1000® Index7/20% Barclays U.S. Aggregate Bond Index4/15% BofA Merrill Lynch U.S. High Yield Constrained Index8, which returned -0.32% over the same period.
During the 12-month period, domestic equity markets (as represented by the S&P 500® Index5) outperformed fixed income markets (as represented by the Barclays U.S. Aggregate Bond Index4). Domestic equity markets also outperformed foreign equity markets (as represented by the MSCI EAFE® Index with Gross Dividends6) and emerging market currencies (as represented by Barclays Global Emerging Markets Strategy Index2).
Detracting from relative performance was the Fund’s overweight exposure to international equities as U.S. stocks outpaced international equities during the period. Also detracting from the Fund’s relative performance was exposure to
emerging markets currencies. A strengthening U.S. dollar and declining commodity prices caused emerging market currencies to underperform the blended benchmark.
The Fund’s underweight exposure to developed markets currencies contributed to relative performance as the divergence between the monetary policies of the U.S. Federal Reserve and other central banks across most of the developed world led to U.S. dollar appreciation for the period. In addition, within fixed income, the Fund’s exposure to short duration bonds contributed to relative performance as this segment of the market outperformed the blended benchmark.
Each Fund’s portfolio is actively managed and, therefore, its holdings and the weightings of a particular issuer or particular sector as a percentage of portfolio assets are subject to change. Sectors may include many industries.
4
1 The J.P. Morgan Corporate Emerging Markets Bond Index Broad Diversified (CEMBI BD) is a market capitalization-weighted index that tracks total returns of U.S. dollar-denominated debt instruments issued by corporate entities in emerging markets countries. The index limits the current face amount allocations of the bonds in the CEMBI Broad by constraining the total face amount outstanding for countries with larger debt stocks.
2 The Barclays Global Emerging Markets Strategy (GEMS) Index is based on investing in one-month synthetic money market deposits across 15 diversified Emerging Market currencies.
3 The JP Morgan Government Bond Index-Emerging Markets (GBI-EM) Global Diversified Index is a comprehensive global emerging markets index that consists of regularly traded, liquid fixed-rate and domestic currency government bonds.
4 The Barclays U.S. Aggregate Bond Index represents securities that are SEC-registered, taxable, and dollar denominated. The index covers the U.S. investment-grade fixed-rate bond market, with index components for government and corporate securities, mortgage pass-through securities, and asset-backed securities. Total return comprises price appreciation/ depreciation and income as a percentage of the original investment.
5 The S&P 500® Index is widely regarded as the standard for measuring large cap U.S. stock market performance and includes a representative sample of leading companies in leading industries.
6 The MSCI EAFE® Index (Europe, Australasia, Far East) is a free float-adjusted market capitalization index that is designed to measure the equity market performance of developed markets, excluding the United States and Canada. The MSCI EAFE® Index consists of the following 21 developed market country indexes: Australia, Austria, Belgium, Denmark, Finland, France, Germany, Hong Kong, Ireland, Israel, Italy, Japan, the Netherlands, New Zealand, Norway, Portugal, Singapore, Spain, Sweden, Switzerland, and the United Kingdom. The MSCI EAFE® Index with Gross Dividends approximates the maximum possible dividend reinvestment. The amount reinvested is the entire dividend distributed to individuals resident in the country of the company, but does not include tax credits.
7 The Russell 1000 Index® measures the performance of the 1,000 largest companies in the Russell 3000 Index and represents approximately 92% of the total market capitalization of the Russell 3000 Index.
8 The BofA Merrill Lynch U.S. High Yield Constrained
Index is a capitalization-weighted index of all US dollar denominated below investment grade corporate debt publicly issued in the US domestic market. Qualifying securities must have a below investment grade rating (based on an average of Moody’s, S&P and Fitch), at least 18 months to final maturity at the time of issuance, at least one year remaining term to final maturity as of the rebalancing date, a fixed coupon schedule and a minimum amount outstanding of $100 million. The index caps individual issuer at 2%. Index constituents are capitalization-weighted, based on their current amount outstanding, provided the total allocation to an individual issuer does not exceed 2%. Issuers that exceed the limit are reduced to 2% and the face value of each of their bonds is adjusted on a pro-rata basis. The face values of bonds of all other issuers that fall below the 2% cap are increased on a pro-rata basis. In the event there are fewer than 50 issuers in the Index, each is equally weighted and the face values of their respective bonds are increased or decreased on a pro-rata basis.
Unless otherwise specified, indexes reflect total return, with all dividends reinvested. Indexes are unmanaged, do not reflect the deduction of fees or expenses, and are not available for direct investment.
Important Performance and Other
Information Performance data quoted in the following pages reflect past performance and are no guarantee of future results. Current performance may be higher or lower than the performance quoted. The investment return and principal value of an investment in the Funds will fluctuate so that shares, on any given day or when redeemed, may be worth more or less than their original cost. You can obtain performance data current to the most recent month end by calling Lord Abbett at 888-522-2388 or referring to www.lordabbett.com.
Except where noted, comparative Fund performance does not account for the deduction of sales charges and would be different if sales charges were included. Each Fund offers classes of shares with distinct pricing options. For a full description of the differences in pricing alternatives, please see each Fund’s prospectus.
During certain periods shown, expense waivers and reimbursements were in place. Without such waivers and expense reimbursements, the Funds’ returns would have been lower.
The annual commentary above discusses the views of the Funds’ management and various portfolio
5
holdings of the Funds as of December 31, 2015. These views and portfolio holdings may have changed after this date. Information provided in the commentary is not a recommendation to buy or sell securities. Because the Funds’ portfolio is actively managed and may change significantly, the Funds may no longer own the securities described above or may have otherwise changed their positions in the securities. For more recent information about the Funds’
portfolio holdings, please visit www.lordabbett.com.
A Note about Risk: See Notes to Financial Statements for a discussion of investment risks. For a more detailed discussion of the risks associated with each Fund, please see each Fund’s prospectus.
Mutual funds are not insured by the FDIC, are not deposits or other obligations of, or guaranteed by, banks, and are subject to investment risks including possible loss of principal amount invested.
6
Emerging Markets Corporate Debt Fund
Investment Comparison
Below is a comparison of a $10,000 investment in Class A shares with the same investment in the J.P. Morgan Corporate Emerging Markets Bond Index Broad Diversified (CEMBI BD) Index, assuming reinvestment of all dividends and distributions. The performance of the other classes will be greater than or less than the performance shown in the graph below due to different sales loads and expenses applicable to such classes. The graph and performance table below do not reflect the deduction of taxes that a shareholder would pay on Fund distributions or the redemption of Fund shares. During certain periods, expenses of the Fund have been waived or reimbursed by Lord Abbett; without such waiver or reimbursement of expenses, the Fund’s returns would have been lower. Past performance is no guarantee of future results.
Average Annual Total Returns at Maximum Applicable
Sales Charge for the Periods Ended December 31, 2015
| | 1 Year | Life of Class | |
| Class A3 | -0.51% | 3.08% | |
| Class C4 | 0.07% | 3.45% | |
| Class F5 | 1.83% | 4.32% | |
| Class I5 | 1.98% | 4.45% | |
| Class R25 | 1.98% | 4.45% | |
| Class R35 | 1.98% | 4.45% | |
| Class R46 | – | -1.33% | * |
| Class R56 | – | -1.21% | * |
| Class R66 | – | -1.18% | * |
1 Reflects the deduction of the maximum initial sales charge of 2.25%.
2 Performance for the unmanaged index does not reflect any fees or expenses. The performance of the index is not necessarily representative of the Fund’s performance.
3 Class A shares commenced operations on December 6, 2013 and performance for the Class began on December 31, 2013. Total return, which is the percentage change in net asset value, after deduction of the maximum initial sales charge of 2.25% applicable to Class A shares, with all dividends and distributions reinvested for the period shown ended December 31, 2015, is calculated using the SEC-required uniform method to compare such return.
4 Class C shares commenced operations on December 6, 2013 and performance for the Class began on December 31, 2013. The 1% CDSC for Class C normally applies before the first anniversary of the purchase date.
5 Commenced operations on December 6, 2013 and performance for the Class began on December 31, 2013. Performance is at net asset value.
6 Commenced operations and performance for the Class began on June 30, 2015. Performance is at net asset value.
* Since share Class has existed for less than one year, average annual returns are not provided.
7
Emerging Markets Currency Fund
Investment Comparison
Below is a comparison of a $10,000 investment in Class A shares with the same investment in the Barclays Global Emerging Markets Strategy (GEMS) Index, assuming reinvestment of all dividends and distributions. The performance of the other classes will be greater than or less than the performance shown in the graph below due to different sales loads and expenses applicable to such classes. The graph and performance table below do not reflect the deduction of taxes that a shareholder would pay on Fund distributions or the redemption of Fund shares. During certain periods, expenses of the Fund have been waived or reimbursed by Lord Abbett; without such waiver or reimbursement of expenses, the Fund’s returns would have been lower. Past performance is no guarantee of future results.
Average Annual Total Returns at Maximum Applicable
Sales Charge for the Periods Ended December 31, 2015
| | 1 Year | 5 Years | 10 Years | Life of Class | |
| Class A3 | -10.96% | -3.25% | 0.80% | – | |
| Class B4 | -14.22% | -3.92% | 0.49% | – | |
| Class C5 | -10.33% | -3.42% | 0.40% | – | |
| Class F6 | -8.86% | -2.70% | – | 0.27% | |
| Class I7 | -8.79% | -2.61% | 1.32% | – | |
| Class R26 | -9.30% | -3.17% | – | -0.16% | |
| Class R36 | -9.24% | -3.08% | – | -0.10% | |
| Class R48 | – | – | – | -6.44% | * |
| Class R58 | – | – | – | -6.34% | * |
| Class R68 | – | – | – | -6.29% | * |
1 Reflects the deduction of the maximum initial sales charge of 2.25%.
2 Performance for the unmanaged index does not reflect any fees or expenses. The performance of the index is not necessarily representative of the Fund’s performance.
3 Total return, which is the percentage change in net asset value, after deduction of the maximum initial sales charge of 2.25% applicable to Class A shares, with all dividends and distributions reinvested for the periods shown ending December 31, 2015, is calculated using the SEC-required uniform method to compute such return.
4 Performance reflects the deduction of a CDSC of 5% for 1 year, 2% for 5 years and 0% for 10 years. Class B shares automatically
convert to Class A shares after approximately 8 years. (There is no initial sales charge for automatic conversions.) All returns for periods greater than 8 years reflect this conversion.
5 The 1% CDSC for Class C shares normally applies before the first anniversary of the purchase date. Performance for other periods is at net asset value.
6 Commenced operations and performance for the Class began on September 28, 2007. Performance is at net asset value.
7 Performance is at net asset value.
8 Commenced operations and performance for the Class began on June 30, 2015. Performance is at net asset value.
* Since share Class has existed for less than one year, average annual returns are not provided.
8
Emerging Markets Local Bond Fund
Investment Comparison
Below is a comparison of a $10,000 investment in Class A shares with the same investment in the JP Morgan GBI-EM Global Diversified Index, assuming reinvestment of all dividends and distributions. The performance of the other classes will be greater than or less than the performance shown in the graph below due to different sales loads and expenses applicable to such classes. The graph and performance table below do not reflect the deduction of taxes that a shareholder would pay on Fund distributions or the redemption of Fund shares. During certain periods, expenses of the Fund have been waived or reimbursed by Lord Abbett; without such waiver or reimbursement of expenses, the Fund’s returns would have been lower. Past performance is no guarantee of future results.
Average Annual Total Returns at Maximum Applicable
Sales Charge for the Periods Ended December 31, 2015
| | 1 Year | Life of Class | |
| Class A3 | -18.20% | -11.00% | |
| Class C4 | -17.71% | -10.87% | |
| Class F5 | -16.23% | -10.09% | |
| Class I5 | -16.15% | -10.01% | |
| Class R25 | -16.15% | -10.11% | |
| Class R35 | -16.15% | -10.09% | |
| Class R46 | – | -11.24% | * |
| Class R56 | – | -11.13% | * |
| Class R66 | – | -11.11% | * |
1 Reflects the deduction of the maximum initial sales charge of 2.25%.
2 Performance for the unmanaged index does not reflect any fees or expenses. The performance of the index is not necessarily representative of the Fund’s performance.
3 Class A shares commenced operations on June 21, 2013 and performance for the Class began on June 28, 2013. Total return, which is the percentage change in net asset value, after deduction of the maximum initial sales charge of 2.25% applicable to Class A shares, with all dividends and distributions reinvested for the period shown ended December 31, 2015, is calculated using the SEC-required uniform method to compare such return.
4 Class C shares commenced operations on June 21, 2013 and performance for the Class began on June 28, 2013. The 1% CDSC for Class C normally applies before the first anniversary of the purchase date. Performance for other periods is at net asset value.
5 Commenced operations on June 21, 2013 and performance for the Class began on June 28, 2013. Performance is at net asset value.
6 Commenced operations and performance for the Class began on June 30, 2015. Performance is at net asset value.
* Since share Class has existed for less than one year, average annual returns are not provided.
9
Multi-Asset Global Opportunity Fund
Investment Comparison
Below is a comparison of a $10,000 investment in Class A shares with the same investment in the 40% MSCI EAFE® Index with Gross Dividends/25% Russell 1000® Index/20% Barclays U.S. Aggregate Bond Index/15% BofA Merrill Lynch U.S. High Yield Constrained Index and Morningstar World Allocation Category Average, assuming reinvestment of all dividends and distributions. The performance of the other classes will be greater than or less than the performance shown in the graph below due to different sales loads and expenses applicable to such classes. The graph and performance table below do not reflect the deduction of taxes that a shareholder would pay on Fund distributions or the redemption of Fund shares. During certain periods, expenses of the Fund have been waived or reimbursed by Lord Abbett and reimbursed by the Underlying Funds; without such waiver or reimbursement of expenses, the Fund’s returns would have been lower.
Past performance is no guarantee of future results.
Average Annual Total Returns at Maximum Applicable
Sales Charge for the Periods Ended December 31, 2015
| | 1 Year | 5 Years | 10 Years | Life of Class | |
| Class A3 | -9.53% | 2.57% | 3.73% | – | |
| Class B4 | -12.37% | 1.96% | 3.40% | – | |
| Class C5 | -9.02% | 2.29% | 3.25% | – | |
| Class F6 | -7.28% | 3.21% | – | 1.35% | |
| Class I7 | -7.23% | 3.29% | 4.28% | – | |
| Class R28 | -7.75% | 2.78% | – | 3.03% | |
| Class R38 | -7.69% | 2.81% | – | 2.98% | |
| Class R49 | – | – | – | -8.18% | * |
| Class R59 | – | – | – | -8.10% | * |
| Class R69 | – | – | – | -8.09% | * |
1 Reflects the deduction of the maximum initial sales charge of 2.25%.
2 Performance for each unmanaged index does not reflect any fees or expenses. The performance of each index is not necessarily representative of the Fund’s performance.
3 Total return, which is the percentage change in net asset value, after deduction of the maximum initial sales charge of 2.25% applicable to Class A shares, with all distributions reinvested for the periods shown ending December 31, 2015, is calculated using the SEC-required uniform method to compute such return.
4 Performance reflects the deduction of a CDSC of 5% for 1 year, 2% for 5 years and 0% for 10 years. Class B shares automatically convert to Class A shares after approximately 8 years. (There is no initial sales charge for automatic conversions.) All returns for periods greater than 8 years reflect this conversion.
5 The 1% CDSC for Class C shares normally applies before the first anniversary of the purchase date. Performance for other periods is at net asset value.
6 Class F shares commenced operations and performance for the Class began on September 28, 2007. Performance is at net asset value.
7 Performance is at net asset value.
8 Commenced operations on June 23, 2008 and performance for the Class began on June 30, 2008. Performance is at net asset value.
9 Commenced operations and performance for the Class began on June 30, 2015. Performance is at net asset value.
* Since share Class has existed for less than one year, average annual returns are not provided.
10
Expense Example
As a shareholder of a Fund, you incur two types of costs: (1) transaction costs, including sales charges (loads) on purchase payments (these charges vary among the share classes); and (2) ongoing costs, including management fees; distribution and service (12b-1) fees (these charges vary among the share classes); and other Fund expenses. This Example is intended to help you understand your ongoing costs (in dollars) of investing in each Fund and to compare these costs with the ongoing costs of investing in other mutual funds.
The Example is based on an investment of $1,000 invested at the beginning of the period and held for the entire period (July 1, 2015 through December 31, 2015).
Actual Expenses
For each class of each Fund, the first line of the table on the following pages provides information about actual account values and actual expenses. You may use the information in this line, together with the amount you invested, to estimate the expenses that you paid over the period. Simply divide your account value by $1,000 (for example, an $8,600 account value divided by $1,000 = 8.6), then multiply the result by the number in the first line under the heading entitled “Expenses Paid During Period 7/1/15 – 12/31/15” to estimate the expenses you paid on your account during this period.
Hypothetical Example for Comparison Purposes
For each class of each Fund, the second line of the table on the following pages provides information about hypothetical account values and hypothetical expenses based on the Fund’s actual expense ratio and an assumed rate of return of 5% per year before expenses, which is not the Fund’s actual return. The hypothetical account values and expenses may not be used to estimate the actual ending account balance or expenses you paid for the period. You may use this information to compare the ongoing costs of investing in each Fund and other funds. To do so, compare this 5% hypothetical example with the 5% hypothetical examples that appear in the shareholder reports of the other funds.
11
Emerging Markets Corporate Debt Fund
Please note that the expenses shown in the table are meant to highlight your ongoing costs only and do not reflect any transactional costs, such as sales charges (loads). Therefore, the second line of the table is useful in comparing ongoing costs only, and will not help you determine the relative total costs of owning different funds. In addition, if these transactional costs were included, your costs would have been higher.
| | | Beginning | | Ending | | Expenses | |
| | | Account | | Account | | Paid During | |
| | | Value | | Value | | Period† | |
| | | | | | | 7/1/15 - | |
| | | 7/1/15 | | 12/31/15 | | 12/31/15 | |
| Class A | | | | | | | | | | | | | |
| Actual | | | $1,000.00 | | | $ | 986.80 | | | | $5.26 | | |
| Hypothetical (5% Return Before Expenses) | | | $1,000.00 | | | $ | 1,019.91 | | | | $5.35 | | |
| Class C | | | | | | | | | | | | | |
| Actual | | | $1,000.00 | | | $ | 983.40 | | | | $8.85 | | |
| Hypothetical (5% Return Before Expenses) | | | $1,000.00 | | | $ | 1,016.28 | | | | $9.00 | | |
| Class F | | | | | | | | | | | | | |
| Actual | | | $1,000.00 | | | $ | 987.10 | | | | $4.76 | | |
| Hypothetical (5% Return Before Expenses) | | | $1,000.00 | | | $ | 1,020.42 | | | | $4.84 | | |
| Class I | | | | | | | | | | | | | |
| Actual | | | $1,000.00 | | | $ | 987.90 | | | | $4.26 | | |
| Hypothetical (5% Return Before Expenses) | | | $1,000.00 | | | $ | 1,020.92 | | | | $4.33 | | |
| Class R2 | | | | | | | | | | | | | |
| Actual | | | $1,000.00 | | | $ | 987.90 | | | | $4.26 | | |
| Hypothetical (5% Return Before Expenses) | | | $1,000.00 | | | $ | 1,020.92 | | | | $4.33 | | |
| Class R3 | | | | | | | | | | | | | |
| Actual | | | $1,000.00 | | | $ | 987.90 | | | | $4.26 | | |
| Hypothetical (5% Return Before Expenses) | | | $1,000.00 | | | $ | 1,020.92 | | | | $4.33 | | |
| Class R4 | | | | | | | | | | | | | |
| Actual | | | $1,000.00 | | | $ | 986.70 | | | | $5.51 | | |
| Hypothetical (5% Return Before Expenses) | | | $1,000.00 | | | $ | 1,019.66 | | | | $5.60 | | |
| Class R5 | | | | | | | | | | | | | |
| Actual | | | $1,000.00 | | | $ | 987.90 | | | | $4.26 | | |
| Hypothetical (5% Return Before Expenses) | | | $1,000.00 | | | $ | 1,020.92 | | | | $4.33 | | |
| Class R6 | | | | | | | | | | | | | |
| Actual | | | $1,000.00 | | | $ | 988.20 | | | | $3.96 | | |
| Hypothetical (5% Return Before Expenses) | | | $1,000.00 | | | $ | 1,021.22 | | | | $4.02 | | |
| † | For each class of the Fund, net expenses are equal to the annualized expense ratio for such class (1.05% for Class A, 1.77% for Class C, 0.95% for Class F, 0.85% for Classes I, R2 and R3, 1.10% for Class R4, 0.85% for Class R5 and 0.79% for Class R6) multiplied by the average account value over the period, multiplied by 184/365 (to reflect one-half year period). |
12
Portfolio Holdings Presented by Sector
December 31, 2015
| Sector* | %** |
| Auto | 1.07 | % |
| Basic Industry | 1.30 | % |
| Consumer Cyclicals | 3.70 | % |
| Consumer Discretionary | 2.15 | % |
| Consumer Services | 1.99 | % |
| Consumer Staples | 3.99 | % |
| Energy | 16.95 | % |
| Financial Services | 34.80 | % |
| Foreign Government | 3.84 | % |
| Health Care | 0.44 | % |
| Materials and Processing | 8.72 | % |
| Technology | 2.41 | % |
| Telecommunications | 7.31 | % |
| Transportation | 2.64 | % |
| Utilities | 5.59 | % |
| Repurchase Agreement | 3.10 | % |
| Total | 100.00 | % |
| * | A sector may comprise several industries. |
| ** | Represents percent of total investments. |
13
Emerging Markets Currency Fund
Please note that the expenses shown in the table are meant to highlight your ongoing costs only and do not reflect any transactional costs, such as sales charges (loads). Therefore, the second line of the table is useful in comparing ongoing costs only, and will not help you determine the relative total costs of owning different funds. In addition, if these transactional costs were included, your costs would have been higher.
| | | Beginning | | Ending | | Expenses | |
| | | Account | | Account | | Paid During | |
| | | Value | | Value | | Period† | |
| | | | | | | 7/1/15 - | |
| | | 7/1/15 | | 12/31/15 | | 12/31/15 | |
| Class A | | | | | | | | | | | | | |
| Actual | | | $1,000.00 | | | $ | 935.60 | | | | $4.93 | | |
| Hypothetical (5% Return Before Expenses) | | | $1,000.00 | | | $ | 1,020.11 | | | | $5.14 | | |
| Class B | | | | | | | | | | | | | |
| Actual | | | $1,000.00 | | | $ | 930.40 | | | | $8.81 | | |
| Hypothetical (5% Return Before Expenses) | | | $1,000.00 | | | $ | 1,016.08 | | | | $9.20 | | |
| Class C | | | | | | | | | | | | | |
| Actual | | | $1,000.00 | | | $ | 933.20 | | | | $7.89 | | |
| Hypothetical (5% Return Before Expenses) | | | $1,000.00 | | | $ | 1,017.04 | | | | $8.24 | | |
| Class F | | | | | | | | | | | | | |
| Actual | | | $1,000.00 | | | $ | 936.10 | | | | $4.39 | | |
| Hypothetical (5% Return Before Expenses) | | | $1,000.00 | | | $ | 1,020.67 | | | | $4.58 | | |
| Class I | | | | | | | | | | | | | |
| Actual | | | $1,000.00 | | | $ | 936.40 | | | | $3.95 | | |
| Hypothetical (5% Return Before Expenses) | | | $1,000.00 | | | $ | 1,021.12 | | | | $4.13 | | |
| Class R2 | | | | | | | | | | | | | |
| Actual | | | $1,000.00 | | | $ | 933.90 | | | | $6.82 | | |
| Hypothetical (5% Return Before Expenses) | | | $1,000.00 | | | $ | 1,018.15 | | | | $7.12 | | |
| Class R3 | | | | | | | | | | | | | |
| Actual | | | $1,000.00 | | | $ | 934.10 | | | | $6.34 | | |
| Hypothetical (5% Return Before Expenses) | | | $1,000.00 | | | $ | 1,018.65 | | | | $6.61 | | |
| Class R4 | | | | | | | | | | | | | |
| Actual | | | $1,000.00 | | | $ | 935.60 | | | | $4.88 | | |
| Hypothetical (5% Return Before Expenses) | | | $1,000.00 | | | $ | 1,020.16 | | | | $5.09 | | |
| Class R5 | | | | | | | | | | | | | |
| Actual | | | $1,000.00 | | | $ | 936.60 | | | | $3.76 | | |
| Hypothetical (5% Return Before Expenses) | | | $1,000.00 | | | $ | 1,021.32 | | | | $3.92 | | |
| Class R6 | | | | | | | | | | | | | |
| Actual | | | $1,000.00 | | | $ | 937.10 | | | | $3.27 | | |
| Hypothetical (5% Return Before Expenses) | | | $1,000.00 | | | $ | 1,021.83 | | | | $3.41 | | |
| † | For each class of the Fund, net expenses are equal to the annualized expense ratio for such class (1.01% for Class A, 1.81% for Class B, 1.62% for Class C, 0.90% for Class F, 0.81% for Class I, 1.40% for Class R2, 1.30% for Class R3, 1.01% for Class R4, 0.76% for Class R5 and 0.67% for Class R6) multiplied by the average account value over the period, multiplied by 184/365 (to reflect one-half year period). |
14
Portfolio Holdings Presented by Sector
December 31, 2015
| Sector* | %** |
| Asset Backed | 14.68% |
| Automotive | 1.29% |
| Banking | 3.97% |
| Basic Industry | 2.66% |
| Capital Goods | 1.63% |
| Consumer Goods | 1.71% |
| Energy | 9.44% |
| Financial Services | 2.95% |
| Foreign Government | 0.03% |
| Healthcare | 4.81% |
| Insurance | 1.10% |
| Leisure | 2.57% |
| Media | 3.47% |
| Mortgage Backed | 32.82% |
| Municipal | 0.49% |
| Real Estate | 3.50% |
| Retail | 0.12% |
| Services | 0.56% |
| Technology & Electronics | 3.23% |
| Telecommunications | 1.19% |
| Transportation | 2.08% |
| U.S. Government | 3.10% |
| Utility | 2.60% |
| Total | 100.00% |
| * | A sector may comprise several industries. |
| ** | Represents percent of total investments. |
15
Emerging Markets Local Bond Fund
Please note that the expenses shown in the table are meant to highlight your ongoing costs only and do not reflect any transactional costs, such as sales charges (loads). Therefore, the second line of the table is useful in comparing ongoing costs only, and will not help you determine the relative total costs of owning different funds. In addition, if these transactional costs were included, your costs would have been higher.
| | | Beginning | | Ending | | Expenses | |
| | | Account | | Account | | Paid During | |
| | | Value | | Value | | Period† | |
| | | | | | | 7/1/15 - | |
| | | 7/1/15 | | 12/31/15 | | 12/31/15 | |
| Class A | | | | | | | | | | | | | |
| Actual | | | $1,000.00 | | | $ | 887.50 | | | | $5.00 | | |
| Hypothetical (5% Return Before Expenses) | | | $1,000.00 | | | $ | 1,019.91 | | | | $5.35 | | |
| Class C | | | | | | | | | | | | | |
| Actual | | | $1,000.00 | | | $ | 884.30 | | | | $8.36 | | |
| Hypothetical (5% Return Before Expenses) | | | $1,000.00 | | | $ | 1,016.33 | | | | $8.94 | | |
| Class F | | | | | | | | | | | | | |
| Actual | | | $1,000.00 | | | $ | 887.90 | | | | $4.52 | | |
| Hypothetical (5% Return Before Expenses) | | | $1,000.00 | | | $ | 1,020.42 | | | | $4.84 | | |
| Class I | | | | | | | | | | | | | |
| Actual | | | $1,000.00 | | | $ | 888.40 | | | | $4.05 | | |
| Hypothetical (5% Return Before Expenses) | | | $1,000.00 | | | $ | 1,020.92 | | | | $4.33 | | |
| Class R2 | | | | | | | | | | | | | |
| Actual | | | $1,000.00 | | | $ | 888.40 | | | | $4.05 | | |
| Hypothetical (5% Return Before Expenses) | | | $1,000.00 | | | $ | 1,020.92 | | | | $4.33 | | |
| Class R3 | | | | | | | | | | | | | |
| Actual | | | $1,000.00 | | | $ | 888.40 | | | | $4.05 | | |
| Hypothetical (5% Return Before Expenses) | | | $1,000.00 | | | $ | 1,020.92 | | | | $4.33 | | |
| Class R4 | | | | | | | | | | | | | |
| Actual | | | $1,000.00 | | | $ | 887.60 | | | | $5.23 | | |
| Hypothetical (5% Return Before Expenses) | | | $1,000.00 | | | $ | 1,019.66 | | | | $5.60 | | |
| Class R5 | | | | | | | | | | | | | |
| Actual | | | $1,000.00 | | | $ | 888.70 | | | | $4.05 | | |
| Hypothetical (5% Return Before Expenses) | | | $1,000.00 | | | $ | 1,020.92 | | | | $4.33 | | |
| Class R6 | | | | | | | | | | | | | |
| Actual | | | $1,000.00 | | | $ | 888.90 | | | | $3.81 | | |
| Hypothetical (5% Return Before Expenses) | | | $1,000.00 | | | $ | 1,021.17 | | | | $4.08 | | |
| † | For each class of the Fund, net expenses are equal to the annualized expense ratio for such class (1.05% for Class A, 1.76% for Class C, 0.95% for Class F, 0.85% for Classes I, R2 and R3, 1.10% for Class R4, 0.85% for Class R5 and 0.80% for Class R6) multiplied by the average account value over the period, multiplied by 184/365 (to reflect one-half year period). |
16
Portfolio Holdings Presented by Sector
December 31, 2015
| Sector* | %** |
| Consumer Services | 1.15% |
| Energy | 2.25% |
| Financial Services | 3.48% |
| Foreign Government | 88.71% |
| Telecommunications | 1.08% |
| Transportation | 0.77% |
| Utilities | 2.56% |
| Total | 100.00% |
| * | A sector may comprise several industries. |
| ** | Represents percent of total investments. |
17
Multi-Asset Global Opportunity Fund
Please note that the expenses shown in the table are meant to highlight your ongoing costs only and do not reflect any transactional costs, such as sales charges (loads). Therefore, the second line of the table is useful in comparing ongoing costs only, and will not help you determine the relative total costs of owning different funds. In addition, if these transactional costs were included, your costs would have been higher.
| | | Beginning | | Ending | | Expenses | |
| | | Account | | Account | | Paid During | |
| | | Value | | Value | | Period†# | |
| | | | | | | 7/1/15 - | |
| | | 7/1/15 | | 12/31/15 | | 12/31/15 | |
| Class A | | | | | | | | | | | | | |
| Actual | | | $1,000.00 | | | $ | 918.10 | | | | $1.69 | | |
| Hypothetical (5% Return Before Expenses) | | | $1,000.00 | | | $ | 1,023.44 | | | | $1.79 | | |
| Class B | | | | | | | | | | | | | |
| Actual | | | $1,000.00 | | | $ | 914.70 | | | | $5.31 | | |
| Hypothetical (5% Return Before Expenses) | | | $1,000.00 | | | $ | 1,019.66 | | | | $5.60 | | |
| Class C | | | | | | | | | | | | | |
| Actual | | | $1,000.00 | | | $ | 914.10 | | | | $5.31 | | |
| Hypothetical (5% Return Before Expenses) | | | $1,000.00 | | | $ | 1,019.66 | | | | $5.60 | | |
| Class F | | | | | | | | | | | | | |
| Actual | | | $1,000.00 | | | $ | 919.70 | | | | $0.97 | | |
| Hypothetical (5% Return Before Expenses) | | | $1,000.00 | | | $ | 1,024.20 | | | | $1.02 | | |
| Class I | | | | | | | | | | | | | |
| Actual | | | $1,000.00 | | | $ | 919.00 | | | | $0.48 | | |
| Hypothetical (5% Return Before Expenses) | | | $1,000.00 | | | $ | 1,024.70 | | | | $0.51 | | |
| Class R2 | | | | | | | | | | | | | |
| Actual | | | $1,000.00 | | | $ | 916.50 | | | | $3.38 | | |
| Hypothetical (5% Return Before Expenses) | | | $1,000.00 | | | $ | 1,021.68 | | | | $3.57 | | |
| Class R3 | | | | | | | | | | | | | |
| Actual | | | $1,000.00 | | | $ | 916.60 | | | | $2.85 | | |
| Hypothetical (5% Return Before Expenses) | | | $1,000.00 | | | $ | 1,022.23 | | | | $3.01 | | |
| Class R4 | | | | | | | | | | | | | |
| Actual | | | $1,000.00 | | | $ | 918.20 | | | | $1.50 | | |
| Hypothetical (5% Return Before Expenses) | | | $1,000.00 | | | $ | 1,023.64 | | | | $1.58 | | |
| Class R5 | | | | | | | | | | | | | |
| Actual | | | $1,000.00 | | | $ | 919.00 | | | | $0.34 | | |
| Hypothetical (5% Return Before Expenses) | | | $1,000.00 | | | $ | 1,024.85 | | | | $0.36 | | |
| Class R6 | | | | | | | | | | | | | |
| Actual | | | $1,000.00 | | | $ | 919.10 | | | | $0.44 | | |
| Hypothetical (5% Return Before Expenses) | | | $1,000.00 | | | $ | 1,024.75 | | | | $0.46 | | |
| † | For each class of the Fund, net expenses are equal to the annualized expense ratio for such class (0.35% for Class A, 1.10% for Classes B and C, 0.20% for Class F, 0.10% for Class I, 0.70% for Class R2, 0.59% for Class R3, 0.31% for Class R4, 0.07% for Class R5 and 0.09% for Class R6) multiplied by the average account value over the period, multiplied by 184/365 (to reflect one-half year period). |
| # | Does not include expenses of Underlying Funds in which Multi-Asset Global Opportunity Fund invests. |
Portfolio Holdings Presented by Asset Allocation
December 31, 2015
| Asset Allocation | %* |
| Mutual Funds | 98.76% |
| Exchange Traded Fund | 0.94% |
| Municipal Bonds | 0.30% |
| Total | 100.00% |
| * | Represents percent of total investments. |
18
Schedule of Investments
EMERGING MARKETS CORPORATE DEBT FUND December 31, 2015
| Investments | | Interest
Rate | | Maturity
Date | | Principal
Amount
(000) | | | Fair
Value | |
| LONG-TERM INVESTMENTS 96.06% | | | | | | | | | | | | |
| | | | | | | | | | | | | |
| CORPORATE BONDS 91.95% | | | | | | | | | | | | |
| | | | | | | | | | | | | |
| Air Transportation 1.03% | | | | | | | | | | | | |
| Air Canada (Canada)†(a) | | 7.75% | | 4/15/2021 | | $ | 200 | | | $ | 208,500 | |
| Emirates Airline (United Arab Emirates)†(a) | | 4.50% | | 2/6/2025 | | | 181 | | | | 183,170 | |
| Total | | | | | | | | | | | 391,670 | |
| | | | | | | | | | | | | |
| Auto Parts: Original Equipment 0.54% | | | | | | | | | | | | |
| Nexteer Automotive Group Ltd.† | | 5.875% | | 11/15/2021 | | | 200 | | | | 205,000 | |
| | | | | | | | | | | | | |
| Automotive 0.52% | | | | | | | | | | | | |
| Hyundai Capital America† | | 2.60% | | 3/19/2020 | | | 200 | | | | 196,673 | |
| | | | | | | | | | | | | |
| Banks: Money Center 0.56% | | | | | | | | | | | | |
| Export-Import Bank of Korea (South Korea)(a) | | 4.00% | | 1/29/2021 | | | 200 | | | | 213,498 | |
| | | | | | | | | | | | | |
| Banks: Regional 20.09% | | | | | | | | | | | | |
| ADCB Finance Cayman Ltd. | | 2.75% | | 9/16/2019 | | | 200 | | | | 198,467 | |
| Agricola Senior Trust† | | 6.75% | | 6/18/2020 | | | 220 | | | | 219,771 | |
| Akbank TAS (Turkey)†(a) | | 4.00% | | 1/24/2020 | | | 200 | | | | 193,499 | |
| Alfa Bank OJSC Via Alfa Bond Issuance plc (Ireland)†(a) | | 7.75% | | 4/28/2021 | | | 200 | | | | 209,500 | |
| Axis Bank Ltd. (United Arab Emirates)†(a) | | 3.25% | | 5/21/2020 | | | 200 | | | | 200,997 | |
| Banco de Bogota SA (Colombia)†(a) | | 5.00% | | 1/15/2017 | | | 200 | | | | 203,200 | |
| Banco de Credito del Peru (Peru)†(a) | | 4.25% | | 4/1/2023 | | | 150 | | | | 150,562 | |
| Banco Internacional del Peru (Panama)†(a) | | 5.75% | | 10/7/2020 | | | 200 | | | | 214,500 | |
| Banco Santander Chile (Chile)†(a) | | 3.875% | | 9/20/2022 | | | 150 | | | | 149,734 | |
| BanColombia SA (Colombia)(a) | | 6.125% | | 7/26/2020 | | | 200 | | | | 206,500 | |
| Bangkok Bank PCL (Hong Kong)†(a) | | 4.80% | | 10/18/2020 | | | 100 | | | | 107,860 | |
| Bangkok Bank PCL (Hong Kong)†(a) | | 5.00% | | 10/3/2023 | | | 200 | | | | 218,546 | |
| Bank of China Ltd. (China)†(a) | | 5.00% | | 11/13/2024 | | | 200 | | | | 206,661 | |
| Bank of India (Jersey)(a) | | 3.125% | | 5/6/2020 | | | 200 | | | | 196,118 | |
| BBVA Banco Continental SA (Peru)†(a) | | 5.00% | | 8/26/2022 | | | 200 | | | | 205,000 | |
| BBVA Bancomer SA† | | 6.008% | | 5/17/2022 | | | 200 | | | | 199,250 | |
| BBVA Bancomer SA† | | 6.75% | | 9/30/2022 | | | 150 | | | | 165,375 | |
| CBQ Finance Ltd. | | 2.875% | | 6/24/2019 | | | 200 | | | | 200,534 | |
| CBQ Finance Ltd.† | | 7.50% | | 11/18/2019 | | | 100 | | | | 114,625 | |
| Corpbanca SA (Chile)(a) | | 3.125% | | 1/15/2018 | | | 200 | | | | 195,174 | |
| DBS Bank Ltd. (Singapore)†(a) | | 2.35% | | 2/28/2017 | | | 200 | | | | 201,805 | |
| DBS Bank Ltd. (Singapore)†(a) | | 3.625% | | 9/21/2022 | | | 200 | | | | 203,647 | |
| | See Notes to Financial Statements. | 19 |
Schedule of Investments (continued)
EMERGING MARKETS CORPORATE DEBT FUND December 31, 2015
| Investments | | Interest
Rate | | Maturity
Date | | Principal
Amount
(000) | | | Fair
Value | |
| Banks: Regional (continued) | | | | | | | | | | | | |
| ICICI Bank Ltd. (Hong Kong)†(a) | | 5.75% | | 11/16/2020 | | $ | 200 | | | $ | 222,007 | |
| Industrial & Commercial Bank of China Ltd. | | | | | | | | | | | | |
| (United Arab Emirates)(a) | | 2.625% | | 5/26/2020 | | | 200 | | | | 197,620 | |
| Industrial Bank of Korea (South Korea)†(a) | | 2.00% | | 4/23/2020 | | | 200 | | | | 196,351 | |
| KEB Hana Bank (South Korea)†(a) | | 2.50% | | 6/12/2019 | | | 400 | | | | 400,752 | |
| Korea Development Bank (The) (South Korea)(a) | | 3.00% | | 3/17/2019 | | | 200 | | | | 204,665 | |
| National Savings Bank (Sri Lanka)†(a) | | 5.15% | | 9/10/2019 | | | 200 | | | | 187,000 | |
| Oversea-Chinese Banking Corp., Ltd. (Singapore)†(a) | | 3.15% | | 3/11/2023 | | | 200 | | | | 201,133 | |
| Popular, Inc. | | 7.00% | | 7/1/2019 | | | 30 | | | | 28,163 | |
| QNB Finance Ltd. | | 2.125% | | 2/14/2018 | | | 200 | | | | 199,228 | |
| QNB Finance Ltd. | | 2.875% | | 4/29/2020 | | | 200 | | | | 201,529 | |
| Sberbank of Russia via SB Capital SA (Luxembourg)†(a) | | 6.125% | | 2/7/2022 | | | 200 | | | | 201,380 | |
| Siam Commercial Bank Ltd. (Hong Kong)†(a) | | 3.375% | | 9/19/2017 | | | 200 | | | | 203,541 | |
| State Bank of India (United Kingdom)†(a) | | 3.25% | | 4/18/2018 | | | 200 | | | | 202,978 | |
| Turkiye Garanti Bankasi AS (Turkey)†(a) | | 6.25% | | 4/20/2021 | | | 200 | | | | 208,546 | |
| Turkiye Halk Bankasi AS (Turkey)†(a) | | 4.75% | | 2/11/2021 | | | 200 | | | | 190,993 | |
| Vnesheconombank Via VEB Finance plc (Ireland)†(a) | | 6.902% | | 7/9/2020 | | | 200 | | | | 202,999 | |
| Woori Bank (South Korea)†(a) | | 4.75% | | 4/30/2024 | | | 200 | | | | 205,048 | |
| Total | | | | | | | | | | | 7,615,258 | |
| | | | | | | | | | | | | |
| Beverages 1.98% | | | | | | | | | | | | |
| Anadolu Efes Biracilik Ve Malt Sanayii AS (Turkey)†(a) | | 3.375% | | 11/1/2022 | | | 200 | | | | 168,581 | |
| Central American Bottling Corp. (Guatemala)†(a) | | 6.75% | | 2/9/2022 | | | 200 | | | | 203,500 | |
| Fomento Economico Mexicano SAB de CV (Mexico)(a) | | 2.875% | | 5/10/2023 | | | 200 | | | | 187,211 | |
| JB y Cia SA de CV (Mexico)†(a) | | 3.75% | | 5/13/2025 | | | 200 | | | | 191,510 | |
| Total | | | | | | | | | | | 750,802 | |
| | | | | | | | | | | | | |
| Building Materials 0.51% | | | | | | | | | | | | |
| Cemex SAB de CV (Mexico)†(a) | | 7.25% | | 1/15/2021 | | | 200 | | | | 193,000 | |
| | | | | | | | | | | | | |
| Business Services 1.62% | | | | | | | | | | | | |
| DP World Ltd. (United Arab Emirates)†(a) | | 6.85% | | 7/2/2037 | | | 200 | | | | 197,500 | |
| HPHT Finance 15 Ltd.† | | 2.875% | | 3/17/2020 | | | 210 | | | | 209,116 | |
| Mersin Uluslararasi Liman Isletmeciligi AS (Turkey)†(a) | | 5.875% | | 8/12/2020 | | | 200 | | | | 205,616 | |
| Total | | | | | | | | | | | 612,232 | |
| 20 | See Notes to Financial Statements. | |
Schedule of Investments (continued)
EMERGING MARKETS CORPORATE DEBT FUND December 31, 2015
| Investments | | Interest
Rate | | Maturity
Date | | Principal
Amount
(000) | | | Fair
Value | |
| Chemicals 3.10% | | | | | | | | | | | | |
| Braskem Finance Ltd. | | 6.45% | | 2/3/2024 | | $ | 200 | | | $ | 173,000 | |
| Israel Chemicals Ltd. (Israel)†(a) | | 4.50% | | 12/2/2024 | | | 200 | | | | 200,920 | |
| Mexichem SAB de CV (Mexico)†(a) | | 4.875% | | 9/19/2022 | | | 200 | | | | 199,500 | |
| OCP SA (Morocco)†(a) | | 6.875% | | 4/25/2044 | | | 200 | | | | 197,066 | |
| PhosAgro OAO via PhosAgro Bond Funding Ltd. (Ireland)†(a) | | 4.204% | | 2/13/2018 | | | 200 | | | | 198,375 | |
| PTT Global Chemical PCL (Thailand)†(a) | | 4.25% | | 9/19/2022 | | | 200 | | | | 205,094 | |
| Total | | | | | | | | | | | 1,173,955 | |
| | | | | | | | | | | | | |
| Containers 0.29% | | | | | | | | | | | | |
| PaperWorks Industries, Inc.† | | 9.50% | | 8/15/2019 | | | 120 | | | | 110,400 | |
| | | | | | | | | | | | | |
| Diversified 1.39% | | | | | | | | | | | | |
| Hutchison Whampoa International 03/33 Ltd. | | 7.45% | | 11/24/2033 | | | 100 | | | | 136,389 | |
| Hutchison Whampoa International 14 Ltd. (Hong Kong)†(a) | | 3.625% | | 10/31/2024 | | | 200 | | | | 198,816 | |
| KOC Holding AS (Turkey)†(a) | | 3.50% | | 4/24/2020 | | | 200 | | | | 192,024 | |
| Total | | | | | | | | | | | 527,229 | |
| | | | | | | | | | | | | |
| Drugs 0.43% | | | | | | | | | | | | |
| Teva Pharmaceutical Finance Co. LLC | | 6.15% | | 2/1/2036 | | | 150 | | | | 164,481 | |
| | | | | | | | | | | | | |
| Electric: Power 5.54% | | | | | | | | | | | | |
| AES El Salvador Trust II† | | 6.75% | | 3/28/2023 | | | 200 | | | | 179,500 | |
| AES Gener SA (Chile)†(a) | | 5.00% | | 7/14/2025 | | | 200 | | | | 191,792 | |
| Dubai Electricity & Water Authority (United Arab Emirates)†(a) | | 7.375% | | 10/21/2020 | | | 100 | | | | 118,729 | |
| E.CL SA (Chile)†(a) | | 4.50% | | 1/29/2025 | | | 200 | | | | 197,553 | |
| Eskom Holdings SOC Ltd. (South Africa)†(a) | | 6.75% | | 8/6/2023 | | | 200 | | | | 174,500 | |
| Israel Electric Corp. Ltd. (Israel)†(a) | | 7.25% | | 1/15/2019 | | | 200 | | | | 222,412 | |
| Korea East-West Power Co. Ltd. (South Korea)†(a) | | 2.50% | | 6/2/2020 | | | 200 | | | | 199,307 | |
| Korea Hydro & Nuclear Power Co., Ltd. (South Korea)†(a) | | 3.25% | | 6/15/2025 | | | 200 | | | | 199,894 | |
| Korea Western Power Co. Ltd. (South Korea)†(a) | | 2.875% | | 10/10/2018 | | | 200 | | | | 203,118 | |
| Majapahit Holding BV (Netherlands)†(a) | | 8.00% | | 8/7/2019 | | | 200 | | | | 224,500 | |
| Star Energy Geothermal Wayang Windu Ltd. (Indonesia)†(a) | | 6.125% | | 3/27/2020 | | | 200 | | | | 190,200 | |
| Total | | | | | | | | | | | 2,101,505 | |
| | | | | | | | | | | | | |
| Energy Equipment & Services 0.56% | | | | | | | | | | | | |
| Greenko Dutch BV (Netherlands)†(a) | | 8.00% | | 8/1/2019 | | | 200 | | | | 210,450 | |
| | See Notes to Financial Statements. | 21 |
Schedule of Investments (continued)
EMERGING MARKETS CORPORATE DEBT FUND December 31, 2015
| Investments | | Interest
Rate | | Maturity
Date | | Principal
Amount
(000) | | | Fair
Value | |
| Engineering & Contracting Services 1.08% | | | | | | | | | | | | |
| Aeropuertos Dominicanos Siglo XXI SA (Dominican Republic)†(a) | | 9.75% | | 11/13/2019 | | $ | 200 | | | $ | 209,000 | |
| China Railway Resources Huitung Ltd. (Hong Kong)(a) | | 3.85% | | 2/5/2023 | | | 200 | | | | 198,695 | |
| Total | | | | | | | | | | | 407,695 | |
| | | | | | | | | | | | | |
| Entertainment 0.26% | | | | | | | | | | | | |
| Eldorado Resorts, Inc.† | | 7.00% | | 8/1/2023 | | | 70 | | | | 68,950 | |
| Mohegan Tribal Gaming Authority | | 9.75% | | 9/1/2021 | | | 30 | | | | 30,075 | |
| Total | | | | | | | | | | | 99,025 | |
| | | | | | | | | | | | | |
| Financial Services 1.86% | | | | | | | | | | | | |
| Guanay Finance Ltd.† | | 6.00% | | 12/15/2020 | | | 200 | | | | 198,500 | |
| Indian Railway Finance Corp., Ltd. (India)(a) | | 3.917% | | 2/26/2019 | | | 200 | | | | 205,548 | |
| Link Finance Cayman 2009 Ltd. (The) | | 3.60% | | 9/3/2024 | | | 200 | | | | 200,450 | |
| SUAM Finance BV (Curacao)†(a) | | 4.875% | | 4/17/2024 | | | 100 | | | | 101,750 | |
| Total | | | | | | | | | | | 706,248 | |
| | | | | | | | | | | | | |
| Food 1.98% | | | | | | | | | | | | |
| Cencosud SA (Chile)†(a) | | 4.875% | | 1/20/2023 | | | 200 | | | | 189,556 | |
| Cosan Luxembourg SA (Luxembourg)†(a) | | 5.00% | | 3/14/2023 | | | 200 | | | | 165,250 | |
| Gruma SAB de CV (Mexico)†(a) | | 4.875% | | 12/1/2024 | | | 200 | | | | 205,000 | |
| Minerva Luxembourg SA (Luxembourg)†(a) | | 7.75% | | 1/31/2023 | | | 200 | | | | 189,000 | |
| Total | | | | | | | | | | | 748,806 | |
| | | | | | | | | | | | | |
| Government 1.65% | | | | | | | | | | | | |
| EXIM Sukuk Malaysia Berhad (Malaysia)(a) | | 2.874% | | 2/19/2019 | | | 200 | | | | 199,885 | |
| IPIC GMTN Ltd.† | | 5.50% | | 3/1/2022 | | | 200 | | | | 224,960 | |
| MDC-GMTN B.V. (Netherlands)†(a) | | 3.25% | | 4/28/2022 | | | 200 | | | | 200,500 | |
| Total | | | | | | | | | | | 625,345 | |
| | | | | | | | | | | | | |
| Household Equipment/Products 0.51% | | | | | | | | | | | | |
| Turkiye Sise ve Cam Fabrikalari AS (Turkey)†(a) | | 4.25% | | 5/9/2020 | | | 200 | | | | 192,500 | |
| | | | | | | | | | | | | |
| Household Furnishings 0.48% | | | | | | | | | | | | |
| Arcelik AS (Turkey)†(a) | | 5.00% | | 4/3/2023 | | | 200 | | | | 182,967 | |
| | | | | | | | | | | | | |
| Insurance 0.53% | | | | | | | | | | | | |
| AIA Group Ltd. (Hong Kong)†(a) | | 2.25% | | 3/11/2019 | | | 200 | | | | 199,194 | |
| | | | | | | | | | | | | |
| Lodging 0.48% | | | | | | | | | | | | |
| MCE Finance Ltd. (Hong Kong)†(a) | | 5.00% | | 2/15/2021 | | | 200 | | | | 183,000 | |
| 22 | See Notes to Financial Statements. | |
Schedule of Investments (continued)
EMERGING MARKETS CORPORATE DEBT FUND December 31, 2015
| Investments | | Interest
Rate | | Maturity
Date | | Principal
Amount
(000) | | | Fair
Value | |
| Machinery: Oil Well Equipment & Services 0.50% | | | | | | | | | | |
| Ferreycorp SAA (Peru)†(a) | | 4.875% | | 4/26/2020 | | $ | 200 | | | $ | 190,000 | |
| | | | | | | | | | | | | |
| Media 1.98% | | | | | | | | | | | | |
| Altice Luxembourg SA (Luxembourg)†(a) | | 7.625% | | 2/15/2025 | | | 200 | | | | 173,000 | |
| Columbus International, Inc. (Barbados)†(a) | | 7.375% | | 3/30/2021 | | | 200 | | | | 198,750 | |
| Myriad International Holdings BV (Netherlands)†(a) | | 5.50% | | 7/21/2025 | | | 200 | | | | 193,240 | |
| VTR Finance BV (Netherlands)†(a) | | 6.875% | | 1/15/2024 | | | 200 | | | | 184,500 | |
| Total | | | | | | | | | | | 749,490 | |
| | | | | | | | | | | | | |
| Metal Fabricating 0.49% | | | | | | | | | | | | |
| Elementia SAB de CV (Mexico)†(a) | | 5.50% | | 1/15/2025 | | | 200 | | | | 184,000 | |
| | | | | | | | | | | | | |
| Metals & Minerals: Miscellaneous 2.98% | | | | | | | | | | | | |
| ALROSA Finance SA (Luxembourg)†(a) | | 7.75% | | 11/3/2020 | | | 200 | | | | 211,175 | |
| Cia Minera Milpo SAA (Peru)†(a) | | 4.625% | | 3/28/2023 | | | 200 | | | | 177,750 | |
| Fresnillo plc (Mexico)†(a) | | 5.50% | | 11/13/2023 | | | 200 | | | | 202,000 | |
| Glencore Funding LLC† | | 4.625% | | 4/29/2024 | | | 3 | | | | 2,194 | |
| MMC Norilsk Nickel OJSC via MMC Finance Ltd. (Ireland)†(a) | | 6.625% | | 10/14/2022 | | | 200 | | | | 204,128 | |
| Southern Copper Corp. (Peru)(a) | | 3.50% | | 11/8/2022 | | | 220 | | | | 203,785 | |
| Volcan Cia Minera SAA (Peru)†(a) | | 5.375% | | 2/2/2022 | | | 200 | | | | 128,000 | |
| Total | | | | | | | | | | | 1,129,032 | |
| | | | | | | | | | | | | |
| Natural Gas 2.55% | | | | | | | | | | | | |
| Fermaca Enterprises S de RL de CV (Mexico)†(a) | | 6.375% | | 3/30/2038 | | | 196 | | | | 184,090 | |
| Gas Natural de Lima y Callao SA (Peru)†(a) | | 4.375% | | 4/1/2023 | | | 200 | | | | 196,500 | |
| Korea Gas Corp. (South Korea)†(a) | | 3.50% | | 7/21/2025 | | | 200 | | | | 204,812 | |
| Nakilat, Inc. (Qatar)†(a) | | 6.267% | | 12/31/2033 | | | 175 | | | | 194,130 | |
| Transportadora de Gas del Peru SA (Peru)†(a) | | 4.25% | | 4/30/2028 | | | 200 | | | | 188,000 | |
| Total | | | | | | | | | | | 967,532 | |
| | | | | | | | | | | | | |
| Oil 12.68% | | | | | | | | | | | | |
| Bill Barrett Corp. | | 7.00% | | 10/15/2022 | | | 5 | | | | 3,375 | |
| CNOOC Finance 2015 USA LLC | | 3.50% | | 5/5/2025 | | | 200 | | | | 190,739 | |
| CrownRock LP/CrownRock Finance, Inc.† | | 7.75% | | 2/15/2023 | | | 48 | | | | 45,360 | |
| Delek & Avner Tamar Bond Ltd. (Israel)†(a) | | 5.412% | | 12/30/2025 | | | 200 | | | | 201,750 | |
| Dolphin Energy Ltd. (United Arab Emirates)†(a) | | 5.50% | | 12/15/2021 | | | 200 | | | | 220,452 | |
| Ecopetrol SA (Colombia)(a) | | 5.875% | | 5/28/2045 | | | 210 | | | | 150,150 | |
| Gazprom Neft OAO via GPN Capital SA (Luxembourg)†(a) | | 4.375% | | 9/19/2022 | | | 200 | | | | 177,630 | |
| Gazprom OAO via Gaz Capital SA (Luxembourg)†(a) | | 4.95% | | 2/6/2028 | | | 200 | | | | 169,498 | |
| | See Notes to Financial Statements. | 23 |
Schedule of Investments (continued)
EMERGING MARKETS CORPORATE DEBT FUND December 31, 2015
| Investments | | Interest
Rate | | Maturity
Date | | Principal
Amount
(000) | | | Fair
Value | |
| Oil (continued) | | | | | | | | | | | | |
| Gazprom OAO Via Gaz Capital SA (Luxembourg)†(a) | | 6.51% | | 3/7/2022 | | $ | 125 | | | $ | 126,156 | |
| Genel Energy Finance plc (United Kingdom)†(a) | | 7.50% | | 5/14/2019 | | | 200 | | | | 142,316 | |
| Hilcorp Energy I LP/Hilcorp Finance Co.† | | 5.00% | | 12/1/2024 | | | 60 | | | | 50,100 | |
| Kosmos Energy Ltd.† | | 7.875% | | 8/1/2021 | | | 200 | | | | 162,000 | |
| Kunlun Energy Co., Ltd. (Hong Kong)†(a) | | 2.875% | | 5/13/2020 | | | 200 | | | | 197,504 | |
| Lukoil International Finance BV (Netherlands)†(a) | | 7.25% | | 11/5/2019 | | | 200 | | | | 216,000 | |
| MEG Energy Corp. (Canada)†(a) | | 6.375% | | 1/30/2023 | | | 35 | | | | 24,150 | |
| Pan American Energy LLC (Argentina)†(a) | | 7.875% | | 5/7/2021 | | | 175 | | | | 171,500 | |
| Petrobras Global Finance BV (Netherlands)(a) | | 3.00% | | 1/15/2019 | | | 180 | | | | 137,250 | |
| Petrobras Global Finance BV (Netherlands)(a) | | 4.375% | | 5/20/2023 | | | 165 | | | | 109,313 | |
| Petrobras Global Finance BV (Netherlands)(a) | | 5.625% | | 5/20/2043 | | | 52 | | | | 31,850 | |
| Petrobras Global Finance BV (Netherlands)(a) | | 6.25% | | 3/17/2024 | | | 120 | | | | 86,400 | |
| Petronas Capital Ltd. (Malaysia)†(a) | | 5.25% | | 8/12/2019 | | | 100 | | | | 107,929 | |
| PTT PCL (Thailand)†(a) | | 4.50% | | 10/25/2042 | | | 200 | | | | 181,888 | |
| Ras Laffan Liquefied Natural Gas Co., Ltd. II (Qatar)†(a) | | 5.298% | | 9/30/2020 | | | 131 | | | | 140,190 | |
| Reliance Industries Ltd. (India)†(a) | | 4.125% | | 1/28/2025 | | | 250 | | | | 245,531 | |
| Rosneft Oil Co. via Rosneft International Finance Ltd. (Ireland)†(a) | | 4.199% | | 3/6/2022 | | | 200 | | | | 177,456 | |
| RSP Permian, Inc. | | 6.625% | | 10/1/2022 | | | 60 | | | | 55,500 | |
| Sasol Financing International plc (Isle of Man)(a) | | 4.50% | | 11/14/2022 | | | 200 | | | | 183,908 | |
| Seven Generations Energy Ltd. (Canada)†(a) | | 8.25% | | 5/15/2020 | | | 30 | | | | 27,150 | |
| Sibur Securities Ltd. (Ireland)†(a) | | 3.914% | | 1/31/2018 | | | 400 | | | | 389,516 | |
| Sinopec Group Overseas Development 2015 Ltd.† | | 2.50% | | 4/28/2020 | | | 200 | | | | 197,150 | |
| YPF SA (Argentina)†(a) | | 8.50% | | 7/28/2025 | | | 510 | | | | 488,325 | |
| Total | | | | | | | | | | | 4,808,036 | |
| | | | | | | | | | | | | |
| Paper & Forest Products 0.99% | | | | | | | | | | | | |
| Celulosa Arauco y Constitucion SA (Chile)(a) | | 5.00% | | 1/21/2021 | | | 150 | | | | 156,699 | |
| Mercer International, Inc. (Canada)(a) | | 7.75% | | 12/1/2022 | | | 25 | | | | 25,375 | |
| Suzano Trading Ltd.† | | 5.875% | | 1/23/2021 | | | 200 | | | | 194,500 | |
| Total | | | | | | | | | | | 376,574 | |
| | | | | | | | | | | | | |
| Real Estate Investment Trusts 8.20% | | | | | | | | | | | | |
| China Overseas Finance Cayman V Ltd. | | 3.95% | | 11/15/2022 | | | 200 | | | | 198,852 | |
| Country Garden Holdings Co., Ltd. (China)†(a) | | 7.50% | | 1/10/2023 | | | 400 | | | | 415,012 | |
| Greenland Global Investment Ltd. (China)(a) | | 4.375% | | 7/3/2019 | | | 200 | | | | 201,294 | |
| Jababeka International BV (Netherlands)†(a) | | 7.50% | | 9/24/2019 | | | 200 | | | | 189,941 | |
| JAFZ Sukuk 2019 Ltd. (United Arab Emirates)(a) | | 7.00% | | 6/19/2019 | | | 200 | | | | 223,840 | |
| 24 | See Notes to Financial Statements. | |
Schedule of Investments (continued)
EMERGING MARKETS CORPORATE DEBT FUND December 31, 2015
| Investments | | Interest
Rate | | Maturity
Date | | Principal
Amount
(000) | | | Fair
Value | |
| Real Estate Investment Trusts (continued) | | | | | | | | | | | | |
| KWG Property Holding Ltd. (China)(a) | | 8.625% | | 2/5/2020 | | $ | 200 | | | $ | 209,000 | |
| MAF Global Securities Ltd. | | 5.25% | | 7/5/2019 | | | 200 | | | | 213,750 | |
| PLA Administradora Industrial S de RL de CV (Mexico)†(a) | | 5.25% | | 11/10/2022 | | | 200 | | | | 194,750 | |
| Poly Real Estate Finance Ltd. | | 5.25% | | 4/25/2019 | | | 200 | | | | 210,317 | |
| Qatari Diar Finance Co. (Qatar)†(a) | | 5.00% | | 7/21/2020 | | | 200 | | | | 221,143 | |
| Shimao Property Holdings Ltd. (Hong Kong)(a) | | 8.375% | | 2/10/2022 | | | 200 | | | | 215,163 | |
| Sukuk Funding No 3 Ltd. (United Arab Emirates)(a) | | 4.348% | | 12/3/2018 | | | 200 | | | | 206,968 | |
| Swire Properties MTN Financing Ltd. (Hong Kong)(a) | | 2.75% | | 3/7/2020 | | | 200 | | | | 200,342 | |
| Yuzhou Properties Co., Ltd. (China)(a) | | 8.625% | | 1/24/2019 | | | 200 | | | | 206,690 | |
| Total | | | | | | | | | | | 3,107,062 | |
| | | | | | | | | | | | | |
| Retail 3.18% | | | | | | | | | | | | |
| El Puerto de Liverpool SAB de CV (Mexico)†(a) | | 3.95% | | 10/2/2024 | | | 200 | | | | 194,750 | |
| Hot Topic, Inc.† | | 9.25% | | 6/15/2021 | | | 20 | | | | 17,800 | |
| InRetail Consumer (Peru)†(a) | | 5.25% | | 10/10/2021 | | | 200 | | | | 202,000 | |
| Lotte Shopping Co., Ltd. (South Korea)†(a) | | 3.375% | | 5/9/2017 | | | 200 | | | | 203,069 | |
| Office Depot de Mexico SA de CV (Mexico)†(a) | | 6.875% | | 9/20/2020 | | | 200 | | | | 202,500 | |
| Pacific Emerald Pte Ltd. (Singapore)(a) | | 9.75% | | 7/25/2018 | | | 200 | | | | 192,000 | |
| SACI Falabella (Chile)†(a) | | 3.75% | | 4/30/2023 | | | 200 | | | | 195,087 | |
| Total | | | | | | | | | | | 1,207,206 | |
| | | | | | | | | | | | | |
| Steel 0.50% | | | | | | | | | | | | |
| Evraz Group SA (Russia)†(a) | | 6.50% | | 4/22/2020 | | | 200 | | | | 188,000 | |
| | | | | | | | | | | | | |
| Technology 2.08% | | | | | | | | | | | | |
| Alibaba Group Holding Ltd. (China)(a) | | 2.50% | | 11/28/2019 | | | 200 | | | | 195,642 | |
| Alibaba Group Holding Ltd. (China)(a) | | 3.60% | | 11/28/2024 | | | 200 | | | | 191,768 | |
| Baidu, Inc. (China)(a) | | 4.125% | | 6/30/2025 | | | 200 | | | | 199,203 | |
| Tencent Holdings Ltd. (China)†(a) | | 3.375% | | 5/2/2019 | | | 200 | | | | 203,528 | |
| Total | | | | | | | | | | | 790,141 | |
| | | | | | | | | | | | | |
| Telecommunications 7.25% | | | | | | | | | | | | |
| America Movil SAB de CV (Mexico)(a) | | 3.125% | | 7/16/2022 | | | 200 | | | | 197,100 | |
| Bharti Airtel International Netherlands BV (Netherlands)†(a) | | 5.125% | | 3/11/2023 | | | 200 | | | | 207,498 | |
| Digicel Ltd. (Jamaica)†(a) | | 6.75% | | 3/1/2023 | | | 200 | | | | 168,000 | |
| Digicel Ltd. (Jamaica)†(a) | | 7.00% | | 2/15/2020 | | | 175 | | | | 160,125 | |
| Emirates Telecommunications Group Co. PJSC (United Arab Emirates)(a) | | 3.50% | | 6/18/2024 | | | 200 | | | | 203,378 | |
| GCX Ltd. (India)†(a) | | 7.00% | | 8/1/2019 | | | 200 | | | | 187,942 | |
| | See Notes to Financial Statements. | 25 |
Schedule of Investments (continued)
EMERGING MARKETS CORPORATE DEBT FUND December 31, 2015
| Investments | | Interest
Rate | | Maturity
Date | | Principal
Amount
(000) | | | Fair
Value | |
| Telecommunications (continued) | | | | | | | | | | | | |
| HKT Capital No 2 Ltd. | | 3.625% | | 4/2/2025 | | $ | 200 | | | $ | 195,661 | |
| Mobile Telesystems OJSC via MTS International Funding Ltd. (Ireland)†(a) | | 8.625% | | 6/22/2020 | | | 100 | | | | 110,784 | |
| Ooredoo International Finance Ltd.† | | 5.00% | | 10/19/2025 | | | 200 | | | | 216,500 | |
| Sable International Finance Ltd.† | | 6.875% | | 8/1/2022 | | | 200 | | | | 194,000 | |
| SingTel Group Treasury Pte Ltd. (Singapore)(a) | | 4.50% | | 9/8/2021 | | | 400 | | | | 435,384 | |
| Sixsigma Networks Mexico SA de CV (Mexico)†(a) | | 8.25% | | 11/7/2021 | | | 200 | | | | 192,000 | |
| SK Telecom Co., Ltd. (South Korea)†(a) | | 2.125% | | 5/1/2018 | | | 200 | | | | 199,417 | |
| T-Mobile USA, Inc. | | 6.50% | | 1/15/2026 | | | 80 | | | | 80,959 | |
| Total | | | | | | | | | | | 2,748,748 | |
| | | | | | | | | | | | | |
| Transportation: Miscellaneous 1.58% | | | | | | | | | | | | |
| Autoridad del Canal de Panama (Panama)†(a) | | 4.95% | | 7/29/2035 | | | 200 | | | | 207,000 | |
| Kazakhstan Temir Zholy Finance BV (Netherlands)†(a) | | 6.375% | | 10/6/2020 | | | 200 | | | | 197,640 | |
| Lima Metro Line 2 Finance Ltd.† | | 5.875% | | 7/5/2034 | | | 200 | | | | 195,000 | |
| Total | | | | | | | | | | | 599,640 | |
| Total Corporate Bonds (cost $35,545,752) | | | | | | | | | | | 34,856,394 | |
| | | | | | | | | | | | | |
| FOREIGN BOND(b) 0.30% | | | | | | | | | | | | |
| | | | | | | | | | | | | |
| Netherlands | | | | | | | | | | | | |
| | | | | | | | | | | | | |
| Technology | | | | | | | | | | | | |
| United Group BV† | | | | | | | | | | | | |
| (cost $140,212) | | 7.875% | | 11/15/2020 | | EUR | 100 | | | | 114,945 | |
| | | | | | | | | | | | | |
| FOREIGN GOVERNMENT OBLIGATIONS 3.81% | | | | | | | | | | | | |
| | | | | | | | | | | | | |
| Argentina 2.43% | | | | | | | | | | | | |
| Provincia de Buenos Aires†(a) | | 9.95% | | 6/9/2021 | | $ | 350 | | | | 361,375 | |
| Republic of Argentina(a)(c) | | 8.28% | | 12/31/2033 | | | 210 | | | | 242,903 | |
| Republic of Argentina(a) | | 8.75% | | 5/7/2024 | | | 300 | | | | 316,840 | |
| Total | | | | | | | | | | | 921,118 | |
| | | | | | | | | | | | | |
| Cyprus 0.91% | | | | | | | | | | | | |
| Republic of Cyprus(b) | | 3.875% | | 5/6/2022 | | EUR | 241 | | | | 273,039 | |
| Republic of Cyprus(b) | | 4.75% | | 6/25/2019 | | EUR | 60 | | | | 70,324 | |
| Total | | | | | | | | | | | 343,363 | |
| 26 | See Notes to Financial Statements. | |
Schedule of Investments (continued)
EMERGING MARKETS CORPORATE DEBT FUND December 31, 2015
| Investments | | Interest
Rate | | Maturity
Date | | Principal
Amount
(000) | | | Fair
Value | |
| Ethiopia 0.47% | | | | | | | | | | |
| Republic of Ethiopia†(a) | | 6.625% | | 12/11/2024 | | $ | 200 | | | $ | 178,080 | |
| Total Foreign Government Obligations (cost $1,430,641) | | | | | | | | | | | 1,442,561 | |
| Total Long-Term Investments (cost $37,116,605) | | | | | | | | | | | 36,413,900 | |
| | | | | | | | | | | | | |
| SHORT-TERM INVESTMENT 3.07% | | | | | | | | | | | | |
| | | | | | | | | | | | | |
| Repurchase Agreement | | | | | | | | | | | | |
| Repurchase Agreement dated 12/31/2015, 0.03% due 1/4/2016 with Fixed Income Clearing Corp. collateralized by $1,190,000 of U.S. Treasury Note at 1.625% due 7/31/2020; value: $1,191,488; proceeds: $1,165,778 (cost $1,165,774) | | | | | | | 1,166 | | | | 1,165,774 | |
| Total Investments in Securities 99.13% (cost $38,282,379) | | | | | | | | | | | 37,579,674 | |
| Cash and Other Assets in Excess of Liabilities(d) 0.87% | | | | | | | | | | | 329,932 | |
| Net Assets 100.00% | | | | | | | | | | $ | 37,909,606 | |
| EUR | | euro. |
| † | | Security was purchased pursuant to Rule 144A under the Securities Act of 1933 and, unless registered under such Act or exempted from registration, may only be resold to qualified institutional buyers. |
| (a) | | Foreign security traded in U.S. dollars. |
| (b) | | Investment in non-U.S. dollar denominated securities. |
| (c) | | Defaulted (non-income producing security). |
| (d) | | Cash and Other Assets in Excess of Liabilities include net unrealized appreciation/depreciation on forward foreign currency exchange contracts and future contracts as follows: |
Open Forward Foreign Currency Exchange Contracts at December 31, 2015:
Forward
Foreign
Currency
Exchange
Contracts | | Transaction
Type | | Counterparty | | Expiration
Date | | Foreign
Currency | | | U.S. $
Cost on
Origination
Date | | | U.S. $
Current
Value | | Unrealized
Appreciation | |
| euro | | Buy | | State Street Bank and Trust | | 2/16/2016 | | | 4,000 | | | $ | 4,273 | | | $ | 4,351 | | | $ | 78 | |
| euro | | Sell | | Morgan Stanley | | 2/16/2016 | | | 260,000 | | | | 288,402 | | | | 282,848 | | | | 5,554 | |
| Mexican peso | | Sell | | Goldman Sachs | | 1/20/2016 | | | 5,360,000 | | | | 320,093 | | | | 310,665 | | | | 9,428 | |
| Unrealized Appreciation on Forward Foreign Currency Exchange Contracts | | | | | | | | | | $ | 15,060 | |
Forward
Foreign
Currency
Exchange
Contracts | | Transaction
Type | | Counterparty | | Expiration
Date | | | Foreign
Currency | | | | U.S. $
Cost on
Origination
Date | | | | U.S. $
Current
Value | | Unrealized
Depreciation | |
| Mexican peso | | Buy | | Citibank | | 1/20/2016 | | | 5,360,000 | | | $ | 325,190 | | | $ | 310,665 | | | $ | (14,525 | ) |
| euro | | Sell | | Goldman Sachs | | 2/16/2016 | | | 170,000 | | | | 183,022 | | | | 184,939 | | | | (1,917 | ) |
| Unrealized Depreciation on Forward Foreign Currency Exchange Contracts | | | | | | | | | | $ | (16,442 | ) |
| | See Notes to Financial Statements. | 27 |
Schedule of Investments (concluded)
EMERGING MARKETS CORPORATE DEBT FUND December 31, 2015
| Open Futures Contracts at December 31, 2015: | | | | | |
| Type | | Expiration | | Contracts | | Position | | | Fair Value | | | Unrealized
Appreciation | |
| U.S. 10-Year Treasury Note | | March 2016 | | 2 | | Short | | $ | (251,813 | ) | | | $ | 1,340 | |
| | | | | | | | | | | | | | | | |
The following is a summary of the inputs used as of December 31, 2015 in valuing the Fund’s investments carried at fair value(1):
| Investment Type(2)(3) | | Level 1 | | | Level 2 | | | Level 3 | | | Total | |
| Corporate Bonds | | $ | – | | | $ | 34,856,394 | | | $ | – | | | $ | 34,856,394 | |
| Foreign Bond | | | – | | | | 114,945 | | | | – | | | | 114,945 | |
| Foreign Government Obligations | | | – | | | | 1,442,561 | | | | – | | | | 1,442,561 | |
| Repurchase Agreement | | | – | | | | 1,165,774 | | | | – | | | | 1,165,774 | |
| Total | | $ | – | | | $ | 37,579,674 | | | $ | – | | | $ | 37,579,674 | |
| Other Financial Instruments | | | | | | | | | | | | | | | | |
| Forward Foreign Currency Exchange Contracts | | | | | | | | | | | | | | | | |
| Assets | | $ | – | | | $ | 15,060 | | | $ | – | | | $ | 15,060 | |
| Liabilities | | | – | | | | (16,442 | ) | | | – | | | | (16,442 | ) |
| Futures Contracts | | | | | | | | | | | | | | | | |
| Assets | | | 1,340 | | | | – | | | | – | | | | 1,340 | |
| Liabilities | | | – | | | | – | | | | – | | | | – | |
| Total | | $ | 1,340 | | | $ | (1,382 | ) | | $ | – | | | $ | (42 | ) |
| (1) | Refer to Note 2(p) for a description of fair value measurements and the three-tier hierarchy of inputs. |
| (2) | See Schedule of Investments for fair values in each industry and identification of foreign issuers and/or geography. |
| (3) | There were no Level 1/Level 2 transfers during the fiscal year ended December 31, 2015. |
| 28 | See Notes to Financial Statements. | |
Schedule of Investments
EMERGING MARKETS CURRENCY FUND December 31, 2015
| Investments | | Interest
Rate | | Maturity
Date | | Principal
Amount
(000) | | | Fair
Value | |
| LONG-TERM INVESTMENTS 89.17% | | | | | | | | | | | | |
| | | | | | | | | | | | | |
| ASSET-BACKED SECURITIES 14.95% | | | | | | | | | | | | |
| | | | | | | | | | | | | |
| Automobiles 6.06% | | | | | | | | | | | | |
| AmeriCredit Automobile Receivables Trust 2013-1 B | | 1.07% | | 3/8/2018 | | $ | 221 | | | $ | 221,043 | |
| AmeriCredit Automobile Receivables Trust 2013-3 B | | 1.58% | | 9/10/2018 | | | 250 | | | | 250,053 | |
| AmeriCredit Automobile Receivables Trust 2013-5 A3 | | 0.90% | | 9/10/2018 | | | 359 | | | | 358,706 | |
| Avis Budget Rental Car Funding AESOP LLC 2011-3A A† | | 3.41% | | 11/20/2017 | | | 462 | | | | 467,194 | |
| Avis Budget Rental Car Funding AESOP LLC 2011-5A A† | | 3.27% | | 2/20/2018 | | | 463 | | | | 469,893 | |
| Avis Budget Rental Car Funding AESOP LLC 2012-2A A† | | 2.802% | | 5/20/2018 | | | 1,390 | | | | 1,406,401 | |
| Avis Budget Rental Car Funding AESOP LLC 2014-1A A† | | 2.46% | | 7/20/2020 | | | 459 | | | | 460,850 | |
| Avis Budget Rental Car Funding AESOP LLC 2014-2A A† | | 2.50% | | 2/20/2021 | | | 328 | | | | 327,627 | |
| Avis Budget Rental Car Funding AESOP LLC 2015-2A A† | | 2.63% | | 12/20/2021 | | | 583 | | | | 576,379 | |
| BMW Vehicle Lease Trust 2015-1 A3 | | 1.24% | | 12/20/2017 | | | 1,650 | | | | 1,647,907 | |
| California Republic Auto Receivables Trust 2013-1 A2† | | 1.41% | | 9/17/2018 | | | 424 | | | | 423,633 | |
| California Republic Auto Receivables Trust 2013-2 A2 | | 1.23% | | 3/15/2019 | | | 285 | | | | 284,391 | |
| California Republic Auto Receivables Trust 2014-1 A3 | | 0.85% | | 5/15/2018 | | | 176 | | | | 175,599 | |
| California Republic Auto Receivables Trust 2014-3 A3 | | 1.09% | | 11/15/2018 | | | 550 | | | | 548,555 | |
| California Republic Auto Receivables Trust 2015-1 A2 | | 0.88% | | 12/15/2017 | | | 756 | | | | 755,242 | |
| California Republic Auto Receivables Trust 2015-1 A3 | | 1.33% | | 4/15/2019 | | | 1,715 | | | | 1,706,456 | |
| Capital Auto Receivables Asset Trust 2015-2 A1A | | 0.99% | | 10/20/2017 | | | 1,761 | | | | 1,755,768 | |
| Capital Auto Receivables Asset Trust 2015-2 A2 | | 1.39% | | 9/20/2018 | | | 739 | | | | 736,046 | |
| CarFinance Capital Auto Trust 2014-1A A† | | 1.46% | | 12/17/2018 | | | 63 | | | | 62,945 | |
| CarMax Auto Owner Trust 2013-2 A3 | | 0.64% | | 1/16/2018 | | | 687 | | | | 685,947 | |
| CarMax Auto Owner Trust 2013-3 A3 | | 0.97% | | 4/16/2018 | | | 419 | | | | 418,100 | |
| CarMax Auto Owner Trust 2014-2 A3 | | 0.98% | | 1/15/2019 | | | 1,240 | | | | 1,236,067 | |
| | See Notes to Financial Statements. | 29 |
Schedule of Investments (continued)
EMERGING MARKETS CURRENCY FUND December 31, 2015
| Investments | | Interest
Rate | | Maturity
Date | | Principal
Amount
(000) | | | Fair
Value | |
| Automobiles (continued) | | | | | | | | | | | | |
| CarMax Auto Owner Trust 2015-2 A2A | | 0.82% | | 6/15/2018 | | $ | 456 | | | $ | 455,254 | |
| Chrysler Capital Auto Receivables Trust 2013-AA A3† | | 0.91% | | 4/16/2018 | | | 466 | | | | 465,612 | |
| Chrysler Capital Auto Receivables Trust 2014-BA A2† | | 0.69% | | 9/15/2017 | | | 286 | | | | 285,422 | |
| Chrysler Capital Auto Receivables Trust 2014-BA A3† | | 1.27% | | 5/15/2019 | | | 1,270 | | | | 1,266,507 | |
| Drive Auto Receivables Trust 2015-BA B† | | 2.12% | | 6/17/2019 | | | 578 | | | | 576,872 | |
| Drive Auto Receivables Trust 2015-CA A3† | | 1.38% | | 10/15/2018 | | | 489 | | | | 487,987 | |
| Fifth Third Auto Trust 2014-2 A3 | | 0.89% | | 11/15/2018 | | | 1,263 | | | | 1,259,984 | |
| Fifth Third Auto Trust 2014-3 A3 | | 0.96% | | 3/15/2019 | | | 409 | | | | 407,732 | |
| GM Financial Automobile Leasing Trust 2014-2A A3† | | 1.22% | | 1/22/2018 | | | 800 | | | | 798,804 | |
| Hyundai Auto Receivables Trust 2014-B A3 | | 0.90% | | 12/17/2018 | | | 855 | | | | 852,848 | |
| Mercedes-Benz Auto Lease Trust 2014-A A3 | | 0.68% | | 12/15/2016 | | | 1,286 | | | | 1,285,799 | |
| Porsche Innovative Lease Owner Trust 2014-1 A3† | | 1.03% | | 11/20/2017 | | | 1,371 | | | | 1,368,103 | |
| Santander Drive Auto Receivables Trust 2013-3 B | | 1.19% | | 5/15/2018 | | | 296 | | | | 295,523 | |
| Santander Drive Auto Receivables Trust 2015-3 B | | 2.07% | | 4/15/2020 | | | 455 | | | | 454,004 | |
| Santander Drive Auto Receivables Trust 2015-3 C | | 2.74% | | 1/15/2021 | | | 537 | | | | 534,721 | |
| Santander Drive Auto Receivables Trust 2015-5 D | | 3.65% | | 12/15/2021 | | | 789 | | | | 779,112 | |
| Volkswagen Auto Loan Enhanced Trust 2013-2 A3 | | 0.70% | | 4/20/2018 | | | 1,879 | | | | 1,870,761 | |
| World Omni Automobile Lease Securitization Trust 2013-A A3 | | 1.10% | | 12/15/2016 | | | 587 | | | | 586,887 | |
| Total | | | | | | | | | | | 29,006,734 | |
| | | | | | | | | | | | | |
| Credit Cards 2.55% | | | | | | | | | | | | |
| Bank of America Credit Card Trust 2014-A3 A | | 0.621%# | | 1/15/2020 | | | 1,460 | | | | 1,458,939 | |
| Capital One Multi-Asset Execution Trust 2014-A2 | | 1.26% | | 1/15/2020 | | | 1,315 | | | | 1,314,971 | |
| Capital One Multi-Asset Execution Trust 2015-A3 | | 0.731%# | | 3/15/2023 | | | 1,928 | | | | 1,913,565 | |
| Citibank Credit Card Issuance Trust 2013-A6 | | 1.32% | | 9/7/2018 | | | 1,575 | | | | 1,578,302 | |
| Synchrony Credit Card Master Note Trust 2011-2 A | | 0.811%# | | 5/15/2019 | | | 1,375 | | | | 1,375,127 | |
| Synchrony Credit Card Master Note Trust 2012-6 A | | 1.36% | | 8/17/2020 | | | 1,509 | | | | 1,502,139 | |
| World Financial Network Credit Card Master Trust 2013-B A | | 0.91% | | 3/16/2020 | | | 1,050 | | | | 1,049,253 | |
| World Financial Network Credit Card Master Trust 2014-A | | 0.711%# | | 12/15/2019 | | | 2,000 | | | | 2,000,136 | |
| Total | | | | | | | | | | | 12,192,432 | |
| | | | | | | | | | | | | |
| Other 6.34% | | | | | | | | | | | | |
| Avenue CLO VI Ltd. 2007-6A A2† | | 0.639%# | | 7/17/2019 | | | 500 | | | | 497,347 | |
| Avery Point IV CLO Ltd. 2014-1A A† | | 1.815%# | | 4/25/2026 | | | 1,000 | | | | 994,002 | |
| 30 | See Notes to Financial Statements. | |
Schedule of Investments (continued)
EMERGING MARKETS CURRENCY FUND December 31, 2015
| Investments | | Interest
Rate | | Maturity
Date | | Principal
Amount
(000) | | | Fair
Value | |
| Other (continued) | | | | | | | | | | | | |
| BlueMountain CLO Ltd. 2014-3A A1† | | 1.769% | # | 10/15/2026 | | $ | 500 | | | $ | 497,400 | |
| Carlyle Global Market Strategies CLO Ltd. 2013-2A A1† | | 1.437% | # | 4/18/2025 | | | 1,000 | | | | 985,463 | |
| Cent CLO 2013-17A A1† | | 1.597% | # | 1/30/2025 | | | 1,800 | | | | 1,778,126 | |
| Cent CLO Ltd. 2013-19A A1A† | | 1.624% | # | 10/29/2025 | | | 900 | | | | 882,336 | |
| CIFC Funding II Ltd. 2014-2A A1L† | | 1.809% | # | 5/24/2026 | | | 500 | | | | 495,289 | |
| CNH Equipment Trust 2015-B A4 | | 1.89% | | 4/15/2022 | | | 570 | | | | 567,723 | |
| Dell Equipment Finance Trust 2015-2 A3† | | 1.72% | | 9/22/2020 | | | 352 | | | | 349,913 | |
| Diamond Resorts Owner Trust 2015-2 A† | | 2.99% | | 5/22/2028 | | | 465 | | | | 464,882 | |
| Fortress Credit BSL II Ltd. 2013-2A A1F† | | 1.787% | # | 10/19/2025 | | | 525 | | | | 518,185 | |
| Fortress Credit BSL Ltd. 2013-1A A† | | 1.467% | # | 1/19/2025 | | | 1,000 | | | | 981,757 | |
| Gleneagles CLO Ltd. 2005-1A B† | | 0.879% | # | 11/1/2017 | | | 342 | | | | 342,179 | |
| H/2 Asset Funding 2014-1 Ltd. | | 2.32% | | 3/19/2037 | | | 2,000 | | | | 2,013,202 | |
| Jackson Mill CLO Ltd. 2015-1A A† | | 1.804% | # | 4/15/2027 | | | 1,300 | | | | 1,288,006 | |
| JFIN CLO Ltd. 2007-1A A2† | | 0.527% | # | 7/20/2021 | | | 307 | | | | 305,330 | |
| JFIN Revolver CLO Ltd. 2013-1A A† | | 1.537% | # | 1/20/2021 | | | 336 | | | | 335,579 | |
| JFIN Revolver CLO Ltd. 2015-3A A1† | | 1.781% | # | 4/20/2023 | | | 1,500 | | | | 1,496,772 | |
| KKR Financial CLO Ltd. 2007-1A B† | | 1.071% | # | 5/15/2021 | | | 750 | | | | 747,785 | |
| Marathon CLO IV Ltd. 2012-4A A1† | | 1.723% | # | 5/20/2023 | | | 871 | | | | 869,740 | |
| Oaktree CLO Ltd. 2014-2A A1A† | | 1.817% | # | 10/20/2026 | | | 525 | | | | 520,807 | |
| Octagon Investment Partners XIX Ltd. 2014-1A A† | | 1.809% | # | 4/15/2026 | | | 500 | | | | 497,720 | |
| OHA Loan Funding Ltd. 2015-1A A† | | 1.821% | # | 2/15/2027 | | | 1,350 | | | | 1,341,880 | |
| OZLM VII Ltd. 2014-7A A1B† | | 1.779% | # | 7/17/2026 | | | 750 | | | | 744,789 | |
| Shackleton CLO Ltd. 2014-5A A† | | 1.811% | # | 5/7/2026 | | | 750 | | | | 742,951 | |
| Sheridan Square CLO Ltd. 2013-1A A1† | | 1.339% | # | 4/15/2025 | | | 500 | | | | 489,933 | |
| SLM Private Education Loan Trust 2010-A 2A† | | 3.581% | # | 5/16/2044 | | | 1,220 | | | | 1,259,994 | |
| SLM Private Education Loan Trust 2011-B A1† | | 1.181% | # | 12/16/2024 | | | 848 | | | | 846,971 | |
| SLM Private Education Loan Trust 2012-A A1† | | 1.731% | # | 8/15/2025 | | | 658 | | | | 660,138 | |
| SLM Private Education Loan Trust 2012-C A1† | | 1.431% | # | 8/15/2023 | | | 559 | | | | 559,448 | |
| SLM Private Education Loan Trust 2012-E A1† | | 1.081% | # | 10/16/2023 | | | 1,138 | | | | 1,135,725 | |
| SLM Private Education Loan Trust 2013-B A1† | | 0.981% | # | 7/15/2022 | | | 388 | | | | 386,700 | |
| SLM Student Loan Trust 2011-1 A1 | | 0.942% | # | 3/25/2026 | | | 578 | | | | 570,487 | |
| Stone Tower CLO V Ltd. 2006-5A A2B† | | 0.619% | # | 7/16/2020 | | | 1,500 | | | | 1,485,047 | |
| Stone Tower CLO VI Ltd. 2007-6A A2B† | | 0.609% | # | 4/17/2021 | | | 600 | | | | 589,853 | |
| Venture XVII CLO Ltd. 2014-17A A† | | 1.769% | # | 7/15/2026 | | | 850 | | | | 842,899 | |
| Venture XVIII CLO Ltd. 2014-18A A† | | 1.739% | # | 10/15/2026 | | | 500 | | | | 495,197 | |
| Westchester CLO Ltd. 2007-1A A1A† | | 0.525% | # | 8/1/2022 | | | 379 | | | | 374,627 | |
| Westgate Resorts LLC 2015-1A A† | | 2.75% | | 5/20/2027 | | | 188 | | | | 186,220 | |
| | See Notes to Financial Statements. | 31 |
Schedule of Investments (continued)
EMERGING MARKETS CURRENCY FUND December 31, 2015
| Investments | | Interest
Rate | | Maturity
Date | | Principal
Amount
(000) | | | Fair
Value | |
| Other (continued) | | | | | | | | | | | | |
| Westgate Resorts LLC 2015-1A B† | | 3.50% | | 5/20/2027 | | $ | 188 | | | $ | 186,999 | |
| Total | | | | | | | | | | | 30,329,401 | |
| Total Asset-Backed Securities (cost $71,719,602) | | | | | | | | | | | 71,528,567 | |
| | | | | | | | | | | | | |
| CORPORATE BONDS 31.80% | | | | | | | | | | | | |
| | | | | | | | | | | | | |
| Aerospace/Defense 0.64% | | | | | | | | | | | | |
| BAE Systems plc (United Kingdom)†(a) | | 3.50% | | 10/11/2016 | | | 500 | | | | 507,310 | |
| Exelis, Inc. | | 4.25% | | 10/1/2016 | | | 2,500 | | | | 2,545,315 | |
| Total | | | | | | | | | | | 3,052,625 | |
| | | | | | | | | | | | | |
| Auto Loans 1.05% | | | | | | | | | | | | |
| Ford Motor Credit Co. LLC | | 1.50% | | 1/17/2017 | | | 720 | | | | 715,134 | |
| Ford Motor Credit Co. LLC | | 4.207% | | 4/15/2016 | | | 1,453 | | | | 1,464,736 | |
| Ford Motor Credit Co. LLC | | 6.625% | | 8/15/2017 | | | 250 | | | | 266,572 | |
| General Motors Financial Co., Inc. | | 4.75% | | 8/15/2017 | | | 2,000 | | | | 2,073,686 | |
| Hyundai Capital America† | | 2.40% | | 10/30/2018 | | | 500 | | | | 498,651 | |
| Total | | | | | | | | | | | 5,018,779 | |
| | | | | | | | | | | | | |
| Auto Parts & Equipment 0.05% | | | | | | | | | | | | |
| BorgWarner, Inc. | | 5.75% | | 11/1/2016 | | | 250 | | | | 257,928 | |
| | | | | | | | | | | | | |
| Automakers 0.11% | | | | | | | | | | | | |
| General Motors Co. | | 3.50% | | 10/2/2018 | | | 500 | | | | 506,270 | |
| | | | | | | | | | | | | |
| Banking 3.00% | | | | | | | | | | | | |
| Bank of America Corp. | | 5.70% | | 5/2/2017 | | | 808 | | | | 842,914 | |
| Bank of America Corp. | | 6.05% | | 5/16/2016 | | | 500 | | | | 508,291 | |
| Bank of America Corp. | | 7.80% | | 9/15/2016 | | | 1,148 | | | | 1,195,652 | |
| Capital One Financial Corp. | | 5.25% | | 2/21/2017 | | | 250 | | | | 258,536 | |
| Capital One Financial Corp. | | 6.15% | | 9/1/2016 | | | 2,000 | | | | 2,061,102 | |
| Fifth Third Bancorp | | 5.45% | | 1/15/2017 | | | 500 | | | | 518,475 | |
| Goldman Sachs Group, Inc. (The) | | 2.382% | # | 8/24/2016 | | | 250 | | | | 251,188 | |
| Goldman Sachs Group, Inc. (The) | | 5.625% | | 1/15/2017 | | | 1,000 | | | | 1,038,935 | |
| Huntington National Bank (The) | | 1.30% | | 11/20/2016 | | | 2,000 | | | | 1,999,098 | |
| Korea Development Bank (The) (South Korea)(a) | | 0.945% | # | 1/22/2017 | | | 1,000 | | | | 1,000,666 | |
| Lloyds Bank plc (United Kingdom)(a) | | 9.875% | | 12/16/2021 | | | 1,000 | | | | 1,070,780 | |
| Macquarie Group Ltd. (Australia)†(a) | | 4.875% | | 8/10/2017 | | | 250 | | | | 258,848 | |
| PNC Funding Corp. | | 5.625% | | 2/1/2017 | | | 695 | | | | 722,728 | |
| Regions Bank | | 7.50% | | 5/15/2018 | | | 500 | | | | 555,874 | |
| Santander Holdings USA, Inc. | | 4.625% | | 4/19/2016 | | | 250 | | | | 252,212 | |
| 32 | See Notes to Financial Statements. | |
Schedule of Investments (continued)
EMERGING MARKETS CURRENCY FUND December 31, 2015
| Investments | | Interest
Rate | | Maturity
Date | | Principal
Amount
(000) | | | Fair
Value | |
| Banking (continued) | | | | | | | | | | | | |
| Shinhan Bank (South Korea)†(a) | | 0.968% | # | 4/8/2017 | | $ | 1,800 | | | $ | 1,799,402 | |
| Total | | | | | | | | | | | 14,334,701 | |
| | | | | | | | | | | | | |
| Beverages 0.16% | | | | | | | | | | | | |
| Beam Suntory, Inc. | | 1.875% | | 5/15/2017 | | | 750 | | | | 751,065 | |
| | | | | | | | | | | | | |
| Brokerage 0.27% | | | | | | | | | | | | |
| Jefferies Group LLC | | 5.50% | | 3/15/2016 | | | 1,000 | | | | 1,008,186 | |
| Lazard Group LLC | | 6.85% | | 6/15/2017 | | | 250 | | | | 266,270 | |
| Total | | | | | | | | | | | 1,274,456 | |
| | | | | | | | | | | | | |
| Building Materials 1.03% | | | | | | | | | | | | |
| Martin Marietta Materials, Inc. | | 1.703% | # | 6/30/2017 | | | 3,500 | | | | 3,476,918 | |
| Martin Marietta Materials, Inc. | | 6.60% | | 4/15/2018 | | | 250 | | | | 269,496 | |
| Mohawk Industries, Inc. | | 6.125% | | 1/15/2016 | | | 1,159 | | | | 1,160,234 | |
| Owens Corning | | 6.50% | | 12/1/2016 | | | 15 | | | | 15,437 | |
| Total | | | | | | | | | | | 4,922,085 | |
| | | | | | | | | | | | | |
| Cable & Satellite Television 1.21% | | | | | | | | | | | | |
| Cox Communications, Inc.† | | 5.875% | | 12/1/2016 | | | 4,500 | | | | 4,653,356 | |
| Cox Communications, Inc.† | | 6.25% | | 6/1/2018 | | | 250 | | | | 268,796 | |
| Cox Communications, Inc.† | | 9.375% | | 1/15/2019 | | | 250 | | | | 289,852 | |
| Time Warner Cable, Inc. | | 8.75% | | 2/14/2019 | | | 500 | | | | 580,428 | |
| Total | | | | | | | | | | | 5,792,432 | |
| | | | | | | | | | | | | |
| Chemicals 0.34% | | | | | | | | | | | | |
| LyondellBasell Industries NV | | 5.00% | | 4/15/2019 | | | 500 | | | | 532,273 | |
| PetroLogistics LP/PetroLogistics Finance Corp.(b) | | 6.25% | | 4/1/2020 | | | 500 | | | | 525,000 | |
| Yara International ASA (Norway)†(a) | | 7.875% | | 6/11/2019 | | | 500 | | | | 566,123 | |
| Total | | | | | | | | | | | 1,623,396 | |
| | | | | | | | | | | | | |
| Consumer/Commercial/Lease Financing 0.87% | | | | | | | | | | | | |
| Air Lease Corp. | | 5.625% | | 4/1/2017 | | | 1,000 | | | | 1,040,000 | |
| Aviation Capital Group Corp.† | | 3.875% | | 9/27/2016 | | | 2,000 | | | | 2,017,500 | |
| International Lease Finance Corp.† | | 7.125% | | 9/1/2018 | | | 1,000 | | | | 1,098,750 | |
| Total | | | | | | | | | | | 4,156,250 | |
| | | | | | | | | | | | | |
| Diversified Capital Goods 0.10% | | | | | | | | | | | | |
| Ingersoll-Rand Global Holding Co., Ltd. | | 2.875% | | 1/15/2019 | | | 500 | | | | 505,376 | |
| | See Notes to Financial Statements. | 33 |
Schedule of Investments (continued)
EMERGING MARKETS CURRENCY FUND December 31, 2015
| Investments | | Interest
Rate | | Maturity
Date | | Principal
Amount
(000) | | | Fair
Value | |
| Electric: Distribution/Transportation 0.37% | | | | | | | | | | | | |
| PPL WEM Ltd./Western Power Distribution Ltd. (United Kingdom)†(a) | | 3.90% | | 5/1/2016 | | $ | 1,550 | | | $ | 1,556,313 | |
| SteelRiver Transmission Co. LLC† | | 4.71% | | 6/30/2017 | | | 216 | | | | 221,556 | |
| Total | | | | | | | | | | | 1,777,869 | |
| | | | | | | | | | | | | |
| Electric: Integrated 1.52% | | | | | | | | | | | | |
| CenterPoint Energy, Inc. | | 5.95% | | 2/1/2017 | | | 2,000 | | | | 2,087,150 | |
| Dominion Resources, Inc. | | 1.25% | | 3/15/2017 | | | 2,000 | | | | 1,988,196 | |
| Jersey Central Power & Light Co. | | 7.35% | | 2/1/2019 | | | 125 | | | | 140,782 | |
| Pacific Gas & Electric Co. | | 5.625% | | 11/30/2017 | | | 1,125 | | | | 1,203,082 | |
| Pennsylvania Electric Co. | | 6.05% | | 9/1/2017 | | | 500 | | | | 532,407 | |
| Pepco Holdings, Inc. | | 6.125% | | 6/1/2017 | | | 500 | | | | 520,139 | |
| Progress Energy, Inc. | | 7.05% | | 3/15/2019 | | | 250 | | | | 283,789 | |
| TECO Finance, Inc. | | 0.921% | # | 4/10/2018 | | | 250 | | | | 246,867 | |
| TECO Finance, Inc. | | 6.572% | | 11/1/2017 | | | 250 | | | | 269,496 | |
| Total | | | | | | | | | | | 7,271,908 | |
| | | | | | | | | | | | | |
| Electronics 0.25% | | | | | | | | | | | | |
| Jabil Circuit, Inc. | | 7.75% | | 7/15/2016 | | | 500 | | | | 513,750 | |
| KLA-Tencor Corp. | | 2.375% | | 11/1/2017 | | | 700 | | | | 700,675 | |
| Total | | | | | | | | | | | 1,214,425 | |
| | | | | | | | | | | | | |
| Energy: Exploration & Production 1.91% | | | | | | | | | | | | |
| Anadarko Petroleum Corp. | | 5.95% | | 9/15/2016 | | | 2,526 | | | | 2,596,054 | |
| Anadarko Petroleum Corp. | | 6.375% | | 9/15/2017 | | | 285 | | | | 298,978 | |
| Canadian Natural Resources Ltd. (Canada)(a) | | 5.70% | | 5/15/2017 | | | 2,000 | | | | 2,043,384 | |
| ConocoPhillips | | 5.75% | | 2/1/2019 | | | 250 | | | | 270,705 | |
| Continental Resources, Inc. | | 7.125% | | 4/1/2021 | | | 1,775 | | | | 1,648,327 | |
| Continental Resources, Inc. | | 7.375% | | 10/1/2020 | | | 1,900 | | | | 1,751,562 | |
| Devon Energy Corp. | | 6.30% | | 1/15/2019 | | | 500 | | | | 515,502 | |
| Total | | | | | | | | | | | 9,124,512 | |
| | | | | | | | | | | | | |
| Food: Wholesale 0.41% | | | | | | | | | | | | |
| Mondelez International, Inc. | | 0.849% | # | 2/1/2019 | | | 2,000 | | | | 1,966,348 | |
| | | | | | | | | | | | | |
| Gas Distribution 3.70% | | | | | | | | | | | | |
| Copano Energy LLC/Copano Energy Finance Corp. | | 7.125% | | 4/1/2021 | | | 1,646 | | | | 1,644,454 | |
| EnLink Midstream Partners LP/EnLink Midstream Finance Corp. | | 7.125% | | 6/1/2022 | | | 2,894 | | | | 3,078,264 | |
| Enterprise Products Operating LLC | | 6.30% | | 9/15/2017 | | | 416 | | | | 437,751 | |
| Florida Gas Transmission Co. LLC† | | 7.90% | | 5/15/2019 | | | 750 | | | | 845,687 | |
| 34 | See Notes to Financial Statements. | |
Schedule of Investments (continued)
EMERGING MARKETS CURRENCY FUND December 31, 2015
| Investments | | Interest
Rate | | Maturity
Date | | Principal
Amount
(000) | | | Fair
Value | |
| Gas Distribution (continued) | | | | | | | | | | | | |
| Gulfstream Natural Gas System LLC† | | 6.95% | | 6/1/2016 | | $ | 250 | | | $ | 254,712 | |
| Hiland Partners LP/Hiland Partners Finance Corp.† | | 7.25% | | 10/1/2020 | | | 500 | | | | 505,625 | |
| Kinder Morgan Finance Co. LLC | | 5.70% | | 1/5/2016 | | | 500 | | | | 500,000 | |
| Kinder Morgan, Inc. | | 7.00% | | 6/15/2017 | | | 250 | | | | 257,619 | |
| Laclede Group, Inc. (The) | | 1.112% | # | 8/15/2017 | | | 3,600 | | | | 3,583,814 | |
| Magellan Midstream Partners LP | | 5.65% | | 10/15/2016 | | | 1,500 | | | | 1,541,100 | |
| Northwest Pipeline LLC | | 7.00% | | 6/15/2016 | | | 150 | | | | 153,984 | |
| Regency Energy Partners LP/Regency Energy Finance Corp. | | 6.50% | | 7/15/2021 | | | 1,000 | | | | 1,010,000 | |
| Sempra Energy | | 9.80% | | 2/15/2019 | | | 300 | | | | 363,276 | |
| Spectra Energy Partners LP | | 2.95% | | 6/15/2016 | | | 2,000 | | | | 2,007,452 | |
| TransCanada PipeLines Ltd. (Canada)(a) | | 7.125% | | 1/15/2019 | | | 500 | | | | 557,354 | |
| Williams Partners LP/ACMP Finance Corp. | | 6.125% | | 7/15/2022 | | | 1,000 | | | | 947,211 | |
| Total | | | | | | | | | | | 17,688,303 | |
| | | | | | | | | | | | | |
| Health Services 0.71% | | | | | | | | | | | | |
| Express Scripts Holding Co. | | 2.65% | | 2/15/2017 | | | 1,000 | | | | 1,010,096 | |
| McKesson Corp. | | 7.50% | | 2/15/2019 | | | 750 | | | | 858,795 | |
| Medco Health Solutions, Inc. | | 7.125% | | 3/15/2018 | | | 1,400 | | | | 1,548,407 | |
| Total | | | | | | | | | | | 3,417,298 | |
| | | | | | | | | | | | | |
| Hotels 0.12% | | | | | | | | | | | | |
| Hyatt Hotels Corp.† | | 6.875% | | 8/15/2019 | | | 500 | | | | 567,291 | |
| | | | | | | | | | | | | |
| Insurance Brokerage 0.43% | | | | | | | | | | | | |
| Willis Group Holdings plc (United Kingdom)(a) | | 4.125% | | 3/15/2016 | | | 1,250 | | | | 1,256,837 | |
| Willis North America, Inc. | | 6.20% | | 3/28/2017 | | | 750 | | | | 789,001 | |
| Total | | | | | | | | | | | 2,045,838 | |
| | | | | | | | | | | | | |
| Integrated Energy 0.89% | | | | | | | | | | | | |
| CNPC General Capital Ltd. (China)†(a) | | 1.262% | # | 5/14/2017 | | | 2,000 | | | | 1,997,084 | |
| Hess Corp. | | 1.30% | | 6/15/2017 | | | 250 | | | | 244,711 | |
| Sinopec Group Overseas Development 2014 Ltd.† | | 1.101% | # | 4/10/2017 | | | 2,000 | | | | 1,997,546 | |
| Total | | | | | | | | | | | 4,239,341 | |
| | | | | | | | | | | | | |
| Investments & Miscellaneous Financial Services 0.54% | | | | | | | | | | | | |
| Neuberger Berman Group LLC/Neuberger Berman Finance Corp.† | | 5.875% | | 3/15/2022 | | | 2,500 | | | | 2,603,125 | |
| | See Notes to Financial Statements. | 35 |
Schedule of Investments (continued)
EMERGING MARKETS CURRENCY FUND December 31, 2015
| Investments | | Interest
Rate | | Maturity
Date | | Principal
Amount
(000) | | | Fair
Value | |
| Life Insurance 0.47% | | | | | | | | | | | | |
| Symetra Financial Corp.† | | 6.125% | | 4/1/2016 | | $ | 1,932 | | | $ | 1,952,029 | |
| Torchmark Corp. | | 6.375% | | 6/15/2016 | | | 305 | | | | 311,382 | |
| Total | | | | | | | | | | | 2,263,411 | |
| | | | | | | | | | | | | |
| Machinery 0.42% | | | | | | | | | | | | |
| Xylem, Inc. | | 3.55% | | 9/20/2016 | | | 2,000 | | | | 2,027,648 | |
| | | | | | | | | | | | | |
| Media: Diversified 0.21% | | | | | | | | | | | | |
| Viacom, Inc. | | 2.20% | | 4/1/2019 | | | 500 | | | | 491,517 | |
| Viacom, Inc. | | 3.50% | | 4/1/2017 | | | 233 | | | | 237,202 | |
| Viacom, Inc. | | 6.125% | | 10/5/2017 | | | 250 | | | | 266,270 | |
| Total | | | | | | | | | | | 994,989 | |
| | | | | | | | | | | | | |
| Medical Products 0.32% | | | | | | | | | | | | |
| Zimmer Biomet Holdings, Inc. | | 1.45% | | 4/1/2017 | | | 800 | | | | 796,347 | |
| Zimmer Biomet Holdings, Inc. | | 2.00% | | 4/1/2018 | | | 750 | | | | 745,784 | |
| Total | | | | | | | | | | | 1,542,131 | |
| | | | | | | | | | | | | |
| Metals/Mining (Excluding Steel) 0.96% | | | | | | | | | | | | |
| Anglo American Capital plc (United Kingdom)†(a) | | 1.271% | # | 4/15/2016 | | | 500 | | | | 495,142 | |
| Glencore Finance Canada Ltd. (Canada)†(a) | | 3.60% | | 1/15/2017 | | | 1,260 | | | | 1,217,459 | |
| Glencore Funding LLC† | | 1.567% | # | 5/27/2016 | | | 1,000 | | | | 983,874 | |
| Glencore Funding LLC† | | 1.681% | # | 1/15/2019 | | | 500 | | | | 413,973 | |
| Kinross Gold Corp. (Canada)(a) | | 3.625% | | 9/1/2016 | | | 1,500 | | | | 1,462,989 | |
| Total | | | | | | | | | | | 4,573,437 | |
| | | | | | | | | | | | | |
| Multi-Line Insurance 0.05% | | | | | | | | | | | | |
| Kemper Corp. | | 6.00% | | 5/15/2017 | | | 250 | | | | 259,802 | |
| | | | | | | | | | | | | |
| Oil Field Equipment & Services 0.62% | | | | | | | | | | | | |
| Cameron International Corp. | | 1.40% | | 6/15/2017 | | | 1,000 | | | | 986,167 | |
| Schlumberger Holdings Corp.† | | 2.35% | | 12/21/2018 | | | 2,000 | | | | 1,988,428 | |
| Total | | | | | | | | | | | 2,974,595 | |
| | | | | | | | | | | | | |
| Oil Refining & Marketing 0.12% | | | | | | | | | | | | |
| Valero Energy Corp. | | 9.375% | | 3/15/2019 | | | 500 | | | | 591,132 | |
| | | | | | | | | | | | | |
| Pharmaceuticals 2.84% | | | | | | | | | | | | |
| Forest Laboratories, Inc.† | | 4.375% | | 2/1/2019 | | | 1,000 | | | | 1,048,328 | |
| Mylan, Inc. | | 1.35% | | 11/29/2016 | | | 1,000 | | | | 991,835 | |
| Mylan, Inc. | | 1.80% | | 6/24/2016 | | | 250 | | | | 249,868 | |
| Perrigo Co. plc (Ireland)(a) | | 1.30% | | 11/8/2016 | | | 1,500 | | | | 1,489,701 | |
| 36 | See Notes to Financial Statements. | |
Schedule of Investments (continued)
EMERGING MARKETS CURRENCY FUND December 31, 2015
| Investments | | Interest
Rate | | Maturity
Date | | Principal
Amount
(000) | | | Fair
Value | |
| Pharmaceuticals (continued) | | | | | | | | | | | | |
| Teva Pharmaceutical Finance Co. BV (Curacao)(a) | | 2.40% | | 11/10/2016 | | $ | 5,500 | | | $ | 5,535,216 | |
| Zoetis, Inc. | | 1.15% | | 2/1/2016 | | | 3,646 | | | | 3,645,413 | |
| Zoetis, Inc. | | 1.875% | | 2/1/2018 | | | 625 | | | | 616,958 | |
| Total | | | | | | | | | | | 13,577,319 | |
| | | | | | | | | | | | | |
| Printing & Publishing 0.21% | | | | | | | | | | | | |
| Pearson Funding Two plc (United Kingdom)†(a) | | 4.00% | | 5/17/2016 | | | 1,000 | | | | 1,007,157 | |
| | | | | | | | | | | | | |
| Property & Casualty Insurance 0.02% | | | | | | | | | | | | |
| Liberty Mutual Group, Inc.† | | 6.70% | | 8/15/2016 | | | 107 | | | | 110,509 | |
| | | | | | | | | | | | | |
| Real Estate Investment Trusts 2.68% | | | | | | | | | | | | |
| DDR Corp. | | 4.75% | | 4/15/2018 | | | 650 | | | | 680,311 | |
| DDR Corp. | | 7.50% | | 7/15/2018 | | | 500 | | | | 561,373 | |
| DDR Corp. | | 7.50% | | 4/1/2017 | | | 600 | | | | 639,391 | |
| HCP, Inc. | | 3.75% | | 2/1/2019 | | | 248 | | | | 256,020 | |
| HCP, Inc. | | 6.00% | | 1/30/2017 | | | 750 | | | | 781,477 | |
| HCP, Inc. | | 6.30% | | 9/15/2016 | | | 521 | | | | 538,734 | |
| Hospitality Properties Trust | | 6.30% | | 6/15/2016 | | | 1,500 | | | | 1,505,148 | |
| Hospitality Properties Trust | | 6.70% | | 1/15/2018 | | | 987 | | | | 1,044,520 | |
| Kilroy Realty LP | | 4.80% | | 7/15/2018 | | | 250 | | | | 262,542 | |
| Mid-America Apartments LP | | 6.05% | | 9/1/2016 | | | 575 | | | | 589,958 | |
| Reckson Operating Partnership LP | | 6.00% | | 3/31/2016 | | | 1,500 | | | | 1,514,080 | |
| Regency Centers LP | | 5.875% | | 6/15/2017 | | | 1,500 | | | | 1,582,342 | |
| Senior Housing Properties Trust | | 3.25% | | 5/1/2019 | | | 500 | | | | 498,606 | |
| SL Green Realty Corp. | | 5.00% | | 8/15/2018 | | | 500 | | | | 524,952 | |
| UDR, Inc. | | 5.25% | | 1/15/2016 | | | 175 | | | | 175,170 | |
| Ventas Realty LP | | 1.55% | | 9/26/2016 | | | 250 | | | | 250,217 | |
| Vereit Operating Partnership LP | | 2.00% | | 2/6/2017 | | | 1,000 | | | | 992,500 | |
| Welltower, Inc. | | 4.125% | | 4/1/2019 | | | 400 | | | | 417,458 | |
| Total | | | | | | | | | | | 12,814,799 | |
| | | | | | | | | | | | | |
| Recreation & Travel 0.36% | | | | | | | | | | | | |
| Carnival Corp. | | 1.20% | | 2/5/2016 | | | 1,500 | | | | 1,500,497 | |
| Carnival Corp. | | 3.95% | | 10/15/2020 | | | 225 | | | | 235,272 | |
| Total | | | | | | | | | | | 1,735,769 | |
| | | | | | | | | | | | | |
| Restaurants 0.12% | | | | | | | | | | | | |
| Yum! Brands, Inc. | | 6.25% | | 4/15/2016 | | | 564 | | | | 571,456 | |
| | See Notes to Financial Statements. | 37 |
Schedule of Investments (continued)
EMERGING MARKETS CURRENCY FUND December 31, 2015
| Investments | | Interest
Rate | | Maturity
Date | | Principal
Amount
(000) | | | Fair
Value | |
| Software/Services 0.38% | | | | | | | | | | | | |
| Fidelity National Information Services, Inc. | | 2.85% | | 10/15/2018 | | $ | 650 | | | $ | 652,728 | |
| Hewlett-Packard Enterprise Co.† | | 2.85% | | 10/5/2018 | | | 1,150 | | | | 1,150,113 | |
| Total | | | | | | | | | | | 1,802,841 | |
| | | | | | | | | | | | | |
| Support: Services 0.54% | | | | | | | | | | | | |
| Western Union Co. (The) | | 5.93% | | 10/1/2016 | | | 2,500 | | | | 2,579,852 | |
| | | | | | | | | | | | | |
| Technology Hardware & Equipment 0.84% | | | | | | | | | | | | |
| Hewlett-Packard Enterprise Co.† | | 2.059 | %# | 10/5/2017 | | | 4,000 | | | | 4,007,764 | |
| | | | | | | | | | | | | |
| Telecommunications: Wireline Integrated & Services 0.16% | | | | | | | | | | | | |
| AT&T, Inc. | | 5.50% | | 2/1/2018 | | | 500 | | | | 534,757 | |
| Embarq Corp. | | 7.082% | | 6/1/2016 | | | 250 | | | | 254,525 | |
| Total | | | | | | | | | | | 789,282 | |
| | | | | | | | | | | | | |
| Tobacco 0.33% | | | | | | | | | | | | |
| Altria Group, Inc. | | 9.70% | | 11/10/2018 | | | 398 | | | | 478,904 | |
| Reynolds American, Inc. | | 3.50% | | 8/4/2016 | | | 500 | | | | 505,412 | |
| Reynolds American, Inc. | | 8.125% | | 6/23/2019 | | | 500 | | | | 588,812 | |
| Total | | | | | | | | | | | 1,573,128 | |
| | | | | | | | | | | | | |
| Trucking & Delivery 0.47% | | | | | | | | | | | | |
| Penske Truck Leasing Co. LP/PTL Finance Corp.† | | 2.50% | | 6/15/2019 | | | 500 | | | | 492,236 | |
| Penske Truck Leasing Co. LP/PTL Finance Corp.† | | 2.875% | | 7/17/2018 | | | 1,125 | | | | 1,132,768 | |
| Penske Truck Leasing Co. LP/PTL Finance Corp.† | | 3.75% | | 5/11/2017 | | | 125 | | | | 127,565 | |
| Ryder System, Inc. | | 2.55% | | 6/1/2019 | | | 500 | | | | 497,365 | |
| Total | | | | | | | | | | | 2,249,934 | |
| Total Corporate Bonds (cost $153,620,730) | | | | | | | | | | | 152,158,576 | |
| | | | | | | | | | | | | |
| FLOATING RATE LOANS(c) 6.61% | | | | | | | | | | | | |
| | | | | | | | | | | | | |
| Advertising 0.38% | | | | | | | | | | | | |
| Nielsen Finance LLC Term Loan A | | 2.287% | | 4/30/2019 | | | 1,850 | | | | 1,846,143 | |
| | | | | | | | | | | | | |
| Aerospace/Defense 0.42% | | | | | | | | | | | | |
| Delos Finance S.A.R.L. Term Loan (Luxembourg)(a) | | 3.50% | | 3/6/2021 | | | 2,000 | | | | 1,996,250 | |
| | | | | | | | | | | | | |
| Air Transportation 0.44% | | | | | | | | | | | | |
| Delta Air Lines, Inc. 2014 Term Loan B2 | | 2.67% | | 4/18/2016 | | | 2,104 | | | | 2,100,341 | |
| | | | | | | | | | | | | |
| Cable & Satellite Television 0.56% | | | | | | | | | | | | |
| Charter Communications Operating LLC | | | | | | | | | | | | |
| Term Loan E | | 3.00% | | 7/1/2020 | | | 1,715 | | | | 1,687,926 | |
| 38 | See Notes to Financial Statements. | |
Schedule of Investments (continued)
EMERGING MARKETS CURRENCY FUND December 31, 2015
| Investments | | Interest
Rate | | Maturity
Date | | Principal
Amount
(000) | | | Fair
Value | |
| Cable & Satellite Television (continued) | | | | | | | | | | | | |
| CSC Holdings LLC Term Loan B | | 2.924% | | 4/17/2020 | | $ | 991 | | | $ | 989,512 | |
| Total | | | | | | | | | | | 2,677,438 | |
| | | | | | | | | | | | | |
| Consumer/Commercial/Lease Financing 0.08% | | | | | | | | | | | | |
| Synchrony Financial Term Loan | | 2.169% | | 8/5/2019 | | | 403 | | | | 401,755 | |
| | | | | | | | | | | | | |
| Electronics 0.89% | | | | | | | | | | | | |
| Avago Technologies Cayman Ltd. Term Loan | | 3.75% | | 5/6/2021 | | | 2,290 | | | | 2,286,513 | |
| Sensata Technologies B.V. 6th Amendment Term Loan (Netherlands)(a) | | 3.00% | | 10/14/2021 | | | 1,995 | | | | 1,965,469 | |
| Total | | | | | | | | | | | 4,251,982 | |
| | | | | | | | | | | | | |
| Food: Wholesale 0.13% | | | | | | | | | | | | |
| Aramark Corp. Term Loan E | | 3.25% | | 9/7/2019 | | | 638 | | | | 637,246 | |
| | | | | | | | | | | | | |
| Gaming 0.95% | | | | | | | | | | | | |
| Las Vegas Sands LLC Term Loan B | | 3.25% | | 12/19/2020 | | | 2,206 | | | | 2,187,142 | |
| Seminole Tribe of Florida Initial Term Loan | | 3.00% | | 4/29/2020 | | | 2,356 | | | | 2,346,463 | |
| Total | | | | | | | | | | | 4,533,605 | |
| | | | | | | | | | | | | |
| Media: Content 0.49% | | | | | | | | | | | | |
| AMC Networks, Inc. Term Loan A | | 1.776% | | 12/16/2019 | | | 2,375 | | | | 2,337,902 | |
| | | | | | | | | | | | | |
| Medical Products 0.33% | | | | | | | | | | | | |
| Fresenius US Finance I, Inc. Tranche B Term Loan (Germany)(a) | | 2.422% | | 8/7/2019 | | | 1,584 | | | | 1,582,236 | |
| | | | | | | | | | | | | |
| Pharmaceuticals 0.47% | | | | | | | | | | | | |
| Amgen, Inc. Term Loan | | 1.607% | | 10/1/2018 | | | 2,135 | | | | 2,131,570 | |
| Warner Chilcott Corp. 3 Year Term Loan | | 1.924% | | 10/1/2016 | | | 104 | | | | 103,319 | |
| Total | | | | | | | | | | | 2,234,889 | |
| | | | | | | | | | | | | |
| Technology Hardware & Equipment 0.11% | | | | | | | | | | | | |
| Dell International LLC Term Loan B2 | | 4.00% | | 4/29/2020 | | | 522 | | | | 519,201 | |
| | | | | | | | | | | | | |
| Telecommunications: Wireless 0.21% | | | | | | | | | | | | |
| DigitalGlobe, Inc. Term Loan | | 4.75% | | 1/31/2020 | | | 1,044 | | | | 1,027,530 | |
| | | | | | | | | | | | | |
| Telecommunications: Wireline Integrated & Services 0.42% | | | | | | | | | | | | |
| AT&T, Inc. Tranche A Term Loan | | 1.416% | | 3/2/2018 | | | 2,000 | | | | 1,997,500 | |
| | See Notes to Financial Statements. | 39 |
Schedule of Investments (continued)
EMERGING MARKETS CURRENCY FUND December 31, 2015
| Investments | | Interest
Rate | | Maturity
Date | | Principal
Amount
(000) | | | Fair
Value | |
| Theaters & Entertainment 0.73% | | | | | | | | | | | | |
| Activision Blizzard, Inc. Term Loan | | 3.25% | | 10/13/2020 | | $ | 2,227 | | | $ | 2,226,677 | |
| Kasima LLC Term Loan | | 3.25% | | 5/17/2021 | | | 1,258 | | | | 1,250,900 | |
| Total | | | | | | | | | | | 3,477,577 | |
| Total Floating Rate Loans (cost $31,809,997) | | | | | | | | | | | 31,621,595 | |
| | | | | | | | | | | | | |
| FOREIGN GOVERNMENT OBLIGATION(a) 0.03% | | | | | | | | | | | | |
| | | | | | | | | | | | | |
| Brazil | | | | | | | | | | | | |
Federal Republic of Brazil
(cost $149,124) | | 8.00% | | 1/15/2018 | | | 139 | | | | 143,750 | |
| | | | | | | | | | | | | |
| GOVERNMENT SPONSORED ENTERPRISES COLLATERALIZED MORTGAGE OBLIGATIONS 2.29% | | | | | | | |
| Federal Home Loan Mortgage Corp. 2012-K705 C† | | 4.161% | # | 9/25/2044 | | | 500 | | | | 509,888 | |
| Federal Home Loan Mortgage Corp. 2012-K706 B† | | 4.027% | # | 11/25/2044 | | | 100 | | | | 102,700 | |
| Federal Home Loan Mortgage Corp. 2012-K707 B† | | 3.883% | # | 1/25/2047 | | | 27 | | | | 27,578 | |
| Federal Home Loan Mortgage Corp. 2012-K708 C† | | 3.754% | # | 2/25/2045 | | | 100 | | | | 101,269 | |
| Federal Home Loan Mortgage Corp. 2012-K709 C† | | 3.741% | # | 4/25/2045 | | | 1,007 | | | | 1,027,244 | |
| Federal Home Loan Mortgage Corp. 2012-K710 B† | | 3.819% | # | 6/25/2047 | | | 200 | | | | 204,495 | |
| Federal Home Loan Mortgage Corp. 2012-K711 B† | | 3.562% | # | 8/25/2045 | | | 303 | | | | 307,086 | |
| Federal Home Loan Mortgage Corp. 2012-K711 C† | | 3.562% | # | 8/25/2045 | | | 200 | | | | 202,753 | |
| Federal Home Loan Mortgage Corp. 2013-K712 B† | | 3.371% | # | 5/25/2045 | | | 100 | | | | 100,563 | |
| Federal Home Loan Mortgage Corp. 2013-K713 B† | | 3.165% | # | 4/25/2046 | | | 400 | | | | 398,752 | |
| Federal Home Loan Mortgage Corp. 2014-K503 B† | | 3.009% | # | 10/25/2047 | | | 415 | | | | 412,548 | |
| Government National Mortgage Assoc. 2013-171 IO | | 1.025% | # | 6/16/2054 | | | 17,126 | | | | 1,353,689 | |
| Government National Mortgage Assoc. 2013-193 IO | | 1.088% | # | 1/16/2055 | | | 1,894 | | | | 149,998 | |
| Government National Mortgage Assoc. 2014-112 A | | 3.00% | | 1/16/2048 | | | 1,640 | | | | 1,676,155 | |
| Government National Mortgage Assoc. 2014-15 IO | | 0.996% | # | 8/16/2054 | | | 18,354 | | | | 1,299,249 | |
| Government National Mortgage Assoc. 2014-70 A | | 2.50% | | 3/16/2049 | | | 123 | | | | 123,153 | |
| Government National Mortgage Assoc. 2014-78 A | | 2.20% | | 4/16/2047 | | | 182 | | | | 182,241 | |
| Government National Mortgage Assoc. 2014-78 IO | | 0.801% | # | 3/16/2056 | | | 1,116 | | | | 70,951 | |
| Government National Mortgage Assoc. 2015-33 AS | | 2.90% | # | 5/16/2054 | | | 495 | | | | 502,578 | |
| Government National Mortgage Assoc. 2015-41 AD | | 2.90% | # | 8/16/2055 | | | 575 | | | | 583,861 | |
| 40 | See Notes to Financial Statements. | |
Schedule of Investments (continued)
EMERGING MARKETS CURRENCY FUND December 31, 2015
| Investments | | Interest
Rate | | Maturity
Date | | Principal
Amount
(000) | | | Fair
Value | |
| GOVERNMENT SPONSORED ENTERPRISES COLLATERALIZED MORTGAGE OBLIGATIONS (continued) |
| Government National Mortgage Assoc. 2015-73 AC | | 2.90% | # | 2/16/2053 | | $ | 1,585 | | | $ | 1,606,525 | |
Total Government Sponsored Enterprises Collateralized Mortgage Obligations
(cost $11,244,801) | | | | | | | | | | | 10,943,276 | |
| | | | | | | | | | | | | |
| GOVERNMENT SPONSORED ENTERPRISES PASS-THROUGHS 4.54% | | | | | | | | | | | | |
| Federal Home Loan Mortgage Corp. | | 2.259% | # | 2/1/2038 | | | 570 | | | | 602,241 | |
| Federal Home Loan Mortgage Corp. | | 2.338% | # | 4/1/2037 | | | 437 | | | | 459,465 | |
| Federal Home Loan Mortgage Corp. | | 2.364% | # | 5/1/2036 | | | 357 | | | | 376,536 | |
| Federal Home Loan Mortgage Corp. | | 2.396% | # | 10/1/2038 | | | 291 | | | | 307,689 | |
| Federal Home Loan Mortgage Corp. | | 2.462% | # | 6/1/2038 | | | 183 | | | | 193,656 | |
| Federal Home Loan Mortgage Corp. | | 2.467% | # | 10/1/2035 | | | 484 | | | | 511,548 | |
| Federal Home Loan Mortgage Corp. | | 2.493% | # | 12/1/2036 | | | 631 | | | | 668,192 | |
| Federal Home Loan Mortgage Corp. | | 2.602% | # | 9/1/2036 | | | 557 | | | | 591,982 | |
| Federal Home Loan Mortgage Corp. | | 2.71% | # | 12/1/2035 | | | 574 | | | | 614,810 | |
| Federal Home Loan Mortgage Corp. | | 3.212% | # | 12/1/2040 | | | 2,168 | | | | 2,255,493 | |
| Federal Home Loan Mortgage Corp. | | 3.217% | # | 6/1/2044 | | | 975 | | | | 1,005,149 | |
| Federal Home Loan Mortgage Corp. | | 5.00% | | 5/1/2021 | | | 69 | | | | 73,424 | |
| Federal National Mortgage Assoc. | | 2.159% | # | 2/1/2036 | | | 356 | | | | 373,478 | |
| Federal National Mortgage Assoc. | | 2.268% | # | 3/1/2039 | | | 320 | | | | 335,403 | |
| Federal National Mortgage Assoc. | | 2.327% | # | 12/1/2035 | | | 532 | | | | 558,506 | |
| Federal National Mortgage Assoc. | | 2.338% | # | 11/1/2036 | | | 1,464 | | | | 1,548,970 | |
| Federal National Mortgage Assoc. | | 2.346% | # | 8/1/2037 | | | 388 | | | | 409,429 | |
| Federal National Mortgage Assoc. | | 2.36% | # | 1/1/2038 | | | 387 | | | | 409,763 | |
| Federal National Mortgage Assoc. | | 2.386% | # | 9/1/2038 | | | 250 | | | | 264,203 | |
| Federal National Mortgage Assoc. | | 2.403% | # | 8/1/2038 | | | 209 | | | | 220,718 | |
| Federal National Mortgage Assoc. | | 2.442% | # | 11/1/2038 | | | 490 | | | | 517,802 | |
| Federal National Mortgage Assoc. | | 2.446% | # | 1/1/2038 | | | 314 | | | | 331,628 | |
| Federal National Mortgage Assoc. | | 2.469% | # | 3/1/2038 | | | 202 | | | | 214,794 | |
| Federal National Mortgage Assoc. | | 2.54% | # | 12/1/2038 | | | 174 | | | | 185,000 | |
| Federal National Mortgage Assoc. | | 3.369% | # | 12/1/2040 | | | 1,126 | | | | 1,184,642 | |
| Federal National Mortgage Assoc. | | 3.419% | # | 12/1/2040 | | | 1,059 | | | | 1,116,504 | |
| Federal National Mortgage Assoc. | | 3.457% | # | 10/1/2040 | | | 1,093 | | | | 1,155,258 | |
| Federal National Mortgage Assoc. | | 3.484% | # | 11/1/2040 | | | 3,558 | | | | 3,752,941 | |
| Federal National Mortgage Assoc. | | 5.50% | | 2/1/2034 | | | 626 | | | | 705,047 | |
| Federal National Mortgage Assoc. | | 5.50% | | 11/1/2034 | | | 677 | | | | 761,630 | |
| Total Government Sponsored Enterprises Pass-Throughs (cost $21,724,144) | | | | | | | | | | | 21,705,901 | |
| | See Notes to Financial Statements. | 41 |
Schedule of Investments (continued)
EMERGING MARKETS CURRENCY FUND December 31, 2015
| Investments | | Interest
Rate | | Maturity
Date | | Principal
Amount
(000) | | | Fair
Value | |
| MUNICIPAL BONDS 0.60% | | | | | | | | | | | | |
| | | | | | | | | | | | | |
| Nursing Home 0.31% | | | | | | | | | | | | |
| New Jersey Econ Dev Auth | | 1.096% | | 6/15/2016 | | $ | 735 | | | $ | 734,963 | |
| New Jersey Econ Dev Auth | | 2.421% | | 6/15/2018 | | | 750 | | | | 747,750 | |
| Total | | | | | | | | | | | 1,482,713 | |
| | | | | | | | | | | | | |
| Transportation Infrastructure 0.29% | | | | | | | | | | | | |
| New Jersey Transp Tr Fnd Auth | | 3.60% | | 12/15/2017 | | | 300 | | | | 306,627 | |
| New Jersey Transp Tr Fnd Auth | | 4.00% | | 12/15/2017 | | | 650 | | | | 674,882 | |
| New Jersey Transp Tr Fnd Auth | | 5.00% | | 6/15/2017 | | | 400 | | | | 417,664 | |
| Total | | | | | | | | | | | 1,399,173 | |
| Total Municipal Bonds (cost $2,885,035) | | | | | | | | | | | 2,881,886 | |
| | | | | | | | | | | | | |
| NON-AGENCY COMMERCIAL MORTGAGE-BACKED SECURITIES 25.34% | | | | | | | | |
| A10 Bridge Asset Financing LLC 2015-AA A† | | 2.381% | # | 5/15/2030 | | | 1,418 | | | | 1,418,000 | |
| Americold LLC Trust 2010-ARTA A1† | | 3.847% | | 1/14/2029 | | | 818 | | | | 846,115 | |
| BAMLL Commercial Mortgage Securities Trust 2014-IP A† | | 2.717% | # | 6/15/2028 | | | 100 | | | | 101,254 | |
| BAMLL Commercial Mortgage Securities Trust 2014-IP B† | | 2.717% | # | 6/15/2028 | | | 200 | | | | 201,839 | |
| BAMLL Commercial Mortgage Securities Trust 2014-IP C† | | 2.717% | # | 6/15/2028 | | | 340 | | | | 340,305 | |
| BAMLL-DB Trust 2012-OSI A2FX† | | 3.352% | | 4/13/2029 | | | 449 | | | | 453,147 | |
| Banc of America Commercial Mortgage Trust 2006-6 AM | | 5.39% | | 10/10/2045 | | | 2,171 | | | | 2,227,342 | |
| Banc of America Commercial Mortgage Trust 2007-2 AM | | 5.629% | # | 4/10/2049 | | | 500 | | | | 516,585 | |
| Banc of America Commercial Mortgage Trust 2007-3 AMF | | 5.317% | | 6/10/2049 | | | 700 | | | | 724,892 | |
| Banc of America Re-REMIC Trust 2009-UB2 A4B2† | | 5.552% | # | 6/24/2049 | | | 1,759 | | | | 1,823,175 | |
| Banc of America Re-REMIC Trust 2010-RC30 A5B† | | 5.334% | | 12/16/2043 | | | 125 | | | | 127,817 | |
| BB-UBS Trust 2012-TFT A† | | 2.892% | | 6/5/2030 | | | 700 | | | | 693,954 | |
| BBCMS Trust 2015-VFM A1† | | 2.466% | | 3/10/2036 | | | 302 | | | | 292,648 | |
| BBCMS Trust 2015-VFM X IO† | | 0.502% | # | 3/12/2036 | | | 55,817 | | | | 1,658,606 | |
| Bear Stearns Commercial Mortgage Securities Trust 2007-PW16 AM | | 5.722% | # | 6/11/2040 | | | 1,230 | | | | 1,281,511 | |
| Bear Stearns Commercial Mortgage Securities Trust 2007-PW17 AM | | 5.882% | # | 6/11/2050 | | | 1,150 | | | | 1,210,853 | |
| Bear Stearns Deutsche Bank Trust 2005-AFR1 A2† | | 5.008% | | 9/15/2027 | | | 83 | | | | 89,288 | |
| Boca Hotel Portfolio Trust 2013-BOCA D† | | 3.381% | # | 8/15/2026 | | | 360 | | | | 359,583 | |
| CD Commercial Mortgage Trust 2007-CD4 WFC3† | | 5.693% | # | 12/11/2049 | | | 3,378 | | | | 3,475,640 | |
| 42 | See Notes to Financial Statements. | |
Schedule of Investments (continued)
EMERGING MARKETS CURRENCY FUND December 31, 2015
| Investments | | Interest
Rate | | Maturity
Date | | Principal
Amount
(000) | | | Fair
Value | |
| NON-AGENCY COMMERCIAL MORTGAGE-BACKED SECURITIES (continued) | | | | | | | | |
| CFCRE Commercial Mortgage Trust 2011-C2 AJ† | | 5.574% | # | 12/15/2047 | | $ | 133 | | | $ | 151,722 | |
| CG-CCRE Commercial Mortgage Trust 2014-FL1 A† | | 1.281% | # | 6/15/2031 | | | 350 | | | | 348,948 | |
| CG-CCRE Commercial Mortgage Trust 2014-FL1 XCP IO† | | 1.411% | # | 6/15/2031 | | | 2,658 | | | | 6,672 | |
| CGBAM Commercial Mortgage Trust 2015-SMRT B† | | 3.213% | | 4/10/2028 | | | 324 | | | | 326,623 | |
| CGBAM Commercial Mortgage Trust 2015-SMRT C† | | 3.516% | | 4/10/2028 | | | 243 | | | | 245,082 | |
| CGBAM Commercial Mortgage Trust 2015-SMRT F† | | 3.786% | # | 4/10/2028 | | | 111 | | | | 106,166 | |
| Citigroup Commercial Mortgage Trust 2013-SMP C† | | 2.738% | | 1/12/2030 | | | 250 | | | | 250,883 | |
| Citigroup Commercial Mortgage Trust 2013-SMP D† | | 2.911% | # | 1/12/2030 | | | 750 | | | | 749,237 | |
| Citigroup Commercial Mortgage Trust 2014-GC21 XA IO | | 1.305% | # | 5/10/2047 | | | 4,414 | | | | 341,665 | |
| Citigroup Commercial Mortgage Trust 2014-GC23 XB IO | | 0.226% | # | 7/10/2047 | | | 3,784 | | | | 71,468 | |
| Citigroup Commercial Mortgage Trust 2015-GC31 XA IO | | 0.479% | # | 6/10/2048 | | | 4,055 | | | | 130,338 | |
| Citigroup Commercial Mortgage Trust 2015-SSHP B† | | 1.981% | # | 9/15/2017 | | | 4,438 | | | | 4,454,524 | |
| Citigroup Commercial Mortgage Trust 2015-SSHP C† | | 2.431% | # | 9/15/2017 | | | 5,000 | | | | 5,018,756 | |
| COBALT CMBS Commercial Mortgage Trust 2007-C2 AMFX | | 5.526% | | 4/15/2047 | | | 925 | | | | 963,636 | |
| Commercial Mortgage Pass-Through Certificates 2010-C1 C† | | 5.991% | # | 7/10/2046 | | | 100 | | | | 111,486 | |
| Commercial Mortgage Pass-Through Certificates 2012-9W57 X IO† | | 1.399% | # | 2/10/2029 | | | 8,000 | | | | 98,655 | |
| Commercial Mortgage Pass-Through Certificates 2012-LTRT A1† | | 2.15% | | 10/5/2030 | | | 365 | | | | 360,004 | |
| Commercial Mortgage Pass-Through Certificates 2013-GAM A2† | | 3.367% | | 2/10/2028 | | | 2,000 | | | | 2,020,955 | |
| Commercial Mortgage Pass-Through Certificates 2013-SFS A1† | | 1.873% | | 4/12/2035 | | | 522 | | | | 510,491 | |
| Commercial Mortgage Pass-Through Certificates 2013-THL B† | | 1.876% | # | 6/8/2030 | | | 225 | | | | 224,780 | |
| Commercial Mortgage Pass-Through Certificates 2014-CR19 XA IO | | 1.295% | # | 8/10/2047 | | | 1,714 | | | | 119,382 | |
| | See Notes to Financial Statements. | 43 |
Schedule of Investments (continued)
EMERGING MARKETS CURRENCY FUND December 31, 2015
| Investments | | Interest
Rate | | Maturity
Date | | Principal
Amount
(000) | | | Fair
Value | |
| NON-AGENCY COMMERCIAL MORTGAGE-BACKED SECURITIES (continued) | | | | | | | | |
| Commercial Mortgage Pass-Through Certificates 2014-FL4 C† | | 2.267% | # | 7/13/2031 | | $ | 468 | | | $ | 463,323 | |
| Commercial Mortgage Pass-Through Certificates 2014-KYO A† | | 1.201% | # | 6/11/2027 | | | 230 | | | | 227,432 | |
| Commercial Mortgage Pass-Through Certificates 2014-LC17 XB IO† | | 0.041% | # | 10/10/2047 | | | 58,568 | | | | 344,409 | |
| Commercial Mortgage Pass-Through Certificates 2014-SAVA A† | | 1.481% | # | 6/15/2034 | | | 187 | | | | 186,760 | |
| Commercial Mortgage Pass-Through Certificates 2014-SAVA B† | | 2.081% | # | 6/15/2034 | | | 375 | | | | 373,960 | |
| Commercial Mortgage Pass-Through Certificates 2014-SAVA C† | | 2.731% | # | 6/15/2034 | | | 375 | | | | 373,628 | |
| Commercial Mortgage Pass-Through Certificates 2014-SAVA XCP IO† | | 3.373% | # | 6/15/2034 | | | 5,932 | | | | 92,434 | |
| Commercial Mortgage Pass-Through Certificates 2014-UBS5 XA IO | | 1.098% | # | 9/10/2047 | | | 3,746 | | | | 220,639 | |
| Commercial Mortgage Pass-Through Certificates 2015-CR23 CMC† | | 3.685% | # | 5/10/2048 | | | 1,000 | | | | 989,725 | |
| Commercial Mortgage Trust 2006-GG7 AM | | 5.826% | # | 7/10/2038 | | | 975 | | | | 986,090 | |
| Core Industrial Trust 2015-WEST XA IO† | | 0.935% | # | 2/10/2037 | | | 2,882 | | | | 210,400 | |
| Credit Suisse First Boston Mortgage Securities Corp. 2006-OMA A† | | 5.384% | | 5/15/2023 | | | 50 | | | | 52,276 | |
| Credit Suisse First Boston Mortgage Securities Corp. 2006-OMA B1† | | 5.466% | | 5/15/2023 | | | 333 | | | | 364,055 | |
| Credit Suisse First Boston Mortgage Securities Corp. 2006-OMA B2† | | 5.538% | | 5/15/2023 | | | 895 | | | | 1,001,229 | |
| Credit Suisse Mortgage Capital Certificates 2006-C4 AM | | 5.509% | | 9/15/2039 | | | 2,000 | | | | 2,038,370 | |
| Credit Suisse Mortgage Capital Certificates 2014-RS1 MRA† | | 0.734% | # | 11/22/2046 | | | 604 | | | | 563,335 | |
| Credit Suisse Mortgage Capital Certificates 2014-TIKI B† | | 1.681% | # | 9/15/2038 | | | 152 | | | | 150,455 | |
| Credit Suisse Mortgage Capital Certificates 2014-TIKI C† | | 2.131% | # | 9/15/2038 | | | 465 | | | | 460,123 | |
| Credit Suisse Mortgage Capital Certificates 2014-USA X1 IO† | | 0.552% | # | 9/15/2037 | | | 20,000 | | | | 892,500 | |
| Credit Suisse Mortgage Capital Certificates 2015-DEAL A† | | 1.651% | # | 4/15/2029 | | | 152 | | | | 152,044 | |
| Credit Suisse Mortgage Capital Certificates 2015-DEAL B† | | 2.181% | # | 4/15/2029 | | | 478 | | | | 474,905 | |
| DBUBS Mortgage Trust 2011-LC1A A1† | | 3.742% | | 11/10/2046 | | | 320 | | | | 320,793 | |
| 44 | See Notes to Financial Statements. | |
Schedule of Investments (continued)
EMERGING MARKETS CURRENCY FUND December 31, 2015
| Investments | | Interest
Rate | | Maturity
Date | | Principal
Amount
(000) | | | Fair
Value | |
| NON-AGENCY COMMERCIAL MORTGAGE-BACKED SECURITIES (continued) | | | | | | | |
| DBUBS Mortgage Trust 2011-LC2A A1† | | 3.527% | | 7/10/2044 | | $ | 783 | | | $ | 810,173 | |
| DBUBS Mortgage Trust 2011-LC2A A2† | | 3.386% | | 7/10/2044 | | | 592 | | | | 593,976 | |
| DBUBS Mortgage Trust 2011-LC2A B† | | 4.998% | | 7/10/2044 | | | 100 | | | | 108,879 | |
| DBUBS Mortgage Trust 2011-LC2A D† | | 5.453% | # | 7/10/2044 | | | 300 | | | | 313,820 | |
| DBUBS Mortgage Trust 2011-LC3A A3 | | 4.638% | | 8/10/2044 | | | 500 | | | | 517,072 | |
| DBWF Mortgage Trust 2015-LCM A1† | | 2.998% | | 6/10/2034 | | | 369 | | | | 373,851 | |
| DBWF Mortgage Trust 2015-LCM XA IO† | | 0.423% | # | 6/10/2034 | | | 962 | | | | 22,498 | |
| Extended Stay America Trust 2013-ESH7 A27† | | 2.958% | | 12/5/2031 | | | 1,260 | | | | 1,263,848 | |
| Extended Stay America Trust 2013-ESH7 B7† | | 3.604% | | 12/5/2031 | | | 800 | | | | 802,951 | |
| Extended Stay America Trust 2013-ESH7 C7† | | 3.902% | | 12/5/2031 | | | 500 | | | | 501,767 | |
| Great Wolf Trust 2015-WOLF A† | | 1.781% | # | 5/15/2034 | | | 151 | | | | 150,475 | |
| Great Wolf Trust 2015-WOLF C† | | 2.831% | # | 5/15/2034 | | | 151 | | | | 149,748 | |
| GS Mortgage Securities Corp. II 2013-KING A† | | 2.706% | | 12/10/2027 | | | 256 | | | | 258,229 | |
| GS Mortgage Securities Corp. II 2013-KING C† | | 3.435% | # | 12/10/2027 | | | 2,250 | | | | 2,270,499 | |
| GS Mortgage Securities Corp. Trust 2012-SHOP A† | | 2.933% | | 6/5/2031 | | | 241 | | | | 244,551 | |
| GS Mortgage Securities Corp. Trust 2012-SHOP B† | | 3.311% | | 6/5/2031 | | | 408 | | | | 415,772 | |
| GS Mortgage Securities Corp. Trust 2013-NYC5 D† | | 3.479% | | 1/10/2030 | | | 200 | | | | 201,786 | |
| GS Mortgage Securities Corp. Trust 2014-NEW B† | | 3.79% | | 1/10/2031 | | | 130 | | | | 132,604 | |
| GS Mortgage Securities Trust 2006-GG8 AM | | 5.591% | | 11/10/2039 | | | 440 | | | | 449,002 | |
| GS Mortgage Securities Trust 2010-C1 D† | | 6.079% | # | 8/10/2043 | | | 100 | | | | 105,282 | |
| GS Mortgage Securities Trust 2013-G1 A1† | | 2.059% | | 4/10/2031 | | | 920 | | | | 897,709 | |
| H/2 Asset Funding 2015-1A-AFL | | 2.074% | | 6/24/2049 | | | 746 | | | | 739,392 | |
| H/2 Asset Funding 2015-1A-AFX | | 3.353% | | 6/24/2049 | | | 373 | | | | 372,383 | |
| H/2 Asset Funding 2015-1A-BFX | | 3.993% | | 6/24/2049 | | | 369 | | | | 364,752 | |
| HILT Mortgage Trust 2014-ORL B† | | 1.531% | # | 7/15/2029 | | | 200 | | | | 197,902 | |
| HILT Mortgage Trust 2014-ORL C† | | 1.931% | # | 7/15/2029 | | | 750 | | | | 742,570 | |
| HILT Mortgage Trust 2014-ORL XCP IO† | | 1.104% | | 7/15/2029 | | | 1,000 | | | | 464 | |
| Irvine Core Office Trust 2013-IRV A1† | | 2.068% | | 5/15/2048 | | | 154 | | | | 152,088 | |
| JPMorgan Chase Commercial Mortgage Securities Trust 2007-CB18 AM | | 5.466% | | 6/12/2047 | | | 2,099 | | | | 2,150,292 | |
| JPMorgan Chase Commercial Mortgage Securities Trust 2010-C1 A2† | | 4.608% | | 6/15/2043 | | | 500 | | | | 517,425 | |
| JPMorgan Chase Commercial Mortgage Securities Trust 2010-C2 B† | | 5.075% | | 11/15/2043 | | | 250 | | | | 266,294 | |
| JPMorgan Chase Commercial Mortgage Securities Trust 2010-CNTR B† | | 5.023% | | 8/5/2032 | | | 2,000 | | | | 2,198,714 | |
| JPMorgan Chase Commercial Mortgage Securities Trust 2010-CNTR C† | | 5.513% | | 8/5/2032 | | | 2,585 | | | | 2,872,449 | |
| JPMorgan Chase Commercial Mortgage Securities Trust 2014-BXH A† | | 1.231% | # | 4/15/2027 | | | 400 | | | | 399,668 | |
| | See Notes to Financial Statements. | 45 |
Schedule of Investments (continued)
EMERGING MARKETS CURRENCY FUND December 31, 2015
| Investments | | Interest
Rate | | Maturity
Date | | Principal
Amount
(000) | | | Fair
Value | |
| NON-AGENCY COMMERCIAL MORTGAGE-BACKED SECURITIES (continued) | | | | | | | |
| JPMorgan Chase Commercial Mortgage Securities Trust 2014-BXH B† | | 1.581% | # | 4/15/2027 | | $ | 250 | | | $ | 249,811 | |
| JPMorgan Chase Commercial Mortgage Securities Trust 2014-C19 A2 | | 3.046% | | 4/15/2047 | | | 223 | | | | 227,914 | |
| JPMorgan Chase Commercial Mortgage Securities Trust 2014-C19 XA IO | | 1.263% | # | 4/15/2047 | | | 1,963 | | | | 92,969 | |
| JPMorgan Chase Commercial Mortgage Securities Trust 2014-C19 XB IO | | 0.282% | # | 4/15/2047 | | | 1,000 | | | | 24,656 | |
| JPMorgan Chase Commercial Mortgage Securities Trust 2014-DSTY A† | | 3.429% | | 6/10/2027 | | | 2,546 | | | | 2,615,040 | |
| JPMorgan Chase Commercial Mortgage Securities Trust 2014-DSTY B† | | 3.771% | | 6/10/2027 | | | 1,359 | | | | 1,398,844 | |
| JPMorgan Chase Commercial Mortgage Securities Trust 2014-DSTY C† | | 3.805% | # | 6/10/2027 | | | 866 | | | | 873,462 | |
| JPMorgan Chase Commercial Mortgage Securities Trust 2014-DSTY XA IO† | | 0.376% | # | 6/10/2027 | | | 1,487 | | | | 20,632 | |
| JPMorgan Chase Commercial Mortgage Securities Trust 2014-DSTY XB IO† | | 0.034% | # | 6/10/2027 | | | 661 | | | | 1,752 | |
| JPMorgan Chase Commercial Mortgage Securities Trust 2014-FL4 C† | | 2.531% | # | 12/15/2030 | | | 250 | | | | 249,584 | |
| JPMorgan Chase Commercial Mortgage Securities Trust 2014-FL4 D† | | 3.431% | # | 12/15/2030 | | | 500 | | | | 498,958 | |
| JPMorgan Chase Commercial Mortgage Securities Trust 2014-FL5 C† | | 2.431% | # | 7/15/2031 | | | 250 | | | | 248,431 | |
| JPMorgan Chase Commercial Mortgage Securities Trust 2014-FL5 XCP IO† | | 0.478% | # | 5/15/2016 | | | 70,793 | | | | 17,698 | |
| JPMorgan Chase Commercial Mortgage Securities Trust 2014-INN A† | | 1.251% | # | 6/15/2029 | | | 1,021 | | | | 1,015,950 | |
| JPMorgan Chase Commercial Mortgage Securities Trust 2014-INN C† | | 2.031% | # | 6/15/2029 | | | 150 | | | | 148,457 | |
| JPMorgan Chase Commercial Mortgage Securities Trust 2015-C29 XA IO | | 0.96% | # | 5/15/2048 | | | 2,988 | | | | 144,297 | |
| JPMorgan Chase Commercial Mortgage Securities Trust 2015-UES XB IO† | | 0.136% | # | 9/5/2032 | | | 46,250 | | | | 290,163 | |
| Ladder Capital Commercial Mortgage Securities LLC 2014-PKMD A† | | 2.857% | # | 11/14/2027 | | | 1,816 | | | | 1,846,851 | |
| Ladder Capital Commercial Mortgage Securities LLC 2014-PKMD B† | | 2.857% | # | 11/14/2027 | | | 156 | | | | 156,641 | |
| Ladder Capital Commercial Mortgage Securities LLC 2014-PKMD MRC† | | 2.857% | # | 11/14/2027 | | | 126 | | | | 127,235 | |
| LB-UBS Commercial Mortgage Trust 2006-C4 AM | | 5.84% | # | 6/15/2038 | | | 720 | | | | 732,711 | |
| LB-UBS Commercial Mortgage Trust 2006-C6 AM | | 5.413% | | 9/15/2039 | | | 4,439 | | | | 4,522,785 | |
| 46 | See Notes to Financial Statements. | |
Schedule of Investments (continued)
EMERGING MARKETS CURRENCY FUND December 31, 2015
| Investments | | Interest
Rate | | Maturity
Date | | Principal
Amount
(000) | | | Fair
Value | |
| NON-AGENCY COMMERCIAL MORTGAGE-BACKED SECURITIES (continued) | | | | | | | |
| LB-UBS Commercial Mortgage Trust 2006-C7 AM | | 5.378% | | 11/15/2038 | | $ | 1,110 | | | $ | 1,135,395 | |
| LMREC, Inc. 2015-CRE1 A† | | 2.168% | # | 2/22/2032 | | | 755 | | | | 746,189 | |
| LMREC, Inc. 2015-CRE1 B† | | 3.913% | # | 2/22/2032 | | | 100 | | | | 98,293 | |
| LSTAR Commercial Mortgage Trust 2014-2 XA IO† | | 1.00% | # | 1/20/2041 | | | 1,739 | | | | 46,510 | |
| LSTAR Commercial Mortgage Trust 2015-3 A2† | | 2.729% | # | 4/20/2048 | | | 297 | | | | 296,910 | |
| Merrill Lynch/Countrywide Commercial Mortgage Trust 2006-4 AM | | 5.204% | | 12/12/2049 | | | 500 | | | | 513,370 | |
| Morgan Stanley Bank of America Merrill Lynch Trust 2013-C12 A2 | | 3.001% | | 10/15/2046 | | | 40 | | | | 40,885 | |
| Morgan Stanley Bank of America Merrill Lynch Trust 2015-C23 XA IO | | 0.767% | # | 7/15/2050 | | | 9,961 | | | | 450,069 | |
| Morgan Stanley Capital I Trust 2005-IQ9 B | | 4.86% | | 7/15/2056 | | | 450 | | | | 454,758 | |
| Morgan Stanley Capital I Trust 2007-HQ12 AM | | 5.723% | # | 4/12/2049 | | | 175 | | | | 181,487 | |
| Morgan Stanley Capital I Trust 2007-IQ15 AM | | 5.917% | # | 6/11/2049 | | | 813 | | | | 852,271 | |
| Morgan Stanley Capital I Trust 2011-C3 A4 | | 4.118% | | 7/15/2049 | | | 714 | | | | 761,653 | |
| Morgan Stanley Capital I Trust 2012-C4 XA IO† | | 2.601% | # | 3/15/2045 | | | 25,348 | | | | 2,043,029 | |
| Morgan Stanley Capital I Trust 2012-STAR A1† | | 2.084% | | 8/5/2034 | | | 709 | | | | 701,247 | |
| Morgan Stanley Capital I Trust 2014-CPT XA IO† | | 0.089% | # | 7/13/2029 | | | 100,000 | | | | 629,000 | |
| Motel 6 Trust 2015-MTL6 A2† | | 2.605% | | 2/5/2030 | | | 911 | | | | 904,687 | |
| Motel 6 Trust 2015-MTL6 B† | | 3.298% | | 2/5/2030 | | | 422 | | | | 418,619 | |
| Motel 6 Trust 2015-MTL6 C† | | 3.644% | | 2/5/2030 | | | 322 | | | | 319,507 | |
| Motel 6 Trust 2015-MTL6 D† | | 4.532% | | 2/5/2030 | | | 550 | | | | 542,001 | |
| MSCG Trust 2015-ALDR A1† | | 2.612% | | 6/7/2035 | | | 203 | | | | 201,774 | |
| Nationslink Funding Corp. Commercial Loan Pass-Through Certificate 1999-LTL1 C† | | 7.399% | | 1/22/2026 | | | 263 | | | | 269,506 | |
| NorthStar Real Estate CDO Ltd. 2013 -1A† | | 2.272% | # | 8/25/2029 | | | 600 | | | | 601,299 | |
| NorthStar Real Estate CDO Ltd. 2013 -1B† | | 5.422% | # | 8/25/2029 | | | 500 | | | | 506,432 | |
| PFP III Ltd. 2014-1 AS† | | 1.995% | # | 6/14/2031 | | | 1,000 | | | | 999,936 | |
| PFP III Ltd. 2014-1 B† | | 2.695% | # | 6/14/2031 | | | 1,000 | | | | 1,000,739 | |
| PFP III Ltd. 2014-1 C† | | 3.245% | # | 6/14/2031 | | | 2,000 | | | | 1,998,509 | |
| Prima Capital CRE Securization 2006-1 | | 2.55% | | 8/26/2049 | | | 1,913 | | | | 1,873,210 | |
| RAIT Trust 2014-FL2 B† | | 2.481% | # | 5/13/2031 | | | 1,000 | | | | 979,678 | |
| RBSCF Trust 2010-RR3 WBTB† | | 5.952% | # | 2/16/2051 | | | 1,500 | | | | 1,554,366 | |
| Resource Capital Corp. Ltd. 2014-CRE2 A† | | 1.401% | # | 4/15/2032 | | | 203 | | | | 202,501 | |
| Selkirk Ltd. 1 A† | | 1.329% | | 2/20/2041 | | | 137 | | | | 135,976 | |
| TimberStar Trust I 2006-1A A† | | 5.668% | | 10/15/2036 | | | 1,549 | | | | 1,589,402 | |
| Vornado DP LLC Trust 2010-VNO A1† | | 2.97% | | 9/13/2028 | | | 525 | | | | 538,110 | |
| Wachovia Bank Commercial Mortgage Trust 2005-C21 D | | 5.301% | # | 10/15/2044 | | | 3,500 | | | | 3,504,220 | |
| Wachovia Bank Commercial Mortgage Trust 2006-C27 AM | | 5.795% | | 7/15/2045 | | | 667 | | | | 678,187 | |
| | See Notes to Financial Statements. | 47 |
Schedule of Investments (continued)
EMERGING MARKETS CURRENCY FUND December 31, 2015
| Investments | | Interest
Rate | | Maturity
Date | | Principal
Amount
(000) | | | Fair
Value | |
| NON-AGENCY COMMERCIAL MORTGAGE-BACKED SECURITIES (continued) | | | | | | | | |
| Wachovia Bank Commercial Mortgage Trust 2007-C30 AM | | 5.383% | | 12/15/2043 | | $ | 166 | | | $ | 171,119 | |
| Wachovia Bank Commercial Mortgage Trust 2007-C31 AM | | 5.591% | | 4/15/2047 | | | 2,075 | | | | 2,152,565 | |
| Wells Fargo Commercial Mortgage Trust 2015-C27 XB IO | | 0.357% | # | 2/15/2048 | | | 68,008 | | | | 2,060,088 | |
| Wells Fargo Commercial Mortgage Trust 2015-C29 XA IO | | 0.776% | # | 6/15/2048 | | | 2,491 | | | | 125,895 | |
| Wells Fargo Commercial Mortgage Trust 2015-C29 XB IO | | 0.018% | # | 6/15/2048 | | | 40,645 | | | | 159,938 | |
| Wells Fargo Commercial Mortgage Trust 2015-LC20 XB IO | | 0.476% | # | 4/15/2050 | | | 24,333 | | | | 931,621 | |
| Wells Fargo Commercial Mortgage Trust 2015-SG1 XA IO | | 0.833% | # | 12/15/2047 | | | 2,619 | | | | 142,994 | |
| WF-RBS Commercial Mortgage Trust 2011-C4 A3† | | 4.394% | | 6/15/2044 | | | 25 | | | | 26,293 | |
| WF-RBS Commercial Mortgage Trust 2011-C5 A3 | | 3.526% | | 11/15/2044 | | | 1,000 | | | | 1,035,336 | |
| WF-RBS Commercial Mortgage Trust 2012-C7 A1 | | 2.30% | | 6/15/2045 | | | 582 | | | | 584,475 | |
| WF-RBS Commercial Mortgage Trust 2012-C8 A2 | | 1.881% | | 8/15/2045 | | | 956 | | | | 956,326 | |
| WF-RBS Commercial Mortgage Trust 2014-C20 XA IO | | 1.21% | # | 5/15/2047 | | | 3,882 | | | | 252,960 | |
| WF-RBS Commercial Mortgage Trust 2014-C20 XB IO | | 0.573% | # | 5/15/2047 | | | 765 | | | | 34,168 | |
| WF-RBS Commercial Mortgage Trust 2014-C21 XB IO | | 0.608% | # | 8/15/2047 | | | 15,000 | | | | 724,323 | |
| WF-RBS Commercial Mortgage Trust 2014-C22 XA IO | | 0.953% | # | 9/15/2057 | | | 12,878 | | | | 729,915 | |
| WF-RBS Commercial Mortgage Trust 2014-C22 XB IO | | 0.453% | # | 9/15/2057 | | | 14,000 | | | | 487,264 | |
| WF-RBS Commercial Mortgage Trust 2014-C23 XA IO | | 0.709% | # | 10/15/2057 | | | 7,918 | | | | 326,748 | |
| WF-RBS Commercial Mortgage Trust 2014-C23 XB IO | | 0.307% | # | 10/15/2057 | | | 5,000 | | | | 111,783 | |
| Total Non-Agency Commercial Mortgage-Backed Securities (cost $123,687,048) | | | | | | | 121,240,174 | |
| | | | | | | | | | | | | |
| U.S. TREASURY OBLIGATIONS 3.01% | | | | | | | | | | | | |
| U.S. Treasury Note | | 0.875% | | 10/15/2017 | | | 3,661 | | | | 3,650,489 | |
| U.S. Treasury Note | | 1.375% | | 10/31/2020 | | | 2,839 | | | | 2,789,150 | |
| U.S. Treasury Note | | 1.625% | | 11/30/2020 | | | 6,151 | | | | 6,115,078 | |
| U.S. Treasury Note | | 2.625% | | 11/15/2020 | | | 1,781 | | | | 1,850,780 | |
| Total U.S. Treasury Obligations (cost $14,471,570) | | | | | | | | | | | 14,405,497 | |
| Total Long-Term Investments (cost $431,312,051) | | | | | | | | | | | 426,629,222 | |
| 48 | See Notes to Financial Statements. | |
Schedule of Investments (continued)
EMERGING MARKETS CURRENCY FUND December 31, 2015
| Investments | | Interest
Rate | | Maturity
Date | | Principal
Amount
(000) | | | Fair
Value | |
| SHORT-TERM INVESTMENTS 7.95% | | | | | | | | | | | | |
| | | | | | | | | | | | | |
| COMMERCIAL PAPER 0.78% | | | | | | | | | | | | |
| | | | | | | | | | | | | |
| Electric: Integrated 0.26% | | | | | | | | | | | | |
| Entergy Corp. | Zero Coupon | | 1/6/2016 | | $ | 750 | | | $ | 749,964 | |
| Entergy Corp. | Zero Coupon | | 1/7/2016 | | | 500 | | | | 499,963 | |
| Total | | | | | | | | | | | 1,249,927 | |
| | | | | | | | | | | | | |
| Gas Distribution 0.21% | | | | | | | | | | | | |
| Enable Midstream Partners LP | Zero Coupon | | 1/13/2016 | | | 1,000 | | | | 999,124 | |
| | | | | | | | | | | | | |
| Telecommunications: Wireless 0.31% | | | | | | | | | | | | |
| Vodafone Group plc | Zero Coupon | | 4/11/2016 | | | 500 | | | | 499,187 | |
| Vodafone Group plc | Zero Coupon | | 4/11/2016 | | | 1,000 | | | | 998,374 | |
| Total | | | | | | | | | | | 1,497,561 | |
| Total Commercial Paper (cost $3,744,754) | | | | | | | | | | | 3,746,612 | |
| | | | | | | | | | | | | |
| CORPORATE BONDS 7.00% | | | | | | | | | | | | |
| | | | | | | | | | | | | |
| Auto Loans 0.04% | | | | | | | | | | | | |
| Hyundai Capital Services, Inc. (South Korea)†(a) | | 4.375% | | 7/27/2016 | | | 200 | | | | 202,841 | |
| | | | | | | | | | | | | |
| Banking 0.86% | | | | | | | | | | | | |
| Associated Banc-Corp. | | 5.125% | | 3/28/2016 | | | 2,120 | | | | 2,131,650 | |
| Countrywide Financial Corp. | | 6.25% | | 5/15/2016 | | | 730 | | | | 742,371 | |
| Fifth Third Bancorp | | 3.625% | | 1/25/2016 | | | 1,041 | | | | 1,042,854 | |
| Intesa Sanpaolo SpA (Italy)(a) | | 3.125% | | 1/15/2016 | | | 200 | | | | 200,101 | |
| Total | | | | | | | | | | | 4,116,976 | |
| | | | | | | | | | | | | |
| Brokerage 0.05% | | | | | | | | | | | | |
| Raymond James Financial, Inc. | | 4.25% | | 4/15/2016 | | | 250 | | | | 251,918 | |
| | | | | | | | | | | | | |
| Building Materials 0.16% | | | | | | | | | | | | |
| CRH America, Inc. | | 4.125% | | 1/15/2016 | | | 500 | | | | 500,368 | |
| Lafarge SA (France)(a) | | 6.50% | | 7/15/2016 | | | 250 | | | | 256,343 | |
| Total | | | | | | | | | | | 756,711 | |
| | | | | | | | | | | | | |
| Consumer/Commercial/Lease Financing 0.48% | | | | | | | | | | | | |
| Air Lease Corp. | | 4.50% | | 1/15/2016 | | | 2,296 | | | | 2,297,492 | |
| | | | | | | | | | | | | |
| Electric: Integrated 0.37% | | | | | | | | | | | | |
| Jersey Central Power & Light Co. | | 5.625% | | 5/1/2016 | | | 761 | | | | 770,719 | |
| Ohio Power Co. | | 6.00% | | 6/1/2016 | | | 400 | | | | 407,456 | |
| TECO Finance, Inc. | | 4.00% | | 3/15/2016 | | | 595 | | | | 597,912 | |
| Total | | | | | | | | | | | 1,776,087 | |
| | See Notes to Financial Statements. | 49 |
Schedule of Investments (continued)
EMERGING MARKETS CURRENCY FUND December 31, 2015
| Investments | | Interest
Rate | | Maturity
Date | | Principal
Amount
(000) | | | Fair
Value | |
| Energy: Exploration & Production 0.53% | | | | | | | | | | | | |
| Canadian Natural Resources Ltd. (Canada)(a) | | 0.978% | # | 3/30/2016 | | $ | 500 | | | $ | 498,919 | |
| Canadian Natural Resources Ltd. (Canada)(a) | | 6.00% | | 8/15/2016 | | | 1,000 | | | | 1,026,672 | |
| Pioneer Natural Resources Co. | | 5.875% | | 7/15/2016 | | | 1,000 | | | | 1,015,759 | |
| Total | | | | | | | | | | | 2,541,350 | |
| | | | | | | | | | | | | |
| Food: Wholesale 0.63% | | | | | | | | | | | | |
| Bunge Ltd. Finance Corp. | | 4.10% | | 3/15/2016 | | | 1,000 | | | | 1,005,182 | |
| ConAgra Foods, Inc. | | 1.30% | | 1/25/2016 | | | 2,000 | | | | 2,000,320 | |
| Total | | | | | | | | | | | 3,005,502 | |
| | | | | | | | | | | | | |
| Forestry/Paper 0.10% | | | | | | | | | | | | |
| International Paper Co. | | 5.25% | | 4/1/2016 | | | 500 | | | | 504,655 | |
| | | | | | | | | | | | | |
| Gas Distribution 0.83% | | | | | | | | | | | | |
| Enbridge, Inc. (Canada)(a) | | 0.976% | # | 10/1/2016 | | | 500 | | | | 496,342 | |
| Enterprise Products Operating LLC | | 3.20% | | 2/1/2016 | | | 500 | | | | 500,169 | |
| ONEOK Partners LP | | 3.25% | | 2/1/2016 | | | 500 | | | | 500,874 | |
| ONEOK Partners LP | | 6.15% | | 10/1/2016 | | | 358 | | | | 367,573 | |
| Plains All American Pipeline LP/PAA Finance Corp. | | 5.875% | | 8/15/2016 | | | 300 | | | | 305,636 | |
| Sempra Energy | | 6.50% | | 6/1/2016 | | | 1,000 | | | | 1,018,265 | |
| Tennessee Gas Pipeline Co. LLC | | 8.00% | | 2/1/2016 | | | 85 | | | | 85,312 | |
| TransCanada PipeLines Ltd. (Canada)(a) | | 7.69% | | 6/30/2016 | | | 500 | | | | 514,397 | |
| Transcontinental Gas Pipe Line Co. LLC | | 6.40% | | 4/15/2016 | | | 175 | | | | 177,156 | |
| Total | | | | | | | | | | | 3,965,724 | |
| | | | | | | | | | | | | |
| Life Insurance 0.09% | | | | | | | | | | | | |
| Unum Group | | 7.125% | | 9/30/2016 | | | 400 | | | | 415,896 | |
| | | | | | | | | | | | | |
| Media: Diversified 0.31% | | | | | | | | | | | | |
| Viacom, Inc. | | 2.50% | | 12/15/2016 | | | 250 | | | | 250,576 | |
| Viacom, Inc. | | 6.25% | | 4/30/2016 | | | 1,201 | | | | 1,219,614 | |
| Total | | | | | | | | | | | 1,470,190 | |
| | | | | | | | | | | | | |
| Oil Field Equipment & Services 0.31% | | | | | | | | | | | | |
| Schlumberger SA (France)†(a) | | 2.65% | | 1/15/2016 | | | 1,300 | | | | 1,300,576 | |
| Weatherford International Ltd. | | 5.50% | | 2/15/2016 | | | 175 | | | | 174,344 | |
| Total | | | | | | | | | | | 1,474,920 | |
| | | | | | | | | | | | | |
| Oil Refining & Marketing 0.05% | | | | | | | | | | | | |
| Marathon Petroleum Corp. | | 3.50% | | 3/1/2016 | | | 250 | | | | 250,714 | |
| 50 | See Notes to Financial Statements. | |
Schedule of Investments (continued)
EMERGING MARKETS CURRENCY FUND December 31, 2015
| Investments | | Interest
Rate | | Maturity
Date | | Principal
Amount
(000) | | | Fair
Value | |
| Real Estate Investment Trusts 0.72% | | | | | | | | | | | | |
| BioMed Realty LP | | 3.85% | | 4/15/2016 | | $ | 1,100 | | | $ | 1,103,448 | |
| Brandywine Operating Partnership LP | | 6.00% | | 4/1/2016 | | | 250 | | | | 252,552 | |
| DDR Corp. | | 9.625% | | 3/15/2016 | | | 250 | | | | 253,916 | |
| First Industrial LP | | 5.75% | | 1/15/2016 | | | 812 | | | | 812,760 | |
| Liberty Property LP | | 5.50% | | 12/15/2016 | | | 500 | | | | 516,537 | |
| Welltower, Inc. | | 6.20% | | 6/1/2016 | | | 501 | | | | 510,776 | |
| Total | | | | | | | | | | | 3,449,989 | |
| | | | | | | | | | | | | |
| Technology Hardware & Equipment 0.60% | | | | | | | | | | | | |
| Juniper Networks, Inc. | | 3.10% | | 3/15/2016 | | | 1,750 | | | | 1,755,674 | |
| Pitney Bowes, Inc. | | 4.75% | | 1/15/2016 | | | 250 | | | | 250,235 | |
| Xerox Corp. | | 6.40% | | 3/15/2016 | | | 500 | | | | 504,631 | |
| Xerox Corp. | | 7.20% | | 4/1/2016 | | | 350 | | | | 354,544 | |
| Total | | | | | | | | | | | 2,865,084 | |
| | | | | | | | | | | | | |
| Telecommunications: Wireline Integrated & Services 0.05% | | | | | | | | | | | | |
| Qwest Corp. | | 8.375% | | 5/1/2016 | | | 230 | | | | 233,738 | |
| | | | | | | | | | | | | |
| Trucking & Delivery 0.82% | | | | | | | | | | | | |
| Penske Truck Leasing Co. LP/PTL Finance Corp.† | | 2.50% | | 3/15/2016 | | | 1,350 | | | | 1,352,400 | |
| Ryder System, Inc. | | 5.85% | | 11/1/2016 | | | 2,475 | | | | 2,566,075 | |
| Total | | | | | | | | | | | 3,918,475 | |
| Total Corporate Bonds (cost $33,525,806) | | | | | | | | | | | 33,498,262 | |
| | | | | | | | | | | | | |
| MUNICIPAL BONDS 0.17% | | | | | | | | | | | | |
| | | | | | | | | | | | | |
| Nursing Home | | | | | | | | | | | | |
| IL St | | 4.961% | | 3/1/2016 | | | 260 | | | | 261,609 | |
| New Jersey Econ Dev Auth | Zero Coupon | | 2/15/2016 | | | 550 | | | | 549,236 | |
| Total Municipal Bonds (cost $810,844) | | | | | | | | | | | 810,845 | |
| Total Short-Term Investments (cost $38,081,404) | | | | | | | | | | | 38,055,719 | |
| Total Investments in Securities 97.12% (cost $469,393,455) | | | | | | | | | | | 464,684,941 | |
| Cash, Foreign Cash and Other Assets in Excess of Liabilities(d) 2.88% | | | | | | | | | | | 13,762,593 | |
| Net Assets 100.00% | | | | | | | | | | $ | 478,447,534 | |
| | See Notes to Financial Statements. | 51 |
Schedule of Investments (continued)
EMERGING MARKETS CURRENCY FUND December 31, 2015
| IO | Interest Only. |
| † | Security was purchased pursuant to Rule 144A under the Securities Act of 1933 and, unless registered under such Act or exempted from registration, may only be resold to qualified institutional buyers. |
| # | Variable rate security. The interest rate represents the rate in effect at December 31, 2015. |
| (a) | Foreign security traded in U.S. dollars. |
| (b) | Security has been fully or partially segregated to cover margin requirements for open futures contracts as of December 31, 2015. |
| (c) | Floating Rate Loans in which the Fund invests generally pay interest at rates which are periodically re-determined at a margin above the London Interbank Offered Rate (“LIBOR”) or the prime rate offered by major U.S. banks. The rate shown is the rate in effect at December 31, 2015. |
| (d) | Cash, Foreign Cash and Other Assets in Excess of Liabilities include net unrealized appreciation/depreciation on forward foreign currency exchange contracts, futures contracts and swaps as follows: |
Open Forward Foreign Currency Exchange Contracts at December 31, 2015:
| Forward | | | | | | | | | | | | | | | | | | | |
| Foreign | | | | | | | | | | | U.S. $ | | | | | | | | |
| Currency | | | | | | | | | | | Cost on | | | U.S. $ | | | | | |
| Exchange | | Transaction | | | | Expiration | | Foreign | | | Origination | | | Current | | | | Unrealized | |
| Contracts | | Type | | Counterparty | | Date | | Currency | | | Date | | | Value | | | | Appreciation | |
| Argentine peso | | Buy | | Bank of America | | 3/10/2016 | | | 55,524,000 | | | $ | 3,713,980 | | | $ | 4,026,336 | | | | $ | 312,356 | |
| Argentine peso | | Buy | | Bank of America | | 3/17/2016 | | | 221,526,000 | | | | 14,967,973 | | | | 15,966,195 | | | | | 998,222 | |
| Argentine peso | | Buy | | J.P. Morgan | | 3/2/2016 | | | 56,806,000 | | | | 3,714,024 | | | | 4,150,586 | | | | | 436,562 | |
| Argentine peso | | Buy | | J.P. Morgan | | 3/2/2016 | | | 111,531,000 | | | | 7,427,972 | | | | 8,149,123 | | | | | 721,151 | |
| Argentine peso | | Buy | | J.P. Morgan | | 3/10/2016 | | | 112,839,000 | | | | 7,428,017 | | | | 8,182,546 | | | | | 754,529 | |
| Colombian peso | | Buy | | J.P. Morgan | | 3/10/2016 | | | 479,000,000 | | | | 143,365 | | | | 149,842 | | | | | 6,477 | |
| Colombian peso | | Buy | | J.P. Morgan | | 3/10/2016 | | | 16,200,000,000 | | | | 4,892,486 | | | | 5,067,734 | | | | | 175,248 | |
| euro | | Buy | | J.P. Morgan | | 1/13/2016 | | | 365,000 | | | | 386,443 | | | | 396,746 | | | | | 10,303 | |
| Hungarian forint | | Buy | | Citibank N.A. | | 2/12/2016 | | | 111,200,000 | | | | 382,543 | | | | 382,891 | | | | | 348 | |
| Hungarian forint | | Buy | | Deutsche Bank AG | | 2/12/2016 | | | 113,790,000 | | | | 387,463 | | | | 391,809 | | | | | 4,346 | |
| Hungarian forint | | Buy | | Morgan Stanley | | 2/12/2016 | | | 6,050,000,000 | | | | 20,749,969 | | | | 20,831,742 | | | | | 81,773 | |
| Indian rupee | | Buy | | Bank of America | | 2/12/2016 | | | 146,200,000 | | | | 2,167,114 | | | | 2,196,994 | | | | | 29,880 | |
| Indian rupee | | Buy | | Bank of America | | 3/10/2016 | | | 799,450,000 | | | | 11,820,937 | | | | 11,966,702 | | | | | 145,765 | |
| Indian rupee | | Buy | | UBS AG | | 2/12/2016 | | | 22,725,000 | | | | 337,695 | | | | 341,496 | | | | | 3,801 | |
| Indonesian rupiah | | Buy | | Deutsche Bank AG | | 3/10/2016 | | | 260,100,000,000 | | | | 18,388,123 | | | | 18,420,770 | | | | | 32,647 | |
| Indonesian rupiah | | Buy | | J.P. Morgan | | 1/13/2016 | | | 7,500,000,000 | | | | 527,018 | | | | 542,265 | | | | | 15,247 | |
| Indonesian rupiah | | Buy | | J.P. Morgan | | 2/12/2016 | | | 264,000,000,000 | | | | 18,670,438 | | | | 18,847,610 | | | | | 177,172 | |
| Indonesian rupiah | | Buy | | J.P. Morgan | | 3/10/2016 | | | 4,050,000,000 | | | | 286,543 | | | | 286,829 | | | | | 286 | |
| Indonesian rupiah | | Buy | | State Street Bank and Trust | | 2/12/2016 | | | 6,805,000,000 | | | | 483,310 | | | | 485,826 | | | | | 2,516 | |
| Malaysian ringgit | | Buy | | J.P. Morgan | | 1/13/2016 | | | 23,000,000 | | | | 5,175,168 | | | | 5,330,192 | | | | | 155,024 | |
| Philippine peso | | Buy | | Barclays Bank plc | | 2/12/2016 | | | 592,000,000 | | | | 12,446,911 | | | | 12,570,566 | | | | | 123,655 | |
| Philippine peso | | Buy | | Barclays Bank plc | | 2/12/2016 | | | 243,100,000 | | | | 5,113,481 | | | | 5,162,001 | | | | | 48,520 | |
| Philippine peso | | Buy | | J.P. Morgan | | 3/10/2016 | | | 18,230,000 | | | | 381,229 | | | | 385,957 | | | | | 4,728 | |
| Philippine peso | | Buy | | Morgan Stanley | | 3/10/2016 | | | 9,150,000 | | | | 190,951 | | | | 193,719 | | | | | 2,768 | |
| Philippine peso | | Buy | | State Street Bank and Trust | | 3/10/2016 | | | 372,000,000 | | | | 7,844,791 | | | | 7,875,812 | | | | | 31,021 | |
| 52 | See Notes to Financial Statements. | |
Schedule of Investments (continued)
EMERGING MARKETS CURRENCY FUND December 31, 2015
Open Forward Foreign Currency Exchange Contracts at December 31, 2015: (continued)
| Forward | | | | | | | | | | | | | | | | | | |
| Foreign | | | | | | | | | | | U.S. $ | | | | | | | |
| Currency | | | | | | | | | | | Cost on | | | U.S. $ | | | | |
| Exchange | | Transaction | | | | Expiration | | Foreign | | | Origination | | | Current | | | Unrealized | |
| Contracts | | Type | | Counterparty | | Date | | Currency | | | Date | | | Value | | | Appreciation | |
| Philippine peso | | Buy | | UBS AG | | 2/12/2016 | | | 18,400,000 | | | $ | 388,036 | | | $ | 390,707 | | | | $ | 2,671 | |
| Polish zloty | | Buy | | Bank of America | | 2/12/2016 | | | 59,000,000 | | | | 14,886,021 | | | | 15,028,325 | | | | 142,304 | |
| Polish zloty | | Buy | | Bank of America | | 3/10/2016 | | | 2,375,000 | | | | 594,836 | | | | 604,695 | | | | 9,859 | |
| Polish zloty | | Buy | | Deutsche Bank AG | | 2/12/2016 | | | 1,565,000 | | | | 387,620 | | | | 398,633 | | | | 11,013 | |
| Polish zloty | | Buy | | Morgan Stanley | | 3/10/2016 | | | 1,900,000 | | | | 482,045 | | | | 483,756 | | | | 1,711 | |
| Polish zloty | | Buy | | UBS AG | | 3/10/2016 | | | 760,000 | | | | 192,417 | | | | 193,502 | | | | 1,085 | |
| Romanian new leu | | Buy | | Goldman Sachs | | 1/13/2016 | | | 1,020,000 | | | | 242,086 | | | | 245,304 | | | | 3,218 | |
| Romanian new leu | | Buy | | State Street Bank and Trust | | 1/13/2016 | | | 39,980,000 | | | | 9,507,729 | | | | 9,614,956 | | | | 107,227 | |
| South Korean won | | Buy | | Morgan Stanley | | 3/10/2016 | | | 170,500,000 | | | | 143,261 | | | | 144,848 | | | | 1,587 | |
| South Korean won | | Buy | | Morgan Stanley | | 3/10/2016 | | | 395,000,000 | | | | 334,003 | | | | 335,571 | | | | 1,568 | |
| Thai baht | | Buy | | Bank of America | | 1/13/2016 | | | 275,000,000 | | | | 7,630,411 | | | | 7,640,296 | | | | 9,885 | |
| Thai baht | | Buy | | J.P. Morgan | | 2/12/2016 | | | 200,500,000 | | | | 5,546,028 | | | | 5,566,242 | | | | 20,214 | |
| Thai baht | | Buy | | J.P. Morgan | | 3/10/2016 | | | 491,350,000 | | | | 13,624,201 | | | | 13,631,982 | | | | 7,781 | |
| Thai baht | | Buy | | State Street Bank and Trust | | 3/10/2016 | | | 10,400,000 | | | | 286,304 | | | | 288,537 | | | | 2,233 | |
| Turkish lira | | Buy | | Barclays Bank plc | | 3/10/2016 | | | 700,000 | | | | 235,012 | | | | 235,558 | | | | 546 | |
| Turkish lira | | Buy | | Citibank N.A. | | 3/10/2016 | | | 4,900,000 | | | | 1,640,400 | | | | 1,648,906 | | | | 8,506 | |
| Turkish lira | | Buy | | Deutsche Bank AG | | 1/13/2016 | | | 11,200,000 | | | | 3,747,905 | | | | 3,830,389 | | | | 82,484 | |
| Turkish lira | | Buy | | Deutsche Bank AG | | 2/12/2016 | | | 32,550,000 | | | | 10,869,355 | | | | 11,036,927 | | | | 167,572 | |
| Turkish lira | | Buy | | J.P. Morgan | | 3/10/2016 | | | 14,470,000 | | | | 4,842,863 | | | | 4,869,322 | | | | 26,459 | |
| Turkish lira | | Buy | | Morgan Stanley | | 1/13/2016 | | | 15,850,000 | | | | 5,325,735 | | | | 5,420,684 | | | | 94,949 | |
| Turkish lira | | Buy | | Morgan Stanley | | 2/12/2016 | | | 30,430,000 | | | | 10,157,554 | | | | 10,318,086 | | | | 160,532 | |
| Brazilian real | | Sell | | Goldman Sachs | | 1/13/2016 | | | 18,450,000 | | | | 4,852,859 | | | | 4,650,728 | | | | 202,131 | |
| euro | | Sell | | Barclays Bank plc | | 1/13/2016 | | | 4,730,000 | | | | 5,213,542 | | | | 5,141,397 | | | | 72,145 | |
| Hungarian forint | | Sell | | Citibank N.A. | | 1/13/2016 | | | 137,000,000 | | | | 478,239 | | | | 472,067 | | | | 6,172 | |
| Hungarian forint | | Sell | | Deutsche Bank AG | | 1/13/2016 | | | 138,300,000 | | | | 477,622 | | | | 476,546 | | | | 1,076 | |
| Indonesian rupiah | | Sell | | Morgan Stanley | | 1/13/2016 | | | 7,500,000,000 | | | | 546,082 | | | | 542,265 | | | | 3,817 | |
| Indonesian rupiah | | Sell | | State Street Bank and Trust | | 2/12/2016 | | | 49,770,000,000 | | | | 3,603,910 | | | | 3,553,203 | | | | 50,707 | |
| Malaysian ringgit | | Sell | | J.P. Morgan | | 1/13/2016 | | | 46,400,000 | | | | 10,874,150 | | | | 10,753,083 | | | | 121,067 | |
| Polish zloty | | Sell | | Goldman Sachs | | 1/13/2016 | | | 930,000 | | | | 240,342 | | | | 237,048 | | | | 3,294 | |
| Romanian new leu | | Sell | | J.P. Morgan | | 1/13/2016 | | | 41,000,000 | | | | 10,462,547 | | | | 9,860,260 | | | | 602,287 | |
| South African rand | | Sell | | Morgan Stanley | | 1/13/2016 | | | 4,400,000 | | | | 289,070 | | | | 284,120 | | | | 4,950 | |
| South Korean won | | Sell | | UBS AG | | 2/12/2016 | | | 281,000,000 | | | | 239,683 | | | | 238,858 | | | | 825 | |
| Taiwan dollar | | Sell | | J.P. Morgan | | 3/10/2016 | | | 354,300,000 | | | | 10,768,997 | | | | 10,741,083 | | | | | 27,914 | |
| Unrealized Appreciation on Forward Foreign Currency Exchange Contracts | | | | | | | | | | | $ | 6,234,134 | |
| | See Notes to Financial Statements. | 53 |
Schedule of Investments (continued)
EMERGING MARKETS CURRENCY FUND December 31, 2015
Open Forward Foreign Currency Exchange Contracts at December 31, 2015: (continued)
| Forward | | | | | | | | | | | | | | | | | | | | |
| Foreign | | | | | | | | | | | | U.S. $ | | | | | | | | |
| Currency | | | | | | | | | | | | Cost on | | U.S. $ | | | | | | |
| Exchange | | Transaction | | | | Expiration | | | Foreign | | | Origination | | Current | | | Unrealized | |
| Contracts | | Type | | Counterparty | | Date | | | Currency | | | Date | | Value | | | Depreciation | |
| Brazilian real | | Buy | | Goldman Sachs | | 2/12/2016 | | | 53,230,000 | | | $ | 13,639,396 | | | $ | 13,283,156 | | | | $ | (356,240) | |
| Brazilian real | | Buy | | Goldman Sachs | | 3/10/2016 | | | 3,710,000 | | | | 959,954 | | | | 918,777 | | | | | (41,177) | |
| Brazilian real | | Buy | | Morgan Stanley | | 1/13/2016 | | | 53,500,000 | | | | 13,491,363 | | | | 13,485,851 | | | | | (5,512) | |
| Brazilian real | | Buy | | State Street Bank and Trust | | 2/12/2016 | | | 3,440,000 | | | | 872,100 | | | | 858,427 | | | | | (13,673) | |
| Chilean peso | | Buy | | J.P. Morgan | | 3/10/2016 | | | 9,514,000,000 | | | | 13,416,061 | | | | 13,327,962 | | | | | (88,099) | |
| Chilean peso | | Buy | | J.P. Morgan | | 3/10/2016 | | | 3,370,000,000 | | | | 4,785,233 | | | | 4,720,962 | | | | | (64,271) | |
| Chilean peso | | Buy | | Morgan Stanley | | 3/10/2016 | | | 9,514,000,000 | | | | 13,417,007 | | | | 13,327,962 | | | | | (89,045) | |
| Colombian peso | | Buy | | Bank of America | | 2/12/2016 | | | 55,385,000,000 | | | | 19,217,557 | | | | 17,378,685 | | | | | (1,838,872) | |
| Colombian peso | | Buy | | J.P. Morgan | | 3/10/2016 | | | 38,400,000,000 | | | | 12,054,131 | | | | 12,012,407 | | | | | (41,724) | |
| Hungarian forint | | Buy | | Morgan Stanley | | 1/13/2016 | | | 4,250,000,000 | | | | 15,386,843 | | | | 14,644,406 | | | | | (742,437) | |
| Hungarian forint | | Buy | | Morgan Stanley | | 2/12/2016 | | | 82,600,000 | | | | 285,995 | | | | 284,414 | | | | | (1,581) | |
| Indian rupee | | Buy | | Morgan Stanley | | 2/12/2016 | | | 1,848,000,000 | | | | 27,810,384 | | | | 27,770,480 | | | | | (39,904) | |
| Mexican peso | | Buy | | Deutsche Bank AG | | 3/10/2016 | | | 82,100,000 | | | | 4,796,093 | | | | 4,741,780 | | | | | (54,313) | |
| Mexican peso | | Buy | | J.P. Morgan | | 1/13/2016 | | | 26,656,000 | | | | 1,600,343 | | | | 1,545,752 | | | | | (54,591) | |
| Mexican peso | | Buy | | J.P. Morgan | | 2/12/2016 | | | 578,000,000 | | | | 34,094,160 | | | | 33,446,246 | | | | | (647,914) | |
| Philippine peso | | Buy | | J.P. Morgan | | 1/13/2016 | | | 330,000,000 | | | | 7,128,970 | | | | 7,031,625 | | | | | (97,345) | |
| Polish zloty | | Buy | | Barclays Bank plc | | 1/13/2016 | | | 66,100,000 | | | | 17,584,791 | | | | 16,848,244 | | | | | (736,547) | |
| Russian ruble | | Buy | | Barclays Bank plc | | 3/10/2016 | | | 17,300,000 | | | | 239,125 | | | | 233,418 | | | | | (5,707) | |
| Russian ruble | | Buy | | J.P. Morgan | | 1/13/2016 | | | 665,000,000 | | | | 10,424,014 | | | | 9,107,092 | | | | | (1,316,922) | |
| Russian ruble | | Buy | | J.P. Morgan | | 2/12/2016 | | | 212,100,000 | | | | 3,195,721 | | | | 2,880,991 | | | | | (314,730) | |
| Russian ruble | | Buy | | J.P. Morgan | | 3/10/2016 | | | 1,257,000,000 | | | | 17,715,453 | | | | 16,959,882 | | | | | (755,571) | |
| Russian ruble | | Buy | | Morgan Stanley | | 2/12/2016 | | | 450,000,000 | | | | 6,767,935 | | | | 6,112,428 | | | | | (655,507) | |
| Singapore dollar | | Buy | | State Street Bank and Trust | | 2/12/2016 | | | 1,020,000 | | | | 721,559 | | | | 718,450 | | | | | (3,109) | |
| South African rand | | Buy | | Bank of America | | 2/12/2016 | | | 81,550,000 | | | | 5,604,657 | | | | 5,236,830 | | | | | (367,827) | |
| South African rand | | Buy | | Deutsche Bank AG | | 1/13/2016 | | | 148,000,000 | | | | 10,843,529 | | | | 9,556,763 | | | | | (1,286,766) | |
| South African rand | | Buy | | Deutsche Bank AG | | 3/10/2016 | | | 204,660,000 | | | | 13,778,292 | | | | 13,077,074 | | | | | (701,218) | |
| South African rand | | Buy | | J.P. Morgan | | 2/12/2016 | | | 7,080,000 | | | | 482,975 | | | | 454,651 | | | | | (28,324) | |
| South African rand | | Buy | | UBS AG | | 3/10/2016 | | | 5,100,000 | | | | 334,559 | | | | 325,872 | | | | | (8,687) | |
| South Korean won | | Buy | | Bank of America | | 2/12/2016 | | | 14,800,000,000 | | | | 12,800,886 | | | | 12,580,427 | | | | | (220,459) | |
| South Korean won | | Buy | | Bank of America | | 3/10/2016 | | | 12,700,000,000 | | | | 10,875,243 | | | | 10,789,259 | | | | | (85,984) | |
| South Korean won | | Buy | | Barclays Bank plc | | 3/10/2016 | | | 11,035,000,000 | | | | 9,391,489 | | | | 9,374,762 | | | | | (16,727) | |
| Thai baht | | Buy | | J.P. Morgan | | 3/10/2016 | | | 392,300,000 | | | | 10,900,250 | | | | 10,883,946 | | | | | (16,304) | |
| Argentine peso | | Sell | | Bank of America | | 3/17/2016 | | | 34,800,000 | | | | 2,383,562 | | | | 2,508,164 | | | | | (124,602) | |
| Argentine peso | | Sell | | Bank of America | | 3/17/2016 | | | 36,500,000 | | | | 2,385,621 | | | | 2,630,690 | | | | | (245,069) | |
| Australian dollar | | Sell | | Standard Chartered Bank | | 3/10/2016 | | | 6,690,000 | | | | 4,839,961 | | | | 4,859,377 | | | | | (19,416) | |
| 54 | See Notes to Financial Statements. | |
Schedule of Investments (continued)
EMERGING MARKETS CURRENCY FUND December 31, 2015
Open Forward Foreign Currency Exchange Contracts at December 31, 2015: (concluded)
| Forward | | | | | | | | | | | | | | | | | | | | | |
| Foreign | | | | | | | | | | | | U.S. $ | | | | | | | | | |
| Currency | | | | | | | | | | | | Cost on | | | U.S. $ | | | | | | |
| Exchange | | Transaction | | | | Expiration | | | Foreign | | | Origination | | | Current | | | Unrealized | |
| Contracts | | Type | | Counterparty | | Date | | | Currency | | | Date | | | Value | | | Depreciation | |
| Hungarian forint | | Sell | | Deutsche Bank AG | | 1/13/2016 | | | 667,000,000 | | | $ | 2,283,863 | | | $ | 2,298,310 | | | | $ | (14,447 | ) |
| Hungarian forint | | Sell | | Morgan Stanley | | 1/13/2016 | | | 84,500,000 | | | | 287,150 | | | | 291,165 | | | | | (4,015 | ) |
| Indian rupee | | Sell | | Morgan Stanley | | 2/12/2016 | | | 22,600,000 | | | | 335,371 | | | | 339,617 | | | | | (4,246 | ) |
| Malaysian ringgit | | Sell | | Bank of America | | 1/13/2016 | | | 1,900,000 | | | | 431,243 | | | | 440,320 | | | | | (9,077 | ) |
| Polish zloty | | Sell | | Morgan Stanley | | 1/13/2016 | | | 2,470,000 | | | | 622,398 | | | | 629,579 | | | | | (7,181 | ) |
| Singapore dollar | | Sell | | State Street Bank and Trust | | 2/12/2016 | | | 11,100,000 | | | | 7,764,247 | | | | 7,818,424 | | | | | (54,177 | ) |
| Thai baht | | Sell | | UBS AG | | 1/13/2016 | | | 12,100,000 | | | | 335,489 | | | | 336,173 | | | | | (684 | ) |
| Unrealized Depreciation on Forward Foreign Currency Exchange Contracts | | | | | | | | | | | | | $ | (11,180,001 | ) |
Open Futures Contracts at December 31, 2015:
| Type | | Expiration | | Contracts | | Position | | Fair Value | | | Unrealized Appreciation | |
| U.S. 2-Year Treasury Note | | March 2016 | | 275 | | Short | | $ | (59,739,453 | ) | | | $ | 81,170 | |
| U.S. 5-Year Treasury Note | | March 2016 | | 622 | | Short | | | (73,595,235 | ) | | | | 173,843 | |
| U.S. 10-Year Treasury Note | | March 2016 | | 72 | | Short | | | (9,065,250 | ) | | | | 31,936 | |
| Totals | | | | | | | | $ | (142,399,938 | ) | | | $ | 286,949 | |
| | See Notes to Financial Statements. | 55 |
Schedule of Investments (continued)
EMERGING MARKETS CURRENCY FUND December 31, 2015
Credit Default Swaps on Indexes – Sell Protection at December 31, 2015(1):
| | | | | | | | | | | | | | | | | | Credit | |
| | | | | | | | | | | | | | | | | | Default | |
| | | | | | | | | | | | | | | | | | Swap | |
| | | | | | | Original | | Current | | | | | | | | | Agreements | |
| Referenced | | Fund | | Termination | | Notional | | Notional | | Fair | | Payments | | | Unrealized | | Payable at | |
| Index* | | Receives | | Date | | Amount | | Amount | | Value(2) | | Upfront(3) | | | Appreciation(4) | | Fair Value(5) | |
| Markit CMBX. | | | | | | | | | | | | | | | | | | | | | | | | |
| NA.AAA.2(6) | | .07% | | 3/15/2049 | | $ | 500,000 | | $ | 344,348 | | $ | 499,775 | | $ | (11,468 | ) | | $ | 11,243 | | $ | (225 | ) |
| Markit CMBX. | | | | | | | | | | | | | | | | | | | | | | | | |
| NA.AAA.3(6) | | .08% | | 12/13/2049 | | | 1,000,000 | | | 905,718 | | | 997,050 | | | (33,317 | ) | | | 30,367 | | | (2,950 | ) |
| Markit CMBX. | | | | | | | | | | | | | | | | | | | | | | | | |
| NA.AAA.2(7) | | .07% | | 3/15/2049 | | | 500,000 | | | 344,348 | | | 499,775 | | | (13,183 | ) | | | 12,958 | | | (225 | ) |
| Markit CMBX. | | | | | | | | | | | | | | | | | | | | | | | | |
| NA.AAA.2(8) | | .07% | | 3/15/2049 | | | 1,300,000 | | | 895,306 | | | 1,299,415 | | | (65,869 | ) | | | 65,284 | | | (585 | ) |
| | | | | | | | | | | | | | | | $ | (123,837 | ) | | $ | 119,852 | | $ | (3,985 | ) |
| (1) | If the Fund is a seller of protection and a credit event occurs, as defined under the terms of that particular swap agreement, the Fund will either (i) pay to the buyer of protection an amount equal to the notional amount of the swap and take delivery of the referenced obligation or underlying securities comprising the referenced index or (ii) pay a net settlement amount in the form of cash or securities equal to the notional amount of the swap less the recovery value of the referenced obligation or underlying securities. |
| (2) | Fair value serves as the indicator of the current status of payment/performance risk. |
| (3) | Upfront payments received are presented net of amortization (See Note 2(n)). |
| (4) | Total unrealized appreciation on Credit Default Swaps on Indexes amounted to $119,852. Total unrealized depreciation on Credit Default Swaps on Indexes amounted to $0. |
| (5) | Includes upfront payments received. |
| (6) | Swap Counterparty: Credit Suisse. |
| (7) | Swap Counterparty: Morgan Stanley. |
| (8) | Swap Counterparty: UBS AG. |
| * | The Referenced Index is for Credit Default Swaps on Indexes, which is comprised of a basket of commercial mortgage-backed securities. (See Note 2(n)). |
Centrally Cleared Interest Rate Swap Contracts at December 31, 2015:
| Periodic | | Periodic | | | | | | | | | | | | | |
| Payments | | Payments | | | | | | | | | | | | | |
| to be Made | | to be Received | | Central | | Termination | | Notional | | | Fair | | | Unrealized | |
| By The Fund | | By The Fund | | Clearinghouse | | Date | | Amount | | | Value | | | Depreciation | |
| 0.539% | | 3-Month LIBOR Index | | Credit Suisse | | 1/10/2016 | | | $13,000,000 | | | | $12,999,332 | | | | $ | (668 | ) |
| 0.7825% | | 3-Month LIBOR Index | | Credit Suisse | | 10/6/2016 | | | 23,000,000 | | | | 22,999,577 | | | | | (423 | ) |
| Total | | | | | | | | | | | | | | | | | $ | (1,091 | ) |
| 56 | See Notes to Financial Statements. | |
Schedule of Investments (continued)
EMERGING MARKETS CURRENCY FUND December 31, 2015
The following is a summary of the inputs used as of December 31, 2015 in valuing the Fund’s investments carried at fair value(1):
| Investment Type(2)(3) | | Level 1 | | | Level 2 | | | Level 3 | | | Total | |
| Asset-Backed Securities | | | | | | | | | | | | | | | | |
| Other | | $ | – | | | $ | 27,851317 | | | $ | 2,478,084 | (4)(6) | | $ | 30,329,401 | |
| Remaining Industries | | | – | | | | 41,199,166 | | | | – | | | | 41,199,166 | |
| Corporate Bonds | | | – | | | | 185,656,838 | | | | – | | | | 185,656,838 | |
| Floating Rate Loans(5) | | | | | | | | | | | | | | | | |
| Advertising | | | – | | | | 1,846,143 | | | | – | | | | 1,846,143 | |
| Aerospace/Defense | | | – | | | | 1,996,250 | | | | – | | | | 1,996,250 | |
| Air Transportation | | | – | | | | 2,100,341 | | | | – | | | | 2,100,341 | |
| Cable & Satellite Television | | | – | | | | 2,677,438 | | | | – | | | | 2,677,438 | |
| Consumer/Commercial/Lease Financing | | | – | | | | 401,755 | | | | – | | | | 401,755 | |
| Electronics | | | – | | | | 4,251,982 | | | | – | | | | 4,251,982 | |
| Food: Wholesale | | | – | | | | 637,246 | | | | – | | | | 637,246 | |
| Gaming | | | – | | | | 4,533,605 | | | | – | | | | 4,533,605 | |
| Media: Content | | | – | | | | 2,337,902 | | | | – | | | | 2,337,902 | |
| Medical Products | | | – | | | | 1,582,236 | | | | – | | | | 1,582,236 | |
| Pharmaceuticals | | | – | | | | 2,131,570 | | | | 103,319 | | | | 2,234,889 | |
| Technology Hardware & Equipment | | | – | | | | 519,201 | | | | – | | | | 519,201 | |
| Telecommunications: Wireless | | | – | | | | 1,027,530 | | | | – | | | | 1,027,530 | |
| Telecommunications: Wireline Integrated & Services | | | – | | | | – | | | | 1,997,500 | | | | 1,997,500 | |
| Theaters & Entertainment | | | – | | | | 3,477,577 | | | | – | | | | 3,477,577 | |
| Foreign Government Obligation | | | – | | | | 143,750 | | | | – | | | | 143,750 | |
Government Sponsored Enterprises
Collateralized Mortgage Obligations | | | – | | | | 10,740,523 | | | | 202,753 | (4) | | | 10,943,276 | |
| Government Sponsored Enterprises Pass-Throughs | | | – | | | | 21,705,901 | | | | – | | | | 21,705,901 | |
| Municipal Bonds | | | – | | | | 3,692,731 | | | | – | | | | 3,692,731 | |
| Non-Agency Commercial Mortgage-Backed Securities | | | – | | | | 115,618,939 | | | | 5,621,235 | (4)(7) | | | 121,240,174 | |
| U.S. Treasury Obligations | | | – | | | | 14,405,497 | | | | – | | | | 14,405,497 | |
| Commercial Paper | | | – | | | | 3,746,612 | | | | – | | | | 3,746,612 | |
| Total | | $ | – | | | $ | 454,282,050 | | | $ | 10,402,891 | | | $ | 464,684,941 | |
| | See Notes to Financial Statements. | 57 |
Schedule of Investments (concluded)
EMERGING MARKETS CURRENCY FUND December 31, 2015
| Other Financial Instruments | | Level 1 | | | Level 2 | | | Level 3 | | | Total | |
| Credit Default Swaps | | | | | | | | | | | | | | | | |
| Assets | | $ | – | | | $ | – | | | $ | – | | | $ | – | |
| Liabilities | | | – | | | | (3,985 | ) | | | – | | | | (3,985 | ) |
| Forward Foreign Currency Exchange Contracts | | | | | | | | | | | | | | | | |
| Assets | | | – | | | | 6,234,134 | | | | – | | | | 6,234,134 | |
| Liabilities | | | – | | | | (11,180,001 | ) | | | – | | | | (11,180,001 | ) |
| Futures Contracts | | | | | | | | | | | | | | | | |
| Assets | | | 286,949 | | | | – | | | | – | | | | 286,949 | |
| Liabilities | | | – | | | | – | | | | – | | | | – | |
| Interest Rate Swaps | | | | | | | | | | | | | | | | |
| Assets | | | – | | | | – | | | | – | | | | – | |
| Liabilities | | | – | | | | (1,091 | ) | | | – | | | | (1,091 | ) |
| Total | | $ | 286,949 | | | $ | (4,950,943 | ) | | $ | – | | | $ | (4,663,994 | ) |
| (1) | Refer to Note 2(p) for a description of fair value measurements and the three-tier hierarchy of inputs. |
| (2) | See Schedule of Investments for fair values in each industry and identification of foreign issuers and/or geography. The table above is presented by Investment Type. Industries are presented within an Investment Type should such Investment Type include securities classified as two or more levels within the three-tier fair value hierarchy. |
| (3) | There were no Level 1/Level 2 transfers during the fiscal year ended December 31, 2015. |
| (4) | Includes securities valued utilizing third party pricing information without adjustment. Such valuations are based on unobservable inputs. A significant change in third party information could result in a significantly lower or higher value of such Level 3 investments. |
| (5) | Floating Rate Loans categorized as Level 3 are valued based on a single quotation obtained from a dealer. Accounting principles generally accepted in the United States of America do not require the Fund to create quantitative unobservable inputs that were not developed by the Fund. Therefore, the Fund does not have access to unobservable inputs and cannot disclose such inputs in the valuation. |
| (6) | Asset-Backed Securities categorized as Level 3 investment includes Diamond Resorts Owner Trust 2015-2A and H/2 Asset Funding 2014-1 Ltd. |
| (7) | Non-Agency Commercial Mortgage-Back Securities categorized as Level 3 investment includes A10 Bridge Asset Financing LLC 2015-AA A, Credit Suisse Mortgage Capital Certificates 2014-RS1 MRA, H/2 Asset Funding 2015-1A-AFL, H/2 Asset Funding 2015-1A-AFX, H/2 Asset Funding 2015-1A-BFX, JPMorgan Chase Commercial Mortgage Securities Trust 2015-UES XB IO and Prima Capital CRE Securization 2006-1. |
The following is a reconciliation of investments with unobservable inputs (Level 3) that were used in determining fair value:
| | | | | | | | | Government | | | | |
| | | | | | | | | Sponsored | | | Non-Agency | |
| | | | | | | | | Enterprises | | | Commercial | |
| | | | | | | | | Collateralized | | | Mortgage- | |
| | | Asset-Backed | | | Floating | | | Mortgage | | | Backed | |
| Investment Type | | Securities | | | Rate Loans | | | Obligations | | | Securities | |
| Balance as of January 1, 2015 | | $ | – | | | $ | 273,987 | | | $ | – | | | $ | – | |
| Accrued discounts/premiums | | | – | | | | (120 | ) | | | 93 | | | | (8,887 | ) |
| Realized gain (loss) | | | 6 | | | | (304 | ) | | | – | | | | 23,623 | |
| Change in unrealized appreciation/depreciation | | | 4 | | | | (1,422 | ) | | | 3,081 | | | | (64,001 | ) |
| Purchases | | | 484,860 | | | | 1,999,151 | | | | – | | | | 5,140,081 | |
| Sales | | | (19,984 | ) | | | (170,473 | ) | | | – | | | | (587,891 | ) |
| Net transfers in or out of Level 3 | | | 2,013,198 | | | | – | | | | 199,579 | | | | 1,118,310 | |
| Balance as of December 31, 2015 | | $ | 2,478,084 | | | $ | 2,100,819 | | | $ | 202,753 | | | $ | 5,621,235 | |
| 58 | See Notes to Financial Statements. | |
Schedule of Investments
EMERGING MARKETS LOCAL BOND FUND December 31, 2015
| Investments | | Interest
Rate | | Maturity
Date | | Principal
Amount
(000) | | | | Fair
Value | |
| FOREIGN CORPORATE BONDS(a) 10.38% | | | | | | | | | | | | |
| | | | | | | | | | | | | |
| Brazil 0.47% | | | | | | | | | | | | |
| | | | | | | | | | | | | |
| Banks: Regional | | | | | | | | | | | | |
| Banco do Brasil SA | | 9.75% | | 7/18/2017 | | BRL | 155 | | | $ | 35,652 | |
| | | | | | | | | | | | | |
| Colombia 1.04% | | | | | | | | | | | | |
| | | | | | | | | | | | | |
| Electric: Power | | | | | | | | | | | | |
| Empresas Publicas de Medellin ESP† | | 7.625% | | 9/10/2024 | | COP | 290,000 | | | | 79,058 | |
| | | | | | | | | | | | | |
| Luxembourg 1.48% | | | | | | | | | | | | |
| | | | | | | | | | | | | |
| Banks: Regional | | | | | | | | | | | | |
| Russian Agricultural Bank OJSC Via RSHB | | | | | | | | | | | | |
| Capital SA† | | 8.625% | | 2/17/2017 | | RUB | 3,300 | | | | 44,024 | |
| Sberbank of Russia Via SB Capital SA | | 7.00% | | 1/31/2016 | | RUB | 5,000 | | | | 68,370 | |
| Total | | | | | | | | | | | 112,394 | |
| | | | | | | | | | | | | |
| Mexico 4.12% | | | | | | | | | | | | |
| | | | | | | | | | | | | |
| Media 1.05% | | | | | | | | | | | | |
| Grupo Televisa SAB | | 8.49% | | 5/11/2037 | | MXN | 1,400 | | | | 79,884 | |
| | | | | | | | | | | | | |
| Oil 2.07% | | | | | | | | | | | | |
| Petroleos Mexicanos† | | 7.65% | | 11/24/2021 | | MXN | 2,750 | | | | 157,065 | |
| | | | | | | | | | | | | |
| Telecommunications 1.00% | | | | | | | | | | | | |
| America Movil SAB de CV | | 9.00% | | 1/15/2016 | | MXN | 1,300 | | | | 75,565 | |
| Total | | | | | | | | | | | 312,514 | |
| | | | | | | | | | | | | |
| South Africa 2.02% | | | | | | | | | | | | |
| | | | | | | | | | | | | |
| Electric: Power 1.32% | | | | | | | | | | | | |
| Eskom Holdings SOC Ltd. | | Zero Coupon | | 12/31/2018 | | ZAR | 800 | | | | 35,128 | |
| Eskom Holdings SOC Ltd. | | 9.25% | | 4/20/2018 | | ZAR | 1,000 | | | | 64,608 | |
| Total | | | | | | | | | | | 99,736 | |
| | | | | | | | | | | | | |
| Transportation: Miscellaneous 0.70% | | | | | | | | | | | | |
| Transnet SOC Ltd. | | 8.90% | | 11/14/2027 | | ZAR | 1,000 | | | | 53,411 | |
| Total | | | | | | | | | | | 153,147 | |
| | | | | | | | | | | | | |
| Turkey 1.25% | | | | | | | | | | | | |
| | | | | | | | | | | | | |
| Banks: Regional | | | | | | | | | | | | |
| Akbank TAS† | | 7.50% | | 2/5/2018 | | TRY | 305 | | | | 94,378 | |
| Total Foreign Corporate Bonds (cost $1,307,722) | | | | | | | | | | | 787,143 | |
| | See Notes to Financial Statements. | 59 |
Schedule of Investments (continued)
EMERGING MARKETS LOCAL BOND FUND December 31, 2015
| Investments | | Interest
Rate | | Maturity
Date | | Principal
Amount
(000) | | | | Fair
Value | |
| FOREIGN GOVERNMENT OBLIGATIONS(a) 81.63% | | | | | | | | | | | | |
| | | | | | | | | | | | | |
| Brazil 10.20% | | | | | | | | | | | | |
| Brazil Letras do Tesouro Nacional | | Zero Coupon | | 1/1/2016 | | BRL | 905 | | | $ | 228,752 | |
| Brazil Letras do Tesouro Nacional | | Zero Coupon | | 7/1/2018 | | BRL | 2,340 | | | | 403,971 | |
| Brazil Notas do Tesouro Nacional Series F | | 10.00% | | 1/1/2017 | | BRL | 215 | | | | 51,868 | |
| Brazil Notas do Tesouro Nacional Series F | | 10.00% | | 1/1/2021 | | BRL | 440 | | | | 88,808 | |
| Total | | | | | | | | | | | 773,399 | |
| | | | | | | | | | | | | |
| Colombia 4.61% | | | | | | | | | | | | |
| Colombian TES Series B | | 6.00% | | 4/28/2028 | | COP | 960,000 | | | | 238,183 | |
| Colombian TES Series B | | 10.00% | | 7/24/2024 | | COP | 320,000 | | | | 111,426 | |
| Total | | | | | | | | | | | 349,609 | |
| | | | | | | | | | | | | |
| Hungary 6.25% | | | | | | | | | | | | |
| Hungary Government Bond | | 5.50% | | 12/20/2018 | | HUF | 52,700 | | | | 197,915 | |
| Hungary Government Bond | | 6.00% | | 11/24/2023 | | HUF | 47,000 | | | | 191,846 | |
| Hungary Government Bond | | 7.50% | | 11/12/2020 | | HUF | 20,100 | | | | 84,293 | |
| Total | | | | | | | | | | | 474,054 | |
| | | | | | | | | | | | | |
| Indonesia 9.25% | | | | | | | | | | | | |
| Indonesia Treasury Bond | | 7.00% | | 5/15/2022 | | IDR | 2,260,000 | | | | 148,796 | |
| Indonesia Treasury Bond | | 8.375% | | 3/15/2024 | | IDR | 850,000 | | | | 60,183 | |
| Indonesia Treasury Bond | | 9.50% | | 7/15/2031 | | IDR | 4,589,000 | | | | 344,849 | |
| Indonesia Treasury Bond | | 10.00% | | 2/15/2028 | | IDR | 1,900,000 | | | | 147,376 | |
| Total | | | | | | | | | | | 701,204 | |
| | | | | | | | | | | | | |
| Malaysia 4.86% | | | | | | | | | | | | |
| Malaysia Government Bond | | 3.48% | | 3/15/2023 | | MYR | 370 | | | | 82,572 | |
| Malaysia Government Bond | | 3.844% | | 4/15/2033 | | MYR | 225 | | | | 47,301 | |
| Malaysia Government Bond | | 4.16% | | 7/15/2021 | | MYR | 1,010 | | | | 238,732 | |
| Total | | | | | | | | | | | 368,605 | |
| | | | | | | | | | | |
| Mexico 6.02% | | | | | | | | | | | | |
| Mexican Bonos | | 7.75% | | 5/29/2031 | | MXN | 1,200 | | | | 76,507 | |
| Mexican Bonos | | 7.75% | | 11/13/2042 | | MXN | 1,500 | | | | 95,328 | |
| Mexican Bonos | | 8.00% | | 12/7/2023 | | MXN | 3,300 | | | | 214,695 | |
| Mexican Bonos | | 8.50% | | 5/31/2029 | | MXN | 1,020 | | | | 69,345 | |
| Total | | | | | | | | | | | 455,875 | |
| 60 | See Notes to Financial Statements. |
Schedule of Investments (continued)
EMERGING MARKETS LOCAL BOND FUND December 31, 2015
| Investments | | Interest
Rate | | Maturity
Date | | Principal
Amount
(000) | | | | Fair
Value | |
| Peru 4.36% | | | | | | | | | | | | |
| Peru Government Bond | | 5.20% | | 9/12/2023 | | PEN | 1,125 | | | $ | 295,994 | |
| Peru Government Bond | | 6.85% | | 2/12/2042 | | PEN | 132 | | | | 34,661 | |
| Total | | | | | | | | | | | 330,655 | |
| | | | | | | | | | | | | |
| Philippines 3.43% | | | | | | | | | | | | |
| Republic of Philippines | | 4.95% | | 1/15/2021 | | PHP | 12,000 | | | | 259,738 | |
| | | | | | | | | | | | | |
| Poland 4.70% | | | | | | | | | | | | |
| Poland Government Bond | | 3.25% | | 7/25/2025 | | PLN | 365 | | | | 95,772 | |
| Poland Government Bond | | 5.25% | | 10/25/2020 | | PLN | 460 | | | | 133,392 | |
| Poland Government Bond | | 5.75% | | 9/23/2022 | | PLN | 418 | | | | 126,732 | |
| Total | | | | | | | | | | | 355,896 | |
| | | | | | | | | | | | | |
| Romania 3.94% | | | | | | | | | | | | |
| Romania Government Bond | | 4.75% | | 2/24/2025 | | RON | 430 | | | | 111,805 | |
| Romania Government Bond | | 5.85% | | 4/26/2023 | | RON | 670 | | | | 186,569 | |
| Total | | | | | | | | | | | 298,374 | |
| | | | | | | | | | | | | |
| Russia 4.25% | | | | | | | | | | | | |
| Russian Federal Bond—OFZ | | 7.50% | | 3/15/2018 | | RUB | 14,430 | | | | 189,962 | |
| Russian Federal Bond—OFZ | | 7.60% | | 4/14/2021 | | RUB | 6,785 | | | | 85,207 | |
| Russian Federal Bond—OFZ | | 8.15% | | 2/3/2027 | | RUB | 3,735 | | | | 47,110 | |
| Total | | | | | | | | | | | 322,279 | |
| | | | | | | | | | | | | |
| South Africa 8.64% | | | | | | | | | | | | |
| Republic of South Africa | | 6.25% | | 3/31/2036 | | ZAR | 3,753 | | | | 162,531 | |
| Republic of South Africa | | 7.00% | | 2/28/2031 | | ZAR | 1,925 | | | | 95,101 | |
| Republic of South Africa | | 7.25% | | 1/15/2020 | | ZAR | 2,330 | | | | 141,259 | |
| Republic of South Africa | | 10.50% | | 12/21/2026 | | ZAR | 3,740 | | | | 255,911 | |
| Total | | | | | | | | | | | 654,802 | |
| | | | | | | | | | | | | |
| Thailand 3.43% | | | | | | | | | | | | |
| Thailand Government Bond | | 3.58% | | 12/17/2027 | | THB | 4,820 | | | | 145,071 | |
| Thailand Government Bond | | 3.625% | | 6/16/2023 | | THB | 3,825 | | | | 115,113 | |
| Total | | | | | | | | | | | 260,184 | |
| | See Notes to Financial Statements. | 61 |
Schedule of Investments (continued)
EMERGING MARKETS LOCAL BOND FUND December 31, 2015
| Investments | | Interest
Rate | | Maturity
Date | | Principal
Amount
(000) | | | Fair
Value | |
| Turkey 7.69% | | | | | | | | | | | | |
| Turkey Government Bond | | 7.10% | | 3/8/2023 | | TRY | 435 | | | $ | 123,614 | |
| Turkey Government Bond | | 7.40% | | 2/5/2020 | | TRY | 695 | | | | 213,821 | |
| Turkey Government Bond | | 8.30% | | 6/20/2018 | | TRY | 750 | | | | 245,208 | |
| Total | | | | | | | | | | | 582,643 | |
| Total Foreign Government Obligations (cost $7,970,216) | | | | | | | | | | | 6,187,317 | |
| Total Investments in Securities 92.01% (cost $9,277,938) | | | | | | | | | | | 6,974,460 | |
| Cash, Foreign Cash and Other Assets in Excess of Liabilities(b) 7.99% | | | | | | | | | | | 605,692 | |
| Net Assets 100.00% | | | | | | | | | | $ | 7,580,152 | |
| BRL | | Brazilian real. |
| COP | | Colombian peso. |
| HUF | | Hungarian forint. |
| IDR | | Indonesian rupiah. |
| MXN | | Mexican peso. |
| MYR | | Malaysian ringgit. |
| PEN | | Peruvian nuevo sol. |
| PHP | | Philippine peso. |
| PLN | | Polish zloty. |
| RON | | Romanian new leu. |
| RUB | | Russian ruble. |
| THB | | Thai baht. |
| TRY | | Turkish lira. |
| ZAR | | South African rand. |
| † | | Security was purchased pursuant to Rule 144A under the Securities Act of 1933 and, unless registered under such Act or exempted from registration, may only be resold to qualified institutional buyers. |
| (a) | | Investment in non-U.S. dollar denominated securities. |
| (b) | | Cash, Foreign Cash and Other Assets in Excess of Liabilities include net unrealized appreciation/depreciation on forward foreign currency exchange contracts and futures contracts as follows: |
| 62 | See Notes to Financial Statements. |
Schedule of Investments (continued)
EMERGING MARKETS LOCAL BOND FUND December 31, 2015
Open Forward Foreign Currency Exchange Contracts at December 31, 2015:
Forward
Foreign
Currency
Exchange
Contracts | | Transaction
Type | | Counterparty | | Expiration
Date | | Foreign
Currency | | | U.S. $
Cost on
Origination
Date | | | U.S. $
Current
Value | | Unrealized
Appreciation | |
| Colombian peso | | Buy | | Morgan Stanley | | 3/22/2016 | | | 259,550,000 | | | $ | 78,239 | | | $ | 81,057 | | | $ | 2,818 | |
| Colombian peso | | Buy | | State Street Bank and Trust | | 3/22/2016 | | | 82,100,000 | | | | 24,546 | | | | 25,640 | | | | 1,094 | |
| Indian rupee | | Buy | | State Street Bank and Trust | | 3/21/2016 | | | 9,350,000 | | | | 137,959 | | | | 139,679 | | | | 1,720 | |
| Indonesian rupiah | | Buy | | UBS AG | | 3/21/2016 | | | 486,100,000 | | | | 33,877 | | | | 34,325 | | | | 448 | |
| Malaysian ringgit | | Buy | | Morgan Stanley | | 3/21/2016 | | | 884,000 | | | | 204,262 | | | | 204,503 | | | | 241 | |
| Malaysian ringgit | | Buy | | State Street Bank and Trust | | 3/21/2016 | | | 375,000 | | | | 86,567 | | | | 86,752 | | | | 185 | |
| Malaysian ringgit | | Buy | | UBS AG | | 3/21/2016 | | | 41,000 | | | | 9,465 | | | | 9,485 | | | | 20 | |
| Mexican peso | | Buy | | Citibank | | 3/22/2016 | | | 252,000 | | | | 14,459 | | | | 14,542 | | | | 82 | |
| Polish zloty | | Buy | | UBS AG | | 3/21/2016 | | | 1,845,000 | | | | 463,228 | | | | 469,650 | | | | 6,422 | |
| Russian ruble | | Buy | | State Street Bank and Trust | | 3/21/2016 | | | 800,000 | | | | 10,638 | | | | 10,758 | | | | 120 | |
| South African rand | | Buy | | State Street Bank and Trust | | 3/22/2016 | | | 443,000 | | | | 28,084 | | | | 28,241 | | | | 157 | |
| Thai baht | | Buy | | Standard Chartered Bank | | 3/21/2016 | | | 11,430,000 | | | | 313,908 | | | | 317,051 | | | | 3,143 | |
| Thai baht | | Buy | | State Street Bank and Trust | | 3/21/2016 | | | 230,000 | | | | 6,336 | | | | 6,380 | | | | 44 | |
| Turkish lira | | Buy | | Citibank | | 3/21/2016 | | | 205,000 | | | | 68,661 | | | | 68,774 | | | | 113 | |
| Turkish lira | | Buy | | Citibank | | 3/21/2016 | | | 132,000 | | | | 44,036 | | | | 44,284 | | | | 248 | |
| Brazilian real | | Sell | | Bank of America | | 3/21/2016 | | | 32,000 | | | | 8,228 | | | | 7,890 | | | | 338 | |
| Brazilian real | | Sell | | UBS AG | | 3/21/2016 | | | 308,000 | | | | 76,633 | | | | 75,943 | | | | 690 | |
| Hungarian forint | | Sell | | Citibank | | 3/21/2016 | | | 8,730,000 | | | | 30,343 | | | | 30,047 | | | | 296 | |
| Indonesian rupiah | | Sell | | State Street Bank and Trust | | 3/21/2016 | | | 798,000,000 | | | | 57,184 | | | | 56,349 | | | | 835 | |
| Malaysian ringgit | | Sell | | Morgan Stanley | | 3/21/2016 | | | 134,000 | | | | 31,110 | | | | 30,999 | | | | 111 | |
| Peruvian Nuevo sol | | Sell | | Bank of America | | 3/21/2016 | | | 645,000 | | | | 188,299 | | | | 186,618 | | | | 1,681 | |
| Peruvian Nuevo sol | | Sell | | State Street Bank and Trust | | 3/21/2016 | | | 70,000 | | | | 20,328 | | | | 20,253 | | | | 75 | |
| Polish zloty | | Sell | | Morgan Stanley | | 3/21/2016 | | | 156,000 | | | | 40,046 | | | | 39,710 | | | | 336 | |
| Romanian new leu | | Sell | | Goldman Sachs | | 3/21/2016 | | | 56,000 | | | | 13,559 | | | | 13,469 | | | | 90 | |
| Russian ruble | | Sell | | Morgan Stanley | | 3/21/2016 | | | 1,550,000 | | | | 21,190 | | | | 20,843 | | | | 346 | |
| South African rand | | Sell | | Morgan Stanley | | 3/22/2016 | | | 2,650,000 | | | | 171,644 | | | | 168,938 | | | | 2,706 | |
| Taiwan dollar | | Sell | | Morgan Stanley | | 3/21/2016 | | | 5,630,000 | | | | 171,109 | | | | 170,672 | | | | 437 | |
| Unrealized Appreciation on Forward Foreign Currency Exchange Contracts | | | | | | | | | | $ | 24,796 | |
| | See Notes to Financial Statements. | 63 |
Schedule of Investments (continued)
EMERGING MARKETS LOCAL BOND FUND December 31, 2015
Open Forward Foreign Currency Exchange Contracts at December 31, 2015: (continued)
Forward
Foreign
Currency
Exchange
Contracts | | Transaction
Type | | Counterparty | | Expiration
Date | | Foreign
Currency | | | U.S. $
Cost on
Origination
Date | | | U.S. $
Current
Value | | Unrealized
Depreciation | |
| Chilean peso | | Buy | | State Street Bank and Trust | | 3/21/2016 | | | 55,700,000 | | | $ | 79,063 | | | $ | 77,938 | | | $ | (1,125 | ) |
| Colombian peso | | Buy | | State Street Bank and Trust | | 3/22/2016 | | | 75,022,000 | | | | 23,607 | | | | 23,429 | | | | (178 | ) |
| Hungarian forint | | Buy | | Standard Chartered Bank | | 3/21/2016 | | | 3,200,000 | | | | 11,188 | | | | 11,014 | | | | (174 | ) |
| Indonesian rupiah | | Buy | | Morgan Stanley | | 3/21/2016 | | | 575,900,000 | | | | 40,995 | | | | 40,666 | | | | (329 | ) |
| Mexican peso | | Buy | | Bank of America | | 3/22/2016 | | | 780,000 | | | | 45,201 | | | | 45,010 | | | | (192 | ) |
| Mexican peso | | Buy | | Bank of America | | 3/22/2016 | | | 1,020,000 | | | | 59,303 | | | | 58,859 | | | | (444 | ) |
| Mexican peso | | Buy | | Morgan Stanley | | 3/22/2016 | | | 60,000 | | | | 3,470 | | | | 3,462 | | | | (8 | ) |
| Russian ruble | | Buy | | Bank of America | | 3/21/2016 | | | 4,600,000 | | | | 63,538 | | | | 61,858 | | | | (1,681 | ) |
| Russian ruble | | Buy | | State Street Bank and Trust | | 3/21/2016 | | | 1,389,000 | | | | 20,277 | | | | 18,678 | | | | (1,599 | ) |
| South African rand | | Buy | | Standard Chartered Bank | | 3/22/2016 | | | 295,000 | | | | 19,110 | | | | 18,806 | | | | (304 | ) |
| South Korean won | | Buy | | Morgan Stanley | | 3/21/2016 | | | 186,500,000 | | | | 158,705 | | | | 158,418 | | | | (287 | ) |
| Thai baht | | Buy | | Citibank | | 3/21/2016 | | | 7,200,000 | | | | 200,033 | | | | 199,717 | | | | (315 | ) |
| Thai baht | | Buy | | Standard Chartered Bank | | 3/21/2016 | | | 586,000 | | | | 16,297 | | | | 16,255 | | | | (42 | ) |
| Turkish lira | | Buy | | Standard Chartered Bank | | 3/21/2016 | | | 38,600 | | | | 12,976 | | | | 12,950 | | | | (26 | ) |
| Australian dollar | | Sell | | Standard Chartered Bank | | 3/21/2016 | | | 113,000 | | | | 81,692 | | | | 82,035 | | | | (343 | ) |
| Brazilian real | | Sell | | Morgan Stanley | | 3/21/2016 | | | 94,000 | | | | 22,660 | | | | 23,177 | | | | (517 | ) |
| Brazilian real | | Sell | | State Street Bank and Trust | | 3/21/2016 | | | 95,000 | | | | 23,370 | | | | 23,424 | | | | (54 | ) |
| Chilean peso | | Sell | | Bank of America | | 3/21/2016 | | | 50,000,000 | | | | 69,670 | | | | 69,962 | | | | (292 | ) |
| Colombian peso | | Sell | | Bank of America | | 3/22/2016 | | | 84,000,000 | | | | 25,011 | | | | 26,233 | | | | (1,222 | ) |
| Euro | | Sell | | Morgan Stanley | | 3/21/2016 | | | 72,000 | | | | 77,986 | | | | 78,398 | | | | (412 | ) |
| Hungarian forint | | Sell | | Standard Chartered Bank | | 3/21/2016 | | | 8,800,000 | | | | 30,036 | | | | 30,288 | | | | (252 | ) |
| Indonesian rupiah | | Sell | | State Street Bank and Trust | | 3/21/2016 | | | 185,110,000 | | | | 13,015 | | | | 13,071 | | | | (56 | ) |
| Philippine peso | | Sell | | Bank of America | | 3/21/2016 | | | 11,050,000 | | | | 231,685 | | | | 233,735 | | | | (2,050 | ) |
| Polish zloty | | Sell | | State Street Bank and Trust | | 3/21/2016 | | | 146,000 | | | | 37,111 | | | | 37,165 | | | | (53 | ) |
| 64 | See Notes to Financial Statements. |
Schedule of Investments (concluded)
EMERGING MARKETS LOCAL BOND FUND December 31, 2015
Open Forward Foreign Currency Exchange Contracts at December 31, 2015: (concluded)
Forward
Foreign
Currency
Exchange
Contracts | | Transaction
Type | | Counterparty | | Expiration
Date | | Foreign
Currency | | | U.S. $
Cost on
Origination
Date | | | U.S. $
Current
Value | | Unrealized
Depreciation | |
| Romanian new leu | | Sell | | Standard Chartered Bank | | 3/21/2016 | | | 262,000 | | | $ | 62,722 | | | $ | 63,016 | | | | (294 | ) |
| Singapore dollar | | Sell | | Standard Chartered Bank | | 3/21/2016 | | | 166,000 | | | | 116,504 | | | | 116,784 | | | | (280 | ) |
| South Korean won | | Sell | | Bank of America | | 3/21/2016 | | | 186,500,000 | | | | 158,188 | | | | 158,418 | | | | (230 | ) |
| Thai baht | | Sell | | State Street Bank and Trust | | 3/21/2016 | | | 1,380,000 | | | | 37,928 | | | | 38,279 | | | | (351 | ) |
| Unrealized Depreciation on Forward Foreign Currency Exchange Contracts | | | | | | | | | | | $ | (13,110 | ) |
Open Futures Contracts at December 31, 2015:
| Type | | Expiration | | Contracts | | Position | | Fair Value | | | Unrealized
Appreciation | |
| U.S. 5-Year Treasury Note | | March 2016 | | 3 | | Short | | | $(354,961 | ) | | | | $838 | |
The following is a summary of the inputs used as of December 31, 2015 in valuing the Fund’s investments carried at fair value(1):
| Investment Type(2)(3) | | Level 1 | | | Level 2 | | | Level 3 | | | Total | |
| Foreign Corporate Bonds | | $ | – | | | $ | 787,143 | | | $ | – | | | $ | 787,143 | |
| Foreign Government Obligations | | | – | | | | 6,187,317 | | | | – | | | | 6,187,317 | |
| Total | | $ | – | | | $ | 6,974,460 | | | $ | – | | | $ | 6,974,460 | |
| Other Financial Instruments | | | | | | | | | | | | | | | | |
| Forward Foreign Currency Exchange Contracts | | | | | | | | | | | | | | | | |
| Assets | | $ | – | | | $ | 24,796 | | | $ | – | | | $ | 24,796 | |
| Liabilities | | | – | | | | (13,110 | ) | | | – | | | | (13,110 | ) |
| Futures Contracts | | | | | | | | | | | | | | | | |
| Assets | | | 838 | | | | – | | | | – | | | | 838 | |
| Liabilities | | | – | | | | – | | | | – | | | | – | |
| Total | | $ | 838 | | | $ | 11,686 | | | $ | – | | | $ | 12,524 | |
| (1) | | Refer to Note 2(p) for a description of fair value measurements and the three-tier hierarchy of inputs. |
| (2) | | See Schedule of Investments for fair values in each industry and identification of foreign issuers and/or geography. |
| (3) | | There were no Level 1/Level 2 transfers during the fiscal year ended December 31, 2015. |
| | See Notes to Financial Statements. | 65 |
Schedule of Investments
MULTI-ASSET GLOBAL OPPORTUNITY FUND December 31, 2015
| Investments | | | | | | Shares | | | Fair
Value
(000) | |
| LONG-TERM INVESTMENTS 99.78% | | | | | | | | | | | | |
| | | | | | | | | | | | | |
| EXCHANGE-TRADED FUND 0.94% | | | | | | | | | | | | |
WisdomTree Japan Hedged Equity Fund
(cost $2,770,816) | | | | | | | 50,078 | | | $ | 2,508 | |
| | | | | | | | | | | | | |
| INVESTMENTS IN UNDERLYING FUNDS(a) 98.54% | | | | | | | | | | | | |
| Lord Abbett Equity Trust-Calibrated Mid Cap Value Fund-Class I(b) | | | | | | | 1,729,666 | | | | 31,774 | |
| Lord Abbett Global Fund, Inc.-Emerging Markets Currency Fund-Class I(c) | | | | | | | 9,436,733 | | | | 48,033 | |
| Lord Abbett Investment Trust-High Yield Fund-Class I(d) | | | | | | | 6,332,184 | | | | 43,819 | |
| Lord Abbett Securities Trust-International Dividend Income Fund-Class I(e) | | | | | | | 16,052,209 | | | | 109,155 | |
| Lord Abbett Mid Cap Stock Fund, Inc.-Class I(f) | | | | | | | 1,187,355 | | | | 29,161 | |
| Lord Abbett Investment Trust-Short Duration Income Fund-Class I(g) | | | | | | | 57,948 | | | | 250 | |
| Total Investments in Underlying Funds (cost $299,710,752) | | | | | | | | | | | 262,192 | |
| | | Interest
Rate | | Maturity
Date | | Credit
Rating:
S&P or
Moody’s(h) | | Principal
Amount
(000) | | | | | |
| | | | | | | | | | | | | | | |
| MUNICIPAL BONDS 0.30% | | | | | | | | | | | | | | |
| | | | | | | | | | | | | | | |
| Tax Revenue | | | | | | | | | | | | | | |
| PR Corp. Sales Tax | | 5.00% | | 8/1/2040 | | Caa3 | | $ | 250 | | | $ | 143 | |
| PR Corp. Sales Tax | | 5.25% | | 8/1/2040 | | Caa3 | | | 325 | | | | 186 | |
| PR Corp. Sales Tax | | 6.00% | | 8/1/2032 | | Caa3 | | | 230 | | | | 128 | |
| PR Corp. Sales Tax | | 6.05% | | 8/1/2037 | | Caa3 | | | 235 | | | | 130 | |
| PR Corp. Sales Tax | | 6.35% | | 8/1/2057 | | Caa3 | | | 370 | | | | 202 | |
| Total Municipal Bonds (cost $858,664) | | | | | | | | | | | | | 789 | |
| Total Investments in Securities 99.78% (cost $303,340,232) | | | | | | | | | | | | | 265,489 | |
| Other Assets in Excess of Liabilities(i) 0.22% | | | | | | | | | | | | | 581 | |
| Net Assets 100.00% | | | | | | | | | | | | $ | 266,070 | |
| 66 | See Notes to Financial Statements. |
Schedule of Investments (continued)
MULTI-ASSET GLOBAL OPPORTUNITY FUND December 31, 2015
| (a) | | Affiliated issuers (See Note 12). |
| (b) | | Fund investment objective is total return. |
| (c) | | Fund investment objective is to seek high total return. |
| (d) | | Fund investment objective is to seek a high current income and the opportunity for capital appreciation to produce a high total return. |
| (e) | | Fund investment objective is to seek a high level of total return. |
| (f) | | Fund investment objective is to seek capital appreciation through investments, primarily in equity securities, which are believed to be undervalued in the marketplace. |
| (g) | | Fund investment objective is to seek a high level of income consistent with preservation of capital. |
| (h) | | Unaudited. |
| (i) | | Other Assets in Excess of Liabilities include net unrealized appreciation/depreciation on credit default swaps, forward foreign currency exchange contracts and futures contracts as follows: |
Centrally Cleared Credit Default Swaps on Indexes—Buy Protection at December 31, 2015(1):
Referenced
Index* | | Fund
Pays | | Termination
Date | | Notional
Amount | | Fair
Value(2) | | Payments
Upfront(3) | | Unrealized
Appreciation |
| Markit CDX. NA.HY.25(4) | | 5.00% | | 12/20/2020 | | $6,000,000 | | $6,060,052 | | $(57,984 | ) | $118,036 |
| (1) | | If the Fund is a buyer of protection and a credit event occurs, as defined under the terms of that particular swap agreement, the Fund will either (i) receive from the seller of protection an amount equal to the notional amount of the swap and make delivery of the referenced obligation or underlying securities comprising the referenced index or (ii) receive a net settlement amount in the form of cash or securities equal to the notional amount of the swap less the recovery value of the referenced obligation or underlying securities. |
| (2) | | Fair value serves as the indicator of the current status of payment/performance risk. |
| (3) | | Upfront payments received by Central Clearinghouse are presented net of amortization (See Note 2(n)). |
| (4) | | Central Clearinghouse: Credit Suisse. |
| * | | The Referenced Index is for Credit Default Swaps on Indexes, which is comprised of a basket of high yield securities. (See Note 2(n)). |
| Open Forward Foreign Currency Exchange Contracts at December 31, 2015: | | |
Forward
Foreign
Currency
Exchange
Contracts | | Transaction
Type | | Counterparty | | Expiration
Date | | Foreign
Currency | | | U.S. $
Cost on
Origination
Date | | | U.S. $
Current
Value | | Unrealized
Appreciation | |
| Australian dollar | | Buy | | Standard Chartered Bank | | 2/29/2016 | | | 1,980,000 | | | $ | 1,417,965 | | | $ | 1,438,911 | | | $ | 20,946 | |
| Canadian dollar | | Buy | | Standard Chartered Bank | | 2/29/2016 | | | 1,785,000 | | | | 1,277,870 | | | | 1,290,216 | | | | 12,346 | |
| euro | | Buy | | Morgan Stanley | | 2/22/2016 | | | 750,000 | | | | 800,177 | | | | 816,030 | | | | 15,853 | |
| Indian rupee | | Buy | | Bank of America | | 2/22/2016 | | | 14,540,000 | | | | 217,122 | | | | 218,190 | | | | 1,068 | |
| Malaysian ringgit | | Buy | | Bank of America | | 2/22/2016 | | | 2,970,000 | | | | 674,779 | | | | 687,744 | | | | 12,965 | |
| Thai baht | | Buy | | Bank of America | | 2/23/2016 | | | 21,450,000 | | | | 592,345 | | | | 595,329 | | | | 2,984 | |
| Australian dollar | | Sell | | Citibank | | 2/29/2016 | | | 484,000 | | | | 353,796 | | | | 351,734 | | | | 2,062 | |
| British pound | | Sell | | Bank of America | | 2/29/2016 | | | 354,000 | | | | 534,882 | | | | 521,918 | | | | 12,964 | |
| British pound | | Sell | | Morgan Stanley | | 2/29/2016 | | | 4,254,000 | | | | 6,407,954 | | | | 6,271,866 | | | | 136,088 | |
| British pound | | Sell | | Standard Chartered Bank | | 2/29/2016 | | | 175,000 | | | | 264,597 | | | | 258,010 | | | | 6,587 | |
| | See Notes to Financial Statements. | 67 |
Schedule of Investments (continued)
MULTI-ASSET GLOBAL OPPORTUNITY FUND December 31, 2015
Open Forward Foreign Currency Exchange Contracts at December 31, 2015: (concluded)
Forward
Foreign
Currency
Exchange
Contracts | | Transaction
Type | | Counterparty | | Expiration
Date | | Foreign
Currency | | | U.S. $
Cost on
Origination
Date | | | U.S. $
Current
Value | | Unrealized
Appreciation | |
| Canadian dollar | | Sell | | Standard Chartered Bank | | 2/29/2016 | | | 5,762,000 | | | $ | 4,324,576 | | | $ | 4,164,832 | | | $ | 159,744 | |
| Canadian dollar | | Sell | | Standard Chartered Bank | | 2/29/2016 | | | 452,000 | | | | 338,506 | | | | 326,710 | | | | 11,796 | |
| euro | | Sell | | Standard Chartered Bank | | 2/29/2016 | | | 377,000 | | | | 412,844 | | | | 410,263 | | | | 2,581 | |
| euro | | Sell | | State Street Bank and Trust | | 2/29/2016 | | | 2,280,000 | | | | 2,493,499 | | | | 2,481,164 | | | | 12,335 | |
| Unrealized Appreciation on Forward Foreign Currency Exchange Contracts | | | | | | | | | | | $ | 438,363 | |
Forward
Foreign
Currency
Exchange
Contracts | | Transaction
Type | | Counterparty | | Expiration
Date | | Foreign
Currency | | | U.S. $
Cost on
Origination
Date | | | U.S. $
Current
Value | | Unrealized
Depreciation | |
| Brazilian real | | Buy | | Bank of America | | 2/22/2016 | | | 1,832,000 | | | $ | 465,504 | | | $ | 455,938 | | | $ | (9,566 | ) |
| British pound | | Buy | | Morgan Stanley | | 2/29/2016 | | | 665,000 | | | | 990,308 | | | | 980,440 | | | | (9,868 | ) |
| South African rand | | Buy | | Standard Chartered Bank | | 2/22/2016 | | | 4,870,000 | | | | 336,971 | | | | 312,157 | | | | (24,814 | ) |
| Turkish lira | | Buy | | Standard Chartered Bank | | 2/22/2016 | | | 1,710,000 | | | | 586,034 | | | | 578,186 | | | | (7,848 | ) |
| Australian dollar | | Sell | | Bank of America | | 2/29/2016 | | | 1,021,000 | | | | 713,470 | | | | 741,984 | | | | (28,514 | ) |
| Australian dollar | | Sell | | Bank of America | | 2/29/2016 | | | 10,862,000 | | | | 7,811,179 | | | | 7,893,660 | | | | (82,481 | ) |
| euro | | Sell | | State Street Bank and Trust | | 2/29/2016 | | | 775,000 | | | | 832,346 | | | | 843,378 | | | | (11,032 | ) |
| euro | | Sell | | State Street Bank and Trust | | 2/29/2016 | | | 8,652,000 | | | | 9,223,897 | | | | 9,415,366 | | | | (191,469 | ) |
| Japanese yen | | Sell | | Morgan Stanley | | 2/29/2016 | | | 144,000,000 | | | | 1,190,337 | | | | 1,199,405 | | | | (9,068 | ) |
| Unrealized Depreciation on Forward Foreign Currency Exchange Contracts | | | | | | | | | | | $ | (374,660 | ) |
Open Futures Contracts at December 31, 2015:
| Type | | Expiration | | Contracts | | Position | | Fair Value | | | Unrealized
Appreciation | |
| E- Mini S&P 500 Index | | March 2016 | | 13 | | Short | | $ | (1,323,010 | ) | | | $ | 10,026 | |
| U.S. 10-Year Treasury Note | | March 2016 | | 53 | | Short | | | (6,673,031 | ) | | | | 27,961 | |
| Totals | | | | | | | | $ | (7,996,041 | ) | | | $ | 37,987 | |
| 68 | See Notes to Financial Statements. |
Schedule of Investments (concluded)
MULTI-ASSET GLOBAL OPPORTUNITY FUND December 31, 2015
The following is a summary of the inputs used as of December 31, 2015 in valuing the Fund’s investments carried at fair value(1):
| Investment Type(2)(3) | | | Level 1
(000) | | | | Level 2
(000) | | | | Level 3
(000) | | | | Total
(000) | |
| Exchange-Traded Fund | | $ | 2,508 | | | $ | – | | | $ | – | | | $ | 2,508 | |
| Investments in Underlying Funds | | | 262,192 | | | | – | | | | – | | | | 262,192 | |
| Municipal Bonds | | | – | | | | 789 | | | | – | | | | 789 | |
| Total | | $ | 264,700 | | | $ | 789 | | | $ | – | | | $ | 265,489 | |
| Other Financial Instruments | | | | | | | | | | | | | | | | |
| Credit Default Swap | | | | | | | | | | | | | | | | |
| Assets | | $ | – | | | $ | 118 | | | $ | – | | | $ | 118 | |
| Liabilities | | | – | | | | – | | | | – | | | | – | |
| Forward Foreign Currency Exchange Contracts | | | | | | | | | | | | | | | | |
| Assets | | | – | | | | 438 | | | | – | | | | 438 | |
| Liabilities | | | – | | | | (375 | ) | | | – | | | | (375 | ) |
| Futures Contracts | | | | | | | | | | | | | | | | |
| Assets | | | 38 | | | | – | | | | – | | | | 38 | |
| Liabilities | | | – | | | | – | | | | – | | | | – | |
| Total | | $ | 38 | | | $ | 181 | | | $ | – | | | $ | 219 | |
| (1) | | Refer to Note 2(p) for a description of fair value measurements and the three-tier hierarchy of inputs. |
| (2) | | See Schedule of Investments for fair values in each investment strategy of the Underlying Funds. |
| (3) | | There were no Level 1/Level 2 transfers during the fiscal year ended December 31, 2015. |
| | See Notes to Financial Statements. | 69 |
Statements of Assets and Liabilities
December 31, 2015
| | | Emerging Markets | | | Emerging Markets | |
| | | Corporate Debt | | | Currency | |
| | | Fund | | | Fund | |
| ASSETS: | | | | | | | | |
| Investments in securities, at cost | | $ | 38,282,379 | | | $ | 469,393,455 | |
| Investments in securities, at fair value | | $ | 37,579,674 | | | $ | 464,684,941 | |
| Deposits with brokers for derivatives collateral | | | 2,700 | | | | 4,462,418 | |
| Cash | | | 505,370 | | | | 15,178,807 | |
| Foreign cash, at value (cost $0 and $11,756, respectively) | | | – | | | | 10,937 | |
| Receivables: | | | | | | | | |
| Interest and dividends | | | 534,193 | | | | 3,009,811 | |
| Capital shares sold | | | 199,056 | | | | 1,201,033 | |
| Investment securities sold | | | – | | | | 33,934 | |
| From advisor (See Note 3) | | | 19,731 | | | | – | |
| Variation margin for interest rate swaps | | | – | | | | 311 | |
| Unrealized appreciation on forward foreign currency exchange contracts | | | 15,060 | | | | 6,234,134 | |
| Prepaid expenses and other assets | | | 52,170 | | | | 43,448 | |
| Total assets | | | 38,907,954 | | | | 494,859,774 | |
| LIABILITIES: | | | | | | | | |
| Payables: | | | | | | | | |
| Investment securities purchased | | | 502,752 | | | | 3,165,233 | |
| Capital shares reacquired | | | 274,113 | | | | 248,190 | |
| Management fee | | | 22,147 | | | | 203,444 | |
| Variation margin for futures contracts | | | 602 | | | | 121,913 | |
| Directors’ fees | | | 853 | | | | 73,419 | |
| To affiliates (See Note 3) | | | – | | | | 36,841 | |
| 12b-1 distribution plan | | | 4,848 | | | | 16,602 | |
| Fund administration | | | 1,266 | | | | 16,276 | |
| Unrealized depreciation on forward foreign currency exchange contracts | | | 16,442 | | | | 11,180,001 | |
| Credit default swap agreements payable, at fair value (including upfront payments received of $0 and $123,837) | | | – | | | | 3,985 | |
| Distributions payable | | | 128,901 | | | | 1,158,860 | |
| Accrued expenses | | | 46,424 | | | | 187,476 | |
| Total liabilities | | | 998,348 | | | | 16,412,240 | |
| NET ASSETS | | $ | 37,909,606 | | | $ | 478,447,534 | |
| COMPOSITION OF NET ASSETS: | | | | | | | | |
| Paid-in capital | | $ | 39,272,839 | | | $ | 590,165,683 | |
| Undistributed (distributions in excess of) net investment income | | | 1,287 | | | | (1,232,279 | ) |
| Accumulated net realized loss on investments, futures contracts, swaps and foreign currency related transactions | | | (661,734 | ) | | | (101,235,033 | ) |
| Net unrealized depreciation on investments, futures contracts, swaps and translation of assets and liabilities denominated in foreign currencies | | | (702,786 | ) | | | (9,250,837 | ) |
| Net Assets | | $ | 37,909,606 | | | $ | 478,447,534 | |
| | |
| 70 | See Notes to Financial Statements. |
Statements of Assets and Liabilities (continued)
December 31, 2015
| | | Emerging Markets | | | Emerging Markets | |
| | | Corporate Debt | | | Currency | |
| | | Fund | | | Fund | |
| | | | | | | |
| Net assets by class: | | | | | | | | |
| Class A Shares | | $ | 13,843,153 | | | $ | 20,466,458 | |
| Class B Shares | | | – | | | $ | 177,642 | |
| Class C Shares | | $ | 580,748 | | | $ | 5,557,588 | |
| Class F Shares | | $ | 12,603,903 | | | $ | 9,438,753 | |
| Class I Shares | | $ | 10,634,045 | | | $ | 442,392,762 | |
| Class R2 Shares | | $ | 109,059 | | | $ | 101,347 | |
| Class R3 Shares | | $ | 109,065 | | | $ | 284,901 | |
| Class R4 Shares | | $ | 9,868 | | | $ | 9,352 | |
| Class R5 Shares | | $ | 9,881 | | | $ | 9,363 | |
| Class R6 Shares | | $ | 9,884 | | | $ | 9,368 | |
| Outstanding shares by class: | | | | | | | | |
| Class A Shares (350 and 415 million shares of common stock authorized, $.001 par value) | | | 957,843 | | | | 4,014,197 | |
| Class B Shares (0 and 30 million shares of common stock authorized, $.001 par value) | | | – | | | | 34,687 | |
| Class C Shares (85 and 100 million shares of common stock authorized, $.001 par value) | | | 40,188 | | | | 1,083,757 | |
| Class F Shares (85 and 100 million shares of common stock authorized, $.001 par value) | | | 872,002 | | | | 1,852,387 | |
| Class I Shares (185 and 200 million shares of common stock authorized, $.001 par value) | | | 735,741 | | | | 86,940,992 | |
| Class R2 Shares (15 and 20 million shares of common stock authorized, $.001 par value) | | | 7,547 | | | | 19,842 | |
| Class R3 Shares (15 and 20 million shares of common stock authorized, $.001 par value) | | | 7,547 | | | | 56,004 | |
| Class R4 Shares (15 and 20 million shares of common stock authorized, $.001 par value) | | | 683 | | | | 1,834 | |
| Class R5 Shares (15 and 20 million shares of common stock authorized, $.001 par value) | | | 684 | | | | 1,840 | |
| Class R6 Shares (15 and 20 million shares of common stock authorized, $.001 par value) | | | 684 | | | | 1,841 | |
| Net asset value, offering and redemption price per share (Net assets divided by outstanding shares): | | | | | | | | |
| Class A Shares-Net asset value | | | $14.45 | | | | $5.10 | |
| Class A Shares-Maximum offering price (Net asset value plus sales charge of 2.25%) | | | $14.78 | | | | $5.22 | |
| Class B Shares-Net asset value | | | – | | | | $5.12 | |
| Class C Shares-Net asset value | | | $14.45 | | | | $5.13 | |
| Class F Shares-Net asset value | | | $14.45 | | | | $5.10 | |
| Class I Shares-Net asset value | | | $14.45 | | | | $5.09 | |
| Class R2 Shares-Net asset value | | | $14.45 | | | | $5.11 | |
| Class R3 Shares-Net asset value | | | $14.45 | | | | $5.09 | |
| Class R4 Shares-Net asset value | | | $14.45 | | | | $5.10 | |
| Class R5 Shares-Net asset value | | | $14.45 | | | | $5.09 | |
| Class R6 Shares-Net asset value | | | $14.45 | | | | $5.09 | |
| | | |
| | See Notes to Financial Statements. | 71 |
Statements of Assets and Liabilities (continued)
December 31, 2015
| | | Emerging Markets | | | Multi-Asset | |
| | | Local Bond | | | Global Opportunity | |
| | | Fund | | | Fund | |
| ASSETS: | | | | | | | | |
| Investments in securities, at cost | | $ | 9,277,938 | | | $ | 3,629,480 | |
| Investments in Underlying Funds, at cost | | | – | | | | 299,710,752 | |
| Investments in securities, at fair value | | $ | 6,974,460 | | | $ | 3,297,394 | |
| Investments in Underlying Funds, at fair value | | | – | | | | 262,191,861 | |
| Deposits with brokers for derivatives collateral | | | 2,700 | | | | 737,879 | |
| Cash | | | 462,382 | | | | – | |
| Foreign cash, at value (cost $3,527 and $0, respectively) | | | 3,494 | | | | – | |
| Receivables: | | | | | | | | |
| Interest and dividends | | | 125,379 | | | | 1,050,528 | |
| Capital shares sold | | | 39,510 | | | | 1,469,676 | |
| Investment securities sold | | | – | | | | 309,282 | |
| From affiliates (See Note 3) | | | – | | | | 30,914 | |
| From advisor (See Note 3) | | | 15,771 | | | | – | |
| Variation margin for centrally cleared credit default swap agreements | | | – | | | | 125,639 | |
| Unrealized appreciation on forward foreign currency exchange contracts | | | 24,796 | | | | 438,363 | |
| Prepaid expenses and other assets | | | 39,485 | | | | 35,644 | |
| Total assets | | | 7,687,977 | | | | 269,687,180 | |
| LIABILITIES: | | | | | | | | |
| Payables: | | | | | | | | |
| Investment securities purchased | | | – | | | | 997,528 | |
| Capital shares reacquired | | | 10,714 | | | | 648,194 | |
| Management fee | | | 4,686 | | | | 22,810 | |
| Directors’ fees | | | 647 | | | | 46,906 | |
| 12b-1 distribution plan | | | 1,600 | | | | 80,946 | |
| Fund administration | | | 268 | | | | – | |
| To bank | | | – | | | | 208,824 | |
| Variation margin for futures contracts | | | 422 | | | | 3,256 | |
| Unrealized depreciation on forward foreign currency exchange contracts | | | 13,110 | | | | 374,660 | |
| Distributions payable | | | 20,631 | | | | 1,135,957 | |
| Accrued expenses | | | 55,747 | | | | 98,541 | |
| Total liabilities | | | 107,825 | | | | 3,617,622 | |
| NET ASSETS | | $ | 7,580,152 | | | $ | 266,069,558 | |
| COMPOSITION OF NET ASSETS: | | | | | | | | |
| Paid-in capital | | $ | 10,329,543 | | | $ | 306,067,468 | |
| Undistributed (distributions in excess of) net investment income | | | (153,257 | ) | | | 293,528 | |
| Accumulated net realized loss on investments, futures contracts, swaps and foreign currency related transactions | | | (299,404 | ) | | | (2,660,187 | ) |
| Net unrealized depreciation on investments, futures contracts, swaps and translation of assets and liabilities denominated in foreign currencies | | | (2,296,730 | ) | | | (37,631,251 | ) |
| Net Assets | | $ | 7,580,152 | | | $ | 266,069,558 | |
| | |
| 72 | See Notes to Financial Statements. |
Statements of Assets and Liabilities (concluded)
December 31, 2015
| | | Emerging Markets | | | Multi-Asset | |
| | | Local Bond | | | Global Opportunity | |
| | | Fund | | | Fund | |
| | | | | | | | | |
| Net assets by class: | | | | | | | | |
| Class A Shares | | $ | 5,097,234 | | | $ | 160,336,469 | |
| Class B Shares | | | – | | | $ | 2,799,788 | |
| Class C Shares | | $ | 386,644 | | | $ | 42,025,936 | |
| Class F Shares | | $ | 128,905 | | | $ | 8,746,697 | |
| Class I Shares | | $ | 1,785,872 | | | $ | 10,632,603 | |
| Class R2 Shares | | $ | 77,407 | | | $ | 364,111 | |
| Class R3 Shares | | $ | 77,447 | | | $ | 6,322,275 | |
| Class R4 Shares | | $ | 8,873 | | | $ | 9,183 | |
| Class R5 Shares | | $ | 8,884 | | | $ | 9,195 | |
| Class R6 Shares | | $ | 8,886 | | | $ | 34,823,301 | |
| Outstanding shares by class (unlimited number of authorized shares of beneficial interest) | | | | | | | | |
| Class A Shares (350 and 430 million shares of common stock authorized, $.001 par value) | | | 513,243 | | | | 15,594,259 | |
| Class B Shares (0 and 15 million shares of common stock authorized, $.001 par value) | | | – | | | | 300,442 | |
| Class C Shares (85 and 20 million shares of common stock authorized, $.001 par value) | | | 38,941 | | | | 4,512,094 | |
| Class F Shares (85 and 20 million shares of common stock authorized, $.001 par value) | | | 12,985 | | | | 850,396 | |
| Class I Shares (185 and 15 million shares of common stock authorized, $.001 par value) | | | 179,886 | | | | 1,027,295 | |
| Class R2 Shares (15 and 20 million shares of common stock authorized, $.001 par value) | | | 7,798 | | | | 34,713 | |
| Class R3 Shares (15 and 20 million shares of common stock authorized, $.001 par value) | | | 7,802 | | | | 611,204 | |
| Class R4 Shares (15 and 20 million shares of common stock authorized, $.001 par value) | | | 894 | | | | 893 | |
| Class R5 Shares (15 and 20 million shares of common stock authorized, $.001 par value) | | | 895 | | | | 887.95 | |
| Class R6 Shares (15 and 20 million shares of common stock authorized, $.001 par value) | | | 895 | | | | 3,362,966 | |
| Net asset value, offering and redemption price per share (Net assets divided by outstanding shares): | | | | | | | | |
| Class A Shares-Net asset value | | | $9.93 | | | | $10.28 | |
| Class A Shares-Maximum offering price (Net asset value plus sales charge of 2.25%) | | | $10.16 | | | | $10.52 | |
| Class B Shares-Net asset value | | | – | | | | $9.32 | |
| Class C Shares-Net asset value | | | $9.93 | | | | $9.31 | |
| Class F Shares-Net asset value | | | $9.93 | | | | $10.29 | |
| Class I Shares-Net asset value | | | $9.93 | | | | $10.35 | |
| Class R2 Shares-Net asset value | | | $9.93 | | | | $10.49 | |
| Class R3 Shares-Net asset value | | | $9.93 | | | | $10.34 | |
| Class R4 Shares-Net asset value | | | $9.93 | | | | $10.28 | |
| Class R5 Shares-Net asset value | | | $9.93 | | | | $10.36 | |
| Class R6 Shares-Net asset value | | | $9.93 | | | | $10.35 | |
| | | | | | | | | |
| | See Notes to Financial Statements. | 73 |
Statements of Operations
For the Year Ended December 31, 2015
| | | Emerging Markets | | | Emerging Markets | |
| | | Corporate Debt | | | Currency | |
| | | Fund | | | Fund | |
| Investment income: | | | | | | | | |
| Interest and other (net of foreign withholding taxes of $0 and $762, respectively) | | $ | 1,181,339 | | | $ | 10,497,557 | |
| Total investment income | | | 1,181,339 | | | | 10,497,557 | |
| Expenses: | | | | | | | | |
| Management fee | | | 163,072 | | | | 2,533,842 | |
| 12b-1 distribution plan-Class A | | | 20,585 | | | | 51,055 | |
| 12b-1 distribution plan-Class B | | | – | | | | 2,669 | |
| 12b-1 distribution plan-Class C | | | 5,555 | | | | 59,401 | |
| 12b-1 distribution plan-Class F | | | 2,852 | | | | 14,892 | |
| 12b-1 distribution plan-Class P | | | – | | | | 10 | |
| 12b-1 distribution plan-Class R2 | | | 657 | | | | 611 | |
| 12b-1 distribution plan-Class R3 | | | 548 | | | | 2,187 | |
| 12b-1 distribution plan-Class R4 | | | 13 | | | | 12 | |
| Shareholder servicing | | | 20,388 | | | | 142,037 | |
| Professional | | | 50,992 | | | | 82,582 | |
| Reports to shareholders | | | 7,861 | | | | 67,016 | |
| Fund administration | | | 9,318 | | | | 202,707 | |
| Custody | | | 8,455 | | | | 53,206 | |
| Directors’ fees | | | 743 | | | | 17,857 | |
| Registration | | | 74,544 | | | | 115,603 | |
| Subsidy (See Note 3) | | | – | | | | 646,647 | |
| Other | | | 14,591 | | | | 86,874 | |
| Gross expenses | | | 380,174 | | | | 4,079,208 | |
| Expense reductions (See Note 9) | | | (25 | ) | | | (58 | ) |
| Fees waived and expenses reimbursed (See Note 3) | | | (153,131 | ) | | | – | |
| Net expenses | | | 227,018 | | | | 4,079,150 | |
| Net investment income | | | 954,321 | | | | 6,418,407 | |
| Net realized and unrealized gain (loss): | | | | | | | | |
| Net realized loss on investments | | | (453,817 | ) | | | (872,520 | ) |
| Net realized gain (loss) on futures contracts, swaps and foreign currency related transactions | | | 36,753 | | | | (55,418,739 | ) |
| Net change in unrealized appreciation/depreciation on investments | | | (673,577 | ) | | | (3,429,564 | ) |
| Net change in unrealized appreciation/depreciation on futures contracts, swaps and translation of assets and liabilities denominated in foreign currencies | | | (5,199 | ) | | | 6,113,417 | |
| Net realized and unrealized loss | | | (1,095,840 | ) | | | (53,607,406 | ) |
| Net Decrease in Net Assets Resulting From Operations | | $ | (141,519 | ) | | $ | (47,188,999 | ) |
| | |
| 74 | See Notes to Financial Statements. |
Statements of Operations (concluded)
For the Year Ended December 31, 2015
| | | Emerging Markets | | | Multi-Asset | |
| | | Local Bond | | | Global Opportunity | |
| | | Fund | | | Fund | |
| Investment income: | | | | | | | | |
| Dividends received from Underlying Funds | | $ | – | | | $ | 9,222,210 | |
| Dividends received from Exchange-Traded Fund | | | – | | | | 19,815 | |
| Interest and other (net of foreign withholding taxes of $12,306 and $677, respectively) | | | 570,352 | | | | 12,240 | |
| Total investment income | | | 570,352 | | | | 9,254,265 | |
| Expenses: | | | | | | | | |
| Management fee | | | 61,573 | | | | 714,660 | |
| 12b-1 distribution plan-Class A | | | 12,091 | | | | 424,923 | |
| 12b-1 distribution plan-Class B | | | – | | | | 37,927 | |
| 12b-1 distribution plan-Class C | | | 4,070 | | | | 462,205 | |
| 12b-1 distribution plan-Class F | | | 153 | | | | 12,406 | |
| 12b-1 distribution plan-Class R2 | | | 512 | | | | 1,216 | |
| 12b-1 distribution plan-Class R3 | | | 427 | | | | 33,005 | |
| 12b-1 distribution plan-Class R4 | | | 11 | | | | 12 | |
| Shareholder servicing | | | 6,524 | | | | 396,734 | |
| Professional | | | 61,003 | | | | 39,491 | |
| Reports to shareholders | | | 3,683 | | | | 54,464 | |
| Fund administration | | | 3,519 | | | | – | |
| Custody | | | 30,497 | | | | 15,943 | |
| Directors’ fees | | | 327 | | | | 10,377 | |
| Registration | | | 87,846 | | | | 108,440 | |
| Other | | | 10,072 | | | | 40,861 | |
| Gross expenses | | | 282,308 | | | | 2,352,664 | |
| Expense reductions (See Note 9) | | | (9 | ) | | | (256 | ) |
| Expenses assumed by Underlying Funds (See Note 3) | | | – | | | | (666,732 | ) |
| Fees waived and expenses reimbursed (See Note 3) | | | (191,208 | ) | | | (428,796 | ) |
| Net expenses | | | 91,091 | | | | 1,256,880 | |
| Net investment income | | | 479,261 | | | | 7,997,385 | |
| Net realized and unrealized gain (loss): | | | | | | | | |
| Capital gain distributions received from Underlying Funds | | | – | | | | 2,251,880 | |
| Capital gain distributions received from Exchange-Traded Fund | | | – | | | | 111,366 | |
| Net realized gain (loss) on investments and Underlying Funds | | | (1,124,257 | ) | | | 2,778,989 | * |
| Net realized gain (loss) on futures contracts, swaps and foreign currency related transactions | | | (139,039 | ) | | | 1,115,662 | |
| Net change in unrealized appreciation/depreciation on investments and Underlying Funds | | | (794,928 | ) | | | (36,853,658 | ) |
| Net change in unrealized appreciation/depreciation on futures contracts, swaps and translation of assets and liabilities denominated in foreign currencies | | | 16,537 | | | | 4,637 | |
| Net realized and unrealized loss | | | (2,041,687 | ) | | | (30,591,124 | ) |
| Net Decrease in Net Assets Resulting From Operations | | $ | (1,562,426 | ) | | $ | (22,593,739 | ) |
* Includes net realized gain from affiliated issuers of $2,768,959 (See Note 12).
| | See Notes to Financial Statements. | 75 |
Statements of Changes in Net Assets
| | | Emerging Markets Corporate Debt Fund |
| | | For the | | | For the | |
| | | Year Ended | | | Year Ended | |
| INCREASE IN NET ASSETS | | December 31, 2015 | | | December 31, 2014 | |
| Operations: | | | | | | | | |
| Net investment income | | $ | 954,321 | | | $ | 512,729 | |
| Net realized gain (loss) on investments, futures contracts and foreign currency related transactions | | | (417,064 | ) | | | 215,565 | |
| Net change in unrealized appreciation/depreciation on investments, futures contracts and translation of assets and liabilities denominated in foreign currencies | | | (678,776 | ) | | | (4,258 | ) |
| Net increase (decrease) in net assets resulting from operations | | | (141,519 | ) | | | 724,036 | |
| Distributions to shareholders from: | | | | | | | | |
| Net investment income | | | | | | | | |
| Class A | | | (455,798 | ) | | | (290,290 | ) |
| Class C | | | (22,655 | ) | | | (8,105 | ) |
| Class F | | | (122,313 | ) | | | (5,982 | ) |
| Class I | | | (434,446 | ) | | | (247,517 | ) |
| Class R2 | | | (5,139 | ) | | | (5,155 | ) |
| Class R3 | | | (5,140 | ) | | | (5,156 | ) |
| Class R4 | | | (217 | ) | | | – | |
| Class R5 | | | (230 | ) | | | – | |
| Class R6 | | | (233 | ) | | | – | |
| Net realized gain | | | | | | | | |
| Class A | | | (929 | ) | | | (177,357 | ) |
| Class C | | | (51 | ) | | | (12,293 | ) |
| Class F | | | (140 | ) | | | (4,485 | ) |
| Class I | | | (1,002 | ) | | | (134,951 | ) |
| Class R2 | | | (9 | ) | | | (2,812 | ) |
| Class R3 | | | (9 | ) | | | (2,812 | ) |
| Class R4 | | | (1 | ) | | | – | |
| Class R5 | | | (1 | ) | | | – | |
| Class R6 | | | (1 | ) | | | – | |
| Total distributions to shareholders | | | (1,048,314 | ) | | | (896,915 | ) |
| Capital share transactions (See Note 14): | | | | | | | | |
| Net proceeds from sales of shares | | | 31,403,742 | | | | 2,088,631 | |
| Reinvestment of distributions | | | 1,008,842 | | | | 893,013 | |
| Cost of shares reacquired | | | (6,048,258 | ) | | | (106,258 | ) |
| Net increase in net assets resulting from capital share transactions | | | 26,364,326 | | | | 2,875,386 | |
| Net increase in net assets | | | 25,174,493 | | | | 2,702,507 | |
| NET ASSETS: | | | | | | | | |
| Beginning of period | | $ | 12,735,113 | | | $ | 10,032,606 | |
| End of period | | $ | 37,909,606 | | | $ | 12,735,113 | |
| Undistributed net investment income | | $ | 1,287 | | | $ | 466 | |
| | |
| 76 | See Notes to Financial Statements. |
Statements of Changes in Net Assets (continued)
| | | Emerging Markets Currency Fund |
| | | For the | | | For the | |
| | | Year Ended | | | Year Ended | |
| INCREASE (DECREASE) IN NET ASSETS | | December 31, 2015 | | | December 31, 2014 | |
| Operations: | | | | | | | | |
| Net investment income | | $ | 6,418,407 | | | $ | 4,967,860 | |
| Net realized loss on investments, futures contracts, swaps and foreign currency related transactions | | | (56,291,259 | ) | | | (14,944,860 | ) |
| Net change in unrealized appreciation/depreciation on investments, futures contracts, swaps and translation of assets and liabilities denominated in foreign currencies | | | 2,683,853 | | | | (10,110,938 | ) |
| Net decrease in net assets resulting from operations | | | (47,188,999 | ) | | | (20,087,938 | ) |
| Distributions to shareholders from: | | | | | | | | |
| Net investment income | | | | | | | | |
| Class A | | | (338,762 | ) | | | (1,026,089 | ) |
| Class B | | | (2,526 | ) | | | (8,560 | ) |
| Class C | | | (76,540 | ) | | | (253,506 | ) |
| Class F | | | (204,204 | ) | | | (803,895 | ) |
| Class I | | | (6,490,974 | ) | | | (10,115,674 | ) |
| Class P | | | (26 | ) | | | (132 | ) |
| Class R2 | | | (1,156 | ) | | | (3,721 | ) |
| Class R3 | | | (5,327 | ) | | | (11,411 | ) |
| Class R4 | | | (65 | ) | | | – | |
| Class R5 | | | (70 | ) | | | – | |
| Class R6 | | | (73 | ) | | | – | |
| Return of capital | | | | | | | | |
| Class A | | | (368,939 | ) | | | – | |
| Class B | | | (2,750 | ) | | | – | |
| Class C | | | (83,359 | ) | | | – | |
| Class F | | | (222,395 | ) | | | – | |
| Class I | | | (7,069,187 | ) | | | – | |
| Class P | | | (28 | ) | | | – | |
| Class R2 | | | (1,260 | ) | | | – | |
| Class R3 | | | (5,801 | ) | | | – | |
| Class R4 | | | (70 | ) | | | – | |
| Class R5 | | | (77 | ) | | | – | |
| Class R6 | | | (79 | ) | | | – | |
| Total distributions to shareholders | | | (14,873,668 | ) | | | (12,222,988 | ) |
| Capital share transactions (Net of share conversions) (See Note 14): | | | | | | | | |
| Net proceeds from sales of shares | | | 232,336,517 | | | | 284,556,555 | |
| Reinvestment of distributions | | | 14,719,492 | | | | 11,865,469 | |
| Cost of shares reacquired | | | (86,705,055 | ) | | | (282,053,273 | ) |
| Net increase in net assets resulting from capital share transactions | | | 160,350,954 | | | | 14,368,751 | |
| Net increase (decrease) in net assets | | | 98,288,287 | | | | (17,942,175 | ) |
| NET ASSETS: | | | | | | | | |
| Beginning of year | | $ | 380,159,247 | | | $ | 398,101,422 | |
| End of year | | $ | 478,447,534 | | | $ | 380,159,247 | |
| Distributions in excess of net investment income | | $ | (1,232,279 | ) | | $ | (4,253,612 | ) |
| | | |
| | See Notes to Financial Statements. | 77 |
Statements of Changes in Net Assets (continued)
| | | Emerging Markets Local Bond Fund |
| | | For the | | | For the | |
| | | Year Ended | | | Year Ended | |
| INCREASE (DECREASE) IN NET ASSETS | | December 31, 2015 | | | December 31, 2014 | |
| Operations: | | | | | | | | |
| Net investment income | | $ | 479,261 | | | $ | 490,121 | |
| Net realized loss on investments, futures contracts and foreign currency related transactions | | | (1,263,296 | ) | | | (56,048 | ) |
| Net change in unrealized appreciation/depreciation on investments, futures contracts and translation of assets and liabilities denominated in foreign currencies | | | (778,391 | ) | | | (1,262,702 | ) |
| Net decrease in net assets resulting from operations | | | (1,562,426 | ) | | | (828,629 | ) |
| Distributions to shareholders from: | | | | | | | | |
| Net investment income | | | | | | | | |
| Class A | | | – | | | | (363,782 | ) |
| Class C | | | – | | | | (16,383 | ) |
| Class F | | | – | | | | (8,351 | ) |
| Class I | | | – | | | | (142,124 | ) |
| Class R2 | | | – | | | | (6,159 | ) |
| Class R3 | | | – | | | | (6,161 | ) |
| Return of capital | | | | | | | | |
| Class A | | | (358,505 | ) | | | – | |
| Class C | | | (23,116 | ) | | | – | |
| Class F | | | (9,234 | ) | | | – | |
| Class I | | | (121,047 | ) | | | – | |
| Class R2 | | | (5,247 | ) | | | – | |
| Class R3 | | | (5,251 | ) | | | – | |
| Class R4 | | | (275 | ) | | | – | |
| Class R5 | | | (287 | ) | | | – | |
| Class R6 | | | (289 | ) | | | – | |
| Total distributions to shareholders | | | (523,251 | ) | | | (542,960 | ) |
| Capital share transactions (See Note 14): | | | | | | | | |
| Net proceeds from sales of shares | | | 702,065 | | | | 6,527,526 | |
| Reinvestment of distributions | | | 512,913 | | | | 537,354 | |
| Cost of shares reacquired | | | (2,784,418 | ) | | | (2,235,218 | ) |
| Net increase (decrease) in net assets resulting from capital share transactions | | | (1,569,440 | ) | | | 4,829,662 | |
| Net increase (decrease) in net assets | | | (3,655,117 | ) | | | 3,458,073 | |
| NET ASSETS: | | | | | | | | |
| Beginning of year | | $ | 11,235,269 | | | $ | 7,777,196 | |
| End of year | | $ | 7,580,152 | | | $ | 11,235,269 | |
| Distributions in excess of net investment income | | $ | (153,257 | ) | | $ | (49,486 | ) |
| | |
| 78 | See Notes to Financial Statements. |
Statements of Changes in Net Assets (concluded)
| | | Multi-Asset Global Opportunity Fund |
| | | For the | | | For the | |
| | | Year Ended | | | Year Ended | |
| INCREASE (DECREASE) IN NET ASSETS | | December 31, 2015 | | | December 31, 2014 | |
| Operations: | | | | | | | | |
| Net investment income | | $ | 7,997,385 | | | $ | 7,905,129 | |
| Capital gain distributions received from Underlying Funds | | | 2,251,880 | | | | 11,679,211 | |
| Capital gain distributions received from Exchange-Traded Fund | | | 111,366 | | | | – | |
| Net realized gain on investments and Underlying Funds | | | 2,778,989 | | | | 5,709,596 | |
| Net realized gain (loss) on futures contracts, swaps and foreign currency related transactions | | | 1,115,662 | | | | (102,866 | ) |
| Net change in unrealized appreciation/depreciation on investments and Underlying Funds | | | (36,853,658 | ) | | | (21,738,039 | ) |
| Net change in unrealized appreciation/depreciation on futures contracts, swaps and translation of assets and liabilities denominated in foreign currencies | | | 4,637 | | | | 215,164 | |
| Net increase (decrease) in net assets resulting from operations | | | (22,593,739 | ) | | | 3,668,195 | |
| Distributions to shareholders from: | | | | | | | | |
| Net investment income | | | | | | | | |
| Class A | | | (4,294,398 | ) | | | (6,346,799 | ) |
| Class B | | | (73,331 | ) | | | (172,458 | ) |
| Class C | | | (945,953 | ) | | | (1,572,470 | ) |
| Class F | | | (324,545 | ) | | | (445,433 | ) |
| Class I | | | (838,856 | ) | | | (1,654,538 | ) |
| Class R2 | | | (4,371 | ) | | | (3,790 | ) |
| Class R3 | | | (156,968 | ) | | | (234,768 | ) |
| Class R4 | | | (98 | ) | | | – | |
| Class R5 | | | (109 | ) | | | – | |
| Class R6 | | | (414,563 | ) | | | – | |
| Net realized gain | | | | | | | | |
| Class A | | | (9,225,306 | ) | | | (3,184,965 | ) |
| Class B | | | (204,873 | ) | | | (98,129 | ) |
| Class C | | | (2,733,974 | ) | | | (956,209 | ) |
| Class F | | | (637,493 | ) | | | (245,239 | ) |
| Class I | | | (609,269 | ) | | | (809,109 | ) |
| Class R2 | | | (12,351 | ) | | | (2,138 | ) |
| Class R3 | | | (363,617 | ) | | | (126,282 | ) |
| Class R4 | | | (522 | ) | | | – | |
| Class R5 | | | (518 | ) | | | – | |
| Class R6 | | | (1,962,944 | ) | | | – | |
| Total distributions to shareholders | | | (22,804,059 | ) | | | (15,852,327 | ) |
| Capital share transactions (Net of share conversions) (See Note 14): | | | | | | | | |
| Net proceeds from sales of shares | | | 112,907,512 | | | | 98,802,401 | |
| Reinvestment of distributions | | | 21,550,767 | | | | 14,827,692 | |
| Cost of shares reacquired | | | (103,434,077 | ) | | | (49,403,463 | ) |
| Net increase in net assets resulting from capital share transactions | | | 31,024,202 | | | | 64,226,630 | |
| Net increase (decrease) in net assets | | | (14,373,596 | ) | | | 52,042,498 | |
| NET ASSETS: | | | | | | | | |
| Beginning of year | | $ | 280,443,154 | | | $ | 228,400,656 | |
| End of year | | $ | 266,069,558 | | | $ | 280,443,154 | |
| Undistributed (distributions in excess of) net investment income | | $ | 293,528 | | | $ | (23,579 | ) |
| | | |
| | See Notes to Financial Statements. | 79 |
Financial Highlights
EMERGING MARKETS CORPORATE DEBT FUND
| | | | | | Per Share Operating Performance: |
| | | | | | Investment operations: | | Distributions to
shareholders from: |
| | | Net asset
value,
beginning
of period | | Net
invest-
ment
income(a) | | Net
realized
and
unrealized
gain (loss) | | Total
from
invest-
ment
opera-
tions | | Net
investment
income | | Net
realized
gain | | Total
distri-
butions |
| Class A | | | | | | | | | | | | | | | | | | | | | | | | | | | | |
| 12/31/2015 | | | $14.85 | | | | $0.60 | | | | $(0.33 | ) | | | $ 0.27 | | | | $(0.67 | ) | | | $ – | (c) | | | $(0.67 | ) |
| 12/31/2014 | | | 14.97 | | | | 0.66 | | | | 0.34 | | | | 1.00 | | | | (0.72 | ) | | | (0.40 | ) | | | (1.12 | ) |
| 12/6/2013 to 12/31/2013(d) | | | 15.00 | | | | 0.02 | | | | (0.02 | ) | | | – | | | | (0.03 | ) | | | – | | | | (0.03 | ) |
| Class C | | | | | | | | | | | | | | | | | | | | | | | | | | | | |
| 12/31/2015 | | | 14.85 | | | | 0.50 | | | | (0.34 | ) | | | 0.16 | | | | (0.56 | ) | | | – | (c) | | | (0.56 | ) |
| 12/31/2014 | | | 14.97 | | | | 0.52 | | | | 0.36 | | | | 0.88 | | | | (0.60 | ) | | | (0.40 | ) | | | (1.00 | ) |
| 12/6/2013 to 12/31/2013(d) | | | 15.00 | | | | 0.01 | | | | (0.02 | ) | | | (0.01 | ) | | | (0.02 | ) | | | – | | | | (0.02 | ) |
| Class F | | | | | | | | | | | | | | | | | | | | | | | | | | | | |
| 12/31/2015 | | | 14.85 | | | | 0.56 | | | | (0.28 | ) | | | 0.28 | | | | (0.68 | ) | | | – | (c) | | | (0.68 | ) |
| 12/31/2014 | | | 14.97 | | | | 0.67 | | | | 0.35 | | | | 1.02 | | | | (0.74 | ) | | | (0.40 | ) | | | (1.14 | ) |
| 12/6/2013 to 12/31/2013(d) | | | 15.00 | | | | 0.02 | | | | (0.02 | ) | | | – | | | | (0.03 | ) | | | – | | | | (0.03 | ) |
| Class I | | | | | | | | | | | | | | | | | | | | | | | | | | | | |
| 12/31/2015 | | | 14.85 | | | | 0.63 | | | | (0.33 | ) | | | 0.30 | | | | (0.70 | ) | | | – | (c) | | | (0.70 | ) |
| 12/31/2014 | | | 14.97 | | | | 0.69 | | | | 0.34 | | | | 1.03 | | | | (0.75 | ) | | | (0.40 | ) | | | (1.15 | ) |
| 12/6/2013 to 12/31/2013(d) | | | 15.00 | | | | 0.02 | | | | (0.02 | ) | | | – | | | | (0.03 | ) | | | – | | | | (0.03 | ) |
| Class R2 | | | | | | | | | | | | | | | | | | | | | | | | | | | | |
| 12/31/2015 | | | 14.85 | | | | 0.64 | | | | (0.34 | ) | | | 0.30 | | | | (0.70 | ) | | | – | (c) | | | (0.70 | ) |
| 12/31/2014 | | | 14.97 | | | | 0.69 | | | | 0.34 | | | | 1.03 | | | | (0.75 | ) | | | (0.40 | ) | | | (1.15 | ) |
| 12/6/2013 to 12/31/2013(d) | | | 15.00 | | | | 0.02 | | | | (0.02 | ) | | | – | | | | (0.03 | ) | | | – | | | | (0.03 | ) |
| Class R3 | | | | | | | | | | | | | | | | | | | | | | | | | | | | |
| 12/31/2015 | | | 14.85 | | | | 0.64 | | | | (0.34 | ) | | | 0.30 | | | | (0.70 | ) | | | – | (c) | | | (0.70 | ) |
| 12/31/2014 | | | 14.97 | | | | 0.69 | | | | 0.34 | | | | 1.03 | | | | (0.75 | ) | | | (0.40 | ) | | | (1.15 | ) |
| 12/6/2013 to 12/31/2013(d) | | | 15.00 | | | | 0.02 | | | | (0.02 | ) | | | – | | | | (0.03 | ) | | | – | | | | (0.03 | ) |
| Class R4 | | | | | | | | | | | | | | | | | | | | | | | | | | | | |
| 6/30/2015 to 12/31/2015(g) | | | 14.97 | | | | 0.29 | | | | (0.49 | ) | | | (0.20 | ) | | | (0.32 | ) | | | – | (c) | | | (0.32 | ) |
| Class R5 | | | | | | | | | | | | | | | | | | | | | | | | | | | | |
| 6/30/2015 to 12/31/2015(g) | | | 14.97 | | | | 0.31 | | | | (0.49 | ) | | | (0.18 | ) | | | (0.34 | ) | | | – | (c) | | | (0.34 | ) |
| Class R6 | | | | | | | | | | | | | | | | | | | | | | | | | | | | |
| 6/30/2015 to 12/31/2015(g) | | | 14.97 | | | | 0.31 | | | | (0.48 | ) | | | (0.17 | ) | | | (0.35 | ) | | | – | (c) | | | (0.35 | ) |
| (a) | Calculated using average shares outstanding during the period. |
| (b) | Total return for Classes A and C does not consider the effects of sales loads and assumes the reinvestment of all distributions. Total return for all other classes assumes the reinvestment of all distributions. |
| (c) | Amount less than $0.01. |
| (d) | Commenced on December 6, 2013. |
| (e) | Not annualized. |
| (f) | Annualized. |
| (g) | Commenced on June 30, 2015. |
| 80 | See Notes to Financial Statements. |
| | | | | | | Ratios to Average Net Assets: | | Supplemental Data: |
| | | | | | | | | |
| | | | | | | Total | | | | | | | | | | | | |
| | | | | | | expenses | | | | | | | | | | | | |
| Net | | | | | after | | | | | Net | | Net | | | |
| asset | | | | | waivers | | | | | invest- | | assets, | | Portfolio |
| value, | | Total | | and/or reim- | | Total | | ment | | end of | | turnover |
| end of | | return(b) | | bursements | | expenses | | income | | period | | rate |
| period | | (%) | | (%) | | (%) | | (%) | | (000) | | (%) |
| | | | | | | | | | | | | |
| | $14.45 | | | | 1.77 | | | | 1.05 | | | | 1.71 | | | | 4.03 | | | | $13,843 | | | | 147.85 | |
| | 14.85 | | | | 6.76 | | | | 1.05 | | | | 2.62 | | | | 4.27 | | | | 6,745 | | | | 293.26 | |
| | 14.97 | | | | (0.04 | )(e) | | | 1.05 | (f) | | | 5.26 | (f) | | | 1.84 | (f) | | | 4,835 | | | | 4.14 | (e) |
| | | | | | | | | | | | | | | | | | | | | | | | | | | |
| | 14.45 | | | | 1.04 | | | | 1.77 | | | | 2.46 | | | | 3.38 | | | | 581 | | | | 147.85 | |
| | 14.85 | | | | 5.90 | | | | 1.81 | | | | 3.27 | | | | 3.34 | | | | 473 | | | | 293.26 | |
| | 14.97 | | | | (0.09 | )(e) | | | 1.86 | (f) | | | 6.07 | (f) | | | 1.03 | (f) | | | 100 | | | | 4.14 | (e) |
| | | | | | | | | | | | | | | | | | | | | | | | | | | |
| | 14.45 | | | | 1.83 | | | | 0.95 | | | | 1.50 | | | | 3.82 | | | | 12,604 | | | | 147.85 | |
| | 14.85 | | | | 6.86 | | | | 0.94 | | | | 2.49 | | | | 4.36 | | | | 170 | | | | 293.26 | |
| | 14.97 | | | | (0.04 | )(e) | | | 0.95 | (f) | | | 5.15 | (f) | | | 1.94 | (f) | | | 100 | | | | 4.14 | (e) |
| | | | | | | | | | | | | | | | | | | | | | | | | | | |
| | 14.45 | | | | 1.98 | | | | 0.85 | | | | 1.50 | | | | 4.26 | | | | 10,634 | | | | 147.85 | |
| | 14.85 | | | | 6.97 | | | | 0.85 | | | | 2.43 | | | | 4.47 | | | | 5,134 | | | | 293.26 | |
| | 14.97 | | | | (0.03 | )(e) | | | 0.85 | (f) | | | 5.06 | (f) | | | 2.03 | (f) | | | 4,798 | | | | 4.14 | (e) |
| | | | | | | | | | | | | | | | | | | | | | | | | | | |
| | 14.45 | | | | 1.98 | | | | 0.85 | | | | 2.14 | | | | 4.31 | | | | 109 | | | | 147.85 | |
| | 14.85 | | | | 6.97 | | | | 0.85 | | | | 3.03 | | | | 4.47 | | | | 107 | | | | 293.26 | |
| | 14.97 | | | | (0.03 | )(e) | | | 0.85 | (f) | | | 5.06 | (f) | | | 2.03 | (f) | | | 100 | | | | 4.14 | (e) |
| | | | | | | | | | | | | | | | | | | | | | | | | | | |
| | 14.45 | | | | 1.98 | | | | 0.85 | | | | 2.04 | | | | 4.31 | | | | 109 | | | | 147.85 | |
| | 14.85 | | | | 6.97 | | | | 0.85 | | | | 2.93 | | | | 4.47 | | | | 107 | | | | 293.26 | |
| | 14.97 | | | | (0.03 | )(e) | | | 0.85 | (f) | | | 5.07 | (f) | | | 2.05 | (f) | | | 100 | | | | 4.14 | (e) |
| | | | | | | | | | | | | | | | | | | | | | | | | | | |
| | 14.45 | | | | (1.33 | )(e) | | | 1.10 | (f) | | | 1.71 | (f) | | | 3.91 | (f) | | | 10 | | | | 147.85 | |
| | | | | | | | | | | | | | | | | | | | | | | | | | | |
| | 14.45 | | | | (1.21 | )(e) | | | 0.85 | (f) | | | 1.46 | (f) | | | 4.17 | (f) | | | 10 | | | | 147.85 | |
| | | | | | | | | | | | | | | | | | | | | | | | | | | |
| | 14.45 | | | | (1.18 | )(e) | | | 0.79 | (f) | | | 1.37 | (f) | | | 4.23 | (f) | | | 10 | | | | 147.85 | |
| | | |
| | See Notes to Financial Statements. | 81 |
Financial Highlights (continued)
EMERGING MARKETS CURRENCY FUND
| | | | | | Per Share Operating Performance: |
| | | | | | Investment operations: | | Distributions to
shareholders from: |
| | | Net asset
value,
beginning
of period | | Net
invest-
ment
income(a) | | Net
realized
and
unrealized
gain (loss) | | Total
from
invest-
ment
opera-
tions | | Net
investment
income | | Net
realized
gain | | Return
of
capital |
| Class A | | | | | | | | | | | | | | | | | | | | | | | | | | | | |
| 12/31/2015 | | | $5.76 | | | | $0.06 | | | | $(0.57 | ) | | | $(0.51 | ) | | | $(0.07 | ) | | | $ – | | | | $(0.08 | ) |
| 12/31/2014 | | | 6.25 | | | | 0.06 | | | | (0.40 | ) | | | (0.34 | ) | | | (0.15 | ) | | | – | | | | – | |
| 12/31/2013 | | | 6.63 | | | | 0.06 | | | | (0.27 | ) | | | (0.21 | ) | | | (0.10 | ) | | | – | | | | (0.07 | ) |
| 12/31/2012 | | | 6.15 | | | | 0.07 | | | | 0.58 | | | | 0.65 | | | | (0.15 | ) | | | – | | | | (0.02 | ) |
| 12/31/2011 | | | 6.74 | | | | 0.08 | | | | (0.46 | ) | | | (0.38 | ) | | | (0.18 | ) | | | (0.03 | ) | | | – | |
| Class B | | | | | | | | | | | | | | | | | | | | | | | | | | | | |
| 12/31/2015 | | | 5.79 | | | | 0.02 | | | | (0.58 | ) | | | (0.56 | ) | | | (0.05 | ) | | | – | | | | (0.06 | ) |
| 12/31/2014 | | | 6.28 | | | | 0.01 | | | | (0.39 | ) | | | (0.38 | ) | | | (0.11 | ) | | | – | | | | – | |
| 12/31/2013 | | | 6.66 | | | | 0.01 | | | | (0.27 | ) | | | (0.26 | ) | | | (0.07 | ) | | | – | | | | (0.05 | ) |
| 12/31/2012 | | | 6.18 | | | | 0.02 | | | | 0.58 | | | | 0.60 | | | | (0.10 | ) | | | – | | | | (0.02 | ) |
| 12/31/2011 | | | 6.77 | | | | 0.03 | | | | (0.46 | ) | | | (0.43 | ) | | | (0.13 | ) | | | (0.03 | ) | | | – | |
| Class C | | | | | | | | | | | | | | | | | | | | | | | | | | | | |
| 12/31/2015 | | | 5.79 | | | �� | 0.03 | | | | (0.57 | ) | | | (0.54 | ) | | | (0.06 | ) | | | – | | | | (0.06 | ) |
| 12/31/2014 | | | 6.29 | | | | 0.02 | | | | (0.40 | ) | | | (0.38 | ) | | | (0.12 | ) | | | – | | | | – | |
| 12/31/2013 | | | 6.67 | | | | 0.02 | | | | (0.27 | ) | | | (0.25 | ) | | | (0.07 | ) | | | – | | | | (0.06 | ) |
| 12/31/2012 | | | 6.19 | | | | 0.02 | | | | 0.59 | | | | 0.61 | | | | (0.11 | ) | | | – | | | | (0.02 | ) |
| 12/31/2011 | | | 6.78 | | | | 0.03 | | | | (0.46 | ) | | | (0.43 | ) | | | (0.13 | ) | | | (0.03 | ) | | | – | |
| Class F | | | | | | | | | | | | | | | | | | | | | | | | | | | | |
| 12/31/2015 | | | 5.76 | | | | 0.07 | | | | (0.57 | ) | | | (0.50 | ) | | | (0.08 | ) | | | – | | | | (0.08 | ) |
| 12/31/2014 | | | 6.25 | | | | 0.06 | | | | (0.39 | ) | | | (0.33 | ) | | | (0.16 | ) | | | – | | | | – | |
| 12/31/2013 | | | 6.62 | | | | 0.07 | | | | (0.27 | ) | | | (0.20 | ) | | | (0.09 | ) | | | – | | | | (0.08 | ) |
| 12/31/2012 | | | 6.15 | | | | 0.07 | | | | 0.58 | | | | 0.65 | | | | (0.16 | ) | | | – | | | | (0.02 | ) |
| 12/31/2011 | | | 6.74 | | | | 0.09 | | | | (0.47 | ) | | | (0.38 | ) | | | (0.18 | ) | | | (0.03 | ) | | | – | |
| Class I | | | | | | | | | | | | | | | | | | | | | | | | | | | | |
| 12/31/2015 | | | 5.75 | | | | 0.07 | | | | (0.57 | ) | | | (0.50 | ) | | �� | (0.08 | ) | | | – | | | | (0.08 | ) |
| 12/31/2014 | | | 6.24 | | | | 0.07 | | | | (0.39 | ) | | | (0.32 | ) | | | (0.17 | ) | | | – | | | | – | |
| 12/31/2013 | | | 6.61 | | | | 0.08 | | | | (0.27 | ) | | | (0.19 | ) | | | (0.10 | ) | | | – | | | | (0.08 | ) |
| 12/31/2012 | | | 6.14 | | | | 0.08 | | | | 0.57 | | | | 0.65 | | | | (0.16 | ) | | | – | | | | (0.02 | ) |
| 12/31/2011 | | | 6.73 | | | | 0.09 | | | | (0.46 | ) | | | (0.37 | ) | | | (0.19 | ) | | | (0.03 | ) | | | – | |
| Class R2 | | | | | | | | | | | | | | | | | | | | | | | | | | | | |
| 12/31/2015 | | | 5.77 | | | | 0.04 | | | | (0.57 | ) | | | (0.53 | ) | | | (0.06 | ) | | | – | | | | (0.07 | ) |
| 12/31/2014 | | | 6.26 | | | | 0.03 | | | | (0.39 | ) | | | (0.36 | ) | | | (0.13 | ) | | | – | | | | – | |
| 12/31/2013 | | | 6.64 | | | | 0.04 | | | | (0.28 | ) | | | (0.24 | ) | | | (0.08 | ) | | | – | | | | (0.06 | ) |
| 12/31/2012 | | | 6.16 | | | | 0.04 | | | | 0.59 | | | | 0.63 | | | | (0.13 | ) | | | – | | | | (0.02 | ) |
| 12/31/2011 | | | 6.75 | | | | 0.05 | | | | (0.46 | ) | | | (0.41 | ) | | | (0.15 | ) | | | (0.03 | ) | | | – | |
| | |
| 82 | See Notes to Financial Statements. |
| | | | | | | | | | Ratios to
Average Net Assets: | | Supplemental Data: |
| | | | | | | | | | | | |
Total
distri-
butions | | Net
asset
value,
end of
period | | Total
return
(%)(b) | | Total
expenses
(%) | | Net
invest-
ment
income
(%) | | Net
assets,
end of
period
(000) | | Portfolio
turnover
rate
(%) |
| | | | | | | | | | | | | |
| | $(0.15 | ) | | | $5.10 | | | | (8.95 | ) | | | 0.98 | | | | 1.10 | | | | $ 20,466 | | | | 51.75 | |
| | (0.15 | ) | | | 5.76 | | | | (5.49 | ) | | | 0.98 | | | | 0.93 | | | | 30,554 | | | | 113.20 | |
| | (0.17 | ) | | | 6.25 | | | | (3.21 | ) | | | 0.99 | | | | 0.97 | | | | 47,961 | | | | 105.11 | |
| | (0.17 | ) | | | 6.63 | | | | 10.69 | | | | 1.01 | | | | 1.02 | | | | 73,947 | | | | 141.92 | |
| | (0.21 | ) | | | 6.15 | | | | (5.87 | ) | | | 1.02 | | | | 1.18 | | | | 80,034 | | | | 130.30 | |
| | | | | | | | | | | | | | | | | | | | | | | | | | | |
| | (0.11 | ) | | | 5.12 | | | | (9.79 | ) | | | 1.78 | | | | 0.30 | | | | 178 | | | | 51.75 | |
| | (0.11 | ) | | | 5.79 | | | | (6.20 | ) | | | 1.78 | | | | 0.13 | | | | 350 | | | | 113.20 | |
| | (0.12 | ) | | | 6.28 | | | | (3.95 | ) | | | 1.79 | | | | 0.18 | | | | 696 | | | | 105.11 | |
| | (0.12 | ) | | | 6.66 | | | | 9.79 | | | | 1.80 | | | | 0.24 | | | | 1,219 | | | | 141.92 | |
| | (0.16 | ) | | | 6.18 | | | | (6.55 | ) | | | 1.80 | | | | 0.44 | | | | 1,674 | | | | 130.30 | |
| | | | | | | | | | | | | | | | | | | | | | | | | | | |
| | (0.12 | ) | | | 5.13 | | | | (9.44 | ) | | | 1.59 | | | | 0.49 | | | | 5,558 | | | | 51.75 | |
| | (0.12 | ) | | | 5.79 | | | | (6.19 | ) | | | 1.61 | | | | 0.31 | | | | 9,675 | | | | 113.20 | |
| | (0.13 | ) | | | 6.29 | | | | (3.78 | ) | | | 1.62 | | | | 0.34 | | | | 17,378 | | | | 105.11 | |
| | (0.13 | ) | | | 6.67 | | | | 9.91 | | | | 1.68 | | | | 0.37 | | | | 28,543 | | | | 141.92 | |
| | (0.16 | ) | | | 6.19 | | | | (6.44 | ) | | | 1.69 | | | | 0.51 | | | | 36,551 | | | | 130.30 | |
| | | | | | | | | | | | | | | | | | | | | | | | | | | |
| | (0.16 | ) | | | 5.10 | | | | (8.86 | ) | | | 0.88 | | | | 1.19 | | | | 9,439 | | | | 51.75 | |
| | (0.16 | ) | | | 5.76 | | | | (5.40 | ) | | | 0.88 | | | | 1.03 | | | | 21,550 | | | | 113.20 | |
| | (0.17 | ) | | | 6.25 | | | | (2.97 | ) | | | 0.89 | | | | 1.06 | | | | 36,181 | | | | 105.11 | |
| | (0.18 | ) | | | 6.62 | | | | 10.63 | | | | 0.91 | | | | 1.12 | | | | 71,622 | | | | 141.92 | |
| | (0.21 | ) | | | 6.15 | | | | (5.77 | ) | | | 0.91 | | | | 1.27 | | | | 76,795 | | | | 130.30 | |
| | | | | | | | | | | | | | | | | | | | | | | | | | | |
| | (0.16 | ) | | | 5.09 | | | | (8.79 | ) | | | 0.78 | | | | 1.29 | | | | 442,393 | | | | 51.75 | |
| | (0.17 | ) | | | 5.75 | | | | (5.32 | ) | | | 0.78 | | | | 1.12 | | | | 317,393 | | | | 113.20 | |
| | (0.18 | ) | | | 6.24 | | | | (2.88 | ) | | | 0.80 | | | | 1.18 | | | | 295,136 | | | | 105.11 | |
| | (0.18 | ) | | | 6.61 | | | | 10.75 | | | | 0.80 | | | | 1.21 | | | | 271,710 | | | | 141.92 | |
| | (0.22 | ) | | | 6.14 | | | | (5.68 | ) | | | 0.81 | | | | 1.40 | | | | 119,329 | | | | 130.30 | |
| | | | | | | | | | | | | | | | | | | | | | | | | | | |
| | (0.13 | ) | | | 5.11 | | | | (9.30 | ) | | | 1.38 | | | | 0.70 | | | | 101 | | | | 51.75 | |
| | (0.13 | ) | | | 5.77 | | | | (5.85 | ) | | | 1.37 | | | | 0.51 | | | | 110 | | | | 113.20 | |
| | (0.14 | ) | | | 6.26 | | | | (3.59 | ) | | | 1.40 | | | | 0.58 | | | | 248 | | | | 105.11 | |
| | (0.15 | ) | | | 6.64 | | | | 10.24 | | | | 1.41 | | | | 0.63 | | | | 300 | | | | 141.92 | |
| | (0.18 | ) | | | 6.16 | | | | (6.22 | ) | | | 1.41 | | | | 0.76 | | | | 218 | | | | 130.30 | |
| | | |
| | See Notes to Financial Statements. | 83 |
Financial Highlights (continued)
EMERGING MARKETS CURRENCY FUND
| | | | | | Per Share Operating Performance: |
| | | | | | Investment operations: | | Distributions to
shareholders from: |
| | | Net asset
value,
beginning
of period | | Net
invest-
ment
income(a) | | Net
realized
and
unrealized
gain (loss) | | Total
from
invest-
ment
opera-
tions | | Net
investment
income | | Net
realized
gain | | Return
of
capital |
| Class R3 | | | | | | | | | | | | | | | | | | | | | | | | | | | | |
| 12/31/2015 | | | $5.75 | | | | $0.04 | | | | $(0.57 | ) | | | $(0.53 | ) | | | $(0.06 | ) | | | $ – | | | | $(0.07 | ) |
| 12/31/2014 | | | 6.24 | | | | 0.04 | | | | (0.39 | ) | | | (0.35 | ) | | | (0.14 | ) | | | – | | | | – | |
| 12/31/2013 | | | 6.61 | | | | 0.04 | | | | (0.26 | ) | | | (0.22 | ) | | | (0.09 | ) | | | – | | | | (0.06 | ) |
| 12/31/2012 | | | 6.14 | | | | 0.05 | | | | 0.57 | | | | 0.62 | | | | (0.13 | ) | | | – | | | | (0.02 | ) |
| 12/31/2011 | | | 6.73 | | | | 0.06 | | | | (0.46 | ) | | | (0.40 | ) | | | (0.16 | ) | | | (0.03 | ) | | | – | |
| Class R4 | | | | | | | | | | | | | | | | | | | | | | | | | | | | |
| 6/30/2015 to 12/31/2015(c) | | | 5.53 | | | | 0.03 | | | | (0.39 | ) | | | (0.36 | ) | | | (0.03 | ) | | | – | | | | (0.04 | ) |
| Class R5 | | | | | | | | | | | | | | | | | | | | | | | | | | | | |
| 6/30/2015 to 12/31/2015(c) | | | 5.52 | | | | 0.04 | | | | (0.39 | ) | | | (0.35 | ) | | | (0.04 | ) | | | – | | | | (0.04 | ) |
| Class R6 | | | | | | | | | | | | | | | | | | | | | | | | | | | | |
| 6/30/2015 to 12/31/2015(c) | | | 5.52 | | | | 0.04 | | | | (0.39 | ) | | | (0.35 | ) | | | (0.04 | ) | | | – | | | | (0.04 | ) |
| | |
| (a) | Calculated using average shares outstanding during the period. |
| (b) | Total return for Classes A, B and C does not consider the effects of sales loads and assumes the reinvestment of all distributions. Total return for all other classes assumes the reinvestment of all distributions. |
| (c) | Commenced on June 30, 2015. |
| (d) | Not annualized. |
| (e) | Annualized. |
| | |
| 84 | See Notes to Financial Statements. |
| | | | | | | | | | Ratios to
Average Net Assets: | | Supplemental Data: |
| | | | | | | | | | | | |
Total
distri-
butions | | Net
asset
value,
end of
period | | Total
return
(%)(b) | | Total
expenses
(%) | | Net
invest-
ment
income
(%) | | Net
assets,
end of
period
(000) | | Portfolio
turnover
rate
(%) |
| | | | | | | | | | | | | |
| | (0.13 | ) | | | $5.09 | | | | (9.24 | ) | | | 1.27 | | | | 0.81 | | | | $285 | | | | 51.75 | |
| | (0.14 | ) | | | 5.75 | | | | (5.77 | ) | | | 1.27 | | | | 0.65 | | | | 524 | | | | 113.20 | |
| | (0.15 | ) | | | 6.24 | | | | (3.35 | ) | | | 1.28 | | | | 0.70 | | | | 494 | | | | 105.11 | |
| | (0.15 | ) | | | 6.61 | | | | 10.23 | | | | 1.29 | | | | 0.74 | | | | 617 | | | | 141.92 | |
| | (0.19 | ) | | | 6.14 | | | | (6.14 | ) | | | 1.31 | | | | 0.92 | | | | 411 | | | | 130.30 | |
| | | | | | | | | | | | | | | | | | | | | | | | | | | |
| | (0.07 | ) | | | 5.10 | | | | (6.44 | )(d) | | | 1.01 | (e) | | | 1.13 | (e) | | | 9 | | | | 51.75 | |
| | | | | | | | | | | | | | | | | | | | | | | | | | | |
| | (0.08 | ) | | | 5.09 | | | | (6.34 | )(d) | | | 0.76 | (e) | | | 1.37 | (e) | | | 9 | | | | 51.75 | |
| | | | | | | | | | | | | | | | | | | | | | | | | | | |
| | (0.08 | ) | | | 5.09 | | | | (6.29 | )(d) | | | 0.67 | (e) | | | 1.47 | (e) | | | 9 | | | | 51.75 | |
| | | |
| | See Notes to Financial Statements. | 85 |
Financial Highlights (continued)
EMERGING MARKETS LOCAL BOND FUND
| | | | | | Per Share Operating Performance: |
| | | | | | Investment operations: | | Distributions to
shareholders from: |
| | | Net asset
value,
beginning
of period | | Net
invest-
ment
income(a) | | Net
realized
and
unrealized
(loss) | | Total
from
invest-
ment
opera-
tions | | Net
investment
income | | Return
of
capital | | Total
distri-
butions |
| Class A | | | | | | | | | | | | | | | | | | | | | | | | | | | | |
| 12/31/2015 | | | $12.60 | | | | $0.62 | | | | $(2.62 | ) | | | $(2.00 | ) | | | $ – | | | | $(0.67 | ) | | | $(0.67 | ) |
| 12/31/2014 | | | 14.39 | | | | 0.75 | | | | (1.70 | ) | | | (0.95 | ) | | | (0.84 | ) | | | – | | | | (0.84 | ) |
| 6/21/2013 to 12/31/2013(c) | | | 15.00 | | | | 0.37 | | | | (0.51 | ) | | | (0.14 | ) | | | (0.47 | ) | | | – | | | | (0.47 | ) |
| Class C | | | | | | | | | | | | | | | | | | | | | | | | | | | | |
| 12/31/2015 | | | 12.60 | | | | 0.53 | | | | (2.61 | ) | | | (2.08 | ) | | | – | | | | (0.59 | ) | | | (0.59 | ) |
| 12/31/2014 | | | 14.38 | | | | 0.64 | | | | (1.69 | ) | | | (1.05 | ) | | | (0.73 | ) | | | – | | | | (0.73 | ) |
| 6/21/2013 to 12/31/2013(c) | | | 15.00 | | | | 0.31 | | | | (0.52 | ) | | | (0.21 | ) | | | (0.41 | ) | | | – | | | | 0.41 | |
| Class F | | | | | | | | | | | | | | | | | | | | | | | | | | | | |
| 12/31/2015 | | | 12.60 | | | | 0.63 | | | | (2.61 | ) | | | (1.98 | ) | | | – | | | | (0.69 | ) | | | (0.69 | ) |
| 12/31/2014 | | | 14.38 | | | | 0.76 | | | | (1.68 | ) | | | (0.92 | ) | | | (0.86 | ) | | | – | | | | (0.86 | ) |
| 6/21/2013 to 12/31/2013(c) | | | 15.00 | | | | 0.38 | | | | (0.52 | ) | | | (0.14 | ) | | | (0.48 | ) | | | – | | | | (0.48 | ) |
| Class I | | | | | | | | | | | | | | | | | | | | | | | | | | | | |
| 12/31/2015 | | | 12.60 | | | | 0.64 | | | | (2.61 | ) | | | (1.97 | ) | | | – | | | | (0.70 | ) | | | (0.70 | ) |
| 12/31/2014 | | | 14.38 | | | | 0.79 | | | | (1.70 | ) | | | (0.91 | ) | | | (0.87 | ) | | | – | | | | (0.87 | ) |
| 6/21/2013 to 12/31/2013(c) | | | 15.00 | | | | 0.38 | | | | (0.52 | ) | | | (0.14 | ) | | | (0.48 | ) | | | – | | | | (0.48 | ) |
| Class R2 | | | | | | | | | | | | | | | | | | | | | | | | | | | | |
| 12/31/2015 | | | 12.60 | | | | 0.64 | | | | (2.61 | ) | | | (1.97 | ) | | | – | | | | (0.70 | ) | | | (0.70 | ) |
| 12/31/2014 | | | 14.38 | | | | 0.79 | | | | (1.70 | ) | | | (0.91 | ) | | | (0.87 | ) | | | – | | | | (0.87 | ) |
| 6/21/2013 to 12/31/2013(c) | | | 15.00 | | | | 0.34 | | | | (0.52 | ) | | | (0.18 | ) | | | (0.44 | ) | | | – | | | | (0.44 | ) |
| Class R3 | | | | | | | | | | | | | | | | | | | | | | | | | | | | |
| 12/31/2015 | | | 12.60 | | | | 0.64 | | | | (2.61 | ) | | | (1.97 | ) | | | – | | | | (0.70 | ) | | | (0.70 | ) |
| 12/31/2014 | | | 14.38 | | | | 0.79 | | | | (1.70 | ) | | | (0.91 | ) | | | (0.87 | ) | | | – | | | | (0.87 | ) |
| 6/21/2013 to 12/31/2013(c) | | | 15.00 | | | | 0.35 | | | | (0.52 | ) | | | (0.17 | ) | | | (0.45 | ) | | | – | | | | (0.45 | ) |
| Class R4 | | | | | | | | | | | | | | | | | | | | | | | | | | | | |
| 6/30/2015 to 12/31/2015(f) | | | 11.53 | | | | 0.29 | | | | (1.58 | ) | | | (1.29 | ) | | | – | | | | (0.31 | ) | | | (0.31 | ) |
| Class R5 | | | | | | | | | | | | | | | | | | | | | | | | | | | | |
| 6/30/2015 to 12/31/2015(f) | | | 11.53 | | | | 0.30 | | | | (1.57 | ) | | | (1.27 | ) | | | – | | | | (0.33 | ) | | | (0.33 | ) |
| Class R6 | | | | | | | | | | | | | | | | | | | | | | | | | | | | |
| 6/30/2015 to 12/31/2015(f) | | | 11.53 | | | | 0.31 | | | | (1.58 | ) | | | (1.27 | ) | | | – | | | | (0.33 | ) | | | (0.33 | ) |
| | |
| (a) | Calculated using average shares outstanding during the period. |
| (b) | Total return for Classes A and C does not consider the effects of sales loads and assumes the reinvestment of all distributions. Total return for all other classes assumes the reinvestment of all distributions. |
| (c) | Commenced on June 21, 2013. |
| (d) | Not annualized. |
| (e) | Annualized. |
| (f) | Commenced on June 30, 2015. |
| | |
| 86 | See Notes to Financial Statements. |
| | | | | | | Ratios to Average Net Assets: | | Supplemental Data: |
| | | | | | | | | |
Net
asset
value,
end of
period | | Total
return(b)
(%) | | Total
expenses
after
waivers
and/or reim-
bursements
(%) | | Total
expenses
(%) | | Net
invest-
ment
income
(%) | | Net
assets,
end of
period
(000) | | Portfolio
turnover
rate
(%) |
| | | | | | | | | | | | | |
| | $ 9.93 | | | | (16.32 | ) | | | 1.05 | | | | 3.22 | | | | 5.44 | | | | $5,097 | | | | 61.85 | |
| | 12.60 | | | | (7.05 | ) | | | 1.05 | | | | 3.01 | | | | 5.33 | | | | 8,345 | | | | 39.30 | |
| | 14.39 | | | | (0.97 | )(d) | | | 1.02 | (e) | | | 5.09 | (e) | | | 4.79 | (e) | | | 4,950 | | | | 28.21 | (d) |
| | | | | | | | | | | | | | | | | | | | | | | | | | | |
| | 9.93 | | | | (16.92 | ) | | | 1.77 | | | | 3.98 | | | | 4.73 | | | | 387 | | | | 61.85 | |
| | 12.60 | | | | (7.71 | ) | | | 1.82 | | | | 3.80 | | | | 4.53 | | | | 396 | | | | 39.30 | |
| | 14.38 | | | | (1.43 | )(d) | | | 1.77 | (e) | | | 5.63 | (e) | | | 3.97 | (e) | | | 226 | | | | 28.21 | (d) |
| | | | | | | | | | | | | | | | | | | | | | | | | | | |
| | 9.93 | | | | (16.23 | ) | | | 0.95 | | | | 3.10 | | | | 5.54 | | | | 129 | | | | 61.85 | |
| | 12.60 | | | | (6.88 | ) | | | 0.95 | | | | 2.96 | | | | 5.45 | | | | 179 | | | | 39.30 | |
| | 14.38 | | | | (0.99 | )(d) | | | 0.92 | (e) | | | 5.16 | (e) | | | 4.84 | (e) | | | 116 | | | | 28.21 | (d) |
| | | | | | | | | | | | | | | | | | | | | | | | | | | |
| | 9.93 | | | | (16.15 | ) | | | 0.85 | | | | 3.02 | | | | 5.65 | | | | 1,786 | | | | 61.85 | |
| | 12.60 | | | | (6.79 | ) | | | 0.85 | | | | 2.96 | | | | 5.58 | | | | 2,130 | | | | 39.30 | |
| | 14.38 | | | | (0.94 | )(d) | | | 0.82 | (e) | | | 5.19 | (e) | | | 4.94 | (e) | | | 2,286 | | | | 28.21 | (d) |
| | | | | | | | | | | | | | | | | | | | | | | | | | | |
| | 9.93 | | | | (16.15 | ) | | | 0.85 | | | | 3.62 | | | | 5.65 | | | | 77 | | | | 61.85 | |
| | 12.60 | | | | (6.79 | ) | | | 0.85 | | | | 3.56 | | | | 5.57 | | | | 92 | | | | 39.30 | |
| | 14.38 | | | | (1.23 | )(d) | | | 1.40 | (e) | | | 5.79 | (e) | | | 4.36 | (e) | | | 99 | | | | 28.21 | (d) |
| | | | | | | | | | | | | | | | | | | | | | | | | | | |
| | 9.93 | | | | (16.15 | ) | | | 0.85 | | | | 3.52 | | | | 5.65 | | | | 77 | | | | 61.85 | |
| | 12.60 | | | | (6.79 | ) | | | 0.85 | | | | 3.46 | | | | 5.57 | | | | 92 | | | | 39.30 | |
| | 14.38 | | | | (1.18 | )(d) | | | 1.30 | (e) | | | 5.69 | (e) | | | 4.46 | (e) | | | 99 | | | | 28.21 | (d) |
| | | | | | | | | | | | | | | | | | | | | | | | | | | |
| | 9.93 | | | | (11.24 | )(d) | | | 1.10 | (e) | | | 3.60 | (e) | | | 5.50 | (e) | | | 9 | | | | 61.85 | |
| | | | | | | | | | | | | | | | | | | | | | | | | | | |
| | 9.93 | | | | (11.13 | )(d) | | | 0.85 | (e) | | | 3.35 | (e) | | | 5.74 | (e) | | | 9 | | | | 61.85 | |
| | | | | | | | | | | | | | | | | | | | | | | | | | | |
| | 9.93 | | | | (11.11 | )(d) | | | 0.80 | (e) | | | 3.31 | (e) | | | 5.79 | (e) | | | 9 | | | | 61.85 | |
| | | |
| | See Notes to Financial Statements. | 87 |
Financial Highlights (continued)
MULTI-ASSET GLOBAL OPPORTUNITY FUND
| | | | | | Per Share Operating Performance: |
| | | | | | Investment operations: | | Distributions to
shareholders from: |
| | | Net asset
value,
beginning
of period | | Net
invest-
ment
income(a) | | Net
realized
and
unrealized
gain (loss) | | Total
from
invest-
ment
opera-
tions | | Net
investment
income | | Net
realized
gain | | Return
of
capital |
| Class A | | | | | | | | | | | | | | | | | | | | | | | | | | | | |
| 12/31/2015 | | | $12.04 | | | | $0.33 | | | | $(1.18 | ) | | | $(0.85 | ) | | | $(0.29 | ) | | | $(0.62 | ) | | | $ – | |
| 12/31/2014 | | | 12.49 | | | | 0.40 | | | | (0.12 | ) | | | 0.28 | | | | (0.49 | ) | | | (0.24 | ) | | | – | |
| 12/31/2013 | | | 11.42 | | | | 0.39 | | | | 1.26 | | | | 1.65 | | | | (0.50 | ) | | | (0.08 | ) | | | – | |
| 12/31/2012 | | | 10.29 | | | | 0.36 | | | | 1.16 | | | | 1.52 | | | | (0.38 | ) | | | – | | | | (0.01 | ) |
| 12/31/2011 | | | 11.41 | | | | 0.35 | | | | (1.12 | ) | | | (0.77 | ) | | | (0.35 | ) | | | – | | | | – | |
| Class B | | | | | | | | | | | | | | | | | | | | | | | | | | | | |
| 12/31/2015 | | | 11.00 | | | | 0.22 | | | | (1.07 | ) | | | (0.85 | ) | | | (0.21 | ) | | | (0.62 | ) | | | – | |
| 12/31/2014 | | | 11.46 | | | | 0.26 | | | | (0.08 | ) | | | 0.18 | | | | (0.40 | ) | | | (0.24 | ) | | | – | |
| 12/31/2013 | | | 10.53 | | | | 0.26 | | | | 1.16 | | | | 1.42 | | | | (0.41 | ) | | | (0.08 | ) | | | – | |
| 12/31/2012 | | | 9.51 | | | | 0.25 | | | | 1.09 | | | | 1.34 | | | | (0.31 | ) | | | – | | | | (0.01 | ) |
| 12/31/2011 | | | 10.57 | | | | 0.24 | | | | (1.03 | ) | | | (0.79 | ) | | | (0.27 | ) | | | – | | | | – | |
| Class C | | | | | | | | | | | | | | | | | | | | | | | | | | | | |
| 12/31/2015 | | | 11.00 | | | | 0.23 | | | | (1.09 | ) | | | (0.86 | ) | | | (0.21 | ) | | | (0.62 | ) | | | – | |
| 12/31/2014 | | | 11.47 | | | | 0.27 | | | | (0.09 | ) | | | 0.18 | | | | (0.41 | ) | | | (0.24 | ) | | | – | |
| 12/31/2013 | | | 10.54 | | | | 0.27 | | | | 1.16 | | | | 1.43 | | | | (0.42 | ) | | | (0.08 | ) | | | – | |
| 12/31/2012 | | | 9.53 | | | | 0.26 | | | | 1.07 | | | | 1.33 | | | | (0.31 | ) | | | – | | | | (0.01 | ) |
| 12/31/2011 | | | 10.59 | | | | 0.25 | | | | (1.03 | ) | | | (0.78 | ) | | | (0.28 | ) | | | – | | | | – | |
| Class F | | | | | | | | | | | | | | | | | | | | | | | | | | | | |
| 12/31/2015 | | | 12.05 | | | | 0.35 | | | | (1.18 | ) | | | (0.83 | ) | | | (0.31 | ) | | | (0.62 | ) | | | – | |
| 12/31/2014 | | | 12.49 | | | | 0.42 | | | | (0.11 | ) | | | 0.31 | | | | (0.51 | ) | | | (0.24 | ) | | | – | |
| 12/31/2013 | | | 11.43 | | | | 0.44 | | | | 1.22 | | | | 1.66 | | | | (0.52 | ) | | | (0.08 | ) | | | – | |
| 12/31/2012 | | | 10.29 | | | | 0.36 | | | | 1.19 | | | | 1.55 | | | | (0.40 | ) | | | – | | | | (0.01 | ) |
| 12/31/2011 | | | 11.41 | | | | 0.37 | | | | (1.12 | ) | | | (0.75 | ) | | | (0.37 | ) | | | – | | | | – | |
| Class I | | | | | | | | | | | | | | | | | | | | | | | | | | | | |
| 12/31/2015 | | | 12.12 | | | | 0.39 | | | | (1.22 | ) | | | (0.83 | ) | | | (0.32 | ) | | | (0.62 | ) | | | – | |
| 12/31/2014 | | | 12.56 | | | | 0.43 | | | | (0.11 | ) | | | 0.32 | | | | (0.52 | ) | | | (0.24 | ) | | | – | |
| 12/31/2013 | | | 11.49 | | | | 0.42 | | | | 1.26 | | | | 1.68 | | | | (0.53 | ) | | | (0.08 | ) | | | – | |
| 12/31/2012 | | | 10.34 | | | | 0.39 | | | | 1.18 | | | | 1.57 | | | | (0.41 | ) | | | – | | | | (0.01 | ) |
| 12/31/2011 | | | 11.47 | | | | 0.38 | | | | (1.13 | ) | | | (0.75 | ) | | | (0.38 | ) | | | – | | | | – | |
| Class R2 | | | | | | | | | | | | | | | | | | | | | | | | | | | | |
| 12/31/2015 | | | 12.27 | | | | 0.32 | | | | (1.23 | ) | | | (0.91 | ) | | | (0.25 | ) | | | (0.62 | ) | | | – | |
| 12/31/2014 | | | 12.72 | | | | 0.37 | | | | (0.13 | ) | | | 0.24 | | | | (0.45 | ) | | | (0.24 | ) | | | – | |
| 12/31/2013 | | | 11.62 | | | | 0.33 | | | | 1.30 | | | | 1.63 | | | | (0.45 | ) | | | (0.08 | ) | | | – | |
| 12/31/2012 | | | 10.46 | | | | 0.34 | | | | 1.18 | | | | 1.52 | | | | (0.35 | ) | | | – | | | | (0.01 | ) |
| 12/31/2011 | | | 11.55 | | | | 0.49 | | | | (1.26 | ) | | | (0.77 | ) | | | (0.32 | ) | | | – | | | | – | |
| | |
| 88 | See Notes to Financial Statements. |
| | | | | | | | | | Ratios to Average Net Assets:* | | Supplemental Data: |
| | | | | | | | | | | | |
Total
distri-
butions | | Net
asset
value,
end of
period | | Total
return
(%)(b) | | Total
expenses
after
waivers
and/or reim-
bursements
(%) | | Total
expenses
(%) | | Net
invest-
ment
income
(%) | | Net
assets,
end of
period
(000) | | Portfolio
turnover
rate
(%) |
| | | | | | | | | | | | | | | |
| | $(0.91 | ) | | | $10.28 | | | | (7.43 | ) | | | 0.35 | | | | 0.74 | | | | 2.90 | | | | $160,336 | | | | 21.63 | |
| | (0.73 | ) | | | 12.04 | | | | 2.15 | | | | 0.34 | | | | 0.74 | | | | 3.12 | | | | 167,387 | | | | 40.53 | |
| | (0.58 | ) | | | 12.49 | | | | 14.66 | | | | 0.31 | | | | 0.77 | | | | 3.20 | | | | 139,986 | | | | 23.32 | |
| | (0.39 | ) | | | 11.42 | | | | 15.02 | | | | 0.30 | | | | 0.80 | | | | 3.31 | | | | 110,910 | | | | 36.34 | |
| | (0.35 | ) | | | 10.29 | | | | (6.89 | ) | | | 0.28 | | | | 0.84 | | | | 3.11 | | | | 108,217 | | | | 27.66 | |
| | | | | | | | | | | | | | | | | | | | | | | | | | | | | | | |
| | (0.83 | ) | | | 9.32 | | | | (8.13 | ) | | | 1.09 | | | | 1.48 | | | | 2.05 | | | | 2,800 | | | | 21.63 | |
| | (0.64 | ) | | | 11.00 | | | | 1.49 | | | | 1.08 | | | | 1.48 | | | | 2.26 | | | | 4,533 | | | | 40.53 | |
| | (0.49 | ) | | | 11.46 | | | | 13.70 | | | | 1.05 | | | | 1.51 | | | | 2.32 | | | | 6,020 | | | | 23.32 | |
| | (0.32 | ) | | | 10.53 | | | | 14.24 | | | | 1.04 | | | | 1.54 | | | | 2.51 | | | | 6,939 | | | | 36.34 | |
| | (0.27 | ) | | | 9.51 | | | | (7.56 | ) | | | 0.99 | | | | 1.55 | | | | 2.29 | | | | 8,276 | | | | 27.66 | |
| | | | | | | | | | | | | | | | | | | | | | | | | | | | | | | |
| | (0.83 | ) | | | 9.31 | | | | (8.18 | ) | | | 1.10 | | | | 1.49 | | | | 2.14 | | | | 42,026 | | | | 21.63 | |
| | (0.65 | ) | | | 11.00 | | | | 1.47 | | | | 1.08 | | | | 1.48 | | | | 2.36 | | | | 45,990 | | | | 40.53 | |
| | (0.50 | ) | | | 11.47 | | | | 13.76 | | | | 1.05 | | | | 1.51 | | | | 2.45 | | | | 35,963 | | | | 23.32 | |
| | (0.32 | ) | | | 10.54 | | | | 14.17 | | | | 1.04 | | | | 1.53 | | | | 2.62 | | | | 29,821 | | | | 36.34 | |
| | (0.28 | ) | | | 9.53 | | | | (7.48 | ) | | | 0.97 | | | | 1.53 | | | | 2.42 | | | | 26,322 | | | | 27.66 | |
| | | | | | | | | | | | | | | | | | | | | | | | | | | | | | | |
| | (0.93 | ) | | | 10.29 | | | | (7.28 | ) | | | 0.20 | | | | 0.59 | | | | 2.98 | | | | 8,747 | | | | 21.63 | |
| | (0.75 | ) | | | 12.05 | | | | 2.39 | | | | 0.19 | | | | 0.59 | | | | 3.30 | | | | 12,885 | | | | 40.53 | |
| | (0.60 | ) | | | 12.49 | | | | 14.73 | | | | 0.16 | | | | 0.62 | | | | 3.60 | | | | 6,472 | | | | 23.32 | |
| | (0.41 | ) | | | 11.43 | | | | 15.28 | | | | 0.15 | | | | 0.65 | | | | 3.31 | | | | 2,423 | | | | 36.34 | |
| | (0.37 | ) | | | 10.29 | | | | (6.72 | ) | | | 0.10 | | | | 0.66 | | | | 3.36 | | | | 3,156 | | | | 27.66 | |
| | | | | | | | | | | | | | | | | | | | | | | | | | | | | | | |
| | (0.94 | ) | | | 10.35 | | | | (7.23 | ) | | | 0.10 | | | | 0.48 | | | | 3.21 | | | | 10,633 | | | | 21.63 | |
| | (0.76 | ) | | | 12.12 | | | | 2.47 | | | | 0.09 | | | | 0.49 | | | | 3.34 | | | | 42,754 | | | | 40.53 | |
| | (0.61 | ) | | | 12.56 | | | | 14.85 | | | | 0.06 | | | | 0.52 | | | | 3.44 | | | | 34,086 | | | | 23.32 | |
| | (0.42 | ) | | | 11.49 | | | | 15.42 | | | | 0.05 | | | | 0.55 | | | | 3.57 | | | | 22,289 | | | | 36.34 | |
| | (0.38 | ) | | | 10.34 | | | | (6.69 | ) | | | 0.00 | | | | 0.57 | | | | 3.38 | | | | 14,086 | | | | 27.66 | |
| | | | | | | | | | | | | | | | | | | | | | | | | | | | | | | |
| | (0.87 | ) | | | 10.49 | | | | (7.75 | ) | | | 0.70 | | | | 1.09 | | | | 2.81 | | | | 364 | | | | 21.63 | |
| | (0.69 | ) | | | 12.27 | | | | 1.86 | | | | 0.69 | | | | 1.09 | | | | 2.88 | | | | 116 | | | | 40.53 | |
| | (0.53 | ) | | | 12.72 | | | | 14.13 | | | | 0.66 | | | | 1.12 | | | | 2.68 | | | | 89 | | | | 23.32 | |
| | (0.36 | ) | | | 11.62 | | | | 14.71 | | | | 0.61 | | | | 1.11 | | | | 3.05 | | | | 107 | | | | 36.34 | |
| | (0.32 | ) | | | 10.46 | | | | (6.77 | ) | | | 0.34 | | | | 0.93 | | | | 4.44 | | | | 88 | | | | 27.66 | |
| | | |
| | See Notes to Financial Statements. | 89 |
Financial Highlights (concluded)
MULTI-ASSET GLOBAL OPPORTUNITY FUND
| | | | | | Per Share Operating Performance: |
| | | | | | Investment operations: | | Distributions to
shareholders from: |
| | | Net asset
value,
beginning
of period | | Net
invest-
ment
income(a) | | Net
realized
and
unrealized
gain (loss) | | Total
from
invest-
ment
opera-
tions | | Net
investment
income | | Net
realized
gain | | Return
of
capital |
| Class R3 | | | | | | | | | | | | | | | | | | | | | | | | | | | | |
| 12/31/2015 | | | 12.11 | | | | 0.31 | | | | (1.20 | ) | | | (0.89 | ) | | | (0.26 | ) | | | (0.62 | ) | | | – | |
| 12/31/2014 | | | 12.55 | | | | 0.37 | | | | (0.11 | ) | | | 0.26 | | | | (0.46 | ) | | | (0.24 | ) | | | – | |
| 12/31/2013 | | | 11.48 | | | | 0.36 | | | | 1.26 | | | | 1.62 | | | | (0.47 | ) | | | (0.08 | ) | | | – | |
| 12/31/2012 | | | 10.34 | | | | 0.35 | | | | 1.16 | | | | 1.51 | | | | (0.36 | ) | | | – | | | | (0.01 | ) |
| 12/31/2011 | | | 11.47 | | | | 0.34 | | | | (1.14 | ) | | | (0.80 | ) | | | (0.33 | ) | | | – | | | | – | |
| Class R4 | | | | | | | | | | | | | | | | | | | | | | | | | | | | |
| 6/30/2015 to 12/31/2015(c) | | | 11.96 | | | | 0.15 | | | | (1.10 | ) | | | (0.95 | ) | | | (0.11 | ) | | | (0.62 | ) | | | – | |
| Class R5 | | | | | | | | | | | | | | | | | | | | | | | | | | | | |
| 6/30/2015 to 12/31/2015(c) | | | 12.04 | | | | 0.17 | | | | (1.11 | ) | | | (0.94 | ) | | | (0.12 | ) | | | (0.62 | ) | | | – | |
| Class R6 | | | | | | | | | | | | | | | | | | | | | | | | | | | | |
| 6/30/2015 to 12/31/2015(c) | | | 12.04 | | | | 0.17 | | | | (1.11 | ) | | | (0.94 | ) | | | (0.13 | ) | | | (0.62 | ) | | | – | |
| | |
| * | Does not include expenses of the Underlying Funds in which the funds invests. |
| (a) | Calculated using average shares outstanding during the period. |
| (b) | Total return for Classes A, B and C does not consider the effects of sales loads and assumes the reinvestment of all distributions. Total return for all other classes assumes the reinvestment of all distributions. |
| (c) | Commenced on June 30, 2015. |
| (d) | Not annualized. |
| (e) | Annualized. |
| | |
| 90 | See Notes to Financial Statements. |
| | | | | | | | | | Ratios to Average Net Assets:* | | Supplemental Data: |
| | | | | | | | | | | | |
Total
distri-
butions | | Net
asset
value,
end of
period | | Total
return
(%)(b) | | Total
expenses
after
waivers
and/or reim-
bursements
(%) | | Total
expenses
(%) | | Net
invest-
ment
income
(%) | | Net
assets,
end of
period
(000) | | Portfolio
turnover
rate
(%) |
| | | | | | | | | | | | | | | |
| | (0.88 | ) | | | 10.34 | | | | (7.69 | ) | | | 0.58 | | | | 0.97 | | | | 2.66 | | | | 6,322 | | | | 21.63 | |
| | (0.70 | ) | | | 12.11 | | | | 2.01 | | | | 0.55 | | | | 0.95 | | | | 2.91 | | | | 6,780 | | | | 40.53 | |
| | (0.55 | ) | | | 12.55 | | | | 14.33 | | | | 0.53 | | | | 0.99 | | | | 2.95 | | | | 5,785 | | | | 23.32 | |
| | (0.37 | ) | | | 11.48 | | | | 14.81 | | | | 0.52 | | | | 1.02 | | | | 3.17 | | | | 5,211 | | | | 36.34 | |
| | (0.33 | ) | | | 10.34 | | | | (7.10 | ) | | | 0.47 | | | | 1.04 | | | | 3.03 | | | | 3,285 | | | | 27.66 | |
| | | | | | | | | | | | | | | | | | | | | | | | | | | | | | | |
| | (0.73 | ) | | | 10.28 | | | | (8.18 | )(d) | | | 0.31 | (e) | | | 0.74 | (e) | | | 2.79 | (e) | | | 9 | | | | 21.63 | |
| | | | | | | | | | | | | | | | | | | | | | | | | | | | | | | |
| | (0.74 | ) | | | 10.36 | | | | (8.10 | )(d) | | | 0.07 | (e) | | | 0.49 | (e) | | | 3.03 | (e) | | | 9 | | | | 21.63 | |
| | | | | | | | | | | | | | | | | | | | | | | | | | | | | | | |
| | (0.75 | ) | | | 10.35 | | | | (8.09 | )(d) | | | 0.09 | (e) | | | 0.37 | (e) | | | 3.02 | (e) | | | 34,823 | | | | 21.63 | |
| | | |
| | See Notes to Financial Statements. | 91 |
Notes to Financial Statements
Lord Abbett Global Fund, Inc. (the “Company”) is registered under the Investment Company Act of 1940, as amended (the “Act”), as an open-end management investment company and was incorporated under Maryland law on February 23, 1988. The Company consists of the following four funds (each, a “Fund” and collectively, the “Funds”) and their respective classes: Lord Abbett Emerging Markets Corporate Debt Fund (“Emerging Markets Corporate Debt Fund”), Class A, C, F, I, R2, R3, R4, R5 and R6 shares; Lord Abbett Emerging Markets Currency Fund (“Emerging Markets Currency Fund”), Class A, B, C, F, I, P, R2, R3, R4, R5 and R6 shares; Lord Abbett Emerging Markets Local Bond Fund (“Emerging Markets Local Bond Fund”), Class A, C, F, I, R2, R3, R4, R5 and R6 shares and Lord Abbett Multi-Asset Global Opportunity Fund (“Multi-Asset Global Opportunity Fund”), Class A, B, C, F, I, P, R2, R3, R4, R5 and R6 shares. Classes R4, R5 and R6 shares commenced on June 30, 2015. The Funds no longer issue Class B shares for purchase. Emerging Markets Currency Fund’s Class P shares were fully redeemed during the fiscal year. As of the date of this report, Multi-Asset Global Opportunity Fund has not issued Class P shares. Emerging Markets Corporate Debt Fund and Multi-Asset Global Opportunity Fund are each diversified as defined in the Act and Emerging Markets Currency Fund and Emerging Markets Local Bond Fund are each non-diversified as defined in the Act.
Emerging Markets Currency Fund’s investment objective is to seek high total return. Emerging Markets Corporate Debt Fund, Emerging Markets Local Bond Fund and Multi-Asset Global Opportunity Fund’s investment objective is total return. Multi-Asset Global Opportunity Fund invests principally in other mutual funds (“Underlying Funds”) managed by Lord, Abbett & Co. LLC (“Lord Abbett”).
Each class of shares has different expenses and dividends. A front-end sales charge is normally added to the net asset value (“NAV”) for Class A shares. There is no front-end sales charge in the case of Class B, C, F, I, P, R2, R3, R4, R5 and R6 shares, although there may be a contingent deferred sales charge (“CDSC”) in certain cases as follows: Class A shares purchased without a sales charge and redeemed before the first day of the month in which the one-year anniversary of the purchase falls (subject to certain exceptions as set forth in each Fund’s prospectus); Class B shares redeemed before the sixth anniversary of purchase; and Class C shares redeemed before the first anniversary of purchase. Class B shares will automatically convert to Class A shares on the 25th day of the month (or, if the 25th day is not a business day, the next business day thereafter) following the eighth anniversary of the day on which the purchase order was accepted.
The preparation of the financial statements in conformity with accounting principles generally accepted in the United States of America (“U.S. GAAP”) requires management to make certain estimates and assumptions that affect the reported amounts of assets and liabilities and disclosure of contingent assets and liabilities at the date of the financial statements and the reported amounts of increases and decreases in net assets from operations during the reporting period. Actual results could differ from those estimates. These Funds are considered investment companies under U.S. GAAP and follows the accounting and reporting guidance applicable to investment companies.
| 2. | SIGNIFICANT ACCOUNTING POLICIES |
| (a) | Investment Valuation–Under procedures approved by the Funds’ Board of Directors (the “Board”), Lord Abbett, the Funds’ investment manager, has formed a Pricing Committee to administer the pricing and valuation of portfolio investments and to ensure that prices utilized reasonably reflect fair value. Among other things, these procedures allow the Funds to utilize independent pricing services, quotations from securities and financial instrument dealers and other market sources to determine fair value. |
92
Notes to Financial Statements (continued)
| | Securities actively traded on any recognized U.S. or non-U.S. exchange or on The NASDAQ Stock Market LLC are valued at the last sale price or official closing price on the exchange or system on which they are principally traded. Events occurring after the close of trading on non-U.S. exchanges may result in adjustments to the valuation of foreign securities to reflect their fair value as of the close of regular trading on the New York Stock Exchange (“NYSE”). Each Fund may utilize an independent fair valuation service in adjusting the valuations of foreign securities. Unlisted equity securities are valued at the last quoted sale price or, if no sale price is available, at the mean between the most recently quoted bid and asked prices. Fixed income securities are valued based on evaluated prices supplied by independent pricing services, which reflect broker/dealer supplied valuations and the independent pricing services’ own electronic data processing techniques. Floating rate loans are valued at the average of bid and ask quotations obtained from dealers in loans on the basis of prices supplied by independent pricing services. Exchange traded options and futures contracts are valued at the last sale price in the market where they are principally traded. If no sale has occurred, the mean between the most recently quoted bid and asked prices is used. Forward foreign currency exchange contracts are valued using daily forward exchange rates. Swaps are valued daily using independent pricing services or quotations from broker/dealers to the extent available. Investments in the Underlying Funds are valued at their NAV each business day at the close of regular trading on the NYSE, normally 4:00 p.m. Eastern time. Exchange Traded Funds (“ETF”) actively traded on any recognized exchange or on The NASDAQ Stock Market LLC are valued at the last sale price or official closing price on the exchange or system on which they are principally traded. |
| | |
| | Securities for which prices are not readily available are valued at fair value as determined by the Pricing Committee. The Pricing Committee considers a number of factors, including observable and unobservable inputs, when arriving at fair value. The Pricing Committee may use related or comparable assets or liabilities, recent transactions, market multiples, book values, yield curves, broker quotes, observable trading activity, option adjusted spread models and other relevant information to determine the fair value of portfolio investments. The Board or a designated committee thereof regularly reviews fair value determinations made by the Pricing Committee and employs techniques such as reviewing related market activity, reviewing inputs and assumptions, and retrospectively comparing prices of subsequent purchases and sales transactions to fair value determinations made by the Pricing Committee. |
| | |
| | Short-term securities with 60 days or less remaining to maturity are valued using the amortized cost method, which approximates fair value. |
| | |
| (b) | Security Transactions–Security transactions are recorded as of the date that the securities are purchased or sold (trade date). Realized gains and losses on sales of portfolio securities are calculated using the identified-cost method. Realized and unrealized gains (losses) are allocated to each class of shares based upon the relative proportion of net assets at the beginning of the day. |
| | |
| (c) | Investment Income–Dividend income is recorded on the ex-dividend date. Interest income is recorded on the accrual basis as earned. Discounts are accreted and premiums are amortized using the effective interest method and are included in Interest and other income on the Statements of Operations. Investment income is allocated to each class of shares based upon the relative proportion of net assets at the beginning of the day. Withholding taxes on foreign dividends have been provided for in accordance with the applicable country’s tax rules and rates. |
93
Notes to Financial Statements (continued)
| (d) | Income Taxes–It is the policy of each Fund to meet the requirements of Subchapter M of the Internal Revenue Code applicable to regulated investment companies and to distribute substantially all taxable income and capital gains to its shareholders. Therefore, no income tax provision is required. |
| | |
| | Each Fund files U.S. federal and various state and local tax returns. No income tax returns are currently under examination. The statute of limitations on each Fund’s filed U.S. federal tax returns remains open for the fiscal periods ended December 31, 2012 through December 31, 2015. The statutes of limitations on the Company’s state and local tax returns may remain open for an additional year depending upon the jurisdiction. |
| | |
| (e) | Expenses–Expenses incurred by the Company that do not specifically relate to an individual fund are generally allocated to the funds within the Company on a pro rata basis by relative net assets. Expenses, excluding class-specific expenses, are allocated to each class of shares based upon the relative proportion of net assets at the beginning of the day. Class A, B, C, F, P, R2, R3 and R4 shares bear their class-specific share of all expenses and fees relating to the Funds’ 12b-1 Distribution Plan. |
| | |
| (f) | Foreign Transactions–The books and records of Emerging Markets Corporate Debt Fund, Emerging Markets Currency Fund and Emerging Markets Local Bond Fund are maintained in U.S. dollars and transactions denominated in foreign currencies are recorded in each Fund’s records at the rate prevailing when earned or recorded. Asset and liability accounts that are denominated in foreign currencies are adjusted daily to reflect current exchange rates and any unrealized gain (loss) is included in Net change in unrealized appreciation/depreciation on futures contracts, swaps and translation of assets and liabilities denominated in foreign currencies on each Fund’s Statement of Operations. The resultant exchange gains and losses upon settlement of such transactions are included in Net realized gain (loss) on futures contracts, swaps and foreign currency related transactions on each Fund’s Statement of Operations. Each Fund does not isolate that portion of the results of operations arising as a result of changes in the foreign exchange rates from the changes in market prices of the securities. |
| | |
| | The Funds use foreign currency exchange contracts to facilitate transactions in foreign-denominated securities. Losses from these transactions may arise from changes in the value of the foreign currency or if the counterparties do not perform under the contracts’ terms. |
| | |
| (g) | Forward Foreign Currency Exchange Contracts–Each Fund may enter into forward foreign currency exchange contracts in order to reduce their exposure to changes in foreign currency exchange rates on their foreign portfolio holdings, or gain or reduce exposure to foreign currency solely for investment purposes. A forward foreign currency exchange contract is a commitment to purchase or sell a foreign currency at a future date at a negotiated rate. The contracts are valued daily at forward exchange rates and any unrealized gain (loss) is included in Net change in unrealized appreciation/depreciation on futures contracts, swaps and translation of assets and liabilities denominated in foreign currencies on each Fund’s Statement of Operations. The gain (loss) arising from the difference between the U.S. dollar cost of the original contract and the value of the foreign currency in U.S. dollars upon closing of such contracts is included in Net realized gain (loss) on futures contracts, swaps and foreign currency related transactions on each Fund’s Statement of Operations. |
| | |
| (h) | Futures Contracts–Each Fund may purchase and sell futures contracts to enhance returns, to attempt to hedge some of its investment risk, or as a substitute position in lieu of holding the |
94
Notes to Financial Statements (continued)
| | underlying asset on which the instrument is based. At the time of entering into a futures transaction, an investor is required to deposit and maintain a specified amount of cash or eligible securities called “initial margin.” Subsequent payments made or received by a Fund called “variation margin” are made on a daily basis as the market price of the futures contract fluctuates. Each Fund will record an unrealized gain (loss) based on the amount of variation margin. When a contract is closed, a realized gain (loss) is recorded equal to the difference between the opening and closing value of the contract. |
| | |
| (i) | When-Issued, Forward Transactions or To-Be-Announced (“TBA”) Transactions–Emerging Markets Corporate Debt Fund, Emerging Markets Currency Fund and Emerging Markets Local Bond Fund may purchase portfolio securities on a when-issued or forward basis. When-issued, forward transactions or TBA transactions involve a commitment by a Fund to purchase securities, with payment and delivery (“settlement”) to take place in the future, in order to secure what is considered to be an advantageous price or yield at the time of entering into the transaction. During the period between purchase and settlement, the fair value of the securities will fluctuate and assets consisting of cash and/or marketable securities (normally short-term U.S. Government or U.S. Government sponsored enterprise securities) marked to market daily in an amount sufficient to make payment at settlement will be segregated at each Fund’s custodian in order to pay for the commitment. At the time each Fund makes the commitment to purchase a security on a when-issued basis, it will record the transaction and reflect the liability for the purchase and fair value of the security in determining its NAV. Each Fund, generally, has the ability to close out a purchase obligation on or before the settlement date rather than take delivery of the security. Under no circumstances will settlement for such securities take place more than 120 days after the purchase date. |
| | |
| (j) | Mortgage Dollar Rolls–Emerging Markets Corporate Debt Fund, Emerging Markets Currency Fund and Emerging Markets Local Bond Fund may enter into mortgage dollar rolls in which a Fund sells mortgage-backed securities for delivery in the current month and simultaneously contracts with the same counterparty to repurchase similar (same type, coupon and maturity) but not identical securities on a specified future date. During the roll period, each Fund loses the right to receive principal (including prepayments of principal) and interest paid on the securities sold. |
| | |
| (k) | Commercial Paper–Each Fund may purchase commercial paper. Commercial paper consists of unsecured promissory notes issued by corporations to finance short-term credit needs. Commercial paper is issued in bearer form with maturities generally not exceeding nine months. Commercial paper obligations may include variable amount master demand notes. |
| | |
| (l) | Repurchase Agreements–Each Fund may enter into repurchase agreements with respect to securities. A repurchase agreement is a transaction in which a fund acquires a security and simultaneously commits to resell that security to the seller (a bank or securities dealer) at an agreed-upon price on an agreed-upon date. Each Fund requires at all times that the repurchase agreement be collateralized by cash, or by securities of the U.S. Government, its agencies, its instrumentalities, or U.S. Government sponsored enterprises having a value equal to, or in excess of, the value of the repurchase agreement (including accrued interest). If the seller of the agreement defaults on its obligation to repurchase the underlying securities at a time when the fair value of these securities has declined, a Fund may incur a loss upon disposition of the securities. |
95
Notes to Financial Statements (continued)
| (m) | Interest Rate Swaps–Each Fund may invest in interest rate swaps in order to enhance returns or hedge against interest rate risk. Interest rate swaps are agreements in which one party pays a stream of interest payments, either fixed or floating, for another party’s stream of interest payments, either fixed or floating, on the same notional amount for a specified period of time. The interest rate swap agreement will normally be entered into on a zero coupon basis, meaning that the floating rate will be based on the cumulative of the variable rate, and the fixed rate will compound until the swap’s maturity date, at which point the payments would be netted. The swaps are valued daily and any unrealized gain (loss) is included in the Net change in unrealized appreciation/depreciation on futures contracts, swaps and translation of assets and liabilities denominated in foreign currencies on each Fund’s Statement of Operations. A liquidation payment received or made at the termination or maturity of the swap is recorded in realized gain (loss) and is included in Net realized gain (loss) on futures contracts, swaps and foreign currency related transactions on each Fund’s Statement of Operations. Daily changes in valuation of centrally cleared swaps, if any, are recorded as a receivable or payable for the change in value as appropriate (“variation margin”) on the Statements of Assets and Liabilities. |
| | |
| (n) | Credit Default Swaps–Each Fund may enter into credit default swap contracts. As a seller of a credit default swap contract (“seller of protection”), a Fund is required to pay the notional amount or other agreed-upon value of a referenced debt obligation to the counterparty in the event of a default by or other credit event involving the referenced issuer, obligation or index. In return, a Fund receives from the counterparty a periodic stream of payments over the term of the contract. |
| | |
| | As a purchaser of a credit default swap contract (“buyer of protection”), a Fund would receive the notional amount or other agreed upon value of a referenced debt obligation from the counterparty in the event of default by or other credit event involving the referenced issuer, obligation or index. In return, a Fund would make periodic payments to the counterparty over the term of the contracts, provided no event of default has occurred. |
| | |
| | These credit default swaps may have as a reference obligation corporate or sovereign issuers or credit indexes. These credit indexes are comprised of a basket of securities representing a particular sector of the market. During the period, Emerging Markets Currency Fund entered into credit default swaps based on CMBX indexes, which are comprised of a basket of commercial mortgage-backed securities. Multi-Asset Global Opportunity Fund entered into a centrally cleared credit default swap based on a CDX high yield index, which is comprised of a basket of high yield securities. |
| | |
| | Credit default swaps are fair valued based upon quotations from counterparties, brokers or market-makers and the change in value, if any, is recorded as an unrealized appreciation or depreciation. Daily changes in valuation of centrally cleared swaps, if any, are recorded as a receivable or payable for the change in value as appropriate (“variation margin”) on the Statements of Assets and Liabilities. For a credit default swap sold by a Fund, payment of the agreed-upon amount made by a Fund in the event of default of the referenced debt obligation is recorded as the cost of the referenced debt obligation purchased/received. For a credit default swap purchased by a Fund, the agreed-upon amount received by a Fund in the event of default of the referenced debt obligation is recorded as proceeds from sale/delivery of the referenced debt obligation and the resulting gain or loss realized on the referenced debt obligation is recorded as such by a Fund. |
96
Notes to Financial Statements (continued)
| | Any upfront payments made or received upon entering a credit default swap contract would be amortized or accreted over the life of the swap and recorded as realized gains or losses. Collateral, in the form of cash or securities, may be required to be held in segregated accounts with the custodian bank or broker in accordance with the swap agreement. The value and credit rating of each credit default swap where a Fund is the seller of protection, are both measures of the current payment/performance risk of the swap. As the value of the swap changes as a positive or negative percentage of the total notional amount, the payment/performance risk may decrease or increase, respectively. The maximum potential amount of future payments (undiscounted) that a Fund as a seller of protection could be required to make under a credit default swap agreement would be an amount equal to the notional amount of the agreement. These potential amounts would be partially offset by any recovery values of the respective referenced obligations, upfront payments received upon entering into the agreement, or net amounts received from the settlement of buy protection credit default swap agreements entered into by a Fund for the same referenced entity or entities. |
| | |
| | Entering into credit default swaps involves credit and market risk. Such risks involve the possibility that there will be no liquid market for these agreements, that there may be unfavorable changes in interest rates, and that Lord Abbett does not correctly predict the creditworthiness of the issuers of the reference obligation on which the credit default swap is based. There was minimal counterparty credit risk to the Multi-Asset Global Opportunity Fund during the fiscal year ended December 31, 2015, since the credit default swap entered into was traded through a central clearinghouse, which guarantees against default. |
| | |
| (o) | Floating Rate Loans–Emerging Markets Corporate Debt Fund, Emerging Markets Currency Fund and Emerging Markets Local Bond Fund may invest in floating rate loans, which usually take the form of loan participations and assignments. Loan participations and assignments are agreements to make money available to U.S. or foreign corporations, partnerships or other business entities (the “Borrower”) in a specified amount, at a specified rate and within a specified time. A loan is typically originated, negotiated and structured by a U.S. or foreign bank, insurance company or other financial institution (the “Agent”) for a group of loan investors (“Loan Investors”). The Agent typically administers and enforces the loan on behalf of the other Loan Investors in the syndicate and may hold any collateral on behalf of the Loan Investors. Such loan participations and assignments are typically senior, secured and collateralized in nature. A Fund records an investment when the Borrower withdraws money and records interest as earned. These loans pay interest at rates which are periodically reset by reference to a base lending rate plus a spread. These base lending rates are generally the prime rate offered by a designated U.S. bank or London InterBank Offered Rate (“LIBOR”). |
| | |
| | The loans in which each Fund invests may be subject to some restrictions on resale. For example, each Fund may be contractually obligated to receive approval from the Agent and/or Borrower prior to the sale of these investments. Each Fund generally has no right to enforce compliance with the terms of the loan agreement with the Borrower. As a result, each Fund assumes the credit risk of the Borrower, the selling participant and any other persons interpositioned between each Fund and the Borrower (“Intermediate Participants”). In the event that the Borrower, selling participant or Intermediate Participants become insolvent or enter into bankruptcy, each Fund may incur certain costs and delays in realizing payment or may suffer a loss of principal and/or interest. |
97
Notes to Financial Statements (continued)
| | Unfunded commitments represent the remaining obligation of each Fund to the Borrower. At any point in time, up to the maturity date of the issue, the Borrower may demand the unfunded portion. Until demanded by the Borrower, unfunded commitments are not recognized as an asset on the Statement of Assets and Liabilities. Unrealized appreciation/depreciation on unfunded commitments presented on the Statement of Assets and Liabilities represents mark to market of the unfunded portion of the Fund’s floating rate notes. As of December 31, 2015, each Fund had no unfunded loan commitments. |
| | |
| (p) | Fair Value Measurements–Fair value is defined as the price that each Fund would receive upon selling an investment or transferring a liability in an orderly transaction to an independent buyer in the principal or most advantageous market of the investment. A three-tier hierarchy is used to maximize the use of observable market data and minimize the use of unobservable inputs and to establish classification of fair value measurements for disclosure purposes. Inputs refer broadly to the assumptions that market participants would use in pricing the asset or liability, including assumptions about risk – for example, the risk inherent in a particular valuation technique used to measure fair value (such as a pricing model) and/or the risk inherent in the inputs to the valuation technique. Inputs may be observable or unobservable. Observable inputs reflect the assumptions market participants would use in pricing the asset or liability. Observable inputs are based on market data obtained from sources independent of the reporting entity. Unobservable inputs reflect the reporting entity’s own assumptions about the assumptions market participants would use in pricing the asset or liability. Unobservable inputs are based on the best information available in the circumstances. The three-tier hierarchy of inputs is summarized in the three broad Levels listed below: |
| • | Level 1 – | unadjusted quoted prices in active markets for identical investments; |
| | | |
| • | Level 2 – | other significant observable inputs (including quoted prices for similar investments, interest rates, prepayment speeds, credit risk, etc.); and |
| | | |
| • | Level 3 – | significant unobservable inputs (including each Fund’s own assumptions in determining the fair value of investments). |
| | A summary of inputs used in valuing each Fund’s investments and other financial instruments as of December 31, 2015 and, if applicable, Level 1/Level 2 transfers and Level 3 rollforwards for the fiscal year then ended is included in each Fund’s Schedule of Investments. |
| | |
| | Changes in valuation techniques may result in transfers into or out of an assigned level within the three-tier hierarchy. All transfers between different levels within the three-tier hierarchy are deemed to have occurred as of the beginning of the reporting period. The inputs or methodology used for valuing securities are not necessarily an indication of the risk associated with investing in those securities. |
| 3. | MANAGEMENT FEE AND OTHER TRANSACTIONS WITH AFFILIATES |
Management Fee
The Company has a management agreement with Lord Abbett, pursuant to which Lord Abbett supplies each Fund with investment management services and executive and other personnel, provides office space and pays for ordinary and necessary office and clerical expenses relating to research and statistical work and supervision of each Fund’s investment portfolio.
The management fee is based on each Fund’s average daily net assets at the following annual rates:
Emerging Markets Corporate Debt Fund and Emerging Markets Local Bond Fund
98
Notes to Financial Statements (continued)
| First $2 billion | .70% |
| Next $3 billion | .65% |
| Over $5 billion | .60% |
Emerging Markets Currency Fund
| First $1 billion | .50% |
| Over $1 billion | .45% |
Multi-Asset Global Opportunity Fund’s management fee is ..25% of the Fund’s average daily net assets.
For the fiscal year ended December 31, 2015, the effective management fee, net of waivers, was at the following annualized rate of each Fund’s average daily net assets:
| | Net Effective |
| | Management Fee |
| Emerging Markets Corporate Debt Fund | .04% |
| Emerging Markets Currency Fund | .50% |
| Emerging Markets Local Bond Fund | .00% |
| Multi-Asset Global Opportunity Fund | .10% |
In addition, Lord Abbett provides certain administrative services to each Fund pursuant to an Administrative Services Agreement in return for a fee at an annual rate of .04% of Emerging Markets Corporate Debt Fund, Emerging Markets Currency Fund and Emerging Markets Local Bond Fund’s average daily net assets. Multi-Asset Global Opportunity Fund does not pay such fee.
For the fiscal year ended December 31, 2015 and continuing through April 30, 2016, Lord Abbett has contractually agreed to waive its fees for Emerging Markets Corporate Debt Fund and Emerging Markets Local Bond Fund and reimburse each Fund’s expenses to the extent necessary to limit total net annual operating expenses, excluding 12b-1 fees, to an annual rate of 0.85% for each class other than R6. For the same period, Lord Abbett has contractually agreed to waive its fees and reimburse expenses to the extent necessary to limit total net annual operating expenses to an annual rate of 0.79% and 0.80% for Class R6 for Emerging Markets Corporate Debt Fund and Emerging Markets Local Bond Fund, respectively. This agreement may be terminated only upon the approval of the Board.
For the fiscal year ended December 31, 2015 and continuing through April 30, 2016, Lord Abbett has contractually agreed to waive its management fee at the annual rate of .15% for Multi-Asset Global Opportunity Fund. This agreement may be terminated only upon approval of the Board.
Multi-Asset Global Opportunity Fund has entered into a Servicing Arrangement with the Underlying Funds in which it invests pursuant to which each Underlying Fund will pay a portion of the expenses (excluding management fees and distribution and service fees) of Multi-Asset Global Opportunity Fund in proportion to the average daily value of total Underlying Fund shares owned by Multi-Asset Global Opportunity Fund. The expenses assumed by the Underlying Funds are reflected in Expenses assumed by Underlying Funds in Multi-Asset Global Opportunity Fund’s Statement of Operations and Receivables from affiliates on Multi-Asset Global Opportunity Fund’s Statement of Assets and Liabilities.
The Emerging Markets Corporate Debt Fund, Emerging Markets Currency Fund, and Emerging Markets Local Bond Fund, along with certain other funds managed by Lord Abbett (collectively, the “Underlying Funds”), have entered into a Service Arrangement with certain “Fund of Funds” managed by Lord Abbett, pursuant to which each Underlying Fund pays a portion of the expenses (excluding management fees and distribution and service fees) of each Fund of Funds in proportion to the average daily value of the Underlying Fund shares owned by each Fund of Funds. Amounts paid
99
Notes to Financial Statements (continued)
pursuant to the Service Arrangement, if applicable, are included in the Subsidy expense of each Fund’s Statement of Operations and Payable to affiliates on each Fund’s Statement of Asset and Liabilities.
As of December 31, 2015, the percentages of Emerging Markets Currency Fund’s outstanding shares owned by Lord Abbett Multi-Asset Balanced Opportunity Fund, Lord Abbett Multi-Asset Global Opportunity Fund and Lord Abbett Multi-Asset Income Fund were 38.19%, 10.04% and 42.24%, respectively.
12b-1 Distribution Plan
Each Fund has adopted a distribution plan with respect to Class A, B, C, F, P, R2, R3 and R4 shares pursuant to Rule 12b-1 under the Act, which provides for the payment of ongoing distribution and service fees to Lord Abbett Distributor LLC (the “Distributor”), an affiliate of Lord Abbett. The following annual rates have been authorized by the Board pursuant to the plan:
| Fees* | Class A(1) | Class B(2) | Class C(3) | Class F | Class P(2) | Class R2** | Class R3** | Class R4 |
| Service | .15% | .25% | .25% | – | .25% | .25% | .25% | .25% |
| Distribution | .05% | .75% | .75% | .10% | .20% | .35% | .25% | – |
| * | The Fund may designate a portion of the aggregate fee as attributable to service activities for purposes of calculating Financial Industry Regulatory Authority, Inc. (“FINRA”) sales charge limitations. |
| ** | Prior to the sale of shares to unaffiliated investors, service and distribution fees were fully waived. |
| (1) | The Class A 12b-1 fee for Multi-Asset Global Opportunity Fund is .25% (.25% service, .00% distribution) of the Fund’s average daily net assets. |
| (2) | Emerging Markets Currency Fund and Multi-Asset Global Opportunity Fund only. |
| (3) | Except for Multi-Asset Global Opportunity Fund, each Fund’s Class C 12b-1 fee is a blended rate calculated based on 1.00% of the Fund’s average daily net assets attributable to Class C shares held for less than one year and .80% (.25% service, .55% distribution) of the Fund’s average daily net assets attributable to Class C shares held for one year or more. All Class C shareholders of the Fund will bear Rule 12b-1 fees at the same rate. |
Classes I, R5 and R6 shares do not have a distribution plan.
Commissions
Distributor received the following commissions on sales of shares of the Funds, after concessions were paid to authorized dealers, for the fiscal year ended December 31, 2015:
| | | Distributor | | | Dealers’ |
| | | Commissions | | | Concessions |
| Emerging Markets Corporate Debt Fund | | $ | 455 | | | $ | 3,104 |
| Emerging Markets Currency Fund | | | 998 | | | | 5,663 |
| Emerging Markets Local Bond Fund | | | 232 | | | | 1,124 |
| Multi-Asset Global Opportunity Fund | | | 51,354 | | | | 344,900 |
Distributor received the following amount of CDSCs for the fiscal year ended December 31, 2015:
| | | Class A | | | Class C |
| Emerging Markets Corporate Debt Fund | | $ | – | | | $ | – |
| Emerging Markets Currency Fund | | | 192 | | | | 413 |
| Emerging Markets Local Bond Fund | | | – | | | | 52 |
| Multi-Asset Global Opportunity Fund | | | 9,822 | | | | 7,426 |
A Director and certain of the Company’s officers have an interest in Lord Abbett.
100
Notes to Financial Statements (continued)
| 4. | DISTRIBUTIONS AND CAPITAL LOSS CARRYFORWARDS |
Dividends from net investment income, if any, are declared daily and paid monthly for Emerging Markets Corporate Debt Fund, Emerging Markets Currency Fund and Emerging Markets Local Bond Fund and declared and paid quarterly for Multi-Asset Global Opportunity Fund. Taxable net realized gains from investment transactions, reduced by allowable capital loss carryforwards, if any, are declared and distributed to shareholders at least annually. The capital loss carryforward amount, if any, is available to offset future net capital gains. Dividends and distributions to shareholders are recorded on the ex-dividend date. The amounts of dividends and distributions from net investment income and net realized capital gains are determined in accordance with federal income tax regulations, which may differ from accounting principles generally accepted in the United States of America. These book/tax differences are either considered temporary or permanent in nature. To the extent these differences are permanent in nature, such amounts are reclassified within the components of net assets based on their federal tax basis treatment; temporary differences do not require reclassification. Dividends and distributions that exceed earnings and profits for tax purposes are reported as a tax return of capital.
The tax character of distributions paid during the fiscal years ended December 31, 2015 and 2014 was as follows:
| | | | | | Emerging Markets | | | | | | Emerging Markets |
| | | | | | Corporate Debt Fund | | | | | | Currency Fund |
| | | Year Ended | | | Year Ended | | | Year Ended | | | Year Ended |
| | | 12/31/2015 | | | 12/31/2014 | | | 12/31/2015 | | | 12/31/2014 |
| Distributions paid from: | | | | | | | | | | | | | | | |
| Ordinary income | | $ | 1,048,314 | | | $ | 885,571 | | | $ | 7,119,723 | | | $ | 12,222,988 |
| Net long-term capital gains | | | – | | | | 11,344 | | | | – | | | | – |
| Return of capital | | | – | | | | – | | | | 7,753,945 | | | | – |
| Total distributions paid | | $ | 1,048,314 | | | $ | 896,915 | | | $ | 14,873,668 | | | $ | 12,222,988 |
| | | | | | Emerging Markets | | | | | | Multi-Asset Global |
| | | | | | Local Bond Fund | | | | | | Opportunity Fund |
| | | Year Ended | | | Year Ended | | | Year Ended | | | Year Ended |
| | | 12/31/2015 | | | 12/31/2014 | | | 12/31/2015 | | | 12/31/2014 |
| Distributions paid from: | | | | | | | | | | | | | | | |
| Tax-exempt income | | $ | – | | | $ | – | | | $ | 21,272 | | | $ | 49,575 |
| Ordinary income | | | – | | | | 526,898 | | | | 7,547,772 | | | | 10,791,652 |
| Net long-term capital gains | | | – | | | | 984 | | | | 15,235,015 | | | | 5,011,100 |
| Return of capital | | | 523,251 | | | | 15,078 | | | | – | | | | – |
| Total distributions paid | | $ | 523,251 | | | $ | 542,960 | | | $ | 22,804,059 | | | $ | 15,852,327 |
As of December 31, 2015, the components of accumulated losses on a tax-basis were as follows:
| | | Emerging Markets | | | Emerging Markets | |
| | | Corporate Debt Fund | | | Currency Fund | |
| Undistributed ordinary income – net | | $ | 2,606 | | | $ | – | |
| Total undistributed earnings | | | 2,606 | | | | – | |
| Capital loss carryforwards* | | | (387,152 | ) | | | (88,940,119 | ) |
| Temporary differences | | | (151,180 | ) | | | (12,981,739 | ) |
| Unrealized losses – net | | | (827,507 | ) | | | (9,796,291 | ) |
| Total accumulated losses – net | | $ | (1,363,233 | ) | | $ | (111,718,149 | ) |
101
Notes to Financial Statements (continued)
| | | Emerging Markets | | | Multi-Asset Global | |
| | | Local Bond Fund | | | Opportunity Fund | |
| Undistributed ordinary income – net | | $ | – | | | $ | 739,204 | |
| Undistributed long-term capital gains – net | | | – | | | | 2,727,269 | |
| Total undistributed earnings | | | – | | | | 3,466,473 | |
| Capital loss carryforwards* | | | (159,752 | ) | | | – | |
| Temporary differences | | | (183,361 | ) | | | (208,956 | ) |
| Unrealized losses – net | | | (2,406,278 | ) | | | (43,255,427 | ) |
| Total accumulated losses – net | | $ | (2,749,391 | ) | | $ | (39,997,910 | ) |
| * | The capital losses will carryforward indefinitely. |
At each Fund’s election, certain losses incurred within the taxable year (Qualified Late-Year Losses) are deemed to arise on the first business day of the Fund’s next taxable year. The following Funds incurred and will elect to defer late-year losses during fiscal 2015 as follows:
| | | Late-Year Ordinary | | | Post-October Capital |
| Emerging Markets Corporate Debt Fund | | $ | 466 | | | $ | 149,861 |
| Emerging Markets Currency Fund | | | – | | | | 11,749,460 |
| Emerging Markets Local Bond Fund | | | 129,242 | | | | 32,841 |
| Multi-Asset Global Opportunity Fund | | | 162,050 | | | | – |
As of December 31, 2015, the aggregate unrealized security gains and losses based on cost for U.S. federal income tax purposes were as follows:
| | | Emerging Markets | | | Emerging Markets | |
| | | Corporate Debt Fund | | | Currency Fund | |
| Tax cost | | $ | 38,407,142 | | | $ | 477,124,014 | |
| Gross unrealized gain | | | 219,932 | | | | 385,916 | |
| Gross unrealized loss | | | (1,047,400 | ) | | | (12,824,989 | ) |
| Net unrealized security loss | | $ | (827,468 | ) | | $ | (12,439,073 | ) |
| | | Emerging Markets | | | Multi-Asset Global | |
| | | Local Bond Fund | | | Opportunity Fund | |
| Tax cost | | $ | 9,367,545 | | | $ | 308,878,668 | |
| Gross unrealized gain | | | – | | | | 4,640,678 | |
| Gross unrealized loss | | | (2,393,085 | ) | | | (48,030,091 | ) |
| Net unrealized security loss | | $ | (2,393,085 | ) | | $ | (43,389,413 | ) |
The difference between book-basis and tax-basis unrealized gains (losses) is attributable to the tax treatment of certain distributions received, amortization of premium and wash sales.
Permanent items identified during the fiscal year ended December 31, 2015 have been reclassified among the components of net assets based on their tax basis treatment as follows:
| | | Undistributed | | | | | | | |
| | | (Distributions in | | | Accumulated | | | | |
| | | Excess of) Net | | | Net Realized | | | Paid-in | |
| | | Investment Income | | | Loss | | | Capital | |
| Emerging Markets Corporate Debt Fund | | $ | 92,671 | | | $ | (92,671 | ) | | $ | – | |
| Emerging Markets Currency Fund | | | 3,722,649 | | | | (3,722,649 | ) | | | – | |
| Emerging Markets Local Bond Fund | | | (583,032 | ) | | | 1,034,491 | | | | (451,459 | ) |
| Multi-Asset Global Opportunity Fund | | | (627,086 | ) | | | 627,086 | | | | – | |
102
Notes to Financial Statements (continued)
The permanent differences are attributable to the tax treatment of foreign currency transactions, certain securities, net investment losses, premium amortization, certain distributions, and principal paydown gains and losses.
| 5. | PORTFOLIO SECURITIES TRANSACTIONS |
Purchases and sales of investment securities (excluding short-term investments) for the fiscal year ended December 31, 2015 were as follows:
| | | U.S. | | | Non-U.S. | | | U.S. | | | Non-U.S. |
| | | Government | | | Government | | | Government | | | Government |
| | | Purchases* | | | Purchases | | | Sales* | | | Sales |
| Emerging Markets Corporate Debt Fund | | $ | – | | | $ | 58,489,219 | | | $ | – | | | $ | 32,964,018 |
| Emerging Markets Currency Fund | | | 45,533,398 | | | | 308,445,658 | | | | 17,938,083 | | | | 202,167,003 |
| Emerging Markets Local Bond Fund | | | – | | | | 5,102,906 | | | | – | | | | 6,360,488 |
| Multi-Asset Global Opportunity Fund | | | – | | | | 80,821,400 | | | | – | | | | 61,381,941 |
| * | Includes U.S. Government sponsored enterprises securities. |
Each Fund is permitted to purchase and sell securities (“cross-trade”) from and to other Lord Abbett Funds or client accounts pursuant to procedures approved by the Board in compliance with Rule 17a-7 under the Act (the “Rule”). Each cross-trade is executed at a fair market price in compliance with provisions of the Rule. For the year ended December 31, 2015, Emerging Markets Currency Fund engaged in cross-trade purchases of $441,094 and sales of $13,010,773, which resulted in net realized losses of ($208,261).
| 6. | DISCLOSURES ABOUT DERIVATIVE INSTRUMENTS AND HEDGING ACTIVITIES |
Each Fund entered into forward foreign currency exchange contracts for the fiscal year ended December 31, 2015 (as described in note 2(g)). A forward foreign currency exchange contract reduces each Fund’s exposure to changes in the value of the currency it will deliver (or settle in cash) and increases its exposure to changes in the value of the currency it will receive (or settle in cash) for the duration of the contract. Each Fund’s use of forward foreign currency exchange contracts involves the risk that Lord Abbett will not accurately predict currency movements, and each Fund’s returns could be reduced as a result. Forward foreign currency exchange contracts are subject to the risk that those currencies will decline in value relative to the U.S. dollar, or, in the case of hedged positions, that the U.S. dollar will decline relative to the currency being hedged. Currency rates in foreign countries may fluctuate significantly over short periods of time. Each Fund’s risk of loss from counterparty credit risk is the unrealized appreciation on foreign currency exchange contracts and deposits with brokers as collateral.
Multi-Asset Global Opportunity Fund entered into E-Mini S&P 500 Index futures contracts for the fiscal year ended December 31, 2015 (as described in note 2(h)) for investment purposes. The Fund bears the risk that the underlying index will move unexpectedly, in which case the Fund may realize a loss. There is minimal counterparty credit risk to the Fund since futures are exchange traded and the exchange’s clearinghouse, as counterparty to all exchange traded futures, guarantees futures against default.
Each Fund entered into U.S. Treasury futures contracts for the fiscal year ended December 31, 2015 (as described in note 2(h)) to economically hedge against changes in interest rates. The Funds bear the risk of interest rates moving unexpectedly, in which case the Funds may not achieve the anticipated benefits of the futures contracts and realize a loss. There is minimal counterparty credit
103
Notes to Financial Statements (continued)
risk to the Funds since futures are exchange traded and the exchange’s clearinghouse, as counterparty to all exchange traded futures, guarantees futures against default.
Emerging Markets Currency Fund and Multi-Asset Global Opportunity Fund entered into credit default swaps on indexes for the fiscal year ended December 31, 2015 (as described in note 2(n)) to economically hedge credit risk. Credit default swaps on indexes involve the exchange of a fixed rate premium for protection against the loss in value of underlying securities within an index in the event of a defined credit event, such as payment default or bankruptcy. Under a credit default swap one party acts as a guarantor by receiving the fixed periodic payment in exchange for the commitment to purchase the underlying security at par if the defined credit event occurs. Upon the occurrence of a defined credit event, the difference between the value of the reference obligation and the swap’s notional amount is recorded as realized gain or loss on swap transactions in the Statements of Operations. Emerging Markets Currency Fund’s maximum risk of loss from counterparty risk, either as the protection seller or as the protection buyer, is the fair value of the contract. There is minimal counterparty credit risk to the Multi-Asset Global Opportunity Fund since centrally cleared credit default swaps are traded through a central clearinghouse. As the counterparty to all centrally cleared credit default swaps, the clearinghouse guarantees credit default swaps against default.
Emerging Markets Currency Fund entered into interest rate swaps for the fiscal year ended December 31, 2015 (as described in note 2(m)) to economically hedge against interest rate risk. The Fund’s use of interest rate swaps involves the risk that Lord Abbett will not accurately predict expectations of interest rates, and the Fund’s returns could be reduced as a result. There is minimal counterparty credit risk to the Fund since interest rate swaps are traded through a central clearinghouse. As the counterparty to all centrally cleared interest rate swaps, the clearinghouse guarantees interest rate swaps against default.
As of December 31, 2015, each Fund had the following derivatives at fair value, grouped into appropriate risk categories that illustrate the Funds’ use of derivative instruments:
| Emerging Markets Corporate Debt Fund | |
| | | | | | Foreign | |
| | | Interest Rate | | | Currency | |
| Asset Derivatives | | Contracts | | | Contracts | |
| Forward Foreign Currency Exchange Contracts(1) | | $ | – | | | $ | 15,060 | |
| Futures Contracts(3) | | | 1,340 | | | | – | |
| | | | | | | | | |
| Liability Derivatives | | | | | | | | |
| Forward Foreign Currency Exchange Contracts(2) | | $ | – | | | $ | 16,442 | |
| | | Emerging Markets Currency Fund | |
| | | | | | Foreign | | | | |
| | | Interest Rate | | | Currency | | | Credit | |
| Asset Derivatives | | Contracts | | | Contracts | | | Contracts | |
| Forward Foreign Currency Exchange Contracts(1) | | $ | – | | | $ | 6,234,134 | | | $ | – | |
| Futures Contracts(3) | | | 286,949 | | | | – | | | | – | |
| | | | | | | | | | | | | |
| Liability Derivatives | | | | | | | | | | | | |
| Credit Default Swaps(4) | | $ | – | | | $ | – | | | $ | 3,985 | |
| Forward Foreign Currency Exchange Contracts(2) | | | – | | | | 11,180,001 | | | | – | |
| Interest Rate Swaps(5) | | | 1,091 | | | | – | | | | – | |
104
Notes to Financial Statements (continued)
| Emerging Markets Local Bond Fund | |
| | | | | | Foreign | |
| | | Interest Rate | | | Currency | |
| Asset Derivatives | | Contracts | | | Contracts | |
| Forward Foreign Currency Exchange Contracts(1) | | | | | | $ | 24,796 | |
| Futures Contracts(3) | | $ | 838 | | | | | |
| | | | | | | | | |
| Liability Derivatives | | | | | | | | |
| Forward Foreign Currency Exchange Contracts(2) | | | | | | $ | 13,110 | |
| | | Multi-Asset Global Opportunity Fund | |
| | | Equity | | | | | | Foreign | | | | |
| | | Index | | | Interest Rate | | | Currency | | | Credit | |
| Asset Derivatives | | Contracts | | | Contracts | | | Contracts | | | Contracts | |
| Centrally Cleared Credit Default Swaps(6) | | $ | – | | | $ | – | | | $ | – | | | $ | 118,036 | |
| Forward Foreign Currency Exchange Contracts(1) | | | – | | | | – | | | | 438,363 | | | | – | |
| Futures Contracts(3) | | | 10,026 | | | | 27,961 | | | | – | | | | – | |
| | | | | | | | | | | | | | | | | |
| Liability Derivatives | | | | | | | | | | | | | | | | |
| Forward Foreign Currency Exchange Contracts(2) | | | | | | | – | | | $ | 374,660 | | | | – | |
| (1) | Statements of Assets and Liabilities location: Unrealized appreciation on forward foreign currency exchange contracts. |
| (2) | Statements of Assets and Liabilities location: Unrealized depreciation on forward foreign currency exchange contracts. |
| (3) | Statements of Assets and Liabilities location: Includes cumulative unrealized appreciation/depreciation of futures contracts as reported in the Schedule of Investments. Only current day’s variation margin is reported within the Statements of Assets and Liabilities. |
| (4) | Statements of Assets and Liabilities location: Credit default swap agreement payable, at fair value. |
| (5) | Statements of Assets and Liabilities location: Includes cumulative unrealized appreciation/depreciation of interest rate swaps, as reported in the Schedule of Investments. Only current day’s variation margin is reported within the Statements of Assets and Liabilities. |
| (6) | Statements of Assets and Liabilities location: Includes cumulative unrealized appreciation/depreciation of centrally cleared credit default swap contracts as reported in the Schedule of Investments. Only current day’s variation margin is reported within the Statements of Assets and Liabilities. |
Transactions in derivative instruments for the fiscal year ended December 31, 2015, were as follows:
| Emerging Markets Corporate Debt Fund | |
| | | | | | Foreign | |
| | | Interest Rate | | | Currency | |
| | | Contracts | | | Contracts | |
| Net Realized Gain (Loss)(1) | | | | | | | | |
| Forward Foreign Currency Exchange Contracts | | $ | – | | | $ | 52,196 | |
| Futures Contracts | | | (16,103 | ) | | | – | |
| Net Change in Unrealized Appreciation/Depreciation(2) | | | | | | | | |
| Forward Foreign Currency Exchange Contracts | | $ | – | | | $ | (10,208 | ) |
| Futures Contracts | | | 5,020 | | | | – | |
| Average Number of Contracts/Notional Amounts* | | | | | | | | |
| Forward Foreign Currency Exchange Contracts(3) | | $ | – | | | $ | 971,888 | |
| Futures Contracts(4) | | | 1 | | | | – | |
105
Notes to Financial Statements (continued)
| | | Emerging Markets Currency Fund | |
| | | | | | Foreign | | | | |
| | | Interest Rate | | | Currency | | | Credit | |
| | | Contracts | | | Contracts | | | Contracts | |
| Net Realized Gain (Loss)(1) | | | | | | | | | | | | |
| Credit Default Swaps | | $ | – | | | $ | – | | | $ | 7,380 | |
| Forward Foreign Currency Exchange Contracts | | | – | | | | (54,329,083 | ) | | | – | |
| Futures Contracts | | | (1,096,254 | ) | | | – | | | | – | |
| Interest Rate Swaps | | | (184,469 | ) | | | – | | | | – | |
| Net Change in Unrealized Appreciation/Depreciation(2) | | | | | | | | | | | | |
| Credit Default Swaps | | $ | – | | | $ | – | | | $ | 14,153 | |
| Forward Foreign Currency Exchange Contracts | | | – | | | | 5,680,799 | | | | – | |
| Futures Contracts | | | 372,806 | | | | – | | | | – | |
| Interest Rate Swaps | | | 46,121 | | | | – | | | | – | |
| Average Number of Contracts/Notional Amounts* | | | | | | | | | | | | |
| Credit Default Swaps(3) | | $ | – | | | $ | – | | | $ | 3,300,000 | |
| Forward Foreign Currency Exchange Contracts(3) | | $ | – | | | $ | 662,344,573 | | | $ | – | |
| Futures Contracts(4) | | | 860 | | | | – | | | | – | |
| Interest Rate Swaps(3) | | $ | 50,153,846 | | | $ | – | | | $ | – | |
| Emerging Markets Local Bond Fund | |
| | | | | | Foreign | |
| | | Interest Rate | | | Currency | |
| | | Contracts | | | Contracts | |
| Net Realized Gain (Loss)(1) | | | | | | | | |
| Forward Foreign Currency Exchange Contracts | | $ | – | | | $ | (61,319 | ) |
| Futures Contracts | | | (1,409 | ) | | | – | |
| Net Change in Unrealized Appreciation/Depreciation(2) | | | | | | | | |
| Forward Foreign Currency Exchange Contracts | | $ | – | | | $ | 4,604 | |
| Futures Contracts | | | 838 | | | | – | |
| Average Number of Contracts/Notional Amounts* | | | | | | | | |
| Forward Foreign Currency Exchange Contracts(3) | | $ | – | | | $ | 7,731,079 | |
| Futures Contracts(4) | | | 3 | | | | – | |
106
Notes to Financial Statements (continued)
| | | | | | Multi-Asset Global Opportunity Fund | |
| | | Equity
Index
Contracts | | | Interest Rate
Contracts | | | Foreign
Currency
Contracts | | | Credit
Contracts | |
| Net Realized Gain (Loss)(1) | | | | | | | | | | | | | | | | |
| Centrally Cleared Credit Default Swap | | $ | – | | | $ | – | | | $ | – | | | $ | (13,119 | ) |
| Forward Foreign Currency Exchange Contracts | | | – | | | | – | | | | 1,883,659 | | | | – | |
| Futures Contracts | | | 123,321 | | | | (105,708 | ) | | | – | | | | – | |
| Net Change in Unrealized Appreciation/Depreciation(2) | | | | | | | | | | | | | | | | |
| Centrally Cleared Credit Default Swap | | $ | – | | | $ | – | | | $ | – | | | $ | 118,036 | |
| Forward Foreign Currency Exchange Contracts | | | – | | | | – | | | | (190,618 | ) | | | – | |
| Futures Contracts | | | (834 | ) | | | 77,905 | | | | – | | | | – | |
| Average Number of Contracts/Notional Amounts* | | | | | | | | | | | | | | | | |
| Centrally Cleared Credit Default Swap(3) | | $ | – | | | $ | – | | | $ | – | | | $ | 844,615 | |
| Forward Foreign Currency Exchange Contracts(3) | | $ | – | | | $ | – | | | $ | 27,472,450 | | | $ | – | |
| Futures Contracts(4) | | | 5 | | | | 50 | | | | – | | | | – | |
| * | | Calculated based on the number of contracts or notional amounts for the fiscal year ended December 31, 2015. |
| (1) | | Statements of Operations location: Net realized gain (loss) on futures contracts, swaps and foreign currency related transactions. |
| (2) | | Statements of Operations location: Net change in unrealized appreciation/depreciation on futures contracts, swaps, and translation of assets and liabilities denominated in foreign currencies. |
| (3) | | Amount represents notional amounts in U.S. dollars. |
| (4) | | Amount represents number of contracts. |
| 7. | DISCLOSURES ABOUT OFFSETTING ASSETS AND LIABILITIES |
The Financial Accounting Standards Board (“FASB”) requires disclosures intended to help better assess the effect or potential effect of offsetting arrangements on a fund’s financial position. The following tables illustrate gross and net information about recognized assets and liabilities eligible for offset in the statements of assets and liabilities; and disclose such amounts subject to an enforceable master netting agreement or similar agreement, by counterparty. A master netting agreement is an agreement between a fund and a counterparty which provides for the net settlement of amounts owed under all contracts traded under that agreement, as well as cash collateral, through a single payment by one party to the other in the event of default on or termination of any one contract. The Funds’ accounting policy with respect to balance sheet offsetting is that, absent an event of default by the counterparty or a termination of the agreement, the master netting agreement does not result in an offset of reported amounts of financial assets and liabilities in the statement of assets and liabilities across transactions between the Funds and the applicable counterparty:
107
Notes to Financial Statements (continued)
| | | Emerging Markets Corporate Debt Fund |
| | | | | | | Gross Amounts | | | Net Amounts of |
| | | | | | | Offset in the | | | Assets Presented |
| | | Gross Amounts of | | | Statement of Assets | | | in the Statement of |
| Description | | Recognized Assets | | | and Liabilities | | | Assets and Liabilities |
| Forward Foreign Currency Exchange Contracts | | $ | 15,060 | | | $ | – | | | $ | 15,060 |
| Repurchase Agreement | | | 1,165,774 | | | | – | | | | 1,165,774 |
| Total | | $ | 1,180,834 | | | $ | – | | | $ | 1,180,834 |
| | | Net Amounts | | | | | | | | | | | | |
| | | of Assets | | | Amounts Not Offset in the | | | |
| | | Presented in | | Statement of Assets and Liabilities | | | |
| | | the Statement | | | | | | Cash | | | Securities | | | |
| | | of Assets and | | | Financial | | | Collateral | | | Collateral | | | Net |
| Counterparty | | Liabilities | | | Instruments | | | Received(a) | | | Received(a) | | | Amount(b) |
| Fixed Income Clearing Corp. | | $ | 1,165,774 | | | $ | – | | | $ | – | | | $ | (1,165,774 | ) | | $ | – |
| Goldman Sachs | | | 9,428 | | | | (1,917 | ) | | | – | | | | – | | | | 7,511 |
| Morgan Stanley | | | 5,554 | | | | – | | | | – | | | | – | | | | 5,554 |
| State Street Bank and Trust | | | 78 | | | | – | | | | – | | | | – | | | | 78 |
| Total | | $ | 1,180,834 | | | $ | (1,917 | ) | | $ | – | | | $ | (1,165,774 | ) | | $ | 13,143 |
| | | | | | Gross Amounts | | | Net Amounts of |
| | | | | | Offset in the | | | Liabilities Presented |
| | | Gross Amounts of | | | Statement of Assets | | | in the Statement of |
| Description | | Recognized Liabilities | | | and Liabilities | | | Assets and Liabilities |
| Forward Foreign Currency Exchange Contracts | | $ | 16,442 | | | $ | – | | | $ | 16,442 |
| Total | | $ | 16,442 | | | $ | – | | | $ | 16,442 |
| | | Net Amounts | | | | | | | | | | | | |
| | | of Liabilities | | | Amounts Not Offset in the | | | |
| | | Presented in | | | Statement of Assets and Liabilities | | | |
| | | the Statement | | | | | | | Cash | | | Securities | | | | |
| | | of Assets and | | | Financial | | | Collateral | | | Collateral | | | Net |
| Counterparty | | Liabilities | | | Instruments | | | Pledged(a) | | | Pledged(a) | | | Amount(c) |
| Citibank | | $ | 14,525 | | | $ | – | | | $ | – | | | $ | – | | | $ | 14,525 |
| Goldman Sachs | | | 1,917 | | | | (1,917 | ) | | | – | | | | – | | | | – |
| Total | | $ | 16,442 | | | $ | (1,917 | ) | | $ | – | | | $ | – | | | $ | 14,525 |
| | | Emerging Markets Currency Fund |
| | | | | | | Gross Amounts | | | Net Amounts of |
| | | | | | | Offset in the | | | Assets Presented |
| | | Gross Amounts of | | | Statement of Assets | | | in the Statement of |
| Description | | Recognized Assets | | | and Liabilities | | | Assets and Liabilities |
| Forward Foreign Currency Exchange Contracts | | $ | 6,234,134 | | | $ | – | | | $ | 6,234,134 |
| Total | | $ | 6,234,134 | | | $ | – | | | $ | 6,234,134 |
108
Notes to Financial Statements (continued)
| | | Net Amounts | | | | | | | | | | | | |
| | | of Assets | | | Amounts Not Offset in the | | | |
| | | Presented in | | | Statement of Assets and Liabilities | | | |
| | | the Statement | | | | | | Cash | | | Securities | | | |
| | | of Assets and | | | Financial | | | Collateral | | | Collateral | | | Net |
| Counterparty | | Liabilities | | | Instruments | | | Received(a) | | | Received(a) | | | Amount(b) |
| Bank of America | | $ | 1,648,271 | | | $ | (1,648,271 | ) | | $ | – | | | $ | – | | | $ | – |
| Barclays Bank plc | | | 244,866 | | | | (244,866 | ) | | | – | | | | – | | | | – |
| Citibank N.A. | | | 15,026 | | | | – | | | | – | | | | – | | | | 15,026 |
| Deutsche Bank AG | | | 299,138 | | | | (299,138 | ) | | | – | | | | – | | | | – |
| Goldman Sachs | | | 208,643 | | | | (208,643 | ) | | | – | | | | – | | | | – |
| J.P. Morgan Chase | | | 3,262,449 | | | | (3,262,449 | ) | | | – | | | | – | | | | – |
| Morgan Stanley | | | 353,655 | | | | (353,655 | ) | | | – | | | | – | | | | – |
| State Street Bank and Trust | | | 193,704 | | | | (70,959 | ) | | | (10,000 | ) | | | – | | | | 112,745 |
| UBS AG | | | 8,382 | | | | (8,382 | ) | | | – | | | | – | | | | – |
| Total | | $ | 6,234,134 | | | $ | (6,096,363 | ) | | $ | (10,000 | ) | | $ | – | | | $ | 127,771 |
| | | | | | Gross Amounts | | | Net Amounts of |
| | | | | | Offset in the | | | Liabilities Presented |
| | | Gross Amounts of | | Statement of Assets | | | in the Statement of |
| Description | | Recognized Liabilities | | | and Liabilities | | | Assets and Liabilities |
| Credit Default Swaps | | $ | 3,985 | | | $ | – | | | $ | 3,985 |
| Forward Foreign Currency Exchange Contracts | | | 11,180,001 | | | | – | | | | 11,180,001 |
| Total | | $ | 11,183,986 | | | $ | – | | | $ | 11,183,986 |
| | | Net Amounts | | | | | | | | | | | | |
| | | of Liabilities | | | Amounts Not Offset in the | | | |
| | | Presented in | | | Statement of Assets and Liabilities | | | |
| | | the Statement | | | | | | Cash | | | Securities | | | |
| | | of Assets and | | | Financial | | | Collateral | | | Collateral | | | Net |
| Counterparty | | Liabilities | | | Instruments | | | Pledged(a) | | | Pledged(a) | | | Amount(c) |
| Bank of America | | $ | 2,891,890 | | | $ | (1,648,271 | ) | | $ | (1,243,619 | ) | | $ | – | | | $ | – |
| Barclays Bank plc | | | 758,981 | | | | (244,866 | ) | | | (360,000 | ) | | | – | | | | 154,115 |
| Credit Suisse | | | 3,175 | | | | – | | | | – | | | | – | | | | 3,175 |
| Deutsche Bank AG | | | 2,056,744 | | | | (299,138 | ) | | | (1,350,000 | ) | | | – | | | | 407,606 |
| Goldman Sachs | | | 397,417 | | | | (208,643 | ) | | | – | | | | – | | | | 188,774 |
| J.P. Morgan Chase | | | 3,425,795 | | | | (3,262,449 | ) | | | (163,346 | ) | | | – | | | | – |
| Morgan Stanley | | | 1,549,653 | | | | (353,655 | ) | | | (300,000 | ) | | | – | | | | 895,998 |
| Standard Chartered Bank | | | 19,416 | | | | – | | | | – | | | | – | | | | 19,416 |
| State Street Bank and Trust | | | 70,959 | | | | (70,959 | ) | | | – | | | | – | | | | – |
| UBS AG | | | 9,956 | | | | (8,382 | ) | | | – | | | | – | | | | 1,574 |
| Total | | $ | 11,183,986 | | | $ | (6,096,363 | ) | | $ | (3,416,965 | ) | | $ | – | | | $ | 1,670,658 |
| | Emerging Markets Local Bond Fund |
| | | | | | | | | | |
| | | | | | | Gross Amounts | | | Net Amounts of |
| | | | | | | Offset in the | | | Assets Presented |
| | | Gross Amounts of | | | Statement of Assets | | | in the Statement of |
| Description | | Recognized Assets | | | and Liabilities | | | Assets and Liabilities |
| Forward Foreign Currency Exchange Contracts | | $ | 24,796 | | | $ | – | | | $ | 24,796 |
| Total | | $ | 24,796 | | | $ | – | | | $ | 24,796 |
109
Notes to Financial Statements (continued)
| | | Net Amounts | | | | | | | | | | | | |
| | | of Assets | | | Amounts Not Offset in the | | | |
| | | Presented in | | | Statement of Assets and Liabilities | | | |
| | | the Statement | | | | | | Cash | | | Securities | | | |
| | | of Assets and | | | Financial | | | Collateral | | | Collateral | | | Net |
| Counterparty | | Liabilities | | | Instruments | | | Received(a) | | | Received(a) | | | Amount(b) |
| Bank of America | | $ | 2,019 | | | $ | (2,019 | ) | | $ | – | | | $ | – | | | $ | – |
| Citibank | | | 739 | | | | (315 | ) | | | – | | | | – | | | | 424 |
| Goldman Sachs | | | 90 | | | | – | | | | – | | | | – | | | | 90 |
| Morgan Stanley | | | 6,995 | | | | (1,553 | ) | | | – | | | | – | | | | 5,442 |
| Standard Chartered Bank | | | 3,143 | | | | (1,715 | ) | | | – | | | | – | | | | 1,428 |
| State Street Bank and Trust | | | 4,230 | | | | (3,416 | ) | | | – | | | | – | | | | 814 |
| UBS AG | | | 7,580 | | | | – | | | | – | | | | – | | | | 7,580 |
| Total | | $ | 24,796 | | | $ | (9,018 | ) | | $ | – | | | $ | – | | | $ | 15,778 |
| | | | | | Gross Amounts | | | Net Amounts of |
| | | | | | Offset in the | | | Liabilities Presented |
| | | Gross Amounts of | | | Statement of Assets | | | in the Statement of |
| Description | | Recognized Liabilities | | | and Liabilities | | | Assets and Liabilities |
| Forward Foreign Currency Exchange Contracts | | $ | 13,110 | | | $ | – | | | $ | 13,110 |
| Total | | $ | 13,110 | | | $ | – | | | $ | 13,110 |
| | | Net Amounts | | | | | | | | | | | | |
| | | of Liabilities | | | Amounts Not Offset in the | | | |
| | | Presented in | | | Statement of Assets and Liabilities | | | |
| | | the Statement | | | | | | Cash | | | Securities | | | |
| | | of Assets and | | | Financial | | | Collateral | | | Collateral | | | Net |
| Counterparty | | Liabilities | | | Instruments | | | Pledged(a) | | | Pledged(a) | | | Amount(c) |
| Bank of America | | $ | 6,111 | | | $ | (2,019 | ) | | $ | – | | | $ | – | | | $ | 4,092 |
| Citibank | | | 315 | | | | (315 | ) | | | – | | | | – | | | | – |
| Morgan Stanley | | | 1,553 | | | | (1,553 | ) | | | – | | | | – | | | | – |
| Standard Chartered Bank | | | 1,715 | | | | (1,715 | ) | | | – | | | | – | | | | – |
| State Street Bank and Trust | | | 3,416 | | | | (3,416 | ) | | | – | | | | – | | | | – |
| Total | | $ | 13,110 | | | $ | (9,018 | ) | | $ | – | | | $ | – | | | $ | 4,092 |
| | Multi-Asset Global Opportunity Fund |
| | | | | | | Gross Amounts | | | Net Amounts of |
| | | | | | | Offset in the | | | Assets Presented |
| | | Gross Amounts of | | | Statement of Assets | | | in the Statement of |
| Description | | Recognized Assets | | | and Liabilities | | | Assets and Liabilities |
| Forward Foreign Currency Exchange Contracts | | $ | 438,363 | | | $ | – | | | $ | 438,363 |
| Total | | $ | 438,363 | | | $ | – | | | $ | 438,363 |
110
Notes to Financial Statements (continued)
| | | Net Amounts | | | | | | | | | | | | |
| | | of Assets | | | Amounts Not Offset in the | | | |
| | | Presented in | | | Statement of Assets and Liabilities | | | |
| | | the Statement | | | | | | Cash | | | Securities | | | |
| | | of Assets and | | | Financial | | | Collateral | | | Collateral | | | Net |
| Counterparty | | Liabilities | | | Instruments | | | Received(a) | | | Received(a) | | | Amount(b) |
| Bank of America | | $ | 58,025 | | | $ | (58,025 | ) | | $ | – | | | $ | – | | | $ | – |
| Citibank | | | 2,062 | | | | – | | | | – | | | | – | | | | 2,062 |
| Morgan Stanley | | | 151,941 | | | | (18,936 | ) | | | – | | | | – | | | | 133,005 |
| Standard Chartered Bank | | | 214,000 | | | | (32,662 | ) | | | – | | | | – | | | | 181,338 |
| State Street Bank and Trust | | | 12,335 | | | | (12,335 | ) | | | – | | | | – | | | | – |
| Total | | $ | 438,363 | | | $ | (121,958 | ) | | $ | – | | | $ | – | | | $ | 316,405 |
| | | | | | Gross Amounts | | | Net Amounts of |
| | | | | | Offset in the | | | Liabilities Presented |
| | | Gross Amounts of | | | Statement of Assets | | | in the Statement of |
| Description | | Recognized Liabilities | | | and Liabilities | | | Assets and Liabilities |
| Forward Foreign Currency Exchange Contracts | | $ | 374,660 | | | $ | – | | | $ | 374,660 |
| Total | | $ | 374,660 | | | $ | – | | | $ | 374,660 |
| | | Net Amounts | | | | | | | | | | | | |
| | | of Liabilities | | | Amounts Not Offset in the | | | |
| | | Presented in | | | Statement of Assets and Liabilities | | | |
| | | the Statement | | | | | | Cash | | | Securities | | | |
| | | of Assets and | | | Financial | | | Collateral | | | Collateral | | | Net |
| Counterparty | | Liabilities | | | Instruments | | | Pledged(a) | | | Pledged(a) | | | Amount(c) |
| Bank of America | | $ | 120,561 | | | $ | (58,025 | ) | | $ | – | | | $ | – | | | $ | 62,536 |
| Morgan Stanley | | | 18,936 | | | | (18,936 | ) | | | – | | | | – | | | | – |
| Standard Chartered Bank | | | 32,662 | | | | (32,662 | ) | | | – | | | | – | | | | – |
| State Street Bank and Trust | | | 202,501 | | | | (12,335 | ) | | | (190,166 | ) | | | – | | | | – |
| Total | | $ | 374,660 | | | $ | (121,958 | ) | | $ | (190,166 | ) | | $ | – | | | $ | 62,536 |
| (a) | | Collateral disclosed is limited to an amount not to exceed 100% of the net amount of assets (liabilities) presented in the Statements of Assets and Liabilities, for each respective counterparty. |
| (b) | | Net amount represents the amount owed to the Fund by each counterparty as of December 31, 2015. |
| (c) | | Net amount represents the amount owed by the Fund to each counterparty as of December 31, 2015. |
| 8. | DIRECTORS’ REMUNERATION |
The Company’s officers and a Director, who are associated with Lord Abbett, do not receive any compensation from the Company for serving in such capacities. Independent Directors’ fees are allocated among all Lord Abbett-sponsored funds based on the net assets of each fund. There is an equity-based plan available to all Independent Directors under which Independent Directors must defer receipt of a portion of, and may elect to defer receipt of an additional portion of, Directors’ fees. The deferred amounts are treated as though equivalent dollar amounts had been invested in the funds. Such amounts and earnings accrued thereon are included in Directors’ fees on the Statements of Operations and in Directors’ fees payable on the Statements of Assets and Liabilities and are not deductible for U.S. federal income tax purposes until such amounts are paid.
111
Notes to Financial Statements (continued)
The Company has entered into an arrangement with its transfer agent and custodian, whereby credits realized as a result of uninvested cash balances are used to reduce a portion of each Fund’s expenses.
Effective August 31, 2015, the Funds, other than Multi-Asset Global Opportunity Fund, and certain other funds managed by Lord Abbett (collectively, the “Participating Funds”) entered into a syndicated line of credit facility with various lenders for $550 million (the “Facility”), whereas State Street Bank and Trust Company (“SSB”) participates as a lender and as agent for the lenders. The Facility is to be used for temporary or emergency purposes as an additional source of liquidity to satisfy redemptions. The Participating Funds are subject to graduated borrowing limits of one-third of Fund assets (if Fund assets are less than $750 million), $250 million, $300 million, or $350 million based on past borrowings and likelihood of future borrowings. The Facility will continue through August 29, 2016.
Prior to August 31, 2015, the Funds, other than Multi-Asset Global Opportunity Fund, and certain other funds managed by Lord Abbett participated in a $500 million unsecured revolving credit facility with SSB (the “SSB Facility”).
During the fiscal year ended December 31, 2015, the Funds did not utilize the Facility or the SSB Facility.
| 11. | CUSTODIAN AND ACCOUNTING AGENT |
SSB is the Company’s custodian and accounting agent. SSB performs custodial, accounting and recordkeeping functions relating to portfolio transactions and calculating each Fund’s NAV.
| 12. | TRANSACTIONS WITH AFFILIATED ISSUERS |
An affiliated issuer is one in which a Fund has ownership of at least 5% of the outstanding voting securities of the underlying issuer at any point during the fiscal year or any company which is under common ownership or control. Multi-Asset Global Opportunity Fund had the following transactions with affiliated issuers (i.e. the Underlying Funds) for the fiscal year ended December 31, 2015:
Multi-Asset Global Opportunity Fund
| Affiliated Issuer | | Balance of
Shares
Held at
12/31/2014 | | | Gross
Additions | | | Gross
Sales | | | Balance of
Shares
Held at
12/31/2015 | | | Fair Value at
12/31/2015 | | | Net Realized
Gain/(Loss)
1/1/2015 to
12/31/2015 | | | Dividend
Income
1/1/2015 to
12/31/2015 | |
| Lord Abbett Affiliated Fund, Inc. – Class I | | | 201,757 | | | | 13,586 | | | | (215,343 | ) | | | – | | | $ | – | | | $ | (23,405 | ) | | $ | – | |
| Lord Abbett Equity Trust – Calibrated Large Cap Value Fund – Class I | | | 101 | | | | – | | | | (101 | ) | | | – | | | | – | | | | (29 | ) | | | – | |
| Lord Abbett Equity Trust – Calibrated Mid Cap Value Fund – Class I | | | 1,641,685 | | | | 276,779 | | | | (188,798 | ) | | | 1,729,666 | | | | 31,773,957 | | | | 3,141,967 | (a) | | | 509,316 | |
| Lord Abbett Global Fund, Inc. – Emerging Markets Currency Fund – Class I | | | 7,591,673 | | | | 2,645,126 | | | | (800,066 | ) | | | 9,436,733 | | | | 48,032,969 | | | | (1,023,877 | ) | | | 1,449,125 | |
112
Notes to Financial Statements (continued)
| Affiliated Issuer | | Balance of
Shares
Held at
12/31/2014 | | | Gross
Additions | | | Gross
Sales | | | Balance of
Shares
Held at 12/31/2015 | | | Fair Value at
12/31/2015 | | | Net Realized
Gain/(Loss)
1/1/2015 to
12/31/2015 | | | Dividend
Income
1/1/2015 to
12/31/2015 | |
| Lord Abbett Research Fund, Inc. – Growth Opportunities Fund – Class I | | $ | 242,925 | | | | 11,999 | | | | (254,924 | ) | | | – | | | $ | – | | | $ | (68,254 | ) | | $ | – | |
| Lord Abbett Investment Trust – High Yield Fund – Class I | | | 7,076,807 | | | | 1,025,300 | | | | (1,769,923 | ) | | | 6,332,184 | | | | 43,818,714 | | | | (490,641 | ) | | | 2,845,391 | |
| Lord Abbett Securities Trust – International Dividend Income Fund – Class I | | | 13,131,186 | | | | 3,639,180 | | | | (718,156 | ) | | | 16,052,209 | | | | 109,155,022 | | | | (919,115 | ) | | | 4,030,032 | |
| Lord Abbett Mid Cap Stock Fund, Inc. – Class I | | | 1,367,113 | | | | 238,774 | | | | (418,532 | ) | | | 1,187,355 | | | | 29,161,443 | | | | 4,479,619 | | | | 310,639 | |
| Lord Abbett Investment Trust – Short Duration Income Fund – Class I | | | – | | | | 3,294,475 | | | | (3,236,527 | ) | | | 57,948 | | | | 249,756 | | | | (75,424 | ) | | | 77,707 | |
| Total | | | | | | | | | | | | | | | | | | $ | 262,191,861 | | | $ | 5,020,839 | | | $ | 9,222,210 | |
| (a) | Includes $2,251,880 of distributed capital gains. |
Each Fund is subject to the risks of investing in securities that are issued by non-U.S. entities, the risks of investing in derivatives, liquidity risk, and the risks from leverage.
Foreign securities may pose greater risks than domestic securities, including greater price fluctuations, less government regulation, and higher transaction costs. These risks generally are greater for emerging markets securities. Foreign investments also may be affected by changes in currency rates or currency controls.
Derivatives are subject to risks such as liquidity risk, leveraging risk, interest rate risk, market risk, and credit risk. Derivatives also involve the risk of mispricing or improper valuation and the risk that changes in the value of the derivative may not correlate perfectly with the value of the underlying asset, rate, or index. Whether a Fund’s use of derivatives is successful will depend on, among other things, the Fund’s ability to correctly forecast market movements, changes in foreign exchange and interest rates, and other factors. If a Fund incorrectly forecasts these and other factors, its performance could suffer. The Fund’s use of derivatives could result in a loss exceeding the amount of the Fund’s investment in these instruments.
Emerging Markets Currency Fund and Emerging Markets Local Bond Fund are non-diversified, which means that they each may invest a greater portion of their assets in a single issuer than a diversified fund. Thus, they may be exposed to greater risk.
Each Fund may invest in swap contracts. Swap contracts are bilateral agreements between a fund and its counterparty. Each party is exposed to the risk of default by the other. In addition, swap contracts may involve a small investment of cash compared to the risk assumed, with the result that small changes may produce disproportionate and substantial gains or losses to a Fund.
Each Fund may invest in credit default swap and interest rate swap contracts. Such contracts are subject to the risk that there will be no liquid market for these agreements, that the counterparty to the agreements may default on its obligation to perform or disagree as to the meaning of the
113
Notes to Financial Statements (continued)
contractual terms in the agreements. Credit default swaps are subject to the risk and that Lord Abbett does not correctly predict the creditworthiness of the issuers of the reference obligation on which the swap is based. Interest rate swaps are subject to the risk that Lord Abbett does not correctly anticipate changes in interest rates.
Illiquid securities may lower a Fund’s returns since it may be unable to sell these securities at its desired time or price. To the extent illiquid securities can be sold, a Fund may have to do so at disadvantageous prices in order to meet requests for the redemption of Fund shares.
Leverage, including borrowing, may increase volatility in a Fund by magnifying the effect of changes in the value of each Fund’s holdings. The use of leverage may cause investors in a Fund to lose more money in adverse environments than would be the case in the absence of leverage.
Each Fund is subject to the general risks and considerations associated with investing in debt securities, including interest rate risk. When interest rates rise, the prices of debt securities and an investment in a Fund are likely to decline. In times of economic uncertainty, high-yield debt securities (or “junk bonds”) may decline in price, even when interest rates are falling. There is also the risk that an issuer of a debt security will fail to make timely payments of principal or interest to a Fund, a risk that is greater with junk bonds.
The mortgage-related securities in which a Fund may invest may be particularly sensitive to changes in prevailing interest rates, economic conditions, including delinquencies and/or defaults. These changes can affect the value, income and/or liquidity of such positions. When interest rates are declining, the value of these securities with prepayment features may not increase as much as other fixed income securities. Early principal repayment may deprive a Fund of income payments above current market rates. Alternatively, rising interest rates may cause payments to occur at a slower-than-expected rate, extending the duration of a security and typically reducing its value. The payment rate will thus affect the price and volatility of a mortgage-related security.
Foreign currency exchange rates may fluctuate significantly over short periods of time. Emerging Markets Corporate Debt Fund, Emerging Markets Currency Fund and Emerging Markets Local Bond Fund’s use of currency-related transactions involves the risk that Lord Abbett will not accurately predict currency movements, and each Fund’s returns could be reduced as a result. A decline in the value of foreign currencies relative to the U.S. dollar will reduce the value of securities held by Emerging Markets Corporate Debt Fund, Emerging Markets Currency Fund and Emerging Markets Local Bond Fund that are denominated in those currencies.
The securities markets of developing or emerging countries tend to be less liquid, are especially subject to greater price volatility, have a smaller market capitalization, have less government regulation and may not be subject to as extensive and frequent accounting, financial, and other reporting requirements as securities issued in more developed countries.
Bonds issued or guaranteed by foreign governments and governmental entities (commonly referred to as “sovereign debt”) are subject to the risk that such governments or entities are unable or unwilling to make interest payments and/or repay the principal owed. Each of Emerging Markets Corporate Debt Fund and Emerging Markets Local Bond Fund may have limited recourse in such instances.
Emerging Markets Corporate Debt Fund, Emerging Markets Currency Fund and Emerging Markets Local Bond Fund believe that their investment strategies with respect to foreign currencies will generate qualifying income under current U.S. federal income tax law. However, there can be no
114
Notes to Financial Statements (continued)
assurance that the U.S. Treasury Department will not issue regulations in the future (possibly with retroactive effect) that would treat some or all of each Fund’s foreign currency gains as nonqualifying income.
The value of Multi-Asset Global Opportunity Fund’s investments will fluctuate in response to various factors related to domestic and foreign equity and fixed income markets, as well as the financial condition and prospects of issuers in which the Fund invests through its Underlying Funds. Because equity and fixed income investments can move in different directions or to different degrees, fixed income investments may counteract some of the volatility experienced by equity holdings, but the diminished risk that may accompany this investment approach also may result in lower returns.
These factors can affect each Fund’s performance.
| 14. | SUMMARY OF CAPITAL TRANSACTIONS |
Transactions in shares of capital stock were as follows:
| Emerging Markets Corporate Debt Fund | | Year Ended
December 31, 2015 | | | Year Ended
December 31, 2014 | |
| Class A Shares | | Shares | | | Amount | | | Shares | | | Amount | |
| Shares sold | | | 569,542 | | | $ | 8,508,814 | | | | 106,068 | | | $ | 1,629,360 | |
| Reinvestment of distributions | | | 29,953 | | | | 444,013 | | | | 30,526 | | | | 464,178 | |
| Shares reacquired | | | (95,739 | ) | | | (1,410,778 | ) | | | (5,480 | ) | | | (85,155 | ) |
| Increase | | | 503,756 | | | $ | 7,542,049 | | | | 131,114 | | | $ | 2,008,383 | |
| | | | | | | | | | | | | | | | | |
| Class C Shares | | | | | | | | | | | | | | | | |
| Shares sold | | | 19,958 | | | $ | 297,313 | | | | 24,534 | | | $ | 385,071 | |
| Reinvestment of distributions | | | 1,511 | | | | 22,472 | | | | 1,356 | | | | 20,421 | |
| Shares reacquired | | | (13,148 | ) | | | (193,561 | ) | | | (697 | ) | | | (10,560 | ) |
| Increase | | | 8,321 | | | $ | 126,224 | | | | 25,193 | | | $ | 394,932 | |
| | | | | | | | | | | | | | | | | |
| Class F Shares | | | | | | | | | | | | | | | | |
| Shares sold | | | 1,029,041 | | | $ | 15,143,533 | | | | 4,128 | | | $ | 64,700 | |
| Reinvestment of distributions | | | 8,499 | | | | 124,512 | | | | 690 | | | | 10,467 | |
| Shares reacquired | | | (176,963 | ) | | | (2,587,182 | ) | | | (70 | ) | | | (1,043 | ) |
| Increase | | | 860,577 | | | $ | 12,680,863 | | | | 4,748 | | | $ | 74,124 | |
| | | | | | | | | | | | | | | | | |
| Class I Shares | | | | | | | | | | | | | | | | |
| Shares sold | | | 488,751 | | | $ | 7,424,082 | | | | – | | | $ | – | |
| Reinvestment of distributions | | | 27,429 | | | | 406,863 | | | | 25,101 | | | | 382,031 | |
| Shares reacquired | | | (126,077 | ) | | | (1,856,737 | ) | | | – | | | | – | |
| Increase | | | 390,103 | | | $ | 5,974,208 | | | | 25,101 | | | $ | 382,031 | |
| | | | | | | | | | | | | | | | | |
| Class R2 Shares | | | | | | | | | | | | | | | | |
| Shares sold | | | – | | | $ | – | | | | 607 | | | $ | 9,500 | |
| Reinvestment of distributions | | | 346 | | | | 5,149 | | | | 523 | | | | 7,958 | |
| Shares reacquired | | | – | | | | – | | | | (607 | ) | | | (9,500 | ) |
| Increase | | | 346 | | | $ | 5,149 | | | | 523 | | | $ | 7,958 | |
| | | | | | | | | | | | | | | | | |
| Class R3 Shares | | | | | | | | | | | | | | | | |
| Reinvestment of distributions | | | 346 | | | $ | 5,150 | | | | 523 | | | $ | 7,958 | |
| Increase | | | 346 | | | $ | 5,150 | | | | 523 | | | $ | 7,958 | |
115
Notes to Financial Statements (continued)
| Emerging Markets Corporate Debt Fund | | Year Ended
December 31, 2015 | | | Year Ended
December 31, 2014 | |
| Class R4 Shares(a) | | Shares | | | Amount | | | Shares | | | Amount | |
| Shares sold | | | 668 | | | $ | 10,000 | | | | – | | | $ | – | |
| Reinvestment of distributions | | | 15 | | | | 218 | | | | – | | | | – | |
| Increase | | | 683 | | | $ | 10,218 | | | | – | | | $ | – | |
| | | | | | | | | | | | | | | | | |
| Class R5 Shares(a) | | | | | | | | | | | | | | | | |
| Shares sold | | | 668 | | | $ | 10,000 | | | | – | | | $ | – | |
| Reinvestment of distributions | | | 16 | | | | 231 | | | | – | | | | – | |
| Increase | | | 684 | | | $ | 10,231 | | | | – | | | $ | – | |
| | | | | | | | | | | | | | | | | |
| Class R6 Shares(a) | | | | | | | | | | | | | | | | |
| Shares sold | | | 668 | | | $ | 10,000 | | | | – | | | $ | – | |
| Reinvestment of distributions | | | 16 | | | | 234 | | | | – | | | | – | |
| Increase | | | 684 | | | $ | 10,234 | | | | – | | | $ | – | |
| | | | | | | | | | | | | | | | | |
| Emerging Markets Currency Fund | | | Year Ended
December 31, 2015 | | | | Year Ended
December 31, 2014 | |
| Class A Shares | | | Shares | | | | Amount | | | | Shares | | | | Amount | |
| Shares sold | | | 323,326 | | | $ | 1,756,595 | | | | 1,172,696 | | | $ | 7,239,988 | |
| Converted from Class B* | | | 12,569 | | | | 69,327 | | | | 16,240 | | | | 100,253 | |
| Reinvestment of distributions | | | 121,039 | | | | 653,791 | | | | 153,276 | | | | 943,703 | |
| Shares reacquired | | | (1,746,230 | ) | | | (9,449,584 | ) | | | (3,710,143 | ) | | | (22,888,787 | ) |
| Decrease | | | (1,289,296 | ) | | $ | (6,969,871 | ) | | | (2,367,931 | ) | | $ | (14,604,843 | ) |
| | | | | | | | | | | | | | | | | |
| Class B Shares | | | | | | | | | | | | | | | | |
| Shares sold | | | 195 | | | $ | 1,029 | | | | 300 | | | $ | 1,892 | |
| Reinvestment of distributions | | | 917 | | | | 4,991 | | | | 1,279 | | | | 7,901 | |
| Shares reacquired | | | (14,440 | ) | | | (76,748 | ) | | | (35,643 | ) | | | (222,425 | ) |
| Converted to Class A* | | | (12,508 | ) | | | (69,327 | ) | | | (16,164 | ) | | | (100,253 | ) |
| Decrease | | | (25,836 | ) | | $ | (140,055 | ) | | | (50,228 | ) | | $ | (312,885 | ) |
| | | | | | | | | | | | | | | | | |
| Class C Shares | | | | | | | | | | | | | | | | |
| Shares sold | | | 56,227 | | | $ | 307,122 | | | | 89,528 | | | $ | 558,072 | |
| Reinvestment of distributions | | | 19,797 | | | | 107,601 | | | | 27,511 | | | | 170,212 | |
| Shares reacquired | | | (661,916 | ) | | | (3,639,417 | ) | | | (1,210,934 | ) | | | (7,459,292 | ) |
| Decrease | | | (585,892 | ) | | $ | (3,224,694 | ) | | | (1,093,895 | ) | | $ | (6,731,008 | ) |
| | | | | | | | | | | | | | | | | |
| Class F Shares | | | | | | | | | | | | | | | | |
| Shares sold | | | 578,216 | | | $ | 3,165,976 | | | | 2,203,018 | | | $ | 13,658,777 | |
| Reinvestment of distributions | | | 68,922 | | | | 374,016 | | | | 101,528 | | | | 623,567 | |
| Shares reacquired | | | (2,537,902 | ) | | | (13,803,302 | ) | | | (4,353,099 | ) | | | (26,544,393 | ) |
| Decrease | | | (1,890,764 | ) | | $ | (10,263,310 | ) | | | (2,048,553 | ) | | $ | (12,262,049 | ) |
| | | | | | | | | | | | | | | | | |
| Class I Shares | | | | | | | | | | | | | | | | |
| Shares sold | | | 40,612,981 | | | $ | 226,848,807 | | | | 42,792,639 | | | $ | 262,847,760 | |
| Reinvestment of distributions | | | 2,533,796 | | | | 13,567,438 | | | | 1,642,045 | | | | 10,108,253 | |
| Shares reacquired | | | (11,412,576 | ) | | | (59,312,827 | ) | | | (36,533,194 | ) | | | (224,615,108 | ) |
| Increase | | | 31,734,201 | | | $ | 181,103,418 | | | | 7,901,490 | | | $ | 48,340,905 | |
116
Notes to Financial Statements (continued)
| | | Year Ended | | | Year Ended | |
| Emerging Markets Currency Fund | | December 31, 2015 | | | December 31, 2014 | |
| Class P Shares | | Shares | | | Amount | | | Shares | | | Amount | |
| Shares sold | | | 1 | | | $ | 3 | | | | 4 | | | $ | 26 | |
| Reinvestment of distributions | | | 8 | | | | 45 | | | | 21 | | | | 130 | |
| Shares reacquired | | | (561 | ) | | | (2,905 | ) | | | (733 | ) | | | (4,603 | ) |
| Decrease | | | (552 | ) | | $ | (2,857 | ) | | | (708 | ) | | $ | (4,447 | ) |
| | | | | | | | | | | | | | | | | |
| Class R2 Shares | | | | | | | | | | | | | | | | |
| Shares sold | | | 7,072 | | | $ | 37,976 | | | | 7,695 | | | $ | 47,236 | |
| Reinvestment of distributions | | | 84 | | | | 456 | | | | 65 | | | | 402 | |
| Shares reacquired | | | (6,384 | ) | | | (35,180 | ) | | | (28,275 | ) | | | (178,330 | ) |
| Increase (decrease) | | | 772 | | | $ | 3,252 | | | | (20,515 | ) | | $ | (130,692 | ) |
| | | | | | | | | | | | | | | | | |
| Class R3 Shares | | | | | | | | | | | | | | | | |
| Shares sold | | | 34,940 | | | $ | 189,009 | | | | 32,901 | | | $ | 202,804 | |
| Reinvestment of distributions | | | 1,989 | | | | 10,720 | | | | 1,845 | | | | 11,301 | |
| Shares reacquired | | | (72,085 | ) | | | (385,092 | ) | | | (22,840 | ) | | | (140,335 | ) |
| Increase (decrease) | | | (35,156 | ) | | $ | (185,363 | ) | | | 11,906 | | | $ | 73,770 | |
| | | | | | | | | | | | | | | | | |
| Class R4 Shares(a) | | | | | | | | | | | | | | | | |
| Shares sold | | | 1,808 | | | $ | 10,000 | | | | – | | | $ | – | |
| Reinvestment of distributions | | | 26 | | | | 135 | | | | – | | | | – | |
| Increase | | | 1,834 | | | $ | 10,135 | | | | – | | | $ | – | |
| | | | | | | | | | | | | | | | | |
| Class R5 Shares(a) | | | | | | | | | | | | | | | | |
| Shares sold | | | 1,812 | | | $ | 10,000 | | | | – | | | $ | – | |
| Reinvestment of distributions | | | 28 | | | | 147 | | | | – | | | | – | |
| Increase | | | 1,840 | | | $ | 10,147 | | | | – | | | $ | – | |
| | | | | | | | | | | | | | | | | |
| Class R6 Shares(a) | | | | | | | | | | | | | | | | |
| Shares sold | | | 1,812 | | | $ | 10,000 | | | | – | | | $ | – | |
| Reinvestment of distributions | | | 29 | | | | 152 | | | | – | | | | – | |
| Increase | | | 1,841 | | | $ | 10,152 | | | | – | | | $ | – | |
| | | | | | | | | | | | | | | | | |
| Emerging Markets Local Bond Fund | | | Year Ended
December 31, 2015 | | | | Year Ended
December 31, 2014 | |
| Class A Shares | | | Shares | | | | Amount | | | | Shares | | | | Amount | |
| Shares sold | | | 40,499 | | | $ | 478,683 | | | | 446,078 | | | $ | 6,149,171 | |
| Reinvestment of distributions | | | 31,797 | | | | 356,143 | | | | 25,985 | | | | 363,212 | |
| Shares reacquired | | | (221,177 | ) | | | (2,650,660 | ) | | | (154,025 | ) | | | (2,149,045 | ) |
| Increase (decrease) | | | (148,881 | ) | | $ | (1,815,834 | ) | | | 318,038 | | | $ | 4,363,338 | |
| | | | | | | | | | | | | | | | | |
| Class C Shares | | | | | | | | | | | | | | | | |
| Shares sold | | | 16,533 | | | $ | 193,322 | | | | 21,096 | | | $ | 299,046 | |
| Reinvestment of distributions | | | 1,371 | | | | 15,165 | | | | 832 | | | | 11,657 | |
| Shares reacquired | | | (10,384 | ) | | | (109,449 | ) | | | (6,196 | ) | | | (85,511 | ) |
| Increase | | | 7,520 | | | $ | 99,038 | | | | 15,732 | | | $ | 225,192 | |
117
Notes to Financial Statements (continued)
| Emerging Markets Local Bond Fund | | Year Ended
December 31, 2015 | | | Year Ended
December 31, 2014 | |
| Class F Shares | | Shares | | | Amount | | | Shares | | | Amount | |
| Shares sold | | | 5 | | | $ | 60 | | | | 5,618 | | | $ | 79,309 | |
| Reinvestment of distributions | | | 817 | | | | 9,178 | | | | 576 | | | | 8,009 | |
| Shares reacquired | | | (2,081 | ) | | | (24,309 | ) | | | (48 | ) | | | (662 | ) |
| Increase (decrease) | | | (1,259 | ) | | $ | (15,071 | ) | | | 6,146 | | | $ | 86,656 | |
| | | | | | | | | | | | | | | | | |
| Class I Shares | | | | | | | | | | | | | | | | |
| Reinvestment of distributions | | | 10,818 | | | $ | 121,076 | | | | 10,131 | | | $ | 142,153 | |
| Increase | | | 10,818 | | | $ | 121,076 | | | | 10,131 | | | $ | 142,153 | |
| | | | | | | | | | | | | | | | | |
| Class R2 Shares | | | | | | | | | | | | | | | | |
| Reinvestment of distributions | | | 469 | | | $ | 5,249 | | | | 439 | | | $ | 6,160 | |
| Increase | | | 469 | | | $ | 5,249 | | | | 439 | | | $ | 6,160 | |
| | | | | | | | | | | | | | | | | |
| Class R3 Shares | | | | | | | | | | | | | | | | |
| Reinvestment of distributions | | | 469 | | | $ | 5,251 | | | | 439 | | | $ | 6,163 | |
| Increase | | | 469 | | | $ | 5,251 | | | | 439 | | | $ | 6,163 | |
| | | | | | | | | | | | | | | | | |
| Class R4 Shares(a) | | | | | | | | | | | | | | | | |
| Shares sold | | | 867 | | | $ | 10,000 | | | | – | | | $ | – | |
| Reinvestment of distributions | | | 27 | | | | 275 | | | | – | | | | – | |
| Increase | | | 894 | | | $ | 10,275 | | | | – | | | $ | – | |
| | | | | | | | | | | | | | | | | |
| Class R5 Shares(a) | | | | | | | | | | | | | | | | |
| Shares sold | | | 867 | | | $ | 10,000 | | | | – | | | $ | – | |
| Reinvestment of distributions | | | 28 | | | | 287 | | | | – | | | | – | |
| Increase | | | 895 | | | $ | 10,287 | | | | – | | | $ | – | |
| | | | | | | | | | | | | | | | | |
| Class R6 Shares(a) | | | | | | | | | | | | | | | | |
| Shares sold | | | 867 | | | $ | 10,000 | | | | – | | | $ | – | |
| Reinvestment of distributions | | | 28 | | | | 289 | | | | – | | | | – | |
| Increase | | | 895 | | | $ | 10,289 | | | | – | | | $ | – | |
| | | | | | | | | | | | | | | | | |
| Multi-Asset Global Opportunity Fund | | | Year Ended
December 31, 2015 | | | | Year Ended
December 31, 2014 | |
| Class A Shares | | | Shares | | | | Amount | | | | Shares | | | | Amount | |
| Shares sold | | | 4,263,454 | | | $ | 49,309,490 | | | | 4,477,606 | | | $ | 57,044,988 | |
| Converted from Class B* | | | 62,334 | | | | 729,493 | | | | 64,046 | | | | 810,678 | |
| Reinvestment of distributions | | | 1,184,695 | | | | 13,110,946 | | | | 748,762 | | | | 9,296,409 | |
| Shares reacquired | | | (3,813,481 | ) | | | (43,382,262 | ) | | | (2,602,686 | ) | | | (32,883,927 | ) |
| Increase | | | 1,697,002 | | | $ | 19,767,667 | | | | 2,687,728 | | | $ | 34,268,148 | |
| | | | | | | | | | | | | | | | | |
| Class B Shares | | | | | | | | | | | | | | | | |
| Shares sold | | | 16,526 | | | $ | 178,696 | | | | 41,858 | | | $ | 483,456 | |
| Reinvestment of distributions | | | 26,789 | | | | 270,520 | | | | 23,047 | | | | 261,729 | |
| Shares reacquired | | | (86,495 | ) | | | (888,995 | ) | | | (107,991 | ) | | | (1,249,031 | ) |
| Converted to Class A* | | | (68,472 | ) | | | (729,493 | ) | | | (69,950 | ) | | | (810,678 | ) |
| Decrease | | | (111,652 | ) | | $ | (1,169,272 | ) | | | (113,036 | ) | | $ | (1,314,524 | ) |
118
Notes to Financial Statements (concluded)
| Multi-Asset Global Opportunity Fund | Year Ended
December 31, 2015 | | | Year Ended
December 31, 2014 | |
| Class C Shares | | Shares | | | Amount | | | Shares | | | Amount | |
| Shares sold | | | 1,414,180 | | | $ | 14,911,064 | | | | 1,588,740 | | | $ | 18,540,172 | |
| Reinvestment of distributions | | | 334,231 | | | | 3,357,652 | | | | 195,446 | | | | 2,214,545 | |
| Shares reacquired | | | (1,417,141 | ) | | | (14,640,774 | ) | | | (738,085 | ) | | | (8,550,699 | ) |
| Increase | | | 331,270 | | | $ | 3,627,942 | | | | 1,046,101 | | | $ | 12,204,018 | |
| | | | | | | | | | | | | | | | | |
| Class F Shares | | | | | | | | | | | | | | | | |
| Shares sold | | | 532,287 | | | $ | 6,345,814 | | | | 924,754 | | | $ | 11,890,241 | |
| Reinvestment of distributions | | | 70,935 | | | | 792,597 | | | | 45,837 | | | | 566,380 | |
| Shares reacquired | | | (822,268 | ) | | | (9,413,791 | ) | | | (419,330 | ) | | | (5,267,649 | ) |
| Increase (decrease) | | | (219,046 | ) | | $ | (2,275,380 | ) | | | 551,261 | | | $ | 7,188,972 | |
| | | | | | | | | | | | | | | | | |
| Class I Shares | | | | | | | | | | | | | | | | |
| Shares sold | | | 180,415 | | | $ | 2,177,760 | | | | 660,134 | | | $ | 8,682,203 | |
| Reinvestment of distributions | | | 95,146 | | | | 1,103,026 | | | | 170,033 | | | | 2,122,250 | |
| Shares reacquired | | | (2,775,791 | ) | | | (33,492,460 | ) | | | (16,348 | ) | | | (205,489 | ) |
| Increase (decrease) | | | (2,500,230 | ) | | $ | (30,211,674 | ) | | | 813,819 | | | $ | 10,598,964 | |
| | | | | | | | | | | | | | | | | |
| Class R2 Shares | | | | | | | | | | | | | | | | |
| Shares sold | | | 31,990 | | | $ | 361,085 | | | | 2,395 | | | $ | 31,089 | |
| Reinvestment of distributions | | | 1,514 | | | | 16,698 | | | | 469 | | | | 5,927 | |
| Shares reacquired | | | (8,204 | ) | | | (89,557 | ) | | | (436 | ) | | | (5,526 | ) |
| Increase | | | 25,300 | | | $ | 288,226 | | | | 2,428 | | | $ | 31,490 | |
| | | | | | | | | | | | | | | | | |
| Class R3 Shares | | | | | | | | | | | | | | | | |
| Shares sold | | | 137,417 | | | $ | 1,607,603 | | | | 167,642 | | | $ | 2,130,252 | |
| Reinvestment of distributions | | | 46,733 | | | | 520,576 | | | | 28,904 | | | | 360,452 | |
| Shares reacquired | | | (132,775 | ) | | | (1,526,238 | ) | | | (97,545 | ) | | | (1,241,142 | ) |
| Increase | | | 51,375 | | | $ | 601,941 | | | | 99,001 | | | $ | 1,249,562 | |
| | | | | | | | | | | | | | | | | |
| Class R4 Shares(a) | | | | | | | | | | | | | | | | |
| Shares sold | | | 836 | | | $ | 10,000 | | | | – | | | $ | – | |
| Reinvestment of distributions | | | 57 | | | | 619 | | | | – | | | | – | |
| Increase | | | 893 | | | $ | 10,619 | | | | – | | | $ | – | |
| | | | | | | | | | | | | | | | | |
| Class R5 Shares(a) | | | | | | | | | | | | | | | | |
| Shares sold | | | 830.57 | | | $ | 10,000 | | | | – | | | $ | – | |
| Reinvestment of distributions | | | 57.38 | | | | 627 | | | | – | | | | – | |
| Increase | | | 887.95 | | | $ | 10,627 | | | | – | | | $ | – | |
| | | | | | | | | | | | | | | | | |
| Class R6 Shares(a) | | | | | | | | | | | | | | | | |
| Shares sold | | | 3,145,367 | | | $ | 37,996,000 | | | | – | | | $ | – | |
| Reinvestment of distributions | | | 217,599 | | | | 2,377,506 | | | | – | | | | – | |
| Increase | | | 3,362,966 | | | $ | 40,373,506 | | | | – | | | $ | – | |
| * | | Automatic conversion of Class B shares occurs on the 25th day of the month (or, if the 25th day is not a business day, the next business day thereafter) following the eighth anniversary of the day on which the purchase order was accepted. |
| (a) | | Shares commenced on June 30, 2015. |
119
Report of Independent Registered Public Accounting Firm
To the Board of Directors and Shareholders of Lord Abbett Global Fund, Inc.:
We have audited the accompanying statements of assets and liabilities, including the schedules of investments, of Lord Abbett Global Fund, Inc. comprising the Lord Abbett Emerging Markets Corporate Debt Fund, Lord Abbett Emerging Markets Currency Fund, Lord Abbett Emerging Markets Local Bond Fund, and Lord Abbett Multi-Asset Global Opportunity Fund (collectively, the “Funds”), as of December 31, 2015, and the related statements of operations for the year then ended, the statements of changes in net assets for each of the two years in the period then ended, and the financial highlights for each of the periods presented. These financial statements and financial highlights are the responsibility of the Funds’ management. Our responsibility is to express an opinion on these financial statements and financial highlights based on our audits.
We conducted our audits in accordance with the standards of the Public Company Accounting Oversight Board (United States). Those standards require that we plan and perform the audit to obtain reasonable assurance about whether the financial statements and financial highlights are free of material misstatement. The Funds are not required to have, nor were we engaged to perform, an audit of their internal control over financial reporting. Our audits included consideration of internal control over financial reporting as a basis for designing audit procedures that are appropriate in the circumstances, but not for the purpose of expressing an opinion on the effectiveness of the Funds’ internal control over financial reporting. Accordingly, we express no such opinion. An audit also includes examining, on a test basis, evidence supporting the amounts and disclosures in the financial statements, assessing the accounting principles used and significant estimates made by management, as well as evaluating the overall financial statement presentation. Our procedures included confirmation of securities owned as of December 31, 2015, by correspondence with the custodian, transfer agent, brokers and agent banks; when replies were not received from brokers and agent banks, we performed other auditing procedures. We believe that our audits provide a reasonable basis for our opinion.
In our opinion, the financial statements and financial highlights referred to above present fairly, in all material respects, the financial position of each of the portfolios constituting the Lord Abbett Global Fund, Inc. as of December 31, 2015, the results of their operations for the year then ended, the changes in their net assets for each of the two years in the period then ended, and the financial highlights for each of the periods presented, in conformity with accounting principles generally accepted in the United States of America.
DELOITTE & TOUCHE LLP
New York, New York
February 26, 2016
120
Supplemental Proxy Information (unaudited)
A joint special meeting of shareholders of Emerging Markets Currency Fund and Multi-Asset Global Opportunity Fund was held on November 5, 2015. The joint special meeting was held for shareholders of each Fund to vote on the following matters:
| | 1. | To amend the Fund’s fundamental restrictions related to borrowing and lending to enable the Fund to participate in an interfund lending program; and |
| | | |
| | 2. | To ratify the selection of Deloitte & Touche LLP as independent registered public accounting firm for the Fund’s current fiscal year. |
The results of the proxy solicitation on the preceding matter were as follows:
| 1. | To approve the amendment to the fundamental investment restrictions of the Fund as described in the proxy statement: |
| | (a) | Amend the fundamental investment restriction with respect to Borrowing |
| | | Votes For | | Votes Against | | Abstain | | Broker Non-Votes |
| Emerging Markets Currency Fund | | 93,592,300 | | 1,626,522 | | | 2,122,814 | | 1,499,835 | |
| Multi-Asset Global Opportunity Fund | | 10,517,489 | | 375,679 | | | 500,206 | | 2,192,043 | |
| 1. | To approve the amendment to the fundamental investment restrictions of the Fund as described in the proxy statement: |
| | (b) | Amend the fundamental investment restriction with respect to Lending |
| | | Votes For | | Votes Against | | Abstain | | Broker Non-Votes |
| Emerging Markets Currency Fund | | 93,604,197 | | 1,614,626 | | | 2,122,813 | | 1,499,835 | |
| Multi-Asset Global Opportunity Fund | | 10,501,546 | | 388,215 | | | 503,613 | | 2,192,043 | |
| 2. | To ratify the selection of Deloitte & Touche LLP as the Fund’s independent registered public accounting firm for the Fund’s current fiscal year |
| | | Votes For | | Votes Against | | Abstain | | Broker Non-Votes |
| Emerging Markets Currency Fund | | 95,994,644 | | 344,702 | | | 2,502,125 | | – | |
| Multi-Asset Global Opportunity Fund | | 12,956,292 | | 140,775 | | | 488,350 | | – | |
121
Investments in Underlying Funds (unaudited)
Multi-Asset Global Opportunity Fund invests in Underlying Funds managed by Lord Abbett. As of December 31, 2015, Multi-Asset Global Opportunity Fund’s investments in the Underlying Funds were allocated as follows:
| Underlying Fund Name | % of Investments in Underlying Funds |
| Lord Abbett Equity Trust – Calibrated Mid Cap Value Fund – Class I | 12.12% |
| Lord Abbett Global Fund, Inc. – Emerging Markets Currency Fund – Class I | 18.32% |
| Lord Abbett Investment Trust – High Yield Fund – Class I | 16.71% |
| Lord Abbett Securities Trust – International Dividend Income Fund – Class I | 41.63% |
| Lord Abbett Mid Cap Stock Fund – Class I | 11.12% |
| Lord Abbett Investment Trust – Short Duration Income Fund – Class I | 0.10% |
The Ten Largest Holdings and the Holdings by Sector, as of December 31, 2015, for each Underlying Fund are presented below. Each Underlying Fund’s annual and semiannual reports, which are sent to shareholders and filed with the SEC, contain information about the Underlying Fund’s portfolio holdings, including a complete schedule of holdings. A complete schedule of holdings for each Underlying Fund is also filed with the SEC on Form N-Q as of the end of each respective Underlying Fund’s first and third quarters. In addition, on or about the first day of the second month following each calendar quarter-end, each Fund makes publicly available a complete schedule of its portfolio holdings as of the last day of each such quarter. The information for the most recently ended calendar quarter may be viewed at www.lordabbett.com or requested at no charge by calling Lord Abbett at 888-522-2388.
Lord Abbett Equity Trust – Calibrated Mid Cap Value Fund
| Ten Largest Holdings | % of Investments |
| Invesco Ltd. | 2.32% |
| Fifth Third Bancorp | 2.27% |
| M&T Bank Corp. | 2.19% |
| XL Group plc | 2.18% |
| Whirlpool Corp. | 2.09% |
| Everest Re Group Ltd. | 1.76% |
| SCANA Corp. | 1.76% |
| Mallinckrodt plc | 1.74% |
| Stanley Black & Decker, Inc. | 1.71% |
| Fidelity National Information Services, Inc. | 1.67% |
| | |
| Holdings by Sector* | % of Investments |
| Consumer Discretionary | 8.85% |
| Consumer Staples | 3.83% |
| Energy | 7.32% |
| Financials | 34.84% |
| Health Care | 6.54% |
| Industrials | 10.02% |
| Information Technology | 10.22% |
| Materials | 5.68% |
| Telecommunication Services | 1.08% |
| Utilities | 11.39% |
| Repurchase Agreement | 0.23% |
| Total | 100.00% |
| * | A sector may comprise several industries. |
122
Investments in Underlying Funds (unaudited)(continued)
Lord Abbett Global Fund, Inc. – Emerging Markets Currency Fund
| Ten Largest Holdings | % of Investments |
| U.S. Treasury Note, 1.625%, 11/30/2020 | 1.32% |
| Teva Pharmaceutical Finance Co. BV, 2.40%, 11/10/2016 | 1.19% |
| Citigroup Commercial Mortgage Trust 2015-SSHP C, 2.431%, 9/15/2017 | 1.08% |
| Cox Communications, Inc., 5.875%, 12/1/2016 | 1.00% |
| LB-UBS Commercial Mortgage Trust 2006-C6 AM, 5.413%, 9/15/2039 | 0.97% |
| Citigroup Commercial Mortgage Trust 2015-SSHP B, 1.981%, 9/15/2017 | 0.96% |
| Hewlett-Packard Enterprise Co., 2.059%, 10/5/2017 | 0.86% |
| Federal National Mortgage Assoc., 3.484%, 11/1/2040 | 0.81% |
| U.S. Treasury Note, 0.875%, 10/15/2017 | 0.79% |
| Zoetis, Inc., 1.15%, 2/1/2016 | 0.78% |
| | |
| Holdings by Sector* | % of Investments |
| Asset Backed | 14.68% |
| Automotive | 1.29% |
| Banking | 3.97% |
| Basic Industry | 2.66% |
| Capital Goods | 1.63% |
| Consumer Goods | 1.71% |
| Energy | 9.44% |
| Financial Services | 2.95% |
| Foreign Government | 0.03% |
| Health Care | 4.81% |
| Insurance | 1.10% |
| Leisure | 2.57% |
| Media | 3.47% |
| Mortgage Backed | 32.82% |
| Municipal | 0.49% |
| Real Estate | 3.50% |
| Retail | 0.12% |
| Services | 0.56% |
| Technology & Electronics | 3.23% |
| Telecommunications | 1.19% |
| Transportation | 2.08% |
| U.S. Government | 3.10% |
| Utilities | 2.60% |
| Total | 100.00% |
| * | A sector may comprise several industries. |
123
Investments in Underlying Funds (unaudited)(continued)
Lord Abbett Investment Trust – High Yield Fund
| Ten Largest Holdings | % of Investments |
| Neptune Finco Corp., 10.875%, 10/15/2025 | 1.54% |
| T-Mobile USA, Inc., 6.836%, 4/28/2023 | 0.76% |
| WhiteWave Foods Co. (The), 5.375%, 10/1/2022 | 0.72% |
| DISH DBS Corp., 5.875%, 7/15/2022 | 0.72% |
| Frontier Communications Corp., 11.00%, 9/15/2025 | 0.72% |
| AMC Networks, Inc., 4.75%, 12/15/2022 | 0.68% |
| AerCap Ireland Capital Ltd./AerCap Global Aviation Trust, 5.00%, 10/1/2021 | 0.64% |
| Frontier Communications Corp., 10.50%, 9/15/2022 | 0.62% |
| Tenet Healthcare Corp., 6.75%, 6/15/2023 | 0.60% |
| L Brands, Inc., 6.875%, 11/1/2035 | 0.59% |
| | |
| Holdings by Sector* | % of Investments |
| Automotive | 2.25% |
| Banking | 3.22% |
| Basic Industry | 10.00% |
| Capital Goods | 5.88% |
| Consumer Goods | 6.52% |
| Energy | 10.46% |
| Financial Services | 3.51% |
| Foreign Government | 0.61% |
| Health Care | 7.21% |
| Insurance | 0.71% |
| Leisure | 7.50% |
| Media | 11.01% |
| Real Estate | 0.66% |
| Retail | 7.09% |
| Services | 3.42% |
| Technology & Electronics | 5.79% |
| Telecommunications | 7.87% |
| Transportation | 2.50% |
| Utilities | 1.80% |
| Repurchase Agreement | 1.99% |
| Total | 100.00% |
| * | A sector may comprise several industries. |
Lord Abbett Securities Trust – International Dividend Income Fund
| Ten Largest Holdings | % of Investments |
| National Grid plc | 2.70% |
| Imperial Tobacco Group plc | 2.53% |
| Snam SpA | 2.36% |
| National Australia Bank Ltd. | 2.16% |
| Berkeley Group Holdings plc | 2.04% |
| ITV plc | 2.01% |
| HSBC Holdings plc | 2.00% |
| Enagas SA | 1.99% |
| SSE plc | 1.90% |
| Bezeq The Israeli Telecommunication Corp., Ltd. | 1.72% |
124
Investments in Underlying Funds (unaudited)(continued)
| Holdings by Sector* | % of Investments |
| Consumer Discretionary | 11.74% |
| Consumer Staples | 7.47% |
| Energy | 8.58% |
| Financials | 27.37% |
| Health Care | 6.27% |
| Industrials | 9.35% |
| Information Technology | 3.01% |
| Materials | 1.53% |
| Telecommunication Services | 13.70% |
| Utilities | 10.85% |
| Repurchase Agreement | 0.13% |
| Total | 100.00% |
| * | A sector may comprise several industries. |
Lord Abbett Mid Cap Stock Fund, Inc.
| Ten Largest Holdings | % of Investments |
| XL Group plc | 2.56% |
| PPL Corp. | 2.37% |
| M&T Bank Corp. | 2.24% |
| Edison International | 2.21% |
| Hartford Financial Services Group, Inc. (The) | 2.17% |
| UDR, Inc. | 1.94% |
| Harris Corp. | 1.90% |
| Fidelity National Information Services, Inc. | 1.85% |
| Portland General Electric Co. | 1.82% |
| Citizens Financial Group, Inc. | 1.74% |
| | |
| Holdings by Sector* | % of Investments |
| Consumer Discretionary | 10.03% |
| Consumer Staples | 2.67% |
| Energy | 8.41% |
| Financials | 35.20% |
| Health Care | 7.46% |
| Industrials | 7.92% |
| Information Technology | 12.39% |
| Materials | 3.97% |
| Utilities | 10.70% |
| Repurchase Agreement | 1.25% |
| Total | 100.00% |
| * | A sector may comprise several industries. |
125
Investments in Underlying Funds (unaudited)(concluded)
Lord Abbett Investment Trust – Short Duration Income Fund
| Ten Largest Holdings | % of Investments |
| U.S. Treasury Note, 0.875%, 10/15/2017 | 1.40% |
| U.S. Treasury Note, 1.00%, 9/30/2016 | 0.87% |
| Air Lease Corp., 5.625%, 4/1/2017 | 0.81% |
| HBOS plc, 6.75%, 5/21/2018 | 0.75% |
| U.S. Treasury Note, 0.875%, 9/15/2016 | 0.75% |
| Wachovia Bank Commercial Mortgage Trust 2007-C31 AM, 5.591%, 4/15/2047 | 0.66% |
| BAMLL Commercial Mortgage Securities Trust 2014-IP A, 2.808%, 6/15/2028 | 0.65% |
| Denali Borrower LLC/Denali Finance Corp., 5.625%, 10/15/2020 | 0.64% |
| Forest Laboratories, Inc., 4.375%, 2/1/2019 | 0.60% |
| Ladder Capital Commercial Mortgage Securities LLC 2014-PKMD A, 2.952%, 11/14/2027 | 0.58% |
| | |
| Holdings by Sector* | % of Investments |
| Auto | 2.54% |
| Basic Industry | 0.67% |
| Capital Goods | 0.94% |
| Consumer Cyclicals | 1.43% |
| Consumer Discretionary | 1.26% |
| Consumer Services | 2.34% |
| Consumer Staples | 1.55% |
| Energy | 7.23% |
| Financial Services | 55.84% |
| Foreign Government | 0.15% |
| Health Care | 5.65% |
| Integrated Oils | 0.77% |
| Materials and Processing | 2.18% |
| Municipal | 0.75% |
| Producer Durables | 0.97% |
| Technology | 2.79% |
| Telecommunications | 1.60% |
| Transportation | 0.89% |
| U.S. Government | 7.94% |
| Utilities | 1.88% |
| Repurchase Agreement | 0.63% |
| Total | 100.00% |
| * | A sector may comprise several industries |
126
Basic Information About Management
The Board is responsible for the management of the business and affairs of the Company in accordance with the laws of the State of Maryland. The Board elects officers who are responsible for the day-to-day operations of each Fund and who execute policies authorized by the Board. The Board also approves an investment adviser to each Fund and continues to monitor the cost and quality of the services the investment adviser provides, and annually considers whether to renew the contract with the adviser. Generally, each Director holds office until his/her successor is elected and qualified or until his/her earlier resignation or removal, as provided in the Company’s organizational documents.
Lord Abbett, a Delaware limited liability company, is each Fund’s investment adviser. Designated Lord Abbett personnel are responsible for the day-to-day management of the Funds.
Interested Director
Ms. Foster is affiliated with Lord Abbett and is an “interested person” of the Company as defined in the Act. Ms. Foster is a director/trustee and officer of each of the 12 investment companies in the Lord Abbett Family of Funds, which consist of 58 portfolios or series.
| | | Current Position and | | |
| Name, Address and | | Length of Service | | Principal Occupation and Other Directorships |
| Year of Birth | | with the Company | | During the Past Five Years |
| | | | | |
Daria L. Foster
Lord, Abbett & Co. LLC
90 Hudson Street
Jersey City, NJ 07302
(1954) | | Director and President
since 2006; Chief
Executive Officer
since 2012 | | Principal Occupation: Managing Partner of Lord
Abbett, joined Lord Abbett in 1990. Other Directorships: None. |
Independent Directors
The following Independent Directors also are directors/trustees of each of the 12 investment companies in the Lord Abbett Family of Funds, which consist of 58 portfolios or series.
| | | Current Position and | | |
| Name, Address and | | Length of Service | | Principal Occupation and Other Directorships |
| Year of Birth | | with the Company | | During the Past Five Years |
| | | | | |
E. Thayer Bigelow
Lord, Abbett & Co. LLC
c/o Legal Dept.
90 Hudson Street
Jersey City, NJ 07302
(1941) | | Director since 1994;
Chairman since 2013 | | Principal Occupation: Managing General Partner, Bigelow Media, LLC (since 2000); Senior Adviser, Time Warner Inc. (1998–2000). Other Directorships: Currently serves as director of Crane Co. (since 1984) and Huttig Building Products Inc. (since 1998). Previously served as a director of R.H. Donnelley Inc. (2009–2010). |
| | | | | |
Robert B. Calhoun, Jr.
Lord, Abbett & Co. LLC
c/o Legal Dept.
90 Hudson Street
Jersey City, NJ 07302
(1942) | | Director since 1998 | | Principal Occupation: Senior Advisor of Monitor Clipper Partners, a private equity investment fund (since 1997); President of Clipper Asset Management Corp. (1991–2009). Other Directorships: None. |
127
Basic Information About Management (continued)
| | | Current Position and | | |
| Name, Address and | | Length of Service | | Principal Occupation and Other Directorships |
| Year of Birth | | with the Company | | During the Past Five Years |
| | | | | |
Eric C. Fast
Lord, Abbett & Co. LLC
c/o Legal Dept.
90 Hudson Street
Jersey City, NJ 07302
(1949) | | Director since 2014 | | Principal Occupation: Chief Executive Officer of Crane Co., an industrial products company (2001–2014).
Other Directorships: Currently serves as director of Automatic Data Processing, Inc. (since 2007) and Regions Financial Corporation (since 2010). Previously served as a director of Crane Co. (1999–2014). |
| | | | | |
Evelyn E. Guernsey
Lord, Abbett & Co. LLC
c/o Legal Dept.
90 Hudson Street
Jersey City, NJ 07302
(1955) | | Director since 2011 | | Principal Occupation: CEO, Americas of J.P. Morgan Asset Management (2004–2010).
Other Directorships: None. |
| | | | | |
Julie A. Hill
Lord, Abbett & Co. LLC
c/o Legal Dept.
90 Hudson Street
Jersey City, NJ 07302
(1946) | | Director since 2004 | | Principal Occupation: Owner and CEO of The Hill Company, a business consulting firm (since 1998).
Other Directorships: Currently serves as director of Anthem, Inc., a health benefits company (since 1994). |
| | | | | |
Franklin W. Hobbs
Lord, Abbett & Co. LLC
c/o Legal Dept.
90 Hudson Street
Jersey City, NJ 07302
(1947) | | Director since 2000 | | Principal Occupation: Advisor of One Equity Partners, a private equity firm (since 2004).
Other Directorships: Currently serves as director and Chairman of the Board of Ally Financial Inc., a financial services firm (since 2009), and as director of Molson Coors Brewing Company (since 2002). |
| | | | | |
James M. McTaggart
Lord, Abbett & Co. LLC
c/o Legal Dept.
90 Hudson Street
Jersey City, NJ 07302
(1947) | | Director since 2012 | | Principal Occupation: Independent management advisor and consultant (since 2012); Vice President, CRA International, Inc. (doing business as Charles River Associates), a global management consulting firm (2009–2012); Founder and Chairman of Marakon Associates, Inc., a strategy consulting firm (1978–2009); and Officer and Director of Trinsum Group, a holding company (2007–2009).
Other Directorships: Currently serves as director of Blyth, Inc., a home products company (since 2004). |
| | | | | |
James L.L. Tullis
Lord, Abbett & Co. LLC
c/o Legal Dept.
90 Hudson Street
Jersey City, NJ 07302
(1947) | | Director since 2006 | | Principal Occupation: CEO of Tullis-Dickerson and Co. Inc., a venture capital management firm (since 1990); CEO of Tullis Health Investors Inc. (since 2012).
Other Directorships: Currently serves as director of Crane Co. (since 1998). |
128
Basic Information About Management (continued)
Officers
None of the officers listed below have received compensation from the Company. All of the officers of the Company also may be officers of the other Lord Abbett Funds and maintain offices at 90 Hudson Street, Jersey City, NJ 07302. Unless otherwise indicated, the position(s) and title(s) listed under the “Principal Occupation During the Past Five Years” column indicate each officer’s position(s) and title(s) with Lord Abbett. Each officer serves for an indefinite term (i.e., until his or her death, resignation, retirement, or removal).
Name and
Year of Birth | | Current Position
with the Company | | Length of Service
of Current
Position | | Principal Occupation
During the Past Five Years |
| | | | | | | |
Daria L. Foster
(1954) | | President and Chief Executive Officer | | Elected as President in 2006 and Chief Executive Officer in 2012 | | Managing Partner of Lord Abbett, joined Lord Abbett in 1990. |
| | | | | | | |
Robert I. Gerber
(1954) | | Executive Vice President | | Elected in 2001 | | Partner and Chief Investment Officer, joined Lord Abbett in 1997. |
| | | | | | | |
Jerald M. Lanzotti
(1967) | | Executive Vice President | | Elected in 2013 | | Partner and Portfolio Manager, joined Lord Abbett in 1996. |
| | | | | | | |
Robert A. Lee
(1969) | | Executive Vice President | | Elected in 2013 | | Partner and Deputy Chief Investment Officer, joined Lord Abbett in 1997. |
| | | | | | | |
Giulio Martini
(1955) | | Executive Vice President | | Elected in 2015 | | Director of Strategic Asset Allocation, joined Lord Abbett in 2015 and was formerly Global Investment Strategist at Anderson Global Macro LLC (2012–2015) and Chief Investment Officer of Currency Strategies at AllianceBernstein (1985–2012). |
| | | | | | | |
Leah G. Traub
(1979) | | Executive Vice President | | Elected in 2009 | | Partner and Portfolio Manager, joined Lord Abbett in 2007. |
| | | | | | | |
John W. Ashbrook
(1964) | | Vice President and Assistant Secretary | | Elected in 2014 | | Assistant General Counsel, joined Lord Abbett in 2008. |
| | | | | | | |
Joan A. Binstock
(1954) | | Chief Financial Officer and Vice President | | Elected in 1999 | | Partner and Chief Financial and Operations Officer, joined Lord Abbett in 1999. |
| | | | | | | |
Brooke A. Fapohunda
(1975) | | Vice President and Assistant Secretary | | Elected in 2014 | | Deputy General Counsel, joined Lord Abbett in 2006. |
129
Basic Information About Management (concluded)
Name and
Year of Birth | | Current Position
with the Company | | Length of Service
of Current
Position | | Principal Occupation
During the Past Five Years |
| | | | | | | |
John K. Forst
(1960) | | Vice President and Assistant Secretary | | Elected in 2005 | | Partner and Deputy General Counsel, joined Lord Abbett in 2004. |
| | | | | | | |
Lawrence H. Kaplan
(1957) | | Vice President and Secretary | | Elected in 1997 | | Partner and General Counsel, joined Lord Abbett in 1997. |
| | | | | | | |
Joseph M. McGill
(1962) | | Chief Compliance Officer | | Elected in 2014 | | Chief Compliance Officer, joined Lord Abbett in 2014 and was formerly Managing Director and the Chief Compliance Officer at UBS Global Asset Management (2003–2013). |
| | | | | | | |
A. Edward Oberhaus, III
(1959) | | Vice President | | Elected in 1996 | | Partner and Director, joined Lord Abbett in 1983. |
| | | | | | | |
Andrew H. O’Brien
(1973) | | Vice President | | Elected in 2013 | | Partner and Portfolio Manager, joined Lord Abbett in 1998. |
| | | | | | | |
David B. Ritt
(1976) | | Vice President | | Elected in 2009 | | Portfolio Manager, joined Lord Abbett in 2006. |
| | | | | | | |
Lawrence B. Stoller
(1963) | | Vice President and Assistant Secretary | | Elected in 2007 | | Partner and Senior Deputy General Counsel, joined Lord Abbett in 2007. |
| | | | | | | |
Scott S. Wallner
(1955) | | AML Compliance Officer | | Elected in 2011 | | Assistant General Counsel, joined Lord Abbett in 2004. |
| | | | | | | |
Bernard J. Grzelak
(1971) | | Treasurer | | Elected in 2003 | | Partner and Director of Fund Administration, joined Lord Abbett in 2003. |
Please call 888-522-2388 for a copy of the statement of additional information, which contains further information about the Company’s Directors. It is available free upon request.
130
Approval of Advisory Contract
The Board of Directors of the Company, including all of the Directors who are not interested persons of the Company or of Lord Abbett (the “Independent Board Members”), annually considers whether to approve the continuation of the existing management agreement between each Fund and Lord Abbett. In connection with its most recent approval, the Board reviewed materials relating specifically to the management agreement, as well as numerous materials received throughout the course of the year, including information about each Fund’s investment performance compared to the performance of its benchmark. Before making its decision as to each Fund, the Board had the opportunity to ask questions and request further information, taking into account its familiarity with Lord Abbett gained through its meetings and discussions. These meetings and discussions included the examination of the portfolio management teams conducted by members of the Contract Committee, the deliberations of the Contract Committee, and discussions between the Contract Committee and Lord Abbett’s management. The Independent Board Members also discussed the materials described above with their independent legal counsel in a private session at which no representatives of management were present.
The materials received by the Board as to each Fund included, but were not limited to: (1) information provided by Morningstar Associates, LLC (“Morningstar”) regarding the investment performance of the Fund compared to the investment performance of a group of funds in the same Morningstar investment category (the “performance peer group”) and the investment performance of one or more appropriate benchmarks; (2) information provided by Morningstar regarding the expense ratios, contractual and effective management fee rates, and other expense components for the Fund and one or more groups of funds in the same Morningstar category, with the same share classes and operational characteristics, including asset size (the “expense peer group”); (3) certain supplemental investment performance information provided by Lord Abbett; (4) information provided by Lord Abbett on the projected expense ratios, management fee rates, and other expense components for the Fund; (5) sales and redemption information for the Fund; (6) information regarding Lord Abbett’s financial condition; (7) an analysis of the relative profitability of the management agreement to Lord Abbett; (8) information provided by Lord Abbett regarding the investment management fees Lord Abbett receives from its other advisory clients maintaining accounts with a similar investment strategy as the Fund; and (9) information regarding the personnel and other resources devoted by Lord Abbett to managing the Fund.
Investment Management Services Generally. The Board considered the investment management services provided by Lord Abbett to each Fund, including investment research, portfolio management, and trading, and Lord Abbett’s commitment to compliance with all applicable legal requirements. The Board also observed that Lord Abbett was solely engaged in the investment management business and accordingly did not experience the conflicts of interest that may result from being engaged in other lines of business. The Board considered the investment advisory services provided by Lord Abbett to other clients, the fees charged for the services, and the differences in the nature of the services provided to the Fund and other Lord Abbett Funds, on the one hand, and the services provided to other clients, on the other.
Investment Performance. The Board reviewed each Fund’s investment performance in relation to that of the performance peer group, in each case as of various periods ended August 31, 2015. As to Emerging Markets Corporate Debt Fund, the Board observed that the Fund’s investment performance was well above the median of the performance peer group for the one-year period. As to Emerging Markets Currency Fund, the Board observed that the Fund’s investment performance was well below the median of the performance peer group for the one-year and ten-
131
Approval of Advisory Contract (continued)
year periods and below the median of the performance peer group for the three-year and five-year periods. As to Multi-Asset Global Opportunity Fund, the Board observed that the Fund’s investment performance was well below the median of the performance peer group for the one-year, three-year, and five-year periods and below the median of the performance peer group for the ten-year period. As to Emerging Markets Local Bond Fund, the Board observed that the Fund’s investment performance was below the median of the performance peer group for the one-year period.
Lord Abbett’s Personnel and Methods. The Board considered the qualifications of the personnel providing investment management services to each Fund, in light of its investment objective and discipline. Among other things, the Board considered the size, experience, and turnover of Lord Abbett’s investment management staff, Lord Abbett’s investment methodology and philosophy, and Lord Abbett’s approach to recruiting, training, and retaining investment management personnel.
Nature and Quality of Other Services. The Board considered the nature, quality, costs, and extent of compliance, administrative, and other services performed by Lord Abbett and the nature and extent of Lord Abbett’s supervision of third party service providers, including each Fund’s transfer agent and custodian.
Expenses. The Board considered the expense levels of each Fund and the expense levels of one or more corresponding expense peer groups. It also considered the projected expense levels of each Fund and how those levels would relate to those of the expense peer group and the amount and nature of the fees paid by shareholders. As to each of Emerging Markets Corporate Debt Fund, Emerging Markets Currency Fund, Emerging Markets Local Bond Fund, and Multi-Asset Global Opportunity Fund, the Board observed that the overall expense level was well below the median of the expense peer group.
Profitability. As to each Fund, the Board considered the level of Lord Abbett’s profits in managing the Fund, including a review of Lord Abbett’s methodology for allocating its costs to its management of the Fund. The Board concluded that the allocation methodology had a reasonable basis and was appropriate. It considered any profits realized by Lord Abbett in connection with the operation of each Fund, including the fee that Lord Abbett receives from the Fund for providing administrative services to the Fund, and whether the amount of profit was fair for the management of the Fund. The Board also considered the profits realized from other business segments of Lord Abbett, which may benefit from or be related to the Fund’s business. The Board considered Lord Abbett’s profit margins in comparison with available industry data, both accounting for and ignoring marketing and distribution expenses, and how those profit margins could affect Lord Abbett’s ability to recruit and retain investment personnel. The Board recognized that Lord Abbett’s profitability was a factor in enabling it to attract and retain qualified investment management personnel to provide services to the Fund. The Board concluded that Lord Abbett’s profitability as to each Fund was not excessive.
Economies of Scale. As to each Fund, the Board considered the extent to which there had been economies of scale in managing the Fund, whether the Fund had appropriately benefited from such economies of scale, and whether there was potential for realization of any further economies of scale. The Board concluded that each existing management fee schedule, with its breakpoint or breakpoints in the level of the management fee, adequately addressed any economies of scale in managing the applicable Fund.
Other Benefits to Lord Abbett. As to each Fund, the Board considered the character and amount of fees paid by the Fund and the Fund’s shareholders to Lord Abbett and the Distributor for services
132
Approval of Advisory Contract (concluded)
other than investment advisory services. The Board also considered the revenues and profitability of Lord Abbett’s investment advisory business apart from its mutual fund business, and the intangible benefits enjoyed by Lord Abbett by virtue of its relationship with the Fund. The Board observed that the Distributor receives 12b-1 fees from certain of the Lord Abbett Funds as to shares held in accounts for which there is no other broker of record, may retain a portion of the 12b-1 fees it receives, and receives a portion of the sales charges on sales and redemptions of some classes of shares. In addition, the Board observed that Lord Abbett accrues certain benefits for its business of providing investment advice to clients other than the Lord Abbett Funds, but that business also benefits the Funds. The Board also noted that Lord Abbett, as disclosed in the prospectuses of the Funds, has entered into revenue sharing arrangements with certain entities that distribute shares of the Funds.
Alternative Arrangements. As to each Fund, the Board considered whether, instead of approving continuation of the management agreement, it might be in the best interests of the Fund to implement one or more alternative arrangements, such as continuing to employ Lord Abbett, but on different terms. After considering all of the relevant factors, the Board unanimously found that continuation of the existing management agreements was in the best interests of each Fund and its shareholders and voted unanimously to approve the continuation of the management agreements. In considering whether to approve the continuation of the management agreement, the Board did not identify any single factor as paramount or controlling. This summary does not discuss in detail all matters considered.
133
Householding
The Company has adopted a policy that allows it to send only one copy of each Fund’s prospectus, proxy material, annual report and semiannual report to certain shareholders residing at the same “household.” This reduces Fund expenses, which benefits you and other shareholders. If you need additional copies or do not want your mailings to be “householded,” please call Lord Abbett at 888-522-2388 or send a written request with your name, the name of your fund or funds and your account number or numbers to Lord Abbett Family of Funds, P.O. Box 219336, Kansas City, MO 64121.
Proxy Voting Policies, Procedures and Records
A description of the policies and procedures that Lord Abbett uses to vote proxies related to each Fund’s portfolio securities, and information on how Lord Abbett voted each Fund’s proxies during the 12-month period ended June 30 are available without charge, upon request, (i) by calling 888-522-2388; (ii) on Lord Abbett’s Website at www.lordabbett.com; and (iii) on the Securities and Exchange Commission’s (“SEC”) Website at www.sec.gov.
Shareholder Reports and Quarterly Portfolio Disclosure
The Funds are required to file their complete schedule of portfolio holdings with the SEC for their first and third fiscal quarters on Form N-Q. Copies of the filings are available without charge, upon request on the SEC’s Website at www.sec.gov and may be available by calling Lord Abbett at 888-522-2388. You can also obtain copies of Form N-Q by visiting the SEC’s Public Reference Room in Washington, DC (information on the operation of the Public Reference Room may be obtained by calling 800-SEC-0330).
Tax Information
58% of the ordinary income distributions paid by Multi-Asset Global Opportunity Fund during the year is qualified dividend income.
For corporate shareholders, 10% of the ordinary income distributions paid by Multi-Asset Global Opportunity Fund qualified for the dividends received deduction.
Multi-Asset Global Opportunity Fund intends to pass through foreign source income of $4,036,848 and foreign taxes of $467,675.
0.30% of the net investment income distributions paid by Multi-Asset Global Opportunity Fund during the fiscal year ended December 31, 2015 is tax-exempt dividend income.
Additionally, of the distributions paid to shareholders during the fiscal year ended December 31, 2015, the following amounts represent capital gains:
| Fund Name | | Short-Term
Capital Gains | | Long-Term
Capital Gains | |
| Emerging Markets Corporate Debt Fund | | $ | 2,050 | | | $ | – | |
| Multi-Asset Global Opportunity Fund | | | 515,852 | | | | 15,235,015 | |
For foreign shareholders, the percentages below reflect the portion of net investment income distributions that represent interest-related dividends:
| Fund Name | | | | |
| | | | | |
| Emerging Markets Corporate Debt Fund | | | 100 | % |
| Emerging Markets Currency Fund | | | 100 | % |
134

 | | |
| | | |
| | Lord Abbett Global Fund, Inc. | |
This report, when not used for the general information of shareholders of the Fund, is to be distributed only if preceded or accompanied by a current fund prospectus.
Lord Abbett mutual fund shares are distributed by
LORD ABBETT DISTRIBUTOR LLC. | Lord Abbett Emerging Markets Corporate Debt Fund
Lord Abbett Emerging Markets Currency Fund
Lord Abbett Emerging Markets Local Bond Fund
Lord Abbett Multi-Asset Global Opportunity Fund | LAGF-2
(02/16) |
| (a) | In accordance with applicable requirements, the Registrant adopted a Sarbanes-Oxley Code of Ethics on June 19, 2003 that applies to the principal executive officer and senior financial officers of the Registrant (“Code of Ethics”). The Code of Ethics was in effect during the fiscal year ended December 31, 2015 (the “Period”). |
| (c) | The Registrant has not amended the Code of Ethics as described in Form N-CSR during the Period. |
| (d) | The Registrant has not granted any waiver, including an implicit waiver, from a provision of the Code of Ethics as described in Form N-CSR during the Period. |
| (f) | See Item 12(a)(1) concerning the filing of the Code of Ethics. |
| Item 3: | Audit Committee Financial Expert. |
The Registrant’s board of directors has determined that each of the following independent directors who are members of the audit committee is an audit committee financial expert: E. Thayer Bigelow and Robert B. Calhoun, Jr. Each of these persons is independent within the meaning of the Form N-CSR.
| Item 4: | Principal Accountant Fees and Services. |
In response to sections (a), (b), (c) and (d) of Item 4, the aggregate fees billed to the Registrant for the fiscal years ended December 31, 2015 and 2014 by the Registrant’s principal accounting firm, Deloitte & Touche LLP, the member firms of Deloitte Touche Tohmatsu and their respective affiliates (collectively, “Deloitte”) were as follows:
| | | Fiscal year ended: | |
| | | 2015 | | | 2014 | |
| Audit Fees {a} | | | $188,200 | | | | $181,800 | |
| Audit-Related Fees | | | - 0 - | | | | - 0 - | |
| Total audit and audit-related fees | | | 188,200 | | | | 181,800 | |
| | | | | | | | | |
| Tax Fees {b} | | | 41,575 | | | | 40,007 | |
| All Other Fees | | | - 0 - | | | | - 0 - | |
| | | | | | | | | |
| Total Fees | | | $229,775 | | | | $221,807 | |
{a} Consists of fees for audits of the Registrant’s annual financial statements.
{b} Fees for the fiscal year ended December 31, 2015 and 2014 consist of fees for preparing the U.S. Income Tax Return for Regulated Investment Companies, New Jersey Corporation Business Tax Return, New Jersey Annual Report Form, U.S. Return of Excise Tax on Undistributed Income of Investment Companies, IRS Forms 1099-MISC and 1096 Annual Summary and Transmittal of U.S. Information Returns.
(e) (1) Pursuant to Rule 2-01(c) (7) of Regulation S-X, the Registrant’s Audit Committee has adopted pre-approval policies and procedures. Such policies and procedures generally provide that the Audit Committee must pre-approve:
| · | any audit, audit-related, tax, and other services to be provided to the Lord Abbett Funds, including the Registrant, and |
| · | any audit-related, tax, and other services to be provided to the Registrant’s investment adviser and any entity controlling, controlled by or under common control with the investment adviser that provides ongoing services to one or more Funds comprising the Registrant if the engagement relates directly to operations and financial reporting of a Fund, by the independent auditor to assure that the provision of such services does not impair the auditor’s independence. |
The Audit Committee has delegated pre-approval authority to its Chairman, subject to a fee limit of $10,000 per event, and not to exceed $25,000 annually. The Chairman will report any pre-approval decisions to the Audit Committee at its next scheduled meeting. Unless a type of service to be provided by the independent auditor has received general pre-approval, it must be pre-approved by the Audit Committee. Any proposed services exceeding pre-approved cost levels will require specific pre-approval by the Audit Committee.
(e) (2) The Registrant’s Audit Committee has approved 100% of the services described in this Item 4 (b) through (d).
(f) Not applicable.
(g) The aggregate non-audit fees billed by Deloitte for services rendered to the Registrant are shown above in the response to Item 4 (a), (b), (c) and (d) as “All Other Fees”.
The aggregate non-audit fees billed by Deloitte for services rendered to the Registrant’s investment adviser, Lord, Abbett & Co. LLC (“Lord Abbett”), for the fiscal years ended December 31, 2015 and 2014 were:
| | | Fiscal year ended: | |
| | | 2015 | | | 2014 | |
| All Other Fees {a} | | | $285,031 | | | | $185,734 | |
{a} Consist of fees for Independent Services Auditors’ Report on Controls Placed in Operation and Tests of Operating Effectiveness related to Lord Abbett’s Asset Management Services (“SOC-1 Report”).
The aggregate non-audit fees billed by Deloitte for services rendered to entities under the common control of Lord Abbett for the fiscal years ended December 31, 2015 and 2014 were:
| | | | Fiscal year ended: | |
| | | | 2015 | | | | 2014 | |
| All Other Fees | | | $ - 0 - | | | | $ - 0 - | |
(h) The Registrant’s Audit Committee has considered the provision of non-audit services that were rendered to the Registrant’s investment adviser, and any entity controlling, controlled by or under common control with the investment adviser that provides ongoing services to the Registrant, that were not pre-approved pursuant to Rule 2-01 (c)(7)(ii) of Regulation S-X and has determined that the provision of such services is compatible with maintaining Deloitte’s independence.
| Item 5: | Audit Committee of Listed Registrants. |
| | |
| | Not applicable. |
| Item 6: | Investments. |
| | |
| | Not applicable. |
| Item 7: | Disclosure of Proxy Voting Policies and Procedures for Closed-End Management Investment Companies. |
| | |
| | Not applicable. |
| | |
| Item 8: | Portfolio Managers of Closed-End Management Investment Companies. |
| | |
| | Not applicable. |
| | |
| Item 9: | Purchases of Equity Securities by Closed-End Management Investment Company and Affiliated Purchasers. |
| | |
| | Not applicable. |
| | |
| Item 10: | Submission of Matters to a Vote of Security Holders. |
| | |
| Not applicable. |
| | |
| Item 11: | Controls and Procedures. |
| (a) | Based on their evaluation of the Registrant’s disclosure controls and procedures (as defined in Rule 30a-3(c) under the Investment Company Act of 1940) as of a date within 90 days prior to the filing date of this report, the Chief Executive |
| | | Officer and Chief Financial Officer of the Registrant have concluded that such disclosure controls and procedures are reasonably designed and effective to ensure that material information relating to the Registrant, including its consolidated subsidiaries, is made known to them by others within those entities. |
| (b) | There were no changes in the Registrant’s internal control over financial reporting (as defined in Rule 30a-3(d) under the Investment Company Act of 1940) that occurred during the second fiscal quarter of the period covered by this report that have materially affected, or are reasonably likely to materially affect, the Registrant’s internal control over financial reporting. |
| (a)(1) | The Lord Abbett Family of Funds Sarbanes Oxley Code of Ethics for the Principal Executive Officer and Senior Financial Officers is attached hereto as part of Ex-99. CODEETH. |
| | | |
| | (a)(2) | Certification of each Principal Executive Officer and Principal Financial Officer of the Registrant as required by Rule 30a-2 under the Investment Company Act of 1940 is attached hereto as a part of EX-99.CERT. |
| (b) | Certification of each Principal Executive Officer and Principal Financial Officer of the Registrant as required by Section 906 of the Sarbanes-Oxley Act of 2002 is provided as a part of EX-99.906CERT. |
SIGNATURES
Pursuant to the requirements of the Securities Exchange Act of 1934 and the Investment Company Act of 1940, the Registrant has duly caused this report to be signed on its behalf by the undersigned, thereunto duly authorized.
| | LORD ABBETT GLOBAL FUND, INC. |
| | | | | |
| | | By: | /s/ Daria L. Foster | |
| | | Daria L. Foster | |
| | | President and Chief Executive Officer | |
Date: February 26, 2016
| | | By: | /s/ Joan A. Binstock | |
| | | | Joan A. Binstock | |
| | | Chief Financial Officer and Vice President |
Date: February 26, 2016
Pursuant to the requirements of the Securities Exchange Act of 1934 and the Investment Company Act of 1940, this report has been signed below by the following persons on behalf of the Registrant and in the capacities and on the dates indicated.
| | | By: | /s/ Daria L. Foster | |
| | | | Daria L. Foster | |
| | | President and Chief Executive Officer | |
Date: February 26, 2016
| | | By: | /s/ Joan A. Binstock | |
| | | | Joan A. Binstock | |
| | | Chief Financial Officer and Vice President |
Date: February 26, 2016