UNITED STATES
SECURITIES AND EXCHANGE COMMISSION
Washington, D.C. 20549
FORM N-CSR
CERTIFIED SHAREHOLDER REPORT OF REGISTERED
MANAGEMENT INVESTMENT COMPANIES
Investment Company Act File Number: 811-05476
LORD ABBETT GLOBAL FUND, INC.
(Exact name of Registrant as specified in charter)
90 Hudson Street, Jersey City, NJ 07302
(Address of principal executive offices) (Zip code)
Brooke A. Fapohunda, Esq., Vice President & Assistant Secretary
90 Hudson Street, Jersey City, NJ 07302
(Name and address of agent for service)
Registrant’s telephone number, including area code: (800) 201- 6984
Date of fiscal year end: 12/31
Date of reporting period: 12/31/2017
| Item 1: | Report(s) to Shareholders. |

LORD ABBETT
ANNUAL REPORT
Lord Abbett
Emerging Markets Corporate Debt Fund
Emerging Markets Currency Fund
Emerging Markets Local Bond Fund
Multi-Asset Global Opportunity Fund
For the fiscal year ended December 31, 2017
Table of Contents
Lord Abbett Emerging Markets Corporate Debt Fund,
Lord Abbett Emerging Markets Currency Fund,
Lord Abbett Emerging Markets Local Bond Fund, and
Lord Abbett Multi-Asset Global Opportunity Fund
Annual Report
For the fiscal year ended December 31, 2017

From left to right: James L.L. Tullis, Chairman of the Lord Abbett Funds and Daria L. Foster, Director, President, and Chief Executive Officer of the Lord Abbett Funds.
Dear Shareholders: We are pleased to provide you with this overview of the performance of the Funds for the fiscal year ended December 31, 2017. On this page and the following pages, we discuss the major factors that influenced fiscal year performance. For detailed and more timely information about the Funds, please visit our website at www.lordabbett.com, where you also can access the quarterly commentaries that provide updates on each Fund’s performance and other portfolio related updates.
Thank you for investing in Lord Abbett mutual funds. We value the trust that you place in us and look forward to serving your investment needs in the years to come.
Best regards,

Daria L. Foster
Director, President and Chief Executive Officer
Lord Abbett Emerging Markets Corporate Debt Fund
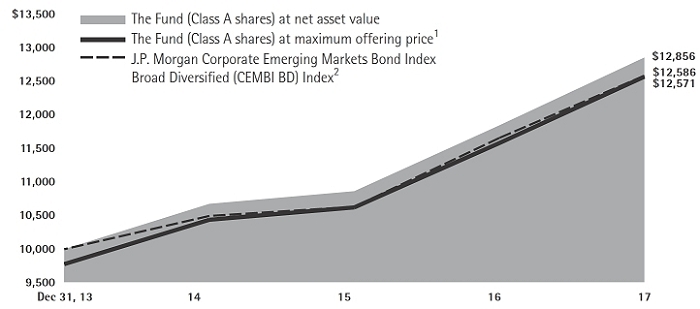
For the fiscal year ended December 31, 2017, the Fund returned 8.54%, reflecting performance at the net asset value (NAV) of Class A shares, with all distributions reinvested, compared to its benchmark, the J.P. Morgan Corporate Emerging Markets Bond Index Broad Diversified1, which returned 7.96% during the same period.
During the 12-month period, U.S. dollar-denominated emerging markets corporate debt (as represented by the J.P. Morgan Corporate Emerging Markets Bond Index Broad Diversified1) significantly outperformed U.S. fixed income markets (as represented by the Bloomberg Barclays U.S. Aggregate Bond Index2). The rally in the asset class was primarily driven by stronger global growth, firmer energy
1
prices and the uptick in demand for Emerging Markets assets overall.
The Fund’s underweight to investment grade bonds contributed to relative performance, as the asset class underperformed in 2017, amid the rally in risky assets due to strong economic growth globally. In terms of regional allocations, the Fund’s overweight to Latin America contributed to relative performance. The region’s U.S. dollar-denominated debt surged over 12% in 2017, driven by continuing powerful economic recovery.
The Fund’s underweight to Africa detracted from relative performance, as the region’s bonds posted strong returns in 2017. Despite idiosyncratic risks in the region, attractive yields lured investors to the continent during the period. Specifically, an underweight to South African securities detracted, as the country’s corporate debt outperformed during the period.
Lord Abbett Emerging Markets Currency Fund
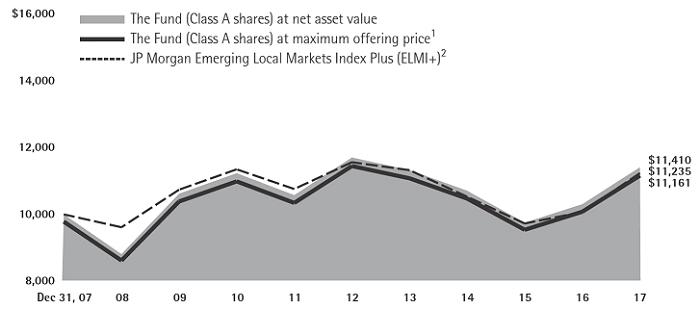
For the fiscal year ended December 31, 2017, the Fund returned 10.73%, reflecting performance at the net asset value (NAV) of Class A shares, with all distributions reinvested, compared to its benchmark, the JP Morgan Emerging Local Markets Index Plus (ELMI+)3, which returned 11.54% during the same period.
During 2017, emerging markets (EM) currencies posted strong performance, with the majority of currencies
significantly outperforming the U.S. dollar during the period. The rally in the asset class was primarily driven by stronger global growth, firmer energy prices and the uptick in demand for Emerging Markets assets overall. In addition, EM currencies (as represented by the J.P. Morgan Emerging Local Markets Index Plus3) outperformed emerging markets corporate debt (as represented by the J.P. Morgan CEMBI Broad Diversified Index1) and underperformed emerging markets local bonds (as represented by the J.P. Morgan GBI-EM Global Diversified Index4).
The Fund’s overweight positioning in Latin America detracted from performance, as the region’s currencies underperformed the benchmark in 2017 due to increased trade protectionist rhetoric from the U.S. Presidential administration and idiosyncratic issues in some of the major countries in the region. In particular, the Fund’s positioning in the Argentine peso detracted during the period, as the currency significantly underperformed broader EM currencies. Argentina continued to struggle with high inflation in 2017.
The Fund’s overweight positioning in Europe contributed to performance, as the region outperformed the benchmark in 2017. In particular, the Fund’s exposure to the Polish zloty helped performance, as the currency posted strong returns during the period. The currency benefited from a strong economic recovery domestically and in the Eurozone, as well as receding tensions with Russia during the period.
2
Lord Abbett Emerging Markets Local Bond Fund
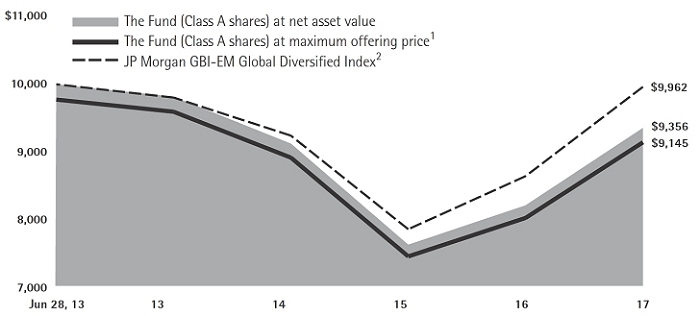
For the fiscal year ended December 31, 2017, the Fund returned 13.87%, reflecting performance at the net asset value (NAV) of Class A shares, with all distributions reinvested, compared to its benchmark, the JP Morgan GBI-EM Global Diversified Index,4 which returned 15.21% during the same period.
During the 12-month period, emerging markets (EM) local debt (as represented by the JP Morgan GBI-EM Global Diversified Index4) significantly outperformed U.S. fixed income markets (as represented by the Barclays U.S. Aggregate Bond Index2). The rally in the asset class was primarily driven by stronger global growth, firmer energy prices and the uptick in demand for Emerging Markets assets overall. In addition, EM local bonds outperformed emerging markets corporate debt (as represented by the J.P. Morgan CEMBI Broad Diversified Index1) and emerging markets currencies (as represented by the J.P. Morgan Emerging Local Markets Index Plus3) in 2017.
The Fund’s overweight positioning in Latin America detracted from performance, as the region’s fixed income securities underperformed the benchmark in 2017 due to muted currency returns. In particular, the Fund’s positioning in Argentina detracted, as local bonds underperformed during the period. Argentina continued to struggle with high inflation in 2017.
The Fund’s overweight to the Africa/Middle East contributed to performance, as the region’s bonds posted the highest returns in 2017. Despite local idiosyncratic risks, attractive yields lured investors to the region during the period. Specifically, an overweight to South African securities contributed, as the country’s sovereign debt outperformed during the period.
Lord Abbett Multi–Asset Global Opportunity Fund
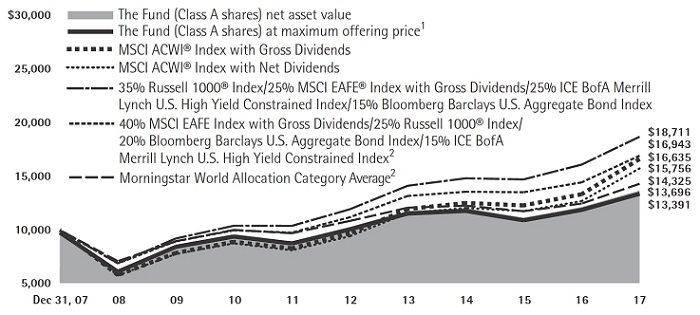
For the fiscal year ended December 31, 2017, the Fund returned 12.65%, reflecting performance at the net asset value (NAV) of Class A shares, with all distributions reinvested, compared to its benchmark, the MSCI All Country World Index (ACWI),5 which returned 23.97% over the same period.
During the 12 month period, U.S. equity markets (as represented by the S&P 500® Index6) outperformed fixed income markets (as represented by the Bloomberg Barclays U.S. Aggregate Bond Index2). Foreign equity markets (as represented by the MSCI ACWI ex-US Index7) outperformed U.S. equity markets. In addition, high yield bonds (as represented by the ICE BofA Merrill Lynch U.S. High Yield Constrained Index8) outperformed higher quality fixed income (as represented by the Bloomberg Barclays U.S. Aggregate Bond Index2).
Detracting from relative performance was the Fund’s allocation to high yield fixed income, as this asset class
3
underperformed the MSCI ACWI benchmark during the period. Also detracting from the Fund’s relative performance was exposure to U.S. mid cap value stocks, as this segment of the market underperformed the benchmark.
The Fund’s allocation to U.S. large cap growth stocks contributed to relative performance as the asset class outperformed the benchmark. In addition,
the Fund’s allocation to international large cap stocks contributed to relative performance as this asset class outperformed the MSCI ACWI benchmark.
Each Fund’s portfolio is actively managed and, therefore, its holdings and the weightings of a particular issuer or particular sector as a percentage of portfolio assets are subject to change. Sectors may include many industries.
1 The J.P. Morgan Corporate Emerging Markets Bond Index Broad Diversified (CEMBI BD) is a market capitalization weighted index that tracks total returns of U.S. dollar denominated debt instruments issued by corporate entities in emerging markets countries. The index limits the current face amount allocations of the bonds in the CEMBI Broad by constraining the total face amount outstanding for countries with larger debt stocks.
2 The Bloomberg Barclays U.S. Aggregate Bond Index an index of U.S dollar-denominated, investment-grade U.S. government and corporate securities, and mortgage pass-through securities, and asset-backed securities. Indexes are unmanaged, do not reflect the deduction of fees or expenses, and an investor cannot invest directly in an index.
3 The JP Morgan Emerging Local Markets Index Plus (ELMI+) tracks total returns for local currency denominated money market instruments in 23 emerging markets countries.
4 The JP Morgan Government Bond Index-Emerging Markets (GBI-EM) Global Diversified Index is a comprehensive global emerging markets index that consists of regularly traded, liquid fixed rate and domestic currency government bonds.
5 The MSCI All Country World Index (ACWI) is a free float-adjusted market capitalization weighted index that is designed to measure the equity market performance of developed and emerging markets. The MSCI ACWI consists of 46 country indices comprising 23 developed and 23 emerging market country indices. The developed market country indices included are: Australia, Austria, Belgium, Canada, Denmark, Finland, France, Germany, Hong Kong, Ireland, Israel, Italy, Japan, Netherlands, New Zealand,
Norway, Portugal, Singapore, Spain, Sweden, Switzerland, the United Kingdom and the United States. The emerging market country indices included are: Brazil, Chile, China, Colombia, Czech Republic, Egypt, Greece, Hungary, India, Indonesia, Korea, Malaysia, Mexico, Peru, Philippines, Poland, Qatar, Russia, South Africa, Taiwan, Thailand, Turkey and United Arab Emirates.
6 The S&P 500® Index is widely regarded as the standard for measuring large cap U.S. stock market performance and includes a representative sample of leading companies in leading industries.
7 The MSCI ACWI (All Country World Index) ex-U.S. Index is a subset of the MSCI ACWI Index. The MSCI ACWI (All Country World Index) Index is a free float-adjusted market capitalization weighted index that is designed to measure the equity market performance of developed and emerging markets. The MSCI ACWI Ex-U.S. Index with Gross Dividends approximates the maximum possible dividend reinvestment. The amount reinvested is the entire dividend distributed to individuals resident in the country of the company, but does not include tax credits. The MSCI ACWI Ex-U.S. Index with Net Dividends approximates the minimum possible dividend reinvestment. The dividend is reinvested after deduction of withholding tax, applying the rate to non-resident individuals who do not benefit from double taxation treaties. MSCI uses withholding tax rates applicable to Luxembourg holding companies, as Luxembourg applies the highest rates.
8 The ICE BofA Merrill Lynch U.S. High Yield Constrained Index is a capitalization weighted index of all U.S. dollar denominated below investment grade corporate debt publicly issued in the U.S. domestic market.
4
Unless otherwise specified, indexes reflect total return, with all dividends reinvested. Indexes are unmanaged, do not reflect the deduction of fees or expenses, and are not available for direct investment.
Important Performance and Other Information
Performance data quoted in the following pages reflect past performance and are no guarantee of future results. Current performance may be higher or lower than the performance quoted. The investment return and principal value of an investment in the Funds will fluctuate so that shares, on any given day or when redeemed, may be worth more or less than their original cost. You can obtain performance data current to the most recent month end by calling Lord Abbett at 888–522–2388 or referring to www.lordabbett.com.
Except where noted, comparative Fund performance does not account for the deduction of sales charges and would be different if sales charges were included. Each Fund offers classes of shares with distinct pricing options. For a full description of the differences in pricing alternatives, please see each Fund’s prospectus.
During certain periods shown, expense waivers and reimbursements were in place. Without such waivers and expense reimbursements, the Funds’ returns would have been lower.
The annual commentary above discusses the views of the Funds’ management and various portfolio holdings of the Funds as of December 31, 2017. These views and portfolio holdings may have changed after this date. Information provided in the commentary is not a recommendation to buy or sell securities. Because the Funds’ portfolio is actively managed and may change significantly, the Funds may no longer own the securities described above or may have otherwise changed their positions in the securities. For more recent information about the Funds’ portfolio holdings, please visit www.lordabbett.com.
A Note about Risk: See Notes to Financial Statements for a discussion of investment risks. For a more detailed discussion of the risks associated with each Fund, please see each Fund’s prospectus.
Mutual funds are not insured by the FDIC, are not deposits or other obligations of, or guaranteed by, banks, and are subject to investment risks including possible loss of principal amount invested.
5
Emerging Markets Corporate Debt Fund
Investment Comparison
Below is a comparison of a $10,000 investment in Class A shares with the same investment in the J.P. Morgan Corporate Emerging Markets Bond Index Broad Diversified (CEMBI BD) Index, assuming reinvestment of all dividends and distributions. The performance of the other classes will be greater than or less than the performance shown in the graph below due to different sales loads and expenses applicable to such classes. The graph and performance table below do not reflect the deduction of taxes that a shareholder would pay on Fund distributions or the redemption of Fund shares. During certain periods, expenses of the Fund have been waived or reimbursed by Lord Abbett; without such waiver or reimbursement of expenses, the Fund’s returns would have been lower. Past performance is no guarantee of future results.
Average Annual Total Returns at Maximum Applicable
Sales Charge for the Periods Ended December 31, 2017
| | | 1 Year | | | Life of Class | | |
| Class A3 | | | 6.08% | | | | 5.89% | | |
| Class C4 | | | 6.85% | | | | 5.72% | | |
| Class F5 | | | 8.71% | | | | 6.59% | | |
| Class F36 | | | – | | | | 5.21% | * | |
| Class I5 | | | 8.84% | | | | 6.71% | | |
| Class R25 | | | 8.84% | | | | 6.71% | | |
| Class R35 | | | 8.84% | | | | 6.71% | | |
| Class R47 | | | 8.57% | | | | 6.35% | | |
| Class R57 | | | 8.84% | | | | 6.62% | | |
| Class R67 | | | 9.01% | | | | 6.73% | | |
1 Reflects the deduction of the maximum initial sales charge of 2.25%.
2 Performance for the unmanaged index does not reflect any fees or expenses. The performance of the index is not necessarily representative of the Fund’s performance.
3 Class A shares commenced operations on December 6, 2013 and performance for the Class began on December 31, 2013. Total return, which is the percentage change in net asset value, after deduction of the maximum initial sales charge of 2.25% applicable to Class A shares, with all dividends and distributions reinvested for the period shown ended December 31, 2017, is calculated using the SEC-required uniform method to compare such return.
4 Class C shares commenced operations on December 6, 2013 and performance for the Class began on December 31, 2013. The 1% CDSC for Class C normally applies before the first anniversary of the purchase date.
5 Commenced operations on December 6, 2013 and performance for the Class began on December 31, 2013. Performance is at net asset value.
6 Commenced operations and performance for the Class began on April 4, 2017. Performance is at net asset value.
7 Commenced operations and performance for the Class began on June 30, 2015. Performance is at net asset value.
* Since Class F3 shares have existed for less than one year, average annual returns are not provided.
6
Emerging Markets Currency Fund
Investment Comparison
Below is a comparison of a $10,000 investment in Class A shares with the same investment in the JPMorgan Emerging Local Markets Index Plus (ELMI+) assuming reinvestment of all dividends and distributions. The performance of the other classes will be greater than or less than the performance shown in the graph below due to different sales loads and expenses applicable to such classes. The graph and performance table below do not reflect the deduction of taxes that a shareholder would pay on Fund distributions or the redemption of Fund shares. During certain periods, expenses of the Fund have been waived or reimbursed by Lord Abbett; without such waiver or reimbursement of expenses, the Fund’s returns would have been lower. Past performance is no guarantee of future results.
Average Annual Total Returns at Maximum Applicable
Sales Charge for the Periods Ended December 31, 2017
| | | 1 Year | | | 5 Years | | | 10 Years | | | Life of Class | | |
| Class A3 | | | 8.19% | | | | -0.96% | | | | 1.10% | | | | – | | |
| Class B4 | | | 4.86% | | | | -1.66% | | | | 0.73% | | | | – | | |
| Class C5 | | | 9.03% | | | | -1.13% | | | | 0.69% | | | | – | | |
| Class F6 | | | 10.83% | | | | -0.39% | | | | 1.48% | | | | – | | |
| Class F37 | | | – | | | | – | | | | – | | | | 5.45% | * | |
| Class I6 | | | 10.96% | | | | -0.29% | | | | 1.58% | | | | – | | |
| Class R26 | | | 10.28% | | | | -0.90% | | | | 1.02% | | | | – | | |
| Class R36 | | | 10.42% | | | | -0.77% | | | | 1.10% | | | | – | | |
| Class R48 | | | 10.67% | | | | – | | | | – | | | | 3.66% | | |
| Class R58 | | | 10.97% | | | | – | | | | – | | | | 3.92% | | |
| Class R68 | | | 10.99% | | | | – | | | | – | | | | 3.99% | | |
1 Reflects the deduction of the maximum initial sales charge of 2.25%.
2 Performance for the unmanaged index does not reflect any fees or expenses. The performance of the index is not necessarily representative of the Fund’s performance.
3 Total return, which is the percentage change in net asset value, after deduction of the maximum initial sales charge of 2.25% applicable to Class A shares, with all dividends and distributions reinvested for the periods shown ending December 31, 2017, is calculated using the SEC-required uniform method to compute such return.
4 Performance reflects the deduction of a CDSC of 5% for 1 year, 2% for 5 years and 0% for 10 years. Class B shares automatically
convert to Class A shares after approximately 8 years. (There is no initial sales charge for automatic conversions.) All returns for periods greater than 8 years reflect this conversion.
5 The 1% CDSC for Class C shares normally applies before the first anniversary of the purchase date. Performance for other periods is at net asset value.
6 Performance is at net asset value.
7 Commenced operations and performance for the Class began on April 4, 2017. Performance is at net asset value.
8 Commenced operations and performance for the Class began on June 30, 2015. Performance is at net asset value.
* Since Class F3 shares have existed for less than one year, average annual returns are not provided.
7
Emerging Markets Local Bond Fund
Investment Comparison
Below is a comparison of a $10,000 investment in Class A shares with the same investment in the JP Morgan GBI-EM Global Diversified Index, assuming reinvestment of all dividends and distributions. The performance of the other classes will be greater than or less than the performance shown in the graph below due to different sales loads and expenses applicable to such classes. The graph and performance table below do not reflect the deduction of taxes that a shareholder would pay on Fund distributions or the redemption of Fund shares. During certain periods, expenses of the Fund have been waived or reimbursed by Lord Abbett; without such waiver or reimbursement of expenses, the Fund’s returns would have been lower. Past performance is no guarantee of future results.
Average Annual Total Returns at Maximum Applicable
Sales Charge for the Periods Ended December 31, 2017
| | | 1 Year | | | Life of Class | | |
| Class A3 | | | 11.32% | | | | -1.96% | | |
| Class C4 | | | 12.13% | | | | -2.16% | | |
| Class F5 | | | 13.98% | | | | -1.39% | | |
| Class F36 | | | – | | | | 6.59% | * | |
| Class I5 | | | 14.08% | | | | -1.27% | | |
| Class R25 | | | 14.09% | | | | -1.33% | | |
| Class R35 | | | 14.09% | | | | -1.32% | | |
| Class R47 | | | 14.03% | | | | 3.42% | | |
| Class R57 | | | 14.09% | | | | 3.64% | | |
| Class R67 | | | 14.30% | | | | 3.75% | | |
1 Reflects the deduction of the maximum initial sales charge of 2.25%.
2 Performance for the unmanaged index does not reflect any fees or expenses. The performance of the index is not necessarily representative of the Fund’s performance.
3 Class A shares commenced operations on June 21, 2013 and performance for the Class began on June 28, 2013. Total return, which is the percentage change in net asset value, after deduction of the maximum initial sales charge of 2.25% applicable to Class A shares, with all dividends and distributions reinvested for the period shown ended December 31, 2017, is calculated using the SEC-required uniform method to compare such return.
4 Class C shares commenced operations on June 21, 2013 and performance for the Class began on June 28, 2013. The 1% CDSC for Class C normally applies before the first anniversary of the purchase date. Performance for other periods is at net asset value.
5 Commenced operations on June 21, 2013 and performance for the Class began on June 28, 2013. Performance is at net asset value.
6 Commenced operations and performance for the Class began on April 4, 2017. Performance is at net asset value.
7 Commenced operations and performance for the Class began on June 30, 2015. Performance is at net asset value.
* Since Class F3 shares have existed for less than one year, average annual returns are not provided.
8
Multi-Asset Global Opportunity Fund
Investment Comparison
Below is a comparison of a $10,000 investment in Class A shares with the same investment in the MSCI ACWI® Index with Gross Dividends, the MSCI ACWI® Index with Net Dividends, 35% Russell 1000® Index/25% MSCI EAFE® Index with Gross Dividends/25% ICE BofA Merrill Lynch U.S. High Yield Constrained Index/15% Bloomberg Barclays U.S. Aggregate Bond Index, 40% MSCI EAFE® Index with Gross Dividends/25% Russell 1000® Index/20% Bloomberg Barclays U.S. Aggregate Bond Index/15% ICE BofA Merrill Lynch U.S. High Yield Constrained Index and Morningstar World Allocation Category Average, assuming reinvestment of all dividends and distributions. The 40% MSCI EAFE Index with Gross Dividends/25% Russell 1000® Index/20% Bloomberg Barclays U.S. Aggregate Bond Index/15% ICE BofA Merrill Lynch U.S. High Yield Constrained Index was previously a primary benchmark index of the Fund during the fiscal year and will be removed from the next annual report. The performance of the other classes will be greater than or less than the performance shown in the graph below due to different sales loads and expenses applicable to such classes. The graph and performance table below do not reflect the deduction of taxes that a shareholder would pay on Fund distributions or the redemption of Fund shares. During certain periods, expenses of the Fund have been waived or reimbursed by Lord Abbett and reimbursed by the Underlying Funds; without such waiver or reimbursement of expenses, the Fund’s returns would have been lower. Past performance is no guarantee of future results.
9
Average Annual Total Returns at Maximum Applicable
Sales Charge for the Periods Ended December 31, 2017
| | | 1 Year | | | 5 Years | | | 10 Years | | | Life of Class | | |
| Class A3 | | | 10.07% | | | | 5.39% | | | | 2.96% | | | | – | | |
| Class B4 | | | 6.75% | | | | 4.74% | | | | 2.63% | | | | – | | |
| Class C5 | | | 10.77% | | | | 5.08% | | | | 2.47% | | | | – | | |
| Class F6 | | | 12.71% | | | | 6.00% | | | | 3.39% | | | | – | | |
| Class F37 | | | – | | | | – | | | | – | | | | 8.84% | * | |
| Class I6 | | | 12.83% | | | | 6.10% | | | | 3.48% | | | | – | | |
| Class R28 | | | 12.21% | | | | 5.48% | | | | – | | | | 4.53% | | |
| Class R38 | | | 12.38% | | | | 5.62% | | | | – | | | | 4.52% | | |
| Class R49 | | | 12.66% | | | | – | | | | – | | | | 4.86% | | |
| Class R59 | | | 12.82% | | | | – | | | | – | | | | 5.11% | | |
| Class R69 | | | 12.97% | | | | – | | | | – | | | | 5.15% | | |
1 Reflects the deduction of the maximum initial sales charge of 2.25%.
2 Performance for each unmanaged index does not reflect any fees or expenses. The performance of each index is not necessarily representative of the Fund’s performance.
3 Total return, which is the percentage change in net asset value, after deduction of the maximum initial sales charge of 2.25% applicable to Class A shares, with all distributions reinvested for the periods shown ending December 31, 2017, is calculated using the SEC-required uniform method to compute such return.
4 Performance reflects the deduction of a CDSC of 5% for 1 year, 2% for 5 years and 0% for 10 years. Class B shares automatically convert to Class A shares after approximately 8 years. (There is no initial sales charge for automatic conversions.) All returns for periods greater than 8 years reflect this conversion.
5 The 1% CDSC for Class C shares normally applies before the first anniversary of the purchase date. Performance for other periods is at net asset value.
6 Performance is at net asset value.
7 Commenced operations and performance for the Class began on April 4, 2017. Performance is at net asset value.
8 Commenced operations on June 23, 2008 and performance for the Class began on June 30, 2008. Performance is at net asset value.
9 Commenced operations and performance for the Class began on June 30, 2015. Performance is at net asset value.
* Since Class F3 shares have existed for less than one year, average annual returns are not provided.
10
Expense Example
As a shareholder of a Fund, you incur two types of costs: (1) transaction costs, including sales charges (loads) on purchase payments (these charges vary among the share classes); and (2) ongoing costs, including management fees; distribution and service (12b-1) fees (these charges vary among the share classes); and other Fund expenses. This Example is intended to help you understand your ongoing costs (in dollars) of investing in each Fund and to compare these costs with the ongoing costs of investing in other mutual funds.
The Example is based on an investment of $1,000 invested at the beginning of the period and held for the entire period (July 1, 2017 through December 31, 2017).
Actual Expenses
For each class of each Fund, the first line of the table on the following pages provides information about actual account values and actual expenses. You may use the information in this line, together with the amount you invested, to estimate the expenses that you paid over the period. Simply divide your account value by $1,000 (for example, an $8,600 account value divided by $1,000 = 8.6), then multiply the result by the number in the first line under the heading entitled “Expenses Paid During Period 7/1/17 – 12/31/17” to estimate the expenses you paid on your account during this period.
Hypothetical Example for Comparison Purposes
For each class of each Fund, the second line of the table on the following pages provides information about hypothetical account values and hypothetical expenses based on the Fund’s actual expense ratio and an assumed rate of return of 5% per year before expenses, which is not the Fund’s actual return. The hypothetical account values and expenses may not be used to estimate the actual ending account balance or expenses you paid for the period. You may use this information to compare the ongoing costs of investing in each Fund and other funds. To do so, compare this 5% hypothetical example with the 5% hypothetical examples that appear in the shareholder reports of the other funds.
11
Emerging Markets Corporate Debt Fund
Please note that the expenses shown in the table are meant to highlight your ongoing costs only and do not reflect any transactional costs, such as sales charges (loads). Therefore, the second line of the table is useful in comparing ongoing costs only, and will not help you determine the relative total costs of owning different funds. In addition, if these transactional costs were included, your costs would have been higher.
| | | Beginning | | Ending | | Expenses | |
| | | Account | | Account | | Paid During | |
| | | Value | | Value | | Period† | |
| | | | | | | 7/1/17 - | |
| | | 7/1/17 | | 12/31/17 | | 12/31/17 | |
| Class A | | | | | | | |
| Actual | | $1,000.00 | | $1,032.70 | | $5.38 | |
| Hypothetical (5% Return Before Expenses) | | $1,000.00 | | $1,019.91 | | $5.35 | |
| Class C | | | | | | | |
| Actual | | $1,000.00 | | $1,029.10 | | $8.95 | |
| Hypothetical (5% Return Before Expenses) | | $1,000.00 | | $1,016.38 | | $8.89 | |
| Class F | | | | | | | |
| Actual | | $1,000.00 | | $1,033.90 | | $4.87 | |
| Hypothetical (5% Return Before Expenses) | | $1,000.00 | | $1,020.42 | | $4.84 | |
| Class F3 | | | | | | | |
| Actual | | $1,000.00 | | $1,034.80 | | $3.44 | |
| Hypothetical (5% Return Before Expenses) | | $1,000.00 | | $1,021.80 | | $3.41 | |
| Class I | | | | | | | |
| Actual | | $1,000.00 | | $1,033.80 | | $4.36 | |
| Hypothetical (5% Return Before Expenses) | | $1,000.00 | | $1,020.92 | | $4.33 | |
| Class R2 | | | | | | | |
| Actual | | $1,000.00 | | $1,034.50 | | $4.36 | |
| Hypothetical (5% Return Before Expenses) | | $1,000.00 | | $1,020.92 | | $4.33 | |
| Class R3 | | | | | | | |
| Actual | | $1,000.00 | | $1,034.50 | | $4.36 | |
| Hypothetical (5% Return Before Expenses) | | $1,000.00 | | $1,020.92 | | $4.33 | |
| Class R4 | | | | | | | |
| Actual | | $1,000.00 | | $1,032.50 | | $5.64 | |
| Hypothetical (5% Return Before Expenses) | | $1,000.00 | | $1,019.66 | | $5.60 | |
| Class R5 | | | | | | | |
| Actual | | $1,000.00 | | $1,033.80 | | $4.36 | |
| Hypothetical (5% Return Before Expenses) | | $1,000.00 | | $1,020.92 | | $4.33 | |
| Class R6 | | | | | | | |
| Actual | | $1,000.00 | | $1,034.70 | | $3.44 | |
| Hypothetical (5% Return Before Expenses) | | $1,000.00 | | $1,021.83 | | $3.41 | |
| † | For each class of the Fund, net expenses are equal to the annualized expense ratio for such class (1.05% for Class A, 1.75% for Class C, 0.95% for Class F, 0.67% for Class F3, 0.85% for Classes I, R2 and R3, 1.10% for Class R4, 0.85% for Class R5 and 0.67% for Class R6) multiplied by the average account value over the period, multiplied by 184/365 (to reflect one-half year period). |
12
Portfolio Holdings Presented by Sector
December 31, 2017
| Sector* | | %** | |
| Auto | | | 0.36 | % | |
| Basic Industry | | | 1.09 | % | |
| Consumer Cyclical | | | 1.07 | % | |
| Consumer Discretionary | | | 0.37 | % | |
| Consumer Services | | | 1.72 | % | |
| Consumer Staples | | | 2.46 | % | |
| Energy | | | 16.20 | % | |
| Financial Services | | | 27.32 | % | |
| Foreign Government | | | 3.08 | % | |
| Government | | | 0.89 | % | |
| Health Care | | | 0.99 | % | |
| Materials & Processing | | | 14.83 | % | |
| Municipal | | | 0.17 | % | |
| Other | | | 1.12 | % | |
| Producer Durables | | | 1.18 | % | |
| Technology | | | 3.90 | % | |
| Telecommunications | | | 4.94 | % | |
| Transportation | | | 2.79 | % | |
| Utilities | | | 10.42 | % | |
| Repurchase Agreement | | | 5.10 | % | |
| Total | | | 100.00 | % | |
| * | | A sector may comprise several industries. |
| ** | | Represents percent of total investments. |
13
Emerging Markets Currency Fund
Please note that the expenses shown in the table are meant to highlight your ongoing costs only and do not reflect any transactional costs, such as sales charges (loads). Therefore, the second line of the table is useful in comparing ongoing costs only, and will not help you determine the relative total costs of owning different funds. In addition, if these transactional costs were included, your costs would have been higher.
| | | Beginning | | Ending | | Expenses | |
| | | Account | | Account | | Paid During | |
| | | Value | | Value | | Period† | |
| | | | | | | 7/1/17 - | |
| | | 7/1/17 | | 12/31/17 | | 12/31/17 | |
| Class A | | | | | | | |
| Actual | | $1,000.00 | | $1,035.90 | | $4.93 | |
| Hypothetical (5% Return Before Expenses) | | $1,000.00 | | $1,020.52 | | $4.89 | |
| Class B | | | | | | | |
| Actual | | $1,000.00 | | $1,030.00 | | $8.95 | |
| Hypothetical (5% Return Before Expenses) | | $1,000.00 | | $1,016.38 | | $8.89 | |
| Class C | | | | | | | |
| Actual | | $1,000.00 | | $1,032.70 | | $8.04 | |
| Hypothetical (5% Return Before Expenses) | | $1,000.00 | | $1,017.29 | | $7.98 | |
| Class F | | | | | | | |
| Actual | | $1,000.00 | | $1,036.40 | | $4.41 | |
| Hypothetical (5% Return Before Expenses) | | $1,000.00 | | $1,020.87 | | $4.38 | |
| Class F3 | | | | | | | |
| Actual | | $1,000.00 | | $1,036.90 | | $3.85 | |
| Hypothetical (5% Return Before Expenses) | | $1,000.00 | | $1,010.10 | | $3.80 | |
| Class I | | | | | | | |
| Actual | | $1,000.00 | | $1,037.00 | | $3.90 | |
| Hypothetical (5% Return Before Expenses) | | $1,000.00 | | $1,021.37 | | $3.87 | |
| Class R2 | | | | | | | |
| Actual | | $1,000.00 | | $1,033.90 | | $6.97 | |
| Hypothetical (5% Return Before Expenses) | | $1,000.00 | | $1,018.35 | | $6.92 | |
| Class R3 | | | | | | | |
| Actual | | $1,000.00 | | $1,034.40 | | $6.46 | |
| Hypothetical (5% Return Before Expenses) | | $1,000.00 | | $1,018.85 | | $6.41 | |
| Class R4 | | | | | | | |
| Actual | | $1,000.00 | | $1,035.70 | | $5.23 | |
| Hypothetical (5% Return Before Expenses) | | $1,000.00 | | $1,020.06 | | $5.19 | |
| Class R5 | | | | | | | |
| Actual | | $1,000.00 | | $1,037.00 | | $3.75 | |
| Hypothetical (5% Return Before Expenses) | | $1,000.00 | | $1,021.48 | | $3.72 | |
| Class R6 | | | | | | | |
| Actual | | $1,000.00 | | $1,037.10 | | $3.85 | |
| Hypothetical (5% Return Before Expenses) | | $1,000.00 | | $1,021.42 | | $3.82 | |
| † | For each class of the Fund, net expenses are equal to the annualized expense ratio for such class (0.96% for Class A, 1.75% for Class B, 1.57% for Class C, 0.86% for Class F, 0.75% for Class F3, 0.76% for Class I, 1.36% for Class R2, 1.26% for Class R3, 1.02% for Class R4, 0.73% for Class R5 and 0.75% for Class R6) multiplied by the average account value over the period, multiplied by 184/365 (to reflect one-half year period). |
14
Portfolio Holdings Presented by Sector
December 31, 2017
| Sector* | | %** | |
| Asset Backed | | | 15.20 | % | |
| Automotive | | | 3.37 | % | |
| Banking | | | 6.97 | % | |
| Basic Industry | | | 3.23 | % | |
| Capital Goods | | | 1.77 | % | |
| Consumer Goods | | | 1.72 | % | |
| Energy | | | 12.63 | % | |
| Financial Services | | | 2.18 | % | |
| Foreign Government | | | 4.95 | % | |
| Healthcare | | | 2.79 | % | |
| Insurance | | | 0.72 | % | |
| Leisure | | | 1.44 | % | |
| Media | | | 0.98 | % | |
| Mortgage Backed | | | 22.82 | % | |
| Municipal | | | 0.37 | % | |
| Real Estate | | | 1.40 | % | |
| Retail | | | 0.56 | % | |
| Services | | | 0.61 | % | |
| Technology & Electronics | | | 4.81 | % | |
| Telecommunications | | | 1.88 | % | |
| Transportation | | | 0.61 | % | |
| U.S. Government | | | 5.27 | % | |
| Utility | | | 3.72 | % | |
| Total | | | 100.00 | % | |
| * | | A sector may comprise several industries. |
| ** | | Represents percent of total investments. |
15
Emerging Markets Local Bond Fund
Please note that the expenses shown in the table are meant to highlight your ongoing costs only and do not reflect any transactional costs, such as sales charges (loads). Therefore, the second line of the table is useful in comparing ongoing costs only, and will not help you determine the relative total costs of owning different funds. In addition, if these transactional costs were included, your costs would have been higher.
| | | Beginning | | Ending | | Expenses | |
| | | Account | | Account | | Paid During | |
| | | Value | | Value | | Period† | |
| | | | | | | 7/1/17 - | |
| | | 7/1/17 | | 12/31/17 | | 12/31/17 | |
| Class A | | | | | | | |
| Actual | | $1,000.00 | | $1,033.90 | | $5.38 | |
| Hypothetical (5% Return Before Expenses) | | $1,000.00 | | $1,019.91 | | $5.35 | |
| Class C | | | | | | | |
| Actual | | $1,000.00 | | $1,030.40 | | $8.80 | |
| Hypothetical (5% Return Before Expenses) | | $1,000.00 | | $1,016.53 | | $8.74 | |
| Class F | | | | | | | |
| Actual | | $1,000.00 | | $1,035.30 | | $4.87 | |
| Hypothetical (5% Return Before Expenses) | | $1,000.00 | | $1,020.42 | | $4.84 | |
| Class F3 | | | | | | | |
| Actual | | $1,000.00 | | $1,035.20 | | $3.80 | |
| Hypothetical (5% Return Before Expenses) | | $1,000.00 | | $1,021.50 | | $3.77 | |
| Class I | | | | | | | |
| Actual | | $1,000.00 | | $1,035.70 | | $4.36 | |
| Hypothetical (5% Return Before Expenses) | | $1,000.00 | | $1,020.92 | | $4.33 | |
| Class R2 | | | | | | | |
| Actual | | $1,000.00 | | $1,035.80 | | $4.36 | |
| Hypothetical (5% Return Before Expenses) | | $1,000.00 | | $1,020.92 | | $4.33 | |
| Class R3 | | | | | | | |
| Actual | | $1,000.00 | | $1,035.80 | | $4.36 | |
| Hypothetical (5% Return Before Expenses) | | $1,000.00 | | $1,020.92 | | $4.33 | |
| Class R4 | | | | | | | |
| Actual | | $1,000.00 | | $1,035.00 | | $5.64 | |
| Hypothetical (5% Return Before Expenses) | | $1,000.00 | | $1,019.66 | | $5.60 | |
| Class R5 | | | | | | | |
| Actual | | $1,000.00 | | $1,035.30 | | $4.36 | |
| Hypothetical (5% Return Before Expenses) | | $1,000.00 | | $1,020.92 | | $4.33 | |
| Class R6 | | | | | | | |
| Actual | | $1,000.00 | | $1,036.80 | | $3.80 | |
| Hypothetical (5% Return Before Expenses) | | $1,000.00 | | $1,021.48 | | $3.77 | |
| † | For each class of the Fund, net expenses are equal to the annualized expense ratio for such class (1.05% for Class A, 1.72% for Class C, 0.95% for Class F, 0.74% for Class F3, 0.85% for Classes I, R2, and R3, 1.10% for Class R4, 0.85% for Class R5 and 0.74% for Class R6) multiplied by the average account value over the period, multiplied by 184/365 (to reflect one-half year period. |
16
Portfolio Holdings Presented by Sector
December 31, 2017
| Sector* | | | %** | |
| Consumer Services | | | 0.61 | % | |
| Energy | | | 1.27 | % | |
| Financial Services | | | 2.93 | % | |
| Foreign Government | | | 85.93 | % | |
| Municipal | | | 3.19 | % | |
| Telecommunications | | | 2.23 | % | |
| Transportation | | | 0.69 | % | |
| Utilities | | | 3.15 | % | |
| Total | | | 100.00 | % | |
| * | | A sector may comprise several industries. |
| ** | | Represents percent of total investments. |
17
Multi-Asset Global Opportunity Fund
Please note that the expenses shown in the table are meant to highlight your ongoing costs only and do not reflect any transactional costs, such as sales charges (loads). Therefore, the second line of the table is useful in comparing ongoing costs only, and will not help you determine the relative total costs of owning different funds. In addition, if these transactional costs were included, your costs would have been higher.
| | | Beginning | | Ending | | Expenses | |
| | | Account | | Account | | Paid During | |
| | | Value | | Value | | Period†# | |
| | | | | | | 7/1/17 - | |
| | | 7/1/17 | | 12/31/17 | | 12/31/17 | |
| Class A | | | | | | | |
| Actual | | $1,000.00 | | $1,062.80 | | $3.22 | |
| Hypothetical (5% Return Before Expenses) | | $1,000.00 | | $1,022.08 | | $3.16 | |
| Class B | | | | | | | |
| Actual | | $1,000.00 | | $1,058.50 | | $7.16 | |
| Hypothetical (5% Return Before Expenses) | | $1,000.00 | | $1,018.25 | | $7.02 | |
| Class C | | | | | | | |
| Actual | | $1,000.00 | | $1,059.10 | | $7.11 | |
| Hypothetical (5% Return Before Expenses) | | $1,000.00 | | $1,018.30 | | $6.97 | |
| Class F | | | | | | | |
| Actual | | $1,000.00 | | $1,063.60 | | $2.44 | |
| Hypothetical (5% Return Before Expenses) | | $1,000.00 | | $1,022.84 | | $2.40 | |
| Class F3 | | | | | | | |
| Actual | | $1,000.00 | | $1,064.70 | | $1.61 | |
| Hypothetical (5% Return Before Expenses) | | $1,000.00 | | $1,023.60 | | $1.58 | |
| Class I | | | | | | | |
| Actual | | $1,000.00 | | $1,063.60 | | $1.92 | |
| Hypothetical (5% Return Before Expenses) | | $1,000.00 | | $1,023.34 | | $1.89 | |
| Class R2 | | | | | | | |
| Actual | | $1,000.00 | | $1,060.80 | | $5.04 | |
| Hypothetical (5% Return Before Expenses) | | $1,000.00 | | $1,020.32 | | $4.94 | |
| Class R3 | | | | | | | |
| Actual | | $1,000.00 | | $1,062.00 | | $4.37 | |
| Hypothetical (5% Return Before Expenses) | | $1,000.00 | | $1,020.97 | | $4.28 | |
| Class R4 | | | | | | | |
| Actual | | $1,000.00 | | $1,063.10 | | $3.22 | |
| Hypothetical (5% Return Before Expenses) | | $1,000.00 | | $1,022.08 | | $3.16 | |
| Class R5 | | | | | | | |
| Actual | | $1,000.00 | | $1,063.60 | | $1.92 | |
| Hypothetical (5% Return Before Expenses) | | $1,000.00 | | $1,023.34 | | $1.89 | |
| Class R6 | | | | | | | |
| Actual | | $1,000.00 | | $1,064.70 | | $1.46 | |
| Hypothetical (5% Return Before Expenses) | | $1,000.00 | | $1,023.79 | | $1.43 | |
| † | For each class of the Fund, net expenses are equal to the annualized expense ratio for such class (0.62% for Class A, 1.38% for Class B, 1.37% for Class C, 0.47% for Class F, 0.31% for Class F3, 0.37% for Class I, 0.97% for Class R2, 0.84% for Class R3, 0.62% for Class R4, 0.37% for Class R5 and 0.28% for Class R6) multiplied by the average account value over the period, multiplied by 184/365 (to reflect one-half year period). |
| # | Does not include expenses of Underlying Funds in which Multi-Asset Global Opportunity Fund invests. |
18
Portfolio Holdings Presented by Portfolio Allocation
December 31, 2017
| Underlying Fund Name | | %* | |
| Lord Abbett Equity Trust-Calibrated Large Cap Value Fund-Class I | | | 7.32 | % | |
| Lord Abbett Equity Trust-Calibrated Mid Cap Value Fund-Class I | | | 12.19 | % | |
| Lord Abbett Investment Trust-Convertible Fund-Class I | | | 7.32 | % | |
| Lord Abbett Global Fund, Inc.-Emerging Markets Currency Fund-Class I | | | 7.82 | % | |
| Lord Abbett Securities Trust-Growth Leaders Fund-Class I | | | 11.68 | % | |
| Lord Abbett Investment Trust-High Yield Fund-Class I | | | 12.31 | % | |
| Lord Abbett Investment Trust-Inflation Focused Fund-Class I | | | 1.93 | % | |
| Lord Abbett Securities Trust-International Equity Fund-Class I | | | 8.36 | % | |
| Lord Abbett Securities Trust-International Dividend Income Fund-Class I | | | 23.08 | % | |
| Lord Abbett Mid Cap Stock Fund, Inc.-Class I | | | 4.88 | % | |
| Lord Abbett Investment Trust-Short Duration Income Fund-Class I | | | 2.02 | % | |
| Repurchase Agreement | | | 1.09 | % | |
| Total | | | 100.00 | % | |
| * | Represents percent of total investments. |
19
Schedule of Investments
EMERGING MARKETS CORPORATE DEBT FUND December 31, 2017
| Investments | | | | | | Shares
(000) | | | Fair
Value | |
| LONG-TERM INVESTMENTS 94.28% | | | | | | | | | | | | |
| | | | | | | | | | | | | |
| COMMON STOCK 0.11% | | | | | | | | | | | | |
| | | | | | | | | | | | | |
| Metals & Minerals: Miscellaneous | | | | | | | | | | | | |
Vedanta Ltd. ADR
(cost $57,261) | | | | | | | 3 | | | $ | 58,761 | |
| | | | | | | | | | | | | |
| | | Interest
Rate | | Maturity
Date | | Principal
Amount
(000) | | | | |
| CORPORATE BONDS 90.42% | | | | | | | | | | | | |
| | | | | | | | | | | | | |
| Aerospace/Defense 0.47% | | | | | | | | | | | | |
| Embraer Netherlands Finance BV (Netherlands)(a) | | 5.05% | | 6/15/2025 | | $ | 248 | | | | 264,120 | |
| | | | | | | | | | | | | |
| Air Transportation 1.58% | | | | | | | | | | | | |
| Azul Investments LLP† | | 5.875% | | 10/26/2024 | | | 200 | | | | 199,250 | |
| Emirates Airline (United Arab Emirates)†(a) | | 4.50% | | 2/6/2025 | | | 143 | | | | 144,817 | |
| Gol Finance, Inc. (Brazil)†(a) | | 7.00% | | 1/31/2025 | | | 199 | | | | 196,614 | |
| Guanay Finance Ltd.† | | 6.00% | | 12/15/2020 | | | 127 | | | | 131,135 | |
| Latam Finance Ltd.† | | 6.875% | | 4/11/2024 | | | 200 | | | | 209,000 | |
| Total | | | | | | | | | | | 880,816 | |
| | | | | | | | | | | | | |
| Automotive 0.36% | | | | | | | | | | | | |
| Hyundai Capital America† | | 2.60% | | 3/19/2020 | | | 200 | | | | 198,464 | |
| | | | | | | | | | | | | |
| Banks: Regional 18.94% | | | | | | | | | | | | |
| ADCB Finance Cayman Ltd. | | 2.75% | | 9/16/2019 | | | 200 | | | | 200,205 | |
| Akbank Turk AS (Turkey)†(a) | | 4.00% | | 1/24/2020 | | | 200 | | | | 201,047 | |
| Alfa Bank AO Via Alfa Bond Issuance plc (Ireland)†(a) | | 7.75% | | 4/28/2021 | | | 200 | | | | 225,514 | |
| Axis Bank Ltd. (United Arab Emirates)†(a) | | 3.25% | | 5/21/2020 | | | 200 | | | | 201,207 | |
| Banco de Bogota SA (Colombia)†(a) | | 4.375% | | 8/3/2027 | | | 200 | | | | 200,000 | |
| Banco de Bogota SA (Colombia)†(a) | | 6.25% | | 5/12/2026 | | | 200 | | | | 216,160 | |
| Banco de Credito del Peru†(b) | | 4.85% | | 10/30/2020 | | PEN | 808 | | | | 249,011 | |
| Banco de Credito del Peru (Peru)†(a) | | 4.25% | | 4/1/2023 | | $ | 200 | | | | 210,250 | |
| Banco de Credito e Inversiones (Chile)†(a) | | 3.50% | | 10/12/2027 | | | 200 | | | | 195,375 | |
| Banco do Brasil SA† | | 4.625% | | 1/15/2025 | | | 200 | | | | 197,866 | |
| Banco do Brasil SA† | 6.25%
(10 Yr Treasury Note CMT + 4.40% | )# | – | (c) | | 200 | | | | 184,500 | |
| Banco Inbursa SA Institucion de Banca Multiple (Mexico)†(a) | | 4.375% | | 4/11/2027 | | | 150 | | | | 150,657 | |
| 20 | See Notes to Financial Statements. | |
Schedule of Investments (continued)
EMERGING MARKETS CORPORATE DEBT FUND December 31, 2017
| Investments | | Interest
Rate | | Maturity
Date | | Principal
Amount
(000) | | | Fair
Value | |
| Banks: Regional (continued) | | | | | | | | | | | | |
| Banco Mercantil del Norte SA (Mexico)†(a) | 7.625%
(10 Yr Treasury Note CMT + 5.35% | )# | – | (c) | $ | 200 | | | $ | 219,750 | |
| Banco Regional SAECA (Paraguay)†(a) | | 8.125% | | 1/24/2019 | | | 150 | | | | 157,155 | |
| Bancolombia SA (Colombia)(a) | | 5.95% | | 6/3/2021 | | | 150 | | | | 162,600 | |
| Bangkok Bank PCL (Hong Kong)†(a) | | 4.80% | | 10/18/2020 | | | 100 | | | | 105,388 | |
| Bangkok Bank PCL (Hong Kong)†(a) | | 5.00% | | 10/3/2023 | | | 200 | | | | 219,210 | |
| Banistmo SA (Panama)†(a) | | 3.65% | | 9/19/2022 | | | 200 | | | | 198,000 | |
| Bank of China Ltd. (China)†(a) | | 5.00% | | 11/13/2024 | | | 200 | | | | 213,590 | |
| Bank of China Ltd. (Hong Kong)(a) | | 3.875% | | 6/30/2025 | | | 200 | | | | 206,861 | |
| Bank of India (Jersey)(a) | | 3.125% | | 5/6/2020 | | | 200 | | | | 199,163 | |
| BBVA Banco Continental SA (Peru)†(a) | | 5.00% | | 8/26/2022 | | | 200 | | | | 216,250 | |
| Finansbank AS (Turkey)†(a) | | 4.875% | | 5/19/2022 | | | 200 | | | | 196,764 | |
| ICICI Bank Ltd. (United Arab Emirates)†(a) | | 3.80% | | 12/14/2027 | | | 200 | | | | 197,727 | |
| Industrial & Commercial Bank of China Ltd. (United Arab Emirates)(a) | | 3.538% | | 11/8/2027 | | | 250 | | | | 248,980 | |
| Industrial & Commercial Bank of China Ltd. (United Arab Emirates)(a) | | 2.625% | | 5/26/2020 | | | 400 | | | | 397,664 | |
| Industrial Bank of Korea (South Korea)†(a) | | 2.00% | | 4/23/2020 | | | 200 | | | | 196,091 | |
| Itau Unibanco Holding SA† | 6.125% (BADLAR + 3.98% | )# | – | (c) | | 200 | | | | 200,120 | |
| KEB Hana Bank (South Korea)(a) | | 2.50% | | 6/12/2019 | | | 200 | | | | 199,515 | |
| Korea Development Bank (The) (South Korea)(a) | | 2.50% | | 1/13/2021 | | | 200 | | | | 197,425 | |
| National Savings Bank (Sri Lanka)†(a) | | 5.15% | | 9/10/2019 | | | 200 | | | | 202,980 | |
| NBK SPC Ltd. (United Arab Emirates)†(a) | | 2.75% | | 5/30/2022 | | | 200 | | | | 197,044 | |
| Oversea-Chinese Banking Corp., Ltd. (Singapore)†(a) | 3.15%
(5 Yr Swap rate + 2.28% | )# | 3/11/2023 | | | 200 | | | | 200,263 | |
| Popular, Inc. | | 7.00% | | 7/1/2019 | | | 30 | | | | 31,350 | |
| QNB Finance Ltd. | | 2.875% | | 4/29/2020 | | | 400 | | | | 396,944 | |
| Sberbank of Russia Via SB Capital SA (Luxembourg)†(a) | | 5.25% | | 5/23/2023 | | | 250 | | | | 260,949 | |
| Sberbank of Russia via SB Capital SA (Luxembourg)†(a) | | 6.125% | | 2/7/2022 | | | 200 | | | | 218,516 | |
| Shinhan Bank (South Korea)†(a) | | 2.25% | | 4/15/2020 | | | 200 | | | | 197,088 | |
| Turkiye Garanti Bankasi AS (Turkey)†(a) | | 6.25% | | 4/20/2021 | | | 200 | | | | 211,825 | |
| Turkiye Halk Bankasi AS (Turkey)†(a) | | 4.75% | | 6/4/2019 | | | 200 | | | | 197,216 | |
| Turkiye Halk Bankasi AS (Turkey)†(a) | | 4.75% | | 2/11/2021 | | | 200 | | | | 191,764 | |
| Turkiye Is Bankasi (Turkey)†(a) | | 5.00% | | 4/30/2020 | | | 400 | | | | 405,307 | |
| Turkiye Vakiflar Bankasi TAO (Turkey)†(a) | | 5.625% | | 5/30/2022 | | | 400 | | | | 399,772 | |
| United Overseas Bank Ltd. (Singapore)(a) | 3.50%
(5 Yr Swap rate + 2.24% | )# | 9/16/2026 | | | 200 | | | | 201,626 | |
| Vnesheconombank via VEB Finance plc (Ireland)†(a) | | 6.80% | | 11/22/2025 | | | 400 | | | | 457,045 | |
| | See Notes to Financial Statements. | 21 |
Schedule of Investments (continued)
EMERGING MARKETS CORPORATE DEBT FUND December 31, 2017
| Investments | | Interest
Rate | | Maturity
Date | | Principal
Amount
(000) | | | Fair
Value | |
| Banks: Regional (continued) | | | | | | | | | | | | |
| Woori Bank (South Korea)†(a) | | 4.75% | | 4/30/2024 | | $ | 200 | | | $ | 209,997 | |
| Zenith Bank plc (Nigeria)†(a) | | 6.25% | | 4/22/2019 | | | 200 | | | | 205,462 | |
| Zenith Bank plc (Nigeria)†(a) | | 7.375% | | 5/30/2022 | | | 200 | | | | 208,640 | |
| Total | | | | | | | | | | | 10,557,833 | |
| | | | | | | | | | | | | |
| Beverages 0.63% | | | | | | | | | | | | |
| Becle SAB de CV (Mexico)†(a) | | 3.75% | | 5/13/2025 | | | 350 | | | | 351,815 | |
| | | | | | | | | | | | | |
| Building Materials 1.08% | | | | | | | | | | | | |
| Cementos Pacasmayo SAA (Peru)†(a) | | 4.50% | | 2/8/2023 | | | 200 | | | | 206,500 | |
| CIMPOR Financial Operations BV (Netherlands)†(a) | | 5.75% | | 7/17/2024 | | | 200 | | | | 194,750 | |
| Grupo Cementos de Chihuahua SAB de CV (Mexico)†(a) | | 5.25% | | 6/23/2024 | | | 200 | | | | 203,000 | |
| Total | | | | | | | | | | | 604,250 | |
| | | | | | | | | | | | | |
| Business Services 2.13% | | | | | | | | | | | | |
| Acwa Power Management & Investments One Ltd. (United Arab Emirates)†(a) | | 5.95% | | 12/15/2039 | | | 200 | | | | 205,588 | |
| Adani Ports & Special Economic Zone Ltd. (India)†(a) | | 4.00% | | 7/30/2027 | | | 400 | | | | 397,574 | |
| Autopistas del Sol SA (Costa Rica)†(a) | | 7.375% | | 12/30/2030 | | | 198 | | | | 211,860 | |
| DP World Ltd. (United Arab Emirates)†(a) | | 6.85% | | 7/2/2037 | | | 300 | | | | 370,060 | |
| Total | | | | | | | | | | | 1,185,082 | |
| | | | | | | | | | | | | |
| Chemicals 3.69% | | | | | | | | | | | | |
| Braskem Finance Ltd. | | 6.45% | | 2/3/2024 | | | 200 | | | | 225,002 | |
| Braskem Netherlands Finance BV (Netherlands)†(a) | | 4.50% | | 1/10/2028 | | | 200 | | | | 197,010 | |
| Chandra Asri Petrochemical Tbk PT (Indonesia)†(a) | | 4.95% | | 11/8/2024 | | | 200 | | | | 197,112 | |
| CNAC HK Finbridge Co. Ltd. (Hong Kong)(a) | | 4.125% | | 7/19/2027 | | | 200 | | | | 200,437 | |
| Equate Petrochemical BV (Netherlands)†(a) | | 3.00% | | 3/3/2022 | | | 200 | | | | 197,422 | |
| Halcyon Agri Corp. Ltd. (Singapore)(a) | 4.50% (H15T2Y + 8.31% | )# | – | (c) | | 200 | | | | 198,953 | |
| Mexichem SAB de CV (Mexico)†(a) | | 5.50% | | 1/15/2048 | | | 200 | | | | 195,250 | |
| OCP SA (Morocco)†(a) | | 6.875% | | 4/25/2044 | | | 200 | | | | 230,068 | |
| PTT Global Chemical PCL (Thailand)†(a) | | 4.25% | | 9/19/2022 | | | 200 | | | | 209,607 | |
| Sociedad Quimica y Minera de Chile SA (Chile)†(a) | | 3.625% | | 4/3/2023 | | | 200 | | | | 204,250 | |
| Total | | | | | | | | | | | 2,055,111 | |
| | | | | | | | | | | | | |
| Coal 0.45% | | | | | | | | | | | | |
| Eterna Capital Pte Ltd. PIK 6.00% (Singapore)(a) | | 6.00% | | 12/11/2022 | | | 10 | | | | 10,506 | (d) |
| Eterna Capital Pte Ltd. PIK 8.00% (Singapore)(a) | | 8.00% | | 12/11/2022 | | | 250 | | | | 241,616 | (d) |
| Total | | | | | | | | | | | 252,122 | |
| 22 | See Notes to Financial Statements. | |
Schedule of Investments (continued)
EMERGING MARKETS CORPORATE DEBT FUND December 31, 2017
| Investments | | Interest
Rate | | Maturity
Date | | Principal
Amount
(000) | | | Fair
Value | |
| Computer Software 0.37% | | | | | | | | | | | | |
| Marble II Pte Ltd. (Singapore)†(a) | | 5.30% | | 6/20/2022 | | $ | 200 | | | $ | 203,348 | |
| | | | | | | | | | | | | |
| Diversified 1.49% | | | | | | | | | | | | |
| CK Hutchison International 17 Ltd.† | | 3.50% | | 4/5/2027 | | | 200 | | | | 200,171 | |
| Grupo KUO SAB De CV (Mexico)†(a) | | 5.75% | | 7/7/2027 | | | 200 | | | | 207,602 | |
| KOC Holding AS (Turkey)†(a) | | 5.25% | | 3/15/2023 | | | 400 | | | | 420,820 | |
| Total | | | | | | | | | | | 828,593 | |
| | | | | | | | | | | | | |
| Drugs 0.98% | | | | | | | | | | | | |
| Teva Pharmaceutical Finance Co. BV (Curacao)(a) | | 3.65% | | 11/10/2021 | | | 200 | | | | 190,407 | |
| Teva Pharmaceutical Finance Netherlands III BV (Netherlands)(a) | | 2.80% | | 7/21/2023 | | | 250 | | | | 217,942 | |
| Teva Pharmaceutical Finance Netherlands III BV (Netherlands)(a) | | 3.15% | | 10/1/2026 | | | 170 | | | | 140,581 | |
| Total | | | | | | | | | | | 548,930 | |
| | | | | | | | | | | | | |
| Electric: Power 9.98% | | | | | | | | | | | | |
| Abu Dhabi National Energy Co. PJSC (United Arab Emirates)†(a) | | 3.625% | | 1/12/2023 | | | 200 | | | | 202,821 | |
| Abu Dhabi National Energy Co. PJSC (United Arab Emirates)†(a) | | 4.375% | | 6/22/2026 | | | 400 | | | | 412,660 | |
| Capex SA (Argentina)†(a) | | 6.875% | | 5/15/2024 | | | 200 | | | | 209,446 | |
| Celeo Redes Operacion Chile SA (Chile)†(a) | | 5.20% | | 6/22/2047 | | | 200 | | | | 203,500 | |
| Centrais Eletricas Brasileiras SA (Brazil)†(a) | | 5.75% | | 10/27/2021 | | | 200 | | | | 206,900 | |
| Colbun SA (Chile)†(a) | | 3.95% | | 10/11/2027 | | | 200 | | | | 199,875 | |
| Dubai Electricity & Water Authority (United Arab Emirates)†(a) | | 7.375% | | 10/21/2020 | | | 100 | | | | 112,287 | |
| Emirates Semb Corp., Water & Power Co. PJSC (United Arab Emirates)†(a) | | 4.45% | | 8/1/2035 | | | 200 | | | | 204,638 | |
| Empresa de Energia de Bogota SA ESP (Colombia)†(a) | | 6.125% | | 11/10/2021 | | | 200 | | | | 204,250 | |
| Energuate Trust (Guatemala)†(a) | | 5.875% | | 5/3/2027 | | | 200 | | | | 207,480 | |
| Engie Energia Chile SA (Chile)†(a) | | 4.50% | | 1/29/2025 | | | 200 | | | | 209,472 | |
| Eskom Holdings SOC Ltd. (South Africa)†(a) | | 5.75% | | 1/26/2021 | | | 400 | | | | 396,360 | |
| Fenix Power Peru SA (Peru)†(a) | | 4.317% | | 9/20/2027 | | | 250 | | | | 250,125 | |
| Infraestructura Energetica Nova SAB de CV (Mexico)†(a) | | 4.875% | | 1/14/2048 | | | 200 | | | | 192,750 | |
| Inkia Energy Ltd. (Peru)†(a) | | 5.875% | | 11/9/2027 | | | 200 | | | | 201,652 | |
| Israel Electric Corp. Ltd. (Israel)†(a) | | 5.00% | | 11/12/2024 | | | 450 | | | | 479,686 | |
| Listrindo Capital BV (Netherlands)†(a) | | 4.95% | | 9/14/2026 | | | 200 | | | | 203,000 | |
| Minejesa Capital BV (Netherlands)†(a) | | 4.625% | | 8/10/2030 | | | 200 | | | | 204,911 | |
| | See Notes to Financial Statements. | 23 |
Schedule of Investments (continued)
EMERGING MARKETS CORPORATE DEBT FUND December 31, 2017
| Investments | | Interest
Rate | | Maturity
Date | | Principal
Amount
(000) | | | Fair
Value | |
| Electric: Power (continued) | | | | | | | | | | | | |
| Orazul Energy Egenor S en C por A (Peru)†(a) | | 5.625% | | 4/28/2027 | | $ | 200 | | | $ | 197,300 | |
| Pampa Energia SA (Argentina)†(a) | | 7.50% | | 1/24/2027 | | | 200 | | | | 220,028 | |
| Perusahaan Listrik Negara PT (Indonesia)†(a) | | 5.50% | | 11/22/2021 | | | 200 | | | | 217,260 | |
| Saudi Electricity Global Sukuk Co. 3† | | 5.50% | | 4/8/2044 | | | 400 | | | | 431,668 | |
| State Grid Overseas Investment 2016 Ltd.† | | 2.25% | | 5/4/2020 | | | 200 | | | | 198,124 | |
| Total | | | | | | | | | | | 5,566,193 | |
| | | | | | | | | | | | | |
| Energy Equipment & Services 0.36% | | | | | | | | | | | | |
| Greenko Dutch BV (Netherlands)†(a) | | 5.25% | | 7/24/2024 | | | 200 | | | | 203,110 | |
| | | | | | | | | | | | | |
| Engineering & Contracting Services 2.23% | | | | | | | | | | | | |
| Aeropuertos Dominicanos Siglo XXI SA (Dominican Republic)†(a) | | 6.75% | | 3/30/2029 | | | 200 | | | | 219,750 | |
| China Railway Resources Huitung Ltd. (Hong Kong)(a) | | 3.85% | | 2/5/2023 | | | 200 | | | | 206,399 | |
| Delhi International Airport Ltd. (India)†(a) | | 6.125% | | 10/31/2026 | | | 200 | | | | 213,000 | |
| GMR Hyderabad International Airport Ltd. (India)†(a) | | 4.25% | | 10/27/2027 | | | 200 | | | | 196,865 | |
| Indika Energy Capital III Pte Ltd. (Singapore)†(a) | | 5.875% | | 11/9/2024 | | | 200 | | | | 200,745 | |
| Pratama Agung Pte Ltd. (Singapore)(a) | | 6.25% | | 2/24/2020 | | | 200 | | | | 205,389 | |
| Total | | | | | | | | | | | 1,242,148 | |
| | | | | | | | | | | | | |
| Financial Services 1.81% | | | | | | | | | | | | |
| Huarong Finance 2017 Co. Ltd. (Hong Kong)(a) | 4.50%
(5 Yr Treasury Constant Maturity Rate + 7.77% | )# | – | (c) | | 200 | | | | 202,302 | |
| Intercorp Financial Services, Inc. (Peru)†(a) | | 4.125% | | 10/19/2027 | | | 200 | | | | 196,500 | |
| SURA Asset Management SA (Colombia)†(a) | | 4.375% | | 4/11/2027 | | | 400 | | | | 405,000 | |
| Unifin Financiera SAB de CV SOFOM ENR (Mexico)†(a) | | 7.00% | | 1/15/2025 | | | 200 | | | | 205,250 | |
| Total | | | | | | | | | | | 1,009,052 | |
| | | | | | | | | | | | | |
| Food 1.81% | | | | | | | | | | | | |
| Arcor SAIC (Argentina)†(a) | | 6.00% | | 7/6/2023 | | | 185 | | | | 196,794 | |
| Cencosud SA (Chile)†(a) | | 4.375% | | 7/17/2027 | | | 200 | | | | 198,200 | |
| Gruma SAB de CV (Mexico)†(a) | | 4.875% | | 12/1/2024 | | | 200 | | | | 214,500 | |
| Minerva Luxembourg SA (Luxembourg)†(a) | | 5.875% | | 1/19/2028 | | | 200 | | | | 194,850 | |
| SMU SA (Chile)†(a) | | 7.75% | | 2/8/2020 | | | 200 | | | | 205,048 | |
| Total | | | | | | | | | | | 1,009,392 | |
| | | | | | | | | | | | | |
| Foreign Government 0.36% | | | | | | | | | | | | |
| EXIM Sukuk Malaysia Berhad (Malaysia)(a) | | 2.874% | | 2/19/2019 | | | 200 | | | | 200,619 | |
| 24 | See Notes to Financial Statements. | |
Schedule of Investments (continued)
EMERGING MARKETS CORPORATE DEBT FUND December 31, 2017
| Investments | | Interest
Rate | | Maturity
Date | | Principal
Amount
(000) | | | Fair
Value | |
| Household Equipment/Products 0.36% | | | | | | | | | | | | |
| Turkiye Sise ve Cam Fabrikalari AS (Turkey)†(a) | | 4.25% | | 5/9/2020 | | $ | 200 | | | $ | 203,129 | |
| | | | | | | | | | | | | |
| Investment Management Companies 0.76% | | | | | | | | | | | | |
| GrupoSura Finance SA† | | 5.50% | | 4/29/2026 | | | 200 | | | | 217,250 | |
| Huarong Finance II Co. Ltd. (Hong Kong)(a) | | 4.625% | | 6/3/2026 | | | 200 | | | | 204,093 | |
| Total | | | | | | | | | | | 421,343 | |
| | | | | | | | | | | | | |
| Machinery: Agricultural 1.18% | | | | | | | | | | | | |
| Kernel Holding SA (Ukraine)†(a) | | 8.75% | | 1/31/2022 | | | 200 | | | | 220,779 | |
| MHP SE (Ukraine)†(a) | | 7.75% | | 5/10/2024 | | | 200 | | | | 217,280 | |
| MHP SE (Ukraine)†(a) | | 8.25% | | 4/2/2020 | | | 200 | | | | 217,655 | |
| Total | | | | | | | | | | | 655,714 | |
| | | | | | | | | | | | | |
| Media 1.71% | | | | | | | | | | | | |
| Altice Financing SA (Luxembourg)†(a) | | 6.625% | | 2/15/2023 | | | 200 | | | | 209,920 | |
| Altice Financing SA (Luxembourg)†(a) | | 7.50% | | 5/15/2026 | | | 200 | | | | 213,500 | |
| Cablevision SA (Argentina)†(a) | | 6.50% | | 6/15/2021 | | | 150 | | | | 159,705 | |
| Grupo Televisa SAB (Mexico)(a) | | 6.625% | | 1/15/2040 | | | 132 | | | | 163,256 | |
| Myriad International Holdings BV (Netherlands)†(a) | | 4.85% | | 7/6/2027 | | | 200 | | | | 207,883 | |
| Total | | | | | | | | | | | 954,264 | |
| | | | | | | | | | | | | |
| Metals & Minerals: Miscellaneous 4.75% | | | | | | | | | | | | |
| AngloGold Ashanti Holdings plc (Isle of Man)(a) | | 6.50% | | 4/15/2040 | | | 150 | | | | 158,557 | |
| Barminco Finance Pty Ltd. (Australia)†(a) | | 6.625% | | 5/15/2022 | | | 66 | | | | 64,845 | |
| Cia Minera Milpo SAA (Peru)†(a) | | 4.625% | | 3/28/2023 | | | 200 | | | | 206,500 | |
| Corp. Nacional del Cobre de Chile (Chile)†(a) | | 4.50% | | 8/1/2047 | | | 200 | | | | 215,732 | |
| First Quantum Minerals Ltd. (Canada)†(a) | | 7.00% | | 2/15/2021 | | | 220 | | | | 228,800 | |
| First Quantum Minerals Ltd. (Canada)†(a) | | 7.50% | | 4/1/2025 | | | 200 | | | | 217,750 | |
| Fresnillo plc (Mexico)†(a) | | 5.50% | | 11/13/2023 | | | 200 | | | | 219,750 | |
| Hudbay Minerals, Inc. (Canada)†(a) | | 7.625% | | 1/15/2025 | | | 48 | | | | 52,800 | |
| MMC Norilsk Nickel OJSC via MMC Finance DAC (Ireland)†(a) | | 4.10% | | 4/11/2023 | | | 400 | | | | 403,370 | |
| Nexa Resources SA (Brazil)†(a) | | 5.375% | | 5/4/2027 | | | 200 | | | | 212,500 | |
| Southern Copper Corp. (Peru)(a) | | 3.50% | | 11/8/2022 | | | 120 | | | | 123,542 | |
| Southern Copper Corp. (Peru)(a) | | 5.875% | | 4/23/2045 | | | 240 | | | | 290,714 | |
| Vedanta Resources plc (India)†(a) | | 6.125% | | 8/9/2024 | | | 200 | | | | 204,572 | |
| Volcan Cia Minera SAA (Peru)†(a) | | 5.375% | | 2/2/2022 | | | 45 | | | | 47,250 | |
| Total | | | | | | | | | | | 2,646,682 | |
| | See Notes to Financial Statements. | 25 |
Schedule of Investments (continued)
EMERGING MARKETS CORPORATE DEBT FUND December 31, 2017
| Investments | | Interest
Rate | | Maturity
Date | | Principal Amount
(000) | | | Fair
Value | |
| Natural Gas 1.45% | | | | | | | | | | | | |
| China Oil & Gas Group Ltd. (Hong Kong)(a) | | 5.00% | | 5/7/2020 | | $ | 200 | | | $ | 204,000 | |
| Gas Natural de Lima y Callao SA (Peru)†(a) | | 4.375% | | 4/1/2023 | | | 200 | | | | 207,000 | |
| Nakilat, Inc. (Qatar)†(a) | | 6.267% | | 12/31/2033 | | | 164 | | | | 190,938 | |
| Transportadora de Gas del Peru SA (Peru)†(a) | | 4.25% | | 4/30/2028 | | | 200 | | | | 207,800 | |
| Total | | | | | | | | | | | 809,738 | |
| | | | | | | | | | | | | |
| Oil 12.78% | | | | | | | | | | | | |
| CNOOC Finance 2012 Ltd. (Hong Kong)†(a) | | 3.875% | | 5/2/2022 | | | 400 | | | | 412,805 | |
| CNOOC Finance 2015 USA LLC | | 3.50% | | 5/5/2025 | | | 200 | | | | 201,931 | |
| CNPC General Capital Ltd.† | | 3.95% | | 4/19/2022 | | | 200 | | | | 207,714 | |
| Cosan Luxembourg SA (Luxembourg)†(a) | | 7.00% | | 1/20/2027 | | | 200 | | | | 216,000 | |
| Dolphin Energy Ltd. (United Arab Emirates)†(a) | | 5.50% | | 12/15/2021 | | | 200 | | | | 217,465 | |
| Ecopetrol SA (Colombia)(a) | | 4.125% | | 1/16/2025 | | | 305 | | | | 307,288 | |
| Ecopetrol SA (Colombia)(a) | | 5.875% | | 5/28/2045 | | | 100 | | | | 102,450 | |
| Gazprom OAO via Gaz Capital SA (Luxembourg)†(a) | | 4.95% | | 2/6/2028 | | | 800 | | | | 834,708 | |
| Geopark Ltd. (Chile)†(a) | | 6.50% | | 9/21/2024 | | | 200 | | | | 205,646 | |
| Hilcorp Energy I LP/Hilcorp Finance Co.† | | 5.00% | | 12/1/2024 | | | 20 | | | | 19,900 | |
| Lukoil International Finance BV (Netherlands)†(a) | | 4.75% | | 11/2/2026 | | | 200 | | | | 210,247 | |
| MEG Energy Corp. (Canada)†(a) | | 6.375% | | 1/30/2023 | | | 155 | | | | 132,525 | |
| Petroamazonas EP (Ecuador)†(a) | | 4.625% | | 11/6/2020 | | | 200 | | | | 196,500 | |
| Petrobras Global Finance BV (Netherlands)†(a) | | 5.999% | | 1/27/2028 | | | 767 | | | | 769,876 | |
| Petrobras Global Finance BV (Netherlands)(a) | | 7.25% | | 3/17/2044 | | | 340 | | | | 354,450 | |
| Petrobras Global Finance BV (Netherlands)(a) | | 7.375% | | 1/17/2027 | | | 100 | | | | 110,300 | |
| Petroleos del Peru SA (Peru)†(a) | | 5.625% | | 6/19/2047 | | | 200 | | | | 210,500 | |
| Petroleos Mexicanos (Mexico)(a) | | 5.50% | | 6/27/2044 | | | 188 | | | | 173,422 | |
| Petronas Capital Ltd. (Malaysia)†(a) | | 5.25% | | 8/12/2019 | | | 100 | | | | 104,392 | |
| PT Saka Energi Indonesia (Indonesia)†(a) | | 4.45% | | 5/5/2024 | | | 200 | | | | 203,430 | |
| Reliance Industries Ltd. (India)†(a) | | 4.125% | | 1/28/2025 | | | 250 | | | | 259,752 | |
| Sinopec Group Overseas Development 2015 Ltd.† | | 4.10% | | 4/28/2045 | | | 200 | | | | 201,549 | |
| SM Energy Co. | | 6.50% | | 1/1/2023 | | | 40 | | | | 41,000 | |
| Tengizchevroil Finance Co. International Ltd. (Kazakhstan)†(a) | | 4.00% | | 8/15/2026 | | | 200 | | | | 201,150 | |
| Tullow Oil plc (United Kingdom)†(a) | | 6.25% | | 4/15/2022 | | | 200 | | | | 201,760 | |
| Tupras Turkiye Petrol Rafinerileri AS (Turkey)†(a) | | 4.50% | | 10/18/2024 | | | 200 | | | | 198,037 | |
| YPF SA (Argentina)†(a) | | 6.95% | | 7/21/2027 | | | 650 | | | | 691,600 | |
| YPF SA (Argentina)†(a) | | 7.00% | | 12/15/2047 | | | 139 | | | | 138,097 | |
| Total | | | | | | | | | | | 7,124,494 | |
| 26 | See Notes to Financial Statements. | |
Schedule of Investments (continued)
EMERGING MARKETS CORPORATE DEBT FUND December 31, 2017
| Investments | | Interest
Rate | | Maturity
Date | | Principal
Amount
(000) | | | Fair
Value | |
| Oil: Crude Producers 1.05% | | | | | | | | | | | | |
| Abu Dhabi Crude Oil Pipeline LLC | | | | | | | | | | | | |
| (United Arab Emirates)†(a) | | 4.60% | | 11/2/2047 | | $ | 200 | | | $ | 206,254 | |
| GNL Quintero SA (Chile)†(a) | | 4.634% | | 7/31/2029 | | | 200 | | | | 209,000 | |
| Ras Laffan Liquefied Natural Gas Co., Ltd. II (Qatar)†(a) | | 5.298% | | 9/30/2020 | | | 163 | | | | 168,989 | |
| Total | | | | | | | | | | | 584,243 | |
| | | | | | | | | | | | | |
| Paper & Forest Products 1.08% | | | | | | | | | | | | |
| Eldorado Intl. Finance GmbH (Austria)†(a) | | 8.625% | | 6/16/2021 | | | 200 | | | | 207,000 | |
| Fibria Overseas Finance Ltd. (Brazil)(a) | | 4.00% | | 1/14/2025 | | | 200 | | | | 198,375 | |
| Klabin Finance SA (Luxembourg)†(a) | | 4.875% | | 9/19/2027 | | | 200 | | | | 197,900 | |
| Total | | | | | | | | | | | 603,275 | |
| | | | | | | | | | | | | |
| Real Estate Investment Trusts 3.51% | | | | | | | | | | | | |
| China Evergrande Group (China)(a) | | 8.75% | | 6/28/2025 | | | 200 | | | | 207,787 | |
| China Overseas Finance Cayman V Ltd. | | 3.95% | | 11/15/2022 | | | 200 | | | | 206,072 | |
| China Overseas Finance Cayman V Ltd. | | 5.35% | | 11/15/2042 | | | 200 | | | | 231,634 | |
| Country Garden Holdings Co. Ltd. (China)(a) | | 4.75% | | 9/28/2023 | | | 200 | | | | 199,170 | |
| IRSA Propiedades Comerciales SA (Argentina)†(a) | | 8.75% | | 3/23/2023 | | | 100 | | | | 112,798 | |
| Kaisa Group Holdings Ltd. (China)(a) | | 9.375% | | 6/30/2024 | | | 400 | | | | 390,821 | |
| MAF Sukuk Ltd. | | 4.50% | | 11/3/2025 | | | 200 | | | | 207,360 | |
| Pakuwon Prima Pte Ltd. (Singapore)(a) | | 5.00% | | 2/14/2024 | | | 200 | | | | 202,043 | |
| Swire Properties MTN Financing Ltd. (Hong Kong)(a) | | 2.75% | | 3/7/2020 | | | 200 | | | | 199,680 | |
| Total | | | | | | | | | | | 1,957,365 | |
| | | | | | | | | | | | | |
| Retail 1.06% | | | | | | | | | | | | |
| Arcos Dorados Holdings, Inc. (Uruguay)†(a) | | 5.875% | | 4/4/2027 | | | 220 | | | | 233,125 | |
| InRetail Consumer (Peru)†(a) | | 5.25% | | 10/10/2021 | | | 100 | | | | 103,500 | |
| SACI Falabella (Chile)†(a) | | 3.75% | | 10/30/2027 | | | 200 | | | | 196,100 | |
| Yum! Brands, Inc. | | 5.35% | | 11/1/2043 | | | 60 | | | | 58,200 | |
| Total | | | | | | | | | | | 590,925 | |
| | | | | | | | | | | | | |
| Steel 2.51% | | | | | | | | | | | | |
| ABJA Investment Co. Pte Ltd. (Singapore)(a) | | 5.95% | | 7/31/2024 | | | 200 | | | | 211,500 | |
| GTL Trade Finance, Inc./Gerdau Holdings, Inc.† | | 5.893% | | 4/29/2024 | | | 200 | | | | 215,500 | |
| Novolipetsk Steel via Steel Funding DAC (Ireland)†(a) | | 4.00% | | 9/21/2024 | | | 250 | | | | 251,076 | |
| Vale Overseas Ltd. (Brazil)(a) | | 4.375% | | 1/11/2022 | | | 180 | | | | 186,570 | |
| Vale Overseas Ltd. (Brazil)(a) | | 6.25% | | 8/10/2026 | | | 50 | | | | 58,050 | |
| Vale Overseas Ltd. (Brazil)(a) | | 6.875% | | 11/10/2039 | | | 252 | | | | 310,275 | |
| Vale SA (Brazil)(a) | | 5.625% | | 9/11/2042 | | | 150 | | | | 165,000 | |
| Total | | | | | | | | | | | 1,397,971 | |
| | See Notes to Financial Statements. | 27 |
Schedule of Investments (continued)
EMERGING MARKETS CORPORATE DEBT FUND December 31, 2017
| Investments | | Interest
Rate | | Maturity
Date | | Principal
Amount
(000) | | | Fair
Value | |
| Technology 3.03% | | | | | | | | | | | | |
| Alibaba Group Holding Ltd. (China)(a) | | 3.60% | | 11/28/2024 | | $ | 400 | | | $ | 415,222 | |
| Alibaba Group Holding Ltd. (China)(a) | | 4.40% | | 12/6/2057 | | | 250 | | | | 260,907 | |
| Baidu, Inc. (China)(a) | | 3.50% | | 11/28/2022 | | | 200 | | | | 203,082 | |
| JD.com, Inc. (China)(a) | | 3.875% | | 4/29/2026 | | | 400 | | | | 403,034 | |
| Tencent Holdings Ltd. (China)†(a) | | 2.875% | | 2/11/2020 | | | 200 | | | | 201,216 | |
| Tencent Holdings Ltd. (China)†(a) | | 3.80% | | 2/11/2025 | | | 200 | | | | 207,727 | |
| Total | | | | | | | | | | | 1,691,188 | |
| | | | | | | | | | | | | |
| Telecommunications 4.91% | | | | | | | | | | | | |
| Bharti Airtel International Netherlands BV (Netherlands)†(a) | | 5.125% | | 3/11/2023 | | | 200 | | | | 212,338 | |
| Digicel Group Ltd. (Jamaica)†(a) | | 7.125% | | 4/1/2022 | | | 300 | | | | 278,931 | |
| Digicel Ltd. (Jamaica)†(a) | | 6.75% | | 3/1/2023 | | | 200 | | | | 197,382 | |
| Emirates Telecommunications Group Co. PJSC (United Arab Emirates)(a) | | 3.50% | | 6/18/2024 | | | 200 | | | | 205,050 | |
| HKT Capital No 2 Ltd. | | 3.625% | | 4/2/2025 | | | 200 | | | | 201,430 | |
| Mobile Telesystems OJSC via MTS International Funding Ltd. (Ireland)†(a) | | 5.00% | | 5/30/2023 | | | 200 | | | | 208,395 | |
| Ooredoo International Finance Ltd.† | | 3.25% | | 2/21/2023 | | | 400 | | | | 396,496 | |
| Ooredoo International Finance Ltd.† | | 3.875% | | 1/31/2028 | | | 200 | | | | 199,235 | |
| SingTel Group Treasury Pte Ltd. (Singapore)(a) | | 4.50% | | 9/8/2021 | | | 200 | | | | 212,801 | |
| Telefonica Celular del Paraguay SA (Paraguay)†(a) | | 6.75% | | 12/13/2022 | | | 200 | | | | 206,102 | |
| VEON Holdings BV (Netherlands)†(a) | | 5.95% | | 2/13/2023 | | | 200 | | | | 215,500 | |
| WTT Investment Ltd. (Hong Kong)†(a) | | 5.50% | | 11/21/2022 | | | 200 | | | | 203,953 | |
| Total | | | | | | | | | | | 2,737,613 | |
| | | | | | | | | | | | | |
| Transportation: Miscellaneous 1.19% | | | | | | | | | | | | |
| JSL Europe SA (Luxembourg)†(a) | | 7.75% | | 7/26/2024 | | | 200 | | | | 212,250 | |
| Kazakhstan Temir Zholy Finance BV (Netherlands)†(a) | | 6.95% | | 7/10/2042 | | | 200 | | | | 235,027 | |
| Rumo Luxembourg Sarl (Luxembourg)†(a) | | 7.375% | | 2/9/2024 | | | 200 | | | | 215,720 | |
| Total | | | | | | | | | | | 662,997 | |
| | | | | | | | | | | | | |
| Utilities 0.37% | | | | | | | | | | | | |
| Aegea Finance Sarl (Brazil)†(a) | | 5.75% | | 10/10/2024 | | | 200 | | | | 204,000 | |
| Total Corporate Bonds (cost $49,146,709) | | | | | | | | | | | 50,405,939 | |
| | | | | | | | | | | | | |
| FOREIGN GOVERNMENT OBLIGATIONS 3.75% | | | | | | | | | | | | |
| | | | | | | | | | | | | |
| Angola 0.41% | | | | | | | | | | | | |
| Republic of Angola†(a) | | 9.50% | | 11/12/2025 | | | 200 | | | | 231,248 | |
| 28 | See Notes to Financial Statements. | |
Schedule of Investments (continued)
EMERGING MARKETS CORPORATE DEBT FUND December 31, 2017
| Investments | | Interest
Rate | | Maturity
Date | | Principal
Amount
(000) | | | Fair
Value | |
| Argentina 2.01% | | | | | | | | | | | | |
| City of Buenos Aires(b) | 26.875%
(BADLAR + 3.75% | )# | 2/22/2028 | | ARS | 1,700 | | | $ | 90,942 | |
| Provincia de Buenos Aires†(a) | | 6.50% | | 2/15/2023 | | $ | 61 | | | | 65,685 | |
| Provincia de la Rioja†(a) | | 9.75% | | 2/24/2025 | | | 150 | | | | 166,671 | |
| Provincia of Neuquen†(a) | | 7.50% | | 4/27/2025 | | | 88 | | | | 94,380 | |
| Provincia of Neuquen†(a) | | 8.625% | | 5/12/2028 | | | 150 | | | | 168,686 | |
| Republic of Argentina GDP Linked Note(a) | | Zero Coupon | | 12/15/2035 | | | 2,070 | | | | 218,902 | |
| Republic of Argentina(a) | | 6.875% | | 1/26/2027 | | | 146 | | | | 159,724 | |
| Republic of Argentina(b) | | 7.82% | | 12/31/2033 | | EUR | 110 | | | | 154,743 | |
| Total | | | | | | | | | | | 1,119,733 | |
| | | | | | | | | | | | | |
| Bahamas 0.47% | | | | | | | | | | | | |
| Commonwealth of Bahamas†(a) | | 6.00% | | 11/21/2028 | | $ | 250 | | | | 261,250 | |
| | | | | | | | | | | | | |
| Indonesia 0.36% | | | | | | | | | | | | |
| Republic of Indonesia(a) | | 4.35% | | 1/11/2048 | | | 200 | | | | 203,406 | |
| | | | | | | | | | | | | |
| Nigeria 0.39% | | | | | | | | | | | | |
| Republic of Nigeria†(a) | | 7.625% | | 11/28/2047 | | | 200 | | | | 215,147 | |
| | | | | | | | | | | | | |
| Uruguay 0.11% | | | | | | | | | | | | |
| Republic of Uruguay†(b) | | 8.50% | | 3/15/2028 | | UYU | 1,740 | | | | 60,773 | |
| Total Foreign Government Obligations (cost $2,003,622) | | | | | | | | | | | 2,091,557 | |
| Total Long-Term Investments (cost $51,207,592) | | | | | | | | | | | 52,556,257 | |
| | | | | | | | | | | | | |
| SHORT-TERM INVESTMENT 5.06% | | | | | | | | | | | | |
| | | | | | | | | | | | | |
| Repurchase Agreement | | | | | | | | | | | | |
Repurchase Agreement dated 12/29/2017, 0.54% due 1/2/2018 with Fixed Income Clearing Corp. collateralized by $2,785,000 of U.S. Treasury Inflation Indexed Note at 0.125% due 4/15/2021; value: $2,881,770; proceeds: $2,821,667
(cost $2,821,498) | | | | | | $ | 2,821 | | | | 2,821,498 | |
| Total Investments in Securities 99.34% (cost $54,029,090) | | | | | | | | | | | 55,377,755 | |
| Cash and Other Assets in Excess of Liabilities(e) 0.66% | | | | | | | | | | | 370,500 | |
| Net Assets 100.00% | | | | | | | | | | $ | 55,748,255 | |
| | See Notes to Financial Statements. | 29 |
Schedule of Investments (continued)
EMERGING MARKETS CORPORATE DEBT FUND December 31, 2017
| ARS | | Argentine Peso |
| EUR | | euro |
| PEN | | Peruvian nuevo sol |
| UYU | | Uruguayan Peso |
| † | | Security was purchased pursuant to Rule 144A under the Securities Act of 1933 and, unless registered under such Act or exempted from registration, may only be resold to qualified institutional buyers. |
| # | | Variable rate security. The interest rate represents the rate in effect at December 31, 2017. |
| (a) | | Foreign security traded in U.S. dollars. |
| (b) | | Investment in non-U.S. dollar denominated securities. |
| (c) | | Security is perpetual in nature and has no stated maturity. |
| (d) | | Level 3 Investment as described in Note 2(q) in the Notes to Financials. Security valued utilizing third party pricing information without adjustment. Such valuations are based on unobservable inputs. A significant change in third party information could result in a significantly lower or higher value of such Level 3 investments. |
| (e) | | Cash and Other Assets in Excess of Liabilities include net unrealized appreciation/depreciation on forward foreign currency exchange contracts and futures contracts as follows: |
Open Forward Foreign Currency Exchange Contracts at December 31, 2017:
Forward
Foreign
Currency
Exchange
Contracts | | Transaction
Type | | Counterparty | | Expiration
Date | | Foreign
Currency | | U.S. $
Cost on
Origination
Date | | | U.S. $
Current
Value | | | Unrealized
Depreciation | |
| euro | | Sell | | State Street Bank and Trust | | 12/20/2018 | | 130,000 | | | $157,192 | | | | $159,738 | | | | $(2,546 | ) |
Open Futures Contracts at December 31, 2017:
| Type | | Expiration | | Contracts | | Position | | Notional
Amount | | | Notional
Value | | | Unrealized
Appreciation | |
| Euro-Bobl Medium Term (Germany) | | March 2018 | | 3 | | Short | | EUR | (395,425 | ) | | EUR | (394,830 | ) | | | $ | 714 | |
| U.S. 10-Year Treasury Note | | March 2018 | | 13 | | Short | | $ | (1,617,586 | ) | | $ | (1,612,609 | ) | | | | 4,977 | |
| U.S. Long Bond | | March 2018 | | 9 | | Short | | | (1,380,359 | ) | | | (1,377,000 | ) | | | | 3,359 | |
| U.S. Ultra Treasury Bond | | March 2018 | | 25 | | Short | | | (3,350,832 | ) | | | (3,339,063 | ) | | | | 11,769 | |
| Unrealized Appreciation on Futures Contracts | | | | | | | | | | | | | | | $ | 20,819 | |
| | | | | | | | | | | | | | | | |
| Type | | Expiration | | Contracts | | Position | | Notional
Amount | | | Notional
Value | | | Unrealized
Depreciation | |
| U.S. 2-Year Treasury Note | | March 2018 | | 17 | | Long | | $ | 3,645,200 | | | $ | 3,639,860 | | | | $ | (5,340 | ) |
| U.S. 5-Year Treasury Note | | March 2018 | | 37 | | Long | | | 4,315,378 | | | | 4,298,070 | | | | | (17,307 | ) |
| Ultra Long U.S. Treasury Bond | | March 2018 | | 4 | | Short | | | (667,509 | ) | | | (670,625 | ) | | | | (3,117 | ) |
| Unrealized Depreciation on Futures Contracts | | | | | | | | | | | | | | | $ | (25,764 | ) |
| 30 | See Notes to Financial Statements. | |
Schedule of Investments (concluded)
EMERGING MARKETS CORPORATE DEBT FUND December 31, 2017
The following is a summary of the inputs used as of December 31, 2017 in valuing the Fund’s investments carried at fair value(1):
| Investment Type(2)(3) | | Level 1 | | | Level 2 | | | Level 3 | | | Total | |
| Common Stock | | $ | 58,761 | | | $ | – | | | $ | – | | | $ | 58,761 | |
| Corporate Bonds | | | | | | | | | | | | | | | | |
| Coal | | | – | | | | – | | | | 252,122 | | | | 252,122 | |
| Remaining Industries | | | – | | | | 50,153,817 | | | | – | | | | 50,153,817 | |
| Foreign Government Obligations | | | – | | | | 2,091,557 | | | | – | | | | 2,091,557 | |
| Repurchase Agreement | | | – | | | | 2,821,498 | | | | – | | | | 2,821,498 | |
| Total | | $ | 58,761 | | | $ | 55,066,872 | | | $ | 252,122 | | | $ | 55,377,755 | |
| Other Financial Instruments | | | | | | | | | | | | | | | | |
| Forward Foreign Currency Exchange Contracts | | | | | | | | | | | | | | | | |
| Assets | | $ | – | | | $ | – | | | $ | – | | | $ | – | |
| Liabilities | | | – | | | | (2,546 | ) | | | – | | | | (2,546 | ) |
| Futures Contracts | | | | | | | | | | | | | | | | |
| Assets | | | 20,819 | | | | – | | | | – | | | | 20,819 | |
| Liabilities | | | (25,764 | ) | | | – | | | | – | | | | (25,764 | ) |
| Total | | $ | (4,945 | ) | | $ | (2,546 | ) | | $ | – | | | $ | (7,491 | ) |
| | (1) | Refer to Note 2(q) for a description of fair value measurements and the three-tier hierarchy of inputs. |
| | (2) | See Schedule of Investments for fair values in each industry and identification of foreign issuers and/or geography. The table above is presented by Investment Type. Industries are presented within an Investment Type should such Investment Type include securities classified as two or more levels within the three-tier fair value hierarchy. Each Level 3 security is identified on the Schedule of Investment along with the valuation technique utilized. |
| | (3) | There were no Level 1/Level 2 transfers during the fiscal year ended December 31, 2017. |
The following is a reconciliation of investments with unobservable inputs (Level 3) that were used in determining fair value:
| | Corporate Bonds | |
| Balance as of January 1, 2017 | | | $ | – | |
| Accrued Discounts (Premiums) | | | | (22 | ) |
| Realized Gain (Loss) | | | | – | |
| Change in Unrealized Appreciation (Depreciation) | | | | (11,712 | ) |
| Purchases | | | | 263,856 | |
| Sales | | | | – | |
| Transfers into Level 3 | | | | – | |
| Transfers out of Level 3 | | | | – | |
| Balance as of December 31, 2017 | | | $ | 252,122 | |
| Change in unrealized appreciation/depreciation for the year ended December 31, 2017 related to Level 3 investments held at December 31, 2017 | | | $ | (11,712 | ) |
| | See Notes to Financial Statements. | 31 |
Schedule of Investments
EMERGING MARKETS CURRENCY FUND December 31, 2017
| Investments | | Interest
Rate | | Maturity
Date | | Principal
Amount
(000) | | | Fair
Value | |
| LONG-TERM INVESTMENTS 85.92% | | | | | | | | | | | | |
| | | | | | | | | | | | | |
| ASSET-BACKED SECURITIES 15.94% | | | | | | | | | | | | |
| | | | | | | | | | | | | |
| Automobiles 7.41% | | | | | | | | | | | | |
| AmeriCredit Automobile Receivables Trust 2016-2 A2A | | 1.42% | | 10/8/2019 | | $ | 31 | | | $ | 30,860 | |
| AmeriCredit Automobile Receivables Trust 2016-4 A2A | | 1.34% | | 4/8/2020 | | | 182 | | | | 181,516 | |
| Avis Budget Rental Car Funding AESOP LLC 2013-2A† | | 2.97% | | 2/20/2020 | | | 407 | | | | 409,791 | |
| Avis Budget Rental Car Funding AESOP LLC 2014-1A† | | 2.46% | | 7/20/2020 | | | 1,762 | | | | 1,765,031 | |
| Avis Budget Rental Car Funding AESOP LLC 2015-2A† | | 2.63% | | 12/20/2021 | | | 359 | | | | 358,530 | |
| California Republic Auto Receivables Trust 2016-1 A3 | | 1.89% | | 5/15/2020 | | | 338 | | | | 337,724 | |
| California Republic Auto Receivables Trust 2016-2 A4 | | 1.83% | | 12/15/2021 | | | 280 | | | | 278,066 | |
| Capital Auto Receivables Asset Trust 2014-3 D | | 3.14% | | 2/20/2020 | | | 444 | | | | 447,009 | |
| Capital Auto Receivables Asset Trust 2016-1 B | | 2.67% | | 12/21/2020 | | | 224 | | | | 225,168 | |
| CarMax Auto Owner Trust 2014-3 C | | 2.29% | | 6/15/2020 | | | 185 | | | | 185,317 | |
| CarMax Auto Owner Trust 2014-4 C | | 2.44% | | 11/16/2020 | | | 898 | | | | 900,363 | |
| CarMax Auto Owner Trust 2016-4 A2 | | 1.21% | | 11/15/2019 | | | 170 | | | | 170,152 | |
| CarMax Auto Owner Trust 2016-4 A4 | | 1.60% | | 6/15/2022 | | | 214 | | | | 210,063 | |
| Chrysler Capital Auto Receivables Trust 2014-BA A4† | | 1.76% | | 12/16/2019 | | | 41 | | | | 41,144 | |
| Chrysler Capital Auto Receivables Trust 2014-BA D† | | 3.44% | | 8/16/2021 | | | 362 | | | | 364,528 | |
| Chrysler Capital Auto Receivables Trust 2016-AA A3† | | 1.77% | | 10/15/2020 | | | 680 | | | | 679,152 | |
| Chrysler Capital Auto Receivables Trust 2016-AA B† | | 2.88% | | 2/15/2022 | | | 222 | | | | 224,024 | |
| Chrysler Capital Auto Receivables Trust 2016-AA C† | | 3.25% | | 6/15/2022 | | | 132 | | | | 133,305 | |
| CPS Auto Receivables Trust 2016-B D† | | 6.58% | | 3/15/2022 | | | 190 | | | | 201,721 | |
| CPS Auto Trust 2017-D A† | | 1.87% | | 3/15/2021 | | | 507 | | | | 506,068 | |
| Drive Auto Receivables Trust 2015-DA C† | | 3.38% | | 11/15/2021 | | | 386 | | | | 388,835 | |
| Drive Auto Receivables Trust 2016-CA B† | | 2.37% | | 11/16/2020 | | | 300 | | | | 300,428 | |
| Drive Auto Receivables Trust 2016-CA C† | | 3.02% | | 11/15/2021 | | | 800 | | | | 806,232 | |
| Drive Auto Receivables Trust 2016-CA D† | | 4.18% | | 3/15/2024 | | | 1,093 | | | | 1,122,899 | |
| Drive Auto Receivables Trust 2017-BA C† | | 2.61% | | 8/16/2021 | | | 1,745 | | | | 1,749,300 | |
| First Investors Auto Owner Trust 2016-2A A1† | | 1.53% | | 11/16/2020 | | | 211 | | | | 210,987 | |
| Ford Credit Auto Owner Trust 2016-C A2A | | 1.04% | | 9/15/2019 | | | 347 | | | | 346,068 | |
| Honda Auto Receivables Owner Trust 2016-4 A2 | | 1.04% | | 4/18/2019 | | | 315 | | | | 314,649 | |
| Hyundai Floorplan Master Owner Trust 2016-1A A1† | | 2.377%
(1 Mo. LIBOR + .90% | )# | 3/15/2021 | | | 197 | | | | 198,668 | |
| 32 | See Notes to Financial Statements. |
Schedule of Investments (continued)
EMERGING MARKETS CURRENCY FUND December 31, 2017
| Investments | | Interest
Rate | | Maturity
Date | | Principal
Amount
(000) | | | Fair
Value | |
| Automobiles (continued) | | | | | | | | | | | | |
| Hyundai Floorplan Master Owner Trust 2016-1A A2† | | 1.81% | | 3/15/2021 | | $ | 229 | | | $ | 228,356 | |
| OSCAR US Funding Trust V 2016-2A A2A† | | 2.31% | | 11/15/2019 | | | 531 | | | | 531,028 | |
| Santander Drive Auto Receivables Trust 2014-3 C | | 2.13% | | 8/17/2020 | | | 201 | | | | 200,966 | |
| Santander Drive Auto Receivables Trust 2015-1 C | | 2.57% | | 4/15/2021 | | | 138 | | | | 138,728 | |
| Santander Drive Auto Receivables Trust 2015-3 B | | 2.07% | | 4/15/2020 | | | 112 | | | | 112,074 | |
| Santander Drive Auto Receivables Trust 2015-3 C | | 2.74% | | 1/15/2021 | | | 537 | | | | 539,607 | |
| Santander Drive Auto Receivables Trust 2015-5 D | | 3.65% | | 12/15/2021 | | | 345 | | | | 350,362 | |
| Santander Drive Auto Receivables Trust 2016-1 D | | 4.02% | | 4/15/2022 | | | 213 | | | | 218,474 | |
| Santander Drive Auto Receivables Trust 2016-3 A2 | | 1.34% | | 11/15/2019 | | | 79 | | | | 78,768 | |
| Santander Drive Auto Receivables Trust 2016-3 B | | 1.89% | | 6/15/2021 | | | 260 | | | | 259,498 | |
| TCF Auto Receivables Owner Trust 2016-1A A2† | | 1.39% | | 11/15/2019 | | | 186 | | | | 186,364 | |
| Toyota Auto Receivables Owner Trust 2016-A A3 | | 1.25% | | 3/16/2020 | | | 167 | | | | 166,132 | |
| Westlake Automobile Receivables Trust 2016-3A B† | | 2.07% | | 12/15/2021 | | | 113 | | | | 112,666 | |
| Total | | | | | | | | | | | 16,210,621 | |
| | | | | | | | | | | | | |
| Credit Cards 1.50% | | | | | | | | | | | | |
| Capital One Multi-Asset Execution Trust 2015-A3 | | 1.877%
(1 Mo. LIBOR + .40% | )# | 3/15/2023 | | | 1,928 | | | | 1,938,986 | |
| Capital One Multi-Asset Execution Trust 2015-A5 | | 1.60% | | 5/17/2021 | | | 100 | | | | 99,408 | |
| Discover Card Execution Note Trust 2016-A2 | | 2.017%
(1 Mo. LIBOR + .54% | )# | 9/15/2021 | | | 564 | | | | 567,083 | |
| MBNA Credit Card Master Note Trust 2004-A3 | | 1.737%
(1 Mo. LIBOR + .26% | )# | 8/16/2021 | | | 675 | | | | 675,628 | |
| Total | | | | | | | | | | | 3,281,105 | |
| | | | | | | | | | | | | |
| Other 7.03% | | | | | | | | | | | | |
| Ammc CLO 19 Ltd. 2016-19A A† | | 2.859%
(3 Mo. LIBOR + 1.50% | )# | 10/15/2028 | | | 750 | | | | 757,484 | |
| Apidos CLO X 2012-10A A† | | 2.798%
(3 Mo. LIBOR + 1.42% | )# | 10/30/2022 | | | 328 | | | | 328,953 | |
| Ascentium Equipment Receivables Trust 2016-2A A2† | | 1.46% | | 4/10/2019 | | | 131 | | | | 130,657 | |
| Ascentium Equipment Receivables Trust 2016-2A A3† | | 1.65% | | 5/10/2022 | | | 271 | | | | 268,914 | |
| Ascentium Equipment Receivables Trust 2016-2A B† | | 2.50% | | 9/12/2022 | | | 175 | | | | 174,249 | |
| Avery Point V CLO Ltd. 2014-5A BR† | | 2.853%
(3 Mo. LIBOR + 1.50% | )# | 7/17/2026 | | | 250 | | | | 251,223 | |
| Birchwood Park CLO Ltd. 2014-1A AR† | | 2.539%
(3 Mo. LIBOR + 1.18% | )# | 7/15/2026 | | | 1,000 | | | | 1,001,612 | |
| BlueMountain CLO Ltd. 2014-4A A1R† | | 2.818%
(3 Mo. LIBOR + 1.35% | )# | 11/30/2026 | | | 1,000 | | | | 1,004,149 | |
| | See Notes to Financial Statements. | 33 |
Schedule of Investments (continued)
EMERGING MARKETS CURRENCY FUND December 31, 2017
| Investments | | Interest
Rate | | Maturity
Date | | Principal
Amount (000) | | | Fair
Value | |
| Other (continued) | | | | | | | | | | | | |
| Cent CLO Ltd. 2013-17A A1† | | 2.678% | | | | | | | | | | |
| | (3 Mo. LIBOR + 1.30% | )# | 1/30/2025 | | $ | 1,059 | | | $ | 1,060,284 | |
| Cent CLO Ltd. 2013-19A A1A† | | 2.708% | | | | | | | | | | |
| | (3 Mo. LIBOR + 1.33% | )# | 10/29/2025 | | | 900 | | | | 901,461 | |
| CIFC Funding V Ltd. 2014-5A A1R† | | 2.753% | | | | | | | | | | |
| | (3 Mo. LIBOR + 1.40% | )# | 1/17/2027 | | | 1,000 | | | | 1,005,519 | |
| CNH Equipment Trust 2014-C A3 | | 1.05% | | 11/15/2019 | | | 47 | | | | 47,312 | |
| CNH Equipment Trust 2015-C A3 | | 1.66% | | 11/16/2020 | | | 177 | | | | 176,991 | |
| Dell Equipment Finance Trust 2015-2 A3† | | 1.72% | | 9/22/2020 | | | 40 | | | | 40,351 | |
| Diamond Resorts Owner Trust 2015-2 A† | | 2.99% | | 5/22/2028 | | | 146 | | | | 145,575 | |
| Diamond Resorts Owner Trust 2016-1 A† | | 3.08% | | 11/20/2028 | | | 111 | | | | 111,645 | |
| DRB Prime Student Loan Trust 2015-D A2† | | 3.20% | | 1/25/2040 | | | 772 | | | | 778,382 | |
| Engs Commercial Finance Trust 2016-1A A2† | | 2.63% | | 2/22/2022 | | | 377 | | | | 375,493 | |
| Ford Credit Floorplan Master Owner Trust 2015-4 A1 | | 1.77% | | 8/15/2020 | | | 256 | | | | 255,873 | |
| H/2 Asset Funding 2014-1 Ltd. | | 2.348% | | 3/19/2037 | | | 2,000 | | | | 2,008,544 | (a) |
| Mountain Hawk II CLO Ltd. 2013-2A A1† | | 2.523%
(3 Mo. LIBOR + 1.16% | )# | 7/22/2024 | | | 1,494 | | | | 1,496,868 | |
| OneMain Financial Issuance Trust 2015-1A A† | | 3.19% | | 3/18/2026 | | | 188 | | | | 189,195 | |
| OneMain Financial Issuance Trust 2016-1A A† | | 3.66% | | 2/20/2029 | | | 305 | | | | 310,025 | |
| SLM Private Education Loan Trust 2010-A 2A† | | 4.727%
(1 Mo. LIBOR + 3.25% | )# | 5/16/2044 | | | 621 | | | | 639,320 | |
| SLM Student Loan Trust 2011-1 A1 | | 1.848%
(1 Mo. LIBOR + .52% | )# | 3/25/2026 | | | 263 | | | | 263,788 | |
| SoFi Professional Loan Program 2017-D A1FX† | | 1.72% | | 9/25/2040 | | | 85 | | | | 84,500 | |
| SoFi Professional Loan Program LLC 2017-C A2A† | | 1.75% | | 7/25/2040 | | | 670 | | | | 666,972 | |
| West CLO Ltd. 2014-2A A1AR† | | 2.231%
(3 Mo. LIBOR + 0.87% | )# | 1/16/2027 | | | 755 | | | | 755,350 | |
| Westgate Resorts LLC 2015-1A A† | | 2.75% | | 5/20/2027 | | | 70 | | | | 69,485 | |
| Westgate Resorts LLC 2015-1A B† | | 3.50% | | 5/20/2027 | | | 70 | | | | 69,470 | |
| Total | | | | | | | | | | | 15,369,644 | |
| Total Asset-Backed Securities (cost $34,813,580) | | | | | | | | | | | 34,861,370 | |
| | | | | | | | | | | | | |
| CORPORATE BONDS 37.79% | | | | | | | | | | | | |
| | | | | | | | | | | | | |
| Aerospace/Defense 0.23% | | | | | | | | | | | | |
| Harris Corp. | | 1.999% | | 4/27/2018 | | | 500 | | | | 499,516 | |
| | | | | | | | | | | | | |
| Auto Loans 1.37% | | | | | | | | | | | | |
| General Motors Financial Co., Inc. | | 2.289%
(3 Mo. LIBOR + .93% | )# | 4/13/2020 | | | 1,004 | | | | 1,014,379 | |
| 34 | See Notes to Financial Statements. |
Schedule of Investments (continued)
EMERGING MARKETS CURRENCY FUND December 31, 2017
| Investments | | Interest
Rate | | Maturity
Date | | Principal
Amount
(000) | | | Fair
Value | |
| Auto Loans (continued) | | | | | | | | | | | | |
| Hyundai Capital America† | | 1.75% | | 9/27/2019 | | $ | 500 | | | $ | 490,673 | |
| Hyundai Capital America† | | 2.40% | | 10/30/2018 | | | 500 | | | | 499,615 | |
| Nissan Motor Acceptance Corp.† | | 2.076%
(3 Mo. LIBOR + .39% | )# | 9/28/2020 | | | 1,000 | | | | 1,001,996 | |
| Total | | | | | | | | | | | 3,006,663 | |
| | | | | | | | | | | | | |
| Automakers 1.60% | | | | | | | | | | | | |
| Daimler Finance North America LLC† | | 1.641%
(3 Mo. LIBOR + .25% | )# | 11/5/2018 | | | 1,000 | | | | 1,000,083 | |
| Daimler Finance North America LLC† | | 1.75% | | 10/30/2019 | | | 1,000 | | | | 988,094 | |
| General Motors Co. | | 3.50% | | 10/2/2018 | | | 1,500 | | | | 1,515,875 | |
| Total | | | | | | | | | | | 3,504,052 | |
| | | | | | | | | | | | | |
| Banking 6.49% | | | | | | | | | | | | |
| Associated Banc-Corp. | | 2.75% | | 11/15/2019 | | | 500 | | | | 501,860 | |
| Associates Corp. of North America | | 6.95% | | 11/1/2018 | | | 1,031 | | | | 1,070,243 | |
| Bank of America Corp. | 2.369% (3 Mo. LIBOR + .66% | )# | 7/21/2021 | | | 1,000 | | | | 998,550 | |
| Bank of America Corp. | | 2.60% | | 1/15/2019 | | | 145 | | | | 145,509 | |
| Citibank NA | 1.633% (3 Mo. LIBOR + .23% | )# | 11/9/2018 | | | 1,000 | | | | 1,000,454 | |
| Citigroup, Inc. | | 1.70% | | 4/27/2018 | | | 1,000 | | | | 999,081 | |
| Citigroup, Inc. | | 2.375%
(3 Mo. LIBOR + .86% | )# | 12/7/2018 | | | 1,000 | | | | 1,004,473 | |
| Compass Bank | | 2.75% | | 9/29/2019 | | | 90 | | | | 90,276 | |
| Credit Suisse AG | | 1.70% | | 4/27/2018 | | | 500 | | | | 499,651 | |
| Fifth Third Bancorp | | 4.50% | | 6/1/2018 | | | 250 | | | | 252,461 | |
| Intesa Sanpaolo SpA (Italy)(c) | | 3.875% | | 1/16/2018 | | | 1,000 | | | | 1,000,678 | |
| JPMorgan Chase & Co. | | 2.008%
(3 Mo. LIBOR + .63% | )# | 1/28/2019 | | | 1,000 | | | | 1,004,806 | |
| Morgan Stanley | | 7.30% | | 5/13/2019 | | | 1,000 | | | | 1,066,369 | |
| National Australia Bank Ltd. (Australia)†(c) | | 1.956% | | | | | | | | | | |
| | | (3 Mo. LIBOR + .51% | )# | 5/22/2020 | | | 500 | | | | 502,301 | |
| PNC Bank NA | | 1.796%
(3 Mo. LIBOR + .36% | )# | 5/19/2020 | | | 1,000 | | | | 1,003,646 | |
| Regions Bank | | 2.25% | | 9/14/2018 | | | 655 | | | | 655,811 | |
| Regions Bank | | 7.50% | | 5/15/2018 | | | 500 | | | | 510,058 | |
| Santander UK plc (United Kingdom)(c) | | 2.00% | | 8/24/2018 | | | 250 | | | | 250,088 | |
| Santander UK plc (United Kingdom)(c) | | 3.054%
(3 Mo. LIBOR + 1.48% | )# | 3/14/2019 | | | 623 | | | | 632,378 | |
| UBS AG (United Kingdom)†(c) | | 1.835%
(3 Mo. LIBOR + .32% | )# | 12/7/2018 | | | 1,000 | | | | 1,001,239 | |
| Total | | | | | | | | | | | 14,189,932 | |
| | | | | | | | | | | | | |
| Brokerage 0.24% | | | | | | | | | | | | |
| Lazard Group LLC | | 4.25% | | 11/14/2020 | | | 500 | | | | 521,102 | |
| | See Notes to Financial Statements. | 35 |
Schedule of Investments (continued)
EMERGING MARKETS CURRENCY FUND December 31, 2017
| Investments | | Interest
Rate | | Maturity
Date | | Principal
Amount
(000) | | | Fair
Value | |
| Building Materials 0.27% | | | | | | | | | | |
| Martin Marietta Materials, Inc. | | 2.096%
(3 Mo. LIBOR + .65% | )# | 5/22/2020 | | $ | 333 | | | $ | 334,888 | |
| Martin Marietta Materials, Inc. | | 6.60% | | 4/15/2018 | | | 250 | | | | 253,248 | |
| Total | | | | | | | | | | | 588,136 | |
| | | | | | | | | | | | | |
| Cable & Satellite Television 0.24% | | | | | | | | | | | | |
| Sky plc (United Kingdom)†(c) | | 9.50% | | 11/15/2018 | | | 500 | | | | 531,103 | |
| | | | | | | | | | | | | |
| Chemicals 0.48% | | | | | | | | | | | | |
| Westlake Chemical Corp. | | 4.875% | | 5/15/2023 | | | 500 | | | | 517,500 | |
| Yara International ASA (Norway)†(c) | | 7.875% | | 6/11/2019 | | | 500 | | | | 536,715 | |
| Total | | | | | | | | | | | 1,054,215 | |
| | | | | | | | | | | | | |
| Consumer/Commercial/Lease Financing 0.79% | | | | | | | | | | | | |
| Discover Bank | | 2.60% | | 11/13/2018 | | | 1,469 | | | | 1,474,259 | |
| International Lease Finance Corp. | | 5.875% | | 4/1/2019 | | | 250 | | | | 260,258 | |
| Total | | | | | | | | | | | 1,734,517 | |
| | | | | | | | | | | | | |
| Diversified Capital Goods 0.38% | | | | | | | | | | | | |
| Pentair Finance Sarl (Luxembourg)(c) | | 2.90% | | 9/15/2018 | | | 831 | | | | 834,410 | |
| | | | | | | | | | | | | |
| Electric: Distribution/Transportation 0.58% | | | | | | | | | | | | |
| Oklahoma Gas & Electric Co. | | 8.25% | | 1/15/2019 | | | 250 | | | | 264,928 | |
| Oncor Electric Delivery Co. LLC | | 6.80% | | 9/1/2018 | | | 500 | | | | 515,070 | |
| State Grid Overseas Investment 2016 Ltd.† | | 2.125% | | 5/18/2021 | | | 500 | | | | 489,166 | |
| Total | | | | | | | | | | | 1,269,164 | |
| | | | | | | | | | | | | |
| Electric: Integrated 1.85% | | | | | | | | | | | | |
| E. ON International Finance BV (Netherlands)†(c) | | 5.80% | | 4/30/2018 | | | 250 | | | | 253,031 | |
| Origin Energy Finance Ltd. (Australia)†(c) | | 3.50% | | 10/9/2018 | | | 500 | | | | 503,070 | |
| Pacific Gas & Electric Co.† | | 1.707%
(3 Mo. LIBOR + .23% | )# | 11/28/2018 | | | 1,000 | | | | 999,533 | |
| Public Service Co. of New Mexico | | 7.95% | | 5/15/2018 | | | 500 | | | | 510,457 | |
| SCANA Corp. | | 4.125% | | 2/1/2022 | | | 2 | | | | 2,044 | |
| South Carolina Electric & Gas Co. | | 5.25% | | 11/1/2018 | | | 750 | | | | 770,039 | |
| TECO Finance, Inc. | | 1.95%
(3 Mo. LIBOR + .60% | )# | 4/10/2018 | | | 1,000 | | | | 1,000,843 | |
| Total | | | | | | | | | | | 4,039,017 | |
| | | | | | | | | | | | | |
| Electronics 0.80% | | | | | | | | | | | | |
| Arrow Electronics, Inc. | | 3.00% | | 3/1/2018 | | | 250 | | | | 250,325 | |
| QUALCOMM, Inc. | | 1.706%
(3 Mo. LIBOR + .27% | )# | 5/18/2018 | | | 500 | | | | 500,250 | |
| QUALCOMM, Inc. | | 1.796%
(3 Mo. LIBOR + .36% | )# | 5/20/2019 | | | 1,000 | | | | 1,001,571 | |
| Total | | | | | | | | | | | 1,752,146 | |
| 36 | See Notes to Financial Statements. |
Schedule of Investments (continued)
EMERGING MARKETS CURRENCY FUND December 31, 2017
| Investments | | Interest
Rate | | Maturity
Date | | Principal
Amount
(000) | | | Fair
Value | |
| Energy: Exploration & Production 3.54% | | | | | | | | | | | | |
| Anadarko Petroleum Corp. | | 4.85% | | 3/15/2021 | | $ | 250 | | | $ | 264,177 | |
| Anadarko Petroleum Corp. | | 6.95% | | 6/15/2019 | | | 1,139 | | | | 1,209,598 | |
| Anadarko Petroleum Corp. | | 8.70% | | 3/15/2019 | | | 1,000 | | | | 1,072,410 | |
| Apache Corp. | | 6.90% | | 9/15/2018 | | | 1,295 | | | | 1,336,118 | |
| Canadian Natural Resources Ltd. (Canada)(c) | | 1.75% | | 1/15/2018 | | | 500 | | | | 499,915 | |
| Canadian Natural Resources Ltd. (Canada)(c) | | 3.45% | | 11/15/2021 | | | 450 | | | | 460,624 | |
| Noble Energy, Inc. | | 5.625% | | 5/1/2021 | | | 500 | | | | 513,980 | |
| Pioneer Natural Resources Co. | | 6.875% | | 5/1/2018 | | | 500 | | | | 507,733 | |
| Pioneer Natural Resources Co. | | 7.50% | | 1/15/2020 | | | 250 | | | | 274,321 | |
| Ras Laffan Liquefied Natural Gas Co., Ltd. III (Qatar)†(c) | | 6.75% | | 9/30/2019 | | | 1,500 | | | | 1,607,660 | |
| Total | | | | | | | | | | | 7,746,536 | |
| | | | | | | | | | | | | |
| Forestry/Paper 0.12% | | | | | | | | | | | | |
| WestRock RKT Co. | | 4.45% | | 3/1/2019 | | | 250 | | | | 255,621 | |
| | | | | | | | | | | | | |
| Gas Distribution 4.72% | | | | | | | | | | | | |
| Andeavor Logistics LP/Tesoro Logistics Finance Corp. | | 6.375% | | 5/1/2024 | | | 1,000 | | | | 1,086,250 | |
| Buckeye Partners LP | | 2.65% | | 11/15/2018 | | | 500 | | | | 501,539 | |
| Buckeye Partners LP | | 6.05% | | 1/15/2018 | | | 500 | | | | 500,617 | |
| Columbia Pipeline Group, Inc. | | 2.45% | | 6/1/2018 | | | 250 | | | | 250,173 | |
| Enbridge Energy Partners LP | | 6.50% | | 4/15/2018 | | | 500 | | | | 506,661 | |
| Enterprise Products Operating LLC | | 6.50% | | 1/31/2019 | | | 200 | | | | 209,035 | |
| Florida Gas Transmission Co. LLC† | | 7.90% | | 5/15/2019 | | | 500 | | | | 535,517 | |
| Kinder Morgan Energy Partners LP | | 6.85% | | 2/15/2020 | | | 500 | | | | 541,837 | |
| Kinder Morgan, Inc. | | 7.25% | | 6/1/2018 | | | 250 | | | | 255,292 | |
| MPLX LP | | 5.50% | | 2/15/2023 | | | 127 | | | | 130,852 | |
| Northwest Pipeline LLC | | 6.05% | | 6/15/2018 | | | 500 | | | | 508,870 | |
| Panhandle Eastern Pipe Line Co. LP | | 7.00% | | 6/15/2018 | | | 500 | | | | 511,121 | |
| Sabine Pass Liquefaction LLC | | 5.625% | | 2/1/2021 | | | 1,015 | | | | 1,088,765 | |
| Sempra Energy | | 6.15% | | 6/15/2018 | | | 1,000 | | | | 1,018,684 | |
| Sempra Energy | | 9.80% | | 2/15/2019 | | | 300 | | | | 324,977 | |
| Spectra Energy Partners LP | | 2.195%
(3 Mo. LIBOR + .70% | )# | 6/5/2020 | | | 1,000 | | | | 1,007,842 | |
| Transcontinental Gas Pipe Line Co. LLC | | 6.05% | | 6/15/2018 | | | 344 | | | | 349,587 | |
| Western Gas Partners LP | | 2.60% | | 8/15/2018 | | | 1,000 | | | | 1,001,831 | |
| Total | | | | | | | | | | | 10,329,450 | |
| | See Notes to Financial Statements. | 37 |
Schedule of Investments (continued)
EMERGING MARKETS CURRENCY FUND December 31, 2017
| Investments | | Interest
Rate | | Maturity
Date | | Principal
Amount
(000) | | | Fair
Value | |
| Hotels 0.36% | | | | | | | | | | | | |
| Hyatt Hotels Corp.† | | 6.875% | | 8/15/2019 | | $ | 500 | | | $ | 533,180 | |
| Wyndham Worldwide Corp. | | 2.50% | | 3/1/2018 | | | 250 | | | | 250,084 | |
| Total | | | | | | | | | | | 783,264 | |
| | | | | | | | | | | | | |
| Insurance Brokerage 0.04% | | | | | | | | | | | | |
| Willis North America, Inc. | | 7.00% | | 9/29/2019 | | | 75 | | | | 80,459 | |
| | | | | | | | | | | | | |
| Integrated Energy 0.75% | | | | | | | | | | | | |
| Eni SpA (Italy)†(c) | | 4.15% | | 10/1/2020 | | | 610 | | | | 631,859 | |
| Petroleos Mexicanos (Mexico)(c) | | 5.50% | | 2/4/2019 | | | 500 | | | | 517,975 | |
| Sinopec Group Overseas Development 2013 Ltd.† | | 2.50% | | 10/17/2018 | | | 500 | | | | 500,374 | |
| Total | | | | | | | | | | | 1,650,208 | |
| | | | | | | | | | | | | |
| Life Insurance 0.15% | | | | | | | | | | | | |
| Lincoln National Corp. | | 7.00% | | 3/15/2018 | | | 250 | | | | 252,458 | |
| Lincoln National Corp. | | 8.75% | | 7/1/2019 | | | 77 | | | | 84,094 | |
| Total | | | | | | | | | | | 336,552 | |
| | | | | | | | | | | | | |
| Machinery 0.46% | | | | | | | | | | | | |
| Caterpillar Financial Services Corp. | | 1.689%
(3 Mo. LIBOR + .18% | )# | 12/6/2018 | | | 1,000 | | | | 1,000,353 | |
| | | | | | | | | | | | | |
| Media: Content 0.20% | | | | | | | | | | | | |
| Activision Blizzard, Inc.† | | 6.125% | | 9/15/2023 | | | 423 | | | | 448,503 | |
| | | | | | | | | | | | | |
| Medical Products 0.76% | | | | | | | | | | | | |
| Fresenius Medical Care US Finance II, Inc.† | | 4.125% | | 10/15/2020 | | | 500 | | | | 515,309 | |
| Zimmer Biomet Holdings, Inc. | | 2.00% | | 4/1/2018 | | | 500 | | | | 500,212 | |
| Zimmer Biomet Holdings, Inc. | | 3.375% | | 11/30/2021 | | | 634 | | | | 642,856 | |
| Total | | | | | | | | | | | 1,658,377 | |
| | | | | | | | | | | | | |
| Metals/Mining (Excluding Steel) 1.68% | | | | | | | | | | | | |
| FMG Resources (August 2006) Pty Ltd. (Australia)†(c) | | 9.75% | | 3/1/2022 | | | 1,000 | | | | 1,109,000 | |
| Glencore Finance Canada Ltd. (Canada)†(c) | | 4.95% | | 11/15/2021 | | | 1,000 | | | | 1,067,963 | |
| Glencore Funding LLC† | | 2.125% | | 4/16/2018 | | | 1,000 | | | | 999,838 | |
| Goldcorp, Inc. (Canada)(c) | | 2.125% | | 3/15/2018 | | | 500 | | | | 500,283 | |
| Total | | | | | | | | | | | 3,677,084 | |
| | | | | | | | | | | | | |
| Non-Electric Utilities 0.12% | | | | | | | | | | | | |
| United Utilities plc (United Kingdom)(c) | | 4.55% | | 6/19/2018 | | | 250 | | | | 252,391 | |
| | | | | | | | | | | | | |
| Oil Field Equipment & Services 0.33% | | | | | | | | | | | | |
| Cameron International Corp. | | 6.375% | | 7/15/2018 | | | 704 | | | | 720,531 | |
| 38 | See Notes to Financial Statements. |
Schedule of Investments (continued)
EMERGING MARKETS CURRENCY FUND December 31, 2017
| Investments | | Interest
Rate | | Maturity
Date | | Principal
Amount
(000) | | | Fair
Value | |
| Packaging 0.12% | | | | | | | | | | | | |
| Packaging Corp. of America | | 6.50% | | 3/15/2018 | | $ | 250 | | | $ | 252,074 | |
| | | | | | | | | | | | | |
| Pharmaceuticals 1.37% | | | | | | | | | | | | |
| Allergan Funding SCS (Luxembourg)(c) | 2.629%
(3 Mo. LIBOR + 1.08% | )# | 3/12/2018 | | | 1,000 | | | | 1,001,489 | |
| Baxalta, Inc. | 2.438%
(3 Mo. LIBOR + .78% | )# | 6/22/2018 | | | 1,000 | | | | 1,002,168 | |
| Teva Pharmaceutical Finance Netherlands III BV (Netherlands)(c) | | 1.40% | | 7/20/2018 | | | 1,000 | | | | 993,473 | |
| Total | | | | | | | | | | | 2,997,130 | |
| | | | | | | | | | | | | |
| Property & Casualty 0.48% | | | | | | | | | | | | |
| CNA Financial Corp. | | 5.875% | | 8/15/2020 | | | 250 | | | | 270,565 | |
| CNA Financial Corp. | | 6.95% | | 1/15/2018 | | | 250 | | | | 250,393 | |
| Liberty Mutual Group, Inc.† | | 5.00% | | 6/1/2021 | | | 500 | | | | 535,125 | |
| Total | | | | | | | | | | | 1,056,083 | |
| | | | | | | | | | | | | |
| Real Estate Investment Trusts 1.30% | | | | | | | | | | | | |
| DDR Corp. | | 7.50% | | 7/15/2018 | | | 500 | | | | 513,711 | |
| Kilroy Realty LP | | 6.625% | | 6/1/2020 | | | 500 | | | | 544,525 | |
| Kimco Realty Corp. | | 6.875% | | 10/1/2019 | | | 250 | | | | 268,771 | |
| SL Green Realty Corp. | | 5.00% | | 8/15/2018 | | | 500 | | | | 506,181 | |
| VEREIT Operating Partnership LP | | 4.125% | | 6/1/2021 | | | 500 | | | | 519,397 | |
| Welltower, Inc. | | 2.25% | | 3/15/2018 | | | 500 | | | | 500,218 | |
| Total | | | | | | | | | | | 2,852,803 | |
| | | | | | | | | | | | | |
| Software/Services 2.48% | | | | | | | | | | | | |
| Baidu, Inc. (China)(c) | | 2.75% | | 6/9/2019 | | | 500 | | | | 500,879 | |
| Baidu, Inc. (China)(c) | | 3.25% | | 8/6/2018 | | | 850 | | | | 854,178 | |
| CA, Inc. | | 2.875% | | 8/15/2018 | | | 1,000 | | | | 1,005,021 | |
| eBay, Inc. | | 1.857%
(3 Mo. LIBOR + .48% | )# | 8/1/2019 | | | 500 | | | | 501,451 | |
| Fidelity National Information Services, Inc. | | 2.85% | | 10/15/2018 | | | 500 | | | | 503,129 | |
| Hewlett Packard Enterprise Co. | | 2.85% | | 10/5/2018 | | | 550 | | | | 552,751 | |
| Hewlett Packard Enterprise Co. | 3.273%
(3 Mo. LIBOR + 1.93% | )# | 10/5/2018 | | | 500 | | | | 506,439 | |
| Tencent Holdings Ltd. (China)†(c) | | 3.375% | | 5/2/2019 | | | 1,000 | | | | 1,012,136 | |
| Total | | | | | | | | | | | 5,435,984 | |
| | | | | | | | | | | | | |
| Specialty Retail 0.12% | | | | | | | | | | | | |
| Best Buy Co., Inc. | | 5.00% | | 8/1/2018 | | | 250 | | | | 254,142 | |
| | | | | | | | | | | | | |
| Support: Services 0.12% | | | | | | | | | | | | |
| Expedia, Inc. | | 7.456% | | 8/15/2018 | | | 250 | | | | 257,872 | |
| | See Notes to Financial Statements. | 39 |
Schedule of Investments (continued)
EMERGING MARKETS CURRENCY FUND December 31, 2017
| Investments | | Interest
Rate | | Maturity
Date | | Principal
Amount
(000) | | | Fair
Value | |
| Technology Hardware & Equipment 0.94% | | | | | | | | | | | | |
| Dell International LLC/EMC Corp.† | | 3.48% | | 6/1/2019 | | $ | 1,000 | | | $ | 1,012,786 | |
| Dell International LLC/EMC Corp.† | | 4.42% | | 6/15/2021 | | | 1,000 | | | | 1,042,733 | |
| Total | | | | | | | | | | | 2,055,519 | |
| | | | | | | | | | | | | |
| Telecommunications: Wireline Integrated & Services 1.52% | | | | | | | | | | | | |
| AT&T, Inc. | | 5.875% | | 10/1/2019 | | | 1,000 | | | | 1,059,825 | |
| BellSouth LLC† | | 4.285% | | 4/26/2021 | | | 1,000 | | | | 1,007,104 | |
| British Telecommunications plc (United Kingdom)(c) | | 5.95% | | 1/15/2018 | | | 500 | | | | 500,673 | |
| Telefonica Emisiones SAU (Spain)(c) | | 3.192% | | 4/27/2018 | | | 500 | | | | 501,816 | |
| Telenor ASA (Norway)(c) | | 1.75% | | 5/22/2018 | | | 250 | | | | 249,844 | |
| Total | | | | | | | | | | | 3,319,262 | |
| | | | | | | | | | | | | |
| Tobacco 0.68% | | | | | | | | | | | | |
| BAT International Finance plc (United Kingdom)†(c) | | 2.099%
(3 Mo. LIBOR + .51% | )# | 6/15/2018 | | | 990 | | | | 990,830 | |
| Imperial Brands Finance plc (United Kingdom)†(c) | | 2.05% | | 2/11/2018 | | | 500 | | | | 499,948 | |
| Total | | | | | | | | | | | 1,490,778 | |
| | | | | | | | | | | | | |
| Transportation: Infrastructure/Services 0.11% | | | | | | | | | | | | |
| HPHT Finance 15 Ltd.† | | 2.25% | | 3/17/2018 | | | 250 | | | | 249,851 | |
| Total Corporate Bonds (cost $82,703,890) | | | | | | | | | | | 82,684,800 | |
| | | | | | | | | | | | | |
| FLOATING RATE LOANS(d) 1.79% | | | | | | | | | | | | |
| | | | | | | | | | | | | |
| Aerospace/Defense 0.03% | | | | | | | | | | | | |
| Harris Corp. Term Loan | 3.07%
(3 Mo. LIBOR + 1.50% | ) | 5/29/2018 | | | 67 | | | | 66,708 | (e) |
| | | | | | | | | | | | | |
| Gaming 0.46% | | | | | | | | | | | | |
| Las Vegas Sands LLC 2017 Refinancing Term Loan | 3.569%
(3 Mo. LIBOR + 2.00% | ) | 3/29/2024 | | | 992 | | | | 998,813 | |
| | | | | | | | | | | | | |
| Health Facilities 0.01% | | | | | | | | | | | | |
| Laboratory Corp. of America Holdings Term Loan | 2.819%
(3 Mo. LIBOR + 1.25% | ) | 2/19/2020 | | | 25 | | | | 25,206 | (e) |
| | | | | | | | | | | | | |
| Packaging 0.43% | | | | | | | | | | | | |
| Ball Corp. USD Term Loan A | 3.319%
(3 Mo. LIBOR + 1.75% | ) | 7/21/2021 | | | 938 | | | | 939,844 | |
| | | | | | | | | | | | | |
| Software/Services 0.23% | | | | | | | | | | | | |
| Everett SpinCo, Inc Tranche A2 Term Loan | | – | (f) | 12/16/2021 | | | 500 | | | | 499,688 | (e) |
| 40 | See Notes to Financial Statements. | |
Schedule of Investments (continued)
EMERGING MARKETS CURRENCY FUND December 31, 2017
| Investments | | Interest
Rate | | Maturity
Date | | Principal
Amount
(000) | | | Fair
Value | |
| Specialty Retail 0.40% | | | | | | | | | | | | |
| PVH Corp. Tranche A Term Loan | 2.991%
(1 Mo. LIBOR + 1.50% | ) | 5/19/2021 | | $ | 881 | | | $ | 880,477 | |
| | | | | | | | | | | | | |
| Telecommunications: Wireless 0.23% | | | | | | | | | | | | |
| American Tower Corporation Term Loan | 2.82%
(3 Mo. LIBOR + 1.25% | ) | 1/21/2023 | | | 500 | | | | 496,875 | (e) |
| Total Floating Rate Loans (cost $3,894,986) | | | | | | | | | | | 3,907,611 | |
| | | | | | | | | | | | | |
| FOREIGN GOVERNMENT OBLIGATIONS(g) 4.61% | | | | | | | | | | | | |
| | | | | | | | | | | | | |
| Argentina 2.79% | | | | | | | | | | | | |
| City of Buenos Aires | 26.661%
(BADLAR + 3.25% | )# | 3/29/2024 | | ARS | 39,830 | | | | 2,090,664 | |
| City of Buenos Aires | 26.875%
(BADLAR + 3.75% | )# | 2/22/2028 | | ARS | 41,000 | | | | 2,193,313 | |
| Provincia de Mendoza | 27.50%
(BADLAR + 4.38% | )# | 6/9/2021 | | ARS | 33,750 | | | | 1,820,621 | |
| Total | | | | | | | | | | | 6,104,598 | |
| | | | | | | | | | | | | |
| Egypt 0.72% | | | | | | | | | | | | |
| Egypt Treasury Bill | | Zero Coupon | | 3/6/2018 | | EGP | 28,650 | | | | 1,566,256 | |
| | | | | | | | | | | | | |
| Nigeria 1.10% | | | | | | | | | | | | |
| Nigeria Treasury Bill | | Zero Coupon | | 5/31/2018 | | NGN | 479,500 | | | | 1,251,402 | (a) |
| Nigeria Treasury Bill | | 0.01% | | 4/19/2018 | | NGN | 432,000 | | | | 1,153,644 | (a) |
| Total | | | | | | | | | | | 2,405,046 | |
| Total Foreign Government Obligations (cost $10,966,209) | | | | | | | | | | | 10,075,900 | |
| | | | | | | | | | | | | |
| GOVERNMENT SPONSORED ENTERPRISES COLLATERALIZED MORTGAGE OBLIGATIONS 3.41% | | | | | | |
| Federal Home Loan Mortgage Corp. 2011-K704 B† | | 4.536% | #(b) | 10/25/2030 | | $ | 376 | | | | 379,846 | |
| Federal Home Loan Mortgage Corp. 2012-K705 C† | | 4.159% | #(b) | 9/25/2044 | | | 500 | | | | 503,659 | |
| Federal Home Loan Mortgage Corp. 2012-K706 B† | | 4.03% | #(b) | 11/25/2044 | | | 100 | | | | 100,965 | |
| Federal Home Loan Mortgage Corp. 2012-K708 C† | | 3.75% | #(b) | 2/25/2045 | | | 100 | | | | 100,617 | |
| Federal Home Loan Mortgage Corp. 2012-K709 B† | | 3.741% | #(b) | 4/25/2045 | | | 261 | | | | 264,899 | |
| Federal Home Loan Mortgage Corp. 2012-K710 B† | | 3.812% | #(b) | 6/25/2047 | | | 200 | | | | 203,273 | |
| Federal Home Loan Mortgage Corp. 2012-K711 B† | | 3.562% | #(b) | 8/25/2045 | | | 303 | | | | 306,810 | |
| Federal Home Loan Mortgage Corp. 2012-K711 C† | | 3.562% | #(b) | 8/25/2045 | | | 200 | | | | 200,539 | |
| Federal Home Loan Mortgage Corp. 2013-K712 B† | | 3.362% | #(b) | 5/25/2045 | | | 100 | | | | 100,923 | |
| Federal Home Loan Mortgage Corp. 2013-K713 B† | | 3.165% | #(b) | 4/25/2046 | | | 400 | | | | 402,343 | |
| Federal Home Loan Mortgage Corp. 2014-K503 B† | | 3.002% | #(b) | 10/25/2047 | | | 415 | | | | 416,398 | |
| Government National Mortgage Assoc. 2013-171 IO | | 0.944% | #(b) | 6/16/2054 | | | 14,069 | | | | 861,484 | |
| Government National Mortgage Assoc. 2013-193 IO | | 0.934% | #(b) | 1/16/2055 | | | 1,322 | | | | 82,004 | |
| Government National Mortgage Assoc. 2014-15 IO | | 0.772% | #(b) | 8/16/2054 | | | 11,862 | | | | 626,871 | |
| Government National Mortgage Assoc. 2014-70 A | | 2.50% | | 3/16/2049 | | | 71 | | | | 68,649 | |
| Government National Mortgage Assoc. 2014-78 A | | 2.20% | | 4/16/2047 | | | 83 | | | | 82,390 | |
| | See Notes to Financial Statements. | 41 |
Schedule of Investments (continued)
EMERGING MARKETS CURRENCY FUND December 31, 2017
| Investments | | Interest
Rate | | Maturity
Date | | Principal
Amount
(000) | | | Fair
Value | |
| GOVERNMENT SPONSORED ENTERPRISES COLLATERALIZED MORTGAGE OBLIGATIONS (continued) |
| Government National Mortgage Assoc. 2014-78 IO | | 0.607% | #(b) | 3/16/2056 | | $ | 750 | | | $ | 34,387 | |
| Government National Mortgage Assoc. 2015-33 AS | | 2.90% | #(b) | 5/16/2054 | | | 304 | | | | 302,002 | |
| Government National Mortgage Assoc. 2015-41 AD | | 2.90% | #(b) | 8/16/2055 | | | 196 | | | | 196,474 | |
| Government National Mortgage Assoc. 2015-73 AC | | 2.90% | #(b) | 2/16/2053 | | | 1,255 | | | | 1,247,442 | |
| Government National Mortgage Assoc. 2017-92 AS | | 2.75% | | 6/16/2058 | | | 992 | | | | 982,988 | |
| Total Government Sponsored Enterprises Collateralized Mortgage Obligations (cost $8,180,586) | | | | | | 7,464,963 | |
| | | | | | | | | | | | | |
| GOVERNMENT SPONSORED ENTERPRISES PASS-THROUGHS 3.61% | | | | | | | | | |
| Federal Home Loan Mortgage Corp. | | 3.346%
(12 Mo. LIBOR + 1.66% | )# | 2/1/2038 | | | 306 | | | | 321,175 | |
| Federal Home Loan Mortgage Corp. | | 3.456%
(12 Mo. LIBOR + 1.71% | )# | 4/1/2037 | | | 275 | | | | 288,838 | |
| Federal Home Loan Mortgage Corp. | | 3.499%
(12 Mo. LIBOR + 1.78% | )# | 5/1/2036 | | | 208 | | | | 218,881 | |
| Federal Home Loan Mortgage Corp. | | 3.526%
(12 Mo. LIBOR + 1.79% | )# | 12/1/2036 | | | 355 | | | | 374,436 | |
| Federal Home Loan Mortgage Corp. | 3.592%
(1 Yr Treasury Constant Maturity Rate + 2.51% | )# | 12/1/2035 | | | 394 | | | | 418,987 | |
| Federal Home Loan Mortgage Corp. | | 5.00% | | 5/1/2021 | | | 28 | | | | 28,803 | |
| Federal National Mortgage Assoc. | 3.112%
(1 Yr Treasury Constant Maturity Rate + 2.20% | )# | 1/1/2038 | | | 164 | | | | 173,632 | |
| Federal National Mortgage Assoc. | 3.132%
(1 Yr Treasury Constant Maturity Rate + 2.23% | )# | 3/1/2038 | | | 115 | | | | 121,431 | |
| Federal National Mortgage Assoc. | | 3.214%
(12 Mo. LIBOR + 1.46% | )# | 12/1/2035 | | | 316 | | | | 329,151 | |
| Federal National Mortgage Assoc. | | 3.22%
(12 Mo. LIBOR + 1.52% | )# | 2/1/2036 | | | 190 | | | | 198,563 | |
| Federal National Mortgage Assoc. | | 3.34%
(12 Mo. LIBOR + 1.62% | )# | 1/1/2038 | | | 205 | | | | 215,156 | |
| Federal National Mortgage Assoc. | | 3.356%
(12 Mo. LIBOR + 1.58% | )# | 11/1/2036 | | | 580 | | | | 606,078 | |
| Federal National Mortgage Assoc. | | 3.397%
(12 Mo. LIBOR + 1.66% | )# | 9/1/2038 | | | 169 | | | | 177,575 | |
| Federal National Mortgage Assoc. | | 3.445%
(12 Mo. LIBOR + 1.69% | )# | 8/1/2038 | | | 126 | | | | 132,362 | |
| Federal National Mortgage Assoc. | | 3.468%
(12 Mo. LIBOR + 1.76% | )# | 11/1/2038 | | | 286 | | | | 301,828 | |
| Federal National Mortgage Assoc. | | 3.532%
(12 Mo. LIBOR + 1.82% | )# | 12/1/2040 | | | 414 | | | | 433,210 | |
| Federal National Mortgage Assoc. | | 3.544%
(12 Mo. LIBOR + 1.80% | )# | 10/1/2040 | | | 469 | | | | 490,434 | |
| 42 | See Notes to Financial Statements. | |
Schedule of Investments (continued)
EMERGING MARKETS CURRENCY FUND December 31, 2017
| Investments | | Interest
Rate | | Maturity
Date | | Principal
Amount
(000) | | | Fair
Value | |
| GOVERNMENT SPONSORED ENTERPRISES PASS-THROUGHS (continued) |
| Federal National Mortgage Assoc. | 3.558%
(12 Mo. LIBOR + 1.81% | )# | 12/1/2040 | | $ | 482 | | | $ | 504,902 | |
| Federal National Mortgage Assoc. | 3.562%
(12 Mo. LIBOR + 1.80% | )# | 11/1/2040 | | | 1,474 | | | | 1,539,139 | |
| Federal National Mortgage Assoc. | 3.618%
(12 Mo. LIBOR + 1.88% | )# | 12/1/2038 | | | 107 | | | | 113,754 | |
| Federal National Mortgage Assoc. | | 5.50% | | 2/1/2034 | | | 393 | | | | 436,720 | |
| Federal National Mortgage Assoc. | | 5.50% | | 11/1/2034 | | | 418 | | | | 464,319 | |
| Total Government Sponsored Enterprises Pass-Throughs (cost $7,902,298) | | | | | | | | 7,889,374 | |
| | | | | | | | | | | | | |
| MUNICIPAL BOND 0.34% | | | | | | | | | | | | |
| | | | | | | | | | | | | |
| Nursing Home | | | | | | | | | | | | |
New Jersey Econ Dev Auth
(cost $750,572) | | 2.421% | | 6/15/2018 | | | 750 | | | | 750,187 | |
| | | | | | | | | | | | | |
| NON-AGENCY COMMERCIAL MORTGAGE-BACKED SECURITIES 18.43% |
| A10 Bridge Asset Financing LLC 2015-AA A1† | | 3.30% | | 5/15/2036 | | | 1,025 | | | | 1,022,337 | (a) |
| BAMLL Commercial Mortgage Securities Trust 2014-IP A† | | 2.717% | #(b) | 6/15/2028 | | | 100 | | | | 99,978 | |
| BAMLL Commercial Mortgage Securities Trust 2014-IP B† | | 2.717% | #(b) | 6/15/2028 | | | 200 | | | | 199,531 | |
| BAMLL Commercial Mortgage Securities Trust 2014-IP C† | | 2.717% | #(b) | 6/15/2028 | | | 340 | | | | 339,754 | |
| Bancorp Commercial Mortgage Trust 2016-CRE1 A† | 2.907%
(1 Mo. LIBOR + 1.43% | )# | 11/15/2033 | | | 88 | | | | 88,534 | |
| BBCMS Trust 2015-MSQ A† | | 3.593% | | 9/15/2032 | | | 113 | | | | 116,485 | |
| BBCMS Trust 2015-VFM A1† | | 2.466% | | 3/10/2036 | | | 251 | | | | 243,359 | |
| BBCMS Trust 2015-VFM X IO† | | 0.462% | #(b) | 3/12/2036 | | | 51,764 | | | | 1,191,347 | |
| Bear Stearns Deutsche Bank Trust 2005-AFR1 A2† | | 5.008% | | 9/15/2027 | | | 70 | | | | 73,521 | |
| CCRESG Commercial Mortgage Trust 2016-HEAT B† | | 4.114% | | 4/10/2029 | | | 619 | | | | 623,711 | |
| CCRESG Commercial Mortgage Trust 2016-HEAT C† | | 4.919% | | 4/10/2029 | | | 619 | | | | 627,445 | |
| CFCRE Commercial Mortgage Trust 2011-C2 AJ† | | 5.754% | #(b) | 12/15/2047 | | | 133 | | | | 144,768 | |
| CFCRE Commercial Mortgage Trust 2016-C6 XA IO | | 1.207% | #(b) | 11/10/2049 | | | 2,061 | | | | 162,655 | |
| CGBAM Commercial Mortgage Trust 2015-SMRT B† | | 3.213% | | 4/10/2028 | | | 324 | | | | 324,930 | |
| CGBAM Commercial Mortgage Trust 2015-SMRT C† | | 3.516% | | 4/10/2028 | | | 243 | | | | 244,455 | |
| Citigroup Commercial Mortgage Trust 2014-GC21 XA IO | | 1.239% | #(b) | 5/10/2047 | | | 4,289 | | | | 256,823 | |
| Citigroup Commercial Mortgage Trust 2014-GC23 XB IO | | 0.231% | #(b) | 7/10/2047 | | | 3,784 | | | | 56,745 | |
| Citigroup Commercial Mortgage Trust 2015-GC31 XA IO | | 0.446% | #(b) | 6/10/2048 | | | 3,989 | | | | 101,947 | |
| | See Notes to Financial Statements. | 43 |
Schedule of Investments (continued)
EMERGING MARKETS CURRENCY FUND December 31, 2017
| Investments | | Interest
Rate | | Maturity
Date | | Principal
Amount
(000) | | | Fair
Value | |
| NON-AGENCY COMMERCIAL MORTGAGE-BACKED SECURITIES (continued) |
| Citigroup Commercial Mortgage Trust 2016-SMPL A† | | 2.228% | | 9/10/2031 | | $ | 507 | | | $ | 497,736 | |
| Citigroup Commercial Mortgage Trust 2016-SMPL B† | | 2.576% | | 9/10/2031 | | | 283 | | | | 276,130 | |
| Citigroup Commercial Mortgage Trust 2016-SMPL C† | | 2.825% | | 9/10/2031 | | | 100 | | | | 97,289 | |
| Citigroup Commercial Mortgage Trust 2016-SMPL XCP IO† | | 1.977% | #(b) | 9/10/2031 | | | 47,247 | | | | 619,224 | |
| Commercial Mortgage Pass-Through Certificates 2010-C1 C† | | 5.99% | #(b) | 7/10/2046 | | | 100 | | | | 106,192 | |
| Commercial Mortgage Pass-Through Certificates 2012-CR3 B† | | 3.922% | | 10/15/2045 | | | 383 | | | | 387,315 | |
| Commercial Mortgage Pass-Through Certificates 2012-LTRT A1† | | 2.15% | | 10/5/2030 | | | 270 | | | | 262,406 | |
| Commercial Mortgage Pass-Through Certificates 2013-SFS A1† | | 1.873% | | 4/12/2035 | | | 391 | | | | 382,142 | |
| Commercial Mortgage Pass-Through Certificates 2014-CR19 XA IO | | 1.224% | #(b) | 8/10/2047 | | | 1,658 | | | | 83,278 | |
| Commercial Mortgage Pass-Through Certificates 2014-FL4 C† | 3.41%
(1 Mo. LIBOR + 1.95% | )# | 7/13/2031 | | | 468 | | | | 472,746 | |
| Commercial Mortgage Pass-Through Certificates 2014-LC17 XB IO† | | 0.039% | #(b) | 10/10/2047 | | | 58,568 | | | | 283,047 | |
| Commercial Mortgage Pass-Through Certificates 2014-UBS5 XA IO | | 1.033% | #(b) | 9/10/2047 | | | 3,634 | | | | 149,762 | |
| Commercial Mortgage Pass-Through Certificates 2015-CR23 CMC† | | 3.685% | #(b) | 5/10/2048 | | | 1,000 | | | | 1,004,129 | |
| Commercial Mortgage Pass-Through Certificates 2016-SAVA B† | 3.732%
(1 Mo. LIBOR + 2.30% | )# | 10/15/2034 | | | 734 | | | | 736,772 | |
| Commercial Mortgage Pass-Through Certificates 2016-SAVA XCP IO† | | 2.173% | #(b) | 10/15/2034 | | | 6,243 | | | | 107,600 | (a) |
| Commercial Mortgage Trust 2006-GG7 AM | | 5.767% | #(b) | 7/10/2038 | | | 403 | | | | 405,714 | |
| Core Industrial Trust 2015-WEST XA IO† | | 0.935% | #(b) | 2/10/2037 | | | 2,882 | | | | 169,182 | |
| Credit Suisse First Boston Mortgage Securities Corp. 2006-OMA A† | | 5.384% | | 5/15/2023 | | | 3 | | | | 3,305 | |
| Credit Suisse First Boston Mortgage Securities Corp. 2006-OMA B1† | | 5.466% | | 5/15/2023 | | | 333 | | | | 342,605 | |
| Credit Suisse Mortgage Capital Certificates 2014-USA X1 IO† | | 0.552% | #(b) | 9/15/2037 | | | 20,000 | | | | 699,900 | |
| Credit Suisse Mortgage Capital Certificates 2015-DEAL A† | 2.797%
(1 Mo. LIBOR + 1.32% | )# | 4/15/2029 | | | 365 | | | | 365,285 | |
| Credit Suisse Mortgage Capital Certificates 2015-DEAL B† | 3.327%
(1 Mo. LIBOR + 1.85% | )# | 4/15/2029 | | | 478 | | | | 478,549 | |
| 44 | See Notes to Financial Statements. | |
Schedule of Investments (continued)
EMERGING MARKETS CURRENCY FUND December 31, 2017
| Investments | | Interest
Rate | | Maturity
Date | | Principal
Amount
(000) | | | Fair
Value | |
| NON-AGENCY COMMERCIAL MORTGAGE-BACKED SECURITIES (continued) | | | | | | | | | |
| Credit Suisse Mortgage Capital Certificates 2016-MFF B† | 3.977%
(1 Mo. LIBOR + 2.50% | )# | 11/15/2033 | | $ | 419 | | | $ | 421,677 | |
| Credit Suisse Mortgage Capital Certificates 2016-MFF C† | 4.977%
(1 Mo. LIBOR + 3.50% | )# | 11/15/2033 | | | 476 | | | | 480,552 | |
| Credit Suisse Mortgage Capital Certificates 2017-LSTK A† | | 2.761% | | 4/5/2033 | | | 1,200 | | | | 1,203,703 | |
| DBUBS Mortgage Trust 2011-LC2A B† | | 4.998% | #(b) | 7/10/2044 | | | 100 | | | | 106,056 | |
| DBUBS Mortgage Trust 2011-LC2A D† | | 5.542% | #(b) | 7/10/2044 | | | 300 | | | | 313,038 | |
| DBUBS Mortgage Trust 2011-LC3A A3 | | 4.638% | | 8/10/2044 | | | 19 | | | | 18,994 | |
| DBWF Mortgage Trust 2015-LCM A1† | | 2.998% | | 6/10/2034 | | | 308 | | | | 307,179 | |
| DBWF Mortgage Trust 2015-LCM XA IO† | | 0.423% | #(b) | 6/10/2034 | | | 805 | | | | 15,465 | |
| GAHR Commercial Mortgage Trust 2015-NRF CFX† | | 3.382% | #(b) | 12/15/2034 | | | 320 | | | | 322,290 | |
| GRACE Mortgage Trust 2014-GRCE A† | | 3.369% | | 6/10/2028 | | | 300 | | | | 307,923 | |
| GS Mortgage Securities Corp. II 2013-KING A† | | 2.706% | | 12/10/2027 | | | 234 | | | | 235,275 | |
| GS Mortgage Securities Corp. Trust 2012-SHOP B† | | 3.311% | | 6/5/2031 | | | 408 | | | | 411,064 | |
| GS Mortgage Securities Corp. Trust 2012-SHOP D† | | 4.182% | | 6/5/2031 | | | 761 | | | | 760,515 | |
| GS Mortgage Securities Corp. Trust 2014-NEW B† | | 3.79% | | 1/10/2031 | | | 130 | | | | 133,323 | |
| GS Mortgage Securities Trust 2012-GCJ7 B | | 4.74% | | 5/10/2045 | | | 95 | | | | 100,045 | |
| GS Mortgage Securities Trust 2013-G1 A1† | | 2.059% | | 4/10/2031 | | | 678 | | | | 657,871 | |
| GS Mortgage Securities Trust 2016-GS4 225A† | | 2.636% | | 11/10/2029 | | | 155 | | | | 153,145 | (a) |
| GS Mortgage Securities Trust 2016-GS4 225C† | | 3.778% | | 11/10/2029 | | | 270 | | | | 268,619 | (a) |
| GS Mortgage Securities Trust 2016-GS4 225D† | | 4.766% | | 11/10/2029 | | | 367 | | | | 366,207 | (a) |
| H/2 Asset Funding 2015-1A-AFL | | 2.174% | | 6/24/2049 | | | 390 | | | | 390,681 | (a) |
| H/2 Asset Funding 2015-1A-AFX | | 3.353% | | 6/24/2049 | | | 195 | | | | 192,146 | (a) |
| H/2 Asset Funding 2015-1A-BFX | | 3.993% | | 6/24/2049 | | | 369 | | | | 355,519 | (a) |
| Hudsons Bay Simon JV Trust 2015-HB7 D7† | | 5.159% | #(b) | 8/5/2034 | | | 837 | | | | 795,353 | |
| Irvine Core Office Trust 2013-IRV A1† | | 2.068% | | 5/15/2048 | | | 116 | | | | 113,882 | |
| JPMorgan Chase Commercial Mortgage Securities Trust 2010-C1 A2† | | 4.608% | | 6/15/2043 | | | 288 | | | | 298,517 | |
| JPMorgan Chase Commercial Mortgage Securities Trust 2010-C2 B† | | 5.075% | #(b) | 11/15/2043 | | | 250 | | | | 261,084 | |
| JPMorgan Chase Commercial Mortgage Securities Trust 2012-WLDN A† | | 3.905% | | 5/5/2030 | | | 711 | | | | 733,586 | |
| JPMorgan Chase Commercial Mortgage Securities Trust 2014-C19 A2 | | 3.046% | | 4/15/2047 | | | 198 | | | | 200,240 | |
| JPMorgan Chase Commercial Mortgage Securities Trust 2014-C19 XA IO | | 1.139% | #(b) | 4/15/2047 | | | 1,867 | | | | 50,274 | |
| JPMorgan Chase Commercial Mortgage Securities Trust 2014-C19 XB IO | | 0.267% | #(b) | 4/15/2047 | | | 1,000 | | | | 19,908 | |
| | See Notes to Financial Statements. | 45 |
Schedule of Investments (continued)
EMERGING MARKETS CURRENCY FUND December 31, 2017
| Investments | | Interest
Rate | | Maturity
Date | | Principal
Amount
(000) | | | Fair
Value | |
| NON-AGENCY COMMERCIAL MORTGAGE-BACKED SECURITIES (continued) | | | | | | |
| JPMorgan Chase Commercial Mortgage Securities Trust 2014-DSTY B† | | 3.771% | | 6/10/2027 | | $ | 1,359 | | | $ | 1,355,412 | |
| JPMorgan Chase Commercial Mortgage Securities Trust 2014-DSTY C† | | 3.805% | #(b) | 6/10/2027 | | | 866 | | | | 855,867 | |
| JPMorgan Chase Commercial Mortgage Securities Trust 2014-DSTY XA IO† | | 0.376% | #(b) | 6/10/2027 | | | 1,487 | | | | 8,721 | |
| JPMorgan Chase Commercial Mortgage Securities Trust 2014-DSTY XB IO† | | 0.034% | #(b) | 6/10/2027 | | | 661 | | | | 681 | |
| JPMorgan Chase Commercial Mortgage Securities Trust 2014-FL4 C† | 3.677%
(1 Mo. LIBOR + 2.20% | )# | 12/15/2030 | | | 250 | | | | 250,738 | |
| JPMorgan Chase Commercial Mortgage Securities Trust 2014-FL4 D† | 4.577%
(1 Mo. LIBOR + 3.10% | )# | 12/15/2030 | | | 500 | | | | 504,582 | |
| JPMorgan Chase Commercial Mortgage Securities Trust 2014-FL5 C† | 3.577%
(1 Mo. LIBOR + 2.10% | )# | 7/15/2031 | | | 250 | | | | 248,536 | |
| JPMorgan Chase Commercial Mortgage Securities Trust 2015-C28 A2 | | 2.773% | | 10/15/2048 | | | 34 | | | | 34,242 | |
| JPMorgan Chase Commercial Mortgage Securities Trust 2015-C29 XA IO | | 0.927% | #(b) | 5/15/2048 | | | 2,925 | | | | 101,968 | |
| JPMorgan Chase Commercial Mortgage Securities Trust 2015-UES XB IO† | | 0.136% | #(b) | 9/5/2032 | | | 46,250 | | | | 165,113 | |
| JPMorgan Chase Commercial Mortgage Securities Trust 2016-WIKI A† | | 2.798% | | 10/5/2031 | | | 309 | | | | 309,591 | |
| JPMorgan Chase Commercial Mortgage Securities Trust 2016-WIKI B† | | 3.201% | | 10/5/2031 | | | 141 | | | | 141,649 | |
| JPMorgan Chase Commercial Mortgage Securities Trust 2016-WIKI C† | | 3.554% | | 10/5/2031 | | | 178 | | | | 179,169 | |
| JPMorgan Chase Commercial Mortgage Securities Trust 2016-WIKI XA IO† | | 1.211% | #(b) | 10/5/2031 | | | 1,543 | | | | 60,177 | (a) |
| JPMorgan Chase Commercial Mortgage Securities Trust 2016-WIKI XB IO† | | 0.657% | #(b) | 10/5/2031 | | | 1,000 | | | | 21,944 | (a) |
| JPMorgan Chase Commercial Mortgage Securities Trust 2016-WPT C† | 4.327%
(1 Mo. LIBOR + 2.85% | )# | 10/15/2033 | | | 41 | | | | 41,285 | |
| JPMorgan Chase Commercial Mortgage Securities Trust 2016-WPT D† | 5.227%
(1 Mo. LIBOR + 3.75% | )# | 10/15/2033 | | | 292 | | | | 295,005 | |
| JPMorgan Chase Commercial Mortgage Securities Trust 2016-WPT XCP IO† | 1.198% | #(b) | 10/15/2018 | | | 53,571 | | | | 533,299 | |
| Ladder Capital Commercial Mortgage Securities LLC 2014-PKMD B† | | 2.857% | #(b) | 11/14/2027 | | | 156 | | | | 156,075 | |
| LMREC, Inc. 2015-CRE1 A† | 3.285%
(1 Mo. LIBOR + 1.75% | )# | 2/22/2032 | | | 755 | | | | 762,229 | |
| LMREC, Inc. 2015-CRE1 B† | 5.035%
(1 Mo. LIBOR + 3.50% | )# | 2/22/2032 | | | 100 | | | | 101,064 | |
| LSTAR Commercial Mortgage Trust 2014-2 XA IO† | | 1.00% | #(b) | 1/20/2041 | | | 741 | | | | 6,570 | |
| LSTAR Commercial Mortgage Trust 2015-3 A2† | | 2.729% | #(b) | 4/20/2048 | | | 228 | | | | 227,608 | |
| 46 | See Notes to Financial Statements. | |
Schedule of Investments (continued)
EMERGING MARKETS CURRENCY FUND December 31, 2017
| Investments | | Interest
Rate | | Maturity
Date | | Principal
Amount
(000) | | | Fair
Value | |
| NON-AGENCY COMMERCIAL MORTGAGE-BACKED SECURITIES (continued) | | | | | | | | | |
| Morgan Stanley Bank of America Merrill Lynch Trust 2013-C12 A2 | | 3.001% | | 10/15/2046 | | $ | 40 | | | $ | 40,197 | |
| Morgan Stanley Bank of America Merrill Lynch Trust 2015-C23 XA IO | | 0.732% | #(b) | 7/15/2050 | | | 9,767 | | | | 327,792 | |
| Morgan Stanley Bank of America Merrill Lynch Trust 2016-C31 XA IO | | 1.456% | #(b) | 11/15/2049 | | | 3,609 | | | | 324,696 | |
| Morgan Stanley Capital Barclays Bank Trust 2016-MART B† | | 2.48% | | 9/13/2031 | | | 250 | | | | 245,757 | |
| Morgan Stanley Capital Barclays Bank Trust 2016-MART C† | | 2.817% | | 9/13/2031 | | | 500 | | | | 493,070 | |
| Morgan Stanley Capital Barclays Bank Trust 2016-MART XCP IO† | | 0.316% | #(b) | 9/13/2031 | | | 124,205 | | | | 369,510 | |
| Morgan Stanley Capital I Trust 2012-STAR A1† | | 2.084% | | 8/5/2034 | | | 516 | | | | 507,611 | |
| Morgan Stanley Capital I Trust 2012-STAR B† | | 3.451% | | 8/5/2034 | | | 100 | | | | 99,359 | |
| Morgan Stanley Capital I Trust 2014-CPT XA IO† | | 0.089% | #(b) | 7/13/2029 | | | 100,000 | | | | 403,000 | |
| Morgan Stanley Capital I Trust 2014-MP A† | | 3.469% | | 8/11/2033 | | | 100 | | | | 102,451 | |
| Morgan Stanley Capital I Trust 2016-UB11 XA IO | | 1.664% | #(b) | 8/15/2049 | | | 1,100 | | | | 106,714 | |
| Morgan Stanley Capital I Trust 2016-UB11 XB IO | | 0.995% | #(b) | 8/15/2049 | | | 1,538 | | | | 109,531 | |
| MSCG Trust 2015-ALDR A1† | | 2.612% | | 6/7/2035 | | | 166 | | | | 162,631 | |
| MSCG Trust 2016-SNR A† | | 3.348% | #(b) | 11/15/2034 | | | 687 | | | | 683,587 | |
| MSCG Trust 2016-SNR B† | | 4.181% | | 11/15/2034 | | | 332 | | | | 332,971 | |
| MSCG Trust 2016-SNR C† | | 5.205% | | 11/15/2034 | | | 213 | | | | 216,623 | |
| Prima Capital CRE Securization 2006-1 | | 2.55% | | 8/26/2049 | | | 1,526 | | | | 1,530,340 | |
| Vornado DP LLC Trust 2010-VNO A1† | | 2.97% | | 9/13/2028 | | | 316 | | | | 319,431 | |
| Wells Fargo Commercial Mortgage Trust 2010-C1 C† | | 5.598% | #(b) | 11/15/2043 | | | 250 | | | | 262,403 | |
| Wells Fargo Commercial Mortgage Trust 2015-C29 XA IO | | 0.736% | #(b) | 6/15/2048 | | | 2,440 | | | | 95,720 | |
| Wells Fargo Commercial Mortgage Trust 2015-C29 XB IO | | 0.018% | #(b) | 6/15/2048 | | | 40,645 | | | | 132,222 | |
| Wells Fargo Commercial Mortgage Trust 2015-LC20 XB IO | | 0.475% | #(b) | 4/15/2050 | | | 24,333 | | | | 760,718 | |
| Wells Fargo Commercial Mortgage Trust 2015-SG1 XA IO | | 0.784% | #(b) | 9/15/2048 | | | 2,560 | | | | 110,067 | |
| Wells Fargo Commercial Mortgage Trust 2016-LC24 XB IO | | 1.012% | #(b) | 10/15/2049 | | | 4,661 | | | | 350,319 | |
| WF-RBS Commercial Mortgage Trust 2011-C4 A3† | | 4.394% | | 6/15/2044 | | | 15 | | | | 15,052 | |
| WF-RBS Commercial Mortgage Trust 2012-C8 A2 | | 1.881% | | 8/15/2045 | | | – | (h) | | | 69 | |
| WF-RBS Commercial Mortgage Trust 2014-C20 XA IO | | 1.129% | #(b) | 5/15/2047 | | | 3,752 | | | | 173,114 | |
| | See Notes to Financial Statements. | 47 |
Schedule of Investments (continued)
EMERGING MARKETS CURRENCY FUND December 31, 2017
| Investments | | Interest
Rate | | Maturity
Date | | Principal
Amount
(000) | | | Fair
Value | |
| NON-AGENCY COMMERCIAL MORTGAGE-BACKED SECURITIES (continued) | | | | | | | | | | |
| WF-RBS Commercial Mortgage Trust 2014-C20 XB IO | | 0.571% | #(b) | 5/15/2047 | | $ | 765 | | | $ | 26,541 | |
| WF-RBS Commercial Mortgage Trust 2014-C21 XB IO | | 0.605% | #(b) | 8/15/2047 | | | 15,000 | | | | 577,431 | |
| WF-RBS Commercial Mortgage Trust 2014-C22 XA IO | | 0.911% | #(b) | 9/15/2057 | | | 12,624 | | | | 544,094 | |
| WF-RBS Commercial Mortgage Trust 2014-C22 XB IO | | 0.452% | #(b) | 9/15/2057 | | | 14,000 | | | | 363,542 | |
| WF-RBS Commercial Mortgage Trust 2014-C23 XA IO | | 0.661% | #(b) | 10/15/2057 | | | 7,725 | | | | 247,085 | |
| WF-RBS Commercial Mortgage Trust 2014-C23 XB IO | | 0.307% | #(b) | 10/15/2057 | | | 5,000 | | | | 83,144 | |
| Total Non-Agency Commercial Mortgage-Backed Securities (cost $40,710,006) | | | | | | | | 40,321,081 | |
| Total Long-Term Investments (cost $189,922,127) | | | | | | | | | | | 187,955,286 | |
| | | | | | | | | | | | | |
| SHORT-TERM INVESTMENTS 7.08% | | | | | | | | | | | | |
| | | | | | | | | | | | | |
| COMMERCIAL PAPER 5.48% | | | | | | | | | | | | |
| | | | | | | | | | | | | |
| Beverages 0.46% | | | | | | | | | | | | |
| Molson Coors Brewing Co. | | 1.678% | | 1/8/2018 | | | 1,000 | | | | 999,725 | |
| | | | | | | | | | | | | |
| Chemicals 0.45% | | | | | | | | | | | | |
| Potash Corp. of Saskatchewan, Inc. | | 1.646% | | 1/26/2018 | | | 1,000 | | | | 998,920 | |
| | | | | | | | | | | | | |
| Electric: Integrated 0.46% | | | | | | | | | | | | |
| Dominion Resources, Inc. | | 1.535% | | 1/4/2018 | | | 1,000 | | | | 999,916 | |
| | | | | | | | | | | | | |
| Gas Distribution 1.83% | | | | | | | | | | | | |
| Enable Midstream | | 2.49% | | 1/16/2018 | | | 1,000 | | | | 999,047 | |
| Enbridge Energy Partners LP | | 2.235% | | 1/16/2018 | | | 1,000 | | | | 999,145 | |
| Energy Transfer Partners LP | | 2.336% | | 1/11/2018 | | | 1,000 | | | | 999,425 | |
| ONEOK, Inc. | | 2.233% | | 1/8/2018 | | | 1,000 | | | | 999,633 | |
| Total | | | | | | | | | | | 3,997,250 | |
| | | | | | | | | | | | | |
| Medical Products 0.46% | | | | | | | | | | | | |
| Boston Scientific Corp. | | 1.777% | | 1/3/2018 | | | 1,000 | | | | 999,952 | |
| | | | | | | | | | | | | |
| Non-Electric Utilities 0.45% | | | | | | | | | | | | |
| NiSource, Inc. | | 2.183% | | 1/16/2018 | | | 1,000 | | | | 999,164 | |
| | | | | | | | | | | | | |
| Rail 0.46% | | | | | | | | | | | | |
| Kansas City Southern | | 1.81% | | 1/8/2018 | | | 1,000 | | | | 999,703 | |
| 48 | See Notes to Financial Statements. | |
Schedule of Investments (continued)
EMERGING MARKETS CURRENCY FUND December 31, 2017
| Investments | | Interest
Rate | | Maturity
Date | | Principal
Amount
(000) | | | Fair
Value | |
| Recreation & Travel 0.46% | | | | | | | | | | | | |
| Carnival Corp. | | 2.10% | | 1/4/2018 | | $ | 1,000 | | | $ | 999,885 | |
| | | | | | | | | | | | | |
| Support: Services 0.45% | | | | | | | | | | | | |
| EQUIFAX, Inc. | | 2.235% | | 1/29/2018 | | | 1,000 | | | | 998,350 | |
| Total Commercial Paper (cost $11,992,201) | | | | | | | | | | | 11,992,865 | |
| | | | | | | | | | | | | |
| CORPORATE BONDS 1.60% | | | | | | | | | | | | |
| | | | | | | | | | | | | |
| Cable & Satellite Television 0.47% | | | | | | | | | | | | |
| Time Warner Cable LLC | | 6.75% | | 7/1/2018 | | | 1,000 | | | | 1,022,258 | |
| | | | | | | | | | | | | |
| Consumer/Commercial/Lease Financing 0.10% | | | | | | | | | | | | |
| Air Lease Corp. | | 2.125% | | 1/15/2018 | | | 230 | | | | 229,987 | |
| | | | | | | | | | | | | |
| Gas Distribution 0.57% | | | | | | | | | | | | |
| Kinder Morgan Energy Partners LP | | 5.95% | | 2/15/2018 | | | 1,000 | | | | 1,004,680 | |
| Kinder Morgan Finance Co. LLC† | | 6.00% | | 1/15/2018 | | | 250 | | | | 250,441 | |
| Total | | | | | | | | | | | 1,255,121 | |
| | | | | | | | | | | | | |
| Tobacco 0.46% | | | | | | | | | | | | |
| Imperial Brands Finance plc (United Kingdom)†(c) | | 2.05% | | 7/20/2018 | | | 1,000 | | | | 999,230 | |
| Total Corporate Bonds (cost $3,510,247) | | | | | | | | | | | 3,506,596 | |
| Total Short-Term Investments (cost $15,502,448) | | | | | | | | | | | 15,499,461 | |
| Total Investments in Securities 93.00% (cost $205,424,575) | | | | | | | | | | | 203,454,747 | |
| Cash, Foreign Cash and Other Assets in Excess of Liabilities(i) 7.00% | | | | | | | | | | | 15,317,383 | |
| Net Assets 100.00% | | | | | | | | | | $ | 218,772,130 | |
| BADLAR | Banco de la Republica Argentina |
| IO | Interest Only |
| LIBOR | London Interbank Offered Rate |
| ARS | Argentine Peso |
| EGP | Egyptian pound |
| NGN | Nigerian naira |
| | See Notes to Financial Statements. | 49 |
Schedule of Investments (continued)
EMERGING MARKETS CURRENCY FUND December 31, 2017
| † | | Security was purchased pursuant to Rule 144A under the Securities Act of 1933 and, unless registered under such Act or exempted from registration, may only be resold to qualified institutional buyers. |
| # | | Variable rate security. The interest rate represents the rate in effect at December 31, 2017. |
| (a) | | Level 3 Investment as described in Note 2(q) in the Notes to Financials. Security valued utilizing third party pricing information without adjustment. Such valuations are based on unobservable inputs. A significant change in third party information could result in a significantly lower or higher value of such Level 3 investments. |
| (b) | | Interest rate is based on the weighted average interest rates of the underlying mortgages within the mortgage pool. |
| (c) | | Foreign security traded in U.S. dollars. |
| (d) | | Floating Rate Loans in which the Fund invests generally pay interest at rates which are periodically re-determined at a margin above the London Interbank Offered Rate (“LIBOR”) or the prime rate offered by major U.S. banks. The rate shown is the rate in effect at December 31, 2017. |
| (e) | | Floating Rate Loans categorized as Level 3 are valued based on a single quotation obtained from a dealer. Accounting principles generally accepted in the United States of America do not require the Fund to create quantitative unobservable inputs that were not developed by the Fund. Therefore, the Fund does not have access to unobservable inputs and cannot disclose such inputs in the valuation. |
| (f) | | Interest rate to be determined. |
| (g) | | Investment in non-U.S. dollar denominated securities. |
| (h) | | Amount is less than $1,000. |
| (i) | | Cash, Foreign Cash and Other Assets in Excess of Liabilities include net unrealized appreciation/depreciation on forward foreign currency exchange contracts, futures contracts and swaps as follows: |
Open Forward Foreign Currency Exchange Contracts at December 31, 2017:
Forward
Foreign
Currency
Exchange
Contracts | | Transaction
Type | | Counterparty | | Expiration
Date | | Foreign
Currency | | | U.S. $
Cost on
Origination
Date | | | U.S. $
Current
Value | | | Unrealized
Appreciation | |
| Chilean peso | | Buy | | BNP Paribas S.A. | | 2/14/2018 | | | 3,410,000,000 | | | $ | 5,400,206 | | | $ | 5,540,388 | | | $ | 140,182 | |
| Chilean peso | | Buy | | State Street Bank and Trust | | 3/12/2018 | | | 4,578,513,000 | | | | 7,063,426 | | | | 7,436,439 | | | | 373,013 | |
| Chinese yuan renminbi | | Buy | | Bank of America | | 2/14/2018 | | | 21,800,000 | | | | 3,254,844 | | | | 3,338,092 | | | | 83,248 | |
| Chinese yuan renminbi | | Buy | | Bank of America | | 3/12/2018 | | | 21,298,000 | | | | 3,192,917 | | | | 3,254,686 | | | | 61,769 | |
| Chinese yuan renminbi | | Buy | | Barclays Bank plc | | 1/12/2018 | | | 32,500,000 | | | | 4,877,683 | | | | 4,989,961 | | | | 112,278 | |
| Chinese yuan renminbi | | Buy | | J.P. Morgan | | 1/12/2018 | | | 15,900,000 | | | | 2,384,595 | | | | 2,441,242 | | | | 56,647 | |
| Colombian peso | | Buy | | BNP Paribas S.A. | | 3/12/2018 | | | 16,531,687,000 | | | | 5,482,263 | | | | 5,506,646 | | | | 24,383 | |
| Colombian peso | | Buy | | Citibank | | 1/12/2018 | | | 587,000,000 | | | | 192,254 | | | | 196,523 | | | | 4,269 | |
| Colombian peso | | Buy | | State Street Bank and Trust | | 2/14/2018 | | | 11,000,000,000 | | | | 3,642,987 | | | | 3,671,789 | | | | 28,802 | |
| Czech koruna | | Buy | | Barclays Bank plc | | 2/14/2018 | | | 94,535,000 | | | | 4,381,700 | | | | 4,449,128 | | | | 67,428 | |
| Czech koruna | | Buy | | BNP Paribas S.A. | | 1/12/2018 | | | 2,000,000 | | | | 91,180 | | | | 93,973 | | | | 2,793 | |
| Czech koruna | | Buy | | Citibank | | 1/12/2018 | | | 84,000,000 | | | | 3,872,604 | | | | 3,946,879 | | | | 74,275 | |
| Czech koruna | | Buy | | Standard Chartered Bank | | 3/12/2018 | | | 42,846,000 | | | | 1,997,910 | | | | 2,018,789 | | | | 20,879 | |
| Hungarian forint | | Buy | | Bank of America | | 2/14/2018 | | | 310,000,000 | | | | 1,161,431 | | | | 1,199,545 | | | | 38,114 | |
| Hungarian forint | | Buy | | Citibank | | 1/12/2018 | | | 468,400,000 | | | | 1,766,868 | | | | 1,809,598 | | | | 42,730 | |
| Hungarian forint | | Buy | | Goldman Sachs | | 1/12/2018 | | | 150,000,000 | | | | 577,236 | | | | 579,504 | | | | 2,268 | |
| Hungarian forint | | Buy | | Goldman Sachs | | 2/14/2018 | | | 905,000,000 | | | | 3,427,791 | | | | 3,501,897 | | | | 74,106 | |
| Indian rupee | | Buy | | Bank of America | | 2/14/2018 | | | 167,000,000 | | | | 2,530,495 | | | | 2,607,367 | | | | 76,872 | |
| Indian rupee | | Buy | | Barclays Bank plc | | 3/12/2018 | | | 861,526,000 | | | | 13,233,683 | | | | 13,412,456 | | | | 178,773 | |
| Indonesian rupiah | | Buy | | J.P. Morgan | | 1/12/2018 | | | 71,200,000,000 | | | | 5,211,154 | | | | 5,261,004 | | | | 49,850 | |
| 50 | See Notes to Financial Statements. |
Schedule of Investments (continued)
EMERGING MARKETS CURRENCY FUND December 31, 2017
Open Forward Foreign Currency Exchange Contracts at December 31, 2017 (continued):
Forward
Foreign
Currency
Exchange
Contracts | | Transaction
Type | | Counterparty | | Expiration
Date | | Foreign
Currency | | | U.S. $
Cost on
Origination
Date | | | U.S. $
Current
Value | | | Unrealized
Appreciation | |
| Indonesian rupiah | | Buy | | J.P. Morgan | | 1/12/2018 | | | 1,300,000,000 | | | $ | 94,946 | | | $ | 96,058 | | | $ | 1,112 | |
| Indonesian rupiah | | Buy | | Standard Chartered Bank | | 3/12/2018 | | | 79,739,489,000 | | | | 5,847,976 | | | | 5,868,302 | | | | 20,326 | |
| Israeli new shekel | | Buy | | Barclays Bank plc | | 1/12/2018 | | | 10,130,000 | | | | 2,908,928 | | | | 2,912,191 | | | | 3,263 | |
| Israeli new shekel | | Buy | | Goldman Sachs | | 1/12/2018 | | | 15,310,000 | | | | 4,364,094 | | | | 4,401,347 | | | | 37,253 | |
| Israeli new shekel | | Buy | | UBS AG | | 1/12/2018 | | | 1,844,000 | | | | 525,087 | | | | 530,116 | | | | 5,029 | |
| Malaysian ringgit | | Buy | | Barclays Bank plc | | 1/12/2018 | | | 36,000,000 | | | | 8,474,576 | | | | 8,859,358 | | | | 384,782 | |
| Malaysian ringgit | | Buy | | Barclays Bank plc | | 1/12/2018 | | | 310,000 | | | | 73,460 | | | | 76,289 | | | | 2,829 | |
| Malaysian ringgit | | Buy | | State Street Bank and Trust | | 2/14/2018 | | | 11,800,000 | | | | 2,819,594 | | | | 2,899,848 | | | �� | 80,254 | |
| Peruvian Nuevo sol | | Buy | | BNP Paribas S.A. | | 1/12/2018 | | | 11,440,000 | | | | 3,490,359 | | | | 3,526,661 | | | | 36,302 | |
| Peruvian Nuevo sol | | Buy | | Citibank | | 1/12/2018 | | | 311,000 | | | | 95,340 | | | | 95,873 | | | | 533 | |
| Peruvian Nuevo sol | | Buy | | Citibank | | 2/14/2018 | | | 3,850,000 | | | | 1,180,294 | | | | 1,185,182 | | | | 4,888 | |
| Peruvian Nuevo sol | | Buy | | Goldman Sachs | | 2/14/2018 | | | 13,600,000 | | | | 4,176,407 | | | | 4,186,617 | | | | 10,210 | |
| Philippine peso | | Buy | | Goldman Sachs | | 3/12/2018 | | | 182,865,000 | | | | 3,577,241 | | | | 3,655,157 | | | | 77,916 | |
| Philippine peso | | Buy | | J.P. Morgan | | 1/12/2018 | | | 379,000,000 | | | | 7,297,584 | | | | 7,590,393 | | | | 292,809 | |
| Polish zloty | | Buy | | Barclays Bank plc | | 3/12/2018 | | | 6,633,000 | | | | 1,859,069 | | | | 1,905,816 | | | | 46,747 | |
| Polish zloty | | Buy | | Barclays Bank plc | | 2/14/2018 | | | 15,830,000 | | | | 4,405,064 | | | | 4,547,803 | | | | 142,739 | |
| Polish zloty | | Buy | | State Street Bank and Trust | | 1/12/2018 | | | 5,000,000 | | | | 1,385,595 | | | | 1,436,397 | | | | 50,802 | |
| Polish zloty | | Buy | | State Street Bank and Trust | | 1/12/2018 | | | 440,000 | | | | 121,222 | | | | 126,403 | | | | 5,181 | |
| Polish zloty | | Buy | | State Street Bank and Trust | | 2/14/2018 | | | 20,860,000 | | | | 5,782,176 | | | | 5,992,872 | | | | 210,696 | |
| Romanian new leu | | Buy | | BNP Paribas S.A. | | 1/12/2018 | | | 470,000 | | | | 119,273 | | | | 120,881 | | | | 1,608 | |
| Romanian new leu | | Buy | | Deutsche Bank AG | | 2/14/2018 | | | 6,660,000 | | | | 1,685,109 | | | | 1,711,346 | | | | 26,237 | |
| Romanian new leu | | Buy | | Goldman Sachs | | 1/12/2018 | | | 380,000 | | | | 97,439 | | | | 97,734 | | | | 295 | |
| Russian ruble | | Buy | | Barclays Bank plc | | 1/12/2018 | | | 5,574,000 | | | | 95,122 | | | | 96,668 | | | | 1,546 | |
| Russian ruble | | Buy | | Barclays Bank plc | | 2/14/2018 | | | 190,000,000 | | | | 3,148,161 | | | | 3,273,480 | | | | 125,319 | |
| Russian ruble | | Buy | | Morgan Stanley | | 1/12/2018 | | | 299,000,000 | | | | 5,088,903 | | | | 5,185,463 | | | | 96,560 | |
| Russian ruble | | Buy | | Morgan Stanley | | 3/12/2018 | | | 322,609,000 | | | | 5,385,191 | | | | 5,538,426 | | | | 153,235 | |
| Singapore dollar | | Buy | | Standard Chartered Bank | | 2/14/2018 | | | 8,020,000 | | | | 5,928,103 | | | | 6,000,272 | | | | 72,169 | |
| South African rand | | Buy | | BNP Paribas S.A. | | 2/14/2018 | | | 37,400,000 | | | | 2,559,889 | | | | 3,003,769 | | | | 443,880 | |
| South African rand | | Buy | | Goldman Sachs | | 1/12/2018 | | | 17,000,000 | | | | 1,238,557 | | | | 1,372,104 | | | | 133,547 | |
| South African rand | | Buy | | Goldman Sachs | | 3/12/2018 | | | 52,281,000 | | | | 3,774,593 | | | | 4,183,041 | | | | 408,448 | |
| South Korean won | | Buy | | Barclays Bank plc | | 3/12/2018 | | | 3,353,000,000 | | | | 3,141,602 | | | | 3,144,254 | | | | 2,652 | |
| South Korean won | | Buy | | J.P. Morgan | | 3/12/2018 | | | 1,791,729,000 | | | | 1,648,203 | | | | 1,680,182 | | | | 31,979 | |
| Taiwan dollar | | Buy | | Bank of America | | 1/12/2018 | | | 24,600,000 | | | | 811,546 | | | | 830,952 | | | | 19,406 | |
| | See Notes to Financial Statements. | 51 |
Schedule of Investments (continued)
EMERGING MARKETS CURRENCY FUND December 31, 2017
Open Forward Foreign Currency Exchange Contracts at December 31, 2017 (continued):
Forward
Foreign
Currency
Exchange
Contracts | | Transaction
Type | | Counterparty | | Expiration
Date | | Foreign
Currency | | | U.S. $
Cost on
Origination
Date | | | U.S. $
Current
Value | | Unrealized
Appreciation | |
| Thai baht | | Buy | | Bank of America | | 1/12/2018 | | | 57,210,000 | | | $ | 1,729,548 | | | $ | 1,755,896 | | | $ | 26,348 | |
| Thai baht | | Buy | | J.P. Morgan | | 1/12/2018 | | | 141,410,000 | | | | 4,278,333 | | | | 4,340,173 | | | | 61,840 | |
| Turkish lira | | Buy | | Bank of America | | 3/12/2018 | | | 18,467,000 | | | | 4,684,916 | | | | 4,772,947 | | | | 88,031 | |
| Turkish lira | | Buy | | Citibank | | 1/12/2018 | | | 470,000 | | | | 121,095 | | | | 123,620 | | | | 2,525 | |
| Turkish lira | | Buy | | Goldman Sachs | | 2/14/2018 | | | 10,500,000 | | | | 2,623,911 | | | | 2,734,761 | | | | 110,850 | |
| Brazilian real | | Sell | | State Street Bank and Trust | | 1/12/2018 | | | 574,000 | | | | 174,230 | | | | 172,868 | | | | 1,362 | |
| Chilean peso | | Sell | | Standard Chartered Bank | | 2/14/2018 | | | 380,300,000 | | | | 618,374 | | | | 617,891 | | | | 483 | |
| Colombian peso | | Sell | | State Street Bank and Trust | | 1/12/2018 | | | 541,500,000 | | | | 181,772 | | | | 181,290 | | | | 482 | |
| Czech koruna | | Sell | | Goldman Sachs | | 2/14/2018 | | | 4,023,000 | | | | 189,578 | | | | 189,336 | | | | 242 | |
| Japanese yen | | Sell | | Barclays Bank plc | | 2/14/2018 | | | 245,300,000 | | | | 2,199,296 | | | | 2,181,309 | | | | 17,987 | |
| Mexican peso | | Sell | | State Street Bank and Trust | | 1/12/2018 | | | 1,663,000 | | | | 86,590 | | | | 84,435 | | | | 2,155 | |
| Peruvian Nuevo sol | | Sell | | State Street Bank and Trust | | 1/12/2018 | | | 284,000 | | | | 87,627 | | | | 87,550 | | | | 77 | |
| Polish zloty | | Sell | | Goldman Sachs | | 1/12/2018 | | | 1,013,000 | | | | 291,584 | | | | 291,014 | | | | 570 | |
| Russian ruble | | Sell | | State Street Bank and Trust | | 2/14/2018 | | | 89,670,000 | | | | 1,549,775 | | | | 1,544,910 | | | | 4,865 | |
| Taiwan dollar | | Sell | | Morgan Stanley | | 1/12/2018 | | | 20,456,000 | | | | 691,158 | | | | 690,973 | | | | 185 | |
| Thai baht | | Sell | | State Street Bank and Trust | | 1/12/2018 | | | 2,145,000 | | | | 65,838 | | | | 65,835 | | | | 3 | |
| Thai baht | | Sell | | State Street Bank and Trust | | 1/12/2018 | | | 2,112,000 | | | | 65,018 | | | | 64,822 | | | | 196 | |
| Thai baht | | Sell | | UBS AG | | 1/12/2018 | | | 37,540,000 | | | | 1,152,234 | | | | 1,152,182 | | | | 52 | |
| Unrealized Appreciation on Forward Foreign Currency Exchange Contracts | | | | | | | | | | | | | | $ | 4,761,484 | |
Forward
Foreign
Currency
Exchange
Contracts | | Transaction
Type | | Counterparty | | Expiration
Date | | Foreign
Currency | | U.S. $
Cost on
Origination
Date | | U.S. $
Current
Value | | Unrealized
Depreciation | |
| Argentine peso | | Buy | | BNP Paribas S.A. | | 1/19/2018 | | | 101,500,000 | | | $ | 5,528,322 | | | $ | 5,403,247 | | | $ | (125,075 | ) |
| Argentine peso | | Buy | | BNP Paribas S.A. | | 3/12/2018 | | | 14,114,000 | | | | 732,434 | | | | 730,728 | | | | (1,706 | ) |
| Argentine peso | | Buy | | J.P. Morgan | | 2/14/2018 | | | 50,000,000 | | | | 2,685,140 | | | | 2,624,918 | | | | (60,222 | ) |
| Argentine peso | | Buy | | UBS AG | | 3/12/2018 | | | 28,017,000 | | | | 1,532,240 | | | | 1,450,531 | | | | (81,709 | ) |
| Brazilian real | | Buy | | Barclays Bank plc | | 1/12/2018 | | | 9,400,000 | | | | 2,961,805 | | | | 2,830,945 | | | | (130,860 | ) |
| Brazilian real | | Buy | | BNP Paribas S.A. | | 1/12/2018 | | | 865,000 | | | | 261,772 | | | | 260,507 | | | | (1,265 | ) |
| Brazilian real | | Buy | | Morgan Stanley | | 1/12/2018 | | | 384,000 | | | | 120,384 | | | | 115,647 | | | | (4,737 | ) |
| Brazilian real | | Buy | | Morgan Stanley | | 1/12/2018 | | | 400,000 | | | | 121,851 | | | | 120,466 | | | | (1,385 | ) |
| 52 | See Notes to Financial Statements. |
Schedule of Investments (continued)
EMERGING MARKETS CURRENCY FUND December 31, 2017
Open Forward Foreign Currency Exchange Contracts at December 31, 2017 (continued):
Forward
Foreign
Currency
Exchange
Contracts | | Transaction
Type | | Counterparty | | Expiration
Date | | Foreign
Currency | | U.S. $
Cost on
Origination
Date | | U.S. $
Current
Value | | Unrealized
Depreciation | |
| Brazilian real | | Buy | | State Street Bank and Trust | | 3/12/2018 | | | 40,778,000 | | | $ | 12,484,845 | | | $ | 12,202,148 | | | $ | (282,697 | ) |
| Chinese yuan renminbi | | Buy | | Standard Chartered Bank | | 3/12/2018 | | | 12,443,000 | | | | 1,903,065 | | | | 1,901,496 | | | | $(1,569 | ) |
| Colombian peso | | Buy | | Barclays Bank plc | | 1/12/2018 | | | 9,100,000,000 | | | | 3,061,757 | | | | 3,046,604 | | | | (15,153 | ) |
| Colombian peso | | Buy | | BNP Paribas S.A. | | 1/12/2018 | | | 214,300,000 | | | | 72,231 | | | | 71,746 | | | | (485 | ) |
| euro | | Buy | | State Street Bank and Trust | | 3/12/2018 | | | 103,000 | | | | 124,320 | | | | 124,080 | | | | (240 | ) |
| Israeli new shekel | | Buy | | Bank of America | | 4/12/2018 | | | 912,000 | | | | 264,112 | | | | 263,213 | | | | (899 | ) |
| Mexican peso | | Buy | | Bank of America | | 3/12/2018 | | | 39,700,000 | | | | 1,994,772 | | | | 1,994,524 | | | | (248 | ) |
| Mexican peso | | Buy | | Barclays Bank plc | | 3/12/2018 | | | 51,840,000 | | | | 2,692,847 | | | | 2,604,436 | | | | (88,411 | ) |
| Mexican peso | | Buy | | J.P. Morgan | | 1/12/2018 | | | 127,800,000 | | | | 6,727,761 | | | | 6,488,780 | | | | (238,981 | ) |
| Mexican peso | | Buy | | Standard Chartered Bank | | 1/12/2018 | | | 1,846,000 | | | | 94,638 | | | | 93,727 | | | | (911 | ) |
| Peruvian Nuevo sol | | Buy | | J.P. Morgan | | 3/12/2018 | | | 14,008,000 | | | | 4,314,402 | | | | 4,307,846 | | | | (6,556 | ) |
| Romanian new leu | | Buy | | Citibank | | 1/12/2018 | | | 12,000,000 | | | | 3,098,533 | | | | 3,086,325 | | | | (12,208 | ) |
| Singapore dollar | | Buy | | Standard Chartered Bank | | 2/14/2018 | | | 4,409,000 | | | | 3,302,112 | | | | 3,298,653 | | | | (3,459 | ) |
| South African rand | | Buy | | Deutsche Bank AG | | 3/12/2018 | | | 7,469,000 | | | | 597,990 | | | | 597,601 | | | | (389 | ) |
| Turkish lira | | Buy | | Barclays Bank plc | | 1/12/2018 | | | 18,230,000 | | | | 4,844,005 | | | | 4,794,895 | | | | (49,110 | ) |
| Turkish lira | | Buy | | Citibank | | 1/12/2018 | | | 4,600,000 | | | | 1,238,482 | | | | 1,209,902 | | | | (28,580 | ) |
| Turkish lira | | Buy | | Morgan Stanley | | 3/12/2018 | | | 2,394,000 | | | | 619,437 | | | | 618,749 | | | | (688 | ) |
| Brazilian real | | Sell | | State Street Bank and Trust | | 1/12/2018 | | | 3,269,000 | | | | 983,898 | | | | 984,506 | | | | (608 | ) |
| Chilean peso | | Sell | | BNP Paribas S.A. | | 2/14/2018 | | | 125,384,000 | | | | 196,960 | | | | 203,717 | | | | (6,757 | ) |
| Chinese yuan renminbi | | Sell | | Standard Chartered Bank | | 1/12/2018 | | | 1,147,000 | | | | 173,378 | | | | 176,107 | | | | (2,729 | ) |
| Colombian peso | | Sell | | Goldman Sachs | | 1/12/2018 | | | 390,861,000 | | | | 129,759 | | | | 130,857 | | | | (1,098 | ) |
| Czech koruna | | Sell | | J.P. Morgan | | 1/12/2018 | | | 1,878,000 | | | | 86,599 | | | | 88,241 | | | | (1,642 | ) |
| euro | | Sell | | J.P. Morgan | | 3/12/2018 | | | 7,377,000 | | | | 8,751,705 | | | | 8,886,757 | | | | (135,052 | ) |
| Hungarian forint | | Sell | | J.P. Morgan | | 1/12/2018 | | | 23,070,000 | | | | 86,529 | | | | 89,128 | | | | (2,599 | ) |
| Indian rupee | | Sell | | State Street Bank and Trust | | 3/12/2018 | | | 14,013,000 | | | | 216,839 | | | | 218,158 | | | | (1,319 | ) |
| Indonesian rupiah | | Sell | | J.P. Morgan | | 3/12/2018 | | | 10,703,000,000 | | | | 787,449 | | | | 787,670 | | | | (221 | ) |
| Indonesian rupiah | | Sell | | Morgan Stanley | | 1/12/2018 | | | 1,474,017,000 | | | | 108,369 | | | | 108,916 | | | | (547 | ) |
| Israeli new shekel | | Sell | | Bank of America | | 1/12/2018 | | | 305,000 | | | | 86,895 | | | | 87,682 | | | | (787 | ) |
| Japanese yen | | Sell | | State Street Bank and Trust | | 2/14/2018 | | | 246,000,000 | | | | 2,179,942 | | | | 2,187,534 | | | | (7,592 | ) |
| Malaysian ringgit | | Sell | | Barclays Bank plc | | 1/12/2018 | | | 268,000 | | | | 65,838 | | | | 65,953 | | | | (115 | ) |
| Malaysian ringgit | | Sell | | Barclays Bank plc | | 1/12/2018 | | | 10,000,000 | | | | 2,460,690 | | | | 2,460,933 | | | | (243 | ) |
| | See Notes to Financial Statements. | 53 |
Schedule of Investments (continued)
EMERGING MARKETS CURRENCY FUND December 31, 2017
Open Forward Foreign Currency Exchange Contracts at December 31, 2017 (continued):
Forward
Foreign
Currency
Exchange
Contracts | | Transaction
Type | | Counterparty | | Expiration
Date | | Foreign
Currency | | U.S. $
Cost on
Origination
Date | | U.S. $
Current
Value | | Unrealized
Depreciation | |
| Malaysian ringgit | | Sell | | State Street Bank and Trust | | 1/12/2018 | | | 6,640,000 | | | $ | 1,597,882 | | | $ | 1,634,059 | | | $ | (36,177 | ) |
| Malaysian ringgit | | Sell | | State Street Bank and Trust | | 1/12/2018 | | | 269,000 | | | | 65,786 | | | | 66,199 | | | | (413 | ) |
| Malaysian ringgit | | Sell | | State Street Bank and Trust | | 1/12/2018 | | | 355,000 | | | | 87,202 | | | | 87,363 | | | | (161 | ) |
| Philippine peso | | Sell | | Barclays Bank plc | | 1/12/2018 | | | 52,450,000 | | | | 1,050,344 | | | | 1,050,438 | | | | (94 | ) |
| Philippine peso | | Sell | | BNP Paribas S.A. | | 1/12/2018 | | | 110,655,000 | | | | 2,168,770 | | | | 2,216,134 | | | | (47,364 | ) |
| Philippine peso | | Sell | | J.P. Morgan | | 1/12/2018 | | | 154,000,000 | | | | 2,987,449 | | | | 3,084,223 | | | | (96,774 | ) |
| Philippine peso | | Sell | | State Street Bank and Trust | | 1/12/2018 | | | 4,366,000 | | | | 87,061 | | | | 87,439 | | | | (378 | ) |
| Polish zloty | | Sell | | Barclays Bank plc | | 1/12/2018 | | | 310,000 | | | | 86,750 | | | | 89,057 | | | | (2,307 | ) |
| Polish zloty | | Sell | | State Street Bank and Trust | | 1/12/2018 | | | 308,000 | | | | 87,052 | | | | 88,482 | | | | (1,430 | ) |
| Romanian new leu | | Sell | | Bank of America | | 1/12/2018 | | | 257,000 | | | | 65,846 | | | | 66,099 | | | | (253 | ) |
| Romanian new leu | | Sell | | Bank of America | | 1/12/2018 | | | 254,000 | | | | 65,284 | | | | 65,327 | | | | (43 | ) |
| Romanian new leu | | Sell | | J.P. Morgan | | 1/12/2018 | | | 861,000 | | | | 220,835 | | | | 221,444 | | | | (609 | ) |
| Russian ruble | | Sell | | Barclays Bank plc | | 1/12/2018 | | | 8,935,000 | | | | 151,447 | | | | 154,957 | | | | (3,510 | ) |
| Singapore dollar | | Sell | | State Street Bank and Trust | | 2/14/2018 | | | 146,000 | | | | 108,329 | | | | 109,232 | | | | (903 | ) |
| Taiwan dollar | | Sell | | J.P. Morgan | | 1/12/2018 | | | 2,170,000 | | | | 72,076 | | | | 73,299 | | | | (1,223 | ) |
| Taiwan dollar | | Sell | | J.P. Morgan | | 3/12/2018 | | | 74,027,000 | | | | 2,514,077 | | | | 2,514,754 | | | | (677 | ) |
| Taiwan dollar | | Sell | | State Street Bank and Trust | | 1/12/2018 | | | 1,974,000 | | | | 65,970 | | | | 66,679 | | | | (709 | ) |
| Turkish lira | | Sell | | State Street Bank and Trust | | 1/12/2018 | | | 421,000 | | | | 108,148 | | | | 110,732 | | | | (2,584 | ) |
| Turkish lira | | Sell | | State Street Bank and Trust | | 1/12/2018 | | | 251,000 | | | | 65,141 | | | | 66,019 | | | | (878 | ) |
| Unrealized Depreciation on Forward Foreign Currency Exchange Contracts | | | | | | | | | | | | $ | (1,495,339 | ) |
Open Futures Contracts at December 31, 2017:
| Type | | Expiration | | Contracts | | Position | | Notional
Amount | | | Notional
Value | | Unrealized
Appreciation | |
| U.S. 5-Year Treasury Note | | March 2018 | | | 25 | | Short | | $ | (2,912,066 | ) | | $ | (2,904,101 | ) | | $ | 7,965 | |
| U.S. 2-Year Treasury Note | | March 2018 | | | 210 | | Short | | | (45,061,052 | ) | | | (44,962,969 | ) | | | 98,083 | |
| Unrealized Appreciation on Futures Contracts | | | | | | | | | | | | | | | | | $ | 106,048 | |
| 54 | See Notes to Financial Statements. |
Schedule of Investments (continued)
EMERGING MARKETS CURRENCY FUND December 31, 2017
Centrally Cleared Interest Rate Swap Contracts at December 31, 2017:
Central
Clearing Party* | | | Periodic
Payments
to be Made
By The Fund | | | Periodic
Payments
to be Received
By The Fund | | Termination
Date | | | Notional
Amount | | | | Notional
Value | | Unrealized
Appreciation | |
| Credit Suisse | | | 1.524% | | | 3-Month LIBOR Index | | 1/13/2021 | | | $38,000,000 | | | | $38,716,175 | | | $ | 716,175 | |
* Central Clearinghouse: Chicago Mercantile Exchange (CME)
The following is a summary of the inputs used as of December 31, 2017 in valuing the Fund’s investments carried at fair value(1):
| Investment Type(2)(3) | | Level 1 | | | Level 2 | | | Level 3 | | | Total | |
| Asset-Backed Securities | | | | | | | | | | | | | | | | |
| Other | | $ | – | | | $ | 13,361,100 | | | $ | 2,008,544 | | | $ | 15,369,644 | |
| Remaining Industries | | | – | | | | 19,491,726 | | | | – | | | | 19,491,726 | |
| Corporate Bonds | | | – | | | | 86,191,396 | | | | – | | | | 86,191,396 | |
| Floating Rate Loans | | | | | | | | | | | | | | | | |
| Aerospace/Defense | | | – | | | | – | | | | 66,708 | | | | 66,708 | |
| Gaming | | | – | | | | 998,813 | | | | – | | | | 998,813 | |
| Health Facilities | | | – | | | | – | | | | 25,206 | | | | 25,206 | |
| Packaging | | | – | | | | 939,844 | | | | – | | | | 939,844 | |
| Software/Services | | | – | | | | – | | | | 499,688 | | | | 499,688 | |
| Specialty Retail | | | – | | | | 880,477 | | | | – | | | | 880,477 | |
| Telecommunications: Wireless | | | – | | | | – | | | | 496,875 | | | | 496,875 | |
| Foreign Government Obligations | | | | | | | | | | | | | | | | |
| Nigeria | | | – | | | | – | | | | 2,405,046 | | | | 2,405,046 | |
| Remaining Countries | | | – | | | | 7,670,854 | | | | – | | | | 7,670,854 | |
| Government Sponsored Enterprises Collateralized Mortgage Obligations | | | – | | | | 7,464,963 | | | | – | | | | 7,464,963 | |
| Government Sponsored Enterprises Pass-Throughs | | | – | | | | 7,889,374 | | | | – | | | | 7,889,374 | |
| Municipal Bond | | | – | | | | 750,187 | | | | – | | | | 750,187 | |
| Non-Agency Commercial Mortgage-Backed Securities | | | – | | | | 37,382,706 | | | | 2,938,375 | | | | 40,321,081 | |
| Commercial Paper | | | – | | | | 11,992,865 | | | | – | | | | 11,992,865 | |
| Total | | $ | – | | | $ | 195,014,305 | | | $ | 8,440,442 | | | $ | 203,454,747 | |
| | See Notes to Financial Statements. | 55 |
Schedule of Investments (concluded)
EMERGING MARKETS CURRENCY FUND December 31, 2017
| Other Financial Instruments | | Level 1 | | | Level 2 | | | Level 3 | | | Total | |
| Forward Foreign Currency Exchange Contracts | | | | | | | | | | | | | | | | |
| Assets | | $ | – | | | $ | 4,761,484 | | | $ | – | | | $ | 4,761,484 | |
| Liabilities | | | – | | | | (1,495,339 | ) | | | – | | | | (1,495,339 | ) |
| Futures Contracts | | | | | | | | | | | | | | | | |
| Assets | | | 106,048 | | | | – | | | | – | | | | 106,048 | |
| Liabilities | | | – | | | | – | | | | – | | | | – | |
| Centrally Cleared Interest Rate Swap Contracts | | | | | | | | | | | | | | | | |
| Assets | | | – | | | | 716,175 | | | | – | | | | 716,175 | |
| Liabilities | | | – | | | | – | | | | – | | | | – | |
| Total | | $ | 106,048 | | | $ | 3,982,320 | | | $ | – | | | $ | 4,088,368 | |
| | (1) | Refer to Note 2(q) for a description of fair value measurements and the three-tier hierarchy of inputs. |
| | (2) | See Schedule of Investments for fair values in each industry and identification of foreign issuers and/or geography. The table above is presented by Investment Type. Industries are presented within an Investment Type should such Investment Type include securities classified as two or more levels within the three-tier fair value hierarchy. Each Level 3 security is identified on the Schedule of Investment along with the valuation technique utilized. |
| | (3) | There were no Level 1/Level 2 transfers during the fiscal year ended December 31, 2017. |
The following is a reconciliation of investments with unobservable inputs (Level 3) that were used in determining fair value:
| Investment Type | | Asset-Backed
Securities | | | Floating
Rate Loans | | | Foreign
Government
Obligations | | | Non-Agency
Commercial
Mortgage-
Backed
Securities | |
| Balance as of January 1, 2017 | | $ | 4,482,668 | | | $ | 4,578,505 | | | $ | – | | | $ | 7,268,149 | |
| Accrued Discounts (Premiums) | | | – | | | | 2,352 | | | | 96,818 | | | | (147,728 | ) |
| Realized Gain (Loss) | | | – | | | | 1,102 | | | | – | | | | 17,470 | |
| Change in Unrealized Appreciation (Depreciation) | | | 10,246 | | | | (3,003 | ) | | | 33,016 | | | | 76,518 | |
| Purchases | | | – | | | | 988,811 | | | | 2,275,212 | | | | 1,024,901 | |
| Sales | | | – | | | | (3,492,096 | ) | | | – | | | | (3,402,493 | ) |
| Net Transfers into Level 3 | | | – | | | | – | | | | – | | | | – | |
| Net Transfers out of Level 3 | | | (2,484,370 | ) | | | (987,194 | ) | | | – | | | $ | (1,898,442 | ) |
| Balance as of December 31, 2017 | | $ | 2,008,544 | | | $ | 1,088,477 | | | $ | 2,405,046 | | | $ | 2,938,375 | |
| Net change in unrealized appreciation/depreciation for period ended December 31, 2017 related to Level 3 investments held at December 31, 2017 | | $ | 10,247 | | | $ | 5,083 | | | $ | 33,016 | | | $ | 4,084 | |
| 56 | See Notes to Financial Statements. |
Schedule of Investments
EMERGING MARKETS LOCAL BOND FUND December 31, 2017
| | | | | | Principal | | | |
| | | Interest | | Maturity | Amount | | Fair | |
| Investments | | Rate | | Date | (000) | | Value | |
| FOREIGN CORPORATE BONDS(a) 10.41% | | | | | | | | | | |
| | | | | | | | | | | |
| Colombia 0.89% | | | | | | | | | | |
| | | | | | | | | | | |
| Electric: Power | | | | | | | | | | |
| Empresas Publicas de Medellin ESP† | | 7.625% | | 9/10/2024 | COP | 290,000 | | $ | 97,871 | |
| | | | | | | | | | | |
| Indonesia 1.35% | | | | | | | | | | |
| | | | | | | | | | | |
| Business Services | | | | | | | | | | |
| Jasa Marga Persero Tbk PT† | | 7.50% | | 12/11/2020 | IDR | 2,000,000 | | | 148,795 | |
| | | | | | | | | | | |
| Mexico 3.91% | | | | | | | | | | |
| | | | | | | | | | | |
| Electric: Power 0.87% | | | | | | | | | | |
| Comision Federal de Electricidad | | 7.96% | | 11/20/2020 | MXN | 1,900 | | | 95,601 | |
| | | | | | | | | | | |
| Media 0.58% | | | | | | | | | | |
| Grupo Televisa SAB | | 8.49% | | 5/11/2037 | MXN | 1,400 | | | 64,710 | |
| | | | | | | | | | | |
| Oil 1.21% | | | | | | | | | | |
| Petroleos Mexicanos† | | 7.65% | | 11/24/2021 | MXN | 2,750 | | | 133,726 | |
| | | | | | | | | | | |
| Telecommunications 1.25% | | | | | | | | | | |
| America Movil SAB de CV | | 6.00% | | 6/9/2019 | MXN | 2,780 | | | 137,669 | |
| Total | | | | | | | | | 431,706 | |
| | | | | | | | | | | |
| Netherlands 0.88% | | | | | | | | | | |
| | | | | | | | | | | |
| Telecommunications | | | | | | | | | | |
| VEON Holdings BV† | | 9.00% | | 2/13/2018 | RUB | 5,600 | | | 97,265 | |
| | | | | | | | | | | |
| Peru 0.73% | | | | | | | | | | |
| | | | | | | | | | | |
| Banks: Regional | | | | | | | | | | |
| Banco de Credito del Peru† | | 4.85% | | 10/30/2020 | PEN | 260 | | | 80,127 | |
| | | | | | | | | | | |
| South Africa 1.92% | | | | | | | | | | |
| | | | | | | | | | | |
| Electric: Power 1.26% | | | | | | | | | | |
| Eskom Holdings SOC Ltd. | | Zero Coupon | | 12/31/2018 | ZAR | 800 | | | 57,870 | |
| Eskom Holdings SOC Ltd. | | 9.25% | | 4/20/2018 | ZAR | 1,000 | | | 81,148 | |
| Total | | | | | | | | | 139,018 | |
| | | | | | | | | | | |
| Transportation: Miscellaneous 0.66% | | | | | | | | | | |
| Transnet SOC Ltd. | | 8.90% | | 11/14/2027 | ZAR | 1,000 | | | 73,103 | |
| Total | | | | | | | | | 212,121 | |
| | | |
| | See Notes to Financial Statements. | 57 |
Schedule of Investments (continued)
EMERGING MARKETS LOCAL BOND FUND December 31, 2017
| | | | | | Principal | | | |
| | | Interest | | Maturity | Amount | | Fair | |
| Investments | | Rate | | Date | (000) | | Value | |
| Turkey 0.73% | | | | | | | | | | |
| | | | | | | | | | | |
| Banks: Regional | | | | | | | | | | |
| Akbank Turk AS† | | 7.50% | | 2/5/2018 | TRY | 305 | | $ | 79,982 | |
| Total Foreign Corporate Bonds (cost $1,439,546) | | | | | | | | | 1,147,867 | |
| | | | | | | | | | | |
| FOREIGN GOVERNMENT OBLIGATIONS(a) 85.20% | | | | | | | | | | |
| | | | | | | | | | | |
| Argentina 4.07% | | | | | | | | | | |
| City of Buenos Aires | 26.661%
(BADLAR + 3.25% | )# | 3/29/2024 | ARS | 2,000 | | | 104,979 | |
| City of Buenos Aires | 26.875%
(BADLAR + 3.75% | )# | 2/22/2028 | ARS | 1,925 | | | 102,979 | |
| Provincia de Mendoza | 27.50%
(BADLAR + 4.38% | )# | 6/9/2021 | ARS | 2,380 | | | 128,388 | |
| Republic of Argentina GDP Linked Note | | Zero Coupon | | 12/15/2035 | ARS | 8,500 | | | 50,658 | |
| Republic of Argentina GDP Linked Note | | 5.83% | | 12/31/2033 | ARS | 150 | | | 61,838 | |
| Total | | | | | | | | | 448,842 | |
| | | | | | | | | | | |
| Brazil 12.58% | | | | | | | | | | |
| Brazil Letras do Tesouro Nacional | | Zero Coupon | | 4/1/2018 | BRL | 750 | | | 222,557 | |
| Brazil Letras do Tesouro Nacional | | Zero Coupon | | 1/1/2019 | BRL | 900 | | | 254,073 | |
| Brazil Notas do Tesouro Nacional Series F | | 10.00% | | 1/1/2021 | BRL | 500 | | | 155,348 | |
| Brazil Notas do Tesouro Nacional Series F | | 10.00% | | 1/1/2023 | BRL | 940 | | | 287,100 | |
| Brazil Notas do Tesouro Nacional Series F | | 10.00% | | 1/1/2025 | BRL | 1,210 | | | 364,760 | |
| Brazil Notas do Tesouro Nacional Series F | | 10.00% | | 1/1/2027 | BRL | 350 | | | 104,203 | |
| Total | | | | | | | | | 1,388,041 | |
| | | | | | | | | | | |
| Chile 3.52% | | | | | | | | | | |
| Bonos Tesoreria Pesos | | 4.50% | | 3/1/2026 | CLP | 115,000 | | | 187,254 | |
| Bonos Tesoreria Pesos | | 5.00% | | 3/1/2035 | CLP | 95,000 | | | 154,388 | |
| Bonos Tesoreria Pesos | | 6.00% | | 1/1/2043 | CLP | 25,000 | | | 46,531 | |
| Total | | | | | | | | | 388,173 | |
| | | | | | | | | | | |
| Colombia 3.98% | | | | | | | | | | |
| Colombian TES Series B | | 6.00% | | 4/28/2028 | COP | 960,000 | | | 309,367 | |
| Colombian TES Series B | | 10.00% | | 7/24/2024 | COP | 320,000 | | | 129,544 | |
| Total | | | | | | | | | 438,911 | |
| | | | | | | | | | | |
| Egypt 1.41% | | | | | | | | | | |
| Egypt Treasury Bill | | Zero Coupon | | 3/6/2018 | EGP | 1,850 | | | 101,137 | |
| Egypt Treasury Bill | | Zero Coupon | | 3/13/2018 | EGP | 1,000 | | | 54,480 | |
| Total | | | | | | | | | 155,617 | |
| | |
| 58 | See Notes to Financial Statements. |
Schedule of Investments (continued)
EMERGING MARKETS LOCAL BOND FUND December 31, 2017
| | | | | | Principal | | | |
| | | Interest | | Maturity | Amount | | Fair | |
| Investments | | Rate | | Date | (000) | | Value | |
| Hungary 3.12% | | | | | | | | | | |
| Hungary Government Bond | | 5.50% | | 6/24/2025 | HUF | 38,500 | | $ | 188,064 | |
| Hungary Government Bond | | 7.00% | | 6/24/2022 | HUF | 32,000 | | | 156,029 | |
| Total | | | | | | | | | 344,093 | |
| |
| India 3.62% | | | | | | | | | | |
| Export-Import Bank of India | | 8.15% | | 3/5/2025 | INR | 15,000 | | | 237,389 | |
| India Government Bond | | 8.27% | | 6/9/2020 | INR | 10,000 | | | 161,686 | |
| Total | | | | | | | | | 399,075 | |
| |
| Indonesia 9.08% | | | | | | | | | | |
| Indonesia Treasury Bond | | 8.375% | | 3/15/2024 | IDR | 3,430,000 | | | 281,583 | |
| Indonesia Treasury Bond | | 8.375% | | 3/15/2034 | IDR | 5,460,000 | | | 449,718 | |
| Indonesia Treasury Bond | | 9.50% | | 7/15/2031 | IDR | 3,009,000 | | | 270,073 | |
| Total | | | | | | | | | 1,001,374 | |
| |
| Malaysia 4.39% | | | | | | | | | | |
| Malaysia Government Bond | | 3.844% | | 4/15/2033 | MYR | 1,295 | | | 299,821 | |
| Malaysia Government Bond | | 4.059% | | 9/30/2024 | MYR | 740 | | | 184,660 | |
| Total | | | | | | | | | 484,481 | |
| |
| Mexico 3.66% | | | | | | | | | | |
| Mexican Bonos | | 7.50% | | 6/3/2027 | MXN | 3,800 | | | 191,182 | |
| Mexican Bonos | | 7.75% | | 5/29/2031 | MXN | 800 | | | 40,750 | |
| Mexican Bonos | | 7.75% | | 11/13/2042 | MXN | 3,400 | | | 172,053 | |
| Total | | | | | | | | | 403,985 | |
| |
| Nigeria 0.92% | | | | | | | | | | |
| Nigeria Treasury Bill | | 0.01% | | 4/19/2018 | NGN | 18,000 | | | 48,068 | (b) |
| Nigeria Treasury Bill | | 0.01% | | 5/31/2018 | NGN | 20,500 | | | 53,501 | (b) |
| Total | | | | | | | | | 101,569 | |
| |
| Peru 2.65% | | | | | | | | | | |
| Peru Government Bond | | 6.85% | | 2/12/2042 | PEN | 132 | | | 44,345 | |
| Peru Government Bond | | 6.95% | | 8/12/2031 | PEN | 410 | | | 144,558 | |
| Republic of Peru | | 6.85% | | 2/12/2042 | PEN | 150 | | | 50,392 | |
| Republic of Peru† | | 6.95% | | 8/12/2031 | PEN | 150 | | | 52,887 | |
| Total | | | | | | | | | 292,182 | |
| |
| Poland 4.56% | | | | | | | | | | |
| Poland Government Bond | | 3.25% | | 7/25/2025 | PLN | 670 | | | 194,237 | |
| Poland Government Bond | | 5.75% | | 9/23/2022 | PLN | 943 | | | 309,507 | |
| Total | | | | | | | | | 503,744 | |
| | | |
| | See Notes to Financial Statements. | 59 |
Schedule of Investments (continued)
EMERGING MARKETS LOCAL BOND FUND December 31, 2017
| | | | | | Principal | | | |
| | | Interest | | Maturity | Amount | | Fair | |
| Investments | | Rate | | Date | (000) | | Value | |
| Romania 0.68% | | | | | | | | | | |
| Romania Government Bond | | 5.95% | | 6/11/2021 | RON | 270 | | $ | 74,866 | |
| |
| Russia 8.96% | | | | | | | | | | |
| Russian Federal Bond—OFZ | | 6.70% | | 5/15/2019 | RUB | 5,700 | | | 98,986 | |
| Russian Federal Bond—OFZ | | 7.40% | | 12/7/2022 | RUB | 6,000 | | | 105,808 | |
| Russian Federal Bond—OFZ | | 7.60% | | 4/14/2021 | RUB | 16,810 | | | 304,585 | |
| Russian Federal Bond—OFZ | | 7.70% | | 3/23/2033 | RUB | 9,300 | | | 162,276 | |
| Russian Federal Bond—OFZ | | 7.75% | | 9/16/2026 | RUB | 17,750 | | | 316,682 | |
| Total | | | | | | | | | 988,337 | |
| |
| South Africa 8.15% | | | | | | | | | | |
| Republic of South Africa | | 6.25% | | 3/31/2036 | ZAR | 6,153 | | | 358,702 | |
| Republic of South Africa | | 7.00% | | 2/28/2031 | ZAR | 3,560 | | | 240,100 | |
| Republic of South Africa | | 10.50% | | 12/21/2026 | ZAR | 3,325 | | | 300,426 | |
| Total | | | | | | | | | 899,228 | |
| |
| Thailand 3.81% | | | | | | | | | | |
| Thailand Government Bond | | 1.875% | | 6/17/2022 | THB | 3,600 | | | 111,015 | |
| Thailand Government Bond | | 3.58% | | 12/17/2027 | THB | 2,270 | | | 76,021 | |
| Thailand Government Bond | | 3.625% | | 6/16/2023 | THB | 3,825 | | | 127,686 | |
| Thailand Government Bond | | 4.875% | | 6/22/2029 | THB | 2,800 | | | 105,589 | |
| Total | | | | | | | | | 420,311 | |
| |
| Turkey 5.46% | | | | | | | | | | |
| Turkey Government Bond | | 7.10% | | 3/8/2023 | TRY | 1,835 | | | 399,338 | |
| Turkey Government Bond | | 8.80% | | 11/14/2018 | TRY | 800 | | | 203,667 | |
| Total | | | | | | | | | 603,005 | |
| |
| Uruguay 0.58% | | | | | | | | | | |
| Republic of Uruguay† | | 8.50% | | 3/15/2028 | UYU | 348 | | | 12,154 | |
| Republic of Uruguay | | 9.875% | | 6/20/2022 | UYU | 1,400 | | | 51,647 | |
| Total | | | | | | | | | 63,801 | |
| Total Foreign Government Obligations (cost $9,523,058) | | | | | 9,399,635 | |
| Total Investments in Securities 95.61% (cost $10,962,604) | | | | | 10,547,502 | |
| Cash, Foreign Cash and Other Assets in Excess of Liabilities(c) 4.39% | | | | | 484,802 | |
| Net Assets 100.00% | | | | | | | | $ | 11,032,304 | |
| | |
| 60 | See Notes to Financial Statements. |
Schedule of Investments (continued)
EMERGING MARKETS LOCAL BOND FUND December 31, 2017
| ARS | | Argentine Peso |
| BRL | | Brazilian real |
| CLP | | Chilean peso |
| COP | | Colombian peso |
| EGP | | Egyptian pound |
| HUF | | Hungarian forint |
| IDR | | Indonesian rupiah |
| INR | | Indian rupee |
| MXN | | Mexican peso |
| MYR | | Malaysian ringgit |
| NGN | | Nigerian naira |
| PEN | | Peruvian nuevo sol |
| PLN | | Polish zloty |
| RON | | Romanian new leu |
| RUB | | Russian ruble |
| THB | | Thai baht |
| TRY | | Turkish lira |
| UYU | | Uruguayan Peso |
| ZAR | | South African rand |
| † | | Security was purchased pursuant to Rule 144A under the Securities Act of 1933 and, unless registered under such Act or exempted from registration, may only be resold to qualified institutional buyers. |
| # | | Variable rate security. The interest rate represents the rate in effect at December 31, 2017. |
| (a) | | Investment in non-U.S. dollar denominated securities. |
| (b) | | Level 3 Investment as described in Note 2(q) in the Notes to Financials. Security valued utilizing third party pricing information without adjustment. Such valuations are based on unobservable inputs. A significant change in third party information could result in a significantly lower or higher value of such Level 3 investments. |
| (c) | | Cash, Foreign Cash and Other Assets in Excess of Liabilities include net unrealized appreciation/depreciation on forward foreign currency exchange contracts as follows: |
Open Forward Foreign Currency Exchange Contracts at December 31, 2017:
| Forward | | | | | | | | | | | | | | | |
| Foreign | | | | | | | | | | U.S. $ | | | | | |
| Currency | | | | | | | | | | Cost on | | U.S. $ | | | |
| Exchange | | Transaction | | | | Expiration | | Foreign | | Origination | | Current | | Unrealized | |
| Contracts | | Type | | Counterparty | | Date | | Currency | | Date | | Value | | Appreciation | |
| Brazilian real | | Buy | | State Street Bank and Trust | | 3/20/2018 | | 232,000 | | $ 69,316 | | $ 69,361 | | $ | 45 | |
| Chinese yuan renminbi | | Buy | | State Street Bank and Trust | | 3/20/2018 | | 1,376,000 | | 206,650 | | 210,156 | | | 3,506 | |
| Colombian peso | | Buy | | BNP Paribas S.A. | | 3/20/2018 | | 470,635,000 | | 155,812 | | 156,673 | | | 861 | |
| Colombian peso | | Buy | | State Street Bank and Trust | | 3/20/2018 | | 22,017,000 | | 7,248 | | 7,330 | | | 82 | |
| Czech koruna | | Buy | | Citibank | | 3/20/2018 | | 12,981,000 | | 603,596 | | 611,902 | | | 8,306 | |
| Czech koruna | | Buy | | State Street Bank and Trust | | 3/20/2018 | | 155,000 | | 7,235 | | 7,306 | | | 71 | |
| Hungarian forint | | Buy | | Goldman Sachs | | 3/20/2018 | | 34,136,000 | | 129,512 | | 132,310 | | | 2,798 | |
| Indian rupee | | Buy | | State Street Bank and Trust | | 3/20/2018 | | 611,000 | | 9,468 | | 9,504 | | | 36 | |
| Polish zloty | | Buy | | Standard Chartered Bank | | 3/20/2018 | | 2,209,000 | | 621,962 | | 634,761 | | | 12,799 | |
| Polish zloty | | Buy | | State Street Bank and Trust | | 3/20/2018 | | 29,000 | | 8,129 | | 8,333 | | | 204 | |
| | | |
| | See Notes to Financial Statements. | 61 |
Schedule of Investments (continued)
EMERGING MARKETS LOCAL BOND FUND December 31, 2017
Open Forward Foreign Currency Exchange Contracts at December 31, 2017 (continued):
| Forward | | | | | | | | | | | | | | | | |
| Foreign | | | | | | | | | | U.S. $ | | | | | | |
| Currency | | | | | | | | | | Cost on | | U.S. $ | | | | |
| Exchange | | Transaction | | | | Expiration | | Foreign | | Origination | | Current | | Unrealized | |
| Contracts | | Type | | Counterparty | | Date | | Currency | | Date | | Value | | Appreciation | |
| Romanian new leu | | Buy | | State Street Bank and Trust | | 3/20/2018 | | 81,000 | | $ 20,703 | | $ 20,794 | | | $ | 91 | |
| Turkish lira | | Buy | | Standard Chartered Bank | | 3/20/2018 | | 629,000 | | 159,537 | | 162,186 | | | | 2,649 | |
| Argentine peso | | Sell | | UBS AG | | 3/20/2018 | | 2,334,000 | | 126,094 | | 120,340 | | | | 5,754 | |
| euro | | Sell | | State Street Bank and Trust | | 3/20/2018 | | 19,000 | | 22,918 | | 22,901 | | | | 17 | |
| Japanese yen | | Sell | | State Street Bank and Trust | | 3/20/2018 | | 23,146,000 | | 207,078 | | 206,204 | | | | 874 | |
| Mexican peso | | Sell | | State Street Bank and Trust | | 3/20/2018 | | 219,000 | | 10,998 | | 10,987 | | | | 11 | |
| Taiwan dollar | | Sell | | State Street Bank and Trust | | 3/20/2018 | | 520,000 | | 17,683 | | 17,681 | | | | 2 | |
| Thai baht | | Sell | | Bank of America | | 3/20/2018 | | 2,225,000 | | 68,463 | | 68,394 | | | | 69 | |
| Unrealized Appreciation on Forward Foreign Currency Exchange Contracts | | | $ | 38,175 | |
| Forward | | | | | | | | | | | | | | | |
| Foreign | | | | | | | | | | U.S. $ | | | | | |
| Currency | | | | | | | | | | Cost on | | U.S. $ | | | |
| Exchange | | Transaction | | | | Expiration | | Foreign | | Origination | | Current | | Unrealized | |
| Contracts | | Type | | Counterparty | | Date | | Currency | | Date | | Value | | Depreciation | |
| Argentine peso | | Buy | | Morgan Stanley | | 3/20/2018 | | 518,000 | | $ 26,784 | | $ 26,708 | | $ | (76 | ) |
| Chilean peso | | Buy | | BNP Paribas S.A. | | 3/20/2018 | | 8,152,000 | | 13,254 | | 13,240 | | | (14 | ) |
| Chinese yuan renminbi | | Buy | | Standard Chartered Bank | | 3/20/2018 | | 72,000 | | 11,003 | | 10,997 | | | (6 | ) |
| Colombian peso | | Buy | | State Street Bank and Trust | | 3/20/2018 | | 143,600,000 | | 47,953 | | 47,804 | | | (149 | ) |
| Czech koruna | | Buy | | State Street Bank and Trust | | 3/20/2018 | | 585,000 | | 27,666 | | 27,576 | | | (90 | ) |
| Hungarian forint | | Buy | | Goldman Sachs | | 3/20/2018 | | 5,400,000 | | 20,986 | | 20,930 | | | (56 | ) |
| Indian rupee | | Buy | | State Street Bank and Trust | | 3/20/2018 | | 781,000 | | 12,154 | | 12,148 | | | (6 | ) |
| Indonesian rupiah | | Buy | | Bank of America | | 3/20/2018 | | 828,800,000 | | 60,968 | | 60,947 | | | (21 | ) |
| Malaysian ringgit | | Buy | | State Street Bank and Trust | | 3/20/2018 | | 1,174,000 | | 288,892 | | 288,650 | | | (242 | ) |
| Mexican peso | | Buy | | BNP Paribas S.A. | | 3/20/2018 | | 4,434,000 | | 229,499 | | 222,451 | | | (7,048 | ) |
| Mexican peso | | Buy | | State Street Bank and Trust | | 3/20/2018 | | 247,000 | | 12,473 | | 12,392 | | | (81 | ) |
| Peruvian Nuevo sol | | Buy | | Citibank | | 3/20/2018 | | 72,000 | | 22,161 | | 22,140 | | | (21 | ) |
| Polish zloty | | Buy | | State Street Bank and Trust | | 3/20/2018 | | 223,000 | | 64,251 | | 64,079 | | | (172 | ) |
| Russian ruble | | Buy | | State Street Bank and Trust | | 3/20/2018 | | 2,821,000 | | 48,579 | | 48,412 | | | (167 | ) |
| Thai baht | | Buy | | Standard Chartered Bank | | 3/20/2018 | | 16,918,000 | | 521,115 | | 520,044 | | | (1,071 | ) |
| | |
| 62 | See Notes to Financial Statements. |
Schedule of Investments (continued)
EMERGING MARKETS LOCAL BOND FUND December 31, 2017
Open Forward Foreign Currency Exchange Contracts at December 31, 2017 (continued):
| Forward | | | | | | | | | | | | | | | | |
| Foreign | | | | | | | | | | U.S. $ | | | | | | |
| Currency | | | | | | | | | | Cost on | | U.S. $ | | | | |
| Exchange | | Transaction | | | | Expiration | | Foreign | | Origination | | Current | | Unrealized | |
| Contracts | | Type | | Counterparty | | Date | | Currency | | Date | | Value | | Depreciation | |
| Thai baht | | Buy | | State Street Bank and Trust | | 3/20/2018 | | 167,000 | | $ 5,136 | | $ 5,133 | | | $ | (3 | ) |
| Thai baht | | Buy | | State Street Bank and Trust | | 3/20/2018 | | 68,000 | | 2,090 | | 2,090 | | | | 0 | ) |
| Turkish lira | | Buy | | State Street Bank and Trust | | 3/20/2018 | | 60,000 | | 15,494 | | 15,471 | | | | (23 | ) |
| Brazilian real | | Sell | | BNP Paribas S.A. | | 3/20/2018 | | 867,000 | | 257,043 | | 259,208 | | | | (2,165 | ) |
| Chilean peso | | Sell | | State Street Bank and Trust | | 3/20/2018 | | 16,467,000 | | 25,819 | | 26,744 | | | | (925 | ) |
| euro | | Sell | | State Street Bank and Trust | | 3/20/2018 | | 5,000 | | 5,934 | | 6,027 | | | | (93 | ) |
| euro | | Sell | | State Street Bank and Trust | | 3/20/2018 | | 321,000 | | 381,524 | | 386,911 | | | | (5,387 | ) |
| Indian rupee | | Sell | | Bank of America | | 3/20/2018 | | 13,829,000 | | 213,305 | | 215,109 | | | | (1,804 | ) |
| Indonesian rupiah | | Sell | | Standard Chartered Bank | | 3/20/2018 | | 2,100,000,000 | | 153,747 | | 154,427 | | | | (680 | ) |
| Indonesian rupiah | | Sell | | State Street Bank and Trust | | 3/20/2018 | | 226,272,000 | | 16,533 | | 16,639 | | | | (106 | ) |
| Japanese yen | | Sell | | State Street Bank and Trust | | 3/20/2018 | | 1,734,000 | | 15,440 | | 15,448 | | | | (8 | ) |
| Malaysian ringgit | | Sell | | Morgan Stanley | | 3/20/2018 | | 188,000 | | 46,194 | | 46,223 | | | | (29 | ) |
| Philippine peso | | Sell | | State Street Bank and Trust | | 3/20/2018 | | 8,310,000 | | 163,706 | | 166,029 | | | | (2,323 | ) |
| Philippine peso | | Sell | | State Street Bank and Trust | | 3/20/2018 | | 442,000 | | 8,825 | | 8,831 | | | | (6 | ) |
| Russian ruble | | Sell | | State Street Bank and Trust | | 3/20/2018 | | 4,323,000 | | 72,658 | | 74,188 | | | | (1,530 | ) |
| South African rand | | Sell | | State Street Bank and Trust | | 3/20/2018 | | 3,882,000 | | 303,201 | | 310,242 | | | | (7,041 | ) |
| South African rand | | Sell | | State Street Bank and Trust | | 3/20/2018 | | 332,000 | | 26,480 | | 26,533 | | | | (53 | ) |
| South Korean won | | Sell | | State Street Bank and Trust | | 3/20/2018 | | 168,901,000 | | 155,090 | | 158,396 | | | | (3,306 | ) |
| South Korean won | | Sell | | State Street Bank and Trust | | 3/20/2018 | | 8,251,000 | | 7,724 | | 7,738 | | | | (14 | ) |
| Taiwan dollar | | Sell | | Morgan Stanley | | 3/20/2018 | | 8,749,000 | | 294,118 | | 297,475 | | | | (3,357 | ) |
| Unrealized Depreciation on Forward Foreign Currency Exchange Contracts | | | $ | (38,073 | ) |
| | | |
| | See Notes to Financial Statements. | 63 |
Schedule of Investments (concluded)
EMERGING MARKETS LOCAL BOND FUND December 31, 2017
The following is a summary of the inputs used as of December 31, 2017 in valuing the Fund’s investments carried at fair value(1):
| Investment Type(2)(3) | | Level 1 | | | Level 2 | | | Level 3 | | | Total | |
| Foreign Corporate Bonds | | $ | – | | | $ | 1,147,867 | | | $ | – | | | $ | 1,147,867 | |
| Foreign Government Obligations | | | | | | | | | | | | | | | | |
| Nigeria | | | – | | | | – | | | | 101,569 | | | | 101,569 | |
| Remaining Industries | | | – | | | | 9,298,066 | | | | – | | | | 9,298,066 | |
| Total | | $ | – | | | $ | 10,445,933 | | | $ | 101,569 | | | $ | 10,547,502 | |
| Other Financial Instruments | | | | | | | | | | | | | | | | |
| Forward Foreign Currency Exchange Contracts | | | | | | | | | | | | | | | | |
| Assets | | $ | – | | | $ | 38,175 | | | $ | – | | | $ | 38,175 | |
| Liabilities | | | – | | | | (38,073 | ) | | | – | | | | (38,073 | ) |
| Total | | $ | – | | | $ | 102 | | | $ | – | | | $ | 102 | |
| | | |
| (1) | | Refer to Note 2(q) for a description of fair value measurements and the three-tier hierarchy of inputs. |
| (2) | | See Schedule of Investments for fair values in each industry and identification of foreign issuers and/or geography. The table above is presented by Investment Type. Industries are presented within an Investment Type should such Investment Type include securities classified as two or more levels within the three-tier fair value hierarchy. Each Level 3 security is identified in the Schedule of Investments along with the valuation technique utilized. |
| (3) | | There were no Level 1/Level 2 transfers during the fiscal year ended December 31, 2017. |
The following is a reconciliation of investments with unobservable inputs (Level 3) that were used in determining fair value:
| Foreign Government Obligations | |
| Balance as of January 1, 2017 | | $ | – | |
| Accrued Discounts (Premiums) | | | 4,068 | |
| Realized Gain (Loss) | | | – | |
| Change in Unrealized Appreciation (Depreciation) | | | 1,394 | |
| Purchases | | | 96,107 | |
| Sales | | | – | |
| Transfers into Level 3 | | | – | |
| Transfers out of Level 3 | | | – | |
| Balance as of December 31, 2017 | | $ | 101,569 | |
| Change in unrealized appreciation/depreciation for the year ended December 31, 2017 related to Level 3 investments held at December 31, 2017 | | $ | 1,394 | |
| | |
| 64 | See Notes to Financial Statements. |
Schedule of Investments
MULTI-ASSET GLOBAL OPPORTUNITY FUND December 31, 2017
| Investments | | Shares | | | Fair
Value
(000) | |
| LONG-TERM INVESTMENTS 100.18% | | | | | | | | |
| | | | | | | | | |
| INVESTMENTS IN UNDERLYING FUNDS(a) 100.18% | | | | | | | | |
| Lord Abbett Equity Trust-Calibrated Large Cap Value Fund-Class I(b) | | | 875,537 | | | $ | 18,272 | |
| Lord Abbett Equity Trust-Calibrated Mid Cap Value Fund-Class I(b) | | | 1,400,722 | | | | 30,410 | |
| Lord Abbett Investment Trust-Convertible Fund-Class I(c) | | | 1,382,223 | | | | 18,259 | |
| Lord Abbett Global Fund, Inc.-Emerging Markets Currency Fund-Class I(d) | | | 3,604,827 | | | | 19,502 | |
| Lord Abbett Securities Trust-Growth Leaders Fund-Class I*(e) | | | 1,029,063 | | | | 29,133 | |
| Lord Abbett Investment Trust-High Yield Fund-Class I(f) | | | 3,966,002 | | | | 30,697 | |
| Lord Abbett Investment Trust-Inflation Focused Fund-Class I(g) | | | 405,118 | | | | 4,825 | |
| Lord Abbett Securities Trust-International Equity Fund-Class I(h) | | | 1,450,907 | | | | 20,864 | |
| Lord Abbett Securities Trust-International Dividend Income Fund-Class I(i) | | | 7,268,111 | | | | 57,563 | |
| Lord Abbett Mid Cap Stock Fund, Inc.-Class I(j) | | | 410,202 | | | | 12,167 | |
| Lord Abbett Investment Trust-Short Duration Income Fund-Class I(k) | | | 1,185,872 | | | | 5,040 | |
| Total Investments in Underlying Funds (cost $240,574,550) | | | | | | | 246,732 | |
| | | | | | | | | |
| | | Principal
Amount
(000) | | | | | |
| SHORT-TERM INVESTMENT 1.10% | | | | | | | | |
| | | | | | | | | |
| REPURCHASE AGREEMENT | | | | | | | | |
Repurchase Agreement dated 12/29/2017, 0.54% due 1/2/2018 with Fixed Income Clearing Corp. collateralized by $2,640,000 of U.S. Treasury Note at 3.625% due 2/15/2020; value: $2,769,484; proceeds: $2,712,221
(cost $2,712,058) | | | $2,712 | | | | 2,712 | |
| Total Investments in Securities 101.28% (cost $243,286,608) | | | | | | | 249,444 | |
| Liabilities in Excess of Cash and Other Assets(l) (1.28%) | | | | | | | (3,152 | ) |
| Net Assets 100.00% | | | | | | $ | 246,292 | |
| | See Notes to Financial Statements. | 65 |
Schedule of Investments (continued)
MULTI-ASSET GLOBAL OPPORTUNITY FUND December 31, 2017
| * | | Non-income producing security. |
| (a) | | Affiliated issuers (See Note 13). |
| (b) | | Fund investment objective is total return. |
| (c) | | Fund investment objective is to seek current income and the opportunity for capital appreciation to produce a high total return. |
| (d) | | Fund investment objective is to seek high total return. |
| (e) | | Fund investment objective is to seek capital appreciation. |
| (f) | | Fund investment objective is to seek a high current income and the opportunity for capital appreciation to produce a high total return. |
| (g) | | Fund investment objective is to provide investment returns that exceed the rate of inflation in the U.S. economy over a full economic cycle and to seek current income. |
| (h) | | Fund investment objective is to seek long-term capital appreciation. |
| (i) | | Fund investment objective is to seek a high level of total return. |
| (j) | | Fund investment objective is to seek capital appreciation through investments, primarily in equity securities, which are believed to be undervalued in the marketplace. |
| (k) | | Fund investment objective is to seek a high level of income consistent with preservation of capital. |
| (l) | | Liabilities in Excess of Cash and Other Assets include net unrealized appreciation/depreciation on forward foreign currency exchange contracts, futures contracts and swaps as follows: |
Open Forward Foreign Currency Exchange Contracts at December 31, 2017:
Forward
Foreign
Currency
Exchange
Contracts | | Transaction
Type | | Counterparty | | Expiration
Date | | Foreign
Currency | | U.S. $
Cost on
Origination
Date | | | U.S. $
Current
Value | | Unrealized
Appreciation |
| Japanese yen | | Sell | | State Street Bank and Trust | | 2/28/2018 | | | 765,550,000 | | | $ | 6,904,703 | | | $ | 6,812,212 | | | | $92,491 |
| | | | | | | | | | | | | | | | | | | | | | | |
Forward
Foreign
Currency
Exchange
Contracts | | Transaction
Type | | Counterparty | | Expiration
Date | | Foreign
Currency | | U.S. $
Cost on
Origination
Date | | | U.S. $
Current
Value | | Unrealized
Depreciation |
| euro | | Sell | | Standard Chartered Bank | | 2/5/2018 | | | 6,295,000 | | | $ | 7,366,928 | | | $ | 7,567,404 | | | $ | (200,476 | ) |
| euro | | Sell | | State Street Bank and Trust | | 2/5/2018 | | | 2,210,000 | | | | 2,574,793 | | | | 2,656,706 | | | | (81,913 | ) |
| euro | | Sell | | State Street Bank and Trust | | 2/28/2018 | | | 7,585,000 | | | | 9,058,767 | | | | 9,130,234 | | | | (71,467 | ) |
| British pound | | Sell | | Credit Suisse International | | 2/5/2018 | | | 2,695,000 | | | | 3,584,838 | | | | 3,642,537 | | | | (57,699 | ) |
| British pound | | Sell | | Citibank | | 2/5/2018 | | | 1,010,000 | | | | 1,326,731 | | | | 1,365,107 | | | | (38,376 | ) |
| British pound | | Sell | | State Street Bank and Trust | | 2/28/2018 | | | 3,505,000 | | | | 4,664,804 | | | | 4,740,694 | | | | (75,890 | ) |
| Japanese yen | | Sell | | State Street Bank and Trust | | 2/5/2018 | | | 617,865,000 | | | | 5,450,318 | | | | 5,491,914 | | | | (41,596 | ) |
| Japanese yen | | Sell | | State Street Bank and Trust | | 2/5/2018 | | | 212,740,000 | | | | 1,879,130 | | | | 1,890,947 | | | | (11,817 | ) |
| Swedish krona | | Sell | | Goldman Sachs | | 2/5/2018 | | | 15,380,000 | | | | 1,845,108 | | | | 1,878,547 | | | | (33,439 | ) |
| Swedish krona | | Sell | | Morgan Stanley | | 2/5/2018 | | | 5,220,000 | | | | 626,145 | | | | 637,582 | | | | (11,437 | ) |
| Swedish krona | | Sell | | State Street Bank and Trust | | 2/28/2018 | | | 19,125,000 | | | | 2,309,077 | | | | 2,339,177 | | | | (30,100 | ) |
| Unrealized Depreciation on Forward Foreign Currency Exchange Contracts | | | $ | (654,210 | ) |
| 66 | See Notes to Financial Statements. | |
Schedule of Investments (concluded)
MULTI-ASSET GLOBAL OPPORTUNITY FUND December 31, 2017
Open Futures Contracts at December 31, 2017:
| Type | | | Expiration | | | Contracts | | | Position | | | Notional
Amount | | | Notional
Value | | Unrealized
Appreciation |
| Euro-BTP | | | March 2018 | | | | 30 | | | | Short | | | EUR | (4,084,200) | | | EUR | (4,108,834) | | | $ | 29,557 |
| Euro-Bund | | | March 2018 | | | | 24 | | | | Long | | | EUR | 3,880,320 | | | EUR | 3,878,817 | | | | 1,804 |
| MSCI EAFE, e-mini | | | March 2018 | | | | 82 | | | | Long | | | $ | 4,560,398 | | | $ | 4,771,170 | | | | 210,772 |
| Nikkei 225 | | | March 2018 | | | | 74 | | | | Long | | | $ | 8,327,091 | | | $ | 8,413,800 | | | | 86,709 |
| Unrealized Appreciation on Futures Contracts | | | | | | | $ | 328,842 |
Open Total Return Swap Contracts at December 31, 2017:
Swap
Counterparty | | Referenced
Index | | Referenced
Spread | | Units | | Position | | Termination
Date | | Notional
Amount | | Notional
Value | | Unrealized
Depreciation |
| Goldman Sachs | | Euro Stoxx Bank Index | | 3 Mo. EURIBOR + 0.27% | | 29,647 | | Long | | 4/10/2018 | | EUR 4,054,070 | | EUR 3,879,273 | | $(207,784) |
The following is a summary of the inputs used as of December 31, 2017 in valuing the Fund’s investments carried at fair value(1):
| Investment Type(2)(3) | | Level 1
(000) | | | Level 2
(000) | | | Level 3
(000) | | | Total
(000) | |
| Investments in Underlying Funds | | $ | 246,732 | | | $ | – | | | $ | – | | | $ | 246,732 | |
| Repurchase Agreement | | | – | | | | 2,712 | | | | – | | | | 2,712 | |
| Total | | $ | 246,732 | | | $ | 2,712 | | | $ | – | | | $ | 249,444 | |
| Other Financial Instruments | | | | | | | | | | | | | | | | |
| Forward Foreign Currency Exchange Contracts | | | | | | | | | | | | | | | | |
| Assets | | $ | – | | | $ | 92 | | | $ | – | | | $ | 92 | |
| Liabilities | | | – | | | | (654 | ) | | | – | | | | (654 | ) |
| Futures Contracts | | | | | | | | | | | | | | | | |
| Assets | | | 329 | | | | – | | | | – | | | | 329 | |
| Liabilities | | | – | | | | – | | | | – | | | | – | |
| Total Return Swap Contracts | | | | | | | | | | | | | | | | |
| Assets | | | – | | | | – | | | | – | | | | – | |
| Liabilities | | | – | | | | (208 | ) | | | – | | | | (208 | ) |
| Total | | $ | 329 | | | $ | (770 | ) | | $ | – | | | $ | (441 | ) |
| (1) | | Refer to Note 2(q) for a description of fair value measurements and the three-tier hierarchy of inputs. |
| (2) | | See Schedule of Investments for fair values in each industry and identification of foreign issuers and/or geography. |
| (3) | | There were no Level 1/Level 2 transfers during the fiscal year ended December 31, 2017. |
| | See Notes to Financial Statements. | 67 |
Statements of Assets and Liabilities
December 31, 2017
| | | Emerging Markets
Corporate Debt
Fund | | | Emerging
Markets Currency
Fund | |
| ASSETS: | | | | | | | | |
| Investments in securities, at cost | | $ | 54,029,090 | | | $ | 205,424,575 | |
| Investments in securities, at fair value | | $ | 55,377,755 | | | $ | 203,454,747 | |
| Cash | | | 500 | | | | 9,780,427 | |
| Deposits with brokers for derivatives collateral | | | 69,002 | | | | 1,129,817 | |
| Foreign cash, at value (cost $0 and $127,715, respectively) | | | – | | | | 121,729 | |
| Receivables: | | | | | | | | |
| Interest and dividends | | | 645,794 | | | | 1,556,904 | |
| Capital shares sold | | | 483,361 | | | | 1,125,140 | |
| Investment securities sold | | | – | | | | 252,969 | |
| From advisor (See Note 3) | | | 31,431 | | | | – | |
| Unrealized appreciation on forward foreign currency exchange contracts | | | – | | | | 4,761,484 | |
| Prepaid expenses and other assets | | | 55,402 | | | | 37,400 | |
| Total assets | | | 56,663,245 | | | | 222,220,617 | |
| LIABILITIES: | | | | | | | | |
| Payables: | | | | | | | | |
| Investment securities purchased | | | 540,794 | | | | 500,000 | |
| Capital shares reacquired | | | 72,126 | | | | 108,719 | |
| Management fee | | | 31,955 | | | | 92,586 | |
| Directors’ fees | | | 2,339 | | | | 76,315 | |
| Variation margin for futures contracts | | | 9,348 | | | | 15,884 | |
| 12b-1 distribution plan | | | 7,217 | | | | 14,248 | |
| Fund administration | | | 1,826 | | | | 7,407 | |
| Variation margin for centrally cleared interest rate swap agreements | | | – | | | | 133,319 | |
| Unrealized depreciation on forward foreign currency exchange contracts | | | 2,546 | | | | 1,495,339 | |
| Distributions payable | | | 181,971 | | | | 817,530 | |
| Accrued expenses | | | 64,868 | | | | 187,140 | |
| Total liabilities | | | 914,990 | | | | 3,448,487 | |
| NET ASSETS | | $ | 55,748,255 | | | $ | 218,772,130 | |
| COMPOSITION OF NET ASSETS: | | | | | | | | |
| Paid-in capital | | $ | 54,521,763 | | | $ | 315,472,205 | |
| Undistributed (distributions in excess of) net investment income | | | (2,339 | ) | | | 2,294,021 | |
| Accumulated net realized loss on investments, futures contracts, swaps and foreign currency related transactions | | | (112,306 | ) | | | (101,092,359 | ) |
| Net unrealized appreciation on investments, futures contracts, swaps and translation of assets and liabilities denominated in foreign currencies | | | 1,341,137 | | | | 2,098,263 | |
| Net Assets | | $ | 55,748,255 | | | $ | 218,772,130 | |
| 68 | See Notes to Financial Statements. | |
Statements of Assets and Liabilities (continued)
December 31, 2017
| | | Emerging Markets
Corporate Debt
Fund | | | Emerging
Markets Currency
Fund | |
| Net assets by class: | | | | | | | | |
| Class A Shares | | $ | 13,809,123 | | | $ | 17,746,038 | |
| Class B Shares | | | – | | | $ | 10,574 | |
| Class C Shares | | $ | 2,260,819 | | | $ | 3,157,957 | |
| Class F Shares | | $ | 27,639,623 | | | $ | 7,311,255 | |
| Class F3 Shares | | $ | 10,518 | | | $ | 456,580 | |
| Class I Shares | | $ | 11,673,933 | | | $ | 189,183,627 | |
| Class R2 Shares | | $ | 129,521 | | | $ | 79,459 | |
| Class R3 Shares | | $ | 147,534 | | | $ | 263,627 | |
| Class R4 Shares | | $ | 11,662 | | | $ | 27,432 | |
| Class R5 Shares | | $ | 53,756 | | | $ | 11,227 | |
| Class R6 Shares | | $ | 11,766 | | | $ | 524,354 | |
| Outstanding shares by class: | | | | | | | | |
| Class A Shares (350 and 415 million shares of common stock authorized, $.001 par value) | | | 888,349 | | | | 3,275,142 | |
| Class B Shares (0 and 30 million shares of common stock authorized, $.001 par value) | | | – | | | | 1,944 | |
| Class C Shares (85 and 100 million shares of common stock authorized, $.001 par value) | | | 145,428 | | | | 579,485 | |
| Class F Shares (85 and 100 million shares of common stock authorized, $.001 par value) | | | 1,777,414 | | | | 1,350,026 | |
| Class F3 Shares (15 and 20 million shares of common stock authorized, $.001 par value) | | | 676.59 | | | | 84,427 | |
| Class I Shares (185 and 200 million shares of common stock authorized, $.001 par value) | | | 750,943 | | | | 34,978,762 | |
| Class R2 Shares (15 and 20 million shares of common stock authorized, $.001 par value) | | | 8,333 | | | | 14,636 | |
| Class R3 Shares (15 and 20 million shares of common stock authorized, $.001 par value) | | | 9,492 | | | | 48,762 | |
| Class R4 Shares (15 and 20 million shares of common stock authorized, $.001 par value) | | | 750.28 | | | | 5,063 | |
| Class R5 Shares (15 and 20 million shares of common stock authorized, $.001 par value) | | | 3,458 | | | | 2,076 | |
| Class R6 Shares (15 and 20 million shares of common stock authorized, $.001 par value) | | | 757 | | | | 96,941 | |
| Net asset value, offering and redemption price per share (Net assets divided by outstanding shares): | | | | | | | | |
| Class A Shares-Net asset value | | | $15.54 | | | | $5.42 | |
| Class A Shares-Maximum offering price (Net asset value plus sales charge of 2.25%) | | | $15.90 | | | | $5.54 | |
| Class B Shares-Net asset value | | | – | | | | $5.44 | |
| Class C Shares-Net asset value | | | $15.55 | | | | $5.45 | |
| Class F Shares-Net asset value | | | $15.55 | | | | $5.42 | |
| Class F3 Shares-Net asset value | | | $15.55 | | | | $5.41 | |
| Class I Shares-Net asset value | | | $15.55 | | | | $5.41 | |
| Class R2 Shares-Net asset value | | | $15.54 | | | | $5.43 | |
| Class R3 Shares-Net asset value | | | $15.54 | | | | $5.41 | |
| Class R4 Shares-Net asset value | | | $15.54 | | | | $5.42 | |
| Class R5 Shares-Net asset value | | | $15.55 | | | | $5.41 | |
| Class R6 Shares-Net asset value | | | $15.54 | | | | $5.41 | |
| | See Notes to Financial Statements. | 69 |
Statements of Assets and Liabilities (continued)
December 31, 2017
| | | Emerging Markets
Local Bond
Fund | | | Multi-Asset
Global Opportunity
Fund | |
| ASSETS: | | | | | | | | |
| Investments in securities, at cost | | $ | 10,962,604 | | | $ | 2,712,058 | |
| Investments in Underlying Funds, at cost | | | – | | | | 240,574,550 | |
| Investments in securities, at fair value | | $ | 10,547,502 | | | $ | 2,712,058 | |
| Investments in Underlying Funds, at value | | | – | | | | 246,732,035 | |
| Cash | | | 611,701 | | | | – | |
| Deposits with brokers for derivatives collateral | | | – | | | | 575,494 | |
| Foreign cash, at value (cost $11,941 and $53, respectively) | | | 11,526 | | | | 54 | |
| Receivables: | | | | | | | | |
| Capital shares sold | | | 56,630 | | | | 1,662,677 | |
| Interest and dividends | | | 207,246 | | | | 572,099 | |
| From advisor (See Note 3) | | | 23,053 | | | | – | |
| Variation margin for futures contracts | | | – | | | | 15,855 | |
| From affiliate (See Note 3) | | | – | | | | 5,577 | |
| Unrealized appreciation on forward foreign currency exchange contracts | | | 38,175 | | | | 92,491 | |
| Prepaid expenses and other assets | | | 35,644 | | | | 27,947 | |
| Total assets | | | 11,531,477 | | | | 252,396,287 | |
| LIABILITIES: | | | | | | | | |
| Payables: | | | | | | | | |
| Investment securities purchased | | | 305,290 | | | | 3,032,296 | |
| Capital shares reacquired | | | 29,891 | | | | 290,492 | |
| 12b-1 distribution plan | | | 2,272 | | | | 62,528 | |
| Directors’ fees | | | 939 | | | | 49,366 | |
| Management fee | | | 6,147 | | | | 20,513 | |
| Fund administration | | | 351 | | | | 8,205 | |
| Unrealized depreciation on forward foreign currency exchange contracts | | | 38,073 | | | | 654,210 | |
| Unrealized depreciation on total return swap contracts | | | – | | | | 207,784 | |
| Distributions payable | | | 45,733 | | | | 1,639,663 | |
| Accrued expenses | | | 70,477 | | | | 139,248 | |
| Total liabilities | | | 499,173 | | | | 6,104,305 | |
| NET ASSETS | | $ | 11,032,304 | | | $ | 246,291,982 | |
| COMPOSITION OF NET ASSETS: | | | | | | | | |
| Paid-in capital | | $ | 12,078,689 | | | $ | 257,147,538 | |
| Distributions in excess of net investment income | | | (235,151 | ) | | | (34,729 | ) |
| Accumulated net realized loss on investments, investments, futures contracts, swaps and foreign currency related transactions | | | (395,886 | ) | | | (16,537,689 | ) |
| Net unrealized appreciation (depreciation) on investments, investments, futures contracts, swaps and translation of assets and liabilities denominated in foreign currencies | | | (415,348 | ) | | | 5,716,862 | |
| Net Assets | | $ | 11,032,304 | | | $ | 246,291,982 | |
| 70 | See Notes to Financial Statements. | |
Statements of Assets and Liabilities (concluded)
December 31, 2017
| | | Emerging Markets
Local Bond
Fund | | | Multi-Asset
Global Opportunity
Fund | |
| Net assets by class: | | | | | | | | |
| Class A Shares | | $ | 6,834,286 | | | $ | 139,431,801 | |
| Class B Shares | | | – | | | $ | 571,484 | |
| Class C Shares | | $ | 1,064,321 | | | $ | 32,424,871 | |
| Class F Shares | | $ | 319,619 | | | $ | 5,879,189 | |
| Class F3 Shares | | $ | 379,809 | | | $ | 20,207 | |
| Class I Shares | | $ | 2,196,760 | | | $ | 13,496,689 | |
| Class R2 Shares | | $ | 95,225 | | | $ | 585,313 | |
| Class R3 Shares | | $ | 95,273 | | | $ | 3,977,153 | |
| Class R4 Shares | | $ | 10,874 | | | $ | 324,207 | |
| Class R5 Shares | | $ | 25,175 | | | $ | 32,582 | |
| Class R6 Shares | | $ | 10,962 | | | $ | 49,548,486 | |
| Outstanding shares by class(unlimited number of authorized shares of beneficial interest) | | | | | | | | |
| Class A Shares (350 and 430 million shares of common stock authorized, $.001 par value) | | | 642,179 | | | | 11,988,861 | |
| Class B Shares (0 and 15 million shares of common stock authorized, $.001 par value) | | | – | | | | 54,577 | |
| Class C Shares (85 and 20 million shares of common stock authorized, $.001 par value) | | | 100,018 | | | | 3,106,727 | |
| Class F Shares (85 and 20 million shares of common stock authorized, $.001 par value) | | | 30,074 | | | | 505,351 | |
| Class F3 Shares (15 and 20 million shares of common stock authorized, $.001 par value) | | | 35,716 | | | | 1,724 | |
| Class I Shares (185 and 15 million shares of common stock authorized, $.001 par value) | | | 206,486 | | | | 1,152,165 | |
| Class R2 Shares (15 and 20 million shares of common stock authorized, $.001 par value) | | | 8,952 | | | | 49,280 | |
| Class R3 Shares (15 and 20 million shares of common stock authorized, $.001 par value) | | | 8,956 | | | | 339,666 | |
| Class R4 Shares (15 and 20 million shares of common stock authorized, $.001 par value) | | | 1,023 | | | | 27,903 | |
| Class R5 Shares (15 and 20 million shares of common stock authorized, $.001 par value) | | | 2,367.49 | | | | 2,779 | |
| Class R6 Shares (15 and 20 million shares of common stock authorized, $.001 par value) | | | 1,030.60 | | | | 4,226,472 | |
| Net asset value, offering and redemption price per share (Net assets divided by outstanding shares): | | | | | | | | |
| Class A Shares-Net asset value | | | $10.64 | | | | $11.63 | |
| Class A Shares-Maximum offering price (Net asset value plus sales charge of 2.25%) | | | $10.88 | | | | $11.90 | |
| Class B Shares-Net asset value | | | – | | | | $10.47 | |
| Class C Shares-Net asset value | | | $10.64 | | | | $10.44 | |
| Class F Shares-Net asset value | | | $10.63 | | | | $11.63 | |
| Class F3 Shares-Net asset value | | | $10.63 | | | | $11.72 | |
| Class I Shares-Net asset value | | | $10.64 | | | | $11.71 | |
| Class R2 Shares-Net asset value | | | $10.64 | | | | $11.88 | |
| Class R3 Shares-Net asset value | | | $10.64 | | | | $11.71 | |
| Class R4 Shares-Net asset value | | | $10.63 | | | | $11.62 | |
| Class R5 Shares-Net asset value | | | $10.63 | | | | $11.72 | |
| Class R6 Shares-Net asset value | | | $10.64 | | | | $11.72 | |
| | See Notes to Financial Statements. | 71 |
Statements of Operations
For the Year Ended December 31, 2017
| | | Emerging Markets
Corporate Debt
Fund | | | Emerging
Markets Currency
Fund | |
| Investment income: | | | | | | | | |
| Interest and other (net of foreign withholding taxes of $2,052 and $59,110, respectively) | | $ | 2,193,247 | | | $ | 7,048,150 | |
| Interest earned from Interfund Lending (See Note 11) | | | – | | | | 958 | |
| Total investment income | | | 2,193,247 | | | | 7,049,108 | |
| Expenses: | | | | | | | | |
| Management fee | | | 315,710 | | | | 1,275,630 | |
| 12b-1 distribution plan-Class A | | | 24,000 | | | | 36,588 | |
| 12b-1 distribution plan-Class B | | | – | | | | 354 | |
| 12b-1 distribution plan-Class C | | | 14,575 | | | | 29,688 | |
| 12b-1 distribution plan-Class F | | | 20,782 | | | | 7,655 | |
| 12b-1 distribution plan-Class R2 | | | 752 | | | | 538 | |
| 12b-1 distribution plan-Class R3 | | | 629 | | | | 1,397 | |
| 12b-1 distribution plan-Class R4 | | | 29 | | | | 56 | |
| Registration | | | 113,277 | | | | 128,232 | |
| Professional | | | 52,358 | | | | 101,701 | |
| Shareholder servicing | | | 67,205 | | | | 67,591 | |
| Fund administration | | | 18,040 | | | | 102,050 | |
| Custody | | | 7,178 | | | | 89,534 | |
| Reports to shareholders | | | 22,122 | | | | 48,884 | |
| Directors’ fees | | | 1,178 | | | | 8,136 | |
| Other | | | 14,904 | | | | 56,399 | |
| Gross expenses | | | 672,739 | | | | 1,954,433 | |
| Expense reductions (See Note 9) | | | (421 | ) | | | (374 | ) |
| Fees waived and expenses reimbursed (See Note 3) | | | (229,602 | ) | | | – | |
| Net expenses | | | 442,716 | | | | 1,954,059 | |
| Net investment income | | | 1,750,531 | | | | 5,095,049 | |
| Net realized and unrealized gain: | | | | | | | | |
| Net realized gain on investments | | | 1,060,673 | | | | 646,955 | |
| Net realized gain (loss) on futures contracts | | | (92,755 | ) | | | 128,289 | |
| Net realized gain (loss) on foreign currency exchange contracts | | | (8,785 | ) | | | 12,297,626 | |
| Net realized loss on swap contracts | | | – | | | | (114,830 | ) |
| Net realized loss on foreign currency related translations | | | (2,952 | ) | | | (4,595 | ) |
| Net change in unrealized appreciation/depreciation on investments | | | 655,437 | | | | (901,402 | ) |
| Net change in unrealized appreciation/depreciation on futures contracts | | | (14,259 | ) | | | (8,791 | ) |
| Net change in unrealized appreciation/depreciation on foreign currency exchange contracts | | | (2,546 | ) | | | 10,434,003 | |
| Net change in unrealized appreciation/depreciation on swap contracts | | | – | | | | 235,262 | |
| Net change in unrealized appreciation/depreciation on translation of assets and liabilities denominated in foreign currencies | | | (36 | ) | | | (18,784 | ) |
| Net realized and unrealized gain | | | 1,594,777 | | | | 22,693,733 | |
| Net Increase in Net Assets Resulting From Operations | | $ | 3,345,308 | | | $ | 27,788,782 | |
| 72 | See Notes to Financial Statements. | |
Statements of Operations (concluded)
For the Year Ended December 31, 2017
| | | Emerging Markets
Local Bond
Fund | | | Multi-Asset
Global Opportunity
Fund | |
| Investment income: | | | | | | | | |
| Dividends received from Underlying Funds | | $ | – | | | $ | 7,430,724 | |
| Interest and other (net of foreign withholding taxes of $19,022 and $0, respectively) | | | 792,338 | | | | 4,611 | |
| Total investment income | | | 792,338 | | | | 7,435,335 | |
| Expenses: | | | | | | | | |
| Management fee | | | 70,534 | | | | 589,760 | |
| 12b-1 distribution plan-Class A | | | 13,079 | | | | 334,341 | |
| 12b-1 distribution plan-Class B | | | – | | | | 11,255 | |
| 12b-1 distribution plan-Class C | | | 6,102 | | | | 322,399 | |
| 12b-1 distribution plan-Class F | | | 429 | | | | 5,520 | |
| 12b-1 distribution plan-Class R2 | | | 545 | | | | 2,860 | |
| 12b-1 distribution plan-Class R3 | | | 455 | | | | 22,391 | |
| 12b-1 distribution plan-Class R4 | | | 26 | | | | 373 | |
| Shareholder servicing | | | 6,449 | | | | 248,021 | |
| Registration | | | 118,938 | | | | 121,147 | |
| Professional | | | 59,730 | | | | 49,878 | |
| Fund administration | | | 4,030 | | | | 94,362 | |
| Reports to shareholders | | | 6,053 | | | | 60,098 | |
| Custody | | | 26,631 | | | | 22,313 | |
| Directors’ fees | | | 285 | | | | 6,676 | |
| Other | | | 9,686 | | | | 13,001 | |
| Gross expenses | | | 322,972 | | | | 1,904,395 | |
| Expense reductions (See Note 9) | | | (92 | ) | | | (1,698 | ) |
| Fees waived and expenses reimbursed (See Note 3) | | | (217,703 | ) | | | (353,856 | ) |
| Net expenses | | | 105,177 | | | | 1,548,841 | |
| Net investment income | | | 687,161 | | | | 5,886,494 | |
| Net realized and unrealized gain (loss): | | | | | | | | |
| Capital gain distributions received from Underlying Funds | | | – | | | | 4,835,180 | |
| Net realized loss on investments in Underlying Funds | | | – | | | | (6,577,551 | ) |
| Net realized loss on investments | | | (538,919 | ) | | | – | |
| Net realized gain (loss) on futures contracts | | | (254 | ) | | | 1,911,826 | |
| Net realized gain (loss) on foreign currency exchange contracts | | | 112,151 | | | | (1,794,054 | ) |
| Net realized loss on swap contracts | | | – | | | | (72,299 | ) |
| Net realized gain (loss) on foreign currency related translations | | | 5,488 | | | | (167,544 | ) |
| Net change in unrealized appreciation/depreciation on investments | | | 1,019,706 | | | | – | |
| Net change in unrealized appreciation/depreciation on investments in Underlying Funds | | | – | | | | 25,693,969 | |
| Net change in unrealized appreciation/depreciation on futures contracts | | | – | | | | 436,553 | |
| Net change in unrealized appreciation/depreciation on foreign currency exchange contracts | | | 247 | | | | (1,888,431 | ) |
| Net change in unrealized appreciation/depreciation on swap contracts | | | – | | | | (207,784 | ) |
| Net change in unrealized appreciation/depreciation on translation of assets and liabilities denominated in foreign currencies | | | 2,752 | | | | 36 | |
| Net realized and unrealized gain | | | 601,171 | | | | 22,169,901 | |
| Net Increase in Net Assets Resulting From Operations | | $ | 1,288,332 | | | $ | 28,056,395 | |
| | See Notes to Financial Statements. | 73 |
Statements of Changes in Net Assets
| | | Emerging Markets Corporate Debt Fund |
| INCREASE (DECREASE) IN NET ASSETS | | For the Year Ended
December 31, 2017 | | | For the Year Ended
December 31, 2016 | |
| Operations: | | | | | | | | |
| Net investment income | | $ | 1,750,531 | | | $ | 1,432,186 | |
| Net realized gain on investments, futures contracts and foreign currency related transactions | | | 956,181 | | | | 385,162 | |
| Net change in unrealized appreciation/depreciation on investments, futures contracts and translation of assets and liabilities denominated in foreign currencies | | | 638,596 | | | | 1,405,327 | |
| Net increase in net assets resulting from operations | | | 3,345,308 | | | | 3,222,675 | |
| Distributions to shareholders from: | | | | | | | | |
| Net investment income | | | | | | | | |
| Class A | | | (492,724 | ) | | | (547,574 | ) |
| Class C | | | (54,624 | ) | | | (31,567 | ) |
| Class F | | | (873,138 | ) | | | (490,236 | ) |
| Class F3 | | | (341 | ) | | | – | |
| Class I | | | (451,584 | ) | | | (473,697 | ) |
| Class R2 | | | (5,457 | ) | | | (5,339 | ) |
| Class R3 | | | (5,476 | ) | | | (5,339 | ) |
| Class R4 | | | (463 | ) | | | (457 | ) |
| Class R5 | | | (1,729 | ) | | | (1,387 | ) |
| Class R6 | | | (514 | ) | | | (492 | ) |
| Net realized gain | | | | | | | | |
| Class A | | | (142,025 | ) | | | – | |
| Class C | | | (21,052 | ) | | | – | |
| Class F | | | (253,922 | ) | | | – | |
| Class F3 | | | (104 | ) | | | – | |
| Class I | | | (115,599 | ) | | | – | |
| Class R2 | | | (1,283 | ) | | | – | |
| Class R3 | | | (1,371 | ) | | | – | |
| Class R4 | | | (115 | ) | | | – | |
| Class R5 | | | (532 | ) | | | – | |
| Class R6 | | | (117 | ) | | | – | |
| Total distributions to shareholders | | | (2,422,170 | ) | | | (1,556,088 | ) |
| Capital share transactions (See Note 15): | | | | | | | | |
| Net proceeds from sales of shares | | | 41,272,630 | | | | 24,947,888 | |
| Reinvestment of distributions | | | 2,359,131 | | | | 1,526,372 | |
| Cost of shares reacquired | | | (18,806,930 | ) | | | (36,050,167 | ) |
| Net increase (decrease) in net assets resulting from capital share transactions | | | 24,824,831 | | | | (9,575,907 | ) |
| Net increase (decrease) in net assets | | | 25,747,969 | | | | (7,909,320 | ) |
| NET ASSETS: | | | | | | | | |
| Beginning of year | | $ | 30,000,286 | | | $ | 37,909,606 | |
| End of year | | $ | 55,748,255 | | | $ | 30,000,286 | |
| Distributions in excess of net investment income | | $ | (2,339 | ) | | $ | (4,135 | ) |
| 74 | See Notes to Financial Statements. |
Statements of Changes in Net Assets (continued)
| | | Emerging Markets Currency Fund |
| DECREASE IN NET ASSETS | | For the Year Ended
December 31, 2017 | | | For the Year Ended
December 31, 2016 | |
| Operations: | | | | | | | | |
| Net investment income | | $ | 5,095,049 | | | $ | 7,376,950 | |
| Net realized gain on investments, futures contracts, swaps and foreign currency related transactions | | | 12,953,445 | | | | 12,514,361 | |
| Net change in unrealized appreciation/depreciation on investments, futures contracts, swaps and translation of assets and liabilities denominated in foreign currencies | | | 9,740,288 | | | | 1,608,812 | |
| Net increase in net assets resulting from operations | | | 27,788,782 | | | | 21,500,123 | |
| Distributions to shareholders from: | | | | | | | | |
| Net investment income | | | | | | | | |
| Class A | | | (790,103 | ) | | | (1,035,581 | ) |
| Class B | | | (1,236 | ) | | | (4,308 | ) |
| Class C | | | (135,794 | ) | | | (212,359 | ) |
| Class F | | | (336,935 | ) | | | (443,669 | ) |
| Class F3 | | | (5,303 | ) | | | – | |
| Class I | | | (10,067,669 | ) | | | (21,196,245 | ) |
| Class P | | | – | | | | (4 | ) |
| Class R2 | | | (3,502 | ) | | | (4,747 | ) |
| Class R3 | | | (11,481 | ) | | | (17,175 | ) |
| Class R4 | | | (980 | ) | | | (517 | ) |
| Class R5 | | | (489 | ) | | | (546 | ) |
| Class R6 | | | (19,673 | ) | | | (554 | ) |
| Total distributions to shareholders | | | (11,373,165 | ) | | | (22,915,705 | ) |
| Capital share transactions (Net of share conversions) (See Note 15): | | | | | | | | |
| Net proceeds from sales of shares | | | 15,270,481 | | | | 124,310,329 | |
| Reinvestment of distributions | | | 11,116,218 | | | | 22,707,050 | |
| Cost of shares reacquired | | | (211,222,674 | ) | | | (236,856,843 | ) |
| Net decrease in net assets resulting from capital share transactions | | | (184,835,975 | ) | | | (89,839,464 | ) |
| Net decrease in net assets | | | (168,420,358 | ) | | | (91,255,046 | ) |
| NET ASSETS: | | | | | | | | |
| Beginning of year | | $ | 387,192,488 | | | $ | 478,447,534 | |
| End of year | | $ | 218,772,130 | | | $ | 387,192,488 | |
| Undistributed (distributions in excess of) net investment income | | $ | 2,294,021 | | | $ | (1,966,708 | ) |
| | See Notes to Financial Statements. | 75 |
Statements of Changes in Net Assets (continued)
| | | Emerging Markets Local Bond Fund |
| INCREASE IN NET ASSETS | | For the Year Ended
December 31, 2017 | | | For the Year Ended
December 31, 2016 | |
| Operations: | | | | | | | | |
| Net investment income | | $ | 687,161 | | | $ | 516,671 | |
| Net realized loss on investments, futures contracts and foreign currency related transactions | | | (421,534 | ) | | | (865,753 | ) |
| Net change in unrealized appreciation/depreciation on investments and translation of assets and liabilities denominated in foreign currencies | | | 1,022,705 | | | | 858,677 | |
| Net increase in net assets resulting from operations | | | 1,288,332 | | | | 509,595 | |
| Distributions to shareholders from: | | | | | | | | |
| Net investment income | | | | | | | | |
| Class A | | | (238,613 | ) | | | – | |
| Class C | | | (23,599 | ) | | | – | |
| Class F | | | (15,912 | ) | | | – | |
| Class F3 | | | (3,486 | ) | | | – | |
| Class I | | | (78,633 | ) | | | – | |
| Class R2 | | | (3,412 | ) | | | – | |
| Class R3 | | | (3,415 | ) | | | ��� | |
| Class R4 | | | (382 | ) | | | – | |
| Class R5 | | | (467 | ) | | | – | |
| Class R6 | | | (403 | ) | | | – | |
| Return of capital | | | | | | | | |
| Class A | | | (227,434 | ) | | | (378,524 | ) |
| Class C | | | (22,498 | ) | | | (26,459 | ) |
| Class F | | | (15,170 | ) | | | (12,354 | ) |
| Class F3 | | | (3,325 | ) | | | – | |
| Class I | | | (74,967 | ) | | | (126,604 | ) |
| Class R2 | | | (3,253 | ) | | | (5,486 | ) |
| Class R3 | | | (3,256 | ) | | | (5,489 | ) |
| Class R4 | | | (364 | ) | | | (609 | ) |
| Class R5 | | | (445 | ) | | | (635 | ) |
| Class R6 | | | (383 | ) | | | (640 | ) |
| Total distributions to shareholders | | | (719,417 | ) | | | (556,800 | ) |
| Capital share transactions (See Note 15): | | | | | | | | |
| Net proceeds from sales of shares | | | 4,052,443 | | | | 2,212,118 | |
| Reinvestment of distributions | | | 703,159 | | | | 545,596 | |
| Cost of shares reacquired | | | (3,486,842 | ) | | | (1,096,032 | ) |
| Net increase in net assets resulting from capital share transactions | | | 1,268,760 | | | | 1,661,682 | |
| Net increase in net assets | | | 1,837,675 | | | | 1,614,477 | |
| NET ASSETS: | | | | | | | | |
| Beginning of year | | $ | 9,194,629 | | | $ | 7,580,152 | |
| End of year | | $ | 11,032,304 | | | $ | 9,194,629 | |
| Distributions in excess of net investment income | | $ | (235,151 | ) | | $ | (68,239 | ) |
| 76 | See Notes to Financial Statements. |
Statements of Changes in Net Assets (concluded)
| | | Multi-Asset Global Opportunity Fund |
| INCREASE (DECREASE) IN NET ASSETS | | For the Year Ended
December 31, 2017 | | | For the Year Ended
December 31, 2016 | |
| Operations: | | | | | | | | |
| Net investment income | | $ | 5,886,494 | | | $ | 8,824,184 | |
| Capital gain distributions received from Underlying Funds | | | 4,835,180 | | | | – | |
| Net realized gain (loss) on futures contracts, swaps and foreign currency related transactions | | | (122,071 | ) | | | 1,000,920 | |
| Net realized loss on investments in Securities | | | – | | | | (532,539 | ) |
| Net realized loss on investments in Underlying Funds | | | (6,577,551 | ) | | | (7,581,096 | ) |
| Net change in unrealized appreciation/depreciation on investments in Underlying Funds | | | 25,693,969 | | | | 18,245,316 | |
| Net change in unrealized appreciation/depreciation on Securities | | | – | | | | 69,177 | |
| Net change in unrealized appreciation/depreciation on futures contracts, swaps and translation of assets and liabilities denominated in foreign currencies | | | (1,659,626 | ) | | | 999,277 | |
| Net increase in net assets resulting from operations | | | 28,056,395 | | | | 21,025,239 | |
| Distributions to shareholders from: | | | | | | | | |
| Net investment income | | | | | | | | |
| Class A | | | (4,709,591 | ) | | | (5,072,090 | ) |
| Class B | | | (23,724 | ) | | | (60,032 | ) |
| Class C | | | (1,010,951 | ) | | | (1,132,296 | ) |
| Class F | | | (202,526 | ) | | | (207,266 | ) |
| Class F3 | | | (623 | ) | | | – | |
| Class I | | | (427,939 | ) | | | (402,584 | ) |
| Class R2 | | | (16,509 | ) | | | (11,684 | ) |
| Class R3 | | | (138,199 | ) | | | (210,941 | ) |
| Class R4 | | | (8,388 | ) | | | (332 | ) |
| Class R5 | | | (1,027 | ) | | | (354 | ) |
| Class R6 | | | (1,792,030 | ) | | | (1,462,429 | ) |
| Net realized gain | | | | | | | | |
| Class A | | | – | | | | (1,722,448 | ) |
| Class B | | | – | | | | (25,814 | ) |
| Class C | | | – | | | | (475,580 | ) |
| Class F | | | – | | | | (68,421 | ) |
| Class F3 | | | – | | | | – | |
| Class I | | | – | | | | (124,264 | ) |
| Class R2 | | | – | | | | (4,279 | ) |
| Class R3 | | | – | | | | (77,126 | ) |
| Class R4 | | | – | | | | (109 | ) |
| Class R5 | | | – | | | | (109 | ) |
| Class R6 | | | – | | | | (469,615 | ) |
| Total distributions to shareholders | | | (8,331,507 | ) | | | (11,527,773 | ) |
| Capital share transactions (Net of share conversions) (See Note 15): | | | | | | | | |
| Net proceeds from sales of shares | | | 57,086,222 | | | | 31,175,121 | |
| Reinvestment of distributions | | | 7,672,305 | | | | 10,713,404 | |
| Cost of shares reacquired | | | (78,397,900 | ) | | | (77,249,082 | ) |
| Net decrease in net assets resulting from capital share transactions | | | (13,639,373 | ) | | | (35,360,557 | ) |
| Net increase (decrease) in net assets | | | 6,085,515 | | | | (25,863,091 | ) |
| NET ASSETS: | | | | | | | | |
| Beginning of year | | $ | 240,206,467 | | | $ | 266,069,558 | |
| End of year | | $ | 246,291,982 | | | $ | 240,206,467 | |
| Distributions in excess of net investment income | | $ | (34,729 | ) | | $ | (19,351 | ) |
| | See Notes to Financial Statements. | 77 |
Financial Highlights
EMERGING MARKETS CORPORATE DEBT FUND
| | | | | Per Share Operating Performance: |
| | | | | Investment operations: | | Distributions to
shareholders from: |
| | | Net asset
value,
beginning
of period | | Net
invest-
ment
income(a) | | Net
realized
and
unrealized
gain (loss) | | Total
from
invest-
ment
opera-
tions | | Net
investment
income | | Net
realized
gain | | Total
distri-
butions |
| Class A | | | | | | | | | | | | | | | | | | | | | | | | | | | | |
| 12/31/2017 | | | $15.08 | | | | $0.59 | | | $ | 0.67 | | | $ | 1.26 | | | | $(0.64 | ) | | | $(0.16 | ) | | | $(0.80 | ) |
| 12/31/2016 | | | 14.45 | | | | 0.61 | | | | 0.68 | | | | 1.29 | | | | (0.66 | ) | | | – | | | | (0.66 | ) |
| 12/31/2015 | | | 14.85 | | | | 0.60 | | | | (0.33 | ) | | | 0.27 | | | | (0.67 | ) | | | – | (c) | | | (0.67 | ) |
| 12/31/2014 | | | 14.97 | | | | 0.66 | | | | 0.34 | | | | 1.00 | | | | (0.72 | ) | | | (0.40 | ) | | | (1.12 | ) |
| 12/6/2013 to 12/31/2013(d) | | | 15.00 | | | | 0.02 | | | | (0.02 | ) | | | – | | | | (0.03 | ) | | | – | | | | (0.03 | ) |
| Class C | | | | | | | | | | | | | | | | | | | | | | | | | | | | |
| 12/31/2017 | | | 15.07 | | | | 0.48 | | | | 0.69 | | | | 1.17 | | | | (0.53 | ) | | | (0.16 | ) | | | (0.69 | ) |
| 12/31/2016 | | | 14.45 | | | | 0.50 | | | | 0.68 | | | | 1.18 | | | | (0.56 | ) | | | – | | | | (0.56 | ) |
| 12/31/2015 | | | 14.85 | | | | 0.50 | | | | (0.34 | ) | | | 0.16 | | | | (0.56 | ) | | | – | (c) | | | (0.56 | ) |
| 12/31/2014 | | | 14.97 | | | | 0.52 | | | | 0.36 | | | | 0.88 | | | | (0.60 | ) | | | (0.40 | ) | | | (1.00 | ) |
| 12/6/2013 to 12/31/2013(d) | | | 15.00 | | | | 0.01 | | | | (0.02 | ) | | | (0.01 | ) | | | (0.02 | ) | | | – | | | | (0.02 | ) |
| Class F | | | | | | | | | | | | | | | | | | | | | | | | | | | | |
| 12/31/2017 | | | 15.08 | | | | 0.61 | | | | 0.68 | | | | 1.29 | | | | (0.66 | ) | | | (0.16 | ) | | | (0.82 | ) |
| 12/31/2016 | | | 14.45 | | | | 0.62 | | | | 0.68 | | | | 1.30 | | | | (0.67 | ) | | | – | | | | (0.67 | ) |
| 12/31/2015 | | | 14.85 | | | | 0.56 | | | | (0.28 | ) | | | 0.28 | | | | (0.68 | ) | | | – | (c) | | | (0.68 | ) |
| 12/31/2014 | | | 14.97 | | | | 0.67 | | | | 0.35 | | | | 1.02 | | | | (0.74 | ) | | | (0.40 | ) | | | (1.14 | ) |
| 12/6/2013 to 12/31/2013(d) | | | 15.00 | | | | 0.02 | | | | (0.02 | ) | | | – | | | | (0.03 | ) | | | – | | | | (0.03 | ) |
| Class F3 | | | | | | | | | | | | | | | | | | | | | | | | | | | | |
| 4/4/2017 to 12/31/2017(g) | | | 15.43 | | | | 0.48 | | | | 0.32 | | | | 0.80 | | | | (0.52 | ) | | | (0.16 | ) | | | (0.68 | ) |
| Class I | | | | | | | | | | | | | | | | | | | | | | | | | | | | |
| 12/31/2017 | | | 15.08 | | | | 0.63 | | | | 0.68 | | | | 1.31 | | | | (0.68 | ) | | | (0.16 | ) | | | (0.84 | ) |
| 12/31/2016 | | | 14.45 | | | | 0.64 | | | | 0.68 | | | | 1.32 | | | | (0.69 | ) | | | – | | | | (0.69 | ) |
| 12/31/2015 | | | 14.85 | | | | 0.63 | | | | (0.33 | ) | | | 0.30 | | | | (0.70 | ) | | | – | (c) | | | (0.70 | ) |
| 12/31/2014 | | | 14.97 | | | | 0.69 | | | | 0.34 | | | | 1.03 | | | | (0.75 | ) | | | (0.40 | ) | | | (1.15 | ) |
| 12/6/2013 to 12/31/2013(d) | | | 15.00 | | | | 0.02 | | | | (0.02 | ) | | | – | | | | (0.03 | ) | | | – | | | | (0.03 | ) |
| Class R2 | | | | | | | | | | | | | | | | | | | | | | | | | | | | |
| 12/31/2017 | | | 15.07 | | | | 0.63 | | | | 0.68 | | | | 1.31 | | | | (0.68 | ) | | | (0.16 | ) | | | (0.84 | ) |
| 12/31/2016 | | | 14.45 | | | | 0.64 | | | | 0.67 | | | | 1.31 | | | | (0.69 | ) | | | – | | | | (0.69 | ) |
| 12/31/2015 | | | 14.85 | | | | 0.64 | | | | (0.34 | ) | | | 0.30 | | | | (0.70 | ) | | | – | (c) | | | (0.70 | ) |
| 12/31/2014 | | | 14.97 | | | | 0.69 | | | | 0.34 | | | | 1.03 | | | | (0.75 | ) | | | (0.40 | ) | | | (1.15 | ) |
| 12/6/2013 to 12/31/2013(d) | | | 15.00 | | | | 0.02 | | | | (0.02 | ) | | | – | | | | (0.03 | ) | | | – | | | | (0.03 | ) |
| Class R3 | | | | | | | | | | | | | | | | | | | | | | | | | | | | |
| 12/31/2017 | | | 15.07 | | | | 0.63 | | | | 0.68 | | | | 1.31 | | | | (0.68 | ) | | | (0.16 | ) | | | (0.84 | ) |
| 12/31/2016 | | | 14.45 | | | | 0.64 | | | | 0.67 | | | | 1.31 | | | | (0.69 | ) | | | – | | | | (0.69 | ) |
| 12/31/2015 | | | 14.85 | | | | 0.64 | | | | (0.34 | ) | | | 0.30 | | | | (0.70 | ) | | | – | (c) | | | (0.70 | ) |
| 12/31/2014 | | | 14.97 | | | | 0.69 | | | | 0.34 | | | | 1.03 | | | | (0.75 | ) | | | (0.40 | ) | | | (1.15 | ) |
| 12/6/2013 to 12/31/2013(d) | | | 15.00 | | | | 0.02 | | | | (0.02 | ) | | | – | | | | (0.03 | ) | | | – | | | | (0.03 | ) |
| 78 | See Notes to Financial Statements. | |
| | | | | | | Ratios to Average Net Assets: | | Supplemental Data: |
| | | | | | | | | | | | | |
Net
asset
value,
end of
period | | Total
return(b)
(%) | | Total
expenses
after
waivers
and/or reim-
bursements
(%) | | Total
expenses
(%) | | Net
invest-
ment
income
(%) | | Net
assets,
end of
period
(000) | | Portfolio
turnover
rate
(%) |
| | | | | | | | | | | | | | | | | | | | | | | | | | | |
| | $15.54 | | | | 8.54 | | | | 1.05 | | | | 1.55 | | | | 3.80 | | | | $13,809 | | | | 81 | |
| | 15.08 | | | | 9.03 | | | | 1.05 | | | | 1.67 | | | | 4.03 | | | | 7,535 | | | | 104 | |
| | 14.45 | | | | 1.77 | | | | 1.05 | | | | 1.71 | | | | 4.03 | | | | 13,843 | | | | 148 | |
| | 14.85 | | | | 6.76 | | | | 1.05 | | | | 2.62 | | | | 4.27 | | | | 6,745 | | | | 293 | |
| | 14.97 | | | | (0.04 | )(e) | | | 1.05 | (f) | | | 5.26 | (f) | | | 1.84 | (f) | | | 4,835 | | | | 4 | (e) |
| | | | | | | | | | | | | | | | | | | | | | | | | | | |
| | 15.55 | | | | 7.85 | | | | 1.76 | | | | 2.27 | | | | 3.10 | | | | 2,261 | | | | 81 | |
| | 15.07 | | | | 8.23 | | | | 1.70 | | | | 2.34 | | | | 3.27 | | | | 1,212 | | | | 104 | |
| | 14.45 | | | | 1.04 | | | | 1.77 | | | | 2.46 | | | | 3.38 | | | | 581 | | | | 148 | |
| | 14.85 | | | | 5.90 | | | | 1.81 | | | | 3.27 | | | | 3.34 | | | | 473 | | | | 293 | |
| | 14.97 | | | | (0.09 | )(e) | | | 1.86 | (f) | | | 6.07 | (f) | | | 1.03 | (f) | | | 100 | | | | 4 | (e) |
| | | | | | | | | | | | | | | | | | | | | | | | | | | |
| | 15.55 | | | | 8.71 | | | | 0.95 | | | | 1.45 | | | | 3.89 | | | | 27,640 | | | | 81 | |
| | 15.08 | | | | 9.10 | | | | 0.95 | | | | 1.57 | | | | 4.09 | | | | 12,321 | | | | 104 | |
| | 14.45 | | | | 1.83 | | | | 0.95 | | | | 1.50 | | | | 3.82 | | | | 12,604 | | | | 148 | |
| | 14.85 | | | | 6.86 | | | | 0.94 | | | | 2.49 | | | | 4.36 | | | | 170 | | | | 293 | |
| | 14.97 | | | | (0.04 | )(e) | | | 0.95 | (f) | | | 5.15 | (f) | | | 1.94 | (f) | | | 100 | | | | 4 | (e) |
| | | | | | | | | | | | | | | | | | | | | | | | | | | |
| | 15.55 | | | | 5.21 | (e) | | | 0.67 | (f) | | | 1.24 | (f) | | | 4.15 | (f) | | | 11 | | | | 81 | |
| | | | | | | | | | | | | | | | | | | | | | | | | | | |
| | 15.55 | | | | 8.84 | | | | 0.85 | | | | 1.37 | | | | 4.04 | | | | 11,674 | | | | 81 | |
| | 15.08 | | | | 9.18 | | | | 0.85 | | | | 1.47 | | | | 4.26 | | | | 8,636 | | | | 104 | |
| | 14.45 | | | | 1.98 | | | | 0.85 | | | | 1.50 | | | | 4.26 | | | | 10,634 | | | | 148 | |
| | 14.85 | | | | 6.97 | | | | 0.85 | | | | 2.43 | | | | 4.47 | | | | 5,134 | | | | 293 | |
| | 14.97 | | | | (0.03 | )(e) | | | 0.85 | (f) | | | 5.06 | (f) | | | 2.03 | (f) | | | 4,798 | | | | 4 | (e) |
| | | | | | | | | | | | | | | | | | | | | | | | | | | |
| | 15.54 | | | | 8.84 | | | | 0.85 | | | | 1.97 | | | | 4.05 | | | | 130 | | | | 81 | |
| | 15.07 | | | | 9.18 | | | | 0.85 | | | | 2.08 | | | | 4.23 | | | | 119 | | | | 104 | |
| | 14.45 | | | | 1.98 | | | | 0.85 | | | | 2.14 | | | | 4.31 | | | | 109 | | | | 148 | |
| | 14.85 | | | | 6.97 | | | | 0.85 | | | | 3.03 | | | | 4.47 | | | | 107 | | | | 293 | |
| | 14.97 | | | | (0.03 | )(e) | | | 0.85 | (f) | | | 5.06 | (f) | | | 2.03 | (f) | | | 100 | | | | 4 | (e) |
| | | | | | | | | | | | | | | | | | | | | | | | | | | |
| | 15.54 | | | | 8.84 | | | | 0.85 | | | | 1.87 | | | | 4.04 | | | | 148 | | | | 81 | |
| | 15.07 | | | | 9.18 | | | | 0.85 | | | | 1.98 | | | | 4.23 | | | | 119 | | | | 104 | |
| | 14.45 | | | | 1.98 | (e) | | | 0.85 | | | | 2.04 | | | | 4.31 | | | | 109 | | | | 148 | |
| | 14.85 | | | | 6.97 | | | | 0.85 | | | | 2.93 | | | | 4.47 | | | | 107 | | | | 293 | |
| | 14.97 | | | | (0.03 | )(e) | | | 0.85 | (f) | | | 5.07 | (f) | | | 2.05 | (f) | | | 100 | | | | 4 | (e) |
| | See Notes to Financial Statements. | 79 |
Financial Highlights (continued)
EMERGING MARKETS CORPORATE DEBT FUND
| | | | | | Per Share Operating Performance: |
| | | | | | Investment operations: | | Distributions to
shareholders from: |
| | | Net asset
value,
beginning
of period | | Net
invest-
ment
income(a) | | Net
realized
and
unrealized
gain (loss) | | Total
from
invest-
ment
opera-
tions | | Net
investment
income | | Net
realized
gain | | Total
distri-
butions |
| Class R4 | | | | | | | | | | | | | | | | | | | | | | | | | | | | |
| 12/31/2017 | | | $15.07 | | | | $0.59 | | | | $ 0.68 | | | | $ 1.27 | | | | $(0.64 | ) | | | $(0.16 | ) | | | $(0.80 | ) |
| 12/31/2016 | | | 14.45 | | | | 0.60 | | | | 0.68 | | | | 1.28 | | | | (0.66 | ) | | | – | | | | (0.66 | ) |
| 6/30/2015 to 12/31/2015(h) | | | 14.97 | | | | 0.29 | | | | (0.49 | ) | | | (0.20 | ) | | | (0.32 | ) | | | – | (c) | | | (0.32 | ) |
| Class R5 | | | | | | | | | | | | | | | | | | | | | | | | | | | | |
| 12/31/2017 | | | 15.07 | | | | 0.63 | | | | 0.69 | | | | 1.32 | | | | (0.68 | ) | | | (0.16 | ) | | | (0.84 | ) |
| 12/31/2016 | | | 14.45 | | | | 0.64 | | | | 0.67 | | | | 1.31 | | | | (0.69 | ) | | | – | | | | (0.69 | ) |
| 6/30/2015 to 12/31/2015(h) | | | 14.97 | | | | 0.31 | | | | (0.49 | ) | | | (0.18 | ) | | | (0.34 | ) | | | – | (c) | | | (0.34 | ) |
| Class R6 | | | | | | | | | | | | | | | | | | | | | | | | | | | | |
| 12/31/2017 | | | 15.07 | | | | 0.65 | | | | 0.68 | | | | 1.33 | | | | (0.70 | ) | | | (0.16 | ) | | | (0.86 | ) |
| 12/31/2016 | | | 14.45 | | | | 0.65 | | | | 0.67 | | | | 1.32 | | | | (0.70 | ) | | | – | | | | (0.70 | ) |
| 6/30/2015 to 12/31/2015(h) | | | 14.97 | | | | 0.31 | | | | (0.48 | ) | | | (0.17 | ) | | | (0.35 | ) | | | – | (c) | | | (0.35 | ) |
| (a) | Calculated using average shares outstanding during the period. |
| (b) | Total return for Classes A and C does not consider the effects of sales loads and assumes the reinvestment of all distributions. Total return for all other classes assumes the reinvestment of all distributions. |
| (c) | Amount less than $0.01. |
| (d) | Commenced on December 6, 2013. |
| (e) | Not annualized. |
| (f) | Annualized. |
| (g) | Commenced on April 4, 2017. |
| (h) | Commenced on June 30, 2015. |
| 80 | See Notes to Financial Statements. | |
| | | | | | | Ratios to Average Net Assets: | | Supplemental Data: |
| | | | | | | | | | | | | | | | | | | | |
Net
asset
value,
end of
period | | Total
return(b)
(%) | | Total
expenses
after
waivers
and/or reim-
bursements
(%) | | Total
expenses
(%) | | Net
invest-
ment
income
(%) | | Net
assets,
end of
period
(000) | | Portfolio
turnover
rate
(%) |
| | | | | | | | | | | | | | | | | | | | |
| | $15.54 | | | | 8.57 | | | | 1.11 | (o) | | | 1.62 | | | | 3.80 | | | | $12 | | | | 81 | |
| | 15.07 | | | | 8.92 | | | | 1.10 | | | | 1.71 | | | | 4.00 | | | | 11 | | | | 104 | |
| | 14.45 | | | | (1.33 | )(e) | | | 1.10 | (f) | | | 1.71 | (f) | | | 3.91 | (f) | | | 10 | | | | 148 | |
| | | | | | | | | | | | | | | | | | | | | | | | | | | |
| | 15.55 | | | | 8.84 | | | | 0.85 | | | | 1.37 | | | | 4.04 | | | | 54 | | | | 81 | |
| | 15.07 | | | | 9.18 | | | | 0.85 | | | | 1.49 | | | | 4.22 | | | | 35 | | | | 104 | |
| | 14.45 | | | | (1.21 | )(e) | | | 0.85 | (f) | | | 1.46 | (f) | | | 4.17 | (f) | | | 10 | | | | 148 | |
| | | | | | | | | | | | | | | | | | | | | | | | | | | |
| | 15.54 | | | | 9.01 | | | | 0.70 | | | | 1.22 | | | | 4.21 | | | | 12 | | | | 81 | |
| | 15.07 | | | | 9.26 | | | | 0.77 | | | | 1.27 | | | | 4.31 | | | | 11 | | | | 104 | |
| | 14.45 | | | | (1.18 | )(e) | | | 0.79 | (f) | | | 1.37 | (f) | | | 4.23 | (f) | | | 10 | | | | 148 | |
| | See Notes to Financial Statements. | 81 |
Financial Highlights
EMERGING MARKETS CURRENCY FUND
| | | | | | Per Share Operating Performance: |
| | | | | | Investment operations: | | Distributions to
shareholders from: |
| | | Net asset
value,
beginning
of period | | Net
invest-
ment
income(a) | | Net
realized
and
unrealized
gain (loss) | | Total
from
invest-
ment
opera-
tions | | Net
investment
income | | Return
of
capital | | Total
distri-
butions |
| Class A | | | | | | | | | | | | | | | | | | | | | | | | | | | | |
| 12/31/2017 | | | $5.11 | | | | $0.10 | | | | $ 0.44 | | | | $ 0.54 | | | | $(0.23 | ) | | $ | – | | | | $(0.23 | ) |
| 12/31/2016 | | | 5.10 | | | | 0.08 | | | | 0.21 | | | | 0.29 | | | | (0.28 | ) | | | – | | | | (0.28 | ) |
| 12/31/2015 | | | 5.76 | | | | 0.06 | | | | (0.57 | ) | | | (0.51 | ) | | | (0.07 | ) | | | (0.08 | ) | | | (0.15 | ) |
| 12/31/2014 | | | 6.25 | | | | 0.06 | | | | (0.40 | ) | | | (0.34 | ) | | | (0.15 | ) | | | – | | | | (0.15 | ) |
| 12/31/2013 | | | 6.63 | | | | 0.06 | | | | (0.27 | ) | | | (0.21 | ) | | | (0.10 | ) | | | (0.07 | ) | | | (0.17 | ) |
| Class B | | | | | | | | | | | | | | | | | | | | | | | | | | | | |
| 12/31/2017 | | | 5.13 | | | | 0.05 | | | | 0.45 | | | | 0.50 | | | | (0.19 | ) | | | – | | | | (0.19 | ) |
| 12/31/2016 | | | 5.12 | | | | 0.04 | | | | 0.21 | | | | 0.25 | | | | (0.24 | ) | | | – | | | | (0.24 | ) |
| 12/31/2015 | | | 5.79 | | | | 0.02 | | | | (0.58 | ) | | | (0.56 | ) | | | (0.05 | ) | | | (0.06 | ) | | | (0.11 | ) |
| 12/31/2014 | | | 6.28 | | | | 0.01 | | | | (0.39 | ) | | | (0.38 | ) | | | (0.11 | ) | | | – | | | | (0.11 | ) |
| 12/31/2013 | | | 6.66 | | | | 0.01 | | | | (0.27 | ) | | | (0.26 | ) | | | (0.07 | ) | | | (0.05 | ) | | | (0.12 | ) |
| Class C | | | | | | | | | | | | | | | | | | | | | | | | | | | | |
| 12/31/2017 | | | 5.14 | | | | 0.07 | | | | 0.44 | | | | 0.51 | | | | (0.20 | ) | | | – | | | | (0.20 | ) |
| 12/31/2016 | | | 5.13 | | | | 0.05 | | | | 0.21 | | | | 0.26 | | | | (0.25 | ) | | | – | | | | (0.25 | ) |
| 12/31/2015 | | | 5.79 | | | | 0.03 | | | | (0.57 | ) | | | (0.54 | ) | | | (0.06 | ) | | | (0.06 | ) | | | (0.12 | ) |
| 12/31/2014 | | | 6.29 | | | | 0.02 | | | | (0.40 | ) | | | (0.38 | ) | | | (0.12 | ) | | | – | | | | (0.12 | ) |
| 12/31/2013 | | | 6.67 | | | | 0.02 | | | | (0.27 | ) | | | (0.25 | ) | | | (0.07 | ) | | | (0.06 | ) | | | (0.13 | ) |
| Class F | | | | | | | | | | | | | | | | | | | | | | | | | | | | |
| 12/31/2017 | | | 5.11 | | | | 0.10 | | | | 0.45 | | | | 0.55 | | | | (0.24 | ) | | | – | | | | (0.24 | ) |
| 12/31/2016 | | | 5.10 | | | | 0.08 | | | | 0.21 | | | | 0.29 | | | | (0.28 | ) | | | – | | | | (0.28 | ) |
| 12/31/2015 | | | 5.76 | | | | 0.07 | | | | (0.57 | ) | | | (0.50 | ) | | | (0.08 | ) | | | (0.08 | ) | | | (0.16 | ) |
| 12/31/2014 | | | 6.25 | | | | 0.06 | | | | (0.39 | ) | | | (0.33 | ) | | | (0.16 | ) | | | – | | | | (0.16 | ) |
| 12/31/2013 | | | 6.62 | | | | 0.07 | | | | (0.27 | ) | | | (0.20 | ) | | | (0.09 | ) | | | (0.08 | ) | | | (0.17 | ) |
| Class F3 | | | | | | | | | | | | | | | | | | | | | | | | | | | | |
| 4/4/2017 to 12/31/2017(c) | | | 5.31 | | | | 0.08 | | | | 0.21 | | | | 0.29 | | | | (0.19 | ) | | | – | | | | (0.19 | ) |
| Class I | | | | | | | | | | | | | | | | | | | | | | | | | | | | |
| 12/31/2017 | | | 5.10 | | | | 0.11 | | | | 0.44 | | | | 0.55 | | | | (0.24 | ) | | | – | | | | (0.24 | ) |
| 12/31/2016 | | | 5.09 | | | | 0.09 | | | | 0.21 | | | | 0.30 | | | | (0.29 | ) | | | – | | | | (0.29 | ) |
| 12/31/2015 | | | 5.75 | | | | 0.07 | | | | (0.57 | ) | | | (0.50 | ) | | | (0.08 | ) | | | (0.08 | ) | | | (0.16 | ) |
| 12/31/2014 | | | 6.24 | | | | 0.07 | | | | (0.39 | ) | | | (0.32 | ) | | | (0.17 | ) | | | – | | | | (0.17 | ) |
| 12/31/2013 | | | 6.61 | | | | 0.08 | | | | (0.27 | ) | | | (0.19 | ) | | | (0.10 | ) | | | (0.08 | ) | | | (0.18 | ) |
| Class R2 | | | | | | | | | | | | | | | | | | | | | | | | | | | | |
| 12/31/2017 | | | 5.12 | | | | 0.08 | | | | 0.44 | | | | 0.52 | | | | (0.21 | ) | | | – | | | | (0.21 | ) |
| 12/31/2016 | | | 5.11 | | | | 0.06 | | | | 0.21 | | | | 0.27 | | | | (0.26 | ) | | | – | | | | (0.26 | ) |
| 12/31/2015 | | | 5.77 | | | | 0.04 | | | | (0.57 | ) | | | (0.53 | ) | | | (0.06 | ) | | | (0.07 | ) | | | (0.13 | ) |
| 12/31/2014 | | | 6.26 | | | | 0.03 | | | | (0.39 | ) | | | (0.36 | ) | | | (0.13 | ) | | | – | | | | (0.13 | ) |
| 12/31/2013 | | | 6.64 | | | | 0.04 | | | | (0.28 | ) | | | (0.24 | ) | | | (0.08 | ) | | | (0.06 | ) | | | (0.14 | ) |
| 82 | See Notes to Financial Statements. | |
| | | | | Ratios to
Average Net Assets: | | Supplemental Data: |
| | | | | | | |
Net
asset
value,
end of
period | | Total
return(b)
(%) | | Total
expenses
(%) | | Net
invest-
ment
income
(%) | | Net
assets,
end of
period
(000) | | Portfolio
turnover
rate
(%) |
| | | | | | | | | | | |
| $ | 5.42 | | | | 10.73 | | | | 0.94 | | | | 1.84 | | | $ | 17,746 | | | | 35 | |
| | 5.11 | | | | 5.68 | | | | 0.99 | | | | 1.51 | | | | 18,357 | | | | 90 | |
| | 5.10 | | | | (8.95 | ) | | | 0.98 | | | | 1.10 | | | | 20,466 | | | | 52 | |
| | 5.76 | | | | (5.49 | ) | | | 0.98 | | | | 0.93 | | | | 30,554 | | | | 113 | |
| | 6.25 | | | | (3.21 | ) | | | 0.99 | | | | 0.97 | | | | 47,961 | | | | 105 | |
| | | | | | | | | | | | | | | | | | | | | | | |
| | 5.44 | | | | 9.86 | | | | 1.73 | | | | 1.03 | | | | 11 | | | | 35 | |
| | 5.13 | | | | 4.83 | | | | 1.80 | | | | 0.71 | | | | 56 | | | | 90 | |
| | 5.12 | | | | (9.79 | ) | | | 1.78 | | | | 0.30 | | | | 178 | | | | 52 | |
| | 5.79 | | | | (6.20 | ) | | | 1.78 | | | | 0.13 | | | | 350 | | | | 113 | |
| | 6.28 | | | | (3.95 | ) | | | 1.79 | | | | 0.18 | | | | 696 | | | | 105 | |
| | | | | | | | | | | | | | | | | | | | | | | |
| | 5.45 | | | | 10.03 | | | | 1.55 | | | | 1.22 | | | | 3,158 | | | | 35 | |
| | 5.14 | | | | 5.03 | | | | 1.60 | | | | 0.91 | | | | 4,025 | | | | 90 | |
| | 5.13 | | | | (9.44 | ) | | | 1.59 | | | | 0.49 | | | | 5,558 | | | | 52 | |
| | 5.79 | | | | (6.19 | ) | | | 1.61 | | | | 0.31 | | | | 9,675 | | | | 113 | |
| | 6.29 | | | | (3.78 | ) | | | 1.62 | | | | 0.34 | | | | 17,378 | | | | 105 | |
| | | | | | | | | | | | | | | | | | | | | | | |
| | 5.42 | | | | 10.83 | | | | 0.84 | | | | 1.94 | | | | 7,311 | | | | 35 | |
| | 5.11 | | | | 5.79 | | | | 0.89 | | | | 1.61 | | | | 7,366 | | | | 90 | |
| | 5.10 | | | | (8.86 | ) | | | 0.88 | | | | 1.19 | | | | 9,439 | | | | 52 | |
| | 5.76 | | | | (5.40 | ) | | | 0.88 | | | | 1.03 | | | | 21,550 | | | | 113 | |
| | 6.25 | | | | (2.97 | ) | | | 0.89 | | | | 1.06 | | | | 36,181 | | | | 105 | |
| | | | | | | | | | | | | | | | | | | | | | | |
| | 5.41 | | | | 5.45 | (e) | | | 0.75 | (f) | | | 2.06 | (f) | | | 457 | | | | 35 | |
| | | | | | | | | | | | | | | | | | | | | | | |
| | 5.41 | | | | 10.96 | | | | 0.74 | | | | 2.03 | | | | 189,184 | | | | 35 | |
| | 5.10 | | | | 5.90 | | | | 0.79 | | | | 1.71 | | | | 356,968 | | | | 90 | |
| | 5.09 | | | | (8.79 | ) | | | 0.78 | | | | 1.29 | | | | 442,393 | | | | 52 | |
| | 5.75 | | | | (5.32 | ) | | | 0.78 | | | | 1.12 | | | | 317,393 | | | | 113 | |
| | 6.24 | | | | (2.88 | ) | | | 0.80 | | | | 1.18 | | | | 295,136 | | | | 105 | |
| | | | | | | | | | | | | | | | | | | | | | | |
| | 5.43 | | | | 10.28 | | | | 1.34 | | | | 1.44 | | | | 79 | | | | 35 | |
| | 5.12 | | | | 5.26 | | | | 1.39 | | | | 1.11 | | | | 96 | | | | 90 | |
| | 5.11 | | | | (9.30 | ) | | | 1.38 | | | | 0.70 | | | | 101 | | | | 52 | |
| | 5.77 | | | | (5.85 | ) | | | 1.37 | | | | 0.51 | | | | 110 | | | | 113 | |
| | 6.26 | | | | (3.59 | ) | | | 1.40 | | | | 0.58 | | | | 248 | | | | 105 | |
| | See Notes to Financial Statements. | 83 |
Financial Highlights (continued)
EMERGING MARKETS CURRENCY FUND
| | | | | Per Share Operating Performance: |
| | | | | Investment operations: | | Distributions to
shareholders from: |
| | | Net asset
value,
beginning
of period | | Net
invest-
ment
income(a) | | Net
realized
and
unrealized
gain (loss) | | Total
from
invest-
ment
opera-
tions | | Net
investment
income | | Return
of
capital | | Total
distri-
butions |
| Class R3 | | | | | | | | | | | | | | | | | | | | | | | | | | | | |
| 12/31/2017 | | | $5.10 | | | | $0.08 | | | | $ 0.44 | | | | $ 0.52 | | | | $(0.21 | ) | | $ | – | | | | $(0.21 | ) |
| 12/31/2016 | | | 5.09 | | | | 0.06 | | | | 0.21 | | | | 0.27 | | | | (0.26 | ) | | | – | | | | (0.26 | ) |
| 12/31/2015 | | | 5.75 | | | | 0.04 | | | | (0.57 | ) | | | (0.53 | ) | | | (0.06 | ) | | | (0.07 | ) | | | (0.13 | ) |
| 12/31/2014 | | | 6.24 | | | | 0.04 | | | | (0.39 | ) | | | (0.35 | ) | | | (0.14 | ) | | | – | | | | (0.14 | ) |
| 12/31/2013 | | | 6.61 | | | | 0.04 | | | | (0.26 | ) | | | (0.22 | ) | | | (0.09 | ) | | | (0.06 | ) | | | (0.15 | ) |
| Class R4 | | | | | | | | | | | | | | | | | | | | | | | | | | | | |
| 12/31/2017 | | | 5.11 | | | | 0.10 | | | | 0.44 | | | | 0.54 | | | | (0.23 | ) | | | – | | | | (0.23 | ) |
| 12/31/2016 | | | 5.10 | | | | 0.08 | | | | 0.21 | | | | 0.29 | | | | (0.28 | ) | | | – | | | | (0.28 | ) |
| 6/30/2015 to 12/31/2015(d) | | | 5.53 | | | | 0.03 | | | | (0.39 | ) | | | (0.36 | ) | | | (0.03 | ) | | | (0.04 | ) | | | (0.07 | ) |
| Class R5 | | | | | | | | | | | | | | | | | | | | | | | | | | | | |
| 12/31/2017 | | | 5.10 | | | | 0.11 | | | | 0.44 | | | | 0.55 | | | | (0.24 | ) | | | – | | | | (0.24 | ) |
| 12/31/2016 | | | 5.09 | | | | 0.09 | | | | 0.21 | | | | 0.30 | | | | (0.29 | ) | | | – | | | | (0.29 | ) |
| 6/30/2015 to 12/31/2015(d) | | | 5.52 | | | | 0.04 | | | | (0.39 | ) | | | (0.35 | ) | | | (0.04 | ) | | | (0.04 | ) | | | (0.08 | ) |
| Class R6 | | | | | | | | | | | | | | | | | | | | | | | | | | | | |
| 12/31/2017 | | | 5.10 | | | | 0.11 | | | | 0.44 | | | | 0.55 | | | | (0.24 | ) | | | – | | | | (0.24 | ) |
| 12/31/2016 | | | 5.09 | | | | 0.10 | | | | 0.20 | | | | 0.30 | | | | (0.29 | ) | | | – | | | | (0.29 | ) |
| 6/30/2015 to 12/31/2015(d) | | | 5.52 | | | | 0.04 | | | | (0.39 | ) | | | (0.35 | ) | | | (0.04 | ) | | | (0.04 | ) | | | (0.08 | ) |
| (a) | Calculated using average shares outstanding during the period. |
| (b) | Total return for Classes A, B and C does not consider the effects of sales loads and assumes the reinvestment of all distributions. Total return for all other classes assumes the reinvestment of all distributions. |
| (c) | Commenced on April 4, 2017. |
| (d) | Commenced on June 30, 2015. |
| (e) | Not annualized. |
| (f) | Annualized. |
| 84 | See Notes to Financial Statements. | |
| | | | | Ratios to
Average Net Assets: | | Supplemental Data: |
| | | | | | | |
Net
asset
value,
end of
period | | Total
return(b)
(%) | | Total
expenses
(%) | | Net
invest-
ment
income
(%) | | Net
assets,
end of
period
(000) | | Portfolio
turnover
rate
(%) |
| | | | | | | | | | | |
| $ | 5.41 | | | | 10.42 | | | | 1.23 | | | | 1.55 | | | $ | 264 | | | | 35 | |
| | 5.10 | | | | 5.38 | | | | 1.28 | | | | 1.22 | | | | 296 | | | | 90 | |
| | 5.09 | | | | (9.24 | ) | | | 1.27 | | | | 0.81 | | | | 285 | | | | 52 | |
| | 5.75 | | | | (5.77 | ) | | | 1.27 | | | | 0.65 | | | | 524 | | | | 113 | |
| | 6.24 | | | | (3.35 | ) | | | 1.28 | | | | 0.70 | | | | 494 | | | | 105 | |
| | | | | | | | | | | | | | | | | | | | | | | |
| | 5.42 | | | | 10.67 | | | | 0.99 | | | | 1.83 | | | | 27 | | | | 35 | |
| | 5.11 | | | | 5.67 | | | | 1.01 | | | | 1.50 | | | | 10 | | | | 90 | |
| | 5.10 | | | | (6.44 | )(e) | | | 1.01 | (f) | | | 1.13 | (f) | | | 9 | | | | 52 | |
| | | | | | | | | | | | | | | | | | | | | | | |
| | 5.41 | | | | 10.97 | | | | 0.73 | | | | 2.06 | | | | 11 | | | | 35 | |
| | 5.10 | | | | 5.94 | | | | 0.75 | | | | 1.76 | | | | 10 | | | | 90 | |
| | 5.09 | | | | (6.34 | )(e) | | | 0.76 | (f) | | | 1.37 | (f) | | | 9 | | | | 52 | |
| | | | | | | | | | | | | | | | | | | | | | | |
| | 5.41 | | | | 10.99 | | | | 0.74 | | | | 2.11 | | | | 524 | | | | 35 | |
| | 5.10 | | | | 6.04 | | | | 0.66 | | | | 1.85 | | | | 10 | | | | 90 | |
| | 5.09 | | | | (6.29 | )(e) | | | 0.67 | (f) | | | 1.47 | (f) | | | 9 | | | | 52 | |
| | See Notes to Financial Statements. | 85 |
Financial Highlights
EMERGING MARKETS LOCAL BOND FUND
| | | | | Per Share Operating Performance: |
| | | | | Investment operations: | | Distributions to
shareholders from: |
| | | Net asset
value,
beginning
of period | | Net
invest-
ment
income(a) | | Net
realized
and
unrealized
gain (loss) | | Total
from
invest-
ment
opera-
tions | | Net
investment
income | | Return
of
capital | | Total
distri-
butions |
| Class A | | | | | | | | | | | | | | | | | | | | | | | | | | | | |
| 12/31/2017 | | | $10.03 | | | | $0.72 | | | $ | 0.64 | | | | $ 1.36 | | | | $(0.26 | ) | | | $(0.49 | ) | | | $(0.75 | ) |
| 12/31/2016 | | | 9.93 | | | | 0.61 | | | | 0.15 | | | | 0.76 | | | | – | | | | (0.66 | ) | | | (0.66 | ) |
| 12/31/2015 | | | 12.60 | | | | 0.62 | | | | (2.62 | ) | | | (2.00 | ) | | | – | | | | (0.67 | ) | | | (0.67 | ) |
| 12/31/2014 | | | 14.39 | | | | 0.75 | | | | (1.70 | ) | | | (0.95 | ) | | | (0.84 | ) | | | – | | | | (0.84 | ) |
| 6/21/2013 to 12/31/2013(c) | | | 15.00 | | | | 0.37 | | | | (0.51 | ) | | | (0.14 | ) | | | (0.47 | ) | | | – | | | | (0.47 | ) |
| Class C | | | | | | | | | | | | | | | | | | | | | | | | | | | | |
| 12/31/2017 | | | 10.03 | | | | 0.66 | | | | 0.63 | | | | 1.29 | | | | (0.19 | ) | | | (0.49 | ) | | | (0.68 | ) |
| 12/31/2016 | | | 9.93 | | | | 0.55 | | | | 0.14 | | | | 0.69 | | | | – | | | | (0.59 | ) | | | (0.59 | ) |
| 12/31/2015 | | | 12.60 | | | | 0.53 | | | | (2.61 | ) | | | (2.08 | ) | | | – | | | | (0.59 | ) | | | (0.59 | ) |
| 12/31/2014 | | | 14.38 | | | | 0.64 | | | | (1.69 | ) | | | (1.05 | ) | | | (0.73 | ) | | | – | | | | (0.73 | ) |
| 6/21/2013 to 12/31/2013(c) | | | 15.00 | | | | 0.31 | | | | (0.52 | ) | | | (0.21 | ) | | | (0.41 | ) | | | – | | | | (0.41 | ) |
| Class F | | | | | | | | | | | | | | | | | | | | | | | | | | | | |
| 12/31/2017 | | | 10.02 | | | | 0.74 | | | | 0.63 | | | | 1.37 | | | | (0.27 | ) | | | (0.49 | ) | | | (0.76 | ) |
| 12/31/2016 | | | 9.93 | | | | 0.62 | | | | 0.14 | | | | 0.76 | | | | – | | | | (0.67 | ) | | | (0.67 | ) |
| 12/31/2015 | | | 12.60 | | | | 0.63 | | | | (2.61 | ) | | | (1.98 | ) | | | – | | | | (0.69 | ) | | | (0.69 | ) |
| 12/31/2014 | | | 14.38 | | | | 0.76 | | | | (1.68 | ) | | | (0.92 | ) | | | (0.86 | ) | | | – | | | | (0.86 | ) |
| 6/21/2013 to 12/31/2013(c) | | | 15.00 | | | | 0.38 | | | | (0.52 | ) | | | (0.14 | ) | | | (0.48 | ) | | | – | | | | (0.48 | ) |
| Class F3 | | | | | | | | | | | | | | | | | | | | | | | | | | | | |
| 4/4/2017 to 12/31/2017(f) | | | 10.54 | | | | 0.56 | | | | 0.12 | | | | 0.68 | | | | (0.10 | ) | | | (0.49 | ) | | | (0.59 | ) |
| Class I | | | | | | | | | | | | | | | | | | | | | | | | | | | | |
| 12/31/2017 | | | 10.03 | | | | 0.74 | | | | 0.64 | | | | 1.38 | | | | (0.28 | ) | | | (0.49 | ) | | | (0.77 | ) |
| 12/31/2016 | | | 9.93 | | | | 0.64 | | | | 0.14 | | | | 0.78 | | | | – | | | | (0.68 | ) | | | (0.68 | ) |
| 12/31/2015 | | | 12.60 | | | | 0.64 | | | | (2.61 | ) | | | (1.97 | ) | | | – | | | | (0.70 | ) | | | (0.70 | ) |
| 12/31/2014 | | | 14.38 | | | | 0.79 | | | | (1.70 | ) | | | (0.91 | ) | | | (0.87 | ) | | | – | | | | (0.87 | ) |
| 6/21/2013 to 12/31/2013(c) | | | 15.00 | | | | 0.38 | | | | (0.52 | ) | | | (0.14 | ) | | | (0.48 | ) | | | – | | | | (0.48 | ) |
| Class R2 | | | | | | | | | | | | | | | | | | | | | | | | | | | | |
| 12/31/2017 | | | 10.03 | | | | 0.74 | | | | 0.64 | | | | 1.38 | | | | (0.28 | ) | | | (0.49 | ) | | | (0.77 | ) |
| 12/31/2016 | | | 9.93 | | | | 0.64 | | | | 0.14 | | | | 0.78 | | | | – | | | | (0.68 | ) | | | (0.68 | ) |
| 12/31/2015 | | | 12.60 | | | | 0.64 | | | | (2.61 | ) | | | (1.97 | ) | | | – | | | | (0.70 | ) | | | (0.70 | ) |
| 12/31/2014 | | | 14.38 | | | | 0.79 | | | | (1.70 | ) | | | (0.91 | ) | | | (0.87 | ) | | | – | | | | (0.87 | ) |
| 6/21/2013 to 12/31/2013(c) | | | 15.00 | | | | 0.34 | | | | (0.52 | ) | | | (0.18 | ) | | | (0.44 | ) | | | – | | | | (0.44 | ) |
| Class R3 | | | | | | | | | | | | | | | | | | | | | | | | | | | | |
| 12/31/2017 | | | 10.03 | | | | 0.74 | | | | 0.64 | | | | 1.38 | | | | (0.28 | ) | | | (0.49 | ) | | | (0.77 | ) |
| 12/31/2016 | | | 9.93 | | | | 0.64 | | | | 0.14 | | | | 0.78 | | | | – | | | | (0.68 | ) | | | (0.68 | ) |
| 12/31/2015 | | | 12.60 | | | | 0.64 | | | | (2.61 | ) | | | (1.97 | ) | | | – | | | | (0.70 | ) | | | (0.70 | ) |
| 12/31/2014 | | | 14.38 | | | | 0.79 | | | | (1.70 | ) | | | (0.91 | ) | | | (0.87 | ) | | | – | | | | (0.87 | ) |
| 6/21/2013 to 12/31/2013(c) | | | 15.00 | | | | 0.35 | | | | (0.52 | ) | | | (0.17 | ) | | | (0.45 | ) | | | – | | | | (0.45 | ) |
| Class R4 | | | | | | | | | | | | | | | | | | | | | | | | | | | | |
| 12/31/2017 | | | 10.02 | | | | 0.72 | | | | 0.65 | | | | 1.37 | | | | (0.27 | ) | | | (0.49 | ) | | | (0.76 | ) |
| 12/31/2016 | | | 9.93 | | | | 0.61 | | | | 0.14 | | | | 0.75 | | | | – | | | | (0.66 | ) | | | (0.66 | ) |
| 6/30/2015 to 12/31/2015(g) | | | 11.53 | | | | 0.29 | | | | (1.58 | ) | | | (1.29 | ) | | | – | | | | (0.31 | ) | | | (0.31 | ) |
| 86 | See Notes to Financial Statements. | |
| | | | | Ratios to Average Net Assets: | | Supplemental Data: |
| | | | | | | |
Net
asset
value,
end of
period | | Total
return(b)
(%) | | Total
expenses
after
waivers
and/or reim-
bursements
(%) | | Total
expenses
(%) | | Net
invest-
ment
income
(%) | | Net
assets,
end of
period
(000) | | Portfolio
turnover
rate
(%) |
| | $10.64 | | | | 13.87 | | | | 1.05 | | | | 3.19 | | | | 6.80 | | | | $6,834 | | | | 58 | |
| | 10.03 | | | | 7.60 | | | | 1.05 | | | | 3.50 | | | | 5.87 | | | | 6,393 | | | | 58 | |
| | 9.93 | | | | (16.32 | ) | | | 1.05 | | | | 3.22 | | | | 5.44 | | | | 5,097 | | | | 62 | |
| | 12.60 | | | | (7.05 | ) | | | 1.05 | | | | 3.01 | | | | 5.33 | | | | 8,345 | | | | 39 | |
| | 14.39 | | | | (0.97 | )(d) | | | 1.02 | (e) | | | 5.09 | (e) | | | 4.79 | (e) | | | 4,950 | | | | 28 | (d) |
| | | | | | | | | | | | | | | | | | | | | | | | | | | |
| | 10.64 | | | | 13.13 | | | | 1.71 | | | | 3.88 | | | | 6.18 | | | | 1,064 | | | | 58 | |
| | 10.03 | | | | 6.90 | | | | 1.71 | | | | 4.17 | | | | 5.22 | | | | 444 | | | | 58 | |
| | 9.93 | | | | (16.92 | ) | | | 1.77 | | | | 3.98 | | | | 4.73 | | | | 387 | | | | 62 | |
| | 12.60 | | | | (7.71 | ) | | | 1.82 | | | | 3.80 | | | | 4.53 | | | | 396 | | | | 39 | |
| | 14.38 | | | | (1.43 | )(d) | | | 1.77 | (e) | | | 5.63 | (e) | | | 3.97 | (e) | | | 226 | | | | 28 | (d) |
| | | | | | | | | | | | | | | | | | | | | | | | | | | |
| | 10.63 | | | | 13.98 | | | | 0.95 | | | | 3.10 | | | | 6.92 | | | | 320 | | | | 58 | |
| | 10.02 | | | | 7.59 | | | | 0.95 | | | | 3.32 | | | | 5.95 | | | | 236 | | | | 58 | |
| | 9.93 | | | | (16.23 | ) | | | 0.95 | | | | 3.10 | | | | 5.54 | | | | 129 | | | | 62 | |
| | 12.60 | | | | (6.88 | ) | | | 0.95 | | | | 2.96 | | | | 5.45 | | | | 179 | | | | 39 | |
| | 14.38 | | | | (0.99 | )(d) | | | 0.92 | (e) | | | 5.16 | (e) | | | 4.84 | (e) | | | 116 | | | | 28 | (d) |
| | | | | | | | | | | | | | | | | | | | | | | | | | | |
| | 10.63 | | | | 6.59 | (d) | | | 0.73 | (e) | | | 3.01 | (e) | | | 7.13 | (e) | | | 380 | | | | 58 | |
| | | | | | | | | | | | | | | | | | | | | | | | | | | |
| | 10.64 | | | | 14.08 | | | | 0.85 | | | | 3.00 | | | | 7.00 | | | | 2,197 | | | | 58 | |
| | 10.03 | | | | 7.81 | | | | 0.85 | | | | 3.33 | | | | 6.09 | | | | 1,926 | | | | 58 | |
| | 9.93 | | | | (16.15 | ) | | | 0.85 | | | | 3.02 | | | | 5.65 | | | | 1,786 | | | | 62 | |
| | 12.60 | | | | (6.79 | ) | | | 0.85 | | | | 2.96 | | | | 5.58 | | | | 2,130 | | | | 39 | |
| | 14.38 | | | | (0.94 | )(d) | | | 0.82 | (e) | | | 5.19 | (e) | | | 4.94 | (e) | | | 2,286 | | | | 28 | (d) |
| | | | | | | | | | | | | | | | | | | | | | | | | | | |
| | 10.64 | | | | 14.09 | | | | 0.85 | | | | 3.60 | | | | 7.01 | | | | 95 | | | | 58 | |
| | 10.03 | | | | 7.81 | | | | 0.85 | | | | 3.93 | | | | 6.09 | | | | 83 | | | | 58 | |
| | 9.93 | | | | (16.15 | ) | | | 0.85 | | | | 3.62 | | | | 5.65 | | | | 77 | | | | 62 | |
| | 12.60 | | | | (6.79 | ) | | | 0.85 | | | | 3.56 | | | | 5.57 | | | | 92 | | | | 39 | |
| | 14.38 | | | | (1.23 | )(d) | | | 1.40 | ((e) | | | 5.79 | (e) | | | 4.36 | (e) | | | 99 | | | | 28 | (d) |
| | | | | | | | | | | | | | | | | | | | | | | | | | | |
| | 10.64 | | | | 14.09 | | | | 0.85 | | | | 3.50 | | | | 7.01 | | | | 95 | | | | 58 | |
| | 10.03 | | | | 7.81 | | | | 0.85 | | | | 3.83 | | | | 6.09 | | | | 84 | | | | 58 | |
| | 9.93 | | | | (16.15 | ) | | | 0.85 | | | | 3.52 | | | | 5.65 | | | | 77 | | | | 62 | |
| | 12.60 | | | | (6.79 | ) | | | 0.85 | | | | 3.46 | | | | 5.57 | | | | 92 | | | | 39 | |
| | 14.38 | | | | (1.18 | )(d) | | | 1.30 | (e) | | | 5.69 | (e) | | | 4.46 | (e) | | | 99 | | | | 28 | (d) |
| | | | | | | | | | | | | | | | | | | | | | | | | | | |
| | 10.63 | | | | 14.03 | | | | 1.10 | | | | 3.22 | | | | 6.85 | | | | 11 | | | | 58 | |
| | 10.02 | | | | 7.49 | | | | 1.10 | | | | 3.55 | | | | 5.88 | | | | 10 | | | | 58 | |
| | 9.93 | | | | (11.24 | )(d) | | | 1.10 | (e) | | | 3.60 | (e) | | | 5.50 | (e) | | | 9 | | | | 62 | (d) |
| | See Notes to Financial Statements. | 87 |
Financial Highlights (continued)
EMERGING MARKETS LOCAL BOND FUND
| | | | | Per Share Operating Performance: |
| | | | | Investment operations: | | Distributions to
shareholders from: |
| | | Net asset
value,
beginning
of period | | Net
invest-
ment
income(a) | | Net
realized
and
unrealized
gain (loss) | | Total
from
invest-
ment
opera-
tions | | Net
investment
income | | Return
of
capital | | Total
distri-
butions |
| Class R5 | | | | | | | | | | | | | | | | | | | | | | | | | | | | |
| 12/31/2017 | | | $10.03 | | | | $0.75 | | | | $ 0.63 | | | | $ 1.38 | | | | $(0.29 | ) | | | $(0.49 | ) | | | $(0.78 | ) |
| 12/31/2016 | | | 9.93 | | | | 0.64 | | | | 0.15 | | | | 0.79 | | | | – | | | | (0.69 | ) | | | (0.69 | ) |
| 6/30/2015 to 12/31/2015(g) | | | 11.53 | | | | 0.30 | | | | (1.57 | ) | | | (1.27 | ) | | | – | | | | (0.33 | ) | | | (0.33 | ) |
| Class R6 | | | | | | | | | | | | | | | | | | | | | | | | | | | | |
| 12/31/2017 | | | 10.03 | | | | 0.76 | | | | 0.64 | | | | 1.40 | | | | (0.30 | ) | | | (0.49 | ) | | | (0.79 | ) |
| 12/31/2016 | | | 9.93 | | | | 0.64 | | | | 0.15 | | | | 0.79 | | | | – | | | | (0.69 | ) | | | (0.69 | ) |
| 6/30/2015 to 12/31/2015(g) | | | 11.53 | | | | 0.31 | | | | (1.58 | ) | | | (1.27 | ) | | | – | | | | (0.33 | ) | | | (0.33 | ) |
| | |
| (a) | Calculated using average shares outstanding during the period. |
| (b) | Total return for Classes A and C does not consider the effects of sales loads and assumes the reinvestment of all distributions. Total return for all other classes assumes the reinvestment of all distributions. |
| (c) | Commenced on June 21, 2013. |
| (d) | Not annualized. |
| (e) | Annualized. |
| (f) | Commenced on April 4, 2017. |
| (g) | Commenced on June 30, 2015. |
| 88 | See Notes to Financial Statements. | |
| | | | | Ratios to Average Net Assets: | | Supplemental Data: |
| | | | | | | | | | | | | |
Net
asset
value,
end of
period | | Total
return(b)
(%) | | Total
expenses
after
waivers
and/or reim-
bursements
(%) | | Total
expenses
(%) | | Net
invest-
ment
income
(%) | | Net
assets,
end of
period
(000) | | Portfolio
turnover
rate
(%) |
| | | | | | | | | | | | | |
| | $10.63 | | | | 14.09 | | | | 0.85 | | | | 2.99 | | | | 7.05 | | | | $25 | | | | 58 | |
| | 10.03 | | | | 7.87 | | | | 0.85 | | | | 3.32 | | | | 6.11 | | | | 10 | | | | 58 | |
| | 9.93 | | | | (11.13 | )(d) | | | 0.85 | (e) | | | 3.35 | (e) | | | 5.74 | (e) | | | 9 | | | | 62 | (d) |
| | | | | | | | | | | | | | | | | | | | | | | | | | | |
| | 10.64 | | | | 14.30 | | | | 0.75 | | | | 2.93 | | | | 7.19 | | | | 11 | | | | 58 | |
| | 10.03 | | | | 7.93 | | | | 0.79 | | | | 3.21 | | | | 6.17 | | | | 10 | | | | 58 | |
| | 9.93 | | | | (11.11 | )(d) | | | 0.80 | (e) | | | 3.31 | ((e) | | | 5.79 | (e) | | | 9 | | | | 62 | (d) |
| | See Notes to Financial Statements. | 89 |
Financial Highlights (continued)
MULTI-ASSET GLOBAL OPPORTUNITY FUND
| | | | | Per Share Operating Performance: |
| | | | | Investment operations: | | | | Distributions to
shareholders from: |
| | | Net asset
value,
beginning
of period | | Net
invest-
ment
income(a) | | Net
realized
and
unrealized
gain (loss) | | Total
from
invest-
ment
opera-
tions | | Net
investment
income | | Return
of
capital | | Total
distri-
butions |
| Class A | | | | | | | | | | | | | | | | | | | | | | | | | | | | |
| 12/31/2017 | | | $10.69 | | | | $0.28 | | | | $ 1.06 | | | | $ 1.34 | | | | $(0.40 | ) | | $ | – | | | | $(0.40 | ) |
| 12/31/2016 | | | 10.28 | | | | 0.37 | | | | 0.52 | | | | 0.89 | | | | (0.36 | ) | | | (0.12 | ) | | | (0.48 | ) |
| 12/31/2015 | | | 12.04 | | | | 0.33 | | | | (1.18 | ) | | | (0.85 | ) | | | (0.29 | ) | | | (0.62 | ) | | | (0.91 | ) |
| 12/31/2014 | | | 12.49 | | | | 0.40 | | | | (0.12 | ) | | | 0.28 | | | | (0.49 | ) | | | (0.24 | ) | | | (0.73 | ) |
| 12/31/2013 | | | 11.42 | | | | 0.39 | | | | 1.26 | | | | 1.65 | | | | (0.50 | ) | | | (0.08 | ) | | | (0.58 | ) |
| Class B | | | | | | | | | | | | | | | | | | | | | | | | | | | | |
| 12/31/2017 | | | 9.65 | | | | 0.15 | | | | 0.98 | | | | 1.13 | | | | (0.31 | ) | | | – | | | | (0.31 | ) |
| 12/31/2016 | | | 9.32 | | | | 0.25 | | | | 0.49 | | | | 0.74 | | | | (0.29 | ) | | | (0.12 | ) | | | (0.41 | ) |
| 12/31/2015 | | | 11.00 | | | | 0.22 | | | | (1.07 | ) | | | (0.85 | ) | | | (0.21 | ) | | | (0.62 | ) | | | (0.83 | ) |
| 12/31/2014 | | | 11.46 | | | | 0.26 | | | | (0.08 | ) | | | 0.18 | | | | (0.40 | ) | | | (0.24 | ) | | | (0.64 | ) |
| 12/31/2013 | | | 10.53 | | | | 0.26 | | | | 1.16 | | | | 1.42 | | | | (0.41 | ) | | | (0.08 | ) | | | (0.49 | ) |
| Class C | | | | | | | | | | | | | | | | | | | | | | | | | | | | |
| 12/31/2017 | | | 9.64 | | | | 0.18 | | | | 0.95 | | | | 1.13 | | | | (0.33 | ) | | | – | | | | (0.33 | ) |
| 12/31/2016 | | | 9.31 | | | | 0.26 | | | | 0.48 | | | | 0.74 | | | | (0.29 | ) | | | (0.12 | ) | | | (0.41 | ) |
| 12/31/2015 | | | 11.00 | | | | 0.23 | | | | (1.09 | ) | | | (0.86 | ) | | | (0.21 | ) | | | (0.62 | ) | | | (0.83 | ) |
| 12/31/2014 | | | 11.47 | | | | 0.27 | | | | (0.09 | ) | | | 0.18 | | | | (0.41 | ) | | | (0.24 | ) | | | (0.65 | ) |
| 12/31/2013 | | | 10.54 | | | | 0.27 | | | | 1.16 | | | | 1.43 | | | | (0.42 | ) | | | (0.08 | ) | | | (0.50 | ) |
| Class F | | | | | | | | | | | | | | | | | | | | | | | | | | | | |
| 12/31/2017 | | | 10.70 | | | | 0.30 | | | | 1.05 | | | | 1.35 | | | | (0.42 | ) | | | – | | | | (0.42 | ) |
| 12/31/2016 | | | 10.29 | | | | 0.37 | | | | 0.54 | | | | 0.91 | | | | (0.38 | ) | | | (0.12 | ) | | | (0.50 | ) |
| 12/31/2015 | | | 12.05 | | | | 0.35 | | | | (1.18 | ) | | | (0.83 | ) | | | (0.31 | ) | | | (0.62 | ) | | | (0.93 | ) |
| 12/31/2014 | | | 12.49 | | | | 0.42 | | | | (0.11 | ) | | | 0.31 | | | | (0.51 | ) | | | (0.24 | ) | | | (0.75 | ) |
| 12/31/2013 | | | 11.43 | | | | 0.44 | | | | 1.22 | | | | 1.66 | | | | (0.52 | ) | | | (0.08 | ) | | | (0.60 | ) |
| Class F3 | | | | | | | | | | | | | | | | | | | | | | | | | | | | |
| 4/4/2017 to 12/31/2017(c) | | | 11.11 | | | | 0.28 | | | | 0.70 | | | | 0.98 | | | | (0.37 | ) | | | – | | | | (0.37 | ) |
| Class I | | | | | | | | | | | | | | | | | | | | | | | | | | | | |
| 12/31/2017 | | | 10.77 | | | | 0.32 | | | | 1.05 | | | | 1.37 | | | | (0.43 | ) | | | – | | | | (0.43 | ) |
| 12/31/2016 | | | 10.35 | | | | 0.41 | | | | 0.52 | | | | 0.93 | | | | (0.39 | ) | | | (0.12 | ) | | | (0.51 | ) |
| 12/31/2015 | | | 12.12 | | | | 0.39 | | | | (1.22 | ) | | | (0.83 | ) | | | (0.32 | ) | | | (0.62 | ) | | | (0.94 | ) |
| 12/31/2014 | | | 12.56 | | | | 0.43 | | | | (0.11 | ) | | | 0.32 | | | | (0.52 | ) | | | (0.24 | ) | | | (0.76 | ) |
| 12/31/2013 | | | 11.49 | | | | 0.42 | | | | 1.26 | | | | 1.68 | | | | (0.53 | ) | | | (0.08 | ) | | | (0.61 | ) |
| Class R2 | | | | | | | | | | | | | | | | | | | | | | | | | | | | |
| 12/31/2017 | | | 10.92 | | | | 0.26 | | | | 1.06 | | | | 1.32 | | | | (0.36 | ) | | | – | | | | (0.36 | ) |
| 12/31/2016 | | | 10.49 | | | | 0.35 | | | | 0.53 | | | | 0.88 | | | | (0.33 | ) | | | (0.12 | ) | | | (0.45 | ) |
| 12/31/2015 | | | 12.27 | | | | 0.32 | | | | (1.23 | ) | | | (0.91 | ) | | | (0.25 | ) | | | (0.62 | ) | | | (0.87 | ) |
| 12/31/2014 | | | 12.72 | | | | 0.37 | | | | (0.13 | ) | | | 0.24 | | | | (0.45 | ) | | | (0.24 | ) | | | (0.69 | ) |
| 12/31/2013 | | | 11.62 | | | | 0.33 | | | | 1.30 | | | | 1.63 | | | | (0.45 | ) | | | (0.08 | ) | | | (0.53 | ) |
| 90 | See Notes to Financial Statements. | |
| | | | | | | Ratios to Average Net Assets:* | | Supplemental Data: |
| | | | | | | | | | | | | | | | | | | | |
Net
asset
value,
end of
period | | Total
return(b)
(%) | | Total
expenses
after
waivers
and/or reim-
bursements
(%) | | Total
expenses
(%) | | Net
invest-
ment
income
(%) | | Net
assets,
end of
period
(000) | | Portfolio
turnover
rate
(%) |
| | | | | | | | | | | | | | | | | | | | | | | | | | | |
| | $11.63 | | | | 12.65 | | | | 0.63 | | | | 0.78 | | | | 2.52 | | | | $139,432 | | | | 58 | |
| | 10.69 | | | | 8.86 | | | | 0.38 | | | | 0.79 | | | | 3.56 | | | | 138,336 | | | | 24 | |
| | 10.28 | | | | (7.43 | ) | | | 0.35 | | | | 0.74 | | | | 2.90 | | | | 160,336 | | | | 22 | |
| | 12.04 | | | | 2.15 | | | | 0.34 | | | | 0.74 | | | | 3.12 | | | | 167,387 | | | | 41 | |
| | 12.49 | | | | 14.66 | | | | 0.31 | | | | 0.77 | | | | 3.20 | | | | 139,986 | | | | 23 | |
| | | | | | | | | | | | | | | | | | | | | | | | | | | |
| | 10.47 | | | | 11.75 | | | | 1.39 | | | | 1.54 | | | | 1.51 | | | | 571 | | | | 58 | |
| | 9.65 | | | | 8.07 | | | | 1.13 | | | | 1.54 | | | | 2.66 | | | | 1,626 | | | | 24 | |
| | 9.32 | | | | (8.13 | ) | | | 1.09 | | | | 1.48 | | | | 2.05 | | | | 2,800 | | | | 22 | |
| | 11.00 | | | | 1.49 | | | | 1.08 | | | | 1.48 | | | | 2.26 | | | | 4,533 | | | | 41 | |
| | 11.46 | | | | 13.70 | | | | 1.05 | | | | 1.51 | | | | 2.32 | | | | 6,020 | | | | 23 | |
| | | | | | | | | | | | | | | | | | | | | | | | | | | |
| | 10.44 | | | | 11.77 | | | | 1.38 | | | | 1.53 | | | | 1.75 | | | | 32,425 | | | | 58 | |
| | 9.64 | | | | 8.15 | | | | 1.12 | | | | 1.54 | | | | 2.79 | | | | 34,137 | | | | 24 | |
| | 9.31 | | | | (8.18 | ) | | | 1.10 | | | | 1.49 | | | | 2.14 | | | | 42,026 | | | | 22 | |
| | 11.00 | | | | 1.47 | | | | 1.08 | | | | 1.48 | | | | 2.36 | | | | 45,990 | | | | 41 | |
| | 11.47 | | | | 13.76 | | | | 1.05 | | | | 1.51 | | | | 2.45 | | | | 35,963 | | | | 23 | |
| | | | | | | | | | | | | | | | | | | | | | | | | | | |
| | 11.63 | | | | 12.71 | | | | 0.48 | | | | 0.63 | | | | 2.69 | | | | 5,879 | | | | 58 | |
| | 10.70 | | | | 9.01 | | | | 0.23 | | | | 0.64 | | | | 3.57 | | | | 4,867 | | | | 24 | |
| | 10.29 | | | | (7.28 | ) | | | 0.20 | | | | 0.59 | | | | 2.98 | | | | 8,747 | | | | 22 | |
| | 12.05 | | | | 2.39 | | | | 0.19 | | | | 0.59 | | | | 3.30 | | | | 12,885 | | | | 41 | |
| | 12.49 | | | | 14.73 | | | | 0.16 | | | | 0.62 | | | | 3.60 | | | | 6,472 | | | | 23 | |
| | | | | | | | | | | | | | | | | | | | | | | | | | | |
| | 11.72 | | | | 8.84 | (d) | | | 0.29 | (e) | | | 0.44 | (e) | | | 3.25 | (e) | | | 20 | | | | 58 | |
| | | | | | | | | | | | | | | | | | | | | | | | | | | |
| | 11.71 | | | | 12.83 | | | | 0.38 | | | | 0.53 | | | | 2.82 | | | | 13,497 | | | | 58 | |
| | 10.77 | | | | 9.18 | | | | 0.13 | | | | 0.54 | | | | 3.89 | | | | 11,092 | | | | 24 | |
| | 10.35 | | | | (7.23 | ) | | | 0.10 | | | | 0.48 | | | | 3.21 | | | | 10,633 | | | | 22 | |
| | 12.12 | | | | 2.47 | | | | 0.09 | | | | 0.49 | | | | 3.34 | | | | 42,754 | | | | 41 | |
| | 12.56 | | | | 14.85 | | | | 0.06 | | | | 0.52 | | | | 3.44 | | | | 34,086 | | | | 23 | |
| | | | | | | | | | | | | | | | | | | | | | | | | | | |
| | 11.88 | | | | 12.21 | | | | 0.98 | | | | 1.13 | | | | 2.29 | | | | 585 | | | | 58 | |
| | 10.92 | | | | 8.52 | | | | 0.73 | | | | 1.14 | | | | 3.33 | | | | 408 | | | | 24 | |
| | 10.49 | | | | (7.75 | ) | | | 0.70 | | | | 1.09 | | | | 2.81 | | | | 364 | | | | 22 | |
| | 12.27 | | | | 1.86 | | | | 0.69 | | | | 1.09 | | | | 2.88 | | | | 116 | | | | 41 | |
| | 12.72 | | | | 14.13 | | | | 0.66 | | | | 1.12 | | | | 2.68 | | | | 89 | | | | 23 | |
| | See Notes to Financial Statements. | 91 |
Financial Highlights (continued)
MULTI-ASSET GLOBAL OPPORTUNITY FUND
| | | | | | Per Share Operating Performance: |
| | | | | | Investment operations: | | Distributions to
shareholders from: |
| | | Net asset
value,
beginning
of period | | Net
invest-
ment
income(a) | | Net
realized
and
unrealized
gain (loss) | | Total
from
invest-
ment
opera-
tions | | Net
investment
income | | Return
of
capital | | Total
distri-
butions |
| Class R3 | | | | | | | | | | | | | | | | | | | | | | | | | | | | |
| 12/31/2017 | | | $10.76 | | | | $0.25 | | | | $ 1.07 | | | | $ 1.32 | | | | $(0.37 | ) | | $ | – | | | | $(0.37 | ) |
| 12/31/2016 | | | 10.34 | | | | 0.35 | | | | 0.53 | | | | 0.88 | | | | (0.34 | ) | | | (0.12 | ) | | | (0.46 | ) |
| 12/31/2015 | | | 12.11 | | | | 0.31 | | | | (1.20 | ) | | | (0.89 | ) | | | (0.26 | ) | | | (0.62 | ) | | | (0.88 | ) |
| 12/31/2014 | | | 12.55 | | | | 0.37 | | | | (0.11 | ) | | | 0.26 | | | | (0.46 | ) | | | (0.24 | ) | | | (0.70 | ) |
| 12/31/2013 | | | 11.48 | | | | 0.36 | | | | 1.26 | | | | 1.62 | | | | (0.47 | ) | | | (0.08 | ) | | | (0.55 | ) |
| Class R4 | | | | | | | | | | | | | | | | | | | | | | | | | | | | |
| 12/31/2017 | | | 10.69 | | | | 0.36 | | | | 0.98 | | | | 1.34 | | | | (0.41 | ) | | | – | | | | (0.41 | ) |
| 12/31/2016 | | | 10.28 | | | | 0.38 | | | | 0.51 | | | | 0.89 | | | | (0.36 | ) | | | (0.12 | ) | | | (0.48 | ) |
| 6/30/2015 to 12/31/2015(f) | | | 11.96 | | | | 0.15 | | | | (1.10 | ) | | | (0.95 | ) | | | (0.11 | ) | | | (0.62 | ) | | | (0.73 | ) |
| Class R5 | | | | | | | | | | | | | | | | | | | | | | | | | | | | |
| 12/31/2017 | | | 10.78 | | | | 0.35 | | | | 1.02 | | | | 1.37 | | | | (0.43 | ) | | | – | | | | (0.43 | ) |
| 12/31/2016 | | | 10.36 | | | | 0.41 | | | | 0.52 | | | | 0.93 | | | | (0.39 | ) | | | (0.12 | ) | | | (0.51 | ) |
| 6/30/2015 to 12/31/2015(f) | | | 12.04 | | | | 0.17 | | | | (1.11 | ) | | | (0.94 | ) | | | (0.12 | ) | | | (0.62 | ) | | | (0.74 | ) |
| Class R6 | | | | | | | | | | | | | | | | | | | | | | | | | | | | |
| 12/31/2017 | | | 10.77 | | | | 0.33 | | | | 1.05 | | | | 1.38 | | | | (0.43 | ) | | | – | | | | (0.43 | ) |
| 12/31/2016 | | | 10.35 | | | | 0.41 | | | | 0.53 | | | | 0.94 | | | | (0.40 | ) | | | (0.12 | ) | | | (0.52 | ) |
| 6/30/2015 to 12/31/2015(f) | | | 12.04 | | | | 0.17 | | | | (1.11 | ) | | | (0.94 | ) | | | (0.13 | ) | | | (0.62 | ) | | | (0.75 | ) |
| * | Does not include expenses of the Underlying Funds in which the Fund invests. |
| (a) | Calculated using average shares outstanding during the period. |
| (b) | Total return for Classes A, B and C does not consider the effects of sales loads and assumes the reinvestment of all distributions. Total return for all other classes assumes the reinvestment of all distributions. |
| (c) | Commenced on April 4, 2017. |
| (d) | Not annualized. |
| (e) | Annualized. |
| (f) | Commenced on June 30, 2015. |
| 92 | See Notes to Financial Statements. |
| | | | | | | Ratios to Average Net Assets:* | | Supplemental Data: |
| | | | | | | | | | | | | | | | | | | | |
Net
asset
value,
end of
period | | Total
return(b)
(%) | | Total
expenses
after
waivers
and/or reim-
bursements
(%) | | Total
expenses
(%) | | Net
invest-
ment
income
(%) | | Net
assets,
end of
period
(000) | | Portfolio
turnover
rate
(%) |
| | | | | | | | | | | | | | | | | | | | | | | | | | | |
| | $11.71 | | | | 12.38 | | | | 0.86 | | | | 1.01 | | | | 2.19 | | | | $3,977 | | | | 58 | |
| | 10.76 | | | | 8.65 | | | | 0.63 | | | | 1.04 | | | | 3.34 | | | | 6,401 | | | | 24 | |
| | 10.34 | | | | (7.69 | ) | | | 0.58 | | | | 0.97 | | | | 2.66 | | | | 6,322 | | | | 22 | |
| | 12.11 | | | | 2.01 | | | | 0.55 | | | | 0.95 | | | | 2.91 | | | | 6,780 | | | | 41 | |
| | 12.55 | | | | 14.33 | | | | 0.53 | | | | 0.99 | | | | 2.95 | | | | 5,785 | | | | 23 | |
| | | | | | | | | | | | | | | | | | | | | | | | | | | |
| | 11.62 | | | | 12.66 | | | | 0.62 | | | | 0.77 | | | | 3.11 | | | | 324 | | | | 58 | |
| | 10.69 | | | | 8.88 | | | | 0.36 | | | | 0.78 | | | | 3.67 | | | | 10 | | | | 24 | |
| | 10.28 | | | | (8.18 | )(d) | | | 0.31 | (e) | | | 0.74 | (e) | | | 2.79 | (e) | | | 9 | | | | 22 | |
| | | | | | | | | | | | | | | | | | | | | | | | | | | |
| | 11.72 | | | | 12.82 | | | | 0.37 | | | | 0.52 | | | | 2.97 | | | | 33 | | | | 58 | |
| | 10.78 | | | | 9.28 | | | | 0.11 | | | | 0.52 | | | | 3.92 | | | | 10 | | | | 24 | |
| | 10.36 | | | | (8.10 | )(d) | | | 0.07 | (e) | | | 0.49 | (e) | | | 3.03 | (e) | | | 9 | | | | 22 | |
| | | | | | | | | | | | | | | | | | | | | | | | | | | |
| | 11.72 | | | | 12.97 | | | | 0.27 | | | | 0.42 | | | | 2.91 | | | | 49,548 | | | | 58 | |
| | 10.77 | | | | 9.23 | | | | 0.13 | | | | 0.39 | | | | 3.92 | | | | 43,320 | | | | 24 | |
| | 10.35 | | | | (8.09 | )(d) | | | 0.09 | (e) | | | 0.37 | (e) | | | 3.02 | (e) | | | 34,823 | | | | 22 | |
| | See Notes to Financial Statements. | 93 |
Notes to Financial Statements
Lord Abbett Global Fund, Inc. (the “Company”) is registered under the Investment Company Act of 1940, as amended (the “Act”), as an open-end management investment company and was incorporated under Maryland law on February 23, 1988.
The Company consists of the following four funds (each, a “Fund” and collectively, the “Funds”) and their respective active share classes:
| Funds | Classes |
| Lord Abbett Emerging Markets Corporate Debt Fund (“Emerging Markets Corporate Debt Fund”) | A, C, F, F3, I, R2, R3, R4, R5 and R6 |
| Lord Abbett Emerging Markets Currency Fund (“Emerging Markets Currency Fund”) | A, B, C, F, F3, I, R2, R3, R4, R5 and R6 |
| Lord Abbett Emerging Markets Local Bond Fund (“Emerging Markets Local Bond Fund”) | A, C, F, F3, I, R2, R3, R4, R5 and R6 |
| Lord Abbett Multi-Asset Global Opportunity Fund (“Multi-Asset Global Opportunity Fund”) | A, B, C, F, F3, I, R2, R3, R4, R5 and R6 |
The Funds no longer issue Class B shares for purchase. The Funds’ Class P shares are closed to substantially all new investors, with certain exceptions as set forth in the Funds’ prospectus. Class F3 shares commenced on April 4, 2017. Emerging Markets Corporate Debt Fund and Multi-Asset Global Opportunity Fund are each diversified as defined in the Act and Emerging Markets Currency Fund and Emerging Markets Local Bond Fund are each non-diversified as defined in the Act.
Emerging Markets Currency Fund’s investment objective is to seek high total return. Emerging Markets Corporate Debt Fund, Emerging Markets Local Bond Fund and Multi-Asset Global Opportunity Fund’s investment objective is total return. Multi-Asset Global Opportunity Fund invests principally in other mutual funds (“Underlying Funds”) managed by Lord, Abbett & Co. LLC (“Lord Abbett”).
Each class of shares has different expenses and dividends. A front-end sales charge is normally added to the net asset value (“NAV”) for Class A shares. There is no front-end sales charge in the case of Class B, C, F, F3, I, P, R2, R3, R4, R5 and R6 shares, although there may be a contingent deferred sales charge (“CDSC”) in certain cases as follows: Class A shares purchased without a sales charge and redeemed before the first day of the month in which the one-year anniversary of the purchase falls (subject to certain exceptions as set forth in each Fund’s prospectus); Class B shares redeemed before the sixth anniversary of purchase; and Class C shares redeemed before the first anniversary of purchase. Class B shares will automatically convert to Class A shares on the 25th day of the month (or, if the 25th day is not a business day, the next business day thereafter) following the eighth anniversary of the day on which the purchase order was accepted.
The preparation of the financial statements in conformity with accounting principles generally accepted in the United States of America (“U.S. GAAP”) requires management to make certain estimates and assumptions that affect the reported amounts of assets and liabilities and disclosure of contingent assets and liabilities at the date of the financial statements and the reported amounts of increases and decreases in net assets from operations during the reporting period. Actual results could differ from those estimates. These Funds are considered investment companies under U.S. GAAP and follows the accounting and reporting guidance applicable to investment companies.
94
Notes to Financial Statements (continued)
| 2. | SIGNIFICANT ACCOUNTING POLICIES |
| | |
| (a) | Investment Valuation–Under procedures approved by the Funds’ Board of Directors (the “Board”), Lord Abbett, the Funds’ investment manager, has formed a Pricing Committee to administer the pricing and valuation of portfolio investments and to ensure that prices utilized reasonably reflect fair value. Among other things, these procedures allow the Funds to utilize independent pricing services, quotations from securities and financial instrument dealers and other market sources to determine fair value. |
| | |
| | Securities actively traded on any recognized U.S. or non-U.S. exchange or on The NASDAQ Stock Market LLC are valued at the last sale price or official closing price on the exchange or system on which they are principally traded. Events occurring after the close of trading on non-U.S. exchanges may result in adjustments to the valuation of foreign securities to reflect their fair value as of the close of regular trading on the New York Stock Exchange (“NYSE”). Each Fund may utilize an independent fair valuation service in adjusting the valuations of foreign securities. Unlisted equity securities are valued at the last quoted sale price or, if no sale price is available, at the mean between the most recently quoted bid and asked prices. Fixed income securities are valued based on evaluated prices supplied by independent pricing services, which reflect broker/dealer supplied valuations and the independent pricing services’ own electronic data processing techniques. Floating rate loans are valued at the average of bid and ask quotations obtained from dealers in loans on the basis of prices supplied by independent pricing services. Exchange traded options and futures contracts are valued at the last sale price in the market where they are principally traded. If no sale has occurred, the mean between the most recently quoted bid and asked prices is used. Forward foreign currency exchange contracts are valued using daily forward exchange rates. Swaps are valued daily using independent pricing services or quotations from broker/dealers to the extent available. Investments in the Underlying Funds are valued at their NAV each business day at the close of regular trading on the NYSE, normally 4:00 p.m. Eastern time. |
| | |
| | Securities for which prices are not readily available are valued at fair value as determined by the Pricing Committee. The Pricing Committee considers a number of factors, including observable and unobservable inputs, when arriving at fair value. The Pricing Committee may use related or comparable assets or liabilities, recent transactions, market multiples, book values, yield curves, broker quotes, observable trading activity, option adjusted spread models and other relevant information to determine the fair value of portfolio investments. The Board or a designated committee thereof regularly reviews fair value determinations made by the Pricing Committee and may employ techniques such as reviewing related market activity, reviewing inputs and assumptions, and retrospectively comparing prices of subsequent purchases and sales transactions to fair value determinations made by the Pricing Committee. |
| | |
| | Short-term securities with 60 days or less remaining to maturity are valued using the amortized cost method, which approximates fair value. |
| | |
| (b) | Security Transactions–Security transactions are recorded as of the date that the securities are purchased or sold (trade date). Realized gains and losses on sales of portfolio securities are calculated using the identified-cost method. Realized and unrealized gains (losses) are allocated to each class of shares based upon the relative proportion of net assets at the beginning of the day. |
95
Notes to Financial Statements (continued)
| (c) | Investment Income–Dividend income is recorded on the ex-dividend date. Interest income is recorded on the accrual basis as earned. Discounts are accreted and premiums are amortized using the effective interest method and are included in Interest and other income on the Statements of Operations. Investment income is allocated to each class of shares based upon the relative proportion of net assets at the beginning of the day. Withholding taxes on foreign dividends have been provided for in accordance with the applicable country’s tax rules and rates. |
| | |
| (d) | Income Taxes–It is the policy of each Fund to meet the requirements of Subchapter M of the Internal Revenue Code applicable to regulated investment companies and to distribute substantially all taxable income and capital gains to its shareholders. Therefore, no income tax provision is required. |
| | |
| | Each Fund files U.S. federal and various state and local tax returns. No income tax returns are currently under examination. The statute of limitations on each Fund’s filed U.S. federal tax returns remains open for the fiscal years ended December 31, 2014 through December 31, 2017. The statutes of limitations on the Company’s state and local tax returns may remain open for an additional year depending upon the jurisdiction. |
| | |
| (e) | Expenses–Expenses incurred by the Company that do not specifically relate to an individual fund are generally allocated to the funds within the Company on a pro rata basis by relative net assets. Expenses, excluding class-specific expenses, are allocated to each class of shares based upon the relative proportion of net assets at the beginning of the day. Class A, B, C, F, P, R2, R3 and R4 shares bear their class-specific share of all expenses and fees relating to the Funds’ 12b-1 Distribution Plan. |
| | |
| (f) | Foreign Transactions–The books and records of Emerging Markets Corporate Debt Fund, Emerging Markets Currency Fund and Emerging Markets Local Bond Fund are maintained in U.S. dollars and transactions denominated in foreign currencies are recorded in each Fund’s records at the rate prevailing when earned or recorded. Asset and liability accounts that are denominated in foreign currencies are adjusted daily to reflect current exchange rates and any unrealized gain (loss) is included in Net change in unrealized appreciation/depreciation on translation of assets and liabilities, denominated in foreign currencies in each Fund’s Statement of Operations. The resultant exchange gains and losses upon settlement of such transactions are included in Net realized gain (loss) on foreign currency related transactions in each Fund’s Statement of Operations. The Funds do not isolate that portion of the results of operations arising as a result of changes in the foreign exchange rates from the changes in market prices of the securities. |
| | |
| | The Funds use foreign currency exchange contracts to facilitate transactions in foreign-denominated securities. Losses from these transactions may arise from changes in the value of the foreign currency or if the counterparties do not perform under the contracts’ terms. |
| | |
| (g) | Forward Foreign Currency Exchange Contracts–Each Fund may enter into forward foreign currency exchange contracts in order to reduce their exposure to changes in foreign currency exchange rates on their foreign portfolio holdings, or gain or reduce exposure to foreign currency solely for investment purposes. A forward foreign currency exchange contract is a commitment to purchase or sell a foreign currency at a future date at a negotiated rate. The contracts are valued daily at forward exchange rates and any unrealized gain (loss) is included in Net change in unrealized appreciation/depreciation on foreign currency exchange contracts in each Fund’s Statement of Operations. The gain (loss) arising from the difference between the |
96
Notes to Financial Statements (continued)
| | U.S. dollar cost of the original contract and the value of the foreign currency in U.S. dollars upon closing of such contracts is included in Net realized gain (loss) on foreign currency exchange contracts in each Fund’s Statement of Operations. |
| | |
| (h) | Futures Contracts-Each Fund may purchase and sell futures contracts to enhance returns, to attempt to economically hedge some of its investment risk, or as a substitute position in lieu of holding the underlying asset on which the instrument is based. At the time of entering into a futures transaction, an investor is required to deposit and maintain a specified amount of cash or eligible securities called “initial margin.” Subsequent payments made or received by a Fund called “variation margin” are made on a daily basis as the market price of the futures contract fluctuates. Each Fund will record an unrealized gain (loss) based on the amount of variation margin. When a contract is closed, a realized gain (loss) is recorded equal to the difference between the opening and closing value of the contract. |
| | |
| (i) | When-Issued, Forward Transactions or To-Be-Announced (“TBA”) Transactions–Emerging Markets Corporate Debt Fund, Emerging Markets Currency Fund and Emerging Markets Local Bond Fund may purchase portfolio securities on a when-issued or forward basis. When-issued, forward transactions or TBA transactions involve a commitment by a Fund to purchase securities, with payment and delivery (“settlement”) to take place in the future, in order to secure what is considered to be an advantageous price or yield at the time of entering into the transaction. During the period between purchase and settlement, the fair value of the securities will fluctuate and assets consisting of cash and/or marketable securities (normally short-term U.S. Government or U.S. Government sponsored enterprise securities) marked to market daily in an amount sufficient to make payment at settlement will be segregated at each Fund’s custodian in order to pay for the commitment. At the time each Fund makes the commitment to purchase a security on a when-issued basis, it will record the transaction and reflect the liability for the purchase and fair value of the security in determining its NAV. Each Fund, generally, has the ability to close out a purchase obligation on or before the settlement date rather than take delivery of the security. Under no circumstances will settlement for such securities take place more than 120 days after the purchase date. |
| | |
| (j) | Mortgage Dollar Rolls–Emerging Markets Corporate Debt Fund, Emerging Markets Currency Fund and Emerging Markets Local Bond Fund may enter into mortgage dollar rolls in which a Fund sells mortgage-backed securities for delivery in the current month and simultaneously contracts with the same counterparty to repurchase similar (same type, coupon and maturity) but not identical securities on a specified future date. During the roll period, each Fund loses the right to receive principal (including prepayments of principal) and interest paid on the securities sold. |
| | |
| (k) | Commercial Paper–Each Fund may purchase commercial paper. Commercial paper consists of unsecured promissory notes issued by corporations to finance short-term credit needs. Commercial paper is issued in bearer form with maturities generally not exceeding nine months. Commercial paper obligations may include variable amount master demand notes. |
| | |
| (l) | Repurchase Agreements–Each Fund may enter into repurchase agreements with respect to securities. A repurchase agreement is a transaction in which a fund acquires a security and simultaneously commits to resell that security to the seller (a bank or securities dealer) at an agreed-upon price on an agreed-upon date. Each Fund requires at all times that the repurchase agreement be collateralized by cash, or by securities of the U.S. Government, its agencies, its instrumentalities, or U.S. Government sponsored enterprises having a value equal to, or in excess of, the value of the |
| | |
| | 97 |
Notes to Financial Statements (continued)
| | repurchase agreement (including accrued interest). If the seller of the agreement defaults on its obligation to repurchase the underlying securities at a time when the fair value of these securities has declined, a Fund may incur a loss upon disposition of the securities. |
| | |
| (m) | Interest Rate Swaps-Each Fund may invest in interest rate swaps in order to enhance returns or hedge against interest rate risk. Interest rate swaps are agreements in which one party pays a stream of interest payments, either fixed or floating, for another party’s stream of interest payments, either fixed or floating, on the same notional amount for a specified period of time. The interest rate swap agreement will normally be entered into on a zero coupon basis, meaning that the floating rate will be based on the cumulative of the variable rate, and the fixed rate will compound until the swap’s maturity date, at which point the payments would be netted. The swaps are valued daily and any unrealized gain (loss) is included in the Net change in unrealized appreciation/depreciation on swap contracts on each Fund’s Statement of Operations. A liquidation payment received or made at the termination or maturity of the swap is recorded in realized gain (loss) and is included in Net realized gain (loss) on swap contracts on each Fund’s Statement of Operations. Daily changes in valuation of centrally cleared swaps, if any, are recorded as a receivable or payable for the change in value as appropriate (“variation margin”) on the Statements of Assets and Liabilities. For centrally cleared swaps, there was minimal counterparty risk to the Fund, since such swaps entered into were traded through a central clearinghouse, which guarantees against default. |
| | |
| (n) | Credit Default Swaps–Each Fund may enter into credit default swap contracts. As a seller of a credit default swap contract (“seller of protection”), a Fund is required to pay the notional amount or other agreed-upon value of a referenced debt obligation to the counterparty in the event of a default by or other credit event involving the referenced issuer, obligation or index. In return, a Fund receives from the counterparty a periodic stream of payments over the term of the contract. |
| | |
| | As a purchaser of a credit default swap contract (“buyer of protection”), a Fund would receive the notional amount or other agreed upon value of a referenced debt obligation from the counterparty in the event of default by or other credit event involving the referenced issuer, obligation or index. In return, a Fund would make periodic payments to the counterparty over the term of the contracts, provided no event of default has occurred. |
| | |
| | These credit default swaps may have as a reference obligation corporate or sovereign issuers or credit indexes. These credit indexes are comprised of a basket of securities representing a particular sector of the market. |
| | |
| | Credit default swaps are fair valued based upon quotations from counterparties, brokers or market-makers and the change in value, if any, is recorded as an unrealized appreciation or depreciation. Daily changes in valuation of centrally cleared swaps, if any, are recorded as a receivable or payable for the change in value as appropriate (“variation margin”) on the Statements of Assets and Liabilities. For a credit default swap sold by a Fund, payment of the agreed-upon amount made by the Fund in the event of default of the referenced debt obligation is recorded as the cost of the referenced debt obligation purchased/received. For a credit default swap purchased by a Fund, the agreed-upon amount received by the Fund in the event of default of the referenced debt obligation is recorded as proceeds from sale/delivery of the referenced debt obligation and the resulting gain or loss realized on the referenced debt obligation is recorded as such by the Fund. |
| | |
| 98 | |
Notes to Financial Statements (continued)
| | Any upfront payments made or received upon entering a credit default swap contract would be amortized or accreted over the life of the swap and recorded as realized gains or losses. Collateral, in the form of cash or securities, may be required to be held in segregated accounts with the custodian bank or broker in accordance with the swap agreement. The value and credit rating of each credit default swap where a Fund is the seller of protection, are both measures of the current payment/performance risk of the swap. As the value of the swap changes as a positive or negative percentage of the total notional amount, the payment/performance risk may decrease or increase, respectively. The maximum potential amount of future payments (undiscounted) that a Fund as a seller of protection could be required to make under a credit default swap agreement would be an amount equal to the notional amount of the agreement. These potential amounts would be partially offset by any recovery values of the respective referenced obligations, upfront payments received upon entering into the agreement, or net amounts received from the settlement of buy protection credit default swap agreements entered into by a Fund for the same referenced entity or entities. |
| | |
| | Entering into credit default swaps involves credit and market risk. Such risks involve the possibility that there will be no liquid market for these agreements, that there may be unfavorable changes in interest rates, and that Lord Abbett does not correctly predict the creditworthiness of the issuers of the reference obligation on which the credit default swap is based. For centrally cleared swaps there was minimal counterparty credit risk to the Fund, since the credit default swap entered into was traded through a central clearinghouse, which guarantees against default. |
| | |
| (o) | Total Return Swaps–Each Fund may enter into total return swap agreements to obtain exposure to a security or market without owning such security or investing directly in that market. Each Fund may agree to make payments that are the equivalent of interest in exchange for the right to receive payments equivalent to any appreciation in the value of an underlying security, index or other asset, as well as receive payments equivalent to any distributions made on that asset, over the term of the swap. If the value of the asset underlying a total return swap declines over the term of the swap, each Fund also may be required to pay an amount equal to that decline in value to their counterparty. |
| | |
| (p) | Floating Rate Loans–Emerging Markets Corporate Debt Fund, Emerging Markets Currency Fund and Emerging Markets Local Bond Fund may invest in floating rate loans, which usually take the form of loan participations and assignments. Loan participations and assignments are agreements to make money available to U.S. or foreign corporations, partnerships or other business entities (the “Borrower”) in a specified amount, at a specified rate and within a specified time. A loan is typically originated, negotiated and structured by a U.S. or foreign bank, insurance company or other financial institution (the “Agent”) for a group of loan investors (“Loan Investors”). The Agent typically administers and enforces the loan on behalf of the other Loan Investors in the syndicate and may hold any collateral on behalf of the Loan Investors. Such loan participations and assignments are typically senior, secured and collateralized in nature. A Fund records an investment when the Borrower withdraws money and records interest as earned. These loans pay interest at rates which are periodically reset by reference to a base lending rate plus a spread. These base lending rates are generally the prime rate offered by a designated U.S. bank or London InterBank Offered Rate (“LIBOR”). |
| | |
| | The loans in which a Fund invests may be subject to some restrictions on resale. For example, a Fund may be contractually obligated to receive approval from the Agent and/or Borrower prior |
| | |
| | 99 |
Notes to Financial Statements (continued)
| | to the sale of these investments. A Fund generally has no right to enforce compliance with the terms of the loan agreement with the Borrower. As a result, each Fund assumes the credit risk of the Borrower, the selling participant and any other persons interpositioned between a Fund and the Borrower (“Intermediate Participants”). In the event that the Borrower, selling participant or Intermediate Participants become insolvent or enter into bankruptcy, a Fund may incur certain costs and delays in realizing payment or may suffer a loss of principal and/or interest. |
| | |
| | Unfunded commitments represent the remaining obligation of a Fund to the Borrower. At any point in time, up to the maturity date of the issue, the Borrower may demand the unfunded portion. Until demanded by the Borrower, unfunded commitments are not recognized as an asset on the Statement of Assets and Liabilities. Unrealized appreciation/depreciation on unfunded commitments presented on the Statement of Assets and Liabilities represents mark to market of the unfunded portion of the Fund’s floating rate notes. As of December 31, 2017, each Fund had no unfunded loan commitments. |
| | |
| (q) | Fair Value Measurements–Fair value is defined as the price that each Fund would receive upon selling an investment or transferring a liability in an orderly transaction to an independent buyer in the principal or most advantageous market of the investment. A three-tier hierarchy is used to maximize the use of observable market data and minimize the use of unobservable inputs and to establish classification of fair value measurements for disclosure purposes. Inputs refer broadly to the assumptions that market participants would use in pricing the asset or liability, including assumptions about risk – for example, the risk inherent in a particular valuation technique used to measure fair value (such as a pricing model) and/or the risk inherent in the inputs to the valuation technique. Inputs may be observable or unobservable. Observable inputs reflect the assumptions market participants would use in pricing the asset or liability. Observable inputs are based on market data obtained from sources independent of the reporting entity. Unobservable inputs reflect the reporting entity’s own assumptions about the assumptions market participants would use in pricing the asset or liability. Unobservable inputs are based on the best information available in the circumstances. The three-tier hierarchy classification is determined based on the lowest level of inputs that is significant to the fair value measurement, and is summarized in the three broad Levels listed below: |
| | • | Level 1 – | unadjusted quoted prices in active markets for identical investments; |
| | | |
| | • | Level 2 – | other significant observable inputs (including quoted prices for similar investments, interest rates, prepayment speeds, credit risk, etc.); and |
| | | |
| | • | Level 3 – | significant unobservable inputs (including each Fund’s own assumptions in determining the fair value of investments). |
| | A summary of inputs used in valuing each Fund’s investments and other financial instruments as of December 31, 2017 and, if applicable, Level 1/Level 2 transfers and Level 3 rollforwards for the fiscal year then ended is included in each Fund’s Schedule of Investments. |
| | |
| | Changes in valuation techniques may result in transfers into or out of an assigned level within the three-tier hierarchy. All transfers between different levels within the three-tier hierarchy are deemed to have occurred as of the beginning of the reporting period. The inputs or methodology used for valuing securities are not necessarily an indication of the risk associated with investing in those securities. |
| | |
| 100 | |
Notes to Financial Statements (continued)
| 3. | MANAGEMENT FEE AND OTHER TRANSACTIONS WITH AFFILIATES |
Management Fee
The Company has a management agreement with Lord Abbett, pursuant to which Lord Abbett supplies each Fund with investment management services and executive and other personnel, provides office space and pays for ordinary and necessary office and clerical expenses relating to research and statistical work and supervision of each Fund’s investment portfolio.
The management fee is based on each Fund’s average daily net assets at the following annual rates:
Emerging Markets Corporate Debt Fund and Emerging Markets Local Bond Fund
| First $2 billion | .70% |
| Next $3 billion | .65% |
| Over $5 billion | .60% |
| | |
| Emerging Markets Currency Fund |
| | |
| First $1 billion | .50% |
| Over $1 billion | .45% |
Multi-Asset Global Opportunity Fund’s management fee is .25% of the Fund’s average daily net assets.
For the fiscal year ended December 31, 2017, the effective management fee, net of waivers, was at the following annualized rate of each Fund’s average daily net assets:
| | Net Effective
Management Fee |
| Emerging Markets Corporate Debt Fund | .19% |
| Emerging Markets Currency Fund | .50% |
| Emerging Markets Local Bond Fund | .00% |
| Multi-Asset Global Opportunity Fund | .10% |
In addition, Lord Abbett provides certain administrative services to each Fund pursuant to an Administrative Services Agreement in return for a fee at an annual rate of .04% of each funds average daily net asset.
For the fiscal year ended December 31, 2017 and continuing through April 30, 2018, Lord Abbett has contractually agreed to waive its fees and reimburse expenses to the extent necessary to limit the total net annual operating expenses, excluding 12b-1 fees, to the following annual rates:
| | | | | | Classes | |
| Fund | | A, C, F, I, R2,
R3, R4 and R5 | | F3 and R6 | |
| Emerging Markets Corporate Debt Fund | | | .85 | % | | | .67% | (1) |
| Emerging Markets Local Bond Fund | | | .85 | % | | | .74% | (1) |
| (1) | Prior to April 1, 2017 Lord Abbett had contractually agreed to waive its fees and reimburse expenses for Emerging Markets Corporate Debt Fund and Emerging Markets Local Bond Fund to the extent necessary to limit total net annual operating expenses, excluding 12b-1 fees, to an annual rate of 0.77% and 0.79% respectively for Class R6. |
For the fiscal year ended December 31, 2017 and continuing through April 30, 2018, Lord Abbett has contractually agreed to waive its management fee at the annual rate of .15% for Multi-Asset Global Opportunity Fund.
All contractual management fee waiver and expense reimbursement agreements between the Funds and Lord Abbett may be terminated only upon approval of the Board.
101
Notes to Financial Statements (continued)
12b-1 Distribution Plan
Each Fund has adopted a distribution plan with respect to Class A, B, C, F, P, R2, R3 and R4 shares pursuant to Rule 12b-1 under the Act, which provides for the payment of ongoing distribution and service fees to Lord Abbett Distributor LLC (the “Distributor”), an affiliate of Lord Abbett. The following annual rates have been authorized by the Board pursuant to the plan:
| Fees* | | Class A(1) | | Class B(2) | | Class C(3) | | Class F(4) | | Class P(2) | | Class R2** | | Class R3** | | Class R4 |
| Service | | .15% | | .25% | | .25% | | – | | .25% | | .25% | | .25% | | .25% |
| Distribution | | .05% | | .75% | | .75% | | .10% | | .20% | | .35% | | .25% | | – |
| * | The Funds may designate a portion of the aggregate fee as attributable to service activities for purposes of calculating Financial Industry Regulatory Authority, Inc. (“FINRA”) sales charge limitations. |
| ** | Prior to the sale of shares to unaffiliated investors, service and distribution fees were fully waived. |
| (1) | The Class A share Rule 12b-1 fee for Multi-Asset Global Opportunity Fund is .25% (.25% service, .00% distribution) of the Fund’s average daily net assets. |
| (2) | Emerging Markets Currency Fund and Multi-Asset Global Opportunity Fund only. |
| (3) | Except for Multi-Asset Global Opportunity Fund, each Fund’s Class C 12b-1 fee is a blended rate calculated based on 1.00% of the Fund’s average daily net assets attributable to Class C share Rule shares held for less than one year and .80% (.25% service, .55% distribution) of the Fund’s average daily net assets attributable to Class C shares held for one year or more. All Class C shareholders of the Fund bear Rule 12b-1 fees at the same rate. |
| (4) | The Class F share Rule 12b-1 fee may be designated as a service fee in limited circumstances as described in the Funds’ prospectus. |
Class F3, I, R5 and R6 shares do not have a distribution plan.
Commissions
Distributor received the following commissions on sales of shares of the Funds, after concessions were paid to authorized dealers, for the fiscal year ended December 31, 2017:
| | | Distributor
Commissions | | | Dealers’
Concessions | |
| Emerging Markets Corporate Debt Fund | | | $ 3,278 | | | | $ 18,295 | |
| Emerging Markets Currency Fund | | | 301 | | | | 2,336 | |
| Emerging Markets Local Bond Fund | | | 703 | | | | 3,979 | |
| Multi-Asset Global Opportunity Fund | | | 19,204 | | | | 119,008 | |
Distributor received the following amount of CDSCs for the fiscal year ended December 31, 2017:
| | | Class A | | | Class C | |
| Emerging Markets Corporate Debt Fund | | $ | – | | | $ | 405 | |
| Emerging Markets Currency Fund | | | 25 | | | | 807 | |
| Emerging Markets Local Bond Fund | | | – | | | | 408 | |
| Multi-Asset Global Opportunity Fund | | | 8,348 | | | | 4,001 | |
Other Related Parties
As of December 31, 2017, the percentages of Emerging Markets Currency Fund’s outstanding shares owned by Lord Abbett Multi-Asset Balanced Opportunity Fund, Lord Abbett Multi-Asset Global Opportunity Fund and Lord Abbett Multi-Asset Income Fund were 41.88%, 8.91% and 30.31%, respectively.
Two Directors and certain of the Company’s officers have an interest in Lord Abbett.
| 4. | DISTRIBUTIONS AND CAPITAL LOSS CARRYFORWARDS |
Dividends from net investment income, if any, are declared daily and paid monthly for Emerging Markets Corporate Debt Fund, Emerging Markets Currency Fund and Emerging Markets Local Bond Fund and declared and paid quarterly for Multi-Asset Global Opportunity Fund. Taxable net realized gains from investment transactions, reduced by allowable capital loss carryforwards, if any, are
102
Notes to Financial Statements (continued)
declared and distributed to shareholders at least annually. The capital loss carryforward amount, if any, is available to offset future net capital gains. Dividends and distributions to shareholders are recorded on the ex-dividend date. The amounts of dividends and distributions from net investment income and net realized capital gains are determined in accordance with federal income tax regulations, which may differ from U.S. GAAP. These book/tax differences are either considered temporary or permanent in nature. To the extent these differences are permanent in nature, such amounts are reclassified within the components of net assets based on their federal tax basis treatment; temporary differences do not require reclassification. Dividends and distributions that exceed earnings and profits for tax purposes, are reported as a tax return of capital.
The tax character of distributions paid during the fiscal years ended December 31, 2017 and 2016 was as follows:
| | | Emerging Markets
Corporate Debt Fund | | | Emerging Markets
Currency Fund | |
| | | Year Ended | | | Year Ended | | | Year Ended | | | Year Ended | |
| | | 12/31/2017 | | | 12/31/2016 | | | 12/31/2017 | | | 12/31/2016 | |
| Distributions paid from: | | | | | | | | | | | | | | | | |
| Ordinary income | | $ | 2,152,985 | | | $ | 1,556,088 | | | $ | 11,373,165 | | | $ | 22,915,705 | |
| Net long-term capital gains | | | 269,185 | | | | – | | | | – | | | | – | |
| Total distributions paid | | $ | 2,422,170 | | | $ | 1,556,088 | | | $ | 11,373,165 | | | $ | 22,915,705 | |
| | | Emerging Markets
Local Bond Fund | | | Multi-Asset Global
Opportunity Fund | |
| | | Year Ended | | | Year Ended | | | Year Ended | | | Year Ended | |
| | | 12/31/2017 | | | 12/31/2016 | | | 12/31/2017 | | | 12/31/2016 | |
| Distributions paid from: | | | | | | | | | | | | | | | | |
| Tax-exempt income | | $ | – | | | $ | – | | | $ | – | | | $ | 22,167 | |
| Ordinary income | | | 368,322 | | | | – | | | | 8,331,507 | | | | 8,778,337 | |
| Net long-term capital gains | | | – | | | | – | | | | – | | | | 2,727,269 | |
| Return of capital | | | 351,095 | | | | 556,800 | | | | – | | | | – | |
| Total distributions paid | | $ | 719,417 | | | $ | 556,800 | | | $ | 8,331,507 | | | $ | 11,527,773 | |
| As of December 31, 2017, the components of accumulated gains (losses) on a tax-basis were as follows: |
| | | Emerging Markets
Corporate Debt Fund | | | Emerging Markets
Currency Fund | |
| Undistributed ordinary income – net | | $ | 92,553 | | | $ | 2,370,336 | |
| Total undistributed earnings | | | 92,553 | | | | 2,370,336 | |
| Capital loss carryforwards* | | | – | | | | (89,150,748 | ) |
| Temporary differences | | | (30,940 | ) | | | (76,315 | ) |
| Unrealized gains (losses) – net | | | 1,164,879 | | | | (9,843,348 | ) |
| Total accumulated gains (losses) – net | | $ | 1,226,492 | | | $ | (96,700,075 | ) |
| | | Emerging Markets
Local Bond Fund | | | Multi-Asset Global
Opportunity Fund | |
| Capital loss carryforwards* | | | (331,980 | ) | | | (9,871,582 | ) |
| Temporary differences | | | (202,301 | ) | | | (242,513 | ) |
| Unrealized losses – net | | | (512,104 | ) | | | (741,461 | ) |
| Total accumulated losses – net | | $ | (1,046,385 | ) | | $ | (10,855,556 | ) |
| * | The capital losses will carry forward indefinitely. |
103
Notes to Financial Statements (continued)
At each Fund’s election, certain losses incurred within the taxable year (Qualified Late-Year Losses) are deemed to arise on the first business day of the Fund’s next taxable year. The following Funds incurred and will elect to defer late-year losses for 2017 as follows:
| | | Late-Year Ordinary | | | Post-October Capital | |
| Emerging Markets Corporate Debt Fund | | $ | – | | | $ | 28,601 | |
| Emerging Markets Local Bond Fund | | | 155,629 | | | | – | |
| Multi-Asset Global Opportunity Fund | | | 116,906 | | | | – | |
As of December 31, 2017, the aggregate unrealized security gains and losses on investments and other financial instruments based on cost for U.S. federal income tax purposes were as follows:
| | | Emerging Markets
Corporate Debt Fund | | | Emerging Markets
Currency Fund | |
| Tax cost | | $ | 54,205,348 | | | $ | 217,366,186 | |
| Gross unrealized gain | | | 1,396,713 | | | | – | |
| Gross unrealized loss | | | (231,797 | ) | | | (9,823,071 | ) |
| Net unrealized security gain (loss) | | $ | 1,164,916 | | | $ | (9,823,071 | ) |
| | | Emerging Markets
Local Bond Fund | | | Multi-Asset Global
Opportunity Fund | |
| Tax cost | | $ | 11,059,360 | | | $ | 249,744,931 | |
| Gross unrealized gain | | | 425,724 | | | | 761,391 | |
| Gross unrealized loss | | | (937,480 | ) | | | (1,502,890 | ) |
| Net unrealized security loss | | $ | (511,756 | ) | | $ | (741,499 | ) |
The difference between book-basis and tax-basis unrealized gains (losses) is attributable to the tax treatment of certain distributions, foreign currency contracts, futures, swaps, amortization of premium and wash sales.
Permanent items identified during the fiscal year ended December 31, 2017 have been reclassified among the components of net assets based on their tax basis treatment as follows:
| | | Undistributed
(Distributions in
Excess of) Net
Investment Income | | | Accumulated Net
Realized Loss | |
| Emerging Markets Corporate Debt Fund | | $ | 137,315 | | | $ | (137,315 | ) |
| Emerging Markets Currency Fund | | | 10,538,845 | | | | (10,538,845 | ) |
| Emerging Markets Local Bond Fund | | | (485,751 | ) | | | 485,751 | |
| Multi-Asset Global Opportunity Fund | | | 2,429,635 | | | | (2,429,635 | ) |
The permanent differences are primarily attributable to the tax treatment of foreign currency transactions, certain securities, premium amortization, certain distributions, certain expenses, and principal paydown gains and losses.
104
Notes to Financial Statements (continued)
| 5. | PORTFOLIO SECURITIES TRANSACTIONS |
Purchases and sales of investment securities (excluding short-term investments) for the fiscal year ended December 31, 2017 were as follows:
| | | U.S.
Government
Purchases | * | | Purchases | | | U.S.
Government
Sales | * | | Sales | |
| Emerging Markets Corporate Debt Fund | | $ | – | | | $ | 56,634,461 | | | $ | – | | | $ | 35,172,838 | |
| Emerging Markets Currency Fund | | | 430,639 | | | | 74,189,720 | | | | 4,514,446 | | | | 243,786,589 | |
| Emerging Markets Local Bond Fund | | | – | | | | 6,451,831 | | | | – | | | | 5,374,923 | |
| Multi-Asset Global Opportunity Fund | | | – | | | | 137,632,067 | | | | – | | | | 148,898,701 | |
| * | Includes U.S. Government sponsored enterprises securities. |
Each Fund is permitted to purchase and sell securities (“cross-trade”) from and to other Lord Abbett funds or client accounts pursuant to procedures approved by the Board in compliance with Rule 17a-7 under the Act (the “Rule”). Each cross-trade is executed at a fair market price in compliance with provisions of the Rule. For the fiscal year ended December 31, 2017, Emerging Markets Currency Fund engaged in cross-trades purchases of $132,828 and sales of $16,321,626, which resulted in a net realized loss of $411,363.
| 6. | DISCLOSURES ABOUT DERIVATIVE INSTRUMENTS AND HEDGING ACTIVITIES |
Each Fund entered into forward foreign currency exchange contracts for the fiscal year ended December 31, 2017 (as described in note 2(g)). A forward foreign currency exchange contract reduces each Fund’s exposure to changes in the value of the currency it will deliver (or settle in cash) and increases its exposure to changes in the value of the currency it will receive (or settle in cash) for the duration of the contract. Each Fund’s use of forward foreign currency exchange contracts involves the risk that Lord Abbett will not accurately predict currency movements, and each Fund’s returns could be reduced as a result. Forward foreign currency exchange contracts are subject to the risk that those currencies will decline in value relative to the U.S. dollar, or, in the case of hedged positions, that the U.S. dollar will decline relative to the currency being hedged. Currency rates in foreign countries may fluctuate significantly over short periods of time. Each Fund’s risk of loss from counterparty credit risk is the unrealized appreciation on foreign currency exchange contracts and deposits with brokers as collateral.
Multi-Asset Global Opportunity Fund entered into E-Mini S&P 500 Index futures contracts for the fiscal year ended December 31, 2017 (as described in note 2(h)) for investment purposes. The Fund bears the risk that the underlying index will move unexpectedly, in which case the Fund may realize a loss. There is minimal counterparty credit risk to the Fund since futures are exchange traded and the exchange’s clearinghouse, as counterparty to all exchange traded futures, guarantees futures against default.
Emerging Markets Corporate Debt Fund, Emerging Markets Currency Fund, and Multi-Asset Global Opportunity Fund entered into U.S. Treasury futures contracts for the fiscal year ended December 31, 2017 (as described in note 2(h)) to economically hedge against changes in interest rates. The Funds bear the risk of interest rates moving unexpectedly, in which case the Funds may not achieve the anticipated benefits of the futures contracts and realize a loss. There is minimal counterparty credit risk to the Funds since futures are exchange traded and the exchange’s clearinghouse, as counterparty to all exchange traded futures, guarantees futures against default.
105
Notes to Financial Statements (continued)
Emerging Markets Currency Fund and Multi-Asset Global Opportunity Fund entered into credit default swaps on indexes for the fiscal year ended December 31, 2017 (as described in note 2(n)) to hedge credit risk. Credit default swaps on indexes involve the exchange of a fixed rate premium for protection against the loss in value of underlying securities within an index in the event of a defined credit event, such as payment default or bankruptcy. Under a credit default swap one party acts as a guarantor by receiving the fixed periodic payment in exchange for the commitment to purchase the underlying security at par if the defined credit event occurs. Upon the occurrence of a defined credit event, the difference between the value of the reference obligation and the swap’s notional amount is recorded as realized gain or loss on swap contracts in the Statements of Operations. Emerging Markets Currency Fund’s maximum risk of loss from counterparty risk, either as the protection seller or as the protection buyer, is the fair value of the contract. There is minimal counterparty credit risk to the Multi-Asset Global Opportunity Fund since centrally cleared credit default swaps are traded through a central clearinghouse. As the counterparty to all centrally cleared credit default swaps, the clearinghouse guarantees credit default swaps against default.
Emerging Markets Currency Fund entered into interest rate swaps for the fiscal year ended December 31, 2017 (as described in note 2(m)) to economically hedge against interest rate risk. The Fund’s use of interest rate swaps involves the risk that Lord Abbett will not accurately predict expectations of interest rates, and the Fund’s returns could be reduced as a result. There is minimal counterparty credit risk to the Fund since centrally cleared interest rate swaps are traded through a central clearinghouse. As the counterparty to all centrally cleared interest rate swaps, the clearinghouse guarantees interest rate swaps against default.
Multi-Asset Global Opportunity Fund entered into total return swaps for the fiscal year ended December 31, 2017 (as described in note 2(o)) to hedge credit risk. The Funds may enter into total return swap agreements to obtain exposure to a security or market without owning such security or investing directly in that market. The Funds may agree to make payments that are the equivalent of interest in exchange for the right to receive payments equivalent to any appreciation in the value of an underlying security, index or other asset, as well as receive payments equivalent to any distributions made on that asset, over the term of the swap. If the value of the asset underlying a total return swap declines over the term of the swap, each Fund also may be required to pay an amount equal to that decline in value to their counterparty.
As of December 31, 2017, each Fund had the following derivatives at fair value, grouped into appropriate risk categories that illustrate the Funds’ use of derivative instruments:
| | Emerging Markets Corporate Debt Fund |
| Asset Derivatives | | Interest Rate
Contracts | | | Foreign
Currency
Contracts | |
| Futures Contracts(1) | | $ | 20,819 | | | $ | – | |
| | | | | | |
| Liability Derivatives | | | | | | | | |
| Futures Contracts(1) | | $ | 25,764 | | | $ | – | |
| Forward Foreign Currency Exchange Contracts(2) | | | – | | | | 2,546 | |
106
Notes to Financial Statements (continued)
| Emerging Markets Currency Fund |
| Asset Derivatives | | | | Interest Rate
Contracts | | | Foreign
Currency
Contracts | |
| Centrally Cleared Interest Rate Swap Contracts(3) | | | | | | $ | 716,175 | | | $ | – | |
| Forward Foreign Currency Exchange Contracts(4) | | | | | | | – | | | | 4,761,484 | |
| Futures Contracts(1) | | | | | | | 106,048 | | | | – | |
| | | | | | | | | | | | | |
| Liability Derivatives | | | | | | | | | | | | |
| Forward Foreign Currency Exchange Contracts(2) | | | | | | | – | | | $ | 1,495,339 | |
| | | | | | | | | | | | | |
| Emerging Markets Local Bond Fund | | | | | |
| Asset Derivatives | | | | | | Foreign
Currency
Contracts | | | | | |
| Forward Foreign Currency Exchange Contracts(4) | | | | | | $38,175 | | | | | |
| | | | | | | | | | | | | |
| Liability Derivatives | | | | | | | | | | | | |
| Forward Foreign Currency Exchange Contracts(2) | | | | | | $38,073 | | | | | |
| | | | | | | | | | | | | |
| Multi-Asset Global Opportunity Fund |
| Asset Derivatives | | Equity
Contracts | | | Interest Rate
Contracts | | | Foreign
Currency
Contracts | |
| Forward Foreign Currency Exchange Contracts(4) | | $ | – | | | $ | – | | | | $ 92,491 | |
| Futures Contracts(1) | | | 297,481 | | | | 31,361 | | | | – | |
| | | | | | | | | | | | | |
| Liability Derivatives | | | | | | | | | | | | |
| Forward Foreign Currency Exchange Contracts(2) | | $ | – | | | | – | | | | $654,210 | |
| Total Return Swap Contracts(5) | | | 207,784 | | | | – | | | | – | |
| (1) | Statements of Assets and Liabilities location: Includes cumulative unrealized appreciation/depreciation of futures contracts as reported in the Schedule of Investments. Only the current day’s variation margin is reported within the Statements of Assets and Liabilities. |
| (2) | Statements of Assets and Liabilities location: Unrealized depreciation on forward foreign currency exchange contracts. |
| (3) | Statements of Assets and Liabilities location: Includes cumulative unrealized appreciation/depreciation of centrally cleared interest rate swap contracts as reported in the Schedule of Investments. Only the current day’s variation margin is reported within the Statements of Assets and Liabilities. |
| (4) | Statements of Assets and Liabilities location: Unrealized appreciation on forward foreign currency exchange contracts. |
| (5) | Statements of Assets and Liabilities location: Unrealized depreciation on total return swap contracts. |
Transactions in derivative instruments for the fiscal year ended December 31, 2017, were as follows:
| Emerging Markets Corporate Debt Fund | | |
| | | Interest Rate
Contracts | | | Foreign
Currency
Contracts | | |
| Net Realized Gain (Loss) | | | | | | | | | |
| Forward Foreign Currency Exchange Contracts(1) | | | – | | | $ | (8,785 | ) | |
| Futures Contracts(2) | | $ | (92,755 | ) | | | – | | |
| Net Change in Unrealized | | | | | | | | | |
| Appreciation/Depreciation | | | | | | | | | |
| Forward Foreign Currency Exchange Contracts(3) | | | – | | | $ | (2,546 | ) | |
| Futures Contracts(4) | | $ | (14,259 | ) | | | – | | |
| Average Number of Contracts/Notional Amounts* | | | | | | | | | |
| Forward Foreign Currency Exchange Contracts(5) | | | – | | | $ | 128,360 | | |
| Futures Contracts(6) | | | 72 | | | | – | | |
107
Notes to Financial Statements (continued)
| Emerging Markets Currency Fund |
| | | Interest Rate
Contracts | | | Foreign
Currency
Contracts | | | Credit
Contracts | |
| Net Realized Gain (Loss) | | | | | | | | | | | | |
| Credit Default Swaps Contracts(7) | | | – | | | | – | | | $ | (114,830 | ) |
| Forward Foreign Currency Exchange Contracts(1) | | | – | | | $ | 12,297,626 | | | | – | |
| Futures Contracts(2) | | $ | 128,289 | | | | – | | | | – | |
| Net Change in Unrealized | | | | | | | | | | | | |
| Appreciation/Depreciation | | | | | | | | | | | | |
| Centrally Cleared Interest Rate Swap Contracts(8) | | $ | 236,594 | | | | – | | | $ | – | |
| Credit Default Swaps Contracts(8) | | | – | | | | – | | | | (1,332 | ) |
| Forward Foreign Currency Exchange Contracts(3) | | | – | | | $ | 10,434,003 | | | | – | |
| Futures Contracts(4) | | | (8,791 | ) | | | – | | | | – | |
| Average Number of Contracts/Notional Amounts* | | | | | | | | | | | | |
| Credit Default Swaps(5) | | | – | | | | – | | | $ | 4,314 | |
| Centrally Cleared Interest Rate Swap Contracts(5) | | $ | 38,000,000 | | | | – | | | | – | |
| Forward Foreign Currency Exchange Contracts(5) | | | – | | | $ | 383,823,736 | | | | – | |
| Futures Contracts(6) | | | 293 | | | | – | | | | – | |
| | | | | | |
| Emerging Markets Local Bond Fund | | | | | |
| | | | Interest Rate
Contracts | | | Foreign
Currency
Contracts | | | | | |
| Net Realized Gain (Loss) | | | | | | | | | | | | |
| Forward Foreign Currency Exchange Contracts(1) | | | – | | | $ | 112,151 | | | | | |
| Futures Contracts(2) | | | $(254 | ) | | | – | | | | | |
| Net Change in Unrealized | | | | | | | | | | | | |
| Appreciation/Depreciation | | | | | | | | | | | | |
| Forward Foreign Currency Exchange Contracts(3) | | | – | | | $ | 247 | | | | | |
| Average Number of Contracts/Notional Amounts* | | | | | | | | | | | | |
| Forward Foreign Currency Exchange Contracts(5) | | | – | | | $ | 7,722,098 | | | | | |
| Futures Contracts(6) | | | 1 | | | | – | | | | | |
108
Notes to Financial Statements (continued)
| Multi-Asset Global Opportunity Fund |
| | | Interest Rate
Contracts | | | Foreign
Currency
Contracts | | | Equity
Contracts | | | Credit
Contracts | |
| Net Realized Gain (Loss) | | | | | | | | | | | | | | | | |
| Credit Default Swaps Contracts(7) | | | – | | | | – | | | | – | | | $ | (72,299 | ) |
| Forward Foreign Currency Exchange Contracts(1) | | | – | | | $ | (1,794,054 | ) | | | – | | | | – | |
| Futures Contracts(2) | | $ | (77,725 | ) | | | – | | | $ | 1,989,551 | | | | – | |
| Net Change in Unrealized | | | | | | | | | | | | | | | | |
| Appreciation/Depreciation | | | | | | | | | | | | | | | | |
| Total Return Swap Contracts(8) | | | – | | | | – | | | $ | (207,784 | ) | | | – | |
| Forward Foreign Currency Exchange Contracts(3) | | | – | | | $ | (1,888,431 | ) | | | – | | | | – | |
| Futures Contracts(4) | | $ | (61,091 | ) | | | – | | | | 497,644 | | | | – | |
| Average Number of | | | | | | | | | | | | | | | | |
| Contracts/Notional Amounts* | | | | | | | | | | | | | | | | |
| Total Return Swap Contracts(5) | | | – | | | | – | | | $ | 1,108,173 | | | | – | |
| Credit Default Swap Contracts(5) | | | – | | | | – | | | | – | | | $ | 1,492,308 | |
| Forward Foreign Currency Exchange Contracts(5) | | | – | | | $ | 39,862,750 | | | | – | | | | – | |
| Futures Contracts(6) | | | 46 | | | | – | | | | 193 | | | | – | |
| * | | Calculated based on the number of contracts or notional amounts for the fiscal year ended December 31, 2017. |
| (1) | | Statements of Operations location: Net realized gain (loss) on foreign currency exchange contracts. |
| (2) | | Statements of Operations location: Net realized gain (loss) on futures contracts. |
| (3) | | Statements of Operations location: Net change in unrealized appreciation/depreciation on foreign currency exchange contracts. |
| (4) | | Statements of Operations location: Net change in unrealized appreciation/depreciation on futures contracts. |
| (5) | | Represents notional amounts. |
| (6) | | Amount represents number of contracts. |
| (7) | | Statements of Operations location: Net realized gain (loss) on swap contracts. |
| (8) | | Statements of Operations location: Net change in unrealized appreciation/depreciation on swap contracts. |
| 7. | DISCLOSURES ABOUT OFFSETTING ASSETS AND LIABILITIES |
The Financial Accounting Standards Board (“FASB”) requires disclosures intended to help better assess the effect or potential effect of offsetting arrangements on a fund’s financial position. The following tables illustrate gross and net information about recognized assets and liabilities eligible for offset in the statements of assets and liabilities; and disclose such amounts subject to an enforceable master netting agreement or similar agreement, by counterparty. A master netting agreement is an agreement between a fund and a counterparty which provides for the net settlement of amounts owed under all contracts traded under that agreement, as well as cash collateral, through a single payment by one party to the other in the event of default on or termination of any one contract. The Funds’ accounting policy with respect to balance sheet offsetting is that, absent an event of default by the counterparty or a termination of the agreement, the master netting agreement does not result in an offset of reported amounts of financial assets and liabilities in the statement of assets and liabilities across transactions between the Funds and the applicable counterparty:
109
Notes to Financial Statements (continued)
| Emerging Markets Corporate Debt Fund | |
| Description | | Gross Amounts of
Recognized Assets | | | Gross Amounts
Offset in the
Statement of Assets
and Liabilities | | | Net Amounts of
Assets Presented
in the Statement of
Assets and Liabilities | |
| Repurchase Agreement | | $ | 2,821,498 | | | $ | – | | | $ | 2,821,498 | |
| Total | | $ | 2,821,498 | | | $ | – | | | $ | 2,821,498 | |
| | | | | | | | | | |
| | | Net Amounts
of Assets
Presented in | | | Amounts Not Offset in the
Statement of Assets and Liabilities | | | | |
| Counterparty | | the Statement
of Assets and
Liabilities | | | Financial
Instruments | | | Cash
Collateral
Received(a) | | | Securities
Collateral
Received(a) | | | Net
Amount(b) | |
| Fixed Income Clearing Corp. | | $ | 2,821,498 | | | $ | – | | | $ | – | | | $ | (2,821,498 | ) | | $ | – | |
| Total | | $ | 2,821,498 | | | $ | – | | | $ | – | | | $ | (2,821,498 | ) | | $ | – | |
| | | | | | | | | | |
| Description | | Gross Amounts of
Recognized Liabilities | | | Gross Amounts
Offset in the
Statement of Assets
and Liabilities | | | Net Amounts of
Liabilities Presented
in the Statement of
Assets and Liabilities | |
| Forward Foreign Currency | | | | | | | | | |
| Exchange Contracts | | $ | 2,546 | | | $ | – | | | $ | 2,546 | |
| Total | | $ | 2,546 | | | $ | – | | | $ | 2,546 | |
| | | | | | | | | | |
| | | Net Amounts
of Liabilities
Presented in | | | Amounts Not Offset in the
Statement of Assets and Liabilities | | | | |
| Counterparty | | the Statement
of Assets and
Liabilities | | | Financial
Instruments | | | Cash
Collateral
Pledged(a) | | | Securities
Collateral
Pledged(a) | | | Net
Amount(c) | |
| State Street Bank and Trust | | $ | 2,546 | | | $ | – | | | $ | – | | | $ | – | | | $ | 2,546 | |
| Total | | $ | 2,546 | | | $ | – | | | $ | – | | | $ | – | | | $ | 2,546 | |
| | |
| Emerging Markets Currency Fund | |
| Description | | Gross Amounts of
Recognized Assets | | | Gross Amounts
Offset in the
Statement of Assets
and Liabilities | | | Net Amounts of
Assets Presented
in the Statement of
Assets and Liabilities | |
| Forward Foreign Currency | | | | | | | | | | | | |
| Exchange Contracts | | $ | 4,761,484 | | | $ | – | | | $ | 4,761,484 | |
| Total | | $ | 4,761,484 | | | $ | – | | | $ | 4,761,484 | |
110
Notes to Financial Statements (continued)
| | | Net Amounts | | | | | | | | | | | | | |
| | | of Assets | | | Amounts Not Offset in the | | | | |
| | | Presented in | | | Statement of Assets and Liabilities | | | | |
| | | the Statement | | | | | | Cash | | | Securities | | | | |
| | | of Assets and | | | Financial | | | Collateral | | | Collateral | | | Net | |
| Counterparty | | Liabilities | | | Instruments | | | Received(a) | | | Received(a) | | | Amount(b) | |
| Bank of America | | $ | 393,788 | | | $ | (2,230 | ) | | $ | (260,000 | ) | | $ | – | | | $ | 131,558 | |
| Barclays Bank plc | | | 1,086,343 | | | | (289,803 | ) | | | (690,000 | ) | | | – | | | | 106,540 | |
| BNP Paribas S.A. | | | 649,148 | | | | (182,652 | ) | | | (300,000 | ) | | | – | | | | 166,496 | |
| Citibank | | | 129,220 | | | | (40,788 | ) | | | – | | | | – | | | | 88,432 | |
| Deutsche Bank AG | | | 26,237 | | | | (389 | ) | | | – | | | | – | | | | 25,848 | |
| Goldman Sachs | | | 855,705 | | | | (1,098 | ) | | | (670,000 | ) | | | – | | | | 184,607 | |
| J.P. Morgan Chase | | | 494,237 | | | | (494,237 | ) | | | – | | | | – | | | | – | |
| Morgan Stanley | | | 249,980 | | | | (7,357 | ) | | | (30,000 | ) | | | – | | | | 212,623 | |
| Standard Chartered Bank | | | 113,857 | | | | (8,668 | ) | | | – | | | | – | | | | 105,189 | |
| State Street Bank and Trust | | | 757,888 | | | | (336,089 | ) | | | – | | | | (288,000 | ) | | | 133,799 | |
| UBS AG | | | 5,081 | | | | (5,081 | ) | | | – | | | | – | | | | – | |
| Total | | $ | 4,761,484 | | | $ | (1,368,392 | ) | | $ | (1,950,000 | ) | | $ | (288,000 | ) | | $ | 1,155,092 | |
| | | | | | Gross Amounts | | | Net Amounts of | |
| | | | | | Offset in the | | | Liabilities Presented | |
| | | Gross Amounts of | | | Statement of Assets | | | in the Statement of | |
| Description | | Recognized Liabilities | | | and Liabilities | | | Assets and Liabilities | |
| Forward Foreign Currency Exchange Contracts | | $ | 1,495,339 | | | $ | – | | | $ | 1,495,339 | |
| Total | | $ | 1,495,339 | | | $ | – | | | $ | 1,495,339 | |
| | | Net Amounts | | | | | | | | | | | | | |
| | | of Liabilities | | | Amounts Not Offset in the | | | | |
| | | Presented in | | | Statement of Assets and Liabilities | | | | |
| | | the Statement | | | | | | Cash | | | Securities | | | | |
| | | of Assets and | | | Financial | | | Collateral | | | Collateral | | | Net | |
| Counterparty | | Liabilities | | | Instruments | | | Pledged(a) | | | Pledged(a) | | | Amount(c) | |
| Bank of America | | $ | 2,230 | | | $ | (2,230 | ) | | $ | – | | | $ | – | | | $ | – | |
| Barclays Bank plc | | | 289,803 | | | | (289,803 | ) | | | – | | | | – | | | | – | |
| BNP Paribas S.A. | | | 182,652 | | | | (182,652 | ) | | | – | | | | – | | | | – | |
| Citibank | | | 40,788 | | | | (40,788 | ) | | | – | | | | – | | | | – | |
| Deutsche Bank AG | | | 389 | | | | (389 | ) | | | – | | | | – | | | | – | |
| Goldman Sachs | | | 1,098 | | | | (1,098 | ) | | | – | | | | – | | | | – | |
| J.P. Morgan Chase | | | 544,556 | | | | (494,237 | ) | | | – | | | | – | | | | 50,319 | |
| Morgan Stanley | | | 7,357 | | | | (7,357 | ) | | | – | | | | – | | | | – | |
| Standard Chartered Bank | | | 8,668 | | | | (8,668 | ) | | | – | | | | – | | | | – | |
| State Street Bank and Trust | | | 336,089 | | | | (336,089 | ) | | | – | | | | – | | | | – | |
| UBS AG | | | 81,709 | | | | (5,081 | ) | | | – | | | | – | | | | 76,628 | |
| Total | | $ | 1,495,339 | | | $ | (1,368,392 | ) | | $ | – | | | $ | – | | | $ | 126,947 | |
111
Notes to Financial Statements (continued)
| | | Emerging Markets Local Bond Fund | |
| | | | | | Gross Amounts | | | Net Amounts of | |
| | | | | | Offset in the | | Assets Presented | |
| | | Gross Amounts of | | | Statement of Assets | | in the Statement of | |
| Description | | Recognized Assets | | | and Liabilities | | Assets and Liabilities | |
| Forward Foreign Currency Exchange Contracts | | $ | 38,175 | | | $ | – | | | $ | 38,175 | |
| Total | | $ | 38,175 | | | $ | – | | | $ | 38,175 | |
| | | Net Amounts | | | | | | | | | | | | | |
| | | of Assets | | | Amounts Not Offset in the | | | | |
| | | Presented in | | | Statement of Assets and Liabilities | | | | |
| | | the Statement | | | | | | Cash | | | Securities | | | | |
| | | of Assets and | | | Financial | | | Collateral | | | Collateral | | | Net | |
| Counterparty | | Liabilities | | | Instruments | | | Received(a) | | | Received(a) | | | Amount(b) | |
| Bank of America | | $ | 69 | | | $ | (69 | ) | | $ | – | | | $ | – | | | $ | – | |
| BNP Paribas S.A. | | | 861 | | | | (861 | ) | | | – | | | | – | | | | – | |
| Citibank | | | 8,306 | | | | (21 | ) | | | – | | | | – | | | | 8,285 | |
| Goldman Sachs | | | 2,798 | | | | (56 | ) | | | – | | | | – | | | | 2,742 | |
| Standard Chartered Bank | | | 15,448 | | | | (1,757 | ) | | | – | | | | – | | | | 13,691 | |
| State Street Bank and Trust | | | 4,939 | | | | (4,939 | ) | | | – | | | | – | | | | – | |
| UBS AG | | | 5,754 | | | | – | | | | – | | | | – | | | | 5,754 | |
| Total | | $ | 38,175 | | | $ | (7,703 | ) | | $ | – | | | $ | – | | | $ | 30,472 | |
| | | | | | Gross Amounts | | | Net Amounts of | |
| | | | | | Offset in the | | | Liabilities Presented | |
| | | Gross Amounts of | | | Statement of Assets | | | in the Statement of | |
| Description | | Recognized Liabilities | | | and Liabilities | | | Assets and Liabilities | |
| Forward Foreign Currency Exchange Contracts | | $ | 38,073 | | | $ | – | | | $ | 38,073 | |
| Total | | $ | 38,073 | | | $ | – | | | $ | 38,073 | |
| | | Net Amounts | | | | | | | | | | | | | |
| | | of Liabilities | | | Amounts Not Offset in the | | | | |
| | | Presented in | | | Statement of Assets and Liabilities | | | | |
| | | the Statement | | | | | | Cash | | | Securities | | | | |
| | | of Assets and | | | Financial | | | Collateral | | | Collateral | | | Net | |
| Counterparty | | Liabilities | | | Instruments | | | Pledged(a) | | | Pledged(a) | | | Amount(c) | |
| Bank of America | | $ | 1,825 | | | $ | (69 | ) | | $ | – | | | $ | – | | | $ | 1,756 | |
| BNP Paribas S.A. | | | 9,227 | | | | (861 | ) | | | – | | | | – | | | | 8,366 | |
| Citibank | | | 21 | | | | (21 | ) | | | – | | | | – | | | | – | |
| Goldman Sachs | | | 56 | | | | (56 | ) | | | – | | | | – | | | | – | |
| Morgan Stanley | | | 3,462 | | | | – | | | | – | | | | – | | | | 3,462 | |
| Standard Chartered Bank | | | 1,757 | | | | (1,757 | ) | | | – | | | | – | | | | – | |
| State Street Bank and Trust | | | 21,725 | | | | (4,939 | ) | | | – | | | | – | | | | 16,786 | |
| Total | | $ | 38,073 | | | $ | (7,703 | ) | | $ | – | | | $ | – | | | $ | 30,370 | |
112
Notes to Financial Statements (continued)
| | | Multi-Asset Global Opportunity Fund | |
| | | | | | Gross Amounts | | | Net Amounts of | |
| | | | | | Offset in the | | | Assets Presented | |
| | | Gross Amounts of | | | Statement of Assets | | | in the Statement of | |
| Description | | Recognized Assets | | | and Liabilities | | | Assets and Liabilities | |
| Forward Foreign Currency Exchange Contracts | | $ | 92,491 | | | $ | – | | | $ | 92,491 | |
| Repurchase Agreement | | | 2,712,058 | | | | – | | | | 2,712,058 | |
| Total | | $ | 2,804,549 | | | $ | – | | | $ | 2,804,549 | |
| | | Net Amounts | | | | | | | | | | | | | |
| | | of Assets | | | Amounts Not Offset in the | | | | |
| | | Presented in | | | Statement of Assets and Liabilities | | | | |
| | | the Statement | | | | | | Cash | | | Securities | | | | |
| | | of Assets and | | | Financial | | | Collateral | | | Collateral | | | Net | |
| Counterparty | | Liabilities | | | Instruments | | | Received(a) | | | Received(a) | | | Amount(b) | |
| Fixed Income Clearing Corp. | | $ | 2,712,058 | | | $ | – | | | $ | – | | | $ | (2,712,058 | ) | | $ | – | |
| State Street Bank and Trust | | | 92,491 | | | | (92,491 | ) | | | – | | | | – | | | | – | |
| Total | | $ | 2,804,549 | | | $ | (92,491 | ) | | $ | – | | | $ | (2,712,058 | ) | | $ | – | |
| | | | | | Gross Amounts | | | Net Amounts of | |
| | | | | | Offset in the | | | Liabilities Presented | |
| | | Gross Amounts of | | | Statement of Assets | | | in the Statement of | |
| Description | | Recognized Liabilities | | | and Liabilities | | | Assets and Liabilities | |
| Forward Foreign Currency Exchange Contracts | | $ | 654,210 | | | $ | – | | | $ | 654,210 | |
| Total Return Swap Contracts | | | 207,784 | | | | – | | | | 207,784 | |
| Total | | $ | 861,994 | | | $ | – | | | $ | 861,994 | |
| | | | | | | | | | | | | | | | |
| | | Net Amounts | | | | | | | | | | | | | |
| | | of Liabilities | | | Amounts Not Offset in the | | | | |
| | | Presented in | | | Statement of Assets and Liabilities | | | | |
| | | the Statement | | | | | | Cash | | | Securities | | | | |
| | | of Assets and | | | Financial | | | Collateral | | | Collateral | | | Net | |
| Counterparty | | Liabilities | | | Instruments | | | Pledged(a) | | | Pledged(a) | | | Amount(c) | |
| Citibank | | $ | 38,376 | | | $ | – | | | $ | – | | | $ | – | | | $ | 38,376 | |
| Credit Suisse International | | | 57,699 | | | | – | | | | – | | | | – | | | | 57,699 | |
| Goldman Sachs | | | 241,223 | | | | – | | | | – | | | | – | | | | 241,223 | |
| Morgan Stanley | | | 11,437 | | | | – | | | | – | | | | – | | | | 11,437 | |
| Standard Chartered Bank | | | 200,476 | | | | – | | | | – | | | | – | | | | 200,476 | |
| State Street Bank and Trust | | | 312,783 | | | | (92,491 | ) | | | – | | | | – | | | | 220,292 | |
| Total | | $ | 861,994 | | | $ | (92,491 | ) | | $ | – | | | $ | – | | | $ | 769,503 | |
| | |
| (a) | Collateral disclosed is limited to an amount not to exceed 100% of the net amount of assets presented in the Statement of Assets and Liabilities, for each respective counterparty. |
| (b) | Net amount represents the amount owed to the Fund by the counterparty as of December 31, 2017. |
| (c) | Net amount represents the amount owed by the Fund to the counterparty as of December 31, 2017. |
| 8. | DIRECTORS’ REMUNERATION |
The Company’s officers and the two Directors who are associated with Lord Abbett do not receive any compensation from the Company for serving in such capacities. Independent Directors’ fees are allocated among all Lord Abbett-sponsored funds based on the net assets of each fund. There is an equity-based plan available to all Independent Directors under which Independent Directors must defer receipt of a portion of, and may elect to defer receipt of an additional portion of, Directors’
113
Notes to Financial Statements (continued)
fees. The deferred amounts are treated as though equivalent dollar amounts had been invested in the funds. Such amounts and earnings accrued thereon are included in Directors’ fees on the Statements of Operations and in Directors’ fees payable on the Statements of Assets and Liabilities and are not deductible for U.S. federal income tax purposes until such amounts are paid.
The Company has entered into an arrangement with its transfer agent and custodian, whereby credits realized as a result of uninvested cash balances are used to reduce a portion of each Fund’s expenses.
Effective August 28, 2017, the Funds and certain other funds managed by Lord Abbett (collectively, the “Participating Funds”) entered into an amended syndicated line of credit facility with various lenders for $600 million (the “Facility”), whereas State Street Bank and Trust Company (“SSB”) participates as a lender and as agent for the lenders. The Facility is to be used for temporary or emergency purposes as an additional source of liquidity to satisfy redemptions. The Participating Funds are subject to graduated borrowing limits of one-third of Fund assets (if Fund assets are less than $750 million), $250 million, $300 million, or $350 million, based on past borrowings and likelihood of future borrowings.
Prior to August 28, 2017, the Funds and certain other funds managed by Lord Abbett participated in a $550 million syndicated line of credit facility, based on the same terms as described above.
During the fiscal year ended December 31, 2017, the Funds did not utilize the Facility.
| 11. | INTERFUND LENDING PROGRAM |
Pursuant to an exemptive order issued by the U.S. Securities and Exchange Commission (“SEC exemptive order”), certain registered open-end management investment companies managed by Lord Abbett, including the Fund, participate in a joint lending and borrowing program (the “Interfund Lending Program”). The SEC exemptive order allows the Funds to borrow money from and lend money to each other for temporary or emergency purposes subject to the limitations and conditions.
During the fiscal year ended December 31, 2017, Emerging Markets Currency Fund participated as a lender in the Interfund Lending Program. The average amount loaned and average interest rate were $13,557,251 and 0.86%, respectively. The Fund earned interest of $958, which is included in the Statement of Operations.
There were no interfund loans outstanding as of December 31, 2017.
| 12. | CUSTODIAN AND ACCOUNTING AGENT |
SSB is the Company’s custodian and accounting agent. SSB performs custodial, accounting and recordkeeping functions relating to portfolio transactions and calculating each Fund’s NAV.
| 13. | TRANSACTIONS WITH AFFILIATED ISSUERS |
An affiliated issuer is one in which a Fund has ownership of at least 5% of the outstanding voting securities of the underlying issuer at any point during the fiscal year or any company which is under common ownership or control. Multi-Asset Global Opportunity Fund had the following transactions with affiliated issuers (i.e. the Underlying Funds) for the fiscal year ended December 31, 2017:
114
Notes to Financial Statements (continued)
Multi-Asset Global Opportunity Fund
| | | | | | | | | | | | | | | | | | | | | | | | Change in | |
| | | | | | | | | | | | | | | | | | | | | | | | unrealized | |
| | | Balance of | | | | | | | | | Balance of | | | | | | Net Realized | | | Dividend | | | Appreciation | |
| | | Shares | | | | | | | | | Shares | | | Fair | | | Gain (Loss) | | | Income | | | (Depreciation) | |
| | | Held at | | | Gross | | | Gross | | | Held at | | | Value at | | | 1/1/2017 to | | | 1/1/2017 to | | | 1/1/2017 to | |
| Affiliated Issuer | | 12/31/2016 | | | Additions | | | Sales | | | 12/31/2017 | | | 12/31/2017 | | | 12/31/2017 | | | 12/31/2017 | | | 12/31/2017 | |
| Lord Abbett Equity Trust-Calibrated Large Cap Value Fund – Class I | | | – | | | | 948,878 | | | | (73,343 | ) | | | 875,537 | | | $ | 18,272,452 | | | $ | 1,945,974 | (a) | | $ | (398,287 | ) | | $ | (143,603 | ) |
| Lord Abbett Equity Trust-Calibrated Mid Cap Value Fund-Class I | | | 1,566,048 | | | | 273,807 | | | | (439,132 | ) | | | 1,400,722 | | | | 30,409,685 | | | | 1,587,782 | (b) | | | 1,167,183 | | | | 420,279 | |
| Lord Abbett Investment Trust-Convertible Fund – Class I | | | – | | | | 1,456,626 | | | | (74,403 | ) | | | 1,382,223 | | | | 18,259,169 | | | | 43,435 | | | | 399,035 | | | | 1,020,339 | |
| Lord Abbett Global Fund, Inc. – Emerging Markets Currency Fund – Class I | | | 6,694,865 | | | | 420,456 | | | | (3,510,494 | ) | | | 3,604,827 | | | | 19,502,114 | | | | (2,860,954 | ) | | | 1,091,278 | | | | 4,421,729 | |
| Lord Abbett Securities Trust – Growth Leaders Fund – Class I | | | – | | | | 1,035,772 | | | | (6,709 | ) | | | 1,029,063 | | | | 29,132,787 | | | | 1,483,829 | (c) | | | – | | | | (394,518 | ) |
| Lord Abbett Investment Trust – High Yield Fund – Class I | | | 4,772,486 | | | | 1,868,045 | | | | (2,674,529 | ) | | | 3,966,002 | | | | 30,696,852 | | | | (220,416 | ) | | | 2,308,493 | | | | 1,329,349 | |
| Lord Abbett Investment Trust – Inflation Focused Fund – Class I | | | – | | | | 405,945 | | | | (827 | ) | | | 405,118 | | | | 4,824,957 | | | | (281 | ) | | | 144,143 | | | | (102,775 | ) |
| Lord Abbett Securities Trust – International Dividend Income Fund – Class I | | | 13,672,118 | | | | 429,149 | | | | (6,833,156 | ) | | | 7,268,111 | | | | 57,563,439 | | | | (10,483,508 | ) | | | 2,018,100 | | | | 22,069,983 | |
| Lord Abbett Securities Trust – International Equity Fund – Class I | | | 469,166 | | | | 1,089,892 | | | | (108,151 | ) | | | 1,450,907 | | | | 20,864,049 | | | | 199,873 | | | | 443,439 | | | | 2,171,828 | |
| Lord Abbett Mid Cap Stock Fund, Inc. – Class I | | | 1,165,421 | | | | 39,923 | | | | (795,142 | ) | | | 410,202 | | | | 12,166,576 | | | | 6,606,421 | (d) | | | 141,596 | | | | (5,110,509 | ) |
| Lord Abbett Investment Trust – Short Duration Income Fund – Class I | | | 1,159,263 | | | | 5,486,275 | | | | (5,459,666 | ) | | | 1,185,872 | | | | 5,039,955 | | | | (44,526 | ) | | | 115,744 | | | | 11,867 | |
| Total | | | | | | | | | | | | | | | | | | $ | 246,732,035 | | | $ | (1,742,371 | ) | | $ | 7,430,724 | | | $ | 25,693,969 | |
| | |
| (a) | Includes $1,202,660 of distributed capital gains. |
| (b) | Includes $1,946,494 of distributed capital gains. |
| (c) | Includes $1,477,103 of distributed capital gains. |
| (d) | Includes $208,923 of distributed capital gains. |
115
Notes to Financial Statements (continued)
Each Fund is subject to the risks of investing in securities that are issued by non-U.S. entities, the risks of investing in derivatives, liquidity risk, and the risks from leverage.
Foreign securities may pose greater risks than domestic securities, including greater price fluctuations, less government regulation, higher transaction costs and other costs, and delays in settlement to the extent they are traded on non-U.S. exchanges or markets. Foreign securities may also be subject to inadequate exchange control regulations and the imposition of economic sanctions or other government restrictions. These risks generally are greater for emerging markets securities. Foreign investments also may be affected by changes in currency rates or currency controls.
The risks associated with derivatives may be different from and greater than the risks associated with directly investing in securities. Derivatives are subject to risks such as liquidity risk, leveraging risk, interest rate risk, market risk, and credit risk. Derivatives also involve the risk of mispricing or improper valuation and the risk that changes in the value of the derivative may not correlate perfectly with the value of the underlying asset, rate, or index. Whether a Fund’s use of derivatives is successful will depend on, among other things, the Fund’s ability to correctly forecast market movements, changes in foreign exchange and interest rates, and other factors. Losses may also arise from the failure of a derivative counterparty to meet its contractual obligations. If a Fund incorrectly forecasts these and other factors, its performance could suffer. The Fund’s use of derivatives could result in a loss exceeding the amount of the Fund’s investment in these instruments.
Emerging Markets Currency Fund and Emerging Markets Local Bond Fund are non-diversified, which means that they each may invest a greater portion of their assets in a single issuer than a diversified fund. Thus, they may be exposed to greater risk.
Each Fund may invest in swap contracts. Swap contracts are bilateral agreements between a fund and its counterparty. Each party is exposed to the risk of default by the other. In addition, swap contracts may involve a small investment of cash compared to the risk assumed, with the result that small changes may produce disproportionate and substantial gains or losses to a Fund.
Each Fund may invest in convertible securities, which have both equity and fixed income risk characteristics. Generally, convertible securities offer lower interest or dividend yields than non-convertible securities of similar quality and less potential for gains or capital appreciation in a rising equity securities market than equity securities. They tend to be more volatile than other fixed income securities and the market for convertible securities may be less liquid than markets for stocks or bonds. A significant portion of convertible securities have below investment grade credit ratings and are subject to increased credit and liquidity risks.
Each Fund may invest in credit default swap and interest rate swap contracts. Such contracts are subject to the risk that there will be no liquid market for these agreements, that the counterparty to the agreements may default on its obligation to perform or disagree as to the meaning of the contractual terms in the agreements. Credit default swaps are subject to the risk and that Lord Abbett does not correctly predict the creditworthiness of the issuers of the reference obligation on which the swap is based. Interest rate swaps are subject to the risk that Lord Abbett does not correctly anticipate changes in interest rates.
Each Fund may invest in senior loans, which are subject to increased credit and liquidity risks. Senior loans are business loans made to borrowers that may be U.S. or foreign corporations, partnerships, or other business entities. The senior loans in which a Fund invests may consist primarily of senior
116
Notes to Financial Statements (continued)
loans that are rated below investment grade or, if unrated, deemed by Lord Abbett to be equivalent to below investment grade securities. Below investment grade senior loans, as in the case of high-yield debt securities, or junk bonds, are usually more credit sensitive than interest rate sensitive, although the value of these instruments may be impacted by broader interest rate swings in the overall fixed income market. In addition, senior loans may be subject to structural subordination.
Illiquid securities may lower a Fund’s returns since it may be unable to sell these securities at its desired time or price. To the extent illiquid securities can be sold, a Fund may have to do so at disadvantageous prices in order to meet requests for the redemption of Fund shares.
Leverage, including borrowing, may increase volatility in a Fund by magnifying the effect of changes in the value of each Fund’s holdings. The use of leverage may cause investors in a Fund to lose more money in adverse environments than would be the case in the absence of leverage.
Each Fund is subject to the general risks and considerations associated with investing in debt securities and to the changing prospects of individual companies and/or sectors in which the Fund invests, including interest rate risk. When interest rates rise, the prices of debt securities and an investment in a Fund are likely to decline. In times of economic uncertainty, high-yield debt securities (“lower-rated bonds” or “junk bonds”) may decline in price, even when interest rates are falling. There is also the risk that an issuer of a debt security will fail to make timely payments of principal or interest to a Fund, a risk that is greater with junk bonds. A default, or concerns in the market about an increase in risk of default, may result in losses to a Fund. High-yield securities are subject to greater price fluctuations, as well as additional risks. The market for below investment grade securities may be less liquid, which may make such securities more difficult to sell at an acceptable price, especially during periods of financial distress, increased market volatility, or significant market decline.
Each Fund is subject to the risk of investing in securities issued or guaranteed by the U.S. Government or its agencies and instrumentalities (such as the Government National Mortgage Association (“Ginnie Mae’’), the Federal National Mortgage Association (“Fannie Mae”), or the Federal Home Loan Mortgage Corporation (“Freddie Mac”)). Unlike Ginnie Mae securities, securities issued or guaranteed by U.S. Government-related organizations such as Fannie Mae and Freddie Mac are not backed by the full faith and credit of the U.S. Government and no assurance can be given that the U.S. Government would provide financial support to its agencies and instrumentalities if not required to do so by law. Consequently, each Fund may be required to look principally to the agency issuing or guaranteeing the obligation.
The mortgage-related and asset-backed securities in which a Fund may invest may be particularly sensitive to changes in prevailing interest rates, economic conditions, including delinquencies and/or defaults. These changes can affect the value, income and/or liquidity of such positions. When interest rates are declining, the value of these securities with prepayment features may not increase as much as other fixed income securities. Early principal repayment may deprive a Fund of income payments above current market rates. Alternatively, rising interest rates may cause payments to occur at a slower-than-expected rate, extending the duration of a security and typically reducing its value. The payment rate will thus affect the price and volatility of a mortgage-related security.
The cost of a Fund’s potential use of forward foreign currency exchange contracts varies with factors such as the currencies involved, the length of the contract period, and the market conditions prevailing. Foreign currency exchange rates may fluctuate significantly over short periods of time. Emerging Markets Corporate Debt Fund, Emerging Markets Currency Fund and
117
Notes to Financial Statements (continued)
Emerging Markets Local Bond Fund’s use of currency-related transactions involves the risk that Lord Abbett will not accurately predict currency movements, and each Fund’s returns could be reduced as a result. A decline in the value of foreign currencies relative to the U.S. dollar will reduce the value of securities held by Emerging Markets Corporate Debt Fund, Emerging Markets Currency Fund and Emerging Markets Local Bond Fund that are denominated in those currencies.
The securities markets of developing or emerging countries tend to be more vulnerable to economic, political and social instability, less liquid, are especially subject to greater price volatility, have a smaller market capitalization, have less government regulation and may not be subject to as extensive and frequent accounting, financial, and other reporting requirements as securities issued in more developed countries.
Bonds issued or guaranteed by foreign governments and governmental entities (commonly referred to as “sovereign debt”) are subject to the risk that such governments or entities are unable or unwilling to make interest payments and/or repay the principal owed. Each of Emerging Markets Corporate Debt Fund and Emerging Markets Local Bond Fund may have limited recourse in such instances.
Emerging Markets Corporate Debt Fund, Emerging Markets Currency Fund and Emerging Markets Local Bond Fund believe that their investment strategies with respect to foreign currencies will generate qualifying income under current U.S. federal income tax law. However, there can be no assurance that the U.S. Treasury Department will not issue regulations in the future (possibly with retroactive effect) that would treat some or all of each Fund’s foreign currency gains as nonqualifying income.
The value of Multi-Asset Global Opportunity Fund’s investments will fluctuate in response to various factors related to domestic and foreign equity and fixed income markets, as well as the financial condition and prospects of issuers in which the Fund invests through its Underlying Funds. In addition, the Multi-Asset Global Opportunity Fund is exposed to the same risks as the Underlying Funds in direct proportion to the allocation of its assets among the Underlying Funds. Because equity and fixed income investments can move in different directions or to different degrees, fixed income investments may counteract some of the volatility experienced by equity holdings, but the diminished risk that may accompany this investment approach also may result in lower returns.
These factors can affect each Fund’s performance.
| 15. | SUMMARY OF CAPITAL TRANSACTIONS |
Transactions in shares of capital stock were as follows:
| Emerging Markets Corporate Debt Fund | | Year Ended
December 31, 2017 | | | Year Ended
December 31, 2016 | |
| Class A Shares | | Shares | | | Amount | | | Shares | | | Amount | |
| Shares sold | | | 1,051,095 | | | $ | 16,408,549 | | | | 626,280 | | | $ | 9,624,073 | |
| Reinvestment of distributions | | | 39,045 | | | | 608,979 | | | | 34,340 | | | | 518,899 | |
| Shares reacquired | | | (701,633 | ) | | | (10,935,061 | ) | | | (1,118,621 | ) | | | (17,046,361 | ) |
| Increase (decrease) | | | 388,507 | | | $ | 6,082,467 | | | | (458,001 | ) | | $ | (6,903,389 | ) |
118
Notes to Financial Statements (continued)
| Emerging Markets Corporate Debt Fund | | Year Ended
December 31, 2017 | | | Year Ended
December 31, 2016 | |
| Class C Shares | | Shares | | | Amount | | | Shares | | | Amount | |
| Shares sold | | | 68,230 | | | $ | 1,066,379 | | | | 64,638 | | | $ | 996,895 | |
| Reinvestment of distributions | | | 4,839 | | | | 75,396 | | | | 2,087 | | | | 31,622 | |
| Shares reacquired | | | (8,074 | ) | | | (125,643 | ) | | | (26,480 | ) | | | (402,036 | ) |
| Increase | | | 64,995 | | | $ | 1,016,132 | | | | 40,245 | | | $ | 626,481 | |
| Class F Shares | | | | | | | | | | | | | | | | |
| Shares sold | | | 1,354,490 | | | $ | 21,088,655 | | | | 969,753 | | | $ | 14,302,947 | |
| Reinvestment of distributions | | | 71,657 | | | | 1,117,444 | | | | 32,444 | | | | 489,655 | |
| Shares reacquired | | | (465,881 | ) | | | (7,303,074 | ) | | | (1,057,051 | ) | | | (15,569,272 | ) |
| Increase (decrease) | | | 960,266 | | | $ | 14,903,025 | | | | (54,854 | ) | | $ | (776,670 | ) |
| Class F3 Shares(a) | | | | | | | | | | | | | | | | |
| Shares sold | | | 648.09 | | | $ | 10,000 | | | | – | | | $ | – | |
| Reinvestment of distributions | | | 28.50 | | | | 445 | | | | – | | | | – | |
| Increase | | | 676.59 | | | $ | 10,445 | | | | – | | | $ | – | |
| Class I Shares | | | | | | | | | | | | | | | | |
| Shares sold | | | 171,795 | | | $ | 2,665,663 | | | | – | | | $ | – | |
| Reinvestment of distributions | | | 34,663 | | | | 539,806 | | | | 31,367 | | | | 473,182 | |
| Shares reacquired | | | (28,394 | ) | | | (443,010 | ) | | | (194,229 | ) | | | (3,031,426 | ) |
| Increase (decrease) | | | 178,064 | | | $ | 2,762,459 | | | | (162,862 | ) | | $ | (2,558,244 | ) |
| Class R2 Shares | | | | | | | | | | | | | | | | |
| Reinvestment of distributions | | | 433 | | | $ | 6,740 | | | | 353 | | | $ | 5,339 | |
| Increase | | | 433 | | | $ | 6,740 | | | | 353 | | | $ | 5,339 | |
| Class R3 Shares | | | | | | | | | | | | | | | | |
| Shares sold | | | 1,152 | | | $ | 18,000 | | | | – | | | $ | – | |
| Reinvestment of distributions | | | 440 | | | | 6,852 | | | | 353 | | | | 5,339 | |
| Increase | | | 1,592 | | | $ | 24,852 | | | | 353 | | | $ | 5,339 | |
| Class R4 Shares | | | | | | | | | | | | | | | | |
| Reinvestment of distributions | | | 37.19 | | | | 579 | | | | 30 | | | | 457 | |
| Increase | | | 37.19 | | | $ | 579 | | | | 30 | | | $ | 457 | |
| Class R5 Shares | | | | | | | | | | | | | | | | |
| Shares sold | | | 982 | | | $ | 15,384 | | | | 1,634 | | | $ | 23,973 | |
| Reinvestment of distributions | | | 145 | | | | 2,261 | | | | 91 | | | | 1,387 | |
| Shares reacquired | | | (9 | ) | | | (142 | ) | | | (69 | ) | | | (1,072 | ) |
| Increase | | | 1,118 | | | $ | 17,503 | | | | 1,656 | | | $ | 24,288 | |
| Class R6 Shares | | | | | | | | | | | | | | | | |
| Reinvestment of distributions | | | 40.44 | | | | 629 | | | | 32.49 | | | | 492 | |
| Increase | | | 40.44 | | | $ | 629 | | | | 32.49 | | | $ | 492 | |
119
Notes to Financial Statements (continued)
| Emerging Markets Currency Fund | | Year Ended
December 31, 2017 | | | Year Ended
December 31, 2016 | |
| Class A Shares | | Shares | | | Amount | | | Shares | | | Amount | |
| Shares sold | | | 487,152 | | | $ | 2,593,453 | | | | 490,790 | | | $ | 2,559,080 | |
| Converted from Class B* | | | 5,736 | | | | 30,699 | | | | 15,609 | | | | 81,471 | |
| Reinvestment of distributions | | | 121,569 | | | | 650,407 | | | | 187,047 | | | | 966,424 | |
| Shares reacquired | | | (929,915 | ) | | | (4,953,828 | ) | | | (1,117,043 | ) | | | (5,837,072 | ) |
| Decrease | | | (315,458 | ) | | $ | (1,679,269 | ) | | | (423,597 | ) | | $ | (2,230,097 | ) |
| Class B Shares | | | | | | | | | | | | | | | | |
| Shares sold | | | 841 | | | $ | 4,414 | | | | 75 | | | $ | 395 | |
| Reinvestment of distributions | | | 227 | | | | 1,219 | | | | 789 | | | | 4,096 | |
| Shares reacquired | | | (4,230 | ) | | | (22,725 | ) | | | (9,196 | ) | | | (48,819 | ) |
| Converted to Class A* | | | (5,711 | ) | | | (30,699 | ) | | | (15,538 | ) | | | (81,471 | ) |
| Decrease | | | (8,873 | ) | | $ | (47,791 | ) | | | (23,870 | ) | | $ | (125,799 | ) |
| Class C Shares | | | | | | | | | | | | | | | | |
| Shares sold | | | 93,947 | | | $ | 500,260 | | | | 46,051 | | | $ | 241,406 | |
| Reinvestment of distributions | | | 17,859 | | | | 96,179 | | | | 27,145 | | | | 140,843 | |
| Shares reacquired | | | (314,953 | ) | | | (1,683,335 | ) | | | (374,321 | ) | | | (1,954,356 | ) |
| Decrease | | | (203,147 | ) | | $ | (1,086,896 | ) | | | (301,125 | ) | | $ | (1,572,107 | ) |
| Class F Shares | | | | | | | | | | | | | | | | |
| Shares sold | | | 940,730 | | | $ | 5,053,983 | | | | 394,398 | | | $ | 2,051,518 | |
| Reinvestment of distributions | | | 58,042 | | | | 310,861 | | | | 78,172 | | | | 403,921 | |
| Shares reacquired | | | (1,090,390 | ) | | | (5,817,170 | ) | | | (883,313 | ) | | | (4,597,477 | ) |
| Decrease | | | (91,618 | ) | | $ | (452,326 | ) | | | (410,743 | ) | | $ | (2,142,038 | ) |
| Class F3 Shares(a) | | | | | | | | | | | | | | | | |
| Shares sold | | | 88,123 | | | $ | 475,419 | | | | – | | | $ | – | |
| Reinvestment of distributions | | | 1,000 | | | | 5,371 | | | | – | | | | – | |
| Shares reacquired | | | (4,696 | ) | | | (25,230 | ) | | | – | | | | – | |
| Increase | | | 84,427 | | | $ | 455,560 | | | | – | | | $ | – | |
| Class I Shares | | | | | | | | | | | | | | | | |
| Shares sold | | | 1,067,190 | | | $ | 5,705,353 | | | | 22,538,806 | | | $ | 119,250,459 | |
| Reinvestment of distributions | | | 1,880,553 | | | | 10,036,785 | | | | 4,101,552 | | | | 21,172,370 | |
| Shares reacquired | | | (37,920,978 | ) | | | (198,218,923 | ) | | | (43,629,353 | ) | | | (224,196,217 | ) |
| Decrease | | | (34,973,235 | ) | | $ | (182,476,785 | ) | | | (16,988,995 | ) | | $ | (83,773,388 | ) |
| Class R2 Shares | | | | | | | | | | | | | | | | |
| Shares sold | | | 4,458 | | | $ | 23,875 | | | | 6,250 | | | $ | 32,694 | |
| Reinvestment of distributions | | | 132 | | | | 710 | | | | 169 | | | | 873 | |
| Shares reacquired | | | (8,620 | ) | | | (46,147 | ) | | | (7,595 | ) | | | (39,619 | ) |
| Decrease | | | (4,030 | ) | | $ | (21,562 | ) | | | (1,176 | ) | | $ | (6,052 | ) |
| Class R3 Shares | | | | | | | | | | | | | | | | |
| Shares sold | | | 34,610 | | | $ | 182,065 | | | | 34,012 | | | $ | 174,691 | |
| Reinvestment of distributions | | | 2,120 | | | | 11,335 | | | | 3,281 | | | | 16,906 | |
| Shares reacquired | | | (46,061 | ) | | | (242,536 | ) | | | (35,204 | ) | | | (183,283 | ) |
| Increase (decrease) | | | (9,331 | ) | | $ | (49,136 | ) | | | 2,089 | | | $ | 8,314 | |
120
Notes to Financial Statements (continued)
| Emerging Markets Currency Fund | | Year Ended
December 31, 2017 | | | Year Ended
December 31, 2016 | |
| Class R4 Shares | | Shares | | | Amount | | | Shares | | | Amount | |
| Shares sold | | | 4,335 | | | $ | 23,204 | | | | – | | | $ | – | |
| Reinvestment of distributions | | | 148 | | | | 795 | | | | 101 | | | | 517 | |
| Shares reacquired | | | (1,355 | ) | | | (7,278 | ) | | | – | | | | – | |
| Increase | | | 3,128 | | | $ | 16,721 | | | | 101 | | | $ | 517 | |
| Class R5 Shares | | | | | | | | | | | | | | | | |
| Shares sold | | | 44 | | | $ | 235 | | | | 16 | | | $ | 86 | |
| Reinvestment of distributions | | | 91 | | | | 489 | | | | 106 | | | | 546 | |
| Shares reacquired | | | (21 | ) | | | (115 | ) | | | – | | | | – | |
| Increase | | | 114 | | | $ | 609 | | | | 122 | | | $ | 632 | |
| Class R6 Shares | | | | | | | | | | | | | | | | |
| Shares sold | | | 133,142 | | | $ | 708,220 | | | | – | | | $ | – | |
| Reinvestment of distributions | | | 385 | | | | 2,067 | | | | 107 | | | | 554 | |
| Shares reacquired | | | (38,534 | ) | | | (205,387 | ) | | | – | | | | – | |
| Increase | | | 94,993 | | | $ | 504,900 | | | | 107 | | | $ | 554 | |
| | | | | | | | | | | | | | | | | |
| Emerging Markets Local Bond Fund | | Year Ended
December 31, 2017 | | | Year Ended
December 31, 2016 | |
| Class A Shares | | | Shares | | | | Amount | | | | Shares | | | | Amount | |
| Shares sold | | | 195,730 | | | $ | 2,087,963 | | | | 130,631 | | | $ | 1,385,183 | |
| Reinvestment of distributions | | | 43,541 | | | | 461,971 | | | | 35,935 | | | | 375,695 | |
| Shares reacquired | | | (234,369 | ) | | | (2,515,744 | ) | | | (42,532 | ) | | | (441,764 | ) |
| Increase | | | 4,902 | | | $ | 34,190 | | | | 124,034 | | | $ | 1,319,114 | |
| Class C Shares | | | | | | | | | | | | | | | | |
| Shares sold | | | 90,016 | | | $ | 968,440 | | | | 19,543 | | | $ | 205,516 | |
| Reinvestment of distributions | | | 3,242 | | | | 34,455 | | | | 1,728 | | | | 18,065 | |
| Shares reacquired | | | (37,474 | ) | | | (398,831 | ) | | | (15,978 | ) | | | (166,023 | ) |
| Increase | | | 55,784 | | | $ | 604,064 | | | | 5,293 | | | $ | 57,558 | |
| Class F Shares | | | | | | | | | | | | | | | | |
| Shares sold | | | 54,054 | | | $ | 573,476 | | | | 58,329 | | | $ | 621,419 | |
| Reinvestment of distributions | | | 2,859 | | | | 30,456 | | | | 1,197 | | | | 12,362 | |
| Shares reacquired | | | (50,420 | ) | | | (541,534 | ) | | | (48,930 | ) | | | (488,245 | ) |
| Increase | | | 6,493 | | | $ | 62,398 | | | | 10,596 | | | $ | 145,536 | |
| Class F3 Shares(a) | | | | | | | | | | | | | | | | |
| Shares sold | | | 37,929 | | | $ | 408,673 | | | | – | | | $ | – | |
| Reinvestment of distributions | | | 654 | | | | 6,897 | | | | – | | | | – | |
| Shares reacquired | | | (2,867 | ) | | | (30,601 | ) | | | – | | | | – | |
| Increase | | | 35,716 | | | $ | 384,969 | | | | – | | | $ | – | |
| Class I Shares | | | | | | | | | | | | | | | | |
| Reinvestment of distributions | | | 14,478 | | | $ | 153,600 | | | | 12,122 | | | $ | 126,613 | |
| Increase | | | 14,478 | | | $ | 153,600 | | | | 12,122 | | | $ | 126,613 | |
| Class R2 Shares | | | | | | | | | | | | | | | | |
| Reinvestment of distributions | | | 629 | | | $ | 6,665 | | | | 525 | | | $ | 5,487 | |
| Increase | | | 629 | | | $ | 6,665 | | | | 525 | | | $ | 5,487 | |
121
Notes to Financial Statements (continued)
| Emerging Markets Local Bond Fund | | Year Ended
December 31, 2017 | | | Year Ended
December 31, 2016 | |
| Class R3 Shares | | Shares | | | Amount | | | Shares | | | Amount | |
| Shares sold | | | 11 | | | $ | 120 | | | | – | | | $ | – | |
| Reinvestment of distributions | | | 629 | | | | 6,671 | | | | 526 | | | | 5,489 | |
| Shares reacquired | | | (12 | ) | | | (123 | ) | | | – | | | | – | |
| Increase | | | 628 | | | $ | 6,668 | | | | 526 | | | $ | 5,489 | |
| Class R4 Shares | | | | | | | | | | | | | | | | |
| Reinvestment of distributions | | | 71 | | | | 746 | | | | 58.13 | | | | 609 | |
| Increase | | | 71 | | | $ | 746 | | | | 58.13 | | | $ | 609 | |
| Class R5 Shares | | | | | | | | | | | | | | | | |
| Shares sold | | | 1,327 | | | $ | 13,771 | | | | – | | | $ | – | |
| Reinvestment of distributions | | | 86 | | | | 912 | | | | 60.69 | | | | 635 | |
| Shares reacquired | | | (1 | ) | | | (9 | ) | | | – | | | | – | |
| Increase | | | 1,412 | | | $ | 14,674 | | | | 60.69 | | | $ | 635 | |
| Class R6 Shares | | | | | | | | | | | | | | | | |
| Reinvestment of distributions | | | 74 | | | | 786 | | | | 61 | | | | 641 | |
| Increase | | | 74 | | | $ | 786 | | | | 61 | | | $ | 641 | |
| | | | | | | | | | | | | | | | | |
| Multi-Asset Global Opportunity Fund | | Year Ended
December 31, 2017 | | | Year Ended
December 31, 2016 | |
| Class A Shares | | | Shares | | | | Amount | | | | Shares | | | | Amount | |
| Shares sold | | | 3,079,342 | | | $ | 34,608,109 | | | | 1,848,399 | | | $ | 19,019,908 | |
| Converted from Class B* | | | 72,078 | | | | 818,653 | | | | 50,505 | | | | 516,452 | |
| Reinvestment of distributions | | | 396,248 | | | | 4,545,856 | | | | 626,033 | | | | 6,578,705 | |
| Shares reacquired | | | (4,495,368 | ) | | | (50,159,022 | ) | | | (5,182,635 | ) | | | (53,956,237 | ) |
| Decrease | | | (947,700 | ) | | $ | (10,186,404 | ) | | | (2,657,698 | ) | | $ | (27,841,172 | ) |
| Class B Shares | | | | | | | | | | | | | | | | |
| Shares sold | | | 12,358 | | | $ | 121,471 | | | | 11,095 | | | $ | 101,963 | |
| Reinvestment of distributions | | | 2,243 | | | | 23,065 | | | | 8,859 | | | | 84,046 | |
| Shares reacquired | | | (48,538 | ) | | | (485,490 | ) | | | (95,974 | ) | | | (896,511 | ) |
| Converted to Class A* | | | (80,031 | ) | | | (818,653 | ) | | | (55,877 | ) | | | (516,452 | ) |
| Decrease | | | (113,968 | ) | | $ | (1,159,607 | ) | | | (131,897 | ) | | $ | (1,226,954 | ) |
| Class C Shares | | | | | | | | | | | | | | | | |
| Shares sold | | | 975,520 | | | $ | 9,746,924 | | | | 423,044 | | | $ | 3,928,011 | |
| Reinvestment of distributions | | | 93,530 | | | | 965,794 | | | | 157,755 | | | | 1,497,694 | |
| Shares reacquired | | | (1,504,522 | ) | | | (15,027,721 | ) | | | (1,550,694 | ) | | | (14,490,196 | ) |
| Decrease | | | (435,472 | ) | | $ | (4,315,003 | ) | | | (969,895 | ) | | $ | (9,064,491 | ) |
| Class F Shares | | | | | | | | | | | | | | | | |
| Shares sold | | | 321,510 | | | $ | 3,629,103 | | | | 140,441 | | | $ | 1,468,581 | |
| Reinvestment of distributions | | | 14,381 | | | | 164,992 | | | | 20,204 | | | | 212,262 | |
| Shares reacquired | | | (285,438 | ) | | | (3,241,530 | ) | | | (556,143 | ) | | | (5,700,647 | ) |
| Increase (decrease) | | | 50,453 | | | $ | 552,565 | | | | (395,498 | ) | | $ | (4,019,804 | ) |
122
Notes to Financial Statements (concluded)
| Multi-Asset Global Opportunity Fund | | Year Ended
December 31, 2017 | | | Year Ended
December 31, 2016 | |
| Class F3 Shares(a) | | Shares | | | Amount | | | Shares | | | Amount | |
| Shares sold | | | 1,695 | | | $ | 19,025 | | | | – | | | $ | – | |
| Reinvestment of distributions | | | 54 | | | | 623 | | | | – | | | | – | |
| Shares reacquired | | | (25 | ) | | | (291 | ) | | | – | | | | – | |
| Increase | | | 1,724 | | | $ | 19,357 | | | | – | | | $ | – | |
| Class I Shares | | | | | | | | | | | | | | | | |
| Shares sold | | | 271,000 | | | $ | 3,196,698 | | | | 20,562 | | | $ | 210,307 | |
| Reinvestment of distributions | | | 2,790 | | | | 32,465 | | | | 9,806 | | | | 103,921 | |
| Shares reacquired | | | (151,735 | ) | | | (1,714,162 | ) | | | (27,553 | ) | | | (288,891 | ) |
| Increase | | | 122,055 | | | $ | 1,515,001 | | | | 2,815 | | | $ | 25,337 | |
| Class R2 Shares | | | | | | | | | | | | | | | | |
| Shares sold | | | 12,058 | | | $ | 140,310 | | | | 4,773 | | | $ | 50,246 | |
| Reinvestment of distributions | | | 1,405 | | | | 16,502 | | | | 1,483 | | | | 15,931 | |
| Shares reacquired | | | (1,541 | ) | | | (17,748 | ) | | | (3,611 | ) | | | (36,818 | ) |
| Increase | | | 11,922 | | | $ | 139,064 | | | | 2,645 | | | $ | 29,359 | |
| Class R3 Shares | | | | | | | | | | | | | | | | |
| Shares sold | | | 366,243 | | | $ | 4,034,359 | | | | 134,579 | | | $ | 1,396,105 | |
| Reinvestment of distributions | | | 11,980 | | | | 137,987 | | | | 27,218 | | | | 287,896 | |
| Shares reacquired | | | (633,440 | ) | | | (7,031,212 | ) | | | (178,118 | ) | | | (1,879,782 | ) |
| Decrease | | | (255,217 | ) | | $ | (2,858,866 | ) | | | (16,321 | ) | | $ | (195,781 | ) |
| Class R4 Shares | | | | | | | | | | | | | | | | |
| Shares sold | | | 28,916 | | | $ | 327,244 | | | | – | | | $ | – | |
| Reinvestment of distributions | | | 727 | | | | 8,388 | | | | 42 | | | | 442 | |
| Shares reacquired | | | (2,675 | ) | | | (30,186 | ) | | | – | | | | – | |
| Increase | | | 26,968 | | | $ | 305,446 | | | | 42 | | | $ | 442 | |
| Class R5 Shares | | | | | | | | | | | | | | | | |
| Shares sold | | | 1,776 | | | $ | 19,876 | | | | – | | | $ | – | |
| Reinvestment of distributions | | | 89 | | | | 1,027 | | | | 43.67 | | | | 463 | |
| Shares reacquired | | | (17 | ) | | | (196 | ) | | | – | | | | – | |
| Increase | | | 1,848 | | | $ | 20,707 | | | | 43.67 | | | $ | 463 | |
| Class R6 Shares | | | | | | | | | | | | | | | | |
| Shares sold | | | 111,118 | | | $ | 1,243,103 | | | | 478,011 | | | $ | 5,000,000 | |
| Reinvestment of distributions | | | 153,689 | | | | 1,775,606 | | | | 182,208 | | | | 1,932,044 | |
| Shares reacquired | | | (61,520 | ) | | | (690,342 | ) | | | – | | | | – | |
| Increase | | | 203,287 | | | $ | 2,328,367 | | | | 660,219 | | | $ | 6,932,044 | |
| * | Automatic conversion of Class B shares occurs on the 25th day of the month (or, if the 25th day is not a business day, the next business day thereafter) following the eighth anniversary of the day on which the purchase order was accepted. |
| (a) | Shares commenced on April 4, 2017. |
123
Report of Independent Registered Public Accounting Firm
To the shareholders and Board of Directors of Lord Abbett Global Fund, Inc.:
Opinion on the Financial Statements and Financial Highlights
We have audited the accompanying statements of assets and liabilities of Lord Abbett Global Fund, Inc. (the “Funds”) comprising the Lord Abbett Emerging Markets Corporate Debt Fund, Lord Abbett Emerging Markets Currency Fund, Lord Abbett Emerging Markets Local Bond Fund, and Lord Abbett Multi-Asset Global Opportunity Fund, including the schedules of investments as of December 31, 2017, the related statements of operations for the year then ended, the statements of changes in net assets, for each of the two years in the period then ended, the financial highlights for each of the periods presented, and the related notes. In our opinion, the financial statements and financial highlights present fairly, in all material respects, the financial position of each of the portfolios constituting the Lord Abbett Global Fund, Inc. as of December 31, 2017, and the results of their operations for the year then ended, the changes in their net assets for each of the two years in the period then ended, and the financial highlights for each of the periods presented, in conformity with accounting principles generally accepted in the United States of America.
Basis of Opinion
These financial statements and financial highlights are the responsibility of the Funds’ management. Our responsibility is to express an opinion on the Funds’ financial statements and financial highlights based on our audits. We are a public accounting firm registered with the Public Company Accounting Oversight Board (United States) (PCAOB) and are required to be independent with respect to the Funds in accordance with the U.S. federal securities laws and the applicable rules and regulations of the Securities and Exchange Commission and the PCAOB.
We conducted our audits in accordance with the standards of the PCAOB. Those standards require that we plan and perform the audits to obtain reasonable assurance about whether the financial statements and financial highlights are free of material misstatement, whether due to error or fraud. The Funds are not required to have, nor were we engaged to perform, an audit of their internal control over financial reporting. As part of our audits we are required to obtain an understanding of internal control over financial reporting but not for the purpose of expressing an opinion on the effectiveness of the Funds’ internal control over financial reporting. Accordingly, we express no such opinion.
Our audits included performing procedures to assess the risks of material misstatement of the financial statements and financial highlights, whether due to error or fraud, and performing procedures that respond to those risks. Such procedures included examining, on a test basis, evidence regarding the amounts and disclosures in the financial statements and financial highlights. Our audits also included evaluating the accounting principles used and significant estimates made by management, as well as evaluating the overall financial statement presentation and financial highlights. Our procedures included confirmation of securities owned as of December 31, 2017, by correspondence with the custodian, brokers and agent banks; when replies were not received from brokers and agent banks, we performed other auditing procedures. We believe that our audits provide a reasonable basis for our opinion.
DELOITTE & TOUCHE LLP
New York, New York
February 27, 2018
We have served as the auditor of one or more Lord Abbett Family of Funds’ investment companies since 1932.
124
Investments in Underlying Funds (unaudited)
Multi-Asset Global Opportunity Fund invests in Underlying Funds managed by Lord Abbett. As of December 31, 2017, Multi-Asset Global Opportunity Fund’s investments in the Underlying Funds were allocated as follows:
| Underlying Fund Name | | % of Investments in Underlying Funds | |
| Lord Abbett Securities Trust – International Dividend Income Fund – Class I | | | 23.33% | |
| Lord Abbett Investment Trust – High Yield Fund – Class I | | | 12.44% | |
| Lord Abbett Equity Trust – Calibrated Mid Cap Value Fund – Class I | | | 12.33% | |
| Lord Abbett Securities Trust – Growth Leaders Fund – Class I | | | 11.81% | |
| Lord Abbett Securities Trust – International Equity Fund – Class I | | | 8.46% | |
| Lord Abbett Global Fund, Inc. – Emerging Markets Currency Fund – Class I | | | 7.90% | |
| Lord Abbett Equity Trust – Calibrated Large Cap Value Fund – Class I | | | 7.40% | |
| Lord Abbett Investment Trust – Convertible Fund – Class I | | | 7.40% | |
| Lord Abbett Mid Cap Stock Fund, Inc. – Class I | | | 4.93% | |
| Lord Abbett Investment Trust – Short Duration Income Fund – Class I | | | 2.04% | |
| Lord Abbett Investment Trust – Inflation Focused Fund – Class I | | | 1.96% | |
The Ten Largest Holdings and the Holdings by Sector, as of December 31, 2017, for each Underlying Fund are presented below. Each Underlying Fund’s annual and semiannual reports, which are sent to shareholders and filed with the SEC, contain information about the Underlying Fund’s portfolio holdings, including a complete schedule of holdings. A complete schedule of holdings for each Underlying Fund is also filed with the SEC on Form N-Q as of the end of each respective Underlying Fund’s first and third quarters. In addition, on or about the first day of the second month following each calendar quarter-end, each Fund makes publicly available a complete schedule of its portfolio holdings as of the last day of each such quarter. The information for the most recently ended calendar quarter may be viewed at www.lordabbett.com or requested at no charge by calling Lord Abbett at 888-522-2388.
Lord Abbett Equity Trust – Calibrated Large Cap Value Fund
| Ten Largest Holdings | | % of Investments | |
| JPMorgan Chase & Co. | | | 4.29% | |
| Chevron Corp. | | | 3.61% | |
| Pfizer, Inc. | | | 2.94% | |
| Johnson & Johnson | | | 2.80% | |
| Bank of America Corp. | | | 2.69% | |
| Intel Corp. | | | 2.34% | |
| AT&T, Inc. | | | 2.15% | |
| Cisco Systems, Inc. | | | 1.75% | |
| Allstate Corp. (The) | | | 1.72% | |
| Abbott Laboratories | | | 1.69% | |
125
Investments in Underlying Funds (unaudited)(continued)
| Holdings by Sector* | | % of Investments | |
| Consumer Discretionary | | | 6.28% | |
| Consumer Staples | | | 8.08% | |
| Energy | | | 11.00% | |
| Financials | | | 26.88% | |
| Health Care | | | 13.53% | |
| Industrials | | | 8.22% | |
| Information Technology | | | 8.99% | |
| Materials | | | 3.08% | |
| Real Estate | | | 4.57% | |
| Telecommunication Services | | | 3.23% | |
| Utilities | | | 5.40% | |
| Repurchase Agreement | | | 0.74% | |
| Total | | | 100.00% | |
| * | A sector may comprise several industries. |
Lord Abbett Equity Trust – Calibrated Mid Cap Value Fund
| Ten Largest Holdings | | % of Investments | |
| Invesco Ltd. | | | 1.97% | |
| M&T Bank Corp. | | | 1.67% | |
| KeyCorp | | | 1.57% | |
| XL Group Ltd. | | | 1.56% | |
| Synchrony Financial | | | 1.50% | |
| Sempra Energy | | | 1.43% | |
| Dover Corp. | | | 1.37% | |
| Comerica, Inc. | | | 1.33% | |
| Royal Caribbean Cruises Ltd. | | | 1.29% | |
| PVH Corp. | | | 1.28% | |
| | | |
| Holdings by Sector* | | % of Investments | |
| Consumer Discretionary | | | 11.56% | |
| Consumer Staples | | | 4.44% | |
| Energy | | | 8.36% | |
| Financials | | | 20.34% | |
| Health Care | | | 6.43% | |
| Industrials | | | 12.55% | |
| Information Technology | | | 6.52% | |
| Materials | | | 5.07% | |
| Real Estate | | | 14.27% | |
| Utilities | | | 9.82% | |
| Repurchase Agreement | | | 0.64% | |
| Total | | | 100.00% | |
| * | A sector may comprise several industries. |
126
Investments in Underlying Funds (unaudited)(continued)
Lord Abbett Investment Trust – Convertible Fund – Class I
| Ten Largest Holdings | | % of Investments | |
| NRG Yield, Inc., 3.25%, 06/01/2020 | | | 2.92% | |
| Intel Corp., 3.25%, 08/01/2039 | | | 2.87% | |
| FireEye, Inc., 1.00%, 06/01/2035 | | | 2.80% | |
| Twitter, Inc., 1.00%, 09/15/2021 | | | 2.71% | |
| SunPower Corp., 0.75%, 06/01/2018 | | | 2.70% | |
| Wells Fargo & Co., 7.50%, | | | 2.65% | |
| Microchip Technology, Inc., 1.625%, 02/15/2025 | | | 2.57% | |
| Micron Technology, Inc., 2.125%, 02/15/2033 | | | 2.53% | |
| VeriSign, Inc., 4.7021%, 08/15/2037 | | | 2.42% | |
| Anthem, Inc., 5.25% | | | 2.27% | |
| | | |
| Holdings by Sector* | | % of Investments | |
| Automotive | | | 2.26% | |
| Banking | | | 4.76% | |
| Basic Industry | | | 3.79% | |
| Capital Goods | | | 5.03% | |
| Consumer Goods | | | 1.34% | |
| Energy | | | 4.87% | |
| Financial Services | | | 1.66% | |
| Healthcare | | | 17.57% | |
| Insurance | | | 0.54% | |
| Leisure | | | 2.51% | |
| Media | | | 1.79% | |
| Real Estate | | | 4.51% | |
| Retail | | | 3.10% | |
| Services | | | 0.53% | |
| Technology & Electronics | | | 33.68% | |
| Telecommunications | | | 1.14% | |
| Transportation | | | 3.48% | |
| Utility | | | 5.77% | |
| Repurchase Agreement | | | 1.67% | |
| Total | | | 100.00% | |
| * | A sector may comprise several industries. |
127
Investments in Underlying Funds (unaudited)(continued)
Lord Abbett Global Fund, Inc. – Emerging Markets Currency Fund
| Ten Largest Holdings | | % of Investments | |
| City of Buenos Aires, 26.875%, 02/22/2028 | | | 1.08% | |
| City of Buenos Aires, 26.6605%, 03/29/2024 | | | 1.03% | |
| H/2 Asset Funding 2014-1 Ltd., 2.348%, 03/19/2037 | | | 0.99% | |
| Capital One Multi-Asset Execution Trust 2015-A3, 1.877%, 03/15/2023 | | | 0.95% | |
| Provincia de Mendoza, 27.50%, 06/09/2021 | | | 0.89% | |
| Avis Budget Rental Car Funding AESOP LLC 2014-1A, 2.46%, 07/20/2020 | | | 0.87% | |
| Drive Auto Receivables Trust 2017-BA C, 2.61%, 08/16/2021 | | | 0.86% | |
| Ras Laffan Liquefied Natural Gas Co., Ltd. III (Qatar), 6.75%, 09/30/2019 | | | 0.79% | |
| Egypt Treasury Bill, 0%, 03/06/2018 | | | 0.77% | |
| Federal National Mortgage Assoc., 3.562%, 11/01/2040 | | | 0.76% | |
| | | |
| Holdings by Sector* | | % of Investments | |
| Asset Backed | | | 15.20% | |
| Automotive | | | 3.37% | |
| Banking | | | 6.97% | |
| Basic Industry | | | 3.23% | |
| Capital Goods | | | 1.77% | |
| Consumer Goods | | | 1.72% | |
| Energy | | | 12.63% | |
| Financial Services | | | 2.18% | |
| Foreign Government | | | 4.95% | |
| Healthcare | | | 2.79% | |
| Insurance | | | 0.72% | |
| Leisure | | | 1.44% | |
| Media | | | 0.98% | |
| Mortgage Backed | | | 22.82% | |
| Municipal | | | 0.37% | |
| Real Estate | | | 1.40% | |
| Retail | | | 0.56% | |
| Service | | | 0.61% | |
| Technology & Electronics | | | 4.81% | |
| Telecommunications | | | 1.88% | |
| Transportation | | | 0.61% | |
| U.S. Government | | | 5.27% | |
| Utility | | | 3.72% | |
| Total | | | 100.00% | |
| * | A sector may comprise several industries. |
128
Investments in Underlying Funds (unaudited)(continued)
Lord Abbett Investment Trust – High Yield Fund
| Ten Largest Holdings | | % of Investments | |
| CSC Holdings LLC, 10.875%, 10/15/2025 | | | 0.95% | |
| Freeport-McMoRan, Inc., 3.875%, 03/15/2023 | | | 0.92% | |
| T-Mobile USA, Inc, 6.5%, 01/15/2026 | | | 0.76% | |
| HCA, Inc., 5.25%, 06/15/2026 | | | 0.69% | |
| Tesla, Inc., 5.30%, 08/15/2025 | | | 0.60% | |
| ArcelorMittal, 6.125%, 06/01/2025 | | | 0.60% | |
| Bombardier, Inc., 7.50%, 03/15/2025 | | | 0.56% | |
| MGM Resorts International, 6.00%, 03/15/2023 | | | 0.53% | |
| Centene Corporation Bridge Term Loan, 0%, 10/16/2018 | | | 0.52% | |
| Dell International LLC/EMC Corp., 7.125%, 06/15/2024 | | | 0.52% | |
| | | |
| Holdings by Sector* | | % of Investments | |
| Automotive | | | 2.84% | |
| Banking | | | 4.28% | |
| Basic Industry | | | 16.33% | |
| Capital Goods | | | 4.03% | |
| Commercial Mortgage Backed | | | 0.38% | |
| Consumer Goods | | | 3.62% | |
| Energy | | | 14.07% | |
| Financial Services | | | 3.98% | |
| Foreign Government | | | 1.07% | |
| Healthcare | | | 7.09% | |
| Insurance | | | 0.94% | |
| Leisure | | | 6.23% | |
| Media | | | 6.88% | |
| Municipal | | | 0.20% | |
| Real Estate | | | 0.45% | |
| Retail | | | 4.96% | |
| Services | | | 5.34% | |
| Technology & Electronics | | | 4.65% | |
| Telecommunications | | | 4.43% | |
| Transportation | | | 3.63% | |
| Utility | | | 2.91% | |
| Repurchase Agreement | | | 1.69% | |
| Total | | | 100.00% | |
| * | A sector may comprise several industries. |
129
Investments in Underlying Funds (unaudited)(continued)
Lord Abbett Investment Trust – Inflation Focused Fund – Class I
| Ten Largest Holdings | | % of Investments | |
| Japan Bank for International Corp.,2.125%,11/16/2020 | | | 2.75% | |
| U.S. Treasury Note,1.375%, 06/30/2018 | | | 0.76% | |
| World Financial Network Credit Card Master Trust, 2.15%, 04/17/2023 | | | 0.74% | |
| OneMain Financial Issuance Trust, 4.1%, 03/20/2028 | | | 0.71% | |
| HBOS plc, 6.75%, 05/21/2018 | | | 0.67% | |
| U.S. Treasury Notes,1.875%, 12/15/2020, | | | 0.65% | |
| FMG Resources Pty Ltd.,9.75%, 03/01/2022 | | | 0.55% | |
| Wells Fargo Dealer Floorplan Master Note Trust 2015-2 A,1.9327%, 01/20/2022 | | | 0.53% | |
| Bank of America Corp.,5.49%, 03/15/2019 | | | 0.51% | |
| Sabine Pass Liquefaction LLC, 5.625%, 02/01/2021 | | | 0.50% | |
| | | |
| Holdings by Sector* | | % of Investments | |
| Auto | | | 1.93% | |
| Basic Industry | | | 0.29% | |
| Capital Goods | | | 0.73% | |
| Consumer Cyclicals | | | 1.57% | |
| Consumer Discretionary | | | 0.49% | |
| Consumer Services | | | 1.25% | |
| Consumer Staples | | | 0.66% | |
| Energy | | | 7.91% | |
| Financial Services | | | 60.45% | |
| Foreign Government | | | 3.08% | |
| Health Care | | | 1.70% | |
| Information Technology | | | 0.02% | |
| Integrated Oils | | | 0.37% | |
| Materials and Processing | | | 3.44% | |
| Municipal | | | 0.30% | |
| Other | | | 0.13% | |
| Producer Durables | | | 1.17% | |
| Technology | | | 2.51% | |
| Telecommunications | | | 0.56% | |
| Transportation | | | 0.22% | |
| U.S. Government | | | 5.18% | |
| Utilities | | | 2.74% | |
| Repurchase Agreement | | | 3.30% | |
| Total | | | 100.00% | |
| * | A sector may comprise several industries. |
130
Investments in Underlying Funds (unaudited)(continued)
Lord Abbett Securities Trust – International Equity Fund
| Ten Largest Holdings | | % of Investments | |
| Honda Motor Co., Ltd. | | | 1.86% | |
| Nestle SA Registered Shares | | | 1.77% | |
| Samsung Electronics Co., Ltd. | | | 1.71% | |
| British American Tobacco plc | | | 1.63% | |
| Vinci SA | | | 1.63% | |
| Vodafone Group plc | | | 1.62% | |
| Enel SpA | | | 1.59% | |
| Allianz SE Registered Shares | | | 1.57% | |
| Sony Corp. | | | 1.56% | |
| Royal Dutch Shell plc B Shares | | | 1.43% | |
| | | |
| Holdings by Sector* | | % of Investments | |
| Consumer Discretionary | | | 13.15% | |
| Consumer Staples | | | 8.28% | |
| Energy | | | 4.20% | |
| Financials | | | 24.38% | |
| Health Care | | | 5.56% | |
| Industrials | | | 16.09% | |
| Information Technology | | | 12.18% | |
| Materials | | | 6.99% | |
| Real Estate | | | 2.44% | |
| Telecommunication Services | | | 2.64% | |
| Utilities | | | 1.59% | |
| Repurchase Agreement | | | 2.50% | |
| Total | | | 100.00% | |
| * | A sector may comprise several industries. |
Lord Abbett Securities Trust – International Dividend Income Fund
| Ten Largest Holdings | | % of Investments | |
| Allianz SE Registered Shares | | | 3.69% | |
| Bank of China Ltd. H Shares | | | 2.89% | |
| Royal Dutch Shell plc Class A ADR | | | 2.86% | |
| British American Tobacco plc | | | 2.75% | |
| Rio Tinto plc ADR | | | 2.31% | |
| AstraZeneca plc | | | 2.16% | |
| Bank of Nova Scotia (The) | | | 1.85% | |
| BASF SE | | | 1.85% | |
| TUI AG | | | 1.75% | |
| Pembina Pipeline Corp. | | | 1.73% | |
131
Investments in Underlying Funds (unaudited)(continued)
| Holdings by Sector* | | % of Investments | |
| Consumer Discretionary | | | 10.08% | |
| Consumer Staples | | | 8.19% | |
| Energy | | | 8.03% | |
| Financials | | | 36.34% | |
| Health Care | | | 6.19% | |
| Industrials | | | 6.75% | |
| Information Technology | | | 6.13% | |
| Materials | | | 5.71% | |
| Real Estate | | | 3.58% | |
| Telecommunication Services | | | 3.94% | |
| Utilities | | | 3.95% | |
| Repurchase Agreement | | | 1.11% | |
| Total | | | 100.00% | |
| * | A sector may comprise several industries. |
Lord Abbett Mid Cap Stock Fund, Inc.
| Ten Largest Holdings | | % of Investments | |
| KeyCorp | | | 2.35% | |
| Pentair plc (United Kingdom) | | | 2.10% | |
| Cimarex Energy Co. | | | 2.03% | |
| Textron, Inc. | | | 2.01% | |
| Citizens Financial Group, Inc. | | | 2.00% | |
| Hubbell, Inc. | | | 2.00% | |
| FirstEnergy Corp. | | | 1.96% | |
| Great Plains Energy, Inc. | | | 1.85% | |
| Concho Resources, Inc. | | | 1.84% | |
| E*TRADE Financial Corp. | | | 1.84% | |
| | | |
| Holdings by Sector* | | % of Investments | |
| Consumer Discretionary | | | 8.19% | |
| Consumer Staples | | | 4.19% | |
| Energy | | | 9.18% | |
| Financials | | | 21.33% | |
| Health Care | | | 5.55% | |
| Industrials | | | 14.08% | |
| Information Technology | | | 7.98% | |
| Materials | | | 9.11% | |
| Real Estate | | | 11.28% | |
| Utilities | | | 7.27% | |
| Repurchase Agreement | | | 1.84% | |
| Total | | | 100.00% | |
| * | A sector may comprise several industries. |
132
Investments in Underlying Funds (unaudited)(continued)
Lord Abbett Investment Trust – Short Duration Fund, Inc.
| Ten Largest Holdings | | % of Investments | |
| U.S. Treasury Note, 1.625%, 11/30/2019 | | | 0.72% | |
| U.S. Treasury Note, 1.50%, 10/31/2019 | | | 0.66% | |
| HBOS plc, 6.75%, 05/21/2018 | | | 0.64% | |
| FMG Resources Pty Ltd., 9.75%, 03/01/2022 | | | 0.57% | |
| BAMLL Commercial Mortgage Securities Trust 2014-IP A, 2.8076%, 06/15/2028 | | | 0.52% | |
| Sabine Pass Liquefaction LLC, 5.625%, 02/01/2021 | | | 0.48% | |
| BellSouth LLC, 4.285%, 04/26/2018 | | | 0.47% | |
| Ladder Capital Commercial Mortgage Securities LLC, 2.8568%, 11/14/2027 | | | 0.46% | |
| World Financial Network Credit Card Master Trust 2016-A, 2.03%, 04/15/2025 | | | 0.46% | |
| BA Credit Card Trust 2017-A2, 1.84%, 01/17/2023 | | | 0.45% | |
| | | |
| Holdings by Sector* | | % of Investments | |
| Automotive | | | 1.96% | |
| Basic Industry | | | 0.30% | |
| Capital Goods | | | 0.74% | |
| Consumer Cyclicals | | | 0.92% | |
| Consumer Discretionary | | | 0.50% | |
| Consumer Services | | | 1.55% | |
| Consumer Staples | | | 0.65% | |
| Energy | | | 8.96% | |
| Financial Services | | | 66.24% | |
| Foreign Government | | | 0.35% | |
| Government | | | 4.07% | |
| Health Care | | | 1.87% | |
| Integrated Oils | | | 0.36% | |
| Materials and Processing | | | 3.64% | |
| Municipal | | | 0.41% | |
| Other | | | 0.12% | |
| Producer Durables | | | 0.79% | |
| Technology | | | 2.65% | |
| Telecommunications | | | 0.78% | |
| Transportation | | | 0.35% | |
| Undefined | | | 0.02% | |
| Utilities | | | 2.32% | |
| Repurchase Agreement | | | 0.45% | |
| Total | | | 100.00% | |
| * | A sector may comprise several industries. |
133
Investments in Underlying Funds (unaudited)(concluded)
Lord Abbett Securities Trust – Growth Leaders Fund, Inc.
| Ten Largest Holdings | | % of Investments | |
| Amazon.com, Inc. | | | 5.22% | |
| Apple, Inc. | | | 4.77% | |
| Alphabet, Inc. Class A | | | 4.75% | |
| Facebook, Inc. Class A | | | 4.48% | |
| Microsoft Corp. | | | 3.99% | |
| UnitedHealth Group, Inc. | | | 1.99% | |
| Visa, Inc. Class A | | | 1.94% | |
| Vertex Pharmaceuticals, Inc. | | | 1.81% | |
| Home Depot, Inc. (The) | | | 1.77% | |
| Constellation Brands, Inc. Class A | | | 1.62% | |
| | | |
| Holdings by Sector* | | % of Investments | |
| Consumer Discretionary | | | 17.11% | |
| Consumer Staples | | | 3.37% | |
| Energy | | | 0.81% | |
| Financials | | | 7.98% | |
| Health Care | | | 14.97% | |
| Industrials | | | 12.20% | |
| Information Technology | | | 38.56% | |
| Materials | | | 2.93% | |
| Repurchase Agreement | | | 2.07% | |
| Total | | | 100.00% | |
| * | A sector may comprise several industries. |
134
Basic Information About Management
The Board is responsible for the management of the business and affairs of the Company in accordance with the laws of the State of Maryland. The Board elects officers who are responsible for the day-to-day operations of each Fund and who execute policies authorized by the Board. The Board also approves an investment adviser to each Fund and continues to monitor the cost and quality of the services the investment adviser provides, and annually considers whether to renew the contract with the adviser. Generally, each Director holds office until his/her successor is elected and qualified or until his/her earlier resignation or removal, as provided in the Company’s organizational documents.
Lord Abbett, a Delaware limited liability company, is each Fund’s investment adviser. Designated Lord Abbett personnel are responsible for the day-to-day management of the Funds.
Interested Directors
Ms. Foster and Mr. Sieg are affiliated with Lord Abbett and are “interested persons” of the Company as defined in the Act. Ms. Foster and Mr. Sieg are directors/trustees of each of the 12 investment companies in the Lord Abbett Family of Funds, which consist of 61 portfolios or series. Ms. Foster is an officer of the Lord Abbett Family of Funds.
Name, Address and
Year of Birth | | Current Position and
Length of Service
with the Company | | Principal Occupation and Other Directorships
During the Past Five Years |
Daria L. Foster(1)
Lord, Abbett & Co. LLC
90 Hudson Street
Jersey City, NJ 07302
(1954) | | Director and President since 2006; Chief Executive Officer since 2012 | | Principal Occupation: Managing Partner of Lord Abbett, joined Lord Abbett in 1990.
Other Directorships: None. |
| | | | | |
Douglas B. Sieg(1)
Lord, Abbett & Co. LLC
90 Hudson Street
Jersey City, NJ 07302
(1969) | | Director since 2016 | | Principal Occupation: Partner (since 2001) and Head of Client Services (since 2013), formerly Director of Marketing and Relationship Management, joined Lord Abbett in 1994.
Other Directorships: None. |
Independent Directors
The following Independent Directors also are directors/trustees of each of the 12 investment companies in the Lord Abbett Family of Funds, which consist of 61 portfolios or series.
Name, Address and
Year of Birth | | Current Position and
Length of Service
with the Company | | Principal Occupation and Other Directorships
During the Past Five Years |
Eric C. Fast
Lord, Abbett & Co. LLC
c/o Legal Dept.
90 Hudson Street
Jersey City, NJ 07302
(1949) | | Director since 2014 | | Principal Occupation: Chief Executive Officer of Crane Co., an industrial products company (2001–2014).
Other Directorships: Currently serves as director of Automatic Data Processing, Inc. (since 2007) and Regions Financial Corporation (since 2010). Previously served as a director of Crane Co. (1999–2014). |
| (1) | Daria L. Foster, Managing Partner of Lord Abbett, a member of the Board, and the Chief Executive Officer and President of the Lord Abbett Family of Funds, will retire from her positions with Lord Abbett and the Lord Abbett Family of Funds effective March 31, 2018. Douglas B. Sieg, Partner and head of Client Services at Lord Abbett, and a member of the Board, will succeed Ms. Foster effective April 1, 2018. |
135
Basic Information About Management (continued)
Name, Address and
Year of Birth | | Current Position and
Length of Service
with the Company | | Principal Occupation and Other Directorships
During the Past Five Years |
Evelyn E. Guernsey
Lord, Abbett & Co. LLC
c/o Legal Dept.
90 Hudson Street
Jersey City, NJ 07302
(1955) | | Director since 2011 | | Principal Occupation: CEO, Americas of J.P. Morgan Asset Management (2004–2010).
Other Directorships: None. |
| | | | | |
Julie A. Hill
Lord, Abbett & Co. LLC
c/o Legal Dept.
90 Hudson Street
Jersey City, NJ 07302
(1946) | | Director since 2004 | | Principal Occupation: Owner and CEO of The Hill Company, a business consulting firm (since 1998).
Other Directorships: Currently serves as director of Anthem, Inc., a health benefits company (since 1994). |
| | | | | |
Franklin W. Hobbs
Lord, Abbett & Co. LLC
c/o Legal Dept.
90 Hudson Street
Jersey City, NJ 07302
(1947) | | Director since 2000 | | Principal Occupation: President and CEO of Ribbon Communications (since 2017) and Advisor of One Equity Partners, a private equity firm (since 2004).
Other Directorships: Currently serves as director of Ribbon Communications (since 2017), director and Chairman of the Board of Ally Financial Inc., a financial services firm (since 2009), and as director of Molson Coors Brewing Company (since 2002). |
| | | | | |
Kathleen M. Lutito
Lord, Abbett & Co. LLC
c/o Legal Dept.
90 Hudson Street
Jersey City, NJ 07302
(1963) | | Director since 2017 | | Principal Occupation: President and Chief Investment Officer of CenturyLink Investment Management Company (since 2006).
Other Directorships: None |
| | | | | |
James M. McTaggart
Lord, Abbett & Co. LLC
c/o Legal Dept.
90 Hudson Street
Jersey City, NJ 07302
(1947) | | Director since 2012 | | Principal Occupation: Independent management advisor and consultant (since 2012); Vice President, CRA International, Inc. (doing business as Charles River Associates), a global management consulting firm (2009–2012); Founder and Chairman of Marakon Associates, Inc., a strategy consulting firm (1978–2009); and Officer and Director of Trinsum Group, a holding company (2007–2009).
Other Directorships: Blyth, Inc., a home products company (2004-2015). |
| | | | | |
Karla M. Rabusch
Lord, Abbett & Co. LLC
c/o Legal Dept.
90 Hudson Street
Jersey City, NJ 07302
(1959) | | Director since 2017 | | Principal Occupation: President and Director of Wells Fargo Funds Management, LLC (2003-2017); President of Wells Fargo Funds (2003-2016).
Other Directorships: None. |
| | | | | |
Mark A. Schmid
Lord, Abbett & Co. LLC
c/o Legal Dept.
90 Hudson Street
Jersey City, NJ 07302
(1959) | | Director since 2016 | | Principal Occupation: Vice President and Chief Investment Officer of the University of Chicago (since 2009).
Other Directorships: None. |
136
Basic Information About Management (continued)
Name, Address and
Year of Birth | | Current Position and
Length of Service
with the Company | | Principal Occupation and Other Directorships
During the Past Five Years |
James L.L. Tullis
Lord, Abbett & Co. LLC
c/o Legal Dept.
90 Hudson Street
Jersey City, NJ 07302
(1947) | | Director since 2006;
Chairman since 2017 | | Principal Occupation: CEO of Tullis-Dickerson and Co. Inc., a venture capital management firm (since 1990); CEO of Tullis Health Investors Inc. (since 2012).
Other Directorships: Currently serves as director of Crane Co. (since 1998). |
Officers
None of the officers listed below have received compensation from the Company. All of the officers of the Company also may be officers of the other Lord Abbett Funds and maintain offices at 90 Hudson Street, Jersey City, NJ 07302. Unless otherwise indicated, the position(s) and title(s) listed under the “Principal Occupation During the Past Five Years” column indicate each officer’s position(s) and title(s) with Lord Abbett. Each officer serves for an indefinite term (i.e., until his or her death, resignation, retirement, or removal).
Name and
Year of Birth | | Current Position
with the Company | | Length of Service
of Current
Position | | Principal Occupation
During the Past Five Years |
Daria L. Foster
(1954) | | President and Chief Executive Officer | | Elected as President in 2006 and Chief Executive Officer in 2012 | | Managing Partner of Lord Abbett, joined Lord Abbett in 1990. |
| | | | | | | |
Robert A. Lee
(1969) | | Executive Vice President | | Elected in 2013 | | Partner and Chief Investment Officer, and was formerly Deputy Chief Investment Officer and Director of Taxable Fixed Income, joined Lord Abbett in 1997. |
| | | | | | | |
David J. Linsen
(1974) | | Executive Vice President | | Elected in 2017 | | Partner and Director, joined Lord Abbett in 2001. |
| | | | | | | |
Giulio Martini
(1955) | | Executive Vice President | | Elected in 2015 | | Partner and Director of Strategic Asset Allocation, joined Lord Abbett in 2015 and was formerly Global Investment Strategist at Anderson Global Macro LLC (2012-2015) and Chief Investment Officer of Currency Strategies at AllianceBernstein (1985–2012). |
137
Basic Information About Management (continued)
Name and
Year of Birth | | Current Position
with the Company | | Length of Service
of Current
Position | | Principal Occupation
During the Past Five Years |
John J. Morton
(1961) | | Executive Vice President | | Elected in 2016 | | Portfolio Manager, joined Lord Abbett in 2016 and was formerly Chief Investment Officer of Emerging Market Debt at Fischer, Francis, Trees, and Watts (2012-2015) and Managing Director and Chief Investment Officer of Fixed Income at Rexiter Capital Management (2007-2012). |
| | | | | | | |
Leah G. Traub
(1979) | | Executive Vice President | | Elected in 2009 | | Partner and Portfolio Manager, joined Lord Abbett in 2007. |
| | | | | | | |
Brooke A. Fapohunda
(1975) | | Vice President and Assistant Secretary | | Elected in 2014 | | Partner and Deputy General Counsel, joined Lord Abbett in 2006. |
| | | | | | | |
John K. Forst
(1960) | | Vice President and Assistant Secretary | | Elected in 2005 | | Partner and Deputy General Counsel, joined Lord Abbett in 2004. |
| | | | | | | |
Bernard J. Grzelak
(1971) | | Chief Financial Officer and Vice President | | Elected in 2017 | | Partner and Chief Operations Officer, and was formerly Director of Fund Administration, joined Lord Abbett in 2003. |
| | | | | | | |
Lawrence H. Kaplan
(1957) | | Vice President and Secretary | | Elected in 1997 | | Partner and General Counsel, joined Lord Abbett in 1997. |
| | | | | | | |
Linda Y. Kim
(1980) | | Vice President and Assistant Secretary | | Elected in 2016 | | Counsel, joined Lord Abbett in 2015 and was formerly an Associate at Stroock & Stroock & Lavan LLP (2007–2015). |
| | | | | | | |
Joseph M. McGill
(1962) | | Chief Compliance Officer | | Elected in 2014 | | Partner and Chief Compliance Officer, joined Lord Abbett in 2014 and was formerly Managing Director and the Chief Compliance Officer at UBS Global Asset Management (2003–2013). |
| | | | | | | |
A. Edward Oberhaus, III
(1959) | | Vice President | | Elected in 1996 | | Partner and Director, joined Lord Abbett in 1983. |
| | | | | | | |
Andrew H. O’Brien
(1973) | | Vice President | | Elected in 2013 | | Partner and Portfolio Manager, joined Lord Abbett in 1998. |
138
Basic Information About Management (concluded)
Name and
Year of Birth | | Current Position
with the Company | | Length of Service
of Current
Position | | Principal Occupation
During the Past Five Years |
David B. Ritt
(1976) | | Vice President | | Elected in 2009 | | Portfolio Manager, joined Lord Abbett in 2006. |
| | | | | | | |
Lawrence B. Stoller
(1963) | | Vice President and Assistant Secretary | | Elected in 2007 | | Partner and Senior Deputy General Counsel, joined Lord Abbett in 2007. |
| | | | | | | |
Scott S. Wallner
(1955) | | AML Compliance Officer | | Elected in 2011 | | Assistant General Counsel, joined Lord Abbett in 2004. |
| | | | | | | |
Christian J. Kelly
(1975) | | Treasurer | | Elected in 2017 | | Director of Fund Administration, joined Lord Abbett in 2009. |
Please call 888-522-2388 for a copy of the statement of additional information, which contains further information about the Company’s Directors. It is available free upon request.
139
Approval of Advisory Contract
The Board, including all of the Directors who are not “interested persons” of the Company or of Lord Abbett, as defined in the Investment Company Act of 1940, as amended (the “Independent Directors”), annually considers whether to approve the continuation of the existing management agreement between each Fund and Lord Abbett (the “Agreement”). In connection with its most recent approval, the Board reviewed materials relating specifically to the Agreement, as well as numerous materials received throughout the course of the year, including information about each Fund’s investment performance compared to the performance of one or more appropriate benchmarks. Before making its decision as to each Fund, the Board had the opportunity to ask questions and request further information, taking into account its familiarity with Lord Abbett gained through its meetings and discussions. These meetings and discussions included reviews of Fund performance conducted by members of the Contract Committee, the deliberations of the Contract Committee, and discussions between the Contract Committee and Lord Abbett’s management. The Independent Directors also met with their independent legal counsel in various private sessions at which no representatives of management were present.
The materials received by the Board as to each Fund included, but were not limited to: (1) information provided by Morningstar Inc. (“Morningstar”) regarding the investment performance of the Fund compared to the investment performance of certain funds with similar investment styles as determined by Morningstar, based, in part, on the Fund’s Morningstar category (the “performance peer group”), and the investment performance of one or more appropriate benchmarks; (2) information provided by Morningstar regarding the expense ratios, contractual and actual management fee rates, and other expense components for the Fund and certain funds in the same Morningstar category, with generally the same or similar share classes and operational characteristics, including asset size (the “expense peer group”); (3) certain supplemental investment performance information provided by Lord Abbett; (4) information provided by Lord Abbett on the expense ratios, management fee rates, and other expense components for the Fund; (5) sales and redemption information for the Fund; (6) information regarding Lord Abbett’s financial condition; (7) an analysis of the relative profitability of the Agreement to Lord Abbett; (8) information provided by Lord Abbett regarding the investment management fee schedules for Lord Abbett’s other advisory clients maintaining accounts with a similar investment strategy as the Fund, if any; and (9) information regarding the personnel and other resources devoted by Lord Abbett to managing the Fund.
Investment Management Services Generally. The Board considered the investment management services provided by Lord Abbett to each Fund, including investment research, portfolio management, and trading, and Lord Abbett’s commitment to compliance with all applicable legal requirements. The Board also observed that Lord Abbett was solely engaged in the investment management business and accordingly did not experience the conflicts of interest that may result from being engaged in other lines of business. The Board considered the investment advisory services provided by Lord Abbett to other clients, the fees charged for the services, and the differences in the nature of the services provided to each Fund and other Lord Abbett Funds, on the one hand, and the services provided to other clients, on the other. After reviewing these and related factors, the Board concluded that each Fund was likely to continue to benefit from the nature, extent and quality of the investment services provided by Lord Abbett under the Agreement.
Investment Performance. The Board reviewed each Fund’s investment performance in relation to that of its performance peer group and one or more appropriate benchmarks as of various periods ended August 31, 2017. As to Emerging Markets Corporate Debt Fund, the Board observed that the Fund’s investment performance was above the median of the performance peer group for the
140
Approval of Advisory Contract (continued)
three-year period, but below the median for the one-year period. As to Emerging Markets Currency Fund, the Board observed that the Fund’s investment performance was above the median of the performance of the peer group for the one-year period, equal to the median for the ten-year period, but below the median for the three- and five-year periods. As to Emerging Markets Local Bond Fund, the Board observed that the Fund’s investment performance was below the median of the performance peer group for the one-year and three-year periods. As to Multi-Asset Global Opportunity Fund, the Board observed that the Fund’s investment performance was below the median of the performance peer group for the one-, three-, five- and ten-year periods. The Board also considered Lord Abbett’s performance and reputation generally, the performance of other Lord Abbett-managed funds overseen by the Board and the willingness of Lord Abbett to take steps intended to improve performance when necessary, including implementing a plan intended to improve the performance of other Lord Abbett-managed equity funds in which Multi-Asset Global Opportunity Fund may invest. After reviewing these and related factors, the Board concluded that each Fund’s Agreement should be continued.
Lord Abbett’s Personnel and Methods. The Board considered the qualifications of the personnel providing investment management services to each Fund, in light of its investment objective and discipline. Among other things, the Board considered the size, experience, and turnover of Lord Abbett’s investment management staff, Lord Abbett’s investment methodology and philosophy, and Lord Abbett’s approach to recruiting, training, and retaining investment management personnel.
Nature and Quality of Other Services. The Board considered the nature, quality, costs, and extent of compliance, administrative, and other services performed by Lord Abbett and the nature and extent of Lord Abbett’s supervision of third party service providers, including each Fund’s transfer agent and custodian.
Expenses. The Board considered the expense level of each Fund and the expense levels of the Fund’s expense peer group. It also considered how the expense level of each Fund related to those of the expense peer group and the amount and nature of the fees paid by shareholders. As to each of Emerging Markets Corporate Debt Fund, Emerging Markets Currency Fund and Emerging Markets Local Bond Fund, the Board observed that the net total expense ratio of the Fund was below the median of the expense peer group. As to Multi-Asset Global Opportunity Fund, the Board observed that the net total expense ratio of the Fund (including acquired fund fees and expenses) was above the median of the expense peer group consisting of other funds-of-funds. After reviewing these and related factors, the Board concluded, within the context of its overall approval of the Agreement, that the expense level of each Fund was reasonable and supported the continuation of the Agreement on behalf of each Fund.
Profitability. As to each Fund, the Board considered the level of Lord Abbett’s operating margin in managing the Fund, including a review of Lord Abbett’s methodology for allocating its costs to its management of the Fund. It considered whether each Fund was profitable to Lord Abbett in connection with the Fund’s operation, including the fee that Lord Abbett receives from the Fund for providing administrative services to the Fund. The Board also considered the profits realized from other business segments of Lord Abbett, which may benefit from or be related to each Fund’s business. The Board considered Lord Abbett’s profit margins excluding Lord Abbett’s marketing and distribution expenses. The Board also considered Lord Abbett’s profit margins, without those exclusions, in comparison with available industry data and how those profit margins could affect Lord Abbett’s ability to recruit and retain investment personnel. The Board recognized that Lord Abbett’s overall profitability was a factor in enabling it to attract and retain qualified investment
141
Approval of Advisory Contract (concluded)
management personnel to provide services to each Fund. After reviewing these and related factors, the Board concluded, within the context of its overall approval of the Agreement, that Lord Abbett’s profitability with respect to each Fund was not excessive.
Economies of Scale. As to each Fund, the Board considered the extent to which there had been economies of scale in managing the Fund, whether the Fund’s shareholders had appropriately benefited from such economies of scale, and whether there was potential for realization of any further economies of scale. With respect to Emerging Markets Corporate Debt Fund and Emerging Markets Local Bond Fund, the Board concluded that the contractual breakpoints in each Fund’s existing management fee schedule, in conjunction with each Fund’s proposed expense limitation agreement, adequately addressed any economies of scale in managing each Fund. With respect to Emerging Markets Currency Fund, the Board concluded that the contractual breakpoint in the existing management fee schedule adequately addressed any economies of scale in managing the Fund. With respect to Multi-Asset Global Opportunity Fund, although the Fund’s management fee does not have breakpoints, the Fund’s relatively modest asset size did not suggest the need for a breakpoint at this time.
Other Benefits to Lord Abbett. As to each Fund, the Board considered the amount and nature of the fees paid by the Fund and the Fund’s shareholders to Lord Abbett and the Distributor for services other than investment advisory services. The Board also considered the revenues and profitability of Lord Abbett’s investment advisory business apart from its mutual fund business, and the intangible benefits enjoyed by Lord Abbett by virtue of its relationship with each Fund. The Board observed that the Distributor receives 12b-1 fees from certain of the Lord Abbett Funds as to shares held in accounts for which there is no other broker of record, may retain a portion of the 12b-1 fees it receives, and receives a portion of the sales charges on sales and redemptions of some classes of shares of the Lord Abbett Funds. In addition, the Board observed that Lord Abbett accrues certain benefits for its business of providing investment advice to clients other than the Lord Abbett Funds, but that business also benefits the Funds. The Board also noted that Lord Abbett, as disclosed in the prospectus of each Fund, has entered into revenue sharing arrangements with certain entities that distribute shares of each Fund. The Board also took into consideration the investment research that Lord Abbett receives as a result of each Fund’s brokerage transactions.
Alternative Arrangements. As to each Fund, the Board considered whether, instead of approving continuation of the Agreement, it might be in the best interests of the Fund to implement one or more alternative arrangements, such as continuing to employ Lord Abbett, but on different terms. After considering all of the relevant factors, the Board unanimously found that continuation of the Agreement was in the best interests of each Fund and its shareholders and voted unanimously to approve the continuation of the Agreement on behalf of each Fund. As to each Fund, in considering whether to approve the continuation of the Agreement, the Board did not identify any single factor as paramount or controlling. Individual Directors may have evaluated the information presented differently from one another, giving different weights to various factors. This summary does not discuss in detail all matters considered.
142
Householding
The Company has adopted a policy that allows it to send only one copy of each Fund’s prospectus, proxy material, annual report and semiannual report to certain shareholders residing at the same “household.” This reduces Fund expenses, which benefits you and other shareholders. If you need additional copies or do not want your mailings to be “householded,” please call Lord Abbett at 888-522-2388 or send a written request with your name, the name of your fund or funds and your account number or numbers to Lord Abbett Family of Funds, P.O. Box 219336, Kansas City, MO 64121.
Proxy Voting Policies, Procedures and Records
A description of the policies and procedures that Lord Abbett uses to vote proxies related to each Fund’s portfolio securities, and information on how Lord Abbett voted each Fund’s proxies during the 12-month period ended June 30 are available without charge, upon request, (i) by calling 888-522-2388; (ii) on Lord Abbett’s Website at www.lordabbett.com; and (iii) on the Securities and Exchange Commission’s (“SEC”) Website at www.sec.gov.
Shareholder Reports and Quarterly Portfolio Disclosure
The Funds are required to file their complete schedule of portfolio holdings with the SEC for their first and third fiscal quarters on Form N-Q. Copies of the filings are available without charge, upon request on the SEC’s Website at www.sec.gov and may be available by calling Lord Abbett at 888-522-2388. You can also obtain copies of Form N-Q by visiting the SEC’s Public Reference Room in Washington, DC (information on the operation of the Public Reference Room may be obtained by calling 800-SEC-0330).
Tax Information
47% of the ordinary income distributions paid by Multi-Asset Global Opportunity Fund during the year is qualified dividend income.
For corporate shareholders, 15% of the ordinary income distributions paid by Multi-Asset Global Opportunity Fund qualified for the dividends received deduction.
Multi-Asset Global Opportunity Fund intends to pass through foreign source income of $2,018,100 and foreign taxes of $263,962.
In addition, of the distributions paid by Emerging Markets Corporate Debt Fund to shareholders during the fiscal year ended December 31, 2017, $295,792 and $269,185, respectively, represent short-term and long-term capital gains.
For foreign shareholders, the percentages below reflect the portion of net investment income distributions that represent interest-related dividends:
| Fund Name | |
| Emerging Markets Corporate Debt Fund | 100 | % |
| Emerging Markets Currency Fund | 85 | % |
| Emerging Markets Local Bond Fund | 100 | % |
143


| | | Lord Abbett Global Fund, Inc. | | |
This report, when not used for the general information of shareholders of the Fund, is to be distributed only if preceded or accompanied by a current fund prospectus.
Lord Abbett mutual fund shares are distributed by
LORD ABBETT DISTRIBUTOR LLC. | | Lord Abbett Emerging Markets Corporate Debt Fund Lord Abbett Emerging Markets Currency Fund Lord Abbett Emerging Markets Local Bond Fund Lord Abbett Multi-Asset Global Opportunity Fund | | LAGF-2
(02/18) |
| (a) | In accordance with applicable requirements, the Registrant adopted a Sarbanes-Oxley Code of Ethics on June 19, 2003 that applies to the principal executive officer and senior financial officers of the Registrant (“Code of Ethics”). The Code of Ethics was in effect during the fiscal year ended December 31, 2017 (the “Period”). |
| | | |
| (b) | Not applicable. |
| | | |
| (c) | The Registrant has not amended the Code of Ethics as described in Form N-CSR during the Period. |
| | | |
| (d) | The Registrant has not granted any waiver, including an implicit waiver, from a provision of the Code of Ethics as described in Form N-CSR during the Period. |
| | | |
| (e) | Not applicable. |
| | | |
| (f) | See Item 12(a)(1) concerning the filing of the Code of Ethics. |
| Item 3: | Audit Committee Financial Expert. |
The Registrant’s board of directors has determined that each of the following independent directors who are members of the audit committee is an audit committee financial expert: Evelyn E. Guernsey and Mark A. Schmid. Each of these persons is independent within the meaning of the Form N-CSR.
| Item 4: | Principal Accountant Fees and Services. |
In response to sections (a), (b), (c) and (d) of Item 4, the aggregate fees billed to the Registrant for the fiscal years ended December 31, 2017 and 2016 by the Registrant’s principal accounting firm, Deloitte & Touche LLP, the member firms of Deloitte Touche Tohmatsu and their respective affiliates (collectively, “Deloitte”) were as follows:
| | | Fiscal year ended: | |
| | | 2017 | | 2016 |
| Audit Fees {a} | | $ | 183,100 | | | $ | 190,000 | |
| Audit-Related Fees | | | - 0 - | | | | - 0 - | |
| Total audit and audit-related fees | | | 183,100 | | | | 190,000 | |
| | | | | | | | | |
| Tax Fees {b} | | | 41,827 | | | | 41,703 | |
| All Other Fees | | | - 0 - | | | | - 0 - | |
| | | | | | | | | |
| Total Fees | | $ | 224,927 | | | $ | 231,703 | |
{a} Consists of fees for audits of the Registrant’s annual financial statements.
{b} Fees for the fiscal year ended December 31, 2017 and 2016 consist of fees for preparing the U.S. Income Tax Return for Regulated Investment Companies, New Jersey Corporation Business Tax Return, New Jersey Annual Report Form, U.S. Return of Excise Tax on Undistributed Income of Investment Companies, IRS Forms 1099-MISC and 1096 Annual Summary and Transmittal of U.S. Information Returns.
(e) (1) Pursuant to Rule 2-01(c) (7) of Regulation S-X, the Registrant’s Audit Committee has adopted pre-approval policies and procedures. Such policies and procedures generally provide that the Audit Committee must pre-approve:
| · | any audit, audit-related, tax, and other services to be provided to the Lord Abbett Funds, including the Registrant, and |
| · | any audit-related, tax, and other services to be provided to the Registrant’s investment adviser and any entity controlling, controlled by or under common control with the investment adviser that provides ongoing services to one or more Funds comprising the Registrant if the engagement relates directly to operations and financial reporting of a Fund, by the independent auditor to assure that the provision of such services does not impair the auditor’s independence. |
The Audit Committee has delegated pre-approval authority to its Chairman, subject to a fee limit of $10,000 per event, and not to exceed $25,000 annually. The Chairman will report any pre-approval decisions to the Audit Committee at its next scheduled meeting. Unless a type of service to be provided by the independent auditor has received general pre-approval, it must be pre-approved by the Audit Committee. Any proposed services exceeding pre-approved cost levels will require specific pre-approval by the Audit Committee.
(e) (2) The Registrant’s Audit Committee has approved 100% of the services described in this Item 4 (b) through (d).
(f) Not applicable.
(g) The aggregate non-audit fees billed by Deloitte for services rendered to the Registrant are shown above in the response to Item 4 (a), (b), (c) and (d) as “All Other Fees”.
The aggregate non-audit fees billed by Deloitte for services rendered to the Registrant’s investment adviser, Lord, Abbett & Co. LLC (“Lord Abbett”), for the fiscal years ended December 31, 2017 and 2016 were:
| | | Fiscal year ended: |
| | | 2017 | | 2016 |
| All Other Fees {a} | | $ | 201,416 | | | $ | 95,230 | |
{a} Consist of fees for Independent Services Auditors’ Report on Controls Placed in Operation and Tests of Operating Effectiveness related to Lord Abbett’s Asset Management Services (“SOC-1 Report”).
The aggregate non-audit fees billed by Deloitte for services rendered to entities under the common control of Lord Abbett for the fiscal years ended December 31, 2017 and 2016 were:
| | | Fiscal year ended: |
| | | 2017 | | 2016 |
| All Other Fees | | $ | - 0 - | | | $ | - 0 - | |
(h) The Registrant’s Audit Committee has considered the provision of non-audit services that were rendered to the Registrant’s investment adviser, and any entity controlling, controlled by or under common control with the investment adviser that provides ongoing services to the Registrant, that were not pre-approved pursuant to Rule 2-01 (c)(7)(ii) of Regulation S-X and has determined that the provision of such services is compatible with maintaining Deloitte’s independence.
| Item 5: | Audit Committee of Listed Registrants. |
Not applicable.
Not applicable.
| Item 7: | Disclosure of Proxy Voting Policies and Procedures for Closed-End Management Investment Companies. |
Not applicable.
| Item 8: | Portfolio Managers of Closed-End Management Investment Companies. |
Not applicable.
| Item 9: | Purchases of Equity Securities by Closed-End Management Investment Company and Affiliated Purchasers. |
Not applicable.
| Item 10: | Submission of Matters to a Vote of Security Holders. |
Not applicable.
| Item 11: | Controls and Procedures. |
| | (a) | Based on their evaluation of the Registrant’s disclosure controls and procedures (as defined in Rule 30a-3(c) under the Investment Company Act of 1940) as of a date within 90 days prior to the filing date of this report, the Chief Executive Officer and Chief Financial Officer of the Registrant have concluded that such disclosure controls and procedures are reasonably designed and effective to |
| | | ensure that material information relating to the Registrant, including its consolidated subsidiaries, is made known to them by others within those entities. |
| | | |
| (b) | There were no changes in the Registrant’s internal control over financial reporting (as defined in Rule 30a-3(d) under the Investment Company Act of 1940) that occurred during the second fiscal quarter of the period covered by this report that have materially affected, or are reasonably likely to materially affect, the Registrant’s internal control over financial reporting. |
| | | |
| (a)(1) | The Lord Abbett Family of Funds Sarbanes Oxley Code of Ethics for the Principal Executive Officer and Senior Financial Officers is attached hereto as part of Ex-99. CODEETH. |
| (a)(2) | Certification of each Principal Executive Officer and Principal Financial Officer of the Registrant as required by Rule 30a-2 under the Investment Company Act of 1940 is attached hereto as a part of EX-99.CERT. |
| (b) | Certification of each Principal Executive Officer and Principal Financial Officer of the Registrant as required by Section 906 of the Sarbanes-Oxley Act of 2002 is provided as a part of EX-99.906CERT. |
SIGNATURES
Pursuant to the requirements of the Securities Exchange Act of 1934 and the Investment Company Act of 1940, the Registrant has duly caused this report to be signed on its behalf by the undersigned, thereunto duly authorized.
| | LORD ABBETT GLOBAL FUND, INC. |
| | |
| | By: | /s/ Daria L. Foster | |
| | | Daria L. Foster | |
| | | President and Chief Executive Officer |
Date: February 27, 2018
| | By: | /s/ Bernard J. Grzelak | |
| | | Bernard J. Grzelak | |
| | | Chief Financial Officer and Vice President |
Date: February 27, 2018
Pursuant to the requirements of the Securities Exchange Act of 1934 and the Investment Company Act of 1940, this report has been signed below by the following persons on behalf of the Registrant and in the capacities and on the dates indicated.
| | By: | /s/ Daria L. Foster | |
| | | Daria L. Foster | |
| | | President and Chief Executive Officer |
Date: February 27, 2018
| | By: | /s/ Bernard J. Grzelak | |
| | | Bernard J. Grzelak | |
| | | Chief Financial Officer and Vice President |
Date: February 27, 2018