UNITED STATES
SECURITIES AND EXCHANGE COMMISSION
Washington, D.C. 20549
FORM N-CSR
CERTIFIED SHAREHOLDER REPORT OF REGISTERED
MANAGEMENT INVESTMENT COMPANIES
Investment Company Act file number 811-5511
Variable Insurance Products Fund II
(Exact name of registrant as specified in charter)
245 Summer St., Boston, MA 02210
(Address of principal executive offices) (Zip code)
Marc Bryant, Secretary
245 Summer St.
Boston, Massachusetts 02210
(Name and address of agent for service)
Registrant's telephone number, including area code:
617-563-7000
| |
Date of fiscal year end: | December 31 |
|
|
Date of reporting period: | June 30, 2017 |
Item 1.
Reports to Stockholders
Fidelity® Variable Insurance Products: Contrafund® Portfolio
Semi-Annual Report June 30, 2017 |
 |
Contents
To view a fund's proxy voting guidelines and proxy voting record for the 12-month period ended June 30, visit http://www.fidelity.com/proxyvotingresults or visit the Securities and Exchange Commission's (SEC) web site at http://www.sec.gov.
You may also call 1-877-208-0098 to request a free copy of the proxy voting guidelines.
Fidelity® Variable Insurance Products are separate account options which are purchased through a variable insurance contract.
Standard & Poor's, S&P and S&P 500 are registered service marks of The McGraw-Hill Companies, Inc. and have been licensed for use by Fidelity Distributors Corporation.
Other third-party marks appearing herein are the property of their respective owners.
All other marks appearing herein are registered or unregistered trademarks or service marks of FMR LLC or an affiliated company. © 2017 FMR LLC. All rights reserved.
This report and the financial statements contained herein are submitted for the general information of the shareholders of the Fund. This report is not authorized for distribution to prospective investors in the Fund unless preceded or accompanied by an effective prospectus.
A fund files its complete schedule of portfolio holdings with the SEC for the first and third quarters of each fiscal year on Form N-Q. Forms N-Q are available on the SEC’s web site at http://www.sec.gov. A fund's Forms N-Q may be reviewed and copied at the SEC’s Public Reference Room in Washington, DC. Information regarding the operation of the SEC's Public Reference Room may be obtained by calling 1-800-SEC-0330.
For a complete list of a fund's portfolio holdings, view the most recent holdings listing, semiannual report, or annual report on Fidelity's web site at http://www.fidelity.com, http://www.institutional.fidelity.com, or http://www.401k.com, as applicable.
NOT FDIC INSURED •MAY LOSE VALUE •NO BANK GUARANTEE
Neither the Fund nor Fidelity Distributors Corporation is a bank.
Investment Summary (Unaudited)
Top Ten Stocks as of June 30, 2017
| | % of fund's net assets | % of fund's net assets 6 months ago |
| Apple, Inc. | 3.6 | 3.6 |
| Autodesk, Inc. | 2.5 | 2.4 |
| Alphabet, Inc. Class C | 2.4 | 2.8 |
| Amazon.com, Inc. | 2.3 | 2.0 |
| Citigroup, Inc. | 2.1 | 1.1 |
| Bank of America Corp. | 1.7 | 1.5 |
| UnitedHealth Group, Inc. | 1.6 | 1.4 |
| Facebook, Inc. Class A | 1.5 | 1.4 |
| General Electric Co. | 1.5 | 1.7 |
| Amgen, Inc. | 1.4 | 1.1 |
| | 20.6 | |
Top Market Sectors as of June 30, 2017
| | % of fund's net assets | % of fund's net assets 6 months ago |
| Information Technology | 20.5 | 18.8 |
| Financials | 14.5 | 15.0 |
| Health Care | 14.2 | 13.2 |
| Consumer Discretionary | 13.7 | 13.1 |
| Industrials | 9.9 | 9.7 |
| Consumer Staples | 9.1 | 9.2 |
| Energy | 5.8 | 7.4 |
| Utilities | 3.2 | 3.2 |
| Real Estate | 3.0 | 2.7 |
| Materials | 2.8 | 2.8 |
Asset Allocation (% of fund's net assets)
| As of June 30, 2017* |
| | Stocks and Equity Futures | 99.1% |
| | Short-Term Investments and Net Other Assets (Liabilities) | 0.9% |

* Foreign investments - 9.0%
| As of December 31, 2016* |
| | Stocks and Equity Futures | 98.1% |
| | Short-Term Investments and Net Other Assets (Liabilities) | 1.9% |

* Foreign investments - 8.3%
Investments June 30, 2017 (Unaudited)
Showing Percentage of Net Assets
| Common Stocks - 98.8% | | | |
| | | Shares | Value |
| CONSUMER DISCRETIONARY - 13.7% | | | |
| Automobiles - 1.1% | | | |
| Tesla, Inc. (a) | | 582,050 | $210,475,101 |
| Diversified Consumer Services - 0.4% | | | |
| ServiceMaster Global Holdings, Inc. (a) | | 2,038,561 | 79,891,206 |
| Hotels, Restaurants & Leisure - 1.5% | | | |
| Hilton Grand Vacations, Inc. (a) | | 377,550 | 13,614,453 |
| Las Vegas Sands Corp. | | 484,300 | 30,941,927 |
| Marriott International, Inc. Class A | | 587,001 | 58,882,070 |
| Park Hotels & Resorts, Inc. | | 850,079 | 22,918,130 |
| Starbucks Corp. | | 904,700 | 52,753,057 |
| U.S. Foods Holding Corp. (a) | | 330,200 | 8,988,044 |
| Wyndham Worldwide Corp. | | 895,347 | 89,901,792 |
| | | | 277,999,473 |
| Internet & Direct Marketing Retail - 2.7% | | | |
| Amazon.com, Inc. (a) | | 452,400 | 437,923,200 |
| Netflix, Inc. (a) | | 508,544 | 75,981,559 |
| | | | 513,904,759 |
| Leisure Products - 0.3% | | | |
| Hasbro, Inc. | | 295,674 | 32,970,608 |
| Mattel, Inc. | | 1,415,128 | 30,467,706 |
| | | | 63,438,314 |
| Media - 3.2% | | | |
| Charter Communications, Inc. Class A (a) | | 502,093 | 169,130,027 |
| Comcast Corp. Class A | | 2,788,600 | 108,532,312 |
| DISH Network Corp. Class A (a) | | 114,000 | 7,154,640 |
| Interpublic Group of Companies, Inc. | | 1,886,600 | 46,410,360 |
| Manchester United PLC (b) | | 1,131,360 | 18,384,600 |
| MDC Partners, Inc. Class A (c) | | 3,114,973 | 30,838,233 |
| The Walt Disney Co. | | 2,211,800 | 235,003,750 |
| Weinstein Co. Holdings LLC Class A-1 (a)(d)(e) | | 11,499 | 482,038 |
| | | | 615,935,960 |
| Multiline Retail - 0.5% | | | |
| Dollar Tree, Inc. (a) | | 1,264,000 | 88,378,880 |
| Specialty Retail - 3.1% | | | |
| Home Depot, Inc. | | 1,536,294 | 235,667,500 |
| L Brands, Inc. | | 1,778,371 | 95,836,413 |
| Lowe's Companies, Inc. | | 972,300 | 75,382,419 |
| O'Reilly Automotive, Inc. (a) | | 230,282 | 50,371,885 |
| Ross Stores, Inc. | | 917,417 | 52,962,483 |
| TJX Companies, Inc. | | 1,193,621 | 86,143,628 |
| | | | 596,364,328 |
| Textiles, Apparel & Luxury Goods - 0.9% | | | |
| NIKE, Inc. Class B | | 2,912,852 | 171,858,268 |
|
| TOTAL CONSUMER DISCRETIONARY | | | 2,618,246,289 |
|
| CONSUMER STAPLES - 9.1% | | | |
| Beverages - 2.1% | | | |
| Anheuser-Busch InBev SA NV | | 390,500 | 43,130,153 |
| Coca-Cola European Partners PLC (a) | | 51,470 | 2,093,285 |
| Constellation Brands, Inc. Class A (sub. vtg.) | | 385,500 | 74,682,915 |
| Molson Coors Brewing Co. Class B | | 113,400 | 9,790,956 |
| Monster Beverage Corp. (a) | | 1,227,788 | 60,996,508 |
| The Coca-Cola Co. | | 4,859,506 | 217,948,844 |
| | | | 408,642,661 |
| Food & Staples Retailing - 1.7% | | | |
| CVS Health Corp. | | 2,050,764 | 165,004,471 |
| Kroger Co. | | 4,130,964 | 96,334,080 |
| Rite Aid Corp. (a) | | 5,465,527 | 16,123,305 |
| Walgreens Boots Alliance, Inc. | | 492,400 | 38,559,844 |
| | | | 316,021,700 |
| Food Products - 0.6% | | | |
| Blue Buffalo Pet Products, Inc. (a) | | 397,600 | 9,069,256 |
| Bunge Ltd. | | 478,082 | 35,664,917 |
| Mondelez International, Inc. | | 395,300 | 17,073,007 |
| Post Holdings, Inc. (a) | | 30,100 | 2,337,265 |
| The Hain Celestial Group, Inc. (a) | | 579,900 | 22,511,718 |
| TreeHouse Foods, Inc. (a) | | 426,598 | 34,848,791 |
| | | | 121,504,954 |
| Household Products - 0.7% | | | |
| Colgate-Palmolive Co. | | 1,698,487 | 125,908,841 |
| Kimberly-Clark Corp. | | 39,982 | 5,162,076 |
| | | | 131,070,917 |
| Personal Products - 0.9% | | | |
| Avon Products, Inc. (a) | | 5,963,000 | 22,659,400 |
| Coty, Inc. Class A | | 2,316,836 | 43,463,843 |
| Estee Lauder Companies, Inc. Class A | | 950,574 | 91,236,093 |
| Unilever NV (Certificaten Van Aandelen) (Bearer) | | 188,400 | 10,400,019 |
| | | | 167,759,355 |
| Tobacco - 3.1% | | | |
| Altria Group, Inc. | | 754,456 | 56,184,338 |
| British American Tobacco PLC sponsored ADR (b) | | 2,487,049 | 170,462,338 |
| Philip Morris International, Inc. | | 2,083,678 | 244,727,981 |
| Reynolds American, Inc. | | 1,899,188 | 123,523,188 |
| | | | 594,897,845 |
|
| TOTAL CONSUMER STAPLES | | | 1,739,897,432 |
|
| ENERGY - 5.8% | | | |
| Energy Equipment & Services - 1.0% | | | |
| Baker Hughes, Inc. | | 745,500 | 40,637,205 |
| Dril-Quip, Inc. (a) | | 195,992 | 9,564,410 |
| Hess Midstream Partners LP | | 419,400 | 8,543,178 |
| NCS Multistage Holdings, Inc. | | 640,005 | 16,115,326 |
| Oceaneering International, Inc. | | 479,162 | 10,944,060 |
| Schlumberger Ltd. | | 1,636,300 | 107,733,992 |
| | | | 193,538,171 |
| Oil, Gas & Consumable Fuels - 4.8% | | | |
| Anadarko Petroleum Corp. | | 1,586,621 | 71,937,396 |
| Black Stone Minerals LP | | 778,700 | 12,272,312 |
| Cabot Oil & Gas Corp. | | 1,319,335 | 33,088,922 |
| Callon Petroleum Co. (a) | | 1,770,300 | 18,782,883 |
| Centennial Resource Development, Inc.: | | | |
| Class A | | 450,500 | 7,126,910 |
| Class A (e) | | 400,000 | 6,328,000 |
| Chevron Corp. | | 774,500 | 80,803,585 |
| Cimarex Energy Co. | | 336,300 | 31,615,563 |
| ConocoPhillips Co. | | 2,325,400 | 102,224,584 |
| Devon Energy Corp. | | 1,598,400 | 51,100,848 |
| EOG Resources, Inc. | | 631,200 | 57,136,224 |
| Extraction Oil & Gas, Inc. | | 764,149 | 10,277,804 |
| Extraction Oil & Gas, Inc. (e) | | 591,781 | 7,959,454 |
| Exxon Mobil Corp. | | 1,573,802 | 127,053,035 |
| Newfield Exploration Co. (a) | | 1,213,700 | 34,541,902 |
| Parsley Energy, Inc. Class A (a) | | 1,231,757 | 34,181,257 |
| PDC Energy, Inc. (a) | | 457,850 | 19,737,914 |
| Phillips 66 Co. | | 741,239 | 61,293,053 |
| Pioneer Natural Resources Co. | | 340,400 | 54,321,032 |
| PrairieSky Royalty Ltd. (b) | | 1,034,012 | 23,545,940 |
| Suncor Energy, Inc. | | 2,250,395 | 65,752,210 |
| | | | 911,080,828 |
|
| TOTAL ENERGY | | | 1,104,618,999 |
|
| FINANCIALS - 14.5% | | | |
| Banks - 6.7% | | | |
| Allied Irish Banks PLC | | 2,132,776 | 12,057,953 |
| Bank of America Corp. | | 13,292,214 | 322,469,112 |
| Citigroup, Inc. | | 5,878,850 | 393,177,488 |
| Huntington Bancshares, Inc. | | 13,298,509 | 179,795,842 |
| JPMorgan Chase & Co. | | 1,669,506 | 152,592,848 |
| PNC Financial Services Group, Inc. | | 1,265,800 | 158,060,446 |
| SunTrust Banks, Inc. | | 772,300 | 43,804,856 |
| Synovus Financial Corp. | | 396,323 | 17,533,330 |
| | | | 1,279,491,875 |
| Capital Markets - 3.0% | | | |
| Affiliated Managers Group, Inc. | | 60,300 | 10,001,358 |
| BlackRock, Inc. Class A | | 270,613 | 114,309,637 |
| CBOE Holdings, Inc. | | 364,391 | 33,305,337 |
| E*TRADE Financial Corp. (a) | | 2,252,278 | 85,654,132 |
| Goldman Sachs Group, Inc. | | 405,000 | 89,869,500 |
| IntercontinentalExchange, Inc. | | 822,600 | 54,225,792 |
| Legg Mason, Inc. | | 231,900 | 8,849,304 |
| Northern Trust Corp. | | 925,600 | 89,977,576 |
| State Street Corp. | | 1,042,700 | 93,561,471 |
| | | | 579,754,107 |
| Consumer Finance - 2.2% | | | |
| Capital One Financial Corp. | | 3,221,448 | 266,156,034 |
| OneMain Holdings, Inc. (a) | | 1,499,198 | 36,865,279 |
| SLM Corp. (a) | | 5,058,976 | 58,178,224 |
| Synchrony Financial | | 2,036,500 | 60,728,430 |
| | | | 421,927,967 |
| Diversified Financial Services - 0.5% | | | |
| Berkshire Hathaway, Inc.: | | | |
| Class A (a) | | 47 | 11,970,900 |
| Class B (a) | | 362,500 | 61,396,625 |
| KBC Ancora | | 450,178 | 22,019,365 |
| Kimbell Royalty Partners LP | | 413,282 | 6,955,536 |
| On Deck Capital, Inc. (a) | | 595,900 | 2,776,894 |
| | | | 105,119,320 |
| Insurance - 2.1% | | | |
| American International Group, Inc. | | 87,600 | 5,476,752 |
| Chubb Ltd. | | 729,448 | 106,047,150 |
| Hartford Financial Services Group, Inc. | | 234,000 | 12,301,380 |
| Marsh & McLennan Companies, Inc. | | 1,201,470 | 93,666,601 |
| MetLife, Inc. | | 342,249 | 18,803,160 |
| The Travelers Companies, Inc. | | 1,024,700 | 129,655,291 |
| Unum Group | | 601,900 | 28,066,597 |
| | | | 394,016,931 |
|
| TOTAL FINANCIALS | | | 2,780,310,200 |
|
| HEALTH CARE - 14.2% | | | |
| Biotechnology - 4.0% | | | |
| Alexion Pharmaceuticals, Inc. (a) | | 437,832 | 53,271,019 |
| Amgen, Inc. | | 1,561,420 | 268,923,367 |
| Biogen, Inc. (a) | | 439,531 | 119,271,132 |
| BioMarin Pharmaceutical, Inc. (a) | | 238,100 | 21,624,242 |
| Celgene Corp. (a) | | 342,800 | 44,519,436 |
| Gilead Sciences, Inc. | | 627,800 | 44,435,684 |
| Regeneron Pharmaceuticals, Inc. (a) | | 150,600 | 73,965,684 |
| Shire PLC sponsored ADR | | 337,800 | 55,828,206 |
| Vertex Pharmaceuticals, Inc. (a) | | 584,730 | 75,354,155 |
| | | | 757,192,925 |
| Health Care Equipment & Supplies - 3.3% | | | |
| Abbott Laboratories | | 2,439,130 | 118,566,109 |
| Boston Scientific Corp. (a) | | 5,402,449 | 149,755,886 |
| Intuitive Surgical, Inc. (a) | | 126,100 | 117,950,157 |
| Medtronic PLC | | 2,231,890 | 198,080,238 |
| ResMed, Inc. | | 265,300 | 20,658,911 |
| Wright Medical Group NV (a) | | 1,153,900 | 31,720,711 |
| | | | 636,732,012 |
| Health Care Providers & Services - 3.0% | | | |
| Aetna, Inc. | | 176,200 | 26,752,446 |
| Cardinal Health, Inc. | | 333,800 | 26,009,696 |
| Henry Schein, Inc. (a) | | 389,241 | 71,238,888 |
| Humana, Inc. | | 375,900 | 90,449,058 |
| UnitedHealth Group, Inc. | | 1,638,700 | 303,847,754 |
| Universal Health Services, Inc. Class B | | 488,200 | 59,599,456 |
| | | | 577,897,298 |
| Health Care Technology - 0.3% | | | |
| Cerner Corp. (a) | | 767,600 | 51,022,372 |
| Life Sciences Tools & Services - 1.0% | | | |
| Agilent Technologies, Inc. | | 1,346,900 | 79,884,639 |
| Bio-Rad Laboratories, Inc. Class A (a) | | 131,600 | 29,782,396 |
| Thermo Fisher Scientific, Inc. | | 489,113 | 85,335,545 |
| | | | 195,002,580 |
| Pharmaceuticals - 2.6% | | | |
| Allergan PLC | | 803,452 | 195,311,147 |
| Bristol-Myers Squibb Co. | | 2,079,905 | 115,892,307 |
| GlaxoSmithKline PLC sponsored ADR | | 1,727,600 | 74,494,112 |
| Jazz Pharmaceuticals PLC (a) | | 311,500 | 48,438,250 |
| Merck & Co., Inc. | | 916,900 | 58,764,121 |
| | | | 492,899,937 |
|
| TOTAL HEALTH CARE | | | 2,710,747,124 |
|
| INDUSTRIALS - 9.9% | | | |
| Aerospace & Defense - 1.5% | | | |
| Axon Enterprise, Inc. (a) | | 653,159 | 16,420,417 |
| Lockheed Martin Corp. | | 22,100 | 6,135,181 |
| Northrop Grumman Corp. | | 368,405 | 94,573,248 |
| Raytheon Co. | | 553,100 | 89,314,588 |
| United Technologies Corp. | | 688,128 | 84,027,310 |
| | | | 290,470,744 |
| Air Freight & Logistics - 0.3% | | | |
| United Parcel Service, Inc. Class B | | 517,335 | 57,212,078 |
| Airlines - 1.1% | | | |
| American Airlines Group, Inc. | | 2,941,168 | 147,999,574 |
| Southwest Airlines Co. | | 1,060,300 | 65,887,042 |
| | | | 213,886,616 |
| Building Products - 0.5% | | | |
| Allegion PLC | | 1,191,700 | 96,670,704 |
| Commercial Services & Supplies - 0.1% | | | |
| Waste Management, Inc. | | 233,600 | 17,134,560 |
| Construction & Engineering - 0.4% | | | |
| Fluor Corp. | | 1,788,705 | 81,886,915 |
| Electrical Equipment - 1.9% | | | |
| AMETEK, Inc. | | 2,116,304 | 128,184,533 |
| Fortive Corp. | | 1,786,760 | 113,191,246 |
| Sensata Technologies Holding BV (a) | | 1,379,161 | 58,917,758 |
| Sunrun, Inc. (a)(b)(c) | | 6,118,822 | 43,566,013 |
| Vivint Solar, Inc. (a)(b) | | 4,288,027 | 25,084,958 |
| | | | 368,944,508 |
| Industrial Conglomerates - 1.8% | | | |
| 3M Co. | | 9,100 | 1,894,529 |
| General Electric Co. | | 10,137,541 | 273,814,982 |
| Honeywell International, Inc. | | 447,400 | 59,633,946 |
| | | | 335,343,457 |
| Machinery - 0.3% | | | |
| Caterpillar, Inc. | | 343,576 | 36,920,677 |
| Deere & Co. | | 66,700 | 8,243,453 |
| WABCO Holdings, Inc. (a) | | 70,100 | 8,938,451 |
| | | | 54,102,581 |
| Road & Rail - 1.4% | | | |
| CSX Corp. | | 2,210,897 | 120,626,540 |
| eHi Car Service Co. Ltd. sponsored ADR (a) | | 40 | 399 |
| Norfolk Southern Corp. | | 410,900 | 50,006,530 |
| Union Pacific Corp. | | 914,900 | 99,641,759 |
| | | | 270,275,228 |
| Trading Companies & Distributors - 0.6% | | | |
| HD Supply Holdings, Inc. (a) | | 3,525,500 | 107,986,065 |
|
| TOTAL INDUSTRIALS | | | 1,893,913,456 |
|
| INFORMATION TECHNOLOGY - 20.5% | | | |
| Electronic Equipment & Components - 0.9% | | | |
| Jabil, Inc. | | 6,068,952 | 177,152,709 |
| Internet Software & Services - 5.6% | | | |
| 58.com, Inc. ADR (a) | | 1,415,895 | 62,455,128 |
| Alibaba Group Holding Ltd. sponsored ADR (a) | | 140,600 | 19,810,540 |
| Alphabet, Inc.: | | | |
| Class A (a) | | 200 | 185,936 |
| Class C (a) | | 499,236 | 453,670,730 |
| Altaba, Inc. (a) | | 660,200 | 35,967,696 |
| Box, Inc. Class A (a) | | 195,000 | 3,556,800 |
| Delivery Hero AG | | 600 | 19,051 |
| Facebook, Inc. Class A (a) | | 1,877,176 | 283,416,032 |
| Just Dial Ltd. (a) | | 888,378 | 5,110,029 |
| MINDBODY, Inc. (a) | | 974,300 | 26,500,960 |
| NetEase, Inc. ADR | | 71,700 | 21,555,171 |
| New Relic, Inc. (a) | | 1,796,103 | 77,250,390 |
| Shopify, Inc. Class A (a) | | 144,700 | 12,564,173 |
| SPS Commerce, Inc. (a) | | 213,600 | 13,619,136 |
| Twilio, Inc. Class A | | 300,700 | 8,753,377 |
| Yext, Inc. (b) | | 3,385,511 | 45,128,862 |
| | | | 1,069,564,011 |
| IT Services - 0.9% | | | |
| Cognizant Technology Solutions Corp. Class A | | 1,317,480 | 87,480,672 |
| FleetCor Technologies, Inc. (a) | | 205,200 | 29,591,892 |
| PayPal Holdings, Inc. (a) | | 803,300 | 43,113,111 |
| | | | 160,185,675 |
| Semiconductors & Semiconductor Equipment - 3.5% | | | |
| Analog Devices, Inc. | | 557,100 | 43,342,380 |
| Broadcom Ltd. | | 141,100 | 32,883,355 |
| Cavium, Inc. (a) | | 161,959 | 10,062,513 |
| GlobalWafers Co. Ltd. | | 910,000 | 6,362,903 |
| Integrated Device Technology, Inc. (a) | | 641,120 | 16,534,485 |
| Marvell Technology Group Ltd. | | 1,068,508 | 17,651,752 |
| Mellanox Technologies Ltd. (a) | | 137,900 | 5,971,070 |
| Micron Technology, Inc. (a) | | 1,676,900 | 50,072,234 |
| NVIDIA Corp. | | 213,102 | 30,806,025 |
| ON Semiconductor Corp. (a) | | 3,827,036 | 53,731,585 |
| Qorvo, Inc. (a) | | 2,552,461 | 161,621,831 |
| Qualcomm, Inc. | | 2,678,929 | 147,930,459 |
| Semtech Corp. (a) | | 739,300 | 26,429,975 |
| Silergy Corp. | | 133,000 | 2,564,509 |
| Siltronic AG (a) | | 617,900 | 52,344,327 |
| Skyworks Solutions, Inc. | | 160,700 | 15,419,165 |
| | | | 673,728,568 |
| Software - 5.4% | | | |
| Activision Blizzard, Inc. | | 1,064,532 | 61,285,107 |
| Adobe Systems, Inc. (a) | | 227,629 | 32,195,846 |
| Autodesk, Inc. (a) | | 4,806,145 | 484,555,539 |
| Citrix Systems, Inc. (a) | | 86,502 | 6,883,829 |
| HubSpot, Inc. (a) | | 384,425 | 25,275,944 |
| Microsoft Corp. | | 2,886,513 | 198,967,341 |
| Parametric Technology Corp. (a) | | 1,198,600 | 66,066,832 |
| Salesforce.com, Inc. (a) | | 1,187,257 | 102,816,456 |
| Zendesk, Inc. (a) | | 1,756,761 | 48,802,821 |
| | | | 1,026,849,715 |
| Technology Hardware, Storage & Peripherals - 4.2% | | | |
| Apple, Inc. | | 4,786,692 | 689,379,381 |
| HP, Inc. | | 5,141,100 | 89,866,428 |
| Western Digital Corp. | | 299,100 | 26,500,260 |
| | | | 805,746,069 |
|
| TOTAL INFORMATION TECHNOLOGY | | | 3,913,226,747 |
|
| MATERIALS - 2.8% | | | |
| Chemicals - 1.9% | | | |
| E.I. du Pont de Nemours & Co. | | 1,910,900 | 154,228,739 |
| LyondellBasell Industries NV Class A | | 686,400 | 57,925,296 |
| Monsanto Co. | | 247,161 | 29,253,976 |
| Platform Specialty Products Corp. (a) | | 1,593,700 | 20,208,116 |
| Sherwin-Williams Co. | | 151,800 | 53,275,728 |
| The Scotts Miracle-Gro Co. Class A | | 104,001 | 9,303,929 |
| W.R. Grace & Co. | | 514,622 | 37,057,930 |
| | | | 361,253,714 |
| Construction Materials - 0.2% | | | |
| Eagle Materials, Inc. | | 346,659 | 32,038,225 |
| Containers & Packaging - 0.5% | | | |
| Ball Corp. | | 1,027,574 | 43,373,899 |
| WestRock Co. | | 1,048,540 | 59,410,276 |
| | | | 102,784,175 |
| Metals & Mining - 0.2% | | | |
| Freeport-McMoRan, Inc. (a) | | 2,601,300 | 31,241,613 |
|
| TOTAL MATERIALS | | | 527,317,727 |
|
| REAL ESTATE - 3.0% | | | |
| Equity Real Estate Investment Trusts (REITs) - 2.9% | | | |
| Altisource Residential Corp. Class B | | 2,271,582 | 29,394,271 |
| American Homes 4 Rent Class A | | 516,300 | 11,652,891 |
| American Tower Corp. | | 930,162 | 123,079,036 |
| Boston Properties, Inc. | | 300,600 | 36,979,812 |
| Colony NorthStar, Inc. | | 2,922,881 | 41,183,393 |
| CoreSite Realty Corp. | | 128,600 | 13,313,958 |
| Corporate Office Properties Trust (SBI) | | 515,800 | 18,068,474 |
| Corrections Corp. of America | | 206,800 | 5,703,544 |
| DDR Corp. | | 580,800 | 5,267,856 |
| Equinix, Inc. | | 106,000 | 45,490,960 |
| Extra Space Storage, Inc. | | 357,183 | 27,860,274 |
| Gaming & Leisure Properties | | 155,600 | 5,861,452 |
| Healthcare Trust of America, Inc. | | 517,300 | 16,093,203 |
| Omega Healthcare Investors, Inc. (b) | | 113,800 | 3,757,676 |
| Outfront Media, Inc. | | 1,006,573 | 23,271,968 |
| Prologis, Inc. | | 866,800 | 50,829,152 |
| SBA Communications Corp. Class A (a) | | 138,700 | 18,710,630 |
| Store Capital Corp. | | 1,989,700 | 44,668,765 |
| Sun Communities, Inc. | | 177,069 | 15,527,181 |
| VEREIT, Inc. | | 1,968,900 | 16,026,846 |
| | | | 552,741,342 |
| Real Estate Management & Development - 0.1% | | | |
| CBRE Group, Inc. (a) | | 379,189 | 13,802,480 |
|
| TOTAL REAL ESTATE | | | 566,543,822 |
|
| TELECOMMUNICATION SERVICES - 2.1% | | | |
| Diversified Telecommunication Services - 2.0% | | | |
| AT&T, Inc. | | 5,150,568 | 194,330,931 |
| Level 3 Communications, Inc. (a) | | 642,086 | 38,075,700 |
| Verizon Communications, Inc. | | 2,914,808 | 130,175,325 |
| Zayo Group Holdings, Inc. (a) | | 614,400 | 18,984,960 |
| | | | 381,566,916 |
| Wireless Telecommunication Services - 0.1% | | | |
| T-Mobile U.S., Inc. (a) | | 203,224 | 12,319,439 |
|
| TOTAL TELECOMMUNICATION SERVICES | | | 393,886,355 |
|
| UTILITIES - 3.2% | | | |
| Electric Utilities - 2.0% | | | |
| Edison International | | 222,726 | 17,414,946 |
| Exelon Corp. | | 2,202,892 | 79,458,314 |
| FirstEnergy Corp. | | 754,490 | 22,000,928 |
| Great Plains Energy, Inc. | | 425,500 | 12,458,640 |
| NextEra Energy, Inc. | | 1,051,050 | 147,283,637 |
| PG&E Corp. | | 1,268,034 | 84,159,417 |
| PPL Corp. | | 462,272 | 17,871,436 |
| | | | 380,647,318 |
| Independent Power and Renewable Electricity Producers - 0.2% | | | |
| NRG Energy, Inc. | | 954,100 | 16,429,602 |
| NRG Yield, Inc. Class C | | 899,627 | 15,833,435 |
| | | | 32,263,037 |
| Multi-Utilities - 1.0% | | | |
| CenterPoint Energy, Inc. | | 260,900 | 7,143,442 |
| Dominion Resources, Inc. | | 1,013,035 | 77,628,872 |
| Sempra Energy | | 915,450 | 103,216,988 |
| | | | 187,989,302 |
| Water Utilities - 0.0% | | | |
| AquaVenture Holdings Ltd. (b) | | 53,406 | 813,373 |
|
| TOTAL UTILITIES | | | 601,713,030 |
|
| TOTAL COMMON STOCKS | | | |
| (Cost $14,380,670,598) | | | 18,850,421,181 |
|
| Convertible Preferred Stocks - 0.0% | | | |
| INFORMATION TECHNOLOGY - 0.0% | | | |
| Software - 0.0% | | | |
| MongoDB, Inc. Series F, 8.00% (a)(e) | | | |
| (Cost $5,014,998) | | 299,866 | 5,014,997 |
| | | Principal Amount | Value |
|
| U.S. Treasury Obligations - 0.0% | | | |
| U.S. Treasury Bills, yield at date of purchase 0.96% 8/31/17 (f) | | | |
| (Cost $2,815,434) | | 2,820,000 | 2,815,736 |
| | | Shares | Value |
|
| Money Market Funds - 2.2% | | | |
| Fidelity Cash Central Fund, 1.10% (g) | | 211,533,453 | $211,575,760 |
| Fidelity Securities Lending Cash Central Fund 1.09% (g)(h) | | 198,822,823 | 198,842,705 |
| TOTAL MONEY MARKET FUNDS | | | |
| (Cost $410,376,171) | | | 410,418,465 |
| TOTAL INVESTMENT PORTFOLIO - 101.0% | | | |
| (Cost $14,798,877,201) | | | 19,268,670,379 |
| NET OTHER ASSETS (LIABILITIES) - (1.0)% | | | (188,001,103) |
| NET ASSETS - 100% | | | $19,080,669,276 |
| Futures Contracts | | | |
| | Expiration Date | Underlying Face Amount at Value | Unrealized Appreciation/(Depreciation) |
| Purchased | | | |
| Equity Index Contracts | | | |
| 443 CME E-mini S&P 500 Index Contracts (United States) | Sept. 2017 | 53,622,935 | $(205,021) |
The face value of futures purchased as a percentage of Net Assets is 0.3%
Legend
(a) Non-income producing
(b) Security or a portion of the security is on loan at period end.
(c) Affiliated company
(d) Investment is owned by a wholly-owned subsidiary (Subsidiary) that is treated as a corporation for U.S. tax purposes.
(e) Restricted securities - Investment in securities not registered under the Securities Act of 1933 (excluding 144A issues). At the end of the period, the value of restricted securities (excluding 144A issues) amounted to $19,784,489 or 0.1% of net assets.
(f) Security or a portion of the security was pledged to cover margin requirements for futures contracts. At period end, the value of securities pledged amounted to $2,061,878.
(g) Affiliated fund that is generally available only to investment companies and other accounts managed by Fidelity Investments. The rate quoted is the annualized seven-day yield of the fund at period end. A complete unaudited listing of the fund's holdings as of its most recent quarter end is available upon request. In addition, each Fidelity Central Fund's financial statements are available on the SEC's website or upon request.
(h) Investment made with cash collateral received from securities on loan.
Additional information on each restricted holding is as follows:
| Security | Acquisition Date | Acquisition Cost |
| Centennial Resource Development, Inc. Class A | 12/28/16 | $5,816,000 |
| Extraction Oil & Gas, Inc. | 12/12/16 | $10,800,003 |
| MongoDB, Inc. Series F, 8.00% | 10/2/13 | $5,014,998 |
| Weinstein Co. Holdings LLC Class A-1 | 10/19/05 | $11,499,000 |
Affiliated Central Funds
Information regarding fiscal year to date income earned by the Fund from investments in Fidelity Central Funds is as follows:
| Fund | Income earned |
| Fidelity Cash Central Fund | $1,501,856 |
| Fidelity Securities Lending Cash Central Fund | 2,167,424 |
| Total | $3,669,280 |
Other Affiliated Issuers
An affiliated company is a company in which the Fund has ownership of at least 5% of the voting securities. Fiscal year to date transactions with companies which are or were affiliates are as follows:
| Affiliate | Value, beginning of period | Purchases | Sales Proceeds | Dividend Income | Value, end of period |
| MDC Partners, Inc. Class A | $21,263,743 | $-- | $1,115,044 | $-- | $30,838,233 |
| Sunrun, Inc. | 32,490,945 | -- | -- | -- | 43,566,013 |
| Total | $53,754,688 | $-- | $1,115,044 | $-- | $74,404,246 |
Investment Valuation
The following is a summary of the inputs used, as of June 30, 2017, involving the Fund's assets and liabilities carried at fair value. The inputs or methodology used for valuing securities may not be an indication of the risk associated with investing in those securities. For more information on valuation inputs, and their aggregation into the levels used below, please refer to the Investment Valuation section in the accompanying Notes to Financial Statements.
| | Valuation Inputs at Reporting Date: |
| Description | Total | Level 1 | Level 2 | Level 3 |
| Investments in Securities: | | | | |
| Equities: | | | | |
| Consumer Discretionary | $2,618,246,289 | $2,617,764,251 | $-- | $482,038 |
| Consumer Staples | 1,739,897,432 | 1,686,367,260 | 53,530,172 | -- |
| Energy | 1,104,618,999 | 1,104,618,999 | -- | -- |
| Financials | 2,780,310,200 | 2,780,310,200 | -- | -- |
| Health Care | 2,710,747,124 | 2,710,747,124 | -- | -- |
| Industrials | 1,893,913,456 | 1,893,913,456 | -- | -- |
| Information Technology | 3,918,241,744 | 3,913,226,747 | -- | 5,014,997 |
| Materials | 527,317,727 | 527,317,727 | -- | -- |
| Real Estate | 566,543,822 | 566,543,822 | -- | -- |
| Telecommunication Services | 393,886,355 | 393,886,355 | -- | -- |
| Utilities | 601,713,030 | 601,713,030 | -- | -- |
| U.S. Government and Government Agency Obligations | 2,815,736 | -- | 2,815,736 | -- |
| Money Market Funds | 410,418,465 | 410,418,465 | -- | -- |
| Total Investments in Securities: | $19,268,670,379 | $19,206,827,436 | $56,345,908 | $5,497,035 |
| Derivative Instruments: | | | | |
| Liabilities | | | | |
| Futures Contracts | $(205,021) | $(205,021) | $-- | $-- |
| Total Liabilities | $(205,021) | $(205,021) | $-- | $-- |
| Total Derivative Instruments: | $(205,021) | $(205,021) | $-- | $-- |
Value of Derivative Instruments
The following table is a summary of the Fund's value of derivative instruments by primary risk exposure as of June 30, 2017. For additional information on derivative instruments, please refer to the Derivative Instruments section in the accompanying Notes to Financial Statements.
| Primary Risk Exposure / Derivative Type | Value |
| | Asset | Liability |
| Equity Risk | | |
| Futures Contracts(a) | $0 | $(205,021) |
| Total Equity Risk | 0 | (205,021) |
| Total Value of Derivatives | $0 | $(205,021) |
(a) Reflects gross cumulative appreciation (depreciation) on futures contracts as presented in the Schedule of Investments. In the Statement of Assets and Liabilities, the period end daily variation margin is included in receivable or payable for daily variation margin for derivative instruments, and the net cumulative appreciation (depreciation) is included in net unrealized appreciation (depreciation).
See accompanying notes which are an integral part of the financial statements.
Financial Statements
Statement of Assets and Liabilities
| | | June 30, 2017 (Unaudited) |
| Assets | | |
Investment in securities, at value (including securities loaned of $194,405,753) — See accompanying schedule:
Unaffiliated issuers (cost $14,290,022,095) | $18,783,847,668 | |
| Fidelity Central Funds (cost $410,376,171) | 410,418,465 | |
| Other affiliated issuers (cost $98,478,935) | 74,404,246 | |
| Total Investments (cost $14,798,877,201) | | $19,268,670,379 |
| Receivable for investments sold | | 136,765,463 |
| Receivable for fund shares sold | | 3,405,069 |
| Dividends receivable | | 21,987,960 |
| Distributions receivable from Fidelity Central Funds | | 907,974 |
| Receivable for daily variation margin for derivative instruments | | 19,935 |
| Other receivables | | 1,494,891 |
| Total assets | | 19,433,251,671 |
| Liabilities | | |
| Payable to custodian bank | $2,391,805 | |
| Payable for investments purchased | 125,541,723 | |
| Payable for fund shares redeemed | 12,752,191 | |
| Accrued management fee | 8,730,498 | |
| Distribution and service plan fees payable | 1,966,367 | |
| Other affiliated payables | 1,297,115 | |
| Other payables and accrued expenses | 1,049,521 | |
| Collateral on securities loaned | 198,853,175 | |
| Total liabilities | | 352,582,395 |
| Net Assets | | $19,080,669,276 |
| Net Assets consist of: | | |
| Paid in capital | | $13,636,891,859 |
| Undistributed net investment income | | 78,807,363 |
| Accumulated undistributed net realized gain (loss) on investments and foreign currency transactions | | 895,407,128 |
| Net unrealized appreciation (depreciation) on investments and assets and liabilities in foreign currencies | | 4,469,562,926 |
| Net Assets | | $19,080,669,276 |
| Initial Class: | | |
| Net Asset Value, offering price and redemption price per share ($7,339,098,518 ÷ 206,269,441 shares) | | $35.58 |
| Service Class: | | |
| Net Asset Value, offering price and redemption price per share ($1,499,167,502 ÷ 42,337,106 shares) | | $35.41 |
| Service Class 2: | | |
| Net Asset Value, offering price and redemption price per share ($8,777,176,357 ÷ 252,673,458 shares) | | $34.74 |
| Investor Class: | | |
| Net Asset Value, offering price and redemption price per share ($1,465,226,899 ÷ 41,412,720 shares) | | $35.38 |
See accompanying notes which are an integral part of the financial statements.
Statement of Operations
| | | Six months ended June 30, 2017 (Unaudited) |
| Investment Income | | |
| Dividends | | $145,809,282 |
| Interest | | 18,067 |
| Income from Fidelity Central Funds | | 3,669,280 |
| Total income | | 149,496,629 |
| Expenses | | |
| Management fee | $51,106,616 | |
| Transfer agent fees | 6,756,604 | |
| Distribution and service plan fees | 11,472,158 | |
| Accounting and security lending fees | 837,589 | |
| Custodian fees and expenses | 162,634 | |
| Independent trustees' fees and expenses | 36,724 | |
| Appreciation in deferred trustee compensation account | 50 | |
| Audit | 42,398 | |
| Legal | 14,981 | |
| Miscellaneous | 88,356 | |
| Total expenses before reductions | 70,518,110 | |
| Expense reductions | (654,639) | 69,863,471 |
| Net investment income (loss) | | 79,633,158 |
| Realized and Unrealized Gain (Loss) | | |
| Net realized gain (loss) on: | | |
| Investment securities: | | |
| Unaffiliated issuers | 938,707,514 | |
| Fidelity Central Funds | (3,758) | |
| Other affiliated issuers | (1,844,781) | |
| Foreign currency transactions | 64,113 | |
| Futures contracts | 5,670,253 | |
| Total net realized gain (loss) | | 942,593,341 |
Change in net unrealized appreciation (depreciation) on:
Investment securities | 989,520,002 | |
| Assets and liabilities in foreign currencies | 97,420 | |
| Futures contracts | 536,652 | |
| Total change in net unrealized appreciation (depreciation) | | 990,154,074 |
| Net gain (loss) | | 1,932,747,415 |
| Net increase (decrease) in net assets resulting from operations | | $2,012,380,573 |
See accompanying notes which are an integral part of the financial statements.
Statement of Changes in Net Assets
| | Six months ended June 30, 2017 (Unaudited) | Year ended December 31, 2016 |
| Increase (Decrease) in Net Assets | | |
| Operations | | |
| Net investment income (loss) | $79,633,158 | $161,252,799 |
| Net realized gain (loss) | 942,593,341 | 751,550,819 |
| Change in net unrealized appreciation (depreciation) | 990,154,074 | 414,451,844 |
| Net increase (decrease) in net assets resulting from operations | 2,012,380,573 | 1,327,255,462 |
| Distributions to shareholders from net investment income | (35,024,534) | (123,732,924) |
| Distributions to shareholders from net realized gain | (684,004,578) | (1,451,984,960) |
| Total distributions | (719,029,112) | (1,575,717,884) |
| Share transactions - net increase (decrease) | (69,818,995) | (517,277,577) |
| Total increase (decrease) in net assets | 1,223,532,466 | (765,739,999) |
| Net Assets | | |
| Beginning of period | 17,857,136,810 | 18,622,876,809 |
| End of period | $19,080,669,276 | $17,857,136,810 |
| Other Information | | |
| Undistributed net investment income end of period | $78,807,363 | $34,198,739 |
See accompanying notes which are an integral part of the financial statements.
Financial Highlights — VIP Contrafund Portfolio Initial Class
| | Six months ended (Unaudited) June 30, | Years ended December 31, | | | | |
| | 2017 | 2016 | 2015 | 2014 | 2013 | 2012 |
| Selected Per–Share Data | | | | | | |
| Net asset value, beginning of period | $33.18 | $33.91 | $37.36 | $34.35 | $26.44 | $23.02 |
| Income from Investment Operations | | | | | | |
| Net investment income (loss)A | .17 | .33 | .35 | .36 | .32 | .32 |
| Net realized and unrealized gain (loss) | 3.58 | 1.85 | (.14) | 3.76 | 7.94 | 3.46 |
| Total from investment operations | 3.75 | 2.18 | .21 | 4.12 | 8.26 | 3.78 |
| Distributions from net investment income | (.07) | (.26) | (.37) | (.36) | (.34) | (.34)B |
| Distributions from net realized gain | (1.28) | (2.65) | (3.30) | (.75) | (.01) | (.01)B |
| Total distributions | (1.35) | (2.91) | (3.66)C | (1.11) | (.35) | (.36)D |
| Redemption fees added to paid in capitalA | – | – | – | –E | –E | –E |
| Net asset value, end of period | $35.58 | $33.18 | $33.91 | $37.36 | $34.35 | $26.44 |
| Total ReturnF,G,H | 11.54% | 8.04% | .64% | 11.94% | 31.29% | 16.42% |
| Ratios to Average Net AssetsI,J | | | | | | |
| Expenses before reductions | .62%K | .63% | .63% | .63% | .64% | .64% |
| Expenses net of fee waivers, if any | .62%K | .63% | .63% | .63% | .63% | .64% |
| Expenses net of all reductions | .62%K | .62% | .62% | .63% | .62% | .63% |
| Net investment income (loss) | .98%K | 1.04% | 1.01% | 1.01% | 1.05% | 1.27% |
| Supplemental Data | | | | | | |
| Net assets, end of period (000 omitted) | $7,339,099 | $6,962,430 | $7,436,130 | $8,005,930 | $7,654,305 | $6,440,357 |
| Portfolio turnover rateL | 61%K | 62% | 80% | 74% | 86% | 87% |
A Calculated based on average shares outstanding during the period.
B The amounts shown reflect certain reclassifications related to book to tax differences that were made in the year shown.
C Total distributions of $3.66 per share is comprised of distributions from net investment income of $.369 and distributions from net realized gain of $3.295 per share.
D Total distributions of $.36 per share is comprised of distributions from net investment income of $.342 and distributions from net realized gain of $.013 per share.
E Amount represents less than $.005 per share.
F Total returns for periods of less than one year are not annualized.
G Total returns do not reflect charges attributable to your insurance company's separate account. Inclusion of these charges would reduce the total returns shown.
H Total returns would have been lower if certain expenses had not been reduced during the applicable periods shown.
I Fees and expenses of any underlying Fidelity Central Funds are not included in the Fund's expense ratio. The Fund indirectly bears its proportionate share of the expenses of any underlying Fidelity Central Funds.
J Expense ratios reflect operating expenses of the class. Expenses before reductions do not reflect amounts reimbursed by the investment adviser or reductions from brokerage service arrangements or reductions from other expense offset arrangements and do not represent the amount paid by the class during periods when reimbursements or reductions occur. Expenses net of fee waivers reflect expenses after reimbursement by the investment adviser but prior to reductions from brokerage service arrangements or other expense offset arrangements. Expenses net of all reductions represent the net expenses paid by the class.
K Annualized
L Amount does not include the portfolio activity of any underlying Fidelity Central Funds.
See accompanying notes which are an integral part of the financial statements.
Financial Highlights — VIP Contrafund Portfolio Service Class
| | Six months ended (Unaudited) June 30, | Years ended December 31, | | | | |
| | 2017 | 2016 | 2015 | 2014 | 2013 | 2012 |
| Selected Per–Share Data | | | | | | |
| Net asset value, beginning of period | $33.04 | $33.79 | $37.23 | $34.24 | $26.36 | $22.95 |
| Income from Investment Operations | | | | | | |
| Net investment income (loss)A | .15 | .29 | .32 | .33 | .29 | .30 |
| Net realized and unrealized gain (loss) | 3.56 | 1.84 | (.13) | 3.73 | 7.91 | 3.44 |
| Total from investment operations | 3.71 | 2.13 | .19 | 4.06 | 8.20 | 3.74 |
| Distributions from net investment income | (.07) | (.23) | (.33) | (.32) | (.31) | (.32)B |
| Distributions from net realized gain | (1.28) | (2.65) | (3.30) | (.75) | (.01) | (.01)B |
| Total distributions | (1.34)C | (2.88) | (3.63) | (1.07) | (.32) | (.33) |
| Redemption fees added to paid in capitalA | – | – | – | –D | –D | –D |
| Net asset value, end of period | $35.41 | $33.04 | $33.79 | $37.23 | $34.24 | $26.36 |
| Total ReturnE,F,G | 11.48% | 7.91% | .56% | 11.82% | 31.14% | 16.31% |
| Ratios to Average Net AssetsH,I | | | | | | |
| Expenses before reductions | .72%J | .73% | .73% | .73% | .74% | .74% |
| Expenses net of fee waivers, if any | .72%J | .73% | .73% | .73% | .73% | .74% |
| Expenses net of all reductions | .72%J | .72% | .72% | .73% | .72% | .73% |
| Net investment income (loss) | .88%J | .94% | .91% | .91% | .95% | 1.16% |
| Supplemental Data | | | | | | |
| Net assets, end of period (000 omitted) | $1,499,168 | $1,428,793 | $1,546,864 | $1,714,615 | $1,688,448 | $1,374,781 |
| Portfolio turnover rateK | 61%J | 62% | 80% | 74% | 86% | 87% |
A Calculated based on average shares outstanding during the period.
B The amounts shown reflect certain reclassifications related to book to tax differences that were made in the year shown.
C Total distributions of $1.34 per share is comprised of distributions from net investment income of $.067 and distributions from net realized gain of $1.275 per share.
D Amount represents less than $.005 per share.
E Total returns for periods of less than one year are not annualized.
F Total returns do not reflect charges attributable to your insurance company's separate account. Inclusion of these charges would reduce the total returns shown.
G Total returns would have been lower if certain expenses had not been reduced during the applicable periods shown.
H Fees and expenses of any underlying Fidelity Central Funds are not included in the Fund's expense ratio. The Fund indirectly bears its proportionate share of the expenses of any underlying Fidelity Central Funds.
I Expense ratios reflect operating expenses of the class. Expenses before reductions do not reflect amounts reimbursed by the investment adviser or reductions from brokerage service arrangements or reductions from other expense offset arrangements and do not represent the amount paid by the class during periods when reimbursements or reductions occur. Expenses net of fee waivers reflect expenses after reimbursement by the investment adviser but prior to reductions from brokerage service arrangements or other expense offset arrangements. Expenses net of all reductions represent the net expenses paid by the class.
J Annualized
K Amount does not include the portfolio activity of any underlying Fidelity Central Funds.
See accompanying notes which are an integral part of the financial statements.
Financial Highlights — VIP Contrafund Portfolio Service Class 2
| | Six months ended (Unaudited) June 30, | Years ended December 31, | | | | |
| | 2017 | 2016 | 2015 | 2014 | 2013 | 2012 |
| Selected Per–Share Data | | | | | | |
| Net asset value, beginning of period | $32.45 | $33.25 | $36.70 | $33.77 | $26.00 | $22.64 |
| Income from Investment Operations | | | | | | |
| Net investment income (loss)A | .12 | .24 | .26 | .27 | .24 | .26 |
| Net realized and unrealized gain (loss) | 3.50 | 1.80 | (.14) | 3.68 | 7.80 | 3.39 |
| Total from investment operations | 3.62 | 2.04 | .12 | 3.95 | 8.04 | 3.65 |
| Distributions from net investment income | (.06) | (.20) | (.28) | (.27) | (.26) | (.28)B |
| Distributions from net realized gain | (1.28) | (2.65) | (3.30) | (.75) | (.01) | (.01)B |
| Total distributions | (1.33)C | (2.84)D | (3.57)E | (1.02) | (.27) | (.29) |
| Redemption fees added to paid in capitalA | – | – | – | –F | –F | –F |
| Net asset value, end of period | $34.74 | $32.45 | $33.25 | $36.70 | $33.77 | $26.00 |
| Total ReturnG,H,I | 11.41% | 7.76% | .39% | 11.65% | 30.95% | 16.14% |
| Ratios to Average Net AssetsJ,K | | | | | | |
| Expenses before reductions | .87%L | .88% | .88% | .88% | .89% | .89% |
| Expenses net of fee waivers, if any | .87%L | .88% | .88% | .88% | .88% | .89% |
| Expenses net of all reductions | .87%L | .87% | .87% | .88% | .87% | .88% |
| Net investment income (loss) | .73%L | .79% | .76% | .76% | .80% | 1.02% |
| Supplemental Data | | | | | | |
| Net assets, end of period (000 omitted) | $8,777,176 | $8,138,206 | $8,363,076 | $8,764,266 | $8,472,780 | $7,740,640 |
| Portfolio turnover rateM | 61%L | 62% | 80% | 74% | 86% | 87% |
A Calculated based on average shares outstanding during the period.
B The amounts shown reflect certain reclassifications related to book to tax differences that were made in the year shown.
C Total distributions of $1.33 per share is comprised of distributions from net investment income of $.059 and distributions from net realized gain of $1.275 per share.
D Total distributions of $2.84 per share is comprised of distributions from net investment income of $.196 and distributions from net realized gain of $2.648 per share.
E Total distributions of $3.57 per share is comprised of distributions from net investment income of $.279 and distributions from net realized gain of $3.295 per share.
F Amount represents less than $.005 per share.
G Total returns for periods of less than one year are not annualized.
H Total returns do not reflect charges attributable to your insurance company's separate account. Inclusion of these charges would reduce the total returns shown.
I Total returns would have been lower if certain expenses had not been reduced during the applicable periods shown.
J Fees and expenses of any underlying Fidelity Central Funds are not included in the Fund's expense ratio. The Fund indirectly bears its proportionate share of the expenses of any underlying Fidelity Central Funds.
K Expense ratios reflect operating expenses of the class. Expenses before reductions do not reflect amounts reimbursed by the investment adviser or reductions from brokerage service arrangements or reductions from other expense offset arrangements and do not represent the amount paid by the class during periods when reimbursements or reductions occur. Expenses net of fee waivers reflect expenses after reimbursement by the investment adviser but prior to reductions from brokerage service arrangements or other expense offset arrangements. Expenses net of all reductions represent the net expenses paid by the class.
L Annualized
M Amount does not include the portfolio activity of any underlying Fidelity Central Funds.
See accompanying notes which are an integral part of the financial statements.
See accompanying notes which are an integral part of the financial statements.
Financial Highlights — VIP Contrafund Portfolio Investor Class
| | Six months ended (Unaudited) June 30, | Years ended December 31, | | | | |
| | 2017 | 2016 | 2015 | 2014 | 2013 | 2012 |
| Selected Per–Share Data | | | | | | |
| Net asset value, beginning of period | $33.01 | $33.76 | $37.21 | $34.22 | $26.35 | $22.94 |
| Income from Investment Operations | | | | | | |
| Net investment income (loss)A | .15 | .30 | .32 | .33 | .29 | .30 |
| Net realized and unrealized gain (loss) | 3.56 | 1.84 | (.13) | 3.74 | 7.91 | 3.45 |
| Total from investment operations | 3.71 | 2.14 | .19 | 4.07 | 8.20 | 3.75 |
| Distributions from net investment income | (.07) | (.24) | (.34) | (.33) | (.32) | (.32)B |
| Distributions from net realized gain | (1.28) | (2.65) | (3.30) | (.75) | (.01) | (.01)B |
| Total distributions | (1.34)C | (2.89) | (3.64) | (1.08) | (.33) | (.34)D |
| Redemption fees added to paid in capitalA | – | – | – | –E | –E | –E |
| Net asset value, end of period | $35.38 | $33.01 | $33.76 | $37.21 | $34.22 | $26.35 |
| Total ReturnF,G,H | 11.49% | 7.95% | .56% | 11.85% | 31.15% | 16.34% |
| Ratios to Average Net AssetsI,J | | | | | | |
| Expenses before reductions | .70%K | .71% | .71% | .71% | .72% | .73% |
| Expenses net of fee waivers, if any | .70%K | .71% | .71% | .71% | .71% | .73% |
| Expenses net of all reductions | .70%K | .70% | .70% | .71% | .71% | .71% |
| Net investment income (loss) | .90%K | .95% | .93% | .93% | .97% | 1.18% |
| Supplemental Data | | | | | | |
| Net assets, end of period (000 omitted) | $1,465,227 | $1,327,708 | $1,276,807 | $1,210,592 | $1,031,358 | $698,845 |
| Portfolio turnover rateL | 61%K | 62% | 80% | 74% | 86% | 87% |
A Calculated based on average shares outstanding during the period.
B The amounts shown reflect certain reclassifications related to book to tax differences that were made in the year shown.
C Total distributions of $1.34 per share is comprised of distributions from net investment income of $.068 and distributions from net realized gain of $1.275 per share.
D Total distributions of $.34 per share is comprised of distributions from net investment income of $.322 and distributions from net realized gain of $.013 per share.
E Amount represents less than $.005 per share.
F Total returns for periods of less than one year are not annualized.
G Total returns do not reflect charges attributable to your insurance company's separate account. Inclusion of these charges would reduce the total returns shown.
H Total returns would have been lower if certain expenses had not been reduced during the applicable periods shown.
I Fees and expenses of any underlying Fidelity Central Funds are not included in the Fund's expense ratio. The Fund indirectly bears its proportionate share of the expenses of any underlying Fidelity Central Funds.
J Expense ratios reflect operating expenses of the class. Expenses before reductions do not reflect amounts reimbursed by the investment adviser or reductions from brokerage service arrangements or reductions from other expense offset arrangements and do not represent the amount paid by the class during periods when reimbursements or reductions occur. Expenses net of fee waivers reflect expenses after reimbursement by the investment adviser but prior to reductions from brokerage service arrangements or other expense offset arrangements. Expenses net of all reductions represent the net expenses paid by the class.
K Annualized
L Amount does not include the portfolio activity of any underlying Fidelity Central Funds.
See accompanying notes which are an integral part of the financial statements.
Notes to Financial Statements (Unaudited)
For the period ended June 30, 2017
1. Organization.
VIP Contrafund Portfolio (the Fund) is a fund of Variable Insurance Products Fund II (the Trust) and is authorized to issue an unlimited number of shares. The Trust is registered under the Investment Company Act of 1940, as amended (the 1940 Act), as an open-end management investment company organized as a Massachusetts business trust. Shares of the Fund may only be purchased by insurance companies for the purpose of funding variable annuity or variable life insurance contracts. The Fund offers the following classes of shares: Initial Class shares, Service Class shares, Service Class 2 shares and Investor Class shares. All classes have equal rights and voting privileges, except for matters affecting a single class.
2. Investments in Fidelity Central Funds.
The Fund invests in Fidelity Central Funds, which are open-end investment companies generally available only to other investment companies and accounts managed by the investment adviser and its affiliates. The Fund's Schedule of Investments lists each of the Fidelity Central Funds held as of period end, if any, as an investment of the Fund, but does not include the underlying holdings of each Fidelity Central Fund. As an Investing Fund, the Fund indirectly bears its proportionate share of the expenses of the underlying Fidelity Central Funds.
The Money Market Central Funds seek preservation of capital and current income and are managed by Fidelity Investments Money Management, Inc. (FIMM), an affiliate of the investment adviser. Annualized expenses of the Money Market Central Funds as of their most recent shareholder report date are less than .005%.
A complete unaudited list of holdings for each Fidelity Central Fund is available upon request or at the Securities and Exchange Commission (the SEC) website at www.sec.gov. In addition, the financial statements of the Fidelity Central Funds are available on the SEC website or upon request.
3. Significant Accounting Policies.
The Fund is an investment company and applies the accounting and reporting guidance of the Financial Accounting Standards Board (FASB) Accounting Standards Codification Topic 946 Financial Services – Investments Companies. The financial statements have been prepared in conformity with accounting principles generally accepted in the United States of America (GAAP), which require management to make certain estimates and assumptions at the date of the financial statements. Actual results could differ from those estimates. Subsequent events, if any, through the date that the financial statements were issued have been evaluated in the preparation of the financial statements. The following summarizes the significant accounting policies of the Fund:
Investment Valuation. Investments are valued as of 4:00 p.m. Eastern time on the last calendar day of the period. The Board of Trustees (the Board) has delegated the day to day responsibility for the valuation of the Fund's investments to the Fair Value Committee (the Committee) established by the Fund's investment adviser. In accordance with valuation policies and procedures approved by the Board, the Fund attempts to obtain prices from one or more third party pricing vendors or brokers to value its investments. When current market prices, quotations or currency exchange rates are not readily available or reliable, investments will be fair valued in good faith by the Committee, in accordance with procedures adopted by the Board. Factors used in determining fair value vary by investment type and may include market or investment specific events, changes in interest rates and credit quality. The frequency with which these procedures are used cannot be predicted and they may be utilized to a significant extent. The Committee oversees the Fund's valuation policies and procedures and reports to the Board on the Committee's activities and fair value determinations. The Board monitors the appropriateness of the procedures used in valuing the Fund's investments and ratifies the fair value determinations of the Committee.
The Fund categorizes the inputs to valuation techniques used to value its investments into a disclosure hierarchy consisting of three levels as shown below:
- Level 1 – quoted prices in active markets for identical investments
- Level 2 – other significant observable inputs (including quoted prices for similar investments, interest rates, prepayment speeds, etc.)
- Level 3 – unobservable inputs (including the Fund's own assumptions based on the best information available)
Valuation techniques used to value the Fund's investments by major category are as follows:
Equity securities, including restricted securities, for which market quotations are readily available, are valued at the last reported sale price or official closing price as reported by a third party pricing vendor on the primary market or exchange on which they are traded and are categorized as Level 1 in the hierarchy. In the event there were no sales during the day or closing prices are not available, securities are valued at the last quoted bid price or may be valued using the last available price and are generally categorized as Level 2 in the hierarchy. For foreign equity securities, when market or security specific events arise, comparisons to the valuation of American Depositary Receipts (ADRs), futures contracts, Exchange-Traded Funds (ETFs) and certain indexes as well as quoted prices for similar securities may be used and would be categorized as Level 2 in the hierarchy. Utilizing these techniques may result in transfers between Level 1 and Level 2. For equity securities, including restricted securities, where observable inputs are limited, assumptions about market activity and risk are used and these securities may be categorized as Level 3 in the hierarchy.
Debt securities, including restricted securities, are valued based on evaluated prices received from third party pricing vendors or from brokers who make markets in such securities. U.S. government and government agency obligations are valued by pricing vendors who utilize matrix pricing which considers yield or price of bonds of comparable quality, coupon, maturity and type or by broker-supplied prices. When independent prices are unavailable or unreliable, debt securities may be valued utilizing pricing methodologies which consider similar factors that would be used by third party pricing vendors. Debt securities are generally categorized as Level 2 in the hierarchy but may be Level 3 depending on the circumstances.
Futures contracts are valued at the settlement price established each day by the board of trade or exchange on which they are traded and are categorized as Level 1 in the hierarchy. Investments in open-end mutual funds, including the Fidelity Central Funds, are valued at their closing net asset value (NAV) each business day and are categorized as Level 1 in the hierarchy.
Changes in valuation techniques may result in transfers in or out of an assigned level within the disclosure hierarchy. The aggregate value of investments by input level as of June 30, 2017, is included at the end of the Fund's Schedule of Investments.
Foreign Currency. The Fund may use foreign currency contracts to facilitate transactions in foreign-denominated securities. Gains and losses from these transactions may arise from changes in the value of the foreign currency or if the counterparties do not perform under the contracts' terms.
Foreign-denominated assets, including investment securities, and liabilities are translated into U.S. dollars at the exchange rates at period end. Purchases and sales of investment securities, income and dividends received and expenses denominated in foreign currencies are translated into U.S. dollars at the exchange rate in effect on the transaction date.
The effects of exchange rate fluctuations on investments are included with the net realized and unrealized gain (loss) on investment securities. Other foreign currency transactions resulting in realized and unrealized gain (loss) are disclosed separately.
Investment Transactions and Income. For financial reporting purposes, the Fund's investment holdings and NAV include trades executed through the end of the last business day of the period. The NAV per share for processing shareholder transactions is calculated as of the close of business of the New York Stock Exchange (NYSE), normally 4:00 p.m. Eastern time and includes trades executed through the end of the prior business day. Gains and losses on securities sold are determined on the basis of identified cost and may include proceeds received from litigation. Dividend income is recorded on the ex-dividend date, except for certain dividends from foreign securities where the ex-dividend date may have passed, which are recorded as soon as the Fund is informed of the ex-dividend date. Non-cash dividends included in dividend income, if any, are recorded at the fair market value of the securities received. Income and capital gain distributions from Fidelity Central Funds, if any, are recorded on the ex-dividend date. Certain distributions received by the Fund represent a return of capital or capital gain. The Fund determines the components of these distributions subsequent to the ex-dividend date, based upon receipt of tax filings or other correspondence relating to the underlying investment. These distributions are recorded as a reduction of cost of investments and/or as a realized gain. Interest income is accrued as earned and includes coupon interest and amortization of premium and accretion of discount on debt securities as applicable. Investment income is recorded net of foreign taxes withheld where recovery of such taxes is uncertain.
Class Allocations and Expenses. Investment income, realized and unrealized capital gains and losses, common expenses of the Fund, and certain fund-level expense reductions, if any, are allocated daily on a pro-rata basis to each class based on the relative net assets of each class to the total net assets of the Fund. Each class differs with respect to transfer agent and distribution and service plan fees incurred. Certain expense reductions may also differ by class. For the reporting period, the allocated portion of income and expenses to each class as a percent of its average net assets may vary due to the timing of recording these transactions in relation to fluctuating net assets of the classes. Expenses directly attributable to a fund are charged to that fund. Expenses attributable to more than one fund are allocated among the respective funds on the basis of relative net assets or other appropriate methods. Expense estimates are accrued in the period to which they relate and adjustments are made when actual amounts are known.
Deferred Trustee Compensation. Under a Deferred Compensation Plan (the Plan), independent Trustees may elect to defer receipt of a portion of their annual compensation. Deferred amounts are invested in a cross-section of Fidelity funds, are marked-to-market and remain in the Fund until distributed in accordance with the Plan. The investment of deferred amounts and the offsetting payable to the Trustees are included in the accompanying Statement of Assets and Liabilities.
Income Tax Information and Distributions to Shareholders. Each year, the Fund intends to qualify as a regulated investment company under Subchapter M of the Internal Revenue Code, including distributing substantially all of its taxable income and realized gains. As a result, no provision for U.S. Federal income taxes is required. The Fund files a U.S. federal tax return, in addition to state and local tax returns as required. The Fund's federal income tax returns are subject to examination by the Internal Revenue Service (IRS) for a period of three fiscal years after they are filed. State and local tax returns may be subject to examination for an additional fiscal year depending on the jurisdiction. Foreign taxes are provided for based on the Fund's understanding of the tax rules and rates that exist in the foreign markets in which it invests.
Distributions are declared and recorded on the ex-dividend date. Income dividends and capital gain distributions are declared separately for each class. Income and capital gain distributions are determined in accordance with income tax regulations, which may differ from GAAP.
Capital accounts within the financial statements are adjusted for permanent book-tax differences. These adjustments have no impact on net assets or the results of operations. Capital accounts are not adjusted for temporary book-tax differences which will reverse in a subsequent period.
Book-tax differences are primarily due to futures contracts, foreign currency transactions, short-term gain distributions from the underlying funds, passive foreign investment companies (PFIC), market discount, partnerships, deferred trustees compensation and losses deferred due to wash sales and excise tax regulations.
The federal tax cost of investment securities and unrealized appreciation (depreciation) as of period end were as follows:
| Gross unrealized appreciation | $4,885,604,518 |
| Gross unrealized depreciation | (442,709,152) |
| Net unrealized appreciation (depreciation) on securities | $4,442,895,366 |
| Tax cost | $14,825,775,013 |
Restricted Securities. The Fund may invest in securities that are subject to legal or contractual restrictions on resale. These securities generally may be resold in transactions exempt from registration or to the public if the securities are registered. Disposal of these securities may involve time-consuming negotiations and expense, and prompt sale at an acceptable price may be difficult. Information regarding restricted securities is included at the end of the Fund's Schedule of Investments.
Consolidated Subsidiary. The Fund invests in certain investments through a wholly-owned subsidiary ("Subsidiary"), which may be subject to federal and state taxes upon disposition.
As of period end, the Fund held an investment of $482,038 in this Subsidiary, representing .00% of the Fund's net assets. The financial statements have been consolidated and include accounts of the Fund and each Subsidiary. Accordingly, all inter-company transactions and balances have been eliminated.
4. Derivative Instruments.
Risk Exposures and the Use of Derivative Instruments. The Fund's investment objective allows the Fund to enter into various types of derivative contracts, including futures contracts. Derivatives are investments whose value is primarily derived from underlying assets, indices or reference rates and may be transacted on an exchange or over-the-counter (OTC). Derivatives may involve a future commitment to buy or sell a specified asset based on specified terms, to exchange future cash flows at periodic intervals based on a notional principal amount, or for one party to make one or more payments upon the occurrence of specified events in exchange for periodic payments from the other party.
The Fund used derivatives to increase returns and to manage exposure to certain risks as defined below. The success of any strategy involving derivatives depends on analysis of numerous economic factors, and if the strategies for investment do not work as intended, the Fund may not achieve its objectives.
The Fund's use of derivatives increased or decreased its exposure to the following risk:
| Equity Risk | Equity risk relates to the fluctuations in the value of financial instruments as a result of changes in market prices (other than those arising from interest rate risk or foreign exchange risk), whether caused by factors specific to an individual investment, its issuer, or all factors affecting all instruments traded in a market or market segment.
|
The Fund is also exposed to additional risks from investing in derivatives, such as liquidity risk and counterparty credit risk. Liquidity risk is the risk that the Fund will be unable to close out the derivative in the open market in a timely manner. Counterparty credit risk is the risk that the counterparty will not be able to fulfill its obligation to the Fund. Counterparty credit risk related to exchange-traded futures contracts may be mitigated by the protection provided by the exchange on which they trade.
Investing in derivatives may involve greater risks than investing in the underlying assets directly and, to varying degrees, may involve risk of loss in excess of any initial investment and collateral received and amounts recognized in the Statement of Assets and Liabilities. In addition, there may be the risk that the change in value of the derivative contract does not correspond to the change in value of the underlying instrument.
Futures Contracts. A futures contract is an agreement between two parties to buy or sell a specified underlying instrument for a fixed price at a specified future date. The Fund used futures contracts to manage its exposure to the stock market.
Upon entering into a futures contract, a fund is required to deposit either cash or securities (initial margin) with a clearing broker in an amount equal to a certain percentage of the face value of the contract. Futures contracts are marked-to-market daily and subsequent daily payments (variation margin) are made or received by a fund depending on the daily fluctuations in the value of the futures contracts and are recorded as unrealized appreciation or (depreciation). This receivable and/or payable, if any, is included in daily variation margin for derivative instruments in the Statement of Assets and Liabilities. Realized gain or (loss) is recorded upon the expiration or closing of a futures contract.
Any open futures contracts at period end are presented in the Schedule of Investments under the caption "Futures Contracts". The underlying face amount at value reflects each contract's exposure to the underlying instrument or index at period end and is representative of volume of activity during the period. Securities deposited to meet initial margin requirements are identified in the Schedule of Investments.
During the period the Fund recognized net realized gain (loss) of $5,670,253 and a change in net unrealized appreciation (depreciation) of $536,652 related to its investment in futures contracts. These amounts are included in the Statement of Operations.
5. Purchases and Sales of Investments.
Purchases and sales of securities, other than short-term securities, aggregated $5,543,001,050 and $6,031,568,623, respectively.
6. Fees and Other Transactions with Affiliates.
Management Fee. Fidelity Management & Research Company (the investment adviser) and its affiliates provide the Fund with investment management related services for which the Fund pays a monthly management fee. The management fee is the sum of an individual fund fee rate that is based on an annual rate of .30% of the Fund's average net assets and an annualized group fee rate that averaged .25% during the period. The group fee rate is based upon the average net assets of all the mutual funds advised by the investment adviser, including any mutual funds previously advised by the investment adviser that are currently advised by Fidelity SelectCo, LLC, an affiliate of the investment adviser. The group fee rate decreases as assets under management increase and increases as assets under management decrease. For the reporting period, the total annualized management fee rate was .55% of the Fund's average net assets.
Distribution and Service Plan Fees. In accordance with Rule 12b-1 of the 1940 Act, the Fund has adopted separate 12b-1 Plans for each Service Class of shares. Each Service Class pays Fidelity Distributors Corporation (FDC), an affiliate of the investment adviser, a service fee. For the period, the service fee is based on an annual rate of .10% of Service Class' average net assets and .25% of Service Class 2's average net assets.
For the period, total fees, all of which were re-allowed to insurance companies for the distribution of shares and providing shareholder support services, were as follows:
| Service Class | $742,032 |
| Service Class 2 | 10,730,126 |
| | $11,472,158 |
Transfer Agent Fees. Fidelity Investments Institutional Operations Company, Inc. (FIIOC), an affiliate of the investment adviser, is the Fund's transfer, dividend disbursing, and shareholder servicing agent. FIIOC receives an asset-based fee with respect to each class. Each class pays a fee for transfer agent services, typesetting and printing and mailing of shareholder reports, excluding mailing of proxy statements, equal to an annual rate of class-level average net assets. The annual rate for Investor class is .15% and the annual rate for all other classes is .07%. For the period, transfer agent fees for each class were as follows:
| Initial Class | $2,391,953 |
| Service Class | 489,741 |
| Service Class 2 | 2,832,753 |
| Investor Class | 1,042,157 |
| | $6,756,604 |
Accounting and Security Lending Fees. Fidelity Service Company, Inc. (FSC), an affiliate of the investment adviser, maintains the Fund's accounting records. The accounting fee is based on the level of average net assets for each month. Under a separate contract, FSC administers the security lending program. The security lending fee is based on the number and duration of lending transactions.
Brokerage Commissions. The Fund placed a portion of its portfolio transactions with brokerage firms which are affiliates of the investment adviser. Brokerage commissions are included in net realized gain (loss) and change in net unrealized appreciation (depreciation) in the Statement of Operations. The commissions paid to these affiliated firms were $161,945 for the period.
Interfund Trades. The Fund may purchase from or sell securities to other Fidelity Funds under procedures adopted by the Board. The procedures have been designed to ensure these interfund trades are executed in accordance with Rule 17a-7 of the 1940 Act. Interfund trades are included within the respective purchases and sales amounts shown in the Purchases and Sales of Investments note.
7. Committed Line of Credit.
The Fund participates with other funds managed by the investment adviser or an affiliate in a $4.25 billion credit facility (the "line of credit") to be utilized for temporary or emergency purposes to fund shareholder redemptions or for other short-term liquidity purposes. The Fund has agreed to pay commitment fees on its pro-rata portion of the line of credit, which amounted to $30,807 and is reflected in Miscellaneous expenses on the Statement of Operations. During the period, the Fund did not borrow on this line of credit.
8. Security Lending.
The Fund lends portfolio securities through a lending agent from time to time in order to earn additional income. For equity securities, a lending agent is used and may loan securities to certain qualified borrowers, including Fidelity Capital Markets (FCM), a broker-dealer affiliated with the Fund. On the settlement date of the loan, the Fund receives collateral (in the form of U.S. Treasury obligations, letters of credit and/or cash) against the loaned securities and maintains collateral in an amount not less than 100% of the market value of the loaned securities during the period of the loan. The market value of the loaned securities is determined at the close of business of the Fund and any additional required collateral is delivered to the Fund on the next business day. The Fund or borrower may terminate the loan at any time, and if the borrower defaults on its obligation to return the securities loaned because of insolvency or other reasons, the Fund may apply collateral received from the borrower against the obligation. The Fund may experience delays and costs in recovering the securities loaned. Any cash collateral received is invested in the Fidelity Securities Lending Cash Central Fund. The value of loaned securities and cash collateral at period end are disclosed on the Fund's Statement of Assets and Liabilities. The value of securities loaned to FCM at period end was $4,594,930. Security lending income represents the income earned on investing cash collateral, less rebates paid to borrowers and any lending agent fees associated with the loan, plus any premium payments received for lending certain types of securities. Security lending income is presented in the Statement of Operations as a component of income from Fidelity Central Funds. Total security lending income during the period amounted to $2,167,424, including $30,392 from securities loaned to FCM.
9. Expense Reductions.
Commissions paid to certain brokers with whom the investment adviser, or its affiliates, places trades on behalf of the Fund include an amount in addition to trade execution, which may be rebated back to the Fund to offset certain expenses. This amount totaled $572,345 for the period. In addition, through arrangements with the Fund's custodian, credits realized as a result of certain uninvested cash balances were used to reduce the Fund's custody expenses by $1,255.
In addition, during the period the investment adviser reimbursed and/or waived a portion of fund-level operating expenses in the amount of $81,039.
10. Distributions to Shareholders.
Distributions to shareholders of each class were as follows:
| | Six months ended
June 30, 2017 | Year ended December 31, 2016 |
| From net investment income | | |
| Initial Class | $14,803,785 | $54,940,478 |
| Service Class | 2,836,259 | 10,073,381 |
| Service Class 2 | 14,656,980 | 48,997,544 |
| Investor Class | 2,727,510 | 9,721,521 |
| Total | $35,024,534 | $123,732,924 |
| From net realized gain | | |
| Initial Class | $262,150,355 | $575,054,471 |
| Service Class | 53,973,585 | 119,636,942 |
| Service Class 2 | 316,739,819 | 657,251,824 |
| Investor Class | 51,140,819 | 100,041,723 |
| Total | $684,004,578 | $1,451,984,960 |
11. Share Transactions.
Transactions for each class of shares were as follows:
| | Shares | Shares | Dollars | Dollars |
| | Six months ended
June 30, 2017 | Year ended December 31, 2016 | Six months ended
June 30, 2017 | Year ended December 31, 2016 |
| Initial Class | | | | |
| Shares sold | 2,408,997 | 4,917,198 | $82,798,475 | $154,447,968 |
| Reinvestment of distributions | 8,257,428 | 22,388,704 | 276,954,140 | 629,994,949 |
| Shares redeemed | (14,220,141) | (36,744,966) | (490,594,552) | (1,144,427,127) |
| Net increase (decrease) | (3,553,716) | (9,439,064) | $(130,841,937) | $(359,984,210) |
| Service Class | | | | |
| Shares sold | 776,456 | 1,377,610 | $26,545,046 | $43,113,058 |
| Reinvestment of distributions | 1,701,403 | 4,635,999 | 56,809,844 | 129,710,323 |
| Shares redeemed | (3,383,374) | (8,552,024) | (116,134,596) | (269,744,462) |
| Net increase (decrease) | (905,515) | (2,538,415) | $(32,779,706) | $(96,921,081) |
| Service Class 2 | | | | |
| Shares sold | 8,974,388 | 22,094,254 | $302,952,345 | $675,363,352 |
| Reinvestment of distributions | 10,109,725 | 25,726,957 | 331,396,799 | 706,249,368 |
| Shares redeemed | (17,175,253) | (48,541,399) | (580,010,015) | (1,504,027,418) |
| Net increase (decrease) | 1,908,860 | (720,188) | $54,339,129 | $(122,414,698) |
| Investor Class | | | | |
| Shares sold | 883,503 | 1,712,207 | $30,284,868 | $53,815,278 |
| Reinvestment of distributions | 1,614,758 | 3,918,305 | 53,868,329 | 109,763,244 |
| Shares redeemed | (1,303,200) | (3,227,939) | (44,689,678) | (101,536,110) |
| Net increase (decrease) | 1,195,061 | 2,402,573 | $39,463,519 | $62,042,412 |
12. Other.
The Fund's organizational documents provide former and current trustees and officers with a limited indemnification against liabilities arising in connection with the performance of their duties to the Fund. In the normal course of business, the Fund may also enter into contracts that provide general indemnifications. The Fund's maximum exposure under these arrangements is unknown as this would be dependent on future claims that may be made against the Fund. The risk of material loss from such claims is considered remote.
At the end of the period, the investment adviser or its affiliates were the owners of record of 13% of the total outstanding shares of the Fund and one otherwise unaffiliated shareholder was the owner of record of 10% of the total outstanding shares of the Fund.
Shareholder Expense Example
As a shareholder of the Fund, you incur two types of costs: (1) transaction costs and (2) ongoing costs, including management fees, distribution and/or service (12b-1) fees and other Fund expenses. This Example is intended to help you understand your ongoing costs (in dollars) of investing in the Fund and to compare these costs with the ongoing costs of investing in other mutual funds.
The Example is based on an investment of $1,000 invested at the beginning of the period and held for the entire period (January 1, 2017 to June 30, 2017).
Actual Expenses
The first line of the accompanying table for each class of the Fund provides information about actual account values and actual expenses. You may use the information in this line, together with the amount you invested, to estimate the expenses that you paid over the period. Simply divide your account value by $1,000.00 (for example, an $8,600 account value divided by $1,000.00 = 8.6), then multiply the result by the number in the first line for a class of the Fund under the heading entitled "Expenses Paid During Period" to estimate the expenses you paid on your account during this period. The estimate of expenses does not include any fees or other expenses of any variable annuity or variable life insurance product. If they were, the estimate of expenses you paid during the period would be higher, and your ending account value would be lower. In addition, the Fund, as a shareholder in the underlying Fidelity Central Funds, will indirectly bear its pro-rata share of the fees and expenses incurred by the underlying Fidelity Central Funds. These fees and expenses are not included in the Fund's annualized expense ratio used to calculate the expense estimate in the table below.
Hypothetical Example for Comparison Purposes
The second line of the accompanying table for each class of the Fund provides information about hypothetical account values and hypothetical expenses based on a Class' actual expense ratio and an assumed rate of return of 5% per year before expenses, which is not the Class' actual return. The hypothetical account values and expenses may not be used to estimate the actual ending account balance or expenses you paid for the period. You may use this information to compare the ongoing costs of investing in the Fund and other funds. To do so, compare this 5% hypothetical example with the 5% hypothetical examples that appear in the shareholder reports of the other funds. The estimate of expenses does not include any fees or other expenses of any variable annuity or variable life insurance product. If they were, the estimate of expenses you paid during the period would be higher, and your ending account value would be lower. In addition, the Fund, as a shareholder in the underlying Fidelity Central Funds, will indirectly bear its pro-rata share of the fees and expenses incurred by the underlying Fidelity Central Funds. These fees and expenses are not included in the Fund's annualized expense ratio used to calculate the expense estimate in the table below.
Please note that the expenses shown in the table are meant to highlight your ongoing costs only and do not reflect any transaction costs. Therefore, the second line of the table is useful in comparing ongoing costs only, and will not help you determine the relative total costs of owning different funds.
| | Annualized Expense Ratio-A | Beginning
Account Value
January 1, 2017 | Ending
Account Value
June 30, 2017 | Expenses Paid
During Period-B
January 1, 2017
to June 30, 2017 |
| Initial Class | .62% | | | |
| Actual | | $1,000.00 | $1,115.40 | $3.25 |
| Hypothetical-C | | $1,000.00 | $1,021.72 | $3.11 |
| Service Class | .72% | | | |
| Actual | | $1,000.00 | $1,114.80 | $3.78 |
| Hypothetical-C | | $1,000.00 | $1,021.22 | $3.61 |
| Service Class 2 | .87% | | | |
| Actual | | $1,000.00 | $1,114.10 | $4.56 |
| Hypothetical-C | | $1,000.00 | $1,020.48 | $4.36 |
| Investor Class | .70% | | | |
| Actual | | $1,000.00 | $1,114.90 | $3.67 |
| Hypothetical-C | | $1,000.00 | $1,021.32 | $3.51 |
A Annualized expense ratio reflects expenses net of applicable fee waivers.
B Expenses are equal to each Class' annualized expense ratio, multiplied by the average account value over the period, multiplied by 181/365 (to reflect the one-half year period).
C 5% return per year before expenses

VIPCON-SANN-0817
1.705691.119
Fidelity® Variable Insurance Products: Disciplined Small Cap Portfolio
Semi-Annual Report June 30, 2017 |
|
Contents
To view a fund's proxy voting guidelines and proxy voting record for the 12-month period ended June 30, visit http://www.fidelity.com/proxyvotingresults or visit the Securities and Exchange Commission's (SEC) web site at http://www.sec.gov.
You may also call 1-877-208-0098 to request a free copy of the proxy voting guidelines.
Fidelity® Variable Insurance Products are separate account options which are purchased through a variable insurance contract.
Standard & Poor's, S&P and S&P 500 are registered service marks of The McGraw-Hill Companies, Inc. and have been licensed for use by Fidelity Distributors Corporation.
Other third-party marks appearing herein are the property of their respective owners.
All other marks appearing herein are registered or unregistered trademarks or service marks of FMR LLC or an affiliated company. © 2017 FMR LLC. All rights reserved.
This report and the financial statements contained herein are submitted for the general information of the shareholders of the Fund. This report is not authorized for distribution to prospective investors in the Fund unless preceded or accompanied by an effective prospectus.
A fund files its complete schedule of portfolio holdings with the SEC for the first and third quarters of each fiscal year on Form N-Q. Forms N-Q are available on the SEC’s web site at http://www.sec.gov. A fund's Forms N-Q may be reviewed and copied at the SEC’s Public Reference Room in Washington, DC. Information regarding the operation of the SEC's Public Reference Room may be obtained by calling 1-800-SEC-0330.
For a complete list of a fund's portfolio holdings, view the most recent holdings listing, semiannual report, or annual report on Fidelity's web site at http://www.fidelity.com, http://www.institutional.fidelity.com, or http://www.401k.com, as applicable.
NOT FDIC INSURED •MAY LOSE VALUE •NO BANK GUARANTEE
Neither the Fund nor Fidelity Distributors Corporation is a bank.
Investment Summary (Unaudited)
Top Ten Stocks as of June 30, 2017
| | % of fund's net assets | % of fund's net assets 6 months ago |
| Wintrust Financial Corp. | 0.7 | 0.7 |
| Umpqua Holdings Corp. | 0.7 | 0.7 |
| Louisiana-Pacific Corp. | 0.7 | 0.0 |
| Cirrus Logic, Inc. | 0.7 | 0.7 |
| Aspen Technology, Inc. | 0.7 | 0.6 |
| Masimo Corp. | 0.7 | 0.6 |
| Fulton Financial Corp. | 0.7 | 0.6 |
| Tenneco, Inc. | 0.7 | 0.7 |
| Essent Group Ltd. | 0.7 | 0.6 |
| LaSalle Hotel Properties (SBI) | 0.7 | 0.2 |
| | 7.0 | |
Top Five Market Sectors as of June 30, 2017
| | % of fund's net assets | % of fund's net assets 6 months ago |
| Information Technology | 17.8 | 17.8 |
| Financials | 16.9 | 18.6 |
| Health Care | 15.3 | 13.8 |
| Consumer Discretionary | 13.8 | 14.2 |
| Industrials | 12.5 | 12.4 |
Asset Allocation (% of fund's net assets)
| As of June 30, 2017* |
| | Stocks and Equity Futures | 100.0% |

* Foreign investments - 5.9%
| As of December 31, 2016* |
| | Stocks and Equity Futures | 99.6% |
| | Short-Term Investments and Net Other Assets (Liabilities) | 0.4% |

* Foreign investments - 5.2%
Percentages shown as 0.0% may reflect amounts less than 0.05%.
Investments June 30, 2017 (Unaudited)
Showing Percentage of Net Assets
| Common Stocks - 96.2% | | | |
| | | Shares | Value |
| CONSUMER DISCRETIONARY - 13.8% | | | |
| Auto Components - 2.5% | | | |
| American Axle & Manufacturing Holdings, Inc. (a) | | 113,214 | $1,766,138 |
| Cooper Tire & Rubber Co. (b) | | 37,917 | 1,368,804 |
| Cooper-Standard Holding, Inc. (a) | | 16,447 | 1,659,009 |
| LCI Industries | | 4,078 | 417,587 |
| Stoneridge, Inc. (a) | | 1,986 | 30,604 |
| Superior Industries International, Inc. | | 8,811 | 181,066 |
| Tenneco, Inc. | | 34,627 | 2,002,479 |
| Tower International, Inc. | | 1,089 | 24,448 |
| | | | 7,450,135 |
| Diversified Consumer Services - 0.7% | | | |
| Capella Education Co. | | 11,962 | 1,023,947 |
| K12, Inc. (a) | | 54,874 | 983,342 |
| | | | 2,007,289 |
| Hotels, Restaurants & Leisure - 0.3% | | | |
| Bojangles', Inc. (a) | | 913 | 14,836 |
| Buffalo Wild Wings, Inc. (a) | | 579 | 73,359 |
| DineEquity, Inc. | | 6,353 | 279,850 |
| Marriott Vacations Worldwide Corp. | | 508 | 59,817 |
| Penn National Gaming, Inc. (a) | | 7,136 | 152,710 |
| Scientific Games Corp. Class A (a) | | 2,471 | 64,493 |
| The Cheesecake Factory, Inc. | | 3,792 | 190,738 |
| | | | 835,803 |
| Household Durables - 2.7% | | | |
| Bassett Furniture Industries, Inc. | | 3,474 | 131,838 |
| Ethan Allen Interiors, Inc. | | 12,042 | 388,957 |
| Flexsteel Industries, Inc. | | 21,565 | 1,166,882 |
| KB Home (b) | | 74,662 | 1,789,648 |
| La-Z-Boy, Inc. | | 56,275 | 1,828,938 |
| M.D.C. Holdings, Inc. | | 26,586 | 939,283 |
| New Home Co. LLC (a) | | 1,009 | 11,573 |
| Taylor Morrison Home Corp. (a) | | 68,202 | 1,637,530 |
| TRI Pointe Homes, Inc. (a) | | 19,450 | 256,546 |
| | | | 8,151,195 |
| Internet & Direct Marketing Retail - 0.1% | | | |
| HSN, Inc. | | 9,748 | 310,961 |
| Shutterfly, Inc. (a) | | 1,657 | 78,708 |
| | | | 389,669 |
| Leisure Products - 1.4% | | | |
| American Outdoor Brands Corp. (a)(b) | | 72,697 | 1,610,966 |
| Brunswick Corp. | | 23,094 | 1,448,687 |
| Callaway Golf Co. | | 13,428 | 171,610 |
| Johnson Outdoors, Inc. Class A | | 1,418 | 68,362 |
| MCBC Holdings, Inc. (a) | | 23,774 | 464,782 |
| Nautilus, Inc. (a) | | 14,187 | 271,681 |
| | | | 4,036,088 |
| Media - 0.2% | | | |
| A.H. Belo Corp. Class A | | 4,519 | 24,855 |
| MSG Network, Inc. Class A (a) | | 26,635 | 597,956 |
| Saga Communications, Inc. Class A | | 335 | 15,326 |
| The McClatchy Co. Class A (a) | | 1,899 | 17,737 |
| | | | 655,874 |
| Multiline Retail - 0.6% | | | |
| Big Lots, Inc. (b) | | 38,434 | 1,856,362 |
| Specialty Retail - 5.0% | | | |
| Aarons, Inc. Class A | | 45,905 | 1,785,705 |
| American Eagle Outfitters, Inc. (b) | | 107,236 | 1,292,194 |
| Asbury Automotive Group, Inc. (a) | | 1,159 | 65,541 |
| Ascena Retail Group, Inc. (a) | | 100 | 215 |
| Barnes & Noble, Inc. | | 7,744 | 58,854 |
| Big 5 Sporting Goods Corp. (b) | | 109,702 | 1,431,611 |
| Caleres, Inc. | | 38,896 | 1,080,531 |
| Chico's FAS, Inc. | | 153,934 | 1,450,058 |
| DSW, Inc. Class A | | 93,356 | 1,652,401 |
| Francesca's Holdings Corp. (a) | | 17,884 | 195,651 |
| Genesco, Inc. (a) | | 4,577 | 155,160 |
| Group 1 Automotive, Inc. | | 2,423 | 153,424 |
| Hibbett Sports, Inc. (a)(b) | | 4,278 | 88,769 |
| Office Depot, Inc. | | 337,619 | 1,904,171 |
| Pier 1 Imports, Inc. | | 102,047 | 529,624 |
| Select Comfort Corp. (a)(b) | | 24,699 | 876,568 |
| Shoe Carnival, Inc. | | 25,698 | 536,574 |
| The Cato Corp. Class A (sub. vtg.) | | 2,027 | 35,655 |
| The Children's Place Retail Stores, Inc. (b) | | 13,594 | 1,387,947 |
| Vitamin Shoppe, Inc. (a) | | 4,495 | 52,367 |
| | | | 14,733,020 |
| Textiles, Apparel & Luxury Goods - 0.3% | | | |
| Fossil Group, Inc. (a) | | 13,332 | 137,986 |
| Movado Group, Inc. | | 26,487 | 668,797 |
| Unifi, Inc. (a) | | 3,733 | 114,976 |
| | | | 921,759 |
|
| TOTAL CONSUMER DISCRETIONARY | | | 41,037,194 |
|
| CONSUMER STAPLES - 4.3% | | | |
| Food & Staples Retailing - 1.1% | | | |
| Ingles Markets, Inc. Class A | | 13,064 | 435,031 |
| SpartanNash Co. | | 52,890 | 1,373,024 |
| United Natural Foods, Inc. (a)(b) | | 36,988 | 1,357,460 |
| | | | 3,165,515 |
| Food Products - 2.1% | | | |
| Dean Foods Co. (b) | | 93,721 | 1,593,257 |
| Fresh Del Monte Produce, Inc. | | 33,111 | 1,685,681 |
| Omega Protein Corp. | | 70,362 | 1,259,480 |
| Sanderson Farms, Inc. (b) | | 13,969 | 1,615,515 |
| Seaboard Corp. | | 18 | 71,910 |
| Seneca Foods Corp. Class A (a) | | 4,789 | 148,698 |
| | | | 6,374,541 |
| Household Products - 0.4% | | | |
| Central Garden & Pet Co. Class A (non-vtg.) (a) | | 42,111 | 1,264,172 |
| Personal Products - 0.2% | | | |
| MediFast, Inc. | | 3,880 | 160,904 |
| Natural Health Trends Corp. (b) | | 710 | 19,774 |
| USANA Health Sciences, Inc. (a)(b) | | 4,388 | 281,271 |
| | | | 461,949 |
| Tobacco - 0.5% | | | |
| Universal Corp. (b) | | 25,451 | 1,646,680 |
|
| TOTAL CONSUMER STAPLES | | | 12,912,857 |
|
| ENERGY - 1.6% | | | |
| Energy Equipment & Services - 1.0% | | | |
| Archrock, Inc. | | 56,563 | 644,818 |
| Fairmount Santrol Holidings, Inc. (a)(b) | | 25,932 | 101,135 |
| Matrix Service Co. (a) | | 31,475 | 294,291 |
| McDermott International, Inc. (a) | | 245,164 | 1,757,826 |
| Natural Gas Services Group, Inc. (a) | | 2,052 | 50,992 |
| PHI, Inc. (non-vtg.) (a) | | 3,802 | 37,108 |
| | | | 2,886,170 |
| Oil, Gas & Consumable Fuels - 0.6% | | | |
| Adams Resources & Energy, Inc. | | 224 | 9,202 |
| Bonanza Creek Energy, Inc. (a) | | 440 | 13,952 |
| California Resources Corp. (a) | | 12,794 | 109,389 |
| Denbury Resources, Inc. (a) | | 21,588 | 33,030 |
| Evolution Petroleum Corp. | | 5,406 | 43,789 |
| Golar LNG Ltd. (b) | | 4,922 | 109,515 |
| International Seaways, Inc. (a) | | 12,118 | 262,597 |
| Navios Maritime Acquisition Corp. | | 14,834 | 21,806 |
| Noble Energy, Inc. | | 12,034 | 340,562 |
| Overseas Shipholding Group, Inc. (a) | | 53,833 | 143,196 |
| Penn Virginia Corp. (a) | | 550 | 20,213 |
| Teekay Tankers Ltd. | | 77,836 | 146,332 |
| Tesoro Corp. | | 3,301 | 308,974 |
| Ultra Petroleum Corp. (a) | | 14,726 | 159,777 |
| W&T Offshore, Inc. (a)(b) | | 57,519 | 112,737 |
| | | | 1,835,071 |
|
| TOTAL ENERGY | | | 4,721,241 |
|
| FINANCIALS - 16.9% | | | |
| Banks - 8.0% | | | |
| Arrow Financial Corp. | | 588 | 18,610 |
| BancFirst Corp. | | 10,397 | 1,004,350 |
| Banco Latinoamericano de Comercio Exterior SA Series E | | 38,986 | 1,067,437 |
| Berkshire Hills Bancorp, Inc. | | 5,428 | 190,794 |
| Brookline Bancorp, Inc., Delaware | | 13,344 | 194,822 |
| Cathay General Bancorp | | 48,176 | 1,828,279 |
| Community Trust Bancorp, Inc. | | 5,186 | 226,888 |
| Customers Bancorp, Inc. (a) | | 10,806 | 305,594 |
| Fidelity Southern Corp. | | 19,198 | 438,866 |
| First Bancorp, North Carolina | | 3,369 | 105,315 |
| First Bancorp, Puerto Rico (a) | | 288,075 | 1,667,954 |
| First Busey Corp. | | 6,735 | 197,470 |
| First Commonwealth Financial Corp. | | 4,792 | 60,763 |
| First Financial Bancorp, Ohio | | 14,366 | 397,938 |
| First Interstate Bancsystem, Inc. | | 16,972 | 631,358 |
| First Midwest Bancorp, Inc., Delaware | | 6,381 | 148,741 |
| Fulton Financial Corp. (b) | | 107,580 | 2,044,020 |
| Great Southern Bancorp, Inc. | | 7,855 | 420,243 |
| Great Western Bancorp, Inc. | | 11,986 | 489,149 |
| Hancock Holding Co. | | 4,809 | 235,641 |
| Hanmi Financial Corp. | | 4,573 | 130,102 |
| Heartland Financial U.S.A., Inc. | | 553 | 26,046 |
| Heritage Commerce Corp. | | 12,734 | 175,475 |
| Hilltop Holdings, Inc. | | 11,129 | 291,691 |
| Home Bancshares, Inc. | | 14,611 | 363,814 |
| Huntington Bancshares, Inc. | | 110,610 | 1,495,447 |
| IBERIABANK Corp. | | 17,032 | 1,388,108 |
| International Bancshares Corp. | | 39,271 | 1,376,449 |
| Investors Bancorp, Inc. | | 17,113 | 228,630 |
| LegacyTexas Financial Group, Inc. | | 11,145 | 424,959 |
| MB Financial, Inc. | | 1,175 | 51,747 |
| OFG Bancorp | | 3,117 | 31,170 |
| Peapack-Gladstone Financial Corp. | | 4,839 | 151,412 |
| Peoples Bancorp, Inc. | | 304 | 9,768 |
| Preferred Bank, Los Angeles | | 779 | 41,653 |
| Republic Bancorp, Inc., Kentucky Class A | | 529 | 18,885 |
| Sandy Spring Bancorp, Inc. | | 13,784 | 560,457 |
| Simmons First National Corp. Class A | | 570 | 30,153 |
| The Bank of NT Butterfield & Son Ltd. | | 1,828 | 62,335 |
| Umpqua Holdings Corp. | | 117,541 | 2,158,053 |
| Union Bankshares Corp. | | 1,066 | 36,137 |
| Washington Trust Bancorp, Inc. | | 1,325 | 68,304 |
| Western Alliance Bancorp. (a) | | 14,513 | 714,040 |
| Wintrust Financial Corp. | | 28,599 | 2,186,095 |
| | | | 23,695,162 |
| Capital Markets - 2.7% | | | |
| B. Riley Financial, Inc. | | 2,371 | 43,982 |
| Diamond Hill Investment Group, Inc. | | 1,077 | 214,754 |
| Evercore Partners, Inc. Class A | | 27,354 | 1,928,457 |
| Financial Engines, Inc. (b) | | 32,000 | 1,171,200 |
| GAMCO Investors, Inc. Class A | | 789 | 23,354 |
| Houlihan Lokey | | 15,054 | 525,385 |
| INTL FCStone, Inc. (a) | | 30,246 | 1,142,089 |
| Manning & Napier, Inc. Class A | | 10,643 | 46,297 |
| Moelis & Co. Class A | | 819 | 31,818 |
| OM Asset Management Ltd. | | 26,026 | 386,746 |
| Oppenheimer Holdings, Inc. Class A (non-vtg.) | | 3,191 | 52,332 |
| Piper Jaffray Companies | | 12,445 | 746,078 |
| Vector Capital Corp. rights (a) | | 5,673 | 0 |
| Waddell & Reed Financial, Inc. Class A (b) | | 89,975 | 1,698,728 |
| | | | 8,011,220 |
| Consumer Finance - 1.1% | | | |
| Enova International, Inc. (a) | | 28,774 | 427,294 |
| Nelnet, Inc. Class A | | 36,685 | 1,724,562 |
| Regional Management Corp. (a) | | 7,000 | 165,410 |
| World Acceptance Corp. (a)(b) | | 12,453 | 932,854 |
| | | | 3,250,120 |
| Diversified Financial Services - 0.4% | | | |
| Cotiviti Holdings, Inc. (a) | | 24,212 | 899,234 |
| Marlin Business Services Corp. | | 13,690 | 344,304 |
| | | | 1,243,538 |
| Insurance - 1.4% | | | |
| EMC Insurance Group | | 1,707 | 47,420 |
| Employers Holdings, Inc. | | 3,499 | 148,008 |
| Federated National Holding Co. | | 30,617 | 489,872 |
| Heritage Insurance Holdings, Inc. | | 22,215 | 289,239 |
| Safety Insurance Group, Inc. | | 939 | 64,134 |
| Selective Insurance Group, Inc. | | 25,863 | 1,294,443 |
| Stewart Information Services Corp. | | 915 | 41,523 |
| United Insurance Holdings Corp. (b) | | 25,806 | 405,928 |
| Universal Insurance Holdings, Inc. (b) | | 52,832 | 1,331,366 |
| | | | 4,111,933 |
| Mortgage Real Estate Investment Trusts - 1.3% | | | |
| American Capital Mortgage Investment Corp. | | 14,377 | 270,288 |
| Apollo Commercial Real Estate Finance, Inc. (b) | | 94,821 | 1,758,930 |
| Cherry Hill Mortgage Investment Corp. | | 1,675 | 30,937 |
| MFA Financial, Inc. (b) | | 175,129 | 1,469,332 |
| Redwood Trust, Inc. | | 23,791 | 405,399 |
| | | | 3,934,886 |
| Real Estate Management & Development - 0.1% | | | |
| The RMR Group, Inc. | | 7,625 | 370,956 |
| Thrifts & Mortgage Finance - 1.9% | | | |
| BofI Holding, Inc. (a)(b) | | 6,422 | 152,330 |
| Dime Community Bancshares, Inc. | | 11,564 | 226,654 |
| Essent Group Ltd. (a) | | 53,825 | 1,999,061 |
| Farmer Mac Class C (non-vtg.) | | 226 | 14,622 |
| First Defiance Financial Corp. | | 1,660 | 87,449 |
| Hingham Institution for Savings | | 259 | 47,120 |
| Northwest Bancshares, Inc. | | 76,180 | 1,189,170 |
| Walker & Dunlop, Inc. (a) | | 33,436 | 1,632,680 |
| Waterstone Financial, Inc. | | 8,096 | 152,610 |
| | | | 5,501,696 |
|
| TOTAL FINANCIALS | | | 50,119,511 |
|
| HEALTH CARE - 15.3% | | | |
| Biotechnology - 3.8% | | | |
| Acceleron Pharma, Inc. (a) | | 565 | 17,170 |
| Achillion Pharmaceuticals, Inc. (a) | | 7,728 | 35,472 |
| Acorda Therapeutics, Inc. (a) | | 16,736 | 329,699 |
| Akebia Therapeutics, Inc. (a) | | 2,356 | 33,856 |
| AMAG Pharmaceuticals, Inc. (a)(b) | | 14,403 | 265,015 |
| Amicus Therapeutics, Inc. (a)(b) | | 7,553 | 76,059 |
| Applied Genetic Technologies Corp. (a) | | 21,295 | 108,605 |
| Array BioPharma, Inc. (a)(b) | | 17,734 | 148,434 |
| Biospecifics Technologies Corp. (a) | | 3,735 | 184,920 |
| bluebird bio, Inc. (a)(b) | | 4,934 | 518,317 |
| Blueprint Medicines Corp. (a) | | 3,013 | 152,669 |
| Clovis Oncology, Inc. (a) | | 4,888 | 457,663 |
| Conatus Pharmaceuticals, Inc. (a) | | 6,328 | 36,449 |
| Cytokinetics, Inc. (a) | | 16,110 | 194,931 |
| Dyax Corp. rights 12/31/19 (a) | | 11,419 | 37,226 |
| Dynavax Technologies Corp. (a) | | 9,609 | 92,727 |
| Eagle Pharmaceuticals, Inc. (a)(b) | | 3,446 | 271,855 |
| Editas Medicine, Inc. (a)(b) | | 12,954 | 217,368 |
| Emergent BioSolutions, Inc. (a) | | 10,603 | 359,548 |
| Exact Sciences Corp. (a)(b) | | 21,015 | 743,301 |
| Exelixis, Inc. (a) | | 11,581 | 285,240 |
| FibroGen, Inc. (a) | | 12,281 | 396,676 |
| Genomic Health, Inc. (a) | | 8,285 | 269,677 |
| Global Blood Therapeutics, Inc. (a) | | 614 | 16,793 |
| Halozyme Therapeutics, Inc. (a)(b) | | 15,653 | 200,671 |
| Insmed, Inc. (a) | | 1,124 | 19,288 |
| Intellia Therapeutics, Inc. (a) | | 1,850 | 29,600 |
| Ironwood Pharmaceuticals, Inc. Class A (a)(b) | | 12,799 | 241,645 |
| Jounce Therapeutics, Inc. | | 5,565 | 78,077 |
| Kite Pharma, Inc. (a)(b) | | 5,844 | 605,847 |
| Ligand Pharmaceuticals, Inc. Class B (a)(b) | | 1,848 | 224,347 |
| Loxo Oncology, Inc. (a) | | 3,721 | 298,387 |
| MiMedx Group, Inc. (a)(b) | | 33,843 | 506,630 |
| Momenta Pharmaceuticals, Inc. (a) | | 4,464 | 75,442 |
| Myriad Genetics, Inc. (a)(b) | | 20,496 | 529,617 |
| NantKwest, Inc. (a) | | 4,895 | 37,153 |
| NewLink Genetics Corp. (a) | | 4,441 | 32,641 |
| Novavax, Inc. (a) | | 29,367 | 33,772 |
| PDL BioPharma, Inc. | | 97,483 | 240,783 |
| Pfenex, Inc. (a) | | 7,975 | 31,980 |
| PharmAthene, Inc. | | 19,837 | 63,478 |
| Portola Pharmaceuticals, Inc. (a) | | 4,822 | 270,852 |
| Progenics Pharmaceuticals, Inc. (a) | | 17,471 | 118,628 |
| Prothena Corp. PLC (a)(b) | | 3,105 | 168,043 |
| Puma Biotechnology, Inc. (a) | | 3,940 | 344,356 |
| Repligen Corp. (a) | | 5,835 | 241,802 |
| Sage Therapeutics, Inc. (a)(b) | | 3,473 | 276,590 |
| Sangamo Therapeutics, Inc. (a) | | 10,073 | 88,642 |
| Sarepta Therapeutics, Inc. (a)(b) | | 3,400 | 114,614 |
| Seres Therapeutics, Inc. (a) | | 1,015 | 11,470 |
| Spark Therapeutics, Inc. (a) | | 1,185 | 70,792 |
| Synergy Pharmaceuticals, Inc. (a)(b) | | 1,464 | 6,515 |
| Trevena, Inc. (a) | | 6,735 | 15,491 |
| Ultragenyx Pharmaceutical, Inc. (a)(b) | | 3,727 | 231,484 |
| Vanda Pharmaceuticals, Inc. (a) | | 16,477 | 268,575 |
| Versartis, Inc. (a) | | 8,529 | 148,831 |
| Xencor, Inc. (a) | | 12,797 | 270,145 |
| | | | 11,145,858 |
| Health Care Equipment & Supplies - 4.1% | | | |
| Angiodynamics, Inc. (a) | | 21,526 | 348,936 |
| Cantel Medical Corp. | | 13,841 | 1,078,352 |
| Exactech, Inc. (a) | | 7,890 | 235,122 |
| Fonar Corp. (a) | | 1,359 | 37,712 |
| Globus Medical, Inc. (a) | | 35,384 | 1,172,980 |
| Haemonetics Corp. (a) | | 8,846 | 349,329 |
| Halyard Health, Inc. (a) | | 8,551 | 335,883 |
| Inogen, Inc. (a) | | 6,452 | 615,650 |
| Integer Holdings Corp. (a) | | 6,035 | 261,014 |
| Integra LifeSciences Holdings Corp. (a) | | 3,818 | 208,119 |
| LeMaitre Vascular, Inc. | | 525 | 16,391 |
| LivaNova PLC (a) | | 15,599 | 954,815 |
| Masimo Corp. (a) | | 22,433 | 2,045,441 |
| Meridian Bioscience, Inc. | | 26,390 | 415,643 |
| Merit Medical Systems, Inc. (a) | | 32,194 | 1,228,201 |
| Natus Medical, Inc. (a) | | 22,019 | 821,309 |
| OraSure Technologies, Inc. (a) | | 4,875 | 84,143 |
| Orthofix International NV (a) | | 23,779 | 1,105,248 |
| Quidel Corp. (a) | | 964 | 26,163 |
| SurModics, Inc. (a) | | 11,230 | 316,125 |
| West Pharmaceutical Services, Inc. | | 4,039 | 381,766 |
| | | | 12,038,342 |
| Health Care Providers & Services - 4.9% | | | |
| Aceto Corp. | | 1,007 | 15,558 |
| Alliance Healthcare Services, Inc. (a) | | 22,968 | 305,474 |
| AMN Healthcare Services, Inc. (a) | | 1,307 | 51,038 |
| Chemed Corp. (b) | | 9,725 | 1,989,054 |
| Community Health Systems, Inc. (a) | | 10,859 | 108,156 |
| Corvel Corp. (a) | | 11,191 | 531,013 |
| Cross Country Healthcare, Inc. (a) | | 1,343 | 17,338 |
| Diplomat Pharmacy, Inc. (a) | | 5,723 | 84,700 |
| HealthSouth Corp. | | 34,110 | 1,650,924 |
| Kindred Healthcare, Inc. | | 9,378 | 109,254 |
| Magellan Health Services, Inc. (a) | | 23,167 | 1,688,874 |
| Molina Healthcare, Inc. (a) | | 28,615 | 1,979,586 |
| National Healthcare Corp. | | 4,918 | 344,949 |
| Owens & Minor, Inc. (b) | | 56,180 | 1,808,434 |
| PharMerica Corp. (a) | | 33,195 | 871,369 |
| Tivity Health, Inc. (a) | | 37,289 | 1,485,967 |
| Triple-S Management Corp. (a) | | 18,445 | 311,905 |
| Wellcare Health Plans, Inc. (a) | | 7,444 | 1,336,645 |
| | | | 14,690,238 |
| Health Care Technology - 0.8% | | | |
| HMS Holdings Corp. (a) | | 49,570 | 917,045 |
| Quality Systems, Inc. (a) | | 83,827 | 1,442,663 |
| | | | 2,359,708 |
| Life Sciences Tools & Services - 0.7% | | | |
| Cambrex Corp. (a) | | 6,969 | 416,398 |
| INC Research Holdings, Inc. Class A (a) | | 10,570 | 618,345 |
| Luminex Corp. | | 10,784 | 227,758 |
| Medpace Holdings, Inc. | | 996 | 28,884 |
| PAREXEL International Corp. (a) | | 4,129 | 358,851 |
| PRA Health Sciences, Inc. (a) | | 7,694 | 577,127 |
| | | | 2,227,363 |
| Pharmaceuticals - 1.0% | | | |
| Aerie Pharmaceuticals, Inc. (a) | | 535 | 28,114 |
| Avexis, Inc. (a) | | 1,869 | 153,557 |
| Catalent, Inc. (a) | | 14,995 | 526,325 |
| Corcept Therapeutics, Inc. (a) | | 22,540 | 265,972 |
| Dermira, Inc. (a) | | 643 | 18,737 |
| Horizon Pharma PLC (a) | | 12,307 | 146,084 |
| Impax Laboratories, Inc. (a) | | 2,278 | 36,676 |
| Innoviva, Inc. (a) | | 856 | 10,957 |
| Nektar Therapeutics (a) | | 13,762 | 269,047 |
| Pacira Pharmaceuticals, Inc. (a) | | 2,832 | 135,086 |
| Phibro Animal Health Corp. Class A | | 6,598 | 244,456 |
| Prestige Brands Holdings, Inc. (a) | | 10,692 | 564,645 |
| Sucampo Pharmaceuticals, Inc. Class A (a)(b) | | 18,802 | 197,421 |
| Supernus Pharmaceuticals, Inc. (a) | | 3,794 | 163,521 |
| The Medicines Company (a)(b) | | 6,546 | 248,813 |
| Theravance Biopharma, Inc. (a)(b) | | 457 | 18,207 |
| | | | 3,027,618 |
|
| TOTAL HEALTH CARE | | | 45,489,127 |
|
| INDUSTRIALS - 12.5% | | | |
| Aerospace & Defense - 1.8% | | | |
| Astronics Corp. (a) | | 39,638 | 1,207,770 |
| Astronics Corp. Class B | | 7,789 | 238,188 |
| Curtiss-Wright Corp. | | 15,124 | 1,388,081 |
| DigitalGlobe, Inc. (a) | | 285 | 9,491 |
| Moog, Inc. Class A (a) | | 26,622 | 1,909,330 |
| National Presto Industries, Inc. | | 110 | 12,155 |
| Triumph Group, Inc. | | 14,791 | 467,396 |
| Wesco Aircraft Holdings, Inc. (a) | | 5,164 | 56,029 |
| | | | 5,288,440 |
| Airlines - 1.1% | | | |
| Hawaiian Holdings, Inc. (a) | | 38,784 | 1,820,909 |
| JetBlue Airways Corp. (a) | | 63,940 | 1,459,750 |
| | | | 3,280,659 |
| Building Products - 0.3% | | | |
| American Woodmark Corp. (a) | | 4,006 | 382,773 |
| NCI Building Systems, Inc. (a) | | 15,120 | 252,504 |
| Ply Gem Holdings, Inc. (a) | | 7,321 | 131,412 |
| Universal Forest Products, Inc. | | 3,155 | 275,463 |
| | | | 1,042,152 |
| Commercial Services & Supplies - 3.7% | | | |
| ARC Document Solutions, Inc. (a) | | 8,508 | 35,393 |
| Brady Corp. Class A | | 15,867 | 537,891 |
| Deluxe Corp. | | 28,582 | 1,978,446 |
| Ennis, Inc. | | 9,290 | 177,439 |
| Essendant, Inc. | | 35,653 | 528,734 |
| Herman Miller, Inc. | | 49,926 | 1,517,750 |
| HNI Corp. | | 3,805 | 151,705 |
| Kimball International, Inc. Class B | | 73,865 | 1,232,807 |
| Knoll, Inc. | | 52,989 | 1,062,429 |
| LSC Communications, Inc. | | 8,141 | 174,217 |
| Msa Safety, Inc. | | 6,877 | 558,206 |
| NL Industries, Inc. (a) | | 1,554 | 10,956 |
| Quad/Graphics, Inc. | | 61,138 | 1,401,283 |
| R.R. Donnelley & Sons Co. | | 638 | 8,001 |
| SP Plus Corp. (a) | | 427 | 13,045 |
| Steelcase, Inc. Class A | | 87,087 | 1,219,218 |
| UniFirst Corp. | | 1,934 | 272,114 |
| VSE Corp. | | 545 | 24,514 |
| | | | 10,904,148 |
| Construction & Engineering - 1.0% | | | |
| Argan, Inc. | | 26,055 | 1,563,300 |
| Chicago Bridge & Iron Co. NV | | 25,344 | 500,037 |
| EMCOR Group, Inc. | | 14,699 | 961,021 |
| MYR Group, Inc. (a) | | 2,143 | 66,476 |
| | | | 3,090,834 |
| Electrical Equipment - 0.4% | | | |
| Allied Motion Technologies, Inc. | | 2,496 | 67,941 |
| EnerSys | | 16,576 | 1,200,931 |
| | | | 1,268,872 |
| Machinery - 1.8% | | | |
| Alamo Group, Inc. | | 6,687 | 607,246 |
| Global Brass & Copper Holdings, Inc. | | 25,205 | 770,013 |
| Greenbrier Companies, Inc. (b) | | 31,123 | 1,439,439 |
| Hurco Companies, Inc. | | 6,004 | 208,639 |
| Kadant, Inc. | | 5,987 | 450,222 |
| Spartan Motors, Inc. | | 5,429 | 48,047 |
| Wabash National Corp. (b) | | 80,075 | 1,760,049 |
| | | | 5,283,655 |
| Marine - 0.3% | | | |
| Costamare, Inc. (b) | | 107,568 | 786,322 |
| Professional Services - 1.8% | | | |
| Barrett Business Services, Inc. | | 4,384 | 251,159 |
| ICF International, Inc. (a) | | 4,196 | 197,632 |
| Insperity, Inc. | | 19,593 | 1,391,103 |
| Kelly Services, Inc. Class A (non-vtg.) | | 18,784 | 421,701 |
| Kforce, Inc. | | 17,698 | 346,881 |
| Resources Connection, Inc. | | 54,210 | 742,677 |
| RPX Corp. (a) | | 118,478 | 1,652,768 |
| TrueBlue, Inc. (a) | | 11,030 | 292,295 |
| | | | 5,296,216 |
| Road & Rail - 0.1% | | | |
| Celadon Group, Inc. | | 9,190 | 28,949 |
| Roadrunner Transportation Systems, Inc. (a) | | 17,910 | 130,206 |
| | | | 159,155 |
| Trading Companies & Distributors - 0.2% | | | |
| Applied Industrial Technologies, Inc. | | 3,761 | 222,087 |
| Rush Enterprises, Inc. Class A (a) | | 12,785 | 475,346 |
| | | | 697,433 |
|
| TOTAL INDUSTRIALS | | | 37,097,886 |
|
| INFORMATION TECHNOLOGY - 17.8% | | | |
| Communications Equipment - 2.3% | | | |
| ADTRAN, Inc. | | 684 | 14,125 |
| Black Box Corp. | | 6,685 | 57,157 |
| Ciena Corp. (a) | | 21,951 | 549,214 |
| Communications Systems, Inc. | | 2,778 | 12,029 |
| Digi International, Inc. (a) | | 4,489 | 45,563 |
| Finisar Corp. (a) | | 37,252 | 967,807 |
| InterDigital, Inc. | | 22,458 | 1,736,003 |
| NETGEAR, Inc. (a) | | 31,992 | 1,378,855 |
| Oclaro, Inc. (a)(b) | | 63,014 | 588,551 |
| Plantronics, Inc. | | 25,174 | 1,316,852 |
| | | | 6,666,156 |
| Electronic Equipment & Components - 5.7% | | | |
| Anixter International, Inc. (a) | | 11,901 | 930,658 |
| Bel Fuse, Inc. Class B (non-vtg.) | | 1,465 | 36,186 |
| Benchmark Electronics, Inc. (a) | | 48,879 | 1,578,792 |
| Cardtronics PLC | | 8,773 | 288,281 |
| Fitbit, Inc. (a) | | 11,087 | 58,872 |
| Insight Enterprises, Inc. (a) | | 25,595 | 1,023,544 |
| Kimball Electronics, Inc. (a) | | 45,923 | 828,910 |
| Methode Electronics, Inc. Class A | | 34,647 | 1,427,456 |
| PC Connection, Inc. | | 3,946 | 106,779 |
| PC Mall, Inc. (a) | | 1,900 | 35,625 |
| Plexus Corp. (a) | | 20,980 | 1,102,919 |
| Sanmina Corp. (a) | | 41,183 | 1,569,072 |
| ScanSource, Inc. (a) | | 42,158 | 1,698,967 |
| SYNNEX Corp. | | 14,931 | 1,791,123 |
| Tech Data Corp. (a) | | 19,448 | 1,964,248 |
| TTM Technologies, Inc. (a)(b) | | 69,328 | 1,203,534 |
| Vishay Intertechnology, Inc. (b) | | 79,460 | 1,319,036 |
| | | | 16,964,002 |
| Internet Software & Services - 0.6% | | | |
| Blucora, Inc. (a) | | 1,987 | 42,124 |
| DHI Group, Inc. (a) | | 31,309 | 89,231 |
| Global Sources Ltd. (a) | | 19,911 | 398,220 |
| MeetMe, Inc. (a)(b) | | 176,625 | 891,956 |
| Nutanix, Inc. Class A (a) | | 22,428 | 451,924 |
| WebMD Health Corp. (a) | | 560 | 32,844 |
| | | | 1,906,299 |
| IT Services - 2.0% | | | |
| Computer Task Group, Inc. | | 3,424 | 19,140 |
| Convergys Corp. (b) | | 35,514 | 844,523 |
| CSG Systems International, Inc. | | 40,607 | 1,647,832 |
| EVERTEC, Inc. | | 46,469 | 803,914 |
| Hackett Group, Inc. | | 21,394 | 331,607 |
| NCI, Inc. Class A (a) | | 7,271 | 153,418 |
| Science Applications International Corp. | | 8,184 | 568,133 |
| Sykes Enterprises, Inc. (a) | | 31,134 | 1,043,923 |
| Syntel, Inc. (b) | | 18,653 | 316,355 |
| Travelport Worldwide Ltd. | | 24,261 | 333,831 |
| | | | 6,062,676 |
| Semiconductors & Semiconductor Equipment - 5.7% | | | |
| Advanced Energy Industries, Inc. (a) | | 10,625 | 687,331 |
| Advanced Micro Devices, Inc. (a)(b) | | 11,085 | 138,341 |
| Alpha & Omega Semiconductor Ltd. (a) | | 14,753 | 245,933 |
| Amkor Technology, Inc. (a) | | 130,329 | 1,273,314 |
| Brooks Automation, Inc. | | 54,506 | 1,182,235 |
| Cabot Microelectronics Corp. | | 24,236 | 1,789,344 |
| Cirrus Logic, Inc. (a) | | 32,663 | 2,048,623 |
| Cohu, Inc. | | 13,629 | 214,520 |
| Diodes, Inc. (a) | | 3,291 | 79,083 |
| Entegris, Inc. (a) | | 21,268 | 466,833 |
| Experi Corp. | | 9,910 | 295,318 |
| IXYS Corp. | | 39,285 | 646,238 |
| MKS Instruments, Inc. | | 27,795 | 1,870,604 |
| Nanometrics, Inc. (a) | | 31,609 | 799,392 |
| Photronics, Inc. (a) | | 135,948 | 1,277,911 |
| Rudolph Technologies, Inc. (a) | | 58,384 | 1,334,074 |
| Semtech Corp. (a) | | 6,152 | 219,934 |
| Silicon Laboratories, Inc. (a) | | 13,173 | 900,375 |
| Synaptics, Inc. (a)(b) | | 19,100 | 987,661 |
| Ultra Clean Holdings, Inc. (a) | | 20,428 | 383,025 |
| | | | 16,840,089 |
| Software - 1.3% | | | |
| Aspen Technology, Inc. (a) | | 37,035 | 2,046,554 |
| Barracuda Networks, Inc. (a) | | 32,068 | 739,488 |
| Progress Software Corp. | | 26,872 | 830,076 |
| QAD, Inc. Class B | | 1,619 | 43,470 |
| Synchronoss Technologies, Inc. (a) | | 11,440 | 188,188 |
| The Rubicon Project, Inc. (a) | | 4,143 | 21,295 |
| Zedge, Inc. (a) | | 8,170 | 18,056 |
| Zix Corp. (a) | | 4,725 | 26,885 |
| | | | 3,914,012 |
| Technology Hardware, Storage & Peripherals - 0.2% | | | |
| Quantum Corp. (a) | | 3,075 | 24,016 |
| Super Micro Computer, Inc. (a) | | 20,781 | 512,252 |
| | | | 536,268 |
|
| TOTAL INFORMATION TECHNOLOGY | | | 52,889,502 |
|
| MATERIALS - 4.0% | | | |
| Chemicals - 1.9% | | | |
| Chase Corp. | | 3,402 | 362,993 |
| FutureFuel Corp. | | 62,257 | 939,458 |
| Innophos Holdings, Inc. | | 6,627 | 290,528 |
| KMG Chemicals, Inc. | | 1,689 | 82,204 |
| Kronos Worldwide, Inc. | | 21,771 | 396,668 |
| Minerals Technologies, Inc. | | 6,421 | 470,017 |
| PolyOne Corp. | | 1,347 | 52,183 |
| Rayonier Advanced Materials, Inc. (b) | | 47,169 | 741,497 |
| Stepan Co. | | 1,553 | 135,328 |
| The Chemours Co. LLC | | 15,328 | 581,238 |
| Trecora Resources (a) | | 982 | 11,048 |
| Trinseo SA | | 23,547 | 1,617,679 |
| Tronox Ltd. Class A | | 5,120 | 77,414 |
| Valhi, Inc. | | 70 | 209 |
| | | | 5,758,464 |
| Containers & Packaging - 0.1% | | | |
| Greif, Inc. Class A | | 4,700 | 262,166 |
| Myers Industries, Inc. | | 1,366 | 24,520 |
| UFP Technologies, Inc. (a) | | 425 | 12,028 |
| | | | 298,714 |
| Metals & Mining - 0.8% | | | |
| AK Steel Holding Corp. (a) | | 58,011 | 381,132 |
| Atkore International Group, Inc. | | 42,505 | 958,488 |
| Cliffs Natural Resources, Inc. (a) | | 27,720 | 191,822 |
| Olympic Steel, Inc. | | 835 | 16,266 |
| Schnitzer Steel Industries, Inc. Class A | | 4,858 | 122,422 |
| Worthington Industries, Inc. | | 16,028 | 804,926 |
| | | | 2,475,056 |
| Paper & Forest Products - 1.2% | | | |
| Louisiana-Pacific Corp. (a) | | 85,770 | 2,067,915 |
| Schweitzer-Mauduit International, Inc. | | 35,851 | 1,334,733 |
| | | | 3,402,648 |
|
| TOTAL MATERIALS | | | 11,934,882 |
|
| REAL ESTATE - 7.3% | | | |
| Equity Real Estate Investment Trusts (REITs) - 7.3% | | | |
| Ashford Hospitality Trust, Inc. | | 9,330 | 56,726 |
| Care Capital Properties, Inc. | | 1,649 | 44,028 |
| CBL & Associates Properties, Inc. (b) | | 208,095 | 1,754,241 |
| Chesapeake Lodging Trust | | 24,315 | 594,988 |
| CorEnergy Infrastructure Trust, Inc. (b) | | 9,004 | 302,444 |
| DiamondRock Hospitality Co. | | 17,231 | 188,679 |
| Four Corners Property Trust, Inc. | | 64,737 | 1,625,546 |
| Hersha Hospitality Trust | | 10,441 | 193,263 |
| InfraReit, Inc. | | 48,023 | 919,640 |
| LaSalle Hotel Properties (SBI) | | 66,877 | 1,992,935 |
| Medical Properties Trust, Inc. | | 51,936 | 668,416 |
| Pebblebrook Hotel Trust (b) | | 7,339 | 236,609 |
| Potlatch Corp. | | 23,697 | 1,082,953 |
| PS Business Parks, Inc. | | 13,477 | 1,784,220 |
| RLJ Lodging Trust | | 92,911 | 1,846,142 |
| Ryman Hospitality Properties, Inc. | | 20,102 | 1,286,729 |
| Sabra Health Care REIT, Inc. (b) | | 67,740 | 1,632,534 |
| Summit Hotel Properties, Inc. | | 92,372 | 1,722,738 |
| Sunstone Hotel Investors, Inc. | | 115,682 | 1,864,794 |
| WP Glimcher, Inc. | | 13,808 | 115,573 |
| Xenia Hotels & Resorts, Inc. | | 84,426 | 1,635,332 |
| | | | 21,548,530 |
| Real Estate Management & Development - 0.0% | | | |
| Gyrodyne LLC | | 126 | 2,583 |
| Marcus & Millichap, Inc. (a) | | 4,711 | 124,182 |
| | | | 126,765 |
|
| TOTAL REAL ESTATE | | | 21,675,295 |
|
| TELECOMMUNICATION SERVICES - 0.4% | | | |
| Diversified Telecommunication Services - 0.3% | | | |
| Frontier Communications Corp. (b) | | 190,445 | 220,916 |
| IDT Corp. Class B | | 41,871 | 601,686 |
| | | | 822,602 |
| Wireless Telecommunication Services - 0.1% | | | |
| Spok Holdings, Inc. | | 15,619 | 276,456 |
|
| TOTAL TELECOMMUNICATION SERVICES | | | 1,099,058 |
|
| UTILITIES - 2.3% | | | |
| Electric Utilities - 0.6% | | | |
| Allete, Inc. | | 21,546 | 1,544,417 |
| Portland General Electric Co. | | 4,696 | 214,560 |
| | | | 1,758,977 |
| Gas Utilities - 0.8% | | | |
| Northwest Natural Gas Co. | | 1,519 | 90,912 |
| ONE Gas, Inc. | | 19,111 | 1,334,139 |
| Southwest Gas Holdings, Inc. | | 12,555 | 917,268 |
| WGL Holdings, Inc. | | 2,240 | 186,883 |
| | | | 2,529,202 |
| Independent Power and Renewable Electricity Producers - 0.6% | | | |
| NRG Yield, Inc. Class A | | 34,063 | 581,115 |
| Ormat Technologies, Inc. | | 19,180 | 1,125,482 |
| | | | 1,706,597 |
| Multi-Utilities - 0.1% | | | |
| NorthWestern Energy Corp. | | 4,665 | 284,658 |
| Water Utilities - 0.2% | | | |
| American States Water Co. | | 9,707 | 460,209 |
| Consolidated Water Co., Inc. | | 1,097 | 13,603 |
| | | | 473,812 |
|
| TOTAL UTILITIES | | | 6,753,246 |
|
| TOTAL COMMON STOCKS | | | |
| (Cost $242,012,102) | | | 285,729,799 |
| | | Principal Amount | Value |
|
| U.S. Treasury Obligations - 0.3% | | | |
| U.S. Treasury Bills, yield at date of purchase 0.56% 8/17/17 (c) | | | |
| (Cost $999,278) | | 1,000,000 | 998,880 |
| | | Shares | Value |
|
| Money Market Funds - 19.0% | | | |
| Fidelity Cash Central Fund, 1.10% (d) | | 9,077,756 | $9,079,571 |
| Fidelity Securities Lending Cash Central Fund 1.09% (d)(e) | | 47,218,633 | 47,223,355 |
| TOTAL MONEY MARKET FUNDS | | | |
| (Cost $56,300,992) | | | 56,302,926 |
| TOTAL INVESTMENT PORTFOLIO - 115.5% | | | |
| (Cost $299,312,372) | | | 343,031,605 |
| NET OTHER ASSETS (LIABILITIES) - (15.5)% | | | (46,138,550) |
| NET ASSETS - 100% | | | $296,893,055 |
| Futures Contracts | | | |
| | Expiration Date | Underlying Face Amount at Value | Unrealized Appreciation/(Depreciation) |
| Purchased | | | |
| Equity Index Contracts | | | |
| 159 ICE Russell 2000 Mini Contracts (United States) | Sept. 2017 | 11,243,685 | $28,800 |
The face value of futures purchased as a percentage of Net Assets is 3.8%
For the period, the average monthly underlying face amount at value for futures contracts in the aggregate was $5,762,712.
Legend
(a) Non-income producing
(b) Security or a portion of the security is on loan at period end.
(c) Security or a portion of the security was pledged to cover margin requirements for futures contracts. At period end, the value of securities pledged amounted to $529,406.
(d) Affiliated fund that is generally available only to investment companies and other accounts managed by Fidelity Investments. The rate quoted is the annualized seven-day yield of the fund at period end. A complete unaudited listing of the fund's holdings as of its most recent quarter end is available upon request. In addition, each Fidelity Central Fund's financial statements are available on the SEC's website or upon request.
(e) Investment made with cash collateral received from securities on loan.
Affiliated Central Funds
Information regarding fiscal year to date income earned by the Fund from investments in Fidelity Central Funds is as follows:
| Fund | Income earned |
| Fidelity Cash Central Fund | $12,153 |
| Fidelity Securities Lending Cash Central Fund | 127,093 |
| Total | $139,246 |
Investment Valuation
The following is a summary of the inputs used, as of June 30, 2017, involving the Fund's assets and liabilities carried at fair value. The inputs or methodology used for valuing securities may not be an indication of the risk associated with investing in those securities. For more information on valuation inputs, and their aggregation into the levels used below, please refer to the Investment Valuation section in the accompanying Notes to Financial Statements.
| | Valuation Inputs at Reporting Date: |
| Description | Total | Level 1 | Level 2 | Level 3 |
| Investments in Securities: | | | | |
| Equities: | | | | |
| Consumer Discretionary | $41,037,194 | $41,037,194 | $-- | $-- |
| Consumer Staples | 12,912,857 | 12,912,857 | -- | -- |
| Energy | 4,721,241 | 4,721,241 | -- | -- |
| Financials | 50,119,511 | 50,119,511 | -- | -- |
| Health Care | 45,489,127 | 45,451,901 | -- | 37,226 |
| Industrials | 37,097,886 | 37,097,886 | -- | -- |
| Information Technology | 52,889,502 | 52,889,502 | -- | -- |
| Materials | 11,934,882 | 11,934,882 | -- | -- |
| Real Estate | 21,675,295 | 21,675,295 | -- | -- |
| Telecommunication Services | 1,099,058 | 1,099,058 | -- | -- |
| Utilities | 6,753,246 | 6,753,246 | -- | -- |
| U.S. Government and Government Agency Obligations | 998,880 | -- | 998,880 | -- |
| Money Market Funds | 56,302,926 | 56,302,926 | -- | -- |
| Total Investments in Securities: | $343,031,605 | $341,995,499 | $998,880 | $37,226 |
| Derivative Instruments: | | | | |
| Assets | | | | |
| Futures Contracts | $28,800 | $28,800 | $-- | $-- |
| Total Assets | $28,800 | $28,800 | $-- | $-- |
| Total Derivative Instruments: | $28,800 | $28,800 | $-- | $-- |
Value of Derivative Instruments
The following table is a summary of the Fund's value of derivative instruments by primary risk exposure as of June 30, 2017. For additional information on derivative instruments, please refer to the Derivative Instruments section in the accompanying Notes to Financial Statements.
| Primary Risk Exposure / Derivative Type | Value |
| | Asset | Liability |
| Equity Risk | | |
| Futures Contracts(a) | $28,800 | $0 |
| Total Equity Risk | 28,800 | 0 |
| Total Value of Derivatives | $28,800 | $0 |
(a) Reflects gross cumulative appreciation (depreciation) on futures contracts as presented in the Schedule of Investments. In the Statement of Assets and Liabilities, the period end daily variation margin is included in receivable or payable for daily variation margin for derivative instruments, and the net cumulative appreciation (depreciation) is included in net unrealized appreciation (depreciation).
See accompanying notes which are an integral part of the financial statements.
Financial Statements
Statement of Assets and Liabilities
| | | June 30, 2017 (Unaudited) |
| Assets | | |
Investment in securities, at value (including securities loaned of $45,782,068) — See accompanying schedule:
Unaffiliated issuers (cost $243,011,380) | $286,728,679 | |
| Fidelity Central Funds (cost $56,300,992) | 56,302,926 | |
| Total Investments (cost $299,312,372) | | $343,031,605 |
| Cash | | 470,200 |
| Receivable for investments sold | | 3,991,519 |
| Receivable for fund shares sold | | 301 |
| Dividends receivable | | 469,669 |
| Distributions receivable from Fidelity Central Funds | | 12,563 |
| Total assets | | 347,975,857 |
| Liabilities | | |
| Payable for investments purchased | $2,867,696 | |
| Payable for fund shares redeemed | 706,686 | |
| Accrued management fee | 173,214 | |
| Distribution and service plan fees payable | 1,589 | |
| Payable for daily variation margin for derivative instruments | 30,547 | |
| Other affiliated payables | 43,656 | |
| Other payables and accrued expenses | 36,189 | |
| Collateral on securities loaned | 47,223,225 | |
| Total liabilities | | 51,082,802 |
| Net Assets | | $296,893,055 |
| Net Assets consist of: | | |
| Paid in capital | | $243,486,021 |
| Undistributed net investment income | | 942,850 |
| Accumulated undistributed net realized gain (loss) on investments | | 8,716,115 |
| Net unrealized appreciation (depreciation) on investments and assets and liabilities in foreign currencies | | 43,748,069 |
| Net Assets | | $296,893,055 |
| Initial Class: | | |
| Net Asset Value, offering price and redemption price per share ($34,181,676 ÷ 2,142,841 shares) | | $15.95 |
| Service Class: | | |
| Net Asset Value, offering price and redemption price per share ($248,064 ÷ 15,510 shares) | | $15.99 |
| Service Class 2: | | |
| Net Asset Value, offering price and redemption price per share ($7,836,849 ÷ 490,474 shares) | | $15.98 |
| Investor Class: | | |
| Net Asset Value, offering price and redemption price per share ($254,626,466 ÷ 16,028,487 shares) | | $15.89 |
See accompanying notes which are an integral part of the financial statements.
Statement of Operations
| | | Six months ended June 30, 2017 (Unaudited) |
| Investment Income | | |
| Dividends | | $2,274,583 |
| Interest | | 2,694 |
| Income from Fidelity Central Funds (including $127,093 from security lending) | | 139,246 |
| Total income | | 2,416,523 |
| Expenses | | |
| Management fee | $1,090,484 | |
| Transfer agent fees | 211,839 | |
| Distribution and service plan fees | 8,363 | |
| Accounting and security lending fees | 63,385 | |
| Custodian fees and expenses | 45,408 | |
| Independent trustees' fees and expenses | 621 | |
| Audit | 27,052 | |
| Legal | 2,152 | |
| Miscellaneous | 1,027 | |
| Total expenses before reductions | 1,450,331 | |
| Expense reductions | (1,360) | 1,448,971 |
| Net investment income (loss) | | 967,552 |
| Realized and Unrealized Gain (Loss) | | |
| Net realized gain (loss) on: | | |
| Investment securities: | | |
| Unaffiliated issuers | 10,929,373 | |
| Fidelity Central Funds | (1,148) | |
| Futures contracts | (81,494) | |
| Total net realized gain (loss) | | 10,846,731 |
Change in net unrealized appreciation (depreciation) on:
Investment securities | (11,089,971) | |
| Assets and liabilities in foreign currencies | 36 | |
| Futures contracts | 34,824 | |
| Total change in net unrealized appreciation (depreciation) | | (11,055,111) |
| Net gain (loss) | | (208,380) |
| Net increase (decrease) in net assets resulting from operations | | $759,172 |
See accompanying notes which are an integral part of the financial statements.
Statement of Changes in Net Assets
| | Six months ended June 30, 2017 (Unaudited) | Year ended December 31, 2016 |
| Increase (Decrease) in Net Assets | | |
| Operations | | |
| Net investment income (loss) | $967,552 | $1,926,337 |
| Net realized gain (loss) | 10,846,731 | 6,721,795 |
| Change in net unrealized appreciation (depreciation) | (11,055,111) | 41,767,033 |
| Net increase (decrease) in net assets resulting from operations | 759,172 | 50,415,165 |
| Distributions to shareholders from net investment income | (548,077) | (1,477,372) |
| Distributions to shareholders from net realized gain | (6,715,859) | (16,439,954) |
| Total distributions | (7,263,936) | (17,917,326) |
| Share transactions - net increase (decrease) | (8,218,595) | 54,712,795 |
| Total increase (decrease) in net assets | (14,723,359) | 87,210,634 |
| Net Assets | | |
| Beginning of period | 311,616,414 | 224,405,780 |
| End of period | $296,893,055 | $311,616,414 |
| Other Information | | |
| Undistributed net investment income end of period | $942,850 | $523,375 |
See accompanying notes which are an integral part of the financial statements.
Financial Highlights — VIP Disciplined Small Cap Portfolio Initial Class
| | Six months ended (Unaudited) June 30, | Years ended December 31, | | | | |
| | 2017 | 2016 | 2015 | 2014 | 2013 | 2012 |
| Selected Per–Share Data | | | | | | |
| Net asset value, beginning of period | $16.25 | $14.52 | $14.94 | $15.40 | $12.03 | $10.94 |
| Income from Investment Operations | | | | | | |
| Net investment income (loss)A | .06 | .13 | .10 | .06 | .09 | .22 |
| Net realized and unrealized gain (loss) | –B,C | 2.75 | (.40) | .69 | 4.44 | 1.83 |
| Total from investment operations | .06 | 2.88 | (.30) | .75 | 4.53 | 2.05 |
| Distributions from net investment income | (.03) | (.09) | (.09) | (.07) | (.07) | (.25) |
| Distributions from net realized gain | (.33) | (1.06) | (.03) | (1.14) | (1.09) | (.71) |
| Total distributions | (.36) | (1.15) | (.12) | (1.21) | (1.16) | (.96) |
| Net asset value, end of period | $15.95 | $16.25 | $14.52 | $14.94 | $15.40 | $12.03 |
| Total ReturnD,E,F | .34% | 22.68% | (1.99)% | 5.28% | 38.35% | 19.00% |
| Ratios to Average Net AssetsG,H | | | | | | |
| Expenses before reductions | .85%I | .86% | .85% | .85% | .86% | .91% |
| Expenses net of fee waivers, if any | .85%I | .86% | .84% | .85% | .86% | .91% |
| Expenses net of all reductions | .85%I | .86% | .84% | .85% | .86% | .91% |
| Net investment income (loss) | .69%I | .90% | .68% | .41% | .66% | 1.80% |
| Supplemental Data | | | | | | |
| Net assets, end of period (000 omitted) | $34,182 | $41,185 | $30,227 | $33,658 | $45,699 | $20,183 |
| Portfolio turnover rateJ | 87%I | 83% | 96% | 100% | 108% | 99% |
A Calculated based on average shares outstanding during the period.
B The amount shown for a share outstanding does not correspond with the aggregate net gain (loss) on investments for the period due to the timing of sales and repurchases of shares in relation to fluctuating market values of the investments of the Fund.
C Amount represents less than $.005 per share.
D Total returns for periods of less than one year are not annualized.
E Total returns do not reflect charges attributable to your insurance company's separate account. Inclusion of these charges would reduce the total returns shown.
F Total returns would have been lower if certain expenses had not been reduced during the applicable periods shown.
G Fees and expenses of any underlying Fidelity Central Funds are not included in the Fund's expense ratio. The Fund indirectly bears its proportionate share of the expenses of any underlying Fidelity Central Funds.
H Expense ratios reflect operating expenses of the class. Expenses before reductions do not reflect amounts reimbursed by the investment adviser or reductions from expense offset arrangements and do not represent the amount paid by the class during periods when reimbursements or reductions occur. Expenses net of fee waivers reflect expenses after reimbursement by the investment adviser but prior to reductions from expense offset arrangements. Expenses net of all reductions represent the net expenses paid by the class.
I Annualized
J Amount does not include the portfolio activity of any underlying Fidelity Central Funds.
See accompanying notes which are an integral part of the financial statements.
Financial Highlights — VIP Disciplined Small Cap Portfolio Service Class
| | Six months ended (Unaudited) June 30, | Years ended December 31, | | | | |
| | 2017 | 2016 | 2015 | 2014 | 2013 | 2012 |
| Selected Per–Share Data | | | | | | |
| Net asset value, beginning of period | $16.29 | $14.56 | $14.98 | $15.44 | $12.06 | $10.96 |
| Income from Investment Operations | | | | | | |
| Net investment income (loss)A | .05 | .11 | .09 | .05 | .08 | .21 |
| Net realized and unrealized gain (loss) | .01B | 2.75 | (.40) | .68 | 4.44 | 1.84 |
| Total from investment operations | .06 | 2.86 | (.31) | .73 | 4.52 | 2.05 |
| Distributions from net investment income | (.03) | (.07) | (.08) | (.05) | (.05) | (.24) |
| Distributions from net realized gain | (.33) | (1.06) | (.03) | (1.14) | (1.09) | (.71) |
| Total distributions | (.36) | (1.13) | (.11) | (1.19) | (1.14) | (.95) |
| Net asset value, end of period | $15.99 | $16.29 | $14.56 | $14.98 | $15.44 | $12.06 |
| Total ReturnC,D,E | .33% | 22.49% | (2.09)% | 5.19% | 38.19% | 18.97% |
| Ratios to Average Net AssetsF,G | | | | | | |
| Expenses before reductions | .95%H | .96% | .95% | .95% | .95% | .99% |
| Expenses net of fee waivers, if any | .95%H | .96% | .94% | .95% | .95% | .99% |
| Expenses net of all reductions | .95%H | .96% | .94% | .95% | .95% | .99% |
| Net investment income (loss) | .59%H | .80% | .58% | .32% | .57% | 1.72% |
| Supplemental Data | | | | | | |
| Net assets, end of period (000 omitted) | $248 | $266 | $311 | $320 | $329 | $279 |
| Portfolio turnover rateI | 87%H | 83% | 96% | 100% | 108% | 99% |
A Calculated based on average shares outstanding during the period.
B The amount shown for a share outstanding does not correspond with the aggregate net gain (loss) on investments for the period due to the timing of sales and repurchases of shares in relation to fluctuating market values of the investments of the Fund.
C Total returns for periods of less than one year are not annualized.
D Total returns do not reflect charges attributable to your insurance company's separate account. Inclusion of these charges would reduce the total returns shown.
E Total returns would have been lower if certain expenses had not been reduced during the applicable periods shown.
F Fees and expenses of any underlying Fidelity Central Funds are not included in the Fund's expense ratio. The Fund indirectly bears its proportionate share of the expenses of any underlying Fidelity Central Funds.
G Expense ratios reflect operating expenses of the class. Expenses before reductions do not reflect amounts reimbursed by the investment adviser or reductions from expense offset arrangements and do not represent the amount paid by the class during periods when reimbursements or reductions occur. Expenses net of fee waivers reflect expenses after reimbursement by the investment adviser but prior to reductions from expense offset arrangements. Expenses net of all reductions represent the net expenses paid by the class.
H Annualized
I Amount does not include the portfolio activity of any underlying Fidelity Central Funds.
See accompanying notes which are an integral part of the financial statements.
Financial Highlights — VIP Disciplined Small Cap Portfolio Service Class 2
| | Six months ended (Unaudited) June 30, | Years ended December 31, | | | | |
| | 2017 | 2016 | 2015 | 2014 | 2013 | 2012 |
| Selected Per–Share Data | | | | | | |
| Net asset value, beginning of period | $16.29 | $14.58 | $14.99 | $15.45 | $12.07 | $10.96 |
| Income from Investment Operations | | | | | | |
| Net investment income (loss)A | .04 | .09 | .07 | .02 | .05 | .18 |
| Net realized and unrealized gain (loss) | .01B | 2.75 | (.40) | .68 | 4.45 | 1.83 |
| Total from investment operations | .05 | 2.84 | (.33) | .70 | 4.50 | 2.01 |
| Distributions from net investment income | (.03) | (.07) | (.05) | (.02) | (.03) | (.19) |
| Distributions from net realized gain | (.33) | (1.06) | (.03) | (1.14) | (1.09) | (.71) |
| Total distributions | (.36) | (1.13) | (.08) | (1.16) | (1.12) | (.90) |
| Net asset value, end of period | $15.98 | $16.29 | $14.58 | $14.99 | $15.45 | $12.07 |
| Total ReturnC,D,E | .26% | 22.31% | (2.18)% | 4.93% | 37.96% | 18.58% |
| Ratios to Average Net AssetsF,G | | | | | | |
| Expenses before reductions | 1.10%H | 1.11% | 1.10% | 1.14% | 1.15% | 1.23% |
| Expenses net of fee waivers, if any | 1.10%H | 1.11% | 1.10% | 1.14% | 1.15% | 1.23% |
| Expenses net of all reductions | 1.10%H | 1.11% | 1.10% | 1.14% | 1.15% | 1.23% |
| Net investment income (loss) | .44%H | .65% | .43% | .12% | .37% | 1.48% |
| Supplemental Data | | | | | | |
| Net assets, end of period (000 omitted) | $7,837 | $6,403 | $3,198 | $3,097 | $4,115 | $1,624 |
| Portfolio turnover rateI | 87%H | 83% | 96% | 100% | 108% | 99% |
A Calculated based on average shares outstanding during the period.
B The amount shown for a share outstanding does not correspond with the aggregate net gain (loss) on investments for the period due to the timing of sales and repurchases of shares in relation to fluctuating market values of the investments of the Fund
C Total returns for periods of less than one year are not annualized.
D Total returns do not reflect charges attributable to your insurance company's separate account. Inclusion of these charges would reduce the total returns shown.
E Total returns would have been lower if certain expenses had not been reduced during the applicable periods shown.
F Fees and expenses of any underlying Fidelity Central Funds are not included in the Fund's expense ratio. The Fund indirectly bears its proportionate share of the expenses of any underlying Fidelity Central Funds.
G Expense ratios reflect operating expenses of the class. Expenses before reductions do not reflect amounts reimbursed by the investment adviser or reductions from expense offset arrangements and do not represent the amount paid by the class during periods when reimbursements or reductions occur. Expenses net of fee waivers reflect expenses after reimbursement by the investment adviser but prior to reductions from expense offset arrangements. Expenses net of all reductions represent the net expenses paid by the class.
H Annualized
I Amount does not include the portfolio activity of any underlying Fidelity Central Funds.
See accompanying notes which are an integral part of the financial statements.
Financial Highlights — VIP Disciplined Small Cap Portfolio Investor Class
| | Six months ended (Unaudited) June 30, | Years ended December 31, | | | | |
| | 2017 | 2016 | 2015 | 2014 | 2013 | 2012 |
| Selected Per–Share Data | | | | | | |
| Net asset value, beginning of period | $16.19 | $14.48 | $14.89 | $15.36 | $12.01 | $10.92 |
| Income from Investment Operations | | | | | | |
| Net investment income (loss)A | .05 | .11 | .09 | .05 | .08 | .21 |
| Net realized and unrealized gain (loss) | .01B | 2.74 | (.39) | .68 | 4.42 | 1.83 |
| Total from investment operations | .06 | 2.85 | (.30) | .73 | 4.50 | 2.04 |
| Distributions from net investment income | (.03) | (.08) | (.08) | (.05) | (.06) | (.24) |
| Distributions from net realized gain | (.33) | (1.06) | (.03) | (1.14) | (1.09) | (.71) |
| Total distributions | (.36) | (1.14) | (.11) | (1.20)C | (1.15) | (.95) |
| Net asset value, end of period | $15.89 | $16.19 | $14.48 | $14.89 | $15.36 | $12.01 |
| Total ReturnD,E,F | .34% | 22.54% | (2.00)% | 5.15% | 38.18% | 18.96% |
| Ratios to Average Net AssetsG,H | | | | | | |
| Expenses before reductions | .93%I | .94% | .93% | .93% | .94% | .98% |
| Expenses net of fee waivers, if any | .93%I | .94% | .92% | .93% | .93% | .98% |
| Expenses net of all reductions | .93%I | .94% | .92% | .93% | .93% | .98% |
| Net investment income (loss) | .61%I | .82% | .60% | .34% | .58% | 1.73% |
| Supplemental Data | | | | | | |
| Net assets, end of period (000 omitted) | $254,626 | $263,763 | $190,669 | $173,570 | $184,956 | $65,042 |
| Portfolio turnover rateJ | 87%I | 83% | 96% | 100% | 108% | 99% |
A Calculated based on average shares outstanding during the period.
B The amount shown for a share outstanding does not correspond with the aggregate net gain (loss) on investments for the period due to the timing of sales and repurchases of shares in relation to fluctuating market values of the investments of the Fund.
C Total distributions of $1.20 per share is comprised of distributions from net investment income of $.054 and distributions from net realized gain of $1.141 per share.
D Total returns for periods of less than one year are not annualized.
E Total returns do not reflect charges attributable to your insurance company's separate account. Inclusion of these charges would reduce the total returns shown.
F Total returns would have been lower if certain expenses had not been reduced during the applicable periods shown.
G Fees and expenses of any underlying Fidelity Central Funds are not included in the Fund's expense ratio. The Fund indirectly bears its proportionate share of the expenses of any underlying Fidelity Central Funds.
H Expense ratios reflect operating expenses of the class. Expenses before reductions do not reflect amounts reimbursed by the investment adviser or reductions from expense offset arrangements and do not represent the amount paid by the class during periods when reimbursements or reductions occur. Expenses net of fee waivers reflect expenses after reimbursement by the investment adviser but prior to reductions from expense offset arrangements. Expenses net of all reductions represent the net expenses paid by the class.
I Annualized
J Amount does not include the portfolio activity of any underlying Fidelity Central Funds.
See accompanying notes which are an integral part of the financial statements.
Notes to Financial Statements (Unaudited)
For the period ended June 30, 2017
1. Organization.
VIP Disciplined Small Cap Portfolio (the Fund) is a fund of Variable Insurance Products Fund II (the Trust) and is authorized to issue an unlimited number of shares. The Trust is registered under the Investment Company Act of 1940, as amended (the 1940 Act), as an open-end management investment company organized as a Massachusetts business trust. Shares of the Fund may only be purchased by insurance companies for the purpose of funding variable annuity or variable life insurance contracts. The Fund offers the following classes of shares: Initial Class shares, Service Class shares, Service Class 2 shares and Investor Class shares. All classes have equal rights and voting privileges, except for matters affecting a single class.
2. Investments in Fidelity Central Funds.
The Fund invests in Fidelity Central Funds, which are open-end investment companies generally available only to other investment companies and accounts managed by the investment adviser and its affiliates. The Fund's Schedule of Investments lists each of the Fidelity Central Funds held as of period end, if any, as an investment of the Fund, but does not include the underlying holdings of each Fidelity Central Fund. As an Investing Fund, the Fund indirectly bears its proportionate share of the expenses of the underlying Fidelity Central Funds.
The Money Market Central Funds seek preservation of capital and current income and are managed by Fidelity Investments Money Management, Inc. (FIMM), an affiliate of the investment adviser. Annualized expenses of the Money Market Central Funds as of their most recent shareholder report date are less than .005%.
A complete unaudited list of holdings for each Fidelity Central Fund is available upon request or at the Securities and Exchange Commission (the SEC) website at www.sec.gov. In addition, the financial statements of the Fidelity Central Funds are available on the SEC website or upon request.
3. Significant Accounting Policies.
The Fund is an investment company and applies the accounting and reporting guidance of the Financial Accounting Standards Board (FASB) Accounting Standards Codification Topic 946 Financial Services – Investments Companies. The financial statements have been prepared in conformity with accounting principles generally accepted in the United States of America (GAAP), which require management to make certain estimates and assumptions at the date of the financial statements. Actual results could differ from those estimates. Subsequent events, if any, through the date that the financial statements were issued have been evaluated in the preparation of the financial statements. The following summarizes the significant accounting policies of the Fund:
Investment Valuation. Investments are valued as of 4:00 p.m. Eastern time on the last calendar day of the period. The Board of Trustees (the Board) has delegated the day to day responsibility for the valuation of the Fund's investments to the Fair Value Committee (the Committee) established by the Fund's investment adviser. In accordance with valuation policies and procedures approved by the Board, the Fund attempts to obtain prices from one or more third party pricing vendors or brokers to value its investments. When current market prices, quotations or currency exchange rates are not readily available or reliable, investments will be fair valued in good faith by the Committee, in accordance with procedures adopted by the Board. Factors used in determining fair value vary by investment type and may include market or investment specific events, changes in interest rates and credit quality. The frequency with which these procedures are used cannot be predicted and they may be utilized to a significant extent. The Committee oversees the Fund's valuation policies and procedures and reports to the Board on the Committee's activities and fair value determinations. The Board monitors the appropriateness of the procedures used in valuing the Fund's investments and ratifies the fair value determinations of the Committee.
The Fund categorizes the inputs to valuation techniques used to value its investments into a disclosure hierarchy consisting of three levels as shown below:
- Level 1 – quoted prices in active markets for identical investments
- Level 2 – other significant observable inputs (including quoted prices for similar investments, interest rates, prepayment speeds, etc.)
- Level 3 – unobservable inputs (including the Fund's own assumptions based on the best information available)
Valuation techniques used to value the Fund's investments by major category are as follows:
Equity securities, including restricted securities, for which market quotations are readily available, are valued at the last reported sale price or official closing price as reported by a third party pricing vendor on the primary market or exchange on which they are traded and are categorized as Level 1 in the hierarchy. In the event there were no sales during the day or closing prices are not available, securities are valued at the last quoted bid price or may be valued using the last available price and are generally categorized as Level 2 in the hierarchy. For foreign equity securities, when market or security specific events arise, comparisons to the valuation of American Depositary Receipts (ADRs, futures contracts, Exchange-Traded Funds (ETFs) and certain indexes as well as quoted prices for similar securities may be used and would be categorized as Level 2 in the hierarchy. Utilizing these techniques may result in transfers between Level 1 and Level 2. For equity securities, including restricted securities, where observable inputs are limited, assumptions about market activity and risk are used and these securities may be categorized as Level 3 in the hierarchy.
Debt securities, including restricted securities, are valued based on evaluated prices received from third party pricing vendors or from brokers who make markets in such securities. U.S. government and government agency obligations are valued by pricing vendors who utilize matrix pricing which considers yield or price of bonds of comparable quality, coupon, maturity and type or by broker-supplied prices. When independent prices are unavailable or unreliable, debt securities may be valued utilizing pricing methodologies which consider similar factors that would be used by third party pricing vendors. Debt securities are generally categorized as Level 2 in the hierarchy but may be Level 3 depending on the circumstances.
Futures contracts are valued at the settlement price established each day by the board of trade or exchange on which they are traded and are categorized as Level 1 in the hierarchy. Investments in open-end mutual funds, including the Fidelity Central Funds, are valued at their closing net asset value (NAV) each business day and are categorized as Level 1 in the hierarchy.
Changes in valuation techniques may result in transfers in or out of an assigned level within the disclosure hierarchy. The aggregate value of investments by input level as of June 30, 2017 is included at the end of the Fund's Schedule of Investments.
Foreign Currency. The Fund may use foreign currency contracts to facilitate transactions in foreign-denominated securities. Gains and losses from these transactions may arise from changes in the value of the foreign currency or if the counterparties do not perform under the contracts' terms.
Foreign-denominated assets, including investment securities, and liabilities are translated into U.S. dollars at the exchange rates at period end. Purchases and sales of investment securities, income and dividends received and expenses denominated in foreign currencies are translated into U.S. dollars at the exchange rate in effect on the transaction date.
The effects of exchange rate fluctuations on investments are included with the net realized and unrealized gain (loss) on investment securities. Other foreign currency transactions resulting in realized and unrealized gain (loss) are disclosed separately.
Investment Transactions and Income. For financial reporting purposes, the Fund's investment holdings and NAV include trades executed through the end of the last business day of the period. The NAV per share for processing shareholder transactions is calculated as of the close of business of the New York Stock Exchange (NYSE), normally 4:00 p.m. Eastern time and includes trades executed through the end of the prior business day. Gains and losses on securities sold are determined on the basis of identified cost and may include proceeds received from litigation. Dividend income is recorded on the ex-dividend date, except for certain dividends from foreign securities where the ex-dividend date may have passed, which are recorded as soon as the Fund is informed of the ex-dividend date. Non-cash dividends included in dividend income, if any, are recorded at the fair market value of the securities received. Income and capital gain distributions from Fidelity Central Funds, if any, are recorded on the ex-dividend date. Certain distributions received by the Fund represent a return of capital or capital gain. The Fund determines the components of these distributions subsequent to the ex-dividend date, based upon receipt of tax filings or other correspondence relating to the underlying investment. These distributions are recorded as a reduction of cost of investments and/or as a realized gain. Interest income is accrued as earned and includes coupon interest and amortization of premium and accretion of discount on debt securities as applicable. Investment income is recorded net of foreign taxes withheld where recovery of such taxes is uncertain.
Class Allocations and Expenses. Investment income, realized and unrealized capital gains and losses, common expenses of the Fund, and certain fund-level expense reductions, if any, are allocated daily on a pro-rata basis to each class based on the relative net assets of each class to the total net assets of the Fund. Each class differs with respect to transfer agent and distribution and service plan fees incurred. Certain expense reductions may also differ by class. For the reporting period, the allocated portion of income and expenses to each class as a percent of its average net assets may vary due to the timing of recording these transactions in relation to fluctuating net assets of the classes. Expenses directly attributable to a fund are charged to that fund. Expenses attributable to more than one fund are allocated among the respective funds on the basis of relative net assets or other appropriate methods. Expense estimates are accrued in the period to which they relate and adjustments are made when actual amounts are known.
Income Tax Information and Distributions to Shareholders. Each year, the Fund intends to qualify as a regulated investment company under Subchapter M of the Internal Revenue Code, including distributing substantially all of its taxable income and realized gains. As a result, no provision for U.S. Federal income taxes is required. The Fund files a U.S. federal tax return, in addition to state and local tax returns as required. The Fund's federal income tax returns are subject to examination by the Internal Revenue Service (IRS) for a period of three fiscal years after they are filed. State and local tax returns may be subject to examination for an additional fiscal year depending on the jurisdiction. Foreign taxes are provided for based on the Fund's understanding of the tax rules and rates that exist in the foreign markets in which it invests.
Distributions are declared and recorded on the ex-dividend date. Income dividends and capital gain distributions are declared separately for each class. Income and capital gain distributions are determined in accordance with income tax regulations, which may differ from GAAP.
Capital accounts within the financial statements are adjusted for permanent book-tax differences. These adjustments have no impact on net assets or the results of operations. Capital accounts are not adjusted for temporary book-tax differences which will reverse in a subsequent period.
Book-tax differences are primarily due to futures contracts, partnerships, passive foreign investment companies (PFIC), market discount, and losses deferred due to wash sales.
The federal tax cost of investment securities and unrealized appreciation (depreciation) as of period end were as follows:
| Gross unrealized appreciation | $54,467,788 |
| Gross unrealized depreciation | (12,562,194) |
| Net unrealized appreciation (depreciation) on securities | $41,905,594 |
| Tax cost | $301,126,011 |
4. Derivative Instruments.
Risk Exposures and the Use of Derivative Instruments. The Fund's investment objective allows the Fund to enter into various types of derivative contracts, including futures contracts. Derivatives are investments whose value is primarily derived from underlying assets, indices or reference rates and may be transacted on an exchange or over-the-counter (OTC). Derivatives may involve a future commitment to buy or sell a specified asset based on specified terms, to exchange future cash flows at periodic intervals based on a notional principal amount, or for one party to make one or more payments upon the occurrence of specified events in exchange for periodic payments from the other party.
The Fund used derivatives to increase returns and to manage exposure to certain risks as defined below. The success of any strategy involving derivatives depends on analysis of numerous economic factors, and if the strategies for investment do not work as intended, the Fund may not achieve its objectives.
The Fund's use of derivatives increased or decreased its exposure to the following risk:
| Equity Risk | Equity risk relates to the fluctuations in the value of financial instruments as a result of changes in market prices (other than those arising from interest rate risk or foreign exchange risk), whether caused by factors specific to an individual investment, its issuer, or all factors affecting all instruments traded in a market or market segment.
|
The Fund is also exposed to additional risks from investing in derivatives, such as liquidity risk and counterparty credit risk. Liquidity risk is the risk that the Fund will be unable to close out the derivative in the open market in a timely manner. Counterparty credit risk is the risk that the counterparty will not be able to fulfill its obligation to the Fund. Counterparty credit risk related to exchange-traded futures contracts may be mitigated by the protection provided by the exchange on which they trade.
Investing in derivatives may involve greater risks than investing in the underlying assets directly and, to varying degrees, may involve risk of loss in excess of any initial investment and collateral received and amounts recognized in the Statement of Assets and Liabilities. In addition, there may be the risk that the change in value of the derivative contract does not correspond to the change in value of the underlying instrument.
Futures Contracts. A futures contract is an agreement between two parties to buy or sell a specified underlying instrument for a fixed price at a specified future date. The Fund used futures contracts to manage its exposure to the stock market.
Upon entering into a futures contract, a fund is required to deposit either cash or securities (initial margin) with a clearing broker in an amount equal to a certain percentage of the face value of the contract. Futures contracts are marked-to-market daily and subsequent daily payments (variation margin) are made or received by a fund depending on the daily fluctuations in the value of the futures contracts and are recorded as unrealized appreciation or (depreciation). This receivable and/or payable, if any, is included in daily variation margin for derivative instruments in the Statement of Assets and Liabilities. Realized gain or (loss) is recorded upon the expiration or closing of a futures contract.
Any open futures contracts at period end are presented in the Schedule of Investments under the caption "Futures Contracts". The underlying face amount at value reflects each contract's exposure to the underlying instrument or index at period end. Securities deposited to meet initial margin requirements are identified in the Schedule of Investments.
During the period the Fund recognized net realized gain (loss) of $(81,494) and a change in net unrealized appreciation (depreciation) of $34,824 related to its investment in futures contracts. These amounts are included in the Statement of Operations.
5. Purchases and Sales of Investments.
Purchases and sales of securities, other than short-term securities, aggregated $132,756,920 and $152,101,186, respectively.
6. Fees and Other Transactions with Affiliates.
Management Fee. Fidelity Management & Research Company (the investment adviser) and its affiliates provide the Fund with investment management related services for which the Fund pays a monthly management fee. The management fee is the sum of an individual fund fee rate that is based on an annual rate of .45% of the Fund's average net assets and an annualized group fee rate that averaged .25% during the period. The group fee rate is based upon the average net assets of all the mutual funds advised by the investment adviser, including any mutual funds previously advised by the investment adviser that are currently advised by Fidelity SelectCo, LLC, an affiliate of the investment adviser. The group fee rate decreases as assets under management increase and increases as assets under management decrease. For the reporting period, the total annualized management fee rate was .70% of the Fund's average net assets.
Sub-Adviser. Geode Capital Management, LLC (Geode), serves as sub-adviser for the Fund. Geode provides discretionary investment advisory services to the Fund and is paid by the investment adviser for providing these services.
Distribution and Service Plan Fees. In accordance with Rule 12b-1 of the 1940 Act, the Fund has adopted separate 12b-1 Plans for each Service Class of shares. Each Service Class pays Fidelity Distributors Corporation (FDC), an affiliate of the investment adviser, a service fee. For the period, the service fee is based on an annual rate of .10% of Service Class' average net assets and .25% of Service Class 2's average net assets.
For the period, total fees, all of which were re-allowed to insurance companies for the distribution of shares and providing shareholder support services, were as follows:
| Service Class | $126 |
| Service Class 2 | 8,237 |
| | $8,363 |
Transfer Agent Fees. Fidelity Investments Institutional Operations Company, Inc. (FIIOC), an affiliate of the investment adviser, is the Fund's transfer, dividend disbursing, and shareholder servicing agent. FIIOC receives an asset-based fee with respect to each class. Each class pays a fee for transfer agent services, typesetting and printing and mailing of shareholder reports, excluding mailing of proxy statements, equal to an annual rate of class-level average net assets. The annual rate for Investor Class is .15% and the annual rate for all other classes is .07%. For the period, transfer agent fees for each class were as follows:
| Initial Class | $12,901 |
| Service Class | 83 |
| Service Class 2 | 2,175 |
| Investor Class | 196,680 |
| | $211,839 |
Accounting and Security Lending Fees. Fidelity Service Company, Inc. (FSC), an affiliate of the investment adviser, maintains the Fund's accounting records. The accounting fee is based on the level of average net assets for each month. Under a separate contract, FSC administers the security lending program. The security lending fee is based on the number and duration of lending transactions.
Interfund Trades. The Fund may purchase from or sell securities to other Fidelity Funds under procedures adopted by the Board. The procedures have been designed to ensure these interfund trades are executed in accordance with Rule 17a-7 of the 1940 Act. Interfund trades are included within the respective purchases and sales amounts shown in the Purchases and Sales of Investments note.
7. Committed Line of Credit.
The Fund participates with other funds managed by the investment adviser or an affiliate in a $4.25 billion credit facility (the "line of credit") to be utilized for temporary or emergency purposes to fund shareholder redemptions or for other short-term liquidity purposes. The Fund has agreed to pay commitment fees on its pro-rata portion of the line of credit, which amounted to $504 and is reflected in Miscellaneous expenses on the Statement of Operations. During the period, the Fund did not borrow on this line of credit.
8. Security Lending.
The Fund lends portfolio securities through a lending agent from time to time in order to earn additional income. On the settlement date of the loan, the Fund receives collateral (in the form of U.S. Treasury obligations, letters of credit and/or cash) against the loaned securities and maintains collateral in an amount not less than 100% of the market value of the loaned securities during the period of the loan. The market value of the loaned securities is determined at the close of business of the Fund and any additional required collateral is delivered to the Fund on the next business day. The Fund or borrower may terminate the loan at any time, and if the borrower defaults on its obligation to return the securities loaned because of insolvency or other reasons, the Fund may apply collateral received from the borrower against the obligation. The Fund may experience delays and costs in recovering the securities loaned. Any cash collateral received is invested in the Fidelity Securities Lending Cash Central Fund. The value of loaned securities and cash collateral at period end are disclosed on the Fund's Statement of Assets and Liabilities. Security lending income represents the income earned on investing cash collateral, less rebates paid to borrowers and any lending agent fees associated with the loan, plus any premium payments received for lending certain types of securities. Security lending income is presented in the Statement of Operations as a component of income from Fidelity Central Funds.
9. Expense Reductions.
During the period the investment adviser reimbursed and/or waived a portion of fund-level operating expenses in the amount of $1,360.
10. Distributions to Shareholders.
Distributions to shareholders of each class were as follows:
| | Six months ended
June 30, 2017 | Year ended December 31, 2016 |
| From net investment income | | |
| Initial Class | $74,687 | $211,720 |
| Service Class | 440 | 1,157 |
| Service Class 2 | 9,491 | 26,481 |
| Investor Class | 463,459 | 1,238,014 |
| Total | $548,077 | $1,477,372 |
| From net realized gain | | |
| Initial Class | $885,573 | $2,180,117 |
| Service Class | 5,413 | 21,487 |
| Service Class 2 | 126,045 | 242,534 |
| Investor Class | 5,698,828 | 13,995,816 |
| Total | $6,715,859 | $16,439,954 |
11. Share Transactions.
Transactions for each class of shares were as follows:
| | Shares | Shares | Dollars | Dollars |
| | Six months ended
June 30, 2017 | Year ended
December 31, 2016 | Six months ended
June 30, 2017 | Year ended
December 31, 2016 |
| Initial Class | | | | |
| Shares sold | 290,221 | 836,381 | $4,714,238 | $12,593,980 |
| Reinvestment of distributions | 59,422 | 198,718 | 960,260 | 2,391,837 |
| Shares redeemed | (741,991) | (581,693) | (11,850,707) | (7,883,903) |
| Net increase (decrease) | (392,348) | 453,406 | $(6,176,209) | $7,101,914 |
| Service Class | | | | |
| Reinvestment of distributions | 361 | 1,896 | $5,853 | $22,644 |
| Shares redeemed | (1,156) | (6,979) | (18,810) | (93,765) |
| Net increase (decrease) | (795) | (5,083) | $(12,957) | $(71,121) |
| Service Class 2 | | | | |
| Shares sold | 252,416 | 239,344 | $4,057,993 | $3,482,612 |
| Reinvestment of distributions | 8,361 | 22,192 | 135,536 | 269,015 |
| Shares redeemed | (163,361) | (87,894) | (2,619,809) | (1,200,378) |
| Net increase (decrease) | 97,416 | 173,642 | $1,573,720 | $2,551,249 |
| Investor Class | | | | |
| Shares sold | 1,380,814 | 3,546,667 | $22,282,026 | $52,700,249 |
| Reinvestment of distributions | 382,751 | 1,272,740 | 6,162,287 | 15,233,830 |
| Shares redeemed | (2,031,493) | (1,695,095) | (32,047,462) | (22,803,326) |
| Net increase (decrease) | (267,928) | 3,124,312 | $(3,603,149) | $45,130,753 |
12. Other.
The Fund's organizational documents provide former and current trustees and officers with a limited indemnification against liabilities arising in connection with the performance of their duties to the Fund. In the normal course of business, the Fund may also enter into contracts that provide general indemnifications. The Fund's maximum exposure under these arrangements is unknown as this would be dependent on future claims that may be made against the Fund. The risk of material loss from such claims is considered remote.
At the end of the period, the investment adviser or its affiliates were the owners of record of 98% of the total outstanding shares of the Fund.
Shareholder Expense Example
As a shareholder of the Fund, you incur two types of costs: (1) transaction costs and (2) ongoing costs, including management fees, distribution and/or service (12b-1) fees and other Fund expenses. This Example is intended to help you understand your ongoing costs (in dollars) of investing in the Fund and to compare these costs with the ongoing costs of investing in other mutual funds.
The Example is based on an investment of $1,000 invested at the beginning of the period and held for the entire period (January 1, 2017 to June 30, 2017).
Actual Expenses
The first line of the accompanying table for each class of the Fund provides information about actual account values and actual expenses. You may use the information in this line, together with the amount you invested, to estimate the expenses that you paid over the period. Simply divide your account value by $1,000.00 (for example, an $8,600 account value divided by $1,000.00 = 8.6), then multiply the result by the number in the first line for a class of the Fund under the heading entitled "Expenses Paid During Period" to estimate the expenses you paid on your account during this period. The estimate of expenses does not include any fees or other expenses of any variable annuity or variable life insurance product. If they were, the estimate of expenses you paid during the period would be higher, and your ending account value would be lower. In addition, the Fund, as a shareholder in the underlying Fidelity Central Funds, will indirectly bear its pro-rata share of the fees and expenses incurred by the underlying Fidelity Central Funds. These fees and expenses are not included in the Fund's annualized expense ratio used to calculate the expense estimate in the table below.
Hypothetical Example for Comparison Purposes
The second line of the accompanying table for each class of the Fund provides information about hypothetical account values and hypothetical expenses based on a Class' actual expense ratio and an assumed rate of return of 5% per year before expenses, which is not the Class' actual return. The hypothetical account values and expenses may not be used to estimate the actual ending account balance or expenses you paid for the period. You may use this information to compare the ongoing costs of investing in the Fund and other funds. To do so, compare this 5% hypothetical example with the 5% hypothetical examples that appear in the shareholder reports of the other funds. The estimate of expenses does not include any fees or other expenses of any variable annuity or variable life insurance product. If they were, the estimate of expenses you paid during the period would be higher, and your ending account value would be lower. In addition, the Fund, as a shareholder in the underlying Fidelity Central Funds, will indirectly bear its pro-rata share of the fees and expenses incurred by the underlying Fidelity Central Funds. These fees and expenses are not included in the Fund's annualized expense ratio used to calculate the expense estimate in the table below.
Please note that the expenses shown in the table are meant to highlight your ongoing costs only and do not reflect any transaction costs. Therefore, the second line of the table is useful in comparing ongoing costs only, and will not help you determine the relative total costs of owning different funds.
| | Annualized Expense Ratio-A | Beginning
Account Value
January 1, 2017 | Ending
Account Value
June 30, 2017 | Expenses Paid
During Period-B
January 1, 2017
to June 30, 2017 |
| Initial Class | .85% | | | |
| Actual | | $1,000.00 | $1,003.40 | $4.22 |
| Hypothetical-C | | $1,000.00 | $1,020.58 | $4.26 |
| Service Class | .95% | | | |
| Actual | | $1,000.00 | $1,003.30 | $4.72 |
| Hypothetical-C | | $1,000.00 | $1,020.08 | $4.76 |
| Service Class 2 | 1.10% | | | |
| Actual | | $1,000.00 | $1,002.60 | $5.46 |
| Hypothetical-C | | $1,000.00 | $1,019.34 | $5.51 |
| Investor Class | .93% | | | |
| Actual | | $1,000.00 | $1,003.40 | $4.62 |
| Hypothetical-C | | $1,000.00 | $1,020.18 | $4.66 |
A Annualized expense ratio reflects expenses net of applicable fee waivers.
B Expenses are equal to each Class' annualized expense ratio, multiplied by the average account value over the period, multiplied by 181/365 (to reflect the one-half year period).
C 5% return per year before expenses
VDSC-SANN-0817
1.821007.111
Fidelity® Variable Insurance Products: Emerging Markets Portfolio
Semi-Annual Report June 30, 2017 |
|
Contents
To view a fund's proxy voting guidelines and proxy voting record for the 12-month period ended June 30, visit http://www.fidelity.com/proxyvotingresults or visit the Securities and Exchange Commission's (SEC) web site at http://www.sec.gov.
You may also call 1-877-208-0098 to request a free copy of the proxy voting guidelines.
Fidelity® Variable Insurance Products are separate account options which are purchased through a variable insurance contract.
Standard & Poor's, S&P and S&P 500 are registered service marks of The McGraw-Hill Companies, Inc. and have been licensed for use by Fidelity Distributors Corporation.
Other third-party marks appearing herein are the property of their respective owners.
All other marks appearing herein are registered or unregistered trademarks or service marks of FMR LLC or an affiliated company. © 2017 FMR LLC. All rights reserved.
This report and the financial statements contained herein are submitted for the general information of the shareholders of the Fund. This report is not authorized for distribution to prospective investors in the Fund unless preceded or accompanied by an effective prospectus.
A fund files its complete schedule of portfolio holdings with the SEC for the first and third quarters of each fiscal year on Form N-Q. Forms N-Q are available on the SEC’s web site at http://www.sec.gov. A fund's Forms N-Q may be reviewed and copied at the SEC’s Public Reference Room in Washington, DC. Information regarding the operation of the SEC's Public Reference Room may be obtained by calling 1-800-SEC-0330.
For a complete list of a fund's portfolio holdings, view the most recent holdings listing, semiannual report, or annual report on Fidelity's web site at http://www.fidelity.com, http://www.institutional.fidelity.com, or http://www.401k.com, as applicable.
NOT FDIC INSURED •MAY LOSE VALUE •NO BANK GUARANTEE
Neither the Fund nor Fidelity Distributors Corporation is a bank.
Investment Summary (Unaudited)
Geographic Diversification (% of fund's net assets)
| As of June 30, 2017 |
| | Cayman Islands | 13.1% |
| | India | 11.9% |
| | United States of America* | 9.1% |
| | Korea (South) | 7.6% |
| | Brazil | 7.0% |
| | China | 6.6% |
| | South Africa | 6.0% |
| | Mexico | 5.8% |
| | Taiwan | 5.3% |
| | Other | 27.6% |
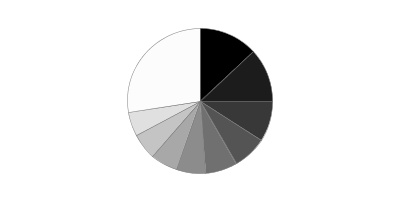
* Includes Short-Term investments and Net Other Assets (Liabilities).
Percentages are based on country or territory of incorporation and are adjusted for the effect of futures contracts, if applicable.
| As of December 31, 2016 |
| | Cayman Islands | 12.5% |
| | India | 11.8% |
| | United States of America* | 10.8% |
| | Brazil | 9.0% |
| | Korea (South) | 8.4% |
| | South Africa | 7.3% |
| | Mexico | 6.8% |
| | Taiwan | 6.5% |
| | Indonesia | 3.2% |
| | Other | 23.7% |

* Includes Short-Term investments and Net Other Assets (Liabilities).
Percentages are based on country or territory of incorporation and are adjusted for the effect of futures contracts, if applicable.
Asset Allocation as of June 30, 2017
| | % of fund's net assets | % of fund's net assets 6 months ago |
| Stocks | 98.7 | 98.8 |
| Short-Term Investments and Net Other Assets (Liabilities) | 1.3 | 1.2 |
Top Ten Stocks as of June 30, 2017
| | % of fund's net assets | % of fund's net assets 6 months ago |
| Samsung Electronics Co. Ltd. (Korea (South), Technology Hardware, Storage & Peripherals) | 5.4 | 4.7 |
| Tencent Holdings Ltd. (Cayman Islands, Internet Software & Services) | 4.8 | 4.1 |
| Taiwan Semiconductor Manufacturing Co. Ltd. (Taiwan, Semiconductors & Semiconductor Equipment) | 4.0 | 4.1 |
| Alibaba Group Holding Ltd. sponsored ADR (Cayman Islands, Internet Software & Services) | 3.9 | 3.1 |
| Naspers Ltd. Class N (South Africa, Media) | 2.3 | 2.2 |
| Housing Development Finance Corp. Ltd. (India, Thrifts & Mortgage Finance) | 1.3 | 1.3 |
| Itau Unibanco Holding SA (Brazil, Banks) | 1.3 | 1.4 |
| Sberbank of Russia (Russia, Banks) | 1.1 | 1.3 |
| NetEase, Inc. ADR (Cayman Islands, Internet Software & Services) | 1.0 | 0.9 |
| Reliance Industries Ltd. (India, Oil, Gas & Consumable Fuels) | 1.0 | 0.0 |
| | 26.1 | |
Top Market Sectors as of June 30, 2017
| | % of fund's net assets | % of fund's net assets 6 months ago |
| Information Technology | 28.5 | 28.2 |
| Financials | 15.4 | 15.4 |
| Consumer Discretionary | 14.5 | 14.6 |
| Consumer Staples | 12.1 | 14.4 |
| Industrials | 9.9 | 7.1 |
| Materials | 6.8 | 6.4 |
| Health Care | 4.1 | 5.6 |
| Energy | 2.3 | 1.6 |
| Utilities | 2.1 | 1.5 |
| Telecommunication Services | 1.8 | 2.2 |
Percentages shown as 0.0% may reflect amounts less than 0.05%.
Investments June 30, 2017 (Unaudited)
Showing Percentage of Net Assets
| Common Stocks - 95.9% | | | |
| | | Shares | Value |
| Argentina - 0.5% | | | |
| Banco Macro SA sponsored ADR | | 15,200 | $1,401,288 |
| Australia - 0.6% | | | |
| Amcor Ltd. | | 134,120 | 1,671,002 |
| Bermuda - 0.7% | | | |
| Credicorp Ltd. (United States) | | 12,376 | 2,220,131 |
| Brazil - 4.9% | | | |
| BB Seguridade Participacoes SA | | 207,400 | 1,793,598 |
| Drogasil SA (a) | | 85,300 | 1,805,181 |
| Equatorial Energia SA | | 101,400 | 1,658,321 |
| Estacio Participacoes SA | | 284,700 | 1,256,396 |
| Kroton Educacional SA | | 430,600 | 1,932,754 |
| Qualicorp SA | | 187,900 | 1,627,797 |
| Smiles SA | | 74,600 | 1,359,639 |
| Ultrapar Participacoes SA | | 82,000 | 1,918,754 |
| Weg SA | | 284,080 | 1,517,769 |
|
| TOTAL BRAZIL | | | 14,870,209 |
|
| Cayman Islands - 13.1% | | | |
| Alibaba Group Holding Ltd. sponsored ADR (a) | | 84,000 | 11,835,600 |
| Ctrip.com International Ltd. ADR (a) | | 49,900 | 2,687,614 |
| JD.com, Inc. sponsored ADR (a) | | 62,300 | 2,443,406 |
| Momo, Inc. ADR (a) | | 41,900 | 1,548,624 |
| NetEase, Inc. ADR | | 10,400 | 3,126,552 |
| New Oriental Education & Technology Group, Inc. sponsored ADR (a) | | 28,500 | 2,008,965 |
| Shenzhou International Group Holdings Ltd. | | 254,000 | 1,668,944 |
| Tencent Holdings Ltd. | | 411,800 | 14,773,309 |
|
| TOTAL CAYMAN ISLANDS | | | 40,093,014 |
|
| Chile - 0.5% | | | |
| Sociedad Quimica y Minera de Chile SA (PN-B) sponsored ADR | | 50,500 | 1,667,510 |
| China - 6.6% | | | |
| Gree Electric Appliances, Inc. of Zhuhai Class A | | 314,300 | 1,908,262 |
| Hangzhou Hikvision Digital Technology Co. Ltd. Class A | | 308,040 | 1,467,311 |
| Hangzhou Robam Appliances Co. Ltd. Class A | | 245,800 | 1,576,101 |
| Inner Mongoli Yili Industries Co. Ltd. (A Shares) | | 561,490 | 1,787,752 |
| Jiangsu Hengrui Medicine Co. Ltd. (A Shares) | | 222,913 | 1,663,078 |
| Jiangsu Yanghe Brewery Joint-Stock Co. Ltd. Class A | | 123,200 | 1,577,223 |
| Kweichow Moutai Co. Ltd. (A Shares) | | 25,248 | 1,756,886 |
| Midea Group Co. Ltd. Class A | | 295,900 | 1,878,148 |
| Shanghai International Airport Co. Ltd. (A Shares) | | 278,324 | 1,531,400 |
| Shenzhen Inovance Technology Co. Ltd. Class A | | 466,495 | 1,757,036 |
| Wuliangye Yibin Co. Ltd. Class A | | 220,087 | 1,806,551 |
| Yunnan Baiyao Group Co. Ltd. | | 110,800 | 1,533,510 |
|
| TOTAL CHINA | | | 20,243,258 |
|
| France - 1.4% | | | |
| Dassault Systemes SA (b) | | 16,100 | 1,443,322 |
| Kering SA | | 4,372 | 1,489,056 |
| LVMH Moet Hennessy - Louis Vuitton SA | | 5,697 | 1,424,566 |
|
| TOTAL FRANCE | | | 4,356,944 |
|
| Germany - 0.5% | | | |
| adidas AG | | 7,909 | 1,515,330 |
| Greece - 0.5% | | | |
| Titan Cement Co. SA (Reg.) | | 58,000 | 1,640,881 |
| Hong Kong - 2.2% | | | |
| AIA Group Ltd. | | 226,000 | 1,651,410 |
| CSPC Pharmaceutical Group Ltd. | | 1,280,000 | 1,868,984 |
| Guangdong Investment Ltd. | | 1,146,000 | 1,579,384 |
| Techtronic Industries Co. Ltd. | | 334,000 | 1,535,790 |
|
| TOTAL HONG KONG | | | 6,635,568 |
|
| India - 11.2% | | | |
| Adani Ports & Special Economic Zone Ltd. (a) | | 325,739 | 1,830,077 |
| Amara Raja Batteries Ltd. | | 105,187 | 1,366,682 |
| Asian Paints Ltd. | | 100,632 | 1,717,612 |
| Eicher Motors Ltd. (a) | | 4,161 | 1,741,116 |
| Godrej Consumer Products Ltd. (a) | | 60,253 | 902,676 |
| Godrej Consumer Products Ltd. | | 60,253 | 902,676 |
| HDFC Bank Ltd. | | 63,555 | 1,637,240 |
| Hero Motocorp Ltd. | | 28,907 | 1,655,756 |
| Housing Development Finance Corp. Ltd. | | 161,714 | 4,041,474 |
| Indraprastha Gas Ltd. | | 92,325 | 1,524,319 |
| IndusInd Bank Ltd. | | 74,637 | 1,708,208 |
| ITC Ltd. | | 544,617 | 2,727,720 |
| Kotak Mahindra Bank Ltd. | | 105,540 | 1,560,970 |
| LIC Housing Finance Ltd. | | 155,089 | 1,781,291 |
| Maruti Suzuki India Ltd. | | 20,862 | 2,330,139 |
| Power Grid Corp. of India Ltd. | | 458,832 | 1,495,003 |
| Reliance Industries Ltd. | | 145,908 | 3,115,955 |
| UPL Ltd. (a) | | 133,322 | 1,733,887 |
| Zee Entertainment Enterprises Ltd. | | 66,961 | 509,150 |
|
| TOTAL INDIA | | | 34,281,951 |
|
| Indonesia - 2.5% | | | |
| PT Bank Central Asia Tbk | | 1,933,700 | 2,633,401 |
| PT Bank Rakyat Indonesia Tbk | | 2,161,740 | 2,473,572 |
| PT Telkomunikasi Indonesia Tbk Series B | | 7,516,300 | 2,552,472 |
|
| TOTAL INDONESIA | | | 7,659,445 |
|
| Israel - 2.0% | | | |
| Check Point Software Technologies Ltd. (a) | | 13,300 | 1,450,764 |
| Elbit Systems Ltd. (Israel) | | 12,200 | 1,504,912 |
| Frutarom Industries Ltd. | | 24,125 | 1,688,166 |
| NICE Systems Ltd. | | 17,500 | 1,403,672 |
|
| TOTAL ISRAEL | | | 6,047,514 |
|
| Kenya - 0.5% | | | |
| Safaricom Ltd. | | 7,546,800 | 1,655,638 |
| Korea (South) - 7.6% | | | |
| Coway Co. Ltd. | | 18,990 | 1,724,600 |
| LG Household & Health Care Ltd. | | 2,505 | 2,174,323 |
| NAVER Corp. | | 3,703 | 2,709,741 |
| Samsung Electronics Co. Ltd. | | 7,957 | 16,516,142 |
|
| TOTAL KOREA (SOUTH) | | | 23,124,806 |
|
| Luxembourg - 0.5% | | | |
| Eurofins Scientific SA | | 2,868 | 1,615,405 |
| Mexico - 5.8% | | | |
| CEMEX S.A.B. de CV sponsored ADR | | 269,192 | 2,535,789 |
| Embotelladoras Arca S.A.B. de CV | | 244,800 | 1,839,701 |
| Fomento Economico Mexicano S.A.B. de CV unit | | 270,300 | 2,662,378 |
| Gruma S.A.B. de CV Series B | | 129,010 | 1,682,435 |
| Grupo Aeroportuario del Pacifico S.A.B. de CV Series B | | 168,000 | 1,892,005 |
| Grupo Aeroportuario del Sureste S.A.B. de CV Series B | | 94,900 | 2,002,293 |
| Grupo Aeroportuario Norte S.A.B. de CV | | 254,700 | 1,539,252 |
| Grupo Cementos de Chihuahua S.A.B. de CV | | 354,900 | 1,828,594 |
| Promotora y Operadora de Infraestructura S.A.B. de CV | | 158,215 | 1,885,286 |
|
| TOTAL MEXICO | | | 17,867,733 |
|
| Netherlands - 1.4% | | | |
| ASML Holding NV (Netherlands) | | 11,000 | 1,433,881 |
| X5 Retail Group NV GDR (Reg. S) (a) | | 42,700 | 1,479,555 |
| Yandex NV Series A (a) | | 54,300 | 1,424,832 |
|
| TOTAL NETHERLANDS | | | 4,338,268 |
|
| Panama - 0.5% | | | |
| Copa Holdings SA Class A | | 12,400 | 1,450,800 |
| Philippines - 2.9% | | | |
| Ayala Corp. | | 101,030 | 1,703,186 |
| Ayala Land, Inc. | | 2,450,600 | 1,931,979 |
| D&L Industries, Inc. | | 5,829,600 | 1,389,748 |
| SM Investments Corp. | | 117,912 | 1,877,874 |
| SM Prime Holdings, Inc. | | 2,848,500 | 1,864,331 |
|
| TOTAL PHILIPPINES | | | 8,767,118 |
|
| Russia - 1.8% | | | |
| NOVATEK OAO GDR (Reg. S) | | 19,700 | 2,194,580 |
| Sberbank of Russia | | 1,340,210 | 3,311,662 |
|
| TOTAL RUSSIA | | | 5,506,242 |
|
| South Africa - 6.0% | | | |
| Bidcorp Ltd. | | 88,225 | 2,017,862 |
| Capitec Bank Holdings Ltd. | | 29,400 | 1,865,240 |
| Discovery Ltd. | | 162,564 | 1,589,542 |
| FirstRand Ltd. | | 638,900 | 2,302,628 |
| Imperial Holdings Ltd. | | 44 | 541 |
| Mondi Ltd. | | 69,163 | 1,792,766 |
| Naspers Ltd. Class N | | 35,668 | 7,024,200 |
| Sanlam Ltd. | | 364,800 | 1,806,921 |
|
| TOTAL SOUTH AFRICA | | | 18,399,700 |
|
| Spain - 0.5% | | | |
| Amadeus IT Holding SA Class A | | 26,000 | 1,554,580 |
| Sweden - 1.0% | | | |
| ASSA ABLOY AB (B Shares) | | 66,800 | 1,472,371 |
| Atlas Copco AB (A Shares) | | 39,600 | 1,518,250 |
|
| TOTAL SWEDEN | | | 2,990,621 |
|
| Switzerland - 1.0% | | | |
| Nestle SA (Reg. S) | | 15,494 | 1,351,351 |
| Sika AG | | 240 | 1,541,767 |
|
| TOTAL SWITZERLAND | | | 2,893,118 |
|
| Taiwan - 5.3% | | | |
| Advantech Co. Ltd. | | 212,292 | 1,505,345 |
| Largan Precision Co. Ltd. | | 15,000 | 2,393,801 |
| Taiwan Semiconductor Manufacturing Co. Ltd. | | 1,807,000 | 12,357,590 |
|
| TOTAL TAIWAN | | | 16,256,736 |
|
| Thailand - 1.2% | | | |
| Airports of Thailand PCL (For. Reg.) | | 1,535,900 | 2,136,334 |
| Thai Beverage PCL | | 2,277,800 | 1,489,029 |
|
| TOTAL THAILAND | | | 3,625,363 |
|
| Turkey - 1.5% | | | |
| Koc Holding A/S | | 348,000 | 1,600,318 |
| Tofas Turk Otomobil Fabrikasi A/S | | 173,940 | 1,428,716 |
| Turkcell Iletisim Hizmet A/S | | 494,000 | 1,625,864 |
|
| TOTAL TURKEY | | | 4,654,898 |
|
| United Arab Emirates - 0.5% | | | |
| National Bank of Abu Dhabi PJSC (a) | | 555,407 | 1,587,741 |
| United Kingdom - 2.9% | | | |
| British American Tobacco PLC (United Kingdom) | | 21,100 | 1,437,816 |
| InterContinental Hotel Group PLC | | 25,755 | 1,431,348 |
| NMC Health PLC | | 56,100 | 1,597,254 |
| Prudential PLC | | 64,956 | 1,490,986 |
| Reckitt Benckiser Group PLC | | 15,600 | 1,581,421 |
| Unilever PLC | | 27,150 | 1,469,300 |
|
| TOTAL UNITED KINGDOM | | | 9,008,125 |
|
| United States of America - 7.8% | | | |
| A.O. Smith Corp. | | 26,000 | 1,464,580 |
| Alphabet, Inc. Class C (a) | | 1,573 | 1,429,432 |
| Amazon.com, Inc. (a) | | 1,590 | 1,539,120 |
| Amphenol Corp. Class A | | 19,000 | 1,402,580 |
| Apple, Inc. | | 10,400 | 1,497,808 |
| China Biologic Products, Inc. (a) | | 13,500 | 1,526,850 |
| Facebook, Inc. Class A (a) | | 10,100 | 1,524,898 |
| MasterCard, Inc. Class A | | 12,400 | 1,505,980 |
| MercadoLibre, Inc. | | 4,400 | 1,103,872 |
| Mettler-Toledo International, Inc. (a) | | 2,600 | 1,530,204 |
| Moody's Corp. | | 13,200 | 1,606,176 |
| MSCI, Inc. | | 15,500 | 1,596,345 |
| Philip Morris International, Inc. | | 12,500 | 1,468,125 |
| S&P Global, Inc. | | 11,300 | 1,649,687 |
| Sherwin-Williams Co. | | 4,400 | 1,544,224 |
| Visa, Inc. Class A | | 15,500 | 1,453,590 |
|
| TOTAL UNITED STATES OF AMERICA | | | 23,843,471 |
|
| TOTAL COMMON STOCKS | | | |
| (Cost $217,121,845) | | | 293,444,408 |
|
| Preferred Stocks - 2.8% | | | |
| Convertible Preferred Stocks - 0.7% | | | |
| India - 0.7% | | | |
| PC Jeweller Ltd. 13.00% (c) | | 10,902,390 | 2,051,574 |
| Nonconvertible Preferred Stocks - 2.1% | | | |
| Brazil - 2.1% | | | |
| Ambev SA sponsored ADR | | 490,190 | 2,691,143 |
| Itau Unibanco Holding SA | | 355,420 | 3,942,674 |
| | | | 6,633,817 |
| TOTAL PREFERRED STOCKS | | | |
| (Cost $7,550,440) | | | 8,685,391 |
|
| Money Market Funds - 1.2% | | | |
| Fidelity Cash Central Fund, 1.10% (d) | | 3,508,286 | 3,508,987 |
| Fidelity Securities Lending Cash Central Fund 1.09% (d)(e) | | 160 | 160 |
| TOTAL MONEY MARKET FUNDS | | | |
| (Cost $3,509,147) | | | 3,509,147 |
| TOTAL INVESTMENT PORTFOLIO - 99.9% | | | |
| (Cost $228,181,432) | | | 305,638,946 |
| NET OTHER ASSETS (LIABILITIES) - 0.1% | | | 216,328 |
| NET ASSETS - 100% | | | $305,855,274 |
Categorizations in the Schedule of Investments are based on country or territory of incorporation.
Legend
(a) Non-income producing
(b) Security or a portion of the security is on loan at period end.
(c) Restricted securities - Investment in securities not registered under the Securities Act of 1933 (excluding 144A issues). At the end of the period, the value of restricted securities (excluding 144A issues) amounted to $2,051,574 or 0.7% of net assets.
(d) Affiliated fund that is generally available only to investment companies and other accounts managed by Fidelity Investments. The rate quoted is the annualized seven-day yield of the fund at period end. A complete unaudited listing of the fund's holdings as of its most recent quarter end is available upon request. In addition, each Fidelity Central Fund's financial statements are available on the SEC's website or upon request.
(e) Investment made with cash collateral received from securities on loan.
Additional information on each restricted holding is as follows:
| Security | Acquisition Date | Acquisition Cost |
| PC Jeweller Ltd. 13.00% | 7/28/16 | $1,627,057 |
Affiliated Central Funds
Information regarding fiscal year to date income earned by the Fund from investments in Fidelity Central Funds is as follows:
| Fund | Income earned |
| Fidelity Cash Central Fund | $18,252 |
| Fidelity Securities Lending Cash Central Fund | 6,485 |
| Total | $24,737 |
Investment Valuation
The following is a summary of the inputs used, as of June 30, 2017, involving the Fund's assets and liabilities carried at fair value. The inputs or methodology used for valuing securities may not be an indication of the risk associated with investing in those securities. For more information on valuation inputs, and their aggregation into the levels used below, please refer to the Investment Valuation section in the accompanying Notes to Financial Statements.
| | Valuation Inputs at Reporting Date: |
| Description | Total | Level 1 | Level 2 | Level 3 |
| Investments in Securities: | | | | |
| Equities: | | | | |
| Consumer Discretionary | $44,380,115 | $33,879,775 | $10,500,340 | $-- |
| Consumer Staples | 36,611,104 | 30,771,216 | 5,839,888 | -- |
| Energy | 7,229,289 | 7,229,289 | -- | -- |
| Financials | 47,355,371 | 40,915,483 | 6,439,888 | -- |
| Health Care | 12,963,082 | 12,963,082 | -- | -- |
| Industrials | 30,088,355 | 28,615,984 | 1,472,371 | -- |
| Information Technology | 86,863,226 | 58,298,446 | 28,564,780 | -- |
| Materials | 20,751,946 | 20,751,946 | -- | -- |
| Real Estate | 3,796,310 | 3,796,310 | -- | -- |
| Telecommunication Services | 5,833,974 | 3,281,502 | 2,552,472 | -- |
| Utilities | 6,257,027 | 4,732,708 | 1,524,319 | -- |
| Money Market Funds | 3,509,147 | 3,509,147 | -- | -- |
| Total Investments in Securities: | $305,638,946 | $248,744,888 | $56,894,058 | $-- |
The following is a summary of transfers between Level 1 and Level 2 for the period ended June 30, 2017. Transfers are assumed to have occurred at the beginning of the period, and are primarily attributable to the valuation techniques used for foreign equity securities, as discussed in the accompanying Notes to Financial Statements:
| Transfers | Total |
| Level 1 to Level 2 | $0 |
| Level 2 to Level 1 | $18,395,002 |
See accompanying notes which are an integral part of the financial statements.
Financial Statements
Statement of Assets and Liabilities
| | | June 30, 2017 (Unaudited) |
| Assets | | |
Investment in securities, at value (including securities loaned of $182) — See accompanying schedule:
Unaffiliated issuers (cost $224,672,285) | $302,129,799 | |
| Fidelity Central Funds (cost $3,509,147) | 3,509,147 | |
| Total Investments (cost $228,181,432) | | $305,638,946 |
| Foreign currency held at value (cost $398,361) | | 398,514 |
| Receivable for investments sold | | 3,048,946 |
| Receivable for fund shares sold | | 814,530 |
| Dividends receivable | | 718,761 |
| Distributions receivable from Fidelity Central Funds | | 4,144 |
| Other receivables | | 23,840 |
| Total assets | | 310,647,681 |
| Liabilities | | |
| Payable to custodian bank | $298,870 | |
| Payable for investments purchased | 3,787,326 | |
| Payable for fund shares redeemed | 154,478 | |
| Accrued management fee | 199,120 | |
| Distribution and service plan fees payable | 994 | |
| Other affiliated payables | 39,004 | |
| Other payables and accrued expenses | 312,615 | |
| Total liabilities | | 4,792,407 |
| Net Assets | | $305,855,274 |
| Net Assets consist of: | | |
| Paid in capital | | $255,725,263 |
| Undistributed net investment income | | 1,610,655 |
| Accumulated undistributed net realized gain (loss) on investments and foreign currency transactions | | (28,704,480) |
| Net unrealized appreciation (depreciation) on investments and assets and liabilities in foreign currencies | | 77,223,836 |
| Net Assets | | $305,855,274 |
| Initial Class: | | |
| Net Asset Value, offering price and redemption price per share ($156,089,013 ÷ 15,010,122 shares) | | $10.40 |
| Service Class: | | |
| Net Asset Value, offering price and redemption price per share ($610,538 ÷ 58,516 shares) | | $10.43 |
| Service Class 2: | | |
| Net Asset Value, offering price and redemption price per share ($5,475,300 ÷ 525,370 shares) | | $10.42 |
| Investor Class: | | |
| Net Asset Value, offering price and redemption price per share ($143,680,423 ÷ 13,878,365 shares) | | $10.35 |
See accompanying notes which are an integral part of the financial statements.
Statement of Operations
| | | Six months ended June 30, 2017 (Unaudited) |
| Investment Income | | |
| Dividends | | $3,338,571 |
| Income from Fidelity Central Funds | | 24,737 |
| Income before foreign taxes withheld | | 3,363,308 |
| Less foreign taxes withheld | | (307,730) |
| Total income | | 3,055,578 |
| Expenses | | |
| Management fee | $1,062,268 | |
| Transfer agent fees | 134,723 | |
| Distribution and service plan fees | 4,666 | |
| Accounting and security lending fees | 69,296 | |
| Custodian fees and expenses | 93,482 | |
| Independent trustees' fees and expenses | 505 | |
| Audit | 45,607 | |
| Legal | 143 | |
| Miscellaneous | 922 | |
| Total expenses before reductions | 1,411,612 | |
| Expense reductions | (30,124) | 1,381,488 |
| Net investment income (loss) | | 1,674,090 |
| Realized and Unrealized Gain (Loss) | | |
| Net realized gain (loss) on: | | |
| Investment securities: | | |
| Unaffiliated issuers | 3,178,034 | |
| Fidelity Central Funds | 368 | |
| Foreign currency transactions | (9,304) | |
| Total net realized gain (loss) | | 3,169,098 |
Change in net unrealized appreciation (depreciation) on:
Investment securities (net of increase in deferred foreign taxes of $233,302) | 52,254,364 | |
| Assets and liabilities in foreign currencies | 1,924 | |
| Total change in net unrealized appreciation (depreciation) | | 52,256,288 |
| Net gain (loss) | | 55,425,386 |
| Net increase (decrease) in net assets resulting from operations | | $57,099,476 |
See accompanying notes which are an integral part of the financial statements.
Statement of Changes in Net Assets
| | Six months ended June 30, 2017 (Unaudited) | Year ended December 31, 2016 |
| Increase (Decrease) in Net Assets | | |
| Operations | | |
| Net investment income (loss) | $1,674,090 | $1,479,027 |
| Net realized gain (loss) | 3,169,098 | (12,728,655) |
| Change in net unrealized appreciation (depreciation) | 52,256,288 | 18,862,755 |
| Net increase (decrease) in net assets resulting from operations | 57,099,476 | 7,613,127 |
| Distributions to shareholders from net investment income | (405,059) | (1,110,495) |
| Share transactions - net increase (decrease) | 19,793,875 | 25,997,383 |
| Total increase (decrease) in net assets | 76,488,292 | 32,500,015 |
| Net Assets | | |
| Beginning of period | 229,366,982 | 196,866,967 |
| End of period | $305,855,274 | $229,366,982 |
| Other Information | | |
| Undistributed net investment income end of period | $1,610,655 | $341,624 |
See accompanying notes which are an integral part of the financial statements.
Financial Highlights — VIP Emerging Markets Portfolio Initial Class
| | Six months ended (Unaudited) June 30, | Years ended December 31, | | | | |
| | 2017 | 2016 | 2015 | 2014 | 2013 | 2012 |
| Selected Per–Share Data | | | | | | |
| Net asset value, beginning of period | $8.36 | $8.14 | $9.10 | $9.01 | $8.75 | $7.74 |
| Income from Investment Operations | | | | | | |
| Net investment income (loss)A | .06 | .06 | .06 | .06 | .07 | .11 |
| Net realized and unrealized gain (loss) | 2.00 | .20 | (.97) | .06 | .27 | 1.00 |
| Total from investment operations | 2.06 | .26 | (.91) | .12 | .34 | 1.11 |
| Distributions from net investment income | (.02) | (.04) | (.05) | (.03) | (.07) | (.08) |
| Distributions from net realized gain | – | – | – | – | (.01) | (.01) |
| Tax return of capital | – | – | – | – | – | (.01) |
| Total distributions | (.02) | (.04) | (.05) | (.03) | (.08) | (.10) |
| Redemption fees added to paid in capitalA | – | – | –B | –B | –B | –B |
| Net asset value, end of period | $10.40 | $8.36 | $8.14 | $9.10 | $9.01 | $8.75 |
| Total ReturnC,D,E | 24.61% | 3.24% | (9.97)% | 1.38% | 3.85% | 14.37% |
| Ratios to Average Net AssetsF,G | | | | | | |
| Expenses before reductions | 1.02%H | 1.05% | 1.07% | 1.10% | 1.14% | 1.38% |
| Expenses net of fee waivers, if any | 1.02%H | 1.05% | 1.07% | 1.10% | 1.10% | 1.10% |
| Expenses net of all reductions | .99%H | 1.05% | 1.05% | 1.10% | 1.07% | 1.05% |
| Net investment income (loss) | 1.29%H | .71% | .69% | .62% | .84% | 1.36% |
| Supplemental Data | | | | | | |
| Net assets, end of period (000 omitted) | $156,089 | $132,435 | $112,675 | $91,224 | $60,924 | $44,979 |
| Portfolio turnover rateI | 69%H | 86% | 106% | 96% | 110% | 198% |
A Calculated based on average shares outstanding during the period.
B Amount represents less than $.005 per share.
C Total returns for periods of less than one year are not annualized.
D Total returns do not reflect charges attributable to your insurance company's separate account. Inclusion of these charges would reduce the total returns shown.
E Total returns would have been lower if certain expenses had not been reduced during the applicable periods shown.
F Fees and expenses of any underlying Fidelity Central Funds are not included in the Fund's expense ratio. The Fund indirectly bears its proportionate share of the expenses of any underlying Fidelity Central Funds.
G Expense ratios reflect operating expenses of the class. Expenses before reductions do not reflect amounts reimbursed by the investment adviser or reductions from brokerage service arrangements or reductions from other expense offset arrangements and do not represent the amount paid by the class during periods when reimbursements or reductions occur. Expenses net of fee waivers reflect expenses after reimbursement by the investment adviser but prior to reductions from brokerage service arrangements or other expense offset arrangements. Expenses net of all reductions represent the net expenses paid by the class.
H Annualized
I Amount does not include the portfolio activity of any underlying Fidelity Central Funds.
See accompanying notes which are an integral part of the financial statements.
Financial Highlights — VIP Emerging Markets Portfolio Service Class
| | Six months ended (Unaudited) June 30, | Years ended December 31, | | | | |
| | 2017 | 2016 | 2015 | 2014 | 2013 | 2012 |
| Selected Per–Share Data | | | | | | |
| Net asset value, beginning of period | $8.39 | $8.17 | $9.14 | $9.04 | $8.77 | $7.76 |
| Income from Investment Operations | | | | | | |
| Net investment income (loss)A | .06 | .05 | .05 | .05 | .07 | .10 |
| Net realized and unrealized gain (loss) | 1.99 | .21 | (.98) | .07 | .27 | 1.00 |
| Total from investment operations | 2.05 | .26 | (.93) | .12 | .34 | 1.10 |
| Distributions from net investment income | (.01) | (.04) | (.04) | (.02) | (.06) | (.07) |
| Distributions from net realized gain | – | – | – | – | (.01) | (.01) |
| Tax return of capital | – | – | – | – | – | (.01) |
| Total distributions | (.01) | (.04) | (.04) | (.02) | (.07) | (.09) |
| Redemption fees added to paid in capitalA | – | – | –B | –B | –B | –B |
| Net asset value, end of period | $10.43 | $8.39 | $8.17 | $9.14 | $9.04 | $8.77 |
| Total ReturnC,D,E | 24.51% | 3.13% | (10.15)% | 1.36% | 3.84% | 14.22% |
| Ratios to Average Net AssetsF,G | | | | | | |
| Expenses before reductions | 1.11%H | 1.16% | 1.17% | 1.20% | 1.23% | 1.47% |
| Expenses net of fee waivers, if any | 1.11%H | 1.16% | 1.17% | 1.20% | 1.20% | 1.20% |
| Expenses net of all reductions | 1.09%H | 1.15% | 1.16% | 1.19% | 1.18% | 1.15% |
| Net investment income (loss) | 1.19%H | .61% | .58% | .52% | .74% | 1.26% |
| Supplemental Data | | | | | | |
| Net assets, end of period (000 omitted) | $611 | $81 | $72 | $84 | $84 | $83 |
| Portfolio turnover rateI | 69%H | 86% | 106% | 96% | 110% | 198% |
A Calculated based on average shares outstanding during the period.
B Amount represents less than $.005 per share.
C Total returns for periods of less than one year are not annualized.
D Total returns do not reflect charges attributable to your insurance company's separate account. Inclusion of these charges would reduce the total returns shown.
E Total returns would have been lower if certain expenses had not been reduced during the applicable periods shown.
F Fees and expenses of any underlying Fidelity Central Funds are not included in the Fund's expense ratio. The Fund indirectly bears its proportionate share of the expenses of any underlying Fidelity Central Funds.
G Expense ratios reflect operating expenses of the class. Expenses before reductions do not reflect amounts reimbursed by the investment adviser or reductions from brokerage service arrangements or reductions from other expense offset arrangements and do not represent the amount paid by the class during periods when reimbursements or reductions occur. Expenses net of fee waivers reflect expenses after reimbursement by the investment adviser but prior to reductions from brokerage service arrangements or other expense offset arrangements. Expenses net of all reductions represent the net expenses paid by the class.
H Annualized
I Amount does not include the portfolio activity of any underlying Fidelity Central Funds.
See accompanying notes which are an integral part of the financial statements.
Financial Highlights — VIP Emerging Markets Portfolio Service Class 2
| | Six months ended (Unaudited) June 30, | Years ended December 31, | | | | |
| | 2017 | 2016 | 2015 | 2014 | 2013 | 2012 |
| Selected Per–Share Data | | | | | | |
| Net asset value, beginning of period | $8.38 | $8.15 | $9.12 | $9.03 | $8.77 | $7.76 |
| Income from Investment Operations | | | | | | |
| Net investment income (loss)A | .05 | .04 | .04 | .03 | .05 | .09 |
| Net realized and unrealized gain (loss) | 2.00 | .20 | (.98) | .07 | .27 | 1.00 |
| Total from investment operations | 2.05 | .24 | (.94) | .10 | .32 | 1.09 |
| Distributions from net investment income | (.01) | (.01) | (.03) | (.01) | (.06) | (.06) |
| Distributions from net realized gain | – | – | – | – | (.01) | (.01) |
| Tax return of capital | – | – | – | – | – | (.01) |
| Total distributions | (.01) | (.01) | (.03) | (.01) | (.06)B | (.08) |
| Redemption fees added to paid in capitalA | – | – | –C | –C | –C | –C |
| Net asset value, end of period | $10.42 | $8.38 | $8.15 | $9.12 | $9.03 | $8.77 |
| Total ReturnD,E,F | 24.51% | 2.95% | (10.31)% | 1.13% | 3.70% | 14.10% |
| Ratios to Average Net AssetsG,H | | | | | | |
| Expenses before reductions | 1.26%I | 1.31% | 1.32% | 1.35% | 1.38% | 1.63% |
| Expenses net of fee waivers, if any | 1.26%I | 1.31% | 1.32% | 1.35% | 1.35% | 1.35% |
| Expenses net of all reductions | 1.24%I | 1.30% | 1.30% | 1.34% | 1.32% | 1.30% |
| Net investment income (loss) | 1.04%I | .45% | .44% | .37% | .59% | 1.11% |
| Supplemental Data | | | | | | |
| Net assets, end of period (000 omitted) | $5,475 | $2,868 | $8,076 | $7,681 | $6,517 | $4,042 |
| Portfolio turnover rateJ | 69%I | 86% | 106% | 96% | 110% | 198% |
A Calculated based on average shares outstanding during the period.
B Total distributions of $.06 per share is comprised of distributions from net investment income of $.055 and distributions from net realized gain of $.008 per share.
C Amount represents less than $.005 per share.
D Total returns for periods of less than one year are not annualized.
E Total returns do not reflect charges attributable to your insurance company's separate account. Inclusion of these charges would reduce the total returns shown.
F Total returns would have been lower if certain expenses had not been reduced during the applicable periods shown.
G Fees and expenses of any underlying Fidelity Central Funds are not included in the Fund's expense ratio. The Fund indirectly bears its proportionate share of the expenses of any underlying Fidelity Central Funds.
H Expense ratios reflect operating expenses of the class. Expenses before reductions do not reflect amounts reimbursed by the investment adviser or reductions from brokerage service arrangements or reductions from other expense offset arrangements and do not represent the amount paid by the class during periods when reimbursements or reductions occur. Expenses net of fee waivers reflect expenses after reimbursement by the investment adviser but prior to reductions from brokerage service arrangements or other expense offset arrangements. Expenses net of all reductions represent the net expenses paid by the class.
I Annualized
J Amount does not include the portfolio activity of any underlying Fidelity Central Funds.
See accompanying notes which are an integral part of the financial statements.
Financial Highlights — VIP Emerging Markets Portfolio Investor Class
| | Six months ended (Unaudited) June 30, | Years ended December 31, | | | | |
| | 2017 | 2016 | 2015 | 2014 | 2013 | 2012 |
| Selected Per–Share Data | | | | | | |
| Net asset value, beginning of period | $8.32 | $8.11 | $9.07 | $8.98 | $8.71 | $7.72 |
| Income from Investment Operations | | | | | | |
| Net investment income (loss)A | .06 | .05 | .05 | .05 | .07 | .11 |
| Net realized and unrealized gain (loss) | 1.98 | .20 | (.96) | .07 | .27 | .98 |
| Total from investment operations | 2.04 | .25 | (.91) | .12 | .34 | 1.09 |
| Distributions from net investment income | (.01) | (.04) | (.05) | (.03) | (.06) | (.08) |
| Distributions from net realized gain | – | – | – | – | (.01) | (.01) |
| Tax return of capital | – | – | – | – | – | (.01) |
| Total distributions | (.01) | (.04) | (.05) | (.03) | (.07) | (.10) |
| Redemption fees added to paid in capitalA | – | – | –B | –B | –B | –B |
| Net asset value, end of period | $10.35 | $8.32 | $8.11 | $9.07 | $8.98 | $8.71 |
| Total ReturnC,D,E | 24.59% | 3.06% | (10.08)% | 1.30% | 3.90% | 14.14% |
| Ratios to Average Net AssetsF,G | | | | | | |
| Expenses before reductions | 1.10%H | 1.14% | 1.15% | 1.18% | 1.22% | 1.46% |
| Expenses net of fee waivers, if any | 1.10%H | 1.14% | 1.15% | 1.18% | 1.18% | 1.18% |
| Expenses net of all reductions | 1.07%H | 1.13% | 1.13% | 1.18% | 1.15% | 1.13% |
| Net investment income (loss) | 1.21%H | .63% | .61% | .54% | .76% | 1.28% |
| Supplemental Data | | | | | | |
| Net assets, end of period (000 omitted) | $143,680 | $93,982 | $76,045 | $69,854 | $54,761 | $46,967 |
| Portfolio turnover rateI | 69%H | 86% | 106% | 96% | 110% | 198% |
A Calculated based on average shares outstanding during the period.
B Amount represents less than $.005 per share.
C Total returns for periods of less than one year are not annualized.
D Total returns do not reflect charges attributable to your insurance company's separate account. Inclusion of these charges would reduce the total returns shown.
E Total returns would have been lower if certain expenses had not been reduced during the applicable periods shown.
F Fees and expenses of any underlying Fidelity Central Funds are not included in the Fund's expense ratio. The Fund indirectly bears its proportionate share of the expenses of any underlying Fidelity Central Funds.
G Expense ratios reflect operating expenses of the class. Expenses before reductions do not reflect amounts reimbursed by the investment adviser or reductions from brokerage service arrangements or reductions from other expense offset arrangements and do not represent the amount paid by the class during periods when reimbursements or reductions occur. Expenses net of fee waivers reflect expenses after reimbursement by the investment adviser but prior to reductions from brokerage service arrangements or other expense offset arrangements. Expenses net of all reductions represent the net expenses paid by the class.
H Annualized
I Amount does not include the portfolio activity of any underlying Fidelity Central Funds.
See accompanying notes which are an integral part of the financial statements.
Notes to Financial Statements (Unaudited)
For the period ended June 30, 2017
1. Organization.
VIP Emerging Markets Portfolio (the Fund) is a fund of Variable Insurance Products Fund II (the Trust) and is authorized to issue an unlimited number of shares. The Trust is registered under the Investment Company Act of 1940, as amended (the 1940 Act), as an open-end management investment company organized as a Massachusetts business trust. Shares of the Fund may only be purchased by insurance companies for the purpose of funding variable annuity or variable life insurance contracts. The Fund offers the following classes of shares: Initial Class shares, Service Class shares, Service Class 2 shares and Investor Class shares. All classes have equal rights and voting privileges, except for matters affecting a single class. The Fund's investments in emerging markets can be subject to social, economic, regulatory, and political uncertainties and can be extremely volatile.
2. Investments in Fidelity Central Funds.
The Fund invests in Fidelity Central Funds, which are open-end investment companies generally available only to other investment companies and accounts managed by the investment adviser and its affiliates. The Fund's Schedule of Investments lists each of the Fidelity Central Funds held as of period end, if any, as an investment of the Fund, but does not include the underlying holdings of each Fidelity Central Fund. As an Investing Fund, the Fund indirectly bears its proportionate share of the expenses of the underlying Fidelity Central Funds.
The Money Market Central Funds seek preservation of capital and current income and are managed by Fidelity Investments Money Management, Inc. (FIMM), an affiliate of the investment adviser. Annualized expenses of the Money Market Central Funds as of their most recent shareholder report date are less than .005%.
A complete unaudited list of holdings for each Fidelity Central Fund is available upon request or at the Securities and Exchange Commission (the SEC) website at www.sec.gov. In addition, the financial statements of the Fidelity Central Funds are available on the SEC website or upon request.
3. Significant Accounting Policies.
The Fund is an investment company and applies the accounting and reporting guidance of the Financial Accounting Standards Board (FASB) Accounting Standards Codification Topic 946 Financial Services – Investments Companies. The financial statements have been prepared in conformity with accounting principles generally accepted in the United States of America (GAAP), which require management to make certain estimates and assumptions at the date of the financial statements. Actual results could differ from those estimates. Subsequent events, if any, through the date that the financial statements were issued have been evaluated in the preparation of the financial statements. The following summarizes the significant accounting policies of the Fund:
Investment Valuation. Investments are valued as of 4:00 p.m. Eastern time on the last calendar day of the period. The Board of Trustees (the Board) has delegated the day to day responsibility for the valuation of the Fund's investments to the Fair Value Committee (the Committee) established by the Fund's investment adviser. In accordance with valuation policies and procedures approved by the Board, the Fund attempts to obtain prices from one or more third party pricing vendors or brokers to value its investments. When current market prices, quotations or currency exchange rates are not readily available or reliable, investments will be fair valued in good faith by the Committee, in accordance with procedures adopted by the Board. Factors used in determining fair value vary by investment type and may include market or investment specific events. The frequency with which these procedures are used cannot be predicted and they may be utilized to a significant extent. The Committee oversees the Fund's valuation policies and procedures and reports to the Board on the Committee's activities and fair value determinations. The Board monitors the appropriateness of the procedures used in valuing the Fund's investments and ratifies the fair value determinations of the Committee.
The Fund categorizes the inputs to valuation techniques used to value its investments into a disclosure hierarchy consisting of three levels as shown below:
- Level 1 – quoted prices in active markets for identical investments
- Level 2 – other significant observable inputs (including quoted prices for similar investments, interest rates, prepayment speeds, etc.)
- Level 3 – unobservable inputs (including the Fund's own assumptions based on the best information available)
Valuation techniques used to value the Fund's investments by major category are as follows:
Equity securities, including restricted securities, for which market quotations are readily available, are valued at the last reported sale price or official closing price as reported by a third party pricing vendor on the primary market or exchange on which they are traded and are categorized as Level 1 in the hierarchy. In the event there were no sales during the day or closing prices are not available, securities are valued at the last quoted bid price or may be valued using the last available price and are generally categorized as Level 2 in the hierarchy. For foreign equity securities, when market or security specific events arise, comparisons to the valuation of American Depositary Receipts (ADRs), futures contracts, Exchange-Traded Funds (ETFs) and certain indexes as well as quoted prices for similar securities may be used and would be categorized as Level 2 in the hierarchy. Utilizing these techniques may result in transfers between Level 1 and Level 2. For equity securities, including restricted securities, where observable inputs are limited, assumptions about market activity and risk are used and these securities may be categorized as Level 3 in the hierarchy.
Investments in open-end mutual funds, including the Fidelity Central Funds, are valued at their closing net asset value (NAV) each business day and are categorized as Level 1 in the hierarchy.
Changes in valuation techniques may result in transfers in or out of an assigned level within the disclosure hierarchy. The aggregate value of investments by input level as of June 30, 2017, including information on transfers between Levels 1 and 2, is included at the end of the Fund's Schedule of Investments.
Foreign Currency. The Fund may use foreign currency contracts to facilitate transactions in foreign-denominated securities. Gains and losses from these transactions may arise from changes in the value of the foreign currency or if the counterparties do not perform under the contracts' terms.
Foreign-denominated assets, including investment securities, and liabilities are translated into U.S. dollars at the exchange rates at period end. Purchases and sales of investment securities, income and dividends received and expenses denominated in foreign currencies are translated into U.S. dollars at the exchange rate in effect on the transaction date.
The effects of exchange rate fluctuations on investments are included with the net realized and unrealized gain (loss) on investment securities. Other foreign currency transactions resulting in realized and unrealized gain (loss) are disclosed separately.
Investment Transactions and Income. For financial reporting purposes, the Fund's investment holdings and NAV include trades executed through the end of the last business day of the period. The NAV per share for processing shareholder transactions is calculated as of the close of business of the New York Stock Exchange (NYSE), normally 4:00 p.m. Eastern time and includes trades executed through the end of the prior business day. Gains and losses on securities sold are determined on the basis of identified cost. Dividend income is recorded on the ex-dividend date, except for certain dividends from foreign securities where the ex-dividend date may have passed, which are recorded as soon as the Fund is informed of the ex-dividend date. Non-cash dividends included in dividend income, if any, are recorded at the fair market value of the securities received. Income and capital gain distributions from Fidelity Central Funds, if any, are recorded on the ex-dividend date. Certain distributions received by the Fund represent a return of capital or capital gain. The Fund determines the components of these distributions subsequent to the ex-dividend date, based upon receipt of tax filings or other correspondence relating to the underlying investment. These distributions are recorded as a reduction of cost of investments and/or as a realized gain. Investment income is recorded net of foreign taxes withheld where recovery of such taxes is uncertain.
Class Allocations and Expenses. Investment income, realized and unrealized capital gains and losses, common expenses of the Fund, and certain fund-level expense reductions, if any, are allocated daily on a pro-rata basis to each class based on the relative net assets of each class to the total net assets of the Fund. Each class differs with respect to transfer agent and distribution and service plan fees incurred. Certain expense reductions may also differ by class. For the reporting period, the allocated portion of income and expenses to each class as a percent of its average net assets may vary due to the timing of recording these transactions in relation to fluctuating net assets of the classes. Expenses directly attributable to a fund are charged to that fund. Expenses attributable to more than one fund are allocated among the respective funds on the basis of relative net assets or other appropriate methods. Expense estimates are accrued in the period to which they relate and adjustments are made when actual amounts are known.
Income Tax Information and Distributions to Shareholders. Each year, the Fund intends to qualify as a regulated investment company under Subchapter M of the Internal Revenue Code, including distributing substantially all of its taxable income and realized gains. As a result, no provision for U.S. Federal income taxes is required. The Fund files a U.S. federal tax return, in addition to state and local tax returns as required. The Fund's federal income tax returns are subject to examination by the Internal Revenue Service (IRS) for a period of three fiscal years after they are filed. State and local tax returns may be subject to examination for an additional fiscal year depending on the jurisdiction. Foreign taxes are provided for based on the Fund's understanding of the tax rules and rates that exist in the foreign markets in which it invests. The Fund is subject to a tax imposed on capital gains by certain countries in which it invests. An estimated deferred tax liability for net unrealized appreciation on the applicable securities is included in Other payables and accrued expenses on the Statement of Assets & Liabilities.
Distributions are declared and recorded on the ex-dividend date. Income dividends and capital gain distributions are declared separately for each class. Income and capital gain distributions are determined in accordance with income tax regulations, which may differ from GAAP.
Capital accounts within the financial statements are adjusted for permanent book-tax differences. These adjustments have no impact on net assets or the results of operations. Capital accounts are not adjusted for temporary book-tax differences which will reverse in a subsequent period.
Book-tax differences are primarily due to foreign currency transactions, certain foreign taxes, passive foreign investment companies (PFIC), capital loss carryforwards, expiring capital loss carryforwards, and losses deferred due to wash sales and excise tax regulations.
The federal tax cost of investment securities and unrealized appreciation (depreciation) as of period end were as follows:
| Gross unrealized appreciation | $78,639,680 |
| Gross unrealized depreciation | (1,901,395) |
| Net unrealized appreciation (depreciation) on securities | $76,738,285 |
| Tax cost | $228,900,661 |
Capital loss carryforwards are only available to offset future capital gains of the Fund to the extent provided by regulations and may be limited. Under the Regulated Investment Company Modernization Act of 2010 (the Act), the Fund is permitted to carry forward capital losses incurred in taxable years beginning after December 22, 2010 for an unlimited period and such capital losses are required to be used prior to any losses that expire. The capital loss carryforward information presented below, including any applicable limitation, is estimated as of prior fiscal period end and is subject to adjustment.
| Fiscal year of expiration | |
| 2017 | $(2,824,257) |
| Total with expiration | (2,824,257) |
| No expiration | |
| Short-term | (23,659,933) |
| Long-term | (4,198,594) |
| Total no expiration | (27,858,527) |
| Total capital loss carryforward | $(30,682,784) |
Restricted Securities. The Fund may invest in securities that are subject to legal or contractual restrictions on resale. These securities generally may be resold in transactions exempt from registration or to the public if the securities are registered. Disposal of these securities may involve time-consuming negotiations and expense, and prompt sale at an acceptable price may be difficult. Information regarding restricted securities is included at the end of the Fund's Schedule of Investments.
4. Purchases and Sales of Investments.
Purchases and sales of securities, other than short-term securities, aggregated $110,397,082 and $90,368,242, respectively.
5. Fees and Other Transactions with Affiliates.
Management Fee. Fidelity Management & Research Company (the investment adviser) and its affiliates provide the Fund with investment management related services for which the Fund pays a monthly management fee. The management fee is the sum of an individual fund fee rate that is based on an annual rate of .55% of the Fund's average net assets and an annualized group fee rate that averaged .25% during the period. The group fee rate is based upon the average net assets of all the mutual funds advised by the investment adviser, including any mutual funds previously advised by the investment adviser that are currently advised by Fidelity SelectCo, LLC, an affiliate of the investment adviser. The group fee rate decreases as assets under management increase and increases as assets under management decrease. For the reporting period, the total annualized management fee rate was .79% of the Fund's average net assets.
Distribution and Service Plan Fees. In accordance with Rule 12b-1 of the 1940 Act, the Fund has adopted separate 12b-1 Plans for each Service Class of shares. Each Service Class pays Fidelity Distributors Corporation (FDC), an affiliate of the investment adviser, a service fee. For the period, the service fee is based on an annual rate of .10% of Service Class' average net assets and .25% of Service Class 2's average net assets.
For the period, total fees, all of which were re-allowed to insurance companies for the distribution of shares and providing shareholder support services, were as follows:
| Service Class | $137 |
| Service Class 2 | 4,529 |
| | $4,666 |
Transfer Agent Fees. Fidelity Investments Institutional Operations Company, Inc. (FIIOC), an affiliate of the investment adviser, is the Fund's transfer, dividend disbursing, and shareholder servicing agent. FIIOC receives an asset-based fee with respect to each class. Each class pays a fee for transfer agent services, typesetting and printing and mailing of shareholder reports, excluding mailing of proxy statements, equal to an annual rate of class-level average net assets. The annual rate for Investor Class is .15% and the annual rate for all other classes is .07%. For the period, transfer agent fees for each class were as follows:
| Initial Class | $48,900 |
| Service Class | 91 |
| Service Class 2 | 1,196 |
| Investor Class | 84,536 |
| | $134,723 |
Accounting and Security Lending Fees. Fidelity Service Company, Inc. (FSC), an affiliate of the investment adviser, maintains the Fund's accounting records. The accounting fee is based on the level of average net assets for each month. Under a separate contract, FSC administers the security lending program. The security lending fee is based on the number and duration of lending transactions.
Brokerage Commissions. The Fund placed a portion of its portfolio transactions with brokerage firms which are affiliates of the investment adviser. Brokerage commissions are included in net realized gain (loss) and change in net unrealized appreciation (depreciation) in the Statement of Operations. The commissions paid to these affiliated firms were $802 for the period.
Interfund Trades. The Fund may purchase from or sell securities to other Fidelity Funds under procedures adopted by the Board. The procedures have been designed to ensure these interfund trades are executed in accordance with Rule 17a-7 of the 1940 Act. Interfund trades are included within the respective purchases and sales amounts shown in the Purchases and Sales of Investments note.
6. Committed Line of Credit.
The Fund participates with other funds managed by the investment adviser or an affiliate in a $4.25 billion credit facility (the "line of credit") to be utilized for temporary or emergency purposes to fund shareholder redemptions or for other short-term liquidity purposes. The Fund has agreed to pay commitment fees on its pro-rata portion of the line of credit, which amounted to $407 and is reflected in Miscellaneous expenses on the Statement of Operations. During the period, the Fund did not borrow on this line of credit.
7. Security Lending.
The Fund lends portfolio securities through a lending agent from time to time in order to earn additional income. For equity securities, a lending agent is used and may loan securities to certain qualified borrowers, including Fidelity Capital Markets (FCM), a broker-dealer affiliated with the Fund. On the settlement date of the loan, the Fund receives collateral (in the form of U.S. Treasury obligations, letters of credit and/or cash) against the loaned securities and maintains collateral in an amount not less than 100% of the market value of the loaned securities during the period of the loan. The market value of the loaned securities is determined at the close of business of the Fund and any additional required collateral is delivered to the Fund on the next business day. The Fund or borrower may terminate the loan at any time, and if the borrower defaults on its obligation to return the securities loaned because of insolvency or other reasons, the Fund may apply collateral received from the borrower against the obligation. The Fund may experience delays and costs in recovering the securities loaned. Any cash collateral received is invested in the Fidelity Securities Lending Cash Central Fund. The value of loaned securities and cash collateral at period end are disclosed on the Fund's Statement of Assets and Liabilities. At period end, there were no security loans outstanding with FCM. Security lending income represents the income earned on investing cash collateral, less rebates paid to borrowers and any lending agent fees associated with the loan, plus any premium payments received for lending certain types of securities. Security lending income is presented in the Statement of Operations as a component of income from Fidelity Central Funds. Total security lending income during the period amounted to $6,485, including $3,415 from securities loaned to FCM.
8. Expense Reductions.
Commissions paid to certain brokers with whom the investment adviser, or its affiliates, places trades on behalf of the Fund include an amount in addition to trade execution, which may be rebated back to the Fund to offset certain expenses. This amount totaled $29,096 for the period.
In addition, during the period the investment adviser reimbursed and/or waived a portion of fund-level operating expenses in the amount of $1,028.
9. Distributions to Shareholders.
Distributions to shareholders of each class were as follows:
| | Six months ended
June 30, 2017 | Year ended December 31, 2016 |
| From net investment income | | |
| Initial Class | $238,616 | $679,873 |
| Service Class | 148 | 291 |
| Service Class 2 | 4,214 | 3,358 |
| Investor Class | 162,081 | 426,973 |
| Total | $405,059 | $1,110,495 |
10. Share Transactions.
Transactions for each class of shares were as follows:
| | Shares | Shares | Dollars | Dollars |
| | Six months ended
June 30, 2017 | Year ended December 31, 2016 | Six months ended
June 30, 2017 | Year ended December 31, 2016 |
| Initial Class | | | | |
| Shares sold | 1,757,049 | 4,689,958 | $16,661,595 | $38,480,671 |
| Reinvestment of distributions | 26,454 | 82,309 | 238,616 | 679,873 |
| Shares redeemed | (2,623,142) | (2,767,616) | (25,136,286) | (23,746,125) |
| Net increase (decrease) | (839,639) | 2,004,651 | $(8,236,075) | $15,414,419 |
| Service Class | | | | |
| Shares sold | 49,826 | 1,379 | $490,399 | $11,573 |
| Reinvestment of distributions | 16 | 35 | 148 | 291 |
| Shares redeemed | (1,012) | (508) | (10,360) | (3,718) |
| Net increase (decrease) | 48,830 | 906 | $480,187 | $8,146 |
| Service Class 2 | | | | |
| Shares sold | 220,625 | 162,060 | $2,216,512 | $1,326,312 |
| Reinvestment of distributions | 466 | 405 | 4,214 | 3,358 |
| Shares redeemed | (37,948) | (810,748) | (366,152) | (6,802,720) |
| Net increase (decrease) | 183,143 | (648,283) | $1,854,574 | $(5,473,050) |
| Investor Class | | | | |
| Shares sold | 3,996,824 | 3,757,797 | $39,041,023 | $31,598,034 |
| Reinvestment of distributions | 18,029 | 51,880 | 162,081 | 426,973 |
| Shares redeemed | (1,430,976) | (1,895,883) | (13,507,915) | (15,977,139) |
| Net increase (decrease) | 2,583,877 | 1,913,794 | $25,695,189 | $16,047,868 |
11. Other.
The Fund's organizational documents provide former and current trustees and officers with a limited indemnification against liabilities arising in connection with the performance of their duties to the Fund. In the normal course of business, the Fund may also enter into contracts that provide general indemnifications. The Fund's maximum exposure under these arrangements is unknown as this would be dependent on future claims that may be made against the Fund. The risk of material loss from such claims is considered remote.
At the end of the period, the investment adviser or its affiliates were the owners of record of 29% of the total outstanding shares of the Fund. VIP Freedom 2020 Portfolio was the owner of record of approximately 19% of the total outstanding shares of the Fund. Mutual funds managed by the investment adviser or its affiliates were the owners of record, in the aggregate, of approximately 68% of the total outstanding shares of the Fund.
Shareholder Expense Example
As a shareholder of the Fund, you incur two types of costs: (1) transaction costs, and (2) ongoing costs, including management fees, distribution and/or service (12b-1) fees and other Fund expenses. This Example is intended to help you understand your ongoing costs (in dollars) of investing in the Fund and to compare these costs with the ongoing costs of investing in other mutual funds.
The Example is based on an investment of $1,000 invested at the beginning of the period and held for the entire period (January 1, 2017 to June 30, 2017).
Actual Expenses
The first line of the accompanying table for each class of the Fund provides information about actual account values and actual expenses. You may use the information in this line, together with the amount you invested, to estimate the expenses that you paid over the period. Simply divide your account value by $1,000.00 (for example, an $8,600 account value divided by $1,000.00 = 8.6), then multiply the result by the number in the first line for a class of the Fund under the heading entitled "Expenses Paid During Period" to estimate the expenses you paid on your account during this period. The estimate of expenses does not include any fees or other expenses of any variable annuity or variable life insurance product. If they were, the estimate of expenses you paid during the period would be higher, and your ending account value would be lower. In addition, the Fund, as a shareholder in the underlying Fidelity Central Funds, will indirectly bear its pro-rata share of the fees and expenses incurred by the underlying Fidelity Central Funds. These fees and expenses are not included in the Fund's annualized expense ratio used to calculate the expense estimate in the table below.
Hypothetical Example for Comparison Purposes
The second line of the accompanying table for each class of the Fund provides information about hypothetical account values and hypothetical expenses based on a Class' actual expense ratio and an assumed rate of return of 5% per year before expenses, which is not the Class' actual return. The hypothetical account values and expenses may not be used to estimate the actual ending account balance or expenses you paid for the period. You may use this information to compare the ongoing costs of investing in the Fund and other funds. To do so, compare this 5% hypothetical example with the 5% hypothetical examples that appear in the shareholder reports of the other funds. The estimate of expenses does not include any fees or other expenses of any variable annuity or variable life insurance product. If they were, the estimate of expenses you paid during the period would be higher, and your ending account value would be lower. In addition, the Fund, as a shareholder in the underlying Fidelity Central Funds, will indirectly bear its pro-rata share of the fees and expenses incurred by the underlying Fidelity Central Funds. These fees and expenses are not included in the Fund's annualized expense ratio used to calculate the expense estimate in the table below.
Please note that the expenses shown in the table are meant to highlight your ongoing costs only and do not reflect any transaction costs. Therefore, the second line of the table is useful in comparing ongoing costs only, and will not help you determine the relative total costs of owning different funds.
| | Annualized Expense Ratio-A | Beginning
Account Value
January 1, 2017 | Ending
Account Value
June 30, 2017 | Expenses Paid
During Period-B
January 1, 2017
to June 30, 2017 |
| Initial Class | 1.02% | | | |
| Actual | | $1,000.00 | $1,246.10 | $5.68 |
| Hypothetical-C | | $1,000.00 | $1,019.74 | $5.11 |
| Service Class | 1.11% | | | |
| Actual | | $1,000.00 | $1,245.10 | $6.18 |
| Hypothetical-C | | $1,000.00 | $1,019.29 | $5.56 |
| Service Class 2 | 1.26% | | | |
| Actual | | $1,000.00 | $1,245.10 | $7.01 |
| Hypothetical-C | | $1,000.00 | $1,018.55 | $6.31 |
| Investor Class | 1.10% | | | |
| Actual | | $1,000.00 | $1,245.90 | $6.13 |
| Hypothetical-C | | $1,000.00 | $1,019.34 | $5.51 |
| | | | | |
A Annualized expense ratio reflects expenses net of applicable fee waivers.
B Expenses are equal to each Class' annualized expense ratio, multiplied by the average account value over the period, multiplied by 181/365 (to reflect the one-half year period).
C 5% return per year before expenses
VIPEM-SANN-0817
1.858138.109
Fidelity® Variable Insurance Products: Index 500 Portfolio
Semi-Annual Report June 30, 2017 |
|
Contents
To view a fund's proxy voting guidelines and proxy voting record for the 12-month period ended June 30, visit http://www.fidelity.com/proxyvotingresults or visit the Securities and Exchange Commission's (SEC) web site at http://www.sec.gov.
You may also call 1-877-208-0098 to request a free copy of the proxy voting guidelines.
Fidelity® Variable Insurance Products are separate account options which are purchased through a variable insurance contract.
Standard & Poor's, S&P and S&P 500 are registered service marks of The McGraw-Hill Companies, Inc. and have been licensed for use by Fidelity Distributors Corporation.
Other third-party marks appearing herein are the property of their respective owners.
All other marks appearing herein are registered or unregistered trademarks or service marks of FMR LLC or an affiliated company. © 2017 FMR LLC. All rights reserved.
This report and the financial statements contained herein are submitted for the general information of the shareholders of the Fund. This report is not authorized for distribution to prospective investors in the Fund unless preceded or accompanied by an effective prospectus.
A fund files its complete schedule of portfolio holdings with the SEC for the first and third quarters of each fiscal year on Form N-Q. Forms N-Q are available on the SEC’s web site at http://www.sec.gov. A fund's Forms N-Q may be reviewed and copied at the SEC’s Public Reference Room in Washington, DC. Information regarding the operation of the SEC's Public Reference Room may be obtained by calling 1-800-SEC-0330.
For a complete list of a fund's portfolio holdings, view the most recent holdings listing, semiannual report, or annual report on Fidelity's web site at http://www.fidelity.com, http://www.institutional.fidelity.com, or http://www.401k.com, as applicable.
NOT FDIC INSURED •MAY LOSE VALUE •NO BANK GUARANTEE
Neither the Fund nor Fidelity Distributors Corporation is a bank.
Investment Summary (Unaudited)
Top Ten Stocks as of June 30, 2017
| | % of fund's net assets | % of fund's net assets 6 months ago |
| Apple, Inc. | 3.6 | 3.2 |
| Microsoft Corp. | 2.5 | 2.5 |
| Amazon.com, Inc. | 1.9 | 1.5 |
| Facebook, Inc. Class A | 1.7 | 1.4 |
| Johnson & Johnson | 1.7 | 1.6 |
| Exxon Mobil Corp. | 1.6 | 1.9 |
| JPMorgan Chase & Co. | 1.6 | 1.6 |
| Berkshire Hathaway, Inc. Class B | 1.6 | 1.6 |
| Alphabet, Inc. Class A | 1.3 | 1.2 |
| Alphabet, Inc. Class C | 1.3 | 1.2 |
| | 18.8 | |
Top Market Sectors as of June 30, 2017
| | % of fund's net assets | % of fund's net assets 6 months ago |
| Information Technology | 22.2 | 20.6 |
| Financials | 14.5 | 14.7 |
| Health Care | 14.5 | 13.5 |
| Consumer Discretionary | 12.2 | 11.9 |
| Industrials | 10.2 | 10.2 |
| Consumer Staples | 9.0 | 9.3 |
| Energy | 6.0 | 7.5 |
| Utilities | 3.2 | 3.1 |
| Real Estate | 2.9 | 2.9 |
| Materials | 2.8 | 2.8 |
Asset Allocation (% of fund's net assets)
| As of June 30, 2017* |
| | Stocks and Equity Futures | 100.0% |

* Foreign investments - 4.7%
| As of December 31, 2016* |
| | Stocks and Equity Futures | 100.0% |

* Foreign investments - 4.3%
Investments June 30, 2017 (Unaudited)
Showing Percentage of Net Assets
| Common Stocks - 99.6% | | | |
| | | Shares | Value |
| CONSUMER DISCRETIONARY - 12.2% | | | |
| Auto Components - 0.2% | | | |
| BorgWarner, Inc. (a) | | 67,174 | $2,845,491 |
| Delphi Automotive PLC | | 90,208 | 7,906,731 |
| The Goodyear Tire & Rubber Co. | | 84,787 | 2,964,154 |
| | | | 13,716,376 |
| Automobiles - 0.5% | | | |
| Ford Motor Co. | | 1,317,005 | 14,737,286 |
| General Motors Co. | | 462,418 | 16,152,261 |
| Harley-Davidson, Inc. (a) | | 58,941 | 3,183,993 |
| | | | 34,073,540 |
| Distributors - 0.1% | | | |
| Genuine Parts Co. | | 49,632 | 4,603,864 |
| LKQ Corp. (b) | | 103,809 | 3,420,507 |
| | | | 8,024,371 |
| Diversified Consumer Services - 0.0% | | | |
| H&R Block, Inc. | | 69,760 | 2,156,282 |
| Hotels, Restaurants & Leisure - 1.8% | | | |
| Carnival Corp. | | 140,943 | 9,241,633 |
| Chipotle Mexican Grill, Inc. (a)(b) | | 9,652 | 4,016,197 |
| Darden Restaurants, Inc. | | 41,869 | 3,786,632 |
| Hilton, Inc. | | 68,997 | 4,267,464 |
| Marriott International, Inc. Class A | | 104,620 | 10,494,432 |
| McDonald's Corp. | | 274,460 | 42,036,294 |
| Royal Caribbean Cruises Ltd. | | 56,490 | 6,170,403 |
| Starbucks Corp. | | 487,622 | 28,433,239 |
| Wyndham Worldwide Corp. (a) | | 35,139 | 3,528,307 |
| Wynn Resorts Ltd. | | 26,886 | 3,605,950 |
| Yum! Brands, Inc. | | 111,397 | 8,216,643 |
| | | | 123,797,194 |
| Household Durables - 0.5% | | | |
| D.R. Horton, Inc. | | 115,087 | 3,978,558 |
| Garmin Ltd. (a) | | 38,632 | 1,971,391 |
| Leggett & Platt, Inc. | | 44,552 | 2,340,317 |
| Lennar Corp. Class A | | 68,421 | 3,648,208 |
| Mohawk Industries, Inc. (b) | | 21,272 | 5,141,230 |
| Newell Brands, Inc. | | 162,675 | 8,722,634 |
| PulteGroup, Inc. | | 95,616 | 2,345,460 |
| Whirlpool Corp. | | 24,908 | 4,772,871 |
| | | | 32,920,669 |
| Internet & Direct Marketing Retail - 2.7% | | | |
| Amazon.com, Inc. (b) | | 133,588 | 129,313,184 |
| Expedia, Inc. | | 40,936 | 6,097,417 |
| Netflix, Inc. (b) | | 145,133 | 21,684,322 |
| Priceline Group, Inc. (b) | | 16,557 | 30,970,200 |
| TripAdvisor, Inc. (a)(b) | | 37,187 | 1,420,543 |
| | | | 189,485,666 |
| Leisure Products - 0.1% | | | |
| Hasbro, Inc. | | 37,883 | 4,224,333 |
| Mattel, Inc. | | 115,350 | 2,483,486 |
| | | | 6,707,819 |
| Media - 3.0% | | | |
| CBS Corp. Class B | | 124,038 | 7,911,144 |
| Charter Communications, Inc. Class A (b) | | 72,628 | 24,464,742 |
| Comcast Corp. Class A | | 1,593,657 | 62,025,130 |
| Discovery Communications, Inc.: | | | |
| Class A (a)(b) | | 51,779 | 1,337,452 |
| Class C (non-vtg.) (b) | | 70,994 | 1,789,759 |
| DISH Network Corp. Class A (b) | | 76,598 | 4,807,290 |
| Interpublic Group of Companies, Inc. | | 133,046 | 3,272,932 |
| News Corp.: | | | |
| Class A | | 128,693 | 1,763,094 |
| Class B | | 40,332 | 570,698 |
| Omnicom Group, Inc. (a) | | 78,372 | 6,497,039 |
| Scripps Networks Interactive, Inc. Class A (a) | | 32,295 | 2,206,071 |
| The Walt Disney Co. | | 489,861 | 52,047,731 |
| Time Warner, Inc. | | 261,149 | 26,221,971 |
| Twenty-First Century Fox, Inc.: | | | |
| Class A | | 354,354 | 10,042,392 |
| Class B | | 164,022 | 4,571,293 |
| Viacom, Inc. Class B (non-vtg.) | | 118,631 | 3,982,443 |
| | | | 213,511,181 |
| Multiline Retail - 0.4% | | | |
| Dollar General Corp. | | 84,953 | 6,124,262 |
| Dollar Tree, Inc. (b) | | 79,701 | 5,572,694 |
| Kohl's Corp. (a) | | 57,406 | 2,219,890 |
| Macy's, Inc. | | 102,537 | 2,382,960 |
| Nordstrom, Inc. (a) | | 37,463 | 1,791,855 |
| Target Corp. | | 185,778 | 9,714,332 |
| | | | 27,805,993 |
| Specialty Retail - 2.2% | | | |
| Advance Auto Parts, Inc. | | 24,866 | 2,899,127 |
| AutoNation, Inc. (a)(b) | | 22,164 | 934,434 |
| AutoZone, Inc. (a)(b) | | 9,481 | 5,408,531 |
| Bed Bath & Beyond, Inc. (a) | | 48,878 | 1,485,891 |
| Best Buy Co., Inc. | | 89,341 | 5,121,920 |
| CarMax, Inc. (a)(b) | | 62,366 | 3,932,800 |
| Foot Locker, Inc. | | 44,190 | 2,177,683 |
| Gap, Inc. (a) | | 74,122 | 1,629,943 |
| Home Depot, Inc. | | 402,582 | 61,756,079 |
| L Brands, Inc. (a) | | 81,135 | 4,372,365 |
| Lowe's Companies, Inc. | | 288,937 | 22,401,286 |
| O'Reilly Automotive, Inc. (a)(b) | | 30,644 | 6,703,069 |
| Ross Stores, Inc. | | 131,999 | 7,620,302 |
| Signet Jewelers Ltd. (a) | | 23,032 | 1,456,544 |
| Staples, Inc. | | 219,942 | 2,214,816 |
| Tiffany & Co., Inc. (a) | | 36,097 | 3,388,425 |
| TJX Companies, Inc. | | 216,612 | 15,632,888 |
| Tractor Supply Co. | | 43,292 | 2,346,859 |
| Ulta Beauty, Inc. (b) | | 19,635 | 5,641,921 |
| | | | 157,124,883 |
| Textiles, Apparel & Luxury Goods - 0.7% | | | |
| Coach, Inc. | | 94,665 | 4,481,441 |
| Hanesbrands, Inc. (a) | | 122,622 | 2,839,926 |
| Michael Kors Holdings Ltd. (b) | | 52,476 | 1,902,255 |
| NIKE, Inc. Class B | | 446,246 | 26,328,514 |
| PVH Corp. | | 26,267 | 3,007,572 |
| Ralph Lauren Corp. | | 18,559 | 1,369,654 |
| Under Armour, Inc.: | | | |
| Class A (sub. vtg.) (a)(b) | | 62,185 | 1,353,146 |
| Class C (non-vtg.) (a) | | 62,074 | 1,251,412 |
| VF Corp. (a) | | 107,877 | 6,213,715 |
| | | | 48,747,635 |
|
| TOTAL CONSUMER DISCRETIONARY | | | 858,071,609 |
|
| CONSUMER STAPLES - 9.0% | | | |
| Beverages - 2.1% | | | |
| Brown-Forman Corp. Class B (non-vtg.) | | 59,564 | 2,894,810 |
| Constellation Brands, Inc. Class A (sub. vtg.) | | 57,732 | 11,184,420 |
| Dr. Pepper Snapple Group, Inc. | | 61,896 | 5,639,345 |
| Molson Coors Brewing Co. Class B | | 62,181 | 5,368,708 |
| Monster Beverage Corp. (b) | | 135,752 | 6,744,159 |
| PepsiCo, Inc. | | 481,022 | 55,553,231 |
| The Coca-Cola Co. | | 1,294,837 | 58,073,439 |
| | | | 145,458,112 |
| Food & Staples Retailing - 1.9% | | | |
| Costco Wholesale Corp. | | 147,688 | 23,619,742 |
| CVS Health Corp. | | 343,061 | 27,602,688 |
| Kroger Co. | | 307,303 | 7,166,306 |
| Sysco Corp. | | 165,801 | 8,344,764 |
| Wal-Mart Stores, Inc. | | 497,389 | 37,642,400 |
| Walgreens Boots Alliance, Inc. | | 287,553 | 22,518,275 |
| Whole Foods Market, Inc. | | 107,608 | 4,531,373 |
| | | | 131,425,548 |
| Food Products - 1.4% | | | |
| Archer Daniels Midland Co. | | 192,162 | 7,951,664 |
| Campbell Soup Co. | | 64,571 | 3,367,378 |
| ConAgra Foods, Inc. | | 136,116 | 4,867,508 |
| General Mills, Inc. | | 194,003 | 10,747,766 |
| Hormel Foods Corp. (a) | | 90,832 | 3,098,280 |
| Kellogg Co. (a) | | 84,924 | 5,898,821 |
| McCormick & Co., Inc. (non-vtg.) (a) | | 38,127 | 3,717,764 |
| Mondelez International, Inc. | | 510,916 | 22,066,462 |
| The Hershey Co. | | 47,140 | 5,061,422 |
| The J.M. Smucker Co. | | 39,204 | 4,639,009 |
| The Kraft Heinz Co. | | 200,908 | 17,205,761 |
| Tyson Foods, Inc. Class A | | 97,044 | 6,077,866 |
| | | | 94,699,701 |
| Household Products - 1.7% | | | |
| Church & Dwight Co., Inc. | | 83,932 | 4,354,392 |
| Clorox Co. | | 43,370 | 5,778,619 |
| Colgate-Palmolive Co. | | 297,433 | 22,048,708 |
| Kimberly-Clark Corp. | | 119,516 | 15,430,711 |
| Procter & Gamble Co. | | 861,231 | 75,056,282 |
| | | | 122,668,712 |
| Personal Products - 0.1% | | | |
| Coty, Inc. Class A (a) | | 158,605 | 2,975,430 |
| Estee Lauder Companies, Inc. Class A | | 75,385 | 7,235,452 |
| | | | 10,210,882 |
| Tobacco - 1.8% | | | |
| Altria Group, Inc. | | 650,447 | 48,438,788 |
| Philip Morris International, Inc. | | 522,993 | 61,425,528 |
| Reynolds American, Inc. | | 278,644 | 18,123,006 |
| | | | 127,987,322 |
|
| TOTAL CONSUMER STAPLES | | | 632,450,277 |
|
| ENERGY - 6.0% | | | |
| Energy Equipment & Services - 0.9% | | | |
| Baker Hughes, Inc. | | 143,274 | 7,809,866 |
| Halliburton Co. | | 292,239 | 12,481,528 |
| Helmerich & Payne, Inc. (a) | | 36,558 | 1,986,562 |
| National Oilwell Varco, Inc. (a) | | 127,972 | 4,215,398 |
| Schlumberger Ltd. | | 467,882 | 30,805,351 |
| TechnipFMC PLC (b) | | 157,117 | 4,273,582 |
| Transocean Ltd. (United States) (a)(b) | | 131,677 | 1,083,702 |
| | | | 62,655,989 |
| Oil, Gas & Consumable Fuels - 5.1% | | | |
| Anadarko Petroleum Corp. | | 188,684 | 8,554,933 |
| Apache Corp. (a) | | 128,083 | 6,139,018 |
| Cabot Oil & Gas Corp. | | 156,757 | 3,931,466 |
| Chesapeake Energy Corp. (a)(b) | | 256,851 | 1,276,549 |
| Chevron Corp. | | 637,958 | 66,558,158 |
| Cimarex Energy Co. | | 32,026 | 3,010,764 |
| Concho Resources, Inc. (b) | | 49,891 | 6,063,253 |
| ConocoPhillips Co. | | 416,573 | 18,312,549 |
| Devon Energy Corp. | | 177,020 | 5,659,329 |
| EOG Resources, Inc. | | 194,385 | 17,595,730 |
| EQT Corp. | | 58,361 | 3,419,371 |
| Exxon Mobil Corp. | | 1,426,824 | 115,187,502 |
| Hess Corp. | | 90,995 | 3,991,951 |
| Kinder Morgan, Inc. | | 646,492 | 12,386,787 |
| Marathon Oil Corp. | | 286,220 | 3,391,707 |
| Marathon Petroleum Corp. | | 174,675 | 9,140,743 |
| Murphy Oil Corp. (a) | | 54,616 | 1,399,808 |
| Newfield Exploration Co. (b) | | 67,075 | 1,908,955 |
| Noble Energy, Inc. | | 153,276 | 4,337,711 |
| Occidental Petroleum Corp. | | 257,459 | 15,414,070 |
| ONEOK, Inc. | | 127,924 | 6,672,516 |
| Phillips 66 Co. | | 147,719 | 12,214,884 |
| Pioneer Natural Resources Co. | | 57,276 | 9,140,104 |
| Range Resources Corp. (a) | | 63,362 | 1,468,098 |
| Tesoro Corp. | | 50,890 | 4,763,304 |
| The Williams Companies, Inc. | | 278,233 | 8,424,895 |
| Valero Energy Corp. | | 150,597 | 10,159,274 |
| | | | 360,523,429 |
|
| TOTAL ENERGY | | | 423,179,418 |
|
| FINANCIALS - 14.5% | | | |
| Banks - 6.5% | | | |
| Bank of America Corp. | | 3,351,125 | 81,298,293 |
| BB&T Corp. | | 273,214 | 12,406,648 |
| Citigroup, Inc. | | 927,111 | 62,005,184 |
| Citizens Financial Group, Inc. | | 170,570 | 6,085,938 |
| Comerica, Inc. | | 59,580 | 4,363,639 |
| Fifth Third Bancorp | | 252,640 | 6,558,534 |
| Huntington Bancshares, Inc. | | 366,068 | 4,949,239 |
| JPMorgan Chase & Co. | | 1,196,343 | 109,345,750 |
| KeyCorp | | 369,095 | 6,916,840 |
| M&T Bank Corp. | | 51,811 | 8,390,791 |
| Peoples United Financial, Inc. (a) | | 115,952 | 2,047,712 |
| PNC Financial Services Group, Inc. | | 162,945 | 20,346,942 |
| Regions Financial Corp. | | 404,773 | 5,925,877 |
| SunTrust Banks, Inc. | | 162,802 | 9,234,129 |
| U.S. Bancorp | | 533,440 | 27,696,205 |
| Wells Fargo & Co. | | 1,514,482 | 83,917,448 |
| Zions Bancorporation (a) | | 68,232 | 2,996,067 |
| | | | 454,485,236 |
| Capital Markets - 2.9% | | | |
| Affiliated Managers Group, Inc. | | 19,060 | 3,161,292 |
| Ameriprise Financial, Inc. | | 51,336 | 6,534,559 |
| Bank of New York Mellon Corp. | | 350,160 | 17,865,163 |
| BlackRock, Inc. Class A | | 40,826 | 17,245,311 |
| CBOE Holdings, Inc. | | 30,937 | 2,827,642 |
| Charles Schwab Corp. | | 409,733 | 17,602,130 |
| CME Group, Inc. | | 114,418 | 14,329,710 |
| E*TRADE Financial Corp. (b) | | 92,493 | 3,517,509 |
| Franklin Resources, Inc. | | 115,298 | 5,164,197 |
| Goldman Sachs Group, Inc. | | 123,270 | 27,353,613 |
| IntercontinentalExchange, Inc. | | 199,368 | 13,142,339 |
| Invesco Ltd. | | 137,002 | 4,821,100 |
| Moody's Corp. | | 56,043 | 6,819,312 |
| Morgan Stanley | | 479,618 | 21,371,778 |
| Northern Trust Corp. | | 72,670 | 7,064,251 |
| Raymond James Financial, Inc. | | 43,162 | 3,462,456 |
| S&P Global, Inc. | | 86,810 | 12,673,392 |
| State Street Corp. | | 119,089 | 10,685,856 |
| T. Rowe Price Group, Inc. (a) | | 81,243 | 6,029,043 |
| The NASDAQ OMX Group, Inc. | | 38,378 | 2,743,643 |
| | | | 204,414,296 |
| Consumer Finance - 0.7% | | | |
| American Express Co. | | 252,810 | 21,296,714 |
| Capital One Financial Corp. | | 162,631 | 13,436,573 |
| Discover Financial Services | | 128,023 | 7,961,750 |
| Navient Corp. | | 95,949 | 1,597,551 |
| Synchrony Financial | | 259,367 | 7,734,324 |
| | | | 52,026,912 |
| Diversified Financial Services - 1.6% | | | |
| Berkshire Hathaway, Inc. Class B (b) | | 639,619 | 108,332,270 |
| Leucadia National Corp. | | 109,046 | 2,852,643 |
| | | | 111,184,913 |
| Insurance - 2.8% | | | |
| AFLAC, Inc. | | 133,631 | 10,380,456 |
| Allstate Corp. | | 122,745 | 10,855,568 |
| American International Group, Inc. | | 296,150 | 18,515,298 |
| Aon PLC | | 88,247 | 11,732,439 |
| Arthur J. Gallagher & Co. | | 60,435 | 3,459,904 |
| Assurant, Inc. | | 18,449 | 1,912,977 |
| Chubb Ltd. | | 157,229 | 22,857,952 |
| Cincinnati Financial Corp. (a) | | 50,465 | 3,656,189 |
| Everest Re Group Ltd. | | 13,829 | 3,520,725 |
| Hartford Financial Services Group, Inc. | | 123,702 | 6,503,014 |
| Lincoln National Corp. | | 75,522 | 5,103,777 |
| Loews Corp. | | 92,970 | 4,351,926 |
| Marsh & McLennan Companies, Inc. | | 173,530 | 13,528,399 |
| MetLife, Inc. | | 363,822 | 19,988,381 |
| Principal Financial Group, Inc. | | 90,259 | 5,782,894 |
| Progressive Corp. | | 195,608 | 8,624,357 |
| Prudential Financial, Inc. | | 144,458 | 15,621,688 |
| The Travelers Companies, Inc. | | 94,088 | 11,904,955 |
| Torchmark Corp. | | 36,634 | 2,802,501 |
| Unum Group | | 76,847 | 3,583,376 |
| Willis Group Holdings PLC | | 42,792 | 6,224,524 |
| XL Group Ltd. | | 88,036 | 3,855,977 |
| | | | 194,767,277 |
|
| TOTAL FINANCIALS | | | 1,016,878,634 |
|
| HEALTH CARE - 14.5% | | | |
| Biotechnology - 3.0% | | | |
| AbbVie, Inc. | | 535,923 | 38,859,777 |
| Alexion Pharmaceuticals, Inc. (b) | | 75,616 | 9,200,199 |
| Amgen, Inc. | | 247,798 | 42,678,250 |
| Biogen, Inc. (b) | | 71,931 | 19,519,196 |
| Celgene Corp. (b) | | 262,929 | 34,146,589 |
| Gilead Sciences, Inc. | | 440,017 | 31,144,403 |
| Incyte Corp. (b) | | 57,232 | 7,206,081 |
| Regeneron Pharmaceuticals, Inc. (b) | | 25,658 | 12,601,670 |
| Vertex Pharmaceuticals, Inc. (b) | | 83,870 | 10,808,327 |
| | | | 206,164,492 |
| Health Care Equipment & Supplies - 2.9% | | | |
| Abbott Laboratories | | 584,322 | 28,403,892 |
| Align Technology, Inc. (b) | | 25,427 | 3,817,101 |
| Baxter International, Inc. | | 164,245 | 9,943,392 |
| Becton, Dickinson & Co. | | 76,557 | 14,937,036 |
| Boston Scientific Corp. (b) | | 461,122 | 12,782,302 |
| C.R. Bard, Inc. | | 24,385 | 7,708,342 |
| Danaher Corp. | | 205,685 | 17,357,757 |
| Dentsply Sirona, Inc. | | 77,189 | 5,004,935 |
| Edwards Lifesciences Corp. (b) | | 70,647 | 8,353,301 |
| Hologic, Inc. (b) | | 94,289 | 4,278,835 |
| IDEXX Laboratories, Inc. (b) | | 29,674 | 4,789,977 |
| Intuitive Surgical, Inc. (b) | | 12,406 | 11,604,200 |
| Medtronic PLC | | 460,948 | 40,909,135 |
| Stryker Corp. | | 104,463 | 14,497,375 |
| The Cooper Companies, Inc. | | 16,452 | 3,938,938 |
| Varian Medical Systems, Inc. (a)(b) | | 30,953 | 3,194,040 |
| Zimmer Biomet Holdings, Inc. | | 67,759 | 8,700,256 |
| | | | 200,220,814 |
| Health Care Providers & Services - 2.8% | | | |
| Aetna, Inc. | | 111,694 | 16,958,500 |
| AmerisourceBergen Corp. (a) | | 55,881 | 5,282,431 |
| Anthem, Inc. | | 89,229 | 16,786,652 |
| Cardinal Health, Inc. | | 106,368 | 8,288,195 |
| Centene Corp. (b) | | 58,012 | 4,633,999 |
| Cigna Corp. | | 86,208 | 14,430,357 |
| DaVita HealthCare Partners, Inc. (b) | | 52,422 | 3,394,849 |
| Envision Healthcare Corp. (a)(b) | | 39,553 | 2,478,787 |
| Express Scripts Holding Co. (b) | | 199,860 | 12,759,062 |
| HCA Holdings, Inc. (b) | | 96,368 | 8,403,290 |
| Henry Schein, Inc. (b) | | 26,713 | 4,889,013 |
| Humana, Inc. | | 48,596 | 11,693,170 |
| Laboratory Corp. of America Holdings (b) | | 34,448 | 5,309,815 |
| McKesson Corp. | | 71,017 | 11,685,137 |
| Patterson Companies, Inc. (a) | | 27,475 | 1,289,951 |
| Quest Diagnostics, Inc. | | 46,074 | 5,121,586 |
| UnitedHealth Group, Inc. | | 324,496 | 60,168,048 |
| Universal Health Services, Inc. Class B | | 30,107 | 3,675,463 |
| | | | 197,248,305 |
| Health Care Technology - 0.1% | | | |
| Cerner Corp. (b) | | 98,998 | 6,580,397 |
| Life Sciences Tools & Services - 0.7% | | | |
| Agilent Technologies, Inc. | | 108,529 | 6,436,855 |
| Illumina, Inc. (b) | | 49,163 | 8,530,764 |
| Mettler-Toledo International, Inc. (b) | | 8,695 | 5,117,355 |
| PerkinElmer, Inc. | | 37,054 | 2,524,860 |
| Thermo Fisher Scientific, Inc. | | 131,736 | 22,983,980 |
| Waters Corp. (b) | | 26,951 | 4,954,672 |
| | | | 50,548,486 |
| Pharmaceuticals - 5.0% | | | |
| Allergan PLC | | 113,097 | 27,492,750 |
| Bristol-Myers Squibb Co. | | 554,744 | 30,910,336 |
| Eli Lilly & Co. | | 326,961 | 26,908,890 |
| Johnson & Johnson | | 907,100 | 120,000,259 |
| Mallinckrodt PLC (b) | | 33,453 | 1,499,029 |
| Merck & Co., Inc. | | 921,018 | 59,028,044 |
| Mylan N.V. (b) | | 155,215 | 6,025,446 |
| Perrigo Co. PLC (a) | | 48,279 | 3,646,030 |
| Pfizer, Inc. | | 2,009,565 | 67,501,288 |
| Zoetis, Inc. Class A | | 165,267 | 10,309,355 |
| | | | 353,321,427 |
|
| TOTAL HEALTH CARE | | | 1,014,083,921 |
|
| INDUSTRIALS - 10.2% | | | |
| Aerospace & Defense - 2.3% | | | |
| Arconic, Inc. | | 148,422 | 3,361,758 |
| General Dynamics Corp. | | 95,492 | 18,916,965 |
| L3 Technologies, Inc. | | 26,224 | 4,381,506 |
| Lockheed Martin Corp. | | 83,820 | 23,269,270 |
| Northrop Grumman Corp. | | 58,784 | 15,090,441 |
| Raytheon Co. | | 98,014 | 15,827,301 |
| Rockwell Collins, Inc. | | 54,680 | 5,745,774 |
| Textron, Inc. | | 90,140 | 4,245,594 |
| The Boeing Co. | | 189,018 | 37,378,310 |
| TransDigm Group, Inc. (a) | | 16,467 | 4,427,482 |
| United Technologies Corp. | | 250,913 | 30,638,986 |
| | | | 163,283,387 |
| Air Freight & Logistics - 0.7% | | | |
| C.H. Robinson Worldwide, Inc. (a) | | 47,442 | 3,258,317 |
| Expeditors International of Washington, Inc. | | 60,667 | 3,426,472 |
| FedEx Corp. | | 82,831 | 18,001,661 |
| United Parcel Service, Inc. Class B | | 231,931 | 25,649,249 |
| | | | 50,335,699 |
| Airlines - 0.6% | | | |
| Alaska Air Group, Inc. | | 41,621 | 3,735,901 |
| American Airlines Group, Inc. (a) | | 165,871 | 8,346,629 |
| Delta Air Lines, Inc. | | 247,849 | 13,319,405 |
| Southwest Airlines Co. | | 203,609 | 12,652,263 |
| United Continental Holdings, Inc. (b) | | 94,887 | 7,140,247 |
| | | | 45,194,445 |
| Building Products - 0.3% | | | |
| Allegion PLC | | 32,081 | 2,602,411 |
| Fortune Brands Home & Security, Inc. | | 51,804 | 3,379,693 |
| Johnson Controls International PLC | | 315,891 | 13,697,034 |
| Masco Corp. | | 107,736 | 4,116,593 |
| | | | 23,795,731 |
| Commercial Services & Supplies - 0.3% | | | |
| Cintas Corp. | | 29,082 | 3,665,495 |
| Republic Services, Inc. | | 77,413 | 4,933,530 |
| Stericycle, Inc. (b) | | 28,712 | 2,191,300 |
| Waste Management, Inc. | | 136,867 | 10,039,194 |
| | | | 20,829,519 |
| Construction & Engineering - 0.1% | | | |
| Fluor Corp. | | 47,069 | 2,154,819 |
| Jacobs Engineering Group, Inc. | | 40,551 | 2,205,569 |
| Quanta Services, Inc. (b) | | 49,874 | 1,641,852 |
| | | | 6,002,240 |
| Electrical Equipment - 0.7% | | | |
| Acuity Brands, Inc. (a) | | 14,850 | 3,018,708 |
| AMETEK, Inc. | | 77,485 | 4,693,266 |
| Eaton Corp. PLC | | 150,620 | 11,722,755 |
| Emerson Electric Co. | | 217,017 | 12,938,554 |
| Fortive Corp. | | 101,534 | 6,432,179 |
| Rockwell Automation, Inc. | | 43,383 | 7,026,311 |
| | | | 45,831,773 |
| Industrial Conglomerates - 2.3% | | | |
| 3M Co. | | 201,230 | 41,894,074 |
| General Electric Co. | | 2,932,504 | 79,206,933 |
| Honeywell International, Inc. | | 256,704 | 34,216,076 |
| Roper Technologies, Inc. | | 34,357 | 7,954,676 |
| | | | 163,271,759 |
| Machinery - 1.5% | | | |
| Caterpillar, Inc. | | 198,388 | 21,318,774 |
| Cummins, Inc. | | 52,038 | 8,441,604 |
| Deere & Co. | | 99,091 | 12,246,657 |
| Dover Corp. | | 52,419 | 4,205,052 |
| Flowserve Corp. (a) | | 43,983 | 2,042,131 |
| Illinois Tool Works, Inc. | | 104,692 | 14,997,129 |
| Ingersoll-Rand PLC | | 86,211 | 7,878,823 |
| PACCAR, Inc. | | 118,287 | 7,811,673 |
| Parker Hannifin Corp. | | 44,847 | 7,167,448 |
| Pentair PLC | | 56,458 | 3,756,715 |
| Snap-On, Inc. | | 19,513 | 3,083,054 |
| Stanley Black & Decker, Inc. | | 51,511 | 7,249,143 |
| Xylem, Inc. | | 60,516 | 3,354,402 |
| | | | 103,552,605 |
| Professional Services - 0.3% | | | |
| Equifax, Inc. | | 40,479 | 5,562,624 |
| IHS Markit Ltd. (a)(b) | | 106,866 | 4,706,379 |
| Nielsen Holdings PLC (a) | | 113,096 | 4,372,291 |
| Robert Half International, Inc. | | 42,825 | 2,052,602 |
| Verisk Analytics, Inc. (b) | | 51,778 | 4,368,510 |
| | | | 21,062,406 |
| Road & Rail - 0.9% | | | |
| CSX Corp. | | 310,698 | 16,951,683 |
| J.B. Hunt Transport Services, Inc. | | 28,887 | 2,639,694 |
| Kansas City Southern | | 35,722 | 3,738,307 |
| Norfolk Southern Corp. | | 97,579 | 11,875,364 |
| Union Pacific Corp. | | 271,891 | 29,611,649 |
| | | | 64,816,697 |
| Trading Companies & Distributors - 0.2% | | | |
| Fastenal Co. (a) | | 97,405 | 4,240,040 |
| United Rentals, Inc. (b) | | 28,458 | 3,207,501 |
| W.W. Grainger, Inc. (a) | | 18,094 | 3,266,510 |
| | | | 10,714,051 |
|
| TOTAL INDUSTRIALS | | | 718,690,312 |
|
| INFORMATION TECHNOLOGY - 22.2% | | | |
| Communications Equipment - 1.0% | | | |
| Cisco Systems, Inc. | | 1,683,679 | 52,699,153 |
| F5 Networks, Inc. (b) | | 21,788 | 2,768,383 |
| Harris Corp. | | 41,052 | 4,477,952 |
| Juniper Networks, Inc. | | 128,664 | 3,587,152 |
| Motorola Solutions, Inc. (a) | | 55,045 | 4,774,603 |
| | | | 68,307,243 |
| Electronic Equipment & Components - 0.4% | | | |
| Amphenol Corp. Class A | | 102,911 | 7,596,890 |
| Corning, Inc. | | 309,872 | 9,311,654 |
| FLIR Systems, Inc. | | 45,949 | 1,592,592 |
| TE Connectivity Ltd. | | 119,549 | 9,406,115 |
| | | | 27,907,251 |
| Internet Software & Services - 4.6% | | | |
| Akamai Technologies, Inc. (b) | | 58,212 | 2,899,540 |
| Alphabet, Inc.: | | | |
| Class A (b) | | 100,221 | 93,173,459 |
| Class C(b) | | 100,478 | 91,307,373 |
| eBay, Inc. (b) | | 338,946 | 11,835,994 |
| Facebook, Inc. Class A (b) | | 795,946 | 120,171,927 |
| VeriSign, Inc. (a)(b) | | 29,728 | 2,763,515 |
| | | | 322,151,808 |
| IT Services - 3.8% | | | |
| Accenture PLC Class A | | 208,802 | 25,824,631 |
| Alliance Data Systems Corp. (a) | | 18,748 | 4,812,424 |
| Automatic Data Processing, Inc. | | 150,657 | 15,436,316 |
| Cognizant Technology Solutions Corp. Class A | | 198,334 | 13,169,378 |
| CSRA, Inc. | | 48,925 | 1,553,369 |
| DXC Technology Co. | | 95,350 | 7,315,252 |
| Fidelity National Information Services, Inc. | | 111,318 | 9,506,557 |
| Fiserv, Inc. (b) | | 71,515 | 8,749,145 |
| Gartner, Inc. (b) | | 30,451 | 3,761,003 |
| Global Payments, Inc. | | 51,346 | 4,637,571 |
| IBM Corp. | | 287,887 | 44,285,657 |
| MasterCard, Inc. Class A | | 315,852 | 38,360,225 |
| Paychex, Inc. | | 107,664 | 6,130,388 |
| PayPal Holdings, Inc. (b) | | 376,187 | 20,189,956 |
| The Western Union Co. (a) | | 158,686 | 3,022,968 |
| Total System Services, Inc. | | 55,772 | 3,248,719 |
| Visa, Inc. Class A | | 621,692 | 58,302,276 |
| | | | 268,305,835 |
| Semiconductors & Semiconductor Equipment - 3.4% | | | |
| Advanced Micro Devices, Inc. (a)(b) | | 260,938 | 3,256,506 |
| Analog Devices, Inc. | | 123,584 | 9,614,835 |
| Applied Materials, Inc. | | 361,863 | 14,948,561 |
| Broadcom Ltd. | | 135,152 | 31,497,174 |
| Intel Corp. | | 1,585,672 | 53,500,573 |
| KLA-Tencor Corp. | | 52,787 | 4,830,538 |
| Lam Research Corp. | | 54,319 | 7,682,336 |
| Microchip Technology, Inc. (a) | | 77,246 | 5,961,846 |
| Micron Technology, Inc. (b) | | 350,177 | 10,456,285 |
| NVIDIA Corp. | | 200,356 | 28,963,463 |
| Qorvo, Inc. (a)(b) | | 42,798 | 2,709,969 |
| Qualcomm, Inc. | | 497,501 | 27,472,005 |
| Skyworks Solutions, Inc. | | 62,136 | 5,961,949 |
| Texas Instruments, Inc. | | 335,494 | 25,809,553 |
| Xilinx, Inc. (a) | | 83,526 | 5,372,392 |
| | | | 238,037,985 |
| Software - 4.9% | | | |
| Activision Blizzard, Inc. | | 233,480 | 13,441,444 |
| Adobe Systems, Inc. (b) | | 166,581 | 23,561,217 |
| ANSYS, Inc. (b) | | 28,790 | 3,503,167 |
| Autodesk, Inc. (b) | | 65,308 | 6,584,353 |
| CA Technologies, Inc. | | 105,518 | 3,637,205 |
| Citrix Systems, Inc. (b) | | 50,896 | 4,050,304 |
| Electronic Arts, Inc. (b) | | 104,396 | 11,036,745 |
| Intuit, Inc. | | 81,963 | 10,885,506 |
| Microsoft Corp. | | 2,599,746 | 179,200,492 |
| Oracle Corp. | | 1,011,449 | 50,714,053 |
| Red Hat, Inc. (b) | | 59,863 | 5,731,882 |
| Salesforce.com, Inc. (b) | | 225,159 | 19,498,769 |
| Symantec Corp. | | 204,814 | 5,785,996 |
| Synopsys, Inc. (b) | | 50,615 | 3,691,352 |
| | | | 341,322,485 |
| Technology Hardware, Storage & Peripherals - 4.1% | | | |
| Apple, Inc. | | 1,755,668 | 252,851,302 |
| Hewlett Packard Enterprise Co. | | 560,597 | 9,300,304 |
| HP, Inc. | | 566,833 | 9,908,241 |
| NetApp, Inc. | | 91,238 | 3,654,082 |
| Seagate Technology LLC (a) | | 100,009 | 3,875,349 |
| Western Digital Corp. | | 98,071 | 8,689,091 |
| Xerox Corp. | | 71,886 | 2,065,285 |
| | | | 290,343,654 |
|
| TOTAL INFORMATION TECHNOLOGY | | | 1,556,376,261 |
|
| MATERIALS - 2.8% | | | |
| Chemicals - 2.1% | | | |
| Air Products & Chemicals, Inc. | | 73,315 | 10,488,444 |
| Albemarle Corp. U.S. | | 37,294 | 3,936,009 |
| CF Industries Holdings, Inc. (a) | | 78,502 | 2,194,916 |
| E.I. du Pont de Nemours & Co. | | 291,958 | 23,563,930 |
| Eastman Chemical Co. | | 49,105 | 4,124,329 |
| Ecolab, Inc. | | 87,901 | 11,668,858 |
| FMC Corp. | | 45,123 | 3,296,235 |
| International Flavors & Fragrances, Inc. | | 26,592 | 3,589,920 |
| LyondellBasell Industries NV Class A | | 111,223 | 9,386,109 |
| Monsanto Co. | | 147,761 | 17,488,992 |
| PPG Industries, Inc. | | 86,270 | 9,486,249 |
| Praxair, Inc. | | 96,259 | 12,759,130 |
| Sherwin-Williams Co. | | 27,282 | 9,574,891 |
| The Dow Chemical Co. | | 378,476 | 23,870,481 |
| The Mosaic Co. | | 118,199 | 2,698,483 |
| | | | 148,126,976 |
| Construction Materials - 0.1% | | | |
| Martin Marietta Materials, Inc. | | 21,090 | 4,694,212 |
| Vulcan Materials Co. | | 44,501 | 5,637,387 |
| | | | 10,331,599 |
| Containers & Packaging - 0.3% | | | |
| Avery Dennison Corp. | | 29,820 | 2,635,193 |
| Ball Corp. | | 117,895 | 4,976,348 |
| International Paper Co. | | 139,035 | 7,870,771 |
| Sealed Air Corp. | | 65,937 | 2,951,340 |
| WestRock Co. | | 84,553 | 4,790,773 |
| | | | 23,224,425 |
| Metals & Mining - 0.3% | | | |
| Freeport-McMoRan, Inc. (b) | | 448,213 | 5,383,038 |
| Newmont Mining Corp. | | 179,557 | 5,815,851 |
| Nucor Corp. | | 107,435 | 6,217,263 |
| | | | 17,416,152 |
|
| TOTAL MATERIALS | | | 199,099,152 |
|
| REAL ESTATE - 2.9% | | | |
| Equity Real Estate Investment Trusts (REITs) - 2.9% | | | |
| Alexandria Real Estate Equities, Inc. | | 30,667 | 3,694,453 |
| American Tower Corp. | | 143,114 | 18,936,844 |
| Apartment Investment & Management Co. Class A | | 52,874 | 2,271,996 |
| AvalonBay Communities, Inc. | | 46,397 | 8,916,111 |
| Boston Properties, Inc. | | 51,809 | 6,373,543 |
| Crown Castle International Corp. | | 123,281 | 12,350,291 |
| Digital Realty Trust, Inc. | | 53,801 | 6,076,823 |
| Equinix, Inc. | | 26,235 | 11,259,013 |
| Equity Residential (SBI) | | 123,633 | 8,138,760 |
| Essex Property Trust, Inc. | | 22,089 | 5,682,837 |
| Extra Space Storage, Inc. (a) | | 42,399 | 3,307,122 |
| Federal Realty Investment Trust (SBI) | | 24,325 | 3,074,437 |
| General Growth Properties, Inc. (a) | | 196,154 | 4,621,388 |
| HCP, Inc. | | 157,783 | 5,042,745 |
| Host Hotels & Resorts, Inc. (a) | | 249,096 | 4,550,984 |
| Iron Mountain, Inc. | | 82,711 | 2,841,950 |
| Kimco Realty Corp. | | 143,332 | 2,630,142 |
| Mid-America Apartment Communities, Inc. | | 38,245 | 4,030,258 |
| Prologis, Inc. | | 178,574 | 10,471,579 |
| Public Storage | | 50,344 | 10,498,234 |
| Realty Income Corp. | | 91,948 | 5,073,691 |
| Regency Centers Corp. | | 49,253 | 3,085,208 |
| Simon Property Group, Inc. | | 105,126 | 17,005,182 |
| SL Green Realty Corp. | | 34,290 | 3,627,882 |
| The Macerich Co. | | 40,103 | 2,328,380 |
| UDR, Inc. | | 90,039 | 3,508,820 |
| Ventas, Inc. | | 119,497 | 8,302,652 |
| Vornado Realty Trust | | 58,004 | 5,446,576 |
| Welltower, Inc. | | 123,300 | 9,229,005 |
| Weyerhaeuser Co. | | 252,985 | 8,474,998 |
| | | | 200,851,904 |
| Real Estate Management & Development - 0.0% | | | |
| CBRE Group, Inc. (b) | | 101,258 | 3,685,791 |
|
| TOTAL REAL ESTATE | | | 204,537,695 |
|
| TELECOMMUNICATION SERVICES - 2.1% | | | |
| Diversified Telecommunication Services - 2.1% | | | |
| AT&T, Inc. | | 2,070,229 | 78,109,740 |
| CenturyLink, Inc. (a) | | 184,803 | 4,413,096 |
| Level 3 Communications, Inc. (b) | | 98,569 | 5,845,142 |
| Verizon Communications, Inc. | | 1,373,655 | 61,347,432 |
| | | | 149,715,410 |
| UTILITIES - 3.2% | | | |
| Electric Utilities - 2.0% | | | |
| Alliant Energy Corp. | | 76,715 | 3,081,642 |
| American Electric Power Co., Inc. | | 165,575 | 11,502,495 |
| Duke Energy Corp. | | 235,673 | 19,699,906 |
| Edison International | | 109,711 | 8,578,303 |
| Entergy Corp. | | 60,432 | 4,639,365 |
| Eversource Energy | | 106,706 | 6,478,121 |
| Exelon Corp. | | 311,847 | 11,248,321 |
| FirstEnergy Corp. | | 149,422 | 4,357,146 |
| NextEra Energy, Inc. | | 157,646 | 22,090,934 |
| PG&E Corp. | | 171,939 | 11,411,591 |
| Pinnacle West Capital Corp. | | 37,566 | 3,199,121 |
| PPL Corp. | | 230,047 | 8,893,617 |
| Southern Co. | | 334,913 | 16,035,634 |
| Xcel Energy, Inc. | | 170,980 | 7,844,562 |
| | | | 139,060,758 |
| Independent Power and Renewable Electricity Producers - 0.1% | | | |
| NRG Energy, Inc. | | 106,435 | 1,832,811 |
| The AES Corp. | | 222,292 | 2,469,664 |
| | | | 4,302,475 |
| Multi-Utilities - 1.0% | | | |
| Ameren Corp. | | 81,703 | 4,466,703 |
| CenterPoint Energy, Inc. | | 145,120 | 3,973,386 |
| CMS Energy Corp. | | 94,438 | 4,367,758 |
| Consolidated Edison, Inc. | | 102,831 | 8,310,801 |
| Dominion Resources, Inc. | | 211,800 | 16,230,234 |
| DTE Energy Co. | | 60,405 | 6,390,245 |
| NiSource, Inc. | | 108,915 | 2,762,084 |
| Public Service Enterprise Group, Inc. | | 170,346 | 7,326,581 |
| SCANA Corp. | | 48,125 | 3,224,856 |
| Sempra Energy | | 84,463 | 9,523,203 |
| WEC Energy Group, Inc. | | 106,266 | 6,522,607 |
| | | | 73,098,458 |
| Water Utilities - 0.1% | | | |
| American Water Works Co., Inc. | | 60,003 | 4,677,234 |
|
| TOTAL UTILITIES | | | 221,138,925 |
|
| TOTAL COMMON STOCKS | | | |
| (Cost $3,780,184,691) | | | 6,994,221,614 |
| | | Principal Amount | Value |
|
| U.S. Treasury Obligations - 0.1% | | | |
| U.S. Treasury Bills, yield at date of purchase 0.88% 10/12/17 (c) | | | |
| (Cost $3,990,020) | | 4,000,000 | 3,988,580 |
| | | Shares | Value |
|
| Money Market Funds - 3.2% | | | |
| Fidelity Cash Central Fund, 1.10% (d) | | 19,550,802 | $19,554,712 |
| Fidelity Securities Lending Cash Central Fund 1.09% (d)(e) | | 203,360,157 | 203,380,493 |
| TOTAL MONEY MARKET FUNDS | | | |
| (Cost $222,919,777) | | | 222,935,205 |
| TOTAL INVESTMENT PORTFOLIO - 102.9% | | | |
| (Cost $4,007,094,488) | | | 7,221,145,399 |
| NET OTHER ASSETS (LIABILITIES) - (2.9)% | | | (200,570,312) |
| NET ASSETS - 100% | | | $7,020,575,087 |
| Futures Contracts | | | |
| | Expiration Date | Underlying Face Amount at Value | Unrealized Appreciation/(Depreciation) |
| Purchased | | | |
| Equity Index Contracts | | | |
| 222 CME E-mini S&P 500 Index Contracts (United States) | Sept. 2017 | 26,871,990 | $(90,417) |
The face value of futures purchased as a percentage of Net Assets is 0.4%
Legend
(a) Security or a portion of the security is on loan at period end.
(b) Non-income producing
(c) Security or a portion of the security was pledged to cover margin requirements for futures contracts. At period end, the value of securities pledged amounted to $1,066,945.
(d) Affiliated fund that is generally available only to investment companies and other accounts managed by Fidelity Investments. The rate quoted is the annualized seven-day yield of the fund at period end. A complete unaudited listing of the fund's holdings as of its most recent quarter end is available upon request. In addition, each Fidelity Central Fund's financial statements are available on the SEC's website or upon request.
(e) Investment made with cash collateral received from securities on loan.
Affiliated Central Funds
Information regarding fiscal year to date income earned by the Fund from investments in Fidelity Central Funds is as follows:
| Fund | Income earned |
| Fidelity Cash Central Fund | $176,796 |
| Fidelity Securities Lending Cash Central Fund | 86,635 |
| Total | $263,431 |
Investment Valuation
The following is a summary of the inputs used, as of June 30, 2017, involving the Fund's assets and liabilities carried at fair value. The inputs or methodology used for valuing securities may not be an indication of the risk associated with investing in those securities. For more information on valuation inputs, and their aggregation into the levels used below, please refer to the Investment Valuation section in the accompanying Notes to Financial Statements.
| | Valuation Inputs at Reporting Date: |
| Description | Total | Level 1 | Level 2 | Level 3 |
| Investments in Securities: | | | | |
| Equities: | | | | |
| Consumer Discretionary | $858,071,609 | $858,071,609 | $-- | $-- |
| Consumer Staples | 632,450,277 | 632,450,277 | -- | -- |
| Energy | 423,179,418 | 423,179,418 | -- | -- |
| Financials | 1,016,878,634 | 1,016,878,634 | -- | -- |
| Health Care | 1,014,083,921 | 1,014,083,921 | -- | -- |
| Industrials | 718,690,312 | 718,690,312 | -- | -- |
| Information Technology | 1,556,376,261 | 1,556,376,261 | -- | -- |
| Materials | 199,099,152 | 199,099,152 | -- | -- |
| Real Estate | 204,537,695 | 204,537,695 | -- | -- |
| Telecommunication Services | 149,715,410 | 149,715,410 | -- | -- |
| Utilities | 221,138,925 | 221,138,925 | -- | -- |
| U.S. Government and Government Agency Obligations | 3,988,580 | -- | 3,988,580 | -- |
| Money Market Funds | 222,935,205 | 222,935,205 | -- | -- |
| Total Investments in Securities: | $7,221,145,399 | $7,217,156,819 | $3,988,580 | $-- |
| Derivative Instruments: | | | | |
| Liabilities | | | | |
| Futures Contracts | $(90,417) | $(90,417) | $-- | $-- |
| Total Liabilities | $(90,417) | $(90,417) | $-- | $-- |
| Total Derivative Instruments: | $(90,417) | $(90,417) | $-- | $-- |
Value of Derivative Instruments
The following table is a summary of the Fund's value of derivative instruments by primary risk exposure as of June 30, 2017. For additional information on derivative instruments, please refer to the Derivative Instruments section in the accompanying Notes to Financial Statements.
| Primary Risk Exposure / Derivative Type | Value |
| | Asset | Liability |
| Equity Risk | | |
| Futures Contracts(a) | $0 | $(90,417) |
| Total Equity Risk | 0 | (90,417) |
| Total Value of Derivatives | $0 | $(90,417) |
(a) Reflects gross cumulative appreciation (depreciation) on futures contracts as presented in the Schedule of Investments. In the Statement of Assets and Liabilities, the period end daily variation margin is included in receivable or payable for daily variation margin for derivative instruments, and the net cumulative appreciation (depreciation) is included in net unrealized appreciation (depreciation).
See accompanying notes which are an integral part of the financial statements.
Financial Statements
Statement of Assets and Liabilities
| | | June 30, 2017 (Unaudited) |
| Assets | | |
Investment in securities, at value (including securities loaned of $199,577,867) — See accompanying schedule:
Unaffiliated issuers (cost $3,784,174,711) | $6,998,210,194 | |
| Fidelity Central Funds (cost $222,919,777) | 222,935,205 | |
| Total Investments (cost $4,007,094,488) | | $7,221,145,399 |
| Receivable for fund shares sold | | 4,344,954 |
| Dividends receivable | | 6,976,072 |
| Distributions receivable from Fidelity Central Funds | | 28,500 |
| Receivable for daily variation margin for derivative instruments | | 10,352 |
| Other receivables | | 41,406 |
| Total assets | | 7,232,546,683 |
| Liabilities | | |
| Payable for investments purchased | $2,966,458 | |
| Payable for fund shares redeemed | 4,721,160 | |
| Accrued management fee | 264,414 | |
| Distribution and service plan fees payable | 289,241 | |
| Other affiliated payables | 323,231 | |
| Other payables and accrued expenses | 41,417 | |
| Collateral on securities loaned | 203,365,675 | |
| Total liabilities | | 211,971,596 |
| Net Assets | | $7,020,575,087 |
| Net Assets consist of: | | |
| Paid in capital | | $3,750,612,778 |
| Undistributed net investment income | | 62,158,233 |
| Accumulated undistributed net realized gain (loss) on investments | | (6,156,418) |
| Net unrealized appreciation (depreciation) on investments | | 3,213,960,494 |
| Net Assets | | $7,020,575,087 |
| Initial Class: | | |
| Net Asset Value, offering price and redemption price per share ($5,588,699,174 ÷ 22,622,095 shares) | | $247.05 |
| Service Class: | | |
| Net Asset Value, offering price and redemption price per share ($80,833,685 ÷ 328,414 shares) | | $246.13 |
| Service Class 2: | | |
| Net Asset Value, offering price and redemption price per share ($1,351,042,228 ÷ 5,540,754 shares) | | $243.84 |
See accompanying notes which are an integral part of the financial statements.
Statement of Operations
| | | Six months ended June 30, 2017 (Unaudited) |
| Investment Income | | |
| Dividends | | $67,047,540 |
| Interest | | 11,453 |
| Income from Fidelity Central Funds | | 263,431 |
| Total income | | 67,322,424 |
| Expenses | | |
| Management fee | $1,522,704 | |
| Transfer agent fees | 1,861,083 | |
| Distribution and service plan fees | 1,665,498 | |
| Independent trustees' fees and expenses | 13,155 | |
| Legal | 5,468 | |
| Miscellaneous | 10,745 | |
| Total expenses before reductions | 5,078,653 | |
| Expense reductions | (684) | 5,077,969 |
| Net investment income (loss) | | 62,244,455 |
| Realized and Unrealized Gain (Loss) | | |
| Net realized gain (loss) on: | | |
| Investment securities: | | |
| Unaffiliated issuers | 2,986,106 | |
| Fidelity Central Funds | 15,667 | |
| Futures contracts | 3,888,024 | |
| Total net realized gain (loss) | | 6,889,797 |
Change in net unrealized appreciation (depreciation) on:
Investment securities | 520,486,874 | |
| Futures contracts | 27,360 | |
| Total change in net unrealized appreciation (depreciation) | | 520,514,234 |
| Net gain (loss) | | 527,404,031 |
| Net increase (decrease) in net assets resulting from operations | | $589,648,486 |
See accompanying notes which are an integral part of the financial statements.
Statement of Changes in Net Assets
| | Six months ended June 30, 2017 (Unaudited) | Year ended December 31, 2016 |
| Increase (Decrease) in Net Assets | | |
| Operations | | |
| Net investment income (loss) | $62,244,455 | $107,503,577 |
| Net realized gain (loss) | 6,889,797 | 17,682,543 |
| Change in net unrealized appreciation (depreciation) | 520,514,234 | 474,343,317 |
| Net increase (decrease) in net assets resulting from operations | 589,648,486 | 599,529,437 |
| Distributions to shareholders from net investment income | (20,827,473) | (86,820,037) |
| Distributions to shareholders from net realized gain | (19,367,326) | (4,792,061) |
| Total distributions | (40,194,799) | (91,612,098) |
| Share transactions - net increase (decrease) | 176,820,797 | 1,042,741,643 |
| Total increase (decrease) in net assets | 726,274,484 | 1,550,658,982 |
| Net Assets | | |
| Beginning of period | 6,294,300,603 | 4,743,641,621 |
| End of period | $7,020,575,087 | $6,294,300,603 |
| Other Information | | |
| Undistributed net investment income end of period | $62,158,233 | $20,741,251 |
See accompanying notes which are an integral part of the financial statements.
Financial Highlights — VIP Index 500 Portfolio Initial Class
| | Six months ended (Unaudited) June 30, | Years ended December 31, | | | | |
| | 2017 | 2016 | 2015 | 2014 | 2013 | 2012 |
| Selected Per–Share Data | | | | | | |
| Net asset value, beginning of period | $227.46 | $206.43 | $208.12 | $186.29 | $144.91 | $129.33 |
| Income from Investment Operations | | | | | | |
| Net investment income (loss)A | 2.26 | 4.42 | 4.15 | 3.75 | 3.31 | 3.12 |
| Net realized and unrealized gain (loss) | 18.78 | 20.06 | (1.44) | 21.58 | 42.98 | 17.29 |
| Total from investment operations | 21.04 | 24.48 | 2.71 | 25.33 | 46.29 | 20.41 |
| Distributions from net investment income | (.76) | (3.23) | (4.26) | (3.31) | (3.27) | (3.06) |
| Distributions from net realized gain | (.69) | (.22) | (.13) | (.18) | (1.64) | (1.77) |
| Total distributions | (1.45) | (3.45) | (4.40)B | (3.50)C | (4.91) | (4.83) |
| Net asset value, end of period | $247.05 | $227.46 | $206.43 | $208.12 | $186.29 | $144.91 |
| Total ReturnD,E,F | 9.29% | 11.86% | 1.33% | 13.57% | 32.25% | 15.91% |
| Ratios to Average Net AssetsG,H | | | | | | |
| Expenses before reductions | .10%I | .10% | .10% | .10% | .10% | .10% |
| Expenses net of fee waivers, if any | .10%I | .10% | .10% | .10% | .10% | .10% |
| Expenses net of all reductions | .10%I | .10% | .10% | .10% | .10% | .10% |
| Net investment income (loss) | 1.89%I | 2.07% | 1.98% | 1.91% | 1.98% | 2.20% |
| Supplemental Data | | | | | | |
| Net assets, end of period (000 omitted) | $5,588,699 | $5,001,375 | $4,103,865 | $3,823,973 | $3,163,673 | $2,294,364 |
| Portfolio turnover rateJ | 3%I | 6% | 9% | 3% | 5% | 5% |
A Calculated based on average shares outstanding during the period.
B Total distributions of $4.40 per share is comprised of distributions from net investment income of $4.262 and distributions from net realized gain of $.133 per share.
C Total distributions of $3.50 per share is comprised of distributions from net investment income of $3.314 and distributions from net realized gain of $.184 per share.
D Total returns for periods of less than one year are not annualized.
E Total returns do not reflect charges attributable to your insurance company's separate account. Inclusion of these charges would reduce the total returns shown.
F Total returns would have been lower if certain expenses had not been reduced during the applicable periods shown.
G Fees and expenses of any underlying Fidelity Central Funds are not included in the Fund's expense ratio. The Fund indirectly bears its proportionate share of the expenses of any underlying Fidelity Central Funds.
H Expense ratios reflect operating expenses of the class. Expenses before reductions do not reflect amounts reimbursed by the investment adviser or reductions from expense offset arrangements and do not represent the amount paid by the class during periods when reimbursements or reductions occur. Expenses net of fee waivers reflect expenses after reimbursement by the investment adviser but prior to reductions from expense offset arrangements. Expenses net of all reductions represent the net expenses paid by the class.
I Annualized
J Amount does not include the portfolio activity of any underlying Fidelity Central Funds.
See accompanying notes which are an integral part of the financial statements.
Financial Highlights — VIP Index 500 Portfolio Service Class
| | Six months ended (Unaudited) June 30, | Years ended December 31, | | | | |
| | 2017 | 2016 | 2015 | 2014 | 2013 | 2012 |
| Selected Per–Share Data | | | | | | |
| Net asset value, beginning of period | $226.70 | $205.82 | $207.49 | $185.77 | $144.53 | $129.00 |
| Income from Investment Operations | | | | | | |
| Net investment income (loss)A | 2.14 | 4.19 | 3.93 | 3.54 | 3.13 | 2.97 |
| Net realized and unrealized gain (loss) | 18.71 | 19.97 | (1.43) | 21.50 | 42.85 | 17.25 |
| Total from investment operations | 20.85 | 24.16 | 2.50 | 25.04 | 45.98 | 20.22 |
| Distributions from net investment income | (.73) | (3.07) | (4.03) | (3.14) | (3.10) | (2.92) |
| Distributions from net realized gain | (.69) | (.22) | (.13) | (.18) | (1.64) | (1.77) |
| Total distributions | (1.42) | (3.28)B | (4.17)C | (3.32) | (4.74) | (4.69) |
| Net asset value, end of period | $246.13 | $226.70 | $205.82 | $207.49 | $185.77 | $144.53 |
| Total ReturnD,E,F | 9.23% | 11.75% | 1.24% | 13.46% | 32.12% | 15.80% |
| Ratios to Average Net AssetsG,H | | | | | | |
| Expenses before reductions | .20%I | .20% | .20% | .20% | .20% | .20% |
| Expenses net of fee waivers, if any | .20%I | .20% | .20% | .20% | .20% | .20% |
| Expenses net of all reductions | .20%I | .20% | .20% | .20% | .20% | .20% |
| Net investment income (loss) | 1.79%I | 1.97% | 1.88% | 1.81% | 1.88% | 2.10% |
| Supplemental Data | | | | | | |
| Net assets, end of period (000 omitted) | $80,834 | $77,697 | $64,618 | $64,442 | $55,066 | $41,443 |
| Portfolio turnover rateJ | 3%I | 6% | 9% | 3% | 5% | 5% |
A Calculated based on average shares outstanding during the period.
B Total distributions of $3.28 per share is comprised of distributions from net investment income of $3.068 and distributions from net realized gain of $.216 per share.
C Total distributions of $4.17 per share is comprised of distributions from net investment income of $4.033 and distributions from net realized gain of $.133 per share.
D Total returns for periods of less than one year are not annualized.
E Total returns do not reflect charges attributable to your insurance company's separate account. Inclusion of these charges would reduce the total returns shown.
F Total returns would have been lower if certain expenses had not been reduced during the applicable periods shown.
G Fees and expenses of any underlying Fidelity Central Funds are not included in the Fund's expense ratio. The Fund indirectly bears its proportionate share of the expenses of any underlying Fidelity Central Funds.
H Expense ratios reflect operating expenses of the class. Expenses before reductions do not reflect amounts reimbursed by the investment adviser or reductions from expense offset arrangements and do not represent the amount paid by the class during periods when reimbursements or reductions occur. Expenses net of fee waivers reflect expenses after reimbursement by the investment adviser but prior to reductions from expense offset arrangements. Expenses net of all reductions represent the net expenses paid by the class.
I Annualized
J Amount does not include the portfolio activity of any underlying Fidelity Central Funds.
See accompanying notes which are an integral part of the financial statements.
Financial Highlights — VIP Index 500 Portfolio Service Class 2
| | Six months ended (Unaudited) June 30, | Years ended December 31, | | | | |
| | 2017 | 2016 | 2015 | 2014 | 2013 | 2012 |
| Selected Per–Share Data | | | | | | |
| Net asset value, beginning of period | $224.72 | $204.25 | $206.02 | $184.56 | $143.64 | $128.24 |
| Income from Investment Operations | | | | | | |
| Net investment income (loss)A | 1.94 | 3.88 | 3.59 | 3.23 | 2.86 | 2.74 |
| Net realized and unrealized gain (loss) | 18.55 | 19.76 | (1.42) | 21.34 | 42.56 | 17.14 |
| Total from investment operations | 20.49 | 23.64 | 2.17 | 24.57 | 45.42 | 19.88 |
| Distributions from net investment income | (.68) | (2.95) | (3.80) | (2.92) | (2.86) | (2.71) |
| Distributions from net realized gain | (.69) | (.22) | (.13) | (.18) | (1.64) | (1.77) |
| Total distributions | (1.37) | (3.17) | (3.94)B | (3.11)C | (4.50) | (4.48) |
| Net asset value, end of period | $243.84 | $224.72 | $204.25 | $206.02 | $184.56 | $143.64 |
| Total ReturnD,E,F | 9.15% | 11.58% | 1.08% | 13.29% | 31.92% | 15.62% |
| Ratios to Average Net AssetsG,H | | | | | | |
| Expenses before reductions | .35%I | .35% | .35% | .35% | .35% | .35% |
| Expenses net of fee waivers, if any | .35%I | .35% | .35% | .35% | .35% | .35% |
| Expenses net of all reductions | .35%I | .35% | .35% | .35% | .35% | .35% |
| Net investment income (loss) | 1.64%I | 1.82% | 1.73% | 1.66% | 1.73% | 1.95% |
| Supplemental Data | | | | | | |
| Net assets, end of period (000 omitted) | $1,351,042 | $1,215,228 | $575,158 | $466,026 | $367,122 | $274,104 |
| Portfolio turnover rateJ | 3%I | 6% | 9% | 3% | 5% | 5% |
A Calculated based on average shares outstanding during the period.
B Total distributions of $3.94 per share is comprised of distributions from net investment income of $3.804 and distributions from net realized gain of $.133 per share.
C Total distributions of $3.11 per share is comprised of distributions from net investment income of $2.923 and distributions from net realized gain of $.184 per share.
D Total returns for periods of less than one year are not annualized.
E Total returns do not reflect charges attributable to your insurance company's separate account. Inclusion of these charges would reduce the total returns shown.
F Total returns would have been lower if certain expenses had not been reduced during the applicable periods shown.
G Fees and expenses of any underlying Fidelity Central Funds are not included in the Fund's expense ratio. The Fund indirectly bears its proportionate share of the expenses of any underlying Fidelity Central Funds.
H Expense ratios reflect operating expenses of the class. Expenses before reductions do not reflect amounts reimbursed by the investment adviser or reductions from expense offset arrangements and do not represent the amount paid by the class during periods when reimbursements or reductions occur. Expenses net of fee waivers reflect expenses after reimbursement by the investment adviser but prior to reductions from expense offset arrangements. Expenses net of all reductions represent the net expenses paid by the class.
I Annualized
J Amount does not include the portfolio activity of any underlying Fidelity Central Funds.
See accompanying notes which are an integral part of the financial statements.
Notes to Financial Statements (Unaudited)
For the period ended June 30, 2017
1. Organization.
VIP Index 500 Portfolio (the Fund) is a fund of Variable Insurance Products Fund II (the Trust) and is authorized to issue an unlimited number of shares. The Trust is registered under the Investment Company Act of 1940, as amended (the 1940 Act), as an open-end management investment company organized as a Massachusetts business trust. Shares of the Fund may only be purchased by insurance companies for the purpose of funding variable annuity or variable life insurance contracts. The Fund offers the following classes of shares: Initial Class shares, Service Class shares and Service Class 2 shares. All classes have equal rights and voting privileges, except for matters affecting a single class.
2. Investments in Fidelity Central Funds.
The Fund invests in Fidelity Central Funds, which are open-end investment companies generally available only to other investment companies and accounts managed by the investment adviser and its affiliates. The Fund's Schedule of Investments lists each of the Fidelity Central Funds held as of period end, if any, as an investment of the Fund, but does not include the underlying holdings of each Fidelity Central Fund. As an Investing Fund, the Fund indirectly bears its proportionate share of the expenses of the underlying Fidelity Central Funds.
The Money Market Central Funds seek preservation of capital and current income and are managed by Fidelity Investments Money Management, Inc. (FIMM), an affiliate of the investment adviser. Annualized expenses of the Money Market Central Funds as of their most recent shareholder report date are less than .005%.
A complete unaudited list of holdings for each Fidelity Central Fund is available upon request or at the Securities and Exchange Commission (the SEC) website at www.sec.gov. In addition, the financial statements of the Fidelity Central Funds are available on the SEC website or upon request.
3. Significant Accounting Policies.
The Fund is an investment company and applies the accounting and reporting guidance of the Financial Accounting Standards Board (FASB) Accounting Standards Codification Topic 946 Financial Services – Investments Companies. The financial statements have been prepared in conformity with accounting principles generally accepted in the United States of America (GAAP), which require management to make certain estimates and assumptions at the date of the financial statements. Actual results could differ from those estimates. Subsequent events, if any, through the date that the financial statements were issued have been evaluated in the preparation of the financial statements. The following summarizes the significant accounting policies of the Fund:
Investment Valuation. Investments are valued as of 4:00 p.m. Eastern time on the last calendar day of the period. The Board of Trustees (the Board) has delegated the day to day responsibility for the valuation of the Fund's investments to the Fair Value Committee (the Committee) established by the Fund's investment adviser. In accordance with valuation policies and procedures approved by the Board, the Fund attempts to obtain prices from one or more third party pricing vendors or brokers to value its investments. When current market prices, quotations or currency exchange rates are not readily available or reliable, investments will be fair valued in good faith by the Committee, in accordance with procedures adopted by the Board. Factors used in determining fair value vary by investment type and may include market or investment specific events, changes in interest rates and credit quality. The frequency with which these procedures are used cannot be predicted and they may be utilized to a significant extent. The Committee oversees the Fund's valuation policies and procedures and reports to the Board on the Committee's activities and fair value determinations. The Board monitors the appropriateness of the procedures used in valuing the Fund's investments and ratifies the fair value determinations of the Committee.
The Fund categorizes the inputs to valuation techniques used to value its investments into a disclosure hierarchy consisting of three levels as shown below:
- Level 1 – quoted prices in active markets for identical investments
- Level 2 – other significant observable inputs (including quoted prices for similar investments, interest rates, prepayment speeds, etc.)
- Level 3 – unobservable inputs (including the Fund's own assumptions based on the best information available)
Valuation techniques used to value the Fund's investments by major category are as follows:
Equity securities, including restricted securities, for which market quotations are readily available, are valued at the last reported sale price or official closing price as reported by a third party pricing vendor on the primary market or exchange on which they are traded and are categorized as Level 1 in the hierarchy. In the event there were no sales during the day or closing prices are not available, securities are valued at the last quoted bid price or may be valued using the last available price and are generally categorized as Level 2 in the hierarchy. For foreign equity securities, when market or security specific events arise, comparisons to the valuation of American Depositary Receipts (ADRs), futures contracts, Exchange-Traded Funds (ETFs) and certain indexes as well as quoted prices for similar securities may be used and would be categorized as Level 2 in the hierarchy. Utilizing these techniques may result in transfers between Level 1 and Level 2. For equity securities, including restricted securities, where observable inputs are limited, assumptions about market activity and risk are used and these securities may be categorized as Level 3 in the hierarchy.
Debt securities, including restricted securities, are valued based on evaluated prices received from third party pricing vendors or from brokers who make markets in such securities. U.S. government and government agency obligations are valued by pricing vendors who utilize matrix pricing which considers yield or price of bonds of comparable quality, coupon, maturity and type or by broker-supplied prices. When independent prices are unavailable or unreliable, debt securities may be valued utilizing pricing methodologies which consider similar factors that would be used by third party pricing vendors. Debt securities are generally categorized as Level 2 in the hierarchy but may be Level 3 depending on the circumstances.
Futures contracts are valued at the settlement price established each day by the board of trade or exchange on which they are traded and are categorized as Level 1 in the hierarchy. Investments in open-end mutual funds, including the Fidelity Central Funds, are valued at their closing net asset value (NAV) each business day and are categorized as Level 1 in the hierarchy.
Changes in valuation techniques may result in transfers in or out of an assigned level within the disclosure hierarchy. The aggregate value of investments by input level as of June 30, 2017 is included at the end of the Fund's Schedule of Investments.
Investment Transactions and Income. For financial reporting purposes, the Fund's investment holdings and NAV include trades executed through the end of the last business day of the period. The NAV per share for processing shareholder transactions is calculated as of the close of business of the New York Stock Exchange (NYSE), normally 4:00 p.m. Eastern time and includes trades executed through the end of the prior business day. Gains and losses on securities sold are determined on the basis of identified cost and may include proceeds received from litigation. Dividend income is recorded on the ex-dividend date, except for certain dividends from foreign securities where the ex-dividend date may have passed, which are recorded as soon as the Fund is informed of the ex-dividend date. Non-cash dividends included in dividend income, if any, are recorded at the fair market value of the securities received. Income and capital gain distributions from Fidelity Central Funds, if any, are recorded on the ex-dividend date. Certain distributions received by the Fund represent a return of capital or capital gain. The Fund determines the components of these distributions subsequent to the ex-dividend date, based upon receipt of tax filings or other correspondence relating to the underlying investment. These distributions are recorded as a reduction of cost of investments and/or as a realized gain. Interest income is accrued as earned and includes coupon interest and amortization of premium and accretion of discount on debt securities as applicable.
Class Allocations and Expenses. Investment income, realized and unrealized capital gains and losses, common expenses of the Fund, and certain fund-level expense reductions, if any, are allocated daily on a pro-rata basis to each class based on the relative net assets of each class to the total net assets of the Fund. Each class differs with respect to transfer agent and distribution and service plan fees incurred. Certain expense reductions may also differ by class. For the reporting period, the allocated portion of income and expenses to each class as a percent of its average net assets may vary due to the timing of recording these transactions in relation to fluctuating net assets of the classes. Expenses directly attributable to a fund are charged to that fund. Expenses attributable to more than one fund are allocated among the respective funds on the basis of relative net assets or other appropriate methods. Expense estimates are accrued in the period to which they relate and adjustments are made when actual amounts are known.
Deferred Trustee Compensation. Under a Deferred Compensation Plan (the Plan), independent Trustees may elect to defer receipt of a portion of their annual compensation. Deferred amounts are invested in a cross-section of Fidelity funds, are marked-to-market and remain in the Fund until distributed in accordance with the Plan. The investment of deferred amounts and the offsetting payable to the Trustees are included in the accompanying Statement of Assets and Liabilities.
Income Tax Information and Distributions to Shareholders. Each year, the Fund intends to qualify as a regulated investment company under Subchapter M of the Internal Revenue Code, including distributing substantially all of its taxable income and realized gains. As a result, no provision for U.S. Federal income taxes is required. The Fund files a U.S. federal tax return, in addition to state and local tax returns as required. The Fund's federal income tax returns are subject to examination by the Internal Revenue Service (IRS) for a period of three fiscal years after they are filed. State and local tax returns may be subject to examination for an additional fiscal year depending on the jurisdiction.
Distributions are declared and recorded on the ex-dividend date. Income dividends and capital gain distributions are declared separately for each class. Income and capital gain distributions are determined in accordance with income tax regulations, which may differ from GAAP.
Capital accounts within the financial statements are adjusted for permanent book-tax differences. These adjustments have no impact on net assets or the results of operations. Capital accounts are not adjusted for temporary book-tax differences which will reverse in a subsequent period.
Book-tax differences are primarily due to futures contracts, market discount, deferred trustees compensation and losses deferred due to wash sales.
The federal tax cost of investment securities and unrealized appreciation (depreciation) as of period end were as follows:
| Gross unrealized appreciation | $3,329,602,389 |
| Gross unrealized depreciation | (130,354,087) |
| Net unrealized appreciation (depreciation) on securities | $3,199,248,302 |
| Tax cost | $4,021,897,097 |
4. Derivative Instruments.
Risk Exposures and the Use of Derivative Instruments. The Fund's investment objective allows the Fund to enter into various types of derivative contracts, including futures contracts. Derivatives are investments whose value is primarily derived from underlying assets, indices or reference rates and may be transacted on an exchange or over-the-counter (OTC). Derivatives may involve a future commitment to buy or sell a specified asset based on specified terms, to exchange future cash flows at periodic intervals based on a notional principal amount, or for one party to make one or more payments upon the occurrence of specified events in exchange for periodic payments from the other party.
The Fund used derivatives to increase returns and to manage exposure to certain risks as defined below. The success of any strategy involving derivatives depends on analysis of numerous economic factors, and if the strategies for investment do not work as intended, the Fund may not achieve its objectives.
The Fund's use of derivatives increased or decreased its exposure to the following risk:
| Equity Risk | Equity risk relates to the fluctuations in the value of financial instruments as a result of changes in market prices (other than those arising from interest rate risk or foreign exchange risk), whether caused by factors specific to an individual investment, its issuer, or all factors affecting all instruments traded in a market or market segment.
|
The Fund is also exposed to additional risks from investing in derivatives, such as liquidity risk and counterparty credit risk. Liquidity risk is the risk that the Fund will be unable to close out the derivative in the open market in a timely manner. Counterparty credit risk is the risk that the counterparty will not be able to fulfill its obligation to the Fund. Counterparty credit risk related to exchange-traded futures contracts may be mitigated by the protection provided by the exchange on which they trade.
Investing in derivatives may involve greater risks than investing in the underlying assets directly and, to varying degrees, may involve risk of loss in excess of any initial investment and collateral received and amounts recognized in the Statement of Assets and Liabilities. In addition, there may be the risk that the change in value of the derivative contract does not correspond to the change in value of the underlying instrument.
Futures Contracts. A futures contract is an agreement between two parties to buy or sell a specified underlying instrument for a fixed price at a specified future date. The Fund used futures contracts to manage its exposure to the stock market.
Upon entering into a futures contract, a fund is required to deposit either cash or securities (initial margin) with a clearing broker in an amount equal to a certain percentage of the face value of the contract. Futures contracts are marked-to-market daily and subsequent daily payments (variation margin) are made or received by a fund depending on the daily fluctuations in the value of the futures contracts and are recorded as unrealized appreciation or (depreciation). This receivable and/or payable, if any, is included in daily variation margin for derivative instruments in the Statement of Assets and Liabilities. Realized gain or (loss) is recorded upon the expiration or closing of a futures contract.
Any open futures contracts at period end are presented in the Schedule of Investments under the caption "Futures Contracts". The underlying face amount at value reflects each contract's exposure to the underlying instrument or index at period end and is representative of volume of activity during the period. Securities deposited to meet initial margin requirements are identified in the Schedule of Investments.
During the period the Fund recognized net realized gain (loss) of $3,888,024 and a change in net unrealized appreciation (depreciation) of $27,360 related to its investments in futures contracts. These amounts are included in the Statement of Operations.
5. Purchases and Sales of Investments.
Purchases and sales of securities, other than short-term securities, aggregated $346,400,138 and $103,431,836, respectively.
6. Fees and Other Transactions with Affiliates.
Management Fee and Expense Contract. Fidelity Management & Research Company (the investment adviser) and its affiliates provide the Fund with investment management related services for which the Fund pays a monthly management fee. The management fee is based on an annual rate of .045% of the Fund's average net assets. Under the management contract, the investment adviser pays all other fund-level expenses, except the compensation of the independent Trustees and certain other expenses such as interest expense, including commitment fees. In addition, under an expense contract, the investment adviser pays class-level expenses as necessary so that total expenses do not exceed an annual rate of .10% of each class' average net assets, excluding the distribution and service fee for each applicable class, with certain exceptions.
Sub-Adviser. Geode Capital Management, LLC (Geode), serves as sub-adviser for the Fund. Geode provides discretionary investment advisory services to the Fund and is paid by the investment adviser for providing these services.
Distribution and Service Plan Fees. In accordance with Rule 12b-1 of the 1940 Act, the Fund has adopted separate 12b-1 Plans for each Service Class of shares. Each Service Class pays Fidelity Distributors Corporation (FDC), an affiliate of the investment adviser, a service fee. For the period, the service fee is based on an annual rate of .10% of Service Class' average net assets and .25% of Service Class 2's average net assets.
For the period, total fees, all of which were re-allowed to insurance companies for the distribution of shares and providing shareholder support services, were as follows:
| Service Class | $40,499 |
| Service Class 2 | 1,624,999 |
| | $1,665,498 |
Transfer Agent Fees. Fidelity Investments Institutional Operations Company, Inc. (FIIOC), an affiliate of the investment adviser, is the transfer, dividend disbursing, and shareholder servicing agent for each class. FIIOC receives asset-based fees of .07% of each class's average net assets for transfer agent services, typesetting, and printing and mailing of shareholder reports, excluding mailing of proxy statements. Under the expense contract, each class pays a portion of the transfer agent fees equal to an annual rate of .055% of class-level average net assets. For the period, transfer agent fees for each class were as follows:
| Initial Class | $1,481,309 |
| Service Class | 22,274 |
| Service Class 2 | 357,500 |
| | $1,861,083 |
Interfund Trades. The Fund may purchase from or sell securities to other Fidelity Funds under procedures adopted by the Board. The procedures have been designed to ensure these interfund trades are executed in accordance with Rule 17a-7 of the 1940 Act. Interfund trades are included within the respective purchases and sales amounts shown in the Purchases and Sales of Investments note.
7. Committed Line of Credit.
The Fund participates with other funds managed by the investment adviser or an affiliate in a $4.25 billion credit facility (the "line of credit") to be utilized for temporary or emergency purposes to fund shareholder redemptions or for other short-term liquidity purposes. The Fund has agreed to pay commitment fees on its pro-rata portion of the line of credit, which amounted to $10,745 and is reflected in Miscellaneous expenses on the Statement of Operations. During the period, the Fund did not borrow on this line of credit.
8. Security Lending.
The Fund lends portfolio securities through a lending agent from time to time in order to earn additional income. On the settlement date of the loan, the Fund receives collateral (in the form of U.S. Treasury obligations, letters of credit and/or cash) against the loaned securities and maintains collateral in an amount not less than 100% of the market value of the loaned securities during the period of the loan. The market value of the loaned securities is determined at the close of business of the Fund and any additional required collateral is delivered to the Fund on the next business day. The Fund or borrower may terminate the loan at any time, and if the borrower defaults on its obligation to return the securities loaned because of insolvency or other reasons, the Fund may apply collateral received from the borrower against the obligation. The Fund may experience delays and costs in recovering the securities loaned. Any cash collateral received is invested in the Fidelity Securities Lending Cash Central Fund. The value of loaned securities and cash collateral at period end are disclosed on the Fund's Statement of Assets and Liabilities. Security lending income represents the income earned on investing cash collateral, less rebates paid to borrowers and any lending agent fees associated with the loan, plus any premium payments received for lending certain types of securities. Security lending income is presented in the Statement of Operations as a component of income from Fidelity Central Funds. Total security lending income during the period amounted to $86,635.
9. Expense Reductions.
Through arrangements with the Fund's custodian, credits realized as a result of certain uninvested cash balances were used to reduce the Fund's expenses. During the period, these credits reduced the Fund's expenses by $684.
10. Distributions to Shareholders.
Distributions to shareholders of each class were as follows:
| | Six months ended
June 30, 2017 | Year ended December 31, 2016 |
| From net investment income | | |
| Initial Class | $16,909,441 | $70,054,010 |
| Service Class | 247,793 | 1,039,558 |
| Service Class 2 | 3,670,239 | 15,726,469 |
| Total | $20,827,473 | $86,820,037 |
| From net realized gain | | |
| Initial Class | $15,374,242 | $4,273,944 |
| Service Class | 235,847 | 67,680 |
| Service Class 2 | 3,757,237 | 450,437 |
| Total | $19,367,326 | $4,792,061 |
11. Share Transactions.
Transactions for each class of shares were as follows:
| | Shares | Shares | Dollars | Dollars |
| | Six months ended June 30, 2017 | Year ended December 31, 2016 | Six months ended June 30, 2017 | Year ended December 31, 2016 |
| Initial Class | | | | |
| Shares sold | 1,326,650 | 3,632,858 | $315,950,762 | $784,242,215 |
| Reinvestment of distributions | 137,782 | 327,219 | 32,283,683 | 74,327,954 |
| Shares redeemed | (830,626) | (1,851,642) | (199,177,541) | (392,431,867) |
| Net increase (decrease) | 633,806 | 2,108,435 | $149,056,904 | $466,138,302 |
| Service Class | | | | |
| Shares sold | 25,827 | 52,986 | $6,175,910 | $11,566,212 |
| Reinvestment of distributions | 2,071 | 4,894 | 483,640 | 1,107,238 |
| Shares redeemed | (42,213) | (29,110) | (10,129,709) | (6,156,452) |
| Net increase (decrease) | (14,315) | 28,770 | $(3,470,159) | $6,516,998 |
| Service Class 2 | | | | |
| Shares sold | 284,485 | 3,813,500 | $67,333,647 | $812,723,011 |
| Reinvestment of distributions | 32,086 | 71,615 | 7,427,476 | 16,176,906 |
| Shares redeemed | (183,623) | (1,293,305) | (43,527,071) | (258,813,574) |
| Net increase (decrease) | 132,948 | 2,591,810 | $31,234,052 | $570,086,343 |
12. Other.
The Fund's organizational documents provide former and current trustees and officers with a limited indemnification against liabilities arising in connection with the performance of their duties to the Fund. In the normal course of business, the Fund may also enter into contracts that provide general indemnifications. The Fund's maximum exposure under these arrangements is unknown as this would be dependent on future claims that may be made against the Fund. The risk of material loss from such claims is considered remote.
At the end of the period, the investment adviser or its affiliates were the owners of record of 38% of the total outstanding shares of the Fund.
Shareholder Expense Example
As a shareholder of the Fund, you incur two types of costs: (1) transaction costs, and (2) ongoing costs, including management fees, distribution and/or service (12b-1) fees and other Fund expenses. This Example is intended to help you understand your ongoing costs (in dollars) of investing in the Fund and to compare these costs with the ongoing costs of investing in other mutual funds.
The Example is based on an investment of $1,000 invested at the beginning of the period and held for the entire period (January 1, 2017 to June 30, 2017).
Actual Expenses
The first line of the accompanying table for each class of the Fund provides information about actual account values and actual expenses. You may use the information in this line, together with the amount you invested, to estimate the expenses that you paid over the period. Simply divide your account value by $1,000.00 (for example, an $8,600 account value divided by $1,000.00 = 8.6), then multiply the result by the number in the first line for a class of the Fund under the heading entitled "Expenses Paid During Period" to estimate the expenses you paid on your account during this period. The estimate of expenses does not include any fees or other expenses of any variable annuity or variable life insurance product. If they were, the estimate of expenses you paid during the period would be higher, and your ending account value would be lower. In addition, the Fund, as a shareholder in the underlying Fidelity Central Funds, will indirectly bear its pro-rata share of the fees and expenses incurred by the underlying Fidelity Central Funds. These fees and expenses are not included in the Fund's annualized expense ratio used to calculate the expense estimate in the table below.
Hypothetical Example for Comparison Purposes
The second line of the accompanying table for each class of the Fund provides information about hypothetical account values and hypothetical expenses based on a Class' actual expense ratio and an assumed rate of return of 5% per year before expenses, which is not the Class' actual return. The hypothetical account values and expenses may not be used to estimate the actual ending account balance or expenses you paid for the period. You may use this information to compare the ongoing costs of investing in the Fund and other funds. To do so, compare this 5% hypothetical example with the 5% hypothetical examples that appear in the shareholder reports of the other funds. The estimate of expenses does not include any fees or other expenses of any variable annuity or variable life insurance product. If they were, the estimate of expenses you paid during the period would be higher, and your ending account value would be lower. In addition, the Fund, as a shareholder in the underlying Fidelity Central Funds, will indirectly bear its pro-rata share of the fees and expenses incurred by the underlying Fidelity Central Funds. These fees and expenses are not included in the Fund's annualized expense ratio used to calculate the expense estimate in the table below.
Please note that the expenses shown in the table are meant to highlight your ongoing costs only and do not reflect any transaction costs. Therefore, the second line of the table is useful in comparing ongoing costs only, and will not help you determine the relative total costs of owning different funds.
| | Annualized Expense Ratio-A | Beginning
Account Value
January 1, 2017 | Ending
Account Value
June 30, 2017 | Expenses Paid
During Period-B
January 1, 2017
to June 30, 2017 |
| Initial Class | .10% | | | |
| Actual | | $1,000.00 | $1,092.90 | $.52 |
| Hypothetical-C | | $1,000.00 | $1,024.30 | $.50 |
| Service Class | .20% | | | |
| Actual | | $1,000.00 | $1,092.30 | $1.04 |
| Hypothetical-C | | $1,000.00 | $1,023.80 | $1.00 |
| Service Class 2 | .35% | | | |
| Actual | | $1,000.00 | $1,091.50 | $1.82 |
| Hypothetical-C | | $1,000.00 | $1,023.06 | $1.76 |
A Annualized expense ratio reflects expenses net of applicable fee waivers.
B Expenses are equal to each Class' annualized expense ratio, multiplied by the average account value over the period, multiplied by 181/365 (to reflect the one-half year period).
C 5% return per year before expenses
VIPIDX-SANN-0817
1.705630.119
Fidelity® Variable Insurance Products: International Capital Appreciation Portfolio
Semi-Annual Report June 30, 2017 |
|
Contents
To view a fund's proxy voting guidelines and proxy voting record for the 12-month period ended June 30, visit http://www.fidelity.com/proxyvotingresults or visit the Securities and Exchange Commission's (SEC) web site at http://www.sec.gov.
You may also call 1-877-208-0098 to request a free copy of the proxy voting guidelines.
Fidelity® Variable Insurance Products are separate account options which are purchased through a variable insurance contract.
Standard & Poor's, S&P and S&P 500 are registered service marks of The McGraw-Hill Companies, Inc. and have been licensed for use by Fidelity Distributors Corporation.
Other third-party marks appearing herein are the property of their respective owners.
All other marks appearing herein are registered or unregistered trademarks or service marks of FMR LLC or an affiliated company. © 2017 FMR LLC. All rights reserved.
This report and the financial statements contained herein are submitted for the general information of the shareholders of the Fund. This report is not authorized for distribution to prospective investors in the Fund unless preceded or accompanied by an effective prospectus.
A fund files its complete schedule of portfolio holdings with the SEC for the first and third quarters of each fiscal year on Form N-Q. Forms N-Q are available on the SEC’s web site at http://www.sec.gov. A fund's Forms N-Q may be reviewed and copied at the SEC’s Public Reference Room in Washington, DC. Information regarding the operation of the SEC's Public Reference Room may be obtained by calling 1-800-SEC-0330.
For a complete list of a fund's portfolio holdings, view the most recent holdings listing, semiannual report, or annual report on Fidelity's web site at http://www.fidelity.com, http://www.institutional.fidelity.com, or http://www.401k.com, as applicable.
NOT FDIC INSURED •MAY LOSE VALUE •NO BANK GUARANTEE
Neither the Fund nor Fidelity Distributors Corporation is a bank.
Investment Summary (Unaudited)
Geographic Diversification (% of fund's net assets)
| As of June 30, 2017 |
| | United States of America* | 13.5% |
| | United Kingdom | 12.6% |
| | France | 10.0% |
| | Japan | 7.1% |
| | Germany | 7.0% |
| | India | 4.8% |
| | Switzerland | 4.6% |
| | Canada | 4.1% |
| | Sweden | 3.5% |
| | Other | 32.8% |

* Includes Short-Term investments and Net Other Assets (Liabilities).
Percentages are based on country or territory of incorporation and are adjusted for the effect of futures contracts, if applicable.
| As of December 31, 2016 |
| | United States of America* | 21.4% |
| | United Kingdom | 13.3% |
| | Japan | 6.9% |
| | Germany | 5.9% |
| | France | 5.4% |
| | India | 5.3% |
| | Switzerland | 4.3% |
| | Canada | 3.7% |
| | Ireland | 3.5% |
| | Other | 30.3% |
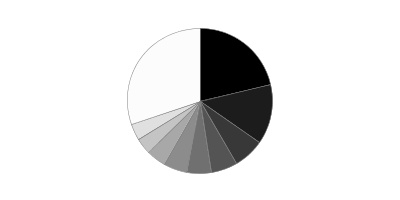
* Includes Short-Term investments and Net Other Assets (Liabilities).
Percentages are based on country or territory of incorporation and are adjusted for the effect of futures contracts, if applicable.
Asset Allocation as of June 30, 2017
| | % of fund's net assets | % of fund's net assets 6 months ago |
| Stocks | 97.5 | 98.7 |
| Short-Term Investments and Net Other Assets (Liabilities) | 2.5 | 1.3 |
Top Ten Stocks as of June 30, 2017
| | % of fund's net assets | % of fund's net assets 6 months ago |
| Nestle SA (Reg. S) (Switzerland, Food Products) | 1.9 | 1.9 |
| Tencent Holdings Ltd. (Cayman Islands, Internet Software & Services) | 1.5 | 1.3 |
| Taiwan Semiconductor Manufacturing Co. Ltd. sponsored ADR (Taiwan, Semiconductors & Semiconductor Equipment) | 1.3 | 1.3 |
| Alibaba Group Holding Ltd. sponsored ADR (Cayman Islands, Internet Software & Services) | 1.3 | 1.1 |
| Unilever PLC (United Kingdom, Personal Products) | 1.3 | 0.0 |
| British American Tobacco PLC (United Kingdom) (United Kingdom, Tobacco) | 1.1 | 1.2 |
| SAP AG (Germany, Software) | 1.0 | 1.0 |
| Naspers Ltd. Class N (South Africa, Media) | 0.9 | 1.0 |
| AIA Group Ltd. (Hong Kong, Insurance) | 0.9 | 0.9 |
| Anheuser-Busch InBev SA NV (Belgium, Beverages) | 0.9 | 1.0 |
| | 12.1 | |
Market Sectors as of June 30, 2017
| | % of fund's net assets | % of fund's net assets 6 months ago |
| Industrials | 24.3 | 20.1 |
| Information Technology | 18.8 | 18.2 |
| Consumer Staples | 13.9 | 14.2 |
| Financials | 12.1 | 11.8 |
| Consumer Discretionary | 10.4 | 15.2 |
| Materials | 7.8 | 7.6 |
| Health Care | 6.7 | 7.1 |
| Real Estate | 2.0 | 3.4 |
| Utilities | 0.9 | 0.0 |
| Telecommunication Services | 0.6 | 0.5 |
Percentages shown as 0.0% may reflect amounts less than 0.05%.
Investments June 30, 2017 (Unaudited)
Showing Percentage of Net Assets
| Common Stocks - 96.8% | | | |
| | | Shares | Value |
| Australia - 2.4% | | | |
| Amcor Ltd. | | 118,569 | $1,477,252 |
| CSL Ltd. | | 16,454 | 1,745,603 |
| realestate.com.au Ltd. | | 26,314 | 1,342,936 |
| Sydney Airport unit | | 234,018 | 1,275,252 |
|
| TOTAL AUSTRALIA | | | 5,841,043 |
|
| Belgium - 0.9% | | | |
| Anheuser-Busch InBev SA NV | | 19,700 | 2,175,836 |
| Bermuda - 1.1% | | | |
| Credicorp Ltd. (United States) | | 7,700 | 1,381,303 |
| Hiscox Ltd. | | 78,900 | 1,302,011 |
|
| TOTAL BERMUDA | | | 2,683,314 |
|
| Canada - 4.1% | | | |
| Alimentation Couche-Tard, Inc. Class B (sub. vtg.) | | 30,700 | 1,471,555 |
| Canadian National Railway Co. | | 25,500 | 2,069,024 |
| CCL Industries, Inc. Class B | | 27,700 | 1,401,447 |
| Constellation Software, Inc. | | 2,550 | 1,334,011 |
| Descartes Systems Group, Inc. (a) | | 49,400 | 1,201,858 |
| Open Text Corp. | | 41,900 | 1,322,461 |
| Waste Connection, Inc. (Canada) | | 20,550 | 1,323,675 |
|
| TOTAL CANADA | | | 10,124,031 |
|
| Cayman Islands - 3.4% | | | |
| Alibaba Group Holding Ltd. sponsored ADR (a) | | 22,330 | 3,146,297 |
| NetEase, Inc. ADR | | 5,100 | 1,533,213 |
| Tencent Holdings Ltd. | | 103,950 | 3,729,202 |
|
| TOTAL CAYMAN ISLANDS | | | 8,408,712 |
|
| Denmark - 1.1% | | | |
| Coloplast A/S Series B | | 15,700 | 1,312,290 |
| DSV de Sammensluttede Vognmaend A/S | | 22,700 | 1,394,702 |
|
| TOTAL DENMARK | | | 2,706,992 |
|
| Finland - 0.6% | | | |
| Kone Oyj (B Shares) | | 28,000 | 1,424,398 |
| France - 10.0% | | | |
| ALTEN | | 14,700 | 1,213,721 |
| Altran Technologies SA | | 64,900 | 1,057,771 |
| Dassault Systemes SA (b) | | 15,200 | 1,362,640 |
| Eiffage SA | | 14,700 | 1,335,781 |
| Essilor International SA | | 11,971 | 1,523,136 |
| Hermes International SCA | | 2,650 | 1,309,501 |
| Kering SA | | 4,500 | 1,532,651 |
| L'Oreal SA | | 8,740 | 1,820,788 |
| Legrand SA | | 21,500 | 1,504,069 |
| LVMH Moet Hennessy - Louis Vuitton SA | | 8,430 | 2,107,967 |
| Orpea | | 11,800 | 1,315,122 |
| Rubis (b) | | 11,200 | 1,269,486 |
| Sartorius Stedim Biotech | | 17,700 | 1,372,670 |
| Sodexo SA | | 10,260 | 1,326,530 |
| SR Teleperformance SA | | 10,500 | 1,344,967 |
| Thales SA | | 13,000 | 1,399,271 |
| VINCI SA | | 21,560 | 1,839,100 |
|
| TOTAL FRANCE | | | 24,635,171 |
|
| Germany - 6.9% | | | |
| adidas AG | | 9,257 | 1,773,601 |
| Fresenius SE & Co. KGaA | | 19,400 | 1,663,158 |
| HeidelbergCement Finance AG | | 14,900 | 1,440,577 |
| Henkel AG & Co. KGaA | | 13,448 | 1,626,585 |
| Infineon Technologies AG | | 72,200 | 1,533,570 |
| KION Group AG | | 17,300 | 1,322,285 |
| MTU Aero Engines Holdings AG | | 9,000 | 1,269,500 |
| Nemetschek Se | | 2,100 | 156,383 |
| Rheinmetall AG | | 13,400 | 1,272,136 |
| SAP AG | | 23,477 | 2,457,370 |
| Symrise AG | | 19,200 | 1,360,054 |
| Wirecard AG (b) | | 19,500 | 1,240,992 |
|
| TOTAL GERMANY | | | 17,116,211 |
|
| Hong Kong - 1.4% | | | |
| AIA Group Ltd. | | 304,000 | 2,221,365 |
| Techtronic Industries Co. Ltd. | | 284,500 | 1,308,180 |
|
| TOTAL HONG KONG | | | 3,529,545 |
|
| India - 4.8% | | | |
| Adani Ports & Special Economic Zone Ltd. (a) | | 235,137 | 1,321,054 |
| Asian Paints Ltd. | | 73,171 | 1,248,901 |
| HDFC Bank Ltd. | | 52,794 | 1,360,026 |
| Housing Development Finance Corp. Ltd. | | 64,635 | 1,615,325 |
| IndusInd Bank Ltd. | | 54,971 | 1,258,115 |
| ITC Ltd. | | 302,492 | 1,515,035 |
| LIC Housing Finance Ltd. | | 115,755 | 1,329,517 |
| Maruti Suzuki India Ltd. | | 12,491 | 1,395,157 |
| Power Grid Corp. of India Ltd. | | 269,415 | 877,829 |
|
| TOTAL INDIA | | | 11,920,959 |
|
| Indonesia - 1.1% | | | |
| PT Bank Central Asia Tbk | | 1,045,300 | 1,423,537 |
| PT Bank Rakyat Indonesia Tbk | | 1,248,000 | 1,428,025 |
|
| TOTAL INDONESIA | | | 2,851,562 |
|
| Ireland - 1.8% | | | |
| CRH PLC | | 46,700 | 1,662,450 |
| Kerry Group PLC Class A | | 15,530 | 1,336,173 |
| Kingspan Group PLC (Ireland) | | 39,300 | 1,349,064 |
|
| TOTAL IRELAND | | | 4,347,687 |
|
| Israel - 1.6% | | | |
| Check Point Software Technologies Ltd. (a) | | 12,700 | 1,385,316 |
| Elbit Systems Ltd. | | 9,500 | 1,175,625 |
| Frutarom Industries Ltd. | | 19,100 | 1,336,537 |
|
| TOTAL ISRAEL | | | 3,897,478 |
|
| Italy - 2.5% | | | |
| Amplifon SpA | | 90,500 | 1,194,894 |
| Buzzi Unicem SpA | | 49,600 | 1,234,417 |
| Davide Campari-Milano SpA | | 190,200 | 1,340,352 |
| Industria Macchine Automatiche SpA (IMA) | | 13,100 | 1,203,706 |
| Interpump Group SpA | | 45,100 | 1,233,173 |
|
| TOTAL ITALY | | | 6,206,542 |
|
| Japan - 7.1% | | | |
| Benefit One, Inc. | | 27,900 | 1,113,768 |
| Daikin Industries Ltd. | | 15,100 | 1,549,140 |
| Hoya Corp. | | 26,800 | 1,389,859 |
| Kansai Paint Co. Ltd. | | 58,600 | 1,346,797 |
| Kao Corp. | | 25,900 | 1,539,971 |
| Keyence Corp. | | 3,848 | 1,688,022 |
| Misumi Group, Inc. | | 60,500 | 1,380,245 |
| Nippon Paint Holdings Co. Ltd. (b) | | 34,900 | 1,318,738 |
| Nitori Holdings Co. Ltd. | | 9,300 | 1,243,583 |
| Recruit Holdings Co. Ltd. | | 72,500 | 1,244,699 |
| Relo Holdings Corp. | | 61,900 | 1,203,603 |
| Sundrug Co. Ltd. | | 34,400 | 1,281,494 |
| Tsuruha Holdings, Inc. | | 12,300 | 1,304,637 |
|
| TOTAL JAPAN | | | 17,604,556 |
|
| Kenya - 0.6% | | | |
| Safaricom Ltd. | | 6,305,800 | 1,383,384 |
| Luxembourg - 0.5% | | | |
| Eurofins Scientific SA | | 2,340 | 1,318,008 |
| Mexico - 1.8% | | | |
| CEMEX S.A.B. de CV sponsored ADR | | 153,332 | 1,444,387 |
| Grupo Aeroportuario del Pacifico S.A.B. de CV Series B | | 125,400 | 1,412,246 |
| Grupo Aeroportuario del Sureste S.A.B. de CV Series B | | 70,160 | 1,480,304 |
|
| TOTAL MEXICO | | | 4,336,937 |
|
| Netherlands - 3.1% | | | |
| ASML Holding NV (Netherlands) | | 13,900 | 1,811,904 |
| Ferrari NV | | 15,600 | 1,341,912 |
| Heineken NV (Bearer) | | 15,300 | 1,487,638 |
| RELX NV | | 83,761 | 1,726,885 |
| Wolters Kluwer NV | | 30,400 | 1,286,947 |
|
| TOTAL NETHERLANDS | | | 7,655,286 |
|
| New Zealand - 0.6% | | | |
| Auckland International Airport Ltd. | | 264,523 | 1,382,097 |
| Philippines - 1.5% | | | |
| Ayala Land, Inc. | | 1,716,900 | 1,353,552 |
| SM Investments Corp. | | 80,683 | 1,284,962 |
| SM Prime Holdings, Inc. | | 1,831,500 | 1,198,709 |
|
| TOTAL PHILIPPINES | | | 3,837,223 |
|
| Russia - 0.6% | | | |
| Sberbank of Russia | | 628,650 | 1,553,396 |
| South Africa - 2.0% | | | |
| Capitec Bank Holdings Ltd. | | 21,809 | 1,383,640 |
| FirstRand Ltd. | | 372,500 | 1,342,509 |
| Naspers Ltd. Class N | | 11,560 | 2,276,544 |
|
| TOTAL SOUTH AFRICA | | | 5,002,693 |
|
| Spain - 1.7% | | | |
| Aena SA | | 6,870 | 1,340,587 |
| Amadeus IT Holding SA Class A | | 28,230 | 1,687,916 |
| Grifols SA | | 46,800 | 1,303,442 |
|
| TOTAL SPAIN | | | 4,331,945 |
|
| Sweden - 3.5% | | | |
| ASSA ABLOY AB (B Shares) | | 66,780 | 1,471,930 |
| Atlas Copco AB (A Shares) | | 44,600 | 1,709,948 |
| Essity AB Class B (a) | | 51,000 | 1,395,361 |
| Hexagon AB (B Shares) | | 30,700 | 1,459,441 |
| Indutrade AB | | 55,200 | 1,264,567 |
| Saab AB (B Shares) | | 25,600 | 1,264,092 |
|
| TOTAL SWEDEN | | | 8,565,339 |
|
| Switzerland - 4.6% | | | |
| Geberit AG (Reg.) | | 3,050 | 1,422,422 |
| Kaba Holding AG (B Shares) (Reg.) | | 1,450 | 1,259,620 |
| Nestle SA (Reg. S) | | 52,860 | 4,610,322 |
| Partners Group Holding AG | | 2,120 | 1,314,360 |
| Schindler Holding AG (participation certificate) | | 6,295 | 1,332,001 |
| Sika AG | | 224 | 1,438,982 |
|
| TOTAL SWITZERLAND | | | 11,377,707 |
|
| Taiwan - 1.3% | | | |
| Taiwan Semiconductor Manufacturing Co. Ltd. sponsored ADR | | 92,800 | 3,244,288 |
| Thailand - 0.6% | | | |
| Airports of Thailand PCL (For. Reg.) | | 1,057,000 | 1,470,216 |
| United Kingdom - 12.6% | | | |
| BAE Systems PLC | | 190,100 | 1,569,329 |
| Beazley PLC | | 207,700 | 1,320,403 |
| British American Tobacco PLC (United Kingdom) | | 41,700 | 2,841,560 |
| Bunzl PLC | | 47,158 | 1,405,311 |
| Cineworld Group PLC | | 139,300 | 1,273,648 |
| Compass Group PLC | | 77,001 | 1,625,303 |
| Cranswick PLC | | 32,510 | 1,187,288 |
| Halma PLC | | 90,900 | 1,302,320 |
| Inchcape PLC | | 70,047 | 688,351 |
| InterContinental Hotel Group PLC | | 22,559 | 1,253,729 |
| Intertek Group PLC | | 24,800 | 1,362,123 |
| London Stock Exchange Group PLC | | 30,600 | 1,453,112 |
| Mondi PLC | | 53,400 | 1,400,754 |
| Prudential PLC | | 85,154 | 1,954,606 |
| Reckitt Benckiser Group PLC | | 20,030 | 2,030,504 |
| Rentokil Initial PLC | | 381,200 | 1,356,918 |
| Rightmove PLC | | 22,936 | 1,269,602 |
| Sage Group PLC | | 150,800 | 1,351,297 |
| St. James's Place Capital PLC | | 89,600 | 1,379,388 |
| Unilever PLC | | 57,800 | 3,128,013 |
|
| TOTAL UNITED KINGDOM | | | 31,153,559 |
|
| United States of America - 11.0% | | | |
| A.O. Smith Corp. | | 21,926 | 1,235,092 |
| Adobe Systems, Inc. (a) | | 9,000 | 1,272,960 |
| Alphabet, Inc. Class C (a) | | 1,374 | 1,248,595 |
| Altria Group, Inc. | | 16,800 | 1,251,096 |
| Amazon.com, Inc. (a) | | 1,212 | 1,173,216 |
| American Tower Corp. | | 9,100 | 1,204,112 |
| Amphenol Corp. Class A | | 15,888 | 1,172,852 |
| Apple, Inc. | | 8,500 | 1,224,170 |
| Equifax, Inc. | | 8,530 | 1,172,193 |
| Facebook, Inc. Class A (a) | | 8,500 | 1,283,330 |
| Fiserv, Inc. (a) | | 9,816 | 1,200,889 |
| Henry Schein, Inc. (a) | | 6,740 | 1,233,555 |
| Home Depot, Inc. | | 8,100 | 1,242,540 |
| MasterCard, Inc. Class A | | 10,150 | 1,232,718 |
| Mettler-Toledo International, Inc. (a) | | 2,217 | 1,304,793 |
| Moody's Corp. | | 10,600 | 1,289,808 |
| MSCI, Inc. | | 12,000 | 1,235,880 |
| Philip Morris International, Inc. | | 10,400 | 1,221,480 |
| Priceline Group, Inc. (a) | | 600 | 1,122,312 |
| S&P Global, Inc. | | 9,111 | 1,330,115 |
| Sherwin-Williams Co. | | 3,470 | 1,217,831 |
| Visa, Inc. Class A | | 13,080 | 1,226,642 |
|
| TOTAL UNITED STATES OF AMERICA | | | 27,096,179 |
|
| TOTAL COMMON STOCKS | | | |
| (Cost $192,884,508) | | | 239,182,294 |
|
| Nonconvertible Preferred Stocks - 0.7% | | | |
| Brazil - 0.6% | | | |
| Itau Unibanco Holding SA sponsored ADR | | 150,500 | 1,663,025 |
| Germany - 0.1% | | | |
| Jungheinrich AG | | 6,028 | 220,351 |
| TOTAL NONCONVERTIBLE PREFERRED STOCKS | | | |
| (Cost $1,816,864) | | | 1,883,376 |
|
| Money Market Funds - 2.4% | | | |
| Fidelity Cash Central Fund, 1.10% (c) | | 4,145,979 | 4,146,808 |
| Fidelity Securities Lending Cash Central Fund 1.09% (c)(d) | | 1,754,720 | 1,754,895 |
| TOTAL MONEY MARKET FUNDS | | | |
| (Cost $5,901,703) | | | 5,901,703 |
| TOTAL INVESTMENT PORTFOLIO - 99.9% | | | |
| (Cost $200,603,075) | | | 246,967,373 |
| NET OTHER ASSETS (LIABILITIES) - 0.1% | | | 158,587 |
| NET ASSETS - 100% | | | $247,125,960 |
Legend
(a) Non-income producing
(b) Security or a portion of the security is on loan at period end.
(c) Affiliated fund that is generally available only to investment companies and other accounts managed by Fidelity Investments. The rate quoted is the annualized seven-day yield of the fund at period end. A complete unaudited listing of the fund's holdings as of its most recent quarter end is available upon request. In addition, each Fidelity Central Fund's financial statements are available on the SEC's website or upon request.
(d) Investment made with cash collateral received from securities on loan.
Affiliated Central Funds
Information regarding fiscal year to date income earned by the Fund from investments in Fidelity Central Funds is as follows:
| Fund | Income earned |
| Fidelity Cash Central Fund | $12,386 |
| Fidelity Securities Lending Cash Central Fund | 24,524 |
| Total | $36,910 |
Investment Valuation
The following is a summary of the inputs used, as of June 30, 2017, involving the Fund's assets and liabilities carried at fair value. The inputs or methodology used for valuing securities may not be an indication of the risk associated with investing in those securities. For more information on valuation inputs, and their aggregation into the levels used below, please refer to the Investment Valuation section in the accompanying Notes to Financial Statements.
| | Valuation Inputs at Reporting Date: |
| Description | Total | Level 1 | Level 2 | Level 3 |
| Investments in Securities: | | | | |
| Equities: | | | | |
| Consumer Discretionary | $25,337,661 | $19,327,847 | $6,009,814 | $-- |
| Consumer Staples | 34,565,688 | 18,239,482 | 16,326,206 | -- |
| Financials | 30,539,466 | 25,671,438 | 4,868,028 | -- |
| Health Care | 16,676,530 | 15,364,240 | 1,312,290 | -- |
| Industrials | 59,774,775 | 51,618,391 | 8,156,384 | -- |
| Information Technology | 46,351,751 | 36,819,705 | 9,532,046 | -- |
| Materials | 19,329,124 | 17,666,674 | 1,662,450 | -- |
| Real Estate | 4,959,976 | 4,959,976 | -- | -- |
| Telecommunication Services | 1,383,384 | 1,383,384 | -- | -- |
| Utilities | 2,147,315 | 2,147,315 | -- | -- |
| Money Market Funds | 5,901,703 | 5,901,703 | -- | -- |
| Total Investments in Securities: | $246,967,373 | $199,100,155 | $47,867,218 | $-- |
The following is a summary of transfers between Level 1 and Level 2 for the period ended June 30, 2017. Transfers are assumed to have occurred at the beginning of the period, and are primarily attributable to the valuation techniques used for foreign equity securities, as discussed in the accompanying Notes to Financial Statements:
| Transfers | Total |
| Level 1 to Level 2 | $4,317,026 |
| Level 2 to Level 1 | $2,961,951 |
See accompanying notes which are an integral part of the financial statements.
Financial Statements
Statement of Assets and Liabilities
| | | June 30, 2017 (Unaudited) |
| Assets | | |
Investment in securities, at value (including securities loaned of $1,671,619) — See accompanying schedule:
Unaffiliated issuers (cost $194,701,372) | $241,065,670 | |
| Fidelity Central Funds (cost $5,901,703) | 5,901,703 | |
| Total Investments (cost $200,603,075) | | $246,967,373 |
| Cash | | 14,270 |
| Foreign currency held at value (cost $272,913) | | 272,913 |
| Receivable for investments sold | | 4,278,653 |
| Receivable for fund shares sold | | 316,560 |
| Dividends receivable | | 581,312 |
| Distributions receivable from Fidelity Central Funds | | 8,778 |
| Other receivables | | 88,841 |
| Total assets | | 252,528,700 |
| Liabilities | | |
| Payable for investments purchased | $3,134,029 | |
| Accrued management fee | 142,083 | |
| Distribution and service plan fees payable | 1,813 | |
| Other affiliated payables | 38,645 | |
| Other payables and accrued expenses | 330,970 | |
| Collateral on securities loaned | 1,755,200 | |
| Total liabilities | | 5,402,740 |
| Net Assets | | $247,125,960 |
| Net Assets consist of: | | |
| Paid in capital | | $204,183,028 |
| Undistributed net investment income | | 1,206,447 |
| Accumulated undistributed net realized gain (loss) on investments and foreign currency transactions | | (4,360,539) |
| Net unrealized appreciation (depreciation) on investments and assets and liabilities in foreign currencies | | 46,097,024 |
| Net Assets | | $247,125,960 |
| Initial Class: | | |
| Net Asset Value, offering price and redemption price per share ($23,592,051 ÷ 1,523,697 shares) | | $15.48 |
| Service Class: | | |
| Net Asset Value, offering price and redemption price per share ($163,386 ÷ 10,577 shares) | | $15.45 |
| Service Class 2: | | |
| Net Asset Value, offering price and redemption price per share ($8,950,394 ÷ 582,797 shares) | | $15.36 |
| Investor Class: | | |
| Net Asset Value, offering price and redemption price per share ($214,420,129 ÷ 13,958,670 shares) | | $15.36 |
See accompanying notes which are an integral part of the financial statements.
Statement of Operations
| | | Six months ended June 30, 2017 (Unaudited) |
| Investment Income | | |
| Dividends | | $2,432,604 |
| Income from Fidelity Central Funds | | 36,910 |
| Income before foreign taxes withheld | | 2,469,514 |
| Less foreign taxes withheld | | (221,267) |
| Total income | | 2,248,247 |
| Expenses | | |
| Management fee | $722,356 | |
| Transfer agent fees | 141,839 | |
| Distribution and service plan fees | 9,228 | |
| Accounting and security lending fees | 54,017 | |
| Custodian fees and expenses | 79,689 | |
| Independent trustees' fees and expenses | 390 | |
| Audit | 56,040 | |
| Legal | 1,748 | |
| Miscellaneous | 754 | |
| Total expenses before reductions | 1,066,061 | |
| Expense reductions | (29,773) | 1,036,288 |
| Net investment income (loss) | | 1,211,959 |
| Realized and Unrealized Gain (Loss) | | |
| Net realized gain (loss) on: | | |
| Investment securities: | | |
| Unaffiliated issuers | 6,968,421 | |
| Fidelity Central Funds | (307) | |
| Foreign currency transactions | 44,918 | |
| Total net realized gain (loss) | | 7,013,032 |
Change in net unrealized appreciation (depreciation) on:
Investment securities (net of increase in deferred foreign taxes of $251,549) | 29,877,287 | |
| Assets and liabilities in foreign currencies | 17,510 | |
| Total change in net unrealized appreciation (depreciation) | | 29,894,797 |
| Net gain (loss) | | 36,907,829 |
| Net increase (decrease) in net assets resulting from operations | | $38,119,788 |
See accompanying notes which are an integral part of the financial statements.
Statement of Changes in Net Assets
| | Six months ended June 30, 2017 (Unaudited) | Year ended December 31, 2016 |
| Increase (Decrease) in Net Assets | | |
| Operations | | |
| Net investment income (loss) | $1,211,959 | $1,518,230 |
| Net realized gain (loss) | 7,013,032 | (4,443,690) |
| Change in net unrealized appreciation (depreciation) | 29,894,797 | (3,117,089) |
| Net increase (decrease) in net assets resulting from operations | 38,119,788 | (6,042,549) |
| Distributions to shareholders from net investment income | – | (1,446,618) |
| Distributions to shareholders from tax return of capital | – | (106,313) |
| Total distributions | – | (1,552,931) |
| Share transactions - net increase (decrease) | 30,557,859 | (3,219,510) |
| Total increase (decrease) in net assets | 68,677,647 | (10,814,990) |
| Net Assets | | |
| Beginning of period | 178,448,313 | 189,263,303 |
| End of period | $247,125,960 | $178,448,313 |
| Other Information | | |
| Undistributed net investment income end of period | $1,206,447 | $– |
| Distributions in excess of net investment income end of period | $– | $(5,512) |
See accompanying notes which are an integral part of the financial statements.
Financial Highlights — VIP International Capital Appreciation Portfolio Initial Class
| | Six months ended (Unaudited) June 30, | Years ended December 31, | | | | |
| | 2017 | 2016 | 2015 | 2014 | 2013 | 2012 |
| Selected Per–Share Data | | | | | | |
| Net asset value, beginning of period | $12.80 | $13.32 | $13.01 | $12.68 | $10.50 | $8.42 |
| Income from Investment Operations | | | | | | |
| Net investment income (loss)A | .09 | .12 | .09 | .10 | .10 | .10 |
| Net realized and unrealized gain (loss) | 2.59 | (.52) | .33 | .28 | 2.17 | 2.08 |
| Total from investment operations | 2.68 | (.40) | .42 | .38 | 2.27 | 2.18 |
| Distributions from net investment income | – | (.11)B | (.10) | (.05) | (.08) | (.10) |
| Distributions from net realized gain | – | – | – | – | (.01) | – |
| Tax return of capital | – | (.01)B | (.01) | – | – | – |
| Total distributions | – | (.12) | (.11) | (.05) | (.09) | (.10) |
| Redemption fees added to paid in capitalA | – | – | –C | –C | –C | –C |
| Net asset value, end of period | $15.48 | $12.80 | $13.32 | $13.01 | $12.68 | $10.50 |
| Total ReturnD,E,F | 20.94% | (2.98)% | 3.22% | 3.01% | 21.62% | 25.91% |
| Ratios to Average Net AssetsG,H | | | | | | |
| Expenses before reductions | .94%I | .99% | .98% | 1.10% | 1.17% | 1.25% |
| Expenses net of fee waivers, if any | .94%I | .99% | .98% | 1.10% | 1.10% | 1.10% |
| Expenses net of all reductions | .91%I | .97% | .96% | 1.09% | 1.07% | 1.05% |
| Net investment income (loss) | 1.24%I | .89% | .68% | .78% | .84% | 1.07% |
| Supplemental Data | | | | | | |
| Net assets, end of period (000 omitted) | $23,592 | $16,644 | $20,154 | $1,464 | $2,404 | $573 |
| Portfolio turnover rateJ | 158%I | 188% | 189% | 183% | 153% | 137% |
A Calculated based on average shares outstanding during the period.
B The amounts shown reflect certain reclassifications related to book to tax differences that were made in the year shown.
C Amount represents less than $.005 per share.
D Total returns for periods of less than one year are not annualized.
E Total returns do not reflect charges attributable to your insurance company's separate account. Inclusion of these charges would reduce the total returns shown.
F Total returns would have been lower if certain expenses had not been reduced during the applicable periods shown.
G Fees and expenses of any underlying Fidelity Central Funds are not included in the Fund's expense ratio. The Fund indirectly bears its proportionate share of the expenses of any underlying Fidelity Central Funds.
H Expense ratios reflect operating expenses of the class. Expenses before reductions do not reflect amounts reimbursed by the investment adviser or reductions from brokerage service arrangements or reductions from other expense offset arrangements and do not represent the amount paid by the class during periods when reimbursements or reductions occur. Expenses net of fee waivers reflect expenses after reimbursement by the investment adviser but prior to reductions from brokerage service arrangements or other expense offset arrangements. Expenses net of all reductions represent the net expenses paid by the class.
I Annualized
J Amount does not include the portfolio activity of any underlying Fidelity Central Funds.
See accompanying notes which are an integral part of the financial statements.
Financial Highlights — VIP International Capital Appreciation Portfolio Service Class
| | Six months ended (Unaudited) June 30, | Years ended December 31, | | | | |
| | 2017 | 2016 | 2015 | 2014 | 2013 | 2012 |
| Selected Per–Share Data | | | | | | |
| Net asset value, beginning of period | $12.78 | $13.30 | $12.99 | $12.66 | $10.49 | $8.41 |
| Income from Investment Operations | | | | | | |
| Net investment income (loss)A | .08 | .10 | .08 | .09 | .08 | .09 |
| Net realized and unrealized gain (loss) | 2.59 | (.51) | .32 | .28 | 2.17 | 2.08 |
| Total from investment operations | 2.67 | (.41) | .40 | .37 | 2.25 | 2.17 |
| Distributions from net investment income | – | (.10)B | (.09) | (.04) | (.07) | (.09) |
| Distributions from net realized gain | – | – | – | – | (.01) | – |
| Tax return of capital | – | (.01)B | (.01) | – | – | – |
| Total distributions | – | (.11) | (.09)C | (.04) | (.08) | (.09) |
| Redemption fees added to paid in capitalA | – | – | –D | –D | –D | –D |
| Net asset value, end of period | $15.45 | $12.78 | $13.30 | $12.99 | $12.66 | $10.49 |
| Total ReturnE,F,G | 20.89% | (3.11)% | 3.12% | 2.93% | 21.44% | 25.83% |
| Ratios to Average Net AssetsH,I | | | | | | |
| Expenses before reductions | 1.04%J | 1.09% | 1.09% | 1.21% | 1.28% | 1.35% |
| Expenses net of fee waivers, if any | 1.04%J | 1.09% | 1.09% | 1.20% | 1.20% | 1.20% |
| Expenses net of all reductions | 1.02%J | 1.07% | 1.07% | 1.19% | 1.17% | 1.15% |
| Net investment income (loss) | 1.14%J | .79% | .58% | .68% | .73% | .96% |
| Supplemental Data | | | | | | |
| Net assets, end of period (000 omitted) | $163 | $142 | $222 | $114 | $111 | $94 |
| Portfolio turnover rateK | 158%J | 188% | 189% | 183% | 153% | 137% |
A Calculated based on average shares outstanding during the period.
B The amounts shown reflect certain reclassifications related to book to tax differences that were made in the year shown.
C Total distributions of $.09 per share is comprised of distributions from net investment income of $.088 and distributions from net realized gain of $.006 per share.
D Amount represents less than $.005 per share.
E Total returns for periods of less than one year are not annualized.
F Total returns do not reflect charges attributable to your insurance company's separate account. Inclusion of these charges would reduce the total returns shown.
G Total returns would have been lower if certain expenses had not been reduced during the applicable periods shown.
H Fees and expenses of any underlying Fidelity Central Funds are not included in the Fund's expense ratio. The Fund indirectly bears its proportionate share of the expenses of any underlying Fidelity Central Funds.
I Expense ratios reflect operating expenses of the class. Expenses before reductions do not reflect amounts reimbursed by the investment adviser or reductions from brokerage service arrangements or reductions from other expense offset arrangements and do not represent the amount paid by the class during periods when reimbursements or reductions occur. Expenses net of fee waivers reflect expenses after reimbursement by the investment adviser but prior to reductions from brokerage service arrangements or other expense offset arrangements. Expenses net of all reductions represent the net expenses paid by the class.
J Annualized
K Amount does not include the portfolio activity of any underlying Fidelity Central Funds.
See accompanying notes which are an integral part of the financial statements.
Financial Highlights — VIP International Capital Appreciation Portfolio Service Class 2
| | Six months ended (Unaudited) June 30, | Years ended December 31, | | | | |
| | 2017 | 2016 | 2015 | 2014 | 2013 | 2012 |
| Selected Per–Share Data | | | | | | |
| Net asset value, beginning of period | $12.72 | $13.24 | $12.92 | $12.61 | $10.46 | $8.40 |
| Income from Investment Operations | | | | | | |
| Net investment income (loss)A | .07 | .08 | .06 | .07 | .07 | .08 |
| Net realized and unrealized gain (loss) | 2.57 | (.50) | .32 | .27 | 2.16 | 2.07 |
| Total from investment operations | 2.64 | (.42) | .38 | .34 | 2.23 | 2.15 |
| Distributions from net investment income | – | (.09)B | (.06) | (.03) | (.07) | (.09) |
| Distributions from net realized gain | – | – | – | – | (.01) | – |
| Tax return of capital | – | (.01)B | .00 | – | – | – |
| Total distributions | – | (.10) | (.06) | (.03) | (.08) | (.09) |
| Redemption fees added to paid in capitalA | – | – | –C | –C | –C | –C |
| Net asset value, end of period | $15.36 | $12.72 | $13.24 | $12.92 | $12.61 | $10.46 |
| Total ReturnD,E,F | 20.75% | (3.18)% | 2.96% | 2.71% | 21.33% | 25.61% |
| Ratios to Average Net AssetsG,H | | | | | | |
| Expenses before reductions | 1.19%I | 1.24% | 1.23% | 1.35% | 1.46% | 1.49% |
| Expenses net of fee waivers, if any | 1.19%I | 1.24% | 1.23% | 1.35% | 1.35% | 1.35% |
| Expenses net of all reductions | 1.16%I | 1.22% | 1.21% | 1.34% | 1.32% | 1.29% |
| Net investment income (loss) | .99%I | .64% | .43% | .54% | .59% | .82% |
| Supplemental Data | | | | | | |
| Net assets, end of period (000 omitted) | $8,950 | $6,144 | $3,629 | $2,360 | $2,374 | $1,476 |
| Portfolio turnover rateJ | 158%I | 188% | 189% | 183% | 153% | 137% |
A Calculated based on average shares outstanding during the period.
B The amounts shown reflect certain reclassifications related to book to tax differences that were made in the year shown.
C Amount represents less than $.005 per share.
D Total returns for periods of less than one year are not annualized.
E Total returns do not reflect charges attributable to your insurance company's separate account. Inclusion of these charges would reduce the total returns shown.
F Total returns would have been lower if certain expenses had not been reduced during the applicable periods shown.
G Fees and expenses of any underlying Fidelity Central Funds are not included in the Fund's expense ratio. The Fund indirectly bears its proportionate share of the expenses of any underlying Fidelity Central Funds.
H Expense ratios reflect operating expenses of the class. Expenses before reductions do not reflect amounts reimbursed by the investment adviser or reductions from brokerage service arrangements or reductions from other expense offset arrangements and do not represent the amount paid by the class during periods when reimbursements or reductions occur. Expenses net of fee waivers reflect expenses after reimbursement by the investment adviser but prior to reductions from brokerage service arrangements or other expense offset arrangements. Expenses net of all reductions represent the net expenses paid by the class.
I Annualized
J Amount does not include the portfolio activity of any underlying Fidelity Central Funds.
See accompanying notes which are an integral part of the financial statements.
Financial Highlights — VIP International Capital Appreciation Portfolio Investor Class
| | Six months ended (Unaudited) June 30, | Years ended December 31, | | | | |
| | 2017 | 2016 | 2015 | 2014 | 2013 | 2012 |
| Selected Per–Share Data | | | | | | |
| Net asset value, beginning of period | $12.71 | $13.22 | $12.92 | $12.59 | $10.43 | $8.37 |
| Income from Investment Operations | | | | | | |
| Net investment income (loss)A | .08 | .11 | .08 | .09 | .09 | .09 |
| Net realized and unrealized gain (loss) | 2.57 | (.51) | .32 | .29 | 2.15 | 2.07 |
| Total from investment operations | 2.65 | (.40) | .40 | .38 | 2.24 | 2.16 |
| Distributions from net investment income | – | (.10)B | (.09) | (.05) | (.07) | (.10) |
| Distributions from net realized gain | – | – | – | – | (.01) | – |
| Tax return of capital | – | (.01)B | (.01) | – | – | – |
| Total distributions | – | (.11) | (.10) | (.05) | (.08) | (.10) |
| Redemption fees added to paid in capitalA | – | – | –C | –C | –C | –C |
| Net asset value, end of period | $15.36 | $12.71 | $13.22 | $12.92 | $12.59 | $10.43 |
| Total ReturnD,E,F | 20.85% | (3.01)% | 3.08% | 2.99% | 21.50% | 25.81% |
| Ratios to Average Net AssetsG,H | | | | | | |
| Expenses before reductions | 1.02%I | 1.07% | 1.07% | 1.19% | 1.26% | 1.34% |
| Expenses net of fee waivers, if any | 1.02%I | 1.07% | 1.06% | 1.18% | 1.18% | 1.18% |
| Expenses net of all reductions | 1.00%I | 1.05% | 1.04% | 1.17% | 1.15% | 1.13% |
| Net investment income (loss) | 1.16%I | .80% | .60% | .71% | .75% | .99% |
| Supplemental Data | | | | | | |
| Net assets, end of period (000 omitted) | $214,420 | $155,518 | $165,258 | $112,479 | $87,029 | $40,107 |
| Portfolio turnover rateJ | 158%I | 188% | 189% | 183% | 153% | 137% |
A Calculated based on average shares outstanding during the period.
B The amounts shown reflect certain reclassifications related to book to tax differences that were made in the year shown.
C Amount represents less than $.005 per share.
D Total returns for periods of less than one year are not annualized.
E Total returns do not reflect charges attributable to your insurance company's separate account. Inclusion of these charges would reduce the total returns shown.
F Total returns would have been lower if certain expenses had not been reduced during the applicable periods shown.
G Fees and expenses of any underlying Fidelity Central Funds are not included in the Fund's expense ratio. The Fund indirectly bears its proportionate share of the expenses of any underlying Fidelity Central Funds.
H Expense ratios reflect operating expenses of the class. Expenses before reductions do not reflect amounts reimbursed by the investment adviser or reductions from brokerage service arrangements or reductions from other expense offset arrangements and do not represent the amount paid by the class during periods when reimbursements or reductions occur. Expenses net of fee waivers reflect expenses after reimbursement by the investment adviser but prior to reductions from brokerage service arrangements or other expense offset arrangements. Expenses net of all reductions represent the net expenses paid by the class.
I Annualized
J Amount does not include the portfolio activity of any underlying Fidelity Central Funds.
See accompanying notes which are an integral part of the financial statements.
Notes to Financial Statements (Unaudited)
For the period ended June 30, 2017
1. Organization.
VIP International Capital Appreciation Portfolio (the Fund) is a fund of Variable Insurance Products Fund II (the Trust) and is authorized to issue an unlimited number of shares. The Trust is registered under the Investment Company Act of 1940, as amended (the 1940 Act), as an open-end management investment company organized as a Massachusetts business trust. Shares of the Fund may only be purchased by insurance companies for the purpose of funding variable annuity or variable life insurance contracts. The Fund offers the following classes of shares: Initial Class shares, Service Class shares, Service Class 2 shares and Investor Class shares. All classes have equal rights and voting privileges, except for matters affecting a single class. The Fund's investments in emerging markets can be subject to social, economic, regulatory, and political uncertainties and can be extremely volatile.
2. Investments in Fidelity Central Funds.
The Fund invests in Fidelity Central Funds, which are open-end investment companies generally available only to other investment companies and accounts managed by the investment adviser and its affiliates. The Fund's Schedule of Investments lists each of the Fidelity Central Funds held as of period end, if any, as an investment of the Fund, but does not include the underlying holdings of each Fidelity Central Fund. As an Investing Fund, the Fund indirectly bears its proportionate share of the expenses of the underlying Fidelity Central Funds.
The Money Market Central Funds seek preservation of capital and current income and are managed by Fidelity Investments Money Management, Inc. (FIMM), an affiliate of the investment adviser. Annualized expenses of the Money Market Central Funds as of their most recent shareholder report date are less than .005%.
A complete unaudited list of holdings for each Fidelity Central Fund is available upon request or at the Securities and Exchange Commission (the SEC) website at www.sec.gov. In addition, the financial statements of the Fidelity Central Funds are available on the SEC website or upon request.
3. Significant Accounting Policies.
The Fund is an investment company and applies the accounting and reporting guidance of the Financial Accounting Standards Board (FASB) Accounting Standards Codification Topic 946 Financial Services – Investments Companies. The financial statements have been prepared in conformity with accounting principles generally accepted in the United States of America (GAAP), which require management to make certain estimates and assumptions at the date of the financial statements. Actual results could differ from those estimates. Subsequent events, if any, through the date that the financial statements were issued have been evaluated in the preparation of the financial statements. The following summarizes the significant accounting policies of the Fund:
Investment Valuation. Investments are valued as of 4:00 p.m. Eastern time on the last calendar day of the period. The Board of Trustees (the Board) has delegated the day to day responsibility for the valuation of the Fund's investments to the Fair Value Committee (the Committee) established by the Fund's investment adviser. In accordance with valuation policies and procedures approved by the Board, the Fund attempts to obtain prices from one or more third party pricing vendors or brokers to value its investments. When current market prices, quotations or currency exchange rates are not readily available or reliable, investments will be fair valued in good faith by the Committee, in accordance with procedures adopted by the Board. Factors used in determining fair value vary by investment type and may include market or investment specific events. The frequency with which these procedures are used cannot be predicted and they may be utilized to a significant extent. The Committee oversees the Fund's valuation policies and procedures and reports to the Board on the Committee's activities and fair value determinations. The Board monitors the appropriateness of the procedures used in valuing the Fund's investments and ratifies the fair value determinations of the Committee.
The Fund categorizes the inputs to valuation techniques used to value its investments into a disclosure hierarchy consisting of three levels as shown below:
- Level 1 – quoted prices in active markets for identical investments
- Level 2 – other significant observable inputs (including quoted prices for similar investments, interest rates, prepayment speeds, etc.)
- Level 3 – unobservable inputs (including the Fund's own assumptions based on the best information available)
Valuation techniques used to value the Fund's investments by major category are as follows:
Equity securities, including restricted securities, for which market quotations are readily available, are valued at the last reported sale price or official closing price as reported by a third party pricing vendor on the primary market or exchange on which they are traded and are categorized as Level 1 in the hierarchy. In the event there were no sales during the day or closing prices are not available, securities are valued at the last quoted bid price or may be valued using the last available price and are generally categorized as Level 2 in the hierarchy. For foreign equity securities, when market or security specific events arise, comparisons to the valuation of American Depositary Receipts (ADRs), futures contracts, and certain indexes as well as quoted prices for similar securities may be used and would be categorized as Level 2 in the hierarchy. Utilizing these techniques may result in transfers between Level 1 and Level 2. For equity securities, including restricted securities, where observable inputs are limited, assumptions about market activity and risk are used and these securities may be categorized as Level 3 in the hierarchy.
Investments in open-end mutual funds, including the Fidelity Central Funds, are valued at their closing net asset value (NAV) each business day and are categorized as Level 1 in the hierarchy.
Changes in valuation techniques may result in transfers in or out of an assigned level within the disclosure hierarchy. The aggregate value of investments by input level as of June 30, 2017, including information on transfers between Levels 1 and 2, is included at the end of the Fund's Schedule of Investments.
Foreign Currency. The Fund may use foreign currency contracts to facilitate transactions in foreign-denominated securities. Gains and losses from these transactions may arise from changes in the value of the foreign currency or if the counterparties do not perform under the contracts' terms.
Foreign-denominated assets, including investment securities, and liabilities are translated into U.S. dollars at the exchange rates at period end. Purchases and sales of investment securities, income and dividends received and expenses denominated in foreign currencies are translated into U.S. dollars at the exchange rate in effect on the transaction date.
The effects of exchange rate fluctuations on investments are included with the net realized and unrealized gain (loss) on investment securities. Other foreign currency transactions resulting in realized and unrealized gain (loss) are disclosed separately.
Investment Transactions and Income. For financial reporting purposes, the Fund's investment holdings and NAV include trades executed through the end of the last business day of the period. The NAV per share for processing shareholder transactions is calculated as of the close of business of the New York Stock Exchange (NYSE), normally 4:00 p.m. Eastern time and includes trades executed through the end of the prior business day. Gains and losses on securities sold are determined on the basis of identified cost and may include proceeds received from litigation. Dividend income is recorded on the ex-dividend date, except for certain dividends from foreign securities where the ex-dividend date may have passed, which are recorded as soon as the Fund is informed of the ex-dividend date. Non-cash dividends included in dividend income, if any, are recorded at the fair market value of the securities received. Income and capital gain distributions from Fidelity Central Funds, if any, are recorded on the ex-dividend date. Certain distributions received by the Fund represent a return of capital or capital gain. The Fund determines the components of these distributions subsequent to the ex-dividend date, based upon receipt of tax filings or other correspondence relating to the underlying investment. These distributions are recorded as a reduction of cost of investments and/or as a realized gain. Investment income is recorded net of foreign taxes withheld where recovery of such taxes is uncertain.
Class Allocations and Expenses. Investment income, realized and unrealized capital gains and losses, common expenses of the Fund, and certain fund-level expense reductions, if any, are allocated daily on a pro-rata basis to each class based on the relative net assets of each class to the total net assets of the Fund. Each class differs with respect to transfer agent and distribution and service plan fees incurred. Certain expense reductions may also differ by class. For the reporting period, the allocated portion of income and expenses to each class as a percent of its average net assets may vary due to the timing of recording these transactions in relation to fluctuating net assets of the classes. Expenses directly attributable to a fund are charged to that fund. Expenses attributable to more than one fund are allocated among the respective funds on the basis of relative net assets or other appropriate methods. Expense estimates are accrued in the period to which they relate and adjustments are made when actual amounts are known.
Income Tax Information and Distributions to Shareholders. Each year, the Fund intends to qualify as a regulated investment company under Subchapter M of the Internal Revenue Code, including distributing substantially all of its taxable income and realized gains. As a result, no provision for U.S. Federal income taxes is required. The Fund files a U.S. federal tax return, in addition to state and local tax returns as required. The Fund's federal income tax returns are subject to examination by the Internal Revenue Service (IRS) for a period of three fiscal years after they are filed. State and local tax returns may be subject to examination for an additional fiscal year depending on the jurisdiction. Foreign taxes are provided for based on the Fund's understanding of the tax rules and rates that exist in the foreign markets in which it invests. The Fund is subject to a tax imposed on capital gains by certain countries in which it invests. An estimated deferred tax liability for net unrealized appreciation on the applicable securities is included in Other payables and accrued expenses on the Statement of Assets & Liabilities.
Distributions are declared and recorded on the ex-dividend date. Income dividends and capital gain distributions are declared separately for each class. Income and capital gain distributions are determined in accordance with income tax regulations, which may differ from GAAP.
Capital accounts within the financial statements are adjusted for permanent book-tax differences. These adjustments have no impact on net assets or the results of operations. Capital accounts are not adjusted for temporary book-tax differences which will reverse in a subsequent period.
Book-tax differences are primarily due to foreign currency transactions, certain foreign taxes, passive foreign investments companies (PFIC), capital loss carryforwards, expiring capital loss carryforwards and losses deferred due to wash sales and excise tax regulations.
The federal tax cost of investment securities and unrealized appreciation (depreciation) as of period end were as follows:
| Gross unrealized appreciation | $47,403,412 |
| Gross unrealized depreciation | (1,731,722) |
| Net unrealized appreciation (depreciation) on securities | $45,671,690 |
| Tax cost | $201,295,683 |
Capital loss carryforwards are only available to offset future capital gains of the Fund to the extent provided by regulations and may be limited. Under the Regulated Investment Company Modernization Act of 2010 (the Act), the Fund is permitted to carry forward capital losses incurred in taxable years beginning after December 22, 2010 for an unlimited period and such capital losses are required to be used prior to any losses that expire. The capital loss carryforward information presented below, including any applicable limitation, is estimated as of prior fiscal period end and is subject to adjustment.
| Fiscal year of expiration | |
| 2017 | $(4,429,182) |
| No expiration | |
| Short-term | (5,222,567) |
| Total capital loss carryforward | $(9,651,749) |
The Fund elected to defer to its next fiscal year $2,739 of ordinary losses recognized during the period November 1, 2016 to December 31, 2016.
4. Purchases and Sales of Investments.
Purchases and sales of securities, other than short-term securities, aggregated $189,507,937 and $161,577,990, respectively.
5. Fees and Other Transactions with Affiliates.
Management Fee. Fidelity Management & Research Company (the investment adviser) and its affiliates provide the Fund with investment management related services for which the Fund pays a monthly management fee. The management fee is the sum of an individual fund fee rate that is based on an annual rate of .45% of the Fund's average net assets and an annualized group fee rate that averaged .25% during the period. The group fee rate is based upon the average net assets of all the mutual funds advised by the investment adviser, including any mutual funds previously advised by the investment adviser that are currently advised by Fidelity SelectCo, LLC, an affiliate of the investment adviser. The group fee rate decreases as assets under management increase and increases as assets under management decrease. For the reporting period, the total annualized management fee rate was .69% of the Fund's average net assets.
Distribution and Service Plan Fees. In accordance with Rule 12b-1 of the 1940 Act, the Fund has adopted separate 12b-1 Plans for each Service Class of shares. Each Service Class pays Fidelity Distributors Corporation (FDC), an affiliate of the investment adviser, a service fee. For the period, the service fee is based on an annual rate of .10% of Service Class' average net assets and .25% of Service Class 2's average net assets.
For the period, total fees, all of which were re-allowed to insurance companies for the distribution of shares and providing shareholder support services, were as follows:
| Service Class | $77 |
| Service Class 2 | 9,151 |
| | $9,228 |
Transfer Agent Fees. Fidelity Investments Institutional Operations Company, Inc. (FIIOC), an affiliate of the investment adviser, is the Fund's transfer, dividend disbursing, and shareholder servicing agent. FIIOC receives an asset-based fee with respect to each class. Each class pays a fee for transfer agent services, typesetting and printing and mailing of shareholder reports, excluding mailing of proxy statements, equal to an annual rate of class-level average net assets. The annual rate for Investor Class is .15% and the annual rate for all other classes is .07%. For the period, transfer agent fees for each class were as follows:
| Initial Class | $6,391 |
| Service Class | 51 |
| Service Class 2 | 2,416 |
| Investor Class | 132,981 |
| | $141,839 |
Accounting and Security Lending Fees. Fidelity Service Company, Inc. (FSC), an affiliate of the investment adviser, maintains the Fund's accounting records. The accounting fee is based on the level of average net assets for each month. Under a separate contract, FSC administers the security lending program. The security lending fee is based on the number and duration of lending transactions.
Brokerage Commissions. The Fund placed a portion of its portfolio transactions with brokerage firms which are affiliates of the investment adviser. Brokerage commissions are included in net realized gain (loss) and change in net unrealized appreciation (depreciation) in the Statement of Operations. The commissions paid to these affiliated firms were $1,237 for the period.
Interfund Trades. The Fund may purchase from or sell securities to other Fidelity Funds under procedures adopted by the Board. The procedures have been designed to ensure these interfund trades are executed in accordance with Rule 17a-7 of the 1940 Act. Interfund trades are included within the respective purchases and sales amounts shown in the Purchases and Sales of Investments note.
6. Committed Line of Credit.
The Fund participates with other funds managed by the investment adviser or an affiliate in a $4.25 billion credit facility (the "line of credit") to be utilized for temporary or emergency purposes to fund shareholder redemptions or for other short-term liquidity purposes. The Fund has agreed to pay commitment fees on its pro-rata portion of the line of credit, which amounted to $318 and is reflected in Miscellaneous expenses on the Statement of Operations. During the period, the Fund did not borrow on this line of credit.
7. Security Lending.
The Fund lends portfolio securities through a lending agent from time to time in order to earn additional income. For equity securities, a lending agent is used and may loan securities to certain qualified borrowers, including Fidelity Capital Markets (FCM), a broker-dealer affiliated with the Fund. On the settlement date of the loan, the Fund receives collateral (in the form of U.S. Treasury obligations, letters of credit and/or cash) against the loaned securities and maintains collateral in an amount not less than 100% of the market value of the loaned securities during the period of the loan. The market value of the loaned securities is determined at the close of business of the Fund and any additional required collateral is delivered to the Fund on the next business day. The Fund or borrower may terminate the loan at any time, and if the borrower defaults on its obligation to return the securities loaned because of insolvency or other reasons, the Fund may apply collateral received from the borrower against the obligation. The Fund may experience delays and costs in recovering the securities loaned. Any cash collateral received is invested in the Fidelity Securities Lending Cash Central Fund. The value of loaned securities and cash collateral at period end are disclosed on the Fund's Statement of Assets and Liabilities. Security lending income represents the income earned on investing cash collateral, less rebates paid to borrowers and any lending agent fees associated with the loan, plus any premium payments received for lending certain types of securities. Security lending income is presented in the Statement of Operations as a component of income from Fidelity Central Funds. Total security lending income during the period amounted to $24,524. During the period, there were no securities loaned to FCM.
8. Expense Reductions.
Commissions paid to certain brokers with whom the investment adviser, or its affiliates, places trades on behalf of the Fund include an amount in addition to trade execution, which may be rebated back to the Fund to offset certain expenses. This amount totaled $28,971 for the period.
In addition, during the period the investment adviser reimbursed and/or waived a portion of fund-level operating expenses in the amount of $802.
9. Distributions to Shareholders.
Distributions to shareholders of each class were as follows:
| | Six months ended
June 30, 2017 | Year ended December 31, 2016 |
| From net investment income | | |
| Initial Class | $– | $146,515 |
| Service Class | – | 1,097 |
| Service Class 2 | – | 43,797 |
| Investor Class | – | 1,255,209 |
| Total | $– | $1,446,618 |
| Tax Return of Capital | | |
| Initial Class | $– | $10,767 |
| Service Class | – | 80 |
| Service Class 2 | – | 3,219 |
| Investor Class | – | 92,247 |
| Total | $– | $106,313 |
10. Share Transactions.
Transactions for each class of shares were as follows:
| | Shares | Shares | Dollars | Dollars |
| | Six months ended June 30, 2017 | Year ended December 31, 2016 | Year ended June 30, 2017 | Year ended December 31, 2016 |
| Initial Class | | | | |
| Shares sold | 339,669 | 140,726 | $5,051,610 | $1,871,117 |
| Reinvestment of distributions | – | 12,404 | – | 157,282 |
| Shares redeemed | (115,830) | (366,088) | (1,630,927) | (4,866,479) |
| Net increase (decrease) | 223,839 | (212,958) | $3,420,683 | $(2,838,080) |
| Service Class | | | | |
| Reinvestment of distributions | – | 93 | – | 1,177 |
| Shares redeemed | (529) | (5,693) | (7,229) | (75,207) |
| Net increase (decrease) | (529) | (5,600) | $(7,229) | $(74,030) |
| Service Class 2 | | | | |
| Shares sold | 188,161 | 357,681 | $2,718,544 | $4,764,967 |
| Reinvestment of distributions | – | 3,734 | – | 47,016 |
| Shares redeemed | (88,431) | (152,446) | (1,255,526) | (2,017,714) |
| Net increase (decrease) | 99,730 | 208,969 | $1,463,018 | $2,794,269 |
| Investor Class | | | | |
| Shares sold | 2,079,116 | 1,417,731 | $30,553,005 | $18,814,334 |
| Reinvestment of distributions | – | 107,111 | – | 1,347,456 |
| Shares redeemed | (356,003) | (1,785,856) | (4,871,618) | (23,263,459) |
| Net increase (decrease) | 1,723,113 | (261,014) | $25,681,387 | $(3,101,669) |
11. Other.
The Fund's organizational documents provide former and current trustees and officers with a limited indemnification against liabilities arising in connection with the performance of their duties to the Fund. In the normal course of business, the Fund may also enter into contracts that provide general indemnifications. The Fund's maximum exposure under these arrangements is unknown as this would be dependent on future claims that may be made against the Fund. The risk of material loss from such claims is considered remote.
At the end of the period, the investment adviser or its affiliates were the owners of record of 96% of the total outstanding shares of the Fund.
Shareholder Expense Example
As a shareholder of the Fund, you incur two types of costs: (1) transaction costs, and (2) ongoing costs, including management fees, distribution and/or service (12b-1) fees and other Fund expenses. This Example is intended to help you understand your ongoing costs (in dollars) of investing in the Fund and to compare these costs with the ongoing costs of investing in other mutual funds.
The Example is based on an investment of $1,000 invested at the beginning of the period and held for the entire period (January 1, 2017 to June 30, 2017).
Actual Expenses
The first line of the accompanying table for each class of the Fund provides information about actual account values and actual expenses. You may use the information in this line, together with the amount you invested, to estimate the expenses that you paid over the period. Simply divide your account value by $1,000.00 (for example, an $8,600 account value divided by $1,000.00 = 8.6), then multiply the result by the number in the first line for a class of the Fund under the heading entitled "Expenses Paid During Period" to estimate the expenses you paid on your account during this period. The estimate of expenses does not include any fees or other expenses of any variable annuity or variable life insurance product. If they were, the estimate of expenses you paid during the period would be higher, and your ending account value would be lower. In addition, the Fund, as a shareholder in the underlying Fidelity Central Funds, will indirectly bear its pro-rata share of the fees and expenses incurred by the underlying Fidelity Central Funds. These fees and expenses are not included in the Fund's annualized expense ratio used to calculate the expense estimate in the table below.
Hypothetical Example for Comparison Purposes
The second line of the accompanying table for each class of the Fund provides information about hypothetical account values and hypothetical expenses based on a Class' actual expense ratio and an assumed rate of return of 5% per year before expenses, which is not the Class' actual return. The hypothetical account values and expenses may not be used to estimate the actual ending account balance or expenses you paid for the period. You may use this information to compare the ongoing costs of investing in the Fund and other funds. To do so, compare this 5% hypothetical example with the 5% hypothetical examples that appear in the shareholder reports of the other funds. The estimate of expenses does not include any fees or other expenses of any variable annuity or variable life insurance product. If they were, the estimate of expenses you paid during the period would be higher, and your ending account value would be lower. In addition, the Fund, as a shareholder in the underlying Fidelity Central Funds, will indirectly bear its pro-rata share of the fees and expenses incurred by the underlying Fidelity Central Funds. These fees and expenses are not included in the Fund's annualized expense ratio used to calculate the expense estimate in the table below.
Please note that the expenses shown in the table are meant to highlight your ongoing costs only and do not reflect any transaction costs. Therefore, the second line of the table is useful in comparing ongoing costs only, and will not help you determine the relative total costs of owning different funds.
| | Annualized Expense Ratio-A | Beginning
Account Value
January 1, 2017 | Ending
Account Value
June 30, 2017 | Expenses Paid
During Period-B
January 1, 2017
to June 30, 2017 |
| Initial Class | .94% | | | |
| Actual | | $1,000.00 | $1,209.40 | $5.15 |
| Hypothetical-C | | $1,000.00 | $1,020.13 | $4.71 |
| Service Class | 1.04% | | | |
| Actual | | $1,000.00 | $1,208.90 | $5.70 |
| Hypothetical-C | | $1,000.00 | $1,019.64 | $5.21 |
| Service Class 2 | 1.19% | | | |
| Actual | | $1,000.00 | $1,207.50 | $6.51 |
| Hypothetical-C | | $1,000.00 | $1,018.89 | $5.96 |
| Investor Class | 1.02% | | | |
| Actual | | $1,000.00 | $1,208.50 | $5.59 |
| Hypothetical-C | | $1,000.00 | $1,019.74 | $5.11 |
A Annualized expense ratio reflects expenses net of applicable fee waivers.
B Expenses are equal to each Class' annualized expense ratio, multiplied by the average account value over the period, multiplied by 181/365 (to reflect the one-half year period).
C 5% return per year before expenses
VIPCAP-SANN-0817
1.818378.112
Item 2.
Code of Ethics
Not applicable.
Item 3.
Audit Committee Financial Expert
Not applicable.
Item 4.
Principal Accountant Fees and Services
Not applicable.
Item 5.
Audit Committee of Listed Registrants
Not applicable.
Item 6.
Investments
(a)
Not applicable.
(b)
Not applicable
Item 7.
Disclosure of Proxy Voting Policies and Procedures for Closed-End Management Investment Companies
Not applicable.
Item 8.
Portfolio Managers of Closed-End Management Investment Companies
Not applicable.
Item 9.
Purchase of Equity Securities by Closed-End Management Investment Company and Affiliated Purchasers
Not applicable.
Item 10.
Submission of Matters to a Vote of Security Holders
There were no material changes to the procedures by which shareholders may recommend nominees to the Variable Insurance Products Fund II’s Board of Trustees.
Item 11.
Controls and Procedures
(a)(i) The President and Treasurer and the Chief Financial Officer have concluded that the Variable Insurance Products Fund II’s (the “Trust”) disclosure controls and procedures (as defined in Rule 30a-3(c) under the Investment Company Act) provide
reasonable assurances that material information relating to the Trust is made known to them by the appropriate persons, based on their evaluation of these controls and procedures as of a date within 90 days of the filing date of this report.
(a)(ii) There was no change in the Trust’s internal control over financial reporting (as defined in Rule 30a-3(d) under the Investment Company Act) that occurred during the second fiscal quarter of the period covered by this report that has materially affected, or is reasonably likely to materially affect, the Trust’s internal control over financial reporting.
Item 12.
Exhibits
| | |
(a) | (1) | Not applicable. |
(a) | (2) | Certification pursuant to Rule 30a-2(a) under the Investment Company Act of 1940 (17 CFR 270.30a-2(a)) is filed and attached hereto as Exhibit 99.CERT. |
(a) | (3) | Not applicable. |
(b) |
| Certification pursuant to Rule 30a-2(b) under the Investment Company Act of 1940 (17 CFR 270.30a-2(b)) is furnished and attached hereto as Exhibit 99.906CERT. |
SIGNATURES
Pursuant to the requirements of the Securities Exchange Act of 1934 and the Investment Company Act of 1940, the registrant has duly caused this report to be signed on its behalf by the undersigned, thereunto duly authorized.
Variable Insurance Products Fund II
| |
By: | /s/Stacie M. Smith |
| Stacie M. Smith |
| President and Treasurer |
|
|
Date: | August 23, 2017 |
Pursuant to the requirements of the Securities Exchange Act of 1934 and the Investment Company Act of 1940, this report has been signed below by the following persons on behalf of the registrant and in the capacities and on the dates indicated.
| |
By: | /s/Stacie M. Smith |
| Stacie M. Smith |
| President and Treasurer |
|
|
Date: | August 23, 2017 |
| |
By: | /s/Howard J. Galligan III |
| Howard J. Galligan III |
| Chief Financial Officer |
|
|
Date: | August 23, 2017 |