UNITED STATES
SECURITIES AND EXCHANGE COMMISSION
Washington, D.C. 20549
FORM N-CSR
CERTIFIED SHAREHOLDER REPORT OF REGISTERED
MANAGEMENT INVESTMENT COMPANIES
Investment Company Act file number 811-05511
Variable Insurance Products Fund II
(Exact name of registrant as specified in charter)
245 Summer St., Boston, MA 02210
(Address of principal executive offices) (Zip code)
Cynthia Lo Bessette, Secretary
245 Summer St.
Boston, Massachusetts 02210
(Name and address of agent for service)
Registrant's telephone number, including area code:
617-563-7000
| |
Date of fiscal year end: | December 31 |
|
|
Date of reporting period: | June 30, 2020 |
Item 1.
Reports to Stockholders
Fidelity® Variable Insurance Products:
Index 500 Portfolio
Semi-Annual Report
June 30, 2020

See the inside front cover for important information about access to your fund’s shareholder reports.

Beginning on January 1, 2021, as permitted by regulations adopted by the Securities and Exchange Commission, and if your insurance carrier elects to participate, you may not be receiving paper copies of the Fund’s shareholder reports from the insurance company that offers your variable insurance product unless you specifically request paper copies from your financial professional or the administrator of your variable insurance product. Instead, the reports will be made available on a website, and you will be notified by mail each time a report is posted and provided with a website link to access the report.
If you already elected to receive shareholder reports electronically, you will not be affected by this change and you need not take any action. You may elect to receive shareholder reports and other communications from the Fund electronically, by contacting your financial professional or the administrator of your variable insurance product. If you own a Fidelity-administered variable insurance product, please visit fidelity.com/mailpreferences to make your election or call 1-800-343-3548.
You may elect to receive all future reports in paper free of charge. If you wish to continue receiving paper copies of your shareholder reports, you may contact your financial professional or the administrator of your variable insurance product. If you own a Fidelity-administered variable insurance product, please visit fidelity.com/mailpreferences to make your election or call 1-800-343-3548. Your election to receive reports in paper will apply to all funds available under your variable insurance product.
Contents
To view a fund's proxy voting guidelines and proxy voting record for the 12-month period ended June 30, visit http://www.fidelity.com/proxyvotingresults or visit the Securities and Exchange Commission's (SEC) web site at http://www.sec.gov.
You may also call 1-877-208-0098 to request a free copy of the proxy voting guidelines.
Fidelity® Variable Insurance Products are separate account options which are purchased through a variable insurance contract.
Standard & Poor's, S&P and S&P 500 are registered service marks of The McGraw-Hill Companies, Inc. and have been licensed for use by Fidelity Distributors Corporation.
Other third-party marks appearing herein are the property of their respective owners.
All other marks appearing herein are registered or unregistered trademarks or service marks of FMR LLC or an affiliated company. © 2020 FMR LLC. All rights reserved.
This report and the financial statements contained herein are submitted for the general information of the shareholders of the Fund. This report is not authorized for distribution to prospective investors in the Fund unless preceded or accompanied by an effective prospectus.
A fund files its complete schedule of portfolio holdings with the SEC for the first and third quarters of each fiscal year on Form N-PORT. Forms N-PORT are available on the SEC’s web site at http://www.sec.gov. A fund's Forms N-PORT may be reviewed and copied at the SEC’s Public Reference Room in Washington, DC. Information regarding the operation of the SEC's Public Reference Room may be obtained by calling 1-800-SEC-0330.
For a complete list of a fund's portfolio holdings, view the most recent holdings listing, semiannual report, or annual report on Fidelity's web site at http://www.fidelity.com, http://www.institutional.fidelity.com, or http://www.401k.com, as applicable.
NOT FDIC INSURED •MAY LOSE VALUE •NO BANK GUARANTEE
Neither the Fund nor Fidelity Distributors Corporation is a bank.
Note to Shareholders:
Early in 2020, the outbreak and spread of a new coronavirus emerged as a public health emergency that had a major influence on financial markets, primarily based on its impact on the global economy and the outlook for corporate earnings. The virus causes a respiratory disease known as COVID-19. On March 11, the World Health Organization declared the COVID-19 outbreak a pandemic, citing sustained risk of further global spread.
In the weeks following, as the crisis worsened, we witnessed an escalating human tragedy with wide-scale social and economic consequences from coronavirus-containment measures. The outbreak of COVID-19 prompted a number of measures to limit the spread, including travel and border restrictions, quarantines, and restrictions on large gatherings. In turn, these resulted in lower consumer activity, diminished demand for a wide range of products and services, disruption in manufacturing and supply chains, and – given the wide variability in outcomes regarding the outbreak – significant market uncertainty and volatility. Amid the turmoil, the U.S. government took unprecedented action – in concert with the U.S. Federal Reserve and central banks around the world – to help support consumers, businesses, and the broader economy, and to limit disruption to the financial system.
The situation continues to unfold, and the extent and duration of its impact on financial markets and the economy remain highly uncertain. Extreme events such as the coronavirus crisis are “exogenous shocks” that can have significant adverse effects on mutual funds and their investments. Although multiple asset classes may be affected by market disruption, the duration and impact may not be the same for all types of assets.
Fidelity is committed to helping you stay informed amid news about COVID-19 and during increased market volatility, and we’re taking extra steps to be responsive to customer needs. We encourage you to visit our websites, where we offer ongoing updates, commentary, and analysis on the markets and our funds.
Investment Summary (Unaudited)
Top Ten Stocks as of June 30, 2020
| | % of fund's net assets |
| Microsoft Corp. | 6.0 |
| Apple, Inc. | 5.8 |
| Amazon.com, Inc. | 4.5 |
| Facebook, Inc. Class A | 2.1 |
| Alphabet, Inc. Class A | 1.6 |
| Alphabet, Inc. Class C | 1.6 |
| Johnson & Johnson | 1.4 |
| Berkshire Hathaway, Inc. Class B | 1.3 |
| Visa, Inc. Class A | 1.3 |
| Procter & Gamble Co. | 1.1 |
| | 26.7 |
Top Market Sectors as of June 30, 2020
| | % of fund's net assets |
| Information Technology | 27.2 |
| Health Care | 14.5 |
| Consumer Discretionary | 10.8 |
| Communication Services | 10.7 |
| Financials | 10.0 |
| Industrials | 7.9 |
| Consumer Staples | 6.9 |
| Utilities | 3.1 |
| Real Estate | 2.8 |
| Energy | 2.8 |
Asset Allocation (% of fund's net assets)
| As of June 30, 2020 * |
| | Stocks and Equity Futures | 100.1% |
| | Short-Term Investments and Net Other Assets (Liabilities)** | (0.1)% |

* Foreign investments - 2.8%
** Short-Term Investments and Net Other Assets (Liabilities) are not included in the pie chart
Schedule of Investments June 30, 2020 (Unaudited)
Showing Percentage of Net Assets
| Common Stocks - 99.2% | | | |
| | | Shares | Value |
| COMMUNICATION SERVICES - 10.7% | | | |
| Diversified Telecommunication Services - 1.8% | | | |
| AT&T, Inc. | | 2,349,847 | $71,035,875 |
| CenturyLink, Inc. | | 326,050 | 3,270,282 |
| Verizon Communications, Inc. | | 1,364,586 | 75,229,626 |
| | | | 149,535,783 |
| Entertainment - 2.0% | | | |
| Activision Blizzard, Inc. | | 254,115 | 19,287,329 |
| Electronic Arts, Inc. (a) | | 95,208 | 12,572,216 |
| Live Nation Entertainment, Inc. (a) | | 46,921 | 2,080,008 |
| Netflix, Inc. (a) | | 145,056 | 66,006,282 |
| Take-Two Interactive Software, Inc. (a) | | 37,589 | 5,246,297 |
| The Walt Disney Co. | | 595,750 | 66,432,083 |
| | | | 171,624,215 |
| Interactive Media & Services - 5.4% | | | |
| Alphabet, Inc.: | | | |
| Class A (a) | | 98,901 | 140,246,563 |
| Class C (a) | | 96,509 | 136,426,087 |
| Facebook, Inc. Class A (a) | | 793,040 | 180,075,593 |
| Twitter, Inc. (a) | | 258,872 | 7,711,797 |
| | | | 464,460,040 |
| Media - 1.3% | | | |
| Charter Communications, Inc. Class A (a) | | 49,704 | 25,351,028 |
| Comcast Corp. Class A | | 1,502,208 | 58,556,068 |
| Discovery Communications, Inc.: | | | |
| Class A (a)(b) | | 52,341 | 1,104,395 |
| Class C (non-vtg.) (a) | | 104,967 | 2,021,664 |
| DISH Network Corp. Class A (a) | | 84,870 | 2,928,864 |
| Fox Corp.: | | | |
| Class A | | 112,646 | 3,021,166 |
| Class B | | 53,013 | 1,422,869 |
| Interpublic Group of Companies, Inc. | | 127,488 | 2,187,694 |
| News Corp.: | | | |
| Class A | | 127,635 | 1,513,751 |
| Class B | | 41,101 | 491,157 |
| Omnicom Group, Inc. | | 70,756 | 3,863,278 |
| ViacomCBS, Inc. Class B | | 178,457 | 4,161,617 |
| | | | 106,623,551 |
| Wireless Telecommunication Services - 0.2% | | | |
| T-Mobile U.S., Inc. | | 187,942 | 19,574,159 |
| T-Mobile U.S., Inc. rights 7/28/20 (a) | | 6,260 | 1,052 |
| | | | 19,575,211 |
|
| TOTAL COMMUNICATION SERVICES | | | 911,818,800 |
|
| CONSUMER DISCRETIONARY - 10.8% | | | |
| Auto Components - 0.1% | | | |
| Aptiv PLC | | 88,405 | 6,888,518 |
| BorgWarner, Inc. | | 68,429 | 2,415,544 |
| | | | 9,304,062 |
| Automobiles - 0.2% | | | |
| Ford Motor Co. | | 1,289,004 | 7,837,144 |
| General Motors Co. | | 415,422 | 10,510,177 |
| | | | 18,347,321 |
| Distributors - 0.1% | | | |
| Genuine Parts Co. | | 47,644 | 4,143,122 |
| LKQ Corp. (a) | | 100,585 | 2,635,327 |
| | | | 6,778,449 |
| Diversified Consumer Services - 0.0% | | | |
| H&R Block, Inc. | | 63,780 | 910,778 |
| Hotels, Restaurants & Leisure - 1.5% | | | |
| Carnival Corp. (b) | | 156,423 | 2,568,466 |
| Chipotle Mexican Grill, Inc. (a) | | 8,464 | 8,907,175 |
| Darden Restaurants, Inc. | | 42,783 | 3,241,668 |
| Domino's Pizza, Inc. | | 12,902 | 4,766,515 |
| Hilton Worldwide Holdings, Inc. | | 91,472 | 6,718,618 |
| Las Vegas Sands Corp. | | 110,784 | 5,045,103 |
| Marriott International, Inc. Class A | | 88,955 | 7,626,112 |
| McDonald's Corp. | | 245,223 | 45,236,287 |
| MGM Mirage, Inc. | | 162,892 | 2,736,586 |
| Norwegian Cruise Line Holdings Ltd. (a)(b) | | 84,665 | 1,391,046 |
| Royal Caribbean Cruises Ltd. (b) | | 56,376 | 2,835,713 |
| Starbucks Corp. | | 385,260 | 28,351,283 |
| Wynn Resorts Ltd. | | 32,075 | 2,389,267 |
| Yum! Brands, Inc. | | 99,141 | 8,616,344 |
| | | | 130,430,183 |
| Household Durables - 0.4% | | | |
| D.R. Horton, Inc. | | 109,127 | 6,051,092 |
| Garmin Ltd. | | 47,875 | 4,667,813 |
| Leggett & Platt, Inc. | | 43,730 | 1,537,110 |
| Lennar Corp. Class A | | 90,605 | 5,583,080 |
| Mohawk Industries, Inc. (a) | | 19,422 | 1,976,383 |
| Newell Brands, Inc. | | 126,077 | 2,002,103 |
| NVR, Inc. (a) | | 1,140 | 3,714,975 |
| PulteGroup, Inc. | | 83,575 | 2,844,057 |
| Whirlpool Corp. | | 20,519 | 2,657,826 |
| | | | 31,034,439 |
| Internet & Direct Marketing Retail - 4.9% | | | |
| Amazon.com, Inc. (a) | | 138,181 | 381,216,506 |
| eBay, Inc. | | 217,881 | 11,427,858 |
| Expedia, Inc. | | 44,719 | 3,675,902 |
| The Booking Holdings, Inc. (a) | | 13,501 | 21,498,182 |
| | | | 417,818,448 |
| Leisure Products - 0.1% | | | |
| Hasbro, Inc. | | 41,764 | 3,130,212 |
| Multiline Retail - 0.5% | | | |
| Dollar General Corp. | | 83,032 | 15,818,426 |
| Dollar Tree, Inc. (a) | | 78,277 | 7,254,712 |
| Kohl's Corp. | | 51,154 | 1,062,469 |
| Target Corp. | | 164,936 | 19,780,774 |
| | | | 43,916,381 |
| Specialty Retail - 2.4% | | | |
| Advance Auto Parts, Inc. | | 22,723 | 3,236,891 |
| AutoZone, Inc. (a) | | 7,703 | 8,689,908 |
| Best Buy Co., Inc. | | 75,006 | 6,545,774 |
| CarMax, Inc. (a)(b) | | 53,656 | 4,804,895 |
| Gap, Inc. | | 69,519 | 877,330 |
| L Brands, Inc. | | 75,878 | 1,135,894 |
| Lowe's Companies, Inc. | | 249,039 | 33,650,150 |
| O'Reilly Automotive, Inc. (a) | | 24,487 | 10,325,433 |
| Ross Stores, Inc. | | 117,248 | 9,994,220 |
| The Home Depot, Inc. | | 354,727 | 88,862,661 |
| Tiffany & Co., Inc. | | 36,014 | 4,391,547 |
| TJX Companies, Inc. | | 395,161 | 19,979,340 |
| Tractor Supply Co. | | 38,152 | 5,028,052 |
| Ulta Beauty, Inc. (a) | | 18,585 | 3,780,561 |
| | | | 201,302,656 |
| Textiles, Apparel & Luxury Goods - 0.6% | | | |
| Hanesbrands, Inc. | | 115,186 | 1,300,450 |
| NIKE, Inc. Class B | | 409,000 | 40,102,450 |
| PVH Corp. | | 23,507 | 1,129,511 |
| Ralph Lauren Corp. | | 15,830 | 1,147,992 |
| Tapestry, Inc. | | 90,151 | 1,197,205 |
| Under Armour, Inc.: | | | |
| Class A (sub. vtg.) (a) | | 60,088 | 585,257 |
| Class C (non-vtg.) (a) | | 65,167 | 576,076 |
| VF Corp. | | 105,255 | 6,414,240 |
| | | | 52,453,181 |
|
| TOTAL CONSUMER DISCRETIONARY | | | 915,426,110 |
|
| CONSUMER STAPLES - 6.9% | | | |
| Beverages - 1.7% | | | |
| Brown-Forman Corp. Class B (non-vtg.) | | 60,165 | 3,830,104 |
| Constellation Brands, Inc. Class A (sub. vtg.) | | 55,419 | 9,695,554 |
| Molson Coors Beverage Co. Class B | | 61,746 | 2,121,593 |
| Monster Beverage Corp. (a) | | 123,309 | 8,547,780 |
| PepsiCo, Inc. | | 457,611 | 60,523,631 |
| The Coca-Cola Co. | | 1,274,892 | 56,962,175 |
| | | | 141,680,837 |
| Food & Staples Retailing - 1.5% | | | |
| Costco Wholesale Corp. | | 145,628 | 44,155,866 |
| Kroger Co. | | 259,343 | 8,778,761 |
| Sysco Corp. | | 167,277 | 9,143,361 |
| Walgreens Boots Alliance, Inc. | | 243,111 | 10,305,475 |
| Walmart, Inc. | | 466,993 | 55,936,422 |
| | | | 128,319,885 |
| Food Products - 1.1% | | | |
| Archer Daniels Midland Co. | | 183,383 | 7,316,982 |
| Campbell Soup Co. | | 55,474 | 2,753,175 |
| Conagra Brands, Inc. | | 160,720 | 5,652,522 |
| General Mills, Inc. | | 199,964 | 12,327,781 |
| Hormel Foods Corp. | | 92,497 | 4,464,830 |
| Kellogg Co. | | 82,553 | 5,453,451 |
| Lamb Weston Holdings, Inc. | | 47,956 | 3,065,827 |
| McCormick & Co., Inc. (non-vtg.) | | 40,804 | 7,320,646 |
| Mondelez International, Inc. | | 470,886 | 24,076,401 |
| The Hershey Co. | | 48,603 | 6,299,921 |
| The J.M. Smucker Co. | | 37,645 | 3,983,217 |
| The Kraft Heinz Co. | | 205,653 | 6,558,274 |
| Tyson Foods, Inc. Class A | | 96,766 | 5,777,898 |
| | | | 95,050,925 |
| Household Products - 1.7% | | | |
| Church & Dwight Co., Inc. | | 81,114 | 6,270,112 |
| Clorox Co. | | 41,264 | 9,052,084 |
| Colgate-Palmolive Co. | | 282,513 | 20,696,902 |
| Kimberly-Clark Corp. | | 112,363 | 15,882,510 |
| Procter & Gamble Co. | | 816,457 | 97,623,763 |
| | | | 149,525,371 |
| Personal Products - 0.2% | | | |
| Coty, Inc. Class A | | 96,573 | 431,681 |
| Estee Lauder Companies, Inc. Class A | | 74,133 | 13,987,414 |
| | | | 14,419,095 |
| Tobacco - 0.7% | | | |
| Altria Group, Inc. | | 612,978 | 24,059,387 |
| Philip Morris International, Inc. | | 513,566 | 35,980,434 |
| | | | 60,039,821 |
|
| TOTAL CONSUMER STAPLES | | | 589,035,934 |
|
| ENERGY - 2.8% | | | |
| Energy Equipment & Services - 0.2% | | | |
| Baker Hughes Co. Class A | | 216,315 | 3,329,088 |
| Halliburton Co. | | 287,893 | 3,736,851 |
| National Oilwell Varco, Inc. | | 128,679 | 1,576,318 |
| Schlumberger Ltd. | | 458,331 | 8,428,707 |
| TechnipFMC PLC | | 137,297 | 939,111 |
| | | | 18,010,075 |
| Oil, Gas & Consumable Fuels - 2.6% | | | |
| Apache Corp. | | 124,657 | 1,682,870 |
| Cabot Oil & Gas Corp. | | 131,504 | 2,259,239 |
| Chevron Corp. | | 615,759 | 54,944,176 |
| Concho Resources, Inc. | | 64,984 | 3,346,676 |
| ConocoPhillips Co. | | 353,755 | 14,864,785 |
| Devon Energy Corp. | | 126,423 | 1,433,637 |
| Diamondback Energy, Inc. | | 52,114 | 2,179,407 |
| EOG Resources, Inc. | | 192,025 | 9,727,987 |
| Exxon Mobil Corp. | | 1,394,559 | 62,364,678 |
| Hess Corp. | | 86,173 | 4,464,623 |
| HollyFrontier Corp. | | 48,510 | 1,416,492 |
| Kinder Morgan, Inc. | | 641,509 | 9,731,692 |
| Marathon Oil Corp. | | 261,313 | 1,599,236 |
| Marathon Petroleum Corp. | | 214,522 | 8,018,832 |
| Noble Energy, Inc. | | 156,267 | 1,400,152 |
| Occidental Petroleum Corp. | | 297,065 | 5,436,290 |
| ONEOK, Inc. | | 145,086 | 4,819,757 |
| Phillips 66 Co. | | 144,046 | 10,356,907 |
| Pioneer Natural Resources Co. | | 54,310 | 5,306,087 |
| The Williams Companies, Inc. | | 400,207 | 7,611,937 |
| Valero Energy Corp. | | 134,618 | 7,918,231 |
| | | | 220,883,691 |
|
| TOTAL ENERGY | | | 238,893,766 |
|
| FINANCIALS - 10.0% | | | |
| Banks - 3.6% | | | |
| Bank of America Corp. | | 2,574,931 | 61,154,611 |
| Citigroup, Inc. | | 686,626 | 35,086,589 |
| Citizens Financial Group, Inc. | | 140,842 | 3,554,852 |
| Comerica, Inc. | | 45,966 | 1,751,305 |
| Fifth Third Bancorp | | 234,873 | 4,528,351 |
| First Republic Bank | | 56,527 | 5,991,297 |
| Huntington Bancshares, Inc. | | 334,928 | 3,026,074 |
| JPMorgan Chase & Co. | | 1,004,889 | 94,519,859 |
| KeyCorp | | 323,026 | 3,934,457 |
| M&T Bank Corp. | | 42,312 | 4,399,179 |
| Peoples United Financial, Inc. | | 140,259 | 1,622,797 |
| PNC Financial Services Group, Inc. | | 139,911 | 14,720,036 |
| Regions Financial Corp. | | 316,362 | 3,517,945 |
| SVB Financial Group (a) | | 16,911 | 3,644,828 |
| Truist Financial Corp. | | 444,415 | 16,687,783 |
| U.S. Bancorp | | 452,046 | 16,644,334 |
| Wells Fargo & Co. | | 1,230,548 | 31,502,029 |
| Zions Bancorp NA | | 54,132 | 1,840,488 |
| | | | 308,126,814 |
| Capital Markets - 2.7% | | | |
| Ameriprise Financial, Inc. | | 40,353 | 6,054,564 |
| Bank of New York Mellon Corp. | | 265,695 | 10,269,112 |
| BlackRock, Inc. Class A | | 50,874 | 27,680,035 |
| Cboe Global Markets, Inc. | | 36,356 | 3,391,288 |
| Charles Schwab Corp. | | 377,903 | 12,750,447 |
| CME Group, Inc. | | 118,254 | 19,221,005 |
| E*TRADE Financial Corp. | | 72,958 | 3,628,201 |
| Franklin Resources, Inc. (b) | | 91,120 | 1,910,786 |
| Goldman Sachs Group, Inc. | | 102,072 | 20,171,469 |
| Intercontinental Exchange, Inc. | | 180,430 | 16,527,388 |
| Invesco Ltd. | | 124,442 | 1,338,996 |
| MarketAxess Holdings, Inc. | | 12,501 | 6,262,001 |
| Moody's Corp. | | 53,221 | 14,621,405 |
| Morgan Stanley | | 394,947 | 19,075,940 |
| MSCI, Inc. | | 28,040 | 9,360,313 |
| Northern Trust Corp. | | 68,620 | 5,444,311 |
| Raymond James Financial, Inc. | | 40,169 | 2,764,832 |
| S&P Global, Inc. | | 79,441 | 26,174,221 |
| State Street Corp. | | 116,077 | 7,376,693 |
| T. Rowe Price Group, Inc. | | 75,033 | 9,266,576 |
| The NASDAQ OMX Group, Inc. | | 37,853 | 4,522,298 |
| | | | 227,811,881 |
| Consumer Finance - 0.5% | | | |
| American Express Co. | | 217,688 | 20,723,898 |
| Capital One Financial Corp. | | 150,172 | 9,399,265 |
| Discover Financial Services | | 101,060 | 5,062,095 |
| Synchrony Financial | | 177,192 | 3,926,575 |
| | | | 39,111,833 |
| Diversified Financial Services - 1.3% | | | |
| Berkshire Hathaway, Inc. Class B (a) | | 641,150 | 114,451,687 |
| Insurance - 1.9% | | | |
| AFLAC, Inc. | | 236,632 | 8,525,851 |
| Allstate Corp. | | 103,564 | 10,044,672 |
| American International Group, Inc. | | 284,117 | 8,858,768 |
| Aon PLC | | 76,202 | 14,676,505 |
| Arthur J. Gallagher & Co. | | 62,505 | 6,093,612 |
| Assurant, Inc. | | 19,687 | 2,033,470 |
| Chubb Ltd. | | 148,858 | 18,848,400 |
| Cincinnati Financial Corp. | | 49,858 | 3,192,408 |
| Everest Re Group Ltd. | | 13,196 | 2,721,015 |
| Globe Life, Inc. | | 32,317 | 2,398,891 |
| Hartford Financial Services Group, Inc. | | 118,136 | 4,554,143 |
| Lincoln National Corp. | | 63,819 | 2,347,901 |
| Loews Corp. | | 79,885 | 2,739,257 |
| Marsh & McLennan Companies, Inc. | | 168,234 | 18,063,285 |
| MetLife, Inc. | | 254,404 | 9,290,834 |
| Principal Financial Group, Inc. | | 84,084 | 3,492,849 |
| Progressive Corp. | | 193,004 | 15,461,550 |
| Prudential Financial, Inc. | | 130,314 | 7,936,123 |
| The Travelers Companies, Inc. | | 83,380 | 9,509,489 |
| Unum Group | | 67,382 | 1,117,867 |
| W.R. Berkley Corp. | | 46,593 | 2,669,313 |
| Willis Towers Watson PLC | | 42,447 | 8,359,937 |
| | | | 162,936,140 |
|
| TOTAL FINANCIALS | | | 852,438,355 |
|
| HEALTH CARE - 14.5% | | | |
| Biotechnology - 2.4% | | | |
| AbbVie, Inc. | | 581,242 | 57,066,340 |
| Alexion Pharmaceuticals, Inc. (a) | | 72,841 | 8,175,674 |
| Amgen, Inc. | | 194,008 | 45,758,727 |
| Biogen, Inc. (a) | | 53,822 | 14,400,076 |
| Gilead Sciences, Inc. | | 413,596 | 31,822,076 |
| Incyte Corp. (a) | | 59,518 | 6,188,086 |
| Regeneron Pharmaceuticals, Inc. (a) | | 33,267 | 20,746,965 |
| Vertex Pharmaceuticals, Inc. (a) | | 85,514 | 24,825,569 |
| | | | 208,983,513 |
| Health Care Equipment & Supplies - 3.8% | | | |
| Abbott Laboratories | | 583,377 | 53,338,159 |
| Abiomed, Inc. (a) | | 14,806 | 3,576,537 |
| Align Technology, Inc. (a) | | 23,647 | 6,489,683 |
| Baxter International, Inc. | | 167,809 | 14,448,355 |
| Becton, Dickinson & Co. | | 97,255 | 23,270,204 |
| Boston Scientific Corp. (a) | | 471,267 | 16,546,184 |
| Danaher Corp. | | 207,517 | 36,695,231 |
| Dentsply Sirona, Inc. | | 72,321 | 3,186,463 |
| DexCom, Inc. (a) | | 30,442 | 12,341,187 |
| Edwards Lifesciences Corp. (a) | | 204,382 | 14,124,840 |
| Hologic, Inc. (a) | | 85,183 | 4,855,431 |
| IDEXX Laboratories, Inc. (a) | | 28,017 | 9,250,093 |
| Intuitive Surgical, Inc. (a) | | 38,463 | 21,917,371 |
| Medtronic PLC | | 442,296 | 40,558,543 |
| ResMed, Inc. | | 47,714 | 9,161,088 |
| STERIS PLC | | 28,019 | 4,299,235 |
| Stryker Corp. | | 106,326 | 19,158,882 |
| Teleflex, Inc. | | 15,314 | 5,573,990 |
| The Cooper Companies, Inc. | | 16,245 | 4,607,732 |
| Varian Medical Systems, Inc. (a) | | 29,812 | 3,652,566 |
| West Pharmaceutical Services, Inc. | | 24,249 | 5,508,645 |
| Zimmer Biomet Holdings, Inc. | | 68,220 | 8,142,739 |
| | | | 320,703,158 |
| Health Care Providers & Services - 2.8% | | | |
| AmerisourceBergen Corp. | | 48,986 | 4,936,319 |
| Anthem, Inc. | | 83,114 | 21,857,320 |
| Cardinal Health, Inc. | | 96,361 | 5,029,081 |
| Centene Corp. (a) | | 190,967 | 12,135,953 |
| Cigna Corp. | | 121,705 | 22,837,943 |
| CVS Health Corp. | | 431,093 | 28,008,112 |
| DaVita HealthCare Partners, Inc. (a) | | 28,138 | 2,226,841 |
| HCA Holdings, Inc. | | 86,721 | 8,417,140 |
| Henry Schein, Inc. (a) | | 47,135 | 2,752,213 |
| Humana, Inc. | | 43,605 | 16,907,839 |
| Laboratory Corp. of America Holdings (a) | | 32,071 | 5,327,314 |
| McKesson Corp. | | 53,391 | 8,191,247 |
| Quest Diagnostics, Inc. | | 44,143 | 5,030,536 |
| UnitedHealth Group, Inc. | | 312,787 | 92,256,526 |
| Universal Health Services, Inc. Class B | | 25,652 | 2,382,814 |
| | | | 238,297,198 |
| Health Care Technology - 0.1% | | | |
| Cerner Corp. | | 100,432 | 6,884,614 |
| Life Sciences Tools & Services - 1.2% | | | |
| Agilent Technologies, Inc. | | 101,836 | 8,999,247 |
| Bio-Rad Laboratories, Inc. Class A (a) | | 7,048 | 3,182,102 |
| Illumina, Inc.(a) | | 48,484 | 17,956,049 |
| IQVIA Holdings, Inc. (a) | | 58,586 | 8,312,182 |
| Mettler-Toledo International, Inc. (a) | | 7,886 | 6,352,567 |
| PerkinElmer, Inc. | | 36,763 | 3,606,083 |
| Thermo Fisher Scientific, Inc. | | 130,253 | 47,195,872 |
| Waters Corp. (a) | | 20,438 | 3,687,015 |
| | | | 99,291,117 |
| Pharmaceuticals - 4.2% | | | |
| Bristol-Myers Squibb Co. | | 746,266 | 43,880,441 |
| Eli Lilly & Co. | | 277,770 | 45,604,279 |
| Johnson & Johnson | | 868,902 | 122,193,688 |
| Merck & Co., Inc. | | 832,510 | 64,377,998 |
| Mylan NV (a) | | 169,464 | 2,724,981 |
| Perrigo Co. PLC | | 44,720 | 2,471,674 |
| Pfizer, Inc. | | 1,832,110 | 59,909,997 |
| Zoetis, Inc. Class A | | 156,658 | 21,468,412 |
| | | | 362,631,470 |
|
| TOTAL HEALTH CARE | | | 1,236,791,070 |
|
| INDUSTRIALS - 7.9% | | | |
| Aerospace & Defense - 1.7% | | | |
| General Dynamics Corp. | | 76,631 | 11,453,269 |
| Harris Corp. | | 71,190 | 12,078,807 |
| Howmet Aerospace, Inc. | | 126,544 | 2,005,722 |
| Huntington Ingalls Industries, Inc. | | 13,435 | 2,344,273 |
| Lockheed Martin Corp. | | 81,364 | 29,691,351 |
| Northrop Grumman Corp. | | 51,129 | 15,719,100 |
| Raytheon Technologies Corp. | | 485,096 | 29,891,616 |
| Teledyne Technologies, Inc. (a) | | 12,092 | 3,760,007 |
| Textron, Inc. | | 74,573 | 2,454,197 |
| The Boeing Co. | | 176,823 | 32,411,656 |
| TransDigm Group, Inc. | | 16,590 | 7,333,610 |
| | | | 149,143,608 |
| Air Freight & Logistics - 0.5% | | | |
| C.H. Robinson Worldwide, Inc. (b) | | 44,348 | 3,506,153 |
| Expeditors International of Washington, Inc. | | 54,868 | 4,172,163 |
| FedEx Corp. | | 79,291 | 11,118,184 |
| United Parcel Service, Inc. Class B | | 232,220 | 25,818,220 |
| | | | 44,614,720 |
| Airlines - 0.2% | | | |
| Alaska Air Group, Inc. | | 40,241 | 1,459,139 |
| American Airlines Group, Inc. (b) | | 163,914 | 2,142,356 |
| Delta Air Lines, Inc. | | 187,296 | 5,253,653 |
| Southwest Airlines Co. | | 176,905 | 6,046,613 |
| United Airlines Holdings, Inc. (a)(b) | | 83,421 | 2,887,201 |
| | | | 17,788,962 |
| Building Products - 0.4% | | | |
| A.O. Smith Corp. | | 44,541 | 2,098,772 |
| Allegion PLC | | 30,502 | 3,117,914 |
| Carrier Global Corp. | | 268,547 | 5,967,114 |
| Fortune Brands Home & Security, Inc. | | 46,125 | 2,948,771 |
| Johnson Controls International PLC | | 245,376 | 8,377,137 |
| Masco Corp. | | 87,019 | 4,369,224 |
| Trane Technologies PLC | | 78,894 | 7,019,988 |
| | | | 33,898,920 |
| Commercial Services & Supplies - 0.4% | | | |
| Cintas Corp. | | 27,818 | 7,409,602 |
| Copart, Inc. (a) | | 68,192 | 5,678,348 |
| Republic Services, Inc. | | 69,039 | 5,664,650 |
| Rollins, Inc. | | 46,000 | 1,949,940 |
| Waste Management, Inc. | | 127,943 | 13,550,443 |
| | | | 34,252,983 |
| Construction & Engineering - 0.1% | | | |
| Jacobs Engineering Group, Inc. | | 42,926 | 3,640,125 |
| Quanta Services, Inc. | | 45,461 | 1,783,435 |
| | | | 5,423,560 |
| Electrical Equipment - 0.5% | | | |
| AMETEK, Inc. | | 75,649 | 6,760,751 |
| Eaton Corp. PLC | | 131,925 | 11,540,799 |
| Emerson Electric Co. | | 197,081 | 12,224,934 |
| Rockwell Automation, Inc. | | 38,201 | 8,136,813 |
| | | | 38,663,297 |
| Industrial Conglomerates - 1.1% | | | |
| 3M Co. | | 189,699 | 29,591,147 |
| General Electric Co. | | 2,885,176 | 19,705,752 |
| Honeywell International, Inc. | | 231,459 | 33,466,657 |
| Roper Technologies, Inc. | | 34,425 | 13,365,851 |
| | | | 96,129,407 |
| Machinery - 1.5% | | | |
| Caterpillar, Inc. | | 178,501 | 22,580,377 |
| Cummins, Inc. | | 48,636 | 8,426,673 |
| Deere & Co. | | 103,212 | 16,219,766 |
| Dover Corp. | | 47,612 | 4,597,415 |
| Flowserve Corp. | | 42,749 | 1,219,201 |
| Fortive Corp. | | 97,751 | 6,613,833 |
| IDEX Corp. | | 24,938 | 3,941,202 |
| Illinois Tool Works, Inc. | | 94,786 | 16,573,332 |
| Ingersoll Rand, Inc. (a) | | 113,558 | 3,193,251 |
| Otis Worldwide Corp. | | 134,242 | 7,633,000 |
| PACCAR, Inc. | | 113,942 | 8,528,559 |
| Parker Hannifin Corp. | | 42,341 | 7,759,835 |
| Pentair PLC | | 54,910 | 2,086,031 |
| Snap-On, Inc. (b) | | 18,018 | 2,495,673 |
| Stanley Black & Decker, Inc. | | 50,843 | 7,086,497 |
| Westinghouse Air Brake Co. | | 59,700 | 3,436,929 |
| Xylem, Inc. | | 59,043 | 3,835,433 |
| | | | 126,227,007 |
| Professional Services - 0.3% | | | |
| Equifax, Inc. | | 40,045 | 6,882,935 |
| IHS Markit Ltd. | | 131,439 | 9,923,645 |
| Nielsen Holdings PLC | | 116,247 | 1,727,430 |
| Robert Half International, Inc. | | 37,910 | 2,002,785 |
| Verisk Analytics, Inc. | | 53,521 | 9,109,274 |
| | | | 29,646,069 |
| Road & Rail - 1.0% | | | |
| CSX Corp. | | 252,432 | 17,604,608 |
| J.B. Hunt Transport Services, Inc. | | 27,966 | 3,365,428 |
| Kansas City Southern | | 31,337 | 4,678,301 |
| Norfolk Southern Corp. | | 84,489 | 14,833,734 |
| Old Dominion Freight Lines, Inc. | | 31,110 | 5,275,945 |
| Union Pacific Corp. | | 223,781 | 37,834,654 |
| | | | 83,592,670 |
| Trading Companies & Distributors - 0.2% | | | |
| Fastenal Co. | | 188,888 | 8,091,962 |
| United Rentals, Inc. (a) | | 23,784 | 3,544,767 |
| W.W. Grainger, Inc. | | 14,301 | 4,492,802 |
| | | | 16,129,531 |
|
| TOTAL INDUSTRIALS | | | 675,510,734 |
|
| INFORMATION TECHNOLOGY - 27.2% | | | |
| Communications Equipment - 1.0% | | | |
| Arista Networks, Inc. (a)(b) | | 17,782 | 3,734,753 |
| Cisco Systems, Inc. | | 1,398,616 | 65,231,450 |
| F5 Networks, Inc. (a) | | 19,961 | 2,784,160 |
| Juniper Networks, Inc. | | 109,930 | 2,513,000 |
| Motorola Solutions, Inc. | | 56,159 | 7,869,561 |
| | | | 82,132,924 |
| Electronic Equipment & Components - 0.5% | | | |
| Amphenol Corp. Class A | | 97,599 | 9,350,960 |
| CDW Corp. | | 47,101 | 5,472,194 |
| Corning, Inc. | | 250,414 | 6,485,723 |
| FLIR Systems, Inc. | | 43,201 | 1,752,665 |
| IPG Photonics Corp. (a) | | 11,615 | 1,862,930 |
| Keysight Technologies, Inc. (a) | | 61,489 | 6,196,861 |
| TE Connectivity Ltd. | | 108,816 | 8,873,945 |
| Zebra Technologies Corp. Class A (a) | | 17,516 | 4,483,220 |
| | | | 44,478,498 |
| IT Services - 5.7% | | | |
| Accenture PLC Class A | | 210,087 | 45,109,881 |
| Akamai Technologies, Inc. (a) | | 53,522 | 5,731,671 |
| Automatic Data Processing, Inc. | | 141,835 | 21,117,813 |
| Broadridge Financial Solutions, Inc. | | 37,877 | 4,779,699 |
| Cognizant Technology Solutions Corp. Class A | | 178,332 | 10,132,824 |
| DXC Technology Co. | | 83,629 | 1,379,879 |
| Fidelity National Information Services, Inc. | | 203,767 | 27,323,117 |
| Fiserv, Inc. (a) | | 185,478 | 18,106,362 |
| FleetCor Technologies, Inc. (a) | | 27,648 | 6,954,301 |
| Gartner, Inc. (a) | | 29,335 | 3,559,216 |
| Global Payments, Inc. | | 98,658 | 16,734,370 |
| IBM Corp. | | 292,844 | 35,366,770 |
| Jack Henry & Associates, Inc. | | 25,218 | 4,640,869 |
| Leidos Holdings, Inc. | | 44,044 | 4,125,601 |
| MasterCard, Inc. Class A | | 291,488 | 86,193,002 |
| Paychex, Inc. | | 105,327 | 7,978,520 |
| PayPal Holdings, Inc. (a) | | 387,249 | 67,470,393 |
| The Western Union Co. | | 135,625 | 2,932,213 |
| VeriSign, Inc. (a) | | 33,540 | 6,937,078 |
| Visa, Inc. Class A | | 556,415 | 107,482,686 |
| | | | 484,056,265 |
| Semiconductors & Semiconductor Equipment - 4.7% | | | |
| Advanced Micro Devices, Inc. (a) | | 386,283 | 20,322,349 |
| Analog Devices, Inc. | | 121,504 | 14,901,251 |
| Applied Materials, Inc. | | 302,275 | 18,272,524 |
| Broadcom, Inc. | | 131,854 | 41,614,441 |
| Intel Corp. | | 1,396,350 | 83,543,621 |
| KLA-Tencor Corp. | | 51,138 | 9,945,318 |
| Lam Research Corp. | | 47,879 | 15,486,941 |
| Maxim Integrated Products, Inc. | | 87,933 | 5,329,619 |
| Microchip Technology, Inc. | | 80,932 | 8,522,949 |
| Micron Technology, Inc. (a) | | 366,828 | 18,898,979 |
| NVIDIA Corp. | | 202,874 | 77,073,861 |
| Qorvo, Inc. (a) | | 37,851 | 4,183,671 |
| Qualcomm, Inc. | | 371,014 | 33,840,187 |
| Skyworks Solutions, Inc. | | 55,023 | 7,035,241 |
| Texas Instruments, Inc. | | 302,668 | 38,429,756 |
| Xilinx, Inc. | | 80,208 | 7,891,665 |
| | | | 405,292,373 |
| Software - 9.3% | | | |
| Adobe, Inc. (a) | | 158,904 | 69,172,500 |
| ANSYS, Inc. (a) | | 28,340 | 8,267,628 |
| Autodesk, Inc. (a) | | 72,303 | 17,294,155 |
| Cadence Design Systems, Inc. (a) | | 91,982 | 8,826,593 |
| Citrix Systems, Inc. | | 38,279 | 5,661,847 |
| Fortinet, Inc. (a) | | 44,257 | 6,075,158 |
| Intuit, Inc. | | 86,009 | 25,475,006 |
| Microsoft Corp. | | 2,501,083 | 508,995,394 |
| Nortonlifelock, Inc. | | 178,777 | 3,545,148 |
| Oracle Corp. | | 686,452 | 37,940,202 |
| Paycom Software, Inc. (a) | | 15,918 | 4,930,282 |
| Salesforce.com, Inc. (a) | | 297,168 | 55,668,481 |
| ServiceNow, Inc. (a) | | 62,902 | 25,479,084 |
| Synopsys, Inc. (a) | | 49,739 | 9,699,105 |
| Tyler Technologies, Inc. (a) | | 13,111 | 4,547,944 |
| | | | 791,578,527 |
| Technology Hardware, Storage & Peripherals - 6.0% | | | |
| Apple, Inc. | | 1,343,713 | 490,186,502 |
| Hewlett Packard Enterprise Co. | | 424,314 | 4,128,575 |
| HP, Inc. | | 471,614 | 8,220,232 |
| NetApp, Inc. | | 72,998 | 3,238,921 |
| Seagate Technology LLC | | 74,461 | 3,604,657 |
| Western Digital Corp. | | 98,889 | 4,365,949 |
| Xerox Holdings Corp. | | 60,734 | 928,623 |
| | | | 514,673,459 |
|
| TOTAL INFORMATION TECHNOLOGY | | | 2,322,212,046 |
|
| MATERIALS - 2.5% | | | |
| Chemicals - 1.8% | | | |
| Air Products & Chemicals, Inc. | | 72,841 | 17,588,188 |
| Albemarle Corp. U.S. | | 35,103 | 2,710,303 |
| Celanese Corp. Class A | | 39,069 | 3,373,217 |
| CF Industries Holdings, Inc. | | 71,026 | 1,998,672 |
| Corteva, Inc. | | 246,877 | 6,613,835 |
| Dow, Inc. | | 244,396 | 9,961,581 |
| DuPont de Nemours, Inc. | | 242,076 | 12,861,498 |
| Eastman Chemical Co. | | 44,610 | 3,106,640 |
| Ecolab, Inc. | | 81,568 | 16,227,954 |
| FMC Corp. | | 42,489 | 4,232,754 |
| International Flavors & Fragrances, Inc. (b) | | 35,254 | 4,317,205 |
| Linde PLC | | 173,210 | 36,739,573 |
| LyondellBasell Industries NV Class A | | 84,792 | 5,572,530 |
| PPG Industries, Inc. | | 77,832 | 8,254,862 |
| Sherwin-Williams Co. | | 26,653 | 15,401,436 |
| The Mosaic Co. | | 114,227 | 1,428,980 |
| | | | 150,389,228 |
| Construction Materials - 0.1% | | | |
| Martin Marietta Materials, Inc. | | 20,487 | 4,232,000 |
| Vulcan Materials Co. | | 43,686 | 5,061,023 |
| | | | 9,293,023 |
| Containers & Packaging - 0.3% | | | |
| Amcor PLC | | 519,264 | 5,301,685 |
| Avery Dennison Corp. | | 27,401 | 3,126,180 |
| Ball Corp. | | 107,567 | 7,474,831 |
| International Paper Co. | | 129,709 | 4,567,054 |
| Packaging Corp. of America | | 31,314 | 3,125,137 |
| Sealed Air Corp. | | 51,387 | 1,688,063 |
| WestRock Co. | | 85,638 | 2,420,130 |
| | | | 27,703,080 |
| Metals & Mining - 0.3% | | | |
| Freeport-McMoRan, Inc. | | 479,197 | 5,544,309 |
| Newmont Corp. | | 264,682 | 16,341,467 |
| Nucor Corp. | | 99,401 | 4,116,195 |
| | | | 26,001,971 |
|
| TOTAL MATERIALS | | | 213,387,302 |
|
| REAL ESTATE - 2.8% | | | |
| Equity Real Estate Investment Trusts (REITs) - 2.8% | | | |
| Alexandria Real Estate Equities, Inc. | | 41,626 | 6,753,819 |
| American Tower Corp. | | 146,208 | 37,800,616 |
| Apartment Investment & Management Co. Class A | | 48,641 | 1,830,847 |
| AvalonBay Communities, Inc. | | 46,430 | 7,179,935 |
| Boston Properties, Inc. | | 47,712 | 4,312,211 |
| Crown Castle International Corp. | | 137,451 | 23,002,425 |
| Digital Realty Trust, Inc. | | 88,497 | 12,576,309 |
| Duke Realty Corp. | | 121,555 | 4,301,831 |
| Equinix, Inc. | | 29,193 | 20,502,244 |
| Equity Residential (SBI) | | 115,415 | 6,788,710 |
| Essex Property Trust, Inc. | | 21,560 | 4,940,905 |
| Extra Space Storage, Inc. | | 42,456 | 3,921,661 |
| Federal Realty Investment Trust (SBI) | | 23,257 | 1,981,729 |
| Healthpeak Properties, Inc. | | 177,687 | 4,897,054 |
| Host Hotels & Resorts, Inc. | | 232,813 | 2,512,052 |
| Iron Mountain, Inc. (b) | | 94,293 | 2,461,047 |
| Kimco Realty Corp. | | 143,028 | 1,836,480 |
| Mid-America Apartment Communities, Inc. | | 37,738 | 4,327,416 |
| Prologis, Inc. | | 243,599 | 22,735,095 |
| Public Storage | | 49,578 | 9,513,522 |
| Realty Income Corp. | | 113,310 | 6,741,945 |
| Regency Centers Corp. | | 56,036 | 2,571,492 |
| SBA Communications Corp. Class A | | 36,819 | 10,969,116 |
| Simon Property Group, Inc. | | 100,615 | 6,880,054 |
| SL Green Realty Corp. | | 25,330 | 1,248,516 |
| UDR, Inc. | | 97,387 | 3,640,326 |
| Ventas, Inc. | | 123,118 | 4,508,581 |
| Vornado Realty Trust | | 52,417 | 2,002,854 |
| Welltower, Inc. | | 137,738 | 7,127,942 |
| Weyerhaeuser Co. | | 246,284 | 5,531,539 |
| | | | 235,398,273 |
| Real Estate Management & Development - 0.0% | | | |
| CBRE Group, Inc. (a) | | 110,597 | 5,001,196 |
|
| TOTAL REAL ESTATE | | | 240,399,469 |
|
| UTILITIES - 3.1% | | | |
| Electric Utilities - 1.9% | | | |
| Alliant Energy Corp. | | 82,354 | 3,939,815 |
| American Electric Power Co., Inc. | | 163,460 | 13,017,954 |
| Duke Energy Corp. | | 242,348 | 19,361,182 |
| Edison International | | 124,683 | 6,771,534 |
| Entergy Corp. | | 66,058 | 6,196,901 |
| Evergy, Inc. | | 74,703 | 4,429,141 |
| Eversource Energy | | 110,980 | 9,241,305 |
| Exelon Corp. | | 321,441 | 11,665,094 |
| FirstEnergy Corp. | | 178,781 | 6,933,127 |
| NextEra Energy, Inc. | | 161,421 | 38,768,482 |
| NRG Energy, Inc. | | 80,526 | 2,621,927 |
| Pinnacle West Capital Corp. | | 36,907 | 2,704,914 |
| PPL Corp. | | 253,654 | 6,554,419 |
| Southern Co. | | 348,296 | 18,059,148 |
| Xcel Energy, Inc. | | 173,155 | 10,822,188 |
| | | | 161,087,131 |
| Gas Utilities - 0.1% | | | |
| Atmos Energy Corp. | | 40,337 | 4,016,758 |
| Independent Power and Renewable Electricity Producers - 0.0% | | | |
| The AES Corp. | | 218,011 | 3,158,979 |
| Multi-Utilities - 1.0% | | | |
| Ameren Corp. | | 81,430 | 5,729,415 |
| CenterPoint Energy, Inc. | | 179,880 | 3,358,360 |
| CMS Energy Corp. | | 94,405 | 5,515,140 |
| Consolidated Edison, Inc. | | 110,190 | 7,925,967 |
| Dominion Energy, Inc. | | 276,768 | 22,468,026 |
| DTE Energy Co. | | 63,546 | 6,831,195 |
| NiSource, Inc. | | 126,475 | 2,876,042 |
| Public Service Enterprise Group, Inc. | | 166,778 | 8,198,806 |
| Sempra Energy | | 96,486 | 11,311,054 |
| WEC Energy Group, Inc. | | 104,016 | 9,117,002 |
| | | | 83,331,007 |
| Water Utilities - 0.1% | | | |
| American Water Works Co., Inc. | | 59,704 | 7,681,517 |
|
| TOTAL UTILITIES | | | 259,275,392 |
|
| TOTAL COMMON STOCKS | | | |
| (Cost $3,590,708,573) | | | 8,455,188,978 |
|
| Money Market Funds - 2.0% | | | |
| Fidelity Cash Central Fund 0.12% (c) | | 141,718,101 | 141,746,445 |
| Fidelity Securities Lending Cash Central Fund 0.12% (c)(d) | | 30,975,791 | 30,978,889 |
| TOTAL MONEY MARKET FUNDS | | | |
| (Cost $172,722,656) | | | 172,725,334 |
| TOTAL INVESTMENT IN SECURITIES - 101.2% | | | |
| (Cost $3,763,431,229) | | | 8,627,914,312 |
| NET OTHER ASSETS (LIABILITIES) - (1.2)% | | | (101,331,712) |
| NET ASSETS - 100% | | | $8,526,582,600 |
| Futures Contracts | | | | | |
| | Number of contracts | Expiration Date | Notional Amount | Value | Unrealized Appreciation/(Depreciation) |
| Purchased | | | | | |
| Equity Index Contracts | | | | | |
| CME E-mini S&P 500 Index Contracts (United States) | 509 | Sept. 2020 | $78,645,590 | $1,901,662 | $1,901,662 |
The notional amount of futures purchased as a percentage of Net Assets is 0.9%
Legend
(a) Non-income producing
(b) Security or a portion of the security is on loan at period end.
(c) Affiliated fund that is generally available only to investment companies and other accounts managed by Fidelity Investments. The rate quoted is the annualized seven-day yield of the fund at period end. A complete unaudited listing of the fund's holdings as of its most recent quarter end is available upon request. In addition, each Fidelity Central Fund's financial statements are available on the SEC's website or upon request.
(d) Investment made with cash collateral received from securities on loan.
Affiliated Central Funds
Information regarding fiscal year to date income earned by the Fund from investments in Fidelity Central Funds is as follows:
| Fund | Income earned |
| Fidelity Cash Central Fund | $136,616 |
| Fidelity Securities Lending Cash Central Fund | 180,405 |
| Total | $317,021 |
Amounts in the income column in the above table include any capital gain distributions from underlying funds, which are presented in the corresponding line-item in the Statement of Operations, if applicable. Amount for Fidelity Securities Lending Cash Central Fund represents the income earned on investing cash collateral, less rebates paid to borrowers and any lending agent fees associated with the loan, plus any premium payments received for lending certain types of securities.
Investment Valuation
The following is a summary of the inputs used, as of June 30, 2020, involving the Fund's assets and liabilities carried at fair value. The inputs or methodology used for valuing securities may not be an indication of the risk associated with investing in those securities. For more information on valuation inputs, and their aggregation into the levels used below, please refer to the Investment Valuation section in the accompanying Notes to Financial Statements.
| | Valuation Inputs at Reporting Date: |
| Description | Total | Level 1 | Level 2 | Level 3 |
| Investments in Securities: | | | | |
| Equities: | | | | |
| Communication Services | $911,818,800 | $911,818,800 | $-- | $-- |
| Consumer Discretionary | 915,426,110 | 915,426,110 | -- | -- |
| Consumer Staples | 589,035,934 | 589,035,934 | -- | -- |
| Energy | 238,893,766 | 238,893,766 | -- | -- |
| Financials | 852,438,355 | 852,438,355 | -- | -- |
| Health Care | 1,236,791,070 | 1,236,791,070 | -- | -- |
| Industrials | 675,510,734 | 675,510,734 | -- | -- |
| Information Technology | 2,322,212,046 | 2,322,212,046 | -- | -- |
| Materials | 213,387,302 | 213,387,302 | -- | -- |
| Real Estate | 240,399,469 | 240,399,469 | -- | -- |
| Utilities | 259,275,392 | 259,275,392 | -- | -- |
| Money Market Funds | 172,725,334 | 172,725,334 | -- | -- |
| Total Investments in Securities: | $8,627,914,312 | $8,627,914,312 | $-- | $-- |
| Derivative Instruments: | | | | |
| Assets | | | | |
| Futures Contracts | $1,901,662 | $1,901,662 | $-- | $-- |
| Total Assets | $1,901,662 | $1,901,662 | $-- | $-- |
| Total Derivative Instruments: | $1,901,662 | $1,901,662 | $-- | $-- |
Value of Derivative Instruments
The following table is a summary of the Fund's value of derivative instruments by primary risk exposure as of June 30, 2020. For additional information on derivative instruments, please refer to the Derivative Instruments section in the accompanying Notes to Financial Statements.
| Primary Risk Exposure / Derivative Type | Value |
| | Asset | Liability |
| Equity Risk | | |
| Futures Contracts(a) | $1,901,662 | $0 |
| Total Equity Risk | 1,901,662 | 0 |
| Total Value of Derivatives | $1,901,662 | $0 |
(a) Reflects gross cumulative appreciation (depreciation) on futures contracts as presented in the Schedule of Investments. In the Statement of Assets and Liabilities, the period end daily variation margin is included in receivable or payable for daily variation margin on futures contracts, and the net cumulative appreciation (depreciation) is included in Total accumulated earnings (loss).
See accompanying notes which are an integral part of the financial statements.
Financial Statements
Statement of Assets and Liabilities
| | | June 30, 2020 (Unaudited) |
| Assets | | |
Investment in securities, at value (including securities loaned of $30,316,454) — See accompanying schedule:
Unaffiliated issuers (cost $3,590,708,573) | $8,455,188,978 | |
| Fidelity Central Funds (cost $172,722,656) | 172,725,334 | |
| Total Investment in Securities (cost $3,763,431,229) | | $8,627,914,312 |
| Segregated cash with brokers for derivative instruments | | 6,216,000 |
| Receivable for fund shares sold | | 2,084,912 |
| Dividends receivable | | 6,532,855 |
| Distributions receivable from Fidelity Central Funds | | 84,435 |
| Receivable for daily variation margin on futures contracts | | 1,083,669 |
| Other receivables | | 26,192 |
| Total assets | | 8,643,942,375 |
| Liabilities | | |
| Payable for investments purchased | $76,333,081 | |
| Payable for fund shares redeemed | 9,016,286 | |
| Accrued management fee | 315,647 | |
| Distribution and service plan fees payable | 324,871 | |
| Other affiliated payables | 385,791 | |
| Other payables and accrued expenses | 26,151 | |
| Collateral on securities loaned | 30,957,948 | |
| Total liabilities | | 117,359,775 |
| Net Assets | | $8,526,582,600 |
| Net Assets consist of: | | |
| Paid in capital | | $3,598,989,859 |
| Total accumulated earnings (loss) | | 4,927,592,741 |
| Net Assets | | $8,526,582,600 |
| Net Asset Value and Maximum Offering Price | | |
| Initial Class: | | |
| Net Asset Value, offering price and redemption price per share ($6,763,735,956 ÷ 21,941,096 shares) | | $308.27 |
| Service Class: | | |
| Net Asset Value, offering price and redemption price per share ($114,255,037 ÷ 372,174 shares) | | $306.99 |
| Service Class 2: | | |
| Net Asset Value, offering price and redemption price per share ($1,648,591,607 ÷ 5,420,287 shares) | | $304.15 |
See accompanying notes which are an integral part of the financial statements.
Statement of Operations
| | | Six months ended June 30, 2020 (Unaudited) |
| Investment Income | | |
| Dividends | | $81,580,913 |
| Interest | | 8,337 |
| Income from Fidelity Central Funds (including $180,405 from security lending) | | 317,021 |
| Total income | | 81,906,271 |
| Expenses | | |
| Management fee | $1,849,647 | |
| Transfer agent fees | 2,260,680 | |
| Distribution and service plan fees | 1,907,616 | |
| Independent trustees' fees and expenses | 26,257 | |
| Legal | 51 | |
| Interest | 15,576 | |
| Commitment fees | 10,852 | |
| Total expenses before reductions | 6,070,679 | |
| Expense reductions | (1,819) | |
| Total expenses after reductions | | 6,068,860 |
| Net investment income (loss) | | 75,837,411 |
| Realized and Unrealized Gain (Loss) | | |
| Net realized gain (loss) on: | | |
| Investment securities: | | |
| Unaffiliated issuers | 17,709,120 | |
| Fidelity Central Funds | 7,429 | |
| Futures contracts | (10,792,431) | |
| Total net realized gain (loss) | | 6,924,118 |
| Change in net unrealized appreciation (depreciation) on: | | |
| Investment securities: | | |
| Unaffiliated issuers | (472,722,727) | |
| Fidelity Central Funds | (1,979) | |
| Futures contracts | 1,019,362 | |
| Total change in net unrealized appreciation (depreciation) | | (471,705,344) |
| Net gain (loss) | | (464,781,226) |
| Net increase (decrease) in net assets resulting from operations | | $(388,943,815) |
See accompanying notes which are an integral part of the financial statements.
Statement of Changes in Net Assets
| | Six months ended June 30, 2020 (Unaudited) | Year ended December 31, 2019 |
| Increase (Decrease) in Net Assets | | |
| Operations | | |
| Net investment income (loss) | $75,837,411 | $154,794,469 |
| Net realized gain (loss) | 6,924,118 | 46,079,613 |
| Change in net unrealized appreciation (depreciation) | (471,705,344) | 1,991,220,335 |
| Net increase (decrease) in net assets resulting from operations | (388,943,815) | 2,192,094,417 |
| Distributions to shareholders | (59,332,047) | (278,671,068) |
| Share transactions - net increase (decrease) | (300,660,408) | 536,384,329 |
| Total increase (decrease) in net assets | (748,936,270) | 2,449,807,678 |
| Net Assets | | |
| Beginning of period | 9,275,518,870 | 6,825,711,192 |
| End of period | $8,526,582,600 | $9,275,518,870 |
See accompanying notes which are an integral part of the financial statements.
Financial Highlights
VIP Index 500 Portfolio Initial Class
| | Six months ended (Unaudited) June 30, | Years endedDecember 31, | | | | |
| | 2020 | 2019 | 2018 | 2017 | 2016 | 2015 |
| Selected Per–Share Data | | | | | | |
| Net asset value, beginning of period | $320.35 | $252.46 | $271.18 | $227.46 | $206.43 | $208.12 |
| Income from Investment Operations | | | | | | |
| Net investment income (loss)A | 2.82 | 5.54 | 5.09 | 4.71 | 4.42 | 4.15 |
| Net realized and unrealized gain (loss) | (12.81) | 72.46 | (17.22) | 44.36 | 20.06 | (1.44) |
| Total from investment operations | (9.99) | 78.00 | (12.13) | 49.07 | 24.48 | 2.71 |
| Distributions from net investment income | (1.06) | (5.82) | (5.28)B | (4.57) | (3.23) | (4.26) |
| Distributions from net realized gain | (1.02) | (4.29) | (1.31)B | (.78) | (.22) | (.13) |
| Total distributions | (2.09)C | (10.11) | (6.59) | (5.35) | (3.45) | (4.40)D |
| Net asset value, end of period | $308.27 | $320.35 | $252.46 | $271.18 | $227.46 | $206.43 |
| Total ReturnE,F,G | (3.16)% | 31.35% | (4.49)% | 21.71% | 11.86% | 1.33% |
| Ratios to Average Net AssetsH,I | | | | | | |
| Expenses before reductions | .10%J | .10% | .10% | .10% | .10% | .10% |
| Expenses net of fee waivers, if any | .10%J | .10% | .10% | .10% | .10% | .10% |
| Expenses net of all reductions | .10%J | .10% | .10% | .10% | .10% | .10% |
| Net investment income (loss) | 1.90%J | 1.90% | 1.82% | 1.89% | 2.07% | 1.98% |
| Supplemental Data | | | | | | |
| Net assets, end of period (000 omitted) | $6,763,736 | $7,294,879 | $5,719,086 | $6,139,813 | $5,001,375 | $4,103,865 |
| Portfolio turnover rateK | 12%J | 7% | 5% | 5% | 6% | 9% |
A Calculated based on average shares outstanding during the period.
B The amounts shown reflect certain reclassifications related to book to tax differences that were made in the year shown.
C Total distributions of $2.09 per share is comprised of distributions from net investment income of $1.064 and distributions from net realized gain of $1.021 per share.
D Total distributions of $4.40 per share is comprised of distributions from net investment income of $4.262 and distributions from net realized gain of $.133 per share.
E Total returns for periods of less than one year are not annualized.
F Total returns do not reflect charges attributable to your insurance company's separate account. Inclusion of these charges would reduce the total returns shown.
G Total returns would have been lower if certain expenses had not been reduced during the applicable periods shown.
H Fees and expenses of any underlying Fidelity Central Funds are not included in the Fund's expense ratio. The Fund indirectly bears its proportionate share of the expenses of any underlying Fidelity Central Funds.
I Expense ratios reflect operating expenses of the class. Expenses before reductions do not reflect amounts reimbursed by the investment adviser or reductions from expense offset arrangements and do not represent the amount paid by the class during periods when reimbursements or reductions occur. Expenses net of fee waivers reflect expenses after reimbursement by the investment adviser but prior to reductions from expense offset arrangements. Expenses net of all reductions represent the net expenses paid by the class.
J Annualized
K Amount does not include the portfolio activity of any underlying Fidelity Central Funds.
See accompanying notes which are an integral part of the financial statements.
VIP Index 500 Portfolio Service Class
| | Six months ended (Unaudited) June 30, | Years endedDecember 31, | | | | |
| | 2020 | 2019 | 2018 | 2017 | 2016 | 2015 |
| Selected Per–Share Data | | | | | | |
| Net asset value, beginning of period | $319.14 | $251.57 | $270.23 | $226.70 | $205.82 | $207.49 |
| Income from Investment Operations | | | | | | |
| Net investment income (loss)A | 2.65 | 5.23 | 4.79 | 4.44 | 4.19 | 3.93 |
| Net realized and unrealized gain (loss) | (12.76) | 72.18 | (17.13) | 44.21 | 19.97 | (1.43) |
| Total from investment operations | (10.11) | 77.41 | (12.34) | 48.65 | 24.16 | 2.50 |
| Distributions from net investment income | (1.01) | (5.55) | (5.01)B | (4.34) | (3.07) | (4.03) |
| Distributions from net realized gain | (1.02) | (4.29) | (1.31)B | (.78) | (.22) | (.13) |
| Total distributions | (2.04)C | (9.84) | (6.32) | (5.12) | (3.28)D | (4.17)E |
| Net asset value, end of period | $306.99 | $319.14 | $251.57 | $270.23 | $226.70 | $205.82 |
| Total ReturnF,G,H | (3.21)% | 31.22% | (4.59)% | 21.59% | 11.75% | 1.24% |
| Ratios to Average Net AssetsI,J | | | | | | |
| Expenses before reductions | .20%K | .20% | .20% | .20% | .20% | .20% |
| Expenses net of fee waivers, if any | .20%K | .20% | .20% | .20% | .20% | .20% |
| Expenses net of all reductions | .20%K | .20% | .20% | .20% | .20% | .20% |
| Net investment income (loss) | 1.80%K | 1.80% | 1.72% | 1.79% | 1.97% | 1.88% |
| Supplemental Data | | | | | | |
| Net assets, end of period (000 omitted) | $114,255 | $117,666 | $89,704 | $92,965 | $77,697 | $64,618 |
| Portfolio turnover rateL | 12%K | 7% | 5% | 5% | 6% | 9% |
A Calculated based on average shares outstanding during the period.
B The amounts shown reflect certain reclassifications related to book to tax differences that were made in the year shown.
C Total distributions of $2.04 per share is comprised of distributions from net investment income of $1.014 and distributions from net realized gain of $1.021 per share.
D Total distributions of $3.28 per share is comprised of distributions from net investment income of $3.068 and distributions from net realized gain of $.216 per share.
E Total distributions of $4.17 per share is comprised of distributions from net investment income of $4.033 and distributions from net realized gain of $.133 per share.
F Total returns for periods of less than one year are not annualized.
G Total returns do not reflect charges attributable to your insurance company's separate account. Inclusion of these charges would reduce the total returns shown.
H Total returns would have been lower if certain expenses had not been reduced during the applicable periods shown.
I Fees and expenses of any underlying Fidelity Central Funds are not included in the Fund's expense ratio. The Fund indirectly bears its proportionate share of the expenses of any underlying Fidelity Central Funds.
J Expense ratios reflect operating expenses of the class. Expenses before reductions do not reflect amounts reimbursed by the investment adviser or reductions from expense offset arrangements and do not represent the amount paid by the class during periods when reimbursements or reductions occur. Expenses net of fee waivers reflect expenses after reimbursement by the investment adviser but prior to reductions from expense offset arrangements. Expenses net of all reductions represent the net expenses paid by the class.
K Annualized
L Amount does not include the portfolio activity of any underlying Fidelity Central Funds.
See accompanying notes which are an integral part of the financial statements.
VIP Index 500 Portfolio Service Class 2
| | Six months ended (Unaudited) June 30, | Years endedDecember 31, | | | | |
| | 2020 | 2019 | 2018 | 2017 | 2016 | 2015 |
| Selected Per–Share Data | | | | | | |
| Net asset value, beginning of period | $316.37 | $249.51 | $267.78 | $224.72 | $204.25 | $206.02 |
| Income from Investment Operations | | | | | | |
| Net investment income (loss)A | 2.43 | 4.77 | 4.34 | 4.04 | 3.88 | 3.59 |
| Net realized and unrealized gain (loss) | (12.69) | 71.54 | (16.96) | 43.79 | 19.76 | (1.42) |
| Total from investment operations | (10.26) | 76.31 | (12.62) | 47.83 | 23.64 | 2.17 |
| Distributions from net investment income | (.94) | (5.16) | (4.34)B | (3.99) | (2.95) | (3.80) |
| Distributions from net realized gain | (1.02) | (4.29) | (1.31)B | (.78) | (.22) | (.13) |
| Total distributions | (1.96) | (9.45) | (5.65) | (4.77) | (3.17) | (3.94)C |
| Net asset value, end of period | $304.15 | $316.37 | $249.51 | $267.78 | $224.72 | $204.25 |
| Total ReturnD,E,F | (3.28)% | 31.02% | (4.73)% | 21.41% | 11.58% | 1.08% |
| Ratios to Average Net AssetsG,H | | | | | | |
| Expenses before reductions | .35%I | .35% | .35% | .35% | .35% | .35% |
| Expenses net of fee waivers, if any | .35%I | .35% | .35% | .35% | .35% | .35% |
| Expenses net of all reductions | .35%I | .35% | .35% | .35% | .35% | .35% |
| Net investment income (loss) | 1.65%I | 1.65% | 1.57% | 1.64% | 1.82% | 1.73% |
| Supplemental Data | | | | | | |
| Net assets, end of period (000 omitted) | $1,648,592 | $1,862,974 | $1,016,922 | $1,502,688 | $1,215,228 | $575,158 |
| Portfolio turnover rateJ | 12%I | 7% | 5% | 5% | 6% | 9% |
A Calculated based on average shares outstanding during the period.
B The amounts shown reflect certain reclassifications related to book to tax differences that were made in the year shown.
C Total distributions of $3.94 per share is comprised of distributions from net investment income of $3.804 and distributions from net realized gain of $.133 per share.
D Total returns for periods of less than one year are not annualized.
E Total returns do not reflect charges attributable to your insurance company's separate account. Inclusion of these charges would reduce the total returns shown.
F Total returns would have been lower if certain expenses had not been reduced during the applicable periods shown.
G Fees and expenses of any underlying Fidelity Central Funds are not included in the Fund's expense ratio. The Fund indirectly bears its proportionate share of the expenses of any underlying Fidelity Central Funds.
H Expense ratios reflect operating expenses of the class. Expenses before reductions do not reflect amounts reimbursed by the investment adviser or reductions from expense offset arrangements and do not represent the amount paid by the class during periods when reimbursements or reductions occur. Expenses net of fee waivers reflect expenses after reimbursement by the investment adviser but prior to reductions from expense offset arrangements. Expenses net of all reductions represent the net expenses paid by the class.
I Annualized
J Amount does not include the portfolio activity of any underlying Fidelity Central Funds.
See accompanying notes which are an integral part of the financial statements.
Notes to Financial Statements (Unaudited)
For the period ended June 30, 2020
1. Organization.
VIP Index 500 Portfolio (the Fund) is a fund of Variable Insurance Products Fund II (the Trust) and is authorized to issue an unlimited number of shares. The Trust is registered under the Investment Company Act of 1940, as amended (the 1940 Act), as an open-end management investment company organized as a Massachusetts business trust. Shares of the Fund may only be purchased by insurance companies for the purpose of funding variable annuity or variable life insurance contracts. The Fund offers the following classes of shares: Initial Class shares, Service Class shares and Service Class 2 shares. All classes have equal rights and voting privileges, except for matters affecting a single class.
Effective January 1, 2020:
Investment advisers Fidelity Investments Money Management, Inc., FMR Co., Inc., and Fidelity SelectCo, LLC, merged with and into Fidelity Management & Research Company. In connection with the merger transactions, the resulting, merged investment adviser was then redomiciled from Massachusetts to Delaware, changed its corporate structure from a corporation to a limited liability company, and changed its name to "Fidelity Management & Research Company LLC".
Broker-dealer Fidelity Distributors Corporation merged with and into Fidelity Investments Institutional Services Company, Inc. ("FIISC"). FIISC was then redomiciled from Massachusetts to Delaware, changed its corporate structure from a corporation to a limited liability company, and changed its name to "Fidelity Distributors Company LLC".
Fidelity Investments Institutional Operations Company, Inc. converted from a Massachusetts corporation to a Massachusetts LLC, and changed its name to "Fidelity Investments Institutional Operations Company LLC".
2. Investments in Fidelity Central Funds.
The Fund invests in Fidelity Central Funds, which are open-end investment companies generally available only to other investment companies and accounts managed by the investment adviser and its affiliates. The Fund's Schedule of Investments lists each of the Fidelity Central Funds held as of period end, if any, as an investment of the Fund, but does not include the underlying holdings of each Fidelity Central Fund. As an Investing Fund, the Fund indirectly bears its proportionate share of the expenses of the underlying Fidelity Central Funds.
The Money Market Central Funds seek preservation of capital and current income and are managed by the investment adviser. Annualized expenses of the Money Market Central Funds as of their most recent shareholder report date ranged from less than .005% to .01%.
A complete unaudited list of holdings for each Fidelity Central Fund is available upon request or at the Securities and Exchange Commission (the SEC) website at www.sec.gov. In addition, the financial statements of the Fidelity Central Funds are available on the SEC website or upon request.
3. Significant Accounting Policies.
The Fund is an investment company and applies the accounting and reporting guidance of the Financial Accounting Standards Board (FASB) Accounting Standards Codification Topic 946 Financial Services – Investments Companies. The financial statements have been prepared in conformity with accounting principles generally accepted in the United States of America (GAAP), which require management to make certain estimates and assumptions at the date of the financial statements. Actual results could differ from those estimates. Subsequent events, if any, through the date that the financial statements were issued have been evaluated in the preparation of the financial statements. The following summarizes the significant accounting policies of the Fund:
Investment Valuation. Investments are valued as of 4:00 p.m. Eastern time on the last calendar day of the period. The Board of Trustees (the Board) has delegated the day to day responsibility for the valuation of the Fund's investments to the Fair Value Committee (the Committee) established by the Fund's investment adviser. In accordance with valuation policies and procedures approved by the Board, the Fund attempts to obtain prices from one or more third party pricing vendors or brokers to value its investments. When current market prices, quotations or currency exchange rates are not readily available or reliable, investments will be fair valued in good faith by the Committee, in accordance with procedures adopted by the Board. Factors used in determining fair value vary by investment type and may include market or investment specific events. The frequency with which these procedures are used cannot be predicted and they may be utilized to a significant extent. The Committee oversees the Fund's valuation policies and procedures and reports to the Board on the Committee's activities and fair value determinations. The Board monitors the appropriateness of the procedures used in valuing the Fund's investments and ratifies the fair value determinations of the Committee.
The Fund categorizes the inputs to valuation techniques used to value its investments into a disclosure hierarchy consisting of three levels as shown below:
- Level 1 – quoted prices in active markets for identical investments
- Level 2 – other significant observable inputs (including quoted prices for similar investments, interest rates, prepayment speeds, etc.)
- Level 3 – unobservable inputs (including the Fund's own assumptions based on the best information available)
Valuation techniques used to value the Fund's investments by major category are as follows:
Equity securities, including restricted securities, for which market quotations are readily available, are valued at the last reported sale price or official closing price as reported by a third party pricing vendor on the primary market or exchange on which they are traded and are categorized as Level 1 in the hierarchy. In the event there were no sales during the day or closing prices are not available, securities are valued at the last quoted bid price or may be valued using the last available price and are generally categorized as Level 2 in the hierarchy. For foreign equity securities, when market or security specific events arise, comparisons to the valuation of American Depositary Receipts (ADRs), futures contracts, Exchange-Traded Funds (ETFs) and certain indexes as well as quoted prices for similar securities may be used and would be categorized as Level 2 in the hierarchy. For equity securities, including restricted securities, where observable inputs are limited, assumptions about market activity and risk are used and these securities may be categorized as Level 3 in the hierarchy.
Futures contracts are valued at the settlement price established each day by the board of trade or exchange on which they are traded and are categorized as Level 1 in the hierarchy. Investments in open-end mutual funds, including the Fidelity Central Funds, are valued at their closing net asset value (NAV) each business day and are categorized as Level 1 in the hierarchy.
Changes in valuation techniques may result in transfers in or out of an assigned level within the disclosure hierarchy. The aggregate value of investments by input level as of June 30, 2020 is included at the end of the Fund's Schedule of Investments.
Investment Transactions and Income. For financial reporting purposes, the Fund's investment holdings and NAV include trades executed through the end of the last business day of the period. The NAV per share for processing shareholder transactions is calculated as of the close of business of the New York Stock Exchange (NYSE), normally 4:00 p.m. Eastern time and includes trades executed through the end of the prior business day. Gains and losses on securities sold are determined on the basis of identified cost and include proceeds received from litigation. Dividend income is recorded on the ex-dividend date, except for certain dividends from foreign securities where the ex-dividend date may have passed, which are recorded as soon as the Fund is informed of the ex-dividend date. Non-cash dividends included in dividend income, if any, are recorded at the fair market value of the securities received. Income and capital gain distributions from Fidelity Central Funds, if any, are recorded on the ex-dividend date. Certain distributions received by the Fund represent a return of capital or capital gain. The Fund determines the components of these distributions subsequent to the ex-dividend date, based upon receipt of tax filings or other correspondence relating to the underlying investment. These distributions are recorded as a reduction of cost of investments and/or as a realized gain. Interest income is accrued as earned and includes coupon interest and amortization of premium and accretion of discount on debt securities as applicable.
Class Allocations and Expenses. Investment income, realized and unrealized capital gains and losses, common expenses of the Fund, and certain fund-level expense reductions, if any, are allocated daily on a pro-rata basis to each class based on the relative net assets of each class to the total net assets of the Fund. Each class differs with respect to transfer agent and distribution and service plan fees incurred. Certain expense reductions may also differ by class. For the reporting period, the allocated portion of income and expenses to each class as a percent of its average net assets may vary due to the timing of recording these transactions in relation to fluctuating net assets of the classes. Expenses directly attributable to a fund are charged to that fund. Expenses attributable to more than one fund are allocated among the respective funds on the basis of relative net assets or other appropriate methods. Expense estimates are accrued in the period to which they relate and adjustments are made when actual amounts are known.
Deferred Trustee Compensation. Under a Deferred Compensation Plan (the Plan), certain independent Trustees have elected to defer receipt of a portion of their annual compensation. Deferred amounts are invested in a cross-section of Fidelity funds, are marked-to-market and remain in the Fund until distributed in accordance with the Plan. The investment of deferred amounts and the offsetting payable to the Trustees of $26,154 are included in the accompanying Statement of Assets and Liabilities in other receivables and other payables and accrued expenses, respectively.
Income Tax Information and Distributions to Shareholders. Each year, the Fund intends to qualify as a regulated investment company under Subchapter M of the Internal Revenue Code, including distributing substantially all of its taxable income and realized gains. As a result, no provision for U.S. Federal income taxes is required. The Fund files a U.S. federal tax return, in addition to state and local tax returns as required. The Fund's federal income tax returns are subject to examination by the Internal Revenue Service (IRS) for a period of three fiscal years after they are filed. State and local tax returns may be subject to examination for an additional fiscal year depending on the jurisdiction.
Distributions are declared and recorded on the ex-dividend date. Income and capital gain distributions are declared separately for each class. Income and capital gain distributions are determined in accordance with income tax regulations, which may differ from GAAP.
Capital accounts within the financial statements are adjusted for permanent book-tax differences. These adjustments have no impact on net assets or the results of operations. Capital accounts are not adjusted for temporary book-tax differences which will reverse in a subsequent period.
Book-tax differences are primarily due to futures contracts, market discount, deferred trustees compensation, certain deemed dividends and losses deferred due to wash sales.
As of period end, the cost and unrealized appreciation (depreciation) in securities, and derivatives if applicable, for federal income tax purposes on an unconsolidated basis were as follows:
| Gross unrealized appreciation | $5,150,549,958 |
| Gross unrealized depreciation | (303,905,077) |
| Net unrealized appreciation (depreciation) | $4,846,644,881 |
| Tax cost | $3,783,171,093 |
4. Derivative Instruments.
Risk Exposures and the Use of Derivative Instruments. The Fund's investment objective allows the Fund to enter into various types of derivative contracts, including futures contracts. Derivatives are investments whose value is primarily derived from underlying assets, indices or reference rates and may be transacted on an exchange or over-the-counter (OTC). Derivatives may involve a future commitment to buy or sell a specified asset based on specified terms, to exchange future cash flows at periodic intervals based on a notional principal amount, or for one party to make one or more payments upon the occurrence of specified events in exchange for periodic payments from the other party.
The Fund used derivatives to increase returns and to manage exposure to certain risks as defined below. The success of any strategy involving derivatives depends on analysis of numerous economic factors, and if the strategies for investment do not work as intended, the Fund may not achieve its objectives.
The Fund's use of derivatives increased or decreased its exposure to the following risk:
| Equity Risk | Equity risk relates to the fluctuations in the value of financial instruments as a result of changes in market prices (other than those arising from interest rate risk or foreign exchange risk), whether caused by factors specific to an individual investment, its issuer, or all factors affecting all instruments traded in a market or market segment.
|
The Fund is also exposed to additional risks from investing in derivatives, such as liquidity risk and counterparty credit risk. Liquidity risk is the risk that the Fund will be unable to close out the derivative in the open market in a timely manner. Counterparty credit risk is the risk that the counterparty will not be able to fulfill its obligation to the Fund. Counterparty credit risk related to exchange-traded futures contracts may be mitigated by the protection provided by the exchange on which they trade.
Investing in derivatives may involve greater risks than investing in the underlying assets directly and, to varying degrees, may involve risk of loss in excess of any initial investment and collateral received and amounts recognized in the Statement of Assets and Liabilities. In addition, there may be the risk that the change in value of the derivative contract does not correspond to the change in value of the underlying instrument.
Futures Contracts. A futures contract is an agreement between two parties to buy or sell a specified underlying instrument for a fixed price at a specified future date. The Fund used futures contracts to manage its exposure to the stock market.
Upon entering into a futures contract, a fund is required to deposit either cash or securities (initial margin) with a clearing broker in an amount equal to a certain percentage of the face value of the contract. Futures contracts are marked-to-market daily and subsequent daily payments (variation margin) are made or received by a fund depending on the daily fluctuations in the value of the futures contracts and are recorded as unrealized appreciation or (depreciation). This receivable and/or payable, if any, is included in daily variation margin on futures contracts in the Statement of Assets and Liabilities. Realized gain or (loss) is recorded upon the expiration or closing of a futures contract. The net realized gain (loss) and change in net unrealized appreciation (depreciation) on futures contracts during the period is presented in the Statement of Operations.
Any open futures contracts at period end are presented in the Schedule of Investments under the caption "Futures Contracts". The notional amount at value reflects each contract's exposure to the underlying instrument or index at period end and is representative of volume of activity during the period. Cash deposited to meet initial margin requirements is presented as segregated cash with brokers for derivative instruments in the Statement of Assets and Liabilities.
5. Purchases and Sales of Investments.
Purchases and sales of securities, other than short-term securities are noted in the table below.
| | Purchases ($) | Sales ($) |
| VIP Index 500 Portfolio | 496,404,426 | 799,996,727 |
6. Fees and Other Transactions with Affiliates.
Management Fee and Expense Contract. Fidelity Management & Research Company LLC (the investment adviser) and its affiliates provide the Fund with investment management related services for which the Fund pays a monthly management fee. The management fee is based on an annual rate of .045% of the Fund's average net assets. Under the management contract, the investment adviser pays all other fund-level expenses, except the compensation of the independent Trustees and certain other expenses such as interest expense, including commitment fees. In addition, under an expense contract, the investment adviser pays class-level expenses as necessary so that total expenses do not exceed an annual rate of .10% of each class' average net assets, excluding the distribution and service fee for each applicable class, with certain exceptions.
Sub-Adviser. Geode Capital Management, LLC (Geode), serves as sub-adviser for the Fund. Geode provides discretionary investment advisory services to the Fund and is paid by the investment adviser for providing these services.
Distribution and Service Plan Fees. In accordance with Rule 12b-1 of the 1940 Act, the Fund has adopted separate 12b-1 Plans for each Service Class of shares. Each Service Class pays Fidelity Distributors Company LLC (FDC), an affiliate of the investment adviser, a service fee. For the period, the service fee is based on an annual rate of .10% of Service Class' average net assets and .25% of Service Class 2's average net assets.
For the period, total fees, all of which were re-allowed to insurance companies for the distribution of shares and providing shareholder support services, were as follows:
| Service Class | $54,794 |
| Service Class 2 | 1,852,822 |
| | $1,907,616 |
Transfer Agent Fees. Fidelity Investments Institutional Operations Company LLC (FIIOC), an affiliate of the investment adviser, is the transfer, dividend disbursing, and shareholder servicing agent for each class. FIIOC receives asset-based fees based on each class's average net assets for transfer agent services, typesetting, and printing and mailing of shareholder reports, excluding mailing of proxy statements. Effective February 1, 2020, the Board approved to change the fee from .065% to .064%. Under the expense contract, each class pays a portion of the transfer agent fees equal to an annual rate of .055% of class-level average net assets. For the period, transfer agent fees for each class were as follows:
| Initial Class | $1,822,922 |
| Service Class | 30,137 |
| Service Class 2 | 407,621 |
| | $2,260,680 |
Interfund Lending Program. Pursuant to an Exemptive Order issued by the SEC, the fund, along with other registered investment companies having management contracts with Fidelity Management & Research Company LLC (FMR), or other affiliated entities of FMR, may participate in an interfund lending program. This program provides an alternative credit facility allowing the fund to borrow from, or lend money to, other participating affiliated funds. At period end, there were no interfund loans outstanding. Activity in this program during the period for which loans were outstanding was as follows:
| | Borrower or Lender | Average Loan Balance | Weighted Average Interest Rate | Interest Expense |
| VIP Index 500 Portfolio | Borrower | $23,309,125 | 1.05% | $15,576 |
Interfund Trades. Funds may purchase from or sell securities to other Fidelity Funds under procedures adopted by the Board. The procedures have been designed to ensure these interfund trades are executed in accordance with Rule 17a-7 of the 1940 Act. Interfund trades are included within the respective purchases and sales amounts shown in the Purchases and Sales of Investments note.
7. Committed Line of Credit.
Certain Funds participate with other funds managed by the investment adviser or an affiliate in a $4.25 billion credit facility (the "line of credit") to be utilized for temporary or emergency purposes to fund shareholder redemptions or for other short-term liquidity purposes. The participating funds have agreed to pay commitment fees on their pro-rata portion of the line of credit, which are reflected in Commitment fees on the Statement of Operations, and are as follows:
| | Amount |
| VIP Index 500 Portfolio | $10,852 |
During the period, there were no borrowings on this line of credit.
8. Security Lending.
The Fund lends portfolio securities from time to time in order to earn additional income. For equity securities, lending agents are used, including National Financial Services (NFS), an affiliate of the Fund. Pursuant to a securities lending agreement, NFS will receive a fee, which is capped at 9.9% of daily lending revenue, for its services as lending agent. The Fund may lend securities to certain qualified borrowers, including NFS. On the settlement date of the loan, the Fund receives collateral (in the form of U.S. Treasury obligations, letters of credit and/or cash) against the loaned securities and maintains collateral in an amount not less than 100% of the market value of the loaned securities during the period of the loan. The market value of the loaned securities is determined at the close of business of the Fund and any additional required collateral is delivered to the Fund on the next business day. The Fund or borrower may terminate the loan at any time, and if the borrower defaults on its obligation to return the securities loaned because of insolvency or other reasons, the Fund may apply collateral received from the borrower against the obligation. The Fund may experience delays and costs in recovering the securities loaned. Any cash collateral received is invested in the Fidelity Securities Lending Cash Central Fund. The value of loaned securities and cash collateral at period end are disclosed on the Fund's Statement of Assets and Liabilities. The value of securities loaned to NFS, as affiliated borrower, at period end was $55,828. Total fees paid by the Fund to NFS, as lending agent, amounted to $12,533. Security lending income represents the income earned on investing cash collateral, less rebates paid to borrowers and any lending agent fees associated with the loan, plus any premium payments received for lending certain types of securities. Security lending income is presented in the Statement of Operations as a component of income from Fidelity Central Funds, and includes $450 from securities loaned to NFS, as affiliated borrower.
9. Expense Reductions.
Through arrangements with the Fund's custodian, credits realized as a result of certain uninvested cash balances were used to reduce the Fund's expenses. During the period, custodian credits reduced the Fund's expenses by $1,819.
10. Distributions to Shareholders.
Distributions to shareholders of each class were as follows:
| | Six months ended
June 30, 2020 | Year ended
December 31, 2019 |
| Distributions to shareholders | | |
| Initial Class | $47,008,753 | $228,445,268 |
| Service Class | 750,409 | 3,546,518 |
| Service Class 2 | 11,572,885 | 46,679,282 |
| Total | $59,332,047 | $278,671,068 |
11. Share Transactions.
Transactions for each class of shares were as follows:
| | Shares | Shares | Dollars | Dollars |
| | Six months ended June 30, 2020 | Year ended December 31, 2019 | Six months ended June 30, 2020 | Year ended December 31, 2019 |
| Initial Class | | | | |
| Shares sold | 1,999,915 | 2,647,754 | $569,855,605 | $769,737,549 |
| Reinvestment of distributions | 143,154 | 787,197 | 47,008,753 | 228,445,268 |
| Shares redeemed | (2,973,720) | (3,316,362) | (867,497,547) | (972,881,354) |
| Net increase (decrease) | (830,651) | 118,589 | $(250,633,189) | $25,301,463 |
| Service Class | | | | |
| Shares sold | 18,478 | 37,954 | $5,330,874 | $10,974,722 |
| Reinvestment of distributions | 2,294 | 12,269 | 750,409 | 3,546,518 |
| Shares redeemed | (17,291) | (38,107) | (4,919,381) | (11,067,349) |
| Net increase (decrease) | 3,481 | 12,116 | $1,161,902 | $3,453,891 |
| Service Class 2 | | | | |
| Shares sold | 1,603,981 | 2,440,351 | $482,733,897 | $676,913,168 |
| Reinvestment of distributions | 35,684 | 161,025 | 11,572,885 | 46,679,282 |
| Shares redeemed | (2,107,948) | (788,463) | (545,495,903) | (215,963,475) |
| Net increase (decrease) | (468,283) | 1,812,913 | $(51,189,121) | $507,628,975 |
12. Other.
The Fund's organizational documents provide former and current trustees and officers with a limited indemnification against liabilities arising in connection with the performance of their duties to the Fund. In the normal course of business, the Fund may also enter into contracts that provide general indemnifications. The Fund's maximum exposure under these arrangements is unknown as this would be dependent on future claims that may be made against the Fund. The risk of material loss from such claims is considered remote.
At the end of the period, the investment adviser or its affiliates were the owners of record of 39% of the total outstanding shares of the Fund.
13. Coronavirus (COVID-19) Pandemic.
An outbreak of COVID-19 first detected in China during December 2019 has since spread globally and was declared a pandemic by the World Health Organization during March 2020. Developments that disrupt global economies and financial markets, such as the COVID-19 pandemic, may magnify factors that affect the Fund's performance.
Shareholder Expense Example
As a shareholder of the Fund, you incur two types of costs: (1) transaction costs and (2) ongoing costs, including management fees, distribution and/or service (12b-1) fees and other Fund expenses. This Example is intended to help you understand your ongoing costs (in dollars) of investing in the Fund and to compare these costs with the ongoing costs of investing in other mutual funds.
The Example is based on an investment of $1,000 invested at the beginning of the period and held for the entire period (January 1, 2020 to June 30, 2020).
Actual Expenses
The first line of the accompanying table for each class of the Fund provides information about actual account values and actual expenses. You may use the information in this line, together with the amount you invested, to estimate the expenses that you paid over the period. Simply divide your account value by $1,000.00 (for example, an $8,600 account value divided by $1,000.00 = 8.6), then multiply the result by the number in the first line for a class of the Fund under the heading entitled "Expenses Paid During Period" to estimate the expenses you paid on your account during this period. The estimate of expenses does not include any fees or other expenses of any variable annuity or variable life insurance product. If they were, the estimate of expenses you paid during the period would be higher, and your ending account value would be lower. In addition, the Fund, as a shareholder in the underlying Fidelity Central Funds, will indirectly bear its pro-rata share of the fees and expenses incurred by the underlying Fidelity Central Funds. These fees and expenses are not included in the Fund's annualized expense ratio used to calculate the expense estimate in the table below.
Hypothetical Example for Comparison Purposes
The second line of the accompanying table for each class of the Fund provides information about hypothetical account values and hypothetical expenses based on a Class' actual expense ratio and an assumed rate of return of 5% per year before expenses, which is not the Class' actual return. The hypothetical account values and expenses may not be used to estimate the actual ending account balance or expenses you paid for the period. You may use this information to compare the ongoing costs of investing in the Fund and other funds. To do so, compare this 5% hypothetical example with the 5% hypothetical examples that appear in the shareholder reports of the other funds. The estimate of expenses does not include any fees or other expenses of any variable annuity or variable life insurance product. If they were, the estimate of expenses you paid during the period would be higher, and your ending account value would be lower. In addition, the Fund, as a shareholder in the underlying Fidelity Central Funds, will indirectly bear its pro-rata share of the fees and expenses incurred by the underlying Fidelity Central Funds. These fees and expenses are not included in the Fund's annualized expense ratio used to calculate the expense estimate in the table below.
Please note that the expenses shown in the table are meant to highlight your ongoing costs only and do not reflect any transaction costs. Therefore, the second line of the table is useful in comparing ongoing costs only, and will not help you determine the relative total costs of owning different funds.
| | Annualized Expense Ratio-A | Beginning
Account Value
January 1, 2020 | Ending
Account Value
June 30, 2020 | Expenses Paid
During Period-B
January 1, 2020
to June 30, 2020 |
| Initial Class | .10% | | | |
| Actual | | $1,000.00 | $968.40 | $.49 |
| Hypothetical-C | | $1,000.00 | $1,024.37 | $.50 |
| Service Class | .20% | | | |
| Actual | | $1,000.00 | $967.90 | $.98 |
| Hypothetical-C | | $1,000.00 | $1,023.87 | $1.01 |
| Service Class 2 | .35% | | | |
| Actual | | $1,000.00 | $967.20 | $1.71 |
| Hypothetical-C | | $1,000.00 | $1,023.12 | $1.76 |
A Annualized expense ratio reflects expenses net of applicable fee waivers.
B Expenses are equal to each Class' annualized expense ratio, multiplied by the average account value over the period, multiplied by 182/366 (to reflect the one-half year period).
C 5% return per year before expenses
Board Approval of Investment Advisory Contracts and Management Fees
VIP Index 500 Portfolio
Each year, the Board of Trustees, including the Independent Trustees (together, the Board), votes on the renewal of the management contract with Fidelity Management & Research Company LLC (FMR) and the sub-advisory agreement (Sub-Advisory Agreement) for the fund with Geode Capital Management, LLC (Geode) (together, the Advisory Contracts). FMR and Geode are referred to herein as the Investment Advisers. The Board, assisted by the advice of fund counsel and Independent Trustees' counsel, requests and considers a broad range of information relevant to the renewal of the Advisory Contracts throughout the year.
The Board meets regularly and, at each of its meetings, covers an extensive agenda of topics and materials and considers factors that are relevant to its annual consideration of the renewal of the fund's Advisory Contracts, including the services and support provided to the fund and its shareholders. The Board has established various standing committees (Committees), each composed of and chaired by Independent Trustees with varying backgrounds, to which the Board has assigned specific subject matter responsibilities in order to enhance effective decision-making by the Board. The Board, acting directly and through its Committees, requests and receives information concerning the annual consideration of the renewal of the fund's Advisory Contracts. The Board also meets as needed to review matters specifically related to the Board's annual consideration of the renewal of the Advisory Contracts. Members of the Board may also meet with trustees of other Fidelity funds through joint ad hoc committees to discuss certain matters relevant to all of the Fidelity funds.
At its January 2020 meeting, the Board unanimously determined to renew the fund's Advisory Contracts. In reaching its determination, the Board considered all factors it believed relevant, including (i) the nature, extent, and quality of the services provided to the fund and its shareholders (including the investment performance of the fund); (ii) the competitiveness of the fund's management fee and total expense ratio relative to peer funds; (iii) the total costs of the services provided by and the profits realized by Fidelity and Geode from their respective relationships with the fund; and (iv) the extent to which, if any, economies of scale exist and are realized as the fund grows, and whether any economies of scale are appropriately shared with fund shareholders.
In considering whether to renew the Advisory Contracts for the fund, the Board reached a determination, with the assistance of fund counsel and Independent Trustees' counsel and through the exercise of its business judgment, that the renewal of the Advisory Contracts was in the best interests of the fund and its shareholders and that the compensation payable under the Advisory Contracts was fair and reasonable. The Board's decision to renew the Advisory Contracts was not based on any single factor, but rather was based on a comprehensive consideration of all the information provided to the Board at its meetings throughout the year. The Board, in reaching its determination to renew the Advisory Contracts, was aware that shareholders of the fund have a broad range of investment choices available to them, including a wide choice among funds offered by Fidelity's competitors, and that the fund's shareholders, who have the opportunity to review and weigh the disclosure provided by the fund in its prospectus and other public disclosures, have chosen to invest in this fund, which is part of the Fidelity family of funds.
Nature, Extent, and Quality of Services Provided. The Board considered staffing as it relates to the fund, including the backgrounds of investment personnel of Fidelity and Geode, and also considered the fund's investment objective, strategies, and related investment philosophy. The Independent Trustees also had discussions with senior management of Fidelity's investment operations and investment groups and with representatives of Geode. The Board considered the structure of the investment personnel compensation programs and whether the structures provide appropriate incentives to act in the best interests of the fund. Additionally, the Board considered the portfolio managers' investments, if any, in the funds that they manage.
The Trustees also discussed with representatives of Fidelity, at meetings throughout the year, Fidelity's role in, among other things, overseeing compliance with federal securities laws and other applicable requirements by Geode with respect to the fund and monitoring and overseeing the performance and investment capabilities of Geode. The Trustees considered that the Board had received from Fidelity periodic reports about its oversight and due diligence processes, as well as periodic reports regarding the performance of Geode.
The Board also considered the nature, extent and quality of services provided by Geode. The Trustees noted that under the Sub-Advisory Agreement, subject to oversight by Fidelity, Geode is responsible for, among other things, identifying investments and arranging for execution of portfolio transactions to implement the fund's investment strategy. In addition, the Trustees noted that Geode is responsible for providing such reporting as may be requested by Fidelity to fulfill its oversight responsibilities discussed above.
Resources Dedicated to Investment Management and Support Services. The Board and the Fund Oversight and Research Committees reviewed the general qualifications and capabilities of Fidelity's and Geode's investment staffs, including their size, education, experience, and resources, as well as Fidelity's and Geode's approach to recruiting, training, managing, and compensating investment personnel. The Board considered that Fidelity's and Geode's investment professionals have extensive resources, tools and capabilities so as to provide competitive investment results over time, and that those professionals also have access to sophisticated tools that permit them to assess portfolio construction and risk and performance attribution characteristics continuously. Additionally, in its deliberations, the Board considered Fidelity's and Geode's trading, risk management, compliance, and technology and operations capabilities and resources, which are integral parts of the investment management process.
Shareholder and Administrative Services. The Board considered (i) the nature, extent, quality, and cost of advisory, administrative, and shareholder services performed by the Investment Advisers and their affiliates under the Advisory Contracts and by FMR's affiliates under separate agreements covering transfer agency, pricing and bookkeeping, and securities lending services for the fund; (ii) the nature and extent of the supervision of third party service providers, principally custodians, subcustodians, and pricing vendors; and (iii) the resources devoted to, and the record of compliance with, the fund's compliance policies and procedures. The Board also reviewed the allocation of fund brokerage, including allocations to brokers affiliated with the Investment Advisers.
The Board noted that the growth of fund assets over time across the complex allows Fidelity to reinvest in the development of services designed to enhance the value and convenience of the Fidelity funds as investment vehicles. These services include 24-hour access to account information and market information over the Internet and through telephone representatives, investor education materials and asset allocation tools, and the expanded availability of Fidelity Investor Centers.
The Board noted that it and the boards of certain other Fidelity funds had formed an ad hoc Committee on Transfer Agency Fees to review the variety of transfer agency fee structures throughout the industry and Fidelity's competitive positioning with respect to industry participants.
Investment in a Large Fund Family. The Board considered the benefits to shareholders of investing in a Fidelity fund, including the benefits of investing in a fund that is part of a large family of funds offering a variety of investment disciplines and providing a large variety of mutual fund investor services. The Board noted that Fidelity had taken, or had made recommendations that resulted in the Fidelity funds taking, a number of actions over the previous year that benefited particular funds, including: (i) continuing to dedicate additional resources to Fidelity's investment research process, which includes meetings with management of issuers of securities in which the funds invest, and to the support of the senior management team that oversees asset management; (ii) continuing efforts to enhance Fidelity's global research capabilities; (iii) launching new funds and ETFs with innovative structures, strategies and pricing and making other enhancements to meet client needs; (iv) launching new share classes of existing funds; (v) eliminating purchase minimums and broadening eligibility requirements for certain funds and share classes; (vi) reducing management fees and total expenses for certain target date funds and index funds; (vii) lowering expense caps for certain existing funds and classes, and converting certain voluntary expense caps to contractual caps, to reduce expenses borne by shareholders; (viii) rationalizing product lines and gaining increased efficiencies from fund mergers, liquidations, and share class consolidations; (ix) continuing to develop, acquire and implement systems and technology to improve services to the funds and shareholders, strengthen information security, and increase efficiency; and (x) continuing to implement enhancements to further strengthen Fidelity's product line to increase investors' probability of success in achieving their investment goals, including retirement income goals.
Investment Performance. The Board considered whether the fund has operated in accordance with its investment objective, as well as its record of compliance with its investment restrictions and its performance history.
The Board took into account discussions that occur at Board meetings throughout the year with representatives of the Investment Advisers about fund investment performance. In this regard the Board noted that as part of regularly scheduled fund reviews and other reports to the Board on fund performance, the Board considers annualized return information for the fund for different time periods, measured against the securities market index the fund seeks to track and a peer group of funds with similar objectives (peer group), if any. The Board also periodically considers the fund's tracking error versus its benchmark index. In its evaluation of fund investment performance, the Board gave particular attention to information indicating changes in performance of certain Fidelity funds for specific time periods and discussed with the Investment Advisers the reasons for any overperformance or underperformance.
In addition to reviewing absolute and relative fund performance, the Independent Trustees periodically consider the appropriateness of fund performance metrics in evaluating the results achieved. In general, the Independent Trustees believe that an index fund's performance should be evaluated based on net performance (after fees and expenses) of both the highest performing and lowest performing fund share classes, where applicable, compared to a fund's benchmark index, over appropriate time periods taking into account relevant factors including the following: general market conditions; the characteristics of the fund's benchmark index; the extent to which statistical sampling is employed; any securities lending revenues; and fund cash flows and other factors.
The Independent Trustees recognize that shareholders evaluate performance on a net basis over their own holding periods, for which one-, three-, and five-year periods are often used as a proxy. For this reason, the performance information reviewed by the Board also included net cumulative total return information for the fund and an appropriate benchmark index and peer group for the most recent one-, three-, and five-year periods ended June 30, 2019, as shown below. Returns are shown compared to the 25th percentile (top of box, 75% beaten) and 75th percentile (bottom of box, 25% beaten) of the peer universe.
VIP Index 500 Portfolio
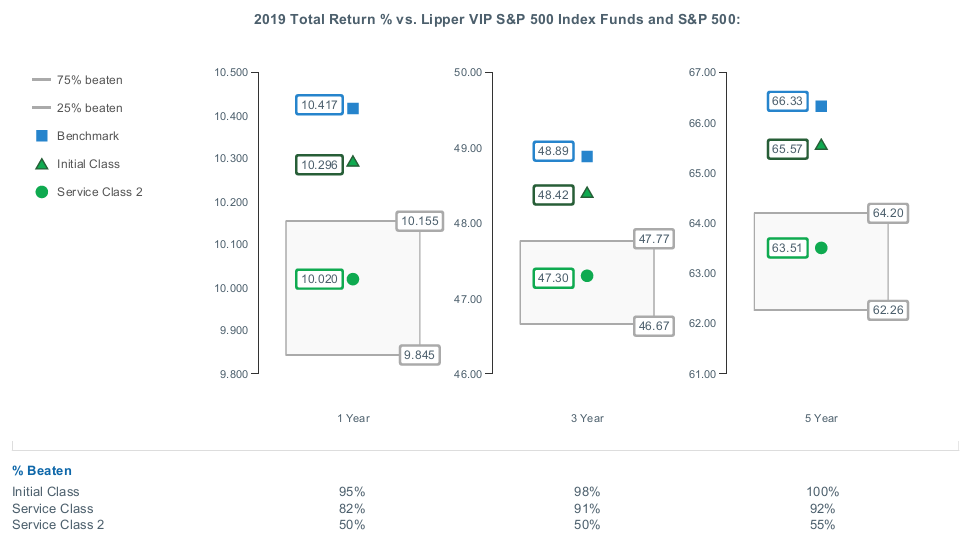
Based on its review, the Board concluded that the nature, extent, and quality of services provided to the fund under the Advisory Contracts should continue to benefit the shareholders of the fund.
Competitiveness of Management Fee and Total Expense Ratio. The Board considered the fund's management fee and total expense ratio compared to "mapped groups" of competitive funds and classes created for the purpose of facilitating the Trustees' competitive analysis of management fees and total expenses. Fidelity creates "mapped groups" by combining similar Lipper investment objective categories that have comparable investment mandates. Combining Lipper investment objective categories aids the Board's management fee and total expense ratio comparisons by broadening the competitive group used for comparison.
Management Fee. The Board considered two proprietary management fee comparisons for the 12-month periods ended June 30 (December 31 for periods prior to 2018) shown in basis points (BP) in the chart below. The group of Lipper funds used by the Board for management fee comparisons is referred to below as the "Total Mapped Group." The Total Mapped Group is broader than the Lipper peer group used by the Board for performance comparisons because the Total Mapped Group combines several Lipper investment objective categories while the Lipper peer group does not. The Total Mapped Group comparison focuses on a fund's standing in terms of gross management fees before expense reimbursements or caps relative to the total universe of funds with comparable investment mandates, regardless of whether their management fee structures also are comparable. Funds with comparable investment mandates offer exposure to similar types of securities. Funds with comparable management fee structures have similar management fee contractual arrangements (
e.g., flat rate charged for advisory services, all-inclusive fee rate,
etc.). "TMG %" represents the percentage of funds in the Total Mapped Group that had management fees that were lower than the fund's. For example, a hypothetical TMG % of 20% would mean that 80% of the funds in the Total Mapped Group had higher, and 20% had lower, management fees than the fund. The fund's actual TMG %s and the number of funds in the Total Mapped Group are in the chart below. The "Asset-Sized Peer Group" (ASPG) comparison focuses on a fund's standing relative to a subset of non-Fidelity funds within the Total Mapped Group that are similar in size and management fee structure. For example, if a fund is in the first quartile of the ASPG, the fund's management fee ranks in the least expensive or lowest 25% of funds in the ASPG. The ASPG represents at least 15% of the funds in the Total Mapped Group with comparable asset size and management fee structures, subject to a minimum of 50 funds (or all funds in the Total Mapped Group if fewer than 50). Additional information, such as the ASPG quartile in which the fund's management fee rate ranked, is also included in the chart and was considered by the Board. Because the vast majority of competitor funds' management fees do not cover non-management expenses, in prior years, the fund was compared on the basis of a hypothetical "net management fee," which was derived by subtracting payments made by FMR for "fund-level" non-management expenses (including pricing and bookkeeping fees and fees paid to non-affiliated custodians), as well as "class-level" expenses paid by FMR under expense limitation agreements in effect for the fund, from the fund's management fee. Given the fund's competitive management fee rate, Fidelity no longer calculates a hypothetical net management fee for the fund and, as a result, the chart does not include hypothetical net management fees for periods after 2016.
VIP Index 500 Portfolio
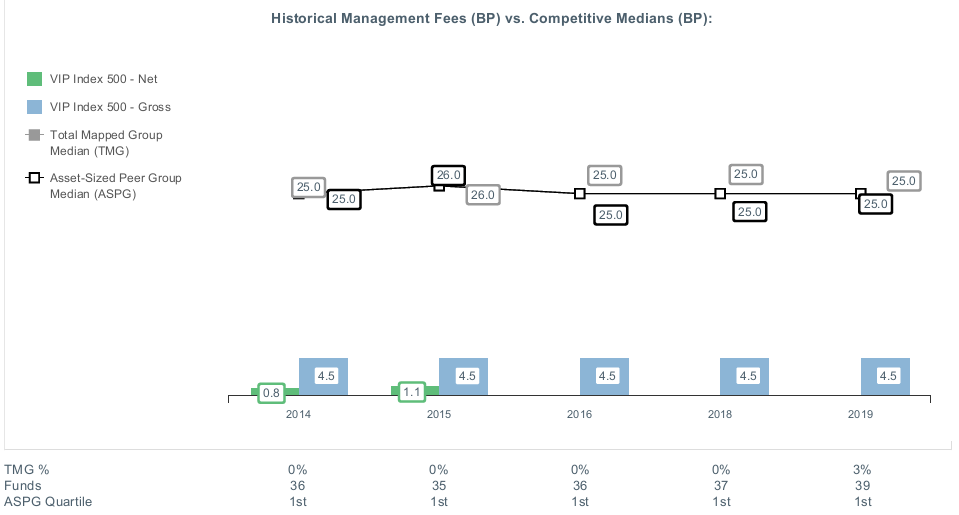
The Board noted that the fund's management fee rate ranked below the median of its Total Mapped Group and below the median of its ASPG for the 12-month period ended June 30, 2019.
The Board noted that it and the boards of other Fidelity funds formed an ad hoc Committee on Group Fee, which meets periodically, to conduct an in-depth review of the "group fee" component of the management fee of funds with such management fee structures. The Committee's focus included the mechanics of the group fee, the competitive landscape of group fee structures, Fidelity funds with no group fee component (such as the fund) and investment products not included in group fee assets. The Board also considered that, for funds subject to the group fee, FMR agreed to voluntarily waive fees over a specified period of time in amounts designed to account for assets converted from certain funds to certain collective investment trusts.
Based on its review, the Board concluded that the fund's management fee is fair and reasonable in light of the services that the fund receives and the other factors considered.
Total Expense Ratio. In its review of each class's total expense ratio, the Board considered the fund's management fee rate as well as other "fund-level" expenses, such as pricing and bookkeeping fees and custodial, legal, and audit fees, paid by FMR under the fund's management contract. The Board also considered other "class-level" expenses, such as transfer agent fees and fund-paid 12b-1 fees. The Board also noted that Fidelity may agree to waive fees or reimburse expenses from time to time, and the extent to which, if any, it has done so for the fund. As part of its review, the Board also considered the current and historical total expense ratios of each class of the fund compared to competitive fund median expenses. Each class of the fund is compared to those funds and classes in the Total Mapped Group (used by the Board for management fee comparisons) that have a similar sales load structure.
The Board noted that the total expense ratio of each of Initial Class, Service Class, and Service Class 2 ranked below the competitive median for the 12-month period ended June 30, 2019.
The Board considered that current contractual arrangements for the fund oblige FMR to pay all "class-level" expenses of each class of the fund to the extent necessary to limit total operating expenses, with certain exceptions, as follows: Initial Class: 0.10%; Service Class: 0.20%; and Service Class 2: 0.35%. These contractual arrangements may not be amended to increase the fees or expenses payable except by a vote of a majority of the Board and by a vote of a majority of the outstanding voting securities of the applicable class.
Fees Charged to Other Clients. The Board also considered fee structures applicable to clients of Fidelity and Geode, such as other funds advised or subadvised by Fidelity or Geode, pension plan clients, and other institutional clients with similar mandates. The Board noted that a joint ad hoc committee created by it and the boards of other Fidelity funds periodically reviews and compares Fidelity's institutional investment advisory business with its business of providing services to the Fidelity funds and also noted the most recent findings of the committee. The Board noted that the committee's review included a consideration of the differences in services provided, fees charged, and costs incurred, as well as competition in the markets serving the different categories of clients.
Based on its review of total expense ratios and fees charged to other Fidelity clients, the Board concluded that the total expense ratio of each class of the fund was reasonable in light of the services that the fund and its shareholders receive and the other factors considered.
Costs of the Services and Profitability. The Board considered the revenues earned and the expenses incurred by Fidelity in conducting the business of developing, marketing, distributing, managing, administering and servicing the fund and servicing the fund's shareholders. The Board also considered the level of Fidelity's profits in respect of all the Fidelity funds.
On an annual basis, Fidelity presents to the Board information about the profitability of its relationships with the fund. Fidelity calculates profitability information for each fund, as well as aggregate profitability information for groups of Fidelity funds and all Fidelity funds, using a series of detailed revenue and cost allocation methodologies which originate with the books and records of Fidelity on which Fidelity's audited financial statements are based. The Audit Committee of the Board reviews any significant changes from the prior year's methodologies and the full Board approves such changes.
PricewaterhouseCoopers LLP (PwC), auditor to Fidelity and certain Fidelity funds, has been engaged annually by the Board as part of the Board's assessment of Fidelity's profitability analysis. PwC's engagement includes the review and assessment of the methodologies used by Fidelity in determining the revenues and expenses attributable to Fidelity's mutual fund business, and completion of agreed-upon procedures in respect of the mathematical accuracy of the fund profitability information and its conformity to established allocation methodologies. After considering PwC's reports issued under the engagement and information provided by Fidelity, the Board concluded that while other allocation methods may also be reasonable, Fidelity's profitability methodologies are reasonable in all material respects.
The Board also reviewed Fidelity's and Geode's non-fund businesses and potential indirect benefits such businesses may have received as a result of their association with Fidelity's mutual fund business (i.e., fall-out benefits) as well as cases where Fidelity's and Geode's affiliates may benefit from the funds' business. The Board noted that changes to fall-out benefits year-over-year reflect business developments at Fidelity's and Geode's various businesses. The Board considered that a joint ad hoc committee created by it and the boards of other Fidelity funds had recently been established, and met periodically, to evaluate potential fall-out benefits (PFOB Committee). The Board noted that the PFOB Committee, among other things: (i) discussed the legal framework surrounding potential fall-out benefits; (ii) reviewed the Board's responsibilities and approach to potential fall-out benefits; and (iii) reviewed practices employed by competitor funds regarding the review of potential fall-out benefits.
The Board considered the costs of the services provided by and the profits realized by Fidelity in connection with the operation of the fund, including the conclusions of the PFOB Committee, and was satisfied that the profitability was not excessive.
The Board also considered information regarding the profitability of Geode's relationship with the fund.
Economies of Scale. The Board considered whether there have been economies of scale in respect of the management of the Fidelity funds, whether the Fidelity funds (including the fund) have appropriately benefited from any such economies of scale, and whether there is potential for realization of any further economies of scale. The Board considered the extent to which the fund will benefit from economies of scale as assets grow through increased services to the fund, through waivers or reimbursements, or through fee or expense ratio reductions. The Board recognized that, due to the fund's current contractual arrangements, the expense ratio of each class will not decline if the class's operating costs decrease as assets grow, or rise as assets decrease. The Board also noted that a committee (the Economies of Scale Committee) created by it and the boards of other Fidelity funds periodically analyzes whether Fidelity attains economies of scale in respect of the management and servicing of the Fidelity funds, whether the Fidelity funds have appropriately benefited from such economies of scale, and whether there is potential for realization of any further economies of scale.
The Board concluded, taking into account the analysis of the Economies of Scale Committee, that economies of scale, if any, are being appropriately shared between fund shareholders and Fidelity.
Additional Information Requested by the Board. In order to develop fully the factual basis for consideration of the Fidelity funds' advisory contracts, the Board requested and received additional information on certain topics, including: (i) fund flow and performance trends, in particular the underperformance of certain funds and strategies, and Fidelity's long-term strategies for certain funds; (ii) consideration of performance fees for additional funds; (iii) changes in Fidelity's non-fund businesses and the impact of such changes on the funds; (iv) metrics for evaluating index fund and ETF performance and information about ETF trading characteristics; (v) the methodology with respect to evaluating competitive fund data and peer group classifications and fee comparisons; (vi) the expense structures for different funds and classes; (vii) information regarding other accounts managed by Fidelity, including collective investment trusts and separately managed accounts; and (viii) Fidelity's philosophies and strategies for evaluating funds and classes with lower or declining asset levels.
Based on its evaluation of all of the conclusions noted above, and after considering all factors it believed relevant, the Board concluded that the advisory and sub-advisory fee arrangements are fair and reasonable, and that the fund's Advisory Contracts should be renewed.
Liquidity Risk Management Program
The Securities and Exchange Commission adopted Rule 22e-4 under the Investment Company Act of 1940 (the Liquidity Rule) to promote effective liquidity risk management throughout the open-end investment company industry, thereby reducing the risk that funds will be unable to meet their redemption obligations and mitigating dilution of the interests of fund shareholders.
The Fund has adopted and implemented a liquidity risk management program pursuant to the Liquidity Rule (the Program) effective December 1, 2018. The Program is reasonably designed to assess and manage the Fund’s liquidity risk and to comply with the requirements of the Liquidity Rule. The Fund’s Board of Trustees (the Board) has designated the Fund’s investment adviser as administrator of the Program. The Fidelity advisers have established a Liquidity Risk Management Committee (the LRM Committee) to manage the Program for each of the Fidelity Funds. The LRM Committee monitors the adequacy and effectiveness of implementation of the Program and on a periodic basis assesses each Fund’s liquidity risk based on a variety of factors including (1) the Fund’s investment strategy, (2) portfolio liquidity and cash flow projections during normal and reasonably foreseeable stressed conditions, (3) shareholder redemptions, (4) borrowings and other funding sources and (5) in the case of exchange-traded funds, certain additional factors including the effect of the Fund’s prices and spreads, market participants, and basket compositions on the overall liquidity of the Fund’s portfolio, as applicable.
In accordance with the Program, each of the Fund’s portfolio investments is classified into one of four liquidity categories described below based on a determination of a reasonable expectation for how long it would take to convert the investment to cash (or sell or dispose of the investment) without significantly changing its market value.
- Highly liquid investments – cash or convertible to cash within three business days or less
- Moderately liquid investments – convertible to cash in three to seven calendar days
- Less liquid investments – can be sold or disposed of, but not settled, within seven calendar days
- Illiquid investments – cannot be sold or disposed of within seven calendar days
Liquidity classification determinations take into account a variety of factors including various market, trading and investment-specific considerations, as well as market depth, and generally utilize analysis from a third-party liquidity metrics service.
The Liquidity Rule places a 15% limit on a fund’s illiquid investments and requires funds that do not primarily hold assets that are highly liquid investments to determine and maintain a minimum percentage of the fund’s net assets to be invested in highly liquid investments (highly liquid investment minimum or HLIM). The Program includes provisions reasonably designed to comply with the 15% limit on illiquid investments and for determining, periodically reviewing and complying with the HLIM requirement as applicable.
At a recent meeting of the Fund’s Board of Trustees, the LRM Committee provided a written report to the Board pertaining to the operation, adequacy, and effectiveness of implementation of the Program for the annual period from December 1, 2018 through November 30, 2019. The report concluded that the Program has been implemented and is operating effectively and is reasonably designed to assess and manage the Fund’s liquidity risk.
Proxy Voting Results
A special meeting of shareholders was held on June 9, 2020. The results of votes taken among shareholders on the proposals before them are reported below. Each vote reported represents one dollar of net asset value held on the record date for the meeting.
PROPOSAL 1
To elect a Board of Trustees.
| | # of
Votes | % of
Votes |
| Dennis J. Dirks |
| Affirmative | 21,597,050,616.024 | 95.502 |
| Withheld | 1,017,240,628.578 | 4.498 |
| TOTAL | 22,614,291,244.601 | 100.000 |
| Donald F. Donahue |
| Affirmative | 21,605,904,576.366 | 95.541 |
| Withheld | 1,008,386,668.235 | 4.459 |
| TOTAL | 22,614,291,244.601 | 100.000 |
| Bettina Doulton |
| Affirmative | 21,645,998,598.109 | 95.718 |
| Withheld | 968,292,646.493 | 4.282 |
| TOTAL | 22,614,291,244.601 | 100.000 |
| Vicki L. Fuller |
| Affirmative | 21,660,928,063.243 | 95.784 |
| Withheld | 953,363,181.358 | 4.216 |
| TOTAL | 22,614,291,244.601 | 100.000 |
| Patricia L. Kampling |
| Affirmative | 21,663,944,422.383 | 95.798 |
| Withheld | 950,346,822.218 | 4.202 |
| TOTAL | 22,614,291,244.601 | 100.000 |
| Alan J. Lacy |
| Affirmative | 21,569,159,491.891 | 95.378 |
| Withheld | 1,045,131,752.710 | 4.622 |
| TOTAL | 22,614,291,244.601 | 100.000 |
| Ned C. Lautenbach |
| Affirmative | 21,469,914,492.101 | 94.940 |
| Withheld | 1,144,376,752.501 | 5.060 |
| TOTAL | 22,614,291,244.601 | 100.000 |
| Robert A. Lawrence |
| Affirmative | 21,583,601,126.100 | 95.442 |
| Withheld | 1,030,690,118.501 | 4.558 |
| TOTAL | 22,614,291,244.601 | 100.000 |
| Joseph Mauriello |
| Affirmative | 21,551,120,396.219 | 95.299 |
| Withheld | 1,063,170,848.382 | 4.701 |
| TOTAL | 22,614,291,244.601 | 100.000 |
| Cornelia M. Small |
| Affirmative | 21,592,890,757.027 | 95.483 |
| Withheld | 1,021,400,487.575 | 4.517 |
| TOTAL | 22,614,291,244.601 | 100.000 |
| Garnett A. Smith |
| Affirmative | 21,519,273,578.917 | 95.158 |
| Withheld | 1,095,017,665.685 | 4.842 |
| TOTAL | 22,614,291,244.601 | 100.000 |
| David M. Thomas |
| Affirmative | 21,574,034,388.063 | 95.400 |
| Withheld | 1,040,256,856.538 | 4.600 |
| TOTAL | 22,614,291,244.601 | 100.000 |
| Susan Tomasky |
| Affirmative | 21,607,546,330.771 | 95.548 |
| Withheld | 1,006,744,913.831 | 4.452 |
| TOTAL | 22,614,291,244.601 | 100.000 |
| Michael E. Wiley |
| Affirmative | 21,549,685,089.255 | 95.292 |
| Withheld | 1,064,606,155.346 | 4.708 |
| TOTAL | 22,614,291,244.601 | 100.000 |
PROPOSAL 2
To convert a fundamental investment policy to a non-fundamental investment policy.
| | # of
Votes | % of
Votes |
| Affirmative | 4,853,584,393.686 | 81.193 |
| Against | 724,297,295.725 | 12.116 |
| Abstain | 399,977,705.124 | 6.691 |
| Broker Non-Vote | 0.00 | 0.00 |
| TOTAL | 5,977,859,394.535 | 100.000 |
|
| Proposal 1 reflects trust wide proposal and voting results. |

VIPIDX-SANN-0820
1.705630.122
Fidelity® Variable Insurance Products:
Contrafund® Portfolio
Semi-Annual Report
June 30, 2020
See the inside front cover for important information about access to your fund’s shareholder reports.
Beginning on January 1, 2021, as permitted by regulations adopted by the Securities and Exchange Commission, and if your insurance carrier elects to participate, you may not be receiving paper copies of the Fund’s shareholder reports from the insurance company that offers your variable insurance product unless you specifically request paper copies from your financial professional or the administrator of your variable insurance product. Instead, the reports will be made available on a website, and you will be notified by mail each time a report is posted and provided with a website link to access the report.
If you already elected to receive shareholder reports electronically, you will not be affected by this change and you need not take any action. You may elect to receive shareholder reports and other communications from the Fund electronically, by contacting your financial professional or the administrator of your variable insurance product. If you own a Fidelity-administered variable insurance product, please visit fidelity.com/mailpreferences to make your election or call 1-800-343-3548.
You may elect to receive all future reports in paper free of charge. If you wish to continue receiving paper copies of your shareholder reports, you may contact your financial professional or the administrator of your variable insurance product. If you own a Fidelity-administered variable insurance product, please visit fidelity.com/mailpreferences to make your election or call 1-800-343-3548. Your election to receive reports in paper will apply to all funds available under your variable insurance product.
Contents
To view a fund's proxy voting guidelines and proxy voting record for the 12-month period ended June 30, visit http://www.fidelity.com/proxyvotingresults or visit the Securities and Exchange Commission's (SEC) web site at http://www.sec.gov.
You may also call 1-877-208-0098 to request a free copy of the proxy voting guidelines.
Fidelity® Variable Insurance Products are separate account options which are purchased through a variable insurance contract.
Standard & Poor's, S&P and S&P 500 are registered service marks of The McGraw-Hill Companies, Inc. and have been licensed for use by Fidelity Distributors Corporation.
Other third-party marks appearing herein are the property of their respective owners.
All other marks appearing herein are registered or unregistered trademarks or service marks of FMR LLC or an affiliated company. © 2020 FMR LLC. All rights reserved.
This report and the financial statements contained herein are submitted for the general information of the shareholders of the Fund. This report is not authorized for distribution to prospective investors in the Fund unless preceded or accompanied by an effective prospectus.
A fund files its complete schedule of portfolio holdings with the SEC for the first and third quarters of each fiscal year on Form N-PORT. Forms N-PORT are available on the SEC’s web site at http://www.sec.gov. A fund's Forms N-PORT may be reviewed and copied at the SEC’s Public Reference Room in Washington, DC. Information regarding the operation of the SEC's Public Reference Room may be obtained by calling 1-800-SEC-0330.
For a complete list of a fund's portfolio holdings, view the most recent holdings listing, semiannual report, or annual report on Fidelity's web site at http://www.fidelity.com, http://www.institutional.fidelity.com, or http://www.401k.com, as applicable.
NOT FDIC INSURED •MAY LOSE VALUE •NO BANK GUARANTEE
Neither the Fund nor Fidelity Distributors Corporation is a bank.
Note to Shareholders:
Early in 2020, the outbreak and spread of a new coronavirus emerged as a public health emergency that had a major influence on financial markets, primarily based on its impact on the global economy and the outlook for corporate earnings. The virus causes a respiratory disease known as COVID-19. On March 11, the World Health Organization declared the COVID-19 outbreak a pandemic, citing sustained risk of further global spread.
In the weeks following, as the crisis worsened, we witnessed an escalating human tragedy with wide-scale social and economic consequences from coronavirus-containment measures. The outbreak of COVID-19 prompted a number of measures to limit the spread, including travel and border restrictions, quarantines, and restrictions on large gatherings. In turn, these resulted in lower consumer activity, diminished demand for a wide range of products and services, disruption in manufacturing and supply chains, and – given the wide variability in outcomes regarding the outbreak – significant market uncertainty and volatility. Amid the turmoil, the U.S. government took unprecedented action – in concert with the U.S. Federal Reserve and central banks around the world – to help support consumers, businesses, and the broader economy, and to limit disruption to the financial system.
The situation continues to unfold, and the extent and duration of its impact on financial markets and the economy remain highly uncertain. Extreme events such as the coronavirus crisis are “exogenous shocks” that can have significant adverse effects on mutual funds and their investments. Although multiple asset classes may be affected by market disruption, the duration and impact may not be the same for all types of assets.
Fidelity is committed to helping you stay informed amid news about COVID-19 and during increased market volatility, and we’re taking extra steps to be responsive to customer needs. We encourage you to visit our websites, where we offer ongoing updates, commentary, and analysis on the markets and our funds.
Investment Summary (Unaudited)
Top Ten Stocks as of June 30, 2020
| | % of fund's net assets |
| Microsoft Corp. | 8.6 |
| Amazon.com, Inc. | 6.6 |
| Alphabet, Inc. Class C | 4.5 |
| Facebook, Inc. Class A | 4.4 |
| Apple, Inc. | 4.4 |
| Salesforce.com, Inc. | 3.5 |
| UnitedHealth Group, Inc. | 3.0 |
| Netflix, Inc. | 2.7 |
| Adobe, Inc. | 2.3 |
| Berkshire Hathaway, Inc. Class B | 2.2 |
| | 42.2 |
Top Market Sectors as of June 30, 2020
| | % of fund's net assets |
| Information Technology | 36.5 |
| Health Care | 16.7 |
| Communication Services | 13.8 |
| Consumer Discretionary | 11.8 |
| Financials | 6.7 |
| Consumer Staples | 4.3 |
| Industrials | 3.2 |
| Materials | 1.8 |
| Real Estate | 1.5 |
| Utilities | 0.7 |
Asset Allocation (% of fund's net assets)
| As of June 30, 2020* |
| | Stocks | 97.4% |
| | Short-Term Investments and Net Other Assets (Liabilities) | 2.6% |

* Foreign investments - 6.1%
Schedule of Investments June 30, 2020 (Unaudited)
Showing Percentage of Net Assets
| Common Stocks - 97.4% | | | |
| | | Shares | Value |
| COMMUNICATION SERVICES - 13.8% | | | |
| Entertainment - 4.2% | | | |
| Activision Blizzard, Inc. | | 1,128,228 | $85,632,505 |
| Electronic Arts, Inc. (a) | | 595,900 | 78,688,595 |
| NetEase, Inc. | | 695,300 | 11,985,302 |
| Netflix, Inc. (a) | | 1,111,454 | 505,756,028 |
| Nintendo Co. Ltd. | | 2,400 | 1,072,965 |
| Sea Ltd. ADR (a) | | 42,300 | 4,536,252 |
| Spotify Technology SA (a) | | 57,797 | 14,922,607 |
| Take-Two Interactive Software, Inc. (a) | | 369,218 | 51,531,756 |
| The Walt Disney Co. | | 248,958 | 27,761,307 |
| | | | 781,887,317 |
| Interactive Media & Services - 9.0% | | | |
| Alphabet, Inc. Class C (a) | | 592,767 | 837,941,359 |
| Facebook, Inc. Class A (a) | | 3,619,613 | 821,905,524 |
| Match Group, Inc. (a)(b) | | 12,300 | 1,316,715 |
| Snap, Inc. Class A (a) | | 351,000 | 8,244,990 |
| Tencent Holdings Ltd. | | 112,800 | 7,227,989 |
| Zoominfo Technologies, Inc. (b) | | 24,400 | 1,245,132 |
| | | | 1,677,881,709 |
| Media - 0.0% | | | |
| Charter Communications, Inc. Class A (a) | | 21,452 | 10,941,378 |
| Wireless Telecommunication Services - 0.6% | | | |
| Bharti Airtel Ltd. (a) | | 142,800 | 1,058,264 |
| T-Mobile U.S., Inc. | | 1,010,501 | 105,243,679 |
| T-Mobile U.S., Inc. rights 7/28/20 (a) | | 500,501 | 84,084 |
| | | | 106,386,027 |
|
| TOTAL COMMUNICATION SERVICES | | | 2,577,096,431 |
|
| CONSUMER DISCRETIONARY - 11.8% | | | |
| Automobiles - 0.0% | | | |
| Tesla, Inc. (a) | | 8,700 | 9,394,347 |
| Diversified Consumer Services - 0.0% | | | |
| Chegg, Inc. (a) | | 35,200 | 2,367,552 |
| Hotels, Restaurants & Leisure - 0.4% | | | |
| Chipotle Mexican Grill, Inc. (a) | | 37,185 | 39,132,007 |
| Domino's Pizza, Inc. | | 16,400 | 6,058,816 |
| DraftKings, Inc. Class A (a) | | 130,400 | 4,337,104 |
| Evolution Gaming Group AB (c) | | 127,500 | 7,602,219 |
| McDonald's Corp. | | 58,290 | 10,752,756 |
| | | | 67,882,902 |
| Household Durables - 0.4% | | | |
| D.R. Horton, Inc. | | 724,000 | 40,145,800 |
| Garmin Ltd. | | 70,646 | 6,887,985 |
| Mohawk Industries, Inc. (a) | | 8,000 | 814,080 |
| NVR, Inc. (a) | | 5,600 | 18,249,000 |
| | | | 66,096,865 |
| Internet & Direct Marketing Retail - 7.9% | | | |
| Alibaba Group Holding Ltd. | | 1,362,900 | 36,776,224 |
| Alibaba Group Holding Ltd. sponsored ADR (a) | | 154,057 | 33,230,095 |
| Amazon.com, Inc. (a) | | 447,402 | 1,234,301,586 |
| Boohoo.Com PLC (a) | | 1,795,800 | 9,167,724 |
| Coupang unit (d)(e) | | 228,895 | 1,716,713 |
| Delivery Hero AG (a)(c) | | 644 | 65,813 |
| eBay, Inc. | | 1,789,100 | 93,838,295 |
| Expedia, Inc. | | 181,085 | 14,885,187 |
| Farfetch Ltd. Class A (a) | | 75,700 | 1,307,339 |
| JD.com, Inc.: | | | |
| Class A | | 514,900 | 15,399,499 |
| sponsored ADR (a) | | 22,800 | 1,372,104 |
| Meituan Dianping Class B (a) | | 495,300 | 10,985,365 |
| MercadoLibre, Inc. (a) | | 2,700 | 2,661,579 |
| Pinduoduo, Inc. ADR (a) | | 135,700 | 11,648,488 |
| | | | 1,467,356,011 |
| Leisure Products - 0.0% | | | |
| Peloton Interactive, Inc. Class A (a) | | 92,700 | 5,355,279 |
| Multiline Retail - 0.6% | | | |
| Dollar General Corp. | | 580,002 | 110,496,181 |
| Specialty Retail - 1.8% | | | |
| AutoZone, Inc. (a) | | 19,000 | 21,434,280 |
| Burlington Stores, Inc. (a) | | 13,445 | 2,647,724 |
| Lowe's Companies, Inc. | | 420,000 | 56,750,400 |
| The Home Depot, Inc. | | 870,460 | 218,058,935 |
| TJX Companies, Inc. | | 554,854 | 28,053,418 |
| | | | 326,944,757 |
| Textiles, Apparel & Luxury Goods - 0.7% | | | |
| adidas AG | | 75,049 | 19,786,806 |
| Allbirds, Inc. (a)(d)(e) | | 130,840 | 1,348,960 |
| Deckers Outdoor Corp. (a) | | 37,859 | 7,435,129 |
| lululemon athletica, Inc. (a) | | 6,459 | 2,015,273 |
| NIKE, Inc. Class B | | 1,112,430 | 109,073,762 |
| | | | 139,659,930 |
|
| TOTAL CONSUMER DISCRETIONARY | | | 2,195,553,824 |
|
| CONSUMER STAPLES - 4.3% | | | |
| Beverages - 0.8% | | | |
| Constellation Brands, Inc. Class A (sub. vtg.) | | 18,400 | 3,219,080 |
| Keurig Dr. Pepper, Inc. (b) | | 446,980 | 12,694,232 |
| Monster Beverage Corp. (a) | | 15,100 | 1,046,732 |
| PepsiCo, Inc. | | 975,642 | 129,038,411 |
| The Coca-Cola Co. | | 244,657 | 10,931,275 |
| | | | 156,929,730 |
| Food & Staples Retailing - 1.7% | | | |
| Alimentation Couche-Tard, Inc. Class B (sub. vtg.) | | 120,000 | 3,762,817 |
| Costco Wholesale Corp. | | 672,601 | 203,939,349 |
| Kroger Co. | | 20,489 | 693,553 |
| Walmart, Inc. | | 911,165 | 109,139,344 |
| | | | 317,535,063 |
| Food Products - 0.2% | | | |
| Freshpet, Inc. (a) | | 28,800 | 2,409,408 |
| The Hershey Co. | | 240,000 | 31,108,800 |
| | | | 33,518,208 |
| Household Products - 0.8% | | | |
| Procter & Gamble Co. | | 1,030,000 | 123,157,100 |
| Reynolds Consumer Products, Inc. | | 477,746 | 16,596,896 |
| | | | 139,753,996 |
| Personal Products - 0.8% | | | |
| Estee Lauder Companies, Inc. Class A | | 737,285 | 139,110,934 |
| L'Oreal SA | | 15,400 | 4,970,300 |
| | | | 144,081,234 |
|
| TOTAL CONSUMER STAPLES | | | 791,818,231 |
|
| ENERGY - 0.4% | | | |
| Oil, Gas & Consumable Fuels - 0.4% | | | |
| Canadian Natural Resources Ltd. | | 70,200 | 1,217,745 |
| EOG Resources, Inc. | | 21,500 | 1,089,190 |
| Hess Corp. | | 104,063 | 5,391,504 |
| Noble Energy, Inc. | | 114,500 | 1,025,920 |
| Phillips 66 Co. | | 115,200 | 8,282,880 |
| Pioneer Natural Resources Co. | | 11,700 | 1,143,090 |
| Reliance Industries Ltd. | | 2,602,481 | 58,705,247 |
| Valero Energy Corp. | | 90,300 | 5,311,446 |
| | | | 82,167,022 |
| FINANCIALS - 6.7% | | | |
| Banks - 1.3% | | | |
| Bank of America Corp. | | 3,046,747 | 72,360,241 |
| Citigroup, Inc. | | 20,200 | 1,032,220 |
| JPMorgan Chase & Co. | | 1,800,939 | 169,396,322 |
| The Toronto-Dominion Bank | | 19,500 | 870,289 |
| | | | 243,659,072 |
| Capital Markets - 2.4% | | | |
| BlackRock, Inc. Class A | | 119,100 | 64,801,119 |
| CME Group, Inc. | | 396,439 | 64,437,195 |
| MarketAxess Holdings, Inc. | | 4,100 | 2,053,772 |
| Moody's Corp. | | 293,400 | 80,605,782 |
| MSCI, Inc. | | 336,000 | 112,163,520 |
| S&P Global, Inc. | | 358,000 | 117,953,840 |
| Tradeweb Markets, Inc. Class A | | 24,650 | 1,433,151 |
| | | | 443,448,379 |
| Consumer Finance - 0.1% | | | |
| American Express Co. | | 271,871 | 25,882,119 |
| Diversified Financial Services - 2.2% | | | |
| Berkshire Hathaway, Inc. Class B (a) | | 2,326,488 | 415,301,373 |
| Insurance - 0.7% | | | |
| Allstate Corp. | | 590,000 | 57,224,100 |
| Intact Financial Corp. | | 11,800 | 1,123,069 |
| Progressive Corp. | | 832,500 | 66,691,575 |
| Selectquote, Inc. (b) | | 59,200 | 1,499,536 |
| | | | 126,538,280 |
|
| TOTAL FINANCIALS | | | 1,254,829,223 |
|
| HEALTH CARE - 16.7% | | | |
| Biotechnology - 4.5% | | | |
| AbbVie, Inc. | | 1,673,907 | 164,344,189 |
| Acceleron Pharma, Inc. (a) | | 49,254 | 4,692,429 |
| Alector, Inc. (a) | | 33,500 | 818,740 |
| Alexion Pharmaceuticals, Inc. (a) | | 28,800 | 3,232,512 |
| Alnylam Pharmaceuticals, Inc. (a) | | 33,900 | 5,020,929 |
| Arcus Biosciences, Inc. (a) | | 113,900 | 2,817,886 |
| Argenx SE ADR (a) | | 22,800 | 5,135,244 |
| BeiGene Ltd. ADR (a) | | 32,400 | 6,104,160 |
| Biogen, Inc. (a) | | 268,700 | 71,890,685 |
| Biohaven Pharmaceutical Holding Co. Ltd. (a) | | 15,900 | 1,162,449 |
| bluebird bio, Inc. (a) | | 36,900 | 2,252,376 |
| CSL Ltd. | | 1,400 | 277,282 |
| Galapagos Genomics NV sponsored ADR (a) | | 6,423 | 1,267,194 |
| Genmab A/S (a) | | 8,500 | 2,845,081 |
| Gilead Sciences, Inc. | | 306,800 | 23,605,192 |
| Global Blood Therapeutics, Inc. (a) | | 74,539 | 4,705,647 |
| Idorsia Ltd. (a) | | 358,109 | 11,452,533 |
| Immunomedics, Inc. (a) | | 34,700 | 1,229,768 |
| Innovent Biologics, Inc. (a)(c) | | 1,516,500 | 11,250,726 |
| Mirati Therapeutics, Inc. (a) | | 29,200 | 3,333,764 |
| Morphosys AG (a) | | 17,700 | 2,236,175 |
| Neurocrine Biosciences, Inc. (a) | | 18,000 | 2,196,000 |
| Passage Bio, Inc. (a) | | 22,800 | 623,124 |
| Regeneron Pharmaceuticals, Inc. (a) | | 391,725 | 244,299,296 |
| Repare Therapeutics, Inc. | | 19,700 | 611,094 |
| Sarepta Therapeutics, Inc. (a) | | 42,100 | 6,750,314 |
| Seattle Genetics, Inc. (a) | | 72,852 | 12,379,012 |
| Turning Point Therapeutics, Inc. (a) | | 48,047 | 3,103,356 |
| Vertex Pharmaceuticals, Inc. (a) | | 815,685 | 236,801,512 |
| Zai Lab Ltd. ADR (a) | | 62,869 | 5,163,431 |
| | | | 841,602,100 |
| Health Care Equipment & Supplies - 4.7% | | | |
| Abbott Laboratories | | 894,671 | 81,799,770 |
| Baxter International, Inc. | | 1,129,368 | 97,238,585 |
| Danaher Corp. | | 1,328,163 | 234,859,063 |
| DexCom, Inc. (a) | | 360,842 | 146,285,347 |
| Edwards Lifesciences Corp. (a) | | 1,245,228 | 86,057,707 |
| Inari Medical, Inc. | | 16,100 | 779,884 |
| Intuitive Surgical, Inc. (a) | | 197,720 | 112,666,788 |
| Masimo Corp. (a) | | 90,292 | 20,585,673 |
| Quidel Corp. (a) | | 7,900 | 1,767,546 |
| ResMed, Inc. | | 376,690 | 72,324,480 |
| Sonova Holding AG Class B | | 15,905 | 3,175,292 |
| Stryker Corp. | | 29,957 | 5,397,952 |
| West Pharmaceutical Services, Inc. | | 53,600 | 12,176,312 |
| | | | 875,114,399 |
| Health Care Providers & Services - 3.9% | | | |
| Centene Corp. (a) | | 782,700 | 49,740,585 |
| Cigna Corp. | | 473,547 | 88,861,095 |
| Henry Schein, Inc. (a) | | 17,200 | 1,004,308 |
| Humana, Inc. | | 54,000 | 20,938,500 |
| Patterson Companies, Inc. | | 39,506 | 869,132 |
| UnitedHealth Group, Inc. | | 1,923,940 | 567,466,103 |
| | | | 728,879,723 |
| Health Care Technology - 0.1% | | | |
| Veeva Systems, Inc. Class A (a) | | 104,468 | 24,489,389 |
| Life Sciences Tools & Services - 1.0% | | | |
| 10X Genomics, Inc. (a) | | 20,671 | 1,846,127 |
| Bio-Rad Laboratories, Inc. Class A (a) | | 31,640 | 14,285,144 |
| Charles River Laboratories International, Inc. (a) | | 6,000 | 1,046,100 |
| Eurofins Scientific SA | | 11,823 | 7,419,962 |
| Lonza Group AG | | 2,119 | 1,122,429 |
| Mettler-Toledo International, Inc. (a) | | 9,300 | 7,491,615 |
| Thermo Fisher Scientific, Inc. | | 402,268 | 145,757,787 |
| | | | 178,969,164 |
| Pharmaceuticals - 2.5% | | | |
| AstraZeneca PLC sponsored ADR | | 1,330,617 | 70,376,333 |
| Bristol-Myers Squibb Co. | | 745,447 | 43,832,284 |
| Bristol-Myers Squibb Co. rights (a) | | 526,000 | 1,883,080 |
| Eli Lilly & Co. | | 911,234 | 149,606,398 |
| Hansoh Pharmaceutical Group Co. Ltd. (c) | | 1,802,000 | 8,486,291 |
| Horizon Therapeutics PLC(a) | | 89,400 | 4,968,852 |
| Johnson & Johnson | | 49,300 | 6,933,059 |
| Merck & Co., Inc. | | 474,615 | 36,701,978 |
| MyoKardia, Inc. (a) | | 18,600 | 1,797,132 |
| Roche Holding AG (participation certificate) | | 125,000 | 43,306,192 |
| Royalty Pharma PLC | | 311,900 | 15,142,745 |
| Teva Pharmaceutical Industries Ltd. sponsored ADR (a) | | 456,700 | 5,631,111 |
| UCB SA | | 9,600 | 1,111,995 |
| Zoetis, Inc. Class A | | 503,696 | 69,026,500 |
| | | | 458,803,950 |
|
| TOTAL HEALTH CARE | | | 3,107,858,725 |
|
| INDUSTRIALS - 3.2% | | | |
| Aerospace & Defense - 0.7% | | | |
| Harris Corp. | | 232,105 | 39,381,255 |
| Huntington Ingalls Industries, Inc. | | 96,500 | 16,838,285 |
| Lockheed Martin Corp. | | 46,800 | 17,078,256 |
| Northrop Grumman Corp. | | 183,551 | 56,430,919 |
| TransDigm Group, Inc. | | 11,300 | 4,995,165 |
| | | | 134,723,880 |
| Air Freight & Logistics - 0.1% | | | |
| C.H. Robinson Worldwide, Inc. | | 77,406 | 6,119,718 |
| United Parcel Service, Inc. Class B | | 41,100 | 4,569,498 |
| | | | 10,689,216 |
| Airlines - 0.2% | | | |
| Ryanair Holdings PLC sponsored ADR (a) | | 18,500 | 1,227,290 |
| Southwest Airlines Co. | | 1,010,000 | 34,521,800 |
| | | | 35,749,090 |
| Building Products - 0.2% | | | |
| Fortune Brands Home & Security, Inc. | | 206,800 | 13,220,724 |
| The AZEK Co., Inc. | | 58,300 | 1,857,438 |
| Toto Ltd. | | 595,300 | 22,888,350 |
| | | | 37,966,512 |
| Commercial Services & Supplies - 0.1% | | | |
| Cintas Corp. | | 49,180 | 13,099,585 |
| Clean TeQ Holdings Ltd. (a) | | 51,800 | 5,005 |
| Copart, Inc. (a) | | 134,600 | 11,208,142 |
| | | | 24,312,732 |
| Electrical Equipment - 0.4% | | | |
| AMETEK, Inc. | | 155,000 | 13,852,350 |
| Rockwell Automation, Inc. | | 155,400 | 33,100,200 |
| Vestas Wind Systems A/S | | 280,052 | 28,678,111 |
| | | | 75,630,661 |
| Industrial Conglomerates - 0.3% | | | |
| General Electric Co. | | 1,000,821 | 6,835,607 |
| Roper Technologies, Inc. | | 123,700 | 48,027,762 |
| | | | 54,863,369 |
| Machinery - 0.4% | | | |
| Fortive Corp. | | 265,006 | 17,930,306 |
| Nordson Corp. | | 108,300 | 20,545,593 |
| Otis Worldwide Corp. | | 627,600 | 35,685,336 |
| | | | 74,161,235 |
| Professional Services - 0.6% | | | |
| Clarivate Analytics PLC (a) | | 991,345 | 22,136,734 |
| CoStar Group, Inc. (a) | | 23,616 | 16,783,183 |
| Experian PLC | | 299,447 | 10,510,247 |
| FTI Consulting, Inc. (a) | | 349,070 | 39,985,969 |
| Verisk Analytics, Inc. | | 81,000 | 13,786,200 |
| | | | 103,202,333 |
| Road & Rail - 0.2% | | | |
| Canadian Pacific Railway Ltd. | | 38,800 | 9,869,193 |
| Old Dominion Freight Lines, Inc. | | 100,700 | 17,077,713 |
| Union Pacific Corp. | | 87,072 | 14,721,263 |
| | | | 41,668,169 |
| Trading Companies & Distributors - 0.0% | | | |
| Fastenal Co. | | 26,500 | 1,135,260 |
|
| TOTAL INDUSTRIALS | | | 594,102,457 |
|
| INFORMATION TECHNOLOGY - 36.5% | | | |
| Electronic Equipment & Components - 1.1% | | | |
| Amphenol Corp. Class A | | 1,214,498 | 116,361,053 |
| CDW Corp. | | 82,450 | 9,579,041 |
| IPG Photonics Corp. (a) | | 24,400 | 3,913,516 |
| Keysight Technologies, Inc. (a) | | 477,456 | 48,118,016 |
| Samsung SDI Co. Ltd. | | 7,400 | 2,268,331 |
| Zebra Technologies Corp. Class A (a) | | 85,130 | 21,789,024 |
| | | | 202,028,981 |
| IT Services - 8.6% | | | |
| Accenture PLC Class A | | 540,397 | 116,034,044 |
| Adyen BV (a)(c) | | 31,717 | 46,163,911 |
| Black Knight, Inc. (a) | | 100,000 | 7,256,000 |
| Booz Allen Hamilton Holding Corp. Class A | | 405,000 | 31,504,950 |
| CACI International, Inc. Class A (a) | | 96,088 | 20,839,565 |
| Edenred SA (b) | | 20,533 | 898,069 |
| EPAM Systems, Inc. (a) | | 75,396 | 19,000,546 |
| Fidelity National Information Services, Inc. | | 370,567 | 49,689,329 |
| Global Payments, Inc. | | 328,078 | 55,648,590 |
| Jack Henry & Associates, Inc. | | 5,700 | 1,048,971 |
| MasterCard, Inc. Class A | | 1,161,740 | 343,526,518 |
| MongoDB, Inc. Class A (a)(b) | | 424,198 | 96,012,975 |
| Okta, Inc. (a) | | 1,432,073 | 286,743,977 |
| PayPal Holdings, Inc. (a) | | 928,044 | 161,693,106 |
| Repay Holdings Corp. (a) | | 198,900 | 4,898,907 |
| Square, Inc. (a) | | 70,100 | 7,356,294 |
| Twilio, Inc. Class A (a) | | 63,600 | 13,955,112 |
| VeriSign, Inc. (a) | | 48,100 | 9,948,523 |
| Visa, Inc. Class A | | 1,746,617 | 337,394,006 |
| | | | 1,609,613,393 |
| Semiconductors & Semiconductor Equipment - 4.0% | | | |
| Advanced Micro Devices, Inc. (a) | | 1,214,439 | 63,891,636 |
| Analog Devices, Inc. | | 73,039 | 8,957,503 |
| Applied Materials, Inc. | | 57,447 | 3,472,671 |
| ASML Holding NV | | 162,999 | 59,988,522 |
| Broadcom, Inc. | | 3,300 | 1,041,513 |
| Enphase Energy, Inc. (a) | | 368,220 | 17,516,225 |
| Inphi Corp. (a) | | 21,000 | 2,467,500 |
| Intel Corp. | | 394,400 | 23,596,952 |
| KLA-Tencor Corp. | | 238,836 | 46,448,825 |
| Lam Research Corp. | | 340,251 | 110,057,588 |
| Lattice Semiconductor Corp. (a) | | 81,500 | 2,313,785 |
| Marvell Technology Group Ltd. | | 32,200 | 1,128,932 |
| Micron Technology, Inc. (a) | | 82,700 | 4,260,704 |
| Monolithic Power Systems, Inc. | | 5,000 | 1,185,000 |
| NVIDIA Corp. | | 500,260 | 190,053,777 |
| NXP Semiconductors NV | | 159,058 | 18,138,974 |
| Qorvo, Inc. (a) | | 30,800 | 3,404,324 |
| Qualcomm, Inc. | | 1,333,310 | 121,611,205 |
| SiTime Corp. | | 17,700 | 839,157 |
| Skyworks Solutions, Inc. | | 140,800 | 18,002,688 |
| SolarEdge Technologies, Inc. (a) | | 106,853 | 14,829,059 |
| Synaptics, Inc. (a) | | 225,674 | 13,567,521 |
| Taiwan Semiconductor Manufacturing Co. Ltd. sponsored ADR | | 76,600 | 4,348,582 |
| Texas Instruments, Inc. | | 151,500 | 19,235,955 |
| | | | 750,358,598 |
| Software - 18.4% | | | |
| Adobe, Inc. (a) | | 1,001,153 | 435,811,912 |
| Agora, Inc. ADR (a) | | 16,300 | 719,971 |
| Alteryx, Inc. Class A (a)(b) | | 1,600 | 262,848 |
| ANSYS, Inc. (a) | | 66,600 | 19,429,218 |
| Atlassian Corp. PLC (a) | | 859,075 | 154,865,450 |
| Cadence Design Systems, Inc. (a) | | 250,800 | 24,066,768 |
| Ceridian HCM Holding, Inc. (a) | | 42,400 | 3,361,048 |
| Citrix Systems, Inc. | | 63,200 | 9,347,912 |
| Coupa Software, Inc. (a) | | 521,510 | 144,479,130 |
| Crowdstrike Holdings, Inc. | | 13,800 | 1,384,002 |
| Datadog, Inc. Class A (a) | | 124,306 | 10,808,407 |
| DocuSign, Inc. (a) | | 16,429 | 2,829,238 |
| Dropbox, Inc. Class A (a) | | 449,731 | 9,790,644 |
| Dynatrace, Inc. | | 393,566 | 15,978,780 |
| Everbridge, Inc. (a) | | 50,600 | 7,001,016 |
| Fortinet, Inc. (a) | | 510,400 | 70,062,608 |
| Intuit, Inc. | | 232,532 | 68,873,653 |
| Microsoft Corp. | | 7,864,800 | 1,600,565,449 |
| Netcompany Group A/S (a)(c) | | 2,256 | 147,962 |
| Pagerduty, Inc. (a)(b) | | 49,569 | 1,418,665 |
| Palo Alto Networks, Inc. (a) | | 9,000 | 2,067,030 |
| Paycom Software, Inc. (a) | | 4,100 | 1,269,893 |
| RingCentral, Inc. (a) | | 250,162 | 71,298,672 |
| Salesforce.com, Inc. (a) | | 3,503,238 | 656,261,575 |
| ServiceNow, Inc. (a) | | 153,600 | 62,217,216 |
| Slack Technologies, Inc. Class A (a)(b) | | 630,400 | 19,599,136 |
| Snowflake Computing, Inc. Class B (d)(e) | | 13,478 | 522,542 |
| Synopsys, Inc. (a) | | 51,000 | 9,945,000 |
| Workday, Inc. Class A (a) | | 46,301 | 8,674,955 |
| Xero Ltd. (a) | | 38,300 | 2,381,682 |
| Zoom Video Communications, Inc. Class A (a) | | 20,562 | 5,213,289 |
| Zscaler, Inc. (a) | | 20,000 | 2,190,000 |
| | | | 3,422,845,671 |
| Technology Hardware, Storage & Peripherals - 4.4% | | | |
| Apple, Inc. | | 2,238,100 | 816,458,880 |
| Samsung Electronics Co. Ltd. | | 126,400 | 5,609,513 |
| | | | 822,068,393 |
|
| TOTAL INFORMATION TECHNOLOGY | | | 6,806,915,036 |
|
| MATERIALS - 1.8% | | | |
| Chemicals - 0.6% | | | |
| Air Products & Chemicals, Inc. | | 43,171 | 10,424,070 |
| FMC Corp. | | 10,000 | 996,200 |
| Sherwin-Williams Co. | | 166,279 | 96,084,320 |
| | | | 107,504,590 |
| Containers & Packaging - 0.0% | | | |
| Silgan Holdings, Inc. | | 20,100 | 651,039 |
| Metals & Mining - 1.2% | | | |
| Agnico Eagle Mines Ltd. (Canada) | | 16,200 | 1,037,320 |
| Barrick Gold Corp. | | 193,999 | 5,226,333 |
| Barrick Gold Corp. (Canada) | | 2,364,509 | 63,623,684 |
| Franco-Nevada Corp. | | 748,100 | 104,505,867 |
| Kirkland Lake Gold Ltd. | | 581,764 | 23,954,484 |
| Lundin Gold, Inc. (a) | | 360,100 | 3,379,253 |
| Newcrest Mining Ltd. | | 131,231 | 2,909,926 |
| Newmont Corp. | | 346,000 | 21,362,040 |
| Northern Star Resources Ltd. | | 123,700 | 1,140,481 |
| | | | 227,139,388 |
|
| TOTAL MATERIALS | | | 335,295,017 |
|
| REAL ESTATE - 1.5% | | | |
| Equity Real Estate Investment Trusts (REITs) - 1.5% | | | |
| Alexandria Real Estate Equities, Inc. | | 14,000 | 2,271,500 |
| American Tower Corp. | | 681,138 | 176,101,419 |
| Digital Realty Trust, Inc. | | 144,800 | 20,577,528 |
| Equity Commonwealth | | 121,500 | 3,912,300 |
| Equity Residential (SBI) | | 169,756 | 9,985,048 |
| Prologis, Inc. | | 125,336 | 11,697,609 |
| SBA Communications Corp. Class A | | 161,100 | 47,994,912 |
| | | | 272,540,316 |
| UTILITIES - 0.7% | | | |
| Electric Utilities - 0.7% | | | |
| NextEra Energy, Inc. | | 450,397 | 108,171,847 |
| PG&E Corp. (a) | | 1,642,200 | 14,566,314 |
| | | | 122,738,161 |
| TOTAL COMMON STOCKS | | | |
| (Cost $10,738,687,281) | | | 18,140,914,443 |
|
| Convertible Preferred Stocks - 0.0% | | | |
| CONSUMER DISCRETIONARY - 0.0% | | | |
| Internet & Direct Marketing Retail - 0.0% | | | |
| Doordash, Inc. Series H (d)(e) | | 17,715 | 4,066,142 |
| Textiles, Apparel & Luxury Goods - 0.0% | | | |
| Allbirds, Inc.: | | | |
| Series A (a)(d)(e) | | 51,640 | 532,408 |
| Series B (a)(d)(e) | | 9,070 | 93,512 |
| Series C (a)(d)(e) | | 86,705 | 893,929 |
| Series Seed (a)(d)(e) | | 27,745 | 286,051 |
| | | | 1,805,900 |
| TOTAL CONVERTIBLE PREFERRED STOCKS | | | |
| (Cost $5,987,150) | | | 5,872,042 |
|
| Money Market Funds - 2.9% | | | |
| Fidelity Cash Central Fund 0.12% (f) | | 488,505,454 | 488,603,155 |
| Fidelity Securities Lending Cash Central Fund 0.12% (f)(g) | | 58,192,745 | 58,198,564 |
| TOTAL MONEY MARKET FUNDS | | | |
| (Cost $546,796,811) | | | 546,801,719 |
| TOTAL INVESTMENT IN SECURITIES - 100.3% | | | |
| (Cost $11,291,471,242) | | | 18,693,588,204 |
| NET OTHER ASSETS (LIABILITIES) - (0.3)% | | | (63,561,653) |
| NET ASSETS - 100% | | | $18,630,026,551 |
Legend
(a) Non-income producing
(b) Security or a portion of the security is on loan at period end.
(c) Security exempt from registration under Rule 144A of the Securities Act of 1933. These securities may be resold in transactions exempt from registration, normally to qualified institutional buyers. At the end of the period, the value of these securities amounted to $73,716,922 or 0.4% of net assets.
(d) Restricted securities (including private placements) - Investment in securities not registered under the Securities Act of 1933 (excluding 144A issues). At the end of the period, the value of restricted securities (excluding 144A issues) amounted to $9,460,257 or 0.1% of net assets.
(e) Level 3 security
(f) Affiliated fund that is generally available only to investment companies and other accounts managed by Fidelity Investments. The rate quoted is the annualized seven-day yield of the fund at period end. A complete unaudited listing of the fund's holdings as of its most recent quarter end is available upon request. In addition, each Fidelity Central Fund's financial statements are available on the SEC's website or upon request.
(g) Investment made with cash collateral received from securities on loan.
Additional information on each restricted holding is as follows:
| Security | Acquisition Date | Acquisition Cost |
| Allbirds, Inc. | 10/9/18 | $1,434,943 |
| Allbirds, Inc. Series A | 10/9/18 | $566,344 |
| Allbirds, Inc. Series B | 10/9/18 | $99,472 |
| Allbirds, Inc. Series C | 10/9/18 | $950,908 |
| Allbirds, Inc. Series Seed | 10/9/18 | $304,284 |
| Coupang unit | 6/12/20 | $1,716,713 |
| Doordash, Inc. Series H | 6/17/20 | $4,066,142 |
| Snowflake Computing, Inc. Class B | 3/19/20 | $522,765 |
Affiliated Central Funds
Information regarding fiscal year to date income earned by the Fund from investments in Fidelity Central Funds is as follows:
| Fund | Income earned |
| Fidelity Cash Central Fund | $1,009,269 |
| Fidelity Securities Lending Cash Central Fund | 114,482 |
| Total | $1,123,751 |
Amounts in the income column in the above table include any capital gain distributions from underlying funds, which are presented in the corresponding line-item in the Statement of Operations, if applicable. Amount for Fidelity Securities Lending Cash Central Fund represents the income earned on investing cash collateral, less rebates paid to borrowers and any lending agent fees associated with the loan, plus any premium payments received for lending certain types of securities.
Investment Valuation
The following is a summary of the inputs used, as of June 30, 2020, involving the Fund's assets and liabilities carried at fair value. The inputs or methodology used for valuing securities may not be an indication of the risk associated with investing in those securities. For more information on valuation inputs, and their aggregation into the levels used below, please refer to the Investment Valuation section in the accompanying Notes to Financial Statements.
| | Valuation Inputs at Reporting Date: |
| Description | Total | Level 1 | Level 2 | Level 3 |
| Investments in Securities: | | | | |
| Equities: | | | | |
| Communication Services | $2,577,096,431 | $2,568,795,477 | $8,300,954 | $-- |
| Consumer Discretionary | 2,201,425,866 | 2,135,925,121 | 56,563,030 | 8,937,715 |
| Consumer Staples | 791,818,231 | 786,847,931 | 4,970,300 | -- |
| Energy | 82,167,022 | 82,167,022 | -- | -- |
| Financials | 1,254,829,223 | 1,254,829,223 | -- | -- |
| Health Care | 3,107,858,725 | 3,063,430,104 | 44,428,621 | -- |
| Industrials | 594,102,457 | 532,025,749 | 62,076,708 | -- |
| Information Technology | 6,806,915,036 | 6,798,514,650 | 7,877,844 | 522,542 |
| Materials | 335,295,017 | 332,385,091 | 2,909,926 | -- |
| Real Estate | 272,540,316 | 272,540,316 | -- | -- |
| Utilities | 122,738,161 | 122,738,161 | -- | -- |
| Money Market Funds | 546,801,719 | 546,801,719 | -- | -- |
| Total Investments in Securities: | $18,693,588,204 | $18,497,000,564 | $187,127,383 | $9,460,257 |
See accompanying notes which are an integral part of the financial statements.
Financial Statements
Statement of Assets and Liabilities
| | | June 30, 2020 (Unaudited) |
| Assets | | |
Investment in securities, at value (including securities loaned of $58,123,199) — See accompanying schedule:
Unaffiliated issuers (cost $10,744,674,431) | $18,146,786,485 | |
| Fidelity Central Funds (cost $546,796,811) | 546,801,719 | |
| Total Investment in Securities (cost $11,291,471,242) | | $18,693,588,204 |
| Foreign currency held at value (cost $57,314) | | 57,307 |
| Receivable for investments sold | | 24,791,896 |
| Receivable for fund shares sold | | 17,690,762 |
| Dividends receivable | | 5,592,436 |
| Distributions receivable from Fidelity Central Funds | | 94,511 |
| Other receivables | | 1,256,410 |
| Total assets | | 18,743,071,526 |
| Liabilities | | |
| Payable to custodian bank | $462,842 | |
| Payable for investments purchased | 19,890,973 | |
| Payable for fund shares redeemed | 19,614,361 | |
| Accrued management fee | 8,158,491 | |
| Distribution and service plan fees payable | 1,656,025 | |
| Other affiliated payables | 1,232,601 | |
| Other payables and accrued expenses | 3,835,781 | |
| Collateral on securities loaned | 58,193,901 | |
| Total liabilities | | 113,044,975 |
| Net Assets | | $18,630,026,551 |
| Net Assets consist of: | | |
| Paid in capital | | $11,051,075,943 |
| Total accumulated earnings (loss) | | 7,578,950,608 |
| Net Assets | | $18,630,026,551 |
| Net Asset Value and Maximum Offering Price | | |
| Initial Class: | | |
| Net Asset Value, offering price and redemption price per share ($7,867,467,259 ÷ 194,804,887 shares) | | $40.39 |
| Service Class: | | |
| Net Asset Value, offering price and redemption price per share ($1,528,175,242 ÷ 38,065,595 shares) | | $40.15 |
| Service Class 2: | | |
| Net Asset Value, offering price and redemption price per share ($7,426,807,300 ÷ 189,544,318 shares) | | $39.18 |
| Investor Class: | | |
| Net Asset Value, offering price and redemption price per share ($1,807,576,750 ÷ 45,083,093 shares) | | $40.09 |
See accompanying notes which are an integral part of the financial statements.
Statement of Operations
| | | Six months ended June 30, 2020 (Unaudited) |
| Investment Income | | |
| Dividends | | $74,097,218 |
| Income from Fidelity Central Funds (including $114,482 from security lending) | | 1,123,751 |
| Total income | | 75,220,969 |
| Expenses | | |
| Management fee | $46,608,478 | |
| Transfer agent fees | 6,164,614 | |
| Distribution and service plan fees | 10,072,849 | |
| Accounting fees | 796,844 | |
| Custodian fees and expenses | 131,090 | |
| Independent trustees' fees and expenses | 54,936 | |
| Audit | 44,268 | |
| Legal | 27,647 | |
| Miscellaneous | 638,015 | |
| Total expenses before reductions | 64,538,741 | |
| Expense reductions | (359,790) | |
| Total expenses after reductions | | 64,178,951 |
| Net investment income (loss) | | 11,042,018 |
| Realized and Unrealized Gain (Loss) | | |
| Net realized gain (loss) on: | | |
| Investment securities: | | |
| Unaffiliated issuers (net of foreign taxes of $725,682) | 193,083,190 | |
| Fidelity Central Funds | (10,401) | |
| Foreign currency transactions | (234,212) | |
| Total net realized gain (loss) | | 192,838,577 |
| Change in net unrealized appreciation (depreciation) on: | | |
| Investment securities: | | |
| Unaffiliated issuers (net of decrease in deferred foreign taxes of $1,472,231) | 1,334,388,014 | |
| Assets and liabilities in foreign currencies | 21,412 | |
| Total change in net unrealized appreciation (depreciation) | | 1,334,409,426 |
| Net gain (loss) | | 1,527,248,003 |
| Net increase (decrease) in net assets resulting from operations | | $1,538,290,021 |
See accompanying notes which are an integral part of the financial statements.
Statement of Changes in Net Assets
| | Six months ended June 30, 2020 (Unaudited) | Year ended December 31, 2019 |
| Increase (Decrease) in Net Assets | | |
| Operations | | |
| Net investment income (loss) | $11,042,018 | $63,308,078 |
| Net realized gain (loss) | 192,838,577 | 245,013,168 |
| Change in net unrealized appreciation (depreciation) | 1,334,409,426 | 4,446,153,621 |
| Net increase (decrease) in net assets resulting from operations | 1,538,290,021 | 4,754,474,867 |
| Distributions to shareholders | (107,569,486) | (2,102,317,791) |
| Share transactions - net increase (decrease) | (968,059,942) | (432,541,997) |
| Total increase (decrease) in net assets | 462,660,593 | 2,219,615,079 |
| Net Assets | | |
| Beginning of period | 18,167,365,958 | 15,947,750,879 |
| End of period | $18,630,026,551 | $18,167,365,958 |
See accompanying notes which are an integral part of the financial statements.
Financial Highlights
VIP Contrafund Portfolio Initial Class
| | Six months ended (Unaudited) June 30, | Years endedDecember 31, | | | | |
| | 2020 | 2019 | 2018 | 2017 | 2016 | 2015 |
| Selected Per–Share Data | | | | | | |
| Net asset value, beginning of period | $37.17 | $32.13 | $37.94 | $33.18 | $33.91 | $37.36 |
| Income from Investment Operations | | | | | | |
| Net investment income (loss)A | .05 | .16 | .23 | .35 | .33 | .35 |
| Net realized and unrealized gain (loss) | 3.40 | 9.15 | (2.50) | 6.69 | 1.85 | (.14) |
| Total from investment operations | 3.45 | 9.31 | (2.27) | 7.04 | 2.18 | .21 |
| Distributions from net investment income | (.04) | (.16) | (.26) | (.36) | (.26) | (.37) |
| Distributions from net realized gain | (.18) | (4.11) | (3.28) | (1.91) | (2.65) | (3.30) |
| Total distributions | (.23)B | (4.27) | (3.54) | (2.28)C | (2.91) | (3.66)D |
| Net asset value, end of period | $40.39 | $37.17 | $32.13 | $37.94 | $33.18 | $33.91 |
| Total ReturnE,F,G | 9.29% | 31.58% | (6.38)% | 21.88% | 8.04% | .64% |
| Ratios to Average Net AssetsH,I | | | | | | |
| Expenses before reductions | .62%J | .61% | .62% | .62% | .63% | .63% |
| Expenses net of fee waivers, if any | .62%J | .61% | .62% | .62% | .63% | .63% |
| Expenses net of all reductions | .61%J | .61% | .61% | .62% | .62% | .62% |
| Net investment income (loss) | .25%J | .48% | .64% | .98% | 1.04% | 1.01% |
| Supplemental Data | | | | | | |
| Net assets, end of period (000 omitted) | $7,867,467 | $6,919,369 | $6,240,295 | $7,609,925 | $6,962,430 | $7,436,130 |
| Portfolio turnover rateK | 42%J | 37%L | 111%L | 70% | 62% | 80% |
A Calculated based on average shares outstanding during the period.
B Total distributions of $.23 per share is comprised of distributions from net investment income of $.044 and distributions from net realized gain of $.183 per share.
C Total distributions of $2.28 per share is comprised of distributions from net investment income of $.364 and distributions from net realized gain of $1.911 per share.
D Total distributions of $3.66 per share is comprised of distributions from net investment income of $.369 and distributions from net realized gain of $3.295 per share.
E Total returns for periods of less than one year are not annualized.
F Total returns do not reflect charges attributable to your insurance company's separate account. Inclusion of these charges would reduce the total returns shown.
G Total returns would have been lower if certain expenses had not been reduced during the applicable periods shown.
H Fees and expenses of any underlying Fidelity Central Funds are not included in the Fund's expense ratio. The Fund indirectly bears its proportionate share of the expenses of any underlying Fidelity Central Funds.
I Expense ratios reflect operating expenses of the class. Expenses before reductions do not reflect amounts reimbursed by the investment adviser or reductions from brokerage service arrangements or reductions from other expense offset arrangements and do not represent the amount paid by the class during periods when reimbursements or reductions occur. Expenses net of fee waivers reflect expenses after reimbursement by the investment adviser but prior to reductions from brokerage service arrangements or other expense offset arrangements. Expenses net of all reductions represent the net expenses paid by the class.
J Annualized
K Amount does not include the portfolio activity of any underlying Fidelity Central Funds.
L Portfolio turnover rate excludes securities received or delivered in-kind.
See accompanying notes which are an integral part of the financial statements.
VIP Contrafund Portfolio Service Class
| | Six months ended (Unaudited) June 30, | Years endedDecember 31, | | | | |
| | 2020 | 2019 | 2018 | 2017 | 2016 | 2015 |
| Selected Per–Share Data | | | | | | |
| Net asset value, beginning of period | $36.96 | $31.97 | $37.77 | $33.04 | $33.79 | $37.23 |
| Income from Investment Operations | | | | | | |
| Net investment income (loss)A | .03 | .13 | .19 | .31 | .29 | .32 |
| Net realized and unrealized gain (loss) | 3.38 | 9.10 | (2.48) | 6.66 | 1.84 | (.13) |
| Total from investment operations | 3.41 | 9.23 | (2.29) | 6.97 | 2.13 | .19 |
| Distributions from net investment income | (.04) | (.13) | (.22) | (.33) | (.23) | (.33) |
| Distributions from net realized gain | (.18) | (4.11) | (3.28) | (1.91) | (2.65) | (3.30) |
| Total distributions | (.22) | (4.24) | (3.51)B | (2.24) | (2.88) | (3.63) |
| Net asset value, end of period | $40.15 | $36.96 | $31.97 | $37.77 | $33.04 | $33.79 |
| Total ReturnC,D,E | 9.25% | 31.45% | (6.49)% | 21.76% | 7.91% | .56% |
| Ratios to Average Net AssetsF,G | | | | | | |
| Expenses before reductions | .72%H | .71% | .72% | .72% | .73% | .73% |
| Expenses net of fee waivers, if any | .72%H | .71% | .72% | .72% | .73% | .73% |
| Expenses net of all reductions | .71%H | .71% | .71% | .72% | .72% | .72% |
| Net investment income (loss) | .15%H | .38% | .54% | .88% | .94% | .91% |
| Supplemental Data | | | | | | |
| Net assets, end of period (000 omitted) | $1,528,175 | $1,493,164 | $1,324,859 | $1,569,798 | $1,428,793 | $1,546,864 |
| Portfolio turnover rateI | 42%H | 37%J | 111%J | 70% | 62% | 80% |
A Calculated based on average shares outstanding during the period.
B Total distributions of $3.51 per share is comprised of distributions from net investment income of $.223 and distributions from net realized gain of $3.282 per share.
C Total returns for periods of less than one year are not annualized.
D Total returns do not reflect charges attributable to your insurance company's separate account. Inclusion of these charges would reduce the total returns shown.
E Total returns would have been lower if certain expenses had not been reduced during the applicable periods shown.
F Fees and expenses of any underlying Fidelity Central Funds are not included in the Fund's expense ratio. The Fund indirectly bears its proportionate share of the expenses of any underlying Fidelity Central Funds.
G Expense ratios reflect operating expenses of the class. Expenses before reductions do not reflect amounts reimbursed by the investment adviser or reductions from brokerage service arrangements or reductions from other expense offset arrangements and do not represent the amount paid by the class during periods when reimbursements or reductions occur. Expenses net of fee waivers reflect expenses after reimbursement by the investment adviser but prior to reductions from brokerage service arrangements or other expense offset arrangements. Expenses net of all reductions represent the net expenses paid by the class.
H Annualized
I Amount does not include the portfolio activity of any underlying Fidelity Central Funds.
J Portfolio turnover rate excludes securities received or delivered in-kind.
See accompanying notes which are an integral part of the financial statements.
VIP Contrafund Portfolio Service Class 2
| | Six months ended (Unaudited) June 30, | Years endedDecember 31, | | | | |
| | 2020 | 2019 | 2018 | 2017 | 2016 | 2015 |
| Selected Per–Share Data | | | | | | |
| Net asset value, beginning of period | $36.10 | $31.31 | $37.05 | $32.45 | $33.25 | $36.70 |
| Income from Investment Operations | | | | | | |
| Net investment income (loss)A | –B | .08 | .14 | .25 | .24 | .26 |
| Net realized and unrealized gain (loss) | 3.29 | 8.89 | (2.44) | 6.54 | 1.80 | (.14) |
| Total from investment operations | 3.29 | 8.97 | (2.30) | 6.79 | 2.04 | .12 |
| Distributions from net investment income | (.03) | (.07) | (.16) | (.28) | (.20) | (.28) |
| Distributions from net realized gain | (.18) | (4.11) | (3.28) | (1.91) | (2.65) | (3.30) |
| Total distributions | (.21) | (4.18) | (3.44) | (2.19) | (2.84)C | (3.57)D |
| Net asset value, end of period | $39.18 | $36.10 | $31.31 | $37.05 | $32.45 | $33.25 |
| Total ReturnE,F,G | 9.14% | 31.27% | (6.64)% | 21.59% | 7.76% | .39% |
| Ratios to Average Net AssetsH,I | | | | | | |
| Expenses before reductions | .87%J | .86% | .87% | .87% | .88% | .88% |
| Expenses net of fee waivers, if any | .87%J | .86% | .87% | .87% | .88% | .88% |
| Expenses net of all reductions | .86%J | .86% | .86% | .87% | .87% | .87% |
| Net investment income (loss) | - %J,K | .23% | .39% | .73% | .79% | .76% |
| Supplemental Data | | | | | | |
| Net assets, end of period (000 omitted) | $7,426,807 | $8,038,646 | $6,979,731 | $9,255,124 | $8,138,206 | $8,363,076 |
| Portfolio turnover rateL | 42%J | 37%M | 111%M | 70% | 62% | 80% |
A Calculated based on average shares outstanding during the period.
B Amount represents less than $.005 per share.
C Total distributions of $2.84 per share is comprised of distributions from net investment income of $.196 and distributions from net realized gain of $2.648 per share.
D Total distributions of $3.57 per share is comprised of distributions from net investment income of $.279 and distributions from net realized gain of $3.295 per share.
E Total returns for periods of less than one year are not annualized.
F Total returns do not reflect charges attributable to your insurance company's separate account. Inclusion of these charges would reduce the total returns shown.
G Total returns would have been lower if certain expenses had not been reduced during the applicable periods shown.
H Fees and expenses of any underlying Fidelity Central Funds are not included in the Fund's expense ratio. The Fund indirectly bears its proportionate share of the expenses of any underlying Fidelity Central Funds.
I Expense ratios reflect operating expenses of the class. Expenses before reductions do not reflect amounts reimbursed by the investment adviser or reductions from brokerage service arrangements or reductions from other expense offset arrangements and do not represent the amount paid by the class during periods when reimbursements or reductions occur. Expenses net of fee waivers reflect expenses after reimbursement by the investment adviser but prior to reductions from brokerage service arrangements or other expense offset arrangements. Expenses net of all reductions represent the net expenses paid by the class.
J Annualized
K Amount represents less than $.005%.
L Amount does not include the portfolio activity of any underlying Fidelity Central Funds.
M Portfolio turnover rate excludes securities received or delivered in-kind.
See accompanying notes which are an integral part of the financial statements.
VIP Contrafund Portfolio Investor Class
| | Six months ended (Unaudited) June 30, | Years endedDecember 31, | | | | |
| | 2020 | 2019 | 2018 | 2017 | 2016 | 2015 |
| Selected Per–Share Data | | | | | | |
| Net asset value, beginning of period | $36.91 | $31.93 | $37.74 | $33.01 | $33.76 | $37.21 |
| Income from Investment Operations | | | | | | |
| Net investment income (loss)A | .03 | .14 | .20 | .32 | .30 | .32 |
| Net realized and unrealized gain (loss) | 3.37 | 9.08 | (2.49) | 6.66 | 1.84 | (.13) |
| Total from investment operations | 3.40 | 9.22 | (2.29) | 6.98 | 2.14 | .19 |
| Distributions from net investment income | (.04) | (.14) | (.23) | (.34) | (.24) | (.34) |
| Distributions from net realized gain | (.18) | (4.11) | (3.28) | (1.91) | (2.65) | (3.30) |
| Total distributions | (.22) | (4.24)B | (3.52)C | (2.25) | (2.89) | (3.64) |
| Net asset value, end of period | $40.09 | $36.91 | $31.93 | $37.74 | $33.01 | $33.76 |
| Total ReturnD,E,F | 9.24% | 31.49% | (6.49)% | 21.81% | 7.95% | .56% |
| Ratios to Average Net AssetsG,H | | | | | | |
| Expenses before reductions | .69%I | .69% | .70% | .70% | .71% | .71% |
| Expenses net of fee waivers, if any | .69%I | .69% | .69% | .70% | .71% | .71% |
| Expenses net of all reductions | .69%I | .69% | .69% | .70% | .70% | .70% |
| Net investment income (loss) | .17%I | .40% | .56% | .90% | .95% | .93% |
| Supplemental Data | | | | | | |
| Net assets, end of period (000 omitted) | $1,807,577 | $1,716,187 | $1,402,867 | $1,553,670 | $1,327,708 | $1,276,807 |
| Portfolio turnover rateJ | 42%I | 37%K | 111%K | 70% | 62% | 80% |
A Calculated based on average shares outstanding during the period.
B Total distributions of $4.24 per share is comprised of distributions from net investment income of $.135 and distributions from net realized gain of $4.109 per share.
C Total distributions of $3.52 per share is comprised of distributions from net investment income of $.233 and distributions from net realized gain of $3.282 per share.
D Total returns for periods of less than one year are not annualized.
E Total returns do not reflect charges attributable to your insurance company's separate account. Inclusion of these charges would reduce the total returns shown.
F Total returns would have been lower if certain expenses had not been reduced during the applicable periods shown.
G Fees and expenses of any underlying Fidelity Central Funds are not included in the Fund's expense ratio. The Fund indirectly bears its proportionate share of the expenses of any underlying Fidelity Central Funds.
H Expense ratios reflect operating expenses of the class. Expenses before reductions do not reflect amounts reimbursed by the investment adviser or reductions from brokerage service arrangements or reductions from other expense offset arrangements and do not represent the amount paid by the class during periods when reimbursements or reductions occur. Expenses net of fee waivers reflect expenses after reimbursement by the investment adviser but prior to reductions from brokerage service arrangements or other expense offset arrangements. Expenses net of all reductions represent the net expenses paid by the class.
I Annualized
J Amount does not include the portfolio activity of any underlying Fidelity Central Funds.
K Portfolio turnover rate excludes securities received or delivered in-kind.
See accompanying notes which are an integral part of the financial statements.
Notes to Financial Statements (Unaudited)
For the period ended June 30, 2020
1. Organization.
VIP Contrafund Portfolio (the Fund) is a fund of Variable Insurance Products Fund II (the Trust) and is authorized to issue an unlimited number of shares. The Trust is registered under the Investment Company Act of 1940, as amended (the 1940 Act), as an open-end management investment company organized as a Massachusetts business trust. Shares of the Fund may only be purchased by insurance companies for the purpose of funding variable annuity or variable life insurance contracts. The Fund offers the following classes of shares: Initial Class shares, Service Class shares, Service Class 2 shares and Investor Class shares. All classes have equal rights and voting privileges, except for matters affecting a single class.
Effective January 1, 2020:
Investment advisers Fidelity Investments Money Management, Inc., FMR Co., Inc., and Fidelity SelectCo, LLC, merged with and into Fidelity Management & Research Company. In connection with the merger transactions, the resulting, merged investment adviser was then redomiciled from Massachusetts to Delaware, changed its corporate structure from a corporation to a limited liability company, and changed its name to "Fidelity Management & Research Company LLC".
Broker-dealer Fidelity Distributors Corporation merged with and into Fidelity Investments Institutional Services Company, Inc. ("FIISC"). FIISC was then redomiciled from Massachusetts to Delaware, changed its corporate structure from a corporation to a limited liability company, and changed its name to "Fidelity Distributors Company LLC".
Fidelity Investments Institutional Operations Company, Inc. converted from a Massachusetts corporation to a Massachusetts LLC, and changed its name to "Fidelity Investments Institutional Operations Company LLC".
2. Investments in Fidelity Central Funds.
The Fund invests in Fidelity Central Funds, which are open-end investment companies generally available only to other investment companies and accounts managed by the investment adviser and its affiliates. The Fund's Schedule of Investments lists each of the Fidelity Central Funds held as of period end, if any, as an investment of the Fund, but does not include the underlying holdings of each Fidelity Central Fund. As an Investing Fund, the Fund indirectly bears its proportionate share of the expenses of the underlying Fidelity Central Funds.
The Money Market Central Funds seek preservation of capital and current income and are managed by the investment adviser. Annualized expenses of the Money Market Central Funds as of their most recent shareholder report date ranged from less than .005% to .01%.
A complete unaudited list of holdings for each Fidelity Central Fund is available upon request or at the Securities and Exchange Commission (the SEC) website at www.sec.gov. In addition, the financial statements of the Fidelity Central Funds are available on the SEC website or upon request.
3. Significant Accounting Policies.
The Fund is an investment company and applies the accounting and reporting guidance of the Financial Accounting Standards Board (FASB) Accounting Standards Codification Topic 946 Financial Services – Investments Companies. The financial statements have been prepared in conformity with accounting principles generally accepted in the United States of America (GAAP), which require management to make certain estimates and assumptions at the date of the financial statements. Actual results could differ from those estimates. Subsequent events, if any, through the date that the financial statements were issued have been evaluated in the preparation of the financial statements. The following summarizes the significant accounting policies of the Fund:
Investment Valuation. Investments are valued as of 4:00 p.m. Eastern time on the last calendar day of the period. The Board of Trustees (the Board) has delegated the day to day responsibility for the valuation of the Fund's investments to the Fair Value Committee (the Committee) established by the Fund's investment adviser. In accordance with valuation policies and procedures approved by the Board, the Fund attempts to obtain prices from one or more third party pricing vendors or brokers to value its investments. When current market prices, quotations or currency exchange rates are not readily available or reliable, investments will be fair valued in good faith by the Committee, in accordance with procedures adopted by the Board. Factors used in determining fair value vary by investment type and may include market or investment specific events. The frequency with which these procedures are used cannot be predicted and they may be utilized to a significant extent. The Committee oversees the Fund's valuation policies and procedures and reports to the Board on the Committee's activities and fair value determinations. The Board monitors the appropriateness of the procedures used in valuing the Fund's investments and ratifies the fair value determinations of the Committee.
The Fund categorizes the inputs to valuation techniques used to value its investments into a disclosure hierarchy consisting of three levels as shown below:
- Level 1 – quoted prices in active markets for identical investments
- Level 2 – other significant observable inputs (including quoted prices for similar investments, interest rates, prepayment speeds, etc.)
- Level 3 – unobservable inputs (including the Fund's own assumptions based on the best information available)
Valuation techniques used to value the Fund's investments by major category are as follows:
Equity securities, including restricted securities, for which market quotations are readily available, are valued at the last reported sale price or official closing price as reported by a third party pricing vendor on the primary market or exchange on which they are traded and are categorized as Level 1 in the hierarchy. In the event there were no sales during the day or closing prices are not available, securities are valued at the last quoted bid price or may be valued using the last available price and are generally categorized as Level 2 in the hierarchy. For foreign equity securities, when market or security specific events arise, comparisons to the valuation of American Depositary Receipts (ADRs), futures contracts, Exchange-Traded Funds (ETFs) and certain indexes as well as quoted prices for similar securities may be used and would be categorized as Level 2 in the hierarchy. For equity securities, including restricted securities, where observable inputs are limited, assumptions about market activity and risk are used and these securities may be categorized as Level 3 in the hierarchy.
Investments in open-end mutual funds, including the Fidelity Central Funds, are valued at their closing net asset value (NAV) each business day and are categorized as Level 1 in the hierarchy.
Changes in valuation techniques may result in transfers in or out of an assigned level within the disclosure hierarchy. The aggregate value of investments by input level as of June 30, 2020 is included at the end of the Fund's Schedule of Investments.
Foreign Currency. The Fund may use foreign currency contracts to facilitate transactions in foreign-denominated securities. Gains and losses from these transactions may arise from changes in the value of the foreign currency or if the counterparties do not perform under the contracts' terms.
Foreign-denominated assets, including investment securities, and liabilities are translated into U.S. dollars at the exchange rates at period end. Purchases and sales of investment securities, income and dividends received and expenses denominated in foreign currencies are translated into U.S. dollars at the exchange rate in effect on the transaction date.
The effects of exchange rate fluctuations on investments are included with the net realized and unrealized gain (loss) on investment securities. Other foreign currency transactions resulting in realized and unrealized gain (loss) are disclosed separately.
Investment Transactions and Income. For financial reporting purposes, the Fund's investment holdings and NAV include trades executed through the end of the last business day of the period. The NAV per share for processing shareholder transactions is calculated as of the close of business of the New York Stock Exchange (NYSE), normally 4:00 p.m. Eastern time and includes trades executed through the end of the prior business day. Gains and losses on securities sold are determined on the basis of identified cost and include proceeds received from litigation. Dividend income is recorded on the ex-dividend date, except for certain dividends from foreign securities where the ex-dividend date may have passed, which are recorded as soon as the Fund is informed of the ex-dividend date. Non-cash dividends included in dividend income, if any, are recorded at the fair market value of the securities received. Income and capital gain distributions from Fidelity Central Funds, if any, are recorded on the ex-dividend date. Certain distributions received by the Fund represent a return of capital or capital gain. The Fund determines the components of these distributions subsequent to the ex-dividend date, based upon receipt of tax filings or other correspondence relating to the underlying investment. These distributions are recorded as a reduction of cost of investments and/or as a realized gain. Investment income is recorded net of foreign taxes withheld where recovery of such taxes is uncertain.
Class Allocations and Expenses. Investment income, realized and unrealized capital gains and losses, common expenses of the Fund, and certain fund-level expense reductions, if any, are allocated daily on a pro-rata basis to each class based on the relative net assets of each class to the total net assets of the Fund. Each class differs with respect to transfer agent and distribution and service plan fees incurred. Certain expense reductions may also differ by class. For the reporting period, the allocated portion of income and expenses to each class as a percent of its average net assets may vary due to the timing of recording these transactions in relation to fluctuating net assets of the classes. Expenses directly attributable to a fund are charged to that fund. Expenses attributable to more than one fund are allocated among the respective funds on the basis of relative net assets or other appropriate methods. Expense estimates are accrued in the period to which they relate and adjustments are made when actual amounts are known.
Deferred Trustee Compensation. Under a Deferred Compensation Plan (the Plan), certain independent Trustees have elected to defer receipt of a portion of their annual compensation. Deferred amounts are invested in a cross-section of Fidelity funds, are marked-to-market and remain in the Fund until distributed in accordance with the Plan. The investment of deferred amounts and the offsetting payable to the Trustees of $1,057,750 are included in the accompanying Statement of Assets and Liabilities in other receivables and other payables and accrued expenses, respectively.
Income Tax Information and Distributions to Shareholders. Each year, the Fund intends to qualify as a regulated investment company under Subchapter M of the Internal Revenue Code, including distributing substantially all of its taxable income and realized gains. As a result, no provision for U.S. Federal income taxes is required. The Fund files a U.S. federal tax return, in addition to state and local tax returns as required. The Fund's federal income tax returns are subject to examination by the Internal Revenue Service (IRS) for a period of three fiscal years after they are filed. State and local tax returns may be subject to examination for an additional fiscal year depending on the jurisdiction. Foreign taxes are provided for based on the Fund's understanding of the tax rules and rates that exist in the foreign markets in which it invests. The Fund is subject to a tax imposed on capital gains by certain countries in which it invests. An estimated deferred tax liability for net unrealized appreciation on the applicable securities is included in Other payables and accrued expenses on the Statement of Assets & Liabilities.
Distributions are declared and recorded on the ex-dividend date. Income and capital gain distributions are declared separately for each class. Income and capital gain distributions are determined in accordance with income tax regulations, which may differ from GAAP.
Capital accounts within the financial statements are adjusted for permanent book-tax differences. These adjustments have no impact on net assets or the results of operations. Capital accounts are not adjusted for temporary book-tax differences which will reverse in a subsequent period.
Book-tax differences are primarily due to foreign currency transactions, certain foreign taxes, passive foreign investment companies (PFIC), redemptions in kind, deferred trustees compensation and losses deferred due to wash sales.
As of period end, the cost and unrealized appreciation (depreciation) in securities, and derivatives if applicable, for federal income tax purposes were as follows:
| Gross unrealized appreciation | $7,515,679,760 |
| Gross unrealized depreciation | (147,192,699) |
| Net unrealized appreciation (depreciation) | $7,368,487,061 |
| Tax cost | $11,325,101,143 |
Restricted Securities (including Private Placements). The Fund may invest in securities that are subject to legal or contractual restrictions on resale. These securities generally may be resold in transactions exempt from registration or to the public if the securities are registered. Disposal of these securities may involve time-consuming negotiations and expense, and prompt sale at an acceptable price may be difficult. Information regarding restricted securities is included at the end of the Fund's Schedule of Investments.
4. Purchases and Sales of Investments.
Purchases and sales of securities, other than short-term securities, are noted in the table below.
| | Purchases ($) | Sales ($) |
| VIP Contrafund Portfolio | 3,568,920,160 | 4,863,532,046 |
Prior Fiscal Year Unaffiliated Redemptions In-Kind. During the prior period, shares of the VIP Contrafund Portfolio were redeemed in-kind for investments. The amount of the in-kind redemptions is included in share transactions in the accompanying Statement of Changes in Net Assets. For additional information of the VIP Contrafund Portfolio in-kind transactions, please refer to the VIP Contrafund Portfolio prior annual shareholder report.
5. Fees and Other Transactions with Affiliates.
Management Fee. Fidelity Management & Research Company LLC (the investment adviser) and its affiliates provide the Fund with investment management related services for which the Fund pays a monthly management fee. The management fee is the sum of an individual fund fee rate that is based on an annual rate of .30% of the Fund's average net assets and an annualized group fee rate that averaged .23% during the period. The group fee rate is based upon the monthly average net assets of a group of registered investment companies with which the investment adviser has management contracts. The group fee rate decreases as assets under management increase and increases as assets under management decrease. For the reporting period, the total annualized management fee rate was .53% of the Fund's average net assets.
Distribution and Service Plan Fees. In accordance with Rule 12b-1 of the 1940 Act, the Fund has adopted separate 12b-1 Plans for each Service Class of shares. Each Service Class pays Fidelity Distributors Company LLC (FDC), an affiliate of the investment adviser, a service fee. For the period, the service fee is based on an annual rate of .10% of Service Class' average net assets and .25% of Service Class 2's average net assets.
For the period, total fees, all of which were re-allowed to insurance companies for the distribution of shares and providing shareholder support services, were as follows:
| Service Class | $721,768 |
| Service Class 2 | 9,351,081 |
| | $10,072,849 |
Transfer Agent Fees. Fidelity Investments Institutional Operations Company LLC (FIIOC), an affiliate of the investment adviser, is the Fund's transfer, dividend disbursing, and shareholder servicing agent. FIIOC receives an asset-based fee with respect to each class. Each class pays a fee for transfer agent services, typesetting and printing and mailing of shareholder reports, excluding mailing of proxy statements. Effective February 1, 2020, the Board approved to change the fee from .145% to .142% for Investor Class, and from .065% to .064% for all other classes. For the period, transfer agent fees for each class were as follows:
| | Amount | % of Class-Level Average Net Assets(a) |
| Initial Class | $2,177,680 | .06 |
| Service Class | 455,105 | .06 |
| Service Class 2 | 2,357,418 | .06 |
| Investor Class | 1,174,411 | .14 |
| | $6,164,614 | |
(a) Annualized
Accounting Fees. Fidelity Service Company, Inc. (FSC), an affiliate of the investment adviser, maintains the Fund's accounting records. The accounting fee is based on the level of average net assets for each month. For the period, the fees were equivalent to the following annualized rates:
| | % of Average Net Assets |
| VIP Contrafund Portfolio | .01 |
Brokerage Commissions. A portion of portfolio transactions were placed with brokerage firms which are affiliates of the investment adviser. Brokerage commissions are included in net realized gain (loss) and change in net unrealized appreciation (depreciation) in the Statement of Operations. The commissions paid to these affiliated firms were as follows:
| | Amount |
| VIP Contrafund Portfolio | $82,354 |
Interfund Trades. Funds may purchase from or sell securities to other Fidelity Funds under procedures adopted by the Board. The procedures have been designed to ensure these interfund trades are executed in accordance with Rule 17a-7 of the 1940 Act. Interfund trades are included within the respective purchases and sales amounts shown in the Purchases and Sales of Investments note.
Other. During the period, the investment adviser reimbursed the Fund for certain losses in the amount of $123,883.
6. Committed Line of Credit.
Certain Funds participate with other funds managed by the investment adviser or an affiliate in a $4.25 billion credit facility (the "line of credit") to be utilized for temporary or emergency purposes to fund shareholder redemptions or for other short-term liquidity purposes. The participating funds have agreed to pay commitment fees on their pro-rata portion of the line of credit, which are reflected in Miscellaneous expenses on the Statement of Operations, and are as follows:
| | Amount |
| VIP Contrafund Portfolio | $21,810 |
During the period, there were no borrowings on this line of credit.
7. Security Lending.
The Fund lends portfolio securities from time to time in order to earn additional income. For equity securities, lending agents are used, including National Financial Services (NFS), an affiliate of the Fund. Pursuant to a securities lending agreement, NFS will receive a fee, which is capped at 9.9% of daily lending revenue, for its services as lending agent. The Fund may lend securities to certain qualified borrowers, including NFS. On the settlement date of the loan, the Fund receives collateral (in the form of U.S. Treasury obligations, letters of credit and/or cash) against the loaned securities and maintains collateral in an amount not less than 100% of the market value of the loaned securities during the period of the loan. The market value of the loaned securities is determined at the close of business of the Fund and any additional required collateral is delivered to the Fund on the next business day. The Fund or borrower may terminate the loan at any time, and if the borrower defaults on its obligation to return the securities loaned because of insolvency or other reasons, the Fund may apply collateral received from the borrower against the obligation. The Fund may experience delays and costs in recovering the securities loaned. Any cash collateral received is invested in the Fidelity Securities Lending Cash Central Fund. The value of loaned securities and cash collateral at period end are disclosed on the Fund's Statement of Assets and Liabilities. Total fees paid by the Fund to NFS, as lending agent, amounted to $8,684. Security lending income represents the income earned on investing cash collateral, less rebates paid to borrowers and any lending agent fees associated with the loan, plus any premium payments received for lending certain types of securities. Security lending income is presented in the Statement of Operations as a component of income from Fidelity Central Funds. During the period, there were no securities loaned to NFS.
8. Expense Reductions.
Commissions paid to certain brokers with whom the investment adviser, or its affiliates, places trades on behalf of the Fund include an amount in addition to trade execution, which may be rebated back to the Fund to offset certain expenses. This amount totaled $323,782 for the period.
In addition, during the period the investment adviser or an affiliate reimbursed and/or waived a portion of fund-level operating expenses in the amount of $36,008.
9. Distributions to Shareholders.
Distributions to shareholders of each class were as follows:
| | Six months ended
June 30, 2020 | Year ended
December 31, 2019 |
| Distributions to shareholders | | |
| Initial Class | $41,638,661 | $815,577,615 |
| Service Class | 8,811,220 | 174,225,616 |
| Service Class 2 | 46,794,638 | 926,626,620 |
| Investor Class | 10,324,967 | 185,887,940 |
| Total | $107,569,486 | $2,102,317,791 |
10. Share Transactions.
Transactions for each class of shares were as follows:
| | Shares | Shares | Dollars | Dollars |
| | Six months ended June 30, 2020 | Year ended December 31, 2019 | Six months ended June 30, 2020 | Year ended December 31, 2019 |
| Initial Class | | | | |
| Shares sold | 22,809,869 | 2,935,670 | $818,284,792 | $99,683,246 |
| Reinvestment of distributions | 1,063,296 | 26,150,469 | 41,638,661 | 815,577,615 |
| Shares redeemed | (15,228,842) | (37,160,663) | (559,350,471) | (1,264,009,092) |
| Net increase (decrease) | 8,644,323 | (8,074,524) | $300,572,982 | $(348,748,231) |
| Service Class | | | | |
| Shares sold | 890,695 | 1,148,632 | $31,206,929 | $38,865,138 |
| Reinvestment of distributions | 226,277 | 5,621,468 | 8,811,220 | 174,225,616 |
| Shares redeemed | (3,449,313) | (7,812,299) | (125,887,366) | (266,838,399) |
| Net increase (decrease) | (2,332,341) | (1,042,199) | $(85,869,217) | $(53,747,645) |
| Service Class 2 | | | | |
| Shares sold | 9,904,533 | 14,840,569 | $350,323,346 | $482,410,740 |
| Reinvestment of distributions | 1,230,466 | 30,647,896 | 46,794,638 | 926,626,620 |
| Shares redeemed | (44,275,239) | (45,696,007)(a) | (1,534,478,358) | (1,508,908,292)(a) |
| Net increase (decrease) | (33,140,240) | (207,542) | $(1,137,360,374) | $(99,870,932) |
| Investor Class | | | | |
| Shares sold | 1,063,832 | 1,266,076 | $38,989,967 | $42,751,874 |
| Reinvestment of distributions | 265,492 | 6,003,266 | 10,324,967 | 185,887,940 |
| Shares redeemed | (2,740,344) | (4,705,289) | (94,718,267) | (158,815,003) |
| Net increase (decrease) | (1,411,020) | 2,564,053 | $(45,403,333) | $69,824,811 |
(a) Amount includes in-kind redemptions (see the Prior Fiscal Year Unaffiliated Redemptions In-Kind note for additional details).
11. Other.
The Fund's organizational documents provide former and current trustees and officers with a limited indemnification against liabilities arising in connection with the performance of their duties to the Fund. In the normal course of business, the Fund may also enter into contracts that provide general indemnifications. The Fund's maximum exposure under these arrangements is unknown as this would be dependent on future claims that may be made against the Fund. The risk of material loss from such claims is considered remote.
At the end of the period, the investment adviser or its affiliates were the owners of record of 15% of the total outstanding shares of the Fund and two otherwise unaffiliated shareholders were the owner of record of 23% of the total outstanding shares of the Fund.
12. Coronavirus (COVID-19) Pandemic.
An outbreak of COVID-19 first detected in China during December 2019 has since spread globally and was declared a pandemic by the World Health Organization during March 2020. Developments that disrupt global economies and financial markets, such as the COVID-19 pandemic, may magnify factors that affect the Fund's performance.
Shareholder Expense Example
As a shareholder of the Fund, you incur two types of costs: (1) transaction costs and (2) ongoing costs, including management fees, distribution and/or service (12b-1) fees and other Fund expenses. This Example is intended to help you understand your ongoing costs (in dollars) of investing in the Fund and to compare these costs with the ongoing costs of investing in other mutual funds.
The Example is based on an investment of $1,000 invested at the beginning of the period and held for the entire period (January 1, 2020 to June 30, 2020).
Actual Expenses
The first line of the accompanying table for each class of the Fund provides information about actual account values and actual expenses. You may use the information in this line, together with the amount you invested, to estimate the expenses that you paid over the period. Simply divide your account value by $1,000.00 (for example, an $8,600 account value divided by $1,000.00 = 8.6), then multiply the result by the number in the first line for a class of the Fund under the heading entitled "Expenses Paid During Period" to estimate the expenses you paid on your account during this period. The estimate of expenses does not include any fees or other expenses of any variable annuity or variable life insurance product. If they were, the estimate of expenses you paid during the period would be higher, and your ending account value would be lower. In addition, the Fund, as a shareholder in the underlying Fidelity Central Funds, will indirectly bear its pro-rata share of the fees and expenses incurred by the underlying Fidelity Central Funds. These fees and expenses are not included in the Fund's annualized expense ratio used to calculate the expense estimate in the table below.
Hypothetical Example for Comparison Purposes
The second line of the accompanying table for each class of the Fund provides information about hypothetical account values and hypothetical expenses based on a Class' actual expense ratio and an assumed rate of return of 5% per year before expenses, which is not the Class' actual return. The hypothetical account values and expenses may not be used to estimate the actual ending account balance or expenses you paid for the period. You may use this information to compare the ongoing costs of investing in the Fund and other funds. To do so, compare this 5% hypothetical example with the 5% hypothetical examples that appear in the shareholder reports of the other funds. The estimate of expenses does not include any fees or other expenses of any variable annuity or variable life insurance product. If they were, the estimate of expenses you paid during the period would be higher, and your ending account value would be lower. In addition, the Fund, as a shareholder in the underlying Fidelity Central Funds, will indirectly bear its pro-rata share of the fees and expenses incurred by the underlying Fidelity Central Funds. These fees and expenses are not included in the Fund's annualized expense ratio used to calculate the expense estimate in the table below.
Please note that the expenses shown in the table are meant to highlight your ongoing costs only and do not reflect any transaction costs. Therefore, the second line of the table is useful in comparing ongoing costs only, and will not help you determine the relative total costs of owning different funds.
| | Annualized Expense Ratio-A | Beginning
Account Value
January 1, 2020 | Ending
Account Value
June 30, 2020 | Expenses Paid
During Period-B
January 1, 2020
to June 30, 2020 |
| Initial Class | .62% | | | |
| Actual | | $1,000.00 | $1,092.90 | $3.23 |
| Hypothetical-C | | $1,000.00 | $1,021.78 | $3.12 |
| Service Class | .72% | | | |
| Actual | | $1,000.00 | $1,092.50 | $3.75 |
| Hypothetical-C | | $1,000.00 | $1,021.28 | $3.62 |
| Service Class 2 | .87% | | | |
| Actual | | $1,000.00 | $1,091.40 | $4.52 |
| Hypothetical-C | | $1,000.00 | $1,020.54 | $4.37 |
| Investor Class | .69% | | | |
| Actual | | $1,000.00 | $1,092.40 | $3.59 |
| Hypothetical-C | | $1,000.00 | $1,021.43 | $3.47 |
A Annualized expense ratio reflects expenses net of applicable fee waivers.
B Expenses are equal to each Class' annualized expense ratio, multiplied by the average account value over the period, multiplied by 182/366 (to reflect the one-half year period).
C 5% return per year before expenses
Board Approval of Investment Advisory Contracts and Management Fees
VIP Contrafund Portfolio
Each year, the Board of Trustees, including the Independent Trustees (together, the Board), votes on the renewal of the management contract with Fidelity Management & Research Company LLC (FMR) and the sub-advisory agreements (together, the Advisory Contracts) for the fund. FMR and the sub-advisers are referred to herein as the Investment Advisers. The Board, assisted by the advice of fund counsel and Independent Trustees' counsel, requests and considers a broad range of information relevant to the renewal of the Advisory Contracts throughout the year.
The Board meets regularly and, at each of its meetings, covers an extensive agenda of topics and materials and considers factors that are relevant to its annual consideration of the renewal of the fund's Advisory Contracts, including the services and support provided to the fund and its shareholders. The Board has established various standing committees (Committees), each composed of and chaired by Independent Trustees with varying backgrounds, to which the Board has assigned specific subject matter responsibilities in order to enhance effective decision-making by the Board. The Board, acting directly and through its Committees, requests and receives information concerning the annual consideration of the renewal of the fund's Advisory Contracts. The Board also meets as needed to review matters specifically related to the Board's annual consideration of the renewal of the Advisory Contracts. Members of the Board may also meet with trustees of other Fidelity funds through joint ad hoc committees to discuss certain matters relevant to all of the Fidelity funds.
At its January 2020 meeting, the Board unanimously determined to renew the fund's Advisory Contracts. In reaching its determination, the Board considered all factors it believed relevant, including (i) the nature, extent, and quality of the services provided to the fund and its shareholders (including the investment performance of the fund); (ii) the competitiveness of the fund's management fee and total expense ratio relative to peer funds; (iii) the total costs of the services provided by and the profits realized by Fidelity from its relationships with the fund; and (iv) the extent to which, if any, economies of scale exist and are realized as the fund grows, and whether any economies of scale are appropriately shared with fund shareholders.
In considering whether to renew the Advisory Contracts for the fund, the Board reached a determination, with the assistance of fund counsel and Independent Trustees' counsel and through the exercise of its business judgment, that the renewal of the Advisory Contracts was in the best interests of the fund and its shareholders and that the compensation payable under the Advisory Contracts was fair and reasonable. The Board's decision to renew the Advisory Contracts was not based on any single factor, but rather was based on a comprehensive consideration of all the information provided to the Board at its meetings throughout the year. The Board, in reaching its determination to renew the Advisory Contracts, was aware that shareholders of the fund have a broad range of investment choices available to them, including a wide choice among funds offered by Fidelity's competitors, and that the fund's shareholders, who have the opportunity to review and weigh the disclosure provided by the fund in its prospectus and other public disclosures, have chosen to invest in this fund, which is part of the Fidelity family of funds.
Nature, Extent, and Quality of Services Provided. The Board considered Fidelity's staffing as it relates to the fund, including the backgrounds of investment personnel of Fidelity, and also considered the fund's investment objective, strategies, and related investment philosophy. The Independent Trustees also had discussions with senior management of Fidelity's investment operations and investment groups. The Board considered the structure of the investment personnel compensation program and whether this structure provides appropriate incentives to act in the best interests of the fund. Additionally, the Board considered the portfolio managers' investments, if any, in the funds that they manage.
Resources Dedicated to Investment Management and Support Services. The Board and the Fund Oversight and Research Committees reviewed the general qualifications and capabilities of Fidelity's investment staff, including its size, education, experience, and resources, as well as Fidelity's approach to recruiting, training, managing, and compensating investment personnel. The Board noted that Fidelity has continued to increase the resources devoted to non-U.S. offices, including expansion of Fidelity's global investment organization. The Board also noted that Fidelity's analysts have extensive resources, tools and capabilities that allow them to conduct sophisticated quantitative and fundamental analysis, as well as credit analysis of issuers, counterparties and guarantors. Further, the Board considered that Fidelity's investment professionals have sufficient access to global information and data so as to provide competitive investment results over time, and that those professionals also have access to sophisticated tools that permit them to assess portfolio construction and risk and performance attribution characteristics continuously, as well as to transmit new information and research conclusions rapidly around the world. Additionally, in its deliberations, the Board considered Fidelity's trading, risk management, compliance, and technology and operations capabilities and resources, which are integral parts of the investment management process.
Shareholder and Administrative Services. The Board considered (i) the nature, extent, quality, and cost of advisory, administrative, and shareholder services performed by the Investment Advisers and their affiliates under the Advisory Contracts and under separate agreements covering transfer agency, pricing and bookkeeping, and securities lending services for the fund; (ii) the nature and extent of the supervision of third party service providers, principally custodians, subcustodians, and pricing vendors; and (iii) the resources devoted to, and the record of compliance with, the fund's compliance policies and procedures. The Board also reviewed the allocation of fund brokerage, including allocations to brokers affiliated with the Investment Advisers, the use of brokerage commissions to pay fund expenses, and the use of "soft" commission dollars to pay for research services.
The Board noted that the growth of fund assets over time across the complex allows Fidelity to reinvest in the development of services designed to enhance the value and convenience of the Fidelity funds as investment vehicles. These services include 24-hour access to account information and market information over the Internet and through telephone representatives, investor education materials and asset allocation tools, and the expanded availability of Fidelity Investor Centers.
The Board noted that it and the boards of certain other Fidelity funds had formed an ad hoc Committee on Transfer Agency Fees to review the variety of transfer agency fee structures throughout the industry and Fidelity's competitive positioning with respect to industry participants.
Investment in a Large Fund Family. The Board considered the benefits to shareholders of investing in a Fidelity fund, including the benefits of investing in a fund that is part of a large family of funds offering a variety of investment disciplines and providing a large variety of mutual fund investor services. The Board noted that Fidelity had taken, or had made recommendations that resulted in the Fidelity funds taking, a number of actions over the previous year that benefited particular funds, including: (i) continuing to dedicate additional resources to Fidelity's investment research process, which includes meetings with management of issuers of securities in which the funds invest, and to the support of the senior management team that oversees asset management; (ii) continuing efforts to enhance Fidelity's global research capabilities; (iii) launching new funds and ETFs with innovative structures, strategies and pricing and making other enhancements to meet client needs; (iv) launching new share classes of existing funds; (v) eliminating purchase minimums and broadening eligibility requirements for certain funds and share classes; (vi) reducing management fees and total expenses for certain target date funds and index funds; (vii) lowering expense caps for certain existing funds and classes, and converting certain voluntary expense caps to contractual caps, to reduce expenses borne by shareholders; (viii) rationalizing product lines and gaining increased efficiencies from fund mergers, liquidations, and share class consolidations; (ix) continuing to develop, acquire and implement systems and technology to improve services to the funds and shareholders, strengthen information security, and increase efficiency; and (x) continuing to implement enhancements to further strengthen Fidelity's product line to increase investors' probability of success in achieving their investment goals, including retirement income goals.
Investment Performance. The Board considered whether the fund has operated in accordance with its investment objective, as well as its record of compliance with its investment restrictions and its performance history. The Board noted that there were portfolio management changes for the fund in August 2017, November 2017, and May 2018. The Board will continue to monitor closely the fund's performance, taking into account the portfolio management changes.
The Board took into account discussions that occur at Board meetings throughout the year with representatives of the Investment Advisers about fund investment performance. In this regard the Board noted that as part of regularly scheduled fund reviews and other reports to the Board on fund performance, the Board considers annualized return information for the fund for different time periods, measured against an appropriate securities market index (benchmark index) and a peer group of funds with similar objectives (peer group), if any. In its evaluation of fund investment performance, the Board gave particular attention to information indicating changes in performance of certain Fidelity funds for specific time periods and discussed with the Investment Advisers the reasons for any overperformance or underperformance.
In addition to reviewing absolute and relative fund performance, the Independent Trustees periodically consider the appropriateness of fund performance metrics in evaluating the results achieved. In general, the Independent Trustees believe that fund performance should be evaluated based on net performance (after fees and expenses) of both the highest performing and lowest performing fund share classes, where applicable, compared to appropriate benchmark indices, over appropriate time periods that may include full market cycles, and compared to peer groups, as applicable, over the same periods, taking into account relevant factors including the following: general market conditions; issuer-specific information; and fund cash flows and other factors.
The Independent Trustees recognize that shareholders evaluate performance on a net basis over their own holding periods, for which one-, three-, and five-year periods are often used as a proxy. For this reason, the performance information reviewed by the Board also included net cumulative total return information for the fund and an appropriate benchmark index and peer group for the most recent one-, three-, and five-year periods ended June 30, 2019, as shown below. Returns are shown compared to the 25th percentile (top of box, 75% beaten) and 75th percentile (bottom of box, 25% beaten) of the peer universe.
VIP Contrafund Portfolio
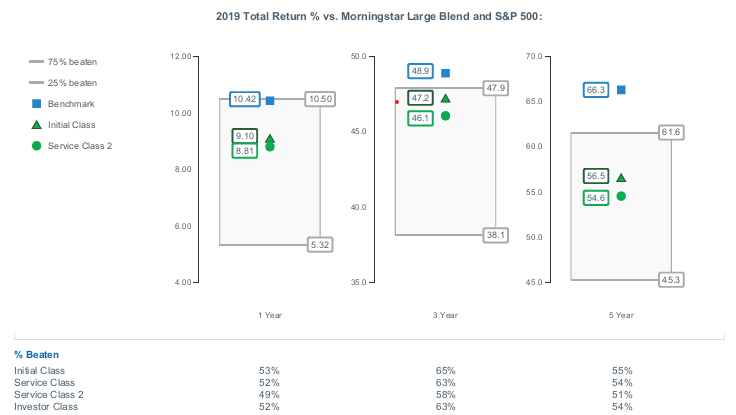
Based on its review, the Board concluded that the nature, extent, and quality of services provided to the fund under the Advisory Contracts should continue to benefit the shareholders of the fund.
Competitiveness of Management Fee and Total Expense Ratio. The Board considered the fund's management fee and total expense ratio compared to "mapped groups" of competitive funds and classes created for the purpose of facilitating the Trustees' competitive analysis of management fees and total expenses. Fidelity creates "mapped groups" by combining similar Lipper investment objective categories that have comparable investment mandates. Combining Lipper investment objective categories aids the Board's management fee and total expense ratio comparisons by broadening the competitive group used for comparison.
Management Fee. The Board considered two proprietary management fee comparisons for the 12-month periods ended June 30 (December 31 for periods prior to 2018) shown in basis points (BP) in the chart below. The group of Lipper funds used by the Board for management fee comparisons is referred to below as the "Total Mapped Group." The Total Mapped Group comparison focuses on a fund's standing in terms of gross management fees before expense reimbursements or caps relative to the total universe of funds with comparable investment mandates, regardless of whether their management fee structures also are comparable. Funds with comparable investment mandates offer exposure to similar types of securities. Funds with comparable management fee structures have similar management fee contractual arrangements (
e.g., flat rate charged for advisory services, all-inclusive fee rate,
etc.). "TMG %" represents the percentage of funds in the Total Mapped Group that had management fees that were lower than the fund's. For example, a hypothetical TMG % of 20% would mean that 80% of the funds in the Total Mapped Group had higher, and 20% had lower, management fees than the fund. The fund's actual TMG %s and the number of funds in the Total Mapped Group are in the chart below. The "Asset-Sized Peer Group" (ASPG) comparison focuses on a fund's standing relative to a subset of non-Fidelity funds within the Total Mapped Group that are similar in size and management fee structure. For example, if a fund is in the first quartile of the ASPG, the fund's management fee ranks in the least expensive or lowest 25% of funds in the ASPG. The ASPG represents at least 15% of the funds in the Total Mapped Group with comparable asset size and management fee structures, subject to a minimum of 50 funds (or all funds in the Total Mapped Group if fewer than 50). Additional information, such as the ASPG quartile in which the fund's management fee rate ranked, is also included in the chart and was considered by the Board.
VIP Contrafund Portfolio
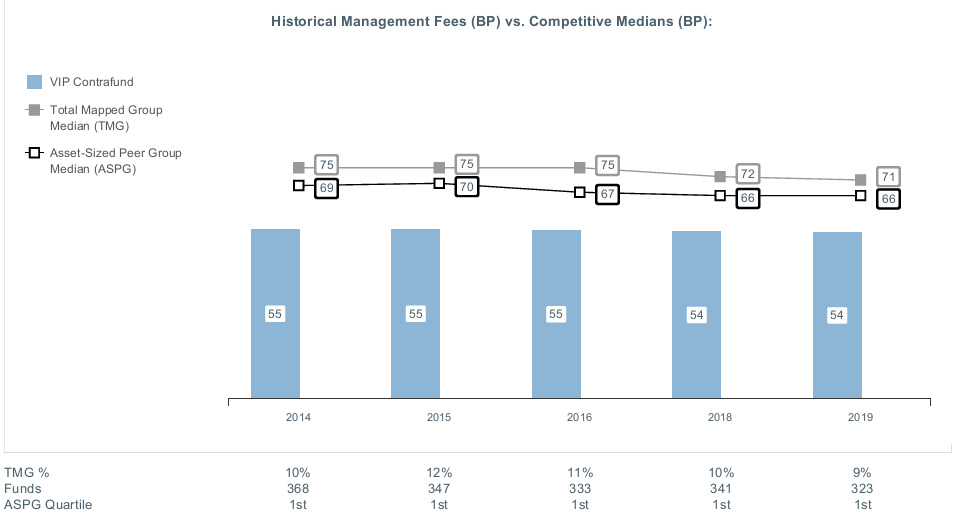
The Board noted that the fund's management fee rate ranked below the median of its Total Mapped Group and below the median of its ASPG for the 12-month period ended June 30, 2019.
The Board noted that it and the boards of other Fidelity funds formed an ad hoc Committee on Group Fee, which meets periodically, to conduct an in-depth review of the "group fee" component of the management fee of funds with such management fee structures. The Committee's focus included the mechanics of the group fee, the competitive landscape of group fee structures, Fidelity funds with no group fee component and investment products not included in group fee assets. The Board also considered that, for funds subject to the group fee, FMR agreed to voluntarily waive fees over a specified period of time in amounts designed to account for assets converted from certain funds to certain collective investment trusts.
The Board also noted that, in 2013, the ad hoc Committee on Management Fees was formed to conduct an in-depth review of the management fee rates of Fidelity's active equity mutual funds. The Committee focused on the following areas: (i) standard fee structures; (ii) research consumption and trading evolution; (iii) management fee competitiveness/profitability by category; and (iv) factors that drive institutional pricing.
Based on its review, the Board concluded that the fund's management fee is fair and reasonable in light of the services that the fund receives and the other factors considered.
Total Expense Ratio. In its review of each class's total expense ratio, the Board considered the fund's management fee rate as well as other fund or class expenses, as applicable, such as transfer agent fees, pricing and bookkeeping fees, fund-paid 12b-1 fees, and custodial, legal, and audit fees. The Board also noted that Fidelity may agree to waive fees or reimburse expenses from time to time, and the extent to which, if any, it has done so for the fund. As part of its review, the Board also considered the current and historical total expense ratios of each class of the fund compared to competitive fund median expenses. Each class of the fund is compared to those funds and classes in the Total Mapped Group (used by the Board for management fee comparisons) that have a similar sales load structure.
The Board noted that the total expense ratio of each class ranked below the competitive median for the 12-month period ended June 30, 2019.
Fees Charged to Other Fidelity Clients. The Board also considered Fidelity fee structures and other information with respect to clients of Fidelity, such as other funds advised or subadvised by Fidelity, pension plan clients, and other institutional clients with similar mandates. The Board noted that a joint ad hoc committee created by it and the boards of other Fidelity funds periodically reviews and compares Fidelity's institutional investment advisory business with its business of providing services to the Fidelity funds and also noted the most recent findings of the committee. The Board noted that the committee's review included a consideration of the differences in services provided, fees charged, and costs incurred, as well as competition in the markets serving the different categories of clients.
Based on its review of total expense ratios and fees charged to other Fidelity clients, the Board concluded that the total expense ratio of each class of the fund was reasonable in light of the services that the fund and its shareholders receive and the other factors considered.
Costs of the Services and Profitability. The Board considered the revenues earned and the expenses incurred by Fidelity in conducting the business of developing, marketing, distributing, managing, administering and servicing the fund and servicing the fund's shareholders. The Board also considered the level of Fidelity's profits in respect of all the Fidelity funds.
On an annual basis, Fidelity presents to the Board information about the profitability of its relationships with the fund. Fidelity calculates profitability information for each fund, as well as aggregate profitability information for groups of Fidelity funds and all Fidelity funds, using a series of detailed revenue and cost allocation methodologies which originate with the books and records of Fidelity on which Fidelity's audited financial statements are based. The Audit Committee of the Board reviews any significant changes from the prior year's methodologies and the full Board approves such changes.
PricewaterhouseCoopers LLP (PwC), auditor to Fidelity and certain Fidelity funds, has been engaged annually by the Board as part of the Board's assessment of Fidelity's profitability analysis. PwC's engagement includes the review and assessment of the methodologies used by Fidelity in determining the revenues and expenses attributable to Fidelity's mutual fund business, and completion of agreed-upon procedures in respect of the mathematical accuracy of the fund profitability information and its conformity to established allocation methodologies. After considering PwC's reports issued under the engagement and information provided by Fidelity, the Board concluded that while other allocation methods may also be reasonable, Fidelity's profitability methodologies are reasonable in all material respects.
The Board also reviewed Fidelity's non-fund businesses and potential indirect benefits such businesses may have received as a result of their association with Fidelity's mutual fund business (i.e., fall-out benefits) as well as cases where Fidelity's affiliates may benefit from the funds' business. The Board noted that changes to fall-out benefits year-over-year reflect business developments at Fidelity's various businesses. The Board considered that a joint ad hoc committee created by it and the boards of other Fidelity funds had recently been established, and met periodically, to evaluate potential fall-out benefits (PFOB Committee). The Board noted that the PFOB Committee, among other things: (i) discussed the legal framework surrounding potential fall-out benefits; (ii) reviewed the Board's responsibilities and approach to potential fall-out benefits; and (iii) reviewed practices employed by competitor funds regarding the review of potential fall-out benefits.
The Board considered the costs of the services provided by and the profits realized by Fidelity in connection with the operation of the fund, including the conclusions of the PFOB Committee, and was satisfied that the profitability was not excessive.
Economies of Scale. The Board considered whether there have been economies of scale in respect of the management of the Fidelity funds, whether the Fidelity funds (including the fund) have appropriately benefited from any such economies of scale, and whether there is potential for realization of any further economies of scale. The Board considered the extent to which the fund will benefit from economies of scale as assets grow through increased services to the fund, through waivers or reimbursements, or through fee or expense ratio reductions. The Board also noted that a committee (the Economies of Scale Committee) created by it and the boards of other Fidelity funds periodically analyzes whether Fidelity attains economies of scale in respect of the management and servicing of the Fidelity funds, whether the Fidelity funds have appropriately benefited from such economies of scale, and whether there is potential for realization of any further economies of scale.
The Board recognized that the fund's management contract incorporates a "group fee" structure, which provides for lower group fee rates as total "group assets" increase, and for higher group fee rates as total "group assets" decrease ("group assets" as defined in the management contract). FMR calculates the group fee rates based on a tiered asset "breakpoint" schedule that varies based on asset class. The Board considered that the group fee is designed to deliver the benefits of economies of scale to fund shareholders when total Fidelity fund assets increase, even if assets of any particular fund are unchanged or have declined, because some portion of Fidelity's costs are attributable to services provided to all Fidelity funds, and all funds benefit if those costs can be allocated among more assets. The Board concluded that, given the group fee structure, fund shareholders will benefit from lower management fees as "group assets" increase at the fund complex level, regardless of whether Fidelity achieves any such economies of scale.
The Board concluded, taking into account the analysis of the Economies of Scale Committee, that economies of scale, if any, are being appropriately shared between fund shareholders and Fidelity.
Additional Information Requested by the Board. In order to develop fully the factual basis for consideration of the Fidelity funds' advisory contracts, the Board requested and received additional information on certain topics, including: (i) fund flow and performance trends, in particular the underperformance of certain funds and strategies, and Fidelity's long-term strategies for certain funds; (ii) consideration of performance fees for additional funds; (iii) changes in Fidelity's non-fund businesses and the impact of such changes on the funds; (iv) metrics for evaluating index fund and ETF performance and information about ETF trading characteristics; (v) the methodology with respect to evaluating competitive fund data and peer group classifications and fee comparisons; (vi) the expense structures for different funds and classes; (vii) information regarding other accounts managed by Fidelity, including collective investment trusts and separately managed accounts; and (viii) Fidelity's philosophies and strategies for evaluating funds and classes with lower or declining asset levels.
Based on its evaluation of all of the conclusions noted above, and after considering all factors it believed relevant, the Board concluded that the advisory fee arrangements are fair and reasonable, and that the fund's Advisory Contracts should be renewed.
Liquidity Risk Management Program
The Securities and Exchange Commission adopted Rule 22e-4 under the Investment Company Act of 1940 (the Liquidity Rule) to promote effective liquidity risk management throughout the open-end investment company industry, thereby reducing the risk that funds will be unable to meet their redemption obligations and mitigating dilution of the interests of fund shareholders.
The Fund has adopted and implemented a liquidity risk management program pursuant to the Liquidity Rule (the Program) effective December 1, 2018. The Program is reasonably designed to assess and manage the Fund’s liquidity risk and to comply with the requirements of the Liquidity Rule. The Fund’s Board of Trustees (the Board) has designated the Fund’s investment adviser as administrator of the Program. The Fidelity advisers have established a Liquidity Risk Management Committee (the LRM Committee) to manage the Program for each of the Fidelity Funds. The LRM Committee monitors the adequacy and effectiveness of implementation of the Program and on a periodic basis assesses each Fund’s liquidity risk based on a variety of factors including (1) the Fund’s investment strategy, (2) portfolio liquidity and cash flow projections during normal and reasonably foreseeable stressed conditions, (3) shareholder redemptions, (4) borrowings and other funding sources and (5) in the case of exchange-traded funds, certain additional factors including the effect of the Fund’s prices and spreads, market participants, and basket compositions on the overall liquidity of the Fund’s portfolio, as applicable.
In accordance with the Program, each of the Fund’s portfolio investments is classified into one of four liquidity categories described below based on a determination of a reasonable expectation for how long it would take to convert the investment to cash (or sell or dispose of the investment) without significantly changing its market value.
- Highly liquid investments – cash or convertible to cash within three business days or less
- Moderately liquid investments – convertible to cash in three to seven calendar days
- Less liquid investments – can be sold or disposed of, but not settled, within seven calendar days
- Illiquid investments – cannot be sold or disposed of within seven calendar days
Liquidity classification determinations take into account a variety of factors including various market, trading and investment-specific considerations, as well as market depth, and generally utilize analysis from a third-party liquidity metrics service.
The Liquidity Rule places a 15% limit on a fund’s illiquid investments and requires funds that do not primarily hold assets that are highly liquid investments to determine and maintain a minimum percentage of the fund’s net assets to be invested in highly liquid investments (highly liquid investment minimum or HLIM). The Program includes provisions reasonably designed to comply with the 15% limit on illiquid investments and for determining, periodically reviewing and complying with the HLIM requirement as applicable.
At a recent meeting of the Fund’s Board of Trustees, the LRM Committee provided a written report to the Board pertaining to the operation, adequacy, and effectiveness of implementation of the Program for the annual period from December 1, 2018 through November 30, 2019. The report concluded that the Program has been implemented and is operating effectively and is reasonably designed to assess and manage the Fund’s liquidity risk.
Proxy Voting Results
A special meeting of shareholders was held on June 9, 2020. The results of votes taken among shareholders on the proposals before them are reported below. Each vote reported represents one dollar of net asset value held on the record date for the meeting.
PROPOSAL 1
To elect a Board of Trustees.
| | # of
Votes | % of
Votes |
| Dennis J. Dirks |
| Affirmative | 21,597,050,616.024 | 95.502 |
| Withheld | 1,017,240,628.578 | 4.498 |
| TOTAL | 22,614,291,244.601 | 100.000 |
| Donald F. Donahue |
| Affirmative | 21,605,904,576.366 | 95.541 |
| Withheld | 1,008,386,668.235 | 4.459 |
| TOTAL | 22,614,291,244.601 | 100.000 |
| Bettina Doulton |
| Affirmative | 21,645,998,598.109 | 95.718 |
| Withheld | 968,292,646.493 | 4.282 |
| TOTAL | 22,614,291,244.601 | 100.000 |
| Vicki L. Fuller |
| Affirmative | 21,660,928,063.243 | 95.784 |
| Withheld | 953,363,181.358 | 4.216 |
| TOTAL | 22,614,291,244.601 | 100.000 |
| Patricia L. Kampling |
| Affirmative | 21,663,944,422.383 | 95.798 |
| Withheld | 950,346,822.218 | 4.202 |
| TOTAL | 22,614,291,244.601 | 100.000 |
| Alan J. Lacy |
| Affirmative | 21,569,159,491.891 | 95.378 |
| Withheld | 1,045,131,752.710 | 4.622 |
| TOTAL | 22,614,291,244.601 | 100.000 |
| Ned C. Lautenbach |
| Affirmative | 21,469,914,492.101 | 94.940 |
| Withheld | 1,144,376,752.501 | 5.060 |
| TOTAL | 22,614,291,244.601 | 100.000 |
| Robert A. Lawrence |
| Affirmative | 21,583,601,126.100 | 95.442 |
| Withheld | 1,030,690,118.501 | 4.558 |
| TOTAL | 22,614,291,244.601 | 100.000 |
| Joseph Mauriello |
| Affirmative | 21,551,120,396.219 | 95.299 |
| Withheld | 1,063,170,848.382 | 4.701 |
| TOTAL | 22,614,291,244.601 | 100.000 |
| Cornelia M. Small |
| Affirmative | 21,592,890,757.027 | 95.483 |
| Withheld | 1,021,400,487.575 | 4.517 |
| TOTAL | 22,614,291,244.601 | 100.000 |
| Garnett A. Smith |
| Affirmative | 21,519,273,578.917 | 95.158 |
| Withheld | 1,095,017,665.685 | 4.842 |
| TOTAL | 22,614,291,244.601 | 100.000 |
| David M. Thomas |
| Affirmative | 21,574,034,388.063 | 95.400 |
| Withheld | 1,040,256,856.538 | 4.600 |
| TOTAL | 22,614,291,244.601 | 100.000 |
| Susan Tomasky |
| Affirmative | 21,607,546,330.771 | 95.548 |
| Withheld | 1,006,744,913.831 | 4.452 |
| TOTAL | 22,614,291,244.601 | 100.000 |
| Michael E. Wiley |
| Affirmative | 21,549,685,089.255 | 95.292 |
| Withheld | 1,064,606,155.346 | 4.708 |
| TOTAL | 22,614,291,244.601 | 100.000 |
PROPOSAL 2
To convert a fundamental investment policy to a non-fundamental investment policy.
| | # of
Votes | % of
Votes |
| Affirmative | 12,494,489,979.676 | 81.109 |
| Against | 1,423,733,795.655 | 9.242 |
| Abstain | 1,486,305,622.772 | 9.648 |
| Broker Non-Vote | 0.00 | 0.00 |
| TOTAL | 15,404,529,398.102 | 100.000 |
|
| Proposal 1 reflects trust wide proposal and voting results. |
VIPCON-SANN-0820
1.705691.122
Fidelity® Variable Insurance Products:
International Capital Appreciation Portfolio
Semi-Annual Report
June 30, 2020
See the inside front cover for important information about access to your fund’s shareholder reports.
Beginning on January 1, 2021, as permitted by regulations adopted by the Securities and Exchange Commission, and if your insurance carrier elects to participate, you may not be receiving paper copies of the Fund’s shareholder reports from the insurance company that offers your variable insurance product unless you specifically request paper copies from your financial professional or the administrator of your variable insurance product. Instead, the reports will be made available on a website, and you will be notified by mail each time a report is posted and provided with a website link to access the report.
If you already elected to receive shareholder reports electronically, you will not be affected by this change and you need not take any action. You may elect to receive shareholder reports and other communications from the Fund electronically, by contacting your financial professional or the administrator of your variable insurance product. If you own a Fidelity-administered variable insurance product, please visit fidelity.com/mailpreferences to make your election or call 1-800-343-3548.
You may elect to receive all future reports in paper free of charge. If you wish to continue receiving paper copies of your shareholder reports, you may contact your financial professional or the administrator of your variable insurance product. If you own a Fidelity-administered variable insurance product, please visit fidelity.com/mailpreferences to make your election or call 1-800-343-3548. Your election to receive reports in paper will apply to all funds available under your variable insurance product.
Contents
To view a fund's proxy voting guidelines and proxy voting record for the 12-month period ended June 30, visit http://www.fidelity.com/proxyvotingresults or visit the Securities and Exchange Commission's (SEC) web site at http://www.sec.gov.
You may also call 1-877-208-0098 to request a free copy of the proxy voting guidelines.
Fidelity® Variable Insurance Products are separate account options which are purchased through a variable insurance contract.
Standard & Poor's, S&P and S&P 500 are registered service marks of The McGraw-Hill Companies, Inc. and have been licensed for use by Fidelity Distributors Corporation.
Other third-party marks appearing herein are the property of their respective owners.
All other marks appearing herein are registered or unregistered trademarks or service marks of FMR LLC or an affiliated company. © 2020 FMR LLC. All rights reserved.
This report and the financial statements contained herein are submitted for the general information of the shareholders of the Fund. This report is not authorized for distribution to prospective investors in the Fund unless preceded or accompanied by an effective prospectus.
A fund files its complete schedule of portfolio holdings with the SEC for the first and third quarters of each fiscal year on Form N-PORT. Forms N-PORT are available on the SEC’s web site at http://www.sec.gov. A fund's Forms N-PORT may be reviewed and copied at the SEC’s Public Reference Room in Washington, DC. Information regarding the operation of the SEC's Public Reference Room may be obtained by calling 1-800-SEC-0330.
For a complete list of a fund's portfolio holdings, view the most recent holdings listing, semiannual report, or annual report on Fidelity's web site at http://www.fidelity.com, http://www.institutional.fidelity.com, or http://www.401k.com, as applicable.
NOT FDIC INSURED •MAY LOSE VALUE •NO BANK GUARANTEE
Neither the Fund nor Fidelity Distributors Corporation is a bank.
Note to Shareholders:
Early in 2020, the outbreak and spread of a new coronavirus emerged as a public health emergency that had a major influence on financial markets, primarily based on its impact on the global economy and the outlook for corporate earnings. The virus causes a respiratory disease known as COVID-19. On March 11, the World Health Organization declared the COVID-19 outbreak a pandemic, citing sustained risk of further global spread.
In the weeks following, as the crisis worsened, we witnessed an escalating human tragedy with wide-scale social and economic consequences from coronavirus-containment measures. The outbreak of COVID-19 prompted a number of measures to limit the spread, including travel and border restrictions, quarantines, and restrictions on large gatherings. In turn, these resulted in lower consumer activity, diminished demand for a wide range of products and services, disruption in manufacturing and supply chains, and – given the wide variability in outcomes regarding the outbreak – significant market uncertainty and volatility. Amid the turmoil, the U.S. government took unprecedented action – in concert with the U.S. Federal Reserve and central banks around the world – to help support consumers, businesses, and the broader economy, and to limit disruption to the financial system.
The situation continues to unfold, and the extent and duration of its impact on financial markets and the economy remain highly uncertain. Extreme events such as the coronavirus crisis are “exogenous shocks” that can have significant adverse effects on mutual funds and their investments. Although multiple asset classes may be affected by market disruption, the duration and impact may not be the same for all types of assets.
Fidelity is committed to helping you stay informed amid news about COVID-19 and during increased market volatility, and we’re taking extra steps to be responsive to customer needs. We encourage you to visit our websites, where we offer ongoing updates, commentary, and analysis on the markets and our funds.
Investment Summary (Unaudited)
Geographic Diversification (% of fund's net assets)
| As of June 30, 2020 |
| | United States of America* | 13.4% |
| | Switzerland | 10.7% |
| | France | 10.3% |
| | Cayman Islands | 8.3% |
| | Germany | 6.7% |
| | United Kingdom | 6.0% |
| | Canada | 5.9% |
| | Japan | 5.4% |
| | Netherlands | 3.6% |
| | Other | 29.7% |
* Includes Short-Term investments and Net Other Assets (Liabilities).
Percentages are based on country or territory of incorporation and are adjusted for the effect of futures contracts, if applicable.
Asset Allocation as of June 30, 2020
| | % of fund's net assets |
| Stocks | 98.0 |
| Short-Term Investments and Net Other Assets (Liabilities) | 2.0 |
Top Ten Stocks as of June 30, 2020
| | % of fund's net assets |
| Alibaba Group Holding Ltd. sponsored ADR (Cayman Islands, Internet & Direct Marketing Retail) | 2.8 |
| Tencent Holdings Ltd. (Cayman Islands, Interactive Media & Services) | 2.8 |
| Nestle SA (Reg. S) (Switzerland, Food Products) | 2.5 |
| Taiwan Semiconductor Manufacturing Co. Ltd. (Taiwan, Semiconductors & Semiconductor Equipment) | 2.1 |
| Roche Holding AG (participation certificate) (Switzerland, Pharmaceuticals) | 2.0 |
| ASML Holding NV (Netherlands) (Netherlands, Semiconductors & Semiconductor Equipment) | 1.7 |
| SAP SE (Germany, Software) | 1.6 |
| AstraZeneca PLC (United Kingdom) (United Kingdom, Pharmaceuticals) | 1.5 |
| LVMH Moet Hennessy Louis Vuitton SE (France, Textiles, Apparel & Luxury Goods) | 1.5 |
| AIA Group Ltd. (Hong Kong, Insurance) | 1.4 |
| | 19.9 |
Top Market Sectors as of June 30, 2020
| | % of fund's net assets |
| Information Technology | 17.0 |
| Industrials | 13.3 |
| Consumer Discretionary | 12.0 |
| Consumer Staples | 12.1 |
| Health Care | 12.1 |
| Financials | 11.7 |
| Communication Services | 7.2 |
| Materials | 5.1 |
| Utilities | 4.4 |
| Real Estate | 1.9 |
Schedule of Investments June 30, 2020 (Unaudited)
Showing Percentage of Net Assets
| Common Stocks - 98.0% | | | |
| | | Shares | Value |
| Australia - 1.0% | | | |
| CSL Ltd. | | 23,561 | $4,666,461 |
| Bailiwick of Jersey - 1.0% | | | |
| Experian PLC | | 128,700 | 4,517,223 |
| Belgium - 0.9% | | | |
| UCB SA | | 33,700 | 3,903,567 |
| Bermuda - 0.9% | | | |
| IHS Markit Ltd. | | 52,600 | 3,971,300 |
| Brazil - 1.0% | | | |
| BM&F BOVESPA SA | | 427,100 | 4,326,684 |
| Canada - 5.9% | | | |
| Canadian National Railway Co. | | 56,400 | 4,989,838 |
| Canadian Pacific Railway Ltd. | | 17,700 | 4,502,183 |
| CGI Group, Inc. Class A (sub. vtg.) (a) | | 64,200 | 4,044,657 |
| Constellation Software, Inc. | | 4,050 | 4,572,926 |
| Thomson Reuters Corp. | | 61,400 | 4,171,727 |
| Waste Connection, Inc. (Canada) | | 44,150 | 4,136,298 |
|
| TOTAL CANADA | | | 26,417,629 |
|
| Cayman Islands - 8.3% | | | |
| Alibaba Group Holding Ltd. sponsored ADR (a) | | 58,330 | 12,581,782 |
| New Oriental Education & Technology Group, Inc. sponsored ADR (a) | | 31,500 | 4,102,245 |
| Shenzhou International Group Holdings Ltd. | | 320,300 | 3,859,883 |
| TAL Education Group ADR (a) | | 64,800 | 4,431,024 |
| Tencent Holdings Ltd. | | 193,950 | 12,427,911 |
|
| TOTAL CAYMAN ISLANDS | | | 37,402,845 |
|
| China - 2.1% | | | |
| Kweichow Moutai Co. Ltd. (A Shares) | | 20,044 | 4,150,020 |
| Ping An Insurance Group Co. of China Ltd. (H Shares) | | 93,500 | 932,101 |
| Wuliangye Yibin Co. Ltd. (A Shares) | | 171,900 | 4,163,262 |
|
| TOTAL CHINA | | | 9,245,383 |
|
| Denmark - 3.3% | | | |
| DSV A/S | | 34,900 | 4,261,141 |
| Novo Nordisk A/S Series B | | 94,000 | 6,123,887 |
| ORSTED A/S (b) | | 37,100 | 4,281,393 |
|
| TOTAL DENMARK | | | 14,666,421 |
|
| Finland - 1.0% | | | |
| Kone OYJ (B Shares) | | 62,500 | 4,298,792 |
| France - 10.3% | | | |
| Air Liquide SA | | 37,010 | 5,351,159 |
| Dassault Systemes SA | | 25,700 | 4,435,039 |
| Hermes International SCA | | 5,120 | 4,278,576 |
| Kering SA | | 8,607 | 4,705,613 |
| L'Oreal SA | | 17,740 | 5,725,528 |
| LVMH Moet Hennessy Louis Vuitton SE | | 14,921 | 6,587,551 |
| Pernod Ricard SA | | 29,000 | 4,563,039 |
| Sanofi SA | | 60,900 | 6,210,868 |
| SR Teleperformance SA | | 16,200 | 4,111,538 |
|
| TOTAL FRANCE | | | 45,968,911 |
|
| Germany - 6.7% | | | |
| Allianz SE | | 27,500 | 5,615,702 |
| Deutsche Borse AG | | 26,200 | 4,740,619 |
| Hannover Reuck SE | | 22,894 | 3,945,664 |
| SAP SE | | 51,500 | 7,199,160 |
| Symrise AG | | 35,200 | 4,113,003 |
| Vonovia SE | | 74,600 | 4,574,519 |
|
| TOTAL GERMANY | | | 30,188,667 |
|
| Hong Kong - 2.3% | | | |
| AIA Group Ltd. | | 674,400 | 6,310,769 |
| Techtronic Industries Co. Ltd. | | 420,500 | 4,112,496 |
|
| TOTAL HONG KONG | | | 10,423,265 |
|
| India - 2.2% | | | |
| HDFC Bank Ltd. | | 303,350 | 4,261,415 |
| Reliance Industries Ltd. (a) | | 17,846 | 188,417 |
| Reliance Industries Ltd. | | 244,900 | 5,524,311 |
|
| TOTAL INDIA | | | 9,974,143 |
|
| Indonesia - 1.0% | | | |
| PT Bank Central Asia Tbk | | 2,166,000 | 4,317,595 |
| Ireland - 3.6% | | | |
| Accenture PLC Class A | | 17,800 | 3,822,016 |
| Aon PLC | | 20,800 | 4,006,080 |
| Kerry Group PLC Class A | | 34,900 | 4,324,880 |
| Linde PLC | | 18,640 | 3,953,730 |
|
| TOTAL IRELAND | | | 16,106,706 |
|
| Italy - 2.1% | | | |
| Enel SpA | | 637,900 | 5,516,845 |
| Recordati SpA | | 75,700 | 3,780,426 |
|
| TOTAL ITALY | | | 9,297,271 |
|
| Japan - 5.4% | | | |
| Daikin Industries Ltd. | | 12,800 | 2,071,040 |
| Hoya Corp. | | 49,400 | 4,694,087 |
| Kao Corp. | | 56,200 | 4,459,909 |
| Keyence Corp. | | 13,216 | 5,511,614 |
| Nitori Holdings Co. Ltd. | | 8,900 | 1,741,260 |
| Olympus Corp. | | 183,000 | 3,523,207 |
| Tokyo Electron Ltd. | | 6,100 | 1,505,137 |
| Unicharm Corp. | | 16,000 | 654,966 |
|
| TOTAL JAPAN | | | 24,161,220 |
|
| Netherlands - 3.6% | | | |
| ASML Holding NV (Netherlands) | | 20,800 | 7,608,914 |
| Ferrari NV | | 24,600 | 4,196,845 |
| Wolters Kluwer NV | | 56,032 | 4,376,420 |
|
| TOTAL NETHERLANDS | | | 16,182,179 |
|
| Spain - 2.2% | | | |
| Cellnex Telecom SA (b) | | 68,559 | 4,177,892 |
| Iberdrola SA | | 481,920 | 5,626,264 |
|
| TOTAL SPAIN | | | 9,804,156 |
|
| Sweden - 3.0% | | | |
| Atlas Copco AB (A Shares) | | 115,300 | 4,910,102 |
| Hexagon AB (B Shares) (a) | | 72,800 | 4,250,091 |
| Swedish Match Co. AB | | 59,400 | 4,175,377 |
|
| TOTAL SWEDEN | | | 13,335,570 |
|
| Switzerland - 10.7% | | | |
| Givaudan SA | | 1,172 | 4,364,152 |
| Lonza Group AG | | 9,137 | 4,839,848 |
| Nestle SA (Reg. S) | | 99,470 | 11,028,301 |
| Partners Group Holding AG | | 4,729 | 4,289,517 |
| Roche Holding AG (participation certificate) | | 26,080 | 9,035,404 |
| Sika AG | | 24,925 | 4,804,854 |
| Temenos Group AG | | 29,407 | 4,567,249 |
| Zurich Insurance Group Ltd. | | 14,530 | 5,148,422 |
|
| TOTAL SWITZERLAND | | | 48,077,747 |
|
| Taiwan - 2.1% | | | |
| Taiwan Semiconductor Manufacturing Co. Ltd. | | 901,000 | 9,650,213 |
| United Kingdom - 6.0% | | | |
| AstraZeneca PLC (United Kingdom) | | 63,400 | 6,598,316 |
| Diageo PLC | | 164,796 | 5,477,383 |
| London Stock Exchange Group PLC | | 44,100 | 4,586,188 |
| Reckitt Benckiser Group PLC | | 58,519 | 5,383,656 |
| RELX PLC (London Stock Exchange) | | 208,244 | 4,825,257 |
|
| TOTAL UNITED KINGDOM | | | 26,870,800 |
|
| United States of America - 11.4% | | | |
| Adobe, Inc. (a) | | 9,200 | 4,004,852 |
| Alphabet, Inc. Class A (a) | | 2,700 | 3,828,735 |
| Amazon.com, Inc. (a) | | 1,410 | 3,889,936 |
| American Tower Corp. | | 14,900 | 3,852,246 |
| Charter Communications, Inc. Class A (a) | | 7,800 | 3,978,312 |
| Facebook, Inc. Class A (a) | | 17,200 | 3,905,604 |
| Intercontinental Exchange, Inc. | | 2,160 | 197,856 |
| MasterCard, Inc. Class A | | 12,690 | 3,752,433 |
| MercadoLibre, Inc. (a) | | 3,900 | 3,844,503 |
| Microsoft Corp. | | 20,000 | 4,070,200 |
| Netflix, Inc. (a) | | 8,500 | 3,867,840 |
| NextEra Energy, Inc. | | 16,430 | 3,945,993 |
| NICE Systems Ltd. sponsored ADR (a)(c) | | 21,400 | 4,049,736 |
| Visa, Inc. Class A | | 19,980 | 3,859,537 |
|
| TOTAL UNITED STATES OF AMERICA | | | 51,047,783 |
|
| TOTAL COMMON STOCKS | | | |
| (Cost $342,733,746) | | | 438,822,531 |
|
| Money Market Funds - 1.3% | | | |
| Fidelity Cash Central Fund 0.12% (d) | | 1,867,542 | 1,867,915 |
| Fidelity Securities Lending Cash Central Fund 0.12% (d)(e) | | 4,036,152 | 4,036,556 |
| TOTAL MONEY MARKET FUNDS | | | |
| (Cost $5,904,471) | | | 5,904,471 |
| TOTAL INVESTMENT IN SECURITIES - 99.3% | | | |
| (Cost $348,638,217) | | | 444,727,002 |
| NET OTHER ASSETS (LIABILITIES) - 0.7% | | | 2,943,938 |
| NET ASSETS - 100% | | | $447,670,940 |
Categorizations in the Schedule of Investments are based on country or territory of incorporation.
Legend
(a) Non-income producing
(b) Security exempt from registration under Rule 144A of the Securities Act of 1933. These securities may be resold in transactions exempt from registration, normally to qualified institutional buyers. At the end of the period, the value of these securities amounted to $8,459,285 or 1.9% of net assets.
(c) Security or a portion of the security is on loan at period end.
(d) Affiliated fund that is generally available only to investment companies and other accounts managed by Fidelity Investments. The rate quoted is the annualized seven-day yield of the fund at period end. A complete unaudited listing of the fund's holdings as of its most recent quarter end is available upon request. In addition, each Fidelity Central Fund's financial statements are available on the SEC's website or upon request.
(e) Investment made with cash collateral received from securities on loan.
Affiliated Central Funds
Information regarding fiscal year to date income earned by the Fund from investments in Fidelity Central Funds is as follows:
| Fund | Income earned |
| Fidelity Cash Central Fund | $29,165 |
| Fidelity Securities Lending Cash Central Fund | 22,545 |
| Total | $51,710 |
Amounts in the income column in the above table include any capital gain distributions from underlying funds, which are presented in the corresponding line-item in the Statement of Operations, if applicable. Amount for Fidelity Securities Lending Cash Central Fund represents the income earned on investing cash collateral, less rebates paid to borrowers and any lending agent fees associated with the loan, plus any premium payments received for lending certain types of securities.
Investment Valuation
The following is a summary of the inputs used, as of June 30, 2020, involving the Fund's assets and liabilities carried at fair value. The inputs or methodology used for valuing securities may not be an indication of the risk associated with investing in those securities. For more information on valuation inputs, and their aggregation into the levels used below, please refer to the Investment Valuation section in the accompanying Notes to Financial Statements.
| | Valuation Inputs at Reporting Date: |
| Description | Total | Level 1 | Level 2 | Level 3 |
| Investments in Securities: | | | | |
| Equities: | | | | |
| Communication Services | $32,186,294 | $19,758,383 | $12,427,911 | $-- |
| Consumer Discretionary | 54,219,218 | 42,926,054 | 11,293,164 | -- |
| Consumer Staples | 54,106,321 | 22,031,544 | 32,074,777 | -- |
| Energy | 5,712,728 | 5,712,728 | -- | -- |
| Financials | 52,678,612 | 31,439,717 | 21,238,895 | -- |
| Health Care | 53,376,071 | 17,044,541 | 36,331,530 | -- |
| Industrials | 59,255,355 | 47,756,990 | 11,498,365 | -- |
| Information Technology | 76,903,774 | 50,940,350 | 25,963,424 | -- |
| Materials | 22,586,898 | 8,317,882 | 14,269,016 | -- |
| Real Estate | 8,426,765 | 8,426,765 | -- | -- |
| Utilities | 19,370,495 | 8,227,386 | 11,143,109 | -- |
| Money Market Funds | 5,904,471 | 5,904,471 | -- | -- |
| Total Investments in Securities: | $444,727,002 | $268,486,811 | $176,240,191 | $-- |
Financial Statements
Statement of Assets and Liabilities
| | | June 30, 2020 (Unaudited) |
| Assets | | |
Investment in securities, at value (including securities loaned of $4,030,812) — See accompanying schedule:
Unaffiliated issuers (cost $342,733,746) | $438,822,531 | |
| Fidelity Central Funds (cost $5,904,471) | 5,904,471 | |
| Total Investment in Securities (cost $348,638,217) | | $444,727,002 |
| Cash | | 5,700 |
| Foreign currency held at value (cost $220,336) | | 220,336 |
| Receivable for investments sold | | 12,780,328 |
| Receivable for fund shares sold | | 114,178 |
| Dividends receivable | | 714,068 |
| Distributions receivable from Fidelity Central Funds | | 1,595 |
| Other receivables | | 210,079 |
| Total assets | | 458,773,286 |
| Liabilities | | |
| Payable for investments purchased | $6,669,320 | |
| Payable for fund shares redeemed | 2,012 | |
| Accrued management fee | 252,076 | |
| Distribution and service plan fees payable | 5,322 | |
| Other affiliated payables | 61,677 | |
| Other payables and accrued expenses | 75,589 | |
| Collateral on securities loaned | 4,036,350 | |
| Total liabilities | | 11,102,346 |
| Net Assets | | $447,670,940 |
| Net Assets consist of: | | |
| Paid in capital | | $369,927,434 |
| Total accumulated earnings (loss) | | 77,743,506 |
| Net Assets | | $447,670,940 |
| Net Asset Value and Maximum Offering Price | | |
| Initial Class: | | |
| Net Asset Value, offering price and redemption price per share ($128,214,233 ÷ 6,882,741 shares) | | $18.63 |
| Service Class: | | |
| Net Asset Value, offering price and redemption price per share ($897,772 ÷ 48,315 shares) | | $18.58 |
| Service Class 2: | | |
| Net Asset Value, offering price and redemption price per share ($26,063,479 ÷ 1,412,925 shares) | | $18.45 |
| Investor Class: | | |
| Net Asset Value, offering price and redemption price per share ($292,495,456 ÷ 15,831,403 shares) | | $18.48 |
See accompanying notes which are an integral part of the financial statements.
Statement of Operations
| | | Six months ended June 30, 2020 (Unaudited) |
| Investment Income | | |
| Dividends | | $4,631,053 |
| Income from Fidelity Central Funds (including $22,545 from security lending) | | 51,710 |
| Income before foreign taxes withheld | | 4,682,763 |
| Less foreign taxes withheld | | (527,980) |
| Total income | | 4,154,783 |
| Expenses | | |
| Management fee | $1,700,018 | |
| Transfer agent fees | 267,678 | |
| Distribution and service plan fees | 30,410 | |
| Accounting fees | 126,362 | |
| Custodian fees and expenses | 68,962 | |
| Independent trustees' fees and expenses | 1,611 | |
| Audit | 46,899 | |
| Legal | 1,348 | |
| Interest | 8,026 | |
| Miscellaneous | 12,620 | |
| Total expenses before reductions | 2,263,934 | |
| Expense reductions | (189,391) | |
| Total expenses after reductions | | 2,074,543 |
| Net investment income (loss) | | 2,080,240 |
| Realized and Unrealized Gain (Loss) | | |
| Net realized gain (loss) on: | | |
| Investment securities: | | |
| Unaffiliated issuers (net of foreign taxes of $28,338) | (19,551,893) | |
| Fidelity Central Funds | 596 | |
| Foreign currency transactions | (243,288) | |
| Total net realized gain (loss) | | (19,794,585) |
| Change in net unrealized appreciation (depreciation) on: | | |
| Investment securities: | | |
| Unaffiliated issuers (net of decrease in deferred foreign taxes of $230,524) | (552,307) | |
| Assets and liabilities in foreign currencies | (24,797) | |
| Total change in net unrealized appreciation (depreciation) | | (577,104) |
| Net gain (loss) | | (20,371,689) |
| Net increase (decrease) in net assets resulting from operations | | $(18,291,449) |
See accompanying notes which are an integral part of the financial statements.
Statement of Changes in Net Assets
| | Six months ended June 30, 2020 (Unaudited) | Year ended December 31, 2019 |
| Increase (Decrease) in Net Assets | | |
| Operations | | |
| Net investment income (loss) | $2,080,240 | $2,460,988 |
| Net realized gain (loss) | (19,794,585) | 29,953,570 |
| Change in net unrealized appreciation (depreciation) | (577,104) | 67,458,177 |
| Net increase (decrease) in net assets resulting from operations | (18,291,449) | 99,872,735 |
| Distributions to shareholders | (21,593,429) | (7,049,260) |
| Share transactions - net increase (decrease) | (94,586,322) | 210,100,139 |
| Total increase (decrease) in net assets | (134,471,200) | 302,923,614 |
| Net Assets | | |
| Beginning of period | 582,142,140 | 279,218,526 |
| End of period | $447,670,940 | $582,142,140 |
See accompanying notes which are an integral part of the financial statements.
Financial Highlights
VIP International Capital Appreciation Portfolio Initial Class
| | Six months ended (Unaudited) June 30, | Years endedDecember 31, | | | | |
| | 2020 | 2019 | 2018 | 2017 | 2016 | 2015 |
| Selected Per–Share Data | | | | | | |
| Net asset value, beginning of period | $19.50 | $14.82 | $17.39 | $12.80 | $13.32 | $13.01 |
| Income from Investment Operations | | | | | | |
| Net investment income (loss)A | .08 | .14B | .12 | .09 | .12 | .09 |
| Net realized and unrealized gain (loss) | (.34) | 4.79 | (2.31) | 4.57 | (.52) | .33 |
| Total from investment operations | (.26) | 4.93 | (2.19) | 4.66 | (.40) | .42 |
| Distributions from net investment income | – | (.09)C | (.12) | (.07) | (.11)C | (.10) |
| Distributions from net realized gain | (.61) | (.16)C | (.26) | – | – | – |
| Tax return of capital | – | – | – | – | (.01)C | (.01) |
| Total distributions | (.61) | (.25) | (.38) | (.07) | (.12) | (.11) |
| Redemption fees added to paid in capitalA | – | – | – | – | – | –D |
| Net asset value, end of period | $18.63 | $19.50 | $14.82 | $17.39 | $12.80 | $13.32 |
| Total ReturnE,F,G | (1.43)% | 33.33% | (12.75)% | 36.45% | (2.98)% | 3.22% |
| Ratios to Average Net AssetsH,I | | | | | | |
| Expenses before reductions | .86%J | .86% | .89% | .92% | .99% | .98% |
| Expenses net of fee waivers, if any | .86%J | .86% | .89% | .92% | .99% | .98% |
| Expenses net of all reductions | .78%J | .84% | .85% | .89% | .97% | .96% |
| Net investment income (loss) | .90%J | .78%B | .69% | .57% | .89% | .68% |
| Supplemental Data | | | | | | |
| Net assets, end of period (000 omitted) | $128,214 | $235,985 | $20,921 | $28,572 | $16,644 | $20,154 |
| Portfolio turnover rateK | 183%J | 137% | 184% | 153% | 188% | 189% |
A Calculated based on average shares outstanding during the period.
B Net investment income per share reflects a large, non-recurring dividend which amounted to $.06 per share. Excluding this non-recurring dividend, the ratio of net investment income (loss) to average net assets would have been .46%.
C The amounts shown reflect certain reclassifications related to book to tax differences that were made in the year shown.
D Amount represents less than $.005 per share.
E Total returns for periods of less than one year are not annualized.
F Total returns do not reflect charges attributable to your insurance company's separate account. Inclusion of these charges would reduce the total returns shown.
G Total returns would have been lower if certain expenses had not been reduced during the applicable periods shown.
H Fees and expenses of any underlying Fidelity Central Funds are not included in the Fund's expense ratio. The Fund indirectly bears its proportionate share of the expenses of any underlying Fidelity Central Funds.
I Expense ratios reflect operating expenses of the class. Expenses before reductions do not reflect amounts reimbursed by the investment adviser or reductions from brokerage service arrangements or reductions from other expense offset arrangements and do not represent the amount paid by the class during periods when reimbursements or reductions occur. Expenses net of fee waivers reflect expenses after reimbursement by the investment adviser but prior to reductions from brokerage service arrangements or other expense offset arrangements. Expenses net of all reductions represent the net expenses paid by the class.
J Annualized
K Amount does not include the portfolio activity of any underlying Fidelity Central Funds.
See accompanying notes which are an integral part of the financial statements.
VIP International Capital Appreciation Portfolio Service Class
| | Six months ended (Unaudited) June 30, | Years endedDecember 31, | | | | |
| | 2020 | 2019 | 2018 | 2017 | 2016 | 2015 |
| Selected Per–Share Data | | | | | | |
| Net asset value, beginning of period | $19.46 | $14.79 | $17.36 | $12.78 | $13.30 | $12.99 |
| Income from Investment Operations | | | | | | |
| Net investment income (loss)A | .07 | .12B | .10 | .07 | .10 | .08 |
| Net realized and unrealized gain (loss) | (.34) | 4.78 | (2.30) | 4.57 | (.51) | .32 |
| Total from investment operations | (.27) | 4.90 | (2.20) | 4.64 | (.41) | .40 |
| Distributions from net investment income | – | (.07)C | (.11) | (.06) | (.10)C | (.09) |
| Distributions from net realized gain | (.61) | (.16)C | (.26) | – | – | – |
| Tax return of capital | – | – | – | – | (.01)C | (.01) |
| Total distributions | (.61) | (.23) | (.37) | (.06) | (.11) | (.09)D |
| Redemption fees added to paid in capitalA | – | – | – | – | – | –E |
| Net asset value, end of period | $18.58 | $19.46 | $14.79 | $17.36 | $12.78 | $13.30 |
| Total ReturnF,G,H | (1.50)% | 33.15% | (12.85)% | 36.35% | (3.11)% | 3.12% |
| Ratios to Average Net AssetsI,J | | | | | | |
| Expenses before reductions | .96%K | .96% | .99% | 1.02% | 1.09% | 1.09% |
| Expenses net of fee waivers, if any | .96%K | .96% | .99% | 1.02% | 1.09% | 1.09% |
| Expenses net of all reductions | .88%K | .94% | .95% | .99% | 1.07% | 1.07% |
| Net investment income (loss) | .80%K | .68%B | .59% | .47% | .79% | .58% |
| Supplemental Data | | | | | | |
| Net assets, end of period (000 omitted) | $898 | $739 | $503 | $236 | $142 | $222 |
| Portfolio turnover rateL | 183%K | 137% | 184% | 153% | 188% | 189% |
A Calculated based on average shares outstanding during the period.
B Net investment income per share reflects a large, non-recurring dividend which amounted to $.06 per share. Excluding this non-recurring dividend, the ratio of net investment income (loss) to average net assets would have been .36%.
C The amounts shown reflect certain reclassifications related to book to tax differences that were made in the year shown.
D Total distributions of $.09 per share is comprised of distributions from net investment income of $.088 and distributions from net realized gain of $.006 per share.
E Amount represents less than $.005 per share.
F Total returns for periods of less than one year are not annualized.
G Total returns do not reflect charges attributable to your insurance company's separate account. Inclusion of these charges would reduce the total returns shown.
H Total returns would have been lower if certain expenses had not been reduced during the applicable periods shown.
I Fees and expenses of any underlying Fidelity Central Funds are not included in the Fund's expense ratio. The Fund indirectly bears its proportionate share of the expenses of any underlying Fidelity Central Funds.
J Expense ratios reflect operating expenses of the class. Expenses before reductions do not reflect amounts reimbursed by the investment adviser or reductions from brokerage service arrangements or reductions from other expense offset arrangements and do not represent the amount paid by the class during periods when reimbursements or reductions occur. Expenses net of fee waivers reflect expenses after reimbursement by the investment adviser but prior to reductions from brokerage service arrangements or other expense offset arrangements. Expenses net of all reductions represent the net expenses paid by the class.
K Annualized
L Amount does not include the portfolio activity of any underlying Fidelity Central Funds.
See accompanying notes which are an integral part of the financial statements.
VIP International Capital Appreciation Portfolio Service Class 2
| | Six months ended (Unaudited) June 30, | Years endedDecember 31, | | | | |
| | 2020 | 2019 | 2018 | 2017 | 2016 | 2015 |
| Selected Per–Share Data | | | | | | |
| Net asset value, beginning of period | $19.33 | $14.70 | $17.26 | $12.72 | $13.24 | $12.92 |
| Income from Investment Operations | | | | | | |
| Net investment income (loss)A | .06 | .09B | .07 | .05 | .08 | .06 |
| Net realized and unrealized gain (loss) | (.33) | 4.75 | (2.28) | 4.54 | (.50) | .32 |
| Total from investment operations | (.27) | 4.84 | (2.21) | 4.59 | (.42) | .38 |
| Distributions from net investment income | – | (.04)C | (.09) | (.05) | (.09)C | (.06) |
| Distributions from net realized gain | (.61) | (.16)C | (.26) | – | – | – |
| Tax return of capital | – | – | – | – | (.01)C | –D |
| Total distributions | (.61) | (.21)E | (.35) | (.05) | (.10) | (.06) |
| Redemption fees added to paid in capitalA | – | – | – | – | – | –D |
| Net asset value, end of period | $18.45 | $19.33 | $14.70 | $17.26 | $12.72 | $13.24 |
| Total ReturnF,G,H | (1.52)% | 32.93% | (12.98)% | 36.09% | (3.18)% | 2.96% |
| Ratios to Average Net AssetsI,J | | | | | | |
| Expenses before reductions | 1.11%K | 1.11% | 1.14% | 1.17% | 1.24% | 1.23% |
| Expenses net of fee waivers, if any | 1.11%K | 1.11% | 1.14% | 1.17% | 1.24% | 1.23% |
| Expenses net of all reductions | 1.03%K | 1.09% | 1.10% | 1.14% | 1.22% | 1.21% |
| Net investment income (loss) | .65%K | .53%B | .44% | .32% | .64% | .43% |
| Supplemental Data | | | | | | |
| Net assets, end of period (000 omitted) | $26,063 | $25,986 | $17,134 | $12,533 | $6,144 | $3,629 |
| Portfolio turnover rateL | 183%K | 137% | 184% | 153% | 188% | 189% |
A Calculated based on average shares outstanding during the period.
B Net investment income per share reflects a large, non-recurring dividend which amounted to $.06 per share. Excluding this non-recurring dividend, the ratio of net investment income (loss) to average net assets would have been .21%.
C The amounts shown reflect certain reclassifications related to book to tax differences that were made in the year shown.
D Amount represents less than $.005 per share.
E Total distributions of $.21 per share is comprised of distributions from net investment income of $.044 and distributions from net realized gain of $.161 per share.
F Total returns for periods of less than one year are not annualized.
G Total returns do not reflect charges attributable to your insurance company's separate account. Inclusion of these charges would reduce the total returns shown.
H Total returns would have been lower if certain expenses had not been reduced during the applicable periods shown.
I Fees and expenses of any underlying Fidelity Central Funds are not included in the Fund's expense ratio. The Fund indirectly bears its proportionate share of the expenses of any underlying Fidelity Central Funds.
J Expense ratios reflect operating expenses of the class. Expenses before reductions do not reflect amounts reimbursed by the investment adviser or reductions from brokerage service arrangements or reductions from other expense offset arrangements and do not represent the amount paid by the class during periods when reimbursements or reductions occur. Expenses net of fee waivers reflect expenses after reimbursement by the investment adviser but prior to reductions from brokerage service arrangements or other expense offset arrangements. Expenses net of all reductions represent the net expenses paid by the class.
K Annualized
L Amount does not include the portfolio activity of any underlying Fidelity Central Funds.
See accompanying notes which are an integral part of the financial statements.
VIP International Capital Appreciation Portfolio Investor Class
| | Six months ended (Unaudited) June 30, | Years endedDecember 31, | | | | |
| | 2020 | 2019 | 2018 | 2017 | 2016 | 2015 |
| Selected Per–Share Data | | | | | | |
| Net asset value, beginning of period | $19.35 | $14.71 | $17.26 | $12.71 | $13.22 | $12.92 |
| Income from Investment Operations | | | | | | |
| Net investment income (loss)A | .07 | .12B | .10 | .08 | .11 | .08 |
| Net realized and unrealized gain (loss) | (.33) | 4.75 | (2.28) | 4.54 | (.51) | .32 |
| Total from investment operations | (.26) | 4.87 | (2.18) | 4.62 | (.40) | .40 |
| Distributions from net investment income | – | (.07)C | (.11) | (.07) | (.10)C | (.09) |
| Distributions from net realized gain | (.61) | (.16)C | (.26) | – | – | – |
| Tax return of capital | – | – | – | – | (.01)C | (.01) |
| Total distributions | (.61) | (.23) | (.37) | (.07) | (.11) | (.10) |
| Redemption fees added to paid in capitalA | – | – | – | – | – | –D |
| Net asset value, end of period | $18.48 | $19.35 | $14.71 | $17.26 | $12.71�� | $13.22 |
| Total ReturnE,F,G | (1.45)% | 33.16% | (12.80)% | 36.33% | (3.01)% | 3.08% |
| Ratios to Average Net AssetsH,I | | | | | | |
| Expenses before reductions | .93%J | .94% | .97% | 1.00% | 1.07% | 1.07% |
| Expenses net of fee waivers, if any | .93%J | .94% | .97% | 1.00% | 1.07% | 1.06% |
| Expenses net of all reductions | .86%J | .92% | .93% | .97% | 1.05% | 1.04% |
| Net investment income (loss) | .82%J | .70%B | .61% | .49% | .80% | .60% |
| Supplemental Data | | | | | | |
| Net assets, end of period (000 omitted) | $292,495 | $319,432 | $240,661 | $286,191 | $155,518 | $165,258 |
| Portfolio turnover rateK | 183%J | 137% | 184% | 153% | 188% | 189% |
A Calculated based on average shares outstanding during the period.
B Net investment income per share reflects a large, non-recurring dividend which amounted to $.06 per share. Excluding this non-recurring dividend, the ratio of net investment income (loss) to average net assets would have been .38%.
C The amounts shown reflect certain reclassifications related to book to tax differences that were made in the year shown.
D Amount represents less than $.005 per share.
E Total returns for periods of less than one year are not annualized.
F Total returns do not reflect charges attributable to your insurance company's separate account. Inclusion of these charges would reduce the total returns shown.
G Total returns would have been lower if certain expenses had not been reduced during the applicable periods shown.
H Fees and expenses of any underlying Fidelity Central Funds are not included in the Fund's expense ratio. The Fund indirectly bears its proportionate share of the expenses of any underlying Fidelity Central Funds.
I Expense ratios reflect operating expenses of the class. Expenses before reductions do not reflect amounts reimbursed by the investment adviser or reductions from brokerage service arrangements or reductions from other expense offset arrangements and do not represent the amount paid by the class during periods when reimbursements or reductions occur. Expenses net of fee waivers reflect expenses after reimbursement by the investment adviser but prior to reductions from brokerage service arrangements or other expense offset arrangements. Expenses net of all reductions represent the net expenses paid by the class.
J Annualized
K Amount does not include the portfolio activity of any underlying Fidelity Central Funds.
See accompanying notes which are an integral part of the financial statements.
Notes to Financial Statements (Unaudited)
For the period ended June 30, 2020
1. Organization.
VIP International Capital Appreciation Portfolio (the Fund) is a fund of Variable Insurance Products Fund II (the Trust) and is authorized to issue an unlimited number of shares. The Trust is registered under the Investment Company Act of 1940, as amended (the 1940 Act), as an open-end management investment company organized as a Massachusetts business trust. Shares of the Fund may only be purchased by insurance companies for the purpose of funding variable annuity or variable life insurance contracts. The Fund offers the following classes of shares: Initial Class shares, Service Class shares, Service Class 2 shares and Investor Class shares. All classes have equal rights and voting privileges, except for matters affecting a single class. The Fund's investments in emerging markets can be subject to social, economic, regulatory, and political uncertainties and can be extremely volatile.
Effective January 1, 2020:
Investment advisers Fidelity Investments Money Management, Inc., FMR Co., Inc., and Fidelity SelectCo, LLC, merged with and into Fidelity Management & Research Company. In connection with the merger transactions, the resulting, merged investment adviser was then redomiciled from Massachusetts to Delaware, changed its corporate structure from a corporation to a limited liability company, and changed its name to "Fidelity Management & Research Company LLC".
Broker-dealer Fidelity Distributors Corporation merged with and into Fidelity Investments Institutional Services Company, Inc. ("FIISC"). FIISC was then redomiciled from Massachusetts to Delaware, changed its corporate structure from a corporation to a limited liability company, and changed its name to "Fidelity Distributors Company LLC".
Fidelity Investments Institutional Operations Company, Inc. converted from a Massachusetts corporation to a Massachusetts LLC, and changed its name to "Fidelity Investments Institutional Operations Company LLC".
2. Investments in Fidelity Central Funds.
The Fund invests in Fidelity Central Funds, which are open-end investment companies generally available only to other investment companies and accounts managed by the investment adviser and its affiliates. The Fund's Schedule of Investments lists each of the Fidelity Central Funds held as of period end, if any, as an investment of the Fund, but does not include the underlying holdings of each Fidelity Central Fund. As an Investing Fund, the Fund indirectly bears its proportionate share of the expenses of the underlying Fidelity Central Funds.
The Money Market Central Funds seek preservation of capital and current income and are managed by the investment adviser. Annualized expenses of the Money Market Central Funds as of their most recent shareholder report date ranged from less than .005% to .01%.
A complete unaudited list of holdings for each Fidelity Central Fund is available upon request or at the Securities and Exchange Commission (the SEC) website at www.sec.gov. In addition, the financial statements of the Fidelity Central Funds are available on the SEC website or upon request.
3. Significant Accounting Policies.
The Fund is an investment company and applies the accounting and reporting guidance of the Financial Accounting Standards Board (FASB) Accounting Standards Codification Topic 946 Financial Services – Investments Companies. The financial statements have been prepared in conformity with accounting principles generally accepted in the United States of America (GAAP), which require management to make certain estimates and assumptions at the date of the financial statements. Actual results could differ from those estimates. Subsequent events, if any, through the date that the financial statements were issued have been evaluated in the preparation of the financial statements. The following summarizes the significant accounting policies of the Fund:
Investment Valuation. Investments are valued as of 4:00 p.m. Eastern time on the last calendar day of the period. The Board of Trustees (the Board) has delegated the day to day responsibility for the valuation of the Fund's investments to the Fair Value Committee (the Committee) established by the Fund's investment adviser. In accordance with valuation policies and procedures approved by the Board, the Fund attempts to obtain prices from one or more third party pricing vendors or brokers to value its investments. When current market prices, quotations or currency exchange rates are not readily available or reliable, investments will be fair valued in good faith by the Committee, in accordance with procedures adopted by the Board. Factors used in determining fair value vary by investment type and may include market or investment specific events. The frequency with which these procedures are used cannot be predicted and they may be utilized to a significant extent. The Committee oversees the Fund's valuation policies and procedures and reports to the Board on the Committee's activities and fair value determinations. The Board monitors the appropriateness of the procedures used in valuing the Fund's investments and ratifies the fair value determinations of the Committee.
The Fund categorizes the inputs to valuation techniques used to value its investments into a disclosure hierarchy consisting of three levels as shown below:
- Level 1 – quoted prices in active markets for identical investments
- Level 2 – other significant observable inputs (including quoted prices for similar investments, interest rates, prepayment speeds, etc.)
- Level 3 – unobservable inputs (including the Fund's own assumptions based on the best information available)
Valuation techniques used to value the Fund's investments by major category are as follows:
Equity securities, including restricted securities, for which market quotations are readily available, are valued at the last reported sale price or official closing price as reported by a third party pricing vendor on the primary market or exchange on which they are traded and are categorized as Level 1 in the hierarchy. In the event there were no sales during the day or closing prices are not available, securities are valued at the last quoted bid price or may be valued using the last available price and are generally categorized as Level 2 in the hierarchy. For foreign equity securities, when market or security specific events arise, comparisons to the valuation of American Depositary Receipts (ADRs), futures contracts, Exchange-Traded Funds (ETFs) and certain indexes as well as quoted prices for similar securities may be used and would be categorized as Level 2 in the hierarchy. For equity securities, including restricted securities, where observable inputs are limited, assumptions about market activity and risk are used and these securities may be categorized as Level 3 in the hierarchy.
Investments in open-end mutual funds, including the Fidelity Central Funds, are valued at their closing net asset value (NAV) each business day and are categorized as Level 1 in the hierarchy.
Changes in valuation techniques may result in transfers in or out of an assigned level within the disclosure hierarchy. The aggregate value of investments by input level as of June 30, 2020 is included at the end of the Fund's Schedule of Investments.
Foreign Currency. The Fund may use foreign currency contracts to facilitate transactions in foreign-denominated securities. Gains and losses from these transactions may arise from changes in the value of the foreign currency or if the counterparties do not perform under the contracts' terms.
Foreign-denominated assets, including investment securities, and liabilities are translated into U.S. dollars at the exchange rates at period end. Purchases and sales of investment securities, income and dividends received and expenses denominated in foreign currencies are translated into U.S. dollars at the exchange rate in effect on the transaction date.
The effects of exchange rate fluctuations on investments are included with the net realized and unrealized gain (loss) on investment securities. Other foreign currency transactions resulting in realized and unrealized gain (loss) are disclosed separately.
Investment Transactions and Income. For financial reporting purposes, the Fund's investment holdings and NAV include trades executed through the end of the last business day of the period. The NAV per share for processing shareholder transactions is calculated as of the close of business of the New York Stock Exchange (NYSE), normally 4:00 p.m. Eastern time and includes trades executed through the end of the prior business day. Gains and losses on securities sold are determined on the basis of identified cost. Dividend income is recorded on the ex-dividend date, except for certain dividends from foreign securities where the ex-dividend date may have passed, which are recorded as soon as the Fund is informed of the ex-dividend date. Non-cash dividends included in dividend income, if any, are recorded at the fair market value of the securities received. Income and capital gain distributions from Fidelity Central Funds, if any, are recorded on the ex-dividend date. Certain distributions received by the Fund represent a return of capital or capital gain. The Fund determines the components of these distributions subsequent to the ex-dividend date, based upon receipt of tax filings or other correspondence relating to the underlying investment. These distributions are recorded as a reduction of cost of investments and/or as a realized gain. Investment income is recorded net of foreign taxes withheld where recovery of such taxes is uncertain.
Class Allocations and Expenses. Investment income, realized and unrealized capital gains and losses, common expenses of the Fund, and certain fund-level expense reductions, if any, are allocated daily on a pro-rata basis to each class based on the relative net assets of each class to the total net assets of the Fund. Each class differs with respect to transfer agent and distribution and service plan fees incurred. Certain expense reductions may also differ by class. For the reporting period, the allocated portion of income and expenses to each class as a percent of its average net assets may vary due to the timing of recording these transactions in relation to fluctuating net assets of the classes. Expenses directly attributable to a fund are charged to that fund. Expenses attributable to more than one fund are allocated among the respective funds on the basis of relative net assets or other appropriate methods. Expense estimates are accrued in the period to which they relate and adjustments are made when actual amounts are known.
Income Tax Information and Distributions to Shareholders. Each year, the Fund intends to qualify as a regulated investment company under Subchapter M of the Internal Revenue Code, including distributing substantially all of its taxable income and realized gains. As a result, no provision for U.S. Federal income taxes is required. The Fund files a U.S. federal tax return, in addition to state and local tax returns as required. The Fund's federal income tax returns are subject to examination by the Internal Revenue Service (IRS) for a period of three fiscal years after they are filed. State and local tax returns may be subject to examination for an additional fiscal year depending on the jurisdiction. Foreign taxes are provided for based on the Fund's understanding of the tax rules and rates that exist in the foreign markets in which it invests. The Fund is subject to a tax imposed on capital gains by certain countries in which it invests.
Distributions are declared and recorded on the ex-dividend date. Income and capital gain distributions are declared separately for each class. Income and capital gain distributions are determined in accordance with income tax regulations, which may differ from GAAP.
Capital accounts within the financial statements are adjusted for permanent book-tax differences. These adjustments have no impact on net assets or the results of operations. Capital accounts are not adjusted for temporary book-tax differences which will reverse in a subsequent period.
Book-tax differences are primarily due to foreign currency transactions, certain foreign taxes, passive foreign investment companies (PFIC) and losses deferred due to wash sales and excise tax regulations.
As of period end, the cost and unrealized appreciation (depreciation) in securities, and derivatives if applicable, for federal income tax purposes were as follows:
| Gross unrealized appreciation | $95,003,031 |
| Gross unrealized depreciation | (3,119,483) |
| Net unrealized appreciation (depreciation) | $91,883,548 |
| Tax cost | $352,843,454 |
Restricted Securities (including Private Placements). The Fund may invest in securities that are subject to legal or contractual restrictions on resale. These securities generally may be resold in transactions exempt from registration or to the public if the securities are registered. Disposal of these securities may involve time-consuming negotiations and expense, and prompt sale at an acceptable price may be difficult. Information regarding restricted securities is included at the end of the Fund's Schedule of Investments.
4. Purchases and Sales of Investments.
Purchases and sales of securities, other than short-term securities are noted in the table below.
| | Purchases ($) | Sales ($) |
| VIP International Capital Appreciation Portfolio | 459,776,588 | 573,948,405 |
5. Fees and Other Transactions with Affiliates.
Management Fee. Fidelity Management & Research Company LLC (the investment adviser) and its affiliates provide the Fund with investment management related services for which the Fund pays a monthly management fee. The management fee is the sum of an individual fund fee rate that is based on an annual rate of .45% of the Fund's average net assets and an annualized group fee rate that averaged .23% during the period. The group fee rate is based upon the monthly average net assets of a group of registered investment companies with which the investment adviser has management contracts. The group fee rate decreases as assets under management increase and increases as assets under management decrease. For the reporting period, the total annualized management fee rate was .69% of the Fund's average net assets.
Distribution and Service Plan Fees. In accordance with Rule 12b-1 of the 1940 Act, the Fund has adopted separate 12b-1 Plans for each Service Class of shares. Each Service Class pays Fidelity Distributors Company LLC (FDC), an affiliate of the investment adviser, a service fee. For the period, the service fee is based on an annual rate of .10% of Service Class' average net assets and .25% of Service Class 2's average net assets.
For the period, total fees, all of which were re-allowed to insurance companies for the distribution of shares and providing shareholder support services, were as follows:
| Service Class | $374 |
| Service Class 2 | 30,036 |
| | $30,410 |
Transfer Agent Fees. Fidelity Investments Institutional Operations Company LLC (FIIOC), an affiliate of the investment adviser, is the Fund's transfer, dividend disbursing, and shareholder servicing agent. FIIOC receives an asset-based fee with respect to each class. Each class pays a fee for transfer agent services, typesetting and printing and mailing of shareholder reports, excluding mailing of proxy statements. Effective February 1, 2020, the Board approved to change the fee from .145% to .142% for Investor Class, and from .065% to .064% for all other classes. For the period, transfer agent fees for each class were as follows:
| | Amount | % of Class-Level Average Net Assets(a) |
| Initial Class | $58,035 | .06 |
| Service Class | 236 | .06 |
| Service Class 2 | 7,571 | .06 |
| Investor Class | 201,836 | .14 |
| | $267,678 | |
(a) Annualized
Accounting Fees. Fidelity Service Company, Inc. (FSC), an affiliate of the investment adviser, maintains the Fund's accounting records. The accounting fee is based on the level of average net assets for each month. For the period, the fees were equivalent to the following annualized rates:
| | % of Average Net Assets |
| VIP International Capital Appreciation Portfolio | .05 |
Brokerage Commissions. A portion of portfolio transactions were placed with brokerage firms which are affiliates of the investment adviser. Brokerage commissions are included in net realized gain (loss) and change in net unrealized appreciation (depreciation) in the Statement of Operations. The commissions paid to these affiliated firms were as follows:
| | Amount |
| VIP International Capital Appreciation Portfolio | $2,533 |
Interfund Lending Program. Pursuant to an Exemptive Order issued by the SEC, the fund, along with other registered investment companies having management contracts with Fidelity Management & Research Company LLC (FMR), or other affiliated entities of FMR, may participate in an interfund lending program. This program provides an alternative credit facility allowing the fund to borrow from, or lend money to, other participating affiliated funds. At period end, there were no interfund loans outstanding. Activity in this program during the period for which loans were outstanding was as follows:
| | Borrower or Lender | Average Loan Balance | Weighted Average Interest Rate | Interest Expense |
| VIP International Capital Appreciation Portfolio | Borrower | $15,282,667 | 1.26% | $8,026 |
Interfund Trades. Funds may purchase from or sell securities to other Fidelity Funds under procedures adopted by the Board. The procedures have been designed to ensure these interfund trades are executed in accordance with Rule 17a-7 of the 1940 Act. Interfund trades are included within the respective purchases and sales amounts shown in the Purchases and Sales of Investments note.
6. Committed Line of Credit.
Certain Funds participate with other funds managed by the investment adviser or an affiliate in a $4.25 billion credit facility (the "line of credit") to be utilized for temporary or emergency purposes to fund shareholder redemptions or for other short-term liquidity purposes. The participating funds have agreed to pay commitment fees on their pro-rata portion of the line of credit, which are reflected in Miscellaneous expenses on the Statement of Operations, and are as follows:
| | Amount |
| VIP International Capital Appreciation Portfolio | $647 |
7. Security Lending.
The Fund lends portfolio securities from time to time in order to earn additional income. For equity securities, lending agents are used, including National Financial Services (NFS), an affiliate of the Fund. Pursuant to a securities lending agreement, NFS will receive a fee, which is capped at 9.9% of daily lending revenue, for its services as lending agent. The Fund may lend securities to certain qualified borrowers, including NFS. On the settlement date of the loan, the Fund receives collateral (in the form of U.S. Treasury obligations, letters of credit and/or cash) against the loaned securities and maintains collateral in an amount not less than 100% of the market value of the loaned securities during the period of the loan. The market value of the loaned securities is determined at the close of business of the Fund and any additional required collateral is delivered to the Fund on the next business day. The Fund or borrower may terminate the loan at any time, and if the borrower defaults on its obligation to return the securities loaned because of insolvency or other reasons, the Fund may apply collateral received from the borrower against the obligation. The Fund may experience delays and costs in recovering the securities loaned. Any cash collateral received is invested in the Fidelity Securities Lending Cash Central Fund. The value of loaned securities and cash collateral at period end are disclosed on the Fund's Statement of Assets and Liabilities. Total fees paid by the Fund to NFS, as lending agent, amounted to $331. Security lending income represents the income earned on investing cash collateral, less rebates paid to borrowers and any lending agent fees associated with the loan, plus any premium payments received for lending certain types of securities. Security lending income is presented in the Statement of Operations as a component of income from Fidelity Central Funds. During the period, there were no securities loaned to NFS.
8. Expense Reductions.
Commissions paid to certain brokers with whom the investment adviser, or its affiliates, places trades on behalf of the Fund include an amount in addition to trade execution, which may be rebated back to the Fund to offset certain expenses. This amount totaled $184,572 for the period. In addition, through arrangements with the Fund's custodian, credits realized as a result of certain uninvested cash balances were used to reduce the Fund's expenses. During the period, custodian credits reduced the Fund's expenses by $3,676.
In addition, during the period the investment adviser or an affiliate reimbursed and/or waived a portion of fund-level operating expenses in the amount of $1,143.
9. Distributions to Shareholders.
Distributions to shareholders of each class were as follows:
| | Six months ended
June 30, 2020 | Year ended
December 31, 2019 |
| Distributions to shareholders | | |
| Initial Class | $10,532,707 | $3,006,827 |
| Service Class | 22,095 | 8,372 |
| Service Class 2 | 821,016 | 273,250 |
| Investor Class | 10,217,611 | 3,760,811 |
| Total | $21,593,429 | $7,049,260 |
10. Share Transactions.
Transactions for each class of shares were as follows:
| | Shares | Shares | Dollars | Dollars |
| | Six months ended June 30, 2020 | Year ended December 31, 2019 | Six months ended June 30, 2020 | Year ended December 31, 2019 |
| Initial Class | | | | |
| Shares sold | 5,224,875 | 10,785,295 | $104,026,589 | $203,835,613 |
| Reinvestment of distributions | 543,764 | 158,588 | 10,532,707 | 3,006,827 |
| Shares redeemed | (10,989,063) | (252,058) | (201,720,587) | (4,413,276) |
| Net increase (decrease) | (5,220,424) | 10,691,825 | $(87,161,291) | $202,429,164 |
| Service Class | | | | |
| Shares sold | 14,855 | 14,556 | $258,772 | $263,840 |
| Reinvestment of distributions | 974 | 378 | 18,820 | 7,157 |
| Shares redeemed | (5,505) | (10,941) | (102,048) | (202,995) |
| Net increase (decrease) | 10,324 | 3,993 | $175,544 | $68,002 |
| Service Class 2 | | | | |
| Shares sold | 375,487 | 586,179 | $6,547,102 | $10,272,648 |
| Reinvestment of distributions | 42,761 | 14,535 | 821,016 | 273,250 |
| Shares redeemed | (349,482) | (422,273) | (6,221,869) | (7,543,579) |
| Net increase (decrease) | 68,766 | 178,441 | $1,146,249 | $3,002,319 |
| Investor Class | | | | |
| Shares sold | 534,947 | 1,939,976 | $9,955,909 | $34,794,598 |
| Reinvestment of distributions | 531,613 | 199,831 | 10,217,611 | 3,760,811 |
| Shares redeemed | (1,744,123) | (1,996,670) | (28,920,344) | (33,954,755) |
| Net increase (decrease) | (677,563) | 143,137 | $(8,746,824) | $4,600,654 |
11. Other.
The Fund's organizational documents provide former and current trustees and officers with a limited indemnification against liabilities arising in connection with the performance of their duties to the Fund. In the normal course of business, the Fund may also enter into contracts that provide general indemnifications. The Fund's maximum exposure under these arrangements is unknown as this would be dependent on future claims that may be made against the Fund. The risk of material loss from such claims is considered remote.
At the end of the period, the investment adviser or its affiliates were the owners of record of 70% of the total outstanding shares of the Fund and one otherwise unaffiliated shareholder was the owner of record of 23% of the total outstanding shares of the Fund.
12. Coronavirus (COVID-19) Pandemic.
An outbreak of COVID-19 first detected in China during December 2019 has since spread globally and was declared a pandemic by the World Health Organization during March 2020. Developments that disrupt global economies and financial markets, such as the COVID-19 pandemic, may magnify factors that affect the Fund's performance.
Shareholder Expense Example
As a shareholder of the Fund, you incur two types of costs: (1) transaction costs and (2) ongoing costs, including management fees, distribution and/or service (12b-1) fees and other Fund expenses. This Example is intended to help you understand your ongoing costs (in dollars) of investing in the Fund and to compare these costs with the ongoing costs of investing in other mutual funds.
The Example is based on an investment of $1,000 invested at the beginning of the period and held for the entire period (January 1, 2020 to June 30, 2020).
Actual Expenses
The first line of the accompanying table for each class of the Fund provides information about actual account values and actual expenses. You may use the information in this line, together with the amount you invested, to estimate the expenses that you paid over the period. Simply divide your account value by $1,000.00 (for example, an $8,600 account value divided by $1,000.00 = 8.6), then multiply the result by the number in the first line for a class of the Fund under the heading entitled "Expenses Paid During Period" to estimate the expenses you paid on your account during this period. The estimate of expenses does not include any fees or other expenses of any variable annuity or variable life insurance product. If they were, the estimate of expenses you paid during the period would be higher, and your ending account value would be lower. In addition, the Fund, as a shareholder in the underlying Fidelity Central Funds, will indirectly bear its pro-rata share of the fees and expenses incurred by the underlying Fidelity Central Funds. These fees and expenses are not included in the Fund's annualized expense ratio used to calculate the expense estimate in the table below.
Hypothetical Example for Comparison Purposes
The second line of the accompanying table for each class of the Fund provides information about hypothetical account values and hypothetical expenses based on a Class' actual expense ratio and an assumed rate of return of 5% per year before expenses, which is not the Class' actual return. The hypothetical account values and expenses may not be used to estimate the actual ending account balance or expenses you paid for the period. You may use this information to compare the ongoing costs of investing in the Fund and other funds. To do so, compare this 5% hypothetical example with the 5% hypothetical examples that appear in the shareholder reports of the other funds. The estimate of expenses does not include any fees or other expenses of any variable annuity or variable life insurance product. If they were, the estimate of expenses you paid during the period would be higher, and your ending account value would be lower. In addition, the Fund, as a shareholder in the underlying Fidelity Central Funds, will indirectly bear its pro-rata share of the fees and expenses incurred by the underlying Fidelity Central Funds. These fees and expenses are not included in the Fund's annualized expense ratio used to calculate the expense estimate in the table below.
Please note that the expenses shown in the table are meant to highlight your ongoing costs only and do not reflect any transaction costs. Therefore, the second line of the table is useful in comparing ongoing costs only, and will not help you determine the relative total costs of owning different funds.
| | Annualized Expense Ratio-A | Beginning
Account Value
January 1, 2020 | Ending
Account Value
June 30, 2020 | Expenses Paid
During Period-B
January 1, 2020
to June 30, 2020 |
| Initial Class | .86% | | | |
| Actual | | $1,000.00 | $985.70 | $4.25 |
| Hypothetical-C | | $1,000.00 | $1,020.59 | $4.32 |
| Service Class | .96% | | | |
| Actual | | $1,000.00 | $985.00 | $4.74 |
| Hypothetical-C | | $1,000.00 | $1,020.09 | $4.82 |
| Service Class 2 | 1.11% | | | |
| Actual | | $1,000.00 | $984.80 | $5.48 |
| Hypothetical-C | | $1,000.00 | $1,019.34 | $5.57 |
| Investor Class | .93% | | | |
| Actual | | $1,000.00 | $985.50 | $4.59 |
| Hypothetical-C | | $1,000.00 | $1,020.24 | $4.67 |
A Annualized expense ratio reflects expenses net of applicable fee waivers.
B Expenses are equal to each Class' annualized expense ratio, multiplied by the average account value over the period, multiplied by 182/366 (to reflect the one-half year period).
C 5% return per year before expenses
Board Approval of Investment Advisory Contracts and Management Fees
VIP International Capital Appreciation Portfolio
Each year, the Board of Trustees, including the Independent Trustees (together, the Board), votes on the renewal of the management contract with Fidelity Management & Research Company LLC (FMR) and the sub-advisory agreements (together, the Advisory Contracts) for the fund. FMR and the sub-advisers are referred to herein as the Investment Advisers. The Board, assisted by the advice of fund counsel and Independent Trustees' counsel, requests and considers a broad range of information relevant to the renewal of the Advisory Contracts throughout the year.
The Board meets regularly and, at each of its meetings, covers an extensive agenda of topics and materials and considers factors that are relevant to its annual consideration of the renewal of the fund's Advisory Contracts, including the services and support provided to the fund and its shareholders. The Board has established various standing committees (Committees), each composed of and chaired by Independent Trustees with varying backgrounds, to which the Board has assigned specific subject matter responsibilities in order to enhance effective decision-making by the Board. The Board, acting directly and through its Committees, requests and receives information concerning the annual consideration of the renewal of the fund's Advisory Contracts. The Board also meets as needed to review matters specifically related to the Board's annual consideration of the renewal of the Advisory Contracts. Members of the Board may also meet with trustees of other Fidelity funds through joint ad hoc committees to discuss certain matters relevant to all of the Fidelity funds.
At its January 2020 meeting, the Board unanimously determined to renew the fund's Advisory Contracts. In reaching its determination, the Board considered all factors it believed relevant, including (i) the nature, extent, and quality of the services provided to the fund and its shareholders (including the investment performance of the fund); (ii) the competitiveness of the fund's management fee and total expense ratio relative to peer funds; (iii) the total costs of the services provided by and the profits realized by Fidelity from its relationships with the fund; and (iv) the extent to which, if any, economies of scale exist and are realized as the fund grows, and whether any economies of scale are appropriately shared with fund shareholders.
In considering whether to renew the Advisory Contracts for the fund, the Board reached a determination, with the assistance of fund counsel and Independent Trustees' counsel and through the exercise of its business judgment, that the renewal of the Advisory Contracts was in the best interests of the fund and its shareholders and that the compensation payable under the Advisory Contracts was fair and reasonable. The Board's decision to renew the Advisory Contracts was not based on any single factor, but rather was based on a comprehensive consideration of all the information provided to the Board at its meetings throughout the year. The Board, in reaching its determination to renew the Advisory Contracts, was aware that shareholders of the fund have a broad range of investment choices available to them, including a wide choice among funds offered by Fidelity's competitors, and that the fund's shareholders, who have the opportunity to review and weigh the disclosure provided by the fund in its prospectus and other public disclosures, have chosen to invest in this fund, which is part of the Fidelity family of funds.
Nature, Extent, and Quality of Services Provided. The Board considered Fidelity's staffing as it relates to the fund, including the backgrounds of investment personnel of Fidelity, and also considered the fund's investment objective, strategies, and related investment philosophy. The Independent Trustees also had discussions with senior management of Fidelity's investment operations and investment groups. The Board considered the structure of the investment personnel compensation program and whether this structure provides appropriate incentives to act in the best interests of the fund. Additionally, the Board considered the portfolio managers' investments, if any, in the funds that they manage.
Resources Dedicated to Investment Management and Support Services. The Board and the Fund Oversight and Research Committees reviewed the general qualifications and capabilities of Fidelity's investment staff, including its size, education, experience, and resources, as well as Fidelity's approach to recruiting, training, managing, and compensating investment personnel. The Board noted that Fidelity has continued to increase the resources devoted to non-U.S. offices, including expansion of Fidelity's global investment organization. The Board also noted that Fidelity's analysts have extensive resources, tools and capabilities that allow them to conduct sophisticated quantitative and fundamental analysis, as well as credit analysis of issuers, counterparties and guarantors. Further, the Board considered that Fidelity's investment professionals have sufficient access to global information and data so as to provide competitive investment results over time, and that those professionals also have access to sophisticated tools that permit them to assess portfolio construction and risk and performance attribution characteristics continuously, as well as to transmit new information and research conclusions rapidly around the world. Additionally, in its deliberations, the Board considered Fidelity's trading, risk management, compliance, and technology and operations capabilities and resources, which are integral parts of the investment management process.
Shareholder and Administrative Services. The Board considered (i) the nature, extent, quality, and cost of advisory, administrative, and shareholder services performed by the Investment Advisers and their affiliates under the Advisory Contracts and under separate agreements covering transfer agency, pricing and bookkeeping, and securities lending services for the fund; (ii) the nature and extent of the supervision of third party service providers, principally custodians, subcustodians, and pricing vendors; and (iii) the resources devoted to, and the record of compliance with, the fund's compliance policies and procedures. The Board also reviewed the allocation of fund brokerage, including allocations to brokers affiliated with the Investment Advisers, the use of brokerage commissions to pay fund expenses, and the use of "soft" commission dollars to pay for research services.
The Board noted that the growth of fund assets over time across the complex allows Fidelity to reinvest in the development of services designed to enhance the value and convenience of the Fidelity funds as investment vehicles. These services include 24-hour access to account information and market information over the Internet and through telephone representatives, investor education materials and asset allocation tools, and the expanded availability of Fidelity Investor Centers.
The Board noted that it and the boards of certain other Fidelity funds had formed an ad hoc Committee on Transfer Agency Fees to review the variety of transfer agency fee structures throughout the industry and Fidelity's competitive positioning with respect to industry participants.
Investment in a Large Fund Family. The Board considered the benefits to shareholders of investing in a Fidelity fund, including the benefits of investing in a fund that is part of a large family of funds offering a variety of investment disciplines and providing a large variety of mutual fund investor services. The Board noted that Fidelity had taken, or had made recommendations that resulted in the Fidelity funds taking, a number of actions over the previous year that benefited particular funds, including: (i) continuing to dedicate additional resources to Fidelity's investment research process, which includes meetings with management of issuers of securities in which the funds invest, and to the support of the senior management team that oversees asset management; (ii) continuing efforts to enhance Fidelity's global research capabilities; (iii) launching new funds and ETFs with innovative structures, strategies and pricing and making other enhancements to meet client needs; (iv) launching new share classes of existing funds; (v) eliminating purchase minimums and broadening eligibility requirements for certain funds and share classes; (vi) reducing management fees and total expenses for certain target date funds and index funds; (vii) lowering expense caps for certain existing funds and classes, and converting certain voluntary expense caps to contractual caps, to reduce expenses borne by shareholders; (viii) rationalizing product lines and gaining increased efficiencies from fund mergers, liquidations, and share class consolidations; (ix) continuing to develop, acquire and implement systems and technology to improve services to the funds and shareholders, strengthen information security, and increase efficiency; and (x) continuing to implement enhancements to further strengthen Fidelity's product line to increase investors' probability of success in achieving their investment goals, including retirement income goals.
Investment Performance. The Board considered whether the fund has operated in accordance with its investment objective, as well as its record of compliance with its investment restrictions and its performance history.
The Board took into account discussions that occur at Board meetings throughout the year with representatives of the Investment Advisers about fund investment performance. In this regard the Board noted that as part of regularly scheduled fund reviews and other reports to the Board on fund performance, the Board considers annualized return information for the fund for different time periods, measured against an appropriate securities market index (benchmark index) and a peer group of funds with similar objectives (peer group), if any. In its evaluation of fund investment performance, the Board gave particular attention to information indicating changes in performance of certain Fidelity funds for specific time periods and discussed with the Investment Advisers the reasons for any overperformance or underperformance.
In addition to reviewing absolute and relative fund performance, the Independent Trustees periodically consider the appropriateness of fund performance metrics in evaluating the results achieved. In general, the Independent Trustees believe that fund performance should be evaluated based on net performance (after fees and expenses) of both the highest performing and lowest performing fund share classes, where applicable, compared to appropriate benchmark indices, over appropriate time periods that may include full market cycles, and compared to peer groups, as applicable, over the same periods, taking into account relevant factors including the following: general market conditions; issuer-specific information; and fund cash flows and other factors.
The Independent Trustees recognize that shareholders evaluate performance on a net basis over their own holding periods, for which one-, three-, and five-year periods are often used as a proxy. For this reason, the performance information reviewed by the Board also included net cumulative total return information for the fund and an appropriate benchmark index and peer group for the most recent one-, three-, and five-year periods ended June 30, 2019, as shown below. Returns are shown compared to the 25th percentile (top of box, 75% beaten) and 75th percentile (bottom of box, 25% beaten) of the peer universe. Returns of the benchmark index are "net MA," i.e., adjusted for tax withholding rates applicable to U.S.-based funds organized as Massachusetts business trusts.
VIP International Capital Appreciation Portfolio
Based on its review, the Board concluded that the nature, extent, and quality of services provided to the fund under the Advisory Contracts should continue to benefit the shareholders of the fund.
Competitiveness of Management Fee and Total Expense Ratio. The Board considered the fund's management fee and total expense ratio compared to "mapped groups" of competitive funds and classes created for the purpose of facilitating the Trustees' competitive analysis of management fees and total expenses. Fidelity creates "mapped groups" by combining similar Lipper investment objective categories that have comparable investment mandates. Combining Lipper investment objective categories aids the Board's management fee and total expense ratio comparisons by broadening the competitive group used for comparison.
Management Fee. The Board considered two proprietary management fee comparisons for the 12-month periods ended June 30 (December 31 for periods prior to 2018) shown in basis points (BP) in the chart below. The group of Lipper funds used by the Board for management fee comparisons is referred to below as the "Total Mapped Group." The Total Mapped Group comparison focuses on a fund's standing in terms of gross management fees before expense reimbursements or caps relative to the total universe of funds with comparable investment mandates, regardless of whether their management fee structures also are comparable. Funds with comparable investment mandates offer exposure to similar types of securities. Funds with comparable management fee structures have similar management fee contractual arrangements (
e.g., flat rate charged for advisory services, all-inclusive fee rate,
etc.). "TMG %" represents the percentage of funds in the Total Mapped Group that had management fees that were lower than the fund's. For example, a hypothetical TMG % of 20% would mean that 80% of the funds in the Total Mapped Group had higher, and 20% had lower, management fees than the fund. The fund's actual TMG %s and the number of funds in the Total Mapped Group are in the chart below. The "Asset-Sized Peer Group" (ASPG) comparison focuses on a fund's standing relative to a subset of non-Fidelity funds within the Total Mapped Group that are similar in size and management fee structure. For example, if a fund is in the first quartile of the ASPG, the fund's management fee ranks in the least expensive or lowest 25% of funds in the ASPG. The ASPG represents at least 15% of the funds in the Total Mapped Group with comparable asset size and management fee structures, subject to a minimum of 50 funds (or all funds in the Total Mapped Group if fewer than 50). Additional information, such as the ASPG quartile in which the fund's management fee rate ranked, is also included in the chart and was considered by the Board.
VIP International Capital Appreciation Portfolio
The Board noted that the fund's management fee rate ranked below the median of its Total Mapped Group and below the median of its ASPG for the 12-month period ended June 30, 2019.
The Board noted that it and the boards of other Fidelity funds formed an ad hoc Committee on Group Fee, which meets periodically, to conduct an in-depth review of the "group fee" component of the management fee of funds with such management fee structures. The Committee's focus included the mechanics of the group fee, the competitive landscape of group fee structures, Fidelity funds with no group fee component and investment products not included in group fee assets. The Board also considered that, for funds subject to the group fee, FMR agreed to voluntarily waive fees over a specified period of time in amounts designed to account for assets converted from certain funds to certain collective investment trusts.
The Board also noted that, in 2013, the ad hoc Committee on Management Fees was formed to conduct an in-depth review of the management fee rates of Fidelity's active equity mutual funds. The Committee focused on the following areas: (i) standard fee structures; (ii) research consumption and trading evolution; (iii) management fee competitiveness/profitability by category; and (iv) factors that drive institutional pricing.
Based on its review, the Board concluded that the fund's management fee is fair and reasonable in light of the services that the fund receives and the other factors considered.
Total Expense Ratio. In its review of each class's total expense ratio, the Board considered the fund's management fee rate as well as other fund or class expenses, as applicable, such as transfer agent fees, pricing and bookkeeping fees, fund-paid 12b-1 fees, and custodial, legal, and audit fees. The Board also noted that Fidelity may agree to waive fees or reimburse expenses from time to time, and the extent to which, if any, it has done so for the fund. As part of its review, the Board also considered the current and historical total expense ratios of each class of the fund compared to competitive fund median expenses. Each class of the fund is compared to those funds and classes in the Total Mapped Group (used by the Board for management fee comparisons) that have a similar sales load structure.
The Board noted that the total expense ratio of each of Initial Class, Investor Class, and Service Class ranked below the competitive median for the 12-month period ended June 30, 2019 and the total expense ratio of Service Class 2 ranked above the competitive median for the 12-month period ended June 30, 2019. The Board considered that, in general, various factors can affect total expense ratios. The Board noted that the total expense ratio of Service Class 2 was above the competitive median because of its 12b-1 fees and that excluding 12b-1 fees of both the class and the competitor classes, the total expense ratio of Service Class 2 ranked below the median. The Board noted that the fund offers multiple classes, each of which has a different 12b-1 fee structure, and that the multiple structures are intended to offer a range of pricing options for the intermediary market. The Board also noted that the total expense ratios of the classes vary primarily by the level of their 12b-1 fees, although differences in transfer agent fees may also cause expenses to vary from class to class.
Fees Charged to Other Fidelity Clients. The Board also considered Fidelity fee structures and other information with respect to clients of Fidelity, such as other funds advised or subadvised by Fidelity, pension plan clients, and other institutional clients with similar mandates. The Board noted that a joint ad hoc committee created by it and the boards of other Fidelity funds periodically reviews and compares Fidelity's institutional investment advisory business with its business of providing services to the Fidelity funds and also noted the most recent findings of the committee. The Board noted that the committee's review included a consideration of the differences in services provided, fees charged, and costs incurred, as well as competition in the markets serving the different categories of clients.
Based on its review of total expense ratios and fees charged to other Fidelity clients, the Board concluded that the total expense ratio of each class of the fund was reasonable in light of the services that the fund and its shareholders receive and the other factors considered.
Costs of the Services and Profitability. The Board considered the revenues earned and the expenses incurred by Fidelity in conducting the business of developing, marketing, distributing, managing, administering and servicing the fund and servicing the fund's shareholders. The Board also considered the level of Fidelity's profits in respect of all the Fidelity funds.
On an annual basis, Fidelity presents to the Board information about the profitability of its relationships with the fund. Fidelity calculates profitability information for each fund, as well as aggregate profitability information for groups of Fidelity funds and all Fidelity funds, using a series of detailed revenue and cost allocation methodologies which originate with the books and records of Fidelity on which Fidelity's audited financial statements are based. The Audit Committee of the Board reviews any significant changes from the prior year's methodologies and the full Board approves such changes.
PricewaterhouseCoopers LLP (PwC), auditor to Fidelity and certain Fidelity funds, has been engaged annually by the Board as part of the Board's assessment of Fidelity's profitability analysis. PwC's engagement includes the review and assessment of the methodologies used by Fidelity in determining the revenues and expenses attributable to Fidelity's mutual fund business, and completion of agreed-upon procedures in respect of the mathematical accuracy of the fund profitability information and its conformity to established allocation methodologies. After considering PwC's reports issued under the engagement and information provided by Fidelity, the Board concluded that while other allocation methods may also be reasonable, Fidelity's profitability methodologies are reasonable in all material respects.
The Board also reviewed Fidelity's non-fund businesses and potential indirect benefits such businesses may have received as a result of their association with Fidelity's mutual fund business (i.e., fall-out benefits) as well as cases where Fidelity's affiliates may benefit from the funds' business. The Board noted that changes to fall-out benefits year-over-year reflect business developments at Fidelity's various businesses. The Board considered that a joint ad hoc committee created by it and the boards of other Fidelity funds had recently been established, and met periodically, to evaluate potential fall-out benefits (PFOB Committee). The Board noted that the PFOB Committee, among other things: (i) discussed the legal framework surrounding potential fall-out benefits; (ii) reviewed the Board's responsibilities and approach to potential fall-out benefits; and (iii) reviewed practices employed by competitor funds regarding the review of potential fall-out benefits.
The Board considered the costs of the services provided by and the profits realized by Fidelity in connection with the operation of the fund, including the conclusions of the PFOB Committee, and was satisfied that the profitability was not excessive.
Economies of Scale. The Board considered whether there have been economies of scale in respect of the management of the Fidelity funds, whether the Fidelity funds (including the fund) have appropriately benefited from any such economies of scale, and whether there is potential for realization of any further economies of scale. The Board considered the extent to which the fund will benefit from economies of scale as assets grow through increased services to the fund, through waivers or reimbursements, or through fee or expense ratio reductions. The Board also noted that a committee (the Economies of Scale Committee) created by it and the boards of other Fidelity funds periodically analyzes whether Fidelity attains economies of scale in respect of the management and servicing of the Fidelity funds, whether the Fidelity funds have appropriately benefited from such economies of scale, and whether there is potential for realization of any further economies of scale.
The Board recognized that the fund's management contract incorporates a "group fee" structure, which provides for lower group fee rates as total "group assets" increase, and for higher group fee rates as total "group assets" decrease ("group assets" as defined in the management contract). FMR calculates the group fee rates based on a tiered asset "breakpoint" schedule that varies based on asset class. The Board considered that the group fee is designed to deliver the benefits of economies of scale to fund shareholders when total Fidelity fund assets increase, even if assets of any particular fund are unchanged or have declined, because some portion of Fidelity's costs are attributable to services provided to all Fidelity funds, and all funds benefit if those costs can be allocated among more assets. The Board concluded that, given the group fee structure, fund shareholders will benefit from lower management fees as "group assets" increase at the fund complex level, regardless of whether Fidelity achieves any such economies of scale.
The Board concluded, taking into account the analysis of the Economies of Scale Committee, that economies of scale, if any, are being appropriately shared between fund shareholders and Fidelity.
Additional Information Requested by the Board. In order to develop fully the factual basis for consideration of the Fidelity funds' advisory contracts, the Board requested and received additional information on certain topics, including: (i) fund flow and performance trends, in particular the underperformance of certain funds and strategies, and Fidelity's long-term strategies for certain funds; (ii) consideration of performance fees for additional funds; (iii) changes in Fidelity's non-fund businesses and the impact of such changes on the funds; (iv) metrics for evaluating index fund and ETF performance and information about ETF trading characteristics; (v) the methodology with respect to evaluating competitive fund data and peer group classifications and fee comparisons; (vi) the expense structures for different funds and classes; (vii) information regarding other accounts managed by Fidelity, including collective investment trusts and separately managed accounts; and (viii) Fidelity's philosophies and strategies for evaluating funds and classes with lower or declining asset levels.
Based on its evaluation of all of the conclusions noted above, and after considering all factors it believed relevant, the Board concluded that the advisory fee arrangements are fair and reasonable, and that the fund's Advisory Contracts should be renewed.
Liquidity Risk Management Program
The Securities and Exchange Commission adopted Rule 22e-4 under the Investment Company Act of 1940 (the Liquidity Rule) to promote effective liquidity risk management throughout the open-end investment company industry, thereby reducing the risk that funds will be unable to meet their redemption obligations and mitigating dilution of the interests of fund shareholders.
The Fund has adopted and implemented a liquidity risk management program pursuant to the Liquidity Rule (the Program) effective December 1, 2018. The Program is reasonably designed to assess and manage the Fund’s liquidity risk and to comply with the requirements of the Liquidity Rule. The Fund’s Board of Trustees (the Board) has designated the Fund’s investment adviser as administrator of the Program. The Fidelity advisers have established a Liquidity Risk Management Committee (the LRM Committee) to manage the Program for each of the Fidelity Funds. The LRM Committee monitors the adequacy and effectiveness of implementation of the Program and on a periodic basis assesses each Fund’s liquidity risk based on a variety of factors including (1) the Fund’s investment strategy, (2) portfolio liquidity and cash flow projections during normal and reasonably foreseeable stressed conditions, (3) shareholder redemptions, (4) borrowings and other funding sources and (5) in the case of exchange-traded funds, certain additional factors including the effect of the Fund’s prices and spreads, market participants, and basket compositions on the overall liquidity of the Fund’s portfolio, as applicable.
In accordance with the Program, each of the Fund’s portfolio investments is classified into one of four liquidity categories described below based on a determination of a reasonable expectation for how long it would take to convert the investment to cash (or sell or dispose of the investment) without significantly changing its market value.
- Highly liquid investments – cash or convertible to cash within three business days or less
- Moderately liquid investments – convertible to cash in three to seven calendar days
- Less liquid investments – can be sold or disposed of, but not settled, within seven calendar days
- Illiquid investments – cannot be sold or disposed of within seven calendar days
Liquidity classification determinations take into account a variety of factors including various market, trading and investment-specific considerations, as well as market depth, and generally utilize analysis from a third-party liquidity metrics service.
The Liquidity Rule places a 15% limit on a fund’s illiquid investments and requires funds that do not primarily hold assets that are highly liquid investments to determine and maintain a minimum percentage of the fund’s net assets to be invested in highly liquid investments (highly liquid investment minimum or HLIM). The Program includes provisions reasonably designed to comply with the 15% limit on illiquid investments and for determining, periodically reviewing and complying with the HLIM requirement as applicable.
At a recent meeting of the Fund’s Board of Trustees, the LRM Committee provided a written report to the Board pertaining to the operation, adequacy, and effectiveness of implementation of the Program for the annual period from December 1, 2018 through November 30, 2019. The report concluded that the Program has been implemented and is operating effectively and is reasonably designed to assess and manage the Fund’s liquidity risk.
Proxy Voting Results
A special meeting of shareholders was held on June 9, 2020. The results of votes taken among shareholders on the proposals before them are reported below. Each vote reported represents one dollar of net asset value held on the record date for the meeting.
PROPOSAL 1
To elect a Board of Trustees.
| | # of
Votes | % of
Votes |
| Dennis J. Dirks |
| Affirmative | 21,597,050,616.024 | 95.502 |
| Withheld | 1,017,240,628.578 | 4.498 |
| TOTAL | 22,614,291,244.601 | 100.000 |
| Donald F. Donahue |
| Affirmative | 21,605,904,576.366 | 95.541 |
| Withheld | 1,008,386,668.235 | 4.459 |
| TOTAL | 22,614,291,244.601 | 100.000 |
| Bettina Doulton |
| Affirmative | 21,645,998,598.109 | 95.718 |
| Withheld | 968,292,646.493 | 4.282 |
| TOTAL | 22,614,291,244.601 | 100.000 |
| Vicki L. Fuller |
| Affirmative | 21,660,928,063.243 | 95.784 |
| Withheld | 953,363,181.358 | 4.216 |
| TOTAL | 22,614,291,244.601 | 100.000 |
| Patricia L. Kampling |
| Affirmative | 21,663,944,422.383 | 95.798 |
| Withheld | 950,346,822.218 | 4.202 |
| TOTAL | 22,614,291,244.601 | 100.000 |
| Alan J. Lacy |
| Affirmative | 21,569,159,491.891 | 95.378 |
| Withheld | 1,045,131,752.710 | 4.622 |
| TOTAL | 22,614,291,244.601 | 100.000 |
| Ned C. Lautenbach |
| Affirmative | 21,469,914,492.101 | 94.940 |
| Withheld | 1,144,376,752.501 | 5.060 |
| TOTAL | 22,614,291,244.601 | 100.000 |
| Robert A. Lawrence |
| Affirmative | 21,583,601,126.100 | 95.442 |
| Withheld | 1,030,690,118.501 | 4.558 |
| TOTAL | 22,614,291,244.601 | 100.000 |
| Joseph Mauriello |
| Affirmative | 21,551,120,396.219 | 95.299 |
| Withheld | 1,063,170,848.382 | 4.701 |
| TOTAL | 22,614,291,244.601 | 100.000 |
| Cornelia M. Small |
| Affirmative | 21,592,890,757.027 | 95.483 |
| Withheld | 1,021,400,487.575 | 4.517 |
| TOTAL | 22,614,291,244.601 | 100.000 |
| Garnett A. Smith |
| Affirmative | 21,519,273,578.917 | 95.158 |
| Withheld | 1,095,017,665.685 | 4.842 |
| TOTAL | 22,614,291,244.601 | 100.000 |
| David M. Thomas |
| Affirmative | 21,574,034,388.063 | 95.400 |
| Withheld | 1,040,256,856.538 | 4.600 |
| TOTAL | 22,614,291,244.601 | 100.000 |
| Susan Tomasky |
| Affirmative | 21,607,546,330.771 | 95.548 |
| Withheld | 1,006,744,913.831 | 4.452 |
| TOTAL | 22,614,291,244.601 | 100.000 |
| Michael E. Wiley |
| Affirmative | 21,549,685,089.255 | 95.292 |
| Withheld | 1,064,606,155.346 | 4.708 |
| TOTAL | 22,614,291,244.601 | 100.000 |
PROPOSAL 2
To convert a fundamental investment policy to a non-fundamental investment policy.
| | # of
Votes | % of
Votes |
| Affirmative | 245,671,441.827 | 81.524 |
| Against | 32,716,010.567 | 10.857 |
| Abstain | 22,960,440.846 | 7.619 |
| Broker Non-Vote | 0.00 | 0.00 |
| TOTAL | 301,347,893.240 | 100.000 |
|
| Proposal 1 reflects trust wide proposal and voting results. |
VIPCAP-SANN-0820
1.818378.115
Fidelity® Variable Insurance Products:
Disciplined Small Cap Portfolio
Semi-Annual Report
June 30, 2020
See the inside front cover for important information about access to your fund’s shareholder reports.
Beginning on January 1, 2021, as permitted by regulations adopted by the Securities and Exchange Commission, and if your insurance carrier elects to participate, you may not be receiving paper copies of the Fund’s shareholder reports from the insurance company that offers your variable insurance product unless you specifically request paper copies from your financial professional or the administrator of your variable insurance product. Instead, the reports will be made available on a website, and you will be notified by mail each time a report is posted and provided with a website link to access the report.
If you already elected to receive shareholder reports electronically, you will not be affected by this change and you need not take any action. You may elect to receive shareholder reports and other communications from the Fund electronically, by contacting your financial professional or the administrator of your variable insurance product. If you own a Fidelity-administered variable insurance product, please visit fidelity.com/mailpreferences to make your election or call 1-800-343-3548.
You may elect to receive all future reports in paper free of charge. If you wish to continue receiving paper copies of your shareholder reports, you may contact your financial professional or the administrator of your variable insurance product. If you own a Fidelity-administered variable insurance product, please visit fidelity.com/mailpreferences to make your election or call 1-800-343-3548. Your election to receive reports in paper will apply to all funds available under your variable insurance product.
Contents
To view a fund's proxy voting guidelines and proxy voting record for the 12-month period ended June 30, visit http://www.fidelity.com/proxyvotingresults or visit the Securities and Exchange Commission's (SEC) web site at http://www.sec.gov.
You may also call 1-877-208-0098 to request a free copy of the proxy voting guidelines.
Fidelity® Variable Insurance Products are separate account options which are purchased through a variable insurance contract.
Standard & Poor's, S&P and S&P 500 are registered service marks of The McGraw-Hill Companies, Inc. and have been licensed for use by Fidelity Distributors Corporation.
Other third-party marks appearing herein are the property of their respective owners.
All other marks appearing herein are registered or unregistered trademarks or service marks of FMR LLC or an affiliated company. © 2020 FMR LLC. All rights reserved.
This report and the financial statements contained herein are submitted for the general information of the shareholders of the Fund. This report is not authorized for distribution to prospective investors in the Fund unless preceded or accompanied by an effective prospectus.
A fund files its complete schedule of portfolio holdings with the SEC for the first and third quarters of each fiscal year on Form N-PORT. Forms N-PORT are available on the SEC’s web site at http://www.sec.gov. A fund's Forms N-PORT may be reviewed and copied at the SEC’s Public Reference Room in Washington, DC. Information regarding the operation of the SEC's Public Reference Room may be obtained by calling 1-800-SEC-0330.
For a complete list of a fund's portfolio holdings, view the most recent holdings listing, semiannual report, or annual report on Fidelity's web site at http://www.fidelity.com, http://www.institutional.fidelity.com, or http://www.401k.com, as applicable.
NOT FDIC INSURED •MAY LOSE VALUE •NO BANK GUARANTEE
Neither the Fund nor Fidelity Distributors Corporation is a bank.
Note to Shareholders:
Early in 2020, the outbreak and spread of a new coronavirus emerged as a public health emergency that had a major influence on financial markets, primarily based on its impact on the global economy and the outlook for corporate earnings. The virus causes a respiratory disease known as COVID-19. On March 11, the World Health Organization declared the COVID-19 outbreak a pandemic, citing sustained risk of further global spread.
In the weeks following, as the crisis worsened, we witnessed an escalating human tragedy with wide-scale social and economic consequences from coronavirus-containment measures. The outbreak of COVID-19 prompted a number of measures to limit the spread, including travel and border restrictions, quarantines, and restrictions on large gatherings. In turn, these resulted in lower consumer activity, diminished demand for a wide range of products and services, disruption in manufacturing and supply chains, and – given the wide variability in outcomes regarding the outbreak – significant market uncertainty and volatility. Amid the turmoil, the U.S. government took unprecedented action – in concert with the U.S. Federal Reserve and central banks around the world – to help support consumers, businesses, and the broader economy, and to limit disruption to the financial system.
The situation continues to unfold, and the extent and duration of its impact on financial markets and the economy remain highly uncertain. Extreme events such as the coronavirus crisis are “exogenous shocks” that can have significant adverse effects on mutual funds and their investments. Although multiple asset classes may be affected by market disruption, the duration and impact may not be the same for all types of assets.
Fidelity is committed to helping you stay informed amid news about COVID-19 and during increased market volatility, and we’re taking extra steps to be responsive to customer needs. We encourage you to visit our websites, where we offer ongoing updates, commentary, and analysis on the markets and our funds.
Investment Summary (Unaudited)
Top Ten Stocks as of June 30, 2020
| | % of fund's net assets |
| Deckers Outdoor Corp. | 0.9 |
| Cannae Holdings, Inc. | 0.7 |
| Box, Inc. Class A | 0.7 |
| EMCOR Group, Inc. | 0.7 |
| Ufp Industries, Inc. | 0.7 |
| EnerSys | 0.7 |
| Rexnord Corp. | 0.6 |
| Essent Group Ltd. | 0.6 |
| Meridian Bioscience, Inc. | 0.6 |
| Crocs, Inc. | 0.6 |
| | 6.8 |
Top Five Market Sectors as of June 30, 2020
| | % of fund's net assets |
| Health Care | 20.8 |
| Financials | 16.8 |
| Information Technology | 15.2 |
| Industrials | 14.9 |
| Consumer Discretionary | 10.1 |
Asset Allocation (% of fund's net assets)
| As of June 30, 2020* |
| | Stocks and Equity Futures | 99.9% |
| | Short-Term Investments and Net Other Assets (Liabilities) | 0.1% |

* Foreign investments - 4.2%
Schedule of Investments June 30, 2020 (Unaudited)
Showing Percentage of Net Assets
| Common Stocks - 96.5% | | | |
| | | Shares | Value |
| COMMUNICATION SERVICES - 2.2% | | | |
| Diversified Telecommunication Services - 1.2% | | | |
| Bandwidth, Inc. (a)(b) | | 5,099 | $647,573 |
| Cogent Communications Group, Inc. | | 15,049 | 1,164,191 |
| Consolidated Communications Holdings, Inc. (a) | | 44,196 | 299,207 |
| Iridium Communications, Inc. (a) | | 1,184 | 30,121 |
| Ooma, Inc. (a) | | 16,451 | 271,112 |
| PDVWireless, Inc. (a) | | 2,412 | 109,360 |
| | | | 2,521,564 |
| Entertainment - 0.1% | | | |
| Glu Mobile, Inc. (a) | | 23,251 | 215,537 |
| Interactive Media & Services - 0.3% | | | |
| EverQuote, Inc. Class A (a) | | 2,557 | 148,715 |
| Liberty TripAdvisor Holdings, Inc. (a) | | 17,914 | 38,157 |
| Yelp, Inc. (a) | | 22,210 | 513,717 |
| Zedge, Inc. (a)(b) | | 8,694 | 12,867 |
| | | | 713,456 |
| Media - 0.3% | | | |
| Cardlytics, Inc. (a) | | 5,212 | 364,736 |
| MSG Network, Inc. Class A (a)(b) | | 2,179 | 21,681 |
| TechTarget, Inc. (a) | | 3,396 | 101,982 |
| Tegna, Inc. | | 7,737 | 86,190 |
| | | | 574,589 |
| Wireless Telecommunication Services - 0.3% | | | |
| Shenandoah Telecommunications Co. | | 10,831 | 533,860 |
|
| TOTAL COMMUNICATION SERVICES | | | 4,559,006 |
|
| CONSUMER DISCRETIONARY - 10.1% | | | |
| Auto Components - 0.3% | | | |
| Adient PLC (a) | | 15,977 | 262,342 |
| Modine Manufacturing Co. (a) | | 9,443 | 52,125 |
| Visteon Corp. (a)(b) | | 2,654 | 181,799 |
| | | | 496,266 |
| Distributors - 0.2% | | | |
| Core-Mark Holding Co., Inc. | | 11,676 | 291,375 |
| Diversified Consumer Services - 0.5% | | | |
| American Public Education, Inc. (a) | | 1,330 | 39,368 |
| Chegg, Inc. (a) | | 10,796 | 726,139 |
| Collectors Universe, Inc. | | 3,998 | 137,051 |
| Weight Watchers International, Inc. (a) | | 6,784 | 172,178 |
| | | | 1,074,736 |
| Hotels, Restaurants & Leisure - 1.1% | | | |
| Bloomin' Brands, Inc. (b) | | 37,643 | 401,274 |
| Brinker International, Inc. | | 26,942 | 646,608 |
| Dine Brands Global, Inc. | | 1,317 | 55,446 |
| Penn National Gaming, Inc. (a) | | 12,071 | 368,648 |
| RCI Hospitality Holdings, Inc. (b) | | 6,060 | 83,992 |
| Scientific Games Corp. Class A (a)(b) | | 24,815 | 383,640 |
| Wingstop, Inc. | | 2,890 | 401,623 |
| | | | 2,341,231 |
| Household Durables - 2.7% | | | |
| Cavco Industries, Inc. (a) | | 2,432 | 469,011 |
| Ethan Allen Interiors, Inc. | | 17,044 | 201,631 |
| Flexsteel Industries, Inc. | | 7,813 | 98,678 |
| Installed Building Products, Inc. (a) | | 1,362 | 93,678 |
| KB Home | | 40,233 | 1,234,348 |
| La-Z-Boy, Inc. | | 26,644 | 720,987 |
| M.D.C. Holdings, Inc. | | 17,306 | 617,824 |
| M/I Homes, Inc. (a) | | 32,164 | 1,107,728 |
| Meritage Homes Corp. (a) | | 3,277 | 249,445 |
| TopBuild Corp. (a) | | 279 | 31,742 |
| TRI Pointe Homes, Inc. (a) | | 46,582 | 684,290 |
| | | | 5,509,362 |
| Internet & Direct Marketing Retail - 0.4% | | | |
| PetMed Express, Inc. (b) | | 490 | 17,464 |
| Shutterstock, Inc. | | 14,082 | 492,448 |
| Stamps.com, Inc. (a) | | 1,111 | 204,080 |
| The Rubicon Project, Inc. (a) | | 5,563 | 37,105 |
| | | | 751,097 |
| Leisure Products - 0.6% | | | |
| Acushnet Holdings Corp. | | 2,432 | 84,609 |
| Johnson Outdoors, Inc. Class A | | 6,840 | 622,577 |
| Malibu Boats, Inc. Class A (a) | | 6,380 | 331,441 |
| Vista Outdoor, Inc. (a) | | 10,644 | 153,806 |
| YETI Holdings, Inc. (a) | | 2,179 | 93,109 |
| | | | 1,285,542 |
| Specialty Retail - 2.7% | | | |
| Asbury Automotive Group, Inc. (a) | | 4,850 | 375,051 |
| Group 1 Automotive, Inc. | | 9,122 | 601,778 |
| Haverty Furniture Companies, Inc. | | 5,598 | 89,568 |
| Hudson Ltd. (a) | | 21,974 | 107,013 |
| Lumber Liquidators Holdings, Inc. (a)(b) | | 2,775 | 38,462 |
| Murphy U.S.A., Inc. (a) | | 1,131 | 127,339 |
| Office Depot, Inc. | | 142,750 | 335,463 |
| Rent-A-Center, Inc. | | 31,204 | 868,095 |
| RH (a) | | 1,320 | 328,548 |
| Sally Beauty Holdings, Inc. (a) | | 5,918 | 74,153 |
| Shoe Carnival, Inc. (b) | | 19,016 | 556,598 |
| Signet Jewelers Ltd. (b) | | 10,238 | 105,144 |
| Sleep Number Corp. (a)(b) | | 22,090 | 919,828 |
| Sonic Automotive, Inc. Class A (sub. vtg.) (b) | | 34,864 | 1,112,510 |
| | | | 5,639,550 |
| Textiles, Apparel & Luxury Goods - 1.6% | | | |
| Crocs, Inc. (a) | | 34,449 | 1,268,412 |
| Deckers Outdoor Corp. (a) | | 8,717 | 1,711,927 |
| Rocky Brands, Inc. | | 2,569 | 52,819 |
| Steven Madden Ltd. | | 10,911 | 269,393 |
| | | | 3,302,551 |
|
| TOTAL CONSUMER DISCRETIONARY | | | 20,691,710 |
|
| CONSUMER STAPLES - 3.4% | | | |
| Beverages - 0.7% | | | |
| Boston Beer Co., Inc. Class A (a) | | 746 | 400,341 |
| Coca-Cola Bottling Co. Consolidated | | 4,416 | 1,012,103 |
| MGP Ingredients, Inc. (b) | | 3,006 | 110,335 |
| | | | 1,522,779 |
| Food & Staples Retailing - 1.0% | | | |
| BJ's Wholesale Club Holdings, Inc. (a) | | 4,780 | 178,151 |
| Ingles Markets, Inc. Class A | | 19,637 | 845,766 |
| Natural Grocers by Vitamin Cottage, Inc. (b) | | 11,810 | 175,733 |
| Performance Food Group Co. (a) | | 1,211 | 35,289 |
| PriceSmart, Inc. | | 7,326 | 441,978 |
| Rite Aid Corp. (a)(b) | | 13,231 | 225,721 |
| Weis Markets, Inc. (b) | | 2,916 | 146,150 |
| | | | 2,048,788 |
| Food Products - 0.9% | | | |
| Cal-Maine Foods, Inc. (a) | | 17,613 | 783,426 |
| Darling Ingredients, Inc. (a) | | 772 | 19,007 |
| Freshpet, Inc. (a) | | 3,412 | 285,448 |
| John B. Sanfilippo & Son, Inc. | | 3,042 | 259,574 |
| Lancaster Colony Corp. | | 1,868 | 289,521 |
| Landec Corp. (a) | | 520 | 4,139 |
| The Simply Good Foods Co. (a) | | 5,148 | 95,650 |
| | | | 1,736,765 |
| Household Products - 0.5% | | | |
| WD-40 Co. (b) | | 5,275 | 1,046,033 |
| Personal Products - 0.2% | | | |
| USANA Health Sciences, Inc. (a) | | 6,481 | 475,900 |
| Tobacco - 0.1% | | | |
| Vector Group Ltd. | | 21,893 | 220,244 |
|
| TOTAL CONSUMER STAPLES | | | 7,050,509 |
|
| ENERGY - 1.3% | | | |
| Energy Equipment & Services - 0.2% | | | |
| Nabors Industries Ltd. | | 5,881 | 217,715 |
| Oil States International, Inc. (a) | | 14,502 | 68,885 |
| | | | 286,600 |
| Oil, Gas & Consumable Fuels - 1.1% | | | |
| Callon Petroleum Co. (a) | | 168,112 | 193,329 |
| DHT Holdings, Inc. | | 99,213 | 508,963 |
| Falcon Minerals Corp. | | 5,905 | 18,896 |
| GasLog Ltd. (b) | | 26,810 | 75,336 |
| Kosmos Energy Ltd. | | 282,372 | 468,738 |
| Magnolia Oil & Gas Corp. Class A (a) | | 22,937 | 138,998 |
| Matador Resources Co. (a)(b) | | 8,423 | 71,596 |
| Nordic American Tanker Shipping Ltd. (b) | | 78,419 | 318,381 |
| Penn Virginia Corp. (a) | | 36,528 | 348,112 |
| Teekay Tankers Ltd. (a)(b) | | 10,736 | 137,636 |
| World Fuel Services Corp. | | 2,418 | 62,288 |
| | | | 2,342,273 |
|
| TOTAL ENERGY | | | 2,628,873 |
|
| FINANCIALS - 16.8% | | | |
| Banks - 6.7% | | | |
| 1st Source Corp. | | 6,236 | 221,877 |
| American National Bankshares, Inc. | | 786 | 19,681 |
| Banc of California, Inc. | | 7,013 | 75,951 |
| BancFirst Corp. | | 27,314 | 1,108,129 |
| Bancorp, Inc., Delaware (a) | | 14,199 | 139,150 |
| Boston Private Financial Holdings, Inc. | | 9,888 | 68,029 |
| Brookline Bancorp, Inc., Delaware | | 3,201 | 32,266 |
| Cadence Bancorp Class A | | 36,172 | 320,484 |
| Capital City Bank Group, Inc. | | 1,594 | 33,394 |
| Capstar Financial Holdings, Inc. | | 891 | 10,692 |
| Cathay General Bancorp | | 34,067 | 895,962 |
| Community Bank System, Inc. | | 925 | 52,744 |
| Community Trust Bancorp, Inc. | | 3,663 | 120,000 |
| Eagle Bancorp, Inc. | | 1,586 | 51,942 |
| Financial Institutions, Inc. | | 7,861 | 146,293 |
| First Bancorp, North Carolina | | 1,072 | 26,886 |
| First Bancorp, Puerto Rico | | 199,569 | 1,115,591 |
| First Business Finance Services, Inc. | | 567 | 9,327 |
| First Financial Bankshares, Inc. | | 5,688 | 164,326 |
| First Financial Corp., Indiana | | 1,791 | 65,980 |
| First Interstate Bancsystem, Inc. | | 9,969 | 308,640 |
| First of Long Island Corp. | | 1,978 | 32,321 |
| Flushing Financial Corp. | | 2,924 | 33,684 |
| Fulton Financial Corp. | | 82,212 | 865,692 |
| Great Southern Bancorp, Inc. | | 11,746 | 474,069 |
| Great Western Bancorp, Inc. | | 3,279 | 45,119 |
| Hancock Whitney Corp. | | 33,712 | 714,694 |
| Hilltop Holdings, Inc. | | 32,364 | 597,116 |
| Hope Bancorp, Inc. | | 7,694 | 70,939 |
| IBERIABANK Corp. | | 681 | 31,013 |
| Independent Bank Group, Inc. (b) | | 6,400 | 259,328 |
| International Bancshares Corp. | | 37,309 | 1,194,634 |
| Investors Bancorp, Inc. | | 130,093 | 1,105,791 |
| Lakeland Bancorp, Inc. | | 3,571 | 40,817 |
| Lakeland Financial Corp. | | 4,568 | 212,823 |
| Macatawa Bank Corp. | | 1,750 | 13,685 |
| Mercantil Bank Holding Corp. Class A (a) | | 239 | 3,595 |
| Mercantile Bank Corp. | | 1,474 | 33,312 |
| Metrocity Bankshares, Inc. | | 666 | 9,544 |
| Nicolet Bankshares, Inc. (a)(b) | | 1,291 | 70,747 |
| OFG Bancorp | | 20,395 | 272,681 |
| Old National Bancorp, Indiana | | 4,263 | 58,659 |
| Park National Corp. | | 3,243 | 228,242 |
| Peapack-Gladstone Financial Corp. | | 5,778 | 108,222 |
| People's Utah Bancorp | | 1,132 | 25,436 |
| Peoples Bancorp, Inc. | | 1,106 | 23,536 |
| Republic Bancorp, Inc., Kentucky Class A | | 458 | 14,981 |
| Sandy Spring Bancorp, Inc. | | 4,009 | 99,343 |
| Sierra Bancorp | | 7,480 | 141,222 |
| South Plains Financial, Inc. | | 181 | 2,577 |
| South State Corp. | | 2,930 | 139,644 |
| Southside Bancshares, Inc. | | 7,061 | 195,731 |
| The First Bancorp, Inc. | | 564 | 12,239 |
| Tompkins Financial Corp. | | 2,162 | 140,033 |
| Trico Bancshares | | 3,818 | 116,258 |
| Trustmark Corp. | | 3,217 | 78,881 |
| UMB Financial Corp. | | 10,526 | 542,615 |
| United Community Bank, Inc. | | 8,128 | 163,535 |
| Univest Corp. of Pennsylvania | | 5,824 | 93,999 |
| Valley National Bancorp | | 37,169 | 290,662 |
| Washington Trust Bancorp, Inc. | | 1,315 | 43,066 |
| WesBanco, Inc. | | 11,659 | 236,794 |
| West Bancorp., Inc. | | 1,037 | 18,137 |
| | | | 13,842,760 |
| Capital Markets - 3.5% | | | |
| Ares Management Corp. | | 3,213 | 127,556 |
| Artisan Partners Asset Management, Inc. | | 38,754 | 1,259,505 |
| Cohen & Steers, Inc. | | 17,911 | 1,218,844 |
| Cowen Group, Inc. Class A | | 1,116 | 18,090 |
| Federated Hermes, Inc. Class B (non-vtg.) | | 48,008 | 1,137,790 |
| Houlihan Lokey | | 7,241 | 402,889 |
| INTL FCStone, Inc. (a) | | 14,786 | 813,230 |
| Oppenheimer Holdings, Inc. Class A (non-vtg.) | | 15,366 | 334,825 |
| Piper Jaffray Companies | | 9,920 | 586,867 |
| PJT Partners, Inc. | | 3,902 | 200,329 |
| Pzena Investment Management, Inc. | | 3,311 | 18,012 |
| Stifel Financial Corp. | | 1,798 | 85,279 |
| Waddell & Reed Financial, Inc. Class A (b) | | 65,111 | 1,009,872 |
| Westwood Holdings Group, Inc. | | 835 | 13,151 |
| | | | 7,226,239 |
| Consumer Finance - 0.8% | | | |
| Enova International, Inc. (a) | | 49,024 | 728,987 |
| LendingClub Corp. (a) | | 1,255 | 5,710 |
| Nelnet, Inc. Class A | | 19,062 | 910,020 |
| | | | 1,644,717 |
| Diversified Financial Services - 0.8% | | | |
| Cannae Holdings, Inc. (a) | | 36,253 | 1,489,998 |
| Marlin Business Services Corp. | | 10,164 | 85,987 |
| Rafael Holdings, Inc. (a) | | 949 | 13,637 |
| | | | 1,589,622 |
| Insurance - 2.7% | | | |
| Amerisafe, Inc. | | 9,065 | 554,415 |
| Crawford & Co. Class B | | 2,442 | 17,167 |
| Donegal Group, Inc. Class A | | 774 | 11,006 |
| eHealth, Inc. (a) | | 6,485 | 637,086 |
| Employers Holdings, Inc. | | 4,553 | 137,273 |
| Goosehead Insurance (a)(b) | | 14,272 | 1,072,684 |
| Horace Mann Educators Corp. | | 18,600 | 683,178 |
| Investors Title Co. | | 150 | 18,198 |
| National General Holdings Corp. | | 15,516 | 335,301 |
| Selective Insurance Group, Inc. | | 20,861 | 1,100,209 |
| Trupanion, Inc. (a)(b) | | 22,190 | 947,291 |
| | | | 5,513,808 |
| Mortgage Real Estate Investment Trusts - 0.0% | | | |
| Invesco Mortgage Capital, Inc. (b) | | 3,949 | 14,769 |
| Thrifts & Mortgage Finance - 2.3% | | | |
| Dime Community Bancshares, Inc. | | 2,308 | 31,689 |
| Essent Group Ltd. | | 35,871 | 1,301,041 |
| Farmer Mac Class C (non-vtg.) | | 4,381 | 280,428 |
| First Defiance Financial Corp. | | 5,285 | 93,386 |
| Northwest Bancshares, Inc. | | 54,446 | 556,710 |
| Pennymac Financial Services, Inc. | | 3,440 | 143,758 |
| Radian Group, Inc. | | 69,193 | 1,073,183 |
| Walker & Dunlop, Inc. | | 12,381 | 629,079 |
| Washington Federal, Inc. | | 16,252 | 436,204 |
| Waterstone Financial, Inc. | | 14,656 | 217,348 |
| | | | 4,762,826 |
|
| TOTAL FINANCIALS | | | 34,594,741 |
|
| HEALTH CARE - 20.8% | | | |
| Biotechnology - 10.3% | | | |
| ACADIA Pharmaceuticals, Inc. (a) | | 4,503 | 218,260 |
| Acceleron Pharma, Inc. (a) | | 2,028 | 193,208 |
| ADMA Biologics, Inc. (a)(b) | | 24,544 | 71,914 |
| Adverum Biotechnologies, Inc. (a) | | 8,011 | 167,270 |
| Affimed NV (a) | | 34,697 | 160,127 |
| Aimmune Therapeutics, Inc. (a)(b) | | 1,835 | 30,663 |
| Akebia Therapeutics, Inc. (a) | | 13,503 | 183,371 |
| Aldeyra Therapeutics, Inc. (a) | | 3,347 | 13,957 |
| Alector, Inc. (a) | | 1,722 | 42,086 |
| Allakos, Inc. (a)(b) | | 3,284 | 235,988 |
| Allogene Therapeutics, Inc. (a) | | 3,214 | 137,623 |
| Amicus Therapeutics, Inc. (a) | | 22,145 | 333,947 |
| Anika Therapeutics, Inc. (a) | | 2,983 | 112,549 |
| Apellis Pharmaceuticals, Inc. (a) | | 9,085 | 296,716 |
| Applied Therapeutics, Inc. (a)(b) | | 1,083 | 39,150 |
| Arcturus Therapeutics Holdings, Inc. (a) | | 3,427 | 160,178 |
| Arcus Biosciences, Inc. (a) | | 7,213 | 178,450 |
| Ardelyx, Inc. (a) | | 30,941 | 214,112 |
| Arena Pharmaceuticals, Inc. (a) | | 4,821 | 303,482 |
| Arrowhead Pharmaceuticals, Inc. (a) | | 9,290 | 401,235 |
| Athenex, Inc. (a)(b) | | 7,370 | 101,411 |
| Avid Bioservices, Inc. (a)(b) | | 7,897 | 51,844 |
| Biohaven Pharmaceutical Holding Co. Ltd. (a)(b) | | 3,939 | 287,980 |
| BioXcel Therapeutics, Inc. (a) | | 4,551 | 241,249 |
| Blueprint Medicines Corp. (a) | | 4,868 | 379,704 |
| Bridgebio Pharma, Inc. (b) | | 5,549 | 180,953 |
| CareDx, Inc. (a) | | 1,810 | 64,128 |
| Castle Biosciences, Inc. (b) | | 1,758 | 66,259 |
| Catalyst Pharmaceutical Partners, Inc. (a) | | 47,302 | 218,535 |
| Cel-Sci Corp. (a)(b) | | 2,471 | 36,867 |
| ChemoCentryx, Inc. (a) | | 3,256 | 187,350 |
| Chimerix, Inc. (a) | | 54,284 | 168,280 |
| Clovis Oncology, Inc. (a)(b) | | 20,313 | 137,113 |
| Coherus BioSciences, Inc. (a)(b) | | 14,969 | 267,346 |
| Constellation Pharmaceuticals, Inc. (a) | | 5,488 | 164,914 |
| Cortexyme, Inc. (a)(b) | | 2,500 | 115,750 |
| Cue Biopharma, Inc. (a) | | 5,986 | 146,717 |
| Cytokinetics, Inc. (a) | | 2,241 | 52,820 |
| CytomX Therapeutics, Inc. (a) | | 4,976 | 41,450 |
| Deciphera Pharmaceuticals, Inc. (a) | | 5,601 | 334,492 |
| Denali Therapeutics, Inc. (a)(b) | | 3,236 | 78,246 |
| Dicerna Pharmaceuticals, Inc. (a) | | 3,375 | 85,725 |
| Eagle Pharmaceuticals, Inc. (a) | | 1,606 | 77,056 |
| Editas Medicine, Inc. (a)(b) | | 3,098 | 91,639 |
| Eidos Therapeutics, Inc. (a)(b) | | 1,849 | 88,142 |
| Eiger Biopharmaceuticals, Inc. (a) | | 5,274 | 50,630 |
| Emergent BioSolutions, Inc. (a) | | 7,314 | 578,391 |
| Enanta Pharmaceuticals, Inc. (a) | | 658 | 33,038 |
| Epizyme, Inc. (a)(b) | | 14,289 | 229,481 |
| Esperion Therapeutics, Inc. (a)(b) | | 985 | 50,540 |
| Fate Therapeutics, Inc. (a) | | 11,763 | 403,589 |
| FibroGen, Inc. (a)(b) | | 11,958 | 484,658 |
| Flexion Therapeutics, Inc. (a)(b) | | 6,277 | 82,543 |
| Global Blood Therapeutics, Inc. (a)(b) | | 3,275 | 206,751 |
| Halozyme Therapeutics, Inc. (a)(b) | | 22,451 | 601,911 |
| Heron Therapeutics, Inc. (a)(b) | | 5,056 | 74,374 |
| IGM Biosciences, Inc. (a)(b) | | 2,269 | 165,637 |
| ImmunoGen, Inc. (a) | | 55,358 | 254,647 |
| Immunomedics, Inc. (a)(b) | | 6,247 | 221,394 |
| Inovio Pharmaceuticals, Inc. (a)(b) | | 12,983 | 349,892 |
| Insmed, Inc. (a) | | 7,739 | 213,132 |
| Intercept Pharmaceuticals, Inc. (a)(b) | | 2,072 | 99,270 |
| Invitae Corp. (a)(b) | | 17,631 | 534,043 |
| Iovance Biotherapeutics, Inc. (a)(b) | | 7,815 | 214,522 |
| Ironwood Pharmaceuticals, Inc. Class A (a) | | 10,256 | 105,842 |
| Kadmon Holdings, Inc. (a) | | 42,921 | 219,756 |
| Karuna Therapeutics, Inc. (a) | | 1,849 | 206,090 |
| Karyopharm Therapeutics, Inc. (a) | | 11,427 | 216,427 |
| Kindred Biosciences, Inc. (a) | | 18,627 | 83,635 |
| Kodiak Sciences, Inc. (a)(b) | | 4,941 | 267,407 |
| Krystal Biotech, Inc. (a) | | 2,557 | 105,911 |
| Kura Oncology, Inc. (a) | | 3,229 | 52,633 |
| La Jolla Pharmaceutical Co. (a) | | 22,398 | 95,415 |
| Lexicon Pharmaceuticals, Inc. (a)(b) | | 33,541 | 66,914 |
| Ligand Pharmaceuticals, Inc. Class B (a)(b) | | 2,798 | 312,956 |
| Macrogenics, Inc. (a) | | 2,084 | 58,185 |
| Madrigal Pharmaceuticals, Inc. (a) | | 167 | 18,913 |
| Mersana Therapeutics, Inc. (a) | | 13,263 | 310,354 |
| Mirati Therapeutics, Inc. (a) | | 4,336 | 495,041 |
| Molecular Templates, Inc. (a) | | 7,205 | 99,357 |
| Momenta Pharmaceuticals, Inc. (a) | | 16,114 | 536,113 |
| Mustang Bio, Inc. (a) | | 4,881 | 15,522 |
| Myriad Genetics, Inc. (a) | | 9,860 | 111,812 |
| Natera, Inc. (a) | | 10,773 | 537,142 |
| NextCure, Inc. (a)(b) | | 963 | 20,647 |
| Novavax, Inc. (a)(b) | | 7,708 | 642,462 |
| Oncternal Therapeutics, Inc. rights (a)(c) | | 466 | 0 |
| Opko Health, Inc. (a)(b) | | 103,545 | 353,088 |
| Organogenesis Holdings, Inc. Class A (a) | | 6,052 | 23,240 |
| OvaScience, Inc. (a) | | 19,327 | 34,016 |
| Oyster Point Pharma, Inc. (a) | | 2,657 | 76,734 |
| Pfenex, Inc. (a) | | 13,730 | 114,646 |
| Pieris Pharmaceuticals, Inc. (a) | | 6,980 | 21,638 |
| Portola Pharmaceuticals, Inc. (a) | | 10,721 | 192,871 |
| Principia Biopharma, Inc. (a) | | 4,632 | 276,947 |
| PTC Therapeutics, Inc. (a) | | 10,389 | 527,138 |
| Puma Biotechnology, Inc. (a) | | 12,244 | 127,705 |
| Radius Health, Inc. (a) | | 11,796 | 160,779 |
| RAPT Therapeutics, Inc. (a)(b) | | 2,321 | 67,355 |
| Recro Pharma, Inc. (a) | | 1,541 | 7,012 |
| REGENXBIO, Inc. (a) | | 3,916 | 144,226 |
| Repligen Corp. (a) | | 1,746 | 215,823 |
| Retrophin, Inc. (a) | | 14,198 | 289,781 |
| Rubius Therapeutics, Inc. (a)(b) | | 5,851 | 34,989 |
| Sangamo Therapeutics, Inc. (a) | | 3,856 | 34,550 |
| Syndax Pharmaceuticals, Inc. (a) | | 7,003 | 103,784 |
| TCR2 Therapeutics, Inc. (a)(b) | | 1,605 | 24,653 |
| TG Therapeutics, Inc. (a) | | 18,225 | 355,023 |
| Translate Bio, Inc. (a) | | 1,700 | 30,464 |
| Turning Point Therapeutics, Inc. (a) | | 1,604 | 103,602 |
| Twist Bioscience Corp. (a) | | 1,047 | 47,429 |
| Ultragenyx Pharmaceutical, Inc. (a)(b) | | 5,095 | 398,531 |
| Veracyte, Inc. (a) | | 12,078 | 312,820 |
| Vericel Corp. (a) | | 6,923 | 95,676 |
| Viela Bio, Inc. (b) | | 1,110 | 48,085 |
| Vir Biotechnology, Inc. (a) | | 3,017 | 123,606 |
| Xbiotech, Inc. (a) | | 7,810 | 107,075 |
| Xencor, Inc. (a) | | 3,284 | 106,369 |
| Y-mAbs Therapeutics, Inc. (a) | | 1,378 | 59,530 |
| | | | 21,206,418 |
| Health Care Equipment & Supplies - 4.6% | | | |
| Accelerate Diagnostics, Inc. (a)(b) | | 4,316 | 65,431 |
| Accuray, Inc. (a) | | 16,418 | 33,329 |
| Axonics Modulation Technologies, Inc. (a) | | 605 | 21,242 |
| Cardiovascular Systems, Inc. (a) | | 25,398 | 801,307 |
| Cerus Corp. (a) | | 28,895 | 190,707 |
| ConforMis, Inc. (a)(b) | | 27,126 | 22,243 |
| Genmark Diagnostics, Inc. (a) | | 70,850 | 1,042,204 |
| Haemonetics Corp. (a) | | 12,412 | 1,111,619 |
| Integer Holdings Corp. (a) | | 14,036 | 1,025,330 |
| Invacare Corp. | | 7,087 | 45,144 |
| Lantheus Holdings, Inc. (a)(b) | | 23,792 | 340,226 |
| LeMaitre Vascular, Inc. | | 419 | 11,062 |
| Meridian Bioscience, Inc. (a) | | 55,576 | 1,294,365 |
| Nevro Corp. (a) | | 5,020 | 599,739 |
| Novocure Ltd. (a) | | 12,024 | 713,023 |
| Orthofix International NV (a) | | 9,089 | 290,848 |
| RTI Biologics, Inc. (a) | | 7,370 | 23,437 |
| Seaspine Holdings Corp. (a) | | 2,164 | 22,657 |
| Senseonics Holdings, Inc. (a)(b) | | 22,186 | 8,653 |
| Shockwave Medical, Inc. (a) | | 176 | 8,337 |
| Sientra, Inc. (a)(b) | | 55,245 | 213,798 |
| SurModics, Inc. (a) | | 18,126 | 783,768 |
| Tandem Diabetes Care, Inc. (a) | | 4,970 | 491,632 |
| Wright Medical Group NV (a) | | 6,988 | 207,683 |
| Zynex, Inc. (a)(b) | | 831 | 20,667 |
| | | | 9,388,451 |
| Health Care Providers & Services - 2.2% | | | |
| Amedisys, Inc. (a) | | 1,992 | 395,492 |
| Apollo Medical Holdings, Inc. (a)(b) | | 7,080 | 116,820 |
| Corvel Corp. (a) | | 13,889 | 984,591 |
| Magellan Health Services, Inc. (a) | | 6,410 | 467,802 |
| National Healthcare Corp. | | 11,522 | 730,956 |
| Owens & Minor, Inc. | | 12,565 | 95,745 |
| Patterson Companies, Inc. (b) | | 8,817 | 193,974 |
| Providence Service Corp. (a) | | 3,923 | 309,564 |
| Select Medical Holdings Corp. (a) | | 45,212 | 665,973 |
| Tenet Healthcare Corp. (a)(b) | | 36,340 | 658,117 |
| | | | 4,619,034 |
| Health Care Technology - 1.5% | | | |
| Allscripts Healthcare Solutions, Inc. (a) | | 99,757 | 675,355 |
| HealthStream, Inc. (a) | | 2,804 | 62,053 |
| HMS Holdings Corp. (a) | | 24,397 | 790,219 |
| Inovalon Holdings, Inc. Class A (a) | | 16,758 | 322,759 |
| Livongo Health, Inc. (b) | | 705 | 53,009 |
| Nextgen Healthcare, Inc. (a) | | 71,373 | 783,676 |
| Schrodinger, Inc. | | 427 | 39,100 |
| Teladoc Health, Inc. (a)(b) | | 2,353 | 449,047 |
| | | | 3,175,218 |
| Life Sciences Tools & Services - 0.7% | | | |
| Fluidigm Corp. (a)(b) | | 12,076 | 48,425 |
| Luminex Corp. (b) | | 9,823 | 319,542 |
| Medpace Holdings, Inc. (a) | | 5,240 | 487,425 |
| Nanostring Technologies, Inc. (a) | | 7,000 | 205,450 |
| NeoGenomics, Inc. (a) | | 8,272 | 256,267 |
| Syneos Health, Inc. (a) | | 3,733 | 217,447 |
| | | | 1,534,556 |
| Pharmaceuticals - 1.5% | | | |
| Akorn, Inc. (a)(b) | | 142,619 | 39,933 |
| Amneal Pharmaceuticals, Inc. (a) | | 32,850 | 156,366 |
| Arvinas Holding Co. LLC (a) | | 833 | 27,939 |
| Assertio Holdings, Inc. (a) | | 58,147 | 49,832 |
| Axsome Therapeutics, Inc. (a) | | 4,396 | 361,703 |
| Collegium Pharmaceutical, Inc. (a) | | 9,124 | 159,670 |
| Corcept Therapeutics, Inc. (a)(b) | | 4,970 | 83,595 |
| Endo International PLC (a) | | 56,915 | 195,218 |
| Evolus, Inc. (a)(b) | | 1,193 | 6,323 |
| Innoviva, Inc. (a) | | 1,050 | 14,679 |
| Intra-Cellular Therapies, Inc. (a) | | 2,425 | 62,250 |
| Mallinckrodt PLC (a)(b) | | 22,370 | 59,952 |
| MyoKardia, Inc. (a) | | 6,637 | 641,267 |
| Pacira Biosciences, Inc. (a) | | 8,474 | 444,631 |
| Phibro Animal Health Corp. Class A | | 1,910 | 50,176 |
| Prestige Brands Holdings, Inc. (a) | | 5,440 | 204,326 |
| Reata Pharmaceuticals, Inc. (a)(b) | | 1,287 | 200,798 |
| Revance Therapeutics, Inc. (a) | | 2,678 | 65,397 |
| Supernus Pharmaceuticals, Inc. (a) | | 1,341 | 31,849 |
| Theravance Biopharma, Inc. (a) | | 2,442 | 51,258 |
| Zogenix, Inc. (a) | | 2,746 | 74,169 |
| | | | 2,981,331 |
|
| TOTAL HEALTH CARE | | | 42,905,008 |
|
| INDUSTRIALS - 14.9% | | | |
| Aerospace & Defense - 1.7% | | | |
| AAR Corp. | | 33,660 | 695,752 |
| Aerojet Rocketdyne Holdings, Inc.(a) | | 1,011 | 40,076 |
| Astronics Corp. (a) | | 14,755 | 155,813 |
| Axon Enterprise, Inc. (a) | | 4,679 | 459,150 |
| Maxar Technologies, Inc. | | 5,058 | 90,842 |
| Moog, Inc. Class A | | 17,921 | 949,455 |
| Parsons Corp. (a) | | 26,875 | 973,950 |
| Vectrus, Inc. (a) | | 1,541 | 75,709 |
| | | | 3,440,747 |
| Air Freight & Logistics - 0.0% | | | |
| Atlas Air Worldwide Holdings, Inc. (a) | | 2,244 | 96,559 |
| Building Products - 2.1% | | | |
| Advanced Drain Systems, Inc. | | 10,502 | 518,799 |
| Builders FirstSource, Inc. (a) | | 2,893 | 59,885 |
| Gibraltar Industries, Inc. (a) | | 4,709 | 226,079 |
| Griffon Corp. | | 1,545 | 28,613 |
| NCI Building Systems, Inc. (a) | | 9,748 | 59,073 |
| Quanex Building Products Corp. | | 30,078 | 417,483 |
| Simpson Manufacturing Co. Ltd. | | 4,738 | 399,698 |
| Trex Co., Inc. (a) | | 9,170 | 1,192,742 |
| Ufp Industries, Inc. | | 27,695 | 1,371,179 |
| | | | 4,273,551 |
| Commercial Services & Supplies - 2.0% | | | |
| ADS Waste Holdings, Inc. (a) | | 1,446 | 43,626 |
| Brady Corp. Class A | | 19,400 | 908,308 |
| Deluxe Corp. | | 19,546 | 460,113 |
| Kimball International, Inc. Class B | | 66,281 | 766,208 |
| Knoll, Inc. | | 17,823 | 217,262 |
| Tetra Tech, Inc. | | 6,452 | 510,482 |
| UniFirst Corp. | | 6,489 | 1,161,207 |
| VSE Corp. | | 655 | 20,560 |
| | | | 4,087,766 |
| Construction & Engineering - 0.9% | | | |
| Comfort Systems U.S.A., Inc. | | 2,302 | 93,807 |
| EMCOR Group, Inc. | | 21,062 | 1,393,041 |
| Great Lakes Dredge & Dock Corp. (a)(b) | | 27,694 | 256,446 |
| Primoris Services Corp. | | 6,568 | 116,648 |
| | | | 1,859,942 |
| Electrical Equipment - 2.9% | | | |
| Atkore International Group, Inc. (a) | | 36,606 | 1,001,174 |
| AZZ, Inc. | | 11,959 | 410,433 |
| Encore Wire Corp. | | 21,079 | 1,029,077 |
| EnerSys | | 20,485 | 1,318,824 |
| Generac Holdings, Inc. (a) | | 3,608 | 439,923 |
| Plug Power, Inc. (a) | | 90,790 | 745,386 |
| Powell Industries, Inc. | | 24,972 | 683,983 |
| Preformed Line Products Co. | | 5,037 | 251,900 |
| Thermon Group Holdings, Inc. (a) | | 1,227 | 17,877 |
| | | | 5,898,577 |
| Machinery - 1.8% | | | |
| Albany International Corp. Class A | | 1,426 | 83,720 |
| Chart Industries, Inc. (a) | | 2,581 | 125,153 |
| CIRCOR International, Inc. (a) | | 4,983 | 126,967 |
| Columbus McKinnon Corp. (NY Shares) | | 890 | 29,771 |
| Evoqua Water Technologies Corp. (a) | | 17,772 | 330,559 |
| Gorman-Rupp Co. | | 2,082 | 64,709 |
| Hillenbrand, Inc. | | 17,510 | 473,996 |
| Hurco Companies, Inc. | | 8,076 | 225,886 |
| Lydall, Inc. (a) | | 1,529 | 20,733 |
| Mueller Industries, Inc. | | 15,617 | 415,100 |
| Park-Ohio Holdings Corp. | | 557 | 9,241 |
| Proto Labs, Inc. (a) | | 1,361 | 153,072 |
| Rexnord Corp. | | 45,793 | 1,334,866 |
| Watts Water Technologies, Inc. Class A | | 3,856 | 312,336 |
| | | | 3,706,109 |
| Marine - 0.1% | | | |
| Costamare, Inc. (b) | | 24,937 | 138,650 |
| Professional Services - 1.5% | | | |
| Barrett Business Services, Inc. | | 2,208 | 117,311 |
| CRA International, Inc. | | 2,294 | 90,613 |
| Heidrick & Struggles International, Inc. | | 27,241 | 588,950 |
| Kforce, Inc. | | 26,282 | 768,749 |
| Korn Ferry | | 5,725 | 175,929 |
| Resources Connection, Inc. | | 74,524 | 892,052 |
| TriNet Group, Inc. (a) | | 8,032 | 489,470 |
| | | | 3,123,074 |
| Road & Rail - 0.5% | | | |
| ArcBest Corp. | | 7,887 | 209,084 |
| Heartland Express, Inc. | | 9,472 | 197,207 |
| Marten Transport Ltd. | | 24,665 | 620,571 |
| | | | 1,026,862 |
| Trading Companies & Distributors - 1.4% | | | |
| Applied Industrial Technologies, Inc. | | 12,958 | 808,450 |
| BMC Stock Holdings, Inc. (a) | | 6,540 | 164,416 |
| GMS, Inc. (a) | | 18,921 | 465,267 |
| Herc Holdings, Inc. (a) | | 4,226 | 129,865 |
| Rush Enterprises, Inc. Class A | | 26,829 | 1,112,330 |
| Systemax, Inc. | | 15,339 | 315,063 |
| WESCO International, Inc. (a) | | 214 | 7,514 |
| | | | 3,002,905 |
|
| TOTAL INDUSTRIALS | | | 30,654,742 |
|
| INFORMATION TECHNOLOGY - 15.2% | | | |
| Communications Equipment - 0.8% | | | |
| Acacia Communications, Inc. (a) | | 854 | 57,380 |
| ADTRAN, Inc. | | 6,593 | 72,061 |
| Calix Networks, Inc. (a) | | 84,193 | 1,254,476 |
| Comtech Telecommunications Corp. | | 2,074 | 35,030 |
| Digi International, Inc. (a) | | 9,565 | 111,432 |
| Inseego Corp. (a)(b) | | 14,129 | 163,896 |
| Plantronics, Inc. (b) | | 1,891 | 27,760 |
| Tessco Technologies, Inc. | | 272 | 1,496 |
| | | | 1,723,531 |
| Electronic Equipment & Components - 2.0% | | | |
| Badger Meter, Inc. (b) | | 10,971 | 690,295 |
| ePlus, Inc. (a) | | 2,937 | 207,587 |
| Insight Enterprises, Inc. (a) | | 17,595 | 865,674 |
| Itron, Inc. (a) | | 523 | 34,649 |
| Kimball Electronics, Inc. (a) | | 24,620 | 333,355 |
| Methode Electronics, Inc. Class A (b) | | 14,219 | 444,486 |
| PC Connection, Inc. | | 19,757 | 915,935 |
| Sanmina Corp. (a) | | 8,838 | 221,304 |
| ScanSource, Inc. (a) | | 17,699 | 426,369 |
| | | | 4,139,654 |
| IT Services - 1.6% | | | |
| Brightcove, Inc. (a) | | 3,560 | 28,053 |
| CSG Systems International, Inc. | | 3,140 | 129,965 |
| EVERTEC, Inc. | | 40,703 | 1,143,754 |
| Limelight Networks, Inc. (a) | | 50,245 | 369,803 |
| ManTech International Corp. Class A | | 3,753 | 257,043 |
| Perspecta, Inc. | | 26,726 | 620,845 |
| Sykes Enterprises, Inc. (a) | | 22,419 | 620,110 |
| | | | 3,169,573 |
| Semiconductors & Semiconductor Equipment - 4.8% | | | |
| Ambarella, Inc. (a) | | 12,703 | 581,797 |
| Amkor Technology, Inc. (a) | | 57,528 | 708,170 |
| Cirrus Logic, Inc. (a) | | 17,133 | 1,058,477 |
| Diodes, Inc. (a) | | 12,355 | 626,399 |
| Enphase Energy, Inc. (a) | | 7,407 | 352,351 |
| FormFactor, Inc. (a) | | 13,718 | 402,349 |
| Inphi Corp. (a) | | 8,306 | 975,955 |
| Lattice Semiconductor Corp. (a) | | 34,105 | 968,241 |
| NeoPhotonics Corp. (a) | | 47,870 | 425,086 |
| Photronics, Inc. (a) | | 5,904 | 65,712 |
| Power Integrations, Inc. | | 10,185 | 1,203,154 |
| Rambus, Inc. (a) | | 5,383 | 81,822 |
| Semtech Corp. (a) | | 2,543 | 132,795 |
| Silicon Laboratories, Inc. (a) | | 11,205 | 1,123,525 |
| Synaptics, Inc. (a) | | 16,253 | 977,130 |
| Ultra Clean Holdings, Inc. (a) | | 6,032 | 136,504 |
| Veeco Instruments, Inc. (a)(b) | | 1,221 | 16,471 |
| | | | 9,835,938 |
| Software - 5.7% | | | |
| Agilysys, Inc. (a) | | 39,380 | 706,477 |
| AppFolio, Inc. (a) | | 2,854 | 464,374 |
| BlackLine, Inc. (a) | | 13,748 | 1,139,847 |
| Box, Inc. Class A (a) | | 68,129 | 1,414,358 |
| Cloudera, Inc. (a) | | 37,433 | 476,148 |
| CommVault Systems, Inc. (a) | | 26,582 | 1,028,723 |
| Cornerstone OnDemand, Inc. (a) | | 15,671 | 604,274 |
| Digital Turbine, Inc. (a) | | 67,574 | 849,405 |
| Domo, Inc. Class B (a) | | 13,214 | 425,094 |
| Ebix, Inc. (b) | | 2,162 | 48,342 |
| Everbridge, Inc. (a) | | 3,837 | 530,887 |
| MobileIron, Inc. (a) | | 122,032 | 601,618 |
| Progress Software Corp. | | 30,499 | 1,181,836 |
| Q2 Holdings, Inc. (a) | | 12,666 | 1,086,616 |
| Rimini Street, Inc. (a) | | 408 | 2,101 |
| SPS Commerce, Inc. (a) | | 11,597 | 871,167 |
| TeleNav, Inc. (a) | | 5,644 | 30,986 |
| Tenable Holdings, Inc. (a) | | 3,977 | 118,554 |
| Verint Systems, Inc. (a) | | 2,252 | 101,745 |
| Yext, Inc. (a) | | 6,284 | 104,377 |
| | | | 11,786,929 |
| Technology Hardware, Storage & Peripherals - 0.3% | | | |
| Avid Technology, Inc. (a)(b) | | 79,301 | 576,518 |
|
| TOTAL INFORMATION TECHNOLOGY | | | 31,232,143 |
|
| MATERIALS - 3.9% | | | |
| Chemicals - 1.0% | | | |
| FutureFuel Corp. | | 27,181 | 324,813 |
| Hawkins, Inc. | | 590 | 25,122 |
| PolyOne Corp. | | 19,398 | 508,810 |
| Stepan Co. | | 10,881 | 1,056,545 |
| Tronox Holdings PLC (b) | | 15,252 | 110,119 |
| | | | 2,025,409 |
| Construction Materials - 0.4% | | | |
| Forterra, Inc. (a) | | 82,859 | 924,706 |
| Containers & Packaging - 0.5% | | | |
| Myers Industries, Inc. | | 63,670 | 926,399 |
| Metals & Mining - 1.4% | | | |
| Coeur d'Alene Mines Corp. (a) | | 31,765 | 161,366 |
| Commercial Metals Co. | | 39,235 | 800,394 |
| Gold Resource Corp. | | 7,439 | 30,574 |
| Hecla Mining Co. | | 56,455 | 184,608 |
| Materion Corp. | | 3,378 | 207,713 |
| Novagold Resources, Inc. (a) | | 24,961 | 228,907 |
| Schnitzer Steel Industries, Inc. Class A | | 1,061 | 18,716 |
| Worthington Industries, Inc. | | 31,804 | 1,186,289 |
| | | | 2,818,567 |
| Paper & Forest Products - 0.6% | | | |
| Boise Cascade Co. | | 22,084 | 830,579 |
| Schweitzer-Mauduit International, Inc. | | 13,624 | 455,178 |
| | | | 1,285,757 |
|
| TOTAL MATERIALS | | | 7,980,838 |
|
| REAL ESTATE - 5.0% | | | |
| Equity Real Estate Investment Trusts (REITs) - 3.8% | | | |
| Agree Realty Corp. | | 1,603 | 105,333 |
| American Assets Trust, Inc. | | 33,242 | 925,457 |
| Braemar Hotels & Resorts, Inc. | | 4,056 | 11,600 |
| CatchMark Timber Trust, Inc. | | 6,447 | 57,056 |
| Clipper Realty, Inc. | | 1,013 | 8,205 |
| CoreCivic, Inc. | | 78,139 | 731,381 |
| EastGroup Properties, Inc. | | 5,512 | 653,778 |
| Essential Properties Realty Trust, Inc. | | 11,910 | 176,744 |
| Farmland Partners, Inc. | | 4,889 | 33,490 |
| Four Corners Property Trust, Inc. | | 12,609 | 307,660 |
| Franklin Street Properties Corp. | | 3,455 | 17,586 |
| Gladstone Land Corp. | | 4,423 | 70,149 |
| Healthcare Realty Trust, Inc. | | 5,977 | 175,066 |
| Kite Realty Group Trust | | 15,336 | 176,977 |
| National Storage Affiliates Trust | | 22,296 | 639,003 |
| New Senior Investment Group, Inc. | | 20,038 | 72,538 |
| Piedmont Office Realty Trust, Inc. Class A | | 5,399 | 89,677 |
| PS Business Parks, Inc. | | 9,195 | 1,217,418 |
| Rexford Industrial Realty, Inc. | | 3,022 | 125,201 |
| RLJ Lodging Trust | | 38,451 | 362,977 |
| Safety Income and Growth, Inc. | | 1,959 | 112,623 |
| Senior Housing Properties Trust (SBI) | | 115,156 | 509,565 |
| Sunstone Hotel Investors, Inc. | | 41,135 | 335,250 |
| Terreno Realty Corp. | | 5,737 | 301,996 |
| The GEO Group, Inc. | | 51,399 | 608,050 |
| | | | 7,824,780 |
| Real Estate Management & Development - 1.2% | | | |
| Gyrodyne LLC (a) | | 137 | 2,288 |
| Kennedy-Wilson Holdings, Inc. | | 26,074 | 396,846 |
| Marcus & Millichap, Inc. (a) | | 15,729 | 453,939 |
| Newmark Group, Inc. | | 120,597 | 586,101 |
| RE/MAX Holdings, Inc. | | 7,758 | 243,834 |
| The RMR Group, Inc. | | 26,504 | 781,073 |
| | | | 2,464,081 |
|
| TOTAL REAL ESTATE | | | 10,288,861 |
|
| UTILITIES - 2.9% | | | |
| Electric Utilities - 1.3% | | | |
| Allete, Inc. | | 13,686 | 747,392 |
| El Paso Electric Co. | | 1,165 | 78,055 |
| MGE Energy, Inc. | | 1,120 | 72,251 |
| Otter Tail Corp. | | 9,749 | 378,164 |
| PNM Resources, Inc. | | 2,700 | 103,788 |
| Portland General Electric Co. | | 27,992 | 1,170,346 |
| Spark Energy, Inc. Class A, (b) | | 9,750 | 68,933 |
| | | | 2,618,929 |
| Gas Utilities - 0.2% | | | |
| New Jersey Resources Corp. | | 7,705 | 251,568 |
| South Jersey Industries, Inc. | | 3,872 | 96,761 |
| Southwest Gas Holdings, Inc. | | 485 | 33,489 |
| | | | 381,818 |
| Independent Power and Renewable Electricity Producers - 0.5% | | | |
| Atlantic Power Corp. (a) | | 32,223 | 64,446 |
| Clearway Energy, Inc. Class A | | 48,048 | 1,007,567 |
| Ormat Technologies, Inc. | | 235 | 14,920 |
| Sunnova Energy International, Inc. (b) | | 872 | 14,885 |
| | | | 1,101,818 |
| Multi-Utilities - 0.3% | | | |
| Avista Corp. | | 13,847 | 503,892 |
| Black Hills Corp. | | 2,816 | 159,555 |
| NorthWestern Energy Corp. | | 739 | 40,290 |
| | | | 703,737 |
| Water Utilities - 0.6% | | | |
| American States Water Co. | | 4,567 | 359,103 |
| California Water Service Group | | 6,913 | 329,750 |
| Consolidated Water Co., Inc. | | 1,845 | 26,623 |
| Middlesex Water Co. | | 6,009 | 403,685 |
| York Water Co. (b) | | 1,631 | 78,223 |
| | | | 1,197,384 |
|
| TOTAL UTILITIES | | | 6,003,686 |
|
| TOTAL COMMON STOCKS | | | |
| (Cost $192,449,515) | | | 198,590,117 |
|
| Nonconvertible Preferred Stocks - 0.0% | | | |
| INDUSTRIALS - 0.0% | | | |
| Trading Companies & Distributors - 0.0% | | | |
| WESCO International, Inc. (a)(d) | | | |
| (Cost $15,079) | | 569 | 15,102 |
|
| Money Market Funds - 12.5% | | | |
| Fidelity Cash Central Fund 0.12% (e) | | 6,457,727 | 6,459,019 |
| Fidelity Securities Lending Cash Central Fund 0.12% (e)(f) | | 19,213,856 | 19,215,777 |
| TOTAL MONEY MARKET FUNDS | | | |
| (Cost $25,674,796) | | | 25,674,796 |
| TOTAL INVESTMENT IN SECURITIES - 109.0% | | | |
| (Cost $218,139,390) | | | 224,280,015 |
| NET OTHER ASSETS (LIABILITIES) - (9.0)% | | | (18,495,274) |
| NET ASSETS - 100% | | | $205,784,741 |
| Futures Contracts | | | | | |
| | Number of contracts | Expiration Date | Notional Amount | Value | Unrealized Appreciation/(Depreciation) |
| Purchased | | | | | |
| Equity Index Contracts | | | | | |
| CME E-mini Russell 2000 Index Contracts (United States) | 97 | Sept. 2020 | $6,972,360 | $143,947 | $143,947 |
The notional amount of futures purchased as a percentage of Net Assets is 3.4%
Legend
(a) Non-income producing
(b) Security or a portion of the security is on loan at period end.
(c) Level 3 security
(d) Coupon rates for floating and adjustable rate securities reflect the rates in effect at period end.
(e) Affiliated fund that is generally available only to investment companies and other accounts managed by Fidelity Investments. The rate quoted is the annualized seven-day yield of the fund at period end. A complete unaudited listing of the fund's holdings as of its most recent quarter end is available upon request. In addition, each Fidelity Central Fund's financial statements are available on the SEC's website or upon request.
(f) Investment made with cash collateral received from securities on loan.
Affiliated Central Funds
Information regarding fiscal year to date income earned by the Fund from investments in Fidelity Central Funds is as follows:
| Fund | Income earned |
| Fidelity Cash Central Fund | $15,785 |
| Fidelity Securities Lending Cash Central Fund | 100,083 |
| Total | $115,868 |
Amounts in the income column in the above table include any capital gain distributions from underlying funds, which are presented in the corresponding line-item in the Statement of Operations, if applicable. Amount for Fidelity Securities Lending Cash Central Fund represents the income earned on investing cash collateral, less rebates paid to borrowers and any lending agent fees associated with the loan, plus any premium payments received for lending certain types of securities.
Investment Valuation
The following is a summary of the inputs used, as of June 30, 2020, involving the Fund's assets and liabilities carried at fair value. The inputs or methodology used for valuing securities may not be an indication of the risk associated with investing in those securities. For more information on valuation inputs, and their aggregation into the levels used below, please refer to the Investment Valuation section in the accompanying Notes to Financial Statements.
| | Valuation Inputs at Reporting Date: |
| Description | Total | Level 1 | Level 2 | Level 3 |
| Investments in Securities: | | | | |
| Equities: | | | | |
| Communication Services | $4,559,006 | $4,559,006 | $-- | $-- |
| Consumer Discretionary | 20,691,710 | 20,691,710 | -- | -- |
| Consumer Staples | 7,050,509 | 7,050,509 | -- | -- |
| Energy | 2,628,873 | 2,628,873 | -- | -- |
| Financials | 34,594,741 | 34,594,741 | -- | -- |
| Health Care | 42,905,008 | 42,905,008 | -- | -- |
| Industrials | 30,669,844 | 30,669,844 | -- | -- |
| Information Technology | 31,232,143 | 31,232,143 | -- | -- |
| Materials | 7,980,838 | 7,980,838 | -- | -- |
| Real Estate | 10,288,861 | 10,288,861 | -- | -- |
| Utilities | 6,003,686 | 6,003,686 | -- | -- |
| Money Market Funds | 25,674,796 | 25,674,796 | -- | -- |
| Total Investments in Securities: | $224,280,015 | $224,280,015 | $-- | $-- |
| Derivative Instruments: | | | | |
| Assets | | | | |
| Futures Contracts | $143,947 | $143,947 | $-- | $-- |
| Total Assets | $143,947 | $143,947 | $-- | $-- |
| Total Derivative Instruments: | $143,947 | $143,947 | $-- | $-- |
Value of Derivative Instruments
The following table is a summary of the Fund's value of derivative instruments by primary risk exposure as of June 30, 2020. For additional information on derivative instruments, please refer to the Derivative Instruments section in the accompanying Notes to Financial Statements.
| Primary Risk Exposure / Derivative Type | Value |
| | Asset | Liability |
| Equity Risk | | |
| Futures Contracts(a) | $143,947 | $0 |
| Total Equity Risk | 143,947 | 0 |
| Total Value of Derivatives | $143,947 | $0 |
(a) Reflects gross cumulative appreciation (depreciation) on futures contracts as presented in the Schedule of Investments. In the Statement of Assets and Liabilities, the period end daily variation margin is included in receivable or payable for daily variation margin on futures contracts, and the net cumulative appreciation (depreciation) is included in Total accumulated earnings (loss).
See accompanying notes which are an integral part of the financial statements.
Financial Statements
Statement of Assets and Liabilities
| | | June 30, 2020 (Unaudited) |
| Assets | | |
Investment in securities, at value (including securities loaned of $18,765,939) — See accompanying schedule:
Unaffiliated issuers (cost $192,464,594) | $198,605,219 | |
| Fidelity Central Funds (cost $25,674,796) | 25,674,796 | |
| Total Investment in Securities (cost $218,139,390) | | $224,280,015 |
| Segregated cash with brokers for derivative instruments | | 620,800 |
| Receivable for investments sold | | 1,736,325 |
| Receivable for fund shares sold | | 40,323 |
| Dividends receivable | | 120,836 |
| Distributions receivable from Fidelity Central Funds | | 34,405 |
| Receivable for daily variation margin on futures contracts | | 69,840 |
| Other receivables | | 4 |
| Total assets | | 226,902,548 |
| Liabilities | | |
| Payable to custodian bank | $1,542,549 | |
| Payable for fund shares redeemed | 212,745 | |
| Accrued management fee | 76,809 | |
| Distribution and service plan fees payable | 1,882 | |
| Other affiliated payables | 29,137 | |
| Other payables and accrued expenses | 42,069 | |
| Collateral on securities loaned | 19,212,616 | |
| Total liabilities | | 21,117,807 |
| Net Assets | | $205,784,741 |
| Net Assets consist of: | | |
| Paid in capital | | $218,199,325 |
| Total accumulated earnings (loss) | | (12,414,584) |
| Net Assets | | $205,784,741 |
| Net Asset Value and Maximum Offering Price | | |
| Initial Class: | | |
| Net Asset Value, offering price and redemption price per share ($17,669,759 ÷ 1,417,569 shares) | | $12.46 |
| Service Class: | | |
| Net Asset Value, offering price and redemption price per share ($184,187 ÷ 14,729 shares) | | $12.51 |
| Service Class 2: | | |
| Net Asset Value, offering price and redemption price per share ($9,029,916 ÷ 723,091 shares) | | $12.49 |
| Investor Class: | | |
| Net Asset Value, offering price and redemption price per share ($178,900,879 ÷ 14,423,356 shares) | | $12.40 |
See accompanying notes which are an integral part of the financial statements.
Statement of Operations
| | | Six months ended June 30, 2020 (Unaudited) |
| Investment Income | | |
| Dividends | | $1,456,434 |
| Interest | | 1,041 |
| Income from Fidelity Central Funds (including $100,083 from security lending) | | 115,868 |
| Total income | | 1,573,343 |
| Expenses | | |
| Management fee | $479,061 | |
| Transfer agent fees | 138,231 | |
| Distribution and service plan fees | 10,549 | |
| Accounting fees | 41,412 | |
| Custodian fees and expenses | 14,960 | |
| Independent trustees' fees and expenses | 702 | |
| Audit | 25,529 | |
| Legal | 12,856 | |
| Miscellaneous | 14,977 | |
| Total expenses before reductions | 738,277 | |
| Expense reductions | (9) | |
| Total expenses after reductions | | 738,268 |
| Net investment income (loss) | | 835,075 |
| Realized and Unrealized Gain (Loss) | | |
| Net realized gain (loss) on: | | |
| Investment securities: | | |
| Unaffiliated issuers | (11,009,996) | |
| Fidelity Central Funds | (23) | |
| Futures contracts | (185,295) | |
| Total net realized gain (loss) | | (11,195,314) |
| Change in net unrealized appreciation (depreciation) on: | | |
| Investment securities: | | |
| Unaffiliated issuers | (31,689,045) | |
| Futures contracts | 5,723 | |
| Total change in net unrealized appreciation (depreciation) | | (31,683,322) |
| Net gain (loss) | | (42,878,636) |
| Net increase (decrease) in net assets resulting from operations | | $(42,043,561) |
See accompanying notes which are an integral part of the financial statements.
Statement of Changes in Net Assets
| | Six months ended June 30, 2020 (Unaudited) | Year ended December 31, 2019 |
| Increase (Decrease) in Net Assets | | |
| Operations | | |
| Net investment income (loss) | $835,075 | $2,576,348 |
| Net realized gain (loss) | (11,195,314) | (2,003,650) |
| Change in net unrealized appreciation (depreciation) | (31,683,322) | 54,214,327 |
| Net increase (decrease) in net assets resulting from operations | (42,043,561) | 54,787,025 |
| Distributions to shareholders | (581,494) | (25,056,254) |
| Share transactions - net increase (decrease) | (19,799,980) | (5,940,974) |
| Total increase (decrease) in net assets | (62,425,035) | 23,789,797 |
| Net Assets | | |
| Beginning of period | 268,209,776 | 244,419,979 |
| End of period | $205,784,741 | $268,209,776 |
See accompanying notes which are an integral part of the financial statements.
Financial Highlights
VIP Disciplined Small Cap Portfolio Initial Class
| | Six months ended (Unaudited) June 30, | Years endedDecember 31, | | | | |
| | 2020 | 2019 | 2018 | 2017 | 2016 | 2015 |
| Selected Per–Share Data | | | | | | |
| Net asset value, beginning of period | $14.68 | $13.07 | $16.86 | $16.25 | $14.52 | $14.94 |
| Income from Investment Operations | | | | | | |
| Net investment income (loss)A | .05 | .15 | .14 | .11 | .13 | .10 |
| Net realized and unrealized gain (loss) | (2.24) | 2.81 | (2.20) | 1.01 | 2.75 | (.40) |
| Total from investment operations | (2.19) | 2.96 | (2.06) | 1.12 | 2.88 | (.30) |
| Distributions from net investment income | (.03) | (.14) | (.14) | (.12) | (.09) | (.09) |
| Distributions from net realized gain | – | (1.21) | (1.59) | (.40) | (1.06) | (.03) |
| Total distributions | (.03) | (1.35) | (1.73) | (.51)B | (1.15) | (.12) |
| Net asset value, end of period | $12.46 | $14.68 | $13.07 | $16.86 | $16.25 | $14.52 |
| Total ReturnC,D,E | (14.92)% | 23.71% | (13.08)% | 7.02% | 22.68% | (1.99)% |
| Ratios to Average Net AssetsF,G | | | | | | |
| Expenses before reductions | .61%H,I | .59% | .60% | .83% | .86% | .85% |
| Expenses net of fee waivers, if any | .61%H,I | .59% | .60% | .83% | .86% | .84% |
| Expenses net of all reductions | .61%H,I | .59% | .60% | .83% | .86% | .84% |
| Net investment income (loss) | .87%H,I | 1.05% | .90% | .67% | .90% | .68% |
| Supplemental Data | | | | | | |
| Net assets, end of period (000 omitted) | $17,670 | $23,600 | $24,285 | $31,332 | $41,185 | $30,227 |
| Portfolio turnover rateJ | 66%H | 77% | 103% | 103% | 83% | 96% |
A Calculated based on average shares outstanding during the period.
B Total distributions of $.51 per share is comprised of distributions from net investment income of $.116 and distributions from net realized gain of $.395 per share.
C Total returns for periods of less than one year are not annualized.
D Total returns do not reflect charges attributable to your insurance company's separate account. Inclusion of these charges would reduce the total returns shown.
E Total returns would have been lower if certain expenses had not been reduced during the applicable periods shown.
F Fees and expenses of any underlying Fidelity Central Funds are not included in the Fund's expense ratio. The Fund indirectly bears its proportionate share of the expenses of any underlying Fidelity Central Funds.
G Expense ratios reflect operating expenses of the class. Expenses before reductions do not reflect amounts reimbursed by the investment adviser or reductions from expense offset arrangements and do not represent the amount paid by the class during periods when reimbursements or reductions occur. Expenses net of fee waivers reflect expenses after reimbursement by the investment adviser but prior to reductions from expense offset arrangements. Expenses net of all reductions represent the net expenses paid by the class.
H Annualized
I Proxy expenses are not annualized.
J Amount does not include the portfolio activity of any underlying Fidelity Central Funds.
See accompanying notes which are an integral part of the financial statements.
VIP Disciplined Small Cap Portfolio Service Class
| | Six months ended (Unaudited) June 30, | Years endedDecember 31, | | | | |
| | 2020 | 2019 | 2018 | 2017 | 2016 | 2015 |
| Selected Per–Share Data | | | | | | |
| Net asset value, beginning of period | $14.74 | $13.12 | $16.91 | $16.29 | $14.56 | $14.98 |
| Income from Investment Operations | | | | | | |
| Net investment income (loss)A | .05 | .13 | .13 | .09 | .11 | .09 |
| Net realized and unrealized gain (loss) | (2.25) | 2.83 | (2.21) | 1.03 | 2.75 | (.40) |
| Total from investment operations | (2.20) | 2.96 | (2.08) | 1.12 | 2.86 | (.31) |
| Distributions from net investment income | (.03) | (.13) | (.12) | (.10) | (.07) | (.08) |
| Distributions from net realized gain | – | (1.21) | (1.59) | (.40) | (1.06) | (.03) |
| Total distributions | (.03) | (1.34) | (1.71) | (.50) | (1.13) | (.11) |
| Net asset value, end of period | $12.51 | $14.74 | $13.12 | $16.91 | $16.29 | $14.56 |
| Total ReturnB,C,D | (14.94)% | 23.59% | (13.13)% | 6.97% | 22.49% | (2.09)% |
| Ratios to Average Net AssetsE,F | | | | | | |
| Expenses before reductions | .71%G,H | .69% | .70% | .93% | .96% | .95% |
| Expenses net of fee waivers, if any | .71%G,H | .69% | .70% | .93% | .96% | .94% |
| Expenses net of all reductions | .71%G,H | .69% | .70% | .93% | .96% | .94% |
| Net investment income (loss) | .78%G,H | .95% | .80% | .57% | .80% | .58% |
| Supplemental Data | | | | | | |
| Net assets, end of period (000 omitted) | $184 | $217 | $193 | $249 | $266 | $311 |
| Portfolio turnover rateI | 66%G | 77% | 103% | 103% | 83% | 96% |
A Calculated based on average shares outstanding during the period.
B Total returns for periods of less than one year are not annualized.
C Total returns do not reflect charges attributable to your insurance company's separate account. Inclusion of these charges would reduce the total returns shown.
D Total returns would have been lower if certain expenses had not been reduced during the applicable periods shown.
E Fees and expenses of any underlying Fidelity Central Funds are not included in the Fund's expense ratio. The Fund indirectly bears its proportionate share of the expenses of any underlying Fidelity Central Funds.
F Expense ratios reflect operating expenses of the class. Expenses before reductions do not reflect amounts reimbursed by the investment adviser or reductions from expense offset arrangements and do not represent the amount paid by the class during periods when reimbursements or reductions occur. Expenses net of fee waivers reflect expenses after reimbursement by the investment adviser but prior to reductions from expense offset arrangements. Expenses net of all reductions represent the net expenses paid by the class.
G Annualized
H Proxy expenses are not annualized.
I Amount does not include the portfolio activity of any underlying Fidelity Central Funds.
See accompanying notes which are an integral part of the financial statements.
VIP Disciplined Small Cap Portfolio Service Class 2
| | Six months ended (Unaudited) June 30, | Years endedDecember 31, | | | | |
| | 2020 | 2019 | 2018 | 2017 | 2016 | 2015 |
| Selected Per–Share Data | | | | | | |
| Net asset value, beginning of period | $14.72 | $13.11 | $16.90 | $16.29 | $14.58 | $14.99 |
| Income from Investment Operations | | | | | | |
| Net investment income (loss)A | .04 | .11 | .10 | .07 | .09 | .07 |
| Net realized and unrealized gain (loss) | (2.24) | 2.82 | (2.20) | 1.02 | 2.75 | (.40) |
| Total from investment operations | (2.20) | 2.93 | (2.10) | 1.09 | 2.84 | (.33) |
| Distributions from net investment income | (.03) | (.11) | (.10) | (.08) | (.07) | (.05) |
| Distributions from net realized gain | – | (1.21) | (1.59) | (.40) | (1.06) | (.03) |
| Total distributions | (.03) | (1.32) | (1.69) | (.48) | (1.13) | (.08) |
| Net asset value, end of period | $12.49 | $14.72 | $13.11 | $16.90 | $16.29 | $14.58 |
| Total ReturnB,C,D | (14.98)% | 23.37% | (13.29)% | 6.79% | 22.31% | (2.18)% |
| Ratios to Average Net AssetsE,F | | | | | | |
| Expenses before reductions | .86%G,H | .84% | .85% | 1.08% | 1.11% | 1.10% |
| Expenses net of fee waivers, if any | .86%G,H | .84% | .85% | 1.08% | 1.11% | 1.10% |
| Expenses net of all reductions | .86%G,H | .84% | .85% | 1.08% | 1.11% | 1.10% |
| Net investment income (loss) | .62%G,H | .80% | .65% | .42% | .65% | .43% |
| Supplemental Data | | | | | | |
| Net assets, end of period (000 omitted) | $9,030 | $9,767 | $6,823 | $7,881 | $6,403 | $3,198 |
| Portfolio turnover rateI | 66%G | 77% | 103% | 103% | 83% | 96% |
A Calculated based on average shares outstanding during the period.
B Total returns for periods of less than one year are not annualized.
C Total returns do not reflect charges attributable to your insurance company's separate account. Inclusion of these charges would reduce the total returns shown.
D Total returns would have been lower if certain expenses had not been reduced during the applicable periods shown.
E Fees and expenses of any underlying Fidelity Central Funds are not included in the Fund's expense ratio. The Fund indirectly bears its proportionate share of the expenses of any underlying Fidelity Central Funds.
F Expense ratios reflect operating expenses of the class. Expenses before reductions do not reflect amounts reimbursed by the investment adviser or reductions from expense offset arrangements and do not represent the amount paid by the class during periods when reimbursements or reductions occur. Expenses net of fee waivers reflect expenses after reimbursement by the investment adviser but prior to reductions from expense offset arrangements. Expenses net of all reductions represent the net expenses paid by the class.
G Annualized
H Proxy expenses are not annualized.
I Amount does not include the portfolio activity of any underlying Fidelity Central Funds.
See accompanying notes which are an integral part of the financial statements.
VIP Disciplined Small Cap Portfolio Investor Class
| | Six months ended (Unaudited) June 30, | Years endedDecember 31, | | | | |
| | 2020 | 2019 | 2018 | 2017 | 2016 | 2015 |
| Selected Per–Share Data | | | | | | |
| Net asset value, beginning of period | $14.61 | $13.02 | $16.79 | $16.19 | $14.48 | $14.89 |
| Income from Investment Operations | | | | | | |
| Net investment income (loss)A | .05 | .13 | .13 | .09 | .11 | .09 |
| Net realized and unrealized gain (loss) | (2.23) | 2.80 | (2.19) | 1.01 | 2.74 | (.39) |
| Total from investment operations | (2.18) | 2.93 | (2.06) | 1.10 | 2.85 | (.30) |
| Distributions from net investment income | (.03) | (.13) | (.12) | (.10) | (.08) | (.08) |
| Distributions from net realized gain | – | (1.21) | (1.59) | (.40) | (1.06) | (.03) |
| Total distributions | (.03) | (1.34) | (1.71) | (.50) | (1.14) | (.11) |
| Net asset value, end of period | $12.40 | $14.61 | $13.02 | $16.79 | $16.19 | $14.48 |
| Total ReturnB,C,D | (14.94)% | 23.55% | (13.09)% | 6.91% | 22.54% | (2.00)% |
| Ratios to Average Net AssetsE,F | | | | | | |
| Expenses before reductions | .69%G,H | .67% | .68% | .91% | .94% | .93% |
| Expenses net of fee waivers, if any | .69%G,H | .67% | .68% | .91% | .94% | .92% |
| Expenses net of all reductions | .69%G,H | .67% | .68% | .91% | .94% | .92% |
| Net investment income (loss) | .79%G,H | .97% | .82% | .59% | .82% | .60% |
| Supplemental Data | | | | | | |
| Net assets, end of period (000 omitted) | $178,901 | $234,625 | $213,119 | $251,217 | $263,763 | $190,669 |
| Portfolio turnover rateI | 66%G | 77% | 103% | 103% | 83% | 96% |
A Calculated based on average shares outstanding during the period.
B Total returns for periods of less than one year are not annualized.
C Total returns do not reflect charges attributable to your insurance company's separate account. Inclusion of these charges would reduce the total returns shown.
D Total returns would have been lower if certain expenses had not been reduced during the applicable periods shown.
E Fees and expenses of any underlying Fidelity Central Funds are not included in the Fund's expense ratio. The Fund indirectly bears its proportionate share of the expenses of any underlying Fidelity Central Funds.
F Expense ratios reflect operating expenses of the class. Expenses before reductions do not reflect amounts reimbursed by the investment adviser or reductions from expense offset arrangements and do not represent the amount paid by the class during periods when reimbursements or reductions occur. Expenses net of fee waivers reflect expenses after reimbursement by the investment adviser but prior to reductions from expense offset arrangements. Expenses net of all reductions represent the net expenses paid by the class.
G Annualized
H Proxy expenses are not annualized.
I Amount does not include the portfolio activity of any underlying Fidelity Central Funds.
See accompanying notes which are an integral part of the financial statements.
Notes to Financial Statements (Unaudited)
For the period ended June 30, 2020
1. Organization.
VIP Disciplined Small Cap Portfolio (the Fund) is a fund of Variable Insurance Products Fund II (the Trust) and is authorized to issue an unlimited number of shares. The Trust is registered under the Investment Company Act of 1940, as amended (the 1940 Act), as an open-end management investment company organized as a Massachusetts business trust. Shares of the Fund may only be purchased by insurance companies for the purpose of funding variable annuity or variable life insurance contracts. The Fund offers the following classes of shares: Initial Class shares, Service Class shares, Service Class 2 shares and Investor Class shares. All classes have equal rights and voting privileges, except for matters affecting a single class.
Effective January 1, 2020:
Investment advisers Fidelity Investments Money Management, Inc., FMR Co., Inc., and Fidelity SelectCo, LLC, merged with and into Fidelity Management & Research Company. In connection with the merger transactions, the resulting, merged investment adviser was then redomiciled from Massachusetts to Delaware, changed its corporate structure from a corporation to a limited liability company, and changed its name to "Fidelity Management & Research Company LLC".
Broker-dealer Fidelity Distributors Corporation merged with and into Fidelity Investments Institutional Services Company, Inc. ("FIISC"). FIISC was then redomiciled from Massachusetts to Delaware, changed its corporate structure from a corporation to a limited liability company, and changed its name to "Fidelity Distributors Company LLC".
Fidelity Investments Institutional Operations Company, Inc. converted from a Massachusetts corporation to a Massachusetts LLC, and changed its name to "Fidelity Investments Institutional Operations Company LLC".
2. Investments in Fidelity Central Funds.
The Fund invests in Fidelity Central Funds, which are open-end investment companies generally available only to other investment companies and accounts managed by the investment adviser and its affiliates. The Fund's Schedule of Investments lists each of the Fidelity Central Funds held as of period end, if any, as an investment of the Fund, but does not include the underlying holdings of each Fidelity Central Fund. As an Investing Fund, the Fund indirectly bears its proportionate share of the expenses of the underlying Fidelity Central Funds.
The Money Market Central Funds seek preservation of capital and current income and are managed by the investment adviser. Annualized expenses of the Money Market Central Funds as of their most recent shareholder report date ranged from less than .005% to .01%.
A complete unaudited list of holdings for each Fidelity Central Fund is available upon request or at the Securities and Exchange Commission (the SEC) website at www.sec.gov. In addition, the financial statements of the Fidelity Central Funds are available on the SEC website or upon request.
3. Significant Accounting Policies.
The Fund is an investment company and applies the accounting and reporting guidance of the Financial Accounting Standards Board (FASB) Accounting Standards Codification Topic 946 Financial Services – Investments Companies. The financial statements have been prepared in conformity with accounting principles generally accepted in the United States of America (GAAP), which require management to make certain estimates and assumptions at the date of the financial statements. Actual results could differ from those estimates. Subsequent events, if any, through the date that the financial statements were issued have been evaluated in the preparation of the financial statements. The following summarizes the significant accounting policies of the Fund:
Investment Valuation. Investments are valued as of 4:00 p.m. Eastern time on the last calendar day of the period. The Board of Trustees (the Board) has delegated the day to day responsibility for the valuation of the Fund's investments to the Fair Value Committee (the Committee) established by the Fund's investment adviser. In accordance with valuation policies and procedures approved by the Board, the Fund attempts to obtain prices from one or more third party pricing vendors or brokers to value its investments. When current market prices, quotations or currency exchange rates are not readily available or reliable, investments will be fair valued in good faith by the Committee, in accordance with procedures adopted by the Board. Factors used in determining fair value vary by investment type and may include market or investment specific events. The frequency with which these procedures are used cannot be predicted and they may be utilized to a significant extent. The Committee oversees the Fund's valuation policies and procedures and reports to the Board on the Committee's activities and fair value determinations. The Board monitors the appropriateness of the procedures used in valuing the Fund's investments and ratifies the fair value determinations of the Committee.
The Fund categorizes the inputs to valuation techniques used to value its investments into a disclosure hierarchy consisting of three levels as shown below:
- Level 1 – quoted prices in active markets for identical investments
- Level 2 – other significant observable inputs (including quoted prices for similar investments, interest rates, prepayment speeds, etc.)
- Level 3 – unobservable inputs (including the Fund's own assumptions based on the best information available)
Valuation techniques used to value the Fund's investments by major category are as follows:
Equity securities, including restricted securities, for which market quotations are readily available, are valued at the last reported sale price or official closing price as reported by a third party pricing vendor on the primary market or exchange on which they are traded and are categorized as Level 1 in the hierarchy. In the event there were no sales during the day or closing prices are not available, securities are valued at the last quoted bid price or may be valued using the last available price and are generally categorized as Level 2 in the hierarchy. For foreign equity securities, when market or security specific events arise, comparisons to the valuation of American Depositary Receipts (ADRs), futures contracts, Exchange-Traded Funds (ETFs) and certain indexes as well as quoted prices for similar securities may be used and would be categorized as Level 2 in the hierarchy. For equity securities, including restricted securities, where observable inputs are limited, assumptions about market activity and risk are used and these securities may be categorized as Level 3 in the hierarchy.
Futures contracts are valued at the settlement price established each day by the board of trade or exchange on which they are traded and are categorized as Level 1 in the hierarchy. Investments in open-end mutual funds, including the Fidelity Central Funds, are valued at their closing net asset value (NAV) each business day and are categorized as Level 1 in the hierarchy.
Changes in valuation techniques may result in transfers in or out of an assigned level within the disclosure hierarchy. The aggregate value of investments by input level as of June 30, 2020 is included at the end of the Fund's Schedule of Investments.
Investment Transactions and Income. For financial reporting purposes, the Fund's investment holdings and NAV include trades executed through the end of the last business day of the period. The NAV per share for processing shareholder transactions is calculated as of the close of business of the New York Stock Exchange (NYSE), normally 4:00 p.m. Eastern time and includes trades executed through the end of the prior business day. Gains and losses on securities sold are determined on the basis of identified cost and include proceeds received from litigation. Dividend income is recorded on the ex-dividend date, except for certain dividends from foreign securities where the ex-dividend date may have passed, which are recorded as soon as the Fund is informed of the ex-dividend date. Non-cash dividends included in dividend income, if any, are recorded at the fair market value of the securities received. Income and capital gain distributions from Fidelity Central Funds, if any, are recorded on the ex-dividend date. Certain distributions received by the Fund represent a return of capital or capital gain. The Fund determines the components of these distributions subsequent to the ex-dividend date, based upon receipt of tax filings or other correspondence relating to the underlying investment. These distributions are recorded as a reduction of cost of investments and/or as a realized gain. Interest income is accrued as earned and includes coupon interest and amortization of premium and accretion of discount on debt securities as applicable.
Class Allocations and Expenses. Investment income, realized and unrealized capital gains and losses, common expenses of the Fund, and certain fund-level expense reductions, if any, are allocated daily on a pro-rata basis to each class based on the relative net assets of each class to the total net assets of the Fund. Each class differs with respect to transfer agent and distribution and service plan fees incurred. Certain expense reductions may also differ by class. For the reporting period, the allocated portion of income and expenses to each class as a percent of its average net assets may vary due to the timing of recording these transactions in relation to fluctuating net assets of the classes. Expenses directly attributable to a fund are charged to that fund. Expenses attributable to more than one fund are allocated among the respective funds on the basis of relative net assets or other appropriate methods. Expense estimates are accrued in the period to which they relate and adjustments are made when actual amounts are known.
Income Tax Information and Distributions to Shareholders. Each year, the Fund intends to qualify as a regulated investment company under Subchapter M of the Internal Revenue Code, including distributing substantially all of its taxable income and realized gains. As a result, no provision for U.S. Federal income taxes is required. The Fund files a U.S. federal tax return, in addition to state and local tax returns as required. The Fund's federal income tax returns are subject to examination by the Internal Revenue Service (IRS) for a period of three fiscal years after they are filed. State and local tax returns may be subject to examination for an additional fiscal year depending on the jurisdiction.
Distributions are declared and recorded on the ex-dividend date. Income and capital gain distributions are declared separately for each class. Income and capital gain distributions are determined in accordance with income tax regulations, which may differ from GAAP.
Capital accounts within the financial statements are adjusted for permanent book-tax differences. These adjustments have no impact on net assets or the results of operations. Capital accounts are not adjusted for temporary book-tax differences which will reverse in a subsequent period.
Book-tax differences are primarily due to futures contracts, partnerships, market discount, capital loss carryforwards and losses deferred due to wash sales and excise tax regulations.
As of period end, the cost and unrealized appreciation (depreciation) in securities, and derivatives if applicable, for federal income tax purposes were as follows:
| Gross unrealized appreciation | $32,615,829 |
| Gross unrealized depreciation | (27,138,691) |
| Net unrealized appreciation (depreciation) | $5,477,138 |
| Tax cost | $218,946,824 |
Capital loss carryforwards are only available to offset future capital gains of the Fund to the extent provided by regulations and may be limited. The capital loss carryforward information presented below, including any applicable limitation, is estimated as of prior fiscal period end and is subject to adjustment.
| No expiration | |
| Short-term | $(7,037,092) |
4. Derivative Instruments.
Risk Exposures and the Use of Derivative Instruments. The Fund's investment objective allows the Fund to enter into various types of derivative contracts, including futures contracts. Derivatives are investments whose value is primarily derived from underlying assets, indices or reference rates and may be transacted on an exchange or over-the-counter (OTC). Derivatives may involve a future commitment to buy or sell a specified asset based on specified terms, to exchange future cash flows at periodic intervals based on a notional principal amount, or for one party to make one or more payments upon the occurrence of specified events in exchange for periodic payments from the other party.
The Fund used derivatives to increase returns and to manage exposure to certain risks as defined below. The success of any strategy involving derivatives depends on analysis of numerous economic factors, and if the strategies for investment do not work as intended, the Fund may not achieve its objectives.
The Fund's use of derivatives increased or decreased its exposure to the following risk:
| Equity Risk | Equity risk relates to the fluctuations in the value of financial instruments as a result of changes in market prices (other than those arising from interest rate risk or foreign exchange risk), whether caused by factors specific to an individual investment, its issuer, or all factors affecting all instruments traded in a market or market segment.
|
The Fund is also exposed to additional risks from investing in derivatives, such as liquidity risk and counterparty credit risk. Liquidity risk is the risk that the Fund will be unable to close out the derivative in the open market in a timely manner. Counterparty credit risk is the risk that the counterparty will not be able to fulfill its obligation to the Fund. Counterparty credit risk related to exchange-traded futures contracts may be mitigated by the protection provided by the exchange on which they trade.
Investing in derivatives may involve greater risks than investing in the underlying assets directly and, to varying degrees, may involve risk of loss in excess of any initial investment and collateral received and amounts recognized in the Statement of Assets and Liabilities. In addition, there may be the risk that the change in value of the derivative contract does not correspond to the change in value of the underlying instrument.
Futures Contracts. A futures contract is an agreement between two parties to buy or sell a specified underlying instrument for a fixed price at a specified future date. The Fund used futures contracts to manage its exposure to the stock market.
Upon entering into a futures contract, a fund is required to deposit either cash or securities (initial margin) with a clearing broker in an amount equal to a certain percentage of the face value of the contract. Futures contracts are marked-to-market daily and subsequent daily payments (variation margin) are made or received by a fund depending on the daily fluctuations in the value of the futures contracts and are recorded as unrealized appreciation or (depreciation). This receivable and/or payable, if any, is included in daily variation margin on futures contracts in the Statement of Assets and Liabilities. Realized gain or (loss) is recorded upon the expiration or closing of a futures contract. The net realized gain (loss) and change in net unrealized appreciation (depreciation) on futures contracts during the period is presented in the Statement of Operations.
Any open futures contracts at period end are presented in the Schedule of Investments under the caption "Futures Contracts". The notional amount at value reflects each contract's exposure to the underlying instrument or index at period end and is representative of volume of activity during the period. Cash deposited to meet initial margin requirements is presented as segregated cash with brokers for derivative instruments in the Statement of Assets and Liabilities.
5. Purchases and Sales of Investments.
Purchases and sales of securities, other than short-term securities, are noted in the table below.
| | Purchases ($) | Sales ($) |
| VIP Disciplined Small Cap Portfolio | 69,841,386 | 87,134,355 |
6. Fees and Other Transactions with Affiliates.
Management Fee. Fidelity Management & Research Company LLC (the investment adviser) and its affiliates provide the Fund with investment management related services for which the Fund pays a monthly management fee that is based on an annual rate of .45% of the Fund's average net assets.
Sub-Adviser. Geode Capital Management, LLC (Geode), serves as sub-adviser for the Fund. Geode provides discretionary investment advisory services to the Fund and is paid by the investment adviser for providing these services.
Distribution and Service Plan Fees. In accordance with Rule 12b-1 of the 1940 Act, the Fund has adopted separate 12b-1 Plans for each Service Class of shares. Each Service Class pays Fidelity Distributors Company LLC (FDC), an affiliate of the investment adviser, a service fee. For the period, the service fee is based on an annual rate of .10% of Service Class' average net assets and .25% of Service Class 2's average net assets.
For the period, total fees, all of which were re-allowed to insurance companies for the distribution of shares and providing shareholder support services, were as follows:
| Service Class | $91 |
| Service Class 2 | 10,458 |
| | $10,549 |
Transfer Agent Fees. Fidelity Investments Institutional Operations Company LLC (FIIOC), an affiliate of the investment adviser, is the Fund's transfer, dividend disbursing, and shareholder servicing agent. FIIOC receives an asset-based fee with respect to each class. Each class pays a fee for transfer agent services, typesetting and printing and mailing of shareholder reports, excluding mailing of proxy statements. Effective February 1, 2020, the Board approved to change the fee from .145% to .142% for Investor Class, and from .065% to .064% for all other classes. For the period, transfer agent fees for each class were as follows:
| | Amount | % of Class-Level Average Net Assets(a) |
| Initial Class | $5,826 | .06 |
| Service Class | 57 | .06 |
| Service Class 2 | 2,633 | .06 |
| Investor Class | 129,715 | .14 |
| | $138,231 | |
(a) Annualized
Accounting Fees. Fidelity Service Company, Inc. (FSC), an affiliate of the investment adviser, maintains the Fund's accounting records. The accounting fee is based on the level of average net assets for each month. For the period, the fees were equivalent to the following annualized rates:
| | % of Average Net Assets |
| VIP Disciplined Small Cap Portfolio | .04 |
Interfund Trades. Funds may purchase from or sell securities to other Fidelity Funds under procedures adopted by the Board. The procedures have been designed to ensure these interfund trades are executed in accordance with Rule 17a-7 of the 1940 Act. Interfund trades are included within the respective purchases and sales amounts shown in the Purchases and Sales of Investments note.
7. Committed Line of Credit.
Certain Funds participate with other funds managed by the investment adviser or an affiliate in a $4.25 billion credit facility (the "line of credit") to be utilized for temporary or emergency purposes to fund shareholder redemptions or for other short-term liquidity purposes. The participating funds have agreed to pay commitment fees on their pro-rata portion of the line of credit, which are reflected in Miscellaneous expenses on the Statement of Operations, and are as follows:
| | Amount |
| VIP Disciplined Small Cap Portfolio | $307 |
During the period, there were no borrowings on this line of credit.
8. Security Lending.
The Fund lends portfolio securities from time to time in order to earn additional income. For equity securities, lending agents are used, including National Financial Services (NFS), an affiliate of the Fund. Pursuant to a securities lending agreement, NFS will receive a fee, which is capped at 9.9% of daily lending revenue, for its services as lending agent. The Fund may lend securities to certain qualified borrowers, including NFS. On the settlement date of the loan, the Fund receives collateral (in the form of U.S. Treasury obligations, letters of credit and/or cash) against the loaned securities and maintains collateral in an amount not less than 100% of the market value of the loaned securities during the period of the loan. The market value of the loaned securities is determined at the close of business of the Fund and any additional required collateral is delivered to the Fund on the next business day. The Fund or borrower may terminate the loan at any time, and if the borrower defaults on its obligation to return the securities loaned because of insolvency or other reasons, the Fund may apply collateral received from the borrower against the obligation. The Fund may experience delays and costs in recovering the securities loaned. Any cash collateral received is invested in the Fidelity Securities Lending Cash Central Fund. The value of loaned securities and cash collateral at period end are disclosed on the Fund's Statement of Assets and Liabilities. The value of securities loaned to NFS, as affiliated borrower, at period end was $262,934. Total fees paid by the Fund to NFS, as lending agent, amounted to $8,607. Security lending income represents the income earned on investing cash collateral, less rebates paid to borrowers and any lending agent fees associated with the loan, plus any premium payments received for lending certain types of securities. Security lending income is presented in the Statement of Operations as a component of income from Fidelity Central Funds, and includes $36,660 from securities loaned to NFS, as affiliated borrower.
9. Expense Reductions.
Through arrangements with the Fund's custodian, credits realized as a result of certain uninvested cash balances were used to reduce the Fund's expenses. During the period, custodian credits reduced the Fund's expenses by $9.
10. Distributions to Shareholders.
Distributions to shareholders of each class were as follows:
| | Six months ended
June 30, 2020 | Year ended
December 31, 2019 |
| Distributions to shareholders | | |
| Initial Class | $53,329 | $2,460,113 |
| Service Class | 471 | 19,721 |
| Service Class 2 | 18,555 | 693,253 |
| Investor Class | 509,139 | 21,883,167 |
| Total | $581,494 | $25,056,254 |
11. Share Transactions.
Transactions for each class of shares were as follows:
| | Shares | Shares | Dollars | Dollars |
| | Six months ended June 30, 2020 | Year ended December 31, 2019 | Six months ended June 30, 2020 | Year ended December 31, 2019 |
| Initial Class | | | | |
| Shares sold | 114,413 | 250,382 | $1,369,288 | $3,511,426 |
| Reinvestment of distributions | 3,719 | 183,369 | 53,329 | 2,460,113 |
| Shares redeemed | (307,966) | (684,095) | (3,643,866) | (9,412,865) |
| Net increase (decrease) | (189,834) | (250,344) | $(2,221,249) | $(3,441,326) |
| Service Class 2 | | | | |
| Shares sold | 181,818 | 221,820 | $2,113,788 | $3,098,010 |
| Reinvestment of distributions | 1,290 | 51,451 | 18,555 | 693,253 |
| Shares redeemed | (123,480) | (130,231) | (1,532,003) | (1,807,991) |
| Net increase (decrease) | 59,628 | 143,040 | $600,340 | $1,983,272 |
| Investor Class | | | | |
| Shares sold | 337,535 | 1,098,859 | $4,089,274 | $15,372,608 |
| Reinvestment of distributions | 35,679 | 1,638,057 | 509,139 | 21,883,167 |
| Shares redeemed | (2,004,905) | (3,054,006) | (22,777,484) | (41,738,695) |
| Net increase (decrease) | (1,631,691) | (317,090) | $(18,179,071) | $(4,482,920) |
12. Other.
The Fund's organizational documents provide former and current trustees and officers with a limited indemnification against liabilities arising in connection with the performance of their duties to the Fund. In the normal course of business, the Fund may also enter into contracts that provide general indemnifications. The Fund's maximum exposure under these arrangements is unknown as this would be dependent on future claims that may be made against the Fund. The risk of material loss from such claims is considered remote.
At the end of the period, the investment adviser or its affiliates were the owners of record of 95% of the total outstanding shares of the Fund.
13. Coronavirus (COVID-19) Pandemic.
An outbreak of COVID-19 first detected in China during December 2019 has since spread globally and was declared a pandemic by the World Health Organization during March 2020. Developments that disrupt global economies and financial markets, such as the COVID-19 pandemic, may magnify factors that affect the Fund's performance.
Shareholder Expense Example
As a shareholder of the Fund, you incur two types of costs: (1) transaction costs and (2) ongoing costs, including management fees, distribution and/or service (12b-1) fees and other Fund expenses. This Example is intended to help you understand your ongoing costs (in dollars) of investing in the Fund and to compare these costs with the ongoing costs of investing in other mutual funds.
The Example is based on an investment of $1,000 invested at the beginning of the period and held for the entire period (January 1, 2020 to June 30, 2020).
Actual Expenses
The first line of the accompanying table for each class of the Fund provides information about actual account values and actual expenses. You may use the information in this line, together with the amount you invested, to estimate the expenses that you paid over the period. Simply divide your account value by $1,000.00 (for example, an $8,600 account value divided by $1,000.00 = 8.6), then multiply the result by the number in the first line for a class of the Fund under the heading entitled "Expenses Paid During Period" to estimate the expenses you paid on your account during this period. The estimate of expenses does not include any fees or other expenses of any variable annuity or variable life insurance product. If they were, the estimate of expenses you paid during the period would be higher, and your ending account value would be lower. In addition, the Fund, as a shareholder in the underlying Fidelity Central Funds, will indirectly bear its pro-rata share of the fees and expenses incurred by the underlying Fidelity Central Funds. These fees and expenses are not included in the Fund's annualized expense ratio used to calculate the expense estimate in the table below.
Hypothetical Example for Comparison Purposes
The second line of the accompanying table for each class of the Fund provides information about hypothetical account values and hypothetical expenses based on a Class' actual expense ratio and an assumed rate of return of 5% per year before expenses, which is not the Class' actual return. The hypothetical account values and expenses may not be used to estimate the actual ending account balance or expenses you paid for the period. You may use this information to compare the ongoing costs of investing in the Fund and other funds. To do so, compare this 5% hypothetical example with the 5% hypothetical examples that appear in the shareholder reports of the other funds. The estimate of expenses does not include any fees or other expenses of any variable annuity or variable life insurance product. If they were, the estimate of expenses you paid during the period would be higher, and your ending account value would be lower. In addition, the Fund, as a shareholder in the underlying Fidelity Central Funds, will indirectly bear its pro-rata share of the fees and expenses incurred by the underlying Fidelity Central Funds. These fees and expenses are not included in the Fund's annualized expense ratio used to calculate the expense estimate in the table below.
Please note that the expenses shown in the table are meant to highlight your ongoing costs only and do not reflect any transaction costs. Therefore, the second line of the table is useful in comparing ongoing costs only, and will not help you determine the relative total costs of owning different funds.
| | Annualized Expense Ratio-A | Beginning
Account Value
January 1, 2020 | Ending
Account Value
June 30, 2020 | Expenses Paid
During Period-B
January 1, 2020
to June 30, 2020 |
| Initial Class | .61% | | | |
| Actual | | $1,000.00 | $850.80 | $2.81 |
| Hypothetical-C | | $1,000.00 | $1,021.83 | $3.07 |
| Service Class | .71% | | | |
| Actual | | $1,000.00 | $850.60 | $3.27 |
| Hypothetical-C | | $1,000.00 | $1,021.33 | $3.57 |
| Service Class 2 | .86% | | | |
| Actual | | $1,000.00 | $850.20 | $3.96 |
| Hypothetical-C | | $1,000.00 | $1,020.59 | $4.32 |
| Investor Class | .69% | | | |
| Actual | | $1,000.00 | $850.60 | $3.17 |
| Hypothetical-C | | $1,000.00 | $1,021.43 | $3.47 |
A Annualized expense ratio reflects expenses net of applicable fee waivers.
B Expenses are equal to each Class' annualized expense ratio, multiplied by the average account value over the period, multiplied by 182/366 (to reflect the one-half year period).
C 5% return per year before expenses
Board Approval of Investment Advisory Contracts and Management Fees
VIP Disciplined Small Cap Portfolio
Each year, the Board of Trustees, including the Independent Trustees (together, the Board), votes on the renewal of the management contract with Fidelity Management & Research Company LLC (FMR) and the sub-advisory agreement (Sub-Advisory Agreement) for the fund with Geode Capital Management, LLC (Geode) (together, the Advisory Contracts). FMR and Geode are referred to herein as the Investment Advisers. The Board, assisted by the advice of fund counsel and Independent Trustees' counsel, requests and considers a broad range of information relevant to the renewal of the Advisory Contracts throughout the year.
The Board meets regularly and, at each of its meetings, covers an extensive agenda of topics and materials and considers factors that are relevant to its annual consideration of the renewal of the fund's Advisory Contracts, including the services and support provided to the fund and its shareholders. The Board has established various standing committees (Committees), each composed of and chaired by Independent Trustees with varying backgrounds, to which the Board has assigned specific subject matter responsibilities in order to enhance effective decision-making by the Board. The Board, acting directly and through its Committees, requests and receives information concerning the annual consideration of the renewal of the fund's Advisory Contracts. The Board also meets as needed to review matters specifically related to the Board's annual consideration of the renewal of the Advisory Contracts. Members of the Board may also meet with trustees of other Fidelity funds through joint ad hoc committees to discuss certain matters relevant to all of the Fidelity funds.
At its January 2020 meeting, the Board unanimously determined to renew the fund's Advisory Contracts. In reaching its determination, the Board considered all factors it believed relevant, including (i) the nature, extent, and quality of the services provided to the fund and its shareholders (including the investment performance of the fund); (ii) the competitiveness of the fund's management fee and total expense ratio relative to peer funds; (iii) the total costs of the services provided by and the profits realized by Fidelity and Geode from their respective relationships with the fund; and (iv) the extent to which, if any, economies of scale exist and are realized as the fund grows, and whether any economies of scale are appropriately shared with fund shareholders.
In considering whether to renew the Advisory Contracts for the fund, the Board reached a determination, with the assistance of fund counsel and Independent Trustees' counsel and through the exercise of its business judgment, that the renewal of the Advisory Contracts was in the best interests of the fund and its shareholders and that the compensation payable under the Advisory Contracts was fair and reasonable. The Board's decision to renew the Advisory Contracts was not based on any single factor, but rather was based on a comprehensive consideration of all the information provided to the Board at its meetings throughout the year. The Board, in reaching its determination to renew the Advisory Contracts, was aware that shareholders of the fund have a broad range of investment choices available to them, including a wide choice among funds offered by Fidelity's competitors, and that the fund's shareholders, who have the opportunity to review and weigh the disclosure provided by the fund in its prospectus and other public disclosures, have chosen to invest in this fund, which is part of the Fidelity family of funds.
Nature, Extent, and Quality of Services Provided. The Board considered staffing as it relates to the fund, including the backgrounds of investment personnel of Fidelity and Geode, and also considered the fund's investment objective, strategies, and related investment philosophy. The Independent Trustees also had discussions with senior management of Fidelity's investment operations and investment groups and with representatives of Geode. The Board considered the structure of the investment personnel compensation programs and whether the structures provide appropriate incentives to act in the best interests of the fund. Additionally, the Board considered the portfolio managers' investments, if any, in the funds that they manage.
The Trustees also discussed with representatives of Fidelity, at meetings throughout the year, Fidelity's role in, among other things, overseeing compliance with federal securities laws and other applicable requirements by Geode with respect to the fund and monitoring and overseeing the performance and investment capabilities of Geode. The Trustees considered that the Board had received from Fidelity periodic reports about its oversight and due diligence processes, as well as periodic reports regarding the performance of Geode.
The Board also considered the nature, extent and quality of services provided by Geode. The Trustees noted that under the Sub-Advisory Agreement, subject to oversight by Fidelity, Geode is responsible for, among other things, identifying investments and arranging for execution of portfolio transactions to implement the fund's investment strategy. In addition, the Trustees noted that Geode is responsible for providing such reporting as may be requested by Fidelity to fulfill its oversight responsibilities discussed above.
Resources Dedicated to Investment Management and Support Services. The Board and the Fund Oversight and Research Committees reviewed the general qualifications and capabilities of Fidelity's and Geode's investment staffs, including their size, education, experience, and resources, as well as Fidelity's and Geode's approach to recruiting, training, managing, and compensating investment personnel. The Board considered that Fidelity's and Geode's investment professionals have extensive resources, tools and capabilities so as to provide competitive investment results over time, and that those professionals also have access to sophisticated tools that permit them to assess portfolio construction and risk and performance attribution characteristics continuously. Additionally, in its deliberations, the Board considered Fidelity's and Geode's trading, risk management, compliance, and technology and operations capabilities and resources, which are integral parts of the investment management process.
Shareholder and Administrative Services. The Board considered (i) the nature, extent, quality, and cost of advisory, administrative, and shareholder services performed by the Investment Advisers and their affiliates under the Advisory Contracts and by FMR's affiliates under separate agreements covering transfer agency, pricing and bookkeeping, and securities lending services for the fund; (ii) the nature and extent of the supervision of third party service providers, principally custodians, subcustodians, and pricing vendors; and (iii) the resources devoted to, and the record of compliance with, the fund's compliance policies and procedures. The Board also reviewed the allocation of fund brokerage, including allocations to brokers affiliated with the Investment Advisers, the use of brokerage commissions to pay fund expenses, and the use of "soft" commission dollars to pay for research services.
The Board noted that the growth of fund assets over time across the complex allows Fidelity to reinvest in the development of services designed to enhance the value and convenience of the Fidelity funds as investment vehicles. These services include 24-hour access to account information and market information over the Internet and through telephone representatives, investor education materials and asset allocation tools, and the expanded availability of Fidelity Investor Centers.
The Board noted that it and the boards of certain other Fidelity funds had formed an ad hoc Committee on Transfer Agency Fees to review the variety of transfer agency fee structures throughout the industry and Fidelity's competitive positioning with respect to industry participants.
Investment in a Large Fund Family. The Board considered the benefits to shareholders of investing in a Fidelity fund, including the benefits of investing in a fund that is part of a large family of funds offering a variety of investment disciplines and providing a large variety of mutual fund investor services. The Board noted that Fidelity had taken, or had made recommendations that resulted in the Fidelity funds taking, a number of actions over the previous year that benefited particular funds, including: (i) continuing to dedicate additional resources to Fidelity's investment research process, which includes meetings with management of issuers of securities in which the funds invest, and to the support of the senior management team that oversees asset management; (ii) continuing efforts to enhance Fidelity's global research capabilities; (iii) launching new funds and ETFs with innovative structures, strategies and pricing and making other enhancements to meet client needs; (iv) launching new share classes of existing funds; (v) eliminating purchase minimums and broadening eligibility requirements for certain funds and share classes; (vi) reducing management fees and total expenses for certain target date funds and index funds; (vii) lowering expense caps for certain existing funds and classes, and converting certain voluntary expense caps to contractual caps, to reduce expenses borne by shareholders; (viii) rationalizing product lines and gaining increased efficiencies from fund mergers, liquidations, and share class consolidations; (ix) continuing to develop, acquire and implement systems and technology to improve services to the funds and shareholders, strengthen information security, and increase efficiency; and (x) continuing to implement enhancements to further strengthen Fidelity's product line to increase investors' probability of success in achieving their investment goals, including retirement income goals.
Investment Performance. The Board considered whether the fund has operated in accordance with its investment objective, as well as its record of compliance with its investment restrictions and its performance history.
The Board took into account discussions that occur at Board meetings throughout the year with representatives of the Investment Advisers about fund investment performance. In this regard the Board noted that as part of regularly scheduled fund reviews and other reports to the Board on fund performance, the Board considers annualized return information for the fund for different time periods, measured against an appropriate securities market index (benchmark index) and a peer group of funds with similar objectives (peer group), if any. In its evaluation of fund investment performance, the Board gave particular attention to information indicating changes in performance of certain Fidelity funds for specific time periods and discussed with the Investment Advisers the reasons for any overperformance or underperformance.
In addition to reviewing absolute and relative fund performance, the Independent Trustees periodically consider the appropriateness of fund performance metrics in evaluating the results achieved. In general, the Independent Trustees believe that fund performance should be evaluated based on net performance (after fees and expenses) of both the highest performing and lowest performing fund share classes, where applicable, compared to appropriate benchmark indices, over appropriate time periods that may include full market cycles, and compared to peer groups, as applicable, over the same periods, taking into account relevant factors including the following: general market conditions; issuer-specific information; and fund cash flows and other factors.
The Independent Trustees recognize that shareholders evaluate performance on a net basis over their own holding periods, for which one-, three-, and five-year periods are often used as a proxy. For this reason, the performance information reviewed by the Board also included net cumulative total return information for the fund and an appropriate benchmark index for the most recent one-, three-, and five-year periods ended June 30, 2019, as shown below. A peer group is not shown below because the fund does not generally utilize a peer group for performance comparison purposes.
VIP Disciplined Small Cap Portfolio
Based on its review, the Board concluded that the nature, extent, and quality of services provided to the fund under the Advisory Contracts should continue to benefit the shareholders of the fund.
Competitiveness of Management Fee and Total Expense Ratio. The Board considered the fund's management fee and total expense ratio compared to "mapped groups" of competitive funds and classes created for the purpose of facilitating the Trustees' competitive analysis of management fees and total expenses. Fidelity creates "mapped groups" by combining similar Lipper investment objective categories that have comparable investment mandates. Combining Lipper investment objective categories aids the Board's management fee and total expense ratio comparisons by broadening the competitive group used for comparison.
Management Fee. The Board considered two proprietary management fee comparisons for the 12-month periods ended June 30 (December 31 for periods prior to 2018) shown in basis points (BP) in the chart below. The group of Lipper funds used by the Board for management fee comparisons is referred to below as the "Total Mapped Group." The Total Mapped Group comparison focuses on a fund's standing in terms of gross management fees before expense reimbursements or caps relative to the total universe of funds with comparable investment mandates, regardless of whether their management fee structures also are comparable. Funds with comparable investment mandates offer exposure to similar types of securities. Funds with comparable management fee structures have similar management fee contractual arrangements (
e.g., flat rate charged for advisory services, all-inclusive fee rate,
etc.). "TMG %" represents the percentage of funds in the Total Mapped Group that had management fees that were lower than the fund's. For example, a hypothetical TMG % of 20% would mean that 80% of the funds in the Total Mapped Group had higher, and 20% had lower, management fees than the fund. The fund's actual TMG %s and the number of funds in the Total Mapped Group are in the chart below. The "Asset-Sized Peer Group" (ASPG) comparison focuses on a fund's standing relative to a subset of non-Fidelity funds within the Total Mapped Group that are similar in size and management fee structure. For example, if a fund is in the first quartile of the ASPG, the fund's management fee ranks in the least expensive or lowest 25% of funds in the ASPG. The ASPG represents at least 15% of the funds in the Total Mapped Group with comparable asset size and management fee structures, subject to a minimum of 50 funds (or all funds in the Total Mapped Group if fewer than 50). Additional information, such as the ASPG quartile in which the fund's management fee rate ranked, is also included in the chart and was considered by the Board.
VIP Disciplined Small Cap Portfolio
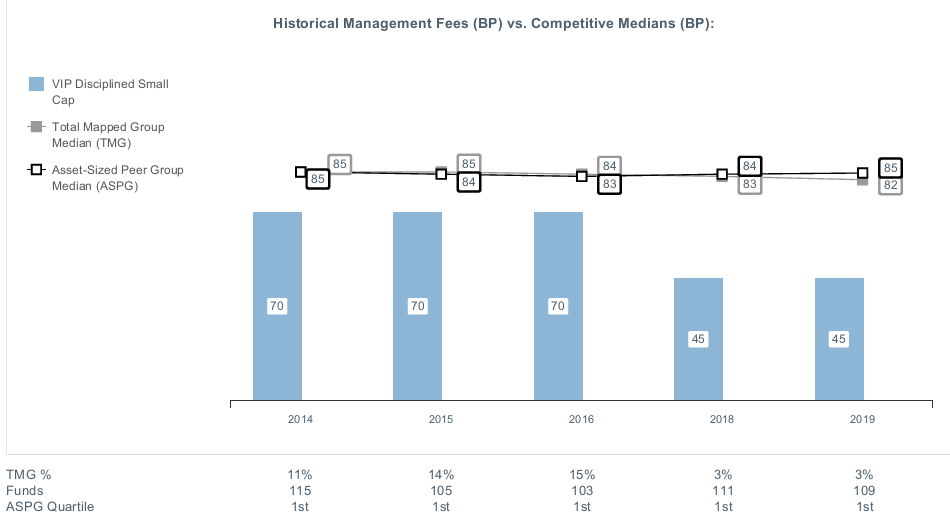
The Board noted that the fund's management fee rate ranked below the median of its Total Mapped Group and below the median of its ASPG for the 12-month period ended June 30, 2019.
The Board noted that it and the boards of other Fidelity funds formed an ad hoc Committee on Group Fee, which meets periodically, to conduct an in-depth review of the "group fee" component of the management fee of funds with such management fee structures. The Committee's focus included the mechanics of the group fee, the competitive landscape of group fee structures, Fidelity funds with no group fee component (such as the fund) and investment products not included in group fee assets. The Board also considered that, for funds subject to the group fee, FMR agreed to voluntarily waive fees over a specified period of time in amounts designed to account for assets converted from certain funds to certain collective investment trusts.
The Board also noted that, in 2013, the ad hoc Committee on Management Fees was formed to conduct an in-depth review of the management fee rates of Fidelity's active equity mutual funds. The Committee focused on the following areas: (i) standard fee structures; (ii) research consumption and trading evolution; (iii) management fee competitiveness/profitability by category; and (iv) factors that drive institutional pricing.
Based on its review, the Board concluded that the fund's management fee is fair and reasonable in light of the services that the fund receives and the other factors considered.
Total Expense Ratio. In its review of each class's total expense ratio, the Board considered the fund's management fee rate as well as other fund or class expenses, as applicable, such as transfer agent fees, pricing and bookkeeping fees, fund-paid 12b-1 fees, and custodial, legal, and audit fees. The Board also noted that Fidelity may agree to waive fees or reimburse expenses from time to time, and the extent to which, if any, it has done so for the fund. As part of its review, the Board also considered the current and historical total expense ratios of each class of the fund compared to competitive fund median expenses. Each class of the fund is compared to those funds and classes in the Total Mapped Group (used by the Board for management fee comparisons) that have a similar sales load structure.
The Board noted that the total expense ratio of each class ranked below the competitive median for the 12-month period ended June 30, 2019.
Fees Charged to Other Clients. The Board also considered fee structures applicable to clients of Fidelity and Geode, such as other funds advised or subadvised by Fidelity or Geode, pension plan clients, and other institutional clients with similar mandates. The Board noted that a joint ad hoc committee created by it and the boards of other Fidelity funds periodically reviews and compares Fidelity's institutional investment advisory business with its business of providing services to the Fidelity funds and also noted the most recent findings of the committee. The Board noted that the committee's review included a consideration of the differences in services provided, fees charged, and costs incurred, as well as competition in the markets serving the different categories of clients.
Based on its review of total expense ratios and fees charged to other Fidelity clients, the Board concluded that the total expense ratio of each class of the fund was reasonable in light of the services that the fund and its shareholders receive and the other factors considered.
Costs of the Services and Profitability. The Board considered the revenues earned and the expenses incurred by Fidelity in conducting the business of developing, marketing, distributing, managing, administering and servicing the fund and servicing the fund's shareholders. The Board also considered the level of Fidelity's profits in respect of all the Fidelity funds.
On an annual basis, Fidelity presents to the Board information about the profitability of its relationships with the fund. Fidelity calculates profitability information for each fund, as well as aggregate profitability information for groups of Fidelity funds and all Fidelity funds, using a series of detailed revenue and cost allocation methodologies which originate with the books and records of Fidelity on which Fidelity's audited financial statements are based. The Audit Committee of the Board reviews any significant changes from the prior year's methodologies and the full Board approves such changes.
PricewaterhouseCoopers LLP (PwC), auditor to Fidelity and certain Fidelity funds, has been engaged annually by the Board as part of the Board's assessment of Fidelity's profitability analysis. PwC's engagement includes the review and assessment of the methodologies used by Fidelity in determining the revenues and expenses attributable to Fidelity's mutual fund business, and completion of agreed-upon procedures in respect of the mathematical accuracy of the fund profitability information and its conformity to established allocation methodologies. After considering PwC's reports issued under the engagement and information provided by Fidelity, the Board concluded that while other allocation methods may also be reasonable, Fidelity's profitability methodologies are reasonable in all material respects.
The Board also reviewed Fidelity's and Geode's non-fund businesses and potential indirect benefits such businesses may have received as a result of their association with Fidelity's mutual fund business (i.e., fall-out benefits) as well as cases where Fidelity's and Geode's affiliates may benefit from the funds' business. The Board noted that changes to fall-out benefits year-over-year reflect business developments at Fidelity's and Geode's various businesses. The Board considered that a joint ad hoc committee created by it and the boards of other Fidelity funds had recently been established, and met periodically, to evaluate potential fall-out benefits (PFOB Committee). The Board noted that the PFOB Committee, among other things: (i) discussed the legal framework surrounding potential fall-out benefits; (ii) reviewed the Board's responsibilities and approach to potential fall-out benefits; and (iii) reviewed practices employed by competitor funds regarding the review of potential fall-out benefits.
The Board considered the costs of the services provided by and the profits realized by Fidelity in connection with the operation of the fund, including the conclusions of the PFOB Committee, and was satisfied that the profitability was not excessive.
The Board also considered information regarding the profitability of Geode's relationship with the fund.
Economies of Scale. The Board considered whether there have been economies of scale in respect of the management of the Fidelity funds, whether the Fidelity funds (including the fund) have appropriately benefited from any such economies of scale, and whether there is potential for realization of any further economies of scale. The Board considered the extent to which the fund will benefit from economies of scale as assets grow through increased services to the fund, through waivers or reimbursements, or through fee or expense ratio reductions. The Board also noted that a committee (the Economies of Scale Committee) created by it and the boards of other Fidelity funds periodically analyzes whether Fidelity attains economies of scale in respect of the management and servicing of the Fidelity funds, whether the Fidelity funds have appropriately benefited from such economies of scale, and whether there is potential for realization of any further economies of scale.
The Board concluded, taking into account the analysis of the Economies of Scale Committee, that economies of scale, if any, are being appropriately shared between fund shareholders and Fidelity.
Additional Information Requested by the Board. In order to develop fully the factual basis for consideration of the Fidelity funds' advisory contracts, the Board requested and received additional information on certain topics, including: (i) fund flow and performance trends, in particular the underperformance of certain funds and strategies, and Fidelity's long-term strategies for certain funds; (ii) consideration of performance fees for additional funds; (iii) changes in Fidelity's non-fund businesses and the impact of such changes on the funds; (iv) metrics for evaluating index fund and ETF performance and information about ETF trading characteristics; (v) the methodology with respect to evaluating competitive fund data and peer group classifications and fee comparisons; (vi) the expense structures for different funds and classes; (vii) information regarding other accounts managed by Fidelity, including collective investment trusts and separately managed accounts; and (viii) Fidelity's philosophies and strategies for evaluating funds and classes with lower or declining asset levels.
Based on its evaluation of all of the conclusions noted above, and after considering all factors it believed relevant, the Board concluded that the advisory and sub-advisory fee arrangements are fair and reasonable, and that the fund's Advisory Contracts should be renewed.
Liquidity Risk Management Program
The Securities and Exchange Commission adopted Rule 22e-4 under the Investment Company Act of 1940 (the Liquidity Rule) to promote effective liquidity risk management throughout the open-end investment company industry, thereby reducing the risk that funds will be unable to meet their redemption obligations and mitigating dilution of the interests of fund shareholders.
The Fund has adopted and implemented a liquidity risk management program pursuant to the Liquidity Rule (the Program) effective December 1, 2018. The Program is reasonably designed to assess and manage the Fund’s liquidity risk and to comply with the requirements of the Liquidity Rule. The Fund’s Board of Trustees (the Board) has designated the Fund’s investment adviser as administrator of the Program. The Fidelity advisers have established a Liquidity Risk Management Committee (the LRM Committee) to manage the Program for each of the Fidelity Funds. The LRM Committee monitors the adequacy and effectiveness of implementation of the Program and on a periodic basis assesses each Fund’s liquidity risk based on a variety of factors including (1) the Fund’s investment strategy, (2) portfolio liquidity and cash flow projections during normal and reasonably foreseeable stressed conditions, (3) shareholder redemptions, (4) borrowings and other funding sources and (5) in the case of exchange-traded funds, certain additional factors including the effect of the Fund’s prices and spreads, market participants, and basket compositions on the overall liquidity of the Fund’s portfolio, as applicable.
In accordance with the Program, each of the Fund’s portfolio investments is classified into one of four liquidity categories described below based on a determination of a reasonable expectation for how long it would take to convert the investment to cash (or sell or dispose of the investment) without significantly changing its market value.
- Highly liquid investments – cash or convertible to cash within three business days or less
- Moderately liquid investments – convertible to cash in three to seven calendar days
- Less liquid investments – can be sold or disposed of, but not settled, within seven calendar days
- Illiquid investments – cannot be sold or disposed of within seven calendar days
Liquidity classification determinations take into account a variety of factors including various market, trading and investment-specific considerations, as well as market depth, and generally utilize analysis from a third-party liquidity metrics service.
The Liquidity Rule places a 15% limit on a fund’s illiquid investments and requires funds that do not primarily hold assets that are highly liquid investments to determine and maintain a minimum percentage of the fund’s net assets to be invested in highly liquid investments (highly liquid investment minimum or HLIM). The Program includes provisions reasonably designed to comply with the 15% limit on illiquid investments and for determining, periodically reviewing and complying with the HLIM requirement as applicable.
At a recent meeting of the Fund’s Board of Trustees, the LRM Committee provided a written report to the Board pertaining to the operation, adequacy, and effectiveness of implementation of the Program for the annual period from December 1, 2018 through November 30, 2019. The report concluded that the Program has been implemented and is operating effectively and is reasonably designed to assess and manage the Fund’s liquidity risk.
Proxy Voting Results
A special meeting of shareholders was held on June 9, 2020. The results of votes taken among shareholders on the proposals before them are reported below. Each vote reported represents one dollar of net asset value held on the record date for the meeting.
PROPOSAL 1
To elect a Board of Trustees.
| | # of
Votes | % of
Votes |
| Dennis J. Dirks |
| Affirmative | 21,597,050,616.024 | 95.502 |
| Withheld | 1,017,240,628.578 | 4.498 |
| TOTAL | 22,614,291,244.601 | 100.000 |
| Donald F. Donahue |
| Affirmative | 21,605,904,576.366 | 95.541 |
| Withheld | 1,008,386,668.235 | 4.459 |
| TOTAL | 22,614,291,244.601 | 100.000 |
| Bettina Doulton |
| Affirmative | 21,645,998,598.109 | 95.718 |
| Withheld | 968,292,646.493 | 4.282 |
| TOTAL | 22,614,291,244.601 | 100.000 |
| Vicki L. Fuller |
| Affirmative | 21,660,928,063.243 | 95.784 |
| Withheld | 953,363,181.358 | 4.216 |
| TOTAL | 22,614,291,244.601 | 100.000 |
| Patricia L. Kampling |
| Affirmative | 21,663,944,422.383 | 95.798 |
| Withheld | 950,346,822.218 | 4.202 |
| TOTAL | 22,614,291,244.601 | 100.000 |
| Alan J. Lacy |
| Affirmative | 21,569,159,491.891 | 95.378 |
| Withheld | 1,045,131,752.710 | 4.622 |
| TOTAL | 22,614,291,244.601 | 100.000 |
| Ned C. Lautenbach |
| Affirmative | 21,469,914,492.101 | 94.940 |
| Withheld | 1,144,376,752.501 | 5.060 |
| TOTAL | 22,614,291,244.601 | 100.000 |
| Robert A. Lawrence |
| Affirmative | 21,583,601,126.100 | 95.442 |
| Withheld | 1,030,690,118.501 | 4.558 |
| TOTAL | 22,614,291,244.601 | 100.000 |
| Joseph Mauriello |
| Affirmative | 21,551,120,396.219 | 95.299 |
| Withheld | 1,063,170,848.382 | 4.701 |
| TOTAL | 22,614,291,244.601 | 100.000 |
| Cornelia M. Small |
| Affirmative | 21,592,890,757.027 | 95.483 |
| Withheld | 1,021,400,487.575 | 4.517 |
| TOTAL | 22,614,291,244.601 | 100.000 |
| Garnett A. Smith |
| Affirmative | 21,519,273,578.917 | 95.158 |
| Withheld | 1,095,017,665.685 | 4.842 |
| TOTAL | 22,614,291,244.601 | 100.000 |
| David M. Thomas |
| Affirmative | 21,574,034,388.063 | 95.400 |
| Withheld | 1,040,256,856.538 | 4.600 |
| TOTAL | 22,614,291,244.601 | 100.000 |
| Susan Tomasky |
| Affirmative | 21,607,546,330.771 | 95.548 |
| Withheld | 1,006,744,913.831 | 4.452 |
| TOTAL | 22,614,291,244.601 | 100.000 |
| Michael E. Wiley |
| Affirmative | 21,549,685,089.255 | 95.292 |
| Withheld | 1,064,606,155.346 | 4.708 |
| TOTAL | 22,614,291,244.601 | 100.000 |
PROPOSAL 2
To convert a fundamental investment policy to a non-fundamental investment policy.
| | # of
Votes | % of
Votes |
| Affirmative | 152,363,036.380 | 86.253 |
| Against | 13,084,230.341 | 7.407 |
| Abstain | 11,200,025.583 | 6.340 |
| Broker Non-Vote | 0.00 | 0.00 |
| TOTAL | 176,647,292.303 | 100.000 |
|
| Proposal 1 reflects trust wide proposal and voting results. |
VDSC-SANN-0820
1.821007.114
Fidelity® Variable Insurance Products:
Emerging Markets Portfolio
Semi-Annual Report
June 30, 2020
See the inside front cover for important information about access to your fund’s shareholder reports.
Beginning on January 1, 2021, as permitted by regulations adopted by the Securities and Exchange Commission, and if your insurance carrier elects to participate, you may not be receiving paper copies of the Fund’s shareholder reports from the insurance company that offers your variable insurance product unless you specifically request paper copies from your financial professional or the administrator of your variable insurance product. Instead, the reports will be made available on a website, and you will be notified by mail each time a report is posted and provided with a website link to access the report.
If you already elected to receive shareholder reports electronically, you will not be affected by this change and you need not take any action. You may elect to receive shareholder reports and other communications from the Fund electronically, by contacting your financial professional or the administrator of your variable insurance product. If you own a Fidelity-administered variable insurance product, please visit fidelity.com/mailpreferences to make your election or call 1-800-343-3548.
You may elect to receive all future reports in paper free of charge. If you wish to continue receiving paper copies of your shareholder reports, you may contact your financial professional or the administrator of your variable insurance product. If you own a Fidelity-administered variable insurance product, please visit fidelity.com/mailpreferences to make your election or call 1-800-343-3548. Your election to receive reports in paper will apply to all funds available under your variable insurance product.
Contents
To view a fund's proxy voting guidelines and proxy voting record for the 12-month period ended June 30, visit http://www.fidelity.com/proxyvotingresults or visit the Securities and Exchange Commission's (SEC) web site at http://www.sec.gov.
You may also call 1-877-208-0098 to request a free copy of the proxy voting guidelines.
Fidelity® Variable Insurance Products are separate account options which are purchased through a variable insurance contract.
Standard & Poor's, S&P and S&P 500 are registered service marks of The McGraw-Hill Companies, Inc. and have been licensed for use by Fidelity Distributors Corporation.
Other third-party marks appearing herein are the property of their respective owners.
All other marks appearing herein are registered or unregistered trademarks or service marks of FMR LLC or an affiliated company. © 2020 FMR LLC. All rights reserved.
This report and the financial statements contained herein are submitted for the general information of the shareholders of the Fund. This report is not authorized for distribution to prospective investors in the Fund unless preceded or accompanied by an effective prospectus.
A fund files its complete schedule of portfolio holdings with the SEC for the first and third quarters of each fiscal year on Form N-PORT. Forms N-PORT are available on the SEC’s web site at http://www.sec.gov. A fund's Forms N-PORT may be reviewed and copied at the SEC’s Public Reference Room in Washington, DC. Information regarding the operation of the SEC's Public Reference Room may be obtained by calling 1-800-SEC-0330.
For a complete list of a fund's portfolio holdings, view the most recent holdings listing, semiannual report, or annual report on Fidelity's web site at http://www.fidelity.com, http://www.institutional.fidelity.com, or http://www.401k.com, as applicable.
NOT FDIC INSURED •MAY LOSE VALUE •NO BANK GUARANTEE
Neither the Fund nor Fidelity Distributors Corporation is a bank.
Note to Shareholders:
Early in 2020, the outbreak and spread of a new coronavirus emerged as a public health emergency that had a major influence on financial markets, primarily based on its impact on the global economy and the outlook for corporate earnings. The virus causes a respiratory disease known as COVID-19. On March 11, the World Health Organization declared the COVID-19 outbreak a pandemic, citing sustained risk of further global spread.
In the weeks following, as the crisis worsened, we witnessed an escalating human tragedy with wide-scale social and economic consequences from coronavirus-containment measures. The outbreak of COVID-19 prompted a number of measures to limit the spread, including travel and border restrictions, quarantines, and restrictions on large gatherings. In turn, these resulted in lower consumer activity, diminished demand for a wide range of products and services, disruption in manufacturing and supply chains, and – given the wide variability in outcomes regarding the outbreak – significant market uncertainty and volatility. Amid the turmoil, the U.S. government took unprecedented action – in concert with the U.S. Federal Reserve and central banks around the world – to help support consumers, businesses, and the broader economy, and to limit disruption to the financial system.
The situation continues to unfold, and the extent and duration of its impact on financial markets and the economy remain highly uncertain. Extreme events such as the coronavirus crisis are “exogenous shocks” that can have significant adverse effects on mutual funds and their investments. Although multiple asset classes may be affected by market disruption, the duration and impact may not be the same for all types of assets.
Fidelity is committed to helping you stay informed amid news about COVID-19 and during increased market volatility, and we’re taking extra steps to be responsive to customer needs. We encourage you to visit our websites, where we offer ongoing updates, commentary, and analysis on the markets and our funds.
Investment Summary (Unaudited)
Geographic Diversification (% of fund's net assets)
| As of June 30, 2020 |
| | Cayman Islands | 22.4% |
| | China | 15.9% |
| | Taiwan | 12.9% |
| | Korea (South) | 7.6% |
| | Hong Kong | 6.3% |
| | Mexico | 5.8% |
| | India | 4.9% |
| | Brazil | 4.8% |
| | Russia | 3.5% |
| | Other* | 15.9% |
* Includes Short-Term investments and Net Other Assets (Liabilities).
Percentages are based on country or territory of incorporation and are adjusted for the effect of futures contracts, if applicable.
Asset Allocation as of June 30, 2020
| | % of fund's net assets |
| Stocks | 97.5 |
| Short-Term Investments and Net Other Assets (Liabilities) | 2.5 |
Top Ten Stocks as of June 30, 2020
| | % of fund's net assets |
| Tencent Holdings Ltd. (Cayman Islands, Interactive Media & Services) | 10.2 |
| Samsung Electronics Co. Ltd. (Korea (South), Technology Hardware, Storage & Peripherals) | 5.6 |
| Taiwan Semiconductor Manufacturing Co. Ltd. (Taiwan, Semiconductors & Semiconductor Equipment) | 4.7 |
| Alibaba Group Holding Ltd. sponsored ADR (Cayman Islands, Internet & Direct Marketing Retail) | 4.5 |
| MediaTek, Inc. (Taiwan, Semiconductors & Semiconductor Equipment) | 3.7 |
| China Resources Beer Holdings Co. Ltd. (Hong Kong, Beverages) | 3.3 |
| Richter Gedeon PLC (Hungary, Pharmaceuticals) | 3.2 |
| Haier Smart Home Co. Ltd. (A Shares) (China, Household Durables) | 3.2 |
| Wal-Mart de Mexico SA de CV Series V (Mexico, Food & Staples Retailing) | 2.8 |
| China Merchants Bank Co. Ltd. (H Shares) (China, Banks) | 2.7 |
| | 43.9 |
Top Market Sectors as of June 30, 2020
| | % of fund's net assets |
| Information Technology | 18.8 |
| Financials | 16.6 |
| Consumer Discretionary | 13.8 |
| Communication Services | 12.8 |
| Consumer Staples | 10.4 |
| Materials | 9.0 |
| Industrials | 7.0 |
| Health Care | 5.1 |
| Energy | 4.0 |
Schedule of Investments June 30, 2020 (Unaudited)
Showing Percentage of Net Assets
| Common Stocks - 94.4% | | | |
| | | Shares | Value |
| Bermuda - 0.7% | | | |
| Shangri-La Asia Ltd. | | 6,420,000 | $5,516,702 |
| Brazil - 1.7% | | | |
| Suzano Papel e Celulose SA (a) | | 2,064,781 | 13,968,719 |
| Cayman Islands - 22.4% | | | |
| Airtac International Group | | 432,548 | 7,586,756 |
| Alibaba Group Holding Ltd. sponsored ADR (a) | | 169,600 | 36,582,720 |
| Bilibili, Inc. ADR (a) | | 178,200 | 8,254,224 |
| JD.com, Inc. sponsored ADR (a) | | 262,696 | 15,809,045 |
| Li Ning Co. Ltd. | | 5,814,237 | 18,454,323 |
| Sunny Optical Technology Group Co. Ltd. | | 747,400 | 11,957,629 |
| Tencent Holdings Ltd. | | 1,284,305 | 82,295,587 |
|
| TOTAL CAYMAN ISLANDS | | | 180,940,284 |
|
| China - 15.9% | | | |
| AVIC Jonhon OptronicTechnology Co. Ltd. | | 1,568,515 | 9,104,069 |
| C&S Paper Co. Ltd. (A Shares) | | 3,549,954 | 11,204,299 |
| China Life Insurance Co. Ltd. (H Shares) | | 6,165,863 | 12,441,253 |
| China Merchants Bank Co. Ltd. (H Shares) | | 4,719,019 | 21,706,087 |
| Haier Smart Home Co. Ltd. (A Shares) | | 10,254,478 | 25,688,806 |
| Hualan Biological Engineer, Inc. (A Shares) | | 2,209,895 | 15,673,036 |
| Industrial & Commercial Bank of China Ltd. (H Shares) | | 34,868,635 | 21,080,472 |
| Shenzhen Inovance Technology Co. Ltd. (A Shares) | | 2,160,631 | 11,617,348 |
|
| TOTAL CHINA | | | 128,515,370 |
|
| Hong Kong - 6.3% | | | |
| China Resources Beer Holdings Co. Ltd. | | 4,804,505 | 26,779,513 |
| CNOOC Ltd. sponsored ADR | | 85,816 | 9,683,477 |
| Sun Art Retail Group Ltd. | | 8,244,000 | 14,083,035 |
|
| TOTAL HONG KONG | | | 50,546,025 |
|
| Hungary - 3.2% | | | |
| Richter Gedeon PLC | | 1,265,000 | 26,168,144 |
| India - 4.9% | | | |
| Housing Development Finance Corp. Ltd. | | 543,859 | 12,631,970 |
| Larsen & Toubro Ltd. | | 680,893 | 8,505,191 |
| Shree Cement Ltd. | | 35,601 | 10,862,935 |
| Solar Industries India Ltd. (a) | | 525,869 | 7,101,616 |
|
| TOTAL INDIA | | | 39,101,712 |
|
| Indonesia - 1.2% | | | |
| PT Bank Mandiri (Persero) Tbk | | 27,996,838 | 9,721,343 |
| Israel - 2.2% | | | |
| Elbit Systems Ltd. (Israel) | | 126,494 | 17,309,186 |
| Korea (South) - 7.6% | | | |
| Samsung Electronics Co. Ltd. | | 1,026,900 | 45,572,852 |
| Shinhan Financial Group Co. Ltd. | | 665,672 | 16,127,263 |
|
| TOTAL KOREA (SOUTH) | | | 61,700,115 |
|
| Luxembourg - 1.3% | | | |
| Globant SA (a) | | 69,600 | 10,429,560 |
| Mexico - 5.8% | | | |
| CEMEX S.A.B. de CV sponsored ADR | | 4,239,200 | 12,208,896 |
| Grupo Financiero Banorte S.A.B. de CV Series O | | 3,574,068 | 12,396,385 |
| Wal-Mart de Mexico SA de CV Series V | | 9,321,300 | 22,365,929 |
|
| TOTAL MEXICO | | | 46,971,210 |
|
| Netherlands - 1.6% | | | |
| Yandex NV Series A (a)(b) | | 260,700 | 13,040,214 |
| Russia - 3.5% | | | |
| Lukoil PJSC sponsored ADR | | 145,063 | 10,772,378 |
| MMC Norilsk Nickel PJSC sponsored ADR | | 122,093 | 3,197,616 |
| Sberbank of Russia sponsored ADR | | 1,281,810 | 14,586,998 |
|
| TOTAL RUSSIA | | | 28,556,992 |
|
| South Africa - 3.2% | | | |
| AngloGold Ashanti Ltd. | | 440,600 | 12,963,426 |
| Impala Platinum Holdings Ltd. | | 1,930,416 | 12,904,668 |
|
| TOTAL SOUTH AFRICA | | | 25,868,094 |
|
| Taiwan - 12.9% | | | |
| ECLAT Textile Co. Ltd. | | 759,000 | 8,823,481 |
| MediaTek, Inc. | | 1,527,000 | 30,053,129 |
| Sporton International, Inc. | | 1,351,504 | 11,025,560 |
| Taiwan Semiconductor Manufacturing Co. Ltd. | | 3,557,338 | 38,101,075 |
| Unified-President Enterprises Corp. | | 3,730,925 | 9,042,284 |
| Yageo Corp. | | 559,000 | 7,239,505 |
|
| TOTAL TAIWAN | | | 104,285,034 |
|
| TOTAL COMMON STOCKS | | | |
| (Cost $668,285,175) | | | 762,638,704 |
|
| Nonconvertible Preferred Stocks - 3.1% | | | |
| Brazil - 3.1% | | | |
| Itau Unibanco Holding SA | | 2,864,350 | 13,404,996 |
| Petroleo Brasileiro SA - Petrobras sponsored ADR | | 1,453,447 | 12,020,007 |
| TOTAL NONCONVERTIBLE PREFERRED STOCKS | | | |
| (Cost $28,822,135) | | | 25,425,003 |
|
| Money Market Funds - 2.0% | | | |
| Fidelity Cash Central Fund 0.12% (c) | | 8,103,987 | 8,105,608 |
| Fidelity Securities Lending Cash Central Fund 0.12% (c)(d) | | 8,074,368 | 8,075,175 |
| TOTAL MONEY MARKET FUNDS | | | |
| (Cost $16,180,783) | | | 16,180,783 |
| TOTAL INVESTMENT IN SECURITIES - 99.5% | | | |
| (Cost $713,288,093) | | | 804,244,490 |
| NET OTHER ASSETS (LIABILITIES) - 0.5% | | | 4,066,502 |
| NET ASSETS - 100% | | | $808,310,992 |
Categorizations in the Schedule of Investments are based on country or territory of incorporation.
Legend
(a) Non-income producing
(b) Security or a portion of the security is on loan at period end.
(c) Affiliated fund that is generally available only to investment companies and other accounts managed by Fidelity Investments. The rate quoted is the annualized seven-day yield of the fund at period end. A complete unaudited listing of the fund's holdings as of its most recent quarter end is available upon request. In addition, each Fidelity Central Fund's financial statements are available on the SEC's website or upon request.
(d) Investment made with cash collateral received from securities on loan.
Affiliated Central Funds
Information regarding fiscal year to date income earned by the Fund from investments in Fidelity Central Funds is as follows:
| Fund | Income earned |
| Fidelity Cash Central Fund | $40,258 |
| Fidelity Securities Lending Cash Central Fund | 37 |
| Total | $40,295 |
Amounts in the income column in the above table include any capital gain distributions from underlying funds, which are presented in the corresponding line-item in the Statement of Operations, if applicable. Amount for Fidelity Securities Lending Cash Central Fund represents the income earned on investing cash collateral, less rebates paid to borrowers and any lending agent fees associated with the loan, plus any premium payments received for lending certain types of securities.
Investment Valuation
The following is a summary of the inputs used, as of June 30, 2020, involving the Fund's assets and liabilities carried at fair value. The inputs or methodology used for valuing securities may not be an indication of the risk associated with investing in those securities. For more information on valuation inputs, and their aggregation into the levels used below, please refer to the Investment Valuation section in the accompanying Notes to Financial Statements.
| | Valuation Inputs at Reporting Date: |
| Description | Total | Level 1 | Level 2 | Level 3 |
| Investments in Securities: | | | | |
| Equities: | | | | |
| Communication Services | $103,590,025 | $21,294,438 | $82,295,587 | $-- |
| Consumer Discretionary | 110,875,077 | 110,875,077 | -- | -- |
| Consumer Staples | 83,475,060 | 83,475,060 | -- | -- |
| Energy | 32,475,862 | 32,475,862 | -- | -- |
| Financials | 134,096,767 | 74,726,436 | 59,370,331 | -- |
| Health Care | 41,841,180 | 41,841,180 | -- | -- |
| Industrials | 56,044,041 | 56,044,041 | -- | -- |
| Information Technology | 152,457,819 | 68,783,892 | 83,673,927 | -- |
| Materials | 73,207,876 | 60,244,450 | 12,963,426 | -- |
| Money Market Funds | 16,180,783 | 16,180,783 | -- | -- |
| Total Investments in Securities: | $804,244,490 | $565,941,219 | $238,303,271 | $-- |
See accompanying notes which are an integral part of the financial statements.
Financial Statements
Statement of Assets and Liabilities
| | | June 30, 2020 (Unaudited) |
| Assets | | |
Investment in securities, at value (including securities loaned of $8,038,214) — See accompanying schedule:
Unaffiliated issuers (cost $697,107,310) | $788,063,707 | |
| Fidelity Central Funds (cost $16,180,783) | 16,180,783 | |
| Total Investment in Securities (cost $713,288,093) | | $804,244,490 |
| Foreign currency held at value (cost $235,434) | | 235,434 |
| Receivable for investments sold | | 7,494,388 |
| Receivable for fund shares sold | | 6,079,103 |
| Dividends receivable | | 2,279,637 |
| Interest receivable | | 9,867 |
| Distributions receivable from Fidelity Central Funds | | 2,100 |
| Other receivables | | 67,407 |
| Total assets | | 820,412,426 |
| Liabilities | | |
| Payable to custodian bank | $10,012 | |
| Payable for investments purchased | 3,133,947 | |
| Payable for fund shares redeemed | 186,549 | |
| Accrued management fee | 494,708 | |
| Distribution and service plan fees payable | 26,665 | |
| Other affiliated payables | 84,330 | |
| Other payables and accrued expenses | 90,048 | |
| Collateral on securities loaned | 8,075,175 | |
| Total liabilities | | 12,101,434 |
| Net Assets | | $808,310,992 |
| Net Assets consist of: | | |
| Paid in capital | | $726,676,790 |
| Total accumulated earnings (loss) | | 81,634,202 |
| Net Assets | | $808,310,992 |
| Net Asset Value and Maximum Offering Price | | |
| Initial Class: | | |
| Net Asset Value, offering price and redemption price per share ($323,838,754 ÷ 29,349,203 shares) | | $11.03 |
| Service Class: | | |
| Net Asset Value, offering price and redemption price per share ($220,821,359 ÷ 19,985,301 shares) | | $11.05 |
| Service Class 2: | | |
| Net Asset Value, offering price and redemption price per share ($51,447,845 ÷ 4,665,235 shares) | | $11.03 |
| Investor Class: | | |
| Net Asset Value, offering price and redemption price per share ($212,203,034 ÷ 19,326,885 shares) | | $10.98 |
See accompanying notes which are an integral part of the financial statements.
Statement of Operations
| | | Six months ended June 30, 2020 (Unaudited) |
| Investment Income | | |
| Dividends | | $5,391,959 |
| Income from Fidelity Central Funds (including $37 from security lending) | | 40,295 |
| Income before foreign taxes withheld | | 5,432,254 |
| Less foreign taxes withheld | | (614,932) |
| Total income | | 4,817,322 |
| Expenses | | |
| Management fee | $2,287,828 | |
| Transfer agent fees | 259,071 | |
| Distribution and service plan fees | 95,255 | |
| Accounting fees | 146,926 | |
| Custodian fees and expenses | 63,486 | |
| Independent trustees' fees and expenses | 1,723 | |
| Audit | 39,866 | |
| Legal | 1,562 | |
| Miscellaneous | 16,340 | |
| Total expenses before reductions | 2,912,057 | |
| Expense reductions | (58,899) | |
| Total expenses after reductions | | 2,853,158 |
| Net investment income (loss) | | 1,964,164 |
| Realized and Unrealized Gain (Loss) | | |
| Net realized gain (loss) on: | | |
| Investment securities: | | |
| Unaffiliated issuers | (10,267,564) | |
| Fidelity Central Funds | 1,739 | |
| Foreign currency transactions | (208,934) | |
| Futures contracts | 511,981 | |
| Total net realized gain (loss) | | (9,962,778) |
| Change in net unrealized appreciation (depreciation) on: | | |
| Investment securities: | | |
| Unaffiliated issuers | (872,444) | |
| Assets and liabilities in foreign currencies | (5,467) | |
| Total change in net unrealized appreciation (depreciation) | | (877,911) |
| Net gain (loss) | | (10,840,689) |
| Net increase (decrease) in net assets resulting from operations | | $(8,876,525) |
See accompanying notes which are an integral part of the financial statements.
Statement of Changes in Net Assets
| | Six months ended June 30, 2020 (Unaudited) | Year ended December 31, 2019 |
| Increase (Decrease) in Net Assets | | |
| Operations | | |
| Net investment income (loss) | $1,964,164 | $9,860,171 |
| Net realized gain (loss) | (9,962,778) | 68,924,540 |
| Change in net unrealized appreciation (depreciation) | (877,911) | 35,425,157 |
| Net increase (decrease) in net assets resulting from operations | (8,876,525) | 114,209,868 |
| Distributions to shareholders | (51,514,254) | (8,095,503) |
| Share transactions - net increase (decrease) | 301,652,414 | 111,495,949 |
| Total increase (decrease) in net assets | 241,261,635 | 217,610,314 |
| Net Assets | | |
| Beginning of period | 567,049,357 | 349,439,043 |
| End of period | $808,310,992 | $567,049,357 |
See accompanying notes which are an integral part of the financial statements.
Financial Highlights
VIP Emerging Markets Portfolio Initial Class
| | Six months ended (Unaudited) June 30, | Years endedDecember 31, | | | | |
| | 2020 | 2019 | 2018 | 2017 | 2016 | 2015 |
| Selected Per–Share Data | | | | | | |
| Net asset value, beginning of period | $12.68 | $9.95 | $12.23 | $8.36 | $8.14 | $9.10 |
| Income from Investment Operations | | | | | | |
| Net investment income (loss)A | .04 | .26B | .08 | .07 | .06 | .06 |
| Net realized and unrealized gain (loss) | (.57) | 2.66 | (2.28) | 3.88 | .20 | (.97) |
| Total from investment operations | (.53) | 2.92 | (2.20) | 3.95 | .26 | (.91) |
| Distributions from net investment income | (.02) | (.19) | (.08) | (.07) | (.04) | (.05) |
| Distributions from net realized gain | (1.09) | – | –C | (.01) | – | – |
| Total distributions | (1.12)D | (.19) | (.08) | (.08) | (.04) | (.05) |
| Redemption fees added to paid in capitalA | – | – | – | – | – | –C |
| Net asset value, end of period | $11.03 | $12.68 | $9.95 | $12.23 | $8.36 | $8.14 |
| Total ReturnE,F,G | (4.46)% | 29.46% | (18.00)% | 47.40% | 3.24% | (9.97)% |
| Ratios to Average Net AssetsH,I | | | | | | |
| Expenses before reductions | .94%J | .96% | 1.01% | 1.01% | 1.05% | 1.07% |
| Expenses net of fee waivers, if any | .94%J | .96% | 1.01% | 1.01% | 1.05% | 1.07% |
| Expenses net of all reductions | .92%J | .91% | .98% | .99% | 1.05% | 1.05% |
| Net investment income (loss) | .73%J | 2.25%B | .71% | .64% | .71% | .69% |
| Supplemental Data | | | | | | |
| Net assets, end of period (000 omitted) | $323,839 | $273,578 | $159,140 | $165,396 | $132,435 | $112,675 |
| Portfolio turnover rateK | 61%J | 135% | 117% | 82% | 86% | 106% |
A Calculated based on average shares outstanding during the period.
B Net investment income per share reflects a large, non-recurring dividend which amounted to $.14 per share. Excluding this non-recurring dividend the ratio of net investment income (loss) to average net assets would have been 1.06%.
C Amount represents less than $.005 per share.
D Total distributions of $1.12 per share is comprised of distributions from net investment income of $.024 and distributions from net realized gain of $1.092 per share.
E Total returns for periods of less than one year are not annualized.
F Total returns do not reflect charges attributable to your insurance company's separate account. Inclusion of these charges would reduce the total returns shown.
G Total returns would have been lower if certain expenses had not been reduced during the applicable periods shown.
H Fees and expenses of any underlying Fidelity Central Funds are not included in the Fund's expense ratio. The Fund indirectly bears its proportionate share of the expenses of any underlying Fidelity Central Funds.
I Expense ratios reflect operating expenses of the class. Expenses before reductions do not reflect amounts reimbursed by the investment adviser or reductions from brokerage service arrangements or reductions from other expense offset arrangements and do not represent the amount paid by the class during periods when reimbursements or reductions occur. Expenses net of fee waivers reflect expenses after reimbursement by the investment adviser but prior to reductions from brokerage service arrangements or other expense offset arrangements. Expenses net of all reductions represent the net expenses paid by the class.
J Annualized
K Amount does not include the portfolio activity of any underlying Fidelity Central Funds.
See accompanying notes which are an integral part of the financial statements.
VIP Emerging Markets Portfolio Service Class
| | Six months ended (Unaudited) June 30, | Years endedDecember 31, | | | | |
| | 2020 | 2019 | 2018 | 2017 | 2016 | 2015 |
| Selected Per–Share Data | | | | | | |
| Net asset value, beginning of period | $12.70 | $9.97 | $12.26 | $8.39 | $8.17 | $9.14 |
| Income from Investment Operations | | | | | | |
| Net investment income (loss)A | .03 | .25B | .06 | .06 | .05 | .05 |
| Net realized and unrealized gain (loss) | (.56) | 2.66 | (2.27) | 3.89 | .21 | (.98) |
| Total from investment operations | (.53) | 2.91 | (2.21) | 3.95 | .26 | (.93) |
| Distributions from net investment income | (.02) | (.18) | (.08) | (.07) | (.04) | (.04) |
| Distributions from net realized gain | (1.09) | – | –C | (.01) | – | – |
| Total distributions | (1.12)D | (.18) | (.08) | (.08) | (.04) | (.04) |
| Redemption fees added to paid in capitalA | – | – | – | – | – | –C |
| Net asset value, end of period | $11.05 | $12.70 | $9.97 | $12.26 | $8.39 | $8.17 |
| Total ReturnE,F,G | (4.46)% | 29.30% | (18.02)% | 47.19% | 3.13% | (10.15)% |
| Ratios to Average Net AssetsH,I | | | | | | |
| Expenses before reductions | 1.03%J | 1.06% | 1.12% | 1.11% | 1.16% | 1.17% |
| Expenses net of fee waivers, if any | 1.03%J | 1.06% | 1.12% | 1.11% | 1.16% | 1.17% |
| Expenses net of all reductions | 1.01%J | 1.01% | 1.09% | 1.09% | 1.15% | 1.16% |
| Net investment income (loss) | .63%J | 2.16%B | .60% | .54% | .61% | .58% |
| Supplemental Data | | | | | | |
| Net assets, end of period (000 omitted) | $220,821 | $36,185 | $17,147 | $1,089 | $81 | $72 |
| Portfolio turnover rateK | 61%J | 135% | 117% | 82% | 86% | 106% |
A Calculated based on average shares outstanding during the period.
B Net investment income per share reflects a large, non-recurring dividend which amounted to $.14 per share. Excluding this non-recurring dividend the ratio of net investment income (loss) to average net assets would have been .97%.
C Amount represents less than $.005 per share.
D Total distributions of $1.12 per share is comprised of distributions from net investment income of $.023 and distributions from net realized gain of $1.092 per share.
E Total returns for periods of less than one year are not annualized.
F Total returns do not reflect charges attributable to your insurance company's separate account. Inclusion of these charges would reduce the total returns shown.
G Total returns would have been lower if certain expenses had not been reduced during the applicable periods shown.
H Fees and expenses of any underlying Fidelity Central Funds are not included in the Fund's expense ratio. The Fund indirectly bears its proportionate share of the expenses of any underlying Fidelity Central Funds.
I Expense ratios reflect operating expenses of the class. Expenses before reductions do not reflect amounts reimbursed by the investment adviser or reductions from brokerage service arrangements or reductions from other expense offset arrangements and do not represent the amount paid by the class during periods when reimbursements or reductions occur. Expenses net of fee waivers reflect expenses after reimbursement by the investment adviser but prior to reductions from brokerage service arrangements or other expense offset arrangements. Expenses net of all reductions represent the net expenses paid by the class.
J Annualized
K Amount does not include the portfolio activity of any underlying Fidelity Central Funds.
See accompanying notes which are an integral part of the financial statements.
VIP Emerging Markets Portfolio Service Class 2
| | Six months ended (Unaudited) June 30, | Years endedDecember 31, | | | | |
| | 2020 | 2019 | 2018 | 2017 | 2016 | 2015 |
| Selected Per–Share Data | | | | | | |
| Net asset value, beginning of period | $12.69 | $9.96 | $12.25 | $8.38 | $8.15 | $9.12 |
| Income from Investment Operations | | | | | | |
| Net investment income (loss)A | .03 | .23B | .05 | .04 | .04 | .04 |
| Net realized and unrealized gain (loss) | (.58) | 2.67 | (2.27) | 3.90 | .20 | (.98) |
| Total from investment operations | (.55) | 2.90 | (2.22) | 3.94 | .24 | (.94) |
| Distributions from net investment income | (.02) | (.17) | (.06) | (.06) | (.01) | (.03) |
| Distributions from net realized gain | (1.09) | – | –C | (.01) | – | – |
| Total distributions | (1.11) | (.17) | (.07)D | (.07) | (.01) | (.03) |
| Redemption fees added to paid in capitalA | – | – | – | – | – | –C |
| Net asset value, end of period | $11.03 | $12.69 | $9.96 | $12.25 | $8.38 | $8.15 |
| Total ReturnE,F,G | (4.55)% | 29.19% | (18.16)% | 47.05% | 2.95% | (10.31)% |
| Ratios to Average Net AssetsH,I | | | | | | |
| Expenses before reductions | 1.19%J | 1.21% | 1.27% | 1.26% | 1.31% | 1.32% |
| Expenses net of fee waivers, if any | 1.19%J | 1.21% | 1.26% | 1.26% | 1.31% | 1.32% |
| Expenses net of all reductions | 1.17%J | 1.16% | 1.23% | 1.24% | 1.30% | 1.30% |
| Net investment income (loss) | .48%J | 2.01%B | .46% | .39% | .45% | .44% |
| Supplemental Data | | | | | | |
| Net assets, end of period (000 omitted) | $51,448 | $47,476 | $20,128 | $7,246 | $2,868 | $8,076 |
| Portfolio turnover rateK | 61%J | 135% | 117% | 82% | 86% | 106% |
A Calculated based on average shares outstanding during the period.
B Net investment income per share reflects a large, non-recurring dividend which amounted to $.14 per share. Excluding this non-recurring dividend the ratio of net investment income (loss) to average net assets would have been .82%.
C Amount represents less than $.005 per share.
D Total distributions of $.07 per share is comprised of distributions from net investment income of $.062 and distributions from net realized gain of $.003 per share.
E Total returns for periods of less than one year are not annualized.
F Total returns do not reflect charges attributable to your insurance company's separate account. Inclusion of these charges would reduce the total returns shown.
G Total returns would have been lower if certain expenses had not been reduced during the applicable periods shown.
H Fees and expenses of any underlying Fidelity Central Funds are not included in the Fund's expense ratio. The Fund indirectly bears its proportionate share of the expenses of any underlying Fidelity Central Funds.
I Expense ratios reflect operating expenses of the class. Expenses before reductions do not reflect amounts reimbursed by the investment adviser or reductions from brokerage service arrangements or reductions from other expense offset arrangements and do not represent the amount paid by the class during periods when reimbursements or reductions occur. Expenses net of fee waivers reflect expenses after reimbursement by the investment adviser but prior to reductions from brokerage service arrangements or other expense offset arrangements. Expenses net of all reductions represent the net expenses paid by the class.
J Annualized
K Amount does not include the portfolio activity of any underlying Fidelity Central Funds.
See accompanying notes which are an integral part of the financial statements.
VIP Emerging Markets Portfolio Investor Class
| | Six months ended (Unaudited) June 30, | Years endedDecember 31, | | | | |
| | 2020 | 2019 | 2018 | 2017 | 2016 | 2015 |
| Selected Per–Share Data | | | | | | |
| Net asset value, beginning of period | $12.63 | $9.91 | $12.17 | $8.32 | $8.11 | $9.07 |
| Income from Investment Operations | | | | | | |
| Net investment income (loss)A | .03 | .25B | .07 | .06 | .05 | .05 |
| Net realized and unrealized gain (loss) | (.56) | 2.65 | (2.26) | 3.87 | .20 | (.96) |
| Total from investment operations | (.53) | 2.90 | (2.19) | 3.93 | .25 | (.91) |
| Distributions from net investment income | (.02) | (.18) | (.06) | (.07) | (.04) | (.05) |
| Distributions from net realized gain | (1.09) | – | –C | (.01) | – | – |
| Total distributions | (1.12)D | (.18) | (.07)E | (.08) | (.04) | (.05) |
| Redemption fees added to paid in capitalA | – | – | – | – | – | –C |
| Net asset value, end of period | $10.98 | $12.63 | $9.91 | $12.17 | $8.32 | $8.11 |
| Total ReturnF,G,H | (4.49)% | 29.38% | (18.02)% | 47.32% | 3.06% | (10.08)% |
| Ratios to Average Net AssetsI,J | | | | | | |
| Expenses before reductions | 1.01%K | 1.04% | 1.09% | 1.09% | 1.14% | 1.15% |
| Expenses net of fee waivers, if any | 1.01%K | 1.04% | 1.09% | 1.09% | 1.14% | 1.15% |
| Expenses net of all reductions | .99%K | .99% | 1.06% | 1.07% | 1.13% | 1.13% |
| Net investment income (loss) | .65%K | 2.18%B | .63% | .56% | .63% | .61% |
| Supplemental Data | | | | | | |
| Net assets, end of period (000 omitted) | $212,203 | $209,811 | $153,024 | $205,217 | $93,982 | $76,045 |
| Portfolio turnover rateL | 61%K | 135% | 117% | 82% | 86% | 106% |
A Calculated based on average shares outstanding during the period.
B Net investment income per share reflects a large, non-recurring dividend which amounted to $.14 per share. Excluding this non-recurring dividend the ratio of net investment income (loss) to average net assets would have been .99%.
C Amount represents less than $.005 per share.
D Total distributions of $1.12 per share is comprised of distributions from net investment income of $.023 and distributions from net realized gain of $1.092 per share.
E Total distributions of $.07 per share is comprised of distributions from net investment income of $.063 and distributions from net realized gain of $.004 per share.
F Total returns for periods of less than one year are not annualized.
G Total returns do not reflect charges attributable to your insurance company's separate account. Inclusion of these charges would reduce the total returns shown.
H Total returns would have been lower if certain expenses had not been reduced during the applicable periods shown.
I Fees and expenses of any underlying Fidelity Central Funds are not included in the Fund's expense ratio. The Fund indirectly bears its proportionate share of the expenses of any underlying Fidelity Central Funds.
J Expense ratios reflect operating expenses of the class. Expenses before reductions do not reflect amounts reimbursed by the investment adviser or reductions from brokerage service arrangements or reductions from other expense offset arrangements and do not represent the amount paid by the class during periods when reimbursements or reductions occur. Expenses net of fee waivers reflect expenses after reimbursement by the investment adviser but prior to reductions from brokerage service arrangements or other expense offset arrangements. Expenses net of all reductions represent the net expenses paid by the class.
K Annualized
L Amount does not include the portfolio activity of any underlying Fidelity Central Funds.
See accompanying notes which are an integral part of the financial statements.
Notes to Financial Statements (Unaudited)
For the period ended June 30, 2020
1. Organization.
VIP Emerging Markets Portfolio (the Fund) is a fund of Variable Insurance Products Fund II (the Trust) and is authorized to issue an unlimited number of shares. The Trust is registered under the Investment Company Act of 1940, as amended (the 1940 Act), as an open-end management investment company organized as a Massachusetts business trust. Shares of the Fund may only be purchased by insurance companies for the purpose of funding variable annuity or variable life insurance contracts. The Fund offers the following classes of shares: Initial Class shares, Service Class shares, Service Class 2 shares and Investor Class shares. All classes have equal rights and voting privileges, except for matters affecting a single class. The Fund's investments in emerging markets can be subject to social, economic, regulatory, and political uncertainties and can be extremely volatile.
Effective January 1, 2020:
Investment advisers Fidelity Investments Money Management, Inc., FMR Co., Inc., and Fidelity SelectCo, LLC, merged with and into Fidelity Management & Research Company. In connection with the merger transactions, the resulting, merged investment adviser was then redomiciled from Massachusetts to Delaware, changed its corporate structure from a corporation to a limited liability company, and changed its name to "Fidelity Management & Research Company LLC".
Broker-dealer Fidelity Distributors Corporation merged with and into Fidelity Investments Institutional Services Company, Inc. ("FIISC"). FIISC was then redomiciled from Massachusetts to Delaware, changed its corporate structure from a corporation to a limited liability company, and changed its name to "Fidelity Distributors Company LLC".
Fidelity Investments Institutional Operations Company, Inc. converted from a Massachusetts corporation to a Massachusetts LLC, and changed its name to "Fidelity Investments Institutional Operations Company LLC".
2. Investments in Fidelity Central Funds.
The Fund invests in Fidelity Central Funds, which are open-end investment companies generally available only to other investment companies and accounts managed by the investment adviser and its affiliates. The Fund's Schedule of Investments lists each of the Fidelity Central Funds held as of period end, if any, as an investment of the Fund, but does not include the underlying holdings of each Fidelity Central Fund. As an Investing Fund, the Fund indirectly bears its proportionate share of the expenses of the underlying Fidelity Central Funds.
The Money Market Central Funds seek preservation of capital and current income and are managed by the investment adviser. Annualized expenses of the Money Market Central Funds as of their most recent shareholder report date ranged from less than .005% to .01%.
A complete unaudited list of holdings for each Fidelity Central Fund is available upon request or at the Securities and Exchange Commission (the SEC) website at www.sec.gov. In addition, the financial statements of the Fidelity Central Funds are available on the SEC website or upon request.
3. Significant Accounting Policies.
The Fund is an investment company and applies the accounting and reporting guidance of the Financial Accounting Standards Board (FASB) Accounting Standards Codification Topic 946 Financial Services – Investments Companies. The financial statements have been prepared in conformity with accounting principles generally accepted in the United States of America (GAAP), which require management to make certain estimates and assumptions at the date of the financial statements. Actual results could differ from those estimates. Subsequent events, if any, through the date that the financial statements were issued have been evaluated in the preparation of the financial statements. The following summarizes the significant accounting policies of the Fund:
Investment Valuation. Investments are valued as of 4:00 p.m. Eastern time on the last calendar day of the period. The Board of Trustees (the Board) has delegated the day to day responsibility for the valuation of the Fund's investments to the Fair Value Committee (the Committee) established by the Fund's investment adviser. In accordance with valuation policies and procedures approved by the Board, the Fund attempts to obtain prices from one or more third party pricing vendors or brokers to value its investments. When current market prices, quotations or currency exchange rates are not readily available or reliable, investments will be fair valued in good faith by the Committee, in accordance with procedures adopted by the Board. Factors used in determining fair value vary by investment type and may include market or investment specific events. The frequency with which these procedures are used cannot be predicted and they may be utilized to a significant extent. The Committee oversees the Fund's valuation policies and procedures and reports to the Board on the Committee's activities and fair value determinations. The Board monitors the appropriateness of the procedures used in valuing the Fund's investments and ratifies the fair value determinations of the Committee.
The Fund categorizes the inputs to valuation techniques used to value its investments into a disclosure hierarchy consisting of three levels as shown below:
- Level 1 – quoted prices in active markets for identical investments
- Level 2 – other significant observable inputs (including quoted prices for similar investments, interest rates, prepayment speeds, etc.)
- Level 3 – unobservable inputs (including the Fund's own assumptions based on the best information available)
Valuation techniques used to value the Fund's investments by major category are as follows:
Equity securities, including restricted securities, for which market quotations are readily available, are valued at the last reported sale price or official closing price as reported by a third party pricing vendor on the primary market or exchange on which they are traded and are categorized as Level 1 in the hierarchy. In the event there were no sales during the day or closing prices are not available, securities are valued at the last quoted bid price or may be valued using the last available price and are generally categorized as Level 2 in the hierarchy. For foreign equity securities, when market or security specific events arise, comparisons to the valuation of American Depositary Receipts (ADRs), futures contracts, Exchange-Traded Funds (ETFs) and certain indexes as well as quoted prices for similar securities may be used and would be categorized as Level 2 in the hierarchy. For equity securities, including restricted securities, where observable inputs are limited, assumptions about market activity and risk are used and these securities may be categorized as Level 3 in the hierarchy.
Investments in open-end mutual funds, including the Fidelity Central Funds, are valued at their closing net asset value (NAV) each business day and are categorized as Level 1 in the hierarchy.
Changes in valuation techniques may result in transfers in or out of an assigned level within the disclosure hierarchy. The aggregate value of investments by input level as of June 30, 2020 is included at the end of the Fund's Schedule of Investments.
Foreign Currency. The Fund may use foreign currency contracts to facilitate transactions in foreign-denominated securities. Gains and losses from these transactions may arise from changes in the value of the foreign currency or if the counterparties do not perform under the contracts' terms.
Foreign-denominated assets, including investment securities, and liabilities are translated into U.S. dollars at the exchange rates at period end. Purchases and sales of investment securities, income and dividends received and expenses denominated in foreign currencies are translated into U.S. dollars at the exchange rate in effect on the transaction date.
The effects of exchange rate fluctuations on investments are included with the net realized and unrealized gain (loss) on investment securities. Other foreign currency transactions resulting in realized and unrealized gain (loss) are disclosed separately.
Investment Transactions and Income. For financial reporting purposes, the Fund's investment holdings and NAV include trades executed through the end of the last business day of the period. The NAV per share for processing shareholder transactions is calculated as of the close of business of the New York Stock Exchange (NYSE), normally 4:00 p.m. Eastern time and includes trades executed through the end of the prior business day. Gains and losses on securities sold are determined on the basis of identified cost and include proceeds received from litigation. Dividend income is recorded on the ex-dividend date, except for certain dividends from foreign securities where the ex-dividend date may have passed, which are recorded as soon as the Fund is informed of the ex-dividend date. Non-cash dividends included in dividend income, if any, are recorded at the fair market value of the securities received. Income and capital gain distributions from Fidelity Central Funds, if any, are recorded on the ex-dividend date. Certain distributions received by the Fund represent a return of capital or capital gain. The Fund determines the components of these distributions subsequent to the ex-dividend date, based upon receipt of tax filings or other correspondence relating to the underlying investment. These distributions are recorded as a reduction of cost of investments and/or as a realized gain. Investment income is recorded net of foreign taxes withheld where recovery of such taxes is uncertain.
Class Allocations and Expenses. Investment income, realized and unrealized capital gains and losses, common expenses of the Fund, and certain fund-level expense reductions, if any, are allocated daily on a pro-rata basis to each class based on the relative net assets of each class to the total net assets of the Fund. Each class differs with respect to transfer agent and distribution and service plan fees incurred. Certain expense reductions may also differ by class. For the reporting period, the allocated portion of income and expenses to each class as a percent of its average net assets may vary due to the timing of recording these transactions in relation to fluctuating net assets of the classes. Expenses directly attributable to a fund are charged to that fund. Expenses attributable to more than one fund are allocated among the respective funds on the basis of relative net assets or other appropriate methods. Expense estimates are accrued in the period to which they relate and adjustments are made when actual amounts are known.
Income Tax Information and Distributions to Shareholders. Each year, the Fund intends to qualify as a regulated investment company under Subchapter M of the Internal Revenue Code, including distributing substantially all of its taxable income and realized gains. As a result, no provision for U.S. Federal income taxes is required. The Fund files a U.S. federal tax return, in addition to state and local tax returns as required. The Fund's federal income tax returns are subject to examination by the Internal Revenue Service (IRS) for a period of three fiscal years after they are filed. State and local tax returns may be subject to examination for an additional fiscal year depending on the jurisdiction. Foreign taxes are provided for based on the Fund's understanding of the tax rules and rates that exist in the foreign markets in which it invests.
Distributions are declared and recorded on the ex-dividend date. Income and capital gain distributions are declared separately for each class. Income and capital gain distributions are determined in accordance with income tax regulations, which may differ from GAAP.
Capital accounts within the financial statements are adjusted for permanent book-tax differences. These adjustments have no impact on net assets or the results of operations. Capital accounts are not adjusted for temporary book-tax differences which will reverse in a subsequent period.
Book-tax differences are primarily due to foreign currency transactions, passive foreign investment companies (PFIC), capital loss carryforwards and losses deferred due to wash sales and excise tax regulations.
As of period end, the cost and unrealized appreciation (depreciation) in securities, and derivatives if applicable, for federal income tax purposes were as follows:
| Gross unrealized appreciation | $134,498,234 |
| Gross unrealized depreciation | (47,599,718) |
| Net unrealized appreciation (depreciation) | $86,898,516 |
| Tax cost | $717,345,974 |
4. Derivative Instruments.
Risk Exposures and the Use of Derivative Instruments. The Fund's investment objective allows the Fund to enter into various types of derivative contracts, including futures contracts. Derivatives are investments whose value is primarily derived from underlying assets, indices or reference rates and may be transacted on an exchange or over-the-counter (OTC). Derivatives may involve a future commitment to buy or sell a specified asset based on specified terms, to exchange future cash flows at periodic intervals based on a notional principal amount, or for one party to make one or more payments upon the occurrence of specified events in exchange for periodic payments from the other party.
The Fund used derivatives to increase returns and to manage exposure to certain risks as defined below. The success of any strategy involving derivatives depends on analysis of numerous economic factors, and if the strategies for investment do not work as intended, the Fund may not achieve its objectives.
The Fund's use of derivatives increased or decreased its exposure to the following risk:
| Equity Risk | Equity risk relates to the fluctuations in the value of financial instruments as a result of changes in market prices (other than those arising from interest rate risk or foreign exchange risk), whether caused by factors specific to an individual investment, its issuer, or all factors affecting all instruments traded in a market or market segment.
|
The Fund is also exposed to additional risks from investing in derivatives, such as liquidity risk and counterparty credit risk. Liquidity risk is the risk that the Fund will be unable to close out the derivative in the open market in a timely manner. Counterparty credit risk is the risk that the counterparty will not be able to fulfill its obligation to the Fund. Counterparty credit risk related to exchange-traded futures contracts may be mitigated by the protection provided by the exchange on which they trade.
Investing in derivatives may involve greater risks than investing in the underlying assets directly and, to varying degrees, may involve risk of loss in excess of any initial investment and collateral received and amounts recognized in the Statement of Assets and Liabilities. In addition, there may be the risk that the change in value of the derivative contract does not correspond to the change in value of the underlying instrument.
Futures Contracts. A futures contract is an agreement between two parties to buy or sell a specified underlying instrument for a fixed price at a specified future date. The Fund used futures contracts to manage its exposure to the stock market.
Upon entering into a futures contract, a fund is required to deposit either cash or securities (initial margin) with a clearing broker in an amount equal to a certain percentage of the face value of the contract. Futures contracts are marked-to-market daily and subsequent daily payments (variation margin) are made or received by a fund depending on the daily fluctuations in the value of the futures contracts and are recorded as unrealized appreciation or (depreciation). This receivable and/or payable, if any, is included in daily variation margin on futures contracts in the Statement of Assets and Liabilities. Realized gain or (loss) is recorded upon the expiration or closing of a futures contract. The net realized gain (loss) and change in net unrealized appreciation (depreciation) on futures contracts during the period is presented in the Statement of Operations.
Any open futures contracts at period end are presented in the Schedule of Investments under the caption "Futures Contracts". The notional amount at value reflects each contract's exposure to the underlying instrument or index at period end.
5. Purchases and Sales of Investments.
Purchases and sales of securities, other than short-term securities, are noted in the table below.
| | Purchases ($) | Sales ($) |
| VIP Emerging Markets Portfolio | 412,973,624 | 176,317,828 |
6. Fees and Other Transactions with Affiliates.
Management Fee. Fidelity Management & Research Company LLC (the investment adviser) and its affiliates provide the Fund with investment management related services for which the Fund pays a monthly management fee. The management fee is the sum of an individual fund fee rate that is based on an annual rate of .55% of the Fund's average net assets and an annualized group fee rate that averaged .23% during the period. The group fee rate is based upon the monthly average net assets of a group of registered investment companies with which the investment adviser has management contracts. The group fee rate decreases as assets under management increase and increases as assets under management decrease. For the reporting period, the total annualized management fee rate was .78% of the Fund's average net assets.
Distribution and Service Plan Fees. In accordance with Rule 12b-1 of the 1940 Act, the Fund has adopted separate 12b-1 Plans for each Service Class of shares. Each Service Class pays Fidelity Distributors Company LLC (FDC), an affiliate of the investment adviser, a service fee. For the period, the service fee is based on an annual rate of .10% of Service Class' average net assets and .25% of Service Class 2's average net assets.
For the period, total fees, all of which were re-allowed to insurance companies for the distribution of shares and providing shareholder support services, were as follows:
| Service Class | $37,729 |
| Service Class 2 | 57,526 |
| | $95,255 |
Transfer Agent Fees. Fidelity Investments Institutional Operations Company LLC (FIIOC), an affiliate of the investment adviser, is the Fund's transfer, dividend disbursing, and shareholder servicing agent. FIIOC receives an asset-based fee with respect to each class. Each class pays a fee for transfer agent services, typesetting and printing and mailing of shareholder reports, excluding mailing of proxy statements. Effective February 1, 2020, the Board approved to change the fee from .145% to .142% for Investor Class, and from .065% to .064% for all other classes. For the period, transfer agent fees for each class were as follows:
| | Amount | % of Class-Level Average Net Assets(a) |
| Initial Class | $85,058 | .06 |
| Service Class | 23,987 | .06 |
| Service Class 2 | 14,516 | .06 |
| Investor Class | 135,510 | .14 |
| | $259,071 | |
(a) Annualized
Accounting Fees. Fidelity Service Company, Inc. (FSC), an affiliate of the investment adviser, maintains the Fund's accounting records. The accounting fee is based on the level of average net assets for each month. For the period, the fees were equivalent to the following annualized rates:
| | % of Average Net Assets |
| VIP Emerging Markets Portfolio | .05 |
Brokerage Commissions. A portion of portfolio transactions were placed with brokerage firms which are affiliates of the investment adviser. Brokerage commissions are included in net realized gain (loss) and change in net unrealized appreciation (depreciation) in the Statement of Operations. The commissions paid to these affiliated firms were as follows:
| | Amount |
| VIP Emerging Markets Portfolio | $1,300 |
Interfund Trades. Funds may purchase from or sell securities to other Fidelity Funds under procedures adopted by the Board. The procedures have been designed to ensure these interfund trades are executed in accordance with Rule 17a-7 of the 1940 Act. Interfund trades are included within the respective purchases and sales amounts shown in the Purchases and Sales of Investments note.
7. Committed Line of Credit.
Certain Funds participate with other funds managed by the investment adviser or an affiliate in a $4.25 billion credit facility (the "line of credit") to be utilized for temporary or emergency purposes to fund shareholder redemptions or for other short-term liquidity purposes. The participating funds have agreed to pay commitment fees on their pro-rata portion of the line of credit, which are reflected in Miscellaneous expenses on the Statement of Operations, and are as follows:
| | Amount |
| VIP Emerging Markets Portfolio | $659 |
During the period, there were no borrowings on this line of credit.
8. Security Lending.
The Fund lends portfolio securities from time to time in order to earn additional income. For equity securities, lending agents are used, including National Financial Services (NFS), an affiliate of the Fund. Pursuant to a securities lending agreement, NFS will receive a fee, which is capped at 9.9% of daily lending revenue, for its services as lending agent. The Fund may lend securities to certain qualified borrowers, including NFS. On the settlement date of the loan, the Fund receives collateral (in the form of U.S. Treasury obligations, letters of credit and/or cash) against the loaned securities and maintains collateral in an amount not less than 100% of the market value of the loaned securities during the period of the loan. The market value of the loaned securities is determined at the close of business of the Fund and any additional required collateral is delivered to the Fund on the next business day. The Fund or borrower may terminate the loan at any time, and if the borrower defaults on its obligation to return the securities loaned because of insolvency or other reasons, the Fund may apply collateral received from the borrower against the obligation. The Fund may experience delays and costs in recovering the securities loaned. Any cash collateral received is invested in the Fidelity Securities Lending Cash Central Fund. The value of loaned securities and cash collateral at period end are disclosed on the Fund's Statement of Assets and Liabilities. Total fees paid by the Fund to NFS, as lending agent, amounted to $3. Security lending income represents the income earned on investing cash collateral, less rebates paid to borrowers and any lending agent fees associated with the loan, plus any premium payments received for lending certain types of securities. Security lending income is presented in the Statement of Operations as a component of income from Fidelity Central Funds. During the period, there were no securities loaned to NFS.
9. Expense Reductions.
Commissions paid to certain brokers with whom the investment adviser, or its affiliates, places trades on behalf of the Fund include an amount in addition to trade execution, which may be rebated back to the Fund to offset certain expenses. This amount totaled $57,259 for the period. In addition, through arrangements with the Fund's custodian, credits realized as a result of certain uninvested cash balances were used to reduce the Fund's expenses. During the period, custodian credits reduced the Fund's expenses by $537.
In addition, during the period the investment adviser or an affiliate reimbursed and/or waived a portion of fund-level operating expenses in the amount of $1,103.
10. Distributions to Shareholders.
Distributions to shareholders of each class were as follows:
| | Six months ended
June 30, 2020 | Year ended
December 31, 2019 |
| Distributions to shareholders | | |
| Initial Class | $24,825,132 | $4,027,524 |
| Service Class | 3,277,532 | 499,424 |
| Service Class 2 | 4,431,570 | 593,613 |
| Investor Class | 18,980,020 | 2,974,942 |
| Total | $51,514,254 | $8,095,503 |
11. Share Transactions.
Transactions for each class of shares were as follows:
| | Shares | Shares | Dollars | Dollars |
| | Six months ended June 30, 2020 | Year ended December 31, 2019 | Six months ended June 30, 2020 | Year ended December 31, 2019 |
| Initial Class | | | | |
| Shares sold | 9,275,514 | 9,172,451 | $98,216,933 | $106,932,333 |
| Reinvestment of distributions | 2,187,236 | 339,875 | 24,825,132 | 4,027,524 |
| Shares redeemed | (3,683,263) | (3,940,236) | (38,750,809) | (45,648,524) |
| Net increase (decrease) | 7,779,487 | 5,572,090 | $84,291,256 | $65,311,333 |
| Service Class | | | | |
| Shares sold | 17,605,269 | 1,590,421 | $179,763,054 | $18,219,839 |
| Reinvestment of distributions | 288,261 | 42,074 | 3,277,532 | 499,424 |
| Shares redeemed | (756,666) | (504,702) | (7,741,349) | (5,852,722) |
| Net increase (decrease) | 17,136,864 | 1,127,793 | $175,299,237 | $12,866,541 |
| Service Class 2 | | | | |
| Shares sold | 1,230,557 | 2,743,759 | $13,213,390 | $31,855,529 |
| Reinvestment of distributions | 390,447 | 50,052 | 4,431,569 | 593,613 |
| Shares redeemed | (697,197) | (1,073,492) | (7,261,359) | (12,468,852) |
| Net increase (decrease) | 923,807 | 1,720,319 | $10,383,600 | $19,980,290 |
| Investor Class | | | | |
| Shares sold | 3,673,939 | 4,935,342 | $39,770,286 | $56,654,758 |
| Reinvestment of distributions | 1,679,648 | 252,114 | 18,980,020 | 2,974,942 |
| Shares redeemed | (2,639,170) | (4,022,148) | (27,071,985) | (46,291,915) |
| Net increase (decrease) | 2,714,417 | 1,165,308 | $31,678,321 | $13,337,785 |
12. Other.
The Fund's organizational documents provide former and current trustees and officers with a limited indemnification against liabilities arising in connection with the performance of their duties to the Fund. In the normal course of business, the Fund may also enter into contracts that provide general indemnifications. The Fund's maximum exposure under these arrangements is unknown as this would be dependent on future claims that may be made against the Fund. The risk of material loss from such claims is considered remote.
At the end of the period, the investment adviser or its affiliates were the owners of record of 12% of the total outstanding shares of the Fund and two otherwise unaffiliated shareholders were the owners of record of 33% of the total outstanding shares of the Fund. In addition, at the end of the period, VIP Freedom 2020 Portfolio was the owner of record of approximately 10% of the total outstanding shares of the Fund. Mutual funds managed by the investment adviser or its affiliates were the owners of record, in the aggregate, of approximately 49% of the total outstanding shares of the Fund.
13. Coronavirus (COVID-19) Pandemic.
An outbreak of COVID-19 first detected in China during December 2019 has since spread globally and was declared a pandemic by the World Health Organization during March 2020. Developments that disrupt global economies and financial markets, such as the COVID-19 pandemic, may magnify factors that affect the Fund's performance.
Shareholder Expense Example
As a shareholder of the Fund, you incur two types of costs: (1) transaction costs and (2) ongoing costs, including management fees, distribution and/or service (12b-1) fees and other Fund expenses. This Example is intended to help you understand your ongoing costs (in dollars) of investing in the Fund and to compare these costs with the ongoing costs of investing in other mutual funds.
The Example is based on an investment of $1,000 invested at the beginning of the period and held for the entire period (January 1, 2020 to June 30, 2020).
Actual Expenses
The first line of the accompanying table for each class of the Fund provides information about actual account values and actual expenses. You may use the information in this line, together with the amount you invested, to estimate the expenses that you paid over the period. Simply divide your account value by $1,000.00 (for example, an $8,600 account value divided by $1,000.00 = 8.6), then multiply the result by the number in the first line for a class of the Fund under the heading entitled "Expenses Paid During Period" to estimate the expenses you paid on your account during this period. The estimate of expenses does not include any fees or other expenses of any variable annuity or variable life insurance product. If they were, the estimate of expenses you paid during the period would be higher, and your ending account value would be lower. In addition, the Fund, as a shareholder in the underlying Fidelity Central Funds, will indirectly bear its pro-rata share of the fees and expenses incurred by the underlying Fidelity Central Funds. These fees and expenses are not included in the Fund's annualized expense ratio used to calculate the expense estimate in the table below.
Hypothetical Example for Comparison Purposes
The second line of the accompanying table for each class of the Fund provides information about hypothetical account values and hypothetical expenses based on a Class' actual expense ratio and an assumed rate of return of 5% per year before expenses, which is not the Class' actual return. The hypothetical account values and expenses may not be used to estimate the actual ending account balance or expenses you paid for the period. You may use this information to compare the ongoing costs of investing in the Fund and other funds. To do so, compare this 5% hypothetical example with the 5% hypothetical examples that appear in the shareholder reports of the other funds. The estimate of expenses does not include any fees or other expenses of any variable annuity or variable life insurance product. If they were, the estimate of expenses you paid during the period would be higher, and your ending account value would be lower. In addition, the Fund, as a shareholder in the underlying Fidelity Central Funds, will indirectly bear its pro-rata share of the fees and expenses incurred by the underlying Fidelity Central Funds. These fees and expenses are not included in the Fund's annualized expense ratio used to calculate the expense estimate in the table below.
Please note that the expenses shown in the table are meant to highlight your ongoing costs only and do not reflect any transaction costs. Therefore, the second line of the table is useful in comparing ongoing costs only, and will not help you determine the relative total costs of owning different funds.
| | Annualized Expense Ratio-A | Beginning
Account Value
January 1, 2020 | Ending
Account Value
June 30, 2020 | Expenses Paid
During Period-B
January 1, 2020
to June 30, 2020 |
| Initial Class | .94% | | | |
| Actual | | $1,000.00 | $955.40 | $4.57 |
| Hypothetical-C | | $1,000.00 | $1,020.19 | $4.72 |
| Service Class | 1.03% | | | |
| Actual | | $1,000.00 | $955.40 | $5.01 |
| Hypothetical-C | | $1,000.00 | $1,019.74 | $5.17 |
| Service Class 2 | 1.19% | | | |
| Actual | | $1,000.00 | $954.50 | $5.78 |
| Hypothetical-C | | $1,000.00 | $1,018.95 | $5.97 |
| Investor Class | 1.01% | | | |
| Actual | | $1,000.00 | $955.10 | $4.91 |
| Hypothetical-C | | $1,000.00 | $1,019.84 | $5.07 |
A Annualized expense ratio reflects expenses net of applicable fee waivers.
B Expenses are equal to each Class' annualized expense ratio, multiplied by the average account value over the period, multiplied by 182/366 (to reflect the one-half year period).
C 5% return per year before expenses
Board Approval of Investment Advisory Contracts and Management Fees
VIP Emerging Markets Portfolio
Each year, the Board of Trustees, including the Independent Trustees (together, the Board), votes on the renewal of the management contract with Fidelity Management & Research Company LLC (FMR) and the sub-advisory agreements (together, the Advisory Contracts) for the fund. FMR and the sub-advisers are referred to herein as the Investment Advisers. The Board, assisted by the advice of fund counsel and Independent Trustees' counsel, requests and considers a broad range of information relevant to the renewal of the Advisory Contracts throughout the year.
The Board meets regularly and, at each of its meetings, covers an extensive agenda of topics and materials and considers factors that are relevant to its annual consideration of the renewal of the fund's Advisory Contracts, including the services and support provided to the fund and its shareholders. The Board has established various standing committees (Committees), each composed of and chaired by Independent Trustees with varying backgrounds, to which the Board has assigned specific subject matter responsibilities in order to enhance effective decision-making by the Board. The Board, acting directly and through its Committees, requests and receives information concerning the annual consideration of the renewal of the fund's Advisory Contracts. The Board also meets as needed to review matters specifically related to the Board's annual consideration of the renewal of the Advisory Contracts. Members of the Board may also meet with trustees of other Fidelity funds through joint ad hoc committees to discuss certain matters relevant to all of the Fidelity funds.
At its January 2020 meeting, the Board unanimously determined to renew the fund's Advisory Contracts. In reaching its determination, the Board considered all factors it believed relevant, including (i) the nature, extent, and quality of the services provided to the fund and its shareholders (including the investment performance of the fund); (ii) the competitiveness of the fund's management fee and total expense ratio relative to peer funds; (iii) the total costs of the services provided by and the profits realized by Fidelity from its relationships with the fund; and (iv) the extent to which, if any, economies of scale exist and are realized as the fund grows, and whether any economies of scale are appropriately shared with fund shareholders.
In considering whether to renew the Advisory Contracts for the fund, the Board reached a determination, with the assistance of fund counsel and Independent Trustees' counsel and through the exercise of its business judgment, that the renewal of the Advisory Contracts was in the best interests of the fund and its shareholders and that the compensation payable under the Advisory Contracts was fair and reasonable. The Board's decision to renew the Advisory Contracts was not based on any single factor, but rather was based on a comprehensive consideration of all the information provided to the Board at its meetings throughout the year. The Board, in reaching its determination to renew the Advisory Contracts, was aware that shareholders of the fund have a broad range of investment choices available to them, including a wide choice among funds offered by Fidelity's competitors, and that the fund's shareholders, who have the opportunity to review and weigh the disclosure provided by the fund in its prospectus and other public disclosures, have chosen to invest in this fund, which is part of the Fidelity family of funds.
Nature, Extent, and Quality of Services Provided. The Board considered Fidelity's staffing as it relates to the fund, including the backgrounds of investment personnel of Fidelity, and also considered the fund's investment objective, strategies, and related investment philosophy. The Independent Trustees also had discussions with senior management of Fidelity's investment operations and investment groups. The Board considered the structure of the investment personnel compensation program and whether this structure provides appropriate incentives to act in the best interests of the fund. Additionally, the Board considered the portfolio managers' investments, if any, in the funds that they manage.
Resources Dedicated to Investment Management and Support Services. The Board and the Fund Oversight and Research Committees reviewed the general qualifications and capabilities of Fidelity's investment staff, including its size, education, experience, and resources, as well as Fidelity's approach to recruiting, training, managing, and compensating investment personnel. The Board noted that Fidelity has continued to increase the resources devoted to non-U.S. offices, including expansion of Fidelity's global investment organization. The Board also noted that Fidelity's analysts have extensive resources, tools and capabilities that allow them to conduct sophisticated quantitative and fundamental analysis, as well as credit analysis of issuers, counterparties and guarantors. Further, the Board considered that Fidelity's investment professionals have sufficient access to global information and data so as to provide competitive investment results over time, and that those professionals also have access to sophisticated tools that permit them to assess portfolio construction and risk and performance attribution characteristics continuously, as well as to transmit new information and research conclusions rapidly around the world. Additionally, in its deliberations, the Board considered Fidelity's trading, risk management, compliance, and technology and operations capabilities and resources, which are integral parts of the investment management process.
Shareholder and Administrative Services. The Board considered (i) the nature, extent, quality, and cost of advisory, administrative, and shareholder services performed by the Investment Advisers and their affiliates under the Advisory Contracts and under separate agreements covering transfer agency, pricing and bookkeeping, and securities lending services for the fund; (ii) the nature and extent of the supervision of third party service providers, principally custodians, subcustodians, and pricing vendors; and (iii) the resources devoted to, and the record of compliance with, the fund's compliance policies and procedures. The Board also reviewed the allocation of fund brokerage, including allocations to brokers affiliated with the Investment Advisers, the use of brokerage commissions to pay fund expenses, and the use of "soft" commission dollars to pay for research services.
The Board noted that the growth of fund assets over time across the complex allows Fidelity to reinvest in the development of services designed to enhance the value and convenience of the Fidelity funds as investment vehicles. These services include 24-hour access to account information and market information over the Internet and through telephone representatives, investor education materials and asset allocation tools, and the expanded availability of Fidelity Investor Centers.
The Board noted that it and the boards of certain other Fidelity funds had formed an ad hoc Committee on Transfer Agency Fees to review the variety of transfer agency fee structures throughout the industry and Fidelity's competitive positioning with respect to industry participants.
Investment in a Large Fund Family. The Board considered the benefits to shareholders of investing in a Fidelity fund, including the benefits of investing in a fund that is part of a large family of funds offering a variety of investment disciplines and providing a large variety of mutual fund investor services. The Board noted that Fidelity had taken, or had made recommendations that resulted in the Fidelity funds taking, a number of actions over the previous year that benefited particular funds, including: (i) continuing to dedicate additional resources to Fidelity's investment research process, which includes meetings with management of issuers of securities in which the funds invest, and to the support of the senior management team that oversees asset management; (ii) continuing efforts to enhance Fidelity's global research capabilities; (iii) launching new funds and ETFs with innovative structures, strategies and pricing and making other enhancements to meet client needs; (iv) launching new share classes of existing funds; (v) eliminating purchase minimums and broadening eligibility requirements for certain funds and share classes; (vi) reducing management fees and total expenses for certain target date funds and index funds; (vii) lowering expense caps for certain existing funds and classes, and converting certain voluntary expense caps to contractual caps, to reduce expenses borne by shareholders; (viii) rationalizing product lines and gaining increased efficiencies from fund mergers, liquidations, and share class consolidations; (ix) continuing to develop, acquire and implement systems and technology to improve services to the funds and shareholders, strengthen information security, and increase efficiency; and (x) continuing to implement enhancements to further strengthen Fidelity's product line to increase investors' probability of success in achieving their investment goals, including retirement income goals.
Investment Performance. The Board considered whether the fund has operated in accordance with its investment objective, as well as its record of compliance with its investment restrictions and its performance history. The Board noted that there were portfolio management changes for
the fund in February 2019 and October 2019. The Board will continue to monitor closely the fund's performance, taking into account the portfolio management changes.
The Board took into account discussions that occur at Board meetings throughout the year with representatives of the Investment Advisers about fund investment performance. In this regard the Board noted that as part of regularly scheduled fund reviews and other reports to the Board on fund performance, the Board considers annualized return information for the fund for different time periods, measured against an appropriate securities market index (benchmark index) and a peer group of funds with similar objectives (peer group), if any. In its evaluation of fund investment performance, the Board gave particular attention to information indicating changes in performance of certain Fidelity funds for specific time periods and discussed with the Investment Advisers the reasons for any overperformance or underperformance.
In addition to reviewing absolute and relative fund performance, the Independent Trustees periodically consider the appropriateness of fund performance metrics in evaluating the results achieved. In general, the Independent Trustees believe that fund performance should be evaluated based on net performance (after fees and expenses) of both the highest performing and lowest performing fund share classes, where applicable, compared to appropriate benchmark indices, over appropriate time periods that may include full market cycles, and compared to peer groups, as applicable, over the same periods, taking into account relevant factors including the following: general market conditions; issuer-specific information; and fund cash flows and other factors.
The Independent Trustees recognize that shareholders evaluate performance on a net basis over their own holding periods, for which one-, three-, and five-year periods are often used as a proxy. For this reason, the performance information reviewed by the Board also included net cumulative total return information for the fund and an appropriate benchmark index and peer group for the most recent one-, three-, and five-year periods ended June 30, 2019, as shown below. Returns are shown compared to the 25th percentile (top of box, 75% beaten) and 75th percentile (bottom of box, 25% beaten) of the peer universe.
VIP Emerging Markets Portfolio
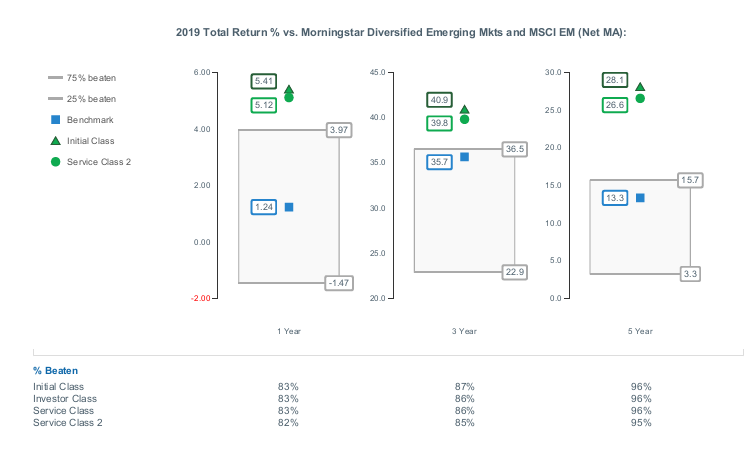
Based on its review, the Board concluded that the nature, extent, and quality of services provided to the fund under the Advisory Contracts should continue to benefit the shareholders of the fund.
Competitiveness of Management Fee and Total Expense Ratio. The Board considered the fund's management fee and total expense ratio compared to "mapped groups" of competitive funds and classes created for the purpose of facilitating the Trustees' competitive analysis of management fees and total expenses. Fidelity creates "mapped groups" by combining similar Lipper investment objective categories that have comparable investment mandates. Combining Lipper investment objective categories aids the Board's management fee and total expense ratio comparisons by broadening the competitive group used for comparison.
Management Fee. The Board considered two proprietary management fee comparisons for the 12-month periods ended June 30 (December 31 for periods prior to 2018) shown in basis points (BP) in the chart below. The group of Lipper funds used by the Board for management fee comparisons is referred to below as the "Total Mapped Group." The Total Mapped Group comparison focuses on a fund's standing in terms of gross management fees before expense reimbursements or caps relative to the total universe of funds with comparable investment mandates, regardless of whether their management fee structures also are comparable. Funds with comparable investment mandates offer exposure to similar types of securities. Funds with comparable management fee structures have similar management fee contractual arrangements (
e.g., flat rate charged for advisory services, all-inclusive fee rate,
etc.). "TMG %" represents the percentage of funds in the Total Mapped Group that had management fees that were lower than the fund's. For example, a hypothetical TMG % of 20% would mean that 80% of the funds in the Total Mapped Group had higher, and 20% had lower, management fees than the fund. The fund's actual TMG %s and the number of funds in the Total Mapped Group are in the chart below. The "Asset-Sized Peer Group" (ASPG) comparison focuses on a fund's standing relative to a subset of non-Fidelity funds within the Total Mapped Group that are similar in size and management fee structure. For example, if a fund is in the first quartile of the ASPG, the fund's management fee ranks in the least expensive or lowest 25% of funds in the ASPG. The ASPG represents at least 15% of the funds in the Total Mapped Group with comparable asset size and management fee structures, subject to a minimum of 50 funds (or all funds in the Total Mapped Group if fewer than 50). Additional information, such as the ASPG quartile in which the fund's management fee rate ranked, is also included in the chart and was considered by the Board.
VIP Emerging Markets Portfolio
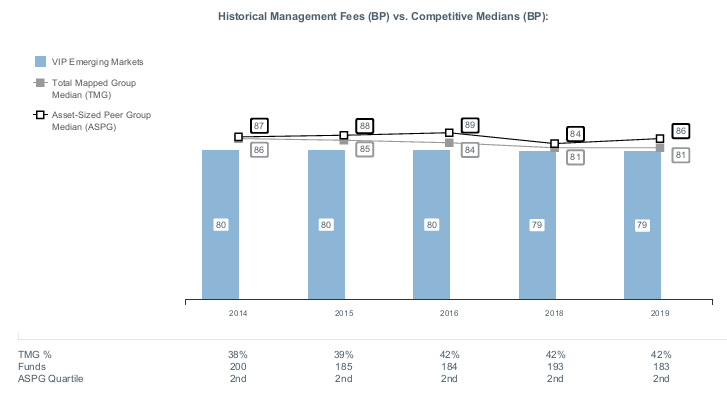
The Board noted that the fund's management fee rate ranked below the median of its Total Mapped Group and below the median of its ASPG for the 12-month period ended June 30, 2019.
The Board noted that it and the boards of other Fidelity funds formed an ad hoc Committee on Group Fee, which meets periodically, to conduct an in-depth review of the "group fee" component of the management fee of funds with such management fee structures. The Committee's focus included the mechanics of the group fee, the competitive landscape of group fee structures, Fidelity funds with no group fee component and investment products not included in group fee assets. The Board also considered that, for funds subject to the group fee, FMR agreed to voluntarily waive fees over a specified period of time in amounts designed to account for assets converted from certain funds to certain collective investment trusts.
The Board also noted that, in 2013, the ad hoc Committee on Management Fees was formed to conduct an in-depth review of the management fee rates of Fidelity's active equity mutual funds. The Committee focused on the following areas: (i) standard fee structures; (ii) research consumption and trading evolution; (iii) management fee competitiveness/profitability by category; and (iv) factors that drive institutional pricing.
Based on its review, the Board concluded that the fund's management fee is fair and reasonable in light of the services that the fund receives and the other factors considered.
Total Expense Ratio. In its review of each class's total expense ratio, the Board considered the fund's management fee rate as well as other fund or class expenses, as applicable, such as transfer agent fees, pricing and bookkeeping fees, fund-paid 12b-1 fees, and custodial, legal, and audit fees. The Board also noted that Fidelity may agree to waive fees or reimburse expenses from time to time, and the extent to which, if any, it has done so for the fund. As part of its review, the Board also considered the current and historical total expense ratios of each class of the fund compared to competitive fund median expenses. Each class of the fund is compared to those funds and classes in the Total Mapped Group (used by the Board for management fee comparisons) that have a similar sales load structure.
The Board noted that the total expense ratio of Initial Class ranked below the competitive median for the 12-month period ended June 30, 2019 and the total expense ratio of each of Investor Class, Service Class, and Service Class 2 ranked above the competitive median for the 12-month period ended June 30, 2019. The Board considered that, in general, various factors can affect total expense ratios. The Board also noted that the total expense ratio of the Investor Class was above the competitive median primarily because of relatively higher transfer agent fees due to low asset levels. The Board noted that the total expense ratio of each of Service Class and Service Class 2 was above the competitive median because of its 12b-1 fees and that excluding 12b-1 fees of both the class and the competitor classes, the total expense ratio of Service Class and Service Class 2 ranked below the median. The Board noted that the fund offers multiple classes, each of which has a different 12b-1 fee structure, and that the multiple structures are intended to offer a range of pricing options for the intermediary market. The Board also noted that the total expense ratios of the classes vary primarily by the level of their 12b-1 fees, although differences in transfer agent fees may also cause expenses to vary from class to class.
Fees Charged to Other Fidelity Clients. The Board also considered Fidelity fee structures and other information with respect to clients of Fidelity, such as other funds advised or subadvised by Fidelity, pension plan clients, and other institutional clients with similar mandates. The Board noted that a joint ad hoc committee created by it and the boards of other Fidelity funds periodically reviews and compares Fidelity's institutional investment advisory business with its business of providing services to the Fidelity funds and also noted the most recent findings of the committee. The Board noted that the committee's review included a consideration of the differences in services provided, fees charged, and costs incurred, as well as competition in the markets serving the different categories of clients.
Based on its review of total expense ratios and fees charged to other Fidelity clients, the Board concluded that the total expense ratio of each class of the fund was reasonable in light of the services that the fund and its shareholders receive and the other factors considered.
Costs of the Services and Profitability. The Board considered the revenues earned and the expenses incurred by Fidelity in conducting the business of developing, marketing, distributing, managing, administering and servicing the fund and servicing the fund's shareholders. The Board also considered the level of Fidelity's profits in respect of all the Fidelity funds.
On an annual basis, Fidelity presents to the Board information about the profitability of its relationships with the fund. Fidelity calculates profitability information for each fund, as well as aggregate profitability information for groups of Fidelity funds and all Fidelity funds, using a series of detailed revenue and cost allocation methodologies which originate with the books and records of Fidelity on which Fidelity's audited financial statements are based. The Audit Committee of the Board reviews any significant changes from the prior year's methodologies and the full Board approves such changes.
PricewaterhouseCoopers LLP (PwC), auditor to Fidelity and certain Fidelity funds, has been engaged annually by the Board as part of the Board's assessment of Fidelity's profitability analysis. PwC's engagement includes the review and assessment of the methodologies used by Fidelity in determining the revenues and expenses attributable to Fidelity's mutual fund business, and completion of agreed-upon procedures in respect of the mathematical accuracy of the fund profitability information and its conformity to established allocation methodologies. After considering PwC's reports issued under the engagement and information provided by Fidelity, the Board concluded that while other allocation methods may also be reasonable, Fidelity's profitability methodologies are reasonable in all material respects.
The Board also reviewed Fidelity's non-fund businesses and potential indirect benefits such businesses may have received as a result of their association with Fidelity's mutual fund business (i.e., fall-out benefits) as well as cases where Fidelity's affiliates may benefit from the funds' business. The Board noted that changes to fall-out benefits year-over-year reflect business developments at Fidelity's various businesses. The Board considered that a joint ad hoc committee created by it and the boards of other Fidelity funds had recently been established, and met periodically, to evaluate potential fall-out benefits (PFOB Committee). The Board noted that the PFOB Committee, among other things: (i) discussed the legal framework surrounding potential fall-out benefits; (ii) reviewed the Board's responsibilities and approach to potential fall-out benefits; and (iii) reviewed practices employed by competitor funds regarding the review of potential fall-out benefits.
The Board considered the costs of the services provided by and the profits realized by Fidelity in connection with the operation of the fund, including the conclusions of the PFOB Committee, and was satisfied that the profitability was not excessive.
Economies of Scale. The Board considered whether there have been economies of scale in respect of the management of the Fidelity funds, whether the Fidelity funds (including the fund) have appropriately benefited from any such economies of scale, and whether there is potential for realization of any further economies of scale. The Board considered the extent to which the fund will benefit from economies of scale as assets grow through increased services to the fund, through waivers or reimbursements, or through fee or expense ratio reductions. The Board also noted that a committee (the Economies of Scale Committee) created by it and the boards of other Fidelity funds periodically analyzes whether Fidelity attains economies of scale in respect of the management and servicing of the Fidelity funds, whether the Fidelity funds have appropriately benefited from such economies of scale, and whether there is potential for realization of any further economies of scale.
The Board recognized that the fund's management contract incorporates a "group fee" structure, which provides for lower group fee rates as total "group assets" increase, and for higher group fee rates as total "group assets" decrease ("group assets" as defined in the management contract). FMR calculates the group fee rates based on a tiered asset "breakpoint" schedule that varies based on asset class. The Board considered that the group fee is designed to deliver the benefits of economies of scale to fund shareholders when total Fidelity fund assets increase, even if assets of any particular fund are unchanged or have declined, because some portion of Fidelity's costs are attributable to services provided to all Fidelity funds, and all funds benefit if those costs can be allocated among more assets. The Board concluded that, given the group fee structure, fund shareholders will benefit from lower management fees as "group assets" increase at the fund complex level, regardless of whether Fidelity achieves any such economies of scale.
The Board concluded, taking into account the analysis of the Economies of Scale Committee, that economies of scale, if any, are being appropriately shared between fund shareholders and Fidelity.
Additional Information Requested by the Board. In order to develop fully the factual basis for consideration of the Fidelity funds' advisory contracts, the Board requested and received additional information on certain topics, including: (i) fund flow and performance trends, in particular the underperformance of certain funds and strategies, and Fidelity's long-term strategies for certain funds; (ii) consideration of performance fees for additional funds; (iii) changes in Fidelity's non-fund businesses and the impact of such changes on the funds; (iv) metrics for evaluating index fund and ETF performance and information about ETF trading characteristics; (v) the methodology with respect to evaluating competitive fund data and peer group classifications and fee comparisons; (vi) the expense structures for different funds and classes; (vii) information regarding other accounts managed by Fidelity, including collective investment trusts and separately managed accounts; and (viii) Fidelity's philosophies and strategies for evaluating funds and classes with lower or declining asset levels.
Based on its evaluation of all of the conclusions noted above, and after considering all factors it believed relevant, the Board concluded that the advisory fee arrangements are fair and reasonable, and that the fund's Advisory Contracts should be renewed.
Liquidity Risk Management Program
The Securities and Exchange Commission adopted Rule 22e-4 under the Investment Company Act of 1940 (the Liquidity Rule) to promote effective liquidity risk management throughout the open-end investment company industry, thereby reducing the risk that funds will be unable to meet their redemption obligations and mitigating dilution of the interests of fund shareholders.
The Fund has adopted and implemented a liquidity risk management program pursuant to the Liquidity Rule (the Program) effective December 1, 2018. The Program is reasonably designed to assess and manage the Fund’s liquidity risk and to comply with the requirements of the Liquidity Rule. The Fund’s Board of Trustees (the Board) has designated the Fund’s investment adviser as administrator of the Program. The Fidelity advisers have established a Liquidity Risk Management Committee (the LRM Committee) to manage the Program for each of the Fidelity Funds. The LRM Committee monitors the adequacy and effectiveness of implementation of the Program and on a periodic basis assesses each Fund’s liquidity risk based on a variety of factors including (1) the Fund’s investment strategy, (2) portfolio liquidity and cash flow projections during normal and reasonably foreseeable stressed conditions, (3) shareholder redemptions, (4) borrowings and other funding sources and (5) in the case of exchange-traded funds, certain additional factors including the effect of the Fund’s prices and spreads, market participants, and basket compositions on the overall liquidity of the Fund’s portfolio, as applicable.
In accordance with the Program, each of the Fund’s portfolio investments is classified into one of four liquidity categories described below based on a determination of a reasonable expectation for how long it would take to convert the investment to cash (or sell or dispose of the investment) without significantly changing its market value.
- Highly liquid investments – cash or convertible to cash within three business days or less
- Moderately liquid investments – convertible to cash in three to seven calendar days
- Less liquid investments – can be sold or disposed of, but not settled, within seven calendar days
- Illiquid investments – cannot be sold or disposed of within seven calendar days
Liquidity classification determinations take into account a variety of factors including various market, trading and investment-specific considerations, as well as market depth, and generally utilize analysis from a third-party liquidity metrics service.
The Liquidity Rule places a 15% limit on a fund’s illiquid investments and requires funds that do not primarily hold assets that are highly liquid investments to determine and maintain a minimum percentage of the fund’s net assets to be invested in highly liquid investments (highly liquid investment minimum or HLIM). The Program includes provisions reasonably designed to comply with the 15% limit on illiquid investments and for determining, periodically reviewing and complying with the HLIM requirement as applicable.
At a recent meeting of the Fund’s Board of Trustees, the LRM Committee provided a written report to the Board pertaining to the operation, adequacy, and effectiveness of implementation of the Program for the annual period from December 1, 2018 through November 30, 2019. The report concluded that the Program has been implemented and is operating effectively and is reasonably designed to assess and manage the Fund’s liquidity risk.
Proxy Voting Results
A special meeting of shareholders was held on June 9, 2020. The results of votes taken among shareholders on the proposals before them are reported below. Each vote reported represents one dollar of net asset value held on the record date for the meeting.
PROPOSAL 1
To elect a Board of Trustees.
| | # of
Votes | % of
Votes |
| Dennis J. Dirks |
| Affirmative | 21,597,050,616.024 | 95.502 |
| Withheld | 1,017,240,628.578 | 4.498 |
| TOTAL | 22,614,291,244.601 | 100.000 |
| Donald F. Donahue |
| Affirmative | 21,605,904,576.366 | 95.541 |
| Withheld | 1,008,386,668.235 | 4.459 |
| TOTAL | 22,614,291,244.601 | 100.000 |
| Bettina Doulton |
| Affirmative | 21,645,998,598.109 | 95.718 |
| Withheld | 968,292,646.493 | 4.282 |
| TOTAL | 22,614,291,244.601 | 100.000 |
| Vicki L. Fuller |
| Affirmative | 21,660,928,063.243 | 95.784 |
| Withheld | 953,363,181.358 | 4.216 |
| TOTAL | 22,614,291,244.601 | 100.000 |
| Patricia L. Kampling |
| Affirmative | 21,663,944,422.383 | 95.798 |
| Withheld | 950,346,822.218 | 4.202 |
| TOTAL | 22,614,291,244.601 | 100.000 |
| Alan J. Lacy |
| Affirmative | 21,569,159,491.891 | 95.378 |
| Withheld | 1,045,131,752.710 | 4.622 |
| TOTAL | 22,614,291,244.601 | 100.000 |
| Ned C. Lautenbach |
| Affirmative | 21,469,914,492.101 | 94.940 |
| Withheld | 1,144,376,752.501 | 5.060 |
| TOTAL | 22,614,291,244.601 | 100.000 |
| Robert A. Lawrence |
| Affirmative | 21,583,601,126.100 | 95.442 |
| Withheld | 1,030,690,118.501 | 4.558 |
| TOTAL | 22,614,291,244.601 | 100.000 |
| Joseph Mauriello |
| Affirmative | 21,551,120,396.219 | 95.299 |
| Withheld | 1,063,170,848.382 | 4.701 |
| TOTAL | 22,614,291,244.601 | 100.000 |
| Cornelia M. Small |
| Affirmative | 21,592,890,757.027 | 95.483 |
| Withheld | 1,021,400,487.575 | 4.517 |
| TOTAL | 22,614,291,244.601 | 100.000 |
| Garnett A. Smith |
| Affirmative | 21,519,273,578.917 | 95.158 |
| Withheld | 1,095,017,665.685 | 4.842 |
| TOTAL | 22,614,291,244.601 | 100.000 |
| David M. Thomas |
| Affirmative | 21,574,034,388.063 | 95.400 |
| Withheld | 1,040,256,856.538 | 4.600 |
| TOTAL | 22,614,291,244.601 | 100.000 |
| Susan Tomasky |
| Affirmative | 21,607,546,330.771 | 95.548 |
| Withheld | 1,006,744,913.831 | 4.452 |
| TOTAL | 22,614,291,244.601 | 100.000 |
| Michael E. Wiley |
| Affirmative | 21,549,685,089.255 | 95.292 |
| Withheld | 1,064,606,155.346 | 4.708 |
| TOTAL | 22,614,291,244.601 | 100.000 |
PROPOSAL 2
To convert a fundamental investment policy to a non-fundamental investment policy.
| | # of
Votes | % of
Votes |
| Affirmative | 370,517,913.061 | 81.479 |
| Against | 29,587,350.344 | 6.506 |
| Abstain | 54,632,871.636 | 12.014 |
| Broker Non-Vote | 0.00 | 0.00 |
| TOTAL | 454,738,135.041 | 100.000 |
|
| Proposal 1 reflects trust wide proposal and voting results. |
VIPEM-SANN-0820
1.858138.112
Fidelity® Variable Insurance Products:
Total Market Index Portfolio
Extended Market Index Portfolio
International Index Portfolio
Semi-Annual Report
June 30, 2020
See the inside front cover for important information about access to your fund’s shareholder reports.
Beginning on January 1, 2021, as permitted by regulations adopted by the Securities and Exchange Commission, and if your insurance carrier elects to participate, you may not be receiving paper copies of the Fund’s shareholder reports from the insurance company that offers your variable insurance product unless you specifically request paper copies from your financial professional or the administrator of your variable insurance product. Instead, the reports will be made available on a website, and you will be notified by mail each time a report is posted and provided with a website link to access the report.
If you already elected to receive shareholder reports electronically, you will not be affected by this change and you need not take any action. You may elect to receive shareholder reports and other communications from the Fund electronically, by contacting your financial professional or the administrator of your variable insurance product. If you own a Fidelity-administered variable insurance product, please visit fidelity.com/mailpreferences to make your election or call 1-800-343-3548.
You may elect to receive all future reports in paper free of charge. If you wish to continue receiving paper copies of your shareholder reports, you may contact your financial professional or the administrator of your variable insurance product. If you own a Fidelity-administered variable insurance product, please visit fidelity.com/mailpreferences to make your election or call 1-800-343-3548. Your election to receive reports in paper will apply to all funds available under your variable insurance product.
Contents
To view a fund's proxy voting guidelines and proxy voting record for the 12-month period ended June 30, visit http://www.fidelity.com/proxyvotingresults or visit the Securities and Exchange Commission's (SEC) web site at http://www.sec.gov.
You may also call 1-877-208-0098 to request a free copy of the proxy voting guidelines.
Fidelity® Variable Insurance Products are separate account options which are purchased through a variable insurance contract.
Standard & Poor's, S&P and S&P 500 are registered service marks of The McGraw-Hill Companies, Inc. and have been licensed for use by Fidelity Distributors Corporation.
Other third-party marks appearing herein are the property of their respective owners.
All other marks appearing herein are registered or unregistered trademarks or service marks of FMR LLC or an affiliated company. © 2020 FMR LLC. All rights reserved.
This report and the financial statements contained herein are submitted for the general information of the shareholders of the Funds. This report is not authorized for distribution to prospective investors in the Funds unless preceded or accompanied by an effective prospectus.
A fund files its complete schedule of portfolio holdings with the SEC for the first and third quarters of each fiscal year on Form N-PORT. Forms N-PORT are available on the SEC’s web site at http://www.sec.gov. A fund's Forms N-PORT may be reviewed and copied at the SEC’s Public Reference Room in Washington, DC. Information regarding the operation of the SEC's Public Reference Room may be obtained by calling 1-800-SEC-0330.
For a complete list of a fund's portfolio holdings, view the most recent holdings listing, semiannual report, or annual report on Fidelity's web site at http://www.fidelity.com, http://www.institutional.fidelity.com, or http://www.401k.com, as applicable.
NOT FDIC INSURED •MAY LOSE VALUE •NO BANK GUARANTEE
Neither the Funds nor Fidelity Distributors Corporation is a bank.
Note to Shareholders:
Early in 2020, the outbreak and spread of a new coronavirus emerged as a public health emergency that had a major influence on financial markets, primarily based on its impact on the global economy and the outlook for corporate earnings. The virus causes a respiratory disease known as COVID-19. On March 11, the World Health Organization declared the COVID-19 outbreak a pandemic, citing sustained risk of further global spread.
In the weeks following, as the crisis worsened, we witnessed an escalating human tragedy with wide-scale social and economic consequences from coronavirus-containment measures. The outbreak of COVID-19 prompted a number of measures to limit the spread, including travel and border restrictions, quarantines, and restrictions on large gatherings. In turn, these resulted in lower consumer activity, diminished demand for a wide range of products and services, disruption in manufacturing and supply chains, and – given the wide variability in outcomes regarding the outbreak – significant market uncertainty and volatility. Amid the turmoil, the U.S. government took unprecedented action – in concert with the U.S. Federal Reserve and central banks around the world – to help support consumers, businesses, and the broader economy, and to limit disruption to the financial system.
The situation continues to unfold, and the extent and duration of its impact on financial markets and the economy remain highly uncertain. Extreme events such as the coronavirus crisis are “exogenous shocks” that can have significant adverse effects on mutual funds and their investments. Although multiple asset classes may be affected by market disruption, the duration and impact may not be the same for all types of assets.
Fidelity is committed to helping you stay informed amid news about COVID-19 and during increased market volatility, and we’re taking extra steps to be responsive to customer needs. We encourage you to visit our websites, where we offer ongoing updates, commentary, and analysis on the markets and our funds.
VIP Total Market Index Portfolio
Investment Summary (Unaudited)
Top Ten Stocks as of June 30, 2020
| | % of fund's net assets |
| Microsoft Corp. | 4.9 |
| Apple, Inc. | 4.8 |
| Amazon.com, Inc. | 3.7 |
| Facebook, Inc. Class A | 1.7 |
| Alphabet, Inc. Class A | 1.4 |
| Alphabet, Inc. Class C | 1.3 |
| Johnson & Johnson | 1.2 |
| Berkshire Hathaway, Inc. Class B | 1.1 |
| Visa, Inc. Class A | 1.0 |
| Procter & Gamble Co. | 0.9 |
| | 22.0 |
Top Market Sectors as of June 30, 2020
| | % of fund's net assets |
| Information Technology | 25.7 |
| Health Care | 14.3 |
| Consumer Discretionary | 10.9 |
| Financials | 10.2 |
| Communication Services | 9.6 |
| Industrials | 8.3 |
| Consumer Staples | 6.1 |
| Real Estate | 3.5 |
| Utilities | 2.9 |
| Materials | 2.6 |
Asset Allocation (% of fund's net assets)
| As of June 30, 2020* |
| | Stocks and Equity Futures | 100.1% |
| | Short-Term Investments and Net Other Assets (Liabilities)** | (0.1)% |

* Foreign investments - 3.3%
** Short-Term Investments and Net Other Assets (Liabilities) are not included in the pie chart
VIP Total Market Index Portfolio
Schedule of Investments June 30, 2020 (Unaudited)
Showing Percentage of Net Assets
| Common Stocks - 96.6% | | | |
| | | Shares | Value |
| COMMUNICATION SERVICES - 9.6% | | | |
| Diversified Telecommunication Services - 1.6% | | | |
| AT&T, Inc. | | 41,766 | $1,262,586 |
| ATN International, Inc. | | 60 | 3,634 |
| Bandwidth, Inc. (a)(b) | | 116 | 14,732 |
| CenturyLink, Inc. | | 5,815 | 58,324 |
| Cincinnati Bell, Inc. (a) | | 298 | 4,425 |
| Cogent Communications Group, Inc. | | 236 | 18,257 |
| Consolidated Communications Holdings, Inc. (a) | | 465 | 3,148 |
| GCI Liberty, Inc. (a) | | 566 | 40,254 |
| Iridium Communications, Inc. (a) | | 561 | 14,272 |
| Liberty Global PLC: | | | |
| Class A (a) | | 819 | 17,903 |
| Class C (a) | | 2,467 | 53,065 |
| Liberty Latin America Ltd.: | | | |
| Class A (a) | | 578 | 5,618 |
| Class C (a) | | 466 | 4,399 |
| ORBCOMM, Inc. (a) | | 369 | 1,421 |
| PDVWireless, Inc. (a) | | 69 | 3,128 |
| Verizon Communications, Inc. | | 24,208 | 1,334,587 |
| Vonage Holdings Corp. (a)(b) | | 1,308 | 13,158 |
| | | | 2,852,911 |
| Entertainment - 1.8% | | | |
| Activision Blizzard, Inc. | | 4,479 | 339,956 |
| AMC Entertainment Holdings, Inc. Class A (b) | | 313 | 1,343 |
| Cinemark Holdings, Inc. (b) | | 599 | 6,918 |
| Electronic Arts, Inc. (a) | | 1,703 | 224,881 |
| Glu Mobile, Inc. (a) | | 966 | 8,955 |
| Lions Gate Entertainment Corp.: | | | |
| Class A (a)(b) | | 517 | 3,831 |
| Class B (a) | | 422 | 2,882 |
| Live Nation Entertainment, Inc. (a) | | 811 | 35,952 |
| Madison Square Garden Entertainment Corp. (a) | | 93 | 6,975 |
| Marcus Corp. | | 132 | 1,752 |
| Netflix, Inc. (a) | | 2,578 | 1,173,093 |
| Roku, Inc. Class A (a)(b) | | 536 | 62,460 |
| Rosetta Stone, Inc. (a) | | 154 | 2,596 |
| Sciplay Corp. (A Shares) (a) | | 97 | 1,439 |
| Take-Two Interactive Software, Inc. (a) | | 663 | 92,535 |
| The Madison Square Garden Co. (a) | | 108 | 15,864 |
| The Walt Disney Co. | | 10,595 | 1,181,448 |
| World Wrestling Entertainment, Inc. Class A | | 269 | 11,688 |
| Zynga, Inc. (a) | | 5,626 | 53,672 |
| | | | 3,228,240 |
| Interactive Media & Services - 4.7% | | | |
| Alphabet, Inc.: | | | |
| Class A (a) | | 1,745 | 2,474,497 |
| Class C (a) | | 1,726 | 2,439,891 |
| ANGI Homeservices, Inc. Class A (a)(b) | | 396 | 4,811 |
| CarGurus, Inc. Class A (a) | | 403 | 10,216 |
| Cars.com, Inc. (a) | | 357 | 2,056 |
| Eventbrite, Inc. (a) | | 205 | 1,757 |
| EverQuote, Inc. Class A (a) | | 60 | 3,490 |
| Facebook, Inc. Class A (a) | | 14,094 | 3,200,325 |
| IAC/InterActiveCorp (a) | | 426 | 137,768 |
| Liberty TripAdvisor Holdings, Inc. (a) | | 472 | 1,005 |
| Match Group, Inc. (a)(b) | | 344 | 36,825 |
| MeetMe, Inc. (a) | | 423 | 2,640 |
| Pinterest, Inc. Class A (a)(b) | | 635 | 14,078 |
| QuinStreet, Inc. (a) | | 260 | 2,720 |
| Snap, Inc. Class A (a)(b) | | 4,837 | 113,621 |
| TripAdvisor, Inc. | | 611 | 11,615 |
| TrueCar, Inc. (a) | | 447 | 1,153 |
| Twitter, Inc. (a) | | 4,569 | 136,111 |
| Yelp, Inc. (a) | | 361 | 8,350 |
| Zillow Group, Inc.: | | | |
| Class A (a) | | 257 | 14,772 |
| Class C (a)(b) | | 781 | 44,993 |
| | | | 8,662,694 |
| Media - 1.3% | | | |
| Altice U.S.A., Inc. Class A (a) | | 1,634 | 36,830 |
| AMC Networks, Inc. Class A (a) | | 240 | 5,614 |
| Cable One, Inc. | | 31 | 55,020 |
| Cardlytics, Inc. (a) | | 112 | 7,838 |
| Central European Media Enterprises Ltd. Class A (a) | | 507 | 1,795 |
| Charter Communications, Inc. Class A (a) | | 879 | 448,325 |
| Clear Channel Outdoor Holdings, Inc. (a) | | 2,016 | 2,097 |
| Comcast Corp. Class A | | 26,691 | 1,040,415 |
| comScore, Inc. (a) | | 171 | 530 |
| Cumulus Media, Inc. (a) | | 82 | 324 |
| Discovery Communications, Inc.: | | | |
| Class A (a)(b) | | 1,022 | 21,564 |
| Class C (non-vtg.) (a) | | 1,757 | 33,840 |
| DISH Network Corp. Class A (a) | | 1,540 | 53,145 |
| E.W. Scripps Co. Class A | | 311 | 2,721 |
| Entercom Communications Corp. Class A (b) | | 662 | 914 |
| Fox Corp.: | | | |
| Class A | | 1,922 | 51,548 |
| Class B | | 1,023 | 27,457 |
| Gannett Co., Inc. (b) | | 697 | 962 |
| Gray Television, Inc. (a) | | 482 | 6,724 |
| Interpublic Group of Companies, Inc. | | 2,366 | 40,601 |
| John Wiley & Sons, Inc. Class A | | 256 | 9,984 |
| Liberty Broadband Corp.: | | | |
| Class A (a) | | 185 | 22,605 |
| Class C (a) | | 852 | 105,614 |
| Liberty Media Corp.: | | | |
| Liberty Braves Class A (a) | | 90 | 1,807 |
| Liberty Braves Class C (a) | | 158 | 3,119 |
| Liberty Formula One Group Series C (a) | | 1,070 | 33,930 |
| Liberty Media Class A (a) | | 269 | 7,849 |
| Liberty SiriusXM Series A (a) | | 523 | 18,054 |
| Liberty SiriusXM Series C (a) | | 980 | 33,761 |
| Loral Space & Communications Ltd. | | 65 | 1,269 |
| Meredith Corp. (b) | | 239 | 3,477 |
| MSG Network, Inc. Class A (a)(b) | | 265 | 2,637 |
| National CineMedia, Inc. (b) | | 349 | 1,037 |
| News Corp.: | | | |
| Class A | | 2,162 | 25,641 |
| Class B | | 911 | 10,886 |
| Nexstar Broadcasting Group, Inc. Class A | | 261 | 21,843 |
| Omnicom Group, Inc. | | 1,298 | 70,871 |
| Scholastic Corp. | | 175 | 5,240 |
| Sinclair Broadcast Group, Inc. Class A (b) | | 378 | 6,978 |
| Sirius XM Holdings, Inc. | | 8,138 | 47,770 |
| TechTarget, Inc. (a) | | 125 | 3,754 |
| Tegna, Inc. | | 1,215 | 13,535 |
| The New York Times Co. Class A (b) | | 815 | 34,254 |
| ViacomCBS, Inc. Class B | | 3,197 | 74,554 |
| WideOpenWest, Inc. (a) | | 125 | 659 |
| | | | 2,399,392 |
| Wireless Telecommunication Services - 0.2% | | | |
| Boingo Wireless, Inc. (a)(b) | | 254 | 3,383 |
| Gogo, Inc. (a)(b) | | 293 | 926 |
| NII Holdings, Inc. (a)(c) | | 363 | 788 |
| Shenandoah Telecommunications Co. | | 264 | 13,013 |
| T-Mobile U.S., Inc. | | 3,339 | 347,757 |
| T-Mobile U.S., Inc. rights 7/28/20 (a) | | 113 | 19 |
| Telephone & Data Systems, Inc. | | 542 | 10,775 |
| U.S. Cellular Corp. (a) | | 93 | 2,871 |
| | | | 379,532 |
|
| TOTAL COMMUNICATION SERVICES | | | 17,522,769 |
|
| CONSUMER DISCRETIONARY - 10.9% | | | |
| Auto Components - 0.2% | | | |
| Adient PLC (a) | | 479 | 7,865 |
| American Axle & Manufacturing Holdings, Inc. (a) | | 577 | 4,385 |
| Aptiv PLC | | 1,570 | 122,334 |
| Autoliv, Inc. | | 446 | 28,771 |
| BorgWarner, Inc. | | 1,260 | 44,478 |
| Cooper Tire & Rubber Co. | | 281 | 7,758 |
| Cooper-Standard Holding, Inc. (a) | | 75 | 994 |
| Dana, Inc. | | 823 | 10,032 |
| Delphi Technologies PLC (a) | | 470 | 6,679 |
| Dorman Products, Inc. (a)(b) | | 166 | 11,134 |
| Fox Factory Holding Corp. (a) | | 218 | 18,009 |
| Garrett Motion, Inc. (a) | | 455 | 2,521 |
| Gentex Corp. | | 1,437 | 37,031 |
| Gentherm, Inc. (a) | | 193 | 7,508 |
| LCI Industries | | 143 | 16,442 |
| Lear Corp. | | 314 | 34,232 |
| Modine Manufacturing Co. (a) | | 291 | 1,606 |
| Motorcar Parts of America, Inc. (a)(b) | | 103 | 1,820 |
| Standard Motor Products, Inc. | | 111 | 4,573 |
| Stoneridge, Inc. (a) | | 160 | 3,306 |
| Tenneco, Inc. (a)(b) | | 284 | 2,147 |
| The Goodyear Tire & Rubber Co. | | 1,295 | 11,584 |
| Veoneer, Inc. (a)(b) | | 574 | 6,136 |
| Visteon Corp. (a)(b) | | 155 | 10,618 |
| Workhorse Group, Inc. (a)(b) | | 301 | 5,234 |
| | | | 407,197 |
| Automobiles - 0.7% | | | |
| Ford Motor Co. | | 22,986 | 139,755 |
| General Motors Co. | | 7,368 | 186,410 |
| Harley-Davidson, Inc. | | 912 | 21,678 |
| Tesla, Inc. (a)(b) | | 858 | 926,477 |
| Thor Industries, Inc. (b) | | 339 | 36,114 |
| Winnebago Industries, Inc. | | 191 | 12,724 |
| | | | 1,323,158 |
| Distributors - 0.1% | | | |
| Core-Mark Holding Co., Inc. | | 294 | 7,337 |
| Funko, Inc. (a) | | 54 | 313 |
| Genuine Parts Co. | | 851 | 74,003 |
| LKQ Corp. (a) | | 1,754 | 45,955 |
| Pool Corp. | | 231 | 62,802 |
| | | | 190,410 |
| Diversified Consumer Services - 0.2% | | | |
| Adtalem Global Education, Inc. (a) | | 300 | 9,345 |
| American Public Education, Inc. (a) | | 50 | 1,480 |
| Bright Horizons Family Solutions, Inc. (a) | | 343 | 40,200 |
| Career Education Corp. (a) | | 372 | 5,926 |
| Carriage Services, Inc. | | 98 | 1,776 |
| Chegg, Inc. (a) | | 697 | 46,880 |
| Collectors Universe, Inc. | | 41 | 1,405 |
| Frontdoor, Inc. (a) | | 544 | 24,116 |
| Graham Holdings Co. | | 25 | 8,567 |
| Grand Canyon Education, Inc. (a) | | 293 | 26,525 |
| H&R Block, Inc. | | 1,167 | 16,665 |
| Houghton Mifflin Harcourt Co. (a) | | 618 | 1,119 |
| K12, Inc. (a)(b) | | 194 | 5,285 |
| Laureate Education, Inc. Class A (a) | | 619 | 6,168 |
| OneSpaWorld Holdings Ltd. (b) | | 183 | 873 |
| Regis Corp. (a)(b) | | 157 | 1,284 |
| Select Interior Concepts, Inc. (a) | | 123 | 431 |
| Service Corp. International | | 1,084 | 42,157 |
| ServiceMaster Global Holdings, Inc. (a) | | 774 | 27,624 |
| Strategic Education, Inc. | | 124 | 19,053 |
| Weight Watchers International, Inc. (a) | | 263 | 6,675 |
| | | | 293,554 |
| Hotels, Restaurants & Leisure - 1.6% | | | |
| ARAMARK Holdings Corp. | | 1,433 | 32,343 |
| Biglari Holdings, Inc. (a) | | 9 | 621 |
| BJ's Restaurants, Inc. | | 99 | 2,073 |
| Bloomin' Brands, Inc. (b) | | 486 | 5,181 |
| Boyd Gaming Corp. | | 462 | 9,656 |
| Brinker International, Inc. | | 221 | 5,304 |
| Caesars Entertainment Corp. (a) | | 3,151 | 38,222 |
| Carnival Corp. (b) | | 2,766 | 45,418 |
| Carrols Restaurant Group, Inc. (a)(b) | | 157 | 760 |
| Chipotle Mexican Grill, Inc. (a) | | 151 | 158,906 |
| Choice Hotels International, Inc. | | 180 | 14,202 |
| Churchill Downs, Inc. | | 204 | 27,163 |
| Chuy's Holdings, Inc. (a) | | 77 | 1,146 |
| Cracker Barrel Old Country Store, Inc. | | 135 | 14,973 |
| Darden Restaurants, Inc. | | 760 | 57,585 |
| Dave & Buster's Entertainment, Inc. (b) | | 360 | 4,799 |
| Del Taco Restaurants, Inc. (a) | | 134 | 795 |
| Denny's Corp. (a)(b) | | 340 | 3,434 |
| Dine Brands Global, Inc. | | 94 | 3,957 |
| Domino's Pizza, Inc. | | 227 | 83,863 |
| Drive Shack, Inc. (a) | | 474 | 877 |
| Dunkin' Brands Group, Inc. | | 488 | 31,832 |
| El Pollo Loco Holdings, Inc. (a)(b) | | 141 | 2,081 |
| Eldorado Resorts, Inc. (a)(b) | | 488 | 19,549 |
| Everi Holdings, Inc. (a)(b) | | 444 | 2,291 |
| Extended Stay America, Inc. unit | | 1,256 | 14,055 |
| Fiesta Restaurant Group, Inc. (a) | | 169 | 1,078 |
| Golden Entertainment, Inc. (a) | | 91 | 812 |
| Hilton Grand Vacations, Inc. (a) | | 483 | 9,443 |
| Hilton Worldwide Holdings, Inc. | | 1,632 | 119,870 |
| Hyatt Hotels Corp. Class A | | 207 | 10,410 |
| Jack in the Box, Inc. (b) | | 135 | 10,002 |
| Las Vegas Sands Corp. | | 1,997 | 90,943 |
| Lindblad Expeditions Holdings (a) | | 126 | 973 |
| Marriott International, Inc. Class A | | 1,598 | 136,997 |
| Marriott Vacations Worldwide Corp. | | 212 | 17,429 |
| McDonald's Corp. | | 4,362 | 804,658 |
| MGM Mirage, Inc. | | 2,906 | 48,821 |
| Monarch Casino & Resort, Inc. (a) | | 73 | 2,488 |
| Noodles & Co. (a) | | 147 | 889 |
| Norwegian Cruise Line Holdings Ltd. (a)(b) | | 1,452 | 23,856 |
| Papa John's International, Inc. | | 120 | 9,529 |
| Penn National Gaming, Inc. (a) | | 734 | 22,416 |
| Planet Fitness, Inc. (a) | | 463 | 28,044 |
| Playa Hotels & Resorts NV (a)(b) | | 349 | 1,263 |
| PlayAGS, Inc. (a) | | 179 | 605 |
| Red Robin Gourmet Burgers, Inc. (a) | | 84 | 857 |
| Red Rock Resorts, Inc. | | 399 | 4,353 |
| Royal Caribbean Cruises Ltd. (b) | | 975 | 49,043 |
| Ruth's Hospitality Group, Inc. | | 153 | 1,248 |
| Scientific Games Corp. Class A (a)(b) | | 325 | 5,025 |
| SeaWorld Entertainment, Inc. (a)(b) | | 227 | 3,362 |
| Shake Shack, Inc. Class A (a)(b) | | 237 | 12,556 |
| Six Flags Entertainment Corp. | | 445 | 8,548 |
| Starbucks Corp. | | 6,859 | 504,754 |
| Texas Roadhouse, Inc. Class A | | 370 | 19,451 |
| The Cheesecake Factory, Inc. (b) | | 241 | 5,524 |
| Twin River Worldwide Holdings, Inc. | | 127 | 2,831 |
| Vail Resorts, Inc. | | 240 | 43,716 |
| Wendy's Co.�� | | 1,034 | 22,521 |
| Wingstop, Inc. | | 169 | 23,486 |
| Wyndham Destinations, Inc. | | 512 | 14,428 |
| Wyndham Hotels & Resorts, Inc. | | 540 | 23,015 |
| Wynn Resorts Ltd. | | 582 | 43,353 |
| Yum! Brands, Inc. | | 1,779 | 154,613 |
| | | | 2,864,296 |
| Household Durables - 0.4% | | | |
| Beazer Homes U.S.A., Inc. (a) | | 145 | 1,460 |
| Cavco Industries, Inc. (a) | | 48 | 9,257 |
| Century Communities, Inc. (a)(b) | | 170 | 5,212 |
| D.R. Horton, Inc. | | 1,935 | 107,296 |
| Ethan Allen Interiors, Inc. | | 165 | 1,952 |
| Garmin Ltd. | | 856 | 83,460 |
| GoPro, Inc. Class A (a)(b) | | 725 | 3,451 |
| Helen of Troy Ltd. (a) | | 158 | 29,792 |
| Hooker Furniture Corp. | | 58 | 1,128 |
| Installed Building Products, Inc. (a) | | 127 | 8,735 |
| iRobot Corp. (a)(b) | | 165 | 13,844 |
| KB Home | | 569 | 17,457 |
| La-Z-Boy, Inc. | | 273 | 7,387 |
| Leggett & Platt, Inc. | | 751 | 26,398 |
| Lennar Corp.: | | | |
| Class A | | 1,447 | 89,164 |
| Class B | | 315 | 14,518 |
| LGI Homes, Inc. (a)(b) | | 146 | 12,852 |
| Lovesac (a) | | 35 | 918 |
| M.D.C. Holdings, Inc. | | 289 | 10,317 |
| M/I Homes, Inc. (a) | | 168 | 5,786 |
| Meritage Homes Corp. (a) | | 203 | 15,452 |
| Mohawk Industries, Inc. (a) | | 342 | 34,802 |
| Newell Brands, Inc. | | 2,203 | 34,984 |
| NVR, Inc. (a) | | 20 | 65,175 |
| PulteGroup, Inc. | | 1,542 | 52,474 |
| Skyline Champion Corp. (a) | | 281 | 6,840 |
| Sonos, Inc. (a) | | 360 | 5,267 |
| Taylor Morrison Home Corp. (a) | | 748 | 14,429 |
| Tempur Sealy International, Inc. (a) | | 257 | 18,491 |
| Toll Brothers, Inc. | | 683 | 22,259 |
| TopBuild Corp. (a) | | 191 | 21,730 |
| TRI Pointe Homes, Inc. (a) | | 807 | 11,855 |
| Tupperware Brands Corp. (b) | | 271 | 1,287 |
| Turtle Beach Corp. (a) | | 50 | 736 |
| Universal Electronics, Inc. (a) | | 89 | 4,167 |
| Whirlpool Corp. | | 365 | 47,278 |
| Zagg, Inc. (a)(b) | | 132 | 414 |
| | | | 808,024 |
| Internet & Direct Marketing Retail - 4.2% | | | |
| 1-800-FLOWERS.com, Inc. Class A (a)(b) | | 123 | 2,462 |
| Amazon.com, Inc. (a) | | 2,455 | 6,772,903 |
| Chewy, Inc. (b) | | 302 | 13,496 |
| Duluth Holdings, Inc. (a) | | 23 | 170 |
| eBay, Inc. | | 3,880 | 203,506 |
| Etsy, Inc. (a) | | 710 | 75,423 |
| Expedia, Inc. | | 798 | 65,596 |
| Groupon, Inc. (a)(b) | | 138 | 2,501 |
| GrubHub, Inc. (a) | | 567 | 39,860 |
| Lands' End, Inc. (a) | | 91 | 732 |
| Liberty Interactive Corp. QVC Group Series A (a) | | 2,189 | 20,796 |
| Overstock.com, Inc. (a)(b) | | 209 | 5,942 |
| PetMed Express, Inc. (b) | | 125 | 4,455 |
| Quotient Technology, Inc. (a) | | 413 | 3,023 |
| Revolve Group, Inc. | | 76 | 1,129 |
| Shutterstock, Inc. | | 105 | 3,672 |
| Stamps.com, Inc. (a) | | 98 | 18,002 |
| Stitch Fix, Inc. (a)(b) | | 137 | 3,417 |
| The Booking Holdings, Inc. (a) | | 241 | 383,754 |
| The RealReal, Inc. | | 87 | 1,113 |
| The Rubicon Project, Inc. (a) | | 537 | 3,582 |
| Wayfair LLC Class A (a)(b) | | 398 | 78,649 |
| | | | 7,704,183 |
| Leisure Products - 0.1% | | | |
| Acushnet Holdings Corp. | | 211 | 7,341 |
| Brunswick Corp. | | 468 | 29,957 |
| Callaway Golf Co. | | 530 | 9,280 |
| Clarus Corp. | | 89 | 1,031 |
| Hasbro, Inc. | | 747 | 55,988 |
| Johnson Outdoors, Inc. Class A | | 38 | 3,459 |
| Malibu Boats, Inc. Class A (a) | | 116 | 6,026 |
| Mattel, Inc. (a)(b) | | 1,965 | 19,002 |
| MCBC Holdings, Inc. (a) | | 87 | 1,657 |
| Polaris, Inc. | | 330 | 30,542 |
| Smith & Wesson Brands, Inc. (a) | | 268 | 5,767 |
| Sturm, Ruger & Co., Inc. | | 97 | 7,372 |
| Vista Outdoor, Inc. (a) | | 373 | 5,390 |
| YETI Holdings, Inc. (a)(b) | | 438 | 18,716 |
| | | | 201,528 |
| Multiline Retail - 0.5% | | | |
| Big Lots, Inc. (b) | | 218 | 9,156 |
| Dillard's, Inc. Class A | | 56 | 1,444 |
| Dollar General Corp. | | 1,468 | 279,669 |
| Dollar Tree, Inc. (a) | | 1,384 | 128,269 |
| Kohl's Corp. | | 887 | 18,423 |
| Macy's, Inc. (b) | | 1,753 | 12,061 |
| Nordstrom, Inc. (b) | | 602 | 9,325 |
| Ollie's Bargain Outlet Holdings, Inc. (a) | | 340 | 33,201 |
| Target Corp. | | 2,929 | 351,275 |
| | | | 842,823 |
| Specialty Retail - 2.2% | | | |
| Aaron's, Inc. Class A | | 384 | 17,434 |
| Abercrombie & Fitch Co. Class A (b) | | 335 | 3,564 |
| Advance Auto Parts, Inc. | | 411 | 58,547 |
| America's Car Mart, Inc. (a) | | 36 | 3,163 |
| American Eagle Outfitters, Inc. | | 898 | 9,788 |
| Asbury Automotive Group, Inc. (a) | | 112 | 8,661 |
| At Home Group, Inc. (a)(b) | | 271 | 1,759 |
| AutoNation, Inc. (a) | | 325 | 12,214 |
| AutoZone, Inc. (a) | | 137 | 154,552 |
| Barnes & Noble Education, Inc. (a) | | 142 | 227 |
| Bed Bath & Beyond, Inc. (b) | | 717 | 7,600 |
| Best Buy Co., Inc. | | 1,340 | 116,942 |
| Boot Barn Holdings, Inc. (a)(b) | | 174 | 3,751 |
| Burlington Stores, Inc. (a) | | 392 | 77,197 |
| Caleres, Inc. | | 215 | 1,793 |
| Camping World Holdings, Inc. (b) | | 214 | 5,812 |
| CarMax, Inc. (a)(b) | | 974 | 87,222 |
| Carvana Co. Class A (a)(b) | | 322 | 38,704 |
| Chico's FAS, Inc. | | 634 | 875 |
| Citi Trends, Inc. | | 43 | 869 |
| Conn's, Inc. (a)(b) | | 140 | 1,413 |
| Dick's Sporting Goods, Inc. | | 430 | 17,742 |
| DSW, Inc. Class A (b) | | 284 | 1,923 |
| Express, Inc. (a)(b) | | 301 | 464 |
| Five Below, Inc. (a) | | 345 | 36,884 |
| Floor & Decor Holdings, Inc. Class A (a) | | 447 | 25,770 |
| Foot Locker, Inc. | | 601 | 17,525 |
| GameStop Corp. Class A (a)(b) | | 448 | 1,944 |
| Gap, Inc. | | 1,183 | 14,929 |
| Genesco, Inc. (a) | | 81 | 1,754 |
| Group 1 Automotive, Inc. | | 97 | 6,399 |
| Guess?, Inc. (b) | | 242 | 2,340 |
| Haverty Furniture Companies, Inc. | | 126 | 2,016 |
| Hibbett Sports, Inc. (a) | | 99 | 2,073 |
| L Brands, Inc. | | 1,322 | 19,790 |
| Lithia Motors, Inc. Class A (sub. vtg.) | | 131 | 19,824 |
| Lowe's Companies, Inc. | | 4,422 | 597,501 |
| Lumber Liquidators Holdings, Inc. (a)(b) | | 132 | 1,830 |
| MarineMax, Inc. (a) | | 123 | 2,754 |
| Michaels Companies, Inc. (a)(b) | | 468 | 3,309 |
| Monro, Inc. (b) | | 185 | 10,164 |
| Murphy U.S.A., Inc. (a) | | 164 | 18,465 |
| National Vision Holdings, Inc. (a)(b) | | 445 | 13,581 |
| O'Reilly Automotive, Inc. (a) | | 435 | 183,426 |
| Office Depot, Inc. | | 2,983 | 7,010 |
| Party City Holdco, Inc. (a)(b) | | 234 | 349 |
| Penske Automotive Group, Inc. (b) | | 186 | 7,200 |
| Rent-A-Center, Inc. | | 277 | 7,706 |
| RH (a) | | 105 | 26,135 |
| Ross Stores, Inc. | | 2,084 | 177,640 |
| Sally Beauty Holdings, Inc. (a) | | 684 | 8,571 |
| Shoe Carnival, Inc. | | 52 | 1,522 |
| Signet Jewelers Ltd. (b) | | 313 | 3,215 |
| Sleep Number Corp. (a)(b) | | 156 | 6,496 |
| Sonic Automotive, Inc. Class A (sub. vtg.) (b) | | 150 | 4,787 |
| Sportsman's Warehouse Holdings, Inc. (a) | | 280 | 3,990 |
| Tailored Brands, Inc. (b) | | 207 | 194 |
| The Buckle, Inc. (b) | | 170 | 2,666 |
| The Cato Corp. Class A (sub. vtg.) | | 98 | 802 |
| The Children's Place Retail Stores, Inc. | | 84 | 3,143 |
| The Home Depot, Inc. | | 6,298 | 1,577,712 |
| Tiffany & Co., Inc. | | 628 | 76,578 |
| Tilly's, Inc. | | 106 | 601 |
| TJX Companies, Inc. | | 7,023 | 355,083 |
| Tractor Supply Co. | | 672 | 88,563 |
| Ulta Beauty, Inc. (a) | | 337 | 68,553 |
| Urban Outfitters, Inc. (a)(b) | | 392 | 5,966 |
| Williams-Sonoma, Inc. | | 476 | 39,037 |
| Winmark Corp. | | 13 | 2,226 |
| Zumiez, Inc. (a) | | 106 | 2,902 |
| | | | 4,093,141 |
| Textiles, Apparel & Luxury Goods - 0.7% | | | |
| Capri Holdings Ltd. (a) | | 842 | 13,160 |
| Carter's, Inc. | | 259 | 20,901 |
| Columbia Sportswear Co. (b) | | 168 | 13,537 |
| Crocs, Inc. (a) | | 397 | 14,618 |
| Deckers Outdoor Corp. (a) | | 174 | 34,172 |
| Fossil Group, Inc. (a)(b) | | 213 | 990 |
| G-III Apparel Group Ltd. (a)(b) | | 247 | 3,283 |
| Hanesbrands, Inc. | | 2,048 | 23,122 |
| Kontoor Brands, Inc. | | 265 | 4,720 |
| Levi Strauss & Co. Class A (b) | | 235 | 3,149 |
| lululemon athletica, Inc. (a) | | 671 | 209,359 |
| Movado Group, Inc. | | 67 | 726 |
| NIKE, Inc. Class B | | 7,259 | 711,745 |
| Oxford Industries, Inc. | | 92 | 4,049 |
| PVH Corp. | | 420 | 20,181 |
| Ralph Lauren Corp. | | 282 | 20,451 |
| Rocky Brands, Inc. | | 37 | 761 |
| Samsonite International SA (d) | | 8,100 | 8,152 |
| Skechers U.S.A., Inc. Class A (sub. vtg.) (a) | | 756 | 23,723 |
| Steven Madden Ltd. | | 442 | 10,913 |
| Tapestry, Inc. | | 1,593 | 21,155 |
| Under Armour, Inc.: | | | |
| Class A (sub. vtg.) (a) | | 1,133 | 11,035 |
| Class C (non-vtg.) (a) | | 1,035 | 9,149 |
| Unifi, Inc. (a) | | 101 | 1,301 |
| Vera Bradley, Inc. (a) | | 105 | 466 |
| VF Corp. | | 1,876 | 114,323 |
| Wolverine World Wide, Inc. | | 457 | 10,881 |
| | | | 1,310,022 |
|
| TOTAL CONSUMER DISCRETIONARY | | | 20,038,336 |
|
| CONSUMER STAPLES - 6.1% | | | |
| Beverages - 1.4% | | | |
| Boston Beer Co., Inc. Class A (a) | | 58 | 31,126 |
| Brown-Forman Corp. Class B (non-vtg.) | | 1,070 | 68,116 |
| Coca-Cola Bottling Co. Consolidated | | 28 | 6,417 |
| Constellation Brands, Inc. Class A (sub. vtg.) | | 981 | 171,626 |
| Craft Brew Alliance, Inc. (a) | | 65 | 1,000 |
| Keurig Dr. Pepper, Inc. | | 1,968 | 55,891 |
| MGP Ingredients, Inc. | | 87 | 3,193 |
| Molson Coors Beverage Co. Class B | | 1,117 | 38,380 |
| Monster Beverage Corp. (a) | | 2,193 | 152,019 |
| National Beverage Corp. (a) | | 76 | 4,638 |
| New Age Beverages Corp. (a)(b) | | 451 | 690 |
| PepsiCo, Inc. | | 8,123 | 1,074,348 |
| The Coca-Cola Co. | | 22,658 | 1,012,359 |
| | | | 2,619,803 |
| Food & Staples Retailing - 1.3% | | | |
| Andersons, Inc. | | 188 | 2,587 |
| BJ's Wholesale Club Holdings, Inc. (a) | | 692 | 25,791 |
| Casey's General Stores, Inc. | | 218 | 32,595 |
| Chefs' Warehouse Holdings (a) | | 153 | 2,078 |
| Costco Wholesale Corp. | | 2,581 | 782,585 |
| Grocery Outlet Holding Corp. | | 397 | 16,198 |
| Ingles Markets, Inc. Class A | | 105 | 4,522 |
| Kroger Co. | | 4,594 | 155,507 |
| Performance Food Group Co. (a) | | 770 | 22,438 |
| PriceSmart, Inc. | | 140 | 8,446 |
| Rite Aid Corp. (a)(b) | | 320 | 5,459 |
| SpartanNash Co. | | 212 | 4,505 |
| Sprouts Farmers Market LLC (a) | | 651 | 16,659 |
| Sysco Corp. | | 2,981 | 162,941 |
| U.S. Foods Holding Corp. (a) | | 1,236 | 24,374 |
| United Natural Foods, Inc. (a)(b) | | 237 | 4,316 |
| Walgreens Boots Alliance, Inc. | | 4,307 | 182,574 |
| Walmart, Inc. | | 8,281 | 991,898 |
| Weis Markets, Inc. | | 100 | 5,012 |
| | | | 2,450,485 |
| Food Products - 1.1% | | | |
| Archer Daniels Midland Co. | | 3,264 | 130,234 |
| B&G Foods, Inc. Class A (b) | | 352 | 8,582 |
| Beyond Meat, Inc. (a) | | 63 | 8,441 |
| Bunge Ltd. | | 865 | 35,577 |
| Cal-Maine Foods, Inc. (a) | | 181 | 8,051 |
| Calavo Growers, Inc. | | 92 | 5,788 |
| Campbell Soup Co. | | 987 | 48,985 |
| Conagra Brands, Inc. | | 2,839 | 99,848 |
| Darling Ingredients, Inc. (a) | | 940 | 23,143 |
| Farmer Brothers Co. (a) | | 69 | 506 |
| Flowers Foods, Inc. | | 1,086 | 24,283 |
| Fresh Del Monte Produce, Inc. | | 185 | 4,555 |
| Freshpet, Inc. (a) | | 204 | 17,067 |
| General Mills, Inc. | | 3,517 | 216,823 |
| Hormel Foods Corp. | | 1,612 | 77,811 |
| Hostess Brands, Inc. Class A (a) | | 679 | 8,297 |
| Ingredion, Inc. | | 413 | 34,279 |
| J&J Snack Foods Corp. | | 84 | 10,679 |
| John B. Sanfilippo & Son, Inc. | | 54 | 4,608 |
| Kellogg Co. | | 1,449 | 95,721 |
| Lamb Weston Holdings, Inc. | | 861 | 55,044 |
| Lancaster Colony Corp. | | 114 | 17,669 |
| Landec Corp. (a) | | 164 | 1,305 |
| McCormick & Co., Inc. (non-vtg.) | | 721 | 129,355 |
| Mondelez International, Inc. | | 8,374 | 428,163 |
| Pilgrim's Pride Corp. (a) | | 312 | 5,270 |
| Post Holdings, Inc. (a) | | 387 | 33,909 |
| Sanderson Farms, Inc. | | 112 | 12,980 |
| Seaboard Corp. | | 2 | 5,868 |
| The Hain Celestial Group, Inc. (a) | | 452 | 14,243 |
| The Hershey Co. | | 864 | 111,992 |
| The J.M. Smucker Co. | | 666 | 70,469 |
| The Kraft Heinz Co. | | 3,632 | 115,824 |
| The Simply Good Foods Co. (a) | | 464 | 8,621 |
| Tootsie Roll Industries, Inc. | | 96 | 3,290 |
| TreeHouse Foods, Inc. (a) | | 317 | 13,885 |
| Tyson Foods, Inc. Class A | | 1,724 | 102,940 |
| | | | 1,994,105 |
| Household Products - 1.5% | | | |
| Central Garden & Pet Co. (a) | | 95 | 3,419 |
| Central Garden & Pet Co. Class A (non-vtg.) (a) | | 198 | 6,690 |
| Church & Dwight Co., Inc. | | 1,433 | 110,771 |
| Clorox Co. | | 732 | 160,579 |
| Colgate-Palmolive Co. | | 4,991 | 365,641 |
| Energizer Holdings, Inc. (b) | | 365 | 17,334 |
| Kimberly-Clark Corp. | | 1,996 | 282,135 |
| Procter & Gamble Co. | | 14,494 | 1,733,048 |
| Spectrum Brands Holdings, Inc. | | 247 | 11,337 |
| WD-40 Co. | | 78 | 15,467 |
| | | | 2,706,421 |
| Personal Products - 0.2% | | | |
| Coty, Inc. Class A | | 1,674 | 7,483 |
| Edgewell Personal Care Co. (a) | | 318 | 9,909 |
| elf Beauty, Inc. (a)(b) | | 136 | 2,594 |
| Estee Lauder Companies, Inc. Class A | | 1,324 | 249,812 |
| Herbalife Nutrition Ltd. (a) | | 524 | 23,570 |
| Inter Parfums, Inc. | | 102 | 4,911 |
| LifeVantage Corp. (a) | | 64 | 865 |
| MediFast, Inc. | | 62 | 8,604 |
| Nu Skin Enterprises, Inc. Class A | | 321 | 12,272 |
| USANA Health Sciences, Inc. (a) | | 73 | 5,360 |
| | | | 325,380 |
| Tobacco - 0.6% | | | |
| 22nd Century Group, Inc. (a)(b) | | 530 | 405 |
| Altria Group, Inc. | | 10,891 | 427,472 |
| Philip Morris International, Inc. | | 9,130 | 639,648 |
| Turning Point Brands, Inc. | | 43 | 1,071 |
| Universal Corp. | | 133 | 5,654 |
| Vector Group Ltd. | | 677 | 6,811 |
| | | | 1,081,061 |
|
| TOTAL CONSUMER STAPLES | | | 11,177,255 |
|
| ENERGY - 2.5% | | | |
| Energy Equipment & Services - 0.2% | | | |
| Archrock, Inc. | | 729 | 4,731 |
| Baker Hughes Co. Class A | | 3,843 | 59,144 |
| Cactus, Inc. | | 269 | 5,549 |
| Championx Corp. (a) | | 1,083 | 10,570 |
| Core Laboratories NV (b) | | 252 | 5,121 |
| DMC Global, Inc. | | 84 | 2,318 |
| Dril-Quip, Inc. (a)(b) | | 201 | 5,988 |
| Exterran Corp. (a) | | 193 | 1,040 |
| Forum Energy Technologies, Inc. (a) | | 281 | 148 |
| Frank's International NV (a) | | 595 | 1,327 |
| Halliburton Co. | | 5,247 | 68,106 |
| Helix Energy Solutions Group, Inc. (a) | | 840 | 2,915 |
| Helmerich & Payne, Inc. | | 617 | 12,038 |
| Liberty Oilfield Services, Inc. Class A (b) | | 249 | 1,365 |
| Matrix Service Co. (a) | | 126 | 1,225 |
| Nabors Industries Ltd. | | 40 | 1,481 |
| National Oilwell Varco, Inc. | | 2,404 | 29,449 |
| Newpark Resources, Inc. (a) | | 424 | 946 |
| Nextier Oilfield Solutions, Inc. (a) | | 896 | 2,195 |
| Noble Corp. (a)(b) | | 1,230 | 395 |
| Oceaneering International, Inc. (a) | | 587 | 3,751 |
| Oil States International, Inc. (a) | | 308 | 1,463 |
| Patterson-UTI Energy, Inc. | | 1,081 | 3,751 |
| ProPetro Holding Corp. (a) | | 427 | 2,195 |
| RPC, Inc. | | 224 | 690 |
| Schlumberger Ltd. | | 8,181 | 150,449 |
| SEACOR Holdings, Inc. (a) | | 93 | 2,634 |
| Select Energy Services, Inc. Class A (a) | | 368 | 1,803 |
| Solaris Oilfield Infrastructure, Inc. Class A | | 201 | 1,491 |
| TechnipFMC PLC | | 2,369 | 16,204 |
| Tidewater, Inc. (a) | | 201 | 1,124 |
| Transocean Ltd. (United States) (a)(b) | | 3,266 | 5,977 |
| U.S. Silica Holdings, Inc. (b) | | 356 | 1,285 |
| Valaris PLC Class A (a)(b) | | 1,124 | 733 |
| | | | 409,601 |
| Oil, Gas & Consumable Fuels - 2.3% | | | |
| Antero Resources Corp. (a) | | 959 | 2,436 |
| Apache Corp. | | 2,140 | 28,890 |
| Arch Resources, Inc. | | 81 | 2,301 |
| Ardmore Shipping Corp. | | 189 | 820 |
| Berry Petroleum Corp. | | 229 | 1,106 |
| Bonanza Creek Energy, Inc. (a) | | 131 | 1,941 |
| Brigham Minerals, Inc. Class A | | 173 | 2,137 |
| Cabot Oil & Gas Corp. | | 2,390 | 41,060 |
| California Resources Corp. (a)(b) | | 224 | 273 |
| Callon Petroleum Co. (a) | | 2,280 | 2,622 |
| Centennial Resource Development, Inc. Class A (a) | | 1,190 | 1,059 |
| Cheniere Energy, Inc. (a) | | 1,366 | 66,005 |
| Chevron Corp. | | 10,973 | 979,121 |
| Cimarex Energy Co. | | 584 | 16,054 |
| Clean Energy Fuels Corp. (a) | | 931 | 2,067 |
| CNX Resources Corp. (a) | | 1,015 | 8,780 |
| Concho Resources, Inc. | | 1,148 | 59,122 |
| ConocoPhillips Co. | | 6,350 | 266,827 |
| CONSOL Energy, Inc. (a)(b) | | 113 | 573 |
| Continental Resources, Inc. (b) | | 494 | 8,660 |
| CVR Energy, Inc. | | 176 | 3,539 |
| Delek U.S. Holdings, Inc. | | 422 | 7,347 |
| Denbury Resources, Inc. (a)(b) | | 2,769 | 765 |
| Devon Energy Corp. | | 2,190 | 24,835 |
| Diamond S Shipping, Inc. (a)(b) | | 121 | 967 |
| Diamondback Energy, Inc. | | 926 | 38,725 |
| EOG Resources, Inc. | | 3,408 | 172,649 |
| EQT Corp. | | 1,448 | 17,231 |
| Equitrans Midstream Corp. | | 2,475 | 20,567 |
| Exxon Mobil Corp. | | 24,883 | 1,112,768 |
| Falcon Minerals Corp. | | 216 | 691 |
| Green Plains, Inc. (b) | | 229 | 2,339 |
| Gulfport Energy Corp. (a) | | 962 | 1,049 |
| Hess Corp. | | 1,536 | 79,580 |
| Highpoint Resources, Inc. (a) | | 535 | 158 |
| HollyFrontier Corp. | | 840 | 24,528 |
| International Seaways, Inc. | | 163 | 2,663 |
| Kinder Morgan, Inc. | | 11,397 | 172,892 |
| Kosmos Energy Ltd. | | 2,038 | 3,383 |
| Laredo Petroleum, Inc. (a) | | 49 | 679 |
| Magnolia Oil & Gas Corp. Class A (a) | | 550 | 3,333 |
| Marathon Oil Corp. | | 4,526 | 27,699 |
| Marathon Petroleum Corp. | | 3,807 | 142,306 |
| Matador Resources Co. (a)(b) | | 607 | 5,160 |
| Murphy Oil Corp. (b) | | 845 | 11,661 |
| National Energy Services Reunited Corp. (a)(b) | | 166 | 1,142 |
| Noble Energy, Inc. | | 2,705 | 24,237 |
| Northern Oil & Gas, Inc. (a)(b) | | 1,343 | 1,127 |
| Oasis Petroleum, Inc. (a)(b) | | 1,530 | 1,148 |
| Occidental Petroleum Corp. | | 5,241 | 95,910 |
| ONEOK, Inc. | | 2,577 | 85,608 |
| Ovintiv, Inc. | | 1,472 | 14,058 |
| Par Pacific Holdings, Inc. (a) | | 202 | 1,816 |
| Parsley Energy, Inc. Class A | | 1,748 | 18,669 |
| PBF Energy, Inc. Class A | | 576 | 5,898 |
| PDC Energy, Inc. (a) | | 543 | 6,755 |
| Peabody Energy Corp. | | 395 | 1,138 |
| Penn Virginia Corp. (a) | | 52 | 496 |
| Phillips 66 Co. | | 2,560 | 184,064 |
| Pioneer Natural Resources Co. | | 978 | 95,551 |
| QEP Resources, Inc. | | 1,400 | 1,806 |
| Range Resources Corp. (b) | | 1,090 | 6,137 |
| Renewable Energy Group, Inc. (a)(b) | | 215 | 5,328 |
| Rex American Resources Corp. (a) | | 36 | 2,497 |
| Ring Energy, Inc. (a)(b) | | 284 | 329 |
| SM Energy Co. (b) | | 616 | 2,310 |
| Southwestern Energy Co. (a)(b) | | 2,911 | 7,452 |
| Talos Energy, Inc. (a)(b) | | 140 | 1,288 |
| Targa Resources Corp. | | 1,316 | 26,412 |
| Teekay Corp. (a)(b) | | 419 | 1,006 |
| Teekay Tankers Ltd. (a)(b) | | 134 | 1,718 |
| Tellurian, Inc. (a)(b) | | 579 | 666 |
| The Williams Companies, Inc. | | 7,086 | 134,776 |
| Valero Energy Corp. | | 2,401 | 141,227 |
| W&T Offshore, Inc. (a)(b) | | 640 | 1,459 |
| World Fuel Services Corp. | | 377 | 9,712 |
| WPX Energy, Inc. (a) | | 2,356 | 15,031 |
| | | | 4,266,139 |
|
| TOTAL ENERGY | | | 4,675,740 |
|
| FINANCIALS - 10.2% | | | |
| Banks - 3.6% | | | |
| 1st Source Corp. | | 76 | 2,704 |
| Allegiance Bancshares, Inc. | | 108 | 2,742 |
| Amalgamated Bank | | 109 | 1,378 |
| Ameris Bancorp | | 369 | 8,705 |
| Associated Banc-Corp. | | 904 | 12,367 |
| Atlantic Capital Bancshares, Inc. (a) | | 138 | 1,678 |
| Banc of California, Inc. | | 253 | 2,740 |
| BancFirst Corp. | | 109 | 4,422 |
| Bancorp, Inc., Delaware (a) | | 267 | 2,617 |
| BancorpSouth Bank | | 541 | 12,302 |
| Bank of America Corp. | | 45,827 | 1,088,391 |
| Bank of Hawaii Corp. | | 267 | 16,396 |
| Bank OZK (b) | | 685 | 16,077 |
| BankUnited, Inc. | | 539 | 10,915 |
| Banner Corp. | | 213 | 8,094 |
| Berkshire Hills Bancorp, Inc. | | 240 | 2,645 |
| BOK Financial Corp. | | 180 | 10,159 |
| Boston Private Financial Holdings, Inc. | | 506 | 3,481 |
| Bridge Bancorp, Inc. | | 102 | 2,330 |
| Brookline Bancorp, Inc., Delaware | | 444 | 4,476 |
| Bryn Mawr Bank Corp. | | 112 | 3,098 |
| Byline Bancorp, Inc. | | 129 | 1,690 |
| Cadence Bancorp Class A | | 714 | 6,326 |
| Camden National Corp. | | 85 | 2,936 |
| Carter Bank & Trust | | 123 | 993 |
| Cathay General Bancorp | | 430 | 11,309 |
| Central Pacific Financial Corp. | | 160 | 2,565 |
| CIT Group, Inc. | | 539 | 11,173 |
| Citigroup, Inc. | | 12,257 | 626,333 |
| Citizens Financial Group, Inc. | | 2,490 | 62,848 |
| City Holding Co. | | 91 | 5,930 |
| Columbia Banking Systems, Inc. | | 407 | 11,536 |
| Comerica, Inc. | | 827 | 31,509 |
| Commerce Bancshares, Inc. | | 584 | 34,730 |
| Community Bank System, Inc. | | 317 | 18,075 |
| Community Trust Bancorp, Inc. | | 92 | 3,014 |
| ConnectOne Bancorp, Inc. | | 190 | 3,063 |
| Cullen/Frost Bankers, Inc. | | 323 | 24,131 |
| Customers Bancorp, Inc. (a) | | 177 | 2,128 |
| CVB Financial Corp. | | 752 | 14,092 |
| Eagle Bancorp, Inc. | | 190 | 6,223 |
| East West Bancorp, Inc. | | 835 | 30,260 |
| Enterprise Financial Services Corp. | | 148 | 4,606 |
| Equity Bancshares, Inc. (a) | | 197 | 3,436 |
| FB Financial Corp. | | 94 | 2,328 |
| Fifth Third Bancorp | | 4,213 | 81,227 |
| First Bancorp, North Carolina | | 166 | 4,163 |
| First Bancorp, Puerto Rico | | 1,227 | 6,859 |
| First Bancshares, Inc. | | 104 | 2,340 |
| First Busey Corp. | | 281 | 5,241 |
| First Citizens Bancshares, Inc. | | 49 | 19,846 |
| First Commonwealth Financial Corp. | | 556 | 4,604 |
| First Financial Bancorp, Ohio | | 577 | 8,015 |
| First Financial Bankshares, Inc. (b) | | 901 | 26,030 |
| First Financial Corp., Indiana | | 76 | 2,800 |
| First Foundation, Inc. | | 243 | 3,971 |
| First Hawaiian, Inc. | | 740 | 12,758 |
| First Horizon National Corp. | | 1,775 | 17,679 |
| First Interstate Bancsystem, Inc. (b) | | 200 | 6,192 |
| First Merchants Corp. | | 315 | 8,685 |
| First Midwest Bancorp, Inc., Delaware | | 642 | 8,571 |
| First Republic Bank | | 992 | 105,142 |
| Flushing Financial Corp. | | 149 | 1,716 |
| FNB Corp., Pennsylvania | | 2,062 | 15,465 |
| Franklin Financial Network, Inc. | | 85 | 2,189 |
| Fulton Financial Corp. | | 929 | 9,782 |
| German American Bancorp, Inc. | | 136 | 4,230 |
| Glacier Bancorp, Inc. | | 569 | 20,080 |
| Great Southern Bancorp, Inc. | | 185 | 7,467 |
| Great Western Bancorp, Inc. | | 312 | 4,293 |
| Hancock Whitney Corp. | | 480 | 10,176 |
| Hanmi Financial Corp. | | 177 | 1,719 |
| HarborOne Bancorp, Inc. | | 308 | 2,630 |
| Heartland Financial U.S.A., Inc. | | 186 | 6,220 |
| Heritage Commerce Corp. | | 330 | 2,477 |
| Heritage Financial Corp., Washington | | 207 | 4,140 |
| Hilltop Holdings, Inc. | | 408 | 7,528 |
| Home Bancshares, Inc. | | 879 | 13,519 |
| Hope Bancorp, Inc. | | 715 | 6,592 |
| Horizon Bancorp, Inc. Indiana | | 203 | 2,170 |
| Huntington Bancshares, Inc. | | 6,158 | 55,638 |
| IBERIABANK Corp. | | 298 | 13,571 |
| Independent Bank Corp. | | 127 | 1,886 |
| Independent Bank Corp., Massachusetts | | 194 | 13,015 |
| Independent Bank Group, Inc. (b) | | 216 | 8,752 |
| International Bancshares Corp. | | 322 | 10,310 |
| Investors Bancorp, Inc. | | 1,140 | 9,690 |
| JPMorgan Chase & Co. | | 17,863 | 1,680,194 |
| KeyCorp | | 5,874 | 71,545 |
| Lakeland Bancorp, Inc. | | 672 | 7,681 |
| Lakeland Financial Corp. | | 143 | 6,662 |
| Live Oak Bancshares, Inc. | | 170 | 2,467 |
| M&T Bank Corp. | | 755 | 78,497 |
| Mercantil Bank Holding Corp. Class A (a)(b) | | 136 | 2,045 |
| Mercantile Bank Corp. | | 92 | 2,079 |
| Midland States Bancorp, Inc. | | 115 | 1,719 |
| MidWestOne Financial Group, Inc. | | 58 | 1,160 |
| National Bank Holdings Corp. | | 175 | 4,725 |
| NBT Bancorp, Inc. | | 238 | 7,321 |
| Nicolet Bankshares, Inc. (a) | | 49 | 2,685 |
| OceanFirst Financial Corp. | | 331 | 5,836 |
| OFG Bancorp | | 290 | 3,877 |
| Old National Bancorp, Indiana (b) | | 971 | 13,361 |
| Origin Bancorp, Inc. | | 112 | 2,464 |
| Pacific Premier Bancorp, Inc. | | 451 | 9,778 |
| PacWest Bancorp | | 681 | 13,423 |
| Park National Corp. | | 80 | 5,630 |
| Peapack-Gladstone Financial Corp. | | 94 | 1,761 |
| Peoples Bancorp, Inc. | | 101 | 2,149 |
| Peoples United Financial, Inc. | | 2,594 | 30,013 |
| Pinnacle Financial Partners, Inc. | | 403 | 16,922 |
| PNC Financial Services Group, Inc. | | 2,504 | 263,446 |
| Popular, Inc. | | 555 | 20,629 |
| Preferred Bank, Los Angeles | | 76 | 3,257 |
| Prosperity Bancshares, Inc. | | 538 | 31,946 |
| QCR Holdings, Inc. | | 82 | 2,557 |
| Regions Financial Corp. | | 5,574 | 61,983 |
| Renasant Corp. | | 323 | 8,043 |
| S&T Bancorp, Inc. | | 217 | 5,089 |
| Sandy Spring Bancorp, Inc. | | 376 | 9,317 |
| Seacoast Banking Corp., Florida (a) | | 291 | 5,936 |
| ServisFirst Bancshares, Inc. | | 262 | 9,369 |
| Signature Bank | | 334 | 35,711 |
| Simmons First National Corp. Class A | | 644 | 11,019 |
| South State Corp. | | 402 | 19,159 |
| Southside Bancshares, Inc. | | 177 | 4,906 |
| Sterling Bancorp | | 1,145 | 13,419 |
| Stock Yards Bancorp, Inc. | | 116 | 4,663 |
| SVB Financial Group (a) | | 306 | 65,952 |
| Synovus Financial Corp. | | 830 | 17,040 |
| TCF Financial Corp. | | 875 | 25,743 |
| Texas Capital Bancshares, Inc. (a) | | 286 | 8,829 |
| Tompkins Financial Corp. | | 67 | 4,340 |
| TowneBank | | 362 | 6,820 |
| Trico Bancshares | | 149 | 4,537 |
| TriState Capital Holdings, Inc. (a) | | 138 | 2,168 |
| Triumph Bancorp, Inc. (a) | | 130 | 3,155 |
| Truist Financial Corp. | | 7,843 | 294,505 |
| Trustmark Corp. | | 363 | 8,901 |
| U.S. Bancorp | | 8,085 | 297,690 |
| UMB Financial Corp. | | 245 | 12,630 |
| Umpqua Holdings Corp. | | 1,228 | 13,066 |
| Union Bankshares Corp. | | 455 | 10,538 |
| United Bankshares, Inc., West Virginia | | 722 | 19,971 |
| United Community Bank, Inc. | | 445 | 8,953 |
| Univest Corp. of Pennsylvania | | 161 | 2,599 |
| Valley National Bancorp | | 2,211 | 17,290 |
| Veritex Holdings, Inc. | | 266 | 4,708 |
| Washington Trust Bancorp, Inc. | | 83 | 2,718 |
| Webster Financial Corp. | | 521 | 14,906 |
| Wells Fargo & Co. | | 21,952 | 561,971 |
| WesBanco, Inc. (b) | | 361 | 7,332 |
| Westamerica Bancorp. | | 152 | 8,728 |
| Western Alliance Bancorp. | | 533 | 20,185 |
| Wintrust Financial Corp. | | 324 | 14,133 |
| Zions Bancorp NA | | 970 | 32,980 |
| | | | 6,675,160 |
| Capital Markets - 2.6% | | | |
| Affiliated Managers Group, Inc. | | 288 | 21,473 |
| Ameriprise Financial, Inc. | | 726 | 108,929 |
| Artisan Partners Asset Management, Inc. | | 309 | 10,043 |
| Assetmark Financial Holdings, Inc. (a) | | 70 | 1,910 |
| B. Riley Financial, Inc. | | 79 | 1,719 |
| Bank of New York Mellon Corp. | | 4,740 | 183,201 |
| BGC Partners, Inc. Class A | | 1,580 | 4,329 |
| BlackRock, Inc. Class A | | 904 | 491,857 |
| Blucora, Inc. (a) | | 259 | 2,958 |
| BrightSphere Investment Group, Inc. | | 380 | 4,735 |
| Cboe Global Markets, Inc. | | 647 | 60,352 |
| Charles Schwab Corp. | | 6,668 | 224,978 |
| CME Group, Inc. | | 2,088 | 339,384 |
| Cohen & Steers, Inc. | | 123 | 8,370 |
| Cowen Group, Inc. Class A | | 186 | 3,015 |
| Diamond Hill Investment Group, Inc. | | 19 | 2,160 |
| Donnelley Financial Solutions, Inc. (a) | | 134 | 1,126 |
| E*TRADE Financial Corp. | | 1,283 | 63,804 |
| Eaton Vance Corp. (non-vtg.) | | 716 | 27,638 |
| Evercore, Inc. Class A | | 223 | 13,139 |
| FactSet Research Systems, Inc. | | 224 | 73,577 |
| Federated Hermes, Inc. Class B (non-vtg.) | | 532 | 12,608 |
| Focus Financial Partners, Inc. Class A (a) | | 176 | 5,817 |
| Franklin Resources, Inc. (b) | | 1,583 | 33,196 |
| Goldman Sachs Group, Inc. | | 1,819 | 359,471 |
| Greenhill & Co., Inc. | | 78 | 779 |
| Hamilton Lane, Inc. Class A | | 193 | 13,002 |
| Houlihan Lokey | | 273 | 15,190 |
| Interactive Brokers Group, Inc. | | 435 | 18,170 |
| Intercontinental Exchange, Inc. | | 3,195 | 292,662 |
| INTL FCStone, Inc. (a) | | 92 | 5,060 |
| Invesco Ltd. | | 2,113 | 22,736 |
| Janus Henderson Group PLC (b) | | 874 | 18,494 |
| Lazard Ltd. Class A | | 640 | 18,323 |
| Legg Mason, Inc. | | 463 | 23,034 |
| LPL Financial | | 468 | 36,691 |
| MarketAxess Holdings, Inc. | | 221 | 110,703 |
| Moelis & Co. Class A | | 367 | 11,436 |
| Moody's Corp. | | 946 | 259,895 |
| Morgan Stanley | | 7,036 | 339,839 |
| Morningstar, Inc. | | 116 | 16,353 |
| MSCI, Inc. | | 495 | 165,241 |
| Northern Trust Corp. | | 1,240 | 98,382 |
| Och-Ziff Capital Management Group LLC Class A | | 95 | 1,228 |
| Oppenheimer Holdings, Inc. Class A (non-vtg.) | | 34 | 741 |
| Piper Jaffray Companies | | 90 | 5,324 |
| PJT Partners, Inc. | | 114 | 5,853 |
| Raymond James Financial, Inc. | | 728 | 50,108 |
| S&P Global, Inc. | | 1,405 | 462,919 |
| SEI Investments Co. | | 747 | 41,070 |
| State Street Corp. | | 2,080 | 132,184 |
| Stifel Financial Corp. | | 461 | 21,865 |
| T. Rowe Price Group, Inc. | | 1,333 | 164,626 |
| TD Ameritrade Holding Corp. | | 1,552 | 56,462 |
| The Blackstone Group LP | | 3,921 | 222,164 |
| The NASDAQ OMX Group, Inc. | | 669 | 79,925 |
| Tradeweb Markets, Inc. Class A | | 453 | 26,337 |
| Victory Capital Holdings, Inc. | | 91 | 1,564 |
| Virtu Financial, Inc. Class A | | 423 | 9,983 |
| Virtus Investment Partners, Inc. | | 40 | 4,652 |
| Waddell & Reed Financial, Inc. Class A (b) | | 404 | 6,266 |
| WisdomTree Investments, Inc. | | 711 | 2,467 |
| | | | 4,821,517 |
| Consumer Finance - 0.5% | | | |
| Ally Financial, Inc. | | 2,273 | 45,074 |
| American Express Co. | | 3,859 | 367,377 |
| Capital One Financial Corp. | | 2,680 | 167,741 |
| Credit Acceptance Corp. (a) | | 79 | 33,102 |
| CURO Group Holdings Corp. | | 91 | 743 |
| Discover Financial Services | | 1,785 | 89,411 |
| Encore Capital Group, Inc. (a)(b) | | 155 | 5,298 |
| Enova International, Inc. (a) | | 212 | 3,152 |
| EZCORP, Inc. (non-vtg.) Class A (a) | | 226 | 1,424 |
| First Cash Financial Services, Inc. | | 244 | 16,465 |
| Green Dot Corp. Class A (a) | | 279 | 13,693 |
| LendingClub Corp. (a) | | 535 | 2,434 |
| LendingTree, Inc. (a) | | 43 | 12,450 |
| Navient Corp. | | 1,078 | 7,578 |
| Nelnet, Inc. Class A | | 119 | 5,681 |
| OneMain Holdings, Inc. | | 432 | 10,601 |
| PRA Group, Inc. (a)(b) | | 254 | 9,820 |
| Regional Management Corp. (a) | | 62 | 1,098 |
| Santander Consumer U.S.A. Holdings, Inc. | | 613 | 11,285 |
| SLM Corp. | | 2,036 | 14,313 |
| Synchrony Financial | | 3,187 | 70,624 |
| World Acceptance Corp. (a) | | 52 | 3,407 |
| | | | 892,771 |
| Diversified Financial Services - 1.2% | | | |
| AXA Equitable Holdings, Inc. | | 2,402 | 46,335 |
| Berkshire Hathaway, Inc. Class B (a) | | 11,371 | 2,029,837 |
| Cannae Holdings, Inc. (a) | | 418 | 17,180 |
| Jefferies Financial Group, Inc. | | 1,357 | 21,101 |
| On Deck Capital, Inc. (a) | | 397 | 285 |
| Voya Financial, Inc. | | 758 | 35,361 |
| | | | 2,150,099 |
| Insurance - 2.1% | | | |
| AFLAC, Inc. | | 4,207 | 151,578 |
| Alleghany Corp. | | 86 | 42,066 |
| Allstate Corp. | | 1,845 | 178,947 |
| AMBAC Financial Group, Inc. (a) | | 273 | 3,909 |
| American Equity Investment Life Holding Co. | | 519 | 12,824 |
| American Financial Group, Inc. | | 432 | 27,415 |
| American International Group, Inc. | | 5,111 | 159,361 |
| American National Insurance Co. | | 53 | 3,820 |
| Amerisafe, Inc. | | 103 | 6,299 |
| Aon PLC | | 1,348 | 259,625 |
| Arch Capital Group Ltd. (a) | | 2,391 | 68,502 |
| Argo Group International Holdings, Ltd. | | 192 | 6,687 |
| Arthur J. Gallagher & Co. | | 1,093 | 106,557 |
| Assurant, Inc. | | 363 | 37,494 |
| Assured Guaranty Ltd. | | 541 | 13,206 |
| Athene Holding Ltd. (a) | | 675 | 21,053 |
| Axis Capital Holdings Ltd. | | 476 | 19,307 |
| Benefytt Technologies, Inc. (a) | | 52 | 1,064 |
| Brighthouse Financial, Inc. (a) | | 527 | 14,661 |
| Brown & Brown, Inc. | | 1,381 | 56,290 |
| Chubb Ltd. | | 2,642 | 334,530 |
| Cincinnati Financial Corp. | | 895 | 57,307 |
| CNO Financial Group, Inc. | | 862 | 13,421 |
| eHealth, Inc. (a) | | 139 | 13,655 |
| Employers Holdings, Inc. | | 183 | 5,517 |
| Enstar Group Ltd. (a) | | 90 | 13,749 |
| Erie Indemnity Co. Class A | | 104 | 19,958 |
| Everest Re Group Ltd. | | 243 | 50,107 |
| First American Financial Corp. | | 650 | 31,213 |
| FNF Group | | 1,692 | 51,877 |
| Genworth Financial, Inc. Class A (a) | | 2,863 | 6,614 |
| Globe Life, Inc. | | 597 | 44,315 |
| Goosehead Insurance (a) | | 66 | 4,961 |
| Greenlight Capital Re, Ltd. (a)(b) | | 134 | 874 |
| Hallmark Financial Services, Inc. (a) | | 69 | 241 |
| Hanover Insurance Group, Inc. | | 223 | 22,597 |
| Hartford Financial Services Group, Inc. | | 2,113 | 81,456 |
| HCI Group, Inc. | | 39 | 1,801 |
| Heritage Insurance Holdings, Inc. | | 117 | 1,532 |
| Horace Mann Educators Corp. | | 237 | 8,705 |
| James River Group Holdings Ltd. | | 179 | 8,055 |
| Kemper Corp. | | 355 | 25,745 |
| Kinsale Capital Group, Inc. | | 115 | 17,849 |
| Lincoln National Corp. | | 1,147 | 42,198 |
| Loews Corp. | | 1,432 | 49,103 |
| Markel Corp. (a) | | 82 | 75,700 |
| Marsh & McLennan Companies, Inc. | | 2,981 | 320,070 |
| MBIA, Inc. (a)(b) | | 402 | 2,915 |
| Mercury General Corp. | | 154 | 6,276 |
| MetLife, Inc. | | 4,576 | 167,116 |
| National General Holdings Corp. | | 374 | 8,082 |
| National Western Life Group, Inc. | | 12 | 2,438 |
| Old Republic International Corp. | | 1,618 | 26,390 |
| Palomar Holdings, Inc. (a) | | 99 | 8,490 |
| Primerica, Inc. | | 237 | 27,634 |
| Principal Financial Group, Inc. | | 1,543 | 64,096 |
| ProAssurance Corp. | | 312 | 4,515 |
| Progressive Corp. | | 3,404 | 272,694 |
| ProSight Global, Inc. | | 72 | 641 |
| Prudential Financial, Inc. | | 2,314 | 140,923 |
| Reinsurance Group of America, Inc. | | 415 | 32,553 |
| RenaissanceRe Holdings Ltd. | | 289 | 49,428 |
| RLI Corp. | | 236 | 19,376 |
| Safety Insurance Group, Inc. | | 87 | 6,635 |
| Selective Insurance Group, Inc. | | 332 | 17,510 |
| State Auto Financial Corp. | | 95 | 1,696 |
| Stewart Information Services Corp. | | 135 | 4,389 |
| The Travelers Companies, Inc. | | 1,483 | 169,136 |
| Third Point Reinsurance Ltd. (a) | | 409 | 3,072 |
| Trupanion, Inc. (a)(b) | | 181 | 7,727 |
| United Fire Group, Inc. | | 129 | 3,575 |
| United Insurance Holdings Corp. | | 105 | 821 |
| Universal Insurance Holdings, Inc. | | 160 | 2,840 |
| Unum Group | | 1,159 | 19,228 |
| W.R. Berkley Corp. | | 861 | 49,327 |
| White Mountains Insurance Group Ltd. | | 17 | 15,095 |
| Willis Group Holdings PLC | | 750 | 147,713 |
| | | | 3,776,146 |
| Mortgage Real Estate Investment Trusts - 0.1% | | | |
| AG Mortgage Investment Trust, Inc. (b) | | 190 | 606 |
| AGNC Investment Corp. | | 3,130 | 40,377 |
| Annaly Capital Management, Inc. | | 8,421 | 55,242 |
| Anworth Mortgage Asset Corp. | | 433 | 736 |
| Apollo Commercial Real Estate Finance, Inc. | | 813 | 7,976 |
| Ares Commercial Real Estate Corp. | | 189 | 1,724 |
| Arlington Asset Investment Corp. | | 136 | 404 |
| Armour Residential REIT, Inc. | | 341 | 3,202 |
| Blackstone Mortgage Trust, Inc. | | 764 | 18,405 |
| Capstead Mortgage Corp. | | 540 | 2,965 |
| Cherry Hill Mortgage Investment Corp. | | 66 | 595 |
| Chimera Investment Corp. | | 1,078 | 10,360 |
| Colony NorthStar Credit Real Estate, Inc. | | 497 | 3,489 |
| Dynex Capital, Inc. | | 134 | 1,916 |
| Exantas Capital Corp. | | 140 | 371 |
| Granite Point Mortgage Trust, Inc. | | 311 | 2,233 |
| Great Ajax Corp. | | 102 | 938 |
| Hannon Armstrong Sustainable Infrastructure Capital, Inc. | | 487 | 13,860 |
| Invesco Mortgage Capital, Inc. (b) | | 1,004 | 3,755 |
| KKR Real Estate Finance Trust, Inc. | | 135 | 2,238 |
| Ladder Capital Corp. Class A | | 562 | 4,552 |
| MFA Financial, Inc. | | 2,590 | 6,449 |
| New Residential Investment Corp. | | 2,356 | 17,505 |
| New York Mortgage Trust, Inc. | | 2,065 | 5,390 |
| Orchid Island Capital, Inc. (b) | | 390 | 1,837 |
| PennyMac Mortgage Investment Trust | | 568 | 9,957 |
| Redwood Trust, Inc. | | 638 | 4,466 |
| Starwood Property Trust, Inc. | | 1,592 | 23,816 |
| TPG RE Finance Trust, Inc. | | 316 | 2,718 |
| Two Harbors Investment Corp. | | 1,547 | 7,797 |
| Western Asset Mortgage Capital Corp. | | 302 | 827 |
| ZAIS Financial Corp. | | 210 | 1,825 |
| | | | 258,531 |
| Thrifts & Mortgage Finance - 0.1% | | | |
| Axos Financial, Inc. (a) | | 315 | 6,955 |
| Capitol Federal Financial, Inc. | | 783 | 8,621 |
| Columbia Financial, Inc. (a) | | 269 | 3,754 |
| Dime Community Bancshares, Inc. | | 186 | 2,554 |
| Essent Group Ltd. | | 665 | 24,120 |
| Farmer Mac Class C (non-vtg.) | | 53 | 3,393 |
| First Defiance Financial Corp. | | 210 | 3,711 |
| Flagstar Bancorp, Inc. | | 200 | 5,886 |
| HomeStreet, Inc. | | 146 | 3,593 |
| Kearny Financial Corp. | | 433 | 3,542 |
| Meridian Bancorp, Inc. Maryland | | 296 | 3,434 |
| Meta Financial Group, Inc. | | 193 | 3,507 |
| MGIC Investment Corp. | | 1,998 | 16,364 |
| New York Community Bancorp, Inc. | | 2,897 | 29,549 |
| NMI Holdings, Inc. (a) | | 569 | 9,150 |
| Northfield Bancorp, Inc. (b) | | 234 | 2,696 |
| Northwest Bancshares, Inc. | | 910 | 9,305 |
| Pennymac Financial Services, Inc. | | 234 | 9,779 |
| Provident Financial Services, Inc. | | 356 | 5,144 |
| Radian Group, Inc. | | 1,134 | 17,588 |
| TFS Financial Corp. | | 280 | 4,007 |
| Trustco Bank Corp., New York | | 563 | 3,564 |
| Walker & Dunlop, Inc. | | 162 | 8,231 |
| Washington Federal, Inc. | | 438 | 11,756 |
| Waterstone Financial, Inc. | | 137 | 2,032 |
| WMI Holdings Corp. (a) | | 413 | 5,138 |
| WSFS Financial Corp. | | 293 | 8,409 |
| | | | 215,782 |
|
| TOTAL FINANCIALS | | | 18,790,006 |
|
| HEALTH CARE - 14.3% | | | |
| Biotechnology - 3.1% | | | |
| AbbVie, Inc. | | 10,334 | 1,014,592 |
| Abeona Therapeutics, Inc. (a) | | 425 | 1,239 |
| ACADIA Pharmaceuticals, Inc. (a) | | 646 | 31,312 |
| Acceleron Pharma, Inc. (a) | | 289 | 27,533 |
| Acorda Therapeutics, Inc. (a)(b) | | 167 | 123 |
| Adamas Pharmaceuticals, Inc. (a) | | 42 | 108 |
| ADMA Biologics, Inc. (a)(b) | | 379 | 1,110 |
| Adverum Biotechnologies, Inc. (a) | | 348 | 7,266 |
| Agenus, Inc. (a)(b) | | 685 | 2,692 |
| Agios Pharmaceuticals, Inc. (a) | | 341 | 18,237 |
| Aimmune Therapeutics, Inc. (a)(b) | | 242 | 4,044 |
| Akebia Therapeutics, Inc. (a) | | 929 | 12,616 |
| Akero Therapeutics, Inc. (a) | | 42 | 1,047 |
| Albireo Pharma, Inc. (a) | | 71 | 1,881 |
| Aldeyra Therapeutics, Inc. (a) | | 125 | 521 |
| Alector, Inc. (a) | | 210 | 5,132 |
| Alexion Pharmaceuticals, Inc. (a) | | 1,303 | 146,249 |
| Alkermes PLC (a) | | 879 | 17,057 |
| Allakos, Inc. (a)(b) | | 137 | 9,845 |
| Allogene Therapeutics, Inc. (a) | | 366 | 15,672 |
| Alnylam Pharmaceuticals, Inc. (a) | | 656 | 97,160 |
| Amgen, Inc. | | 3,453 | 814,425 |
| Amicus Therapeutics, Inc. (a) | | 1,441 | 21,730 |
| AnaptysBio, Inc. (a) | | 170 | 3,798 |
| Anavex Life Sciences Corp. (a)(b) | | 263 | 1,294 |
| Anika Therapeutics, Inc. (a) | | 79 | 2,981 |
| Apellis Pharmaceuticals, Inc. (a) | | 286 | 9,341 |
| Arcus Biosciences, Inc. (a) | | 278 | 6,878 |
| Ardelyx, Inc. (a) | | 331 | 2,291 |
| Arena Pharmaceuticals, Inc. (a)(b) | | 359 | 22,599 |
| Arrowhead Pharmaceuticals, Inc. (a) | | 566 | 24,446 |
| Assembly Biosciences, Inc. (a) | | 146 | 3,405 |
| Atara Biotherapeutics, Inc. (a) | | 326 | 4,750 |
| Athenex, Inc. (a)(b) | | 291 | 4,004 |
| Avid Bioservices, Inc. (a)(b) | | 270 | 1,773 |
| AVROBIO, Inc. (a) | | 142 | 2,478 |
| BioCryst Pharmaceuticals, Inc. (a) | | 740 | 3,526 |
| Biogen, Inc. (a) | | 961 | 257,116 |
| Biohaven Pharmaceutical Holding Co. Ltd. (a)(b) | | 288 | 21,056 |
| BioMarin Pharmaceutical, Inc. (a) | | 1,060 | 130,740 |
| Biospecifics Technologies Corp. (a) | | 34 | 2,084 |
| bluebird bio, Inc. (a) | | 375 | 22,890 |
| Blueprint Medicines Corp. (a) | | 310 | 24,180 |
| Bridgebio Pharma, Inc. (b) | | 119 | 3,881 |
| Calithera Biosciences, Inc. (a) | | 295 | 1,558 |
| CareDx, Inc. (a) | | 200 | 7,086 |
| Castle Biosciences, Inc. | | 31 | 1,168 |
| Catalyst Biosciences, Inc. (a) | | 98 | 575 |
| Catalyst Pharmaceutical Partners, Inc. (a) | | 620 | 2,864 |
| Cel-Sci Corp. (a)(b) | | 183 | 2,730 |
| ChemoCentryx, Inc. (a) | | 266 | 15,306 |
| Clovis Oncology, Inc. (a)(b) | | 451 | 3,044 |
| Coherus BioSciences, Inc. (a)(b) | | 362 | 6,465 |
| Concert Pharmaceuticals, Inc. (a) | | 140 | 1,393 |
| Corbus Pharmaceuticals Holdings, Inc. (a)(b) | | 351 | 2,945 |
| Cortexyme, Inc. (a) | | 26 | 1,204 |
| Cue Biopharma, Inc. (a) | | 102 | 2,500 |
| Cytokinetics, Inc. (a) | | 332 | 7,825 |
| CytomX Therapeutics, Inc. (a) | | 220 | 1,833 |
| Deciphera Pharmaceuticals, Inc. (a) | | 111 | 6,629 |
| Denali Therapeutics, Inc. (a)(b) | | 422 | 10,204 |
| Dicerna Pharmaceuticals, Inc. (a) | | 368 | 9,347 |
| Dynavax Technologies Corp. (a)(b) | | 471 | 4,178 |
| Eagle Pharmaceuticals, Inc. (a) | | 50 | 2,399 |
| Editas Medicine, Inc. (a)(b) | | 357 | 10,560 |
| Eiger Biopharmaceuticals, Inc. (a) | | 159 | 1,526 |
| Emergent BioSolutions, Inc. (a) | | 248 | 19,612 |
| Enanta Pharmaceuticals, Inc. (a) | | 84 | 4,218 |
| Epizyme, Inc. (a)(b) | | 435 | 6,986 |
| Esperion Therapeutics, Inc. (a)(b) | | 141 | 7,235 |
| Exact Sciences Corp. (a) | | 822 | 71,465 |
| Exelixis, Inc. (a) | | 1,803 | 42,803 |
| Fate Therapeutics, Inc. (a) | | 366 | 12,557 |
| FibroGen, Inc. (a)(b) | | 531 | 21,521 |
| Five Prime Therapeutics, Inc. (a) | | 126 | 769 |
| Flexion Therapeutics, Inc. (a)(b) | | 208 | 2,735 |
| G1 Therapeutics, Inc. (a)(b) | | 170 | 4,124 |
| Geron Corp. (a) | | 2,577 | 5,618 |
| Gilead Sciences, Inc. | | 7,343 | 564,970 |
| Global Blood Therapeutics, Inc. (a)(b) | | 374 | 23,611 |
| GlycoMimetics, Inc. (a) | | 147 | 553 |
| Gossamer Bio, Inc. (a)(b) | | 212 | 2,756 |
| Gritstone Oncology, Inc. (a)(b) | | 105 | 697 |
| Halozyme Therapeutics, Inc. (a)(b) | | 647 | 17,346 |
| Heron Therapeutics, Inc. (a)(b) | | 449 | 6,605 |
| Homology Medicines, Inc. (a) | | 137 | 2,081 |
| ImmunoGen, Inc. (a)(b) | | 910 | 4,186 |
| Immunomedics, Inc. (a)(b) | | 1,158 | 41,040 |
| Incyte Corp. (a) | | 1,048 | 108,961 |
| Inovio Pharmaceuticals, Inc. (a)(b) | | 805 | 21,695 |
| Insmed, Inc. (a) | | 577 | 15,891 |
| Intellia Therapeutics, Inc. (a)(b) | | 224 | 4,708 |
| Intercept Pharmaceuticals, Inc. (a)(b) | | 142 | 6,803 |
| Invitae Corp. (a)(b) | | 643 | 19,476 |
| Ionis Pharmaceuticals, Inc. (a) | | 777 | 45,812 |
| Iovance Biotherapeutics, Inc. (a)(b) | | 807 | 22,152 |
| Ironwood Pharmaceuticals, Inc. Class A (a) | | 881 | 9,092 |
| Kadmon Holdings, Inc. (a) | | 887 | 4,541 |
| Kalvista Pharmaceuticals, Inc. (a) | | 69 | 835 |
| Karuna Therapeutics, Inc. (a) | | 59 | 6,576 |
| Karyopharm Therapeutics, Inc. (a) | | 383 | 7,254 |
| Kiniksa Pharmaceuticals Ltd. (a) | | 56 | 1,427 |
| Kodiak Sciences, Inc. (a)(b) | | 136 | 7,360 |
| Krystal Biotech, Inc. (a) | | 62 | 2,568 |
| Kura Oncology, Inc. (a) | | 399 | 6,504 |
| La Jolla Pharmaceutical Co. (a) | | 126 | 537 |
| Ligand Pharmaceuticals, Inc. Class B (a) | | 108 | 12,080 |
| Macrogenics, Inc. (a) | | 275 | 7,678 |
| Madrigal Pharmaceuticals, Inc. (a) | | 54 | 6,116 |
| MannKind Corp. (a)(b) | | 796 | 1,393 |
| Minerva Neurosciences, Inc. (a)(b) | | 186 | 671 |
| Mirati Therapeutics, Inc. (a) | | 223 | 25,460 |
| Moderna, Inc. (a)(b) | | 1,722 | 110,570 |
| Molecular Templates, Inc. (a) | | 125 | 1,724 |
| Momenta Pharmaceuticals, Inc. (a) | | 727 | 24,187 |
| Myriad Genetics, Inc. (a) | | 439 | 4,978 |
| Natera, Inc. (a) | | 367 | 18,299 |
| Neurocrine Biosciences, Inc. (a) | | 552 | 67,344 |
| NextCure, Inc. (a) | | 55 | 1,179 |
| Novavax, Inc. (a)(b) | | 360 | 30,006 |
| Opko Health, Inc. (a)(b) | | 2,201 | 7,505 |
| PDL BioPharma, Inc. (a)(b) | | 644 | 1,874 |
| Pfenex, Inc. (a) | | 162 | 1,353 |
| Pieris Pharmaceuticals, Inc. (a)(b) | | 267 | 828 |
| Portola Pharmaceuticals, Inc. (a) | | 387 | 6,962 |
| Precigen, Inc. (a)(b) | | 490 | 2,445 |
| Principia Biopharma, Inc. (a) | | 106 | 6,338 |
| Protagonist Therapeutics, Inc. (a) | | 120 | 2,119 |
| Prothena Corp. PLC (a) | | 176 | 1,841 |
| PTC Therapeutics, Inc. (a) | | 416 | 21,108 |
| Puma Biotechnology, Inc. (a) | | 204 | 2,128 |
| Radius Health, Inc. (a) | | 224 | 3,053 |
| Recro Pharma, Inc. (a) | | 85 | 387 |
| Regeneron Pharmaceuticals, Inc. (a) | | 587 | 366,083 |
| REGENXBIO, Inc. (a) | | 177 | 6,519 |
| Repligen Corp. (a) | | 290 | 35,847 |
| Retrophin, Inc. (a) | | 241 | 4,919 |
| Rhythm Pharmaceuticals, Inc. (a) | | 184 | 4,103 |
| Rigel Pharmaceuticals, Inc. (a) | | 1,110 | 2,031 |
| Rocket Pharmaceuticals, Inc. (a) | | 188 | 3,935 |
| Rubius Therapeutics, Inc. (a)(b) | | 189 | 1,130 |
| Sage Therapeutics, Inc. (a) | | 293 | 12,183 |
| Sangamo Therapeutics, Inc. (a) | | 643 | 5,761 |
| Sarepta Therapeutics, Inc. (a) | | 456 | 73,115 |
| Seattle Genetics, Inc. (a) | | 676 | 114,866 |
| Sorrento Therapeutics, Inc. (a)(b) | | 836 | 5,250 |
| Spectrum Pharmaceuticals, Inc. (a) | | 507 | 1,714 |
| Stoke Therapeutics, Inc. | | 46 | 1,096 |
| Syndax Pharmaceuticals, Inc. (a) | | 131 | 1,941 |
| Syros Pharmaceuticals, Inc. (a) | | 187 | 1,993 |
| TCR2 Therapeutics, Inc. (a) | | 55 | 845 |
| TG Therapeutics, Inc. (a) | | 589 | 11,474 |
| Translate Bio, Inc. (a)(b) | | 345 | 6,182 |
| Turning Point Therapeutics, Inc. (a)(b) | | 115 | 7,428 |
| Twist Bioscience Corp. (a) | | 181 | 8,199 |
| Ultragenyx Pharmaceutical, Inc. (a)(b) | | 356 | 27,846 |
| United Therapeutics Corp. (a) | | 251 | 30,371 |
| UNITY Biotechnology, Inc. (a)(b) | | 157 | 1,363 |
| Vanda Pharmaceuticals, Inc. (a) | | 284 | 3,249 |
| Veracyte, Inc. (a)(b) | | 250 | 6,475 |
| Verastem, Inc. (a) | | 977 | 1,680 |
| Vericel Corp. (a) | | 239 | 3,303 |
| Vertex Pharmaceuticals, Inc. (a) | | 1,533 | 445,045 |
| Viking Therapeutics, Inc. (a)(b) | | 360 | 2,596 |
| Voyager Therapeutics, Inc. (a) | | 176 | 2,221 |
| Xbiotech, Inc. (a) | | 84 | 1,152 |
| Xencor, Inc. (a) | | 277 | 8,972 |
| XOMA Corp. (a) | | 51 | 1,008 |
| Y-mAbs Therapeutics, Inc. (a) | | 95 | 4,104 |
| ZIOPHARM Oncology, Inc. (a)(b) | | 1,046 | 3,431 |
| | | | 5,655,177 |
| Health Care Equipment & Supplies - 3.5% | | | |
| Abbott Laboratories | | 10,360 | 947,215 |
| Abiomed, Inc. (a) | | 265 | 64,013 |
| Accelerate Diagnostics, Inc. (a)(b) | | 129 | 1,956 |
| Accuray, Inc. (a) | | 588 | 1,194 |
| Align Technology, Inc. (a) | | 421 | 115,539 |
| Alphatec Holdings, Inc. (a) | | 221 | 1,039 |
| Angiodynamics, Inc. (a) | | 249 | 2,532 |
| Antares Pharma, Inc. (a) | | 985 | 2,709 |
| Atricure, Inc. (a) | | 297 | 13,350 |
| Atrion Corp. | | 8 | 5,096 |
| Avanos Medical, Inc. (a)(b) | | 276 | 8,112 |
| AxoGen, Inc. (a) | | 226 | 2,088 |
| Axonics Modulation Technologies, Inc. (a) | | 163 | 5,723 |
| Baxter International, Inc. | | 2,976 | 256,234 |
| Becton, Dickinson & Co. | | 1,718 | 411,066 |
| BioLife Solutions, Inc. (a) | | 65 | 1,063 |
| Boston Scientific Corp. (a) | | 8,433 | 296,083 |
| Cantel Medical Corp. | | 210 | 9,288 |
| Cardiovascular Systems, Inc. (a) | | 204 | 6,436 |
| Cerus Corp. (a) | | 876 | 5,782 |
| CONMED Corp. | | 159 | 11,446 |
| Cryolife, Inc. (a)(b) | | 197 | 3,776 |
| CryoPort, Inc. (a)(b) | | 200 | 6,050 |
| Cutera, Inc. (a) | | 77 | 937 |
| Danaher Corp. | | 3,684 | 651,442 |
| Dentsply Sirona, Inc. | | 1,329 | 58,556 |
| DexCom, Inc. (a) | | 541 | 219,321 |
| Edwards Lifesciences Corp. (a) | | 3,648 | 252,113 |
| Genmark Diagnostics, Inc. (a) | | 369 | 5,428 |
| Glaukos Corp. (a)(b) | | 221 | 8,491 |
| Globus Medical, Inc. (a) | | 467 | 22,281 |
| Haemonetics Corp. (a) | | 293 | 26,241 |
| Heska Corp. (a) | | 44 | 4,099 |
| Hill-Rom Holdings, Inc. | | 392 | 43,034 |
| Hologic, Inc. (a) | | 1,525 | 86,925 |
| ICU Medical, Inc. (a) | | 109 | 20,090 |
| IDEXX Laboratories, Inc. (a) | | 501 | 165,410 |
| Inogen, Inc. (a) | | 96 | 3,410 |
| Insulet Corp. (a) | | 385 | 74,790 |
| Integer Holdings Corp. (a) | | 188 | 13,733 |
| Integra LifeSciences Holdings Corp. (a) | | 401 | 18,843 |
| IntriCon Corp. (a) | | 38 | 514 |
| Intuitive Surgical, Inc. (a) | | 683 | 389,194 |
| Invacare Corp. (b) | | 158 | 1,006 |
| IRadimed Corp. (a) | | 38 | 882 |
| iRhythm Technologies, Inc. (a) | | 149 | 17,268 |
| Lantheus Holdings, Inc. (a)(b) | | 527 | 7,536 |
| LeMaitre Vascular, Inc. | | 108 | 2,851 |
| LivaNova PLC (a) | | 271 | 13,043 |
| Masimo Corp. (a) | | 300 | 68,397 |
| Medtronic PLC | | 7,860 | 720,762 |
| Meridian Bioscience, Inc. (a) | | 296 | 6,894 |
| Merit Medical Systems, Inc. (a)(b) | | 320 | 14,608 |
| Mesa Laboratories, Inc. | | 22 | 4,770 |
| Natus Medical, Inc. (a) | | 179 | 3,906 |
| Neogen Corp. (a) | | 316 | 24,522 |
| Nevro Corp. (a) | | 206 | 24,611 |
| NuVasive, Inc. (a) | | 296 | 16,475 |
| OraSure Technologies, Inc. (a) | | 391 | 4,547 |
| Orthofix International NV (a) | | 105 | 3,360 |
| OrthoPediatrics Corp. (a) | | 61 | 2,669 |
| Penumbra, Inc. (a)(b) | | 195 | 34,870 |
| Quidel Corp. (a) | | 229 | 51,236 |
| ResMed, Inc. | | 839 | 161,088 |
| Seaspine Holdings Corp. (a) | | 124 | 1,298 |
| Senseonics Holdings, Inc. (a)(b) | | 1,109 | 433 |
| Shockwave Medical, Inc. (a) | | 53 | 2,511 |
| SI-BONE, Inc. (a) | | 108 | 1,722 |
| Sientra, Inc. (a)(b) | | 292 | 1,130 |
| Silk Road Medical, Inc. (a) | | 76 | 3,184 |
| Staar Surgical Co. (a) | | 175 | 10,770 |
| STERIS PLC | | 496 | 76,106 |
| Stryker Corp. | | 1,878 | 338,397 |
| SurModics, Inc. (a) | | 68 | 2,940 |
| Tactile Systems Technology, Inc. (a)(b) | | 106 | 4,392 |
| Tandem Diabetes Care, Inc. (a) | | 336 | 33,237 |
| Teleflex, Inc. | | 271 | 98,639 |
| The Cooper Companies, Inc. | | 289 | 81,972 |
| TransMedics Group, Inc. (a) | | 50 | 896 |
| Vapotherm, Inc. (a) | | 99 | 4,058 |
| Varex Imaging Corp. (a) | | 233 | 3,530 |
| Varian Medical Systems, Inc. (a) | | 539 | 66,038 |
| ViewRay, Inc. (a) | | 593 | 1,328 |
| West Pharmaceutical Services, Inc. | | 433 | 98,365 |
| Wright Medical Group NV (a) | | 717 | 21,309 |
| Zimmer Biomet Holdings, Inc. | | 1,205 | 143,829 |
| Zynex, Inc. (a) | | 95 | 2,363 |
| | | | 6,426,390 |
| Health Care Providers & Services - 2.5% | | | |
| Acadia Healthcare Co., Inc. (a) | | 499 | 12,535 |
| Addus HomeCare Corp. (a) | | 75 | 6,942 |
| Amedisys, Inc. (a) | | 190 | 37,723 |
| American Renal Associates Holdings, Inc. (a) | | 30 | 196 |
| AmerisourceBergen Corp. | | 881 | 88,778 |
| AMN Healthcare Services, Inc. (a) | | 264 | 11,943 |
| Anthem, Inc. | | 1,479 | 388,947 |
| Apollo Medical Holdings, Inc. (a) | | 140 | 2,310 |
| BioScrip, Inc. (a) | | 195 | 2,707 |
| BioTelemetry, Inc. (a) | | 200 | 9,038 |
| Brookdale Senior Living, Inc. (a) | | 1,050 | 3,098 |
| Cardinal Health, Inc. | | 1,713 | 89,401 |
| Centene Corp. (a) | | 3,407 | 216,515 |
| Chemed Corp. | | 95 | 42,852 |
| Cigna Corp. | | 2,162 | 405,699 |
| Community Health Systems, Inc. (a)(b) | | 667 | 2,008 |
| Corvel Corp. (a) | | 53 | 3,757 |
| Covetrus, Inc. (a)(b) | | 585 | 10,466 |
| Cross Country Healthcare, Inc. (a) | | 203 | 1,250 |
| CVS Health Corp. | | 7,647 | 496,826 |
| DaVita HealthCare Partners, Inc. (a) | | 521 | 41,232 |
| Encompass Health Corp. | | 572 | 35,424 |
| Guardant Health, Inc. (a) | | 301 | 24,420 |
| Hanger, Inc. (a)(b) | | 207 | 3,428 |
| HCA Holdings, Inc. | | 1,546 | 150,055 |
| HealthEquity, Inc. (a) | | 450 | 26,402 |
| Henry Schein, Inc. (a) | | 872 | 50,916 |
| Humana, Inc. | | 772 | 299,343 |
| Laboratory Corp. of America Holdings (a) | | 574 | 95,347 |
| LHC Group, Inc. (a) | | 169 | 29,460 |
| Magellan Health Services, Inc. (a) | | 122 | 8,904 |
| McKesson Corp. | | 944 | 144,828 |
| MEDNAX, Inc. (a)(b) | | 477 | 8,157 |
| Molina Healthcare, Inc. (a) | | 350 | 62,293 |
| National Healthcare Corp. | | 63 | 3,997 |
| National Research Corp. Class A | | 63 | 3,667 |
| Owens & Minor, Inc. (b) | | 383 | 2,918 |
| Patterson Companies, Inc. (b) | | 467 | 10,274 |
| Pennant Group, Inc. (a) | | 162 | 3,661 |
| PetIQ, Inc. Class A (a)(b) | | 108 | 3,763 |
| Premier, Inc. (a) | | 373 | 12,786 |
| Providence Service Corp. (a) | | 72 | 5,682 |
| Quest Diagnostics, Inc. | | 792 | 90,256 |
| R1 RCM, Inc. (a) | | 605 | 6,746 |
| RadNet, Inc. (a) | | 243 | 3,856 |
| Select Medical Holdings Corp. (a) | | 616 | 9,074 |
| Surgery Partners, Inc. (a) | | 92 | 1,064 |
| Tenet Healthcare Corp. (a)(b) | | 587 | 10,631 |
| The Ensign Group, Inc. | | 283 | 11,844 |
| The Joint Corp. (a) | | 61 | 931 |
| Tivity Health, Inc. (a) | | 266 | 3,014 |
| Triple-S Management Corp. (b) | | 165 | 3,138 |
| U.S. Physical Therapy, Inc. | | 72 | 5,833 |
| UnitedHealth Group, Inc. | | 5,554 | 1,638,152 |
| Universal Health Services, Inc. Class B | | 476 | 44,216 |
| | | | 4,688,703 |
| Health Care Technology - 0.3% | | | |
| Allscripts Healthcare Solutions, Inc. (a) | | 897 | 6,073 |
| Cerner Corp. | | 1,805 | 123,733 |
| Change Healthcare, Inc. | | 1,236 | 13,843 |
| Computer Programs & Systems, Inc. | | 60 | 1,367 |
| Evolent Health, Inc. (a) | | 426 | 3,033 |
| Health Catalyst, Inc. | | 41 | 1,196 |
| HealthStream, Inc. (a) | | 162 | 3,585 |
| HMS Holdings Corp. (a) | | 542 | 17,555 |
| Inovalon Holdings, Inc. Class A (a) | | 429 | 8,263 |
| Inspire Medical Systems, Inc. (a) | | 114 | 9,920 |
| Nextgen Healthcare, Inc. (a) | | 253 | 2,778 |
| Omnicell, Inc. (a) | | 237 | 16,737 |
| OptimizeRx Corp. (a) | | 90 | 1,173 |
| Phreesia, Inc. | | 91 | 2,573 |
| Simulations Plus, Inc. | | 68 | 4,068 |
| Tabula Rasa HealthCare, Inc. (a)(b) | | 111 | 6,075 |
| Teladoc Health, Inc. (a)(b) | | 440 | 83,970 |
| Veeva Systems, Inc. Class A (a) | | 795 | 186,364 |
| Vocera Communications, Inc. (a) | | 166 | 3,519 |
| | | | 495,825 |
| Life Sciences Tools & Services - 1.1% | | | |
| Adaptive Biotechnologies Corp. | | 127 | 6,144 |
| Agilent Technologies, Inc. | | 1,810 | 159,950 |
| Avantor, Inc. (a) | | 1,566 | 26,622 |
| Bio-Rad Laboratories, Inc. Class A (a) | | 127 | 57,339 |
| Bio-Techne Corp. | | 225 | 59,416 |
| Bruker Corp. | | 573 | 23,310 |
| Charles River Laboratories International, Inc. (a) | | 294 | 51,259 |
| Codexis, Inc. (a)(b) | | 305 | 3,477 |
| Fluidigm Corp. (a)(b) | | 464 | 1,861 |
| Frontage Holdings Corp. (a)(d) | | 4,000 | 2,477 |
| Illumina, Inc. (a) | | 857 | 317,390 |
| IQVIA Holdings, Inc. (a) | | 1,035 | 146,846 |
| Luminex Corp. (b) | | 233 | 7,579 |
| Medpace Holdings, Inc. (a)(b) | | 152 | 14,139 |
| Mettler-Toledo International, Inc. (a) | | 143 | 115,194 |
| Nanostring Technologies, Inc. (a)(b) | | 199 | 5,841 |
| NeoGenomics, Inc. (a)(b) | | 698 | 21,624 |
| Pacific Biosciences of California, Inc. (a)(b) | | 896 | 3,091 |
| PerkinElmer, Inc. | | 662 | 64,936 |
| PRA Health Sciences, Inc. (a) | | 385 | 37,457 |
| Quanterix Corp. (a) | | 80 | 2,191 |
| Syneos Health, Inc. (a) | | 351 | 20,446 |
| Thermo Fisher Scientific, Inc. | | 2,312 | 837,730 |
| Waters Corp. (a) | | 364 | 65,666 |
| | | | 2,051,985 |
| Pharmaceuticals - 3.8% | | | |
| AcelRx Pharmaceuticals, Inc. (a) | | 380 | 460 |
| Aerie Pharmaceuticals, Inc. (a)(b) | | 218 | 3,218 |
| Akcea Therapeutics, Inc. (a) | | 162 | 2,219 |
| AMAG Pharmaceuticals, Inc. (a)(b) | | 165 | 1,262 |
| Amneal Pharmaceuticals, Inc. (a) | | 623 | 2,965 |
| Amphastar Pharmaceuticals, Inc. (a) | | 203 | 4,559 |
| ANI Pharmaceuticals, Inc. (a) | | 53 | 1,714 |
| Arvinas Holding Co. LLC (a) | | 78 | 2,616 |
| Assertio Holdings, Inc. (a) | | 321 | 275 |
| Axsome Therapeutics, Inc. (a)(b) | | 151 | 12,424 |
| Biodelivery Sciences International, Inc. (a) | | 497 | 2,167 |
| Bristol-Myers Squibb Co. | | 13,240 | 778,512 |
| Cara Therapeutics, Inc. (a)(b) | | 237 | 4,053 |
| Catalent, Inc. (a) | | 923 | 67,656 |
| Chiasma, Inc. (a)(b) | | 219 | 1,178 |
| Collegium Pharmaceutical, Inc. (a) | | 169 | 2,958 |
| Corcept Therapeutics, Inc. (a)(b) | | 550 | 9,251 |
| CorMedix, Inc. (a)(b) | | 154 | 970 |
| CymaBay Therapeutics, Inc. (a)(b) | | 265 | 925 |
| Durect Corp. (a)(b) | | 1,081 | 2,508 |
| Elanco Animal Health, Inc. (a) | | 2,362 | 50,665 |
| Eli Lilly & Co. | | 4,922 | 808,094 |
| Endo International PLC (a) | | 1,090 | 3,739 |
| Evofem Biosciences, Inc. (a) | | 74 | 209 |
| Evolus, Inc. (a)(b) | | 146 | 774 |
| Horizon Pharma PLC (a) | | 1,125 | 62,528 |
| Innoviva, Inc. (a)(b) | | 369 | 5,159 |
| Intersect ENT, Inc. (a) | | 173 | 2,342 |
| Intra-Cellular Therapies, Inc. (a) | | 307 | 7,881 |
| Jazz Pharmaceuticals PLC (a) | | 344 | 37,957 |
| Johnson & Johnson | | 15,430 | 2,169,921 |
| Kala Pharmaceuticals, Inc. (a) | | 377 | 3,962 |
| Lannett Co., Inc. (a) | | 145 | 1,053 |
| Mallinckrodt PLC (a)(b) | | 557 | 1,493 |
| Merck & Co., Inc. | | 14,794 | 1,144,020 |
| Mylan NV (a) | | 3,060 | 49,205 |
| MyoKardia, Inc. (a) | | 300 | 28,986 |
| Nektar Therapeutics (a)(b) | | 1,001 | 23,183 |
| Ocular Therapeutix, Inc. (a) | | 539 | 4,490 |
| Odonate Therapeutics, Inc. (a) | | 65 | 2,752 |
| Omeros Corp. (a)(b) | | 316 | 4,652 |
| OptiNose, Inc. (a) | | 74 | 551 |
| Pacira Biosciences, Inc. (a) | | 238 | 12,488 |
| Perrigo Co. PLC | | 807 | 44,603 |
| Pfizer, Inc. | | 32,584 | 1,065,497 |
| Phibro Animal Health Corp. Class A | | 127 | 3,336 |
| Prestige Brands Holdings, Inc. (a) | | 306 | 11,493 |
| Reata Pharmaceuticals, Inc. (a)(b) | | 164 | 25,587 |
| Revance Therapeutics, Inc. (a) | | 342 | 8,352 |
| Supernus Pharmaceuticals, Inc. (a) | | 298 | 7,078 |
| TherapeuticsMD, Inc. (a)(b) | | 1,083 | 1,354 |
| Theravance Biopharma, Inc. (a)(b) | | 268 | 5,625 |
| Tricida, Inc. (a)(b) | | 152 | 4,177 |
| WAVE Life Sciences (a) | | 101 | 1,051 |
| Xeris Pharmaceuticals, Inc. (a)(b) | | 264 | 702 |
| Zoetis, Inc. Class A | | 2,780 | 380,971 |
| Zogenix, Inc.(a) | | 321 | 8,670 |
| Zynerba Pharmaceuticals, Inc. (a)(b) | | 105 | 354 |
| | | | 6,896,844 |
|
| TOTAL HEALTH CARE | | | 26,214,924 |
|
| INDUSTRIALS - 8.3% | | | |
| Aerospace & Defense - 1.6% | | | |
| AAR Corp. | | 187 | 3,865 |
| Aerojet Rocketdyne Holdings, Inc. (a) | | 407 | 16,133 |
| AeroVironment, Inc. (a) | | 128 | 10,193 |
| Astronics Corp. (a) | | 113 | 1,193 |
| Axon Enterprise, Inc. (a) | | 368 | 36,112 |
| BWX Technologies, Inc. | | 541 | 30,642 |
| Cubic Corp. (b) | | 182 | 8,741 |
| Curtiss-Wright Corp. | | 242 | 21,606 |
| Ducommun, Inc. (a) | | 49 | 1,709 |
| General Dynamics Corp. | | 1,364 | 203,863 |
| Harris Corp. | | 1,261 | 213,954 |
| HEICO Corp. (b) | | 254 | 25,311 |
| HEICO Corp. Class A | | 415 | 33,715 |
| Hexcel Corp. | | 475 | 21,480 |
| Howmet Aerospace, Inc. | | 2,321 | 36,788 |
| Huntington Ingalls Industries, Inc. | | 241 | 42,052 |
| Kratos Defense & Security Solutions, Inc. (a) | | 511 | 7,987 |
| Lockheed Martin Corp. | | 1,446 | 527,674 |
| Maxar Technologies, Inc. (b) | | 346 | 6,214 |
| Mercury Systems, Inc. (a) | | 314 | 24,699 |
| Moog, Inc. Class A | | 184 | 9,748 |
| National Presto Industries, Inc. | | 31 | 2,709 |
| Northrop Grumman Corp. | | 904 | 277,926 |
| Park Aerospace Corp. | | 127 | 1,415 |
| Parsons Corp. (a) | | 110 | 3,986 |
| Raytheon Technologies Corp. | | 8,627 | 531,596 |
| Spirit AeroSystems Holdings, Inc. Class A | | 586 | 14,029 |
| Teledyne Technologies, Inc.(a) | | 214 | 66,543 |
| Textron, Inc. | | 1,369 | 45,054 |
| The Boeing Co. | | 3,145 | 576,479 |
| TransDigm Group, Inc. | | 293 | 129,521 |
| Triumph Group, Inc. | | 297 | 2,676 |
| Vectrus, Inc. (a) | | 59 | 2,899 |
| | | | 2,938,512 |
| Air Freight & Logistics - 0.5% | | | |
| Air Transport Services Group, Inc. (a) | | 351 | 7,817 |
| Atlas Air Worldwide Holdings, Inc. (a) | | 148 | 6,368 |
| C.H. Robinson Worldwide, Inc. | | 794 | 62,774 |
| Echo Global Logistics, Inc. (a) | | 171 | 3,697 |
| Expeditors International of Washington, Inc. | | 995 | 75,660 |
| FedEx Corp. | | 1,403 | 196,729 |
| Forward Air Corp. | | 153 | 7,622 |
| Hub Group, Inc. Class A (a) | | 189 | 9,046 |
| United Parcel Service, Inc. Class B | | 4,125 | 458,618 |
| XPO Logistics, Inc. (a) | | 522 | 40,325 |
| | | | 868,656 |
| Airlines - 0.2% | | | |
| Alaska Air Group, Inc. | | 699 | 25,346 |
| Allegiant Travel Co. | | 72 | 7,863 |
| American Airlines Group, Inc. (b) | | 2,912 | 38,060 |
| Delta Air Lines, Inc. | | 3,380 | 94,809 |
| Hawaiian Holdings, Inc. (b) | | 257 | 3,608 |
| JetBlue Airways Corp. (a) | | 1,653 | 18,018 |
| Mesa Air Group, Inc. (a) | | 77 | 265 |
| SkyWest, Inc. | | 280 | 9,134 |
| Southwest Airlines Co. | | 3,070 | 104,933 |
| Spirit Airlines, Inc. (a)(b) | | 500 | 8,900 |
| United Airlines Holdings, Inc. (a)(b) | | 1,453 | 50,288 |
| | | | 361,224 |
| Building Products - 0.5% | | | |
| A.O. Smith Corp. | | 775 | 36,518 |
| AAON, Inc. | | 228 | 12,378 |
| Advanced Drain Systems, Inc. | | 297 | 14,672 |
| Allegion PLC | | 549 | 56,119 |
| American Woodmark Corp. (a) | | 88 | 6,657 |
| Apogee Enterprises, Inc. | | 137 | 3,156 |
| Armstrong World Industries, Inc. | | 272 | 21,205 |
| Builders FirstSource, Inc. (a) | | 671 | 13,890 |
| Carrier Global Corp. | | 4,765 | 105,878 |
| CSW Industrials, Inc. | | 81 | 5,598 |
| Fortune Brands Home & Security, Inc. | | 812 | 51,911 |
| Gibraltar Industries, Inc. (a) | | 185 | 8,882 |
| Griffon Corp. | | 240 | 4,445 |
| Insteel Industries, Inc. | | 111 | 2,117 |
| Jeld-Wen Holding, Inc. (a) | | 379 | 6,106 |
| Johnson Controls International PLC | | 4,398 | 150,148 |
| Lennox International, Inc. | | 208 | 48,462 |
| Masco Corp. | | 1,559 | 78,277 |
| Masonite International Corp. (a)(b) | | 146 | 11,356 |
| NCI Building Systems, Inc. (a) | | 253 | 1,533 |
| Owens Corning | | 619 | 34,515 |
| Patrick Industries, Inc. | | 132 | 8,085 |
| PGT, Inc. (a) | | 327 | 5,127 |
| Quanex Building Products Corp. | | 174 | 2,415 |
| Resideo Technologies, Inc. (a)(b) | | 725 | 8,497 |
| Simpson Manufacturing Co. Ltd. | | 227 | 19,150 |
| Trane Technologies PLC | | 1,400 | 124,572 |
| Trex Co., Inc. (a) | | 348 | 45,264 |
| Ufp Industries, Inc. | | 346 | 17,130 |
| | | | 904,063 |
| Commercial Services & Supplies - 0.5% | | | |
| ABM Industries, Inc. | | 406 | 14,738 |
| ACCO Brands Corp. | | 561 | 3,983 |
| ADS Waste Holdings, Inc. (a) | | 431 | 13,003 |
| Brady Corp. Class A | | 276 | 12,922 |
| BrightView Holdings, Inc. (a) | | 169 | 1,893 |
| Casella Waste Systems, Inc. Class A (a)(b) | | 248 | 12,926 |
| Cimpress PLC (a) | | 138 | 10,535 |
| Cintas Corp. | | 494 | 131,582 |
| Clean Harbors, Inc. (a) | | 295 | 17,694 |
| Copart, Inc. (a) | | 1,200 | 99,924 |
| Covanta Holding Corp. | | 676 | 6,483 |
| Deluxe Corp. | | 233 | 5,485 |
| Ennis, Inc. | | 158 | 2,866 |
| Harsco Corp. (a) | | 460 | 6,215 |
| Healthcare Services Group, Inc. (b) | | 431 | 10,542 |
| Herman Miller, Inc. | | 330 | 7,791 |
| HNI Corp. (b) | | 253 | 7,734 |
| IAA Spinco, Inc. (a) | | 831 | 32,052 |
| Interface, Inc. | | 325 | 2,646 |
| KAR Auction Services, Inc. | | 721 | 9,921 |
| Kimball International, Inc. Class B | | 228 | 2,636 |
| Knoll, Inc. | | 264 | 3,218 |
| Matthews International Corp. Class A | | 169 | 3,228 |
| McGrath RentCorp. | | 140 | 7,561 |
| Mobile Mini, Inc. | | 252 | 7,434 |
| MSA Safety, Inc. (b) | | 203 | 23,231 |
| Pitney Bowes, Inc. (b) | | 1,028 | 2,673 |
| Quad/Graphics, Inc. | | 110 | 358 |
| R.R. Donnelley & Sons Co. | | 324 | 386 |
| Republic Services, Inc. | | 1,228 | 100,757 |
| Rollins, Inc. | | 798 | 33,827 |
| SP Plus Corp. (a) | | 134 | 2,775 |
| Steelcase, Inc. Class A | | 518 | 6,247 |
| Stericycle, Inc. (a) | | 568 | 31,797 |
| Team, Inc. (a)(b) | | 200 | 1,114 |
| Tetra Tech, Inc. | | 337 | 26,663 |
| The Brink's Co. | | 328 | 14,927 |
| U.S. Ecology, Inc. | | 137 | 4,642 |
| UniFirst Corp. | | 86 | 15,390 |
| Viad Corp. | | 122 | 2,320 |
| Waste Management, Inc. | | 2,275 | 240,945 |
| | | | 943,064 |
| Construction & Engineering - 0.1% | | | |
| AECOM (a) | | 978 | 36,753 |
| Aegion Corp. (a) | | 158 | 2,507 |
| Ameresco, Inc. Class A (a)(b) | | 112 | 3,111 |
| Arcosa, Inc. | | 278 | 11,732 |
| Argan, Inc. | | 69 | 3,269 |
| Comfort Systems U.S.A., Inc. | | 209 | 8,517 |
| Construction Partners, Inc. Class A (a) | | 182 | 3,232 |
| Dycom Industries, Inc. (a) | | 183 | 7,483 |
| EMCOR Group, Inc. | | 321 | 21,231 |
| Fluor Corp. | | 801 | 9,676 |
| Granite Construction, Inc. (b) | | 251 | 4,804 |
| Great Lakes Dredge & Dock Corp. (a)(b) | | 349 | 3,232 |
| Jacobs Engineering Group, Inc. | | 759 | 64,363 |
| MasTec, Inc. (a)(b) | | 336 | 15,076 |
| MYR Group, Inc. (a) | | 103 | 3,287 |
| Northwest Pipe Co. (a) | | 54 | 1,354 |
| NV5 Holdings, Inc. (a) | | 59 | 2,999 |
| Primoris Services Corp. | | 266 | 4,724 |
| Quanta Services, Inc. | | 804 | 31,541 |
| Sterling Construction Co., Inc. (a) | | 156 | 1,633 |
| Tutor Perini Corp. (a) | | 192 | 2,339 |
| Valmont Industries, Inc. | | 123 | 13,975 |
| Williams Scotsman Corp. (a) | | 299 | 3,675 |
| | | | 260,513 |
| Electrical Equipment - 0.5% | | | |
| Acuity Brands, Inc. | | 243 | 23,265 |
| Allied Motion Technologies, Inc. | | 50 | 1,765 |
| American Superconductor Corp. (a) | | 124 | 1,008 |
| AMETEK, Inc. | | 1,339 | 119,666 |
| Atkore International Group, Inc. (a) | | 273 | 7,467 |
| AZZ, Inc. | | 153 | 5,251 |
| Bloom Energy Corp. Class A (a)(b) | | 157 | 1,708 |
| Eaton Corp. PLC | | 2,353 | 205,840 |
| Emerson Electric Co. | | 3,512 | 217,849 |
| Encore Wire Corp. | | 127 | 6,200 |
| EnerSys | | 237 | 15,258 |
| Generac Holdings, Inc. (a) | | 376 | 45,846 |
| GrafTech International Ltd. (b) | | 267 | 2,131 |
| Hubbell, Inc. Class B | | 333 | 41,745 |
| nVent Electric PLC | | 882 | 16,520 |
| Plug Power, Inc. (a)(b) | | 1,847 | 15,164 |
| Powell Industries, Inc. | | 48 | 1,315 |
| Regal Beloit Corp. | | 231 | 20,171 |
| Rockwell Automation, Inc. | | 676 | 143,988 |
| Sensata Technologies, Inc. PLC (a) | | 905 | 33,693 |
| Sunrun, Inc. (a) | | 442 | 8,716 |
| Thermon Group Holdings, Inc. (a) | | 201 | 2,929 |
| TPI Composites, Inc. (a) | | 180 | 4,207 |
| Vicor Corp. (a) | | 102 | 7,339 |
| Vivint Solar, Inc. (a) | | 242 | 2,396 |
| | | | 951,437 |
| Industrial Conglomerates - 1.0% | | | |
| 3M Co. | | 3,371 | 525,842 |
| Carlisle Companies, Inc. | | 336 | 40,209 |
| General Electric Co. | | 51,002 | 348,344 |
| Honeywell International, Inc. | | 4,118 | 595,422 |
| Raven Industries, Inc. | | 217 | 4,668 |
| Roper Technologies, Inc. | | 613 | 238,003 |
| | | | 1,752,488 |
| Machinery - 1.7% | | | |
| AGCO Corp. | | 371 | 20,576 |
| Alamo Group, Inc. | | 58 | 5,953 |
| Albany International Corp. Class A | | 179 | 10,509 |
| Allison Transmission Holdings, Inc. | | 673 | 24,753 |
| Altra Industrial Motion Corp. | | 364 | 11,597 |
| Astec Industries, Inc. (b) | | 127 | 5,881 |
| Barnes Group, Inc. | | 269 | 10,642 |
| Blue Bird Corp. (a) | | 106 | 1,589 |
| Briggs & Stratton Corp. (b) | | 168 | 220 |
| Caterpillar, Inc. | | 3,179 | 402,144 |
| Chart Industries, Inc. (a) | | 203 | 9,843 |
| CIRCOR International, Inc. (a) | | 118 | 3,007 |
| Colfax Corp. (a) | | 472 | 13,169 |
| Columbus McKinnon Corp. (NY Shares) | | 133 | 4,449 |
| Commercial Vehicle Group, Inc. (a) | | 157 | 454 |
| Crane Co. | | 388 | 23,070 |
| Cummins, Inc. | | 867 | 150,216 |
| Deere & Co. | | 1,834 | 288,213 |
| Donaldson Co., Inc. | | 768 | 35,727 |
| Douglas Dynamics, Inc. | | 132 | 4,636 |
| Dover Corp. | | 860 | 83,042 |
| Energy Recovery, Inc. (a)(b) | | 161 | 1,223 |
| Enerpac Tool Group Corp. Class A | | 304 | 5,350 |
| EnPro Industries, Inc. | | 123 | 6,063 |
| ESCO Technologies, Inc. | | 142 | 12,003 |
| Evoqua Water Technologies Corp. (a) | | 407 | 7,570 |
| Federal Signal Corp. | | 348 | 10,346 |
| Flowserve Corp. | | 741 | 21,133 |
| Fortive Corp. | | 1,723 | 116,578 |
| Franklin Electric Co., Inc. | | 216 | 11,344 |
| Gardner Denver Holdings, Inc. (a) | | 2,034 | 57,196 |
| Gates Industrial Corp. PLC (a)(b) | | 276 | 2,837 |
| Gorman-Rupp Co. | | 111 | 3,450 |
| Graco, Inc. | | 985 | 47,270 |
| Greenbrier Companies, Inc. (b) | | 197 | 4,482 |
| Helios Technologies, Inc. | | 165 | 6,146 |
| Hillenbrand, Inc. | | 435 | 11,775 |
| Hyster-Yale Materials Handling Class A | | 63 | 2,436 |
| IDEX Corp. | | 446 | 70,486 |
| Illinois Tool Works, Inc. | | 1,679 | 293,573 |
| ITT, Inc. | | 500 | 29,370 |
| John Bean Technologies Corp. | | 183 | 15,742 |
| Kadant, Inc. | | 66 | 6,578 |
| Kennametal, Inc. | | 461 | 13,235 |
| Lincoln Electric Holdings, Inc. | | 374 | 31,506 |
| Lindsay Corp. | | 61 | 5,625 |
| LiqTech International, Inc. (a)(b) | | 151 | 824 |
| Lydall, Inc. (a) | | 95 | 1,288 |
| Manitowoc Co., Inc. (a) | | 192 | 2,089 |
| Meritor, Inc. (a) | | 412 | 8,158 |
| Middleby Corp. (a) | | 318 | 25,103 |
| Miller Industries, Inc. | | 63 | 1,876 |
| Mueller Industries, Inc. | | 330 | 8,771 |
| Mueller Water Products, Inc. Class A | | 883 | 8,327 |
| Navistar International Corp. (a) | | 378 | 10,660 |
| NN, Inc. (b) | | 274 | 1,299 |
| Nordson Corp. | | 301 | 57,103 |
| Omega Flex, Inc. | | 16 | 1,693 |
| Oshkosh Corp. | | 413 | 29,579 |
| Otis Worldwide Corp. | | 2,376 | 135,099 |
| PACCAR, Inc. | | 2,009 | 150,374 |
| Parker Hannifin Corp. | | 757 | 138,735 |
| Pentair PLC | | 1,000 | 37,990 |
| Proto Labs, Inc. (a) | | 153 | 17,208 |
| RBC Bearings, Inc. (a) | | 143 | 19,168 |
| REV Group, Inc. | | 142 | 866 |
| Rexnord Corp. | | 694 | 20,230 |
| Snap-On, Inc. (b) | | 332 | 45,985 |
| SPX Corp. (a)(b) | | 243 | 9,999 |
| SPX Flow, Inc. (a) | | 232 | 8,686 |
| Standex International Corp. | | 77 | 4,431 |
| Stanley Black & Decker, Inc. | | 892 | 124,327 |
| Tennant Co. | | 108 | 7,021 |
| Terex Corp. | | 375 | 7,039 |
| The Shyft Group, Inc. | | 165 | 2,779 |
| Timken Co. | | 382 | 17,377 |
| Toro Co. | | 615 | 40,799 |
| TriMas Corp. (a) | | 247 | 5,916 |
| Trinity Industries, Inc. (b) | | 556 | 11,837 |
| Wabash National Corp. (b) | | 336 | 3,568 |
| Watts Water Technologies, Inc. Class A | | 160 | 12,960 |
| Welbilt, Inc. (a)(b) | | 732 | 4,458 |
| Westinghouse Air Brake Co. | | 1,078 | 62,060 |
| Woodward, Inc. | | 358 | 27,763 |
| Xylem, Inc. | | 1,065 | 69,182 |
| | | | 3,045,634 |
| Marine - 0.0% | | | |
| Eagle Bulk Shipping, Inc. (a) | | 280 | 613 |
| Genco Shipping & Trading Ltd. | | 96 | 603 |
| Kirby Corp. (a) | | 342 | 18,318 |
| Matson, Inc. | | 250 | 7,275 |
| | | | 26,809 |
| Professional Services - 0.5% | | | |
| ASGN, Inc. (a) | | 297 | 19,804 |
| Barrett Business Services, Inc. | | 42 | 2,231 |
| CBIZ, Inc. (a) | | 306 | 7,335 |
| CoreLogic, Inc. (b) | | 505 | 33,946 |
| CoStar Group, Inc. (a) | | 231 | 164,165 |
| CRA International, Inc. | | 43 | 1,699 |
| Equifax, Inc. | | 714 | 122,722 |
| Exponent, Inc. | | 304 | 24,603 |
| Forrester Research, Inc. (a) | | 68 | 2,179 |
| Franklin Covey Co. (a) | | 53 | 1,134 |
| FTI Consulting, Inc. (a) | | 223 | 25,545 |
| Heidrick & Struggles International, Inc. | | 121 | 2,616 |
| Huron Consulting Group, Inc. (a) | | 131 | 5,797 |
| ICF International, Inc. | | 110 | 7,131 |
| IHS Markit Ltd. | | 2,337 | 176,444 |
| Insperity, Inc. | | 215 | 13,917 |
| Kelly Services, Inc. Class A (non-vtg.) | | 201 | 3,179 |
| Kforce, Inc. | | 103 | 3,013 |
| Korn Ferry | | 316 | 9,711 |
| Manpower, Inc. | | 331 | 22,756 |
| MISTRAS Group, Inc. (a) | | 100 | 395 |
| Nielsen Holdings PLC | | 2,019 | 30,002 |
| Resources Connection, Inc. | | 147 | 1,760 |
| Robert Half International, Inc. | | 669 | 35,343 |
| TransUnion Holding Co., Inc. | | 1,113 | 96,876 |
| TriNet Group, Inc. (a) | | 253 | 15,418 |
| TrueBlue, Inc. (a) | | 217 | 3,314 |
| Upwork, Inc. (a) | | 314 | 4,534 |
| Verisk Analytics, Inc. | | 956 | 162,711 |
| Willdan Group, Inc. (a) | | 46 | 1,150 |
| | | | 1,001,430 |
| Road & Rail - 0.9% | | | |
| AMERCO | | 45 | 13,599 |
| ArcBest Corp. | | 157 | 4,162 |
| Avis Budget Group, Inc. (a)(b) | | 322 | 7,371 |
| Covenant Transport Group, Inc. Class A (a) | | 46 | 664 |
| CSX Corp. | | 4,498 | 313,691 |
| Heartland Express, Inc. | | 239 | 4,976 |
| J.B. Hunt Transport Services, Inc. | | 504 | 60,651 |
| Kansas City Southern | | 561 | 83,752 |
| Knight-Swift Transportation Holdings, Inc. Class A (b) | | 693 | 28,905 |
| Landstar System, Inc. | | 227 | 25,494 |
| Lyft, Inc. (a)(b) | | 1,271 | 41,956 |
| Marten Transport Ltd. | | 236 | 5,938 |
| Norfolk Southern Corp. | | 1,506 | 264,408 |
| Old Dominion Freight Lines, Inc. | | 562 | 95,310 |
| Ryder System, Inc. | | 296 | 11,103 |
| Saia, Inc. (a) | | 149 | 16,566 |
| Schneider National, Inc. Class B | | 189 | 4,663 |
| Union Pacific Corp. | | 3,974 | 671,884 |
| Universal Logistics Holdings, Inc. | | 45 | 782 |
| Werner Enterprises, Inc. | | 373 | 16,237 |
| YRC Worldwide, Inc. (a)(b) | | 116 | 215 |
| | | | 1,672,327 |
| Trading Companies & Distributors - 0.3% | | | |
| Air Lease Corp. Class A | | 592 | 17,340 |
| Applied Industrial Technologies, Inc. | | 219 | 13,663 |
| Beacon Roofing Supply, Inc. (a) | | 375 | 9,889 |
| BlueLinx Corp. (a) | | 35 | 300 |
| BMC Stock Holdings, Inc. (a) | | 386 | 9,704 |
| CAI International, Inc. (a) | | 77 | 1,283 |
| DXP Enterprises, Inc. (a) | | 76 | 1,513 |
| Fastenal Co. | | 3,354 | 143,685 |
| Foundation Building Materials, Inc. (a) | | 97 | 1,514 |
| GATX Corp. (b) | | 199 | 12,135 |
| GMS, Inc. (a) | | 242 | 5,951 |
| H&E Equipment Services, Inc. | | 169 | 3,123 |
| HD Supply Holdings, Inc. (a) | | 942 | 32,640 |
| Herc Holdings, Inc. (a) | | 141 | 4,333 |
| Kaman Corp. | | 157 | 6,531 |
| MRC Global, Inc. (a) | | 457 | 2,701 |
| MSC Industrial Direct Co., Inc. Class A | | 256 | 18,639 |
| Now, Inc. (a) | | 631 | 5,446 |
| Rush Enterprises, Inc. Class A | | 155 | 6,426 |
| SiteOne Landscape Supply, Inc. (a)(b) | | 261 | 29,746 |
| Textainer Group Holdings Ltd. (a)(b) | | 282 | 2,307 |
| Titan Machinery, Inc. (a) | | 65 | 706 |
| Triton International Ltd. (b) | | 297 | 8,981 |
| United Rentals, Inc. (a) | | 431 | 64,236 |
| Univar, Inc. (a) | | 782 | 13,185 |
| Veritiv Corp. (a) | | 66 | 1,119 |
| W.W. Grainger, Inc. | | 257 | 80,739 |
| Watsco, Inc. | | 190 | 33,763 |
| WESCO International, Inc. (a) | | 277 | 9,725 |
| | | | 541,323 |
| Transportation Infrastructure - 0.0% | | | |
| Macquarie Infrastructure Co. LLC | | 440 | 13,504 |
|
| TOTAL INDUSTRIALS | | | 15,280,984 |
|
| INFORMATION TECHNOLOGY - 25.7% | | | |
| Communications Equipment - 0.9% | | | |
| Acacia Communications, Inc. (a) | | 214 | 14,379 |
| ADTRAN, Inc. | | 389 | 4,252 |
| Applied Optoelectronics, Inc. (a) | | 70 | 761 |
| Arista Networks, Inc. (a)(b) | | 319 | 67,000 |
| CalAmp Corp. (a) | | 151 | 1,210 |
| Calix Networks, Inc. (a) | | 242 | 3,606 |
| Casa Systems, Inc. (a) | | 111 | 462 |
| Ciena Corp. (a) | | 921 | 49,881 |
| Cisco Systems, Inc. | | 24,858 | 1,159,377 |
| CommScope Holding Co., Inc. (a) | | 1,101 | 9,171 |
| Comtech Telecommunications Corp. | | 143 | 2,415 |
| Digi International, Inc. (a) | | 160 | 1,864 |
| EchoStar Holding Corp. Class A (a) | | 257 | 7,186 |
| Extreme Networks, Inc. (a) | | 746 | 3,238 |
| F5 Networks, Inc. (a) | | 363 | 50,631 |
| Harmonic, Inc. (a) | | 554 | 2,632 |
| Infinera Corp. (a)(b) | | 884 | 5,233 |
| Inseego Corp. (a)(b) | | 298 | 3,457 |
| InterDigital, Inc. | | 175 | 9,910 |
| Juniper Networks, Inc. | | 1,910 | 43,663 |
| Lumentum Holdings, Inc. (a) | | 462 | 37,621 |
| Motorola Solutions, Inc. | | 1,002 | 140,410 |
| NETGEAR, Inc. (a) | | 165 | 4,272 |
| NetScout Systems, Inc. (a) | | 369 | 9,432 |
| Plantronics, Inc. (b) | | 165 | 2,422 |
| Sonus Networks, Inc. (a) | | 674 | 2,649 |
| Ubiquiti, Inc. | | 70 | 12,219 |
| ViaSat, Inc. (a) | | 326 | 12,509 |
| Viavi Solutions, Inc. (a) | | 1,285 | 16,371 |
| | | | 1,678,233 |
| Electronic Equipment & Components - 0.7% | | | |
| Akoustis Technologies, Inc.(a)(b) | | 144 | 1,194 |
| Amphenol Corp. Class A | | 1,740 | 166,709 |
| Arlo Technologies, Inc. (a) | | 335 | 864 |
| Arrow Electronics, Inc. (a) | | 461 | 31,666 |
| Avnet, Inc. | | 571 | 15,922 |
| Badger Meter, Inc. (b) | | 165 | 10,382 |
| Belden, Inc. | | 223 | 7,259 |
| Benchmark Electronics, Inc. | | 211 | 4,558 |
| CDW Corp. | | 847 | 98,404 |
| Cognex Corp. | | 1,012 | 60,437 |
| Coherent, Inc. (a) | | 137 | 17,944 |
| Corning, Inc. | | 4,538 | 117,534 |
| CTS Corp. | | 177 | 3,547 |
| Dolby Laboratories, Inc. Class A | | 408 | 26,875 |
| ePlus, Inc. (a) | | 82 | 5,796 |
| Fabrinet (a) | | 230 | 14,357 |
| FARO Technologies, Inc. (a) | | 102 | 5,467 |
| Fitbit, Inc. (a) | | 1,299 | 8,392 |
| FLIR Systems, Inc. | | 760 | 30,833 |
| II-VI, Inc. (a)(b) | | 494 | 23,327 |
| Insight Enterprises, Inc. (a) | | 201 | 9,889 |
| IPG Photonics Corp. (a) | | 203 | 32,559 |
| Itron, Inc. (a) | | 200 | 13,250 |
| Jabil, Inc. | | 784 | 25,151 |
| Keysight Technologies, Inc. (a) | | 1,101 | 110,959 |
| Knowles Corp. (a) | | 459 | 7,004 |
| Littelfuse, Inc. | | 137 | 23,376 |
| Luna Innovations, Inc. (a)(b) | | 119 | 695 |
| Methode Electronics, Inc. Class A | | 222 | 6,940 |
| MTS Systems Corp. | | 93 | 1,636 |
| Napco Security Technolgies, Inc. (a) | | 63 | 1,474 |
| National Instruments Corp. | | 668 | 25,858 |
| nLIGHT, Inc. (a)(b) | | 186 | 4,140 |
| Novanta, Inc. (a) | | 198 | 21,140 |
| OSI Systems, Inc. (a) | | 98 | 7,315 |
| Par Technology Corp. (a) | | 70 | 2,095 |
| PC Connection, Inc. | | 66 | 3,060 |
| Plexus Corp. (a) | | 164 | 11,572 |
| Rogers Corp. (a)(b) | | 107 | 13,332 |
| Sanmina Corp. (a) | | 386 | 9,665 |
| ScanSource, Inc. (a) | | 156 | 3,758 |
| SYNNEX Corp. | | 261 | 31,260 |
| TE Connectivity Ltd. | | 1,962 | 160,001 |
| Trimble, Inc. (a) | | 1,494 | 64,526 |
| TTM Technologies, Inc. (a) | | 554 | 6,570 |
| Vishay Intertechnology, Inc. | | 748 | 11,422 |
| Vishay Precision Group, Inc. (a) | | 59 | 1,450 |
| Zebra Technologies Corp. Class A (a) | | 318 | 81,392 |
| | | | 1,342,956 |
| IT Services - 5.4% | | | |
| Accenture PLC Class A | | 3,725 | 799,832 |
| Akamai Technologies, Inc. (a) | | 943 | 100,986 |
| Alliance Data Systems Corp. | | 232 | 10,468 |
| Amdocs Ltd. | | 797 | 48,521 |
| Automatic Data Processing, Inc. | | 2,516 | 374,607 |
| Black Knight, Inc. (a) | | 874 | 63,417 |
| Booz Allen Hamilton Holding Corp. Class A | | 817 | 63,554 |
| Brightcove, Inc. (a) | | 204 | 1,608 |
| Broadridge Financial Solutions, Inc. | | 671 | 84,673 |
| CACI International, Inc. Class A (a) | | 151 | 32,749 |
| Cardtronics PLC (a)(b) | | 211 | 5,060 |
| Cass Information Systems, Inc. | | 73 | 2,849 |
| Cognizant Technology Solutions Corp. Class A | | 3,201 | 181,881 |
| Conduent, Inc. (a) | | 994 | 2,376 |
| CSG Systems International, Inc. | | 193 | 7,988 |
| DXC Technology Co. | | 1,450 | 23,925 |
| Endurance International Group Holdings, Inc. (a) | | 535 | 2,156 |
| EPAM Systems, Inc. (a) | | 323 | 81,399 |
| Euronet Worldwide, Inc. (a) | | 306 | 29,321 |
| EVERTEC, Inc. | | 326 | 9,161 |
| EVO Payments, Inc. Class A (a) | | 232 | 5,297 |
| ExlService Holdings, Inc. (a) | | 192 | 12,173 |
| Fastly, Inc. Class A (a)(b) | | 108 | 9,194 |
| Fidelity National Information Services, Inc. | | 3,615 | 484,735 |
| Fiserv, Inc. (a) | | 3,294 | 321,560 |
| FleetCor Technologies, Inc. (a) | | 496 | 124,759 |
| Gartner, Inc. (a) | | 526 | 63,820 |
| Genpact Ltd. | | 949 | 34,657 |
| Global Payments, Inc. | | 1,753 | 297,344 |
| GoDaddy, Inc. (a) | | 975 | 71,497 |
| GreenSky, Inc. Class A (a)(b) | | 213 | 1,044 |
| GTT Communications, Inc. (a)(b) | | 132 | 1,077 |
| Hackett Group, Inc. | | 159 | 2,153 |
| i3 Verticals, Inc. Class A (a) | | 81 | 2,450 |
| IBM Corp. | | 5,201 | 628,125 |
| International Money Express, Inc. (a) | | 142 | 1,769 |
| Jack Henry & Associates, Inc. | | 450 | 82,814 |
| KBR, Inc. | | 816 | 18,401 |
| Leidos Holdings, Inc. | | 780 | 73,063 |
| Limelight Networks, Inc. (a) | | 717 | 5,277 |
| Liveramp Holdings, Inc. (a) | | 384 | 16,308 |
| ManTech International Corp. Class A | | 153 | 10,479 |
| MasterCard, Inc. Class A | | 5,170 | 1,528,769 |
| Maximus, Inc. | | 377 | 26,560 |
| MongoDB, Inc. Class A (a)(b) | | 215 | 48,663 |
| NIC, Inc. | | 422 | 9,689 |
| Okta, Inc. (a) | | 683 | 136,757 |
| Paychex, Inc. | | 1,861 | 140,971 |
| PayPal Holdings, Inc. (a) | | 6,877 | 1,198,180 |
| Paysign, Inc. (a)(b) | | 151 | 1,466 |
| Perficient, Inc. (a) | | 188 | 6,727 |
| Perspecta, Inc. | | 794 | 18,445 |
| Repay Holdings Corp. (a) | | 275 | 6,773 |
| Sabre Corp. | | 1,549 | 12,485 |
| Science Applications International Corp. | | 310 | 24,081 |
| Square, Inc. (a) | | 2,004 | 210,300 |
| Switch, Inc. Class A | | 306 | 5,453 |
| Sykes Enterprises, Inc. (a) | | 211 | 5,836 |
| The Western Union Co. | | 2,468 | 53,358 |
| Ttec Holdings, Inc. | | 105 | 4,889 |
| Twilio, Inc. Class A (a) | | 756 | 165,882 |
| Unisys Corp. (a) | | 299 | 3,262 |
| VeriSign, Inc. (a) | | 604 | 124,925 |
| Verra Mobility Corp. (a) | | 735 | 7,556 |
| Virtusa Corp. (a) | | 169 | 5,487 |
| Visa, Inc. Class A | | 9,866 | 1,905,815 |
| WEX, Inc. (a) | | 253 | 41,748 |
| | | | 9,888,604 |
| Semiconductors & Semiconductor Equipment - 4.4% | | | |
| ACM Research, Inc. (a) | | 51 | 3,180 |
| Advanced Energy Industries, Inc. (a) | | 219 | 14,846 |
| Advanced Micro Devices, Inc. (a) | | 6,820 | 358,800 |
| Alpha & Omega Semiconductor Ltd. (a) | | 107 | 1,164 |
| Ambarella, Inc. (a) | | 178 | 8,152 |
| Amkor Technology, Inc. (a) | | 598 | 7,361 |
| Analog Devices, Inc. | | 2,149 | 263,553 |
| Applied Materials, Inc. | | 5,392 | 325,946 |
| Axcelis Technologies, Inc. (a) | | 167 | 4,651 |
| Broadcom, Inc. | | 2,342 | 739,159 |
| Brooks Automation, Inc. | | 479 | 21,191 |
| Cabot Microelectronics Corp. | | 165 | 23,024 |
| Ceva, Inc. (a) | | 115 | 4,303 |
| Cirrus Logic, Inc. (a) | | 348 | 21,499 |
| Cohu, Inc. (b) | | 243 | 4,214 |
| Cree, Inc. (a) | | 659 | 39,006 |
| Diodes, Inc. (a) | | 227 | 11,509 |
| DSP Group, Inc. (a) | | 130 | 2,064 |
| Enphase Energy, Inc. (a) | | 456 | 21,692 |
| Entegris, Inc. | | 808 | 47,712 |
| First Solar, Inc. (a)(b) | | 432 | 21,384 |
| FormFactor, Inc. (a) | | 431 | 12,641 |
| Ichor Holdings Ltd. (a) | | 129 | 3,429 |
| Impinj, Inc. (a) | | 72 | 1,978 |
| Inphi Corp. (a) | | 285 | 33,488 |
| Intel Corp. | | 24,798 | 1,483,664 |
| KLA-Tencor Corp. | | 907 | 176,393 |
| Kulicke & Soffa Industries, Inc. | | 348 | 7,249 |
| Lam Research Corp. | | 847 | 273,971 |
| Lattice Semiconductor Corp. (a) | | 745 | 21,151 |
| MACOM Technology Solutions Holdings, Inc. (a) | | 253 | 8,691 |
| Marvell Technology Group Ltd. | | 3,897 | 136,629 |
| Maxim Integrated Products, Inc. | | 1,595 | 96,673 |
| MaxLinear, Inc. Class A (a) | | 381 | 8,176 |
| Microchip Technology, Inc. | | 1,451 | 152,805 |
| Micron Technology, Inc. (a) | | 6,465 | 333,077 |
| MKS Instruments, Inc. | | 336 | 38,049 |
| Monolithic Power Systems, Inc. | | 252 | 59,724 |
| NeoPhotonics Corp. (a) | | 274 | 2,433 |
| NVE Corp. | | 22 | 1,360 |
| NVIDIA Corp. | | 3,603 | 1,368,816 |
| ON Semiconductor Corp. (a) | | 2,349 | 46,557 |
| Onto Innovation, Inc. (a) | | 278 | 9,463 |
| PDF Solutions, Inc. (a) | | 137 | 2,680 |
| Photronics, Inc. (a) | | 359 | 3,996 |
| Power Integrations, Inc. (b) | | 191 | 22,563 |
| Qorvo, Inc. (a) | | 685 | 75,713 |
| Qualcomm, Inc. | | 6,595 | 601,530 |
| Rambus, Inc. (a) | | 633 | 9,622 |
| Semtech Corp. (a) | | 373 | 19,478 |
| Silicon Laboratories, Inc. (a) | | 275 | 27,574 |
| Skyworks Solutions, Inc. | | 979 | 125,175 |
| SMART Global Holdings, Inc. (a) | | 81 | 2,202 |
| SolarEdge Technologies, Inc. (a) | | 296 | 41,079 |
| SunPower Corp. (a)(b) | | 527 | 4,037 |
| Synaptics, Inc. (a) | | 188 | 11,303 |
| Teradyne, Inc. | | 990 | 83,665 |
| Texas Instruments, Inc. | | 5,379 | 682,972 |
| Ultra Clean Holdings, Inc. (a) | | 225 | 5,092 |
| Universal Display Corp. | | 243 | 36,358 |
| Veeco Instruments, Inc. (a)(b) | | 249 | 3,359 |
| Xilinx, Inc. | | 1,438 | 141,485 |
| | | | 8,120,710 |
| Software - 9.2% | | | |
| 2U, Inc. (a)(b) | | 360 | 13,666 |
| 8x8, Inc. (a)(b) | | 567 | 9,072 |
| A10 Networks, Inc. (a) | | 371 | 2,527 |
| ACI Worldwide, Inc. (a) | | 660 | 17,813 |
| Adobe, Inc. (a) | | 2,820 | 1,227,574 |
| Agilysys, Inc. (a) | | 115 | 2,063 |
| Alarm.com Holdings, Inc. (a) | | 246 | 15,943 |
| Altair Engineering, Inc. Class A (a)(b) | | 217 | 8,626 |
| Alteryx, Inc. Class A (a)(b) | | 296 | 48,627 |
| Anaplan, Inc. (a) | | 553 | 25,056 |
| ANSYS, Inc. (a) | | 501 | 146,157 |
| AppFolio, Inc. (a) | | 81 | 13,180 |
| Appian Corp. Class A (a)(b) | | 194 | 9,943 |
| Aspen Technology, Inc. (a) | | 406 | 42,066 |
| Asure Software, Inc. (a) | | 112 | 720 |
| Autodesk, Inc. (a) | | 1,286 | 307,598 |
| Avalara, Inc. (a) | | 407 | 54,168 |
| Avaya Holdings Corp. (a)(b) | | 554 | 6,847 |
| Benefitfocus, Inc. (a) | | 195 | 2,098 |
| Blackbaud, Inc. | | 276 | 15,754 |
| BlackLine, Inc. (a) | | 280 | 23,215 |
| Bottomline Technologies, Inc. (a) | | 208 | 10,560 |
| Box, Inc. Class A (a) | | 915 | 18,995 |
| Cadence Design Systems, Inc. (a) | | 1,645 | 157,854 |
| CDK Global, Inc. | | 686 | 28,414 |
| Cerence, Inc. (a)(b) | | 219 | 8,944 |
| Ceridian HCM Holding, Inc. (a) | | 580 | 45,977 |
| Citrix Systems, Inc. | | 672 | 99,396 |
| Cloudera, Inc. (a) | | 1,391 | 17,694 |
| CommVault Systems, Inc. (a) | | 246 | 9,520 |
| Cornerstone OnDemand, Inc. (a) | | 372 | 14,344 |
| Coupa Software, Inc. (a) | | 393 | 108,877 |
| Crowdstrike Holdings, Inc. | | 118 | 11,834 |
| Digimarc Corp. (a) | | 81 | 1,295 |
| Digital Turbine, Inc. (a) | | 353 | 4,437 |
| DocuSign, Inc. (a) | | 762 | 131,224 |
| Domo, Inc. Class B (a) | | 114 | 3,667 |
| Dropbox, Inc. Class A (a) | | 1,223 | 26,625 |
| Dynatrace, Inc. | | 916 | 37,190 |
| Ebix, Inc. (b) | | 121 | 2,706 |
| Elastic NV (a) | | 218 | 20,102 |
| Envestnet, Inc. (a) | | 337 | 24,783 |
| Everbridge, Inc. (a) | | 213 | 29,471 |
| Fair Isaac Corp. (a) | | 173 | 72,321 |
| FireEye, Inc. (a)(b) | | 1,225 | 14,914 |
| Five9, Inc. (a) | | 374 | 41,391 |
| Forescout Technologies, Inc. (a) | | 206 | 4,367 |
| Fortinet, Inc. (a) | | 788 | 108,169 |
| Globalscape, Inc. | | 103 | 1,004 |
| Guidewire Software, Inc. (a) | | 488 | 54,095 |
| HubSpot, Inc. (a) | | 246 | 55,190 |
| Intelligent Systems Corp. (a) | | 30 | 1,022 |
| Intuit, Inc. | | 1,529 | 452,875 |
| j2 Global, Inc. | | 263 | 16,624 |
| LivePerson, Inc. (a) | | 335 | 13,879 |
| LogMeIn, Inc. | | 276 | 23,397 |
| Manhattan Associates, Inc. (a) | | 371 | 34,948 |
| Microsoft Corp. | | 44,414 | 9,038,637 |
| MicroStrategy, Inc. Class A (a) | | 48 | 5,678 |
| Mitek Systems, Inc. (a) | | 228 | 2,191 |
| MobileIron, Inc. (a) | | 554 | 2,731 |
| Model N, Inc. (a) | | 150 | 5,214 |
| New Relic, Inc. (a) | | 327 | 22,530 |
| Nortonlifelock, Inc. | | 3,196 | 63,377 |
| Nuance Communications, Inc. (a) | | 1,690 | 42,765 |
| Nutanix, Inc. Class A (a) | | 826 | 19,580 |
| Onespan, Inc. (a) | | 197 | 5,502 |
| Oracle Corp. | | 12,183 | 673,354 |
| Palo Alto Networks, Inc. (a) | | 573 | 131,601 |
| Parametric Technology Corp. (a) | | 625 | 48,619 |
| Pareteum Corp. (a)(b) | | 313 | 194 |
| Paycom Software, Inc. (a) | | 289 | 89,512 |
| Paylocity Holding Corp. (a)(b) | | 207 | 30,199 |
| Pegasystems, Inc. | | 215 | 21,752 |
| Pluralsight, Inc. (a) | | 466 | 8,411 |
| Progress Software Corp. | | 258 | 9,998 |
| Proofpoint, Inc. (a) | | 334 | 37,114 |
| PROS Holdings, Inc. (a) | | 223 | 9,908 |
| Q2 Holdings, Inc. (a) | | 280 | 24,021 |
| QAD, Inc. Class A | | 63 | 2,601 |
| Qualys, Inc. (a) | | 188 | 19,556 |
| Rapid7, Inc. (a) | | 255 | 13,010 |
| RealPage, Inc. (a) | | 495 | 32,180 |
| RingCentral, Inc. (a) | | 452 | 128,825 |
| SailPoint Technologies Holding, Inc. (a)(b) | | 478 | 12,653 |
| Salesforce.com, Inc. (a) | | 5,282 | 989,477 |
| SecureWorks Corp. (a) | | 46 | 526 |
| ServiceNow, Inc. (a) | | 1,118 | 452,857 |
| ShotSpotter, Inc. (a) | | 54 | 1,361 |
| Smartsheet, Inc. (a) | | 559 | 28,464 |
| Smith Micro Software, Inc. (a)(b) | | 172 | 767 |
| SolarWinds, Inc. (a)(b) | | 368 | 6,503 |
| Splunk, Inc. (a) | | 936 | 185,983 |
| SPS Commerce, Inc. (a) | | 197 | 14,799 |
| SS&C Technologies Holdings, Inc. | | 1,309 | 73,932 |
| SurveyMonkey (a) | | 509 | 11,982 |
| Synchronoss Technologies, Inc. (a) | | 197 | 695 |
| Synopsys, Inc. (a) | | 881 | 171,795 |
| TeleNav, Inc. (a) | | 210 | 1,153 |
| Tenable Holdings, Inc. (a) | | 239 | 7,125 |
| Teradata Corp. (a) | | 630 | 13,104 |
| The Trade Desk, Inc. (a)(b) | | 244 | 99,186 |
| Tyler Technologies, Inc. (a) | | 238 | 82,557 |
| Upland Software, Inc. (a) | | 127 | 4,415 |
| Varonis Systems, Inc. (a) | | 206 | 18,227 |
| Verint Systems, Inc. (a) | | 377 | 17,033 |
| VirnetX Holding Corp. (b) | | 385 | 2,503 |
| VMware, Inc. Class A (a)(b) | | 460 | 71,236 |
| Workday, Inc. Class A (a) | | 963 | 180,428 |
| Workiva, Inc. (a) | | 214 | 11,447 |
| Xperi Holding Corp. | | 594 | 8,767 |
| Yext, Inc. (a) | | 530 | 8,803 |
| Zendesk, Inc. (a) | | 670 | 59,315 |
| Zix Corp. (a) | | 261 | 1,801 |
| Zoom Video Communications, Inc. Class A (a)(b) | | 165 | 41,834 |
| Zscaler, Inc. (a)(b) | | 397 | 43,472 |
| Zuora, Inc. (a) | | 393 | 5,011 |
| | | | 16,819,089 |
| Technology Hardware, Storage & Peripherals - 5.1% | | | |
| 3D Systems Corp. (a)(b) | | 692 | 4,837 |
| Apple, Inc. | | 23,863 | 8,705,222 |
| Avid Technology, Inc. (a)(b) | | 185 | 1,345 |
| Dell Technologies, Inc. (a) | | 943 | 51,808 |
| Diebold Nixdorf, Inc. (a)(b) | | 478 | 2,897 |
| Hewlett Packard Enterprise Co. | | 7,629 | 74,230 |
| HP, Inc. | | 8,476 | 147,737 |
| Immersion Corp. (a) | | 125 | 779 |
| NCR Corp. (a) | | 721 | 12,488 |
| NetApp, Inc. | | 1,277 | 56,660 |
| Pure Storage, Inc. Class A (a) | | 1,276 | 22,113 |
| Seagate Technology LLC | | 1,359 | 65,789 |
| Western Digital Corp. | | 1,755 | 77,483 |
| Xerox Holdings Corp. | | 1,052 | 16,085 |
| | | | 9,239,473 |
|
| TOTAL INFORMATION TECHNOLOGY | | | 47,089,065 |
|
| MATERIALS - 2.6% | | | |
| Chemicals - 1.7% | | | |
| Advanced Emissions Solutions, Inc. | | 95 | 461 |
| AdvanSix, Inc. (a) | | 134 | 1,573 |
| Air Products & Chemicals, Inc. | | 1,286 | 310,518 |
| Albemarle Corp. U.S. | | 610 | 47,098 |
| American Vanguard Corp. | | 207 | 2,848 |
| Amyris, Inc. (a)(b) | | 218 | 931 |
| Ashland Global Holdings, Inc. | | 416 | 28,746 |
| Axalta Coating Systems Ltd. (a) | | 1,184 | 26,699 |
| Balchem Corp. | | 182 | 17,265 |
| Cabot Corp. | | 316 | 11,708 |
| Celanese Corp. Class A | | 696 | 60,093 |
| CF Industries Holdings, Inc. | | 1,314 | 36,976 |
| Chase Corp. | | 45 | 4,613 |
| Corteva, Inc. | | 4,403 | 117,956 |
| Dow, Inc. | | 4,341 | 176,939 |
| DuPont de Nemours, Inc. | | 4,285 | 227,662 |
| Eastman Chemical Co. | | 788 | 54,876 |
| Ecolab, Inc. | | 1,448 | 288,080 |
| Element Solutions, Inc. (a) | | 1,253 | 13,595 |
| Ferro Corp. (a) | | 464 | 5,540 |
| FMC Corp. | | 764 | 76,110 |
| GCP Applied Technologies, Inc. (a) | | 305 | 5,667 |
| H.B. Fuller Co. | | 288 | 12,845 |
| Huntsman Corp. | | 1,283 | 23,056 |
| Ingevity Corp. (a) | | 231 | 12,144 |
| Innospec, Inc. | | 138 | 10,661 |
| International Flavors & Fragrances, Inc. (b) | | 628 | 76,905 |
| Intrepid Potash, Inc. (a) | | 452 | 447 |
| Koppers Holdings, Inc. (a) | | 132 | 2,487 |
| Kraton Performance Polymers, Inc. (a) | | 203 | 3,508 |
| Kronos Worldwide, Inc. (b) | | 103 | 1,072 |
| Linde PLC | | 3,080 | 653,299 |
| Livent Corp. (a)(b) | | 829 | 5,107 |
| LyondellBasell Industries NV Class A | | 1,507 | 99,040 |
| Minerals Technologies, Inc. | | 188 | 8,823 |
| NewMarket Corp. | | 42 | 16,820 |
| Olin Corp. | | 920 | 10,571 |
| PolyOne Corp. | | 510 | 13,377 |
| PPG Industries, Inc. | | 1,387 | 147,105 |
| PQ Group Holdings, Inc. (a) | | 231 | 3,058 |
| Quaker Chemical Corp. | | 75 | 13,924 |
| Rayonier Advanced Materials, Inc. | | 220 | 618 |
| RPM International, Inc. | | 765 | 57,421 |
| Sensient Technologies Corp. | | 240 | 12,518 |
| Sherwin-Williams Co. | | 474 | 273,901 |
| Stepan Co. | | 115 | 11,167 |
| The Chemours Co. LLC | | 918 | 14,091 |
| The Mosaic Co. | | 1,981 | 24,782 |
| The Scotts Miracle-Gro Co. Class A | | 232 | 31,197 |
| Tredegar Corp. | | 136 | 2,094 |
| Trinseo SA (b) | | 216 | 4,787 |
| Tronox Holdings PLC | | 498 | 3,596 |
| Valvoline, Inc. | | 1,066 | 20,606 |
| Venator Materials PLC (a) | | 255 | 456 |
| W.R. Grace & Co. | | 317 | 16,107 |
| Westlake Chemical Corp. | | 203 | 10,891 |
| | | | 3,114,435 |
| Construction Materials - 0.1% | | | |
| Eagle Materials, Inc. | | 235 | 16,502 |
| Forterra, Inc. (a) | | 139 | 1,551 |
| Martin Marietta Materials, Inc. | | 369 | 76,224 |
| Summit Materials, Inc. (a) | | 625 | 10,050 |
| U.S. Concrete, Inc. (a) | | 82 | 2,034 |
| Vulcan Materials Co. | | 777 | 90,015 |
| | | | 196,376 |
| Containers & Packaging - 0.4% | | | |
| Amcor PLC | | 9,104 | 92,952 |
| Aptargroup, Inc. | | 380 | 42,552 |
| Avery Dennison Corp. | | 493 | 56,246 |
| Ball Corp. | | 1,907 | 132,517 |
| Berry Global Group, Inc. (a) | | 747 | 33,107 |
| Crown Holdings, Inc. (a) | | 806 | 52,495 |
| Graphic Packaging Holding Co. | | 1,633 | 22,846 |
| Greif, Inc. Class A | | 152 | 5,230 |
| International Paper Co. | | 2,330 | 82,039 |
| Myers Industries, Inc. | | 229 | 3,332 |
| O-I Glass, Inc. | | 897 | 8,055 |
| Packaging Corp. of America | | 564 | 56,287 |
| Sealed Air Corp. | | 881 | 28,941 |
| Silgan Holdings, Inc. | | 442 | 14,316 |
| Sonoco Products Co. | | 636 | 33,256 |
| UFP Technologies, Inc. (a) | | 36 | 1,586 |
| WestRock Co. | | 1,549 | 43,775 |
| | | | 709,532 |
| Metals & Mining - 0.4% | | | |
| Alcoa Corp. (a) | | 1,041 | 11,701 |
| Allegheny Technologies, Inc. (a) | | 727 | 7,408 |
| Arconic Rolled Products Corp. (a) | | 547 | 7,620 |
| Carpenter Technology Corp. | | 267 | 6,483 |
| Century Aluminum Co. (a)(b) | | 213 | 1,519 |
| Cleveland-Cliffs, Inc. (b) | | 2,265 | 12,503 |
| Coeur d'Alene Mines Corp. (a) | | 1,361 | 6,914 |
| Commercial Metals Co. | | 672 | 13,709 |
| Compass Minerals International, Inc. | | 195 | 9,506 |
| Contura Energy, Inc. (a) | | 151 | 459 |
| Freeport-McMoRan, Inc. | | 8,552 | 98,947 |
| Gold Resource Corp. | | 378 | 1,554 |
| Haynes International, Inc. | | 56 | 1,308 |
| Hecla Mining Co. | | 2,844 | 9,300 |
| Kaiser Aluminum Corp. | | 88 | 6,479 |
| Materion Corp. | | 118 | 7,256 |
| McEwen Mining, Inc. (a)(b) | | 1,869 | 1,888 |
| Newmont Corp. | | 4,709 | 290,734 |
| Nucor Corp. | | 1,786 | 73,958 |
| Reliance Steel & Aluminum Co. | | 375 | 35,599 |
| Royal Gold, Inc. | | 399 | 49,604 |
| Ryerson Holding Corp. (a) | | 91 | 512 |
| Schnitzer Steel Industries, Inc. Class A | | 163 | 2,875 |
| Steel Dynamics, Inc. | | 1,220 | 31,830 |
| SunCoke Energy, Inc. | | 492 | 1,456 |
| TimkenSteel Corp. (a)(b) | | 156 | 607 |
| United States Steel Corp. (b) | | 1,016 | 7,336 |
| Warrior Metropolitan Coal, Inc. | | 289 | 4,448 |
| Worthington Industries, Inc. | | 216 | 8,057 |
| | | | 711,570 |
| Paper & Forest Products - 0.0% | | | |
| Boise Cascade Co. | | 226 | 8,500 |
| Clearwater Paper Corp. (a) | | 102 | 3,685 |
| Domtar Corp. | | 338 | 7,135 |
| Louisiana-Pacific Corp. | | 665 | 17,057 |
| Mercer International, Inc. (SBI) | | 182 | 1,485 |
| Neenah, Inc. | | 90 | 4,451 |
| P.H. Glatfelter Co. | | 264 | 4,237 |
| Resolute Forest Products (a) | | 354 | 747 |
| Schweitzer-Mauduit International, Inc. | | 187 | 6,248 |
| Verso Corp. | | 209 | 2,500 |
| | | | 56,045 |
|
| TOTAL MATERIALS | | | 4,787,958 |
|
| REAL ESTATE - 3.5% | | | |
| Equity Real Estate Investment Trusts (REITs) - 3.4% | | | |
| Acadia Realty Trust (SBI) | | 495 | 6,425 |
| Agree Realty Corp. | | 306 | 20,107 |
| Alexander & Baldwin, Inc. | | 388 | 4,730 |
| Alexanders, Inc. | | 12 | 2,891 |
| Alexandria Real Estate Equities, Inc. | | 743 | 120,552 |
| American Assets Trust, Inc. | | 271 | 7,545 |
| American Campus Communities, Inc. | | 784 | 27,409 |
| American Finance Trust, Inc. | | 602 | 4,777 |
| American Homes 4 Rent Class A | | 1,521 | 40,915 |
| American Tower Corp. | | 2,598 | 671,687 |
| Americold Realty Trust | | 1,130 | 41,019 |
| Apartment Investment & Management Co. Class A | | 915 | 34,441 |
| Apple Hospitality (REIT), Inc. | | 1,208 | 11,669 |
| Armada Hoffler Properties, Inc. | | 301 | 2,995 |
| Ashford Hospitality Trust, Inc. | | 297 | 215 |
| AvalonBay Communities, Inc. | | 817 | 126,341 |
| Bluerock Residential Growth (REIT), Inc. | | 100 | 808 |
| Boston Properties, Inc. | | 888 | 80,257 |
| Braemar Hotels & Resorts, Inc. | | 135 | 386 |
| Brandywine Realty Trust (SBI) | | 1,003 | 10,923 |
| Brixmor Property Group, Inc. | | 1,686 | 21,615 |
| Camden Property Trust (SBI) | | 575 | 52,452 |
| CareTrust (REIT), Inc. | | 544 | 9,335 |
| CatchMark Timber Trust, Inc. | | 262 | 2,319 |
| CBL & Associates Properties, Inc. (a)(b) | | 625 | 170 |
| Chatham Lodging Trust | | 267 | 1,634 |
| City Office REIT, Inc. | | 300 | 3,018 |
| Colony Capital, Inc. | | 2,851 | 6,842 |
| Columbia Property Trust, Inc. | | 681 | 8,948 |
| Community Healthcare Trust, Inc. | | 109 | 4,458 |
| CoreCivic, Inc. | | 678 | 6,346 |
| CorEnergy Infrastructure Trust, Inc. | | 70 | 641 |
| CorePoint Lodging, Inc. | | 270 | 1,137 |
| CoreSite Realty Corp. | | 234 | 28,328 |
| Corporate Office Properties Trust (SBI) | | 633 | 16,040 |
| Cousins Properties, Inc. | | 832 | 24,819 |
| Crown Castle International Corp. | | 2,443 | 408,836 |
| CubeSmart | | 1,097 | 29,608 |
| CyrusOne, Inc. | | 691 | 50,270 |
| DiamondRock Hospitality Co. | | 1,141 | 6,310 |
| Digital Realty Trust, Inc. | | 1,574 | 223,681 |
| Douglas Emmett, Inc. | | 1,044 | 32,009 |
| Duke Realty Corp. | | 2,156 | 76,301 |
| Easterly Government Properties, Inc. | | 429 | 9,918 |
| EastGroup Properties, Inc. | | 226 | 26,806 |
| Empire State Realty Trust, Inc. | | 811 | 5,677 |
| EPR Properties | | 445 | 14,743 |
| Equinix, Inc. | | 519 | 364,494 |
| Equity Commonwealth | | 722 | 23,248 |
| Equity Lifestyle Properties, Inc. | | 1,070 | 66,854 |
| Equity Residential (SBI) | | 2,041 | 120,052 |
| Essential Properties Realty Trust, Inc. | | 495 | 7,346 |
| Essex Property Trust, Inc. | | 388 | 88,918 |
| Extra Space Storage, Inc. | | 758 | 70,016 |
| Federal Realty Investment Trust (SBI) | | 429 | 36,555 |
| First Industrial Realty Trust, Inc. | | 720 | 27,677 |
| Four Corners Property Trust, Inc. | | 400 | 9,760 |
| Franklin Street Properties Corp. | | 610 | 3,105 |
| Front Yard Residential Corp. Class B | | 295 | 2,567 |
| Gaming & Leisure Properties | | 1,224 | 42,350 |
| Getty Realty Corp. | | 196 | 5,817 |
| Gladstone Commercial Corp. | | 173 | 3,244 |
| Gladstone Land Corp. | | 81 | 1,285 |
| Global Medical REIT, Inc. | | 213 | 2,413 |
| Global Net Lease, Inc. | | 508 | 8,499 |
| Government Properties Income Trust | | 269 | 6,986 |
| HCP, Inc. | | 3,246 | 89,460 |
| Healthcare Realty Trust, Inc. | | 759 | 22,231 |
| Healthcare Trust of America, Inc. | | 1,263 | 33,495 |
| Hersha Hospitality Trust | | 208 | 1,198 |
| Highwoods Properties, Inc. (SBI) | | 594 | 22,174 |
| Hospitality Properties Trust (SBI) | | 919 | 6,516 |
| Host Hotels & Resorts, Inc. | | 4,258 | 45,944 |
| Hudson Pacific Properties, Inc. | | 889 | 22,367 |
| Independence Realty Trust, Inc. | | 509 | 5,848 |
| Industrial Logistics Properties Trust | | 359 | 7,377 |
| Investors Real Estate Trust | | 69 | 4,864 |
| Invitation Homes, Inc. | | 3,159 | 86,967 |
| Iron Mountain, Inc. | | 1,713 | 44,709 |
| iStar Financial, Inc. | | 367 | 4,521 |
| JBG SMITH Properties | | 674 | 19,930 |
| Jernigan Capital, Inc. | | 129 | 1,765 |
| Kilroy Realty Corp. | | 666 | 39,094 |
| Kimco Realty Corp. | | 2,600 | 33,384 |
| Kite Realty Group Trust | | 489 | 5,643 |
| Lamar Advertising Co. Class A | | 528 | 35,249 |
| Lexington Corporate Properties Trust | | 1,788 | 18,863 |
| Life Storage, Inc. | | 297 | 28,200 |
| LTC Properties, Inc. | | 225 | 8,476 |
| Mack-Cali Realty Corp. | | 515 | 7,874 |
| Medical Properties Trust, Inc. | | 3,052 | 57,378 |
| Mid-America Apartment Communities, Inc. | | 672 | 77,058 |
| Monmouth Real Estate Investment Corp. Class A | | 552 | 7,998 |
| National Health Investors, Inc. | | 263 | 15,969 |
| National Retail Properties, Inc. | | 1,000 | 35,480 |
| National Storage Affiliates Trust | | 425 | 12,181 |
| New Senior Investment Group, Inc. | | 501 | 1,814 |
| NexPoint Residential Trust, Inc. | | 129 | 4,560 |
| Omega Healthcare Investors, Inc. | | 1,345 | 39,987 |
| Outfront Media, Inc. | | 814 | 11,534 |
| Paramount Group, Inc. | | 1,827 | 14,086 |
| Park Hotels & Resorts, Inc. | | 1,358 | 13,431 |
| Pebblebrook Hotel Trust | | 758 | 10,354 |
| Pennsylvania Real Estate Investment Trust (SBI) (b) | | 290 | 394 |
| Physicians Realty Trust | | 1,226 | 21,480 |
| Piedmont Office Realty Trust, Inc. Class A | | 697 | 11,577 |
| Plymouth Industrial REIT, Inc. | | 76 | 973 |
| Potlatch Corp. | | 404 | 15,364 |
| Preferred Apartment Communities, Inc. Class A | | 278 | 2,113 |
| Prologis, Inc. | | 4,302 | 401,506 |
| PS Business Parks, Inc. | | 112 | 14,829 |
| Public Storage | | 875 | 167,904 |
| QTS Realty Trust, Inc. Class A | | 376 | 24,098 |
| Ramco-Gershenson Properties Trust (SBI) | | 474 | 3,299 |
| Rayonier, Inc. | | 807 | 20,006 |
| Realty Income Corp. | | 2,011 | 119,655 |
| Regency Centers Corp. | | 1,005 | 46,119 |
| Retail Opportunity Investments Corp. | | 661 | 7,489 |
| Retail Properties America, Inc. | | 1,236 | 9,048 |
| Retail Value, Inc. | | 70 | 865 |
| Rexford Industrial Realty, Inc. | | 689 | 28,545 |
| RLJ Lodging Trust | | 960 | 9,062 |
| Ryman Hospitality Properties, Inc. | | 312 | 10,795 |
| Sabra Health Care REIT, Inc. | | 1,247 | 17,994 |
| Safety Income and Growth, Inc. | | 69 | 3,967 |
| Saul Centers, Inc. | | 66 | 2,130�� |
| SBA Communications Corp. Class A | | 657 | 195,733 |
| Senior Housing Properties Trust (SBI) | | 1,350 | 5,974 |
| Seritage Growth Properties (a)(b) | | 190 | 2,166 |
| Simon Property Group, Inc. | | 1,800 | 123,084 |
| SITE Centers Corp. | | 864 | 6,998 |
| SL Green Realty Corp. | | 467 | 23,018 |
| Spirit Realty Capital, Inc. | | 656 | 22,868 |
| Stag Industrial, Inc. | | 842 | 24,687 |
| Store Capital Corp. | | 1,362 | 32,429 |
| Summit Hotel Properties, Inc. | | 556 | 3,297 |
| Sun Communities, Inc. | | 585 | 79,373 |
| Sunstone Hotel Investors, Inc. | | 1,286 | 10,481 |
| Tanger Factory Outlet Centers, Inc. (b) | | 527 | 3,758 |
| Taubman Centers, Inc. | | 353 | 13,329 |
| Terreno Realty Corp. | | 433 | 22,793 |
| The GEO Group, Inc. | | 694 | 8,210 |
| The Macerich Co. (b) | | 668 | 5,992 |
| UDR, Inc. | | 1,731 | 64,705 |
| UMH Properties, Inc. | | 204 | 2,638 |
| Uniti Group, Inc. | | 1,096 | 10,248 |
| Universal Health Realty Income Trust (SBI) | | 73 | 5,803 |
| Urban Edge Properties | | 651 | 7,727 |
| Urstadt Biddle Properties, Inc. Class A | | 159 | 1,889 |
| Ventas, Inc. | | 2,187 | 80,088 |
| VEREIT, Inc. | | 6,484 | 41,692 |
| VICI Properties, Inc. | | 2,750 | 55,523 |
| Vornado Realty Trust | | 963 | 36,796 |
| Washington Prime Group, Inc. (b) | | 1,000 | 841 |
| Washington REIT (SBI) | | 457 | 10,145 |
| Weingarten Realty Investors (SBI) | | 685 | 12,967 |
| Welltower, Inc. | | 2,467 | 127,667 |
| Weyerhaeuser Co. | | 4,387 | 98,532 |
| Whitestone REIT Class B | | 271 | 1,970 |
| WP Carey, Inc. | | 1,016 | 68,732 |
| Xenia Hotels & Resorts, Inc. | | 662 | 6,176 |
| | | | 6,235,059 |
| Real Estate Management & Development - 0.1% | | | |
| Altisource Portfolio Solutions SA (a) | | 44 | 649 |
| CBRE Group, Inc. (a) | | 1,958 | 88,541 |
| Cto Realty Growth, Inc. | | 28 | 1,106 |
| eXp World Holdings, Inc. (a)(b) | | 129 | 2,199 |
| Forestar Group, Inc. (a) | | 88 | 1,327 |
| Howard Hughes Corp. (a) | | 297 | 15,429 |
| Jones Lang LaSalle, Inc. | | 297 | 30,728 |
| Kennedy-Wilson Holdings, Inc. | | 701 | 10,669 |
| Marcus & Millichap, Inc. (a) | | 136 | 3,925 |
| Newmark Group, Inc. | | 858 | 4,170 |
| RE/MAX Holdings, Inc. | | 99 | 3,112 |
| Realogy Holdings Corp. | | 621 | 4,602 |
| Redfin Corp. (a) | | 557 | 23,344 |
| The RMR Group, Inc. | | 88 | 2,593 |
| The St. Joe Co. (a)(b) | | 178 | 3,457 |
| | | | 195,851 |
|
| TOTAL REAL ESTATE | | | 6,430,910 |
|
| UTILITIES - 2.9% | | | |
| Electric Utilities - 1.7% | | | |
| Allete, Inc. | | 329 | 17,967 |
| Alliant Energy Corp. | | 1,489 | 71,234 |
| American Electric Power Co., Inc. | | 2,876 | 229,045 |
| Avangrid, Inc. | | 314 | 13,182 |
| Duke Energy Corp. | | 4,305 | 343,926 |
| Edison International | | 2,249 | 122,143 |
| El Paso Electric Co. | | 229 | 15,343 |
| Entergy Corp. | | 1,165 | 109,289 |
| Evergy, Inc. | | 1,335 | 79,152 |
| Eversource Energy | | 1,977 | 164,625 |
| Exelon Corp. | | 5,676 | 205,982 |
| FirstEnergy Corp. | | 3,160 | 122,545 |
| Hawaiian Electric Industries, Inc. | | 652 | 23,511 |
| IDACORP, Inc. | | 288 | 25,163 |
| MGE Energy, Inc. (b) | | 242 | 15,611 |
| NextEra Energy, Inc. | | 2,865 | 688,087 |
| NRG Energy, Inc. | | 1,487 | 48,417 |
| OGE Energy Corp. | | 1,218 | 36,978 |
| Otter Tail Corp. | | 223 | 8,650 |
| Pinnacle West Capital Corp. | | 672 | 49,251 |
| PNM Resources, Inc. | | 444 | 17,067 |
| Portland General Electric Co. | | 537 | 22,452 |
| PPL Corp. | | 4,491 | 116,047 |
| Southern Co. | | 6,195 | 321,211 |
| Xcel Energy, Inc. | | 3,054 | 190,875 |
| | | | 3,057,753 |
| Gas Utilities - 0.1% | | | |
| Atmos Energy Corp. | | 701 | 69,806 |
| Chesapeake Utilities Corp. | | 92 | 7,728 |
| National Fuel Gas Co. | | 519 | 21,762 |
| New Jersey Resources Corp. | | 548 | 17,892 |
| Northwest Natural Holding Co. (b) | | 173 | 9,652 |
| ONE Gas, Inc. | | 301 | 23,192 |
| South Jersey Industries, Inc. | | 517 | 12,920 |
| Southwest Gas Holdings, Inc. | | 312 | 21,544 |
| Spire, Inc. | | 295 | 19,384 |
| UGI Corp. | | 1,254 | 39,877 |
| | | | 243,757 |
| Independent Power and Renewable Electricity Producers - 0.1% | | | |
| Clearway Energy, Inc.: | | | |
| Class A | | 224 | 4,697 |
| Class C | | 403 | 9,293 |
| Ormat Technologies, Inc. | | 289 | 18,349 |
| Sunnova Energy International, Inc. | | 77 | 1,314 |
| Terraform Power, Inc. | | 461 | 8,501 |
| The AES Corp. | | 3,953 | 57,279 |
| Vistra Energy Corp. | | 2,649 | 49,324 |
| | | | 148,757 |
| Multi-Utilities - 0.9% | | | |
| Ameren Corp. | | 1,439 | 101,248 |
| Avista Corp. | | 404 | 14,702 |
| Black Hills Corp. | | 423 | 23,967 |
| CenterPoint Energy, Inc. | | 3,303 | 61,667 |
| CMS Energy Corp. | | 1,657 | 96,802 |
| Consolidated Edison, Inc. | | 1,936 | 139,256 |
| Dominion Energy, Inc. | | 4,915 | 399,000 |
| DTE Energy Co. | | 1,125 | 120,938 |
| MDU Resources Group, Inc. | | 1,136 | 25,196 |
| NiSource, Inc. | | 2,218 | 50,437 |
| NorthWestern Energy Corp. | | 281 | 15,320 |
| Public Service Enterprise Group, Inc. | | 2,945 | 144,776 |
| Sempra Energy | | 1,723 | 201,987 |
| Unitil Corp. | | 84 | 3,765 |
| WEC Energy Group, Inc. | | 1,836 | 160,925 |
| | | | 1,559,986 |
| Water Utilities - 0.1% | | | |
| American States Water Co. (b) | | 208 | 16,355 |
| American Water Works Co., Inc. | | 1,054 | 135,608 |
| Cadiz, Inc. (a)(b) | | 134 | 1,361 |
| California Water Service Group | | 273 | 13,022 |
| Essential Utilities, Inc. | | 1,275 | 53,856 |
| Middlesex Water Co. | | 100 | 6,718 |
| SJW Corp. (b) | | 146 | 9,068 |
| York Water Co. | | 70 | 3,357 |
| | | | 239,345 |
|
| TOTAL UTILITIES | | | 5,249,598 |
|
| TOTAL COMMON STOCKS | | | |
| (Cost $163,342,779) | | | 177,257,545 |
|
| Money Market Funds - 5.0% | | | |
| Fidelity Cash Central Fund 0.12% (e) | | 5,731,219 | 5,732,365 |
| Fidelity Securities Lending Cash Central Fund 0.12% (e)(f) | | 3,499,677 | 3,500,027 |
| TOTAL MONEY MARKET FUNDS | | | |
| (Cost $9,232,392) | | | 9,232,392 |
| TOTAL INVESTMENT IN SECURITIES - 101.6% | | | |
| (Cost $172,575,171) | | | 186,489,937 |
| NET OTHER ASSETS (LIABILITIES) - (1.6)% | | | (2,984,674) |
| NET ASSETS - 100% | | | $183,505,263 |
| Futures Contracts | | | | | |
| | Number of contracts | Expiration Date | Notional Amount | Value | Unrealized Appreciation/(Depreciation) |
| Purchased | | | | | |
| Equity Index Contracts | | | | | |
| CME E-mini Russell 2000 Index Contracts (United States) | 6 | Sept. 2020 | $431,280 | $15,596 | $15,596 |
| CME E-mini S&P 500 Index Contracts (United States) | 37 | Sept. 2020 | 5,716,870 | 42,499 | 42,499 |
| CME E-mini S&P MidCap 400 Index Contracts (United States) | 2 | Sept. 2020 | 355,820 | 2,308 | 2,308 |
| TOTAL FUTURES CONTRACTS | | | | | $60,403 |
The notional amount of futures purchased as a percentage of Net Assets is 3.5%
Legend
(a) Non-income producing
(b) Security or a portion of the security is on loan at period end.
(c) Level 3 security
(d) Security exempt from registration under Rule 144A of the Securities Act of 1933. These securities may be resold in transactions exempt from registration, normally to qualified institutional buyers. At the end of the period, the value of these securities amounted to $10,629 or 0.0% of net assets.
(e) Affiliated fund that is generally available only to investment companies and other accounts managed by Fidelity Investments. The rate quoted is the annualized seven-day yield of the fund at period end. A complete unaudited listing of the fund's holdings as of its most recent quarter end is available upon request. In addition, each Fidelity Central Fund's financial statements are available on the SEC's website or upon request.
(f) Investment made with cash collateral received from securities on loan.
Affiliated Central Funds
Information regarding fiscal year to date income earned by the Fund from investments in Fidelity Central Funds is as follows:
| Fund | Income earned |
| Fidelity Cash Central Fund | $11,687 |
| Fidelity Securities Lending Cash Central Fund | 9,999 |
| Total | $21,686 |
Amounts in the income column in the above table include any capital gain distributions from underlying funds, which are presented in the corresponding line-item in the Statement of Operations, if applicable. Amount for Fidelity Securities Lending Cash Central Fund represents the income earned on investing cash collateral, less rebates paid to borrowers and any lending agent fees associated with the loan, plus any premium payments received for lending certain types of securities.
Investment Valuation
The following is a summary of the inputs used, as of June 30, 2020, involving the Fund's assets and liabilities carried at fair value. The inputs or methodology used for valuing securities may not be an indication of the risk associated with investing in those securities. For more information on valuation inputs, and their aggregation into the levels used below, please refer to the Investment Valuation section in the accompanying Notes to Financial Statements.
| | Valuation Inputs at Reporting Date: |
| Description | Total | Level 1 | Level 2 | Level 3 |
| Investments in Securities: | | | | |
| Equities: | | | | |
| Communication Services | $17,522,769 | $17,521,981 | $-- | $788 |
| Consumer Discretionary | 20,038,336 | 20,038,336 | -- | -- |
| Consumer Staples | 11,177,255 | 11,177,255 | -- | -- |
| Energy | 4,675,740 | 4,675,740 | -- | -- |
| Financials | 18,790,006 | 18,790,006 | -- | -- |
| Health Care | 26,214,924 | 26,214,924 | -- | -- |
| Industrials | 15,280,984 | 15,280,984 | -- | -- |
| Information Technology | 47,089,065 | 47,089,065 | -- | -- |
| Materials | 4,787,958 | 4,787,958 | -- | -- |
| Real Estate | 6,430,910 | 6,430,910 | -- | -- |
| Utilities | 5,249,598 | 5,249,598 | -- | -- |
| Money Market Funds | 9,232,392 | 9,232,392 | -- | -- |
| Total Investments in Securities: | $186,489,937 | $186,489,149 | $-- | $788 |
| Derivative Instruments: | | | | |
| Assets | | | | |
| Futures Contracts | $60,403 | $60,403 | $-- | $-- |
| Total Assets | $60,403 | $60,403 | $-- | $-- |
| Total Derivative Instruments: | $60,403 | $60,403 | $-- | $-- |
Value of Derivative Instruments
The following table is a summary of the Fund's value of derivative instruments by primary risk exposure as of June 30, 2020. For additional information on derivative instruments, please refer to the Derivative Instruments section in the accompanying Notes to Financial Statements.
| Primary Risk Exposure / Derivative Type | Value |
| | Asset | Liability |
| Equity Risk | | |
| Futures Contracts(a) | $60,403 | $0 |
| Total Equity Risk | 60,403 | 0 |
| Total Value of Derivatives | $60,403 | $0 |
(a) Reflects gross cumulative appreciation (depreciation) on futures contracts as presented in the Schedule of Investments. In the Statement of Assets and Liabilities, the period end daily variation margin is included in receivable or payable for daily variation margin on futures contracts, and the net cumulative appreciation (depreciation) is included in Total accumulated earnings (loss).
See accompanying notes which are an integral part of the financial statements.
VIP Total Market Index Portfolio
Financial Statements
Statement of Assets and Liabilities
| | | June 30, 2020 (Unaudited) |
| Assets | | |
Investment in securities, at value (including securities loaned of $3,471,899) — See accompanying schedule:
Unaffiliated issuers (cost $163,342,779) | $177,257,545 | |
| Fidelity Central Funds (cost $9,232,392) | 9,232,392 | |
| Total Investment in Securities (cost $172,575,171) | | $186,489,937 |
| Segregated cash with brokers for derivative instruments | | 518,800 |
| Cash | | 28,258 |
| Foreign currency held at value (cost $1,730) | | 1,784 |
| Receivable for investments sold | | 3,442 |
| Dividends receivable | | 143,056 |
| Distributions receivable from Fidelity Central Funds | | 4,540 |
| Receivable for daily variation margin on futures contracts | | 87,953 |
| Total assets | | 187,277,770 |
| Liabilities | | |
| Payable for investments purchased | $1,805 | |
| Payable for fund shares redeemed | 251,296 | |
| Accrued management fee | 9,022 | |
| Distribution and service plan fees payable | 445 | |
| Other affiliated payables | 9,022 | |
| Other payables and accrued expenses | 871 | |
| Collateral on securities loaned | 3,500,046 | |
| Total liabilities | | 3,772,507 |
| Net Assets | | $183,505,263 |
| Net Assets consist of: | | |
| Paid in capital | | $170,463,380 |
| Total accumulated earnings (loss) | | 13,041,883 |
| Net Assets | | $183,505,263 |
| Net Asset Value and Maximum Offering Price | | |
| Initial Class: | | |
| Net Asset Value, offering price and redemption price per share ($181,119,232 ÷ 15,877,575 shares) | | $11.41 |
| Service Class: | | |
| Net Asset Value, offering price and redemption price per share ($277,477 ÷ 24,336 shares) | | $11.40 |
| Service Class 2: | | |
| Net Asset Value, offering price and redemption price per share ($2,108,554 ÷ 185,101 shares) | | $11.39 |
See accompanying notes which are an integral part of the financial statements.
Statement of Operations
| | | Six months ended June 30, 2020 (Unaudited) |
| Investment Income | | |
| Dividends | | $1,589,023 |
| Interest | | 531 |
| Income from Fidelity Central Funds (including $9,999 from security lending) | | 21,686 |
| Total income | | 1,611,240 |
| Expenses | | |
| Management fee | $50,942 | |
| Transfer agent fees | 50,942 | |
| Distribution and service plan fees | 2,230 | |
| Independent trustees' fees and expenses | 527 | |
| Miscellaneous | 2,599 | |
| Total expenses before reductions | 107,240 | |
| Expense reductions | (37) | |
| Total expenses after reductions | | 107,203 |
| Net investment income (loss) | | 1,504,037 |
| Realized and Unrealized Gain (Loss) | | |
| Net realized gain (loss) on: | | |
| Investment securities: | | |
| Unaffiliated issuers | (1,783,633) | |
| Fidelity Central Funds | (234) | |
| Foreign currency transactions | (3) | |
| Futures contracts | (205,021) | |
| Total net realized gain (loss) | | (1,988,891) |
| Change in net unrealized appreciation (depreciation) on: | | |
| Investment securities: | | |
| Unaffiliated issuers | (5,880,090) | |
| Assets and liabilities in foreign currencies | 35 | |
| Futures contracts | 6,842 | |
| Total change in net unrealized appreciation (depreciation) | | (5,873,213) |
| Net gain (loss) | | (7,862,104) |
| Net increase (decrease) in net assets resulting from operations | | $(6,358,067) |
See accompanying notes which are an integral part of the financial statements.
Statement of Changes in Net Assets
| | Six months ended June 30, 2020 (Unaudited) | Year ended December 31, 2019 |
| Increase (Decrease) in Net Assets | | |
| Operations | | |
| Net investment income (loss) | $1,504,037 | $2,310,100 |
| Net realized gain (loss) | (1,988,891) | 505,577 |
| Change in net unrealized appreciation (depreciation) | (5,873,213) | 29,743,716 |
| Net increase (decrease) in net assets resulting from operations | (6,358,067) | 32,559,393 |
| Distributions to shareholders | (263,309) | (2,781,173) |
| Share transactions - net increase (decrease) | 14,644,615 | 62,925,364 |
| Total increase (decrease) in net assets | 8,023,239 | 92,703,584 |
| Net Assets | | |
| Beginning of period | 175,482,024 | 82,778,440 |
| End of period | $183,505,263 | $175,482,024 |
See accompanying notes which are an integral part of the financial statements.
Financial Highlights
VIP Total Market Index Portfolio Initial Class
| | Six months ended (Unaudited) June 30, | Years endedDecember 31, | |
| | 2020 | 2019 | 2018 A |
| Selected Per–Share Data | | | |
| Net asset value, beginning of period | $11.86 | $9.23 | $10.00 |
| Income from Investment Operations | | | |
| Net investment income (loss)B | .10 | .20 | .13 |
| Net realized and unrealized gain (loss) | (.53) | 2.63 | (.81) |
| Total from investment operations | (.43) | 2.83 | (.68) |
| Distributions from net investment income | – | (.17) | (.08) |
| Distributions from net realized gain | (.02) | (.03) | (.01) |
| Total distributions | (.02) | (.20) | (.09) |
| Net asset value, end of period | $11.41 | $11.86 | $9.23 |
| Total ReturnC,D,E | (3.66)% | 30.70% | (6.76)% |
| Ratios to Average Net AssetsF,G | | | |
| Expenses before reductions | .12%H | .12% | .12%H |
| Expenses net of fee waivers, if any | .12%H | .12% | .12%H |
| Expenses net of all reductions | .12%H | .12% | .12%H |
| Net investment income (loss) | 1.78%H | 1.80% | 1.84%H |
| Supplemental Data | | | |
| Net assets, end of period (000 omitted) | $181,119 | $173,833 | $81,855 |
| Portfolio turnover rateI | 16%H | 4% | 4%H |
A For the period April 17, 2018 (commencement of operations) to December 31, 2018.
B Calculated based on average shares outstanding during the period.
C Total returns for periods of less than one year are not annualized.
D Total returns do not reflect charges attributable to your insurance company's separate account. Inclusion of these charges would reduce the total returns shown.
E Total returns would have been lower if certain expenses had not been reduced during the applicable periods shown.
F Fees and expenses of any underlying Fidelity Central Funds are not included in the Fund's expense ratio. The Fund indirectly bears its proportionate share of the expenses of any underlying Fidelity Central Funds.
G Expense ratios reflect operating expenses of the class. Expenses before reductions do not reflect amounts reimbursed by the investment adviser or reductions from expense offset arrangements and do not represent the amount paid by the class during periods when reimbursements or reductions occur. Expenses net of fee waivers reflect expenses after reimbursement by the investment adviser but prior to reductions from expense offset arrangements. Expenses net of all reductions represent the net expenses paid by the class.
H Annualized
I Amount does not include the portfolio activity of any underlying Fidelity Central Funds.
See accompanying notes which are an integral part of the financial statements.
VIP Total Market Index Portfolio Service Class
| | Six months ended (Unaudited) June 30, | Year endedDecember 31, |
| | 2020 | 2019 A |
| Selected Per–Share Data | | |
| Net asset value, beginning of period | $11.86 | $10.73 |
| Income from Investment Operations | | |
| Net investment income (loss)B | .09 | .13 |
| Net realized and unrealized gain (loss) | (.53) | 1.19 |
| Total from investment operations | (.44) | 1.32 |
| Distributions from net investment income | – | (.16) |
| Distributions from net realized gain | (.02) | (.03) |
| Total distributions | (.02) | (.19) |
| Net asset value, end of period | $11.40 | $11.86 |
| Total ReturnC,D,E | (3.75)% | 12.36% |
| Ratios to Average Net AssetsF,G | | |
| Expenses before reductions | .22%H | .22%H |
| Expenses net of fee waivers, if any | .22%H | .22%H |
| Expenses net of all reductions | .22%H | .22%H |
| Net investment income (loss) | 1.68%H | 1.68%H |
| Supplemental Data | | |
| Net assets, end of period (000 omitted) | $277 | $111 |
| Portfolio turnover rateI | 16%H | 4% |
A For the period April 11, 2019 (commencement of sale of shares) to December 31, 2019.
B Calculated based on average shares outstanding during the period.
C Total returns for periods of less than one year are not annualized.
D Total returns do not reflect charges attributable to your insurance company's separate account. Inclusion of these charges would reduce the total returns shown.
E Total returns would have been lower if certain expenses had not been reduced during the applicable periods shown.
F Fees and expenses of any underlying Fidelity Central Funds are not included in the Fund's expense ratio. The Fund indirectly bears its proportionate share of the expenses of any underlying Fidelity Central Funds.
G Expense ratios reflect operating expenses of the class. Expenses before reductions do not reflect amounts reimbursed by the investment adviser or reductions from expense offset arrangements and do not represent the amount paid by the class during periods when reimbursements or reductions occur. Expenses net of fee waivers reflect expenses after reimbursement by the investment adviser but prior to reductions from expense offset arrangements. Expenses net of all reductions represent the net expenses paid by the class.
H Annualized
I Amount does not include the portfolio activity of any underlying Fidelity Central Funds.
See accompanying notes which are an integral part of the financial statements.
VIP Total Market Index Portfolio Service Class 2
| | Six months ended (Unaudited) June 30, | Years endedDecember 31, | |
| | 2020 | 2019 | 2018 A |
| Selected Per–Share Data | | | |
| Net asset value, beginning of period | $11.86 | $9.23 | $10.00 |
| Income from Investment Operations | | | |
| Net investment income (loss)B | .08 | .17 | .12 |
| Net realized and unrealized gain (loss) | (.53) | 2.64 | (.82) |
| Total from investment operations | (.45) | 2.81 | (.70) |
| Distributions from net investment income | – | (.14) | (.06) |
| Distributions from net realized gain | (.02) | (.03) | (.01) |
| Total distributions | (.02) | (.18)C | (.07) |
| Net asset value, end of period | $11.39 | $11.86 | $9.23 |
| Total ReturnD,E,F | (3.83)% | 30.44% | (6.96)% |
| Ratios to Average Net AssetsG,H | | | |
| Expenses before reductions | .37%I | .37% | .37%I |
| Expenses net of fee waivers, if any | .37%I | .37% | .37%I |
| Expenses net of all reductions | .37%I | .37% | .37%I |
| Net investment income (loss) | 1.53%I | 1.55% | 1.59%I |
| Supplemental Data | | | |
| Net assets, end of period (000 omitted) | $2,109 | $1,538 | $923 |
| Portfolio turnover rateJ | 16%I | 4% | 4%I |
A For the period April 17, 2018 (commencement of operations) to December 31, 2018.
B Calculated based on average shares outstanding during the period.
C Total distributions of $.18 per share is comprised of distributions from net investment income of $.144 and distributions from net realized gain of $.031 per share.
D Total returns for periods of less than one year are not annualized.
E Total returns do not reflect charges attributable to your insurance company's separate account. Inclusion of these charges would reduce the total returns shown.
F Total returns would have been lower if certain expenses had not been reduced during the applicable periods shown.
G Fees and expenses of any underlying Fidelity Central Funds are not included in the Fund's expense ratio. The Fund indirectly bears its proportionate share of the expenses of any underlying Fidelity Central Funds.
H Expense ratios reflect operating expenses of the class. Expenses before reductions do not reflect amounts reimbursed by the investment adviser or reductions from expense offset arrangements and do not represent the amount paid by the class during periods when reimbursements or reductions occur. Expenses net of fee waivers reflect expenses after reimbursement by the investment adviser but prior to reductions from expense offset arrangements. Expenses net of all reductions represent the net expenses paid by the class.
I Annualized
J Amount does not include the portfolio activity of any underlying Fidelity Central Funds.
See accompanying notes which are an integral part of the financial statements.
VIP Extended Market Index Portfolio
Investment Summary (Unaudited)
Top Ten Stocks as of June 30, 2020
| | % of fund's net assets |
| Moderna, Inc. | 0.5 |
| Teladoc Health, Inc. | 0.4 |
| Wayfair LLC Class A | 0.4 |
| Etsy, Inc. | 0.3 |
| Catalent, Inc. | 0.3 |
| Sarepta Therapeutics, Inc. | 0.3 |
| Neurocrine Biosciences, Inc. | 0.3 |
| Masimo Corp. | 0.3 |
| E*TRADE Financial Corp. | 0.3 |
| Abiomed, Inc. | 0.3 |
| | 3.4 |
Top Market Sectors as of June 30, 2020
| | % of fund's net assets |
| Health Care | 16.1 |
| Information Technology | 15.9 |
| Industrials | 14.7 |
| Financials | 13.3 |
| Consumer Discretionary | 12.8 |
| Real Estate | 7.9 |
| Materials | 4.9 |
| Consumer Staples | 3.4 |
| Communication Services | 3.4 |
| Utilities | 2.6 |
Asset Allocation (% of fund's net assets)
| As of June 30, 2020* |
| | Stocks and Equity Futures | 99.9% |
| | Short-Term Investments and Net Other Assets (Liabilities) | 0.1% |

* Foreign investments - 4.4%
VIP Extended Market Index Portfolio
Schedule of Investments June 30, 2020 (Unaudited)
Showing Percentage of Net Assets
| Common Stocks - 97.4% | | | |
| | | Shares | Value |
| COMMUNICATION SERVICES - 3.4% | | | |
| Diversified Telecommunication Services - 0.5% | | | |
| ATN International, Inc. | | 198 | $11,993 |
| Bandwidth, Inc. (a)(b) | | 305 | 38,735 |
| Cincinnati Bell, Inc. (a) | | 870 | 12,920 |
| Cogent Communications Group, Inc. | | 740 | 57,246 |
| Consolidated Communications Holdings, Inc. (a) | | 1,267 | 8,578 |
| GCI Liberty, Inc. (a) | | 1,691 | 120,264 |
| Iridium Communications, Inc. (a) | | 1,739 | 44,240 |
| Liberty Latin America Ltd.: | | | |
| Class A (a) | | 891 | 8,661 |
| Class C (a) | | 1,961 | 18,512 |
| ORBCOMM, Inc. (a) | | 1,355 | 5,217 |
| PDVWireless, Inc. (a) | | 205 | 9,295 |
| Vonage Holdings Corp. (a) | | 4,136 | 41,608 |
| | | | 377,269 |
| Entertainment - 0.5% | | | |
| AMC Entertainment Holdings, Inc. Class A (b) | | 856 | 3,672 |
| Cinemark Holdings, Inc. (b) | | 1,897 | 21,910 |
| Glu Mobile, Inc. (a) | | 2,340 | 21,692 |
| Lions Gate Entertainment Corp.: | | | |
| Class A (a)(b) | | 1,205 | 8,929 |
| Class B (a) | | 1,754 | 11,980 |
| Madison Square Garden Entertainment Corp. (a) | | 313 | 23,475 |
| Marcus Corp. | | 402 | 5,335 |
| Rosetta Stone, Inc. (a) | | 433 | 7,300 |
| Sciplay Corp. (A Shares) (a) | | 375 | 5,561 |
| The Madison Square Garden Co. (a) | | 306 | 44,948 |
| World Wrestling Entertainment, Inc. Class A | | 822 | 35,716 |
| Zynga, Inc. (a) | | 16,973 | 161,922 |
| | | | 352,440 |
| Interactive Media & Services - 0.7% | | | |
| ANGI Homeservices, Inc. Class A (a)(b) | | 1,137 | 13,815 |
| CarGurus, Inc. Class A (a) | | 1,294 | 32,803 |
| Cars.com, Inc. (a) | | 1,144 | 6,589 |
| Eventbrite, Inc. (a) | | 633 | 5,425 |
| EverQuote, Inc. Class A (a) | | 187 | 10,876 |
| Liberty TripAdvisor Holdings, Inc. (a) | | 1,194 | 2,543 |
| Match Group, Inc. (a)(b) | | 1,014 | 108,549 |
| MeetMe, Inc. (a) | | 1,144 | 7,139 |
| Pinterest, Inc. Class A (a)(b) | | 2,018 | 44,739 |
| QuinStreet, Inc. (a) | | 804 | 8,410 |
| TripAdvisor, Inc. | | 1,800 | 34,218 |
| TrueCar, Inc. (a) | | 1,683 | 4,342 |
| Yelp, Inc. (a) | | 1,181 | 27,317 |
| Zillow Group, Inc.: | | | |
| Class A (a) | | 666 | 38,282 |
| Class C (a)(b) | | 2,424 | 139,647 |
| | | | 484,694 |
| Media - 1.5% | | | |
| Altice U.S.A., Inc. Class A (a) | | 4,823 | 108,710 |
| AMC Networks, Inc. Class A (a) | | 727 | 17,005 |
| Cable One, Inc. | | 93 | 165,061 |
| Cardlytics, Inc. (a) | | 369 | 25,823 |
| Central European Media Enterprises Ltd. Class A (a) | | 1,549 | 5,483 |
| Clear Channel Outdoor Holdings, Inc. (a) | | 6,257 | 6,507 |
| comScore, Inc. (a) | | 808 | 2,505 |
| Cumulus Media, Inc. (a) | | 244 | 964 |
| E.W. Scripps Co. Class A | | 954 | 8,348 |
| Entercom Communications Corp. Class A (b) | | 2,015 | 2,781 |
| Gannett Co., Inc. (b) | | 2,155 | 2,974 |
| Gray Television, Inc. (a) | | 1,524 | 21,260 |
| Interpublic Group of Companies, Inc. | | 6,896 | 118,335 |
| John Wiley & Sons, Inc. Class A | | 782 | 30,498 |
| Loral Space & Communications Ltd. | | 240 | 4,685 |
| Meredith Corp. (b) | | 707 | 10,287 |
| MSG Network, Inc. Class A (a)(b) | | 814 | 8,099 |
| National CineMedia, Inc. (b) | | 1,060 | 3,148 |
| News Corp.: | | | |
| Class A | | 6,464 | 76,663 |
| Class B | | 2,613 | 31,225 |
| Nexstar Broadcasting Group, Inc. Class A | | 805 | 67,370 |
| Scholastic Corp. | | 537 | 16,078 |
| Sinclair Broadcast Group, Inc. Class A (b) | | 997 | 18,405 |
| Sirius XM Holdings, Inc. (b) | | 24,052 | 141,185 |
| TechTarget, Inc. (a) | | 403 | 12,102 |
| Tegna, Inc. | | 3,873 | 43,145 |
| The New York Times Co. Class A (b) | | 2,559 | 107,555 |
| WideOpenWest, Inc. (a) | | 404 | 2,129 |
| | | | 1,058,330 |
| Wireless Telecommunication Services - 0.2% | | | |
| Boingo Wireless, Inc. (a) | | 777 | 10,350 |
| Gogo, Inc. (a)(b) | | 865 | 2,733 |
| NII Holdings, Inc. (a)(c) | | 1,280 | 2,778 |
| Shenandoah Telecommunications Co. | | 841 | 41,453 |
| Telephone & Data Systems, Inc. | | 1,718 | 34,154 |
| U.S. Cellular Corp. (a) | | 270 | 8,335 |
| | | | 99,803 |
|
| TOTAL COMMUNICATION SERVICES | | | 2,372,536 |
|
| CONSUMER DISCRETIONARY - 12.8% | | | |
| Auto Components - 1.3% | | | |
| Adient PLC (a) | | 1,539 | 25,270 |
| American Axle & Manufacturing Holdings, Inc. (a) | | 2,011 | 15,284 |
| Autoliv, Inc. | | 1,394 | 89,927 |
| BorgWarner, Inc. | | 3,668 | 129,480 |
| Cooper Tire & Rubber Co. | | 879 | 24,269 |
| Cooper-Standard Holding, Inc. (a) | | 269 | 3,564 |
| Dana, Inc. | | 2,616 | 31,889 |
| Delphi Technologies PLC (a) | | 1,507 | 21,414 |
| Dorman Products, Inc. (a) | | 519 | 34,809 |
| Fox Factory Holding Corp. (a) | | 727 | 60,057 |
| Garrett Motion, Inc. (a) | | 1,245 | 6,897 |
| Gentex Corp. | | 4,330 | 111,584 |
| Gentherm, Inc. (a) | | 583 | 22,679 |
| LCI Industries | | 449 | 51,626 |
| Lear Corp. | | 969 | 105,640 |
| Modine Manufacturing Co. (a) | | 851 | 4,698 |
| Motorcar Parts of America, Inc. (a)(b) | | 308 | 5,442 |
| Standard Motor Products, Inc. | | 360 | 14,832 |
| Stoneridge, Inc. (a) | | 483 | 9,979 |
| Tenneco, Inc. (a)(b) | | 1,000 | 7,560 |
| The Goodyear Tire & Rubber Co. | | 4,129 | 36,934 |
| Veoneer, Inc. (a)(b) | | 1,757 | 18,782 |
| Visteon Corp. (a)(b) | | 491 | 33,634 |
| Workhorse Group, Inc. (a)(b) | | 934 | 16,242 |
| | | | 882,492 |
| Automobiles - 0.3% | | | |
| Harley-Davidson, Inc. | | 2,745 | 65,249 |
| Thor Industries, Inc. (b) | | 981 | 104,506 |
| Winnebago Industries, Inc. | | 604 | 40,238 |
| | | | 209,993 |
| Distributors - 0.3% | | | |
| Core-Mark Holding Co., Inc. | | 813 | 20,288 |
| Funko, Inc. (a)(b) | | 308 | 1,786 |
| Pool Corp. | | 708 | 192,484 |
| | | | 214,558 |
| Diversified Consumer Services - 1.3% | | | |
| Adtalem Global Education, Inc. (a) | | 921 | 28,689 |
| American Public Education, Inc. (a) | | 279 | 8,258 |
| Bright Horizons Family Solutions, Inc. (a) | | 1,035 | 121,302 |
| Career Education Corp. (a) | | 1,244 | 19,817 |
| Carriage Services, Inc. | | 286 | 5,182 |
| Chegg, Inc. (a) | | 2,086 | 140,304 |
| Collectors Universe, Inc. | | 128 | 4,388 |
| Frontdoor, Inc. (a) | | 1,510 | 66,938 |
| Graham Holdings Co. | | 75 | 25,700 |
| Grand Canyon Education, Inc. (a) | | 839 | 75,955 |
| H&R Block, Inc. | | 3,417 | 48,795 |
| Houghton Mifflin Harcourt Co. (a) | | 1,867 | 3,379 |
| K12, Inc. (a) | | 686 | 18,687 |
| Laureate Education, Inc. Class A (a) | | 1,946 | 19,392 |
| OneSpaWorld Holdings Ltd. (b) | | 578 | 2,757 |
| Regis Corp. (a)(b) | | 422 | 3,452 |
| Select Interior Concepts, Inc. (a) | | 320 | 1,120 |
| Service Corp. International | | 3,162 | 122,970 |
| ServiceMaster Global Holdings, Inc. (a) | | 2,345 | 83,693 |
| Strategic Education, Inc. | | 398 | 61,153 |
| Weight Watchers International, Inc. (a) | | 812 | 20,609 |
| | | | 882,540 |
| Hotels, Restaurants & Leisure - 2.2% | | | |
| Biglari Holdings, Inc. (a) | | 16 | 1,104 |
| BJ's Restaurants, Inc. | | 404 | 8,460 |
| Bloomin' Brands, Inc. (b) | | 1,518 | 16,182 |
| Boyd Gaming Corp. | | 1,427 | 29,824 |
| Brinker International, Inc. | | 802 | 19,248 |
| Caesars Entertainment Corp. (a) | | 9,933 | 120,487 |
| Carrols Restaurant Group, Inc. (a)(b) | | 814 | 3,940 |
| Choice Hotels International, Inc. | | 557 | 43,947 |
| Churchill Downs, Inc. | | 624 | 83,086 |
| Chuy's Holdings, Inc. (a) | | 299 | 4,449 |
| Cracker Barrel Old Country Store, Inc. | | 423 | 46,915 |
| Dave & Buster's Entertainment, Inc. (b) | | 845 | 11,264 |
| Del Taco Restaurants, Inc. (a) | | 549 | 3,256 |
| Denny's Corp. (a) | | 1,026 | 10,363 |
| Dine Brands Global, Inc. | | 291 | 12,251 |
| Drive Shack, Inc. (a) | | 961 | 1,778 |
| Dunkin' Brands Group, Inc. | | 1,458 | 95,105 |
| El Pollo Loco Holdings, Inc. (a)(b) | | 330 | 4,871 |
| Eldorado Resorts, Inc. (a)(b) | | 1,479 | 59,249 |
| Everi Holdings, Inc. (a) | | 1,443 | 7,446 |
| Extended Stay America, Inc. unit | | 3,169 | 35,461 |
| Fiesta Restaurant Group, Inc. (a) | | 415 | 2,648 |
| Golden Entertainment, Inc. (a) | | 341 | 3,042 |
| Hilton Grand Vacations, Inc. (a) | | 1,539 | 30,087 |
| Hyatt Hotels Corp. Class A | | 637 | 32,035 |
| Jack in the Box, Inc. | | 404 | 29,932 |
| Lindblad Expeditions Holdings (a) | | 472 | 3,644 |
| Marriott Vacations Worldwide Corp. | | 649 | 53,354 |
| Monarch Casino & Resort, Inc. (a) | | 201 | 6,850 |
| Noodles & Co. (a) | | 507 | 3,067 |
| Papa John's International, Inc. | | 401 | 31,843 |
| Penn National Gaming, Inc. (a) | | 2,294 | 70,059 |
| Planet Fitness, Inc. (a) | | 1,422 | 86,131 |
| Playa Hotels & Resorts NV (a)(b) | | 949 | 3,435 |
| PlayAGS, Inc. (a) | | 458 | 1,548 |
| Red Robin Gourmet Burgers, Inc. (a)(b) | | 228 | 2,326 |
| Red Rock Resorts, Inc. | | 1,237 | 13,496 |
| Ruth's Hospitality Group, Inc. | | 574 | 4,684 |
| Scientific Games Corp. Class A (a) | | 964 | 14,903 |
| SeaWorld Entertainment, Inc. (a)(b) | | 701 | 10,382 |
| Shake Shack, Inc. Class A (a)(b) | | 627 | 33,218 |
| Six Flags Entertainment Corp. | | 1,395 | 26,798 |
| Texas Roadhouse, Inc. Class A | | 1,161 | 61,034 |
| The Cheesecake Factory, Inc. (b) | | 731 | 16,755 |
| Twin River Worldwide Holdings, Inc. | | 389 | 8,671 |
| Vail Resorts, Inc. | | 717 | 130,602 |
| Wendy's Co. | | 3,163 | 68,890 |
| Wingstop, Inc. | | 529 | 73,515 |
| Wyndham Destinations, Inc. | | 1,516 | 42,721 |
| Wyndham Hotels & Resorts, Inc. | | 1,655 | 70,536 |
| | | | 1,554,892 |
| Household Durables - 1.7% | | | |
| Beazer Homes U.S.A., Inc. (a) | | 511 | 5,146 |
| Cavco Industries, Inc. (a) | | 156 | 30,085 |
| Century Communities, Inc. (a) | | 499 | 15,299 |
| Ethan Allen Interiors, Inc. | | 412 | 4,874 |
| GoPro, Inc. Class A (a)(b) | | 2,223 | 10,581 |
| Helen of Troy Ltd. (a) | | 448 | 84,475 |
| Hooker Furniture Corp. | | 242 | 4,707 |
| Installed Building Products, Inc. (a) | | 376 | 25,861 |
| iRobot Corp. (a) | | 501 | 42,034 |
| KB Home | | 1,556 | 47,738 |
| La-Z-Boy, Inc. | | 827 | 22,379 |
| Leggett & Platt, Inc. | | 2,337 | 82,146 |
| LGI Homes, Inc. (a) | | 384 | 33,804 |
| Lovesac (a) | | 170 | 4,459 |
| M.D.C. Holdings, Inc. | | 891 | 31,809 |
| M/I Homes, Inc. (a) | | 497 | 17,117 |
| Meritage Homes Corp. (a) | | 628 | 47,803 |
| Mohawk Industries, Inc. (a) | | 1,056 | 107,459 |
| Newell Brands, Inc. | | 6,765 | 107,428 |
| Skyline Champion Corp. (a) | | 871 | 21,200 |
| Sonos, Inc. (a) | | 1,120 | 16,386 |
| Taylor Morrison Home Corp. (a) | | 2,308 | 44,521 |
| Tempur Sealy International, Inc. (a) | | 770 | 55,402 |
| Toll Brothers, Inc. | | 2,056 | 67,005 |
| TopBuild Corp. (a) | | 593 | 67,466 |
| TRI Pointe Homes, Inc. (a) | | 2,321 | 34,095 |
| Tupperware Brands Corp. (b) | | 805 | 3,824 |
| Turtle Beach Corp. (a)(b) | | 235 | 3,459 |
| Universal Electronics, Inc. (a) | | 251 | 11,752 |
| Whirlpool Corp. | | 1,104 | 143,001 |
| Zagg, Inc. (a)(b) | | 548 | 1,721 |
| | | | 1,195,036 |
| Internet & Direct Marketing Retail - 1.2% | | | |
| 1-800-FLOWERS.com, Inc. Class A (a) | | 412 | 8,248 |
| Chewy, Inc. (b) | | 966 | 43,171 |
| Duluth Holdings, Inc. (a)(b) | | 244 | 1,798 |
| Etsy, Inc. (a) | | 2,109 | 224,039 |
| Groupon, Inc. (a) | | 389 | 7,049 |
| GrubHub, Inc. (a) | | 1,628 | 114,448 |
| Lands' End, Inc. (a)(b) | | 248 | 1,994 |
| Liberty Interactive Corp. QVC Group Series A (a) | | 6,922 | 65,759 |
| Overstock.com, Inc. (a)(b) | | 603 | 17,143 |
| PetMed Express, Inc. (b) | | 348 | 12,403 |
| Quotient Technology, Inc. (a) | | 1,294 | 9,472 |
| Revolve Group, Inc. (b) | | 239 | 3,552 |
| Shutterstock, Inc. | | 338 | 11,820 |
| Stamps.com, Inc. (a) | | 286 | 52,535 |
| Stitch Fix, Inc. (a)(b) | | 463 | 11,547 |
| The RealReal, Inc. (b) | | 272 | 3,479 |
| The Rubicon Project, Inc. (a) | | 1,682 | 11,219 |
| Wayfair LLC Class A (a) | | 1,202 | 237,527 |
| | | | 837,203 |
| Leisure Products - 0.6% | | | |
| Acushnet Holdings Corp. | | 623 | 21,674 |
| Brunswick Corp. | | 1,405 | 89,934 |
| Callaway Golf Co. | | 1,679 | 29,399 |
| Clarus Corp. | | 357 | 4,134 |
| Johnson Outdoors, Inc. Class A | | 110 | 10,012 |
| Malibu Boats, Inc. Class A (a) | | 366 | 19,014 |
| Mattel, Inc. (a)(b) | | 6,158 | 59,548 |
| MCBC Holdings, Inc. (a) | | 345 | 6,572 |
| Polaris, Inc. | | 1,025 | 94,864 |
| Smith & Wesson Brands, Inc. (a) | | 1,002 | 21,563 |
| Sturm, Ruger & Co., Inc. | | 293 | 22,268 |
| Vista Outdoor, Inc. (a) | | 1,068 | 15,433 |
| YETI Holdings, Inc. (a)(b) | | 1,203 | 51,404 |
| | | | 445,819 |
| Multiline Retail - 0.4% | | | |
| Big Lots, Inc. (b) | | 706 | 29,652 |
| Dillard's, Inc. Class A (b) | | 173 | 4,462 |
| Kohl's Corp. | | 2,784 | 57,824 |
| Macy's, Inc. (b) | | 5,539 | 38,108 |
| Nordstrom, Inc. (b) | | 1,929 | 29,880 |
| Ollie's Bargain Outlet Holdings, Inc. (a) | | 1,004 | 98,041 |
| | | | 257,967 |
| Specialty Retail - 2.3% | | | |
| Aaron's, Inc. Class A | | 1,215 | 55,161 |
| Abercrombie & Fitch Co. Class A (b) | | 1,101 | 11,715 |
| Advance Auto Parts, Inc. | | 1,225 | 174,501 |
| America's Car Mart, Inc. (a) | | 109 | 9,578 |
| American Eagle Outfitters, Inc. | | 2,743 | 29,899 |
| Asbury Automotive Group, Inc. (a) | | 345 | 26,679 |
| At Home Group, Inc. (a)(b) | | 835 | 5,419 |
| AutoNation, Inc. (a) | | 1,022 | 38,407 |
| Barnes & Noble Education, Inc. (a) | | 639 | 1,022 |
| Bed Bath & Beyond, Inc. (b) | | 2,212 | 23,447 |
| Boot Barn Holdings, Inc. (a)(b) | | 499 | 10,758 |
| Caleres, Inc. | | 733 | 6,113 |
| Camping World Holdings, Inc. | | 589 | 15,997 |
| Carvana Co. Class A (a)(b) | | 983 | 118,157 |
| Chico's FAS, Inc. | | 2,085 | 2,877 |
| Citi Trends, Inc. | | 179 | 3,619 |
| Conn's, Inc. (a)(b) | | 288 | 2,906 |
| Dick's Sporting Goods, Inc. | | 1,164 | 48,027 |
| DSW, Inc. Class A (b) | | 972 | 6,580 |
| Express, Inc. (a)(b) | | 1,146 | 1,765 |
| Five Below, Inc. (a) | | 991 | 105,948 |
| Floor & Decor Holdings, Inc. Class A (a) | | 1,249 | 72,005 |
| Foot Locker, Inc. | | 1,857 | 54,150 |
| GameStop Corp. Class A (a)(b) | | 1,162 | 5,043 |
| Gap, Inc. | | 3,835 | 48,398 |
| Genesco, Inc. (a) | | 250 | 5,415 |
| Group 1 Automotive, Inc. | | 312 | 20,583 |
| Guess?, Inc. (b) | | 748 | 7,233 |
| Haverty Furniture Companies, Inc. | | 291 | 4,656 |
| Hibbett Sports, Inc. (a) | | 299 | 6,261 |
| L Brands, Inc. | | 4,129 | 61,811 |
| Lithia Motors, Inc. Class A (sub. vtg.) | | 394 | 59,624 |
| Lumber Liquidators Holdings, Inc. (a)(b) | | 563 | 7,803 |
| MarineMax, Inc. (a) | | 378 | 8,463 |
| Michaels Companies, Inc. (a)(b) | | 1,313 | 9,283 |
| Monro, Inc. (b) | | 593 | 32,579 |
| Murphy U.S.A., Inc. (a) | | 486 | 54,719 |
| National Vision Holdings, Inc. (a)(b) | | 1,417 | 43,247 |
| Office Depot, Inc. | | 9,234 | 21,700 |
| Party City Holdco, Inc. (a)(b) | | 895 | 1,334 |
| Penske Automotive Group, Inc. (b) | | 587 | 22,723 |
| Rent-A-Center, Inc. | | 846 | 23,536 |
| RH (a) | | 295 | 73,426 |
| Sally Beauty Holdings, Inc. (a) | | 1,992 | 24,960 |
| Shoe Carnival, Inc. (b) | | 151 | 4,420 |
| Signet Jewelers Ltd. (b) | | 919 | 9,438 |
| Sleep Number Corp. (a)(b) | | 498 | 20,737 |
| Sonic Automotive, Inc. Class A (sub. vtg.) (b) | | 430 | 13,721 |
| Sportsman's Warehouse Holdings, Inc. (a) | | 749 | 10,673 |
| Tailored Brands, Inc. (b) | | 994 | 932 |
| The Buckle, Inc. (b) | | 510 | 7,997 |
| The Cato Corp. Class A (sub. vtg.) | | 355 | 2,904 |
| The Children's Place Retail Stores, Inc. (b) | | 272 | 10,178 |
| Tilly's, Inc. | | 336 | 1,905 |
| Urban Outfitters, Inc. (a)(b) | | 1,255 | 19,101 |
| Williams-Sonoma, Inc. | | 1,383 | 113,420 |
| Winmark Corp. | | 38 | 6,507 |
| Zumiez, Inc. (a) | | 358 | 9,802 |
| | | | 1,599,262 |
| Textiles, Apparel & Luxury Goods - 1.2% | | | |
| Capri Holdings Ltd. (a) | | 2,659 | 41,560 |
| Carter's, Inc. | | 773 | 62,381 |
| Columbia Sportswear Co. | | 503 | 40,532 |
| Crocs, Inc. (a) | | 1,211 | 44,589 |
| Deckers Outdoor Corp. (a) | | 497 | 97,606 |
| Fossil Group, Inc. (a)(b) | | 769 | 3,576 |
| G-III Apparel Group Ltd.(a)(b) | | 735 | 9,768 |
| Hanesbrands, Inc. | | 6,194 | 69,930 |
| Kontoor Brands, Inc. | | 816 | 14,533 |
| Levi Strauss & Co. Class A (b) | | 747 | 10,010 |
| Movado Group, Inc. | | 293 | 3,176 |
| Oxford Industries, Inc. (b) | | 300 | 13,203 |
| PVH Corp. | | 1,263 | 60,687 |
| Ralph Lauren Corp. | | 851 | 61,715 |
| Rocky Brands, Inc. | | 111 | 2,282 |
| Samsonite International SA (d) | | 25,800 | 25,965 |
| Skechers U.S.A., Inc. Class A (sub. vtg.) (a) | | 2,420 | 75,940 |
| Steven Madden Ltd. | | 1,349 | 33,307 |
| Tapestry, Inc. | | 4,903 | 65,112 |
| Under Armour, Inc.: | | | |
| Class A (sub. vtg.) (a) | | 3,278 | 31,928 |
| Class C (non-vtg.) (a) | | 3,519 | 31,108 |
| Unifi, Inc. (a) | | 238 | 3,065 |
| Vera Bradley, Inc. (a) | | 437 | 1,940 |
| Wolverine World Wide, Inc. | | 1,436 | 34,191 |
| | | | 838,104 |
|
| TOTAL CONSUMER DISCRETIONARY | | | 8,917,866 |
|
| CONSUMER STAPLES - 3.4% | | | |
| Beverages - 0.4% | | | |
| Boston Beer Co., Inc. Class A (a) | | 171 | 91,767 |
| Coca-Cola Bottling Co. Consolidated | | 82 | 18,794 |
| Craft Brew Alliance, Inc. (a)(b) | | 221 | 3,401 |
| Keurig Dr. Pepper, Inc. | | 5,973 | 169,633 |
| MGP Ingredients, Inc. (b) | | 235 | 8,626 |
| National Beverage Corp. (a)(b) | | 216 | 13,180 |
| New Age Beverages Corp. (a)(b) | | 1,390 | 2,127 |
| | | | 307,528 |
| Food & Staples Retailing - 0.8% | | | |
| Andersons, Inc. | | 568 | 7,816 |
| BJ's Wholesale Club Holdings, Inc. (a) | | 2,202 | 82,069 |
| Casey's General Stores, Inc. | | 653 | 97,637 |
| Chefs' Warehouse Holdings (a) | | 553 | 7,510 |
| Grocery Outlet Holding Corp. | | 1,127 | 45,982 |
| Ingles Markets, Inc. Class A | | 263 | 11,327 |
| Performance Food Group Co. (a) | | 2,354 | 68,596 |
| PriceSmart, Inc. | | 394 | 23,770 |
| Rite Aid Corp. (a)(b) | | 961 | 16,395 |
| SpartanNash Co. | | 629 | 13,366 |
| Sprouts Farmers Market LLC (a) | | 2,080 | 53,227 |
| U.S. Foods Holding Corp. (a) | | 3,903 | 76,967 |
| United Natural Foods, Inc. (a)(b) | | 933 | 16,990 |
| Weis Markets, Inc. (b) | | 283 | 14,184 |
| | | | 535,836 |
| Food Products - 1.6% | | | |
| B&G Foods, Inc. Class A (b) | | 1,143 | 27,866 |
| Beyond Meat, Inc. (a)(b) | | 188 | 25,188 |
| Bunge Ltd. | | 2,513 | 103,360 |
| Cal-Maine Foods, Inc. (a) | | 533 | 23,708 |
| Calavo Growers, Inc. (b) | | 291 | 18,307 |
| Campbell Soup Co. | | 3,002 | 148,989 |
| Darling Ingredients, Inc. (a) | | 2,912 | 71,693 |
| Farmer Brothers Co. (a) | | 278 | 2,041 |
| Flowers Foods, Inc. | | 3,419 | 76,449 |
| Fresh Del Monte Produce, Inc. | | 533 | 13,122 |
| Freshpet, Inc. (a) | | 612 | 51,200 |
| Hostess Brands, Inc. Class A (a) | | 2,195 | 26,823 |
| Ingredion, Inc. | | 1,186 | 98,438 |
| J&J Snack Foods Corp. | | 266 | 33,817 |
| John B. Sanfilippo & Son, Inc. | | 157 | 13,397 |
| Lancaster Colony Corp. | | 354 | 54,866 |
| Landec Corp. (a) | | 511 | 4,068 |
| Pilgrim's Pride Corp. (a) | | 910 | 15,370 |
| Post Holdings, Inc. (a) | | 1,136 | 99,536 |
| Sanderson Farms, Inc. | | 353 | 40,909 |
| Seaboard Corp. | | 4 | 11,735 |
| The Hain Celestial Group, Inc. (a) | | 1,390 | 43,799 |
| The Simply Good Foods Co. (a) | | 1,493 | 27,740 |
| Tootsie Roll Industries, Inc. (b) | | 305 | 10,452 |
| TreeHouse Foods, Inc. (a) | | 1,011 | 44,282 |
| | | | 1,087,155 |
| Household Products - 0.2% | | | |
| Central Garden & Pet Co. (a) | | 208 | 7,486 |
| Central Garden & Pet Co. Class A (non-vtg.) (a) | | 648 | 21,896 |
| Energizer Holdings, Inc. (b) | | 1,129 | 53,616 |
| Spectrum Brands Holdings, Inc. | | 728 | 33,415 |
| WD-40 Co. (b) | | 244 | 48,385 |
| | | | 164,798 |
| Personal Products - 0.3% | | | |
| Coty, Inc. Class A | | 5,315 | 23,758 |
| Edgewell Personal Care Co. (a) | | 964 | 30,038 |
| elf Beauty, Inc. (a)(b) | | 467 | 8,906 |
| Herbalife Nutrition Ltd. (a) | | 1,652 | 74,307 |
| Inter Parfums, Inc. | | 312 | 15,023 |
| LifeVantage Corp. (a) | | 197 | 2,663 |
| MediFast, Inc. | | 212 | 29,419 |
| Nu Skin Enterprises, Inc. Class A | | 922 | 35,248 |
| USANA Health Sciences, Inc. (a) | | 214 | 15,714 |
| | | | 235,076 |
| Tobacco - 0.1% | | | |
| 22nd Century Group, Inc. (a)(b) | | 1,887 | 1,442 |
| Turning Point Brands, Inc. (b) | | 168 | 4,185 |
| Universal Corp. | | 441 | 18,747 |
| Vector Group Ltd. | | 2,084 | 20,965 |
| | | | 45,339 |
|
| TOTAL CONSUMER STAPLES | | | 2,375,732 |
|
| ENERGY - 2.4% | | | |
| Energy Equipment & Services - 0.6% | | | |
| Archrock, Inc. | | 2,256 | 14,641 |
| Cactus, Inc. | | 856 | 17,659 |
| Championx Corp. (a) | | 3,308 | 32,286 |
| Core Laboratories NV (b) | | 770 | 15,646 |
| DMC Global, Inc. (b) | | 258 | 7,121 |
| Dril-Quip, Inc. (a) | | 640 | 19,066 |
| Exterran Corp. (a) | | 480 | 2,587 |
| Forum Energy Technologies, Inc. (a) | | 1,763 | 931 |
| Frank's International NV (a) | | 1,777 | 3,963 |
| Helix Energy Solutions Group, Inc. (a) | | 2,479 | 8,602 |
| Helmerich & Payne, Inc. | | 1,913 | 37,323 |
| Liberty Oilfield Services, Inc. Class A | | 905 | 4,959 |
| Matrix Service Co. (a) | | 470 | 4,568 |
| Nabors Industries Ltd. | | 117 | 4,331 |
| National Oilwell Varco, Inc. | | 6,905 | 84,586 |
| Newpark Resources, Inc. (a) | | 1,603 | 3,575 |
| Nextier Oilfield Solutions, Inc. (a) | | 2,760 | 6,762 |
| Noble Corp. (a)(b) | | 4,355 | 1,398 |
| Oceaneering International, Inc. (a) | | 1,712 | 10,940 |
| Oil States International, Inc. (a) | | 1,072 | 5,092 |
| Patterson-UTI Energy, Inc. | | 3,406 | 11,819 |
| ProPetro Holding Corp. (a) | | 1,442 | 7,412 |
| RPC, Inc. | | 855 | 2,633 |
| SEACOR Holdings, Inc. (a) | | 304 | 8,609 |
| Select Energy Services, Inc. Class A (a) | | 1,123 | 5,503 |
| Solaris Oilfield Infrastructure, Inc. Class A | | 532 | 3,947 |
| TechnipFMC PLC | | 7,580 | 51,847 |
| Tidewater, Inc. (a) | | 686 | 3,835 |
| Transocean Ltd. (United States) (a)(b) | | 10,353 | 18,946 |
| U.S. Silica Holdings, Inc. | | 1,249 | 4,509 |
| Valaris PLC Class A (a)(b) | | 3,460 | 2,256 |
| | | | 407,352 |
| Oil, Gas & Consumable Fuels - 1.8% | | | |
| Antero Resources Corp. (a) | | 3,279 | 8,329 |
| Arch Resources, Inc. | | 264 | 7,500 |
| Ardmore Shipping Corp. | | 581 | 2,522 |
| Berry Petroleum Corp. | | 710 | 3,429 |
| Bonanza Creek Energy, Inc. (a) | | 351 | 5,202 |
| Brigham Minerals, Inc. Class A | | 495 | 6,113 |
| Cabot Oil & Gas Corp. | | 7,085 | 121,720 |
| California Resources Corp. (a)(b) | | 827 | 1,009 |
| Callon Petroleum Co. (a) | | 6,652 | 7,650 |
| Centennial Resource Development, Inc. Class A (a) | | 3,498 | 3,113 |
| Cimarex Energy Co. | | 1,837 | 50,499 |
| Clean Energy Fuels Corp. (a) | | 2,575 | 5,717 |
| CNX Resources Corp. (a) | | 3,301 | 28,554 |
| CONSOL Energy, Inc. (a)(b) | | 392 | 1,987 |
| Continental Resources, Inc. (b) | | 1,508 | 26,435 |
| CVR Energy, Inc. | | 508 | 10,216 |
| Delek U.S. Holdings, Inc. | | 1,303 | 22,685 |
| Denbury Resources, Inc. (a)(b) | | 8,850 | 2,443 |
| Devon Energy Corp. | | 6,817 | 77,305 |
| Diamond S Shipping, Inc. (a)(b) | | 383 | 3,060 |
| EQT Corp. | | 4,551 | 54,157 |
| Equitrans Midstream Corp. | | 7,233 | 60,106 |
| Falcon Minerals Corp. | | 631 | 2,019 |
| Green Plains, Inc. | | 558 | 5,700 |
| Gulfport Energy Corp. (a) | | 2,454 | 2,675 |
| Highpoint Resources, Inc. (a) | | 2,099 | 619 |
| HollyFrontier Corp. | | 2,647 | 77,292 |
| International Seaways, Inc. | | 439 | 7,173 |
| Kosmos Energy Ltd. | | 6,314 | 10,481 |
| Laredo Petroleum, Inc. (a)(b) | | 162 | 2,245 |
| Magnolia Oil & Gas Corp. Class A (a) | | 1,772 | 10,738 |
| Marathon Oil Corp. | | 14,066 | 86,084 |
| Matador Resources Co. (a)(b) | | 1,923 | 16,346 |
| Murphy Oil Corp. (b) | | 2,609 | 36,004 |
| National Energy Services Reunited Corp. (a) | | 501 | 3,447 |
| Noble Energy, Inc. | | 8,526 | 76,393 |
| Northern Oil & Gas, Inc. (a)(b) | | 3,916 | 3,285 |
| Oasis Petroleum, Inc. (a)(b) | | 5,045 | 3,784 |
| Ovintiv, Inc. (b) | | 4,644 | 44,350 |
| Par Pacific Holdings, Inc. (a) | | 643 | 5,781 |
| Parsley Energy, Inc. Class A | | 5,570 | 59,488 |
| PBF Energy, Inc. Class A | | 1,781 | 18,237 |
| PDC Energy, Inc. (a) | | 1,699 | 21,136 |
| Peabody Energy Corp. | | 1,187 | 3,419 |
| Penn Virginia Corp. (a)(b) | | 247 | 2,354 |
| QEP Resources, Inc. | | 4,027 | 5,195 |
| Range Resources Corp. (b) | | 3,727 | 20,983 |
| Renewable Energy Group, Inc. (a)(b) | | 682 | 16,900 |
| Rex American Resources Corp. (a) | | 105 | 7,284 |
| Ring Energy, Inc. (a)(b) | | 1,068 | 1,239 |
| SM Energy Co. | | 1,855 | 6,956 |
| Southwestern Energy Co. (a)(b) | | 9,666 | 24,745 |
| Talos Energy, Inc. (a)(b) | | 351 | 3,229 |
| Targa Resources Corp. | | 4,129 | 82,869 |
| Teekay Corp. (a)(b) | | 1,091 | 2,618 |
| Teekay Tankers Ltd. (a)(b) | | 436 | 5,590 |
| Tellurian, Inc. (a)(b) | | 1,562 | 1,796 |
| W&T Offshore, Inc. (a)(b) | | 1,710 | 3,899 |
| World Fuel Services Corp. | | 1,127 | 29,032 |
| WPX Energy, Inc. (a) | | 7,249 | 46,249 |
| | | | 1,267,385 |
|
| TOTAL ENERGY | | | 1,674,737 |
|
| FINANCIALS - 13.3% | | | |
| Banks - 5.5% | | | |
| 1st Source Corp. | | 256 | 9,108 |
| Allegiance Bancshares, Inc. | | 335 | 8,506 |
| Amalgamated Bank | | 264 | 3,337 |
| Ameris Bancorp | | 1,150 | 27,129 |
| Associated Banc-Corp. | | 2,743 | 37,524 |
| Atlantic Capital Bancshares, Inc. (a) | | 420 | 5,107 |
| Banc of California, Inc. | | 789 | 8,545 |
| BancFirst Corp. | | 314 | 12,739 |
| Bancorp, Inc., Delaware (a) | | 868 | 8,506 |
| BancorpSouth Bank | | 1,727 | 39,272 |
| Bank of Hawaii Corp. | | 705 | 43,294 |
| Bank OZK (b) | | 2,169 | 50,906 |
| BankUnited, Inc. | | 1,654 | 33,494 |
| Banner Corp. | | 619 | 23,522 |
| Berkshire Hills Bancorp, Inc. | | 742 | 8,177 |
| BOK Financial Corp. | | 564 | 31,832 |
| Boston Private Financial Holdings, Inc. | | 1,453 | 9,997 |
| Bridge Bancorp, Inc. | | 320 | 7,309 |
| Brookline Bancorp, Inc., Delaware | | 1,400 | 14,112 |
| Bryn Mawr Bank Corp. | | 357 | 9,875 |
| Byline Bancorp, Inc. | | 408 | 5,345 |
| Cadence Bancorp Class A | | 2,242 | 19,864 |
| Camden National Corp. | | 264 | 9,119 |
| Carter Bank & Trust | | 395 | 3,188 |
| Cathay General Bancorp | | 1,341 | 35,268 |
| Central Pacific Financial Corp. | | 501 | 8,031 |
| CIT Group, Inc. | | 1,758 | 36,443 |
| City Holding Co. | | 288 | 18,769 |
| Columbia Banking Systems, Inc. | | 1,274 | 36,112 |
| Comerica, Inc. | | 2,474 | 94,259 |
| Commerce Bancshares, Inc. | | 1,777 | 105,678 |
| Community Bank System, Inc. | | 915 | 52,173 |
| Community Trust Bancorp, Inc. | | 302 | 9,894 |
| ConnectOne Bancorp, Inc. | | 587 | 9,462 |
| Cullen/Frost Bankers, Inc. | | 1,012 | 75,607 |
| Customers Bancorp, Inc. (a) | | 501 | 6,022 |
| CVB Financial Corp. | | 2,279 | 42,708 |
| Eagle Bancorp, Inc. | | 563 | 18,438 |
| East West Bancorp, Inc. | | 2,514 | 91,107 |
| Enterprise Financial Services Corp. | | 462 | 14,377 |
| Equity Bancshares, Inc. (a) | | 248 | 4,325 |
| FB Financial Corp. (b) | | 304 | 7,530 |
| First Bancorp, North Carolina | | 525 | 13,167 |
| First Bancorp, Puerto Rico | | 3,855 | 21,549 |
| First Bancshares, Inc. | | 364 | 8,190 |
| First Busey Corp. | | 885 | 16,505 |
| First Citizens Bancshares, Inc. | | 140 | 56,703 |
| First Commonwealth Financial Corp. | | 1,718 | 14,225 |
| First Financial Bancorp, Ohio | | 1,756 | 24,391 |
| First Financial Bankshares, Inc. | | 2,513 | 72,601 |
| First Financial Corp., Indiana | | 239 | 8,805 |
| First Foundation, Inc. | | 702 | 11,471 |
| First Hawaiian, Inc. | | 2,289 | 39,462 |
| First Horizon National Corp. | | 5,587 | 55,647 |
| First Interstate Bancsystem, Inc. | | 615 | 19,040 |
| First Merchants Corp. | | 964 | 26,577 |
| First Midwest Bancorp, Inc., Delaware | | 2,044 | 27,287 |
| Flushing Financial Corp. | | 482 | 5,553 |
| FNB Corp., Pennsylvania | | 5,810 | 43,575 |
| Franklin Financial Network, Inc. | | 240 | 6,180 |
| Fulton Financial Corp. | | 2,855 | 30,063 |
| German American Bancorp, Inc. | | 430 | 13,373 |
| Glacier Bancorp, Inc. | | 1,570 | 55,405 |
| Great Southern Bancorp, Inc. | | 190 | 7,668 |
| Great Western Bancorp, Inc. | | 1,019 | 14,021 |
| Hancock Whitney Corp. | | 1,524 | 32,309 |
| Hanmi Financial Corp. | | 566 | 5,496 |
| HarborOne Bancorp, Inc. | | 1,002 | 8,557 |
| Heartland Financial U.S.A., Inc. | | 577 | 19,295 |
| Heritage Commerce Corp. | | 1,029 | 7,723 |
| Heritage Financial Corp., Washington | | 643 | 12,860 |
| Hilltop Holdings, Inc. | | 1,236 | 22,804 |
| Home Bancshares, Inc. | | 2,727 | 41,941 |
| Hope Bancorp, Inc. | | 2,207 | 20,349 |
| Horizon Bancorp, Inc. Indiana | | 668 | 7,141 |
| IBERIABANK Corp. | | 937 | 42,671 |
| Independent Bank Corp. | | 399 | 5,925 |
| Independent Bank Corp., Massachusetts | | 585 | 39,248 |
| Independent Bank Group, Inc. | | 642 | 26,014 |
| International Bancshares Corp. | | 989 | 31,668 |
| Investors Bancorp, Inc. | | 3,628 | 30,838 |
| Lakeland Bancorp, Inc. | | 898 | 10,264 |
| Lakeland Financial Corp. | | 467 | 21,758 |
| Live Oak Bancshares, Inc. | | 520 | 7,545 |
| Mercantil Bank Holding Corp. Class A (a) | | 426 | 6,407 |
| Mercantile Bank Corp. | | 315 | 7,119 |
| Midland States Bancorp, Inc. | | 344 | 5,143 |
| MidWestOne Financial Group, Inc. | | 188 | 3,760 |
| National Bank Holdings Corp. | | 545 | 14,715 |
| NBT Bancorp, Inc. | | 759 | 23,347 |
| Nicolet Bankshares, Inc. (a) | | 157 | 8,604 |
| OceanFirst Financial Corp. | | 1,065 | 18,776 |
| OFG Bancorp | | 899 | 12,020 |
| Old National Bancorp, Indiana | | 2,925 | 40,248 |
| Origin Bancorp, Inc. | | 350 | 7,700 |
| Pacific Premier Bancorp, Inc. | | 1,447 | 31,371 |
| PacWest Bancorp | | 2,084 | 41,076 |
| Park National Corp. | | 247 | 17,384 |
| Peapack-Gladstone Financial Corp. | | 298 | 5,582 |
| Peoples Bancorp, Inc. | | 312 | 6,639 |
| Peoples United Financial, Inc. | | 7,543 | 87,273 |
| Pinnacle Financial Partners, Inc. | | 1,265 | 53,117 |
| Popular, Inc. | | 1,573 | 58,468 |
| Preferred Bank, Los Angeles | | 235 | 10,070 |
| Prosperity Bancshares, Inc. | | 1,643 | 97,561 |
| QCR Holdings, Inc. | | 260 | 8,107 |
| Renasant Corp. | | 996 | 24,800 |
| S&T Bancorp, Inc. | | 675 | 15,829 |
| Sandy Spring Bancorp, Inc. | | 848 | 21,013 |
| Seacoast Banking Corp., Florida (a) | | 917 | 18,707 |
| ServisFirst Bancshares, Inc. | | 809 | 28,930 |
| Signature Bank | | 951 | 101,681 |
| Simmons First National Corp. Class A | | 1,939 | 33,176 |
| South State Corp. | | 1,277 | 60,862 |
| Southside Bancshares, Inc. | | 561 | 15,551 |
| Sterling Bancorp | | 3,472 | 40,692 |
| Stock Yards Bancorp, Inc. | | 375 | 15,075 |
| Synovus Financial Corp. | | 2,623 | 53,850 |
| TCF Financial Corp. | | 2,695 | 79,287 |
| Texas Capital Bancshares, Inc. (a) | | 896 | 27,660 |
| Tompkins Financial Corp. | | 224 | 14,508 |
| TowneBank | | 1,155 | 21,760 |
| Trico Bancshares | | 470 | 14,312 |
| TriState Capital Holdings, Inc. (a) | | 416 | 6,535 |
| Triumph Bancorp, Inc. (a) | | 409 | 9,926 |
| Trustmark Corp. | | 1,121 | 27,487 |
| UMB Financial Corp. | | 753 | 38,817 |
| Umpqua Holdings Corp. | | 3,944 | 41,964 |
| Union Bankshares Corp. | | 1,402 | 32,470 |
| United Bankshares, Inc., West Virginia | | 2,272 | 62,844 |
| United Community Bank, Inc. | | 1,401 | 28,188 |
| Univest Corp. of Pennsylvania | | 499 | 8,054 |
| Valley National Bancorp | | 7,005 | 54,779 |
| Veritex Holdings, Inc. | | 826 | 14,620 |
| Washington Trust Bancorp, Inc. | | 280 | 9,170 |
| Webster Financial Corp. | | 1,608 | 46,005 |
| WesBanco, Inc. | | 1,154 | 23,438 |
| Westamerica Bancorp. | | 484 | 27,791 |
| Western Alliance Bancorp. | | 1,650 | 62,486 |
| Wintrust Financial Corp. | | 1,025 | 44,711 |
| Zions Bancorp NA | | 2,915 | 99,110 |
| | | | 3,872,449 |
| Capital Markets - 2.4% | | | |
| Affiliated Managers Group, Inc. | | 839 | 62,556 |
| Artisan Partners Asset Management, Inc. | | 1,020 | 33,150 |
| Assetmark Financial Holdings, Inc. (a) | | 216 | 5,895 |
| B. Riley Financial, Inc. | | 245 | 5,331 |
| BGC Partners, Inc. Class A | | 5,083 | 13,927 |
| Blucora, Inc. (a) | | 864 | 9,867 |
| BrightSphere Investment Group, Inc. | | 1,158 | 14,429 |
| Cohen & Steers, Inc. | | 386 | 26,267 |
| Cowen Group, Inc. Class A | | 513 | 8,316 |
| Diamond Hill Investment Group, Inc. | | 53 | 6,025 |
| Donnelley Financial Solutions, Inc. (a) | | 518 | 4,351 |
| E*TRADE Financial Corp. | | 3,924 | 195,141 |
| Eaton Vance Corp. (non-vtg.) | | 2,010 | 77,586 |
| Evercore, Inc. Class A | | 725 | 42,717 |
| Federated Hermes, Inc. Class B (non-vtg.) | | 1,690 | 40,053 |
| Focus Financial Partners, Inc. Class A (a) | | 531 | 17,550 |
| Franklin Resources, Inc. (b) | | 4,916 | 103,089 |
| Greenhill & Co., Inc. | | 277 | 2,767 |
| Hamilton Lane, Inc. Class A | | 512 | 34,493 |
| Houlihan Lokey | | 873 | 48,574 |
| Interactive Brokers Group, Inc. | | 1,362 | 56,891 |
| INTL FCStone, Inc. (a) | | 285 | 15,675 |
| Invesco Ltd. | | 6,700 | 72,092 |
| Janus Henderson Group PLC (b) | | 2,725 | 57,661 |
| Lazard Ltd. Class A | | 2,003 | 57,346 |
| Legg Mason, Inc. | | 1,477 | 73,481 |
| LPL Financial | | 1,401 | 109,838 |
| Moelis & Co. Class A | | 949 | 29,571 |
| Morningstar, Inc. | | 359 | 50,608 |
| Och-Ziff Capital Management Group LLC Class A | | 296 | 3,827 |
| Oppenheimer Holdings, Inc. Class A (non-vtg.) | | 170 | 3,704 |
| Piper Jaffray Companies | | 260 | 15,382 |
| PJT Partners, Inc. | | 374 | 19,201 |
| SEI Investments Co. | | 2,199 | 120,901 |
| Stifel Financial Corp. | | 1,215 | 57,627 |
| Tradeweb Markets, Inc. Class A | | 1,366 | 79,419 |
| Victory Capital Holdings, Inc. | | 279 | 4,796 |
| Virtu Financial, Inc. Class A | | 1,360 | 32,096 |
| Virtus Investment Partners, Inc. | | 129 | 15,001 |
| Waddell & Reed Financial, Inc. Class A (b) | | 1,163 | 18,038 |
| WisdomTree Investments, Inc. | | 2,154 | 7,474 |
| | | | 1,652,713 |
| Consumer Finance - 0.7% | | | |
| Credit Acceptance Corp. (a)(b) | | 232 | 97,210 |
| CURO Group Holdings Corp. | | 238 | 1,944 |
| Encore Capital Group, Inc. (a)(b) | | 484 | 16,543 |
| Enova International, Inc. (a) | | 511 | 7,599 |
| EZCORP, Inc. (non-vtg.) Class A (a) | | 991 | 6,243 |
| First Cash Financial Services, Inc. | | 734 | 49,530 |
| Green Dot Corp. Class A (a) | | 865 | 42,454 |
| LendingClub Corp. (a) | | 1,271 | 5,783 |
| LendingTree, Inc. (a)(b) | | 135 | 39,087 |
| Navient Corp. | | 3,018 | 21,217 |
| Nelnet, Inc. Class A | | 365 | 17,425 |
| OneMain Holdings, Inc. | | 1,338 | 32,835 |
| PRA Group, Inc. (a)(b) | | 809 | 31,276 |
| Regional Management Corp. (a) | | 156 | 2,763 |
| Santander Consumer U.S.A. Holdings, Inc. | | 1,717 | 31,610 |
| SLM Corp. | | 6,664 | 46,848 |
| World Acceptance Corp. (a) | | 95 | 6,224 |
| | | | 456,591 |
| Diversified Financial Services - 0.3% | | | |
| Cannae Holdings, Inc. (a) | | 1,501 | 61,691 |
| Jefferies Financial Group, Inc. | | 4,016 | 62,449 |
| On Deck Capital, Inc. (a) | | 989 | 711 |
| Voya Financial, Inc. | | 2,240 | 104,496 |
| | | | 229,347 |
| Insurance - 2.8% | | | |
| AMBAC Financial Group, Inc. (a) | | 799 | 11,442 |
| American Equity Investment Life Holding Co. | | 1,641 | 40,549 |
| American Financial Group, Inc. | | 1,328 | 84,275 |
| American National Insurance Co. | | 156 | 11,243 |
| Amerisafe, Inc. | | 342 | 20,917 |
| Argo Group International Holdings, Ltd. | | 604 | 21,037 |
| Assurant, Inc. | | 1,056 | 109,074 |
| Assured Guaranty Ltd. | | 1,546 | 37,738 |
| Athene Holding Ltd. (a) | | 2,109 | 65,780 |
| Axis Capital Holdings Ltd. | | 1,491 | 60,475 |
| Benefytt Technologies, Inc. (a)(b) | | 201 | 4,112 |
| Brighthouse Financial, Inc. (a) | | 1,668 | 46,404 |
| CNO Financial Group, Inc. | | 2,554 | 39,766 |
| eHealth, Inc. (a) | | 455 | 44,699 |
| Employers Holdings, Inc. | | 554 | 16,703 |
| Enstar Group Ltd. (a) | | 271 | 41,401 |
| Erie Indemnity Co. Class A | | 328 | 62,943 |
| First American Financial Corp. | | 1,977 | 94,936 |
| Genworth Financial, Inc. Class A (a) | | 8,929 | 20,626 |
| Goosehead Insurance (a)(b) | | 219 | 16,460 |
| Greenlight Capital Re, Ltd. (a)(b) | | 527 | 3,436 |
| Hallmark Financial Services, Inc. (a) | | 223 | 778 |
| Hanover Insurance Group, Inc. | | 673 | 68,195 |
| HCI Group, Inc. | | 108 | 4,987 |
| Heritage Insurance Holdings, Inc. | | 487 | 6,375 |
| Horace Mann Educators Corp. | | 747 | 27,437 |
| James River Group Holdings Ltd. | | 532 | 23,940 |
| Kemper Corp. | | 1,089 | 78,974 |
| Kinsale Capital Group, Inc. | | 370 | 57,428 |
| MBIA, Inc. (a)(b) | | 1,070 | 7,758 |
| Mercury General Corp. | | 481 | 19,601 |
| National General Holdings Corp. | | 1,172 | 25,327 |
| National Western Life Group, Inc. | | 40 | 8,128 |
| Old Republic International Corp. | | 5,060 | 82,529 |
| Palomar Holdings, Inc. (a) | | 320 | 27,443 |
| Primerica, Inc. | | 723 | 84,302 |
| ProAssurance Corp. | | 942 | 13,631 |
| ProSight Global, Inc. | | 139 | 1,237 |
| Reinsurance Group of America, Inc. | | 1,205 | 94,520 |
| RenaissanceRe Holdings Ltd. | | 893 | 152,730 |
| RLI Corp. | | 708 | 58,127 |
| Safety Insurance Group, Inc. | | 259 | 19,751 |
| Selective Insurance Group, Inc. | | 1,055 | 55,641 |
| State Auto Financial Corp. | | 295 | 5,266 |
| Stewart Information Services Corp. | | 422 | 13,719 |
| Third Point Reinsurance Ltd. (a) | | 1,425 | 10,702 |
| Trupanion, Inc. (a)(b) | | 520 | 22,199 |
| United Fire Group, Inc. | | 378 | 10,474 |
| United Insurance Holdings Corp. | | 327 | 2,557 |
| Universal Insurance Holdings, Inc. | | 540 | 9,585 |
| Unum Group | | 3,607 | 59,840 |
| White Mountains Insurance Group Ltd. | | 52 | 46,174 |
| | | | 1,953,371 |
| Mortgage Real Estate Investment Trusts - 0.7% | | | |
| AG Mortgage Investment Trust, Inc. (b) | | 575 | 1,834 |
| Anworth Mortgage Asset Corp. | | 1,766 | 3,002 |
| Apollo Commercial Real Estate Finance, Inc. | | 2,590 | 25,408 |
| Ares Commercial Real Estate Corp. | | 602 | 5,490 |
| Arlington Asset Investment Corp. | | 734 | 2,180 |
| Armour Residential REIT, Inc. | | 1,172 | 11,005 |
| Blackstone Mortgage Trust, Inc. | | 2,580 | 62,152 |
| Capstead Mortgage Corp. | | 1,647 | 9,042 |
| Cherry Hill Mortgage Investment Corp. | | 291 | 2,625 |
| Chimera Investment Corp. | | 3,445 | 33,106 |
| Colony NorthStar Credit Real Estate, Inc. | | 1,466 | 10,291 |
| Dynex Capital, Inc. | | 411 | 5,877 |
| Exantas Capital Corp. | | 576 | 1,526 |
| Granite Point Mortgage Trust, Inc. | | 943 | 6,771 |
| Great Ajax Corp. | | 306 | 2,815 |
| Hannon Armstrong Sustainable Infrastructure Capital, Inc. | | 1,311 | 37,311 |
| Invesco Mortgage Capital, Inc. (b) | | 3,103 | 11,605 |
| KKR Real Estate Finance Trust, Inc. | | 412 | 6,831 |
| Ladder Capital Corp. Class A | | 1,719 | 13,924 |
| MFA Financial, Inc. | | 7,948 | 19,791 |
| New Residential Investment Corp. | | 7,396 | 54,952 |
| New York Mortgage Trust, Inc. | | 6,762 | 17,649 |
| Orchid Island Capital, Inc. (b) | | 1,123 | 5,289 |
| PennyMac Mortgage Investment Trust | | 1,761 | 30,870 |
| Redwood Trust, Inc. | | 1,966 | 13,762 |
| Starwood Property Trust, Inc. | | 5,024 | 75,159 |
| TPG RE Finance Trust, Inc. | | 1,069 | 9,193 |
| Two Harbors Investment Corp. | | 4,864 | 24,515 |
| Western Asset Mortgage Capital Corp. | | 942 | 2,581 |
| ZAIS Financial Corp. | | 654 | 5,683 |
| | | | 512,239 |
| Thrifts & Mortgage Finance - 0.9% | | | |
| Axos Financial, Inc. (a) | | 929 | 20,512 |
| Capitol Federal Financial, Inc. | | 2,526 | 27,811 |
| Columbia Financial, Inc. (a) | | 866 | 12,085 |
| Dime Community Bancshares, Inc. | | 484 | 6,645 |
| Essent Group Ltd. | | 1,964 | 71,234 |
| Farmer Mac Class C (non-vtg.) | | 171 | 10,946 |
| First Defiance Financial Corp. | | 666 | 11,768 |
| Flagstar Bancorp, Inc. | | 597 | 17,570 |
| HomeStreet, Inc. | | 425 | 10,459 |
| Kearny Financial Corp. | | 1,337 | 10,937 |
| Meridian Bancorp, Inc. Maryland | | 928 | 10,765 |
| Meta Financial Group, Inc. | | 548 | 9,957 |
| MGIC Investment Corp. | | 6,031 | 49,394 |
| New York Community Bancorp, Inc. | | 8,192 | 83,558 |
| NMI Holdings, Inc. (a) | | 1,519 | 24,426 |
| Northfield Bancorp, Inc. | | 747 | 8,605 |
| Northwest Bancshares, Inc. | | 2,130 | 21,779 |
| Pennymac Financial Services, Inc. | | 740 | 30,925 |
| Provident Financial Services, Inc. | | 1,051 | 15,187 |
| Radian Group, Inc. | | 3,463 | 53,711 |
| TFS Financial Corp. | | 905 | 12,951 |
| Trustco Bank Corp., New York | | 1,811 | 11,464 |
| Walker & Dunlop, Inc. | | 511 | 25,964 |
| Washington Federal, Inc. | | 1,344 | 36,073 |
| Waterstone Financial, Inc. | | 435 | 6,451 |
| WMI Holdings Corp. (a) | | 1,269 | 15,786 |
| WSFS Financial Corp. | | 905 | 25,974 |
| | | | 642,937 |
|
| TOTAL FINANCIALS | | | 9,319,647 |
|
| HEALTH CARE - 16.1% | | | |
| Biotechnology - 6.6% | | | |
| Abeona Therapeutics, Inc. (a) | | 1,010 | 2,944 |
| ACADIA Pharmaceuticals, Inc. (a) | | 2,023 | 98,055 |
| Acceleron Pharma, Inc. (a) | | 823 | 78,407 |
| Acorda Therapeutics, Inc. (a)(b) | | 1,048 | 770 |
| Adamas Pharmaceuticals, Inc. (a) | | 224 | 573 |
| ADMA Biologics, Inc. (a)(b) | | 1,189 | 3,484 |
| Adverum Biotechnologies, Inc. (a) | | 1,166 | 24,346 |
| Agenus, Inc. (a)(b) | | 2,488 | 9,778 |
| Agios Pharmaceuticals, Inc. (a) | | 1,082 | 57,865 |
| Aimmune Therapeutics, Inc. (a)(b) | | 774 | 12,934 |
| Akebia Therapeutics, Inc. (a) | | 2,513 | 34,127 |
| Akero Therapeutics, Inc. (a) | | 105 | 2,617 |
| Albireo Pharma, Inc. (a) | | 223 | 5,907 |
| Aldeyra Therapeutics, Inc. (a) | | 317 | 1,322 |
| Alector, Inc. (a) | | 675 | 16,497 |
| Alkermes PLC (a) | | 2,823 | 54,780 |
| Allakos, Inc. (a)(b) | | 433 | 31,115 |
| Allogene Therapeutics, Inc. (a) | | 1,145 | 49,029 |
| Amicus Therapeutics, Inc. (a) | | 4,559 | 68,750 |
| AnaptysBio, Inc. (a) | | 436 | 9,740 |
| Anavex Life Sciences Corp. (a)(b) | | 825 | 4,059 |
| Anika Therapeutics, Inc. (a) | | 241 | 9,093 |
| Apellis Pharmaceuticals, Inc. (a) | | 929 | 30,341 |
| Arcus Biosciences, Inc. (a) | | 728 | 18,011 |
| Ardelyx, Inc. (a) | | 1,120 | 7,750 |
| Arena Pharmaceuticals, Inc. (a) | | 989 | 62,258 |
| Arrowhead Pharmaceuticals, Inc. (a) | | 1,812 | 78,260 |
| Assembly Biosciences, Inc. (a) | | 523 | 12,196 |
| Atara Biotherapeutics, Inc. (a) | | 1,045 | 15,226 |
| Athenex, Inc. (a)(b) | | 880 | 12,109 |
| Avid Bioservices, Inc. (a) | | 775 | 5,088 |
| AVROBIO, Inc. (a) | | 441 | 7,695 |
| BioCryst Pharmaceuticals, Inc. (a) | | 2,232 | 10,635 |
| Biohaven Pharmaceutical Holding Co. Ltd. (a)(b) | | 786 | 57,464 |
| Biospecifics Technologies Corp. (a) | | 100 | 6,128 |
| bluebird bio, Inc. (a) | | 1,146 | 69,952 |
| Blueprint Medicines Corp. (a) | | 960 | 74,880 |
| Bridgebio Pharma, Inc. (b) | | 367 | 11,968 |
| Calithera Biosciences, Inc. (a) | | 1,015 | 5,359 |
| CareDx, Inc. (a) | | 701 | 24,836 |
| Castle Biosciences, Inc. | | 75 | 2,827 |
| Catalyst Biosciences, Inc. (a)(b) | | 307 | 1,802 |
| Catalyst Pharmaceutical Partners, Inc. (a) | | 1,750 | 8,085 |
| Cel-Sci Corp. (a)(b) | | 642 | 9,579 |
| ChemoCentryx, Inc. (a) | | 857 | 49,312 |
| Clovis Oncology, Inc. (a)(b) | | 1,577 | 10,645 |
| Coherus BioSciences, Inc. (a)(b) | | 1,070 | 19,110 |
| Concert Pharmaceuticals, Inc. (a) | | 344 | 3,423 |
| Corbus Pharmaceuticals Holdings, Inc. (a)(b) | | 1,084 | 9,095 |
| Cortexyme, Inc. (a) | | 90 | 4,167 |
| Cue Biopharma, Inc. (a) | | 397 | 9,730 |
| Cytokinetics, Inc. (a)(b) | | 1,056 | 24,890 |
| CytomX Therapeutics, Inc. (a) | | 803 | 6,689 |
| Deciphera Pharmaceuticals, Inc. (a) | | 349 | 20,842 |
| Denali Therapeutics, Inc. (a)(b) | | 1,337 | 32,329 |
| Dicerna Pharmaceuticals, Inc. (a) | | 1,048 | 26,619 |
| Dynavax Technologies Corp. (a)(b) | | 1,816 | 16,108 |
| Eagle Pharmaceuticals, Inc. (a) | | 176 | 8,444 |
| Editas Medicine, Inc. (a)(b) | | 1,082 | 32,006 |
| Eiger Biopharmaceuticals, Inc. (a) | | 389 | 3,734 |
| Emergent BioSolutions, Inc. (a) | | 786 | 62,157 |
| Enanta Pharmaceuticals, Inc. (a) | | 298 | 14,963 |
| Epizyme, Inc. (a)(b) | | 1,366 | 21,938 |
| Esperion Therapeutics, Inc. (a)(b) | | 450 | 23,090 |
| Exelixis, Inc. (a) | | 5,456 | 129,525 |
| Fate Therapeutics, Inc. (a) | | 1,235 | 42,373 |
| FibroGen, Inc. (a) | | 1,433 | 58,079 |
| Five Prime Therapeutics, Inc. (a) | | 564 | 3,440 |
| Flexion Therapeutics, Inc. (a)(b) | | 765 | 10,060 |
| G1 Therapeutics, Inc. (a) | | 486 | 11,790 |
| Geron Corp. (a) | | 5,569 | 12,140 |
| Global Blood Therapeutics, Inc. (a)(b) | | 1,073 | 67,738 |
| GlycoMimetics, Inc. (a) | | 694 | 2,609 |
| Gossamer Bio, Inc. (a)(b) | | 873 | 11,349 |
| Gritstone Oncology, Inc. (a)(b) | | 327 | 2,171 |
| Halozyme Therapeutics, Inc. (a)(b) | | 2,026 | 54,317 |
| Heron Therapeutics, Inc. (a)(b) | | 1,385 | 20,373 |
| Homology Medicines, Inc. (a) | | 425 | 6,456 |
| ImmunoGen, Inc. (a) | | 2,996 | 13,782 |
| Immunomedics, Inc. (a)(b) | | 3,691 | 130,809 |
| Inovio Pharmaceuticals, Inc. (a)(b) | | 2,640 | 71,148 |
| Insmed, Inc. (a) | | 1,799 | 49,544 |
| Intellia Therapeutics, Inc. (a)(b) | | 817 | 17,173 |
| Intercept Pharmaceuticals, Inc. (a)(b) | | 455 | 21,799 |
| Invitae Corp. (a)(b) | | 2,055 | 62,246 |
| Ionis Pharmaceuticals, Inc. (a) | | 2,259 | 133,191 |
| Iovance Biotherapeutics, Inc. (a)(b) | | 2,368 | 65,002 |
| Ironwood Pharmaceuticals, Inc. Class A (a) | | 2,832 | 29,226 |
| Jounce Therapeutics, Inc. (a) | | 279 | 1,925 |
| Kadmon Holdings, Inc. (a) | | 2,514 | 12,872 |
| Kalvista Pharmaceuticals, Inc. (a) | | 195 | 2,360 |
| Karuna Therapeutics, Inc. (a) | | 182 | 20,286 |
| Karyopharm Therapeutics, Inc. (a) | | 1,150 | 21,781 |
| Kiniksa Pharmaceuticals Ltd. (a)(b) | | 258 | 6,574 |
| Kodiak Sciences, Inc. (a)(b) | | 445 | 24,083 |
| Krystal Biotech, Inc. (a) | | 194 | 8,035 |
| Kura Oncology, Inc. (a) | | 869 | 14,165 |
| La Jolla Pharmaceutical Co. (a) | | 342 | 1,457 |
| Ligand Pharmaceuticals, Inc. Class B (a)(b) | | 283 | 31,654 |
| Macrogenics, Inc. (a) | | 856 | 23,900 |
| Madrigal Pharmaceuticals, Inc. (a)(b) | | 165 | 18,686 |
| MannKind Corp. (a)(b) | | 3,227 | 5,647 |
| Minerva Neurosciences, Inc. (a) | | 559 | 2,018 |
| Mirati Therapeutics, Inc. (a) | | 669 | 76,380 |
| Moderna, Inc. (a)(b) | | 5,241 | 336,523 |
| Molecular Templates, Inc. (a) | | 392 | 5,406 |
| Momenta Pharmaceuticals, Inc. (a) | | 2,090 | 69,534 |
| Myriad Genetics, Inc. (a) | | 1,362 | 15,445 |
| Natera, Inc. (a) | | 1,176 | 58,635 |
| Neurocrine Biosciences, Inc. (a) | | 1,651 | 201,422 |
| NextCure, Inc. (a)(b) | | 155 | 3,323 |
| Novavax, Inc. (a)(b) | | 1,029 | 85,767 |
| Opko Health, Inc. (a)(b) | | 7,280 | 24,825 |
| PDL BioPharma, Inc. (a) | | 2,012 | 5,855 |
| Pfenex, Inc. (a) | | 512 | 4,275 |
| PhaseBio Pharmaceuticals, Inc. (a)(b) | | 264 | 1,214 |
| Pieris Pharmaceuticals, Inc. (a)(b) | | 801 | 2,483 |
| Portola Pharmaceuticals, Inc. (a) | | 1,300 | 23,387 |
| Precigen, Inc. (a)(b) | | 1,275 | 6,362 |
| Principia Biopharma, Inc. (a) | | 333 | 19,910 |
| Protagonist Therapeutics, Inc. (a) | | 505 | 8,918 |
| Prothena Corp. PLC (a) | | 675 | 7,061 |
| PTC Therapeutics, Inc. (a) | | 1,122 | 56,930 |
| Puma Biotechnology, Inc. (a) | | 609 | 6,352 |
| Radius Health, Inc. (a) | | 745 | 10,154 |
| Recro Pharma, Inc. (a) | | 271 | 1,233 |
| REGENXBIO, Inc. (a) | | 575 | 21,177 |
| Repligen Corp. (a) | | 835 | 103,214 |
| Retrophin, Inc. (a) | | 791 | 16,144 |
| Rhythm Pharmaceuticals, Inc. (a)(b) | | 530 | 11,819 |
| Rigel Pharmaceuticals, Inc. (a) | | 3,047 | 5,576 |
| Rocket Pharmaceuticals, Inc. (a)(b) | | 607 | 12,705 |
| Rubius Therapeutics, Inc. (a)(b) | | 588 | 3,516 |
| Sage Therapeutics, Inc. (a) | | 938 | 39,002 |
| Sangamo Therapeutics, Inc. (a) | | 2,081 | 18,646 |
| Sarepta Therapeutics, Inc. (a) | | 1,319 | 211,488 |
| Sesen Bio, Inc. (a) | | 1,602 | 1,153 |
| Sorrento Therapeutics, Inc. (a)(b) | | 2,927 | 18,382 |
| Spectrum Pharmaceuticals, Inc. (a) | | 2,046 | 6,915 |
| Stoke Therapeutics, Inc. (b) | | 144 | 3,432 |
| Syndax Pharmaceuticals, Inc. (a) | | 457 | 6,773 |
| Syros Pharmaceuticals, Inc. (a) | | 690 | 7,355 |
| TCR2 Therapeutics, Inc. (a) | | 229 | 3,517 |
| TG Therapeutics, Inc. (a) | | 1,737 | 33,837 |
| Translate Bio, Inc. (a)(b) | | 1,047 | 18,762 |
| Turning Point Therapeutics, Inc. (a) | | 352 | 22,736 |
| Twist Bioscience Corp. (a) | | 530 | 24,009 |
| Ultragenyx Pharmaceutical, Inc. (a)(b) | | 1,000 | 78,220 |
| United Therapeutics Corp. (a) | | 782 | 94,622 |
| UNITY Biotechnology, Inc. (a)(b) | | 398 | 3,455 |
| Vanda Pharmaceuticals, Inc. (a) | | 930 | 10,639 |
| Veracyte, Inc. (a) | | 795 | 20,591 |
| Verastem, Inc. (a) | | 2,357 | 4,054 |
| Vericel Corp. (a) | | 785 | 10,849 |
| Viking Therapeutics, Inc. (a)(b) | | 1,129 | 8,140 |
| Voyager Therapeutics, Inc. (a) | | 452 | 5,704 |
| Xbiotech, Inc. (a) | | 265 | 3,633 |
| Xencor, Inc. (a) | | 895 | 28,989 |
| XOMA Corp. (a) | | 122 | 2,411 |
| Y-mAbs Therapeutics, Inc. (a) | | 299 | 12,917 |
| ZIOPHARM Oncology, Inc. (a)(b) | | 3,278 | 10,752 |
| | | | 4,646,243 |
| Health Care Equipment & Supplies - 3.1% | | | |
| Abiomed, Inc. (a) | | 798 | 192,765 |
| Accelerate Diagnostics, Inc. (a)(b) | | 515 | 7,807 |
| Accuray, Inc. (a) | | 1,660 | 3,370 |
| Alphatec Holdings, Inc. (a) | | 707 | 3,323 |
| Angiodynamics, Inc. (a) | | 706 | 7,180 |
| Antares Pharma, Inc. (a) | | 2,737 | 7,527 |
| Atricure, Inc. (a) | | 787 | 35,376 |
| Atrion Corp. | | 26 | 16,562 |
| Avanos Medical, Inc. (a) | | 837 | 24,599 |
| AxoGen, Inc. (a) | | 651 | 6,015 |
| Axonics Modulation Technologies, Inc. (a) | | 364 | 12,780 |
| BioLife Solutions, Inc. (a)(b) | | 262 | 4,284 |
| Cantel Medical Corp. | | 652 | 28,838 |
| Cardiovascular Systems, Inc. (a) | | 636 | 20,066 |
| Cerus Corp. (a) | | 2,839 | 18,737 |
| CONMED Corp. | | 512 | 36,859 |
| Cryolife, Inc. (a)(b) | | 653 | 12,518 |
| CryoPort, Inc. (a)(b) | | 672 | 20,328 |
| Cutera, Inc. (a) | | 319 | 3,882 |
| Genmark Diagnostics, Inc. (a) | | 1,116 | 16,416 |
| Glaukos Corp. (a)(b) | | 709 | 27,240 |
| Globus Medical, Inc. (a) | | 1,344 | 64,122 |
| Haemonetics Corp. (a) | | 901 | 80,694 |
| Heska Corp. (a)(b) | | 151 | 14,069 |
| Hill-Rom Holdings, Inc. | | 1,186 | 130,199 |
| ICU Medical, Inc. (a) | | 346 | 63,771 |
| Inogen, Inc. (a) | | 331 | 11,757 |
| Integer Holdings Corp. (a) | | 588 | 42,953 |
| Integra LifeSciences Holdings Corp. (a) | | 1,242 | 58,362 |
| IntriCon Corp. (a) | | 149 | 2,014 |
| Invacare Corp. | | 546 | 3,478 |
| IRadimed Corp. (a) | | 92 | 2,135 |
| iRhythm Technologies, Inc. (a) | | 482 | 55,859 |
| Lantheus Holdings, Inc. (a)(b) | | 1,191 | 17,031 |
| LeMaitre Vascular, Inc. | | 299 | 7,894 |
| LivaNova PLC (a) | | 862 | 41,488 |
| Masimo Corp. (a) | | 882 | 201,087 |
| Meridian Bioscience, Inc. (a) | | 783 | 18,236 |
| Merit Medical Systems, Inc. (a) | | 985 | 44,965 |
| Mesa Laboratories, Inc. | | 70 | 15,176 |
| Natus Medical, Inc. (a) | | 603 | 13,157 |
| Neogen Corp. (a) | | 932 | 72,323 |
| Nevro Corp. (a) | | 601 | 71,801 |
| NuVasive, Inc. (a) | | 911 | 50,706 |
| OraSure Technologies, Inc. (a) | | 1,266 | 14,724 |
| Orthofix International NV (a) | | 336 | 10,752 |
| OrthoPediatrics Corp. (a) | | 194 | 8,489 |
| Penumbra, Inc. (a)(b) | | 586 | 104,789 |
| Quidel Corp. (a) | | 680 | 152,143 |
| Seaspine Holdings Corp. (a) | | 402 | 4,209 |
| Senseonics Holdings, Inc. (a) | | 2,507 | 978 |
| Shockwave Medical, Inc. (a) | | 163 | 7,721 |
| SI-BONE, Inc. (a) | | 342 | 5,451 |
| Sientra, Inc. (a)(b) | | 763 | 2,953 |
| Silk Road Medical, Inc. (a)(b) | | 237 | 9,928 |
| Staar Surgical Co. (a) | | 516 | 31,755 |
| SurModics, Inc. (a) | | 238 | 10,291 |
| Tactile Systems Technology, Inc. (a)(b) | | 334 | 13,838 |
| Tandem Diabetes Care, Inc. (a) | | 1,014 | 100,305 |
| TransMedics Group, Inc. (a) | | 97 | 1,738 |
| Vapotherm, Inc. (a) | | 331 | 13,568 |
| Varex Imaging Corp. (a) | | 671 | 10,166 |
| ViewRay, Inc. (a) | | 1,925 | 4,312 |
| Wright Medical Group NV (a) | | 2,288 | 67,999 |
| Zynex, Inc. (a)(b) | | 288 | 7,163 |
| | | | 2,173,021 |
| Health Care Providers & Services - 2.1% | | | |
| Acadia Healthcare Co., Inc. (a) | | 1,563 | 39,263 |
| Addus HomeCare Corp. (a) | | 241 | 22,307 |
| Amedisys, Inc. (a) | | 574 | 113,962 |
| American Renal Associates Holdings, Inc. (a) | | 246 | 1,604 |
| AMN Healthcare Services, Inc. (a) | | 833 | 37,685 |
| Apollo Medical Holdings, Inc. (a)(b) | | 453 | 7,475 |
| BioScrip, Inc. (a) | | 566 | 7,856 |
| BioTelemetry, Inc. (a) | | 606 | 27,385 |
| Brookdale Senior Living, Inc. (a) | | 3,282 | 9,682 |
| Chemed Corp. | | 281 | 126,751 |
| Community Health Systems, Inc. (a)(b) | | 2,039 | 6,137 |
| Corvel Corp. (a) | | 152 | 10,775 |
| Covetrus, Inc. (a)(b) | | 1,714 | 30,663 |
| Cross Country Healthcare, Inc. (a) | | 620 | 3,819 |
| DaVita HealthCare Partners, Inc. (a) | | 1,511 | 119,581 |
| Encompass Health Corp. | | 1,765 | 109,306 |
| Guardant Health, Inc. (a) | | 920 | 74,640 |
| Hanger, Inc. (a) | | 648 | 10,731 |
| HealthEquity, Inc. (a) | | 1,263 | 74,100 |
| LHC Group, Inc. (a) | | 527 | 91,867 |
| Magellan Health Services, Inc. (a) | | 390 | 28,462 |
| MEDNAX, Inc. (a)(b) | | 1,505 | 25,736 |
| Molina Healthcare, Inc. (a) | | 1,050 | 186,879 |
| National Healthcare Corp. | | 209 | 13,259 |
| National Research Corp. Class A | | 223 | 12,981 |
| Owens & Minor, Inc. (b) | | 1,110 | 8,458 |
| Patterson Companies, Inc. (b) | | 1,563 | 34,386 |
| Pennant Group, Inc. (a) | | 486 | 10,984 |
| PetIQ, Inc. Class A (a)(b) | | 356 | 12,403 |
| Premier, Inc. (a) | | 1,186 | 40,656 |
| Providence Service Corp. (a) | | 201 | 15,861 |
| R1 RCM, Inc. (a) | | 1,796 | 20,025 |
| RadNet, Inc. (a) | | 726 | 11,522 |
| Select Medical Holdings Corp. (a) | | 1,909 | 28,120 |
| Surgery Partners, Inc. (a) | | 359 | 4,154 |
| Tenet Healthcare Corp. (a) | | 1,868 | 33,829 |
| The Ensign Group, Inc. | | 904 | 37,832 |
| The Joint Corp. (a) | | 195 | 2,978 |
| Tivity Health, Inc. (a) | | 776 | 8,792 |
| Triple-S Management Corp. (b) | | 439 | 8,350 |
| U.S. Physical Therapy, Inc. | | 235 | 19,040 |
| | | | 1,490,296 |
| Health Care Technology - 0.8% | | | |
| Allscripts Healthcare Solutions, Inc. (a) | | 2,883 | 19,518 |
| Change Healthcare, Inc. | | 3,925 | 43,960 |
| Computer Programs & Systems, Inc. | | 219 | 4,991 |
| Evolent Health, Inc. (a) | | 1,292 | 9,199 |
| Health Catalyst, Inc. (b) | | 128 | 3,734 |
| HealthStream, Inc. (a) | | 473 | 10,467 |
| HMS Holdings Corp. (a) | | 1,578 | 51,111 |
| Inovalon Holdings, Inc. Class A (a) | | 1,358 | 26,155 |
| Inspire Medical Systems, Inc. (a) | | 290 | 25,236 |
| Nextgen Healthcare, Inc. (a) | | 871 | 9,564 |
| Omnicell, Inc. (a) | | 759 | 53,601 |
| OptimizeRx Corp. (a) | | 217 | 2,828 |
| Phreesia, Inc. | | 317 | 8,965 |
| Simulations Plus, Inc. (b) | | 214 | 12,801 |
| Tabula Rasa HealthCare, Inc. (a)(b) | | 369 | 20,195 |
| Teladoc Health, Inc. (a) | | 1,321 | 252,100 |
| Vocera Communications, Inc. (a) | | 555 | 11,766 |
| | | | 566,191 |
| Life Sciences Tools & Services - 1.5% | | | |
| Adaptive Biotechnologies Corp. | | 416 | 20,126 |
| Avantor, Inc. (a) | | 4,780 | 81,260 |
| Bio-Rad Laboratories, Inc. Class A (a) | | 378 | 170,663 |
| Bio-Techne Corp. | | 678 | 179,039 |
| Bruker Corp. | | 1,808 | 73,549 |
| Charles River Laboratories International, Inc. (a) | | 878 | 153,079 |
| Codexis, Inc. (a)(b) | | 853 | 9,724 |
| Fluidigm Corp. (a)(b) | | 1,219 | 4,888 |
| Frontage Holdings Corp. (a)(d) | | 12,000 | 7,432 |
| Luminex Corp. | | 761 | 24,755 |
| Medpace Holdings, Inc. (a) | | 478 | 44,464 |
| Nanostring Technologies, Inc. (a) | | 632 | 18,549 |
| NeoGenomics, Inc. (a) | | 1,950 | 60,411 |
| Pacific Biosciences of California, Inc. (a) | | 2,463 | 8,497 |
| PRA Health Sciences, Inc. (a) | | 1,124 | 109,354 |
| Quanterix Corp. (a) | | 242 | 6,628 |
| Syneos Health, Inc. (a) | | 1,108 | 64,541 |
| | | | 1,036,959 |
| Pharmaceuticals - 2.0% | | | |
| AcelRx Pharmaceuticals, Inc. (a) | | 1,268 | 1,534 |
| Aerie Pharmaceuticals, Inc. (a)(b) | | 730 | 10,775 |
| Akcea Therapeutics, Inc. (a)(b) | | 283 | 3,877 |
| AMAG Pharmaceuticals, Inc. (a)(b) | | 694 | 5,309 |
| Amneal Pharmaceuticals, Inc. (a) | | 1,920 | 9,139 |
| Amphastar Pharmaceuticals, Inc. (a) | | 597 | 13,409 |
| ANI Pharmaceuticals, Inc. (a) | | 162 | 5,239 |
| Arvinas Holding Co. LLC (a) | | 266 | 8,922 |
| Assertio Holdings, Inc. (a) | | 1,469 | 1,259 |
| Axsome Therapeutics, Inc. (a) | | 483 | 39,741 |
| Biodelivery Sciences International, Inc. (a) | | 1,567 | 6,832 |
| Cara Therapeutics, Inc. (a)(b) | | 737 | 12,603 |
| Catalent, Inc. (a) | | 2,887 | 211,617 |
| Chiasma, Inc. (a)(b) | | 595 | 3,201 |
| Collegium Pharmaceutical, Inc. (a) | | 523 | 9,153 |
| Corcept Therapeutics, Inc. (a)(b) | | 1,844 | 31,016 |
| CorMedix, Inc. (a)(b) | | 448 | 2,822 |
| CymaBay Therapeutics, Inc. (a)(b) | | 1,053 | 3,675 |
| Durect Corp. (a)(b) | | 3,358 | 7,791 |
| Endo International PLC (a) | | 3,528 | 12,101 |
| Evofem Biosciences, Inc. (a)(b) | | 233 | 659 |
| Evolus, Inc. (a)(b) | | 390 | 2,067 |
| Horizon Pharma PLC (a) | | 3,385 | 188,138 |
| Innoviva, Inc. (a)(b) | | 1,176 | 16,440 |
| Intersect ENT, Inc. (a) | | 554 | 7,501 |
| Intra-Cellular Therapies, Inc. (a) | | 965 | 24,772 |
| Jazz Pharmaceuticals PLC (a) | | 984 | 108,575 |
| Kala Pharmaceuticals, Inc. (a) | | 737 | 7,746 |
| Lannett Co., Inc. (a) | | 568 | 4,124 |
| Mallinckrodt PLC (a)(b) | | 1,534 | 4,111 |
| MyoKardia, Inc. (a) | | 936 | 90,436 |
| Nektar Therapeutics (a)(b) | | 3,134 | 72,583 |
| Ocular Therapeutix, Inc. (a) | | 1,060 | 8,830 |
| Odonate Therapeutics, Inc. (a) | | 203 | 8,595 |
| Omeros Corp. (a)(b) | | 939 | 13,822 |
| OptiNose, Inc. (a)(b) | | 432 | 3,214 |
| Pacira Biosciences, Inc. (a) | | 748 | 39,248 |
| Paratek Pharmaceuticals, Inc. (a) | | 663 | 3,461 |
| Perrigo Co. PLC | | 2,422 | 133,864 |
| Phibro Animal Health Corp. Class A | | 354 | 9,300 |
| Prestige Brands Holdings, Inc. (a) | | 904 | 33,954 |
| Reata Pharmaceuticals, Inc. (a)(b) | | 470 | 73,329 |
| Revance Therapeutics, Inc. (a) | | 846 | 20,659 |
| Supernus Pharmaceuticals, Inc. (a) | | 940 | 22,325 |
| TherapeuticsMD, Inc. (a)(b) | | 3,995 | 4,994 |
| Theravance Biopharma, Inc. (a)(b) | | 843 | 17,695 |
| Tricida, Inc. (a)(b) | | 469 | 12,888 |
| WAVE Life Sciences (a)(b) | | 363 | 3,779 |
| Xeris Pharmaceuticals, Inc. (a)(b) | | 633 | 1,684 |
| Zogenix, Inc. (a) | | 926 | 25,011 |
| Zynerba Pharmaceuticals, Inc. (a)(b) | | 439 | 1,479 |
| | | | 1,365,298 |
|
| TOTAL HEALTH CARE | | | 11,278,008 |
|
| INDUSTRIALS - 14.7% | | | |
| Aerospace & Defense - 1.0% | | | |
| AAR Corp. | | 566 | 11,699 |
| Aerojet Rocketdyne Holdings, Inc. (a) | | 1,270 | 50,343 |
| AeroVironment, Inc. (a) | | 387 | 30,817 |
| Astronics Corp. (a) | | 394 | 4,161 |
| Axon Enterprise, Inc. (a) | | 1,115 | 109,415 |
| BWX Technologies, Inc. | | 1,694 | 95,948 |
| Cubic Corp. (b) | | 552 | 26,513 |
| Curtiss-Wright Corp. | | 738 | 65,889 |
| Ducommun, Inc. (a) | | 187 | 6,521 |
| Hexcel Corp. | | 1,486 | 67,197 |
| Kratos Defense & Security Solutions, Inc. (a) | | 1,860 | 29,072 |
| Maxar Technologies, Inc. (b) | | 1,053 | 18,912 |
| Mercury Systems, Inc. (a) | | 987 | 77,637 |
| Moog, Inc. Class A | | 537 | 28,450 |
| National Presto Industries, Inc. | | 93 | 8,127 |
| Park Aerospace Corp. | | 334 | 3,721 |
| Parsons Corp. (a) | | 334 | 12,104 |
| Spirit AeroSystems Holdings, Inc. Class A | | 1,881 | 45,031 |
| Triumph Group, Inc. | | 876 | 7,893 |
| Vectrus, Inc. (a) | | 202 | 9,924 |
| | | | 709,374 |
| Air Freight & Logistics - 0.6% | | | |
| Air Transport Services Group, Inc. (a) | | 1,039 | 23,139 |
| Atlas Air Worldwide Holdings, Inc. (a) | | 455 | 19,579 |
| C.H. Robinson Worldwide, Inc. | | 2,385 | 188,558 |
| Echo Global Logistics, Inc. (a) | | 475 | 10,270 |
| Forward Air Corp. | | 508 | 25,309 |
| Hub Group, Inc. Class A (a) | | 587 | 28,094 |
| XPO Logistics, Inc. (a) | | 1,618 | 124,991 |
| | | | 419,940 |
| Airlines - 0.3% | | | |
| Alaska Air Group, Inc. | | 2,179 | 79,011 |
| Allegiant Travel Co. (b) | | 231 | 25,228 |
| Hawaiian Holdings, Inc. | | 815 | 11,443 |
| JetBlue Airways Corp. (a) | | 4,803 | 52,353 |
| Mesa Air Group, Inc. (a) | | 427 | 1,469 |
| SkyWest, Inc. | | 895 | 29,195 |
| Spirit Airlines, Inc. (a)(b) | | 1,554 | 27,661 |
| | | | 226,360 |
| Building Products - 1.5% | | | |
| A.O. Smith Corp. | | 2,397 | 112,947 |
| AAON, Inc. | | 722 | 39,197 |
| Advanced Drain Systems, Inc. | | 940 | 46,436 |
| American Woodmark Corp. (a) | | 286 | 21,636 |
| Apogee Enterprises, Inc. | | 472 | 10,875 |
| Armstrong World Industries, Inc. | | 857 | 66,812 |
| Builders FirstSource, Inc. (a) | | 2,090 | 43,263 |
| CSW Industrials, Inc. | | 276 | 19,074 |
| Gibraltar Industries, Inc. (a) | | 571 | 27,414 |
| Griffon Corp. | | 744 | 13,779 |
| Insteel Industries, Inc. | | 309 | 5,893 |
| Jeld-Wen Holding, Inc. (a) | | 1,192 | 19,203 |
| Lennox International, Inc. | | 618 | 143,988 |
| Masonite International Corp. (a)(b) | | 435 | 33,834 |
| NCI Building Systems, Inc. (a) | | 819 | 4,963 |
| Owens Corning | | 1,915 | 106,780 |
| Patrick Industries, Inc. | | 391 | 23,949 |
| PGT, Inc. (a) | | 1,038 | 16,276 |
| Quanex Building Products Corp. | | 597 | 8,286 |
| Resideo Technologies, Inc. (a)(b) | | 2,163 | 25,350 |
| Simpson Manufacturing Co. Ltd. | | 702 | 59,221 |
| Trex Co., Inc. (a) | | 1,027 | 133,582 |
| Ufp Industries, Inc. | | 1,085 | 53,718 |
| | | | 1,036,476 |
| Commercial Services & Supplies - 1.6% | | | |
| ABM Industries, Inc. | | 1,180 | 42,834 |
| ACCO Brands Corp. | | 1,738 | 12,340 |
| ADS Waste Holdings, Inc. (a) | | 1,290 | 38,919 |
| Brady Corp. Class A | | 860 | 40,265 |
| BrightView Holdings, Inc. (a) | | 525 | 5,880 |
| Casella Waste Systems, Inc. Class A (a) | | 791 | 41,227 |
| Cimpress PLC (a) | | 428 | 32,674 |
| Clean Harbors, Inc. (a) | | 903 | 54,162 |
| Covanta Holding Corp. | | 2,096 | 20,101 |
| Deluxe Corp. | | 741 | 17,443 |
| Ennis, Inc. | | 450 | 8,163 |
| Harsco Corp. (a) | | 1,402 | 18,941 |
| Healthcare Services Group, Inc. (b) | | 1,322 | 32,336 |
| Herman Miller, Inc. | | 1,068 | 25,215 |
| HNI Corp. (b) | | 761 | 23,264 |
| IAA Spinco, Inc. (a) | | 2,376 | 91,642 |
| Interface, Inc. | | 1,021 | 8,311 |
| KAR Auction Services, Inc. | | 2,334 | 32,116 |
| Kimball International, Inc. Class B | | 652 | 7,537 |
| Knoll, Inc. | | 872 | 10,630 |
| Matthews International Corp. Class A | | 557 | 10,639 |
| McGrath RentCorp. | | 440 | 23,764 |
| Mobile Mini, Inc. | | 802 | 23,659 |
| MSA Safety, Inc. (b) | | 634 | 72,555 |
| Pitney Bowes, Inc. (b) | | 3,005 | 7,813 |
| Quad/Graphics, Inc. | | 617 | 2,005 |
| R.R. Donnelley & Sons Co. | | 1,139 | 1,355 |
| Rollins, Inc. | | 2,500 | 105,975 |
| SP Plus Corp. (a) | | 406 | 8,408 |
| Steelcase, Inc. Class A | | 1,557 | 18,777 |
| Stericycle, Inc. (a) | | 1,620 | 90,688 |
| Team, Inc. (a)(b) | | 520 | 2,896 |
| Tetra Tech, Inc. | | 956 | 75,639 |
| The Brink's Co. | | 893 | 40,640 |
| U.S. Ecology, Inc. | | 450 | 15,246 |
| UniFirst Corp. | | 274 | 49,032 |
| Viad Corp. | | 354 | 6,733 |
| | | | 1,119,824 |
| Construction & Engineering - 0.9% | | | |
| AECOM (a) | | 2,842 | 106,802 |
| Aegion Corp. (a) | | 524 | 8,316 |
| Ameresco, Inc. Class A (a) | | 329 | 9,140 |
| Arcosa, Inc. | | 867 | 36,587 |
| Argan, Inc. | | 243 | 11,513 |
| Comfort Systems U.S.A., Inc. | | 652 | 26,569 |
| Construction Partners, Inc. Class A (a) | | 569 | 10,105 |
| Dycom Industries, Inc. (a) | | 562 | 22,980 |
| EMCOR Group, Inc. | | 974 | 64,420 |
| Fluor Corp. | | 2,496 | 30,152 |
| Granite Construction, Inc. (b) | | 826 | 15,810 |
| Great Lakes Dredge & Dock Corp. (a) | | 1,120 | 10,371 |
| MasTec, Inc. (a)(b) | | 1,038 | 46,575 |
| MYR Group, Inc. (a) | | 282 | 8,999 |
| Northwest Pipe Co. (a) | | 172 | 4,312 |
| NV5 Holdings, Inc. (a)(b) | | 182 | 9,251 |
| Primoris Services Corp. | | 764 | 13,569 |
| Quanta Services, Inc. | | 2,443 | 95,839 |
| Sterling Construction Co., Inc. (a) | | 440 | 4,607 |
| Tutor Perini Corp. (a) | | 679 | 8,270 |
| Valmont Industries, Inc. | | 382 | 43,403 |
| Williams Scotsman Corp. (a) | | 1,009 | 12,401 |
| | | | 599,991 |
| Electrical Equipment - 1.1% | | | |
| Acuity Brands, Inc. | | 703 | 67,305 |
| Allied Motion Technologies, Inc. | | 122 | 4,307 |
| American Superconductor Corp. (a) | | 334 | 2,715 |
| Atkore International Group, Inc. (a) | | 858 | 23,466 |
| AZZ, Inc. | | 459 | 15,753 |
| Bloom Energy Corp. Class A (a)(b) | | 412 | 4,483 |
| Encore Wire Corp. | | 366 | 17,868 |
| EnerSys | | 759 | 48,864 |
| Generac Holdings, Inc. (a) | | 1,112 | 135,586 |
| GrafTech International Ltd. (b) | | 955 | 7,621 |
| Hubbell, Inc. Class B | | 964 | 120,847 |
| nVent Electric PLC | | 2,780 | 52,069 |
| Plug Power, Inc. (a)(b) | | 5,253 | 43,127 |
| Powell Industries, Inc. | | 154 | 4,218 |
| Regal Beloit Corp. | | 719 | 62,783 |
| Sensata Technologies, Inc. PLC (a) | | 2,790 | 103,872 |
| Sunrun, Inc. (a) | | 1,420 | 28,002 |
| Thermon Group Holdings, Inc. (a) | | 586 | 8,538 |
| TPI Composites, Inc. (a) | | 558 | 13,040 |
| Vicor Corp. (a) | | 335 | 24,103 |
| Vivint Solar, Inc. (a) | | 809 | 8,009 |
| | | | 796,576 |
| Industrial Conglomerates - 0.2% | | | |
| Carlisle Companies, Inc. (b) | | 975 | 116,678 |
| Raven Industries, Inc. | | 625 | 13,444 |
| | | | 130,122 |
| Machinery - 4.1% | | | |
| AGCO Corp. | | 1,112 | 61,672 |
| Alamo Group, Inc. | | 169 | 17,346 |
| Albany International Corp. Class A | | 540 | 31,703 |
| Allison Transmission Holdings, Inc. | | 2,005 | 73,744 |
| Altra Industrial Motion Corp. | | 1,140 | 36,320 |
| Astec Industries, Inc. | | 397 | 18,385 |
| Barnes Group, Inc. | | 844 | 33,389 |
| Blue Bird Corp. (a) | | 263 | 3,942 |
| Briggs & Stratton Corp. (b) | | 660 | 865 |
| Chart Industries, Inc. (a) | | 637 | 30,888 |
| CIRCOR International, Inc. (a) | | 348 | 8,867 |
| Colfax Corp. (a) | | 1,509 | 42,101 |
| Columbus McKinnon Corp. (NY Shares) | | 413 | 13,815 |
| Commercial Vehicle Group, Inc. (a) | | 477 | 1,379 |
| Crane Co. | | 880 | 52,325 |
| Donaldson Co., Inc. | | 2,242 | 104,298 |
| Douglas Dynamics, Inc. | | 401 | 14,083 |
| Energy Recovery, Inc. (a)(b) | | 576 | 4,375 |
| Enerpac Tool Group Corp. Class A | | 944 | 16,614 |
| EnPro Industries, Inc. | | 364 | 17,942 |
| ESCO Technologies, Inc. | | 467 | 39,476 |
| Evoqua Water Technologies Corp. (a) | | 1,317 | 24,496 |
| Federal Signal Corp. | | 1,081 | 32,138 |
| Flowserve Corp. | | 2,323 | 66,252 |
| Franklin Electric Co., Inc. | | 675 | 35,451 |
| Gardner Denver Holdings, Inc. (a) | | 6,150 | 172,938 |
| Gates Industrial Corp. PLC (a) | | 798 | 8,203 |
| Gorman-Rupp Co. | | 315 | 9,790 |
| Graco, Inc. | | 2,957 | 141,906 |
| Greenbrier Companies, Inc. (b) | | 576 | 13,104 |
| Helios Technologies, Inc. | | 530 | 19,743 |
| Hillenbrand, Inc. | | 1,330 | 36,003 |
| Hyster-Yale Materials Handling Class A | | 176 | 6,804 |
| ITT, Inc. | | 1,530 | 89,872 |
| John Bean Technologies Corp. | | 569 | 48,945 |
| Kadant, Inc. | | 202 | 20,131 |
| Kennametal, Inc. | | 1,475 | 42,347 |
| Lincoln Electric Holdings, Inc. | | 1,048 | 88,284 |
| Lindsay Corp. | | 192 | 17,704 |
| LiqTech International, Inc. (a)(b) | | 284 | 1,551 |
| Lydall, Inc. (a) | | 315 | 4,271 |
| Manitowoc Co., Inc. (a) | | 599 | 6,517 |
| Meritor, Inc. (a) | | 1,269 | 25,126 |
| Middleby Corp. (a) | | 988 | 77,993 |
| Miller Industries, Inc. | | 198 | 5,894 |
| Mueller Industries, Inc. | | 1,009 | 26,819 |
| Mueller Water Products, Inc. Class A | | 2,843 | 26,809 |
| Navistar International Corp. (a) | | 1,183 | 33,361 |
| NN, Inc. (b) | | 763 | 3,617 |
| Nordson Corp. | | 909 | 172,446 |
| Omega Flex, Inc. | | 51 | 5,396 |
| Oshkosh Corp. | | 1,207 | 86,445 |
| Pentair PLC | | 2,935 | 111,501 |
| Proto Labs, Inc. (a) | | 470 | 52,861 |
| RBC Bearings, Inc. (a) | | 444 | 59,514 |
| REV Group, Inc. | | 503 | 3,068 |
| Rexnord Corp. | | 2,124 | 61,915 |
| Snap-On, Inc. | | 964 | 133,524 |
| SPX Corp. (a)(b) | | 803 | 33,043 |
| SPX Flow, Inc. (a) | | 775 | 29,016 |
| Standex International Corp. | | 212 | 12,201 |
| Tennant Co. | | 335 | 21,778 |
| Terex Corp. | | 1,140 | 21,398 |
| The Shyft Group, Inc. | | 583 | 9,818 |
| Timken Co. | | 1,213 | 55,179 |
| Toro Co. | | 1,892 | 125,515 |
| TriMas Corp. (a) | | 767 | 18,370 |
| Trinity Industries, Inc. (b) | | 1,669 | 35,533 |
| Wabash National Corp. (b) | | 914 | 9,707 |
| Watts Water Technologies, Inc. Class A | | 487 | 39,447 |
| Welbilt, Inc. (a)(b) | | 2,262 | 13,776 |
| Woodward, Inc. | | 1,002 | 77,705 |
| | | | 2,898,754 |
| Marine - 0.1% | | | |
| Eagle Bulk Shipping, Inc. (a) | | 1,300 | 2,847 |
| Genco Shipping & Trading Ltd. | | 261 | 1,639 |
| Kirby Corp. (a) | | 1,070 | 57,309 |
| Matson, Inc. | | 759 | 22,087 |
| | | | 83,882 |
| Professional Services - 1.2% | | | |
| ASGN, Inc. (a) | | 932 | 62,146 |
| Barrett Business Services, Inc. | | 136 | 7,226 |
| CBIZ, Inc. (a) | | 969 | 23,227 |
| CoreLogic, Inc. (b) | | 1,417 | 95,251 |
| CRA International, Inc. | | 139 | 5,491 |
| Exponent, Inc. | | 920 | 74,456 |
| Forrester Research, Inc. (a) | | 177 | 5,671 |
| Franklin Covey Co. (a) | | 170 | 3,638 |
| FTI Consulting, Inc. (a) | | 657 | 75,259 |
| Heidrick & Struggles International, Inc. | | 326 | 7,048 |
| Huron Consulting Group, Inc. (a) | | 406 | 17,966 |
| ICF International, Inc. | | 334 | 21,653 |
| Insperity, Inc. | | 650 | 42,075 |
| Kelly Services, Inc. Class A (non-vtg.) | | 577 | 9,125 |
| Kforce, Inc. | | 341 | 9,974 |
| Korn Ferry | | 1,002 | 30,791 |
| Manpower, Inc. | | 1,032 | 70,950 |
| MISTRAS Group, Inc. (a) | | 308 | 1,217 |
| Nielsen Holdings PLC | | 6,329 | 94,049 |
| Resources Connection, Inc. | | 502 | 6,009 |
| Robert Half International, Inc. | | 2,037 | 107,615 |
| TriNet Group, Inc. (a) | | 762 | 46,436 |
| TrueBlue, Inc. (a) | | 668 | 10,200 |
| Upwork, Inc. (a) | | 1,123 | 16,216 |
| Willdan Group, Inc. (a)(b) | | 175 | 4,377 |
| | | | 848,066 |
| Road & Rail - 0.9% | | | |
| AMERCO | | 144 | 43,515 |
| ArcBest Corp. | | 466 | 12,354 |
| Avis Budget Group, Inc. (a)(b) | | 955 | 21,860 |
| Covenant Transport Group, Inc. Class A (a) | | 246 | 3,550 |
| Heartland Express, Inc. | | 835 | 17,385 |
| J.B. Hunt Transport Services, Inc. | | 1,495 | 179,908 |
| Knight-Swift Transportation Holdings, Inc. Class A (b) | | 2,182 | 91,011 |
| Landstar System, Inc. | | 679 | 76,258 |
| Marten Transport Ltd. | | 680 | 17,109 |
| Ryder System, Inc. | | 948 | 35,559 |
| Saia, Inc. (a) | | 463 | 51,476 |
| Schneider National, Inc. Class B | | 584 | 14,407 |
| Universal Logistics Holdings, Inc. | | 162 | 2,816 |
| Werner Enterprises, Inc. | | 1,021 | 44,444 |
| YRC Worldwide, Inc. (a)(b) | | 571 | 1,056 |
| | | | 612,708 |
| Trading Companies & Distributors - 1.1% | | | |
| Air Lease Corp. Class A | | 1,864 | 54,597 |
| Applied Industrial Technologies, Inc. | | 691 | 43,111 |
| Beacon Roofing Supply, Inc. (a) | | 1,222 | 32,224 |
| BlueLinx Corp. (a) | | 141 | 1,208 |
| BMC Stock Holdings, Inc. (a) | | 1,216 | 30,570 |
| CAI International, Inc. (a) | | 284 | 4,731 |
| DXP Enterprises, Inc. (a) | | 292 | 5,814 |
| Foundation Building Materials, Inc. (a) | | 307 | 4,792 |
| GATX Corp. (b) | | 614 | 37,442 |
| GMS, Inc. (a) | | 737 | 18,123 |
| H&E Equipment Services, Inc. | | 589 | 10,885 |
| HD Supply Holdings, Inc. (a) | | 2,877 | 99,688 |
| Herc Holdings, Inc. (a) | | 427 | 13,122 |
| Kaman Corp. | | 494 | 20,550 |
| MRC Global, Inc. (a) | | 1,415 | 8,363 |
| MSC Industrial Direct Co., Inc. Class A | | 800 | 58,248 |
| Now, Inc. (a) | | 1,926 | 16,621 |
| Rush Enterprises, Inc. Class A | | 487 | 20,191 |
| SiteOne Landscape Supply, Inc. (a)(b) | | 746 | 85,022 |
| Textainer Group Holdings Ltd. (a) | | 790 | 6,462 |
| Titan Machinery, Inc. (a) | | 367 | 3,986 |
| Triton International Ltd. | | 908 | 27,458 |
| Univar, Inc. (a) | | 2,499 | 42,133 |
| Veritiv Corp. (a) | | 208 | 3,528 |
| Watsco, Inc. | | 580 | 103,066 |
| WESCO International, Inc. (a) | | 874 | 30,686 |
| | | | 782,621 |
| Transportation Infrastructure - 0.1% | | | |
| Macquarie Infrastructure Co. LLC | | 1,387 | 42,567 |
|
| TOTAL INDUSTRIALS | | | 10,307,261 |
|
| INFORMATION TECHNOLOGY - 15.9% | | | |
| Communications Equipment - 1.3% | | | |
| Acacia Communications, Inc. (a) | | 679 | 45,622 |
| ADTRAN, Inc. | | 891 | 9,739 |
| Applied Optoelectronics, Inc. (a)(b) | | 368 | 4,000 |
| CalAmp Corp. (a) | | 600 | 4,806 |
| Calix Networks, Inc. (a) | | 884 | 13,172 |
| Casa Systems, Inc. (a) | | 474 | 1,972 |
| Ciena Corp. (a) | | 2,720 | 147,315 |
| CommScope Holding Co., Inc. (a) | | 3,497 | 29,130 |
| Comtech Telecommunications Corp. | | 430 | 7,263 |
| Digi International, Inc. (a) | | 495 | 5,767 |
| EchoStar Holding Corp. Class A (a) | | 805 | 22,508 |
| Extreme Networks, Inc. (a) | | 2,154 | 9,348 |
| F5 Networks, Inc. (a) | | 1,081 | 150,778 |
| Harmonic, Inc. (a) | | 1,813 | 8,612 |
| Infinera Corp. (a)(b) | | 2,872 | 17,002 |
| Inseego Corp. (a)(b) | | 1,229 | 14,256 |
| InterDigital, Inc. | | 556 | 31,486 |
| Juniper Networks, Inc. | | 5,858 | 133,914 |
| Lumentum Holdings, Inc. (a) | | 1,327 | 108,058 |
| NETGEAR, Inc. (a) | | 519 | 13,437 |
| NetScout Systems, Inc. (a) | | 1,121 | 28,653 |
| Plantronics, Inc. (b) | | 584 | 8,573 |
| Sonus Networks, Inc. (a) | | 1,556 | 6,115 |
| Ubiquiti, Inc. (b) | | 213 | 37,181 |
| ViaSat, Inc. (a) | | 1,027 | 39,406 |
| Viavi Solutions, Inc. (a) | | 4,108 | 52,336 |
| | | | 950,449 |
| Electronic Equipment & Components - 2.4% | | | |
| Akoustis Technologies, Inc. (a)(b) | | 458 | 3,797 |
| Arlo Technologies, Inc. (a) | | 1,208 | 3,117 |
| Arrow Electronics, Inc. (a) | | 1,394 | 95,754 |
| Avnet, Inc. | | 1,756 | 48,966 |
| Badger Meter, Inc. | | 525 | 33,033 |
| Belden, Inc. | | 700 | 22,785 |
| Benchmark Electronics, Inc. | | 656 | 14,170 |
| Cognex Corp. | | 3,041 | 181,609 |
| Coherent, Inc. (a) | | 434 | 56,845 |
| CTS Corp. | | 598 | 11,984 |
| Dolby Laboratories, Inc. Class A | | 1,148 | 75,619 |
| ePlus, Inc. (a) | | 241 | 17,034 |
| Fabrinet (a) | | 657 | 41,010 |
| FARO Technologies, Inc. (a) | | 310 | 16,616 |
| Fitbit, Inc. (a) | | 4,162 | 26,887 |
| FLIR Systems, Inc. | | 2,323 | 94,244 |
| II-VI, Inc. (a) | | 1,559 | 73,616 |
| Insight Enterprises, Inc. (a) | | 636 | 31,291 |
| IPG Photonics Corp. (a) | | 633 | 101,527 |
| Itron, Inc. (a) | | 630 | 41,738 |
| Jabil, Inc. | | 2,436 | 78,147 |
| Knowles Corp. (a) | | 1,523 | 23,241 |
| Littelfuse, Inc. | | 433 | 73,883 |
| Luna Innovations, Inc. (a)(b) | | 393 | 2,295 |
| Methode Electronics, Inc. Class A | | 660 | 20,632 |
| MTS Systems Corp. | | 320 | 5,629 |
| Napco Security Technolgies, Inc. (a) | | 199 | 4,655 |
| National Instruments Corp. | | 2,096 | 81,136 |
| nLIGHT, Inc. (a)(b) | | 575 | 12,800 |
| Novanta, Inc. (a) | | 625 | 66,731 |
| OSI Systems, Inc. (a) | | 303 | 22,616 |
| Par Technology Corp. (a)(b) | | 195 | 5,836 |
| PC Connection, Inc. | | 188 | 8,716 |
| Plexus Corp. (a) | | 527 | 37,185 |
| Rogers Corp. (a)(b) | | 330 | 41,118 |
| Sanmina Corp. (a) | | 1,204 | 30,148 |
| ScanSource, Inc. (a) | | 434 | 10,455 |
| SYNNEX Corp. | | 727 | 87,073 |
| TTM Technologies, Inc. (a) | | 1,753 | 20,791 |
| Vishay Intertechnology, Inc. | | 2,351 | 35,900 |
| Vishay Precision Group, Inc. (a) | | 221 | 5,432 |
| | | | 1,666,061 |
| IT Services - 2.1% | | | |
| Alliance Data Systems Corp. | | 762 | 34,381 |
| Brightcove, Inc. (a) | | 634 | 4,996 |
| CACI International, Inc. Class A (a) | | 444 | 96,295 |
| Cardtronics PLC (a)(b) | | 664 | 15,923 |
| Cass Information Systems, Inc. | | 215 | 8,391 |
| Conduent, Inc. (a) | | 2,882 | 6,888 |
| CSG Systems International, Inc. | | 581 | 24,048 |
| DXC Technology Co. | | 4,490 | 74,085 |
| Endurance International Group Holdings, Inc. (a) | | 1,447 | 5,831 |
| Euronet Worldwide, Inc. (a) | | 929 | 89,017 |
| EVERTEC, Inc. | | 1,083 | 30,432 |
| EVO Payments, Inc. Class A (a) | | 719 | 16,415 |
| ExlService Holdings, Inc. (a) | | 615 | 38,991 |
| Fastly, Inc. Class A (a) | | 330 | 28,093 |
| Genpact Ltd. | | 2,734 | 99,846 |
| GreenSky, Inc. Class A (a)(b) | | 758 | 3,714 |
| GTT Communications, Inc. (a)(b) | | 516 | 4,211 |
| Hackett Group, Inc. | | 493 | 6,675 |
| i3 Verticals, Inc. Class A (a) | | 254 | 7,684 |
| International Money Express, Inc. (a) | | 443 | 5,520 |
| KBR, Inc. | | 2,528 | 57,006 |
| Limelight Networks, Inc. (a) | | 2,115 | 15,566 |
| Liveramp Holdings, Inc. (a) | | 1,161 | 49,308 |
| ManTech International Corp. Class A | | 477 | 32,670 |
| Maximus, Inc. | | 1,086 | 76,509 |
| MongoDB, Inc. Class A (a)(b) | | 643 | 145,537 |
| NIC, Inc. | | 1,189 | 27,299 |
| Paysign, Inc. (a) | | 469 | 4,554 |
| Perficient, Inc. (a) | | 600 | 21,468 |
| Perspecta, Inc. | | 2,410 | 55,984 |
| Repay Holdings Corp. (a) | | 649 | 15,985 |
| Sabre Corp. | | 4,931 | 39,744 |
| Science Applications International Corp. | | 872 | 67,737 |
| Switch, Inc. Class A | | 1,058 | 18,854 |
| Sykes Enterprises, Inc. (a) | | 700 | 19,362 |
| Ttec Holdings, Inc. | | 309 | 14,387 |
| Unisys Corp. (a) | | 907 | 9,895 |
| Verra Mobility Corp. (a) | | 2,340 | 24,055 |
| Virtusa Corp. (a) | | 523 | 16,982 |
| WEX, Inc. (a) | | 770 | 127,058 |
| | | | 1,441,396 |
| Semiconductors & Semiconductor Equipment - 3.0% | | | |
| ACM Research, Inc. (a)(b) | | 160 | 9,978 |
| Advanced Energy Industries, Inc. (a) | | 681 | 46,165 |
| Alpha & Omega Semiconductor Ltd. (a) | | 330 | 3,590 |
| Ambarella, Inc. (a) | | 577 | 26,427 |
| Amkor Technology, Inc. (a) | | 1,843 | 22,687 |
| Axcelis Technologies, Inc. (a) | | 586 | 16,320 |
| Brooks Automation, Inc. | | 1,319 | 58,353 |
| Cabot Microelectronics Corp. | | 517 | 72,142 |
| Ceva, Inc. (a) | | 387 | 14,482 |
| Cirrus Logic, Inc. (a) | | 1,039 | 64,189 |
| Cohu, Inc. (b) | | 721 | 12,502 |
| Cree, Inc. (a) | | 1,917 | 113,467 |
| Diodes, Inc. (a) | | 743 | 37,670 |
| DSP Group, Inc. (a) | | 400 | 6,352 |
| Enphase Energy, Inc. (a) | | 1,444 | 68,691 |
| Entegris, Inc. | | 2,394 | 141,366 |
| First Solar, Inc. (a)(b) | | 1,346 | 66,627 |
| FormFactor, Inc. (a) | | 1,344 | 39,420 |
| Ichor Holdings Ltd. (a) | | 427 | 11,350 |
| Impinj, Inc. (a) | | 264 | 7,252 |
| Inphi Corp. (a) | | 854 | 100,345 |
| Kulicke & Soffa Industries, Inc. | | 1,121 | 23,350 |
| Lattice Semiconductor Corp. (a) | | 2,393 | 67,937 |
| MACOM Technology Solutions Holdings, Inc. (a) | | 810 | 27,824 |
| MaxLinear, Inc. Class A (a) | | 1,159 | 24,872 |
| MKS Instruments, Inc. | | 976 | 110,522 |
| Monolithic Power Systems, Inc. | | 737 | 174,669 |
| NeoPhotonics Corp. (a) | | 731 | 6,491 |
| NVE Corp. | | 93 | 5,750 |
| ON Semiconductor Corp. (a) | | 7,305 | 144,785 |
| Onto Innovation, Inc. (a) | | 845 | 28,764 |
| PDF Solutions, Inc. (a) | | 520 | 10,171 |
| Photronics, Inc. (a) | | 1,151 | 12,811 |
| Power Integrations, Inc. | | 531 | 62,727 |
| Rambus, Inc. (a) | | 2,029 | 30,841 |
| Semtech Corp. (a) | | 1,156 | 60,366 |
| Silicon Laboratories, Inc. (a) | | 780 | 78,211 |
| SMART Global Holdings, Inc. (a) | | 245 | 6,659 |
| SolarEdge Technologies, Inc. (a) | | 881 | 122,265 |
| SunPower Corp. (a)(b) | | 1,640 | 12,562 |
| Synaptics, Inc. (a) | | 602 | 36,192 |
| Ultra Clean Holdings, Inc. (a) | | 691 | 15,637 |
| Universal Display Corp. | | 753 | 112,664 |
| Veeco Instruments, Inc. (a)(b) | | 859 | 11,588 |
| | | | 2,127,033 |
| Software - 6.6% | | | |
| 2U, Inc. (a)(b) | | 1,131 | 42,933 |
| 8x8, Inc. (a) | | 1,814 | 29,024 |
| A10 Networks, Inc. (a) | | 1,034 | 7,042 |
| ACI Worldwide, Inc. (a) | | 2,068 | 55,815 |
| Agilysys, Inc. (a) | | 359 | 6,440 |
| Alarm.com Holdings, Inc. (a) | | 751 | 48,672 |
| Altair Engineering, Inc. Class A (a)(b) | | 708 | 28,143 |
| Alteryx, Inc. Class A (a)(b) | | 884 | 145,224 |
| Anaplan, Inc. (a) | | 1,583 | 71,726 |
| AppFolio, Inc. (a) | | 261 | 42,467 |
| Appian Corp. Class A (a)(b) | | 623 | 31,929 |
| Aspen Technology, Inc. (a) | | 1,200 | 124,332 |
| Asure Software, Inc. (a) | | 190 | 1,222 |
| Avalara, Inc. (a) | | 1,211 | 161,172 |
| Avaya Holdings Corp. (a)(b) | | 1,474 | 18,219 |
| Benefitfocus, Inc. (a) | | 520 | 5,595 |
| Blackbaud, Inc. | | 874 | 49,888 |
| BlackLine, Inc. (a) | | 767 | 63,592 |
| Bottomline Technologies, Inc. (a) | | 670 | 34,016 |
| Box, Inc. Class A (a) | | 2,683 | 55,699 |
| CDK Global, Inc. | | 2,152 | 89,136 |
| Cerence, Inc. (a)(b) | | 650 | 26,546 |
| Ceridian HCM Holding, Inc. (a) | | 1,806 | 143,162 |
| Cloudera, Inc. (a) | | 4,620 | 58,766 |
| CommVault Systems, Inc. (a) | | 745 | 28,832 |
| Cornerstone OnDemand, Inc. (a) | | 990 | 38,174 |
| Crowdstrike Holdings, Inc. | | 365 | 36,606 |
| Digimarc Corp. (a)(b) | | 203 | 3,246 |
| Digital Turbine, Inc. (a) | | 1,114 | 14,003 |
| Domo, Inc. Class B (a) | | 386 | 12,418 |
| Dropbox, Inc. Class A (a) | | 3,973 | 86,492 |
| Dynatrace, Inc. | | 2,798 | 113,599 |
| Ebix, Inc. (b) | | 386 | 8,631 |
| Elastic NV (a) | | 596 | 54,957 |
| Envestnet, Inc. (a) | | 949 | 69,789 |
| Everbridge, Inc. (a) | | 610 | 84,400 |
| FireEye, Inc. (a)(b) | | 3,971 | 48,347 |
| Five9, Inc. (a) | | 1,098 | 121,516 |
| Forescout Technologies, Inc. (a) | | 699 | 14,819 |
| Globalscape, Inc. | | 181 | 1,765 |
| HubSpot, Inc. (a) | | 728 | 163,327 |
| Intelligent Systems Corp. (a) | | 97 | 3,306 |
| j2 Global, Inc. | | 805 | 50,884 |
| LivePerson, Inc. (a) | | 1,093 | 45,283 |
| LogMeIn, Inc. | | 865 | 73,326 |
| Manhattan Associates, Inc. (a) | | 1,127 | 106,163 |
| MicroStrategy, Inc. Class A (a) | | 136 | 16,087 |
| Mitek Systems, Inc. (a) | | 766 | 7,361 |
| MobileIron, Inc. (a) | | 1,563 | 7,706 |
| Model N, Inc. (a) | | 502 | 17,450 |
| New Relic, Inc. (a) | | 908 | 62,561 |
| Nuance Communications, Inc. (a) | | 4,979 | 125,994 |
| Nutanix, Inc. Class A (a) | | 2,682 | 63,577 |
| Onespan, Inc. (a) | | 605 | 16,898 |
| Parametric Technology Corp. (a) | | 1,843 | 143,367 |
| Pareteum Corp. (a)(b) | | 2,314 | 1,435 |
| Paylocity Holding Corp. (a)(b) | | 638 | 93,078 |
| Pegasystems, Inc. | | 679 | 68,694 |
| Pluralsight, Inc. (a) | | 1,726 | 31,154 |
| Progress Software Corp. | | 803 | 31,116 |
| Proofpoint, Inc. (a) | | 1,017 | 113,009 |
| PROS Holdings, Inc. (a) | | 705 | 31,323 |
| Q2 Holdings, Inc. (a) | | 869 | 74,552 |
| QAD, Inc. Class A | | 197 | 8,132 |
| Qualys, Inc. (a) | | 592 | 61,580 |
| Rapid7, Inc. (a) | | 789 | 40,255 |
| RealPage, Inc. (a) | | 1,539 | 100,050 |
| SailPoint Technologies Holding, Inc. (a)(b) | | 1,513 | 40,049 |
| SecureWorks Corp. (a) | | 178 | 2,035 |
| ShotSpotter, Inc. (a)(b) | | 137 | 3,452 |
| Smartsheet, Inc. (a) | | 1,631 | 83,051 |
| Smith Micro Software, Inc. (a) | | 420 | 1,873 |
| SolarWinds, Inc. (a)(b) | | 1,139 | 20,126 |
| SPS Commerce, Inc. (a) | | 628 | 47,175 |
| SurveyMonkey (a) | | 1,656 | 38,982 |
| Synchronoss Technologies, Inc. (a) | | 613 | 2,164 |
| TeleNav, Inc. (a) | | 663 | 3,640 |
| Tenable Holdings, Inc. (a) | | 773 | 23,043 |
| Teradata Corp. (a) | | 1,935 | 40,248 |
| Upland Software, Inc. (a) | | 367 | 12,757 |
| Varonis Systems, Inc. (a) | | 559 | 49,460 |
| Verint Systems, Inc. (a) | | 1,140 | 51,505 |
| VirnetX Holding Corp. (b) | | 1,196 | 7,774 |
| Workiva, Inc. (a) | | 675 | 36,106 |
| Xperi Holding Corp. | | 2,044 | 30,169 |
| Yext, Inc. (a) | | 1,744 | 28,968 |
| Zendesk, Inc. (a) | | 2,029 | 179,627 |
| Zix Corp. (a) | | 990 | 6,831 |
| Zoom Video Communications, Inc. Class A (a)(b) | | 506 | 128,291 |
| Zscaler, Inc. (a)(b) | | 1,172 | 128,334 |
| Zuora, Inc. (a) | | 1,323 | 16,868 |
| | | | 4,618,550 |
| Technology Hardware, Storage & Peripherals - 0.5% | | | |
| 3D Systems Corp. (a)(b) | | 2,084 | 14,567 |
| Avid Technology, Inc. (a) | | 586 | 4,260 |
| Dell Technologies, Inc. (a) | | 2,734 | 150,206 |
| Diebold Nixdorf, Inc. (a)(b) | | 1,390 | 8,423 |
| Immersion Corp. (a) | | 457 | 2,847 |
| NCR Corp. (a) | | 2,275 | 39,403 |
| Pure Storage, Inc. Class A (a) | | 4,127 | 71,521 |
| Xerox Holdings Corp. | | 3,236 | 49,478 |
| | | | 340,705 |
|
| TOTAL INFORMATION TECHNOLOGY | | | 11,144,194 |
|
| MATERIALS - 4.9% | | | |
| Chemicals - 2.4% | | | |
| Advanced Emissions Solutions, Inc. | | 295 | 1,431 |
| AdvanSix, Inc. (a) | | 498 | 5,847 |
| Albemarle Corp. U.S. (b) | | 1,886 | 145,618 |
| American Vanguard Corp. | | 444 | 6,109 |
| Amyris, Inc. (a)(b) | | 1,252 | 5,346 |
| Ashland Global Holdings, Inc. | | 1,071 | 74,006 |
| Axalta Coating Systems Ltd. (a) | | 3,716 | 83,796 |
| Balchem Corp. | | 571 | 54,165 |
| Cabot Corp. | | 1,013 | 37,532 |
| CF Industries Holdings, Inc. | | 3,801 | 106,960 |
| Chase Corp. | | 134 | 13,735 |
| Element Solutions, Inc. (a) | | 3,880 | 42,098 |
| Ferro Corp. (a) | | 1,435 | 17,134 |
| GCP Applied Technologies, Inc. (a) | | 940 | 17,465 |
| H.B. Fuller Co. | | 909 | 40,541 |
| Huntsman Corp. | | 3,490 | 62,715 |
| Ingevity Corp. (a) | | 735 | 38,639 |
| Innospec, Inc. | | 435 | 33,604 |
| Intrepid Potash, Inc. (a) | | 1,501 | 1,486 |
| Koppers Holdings, Inc. (a) | | 369 | 6,952 |
| Kraton Performance Polymers, Inc. (a) | | 540 | 9,331 |
| Kronos Worldwide, Inc. (b) | | 341 | 3,550 |
| Livent Corp. (a) | | 2,560 | 15,770 |
| Minerals Technologies, Inc. | | 615 | 28,862 |
| NewMarket Corp. | | 128 | 51,261 |
| Olin Corp. | | 2,805 | 32,229 |
| PolyOne Corp. | | 1,631 | 42,781 |
| PQ Group Holdings, Inc. (a) | | 667 | 8,831 |
| Quaker Chemical Corp. | | 233 | 43,256 |
| Rayonier Advanced Materials, Inc. | | 825 | 2,318 |
| RPM International, Inc. | | 2,292 | 172,038 |
| Sensient Technologies Corp. | | 757 | 39,485 |
| Stepan Co. | | 356 | 34,568 |
| The Chemours Co. LLC | | 2,952 | 45,313 |
| The Mosaic Co. | | 6,215 | 77,750 |
| The Scotts Miracle-Gro Co. Class A | | 698 | 93,860 |
| Tredegar Corp. | | 438 | 6,745 |
| Trinseo SA (b) | | 684 | 15,157 |
| Tronox Holdings PLC | | 1,671 | 12,065 |
| Valvoline, Inc. | | 3,287 | 63,538 |
| Venator Materials PLC (a) | | 844 | 1,511 |
| W.R. Grace & Co. | | 983 | 49,946 |
| Westlake Chemical Corp. | | 615 | 32,995 |
| | | | 1,678,339 |
| Construction Materials - 0.1% | | | |
| Eagle Materials, Inc. | | 746 | 52,384 |
| Forterra, Inc. (a) | | 316 | 3,527 |
| Summit Materials, Inc. (a) | | 1,998 | 32,128 |
| U.S. Concrete, Inc. (a) | | 289 | 7,167 |
| | | | 95,206 |
| Containers & Packaging - 1.1% | | | |
| Aptargroup, Inc. | | 1,134 | 126,985 |
| Berry Global Group, Inc. (a) | | 2,350 | 104,152 |
| Graphic Packaging Holding Co. | | 4,941 | 69,125 |
| Greif, Inc. Class A | | 463 | 15,932 |
| Myers Industries, Inc. | | 682 | 9,923 |
| O-I Glass, Inc. | | 2,742 | 24,623 |
| Packaging Corp. of America | | 1,682 | 167,864 |
| Sealed Air Corp. | | 2,747 | 90,239 |
| Silgan Holdings, Inc. | | 1,370 | 44,374 |
| Sonoco Products Co. | | 1,772 | 92,658 |
| UFP Technologies, Inc. (a) | | 118 | 5,199 |
| | | | 751,074 |
| Metals & Mining - 1.1% | | | |
| Alcoa Corp. (a) | | 3,302 | 37,114 |
| Allegheny Technologies, Inc. (a) | | 2,222 | 22,642 |
| Carpenter Technology Corp. | | 841 | 20,419 |
| Century Aluminum Co. (a) | | 922 | 6,574 |
| Cleveland-Cliffs, Inc. (b) | | 7,095 | 39,164 |
| Coeur d'Alene Mines Corp. (a) | | 4,205 | 21,361 |
| Commercial Metals Co. | | 2,112 | 43,085 |
| Compass Minerals International, Inc. | | 610 | 29,738 |
| Contura Energy, Inc. (a) | | 320 | 973 |
| Gold Resource Corp. | | 1,152 | 4,735 |
| Haynes International, Inc. | | 214 | 4,999 |
| Hecla Mining Co. | | 9,353 | 30,584 |
| Kaiser Aluminum Corp. | | 290 | 21,350 |
| Materion Corp. | | 359 | 22,075 |
| McEwen Mining, Inc. (a)(b) | | 5,422 | 5,476 |
| Reliance Steel & Aluminum Co. | | 1,126 | 106,891 |
| Royal Gold, Inc. | | 1,168 | 145,206 |
| Ryerson Holding Corp. (a) | | 318 | 1,790 |
| Schnitzer Steel Industries, Inc. Class A | | 502 | 8,855 |
| Steel Dynamics, Inc. | | 3,733 | 97,394 |
| SunCoke Energy, Inc. | | 1,520 | 4,499 |
| TimkenSteel Corp. (a)(b) | | 642 | 2,497 |
| United States Steel Corp. (b) | | 3,909 | 28,223 |
| Warrior Metropolitan Coal, Inc. | | 891 | 13,712 |
| Worthington Industries, Inc. | | 643 | 23,984 |
| | | | 743,340 |
| Paper & Forest Products - 0.2% | | | |
| Boise Cascade Co. | | 686 | 25,800 |
| Clearwater Paper Corp. (a) | | 290 | 10,478 |
| Domtar Corp. | | 976 | 20,603 |
| Louisiana-Pacific Corp. | | 2,002 | 51,351 |
| Mercer International, Inc. (SBI) | | 706 | 5,761 |
| Neenah, Inc. | | 291 | 14,393 |
| P.H. Glatfelter Co. | | 799 | 12,824 |
| Resolute Forest Products (a) | | 1,407 | 2,969 |
| Schweitzer-Mauduit International, Inc. | | 540 | 18,041 |
| Verso Corp. | | 629 | 7,523 |
| | | | 169,743 |
|
| TOTAL MATERIALS | | | 3,437,702 |
|
| REAL ESTATE - 7.9% | | | |
| Equity Real Estate Investment Trusts (REITs) - 7.4% | | | |
| Acadia Realty Trust (SBI) | | 1,530 | 19,859 |
| Agree Realty Corp. | | 964 | 63,344 |
| Alexander & Baldwin, Inc. | | 1,187 | 14,470 |
| Alexanders, Inc. | | 37 | 8,913 |
| American Assets Trust, Inc. | | 860 | 23,942 |
| American Campus Communities, Inc. | | 2,450 | 85,652 |
| American Finance Trust, Inc. | | 1,979 | 15,703 |
| American Homes 4 Rent Class A | | 4,545 | 122,261 |
| Americold Realty Trust | | 3,556 | 129,083 |
| Apartment Investment & Management Co. Class A | | 2,653 | 99,859 |
| Apple Hospitality (REIT), Inc. | | 3,794 | 36,650 |
| Armada Hoffler Properties, Inc. | | 996 | 9,910 |
| Ashford Hospitality Trust, Inc. | | 1,407 | 1,017 |
| Bluerock Residential Growth (REIT), Inc. | | 377 | 3,046 |
| Braemar Hotels & Resorts, Inc. | | 532 | 1,522 |
| Brandywine Realty Trust (SBI) | | 3,103 | 33,792 |
| Brixmor Property Group, Inc. | | 5,322 | 68,228 |
| CareTrust (REIT), Inc. | | 1,703 | 29,223 |
| CatchMark Timber Trust, Inc. | | 887 | 7,850 |
| CBL & Associates Properties, Inc. (a)(b) | | 2,758 | 752 |
| Chatham Lodging Trust | | 828 | 5,067 |
| City Office REIT, Inc. | | 859 | 8,642 |
| Colony Capital, Inc. | | 8,516 | 20,438 |
| Columbia Property Trust, Inc. | | 2,080 | 27,331 |
| Community Healthcare Trust, Inc. | | 375 | 15,338 |
| CoreCivic, Inc. | | 2,157 | 20,190 |
| CorEnergy Infrastructure Trust, Inc. | | 226 | 2,068 |
| CorePoint Lodging, Inc. | | 719 | 3,027 |
| CoreSite Realty Corp. | | 719 | 87,042 |
| Corporate Office Properties Trust (SBI) | | 2,006 | 50,832 |
| Cousins Properties, Inc. | | 2,654 | 79,169 |
| CubeSmart | | 3,454 | 93,223 |
| CyrusOne, Inc. | | 2,045 | 148,774 |
| DiamondRock Hospitality Co. | | 3,525 | 19,493 |
| Douglas Emmett, Inc. | | 2,943 | 90,232 |
| Easterly Government Properties, Inc. | | 1,322 | 30,565 |
| EastGroup Properties, Inc. | | 695 | 82,434 |
| Empire State Realty Trust, Inc. | | 2,742 | 19,194 |
| EPR Properties | | 1,382 | 45,786 |
| Equity Commonwealth | | 2,173 | 69,971 |
| Essential Properties Realty Trust, Inc. | | 1,641 | 24,352 |
| Federal Realty Investment Trust (SBI) | | 1,254 | 106,853 |
| First Industrial Realty Trust, Inc. | | 2,267 | 87,143 |
| Four Corners Property Trust, Inc. | | 1,272 | 31,037 |
| Franklin Street Properties Corp. | | 1,908 | 9,712 |
| Front Yard Residential Corp. Class B | | 884 | 7,691 |
| Gaming & Leisure Properties | | 3,678 | 127,259 |
| Getty Realty Corp. | | 636 | 18,876 |
| Gladstone Commercial Corp. | | 628 | 11,775 |
| Gladstone Land Corp. | | 335 | 5,313 |
| Global Medical REIT, Inc. | | 692 | 7,840 |
| Global Net Lease, Inc. | | 1,605 | 26,852 |
| Government Properties Income Trust | | 877 | 22,776 |
| Healthcare Realty Trust, Inc. | | 2,395 | 70,150 |
| Healthcare Trust of America, Inc. | | 3,892 | 103,216 |
| Hersha Hospitality Trust | | 643 | 3,704 |
| Highwoods Properties, Inc. (SBI) | | 1,855 | 69,247 |
| Hospitality Properties Trust (SBI) | | 2,877 | 20,398 |
| Hudson Pacific Properties, Inc. | | 2,766 | 69,593 |
| Independence Realty Trust, Inc. | | 1,727 | 19,843 |
| Industrial Logistics Properties Trust | | 1,200 | 24,660 |
| Investors Real Estate Trust | | 215 | 15,155 |
| Iron Mountain, Inc. | | 5,116 | 133,528 |
| iStar Financial, Inc. | | 1,305 | 16,078 |
| JBG SMITH Properties | | 2,105 | 62,245 |
| Jernigan Capital, Inc. | | 446 | 6,101 |
| Kilroy Realty Corp. | | 1,887 | 110,767 |
| Kimco Realty Corp. | | 7,710 | 98,996 |
| Kite Realty Group Trust | | 1,473 | 16,998 |
| Lamar Advertising Co. Class A | | 1,532 | 102,276 |
| Lexington Corporate Properties Trust | | 4,929 | 52,001 |
| Life Storage, Inc. | | 832 | 78,998 |
| LTC Properties, Inc. | | 702 | 26,444 |
| Mack-Cali Realty Corp. | | 1,606 | 24,556 |
| Monmouth Real Estate Investment Corp. Class A | | 1,795 | 26,010 |
| National Health Investors, Inc. | | 790 | 47,969 |
| National Retail Properties, Inc. | | 3,059 | 108,533 |
| National Storage Affiliates Trust | | 1,107 | 31,727 |
| New Senior Investment Group, Inc. | | 1,499 | 5,426 |
| NexPoint Residential Trust, Inc. | | 392 | 13,857 |
| Omega Healthcare Investors, Inc. | | 4,030 | 119,812 |
| Outfront Media, Inc. | | 2,591 | 36,714 |
| Paramount Group, Inc. | | 3,493 | 26,931 |
| Park Hotels & Resorts, Inc. | | 4,196 | 41,498 |
| Pebblebrook Hotel Trust | | 2,380 | 32,511 |
| Pennsylvania Real Estate Investment Trust (SBI) (b) | | 1,173 | 1,595 |
| Physicians Realty Trust | | 3,639 | 63,755 |
| Piedmont Office Realty Trust, Inc. Class A | | 2,280 | 37,871 |
| Plymouth Industrial REIT, Inc. | | 248 | 3,174 |
| Potlatch Corp. | | 1,209 | 45,978 |
| Preferred Apartment Communities, Inc. Class A | | 795 | 6,042 |
| PS Business Parks, Inc. | | 357 | 47,267 |
| QTS Realty Trust, Inc. Class A | | 1,072 | 68,704 |
| Ramco-Gershenson Properties Trust (SBI) | | 1,422 | 9,897 |
| Rayonier, Inc. | | 2,459 | 60,959 |
| Retail Opportunity Investments Corp. | | 2,059 | 23,328 |
| Retail Properties America, Inc. | | 3,783 | 27,692 |
| Retail Value, Inc. | | 274 | 3,387 |
| Rexford Industrial Realty, Inc. | | 2,186 | 90,566 |
| RLJ Lodging Trust | | 2,956 | 27,905 |
| Ryman Hospitality Properties, Inc. | | 970 | 33,562 |
| Sabra Health Care REIT, Inc. | | 3,680 | 53,102 |
| Safety Income and Growth, Inc. | | 243 | 13,970 |
| Saul Centers, Inc. | | 217 | 7,003 |
| Senior Housing Properties Trust (SBI) | | 4,158 | 18,399 |
| Seritage Growth Properties (a)(b) | | 664 | 7,570 |
| SITE Centers Corp. | | 2,636 | 21,352 |
| SL Green Realty Corp. | | 1,370 | 67,527 |
| Spirit Realty Capital, Inc. | | 1,838 | 64,073 |
| Stag Industrial, Inc. | | 2,652 | 77,757 |
| Store Capital Corp. | | 3,967 | 94,454 |
| Summit Hotel Properties, Inc. | | 1,848 | 10,959 |
| Sunstone Hotel Investors, Inc. | | 3,887 | 31,679 |
| Tanger Factory Outlet Centers, Inc. (b) | | 1,655 | 11,800 |
| Taubman Centers, Inc. | | 1,092 | 41,234 |
| Terreno Realty Corp. | | 1,213 | 63,852 |
| The GEO Group, Inc. | | 2,206 | 26,097 |
| The Macerich Co. (b) | | 2,030 | 18,209 |
| UMH Properties, Inc. | | 656 | 8,482 |
| Uniti Group, Inc. | | 3,496 | 32,688 |
| Universal Health Realty Income Trust (SBI) | | 224 | 17,806 |
| Urban Edge Properties | | 2,001 | 23,752 |
| Urstadt Biddle Properties, Inc. Class A | | 529 | 6,285 |
| Washington Prime Group, Inc. (b) | | 3,408 | 2,865 |
| Washington REIT (SBI) | | 1,463 | 32,479 |
| Weingarten Realty Investors (SBI) | | 2,179 | 41,248 |
| Whitestone REIT Class B | | 715 | 5,198 |
| Xenia Hotels & Resorts, Inc. | | 2,033 | 18,968 |
| | | | 5,167,803 |
| Real Estate Management & Development - 0.5% | | | |
| Altisource Portfolio Solutions SA (a)(b) | | 165 | 2,432 |
| Cto Realty Growth, Inc. | | 84 | 3,318 |
| eXp World Holdings, Inc. (a)(b) | | 406 | 6,922 |
| Forestar Group, Inc. (a) | | 275 | 4,147 |
| Howard Hughes Corp. (a) | | 804 | 41,768 |
| Jones Lang LaSalle, Inc. | | 915 | 94,666 |
| Kennedy-Wilson Holdings, Inc. | | 2,218 | 33,758 |
| Marcus & Millichap, Inc. (a) | | 407 | 11,746 |
| Newmark Group, Inc. | | 2,769 | 13,457 |
| RE/MAX Holdings, Inc. | | 330 | 10,372 |
| Realogy Holdings Corp. | | 2,003 | 14,842 |
| Redfin Corp. (a) | | 1,575 | 66,008 |
| The RMR Group, Inc. | | 266 | 7,839 |
| The St. Joe Co. (a)(b) | | 555 | 10,778 |
| | | | 322,053 |
|
| TOTAL REAL ESTATE | | | 5,489,856 |
|
| UTILITIES - 2.6% | | | |
| Electric Utilities - 1.0% | | | |
| Allete, Inc. | | 919 | 50,187 |
| Avangrid, Inc. | | 990 | 41,560 |
| El Paso Electric Co. | | 724 | 48,508 |
| Hawaiian Electric Industries, Inc. | | 1,937 | 69,848 |
| IDACORP, Inc. | | 896 | 78,284 |
| MGE Energy, Inc. | | 642 | 41,415 |
| NRG Energy, Inc. | | 4,327 | 140,887 |
| OGE Energy Corp. | | 3,558 | 108,021 |
| Otter Tail Corp. | | 712 | 27,618 |
| PNM Resources, Inc. | | 1,417 | 54,469 |
| Portland General Electric Co. | | 1,588 | 66,394 |
| | | | 727,191 |
| Gas Utilities - 0.8% | | | |
| Chesapeake Utilities Corp. | | 291 | 24,444 |
| National Fuel Gas Co. | | 1,603 | 67,214 |
| New Jersey Resources Corp. | | 1,697 | 55,407 |
| Northwest Natural Holding Co. (b) | | 548 | 30,573 |
| ONE Gas, Inc. | | 935 | 72,042 |
| South Jersey Industries, Inc. | | 1,657 | 41,408 |
| Southwest Gas Holdings, Inc. | | 970 | 66,979 |
| Spire, Inc. | | 905 | 59,468 |
| UGI Corp. | | 3,716 | 118,169 |
| | | | 535,704 |
| Independent Power and Renewable Electricity Producers - 0.2% | | | |
| Clearway Energy, Inc.: | | | |
| Class A | | 633 | 13,274 |
| Class C | | 1,369 | 31,569 |
| Ormat Technologies, Inc. | | 908 | 57,649 |
| Sunnova Energy International, Inc. | | 239 | 4,080 |
| Terraform Power, Inc. | | 1,412 | 26,037 |
| | | | 132,609 |
| Multi-Utilities - 0.4% | | | |
| Avista Corp. | | 1,195 | 43,486 |
| Black Hills Corp. | | 1,112 | 63,006 |
| MDU Resources Group, Inc. | | 3,563 | 79,027 |
| NorthWestern Energy Corp. | | 897 | 48,904 |
| Unitil Corp. | | 260 | 11,653 |
| | | | 246,076 |
| Water Utilities - 0.2% | | | |
| American States Water Co. | | 654 | 51,424 |
| Cadiz, Inc. (a)(b) | | 561 | 5,700 |
| California Water Service Group | | 874 | 41,690 |
| Middlesex Water Co. | | 304 | 20,423 |
| SJW Corp. | | 469 | 29,130 |
| York Water Co. (b) | | 227 | 10,887 |
| | | | 159,254 |
|
| TOTAL UTILITIES | | | 1,800,834 |
|
| TOTAL COMMON STOCKS | | | |
| (Cost $75,937,702) | | | 68,118,373 |
|
| Money Market Funds - 11.5% | | | |
| Fidelity Cash Central Fund 0.12% (e) | | 1,425,874 | 1,426,159 |
| Fidelity Securities Lending Cash Central Fund 0.12% (e)(f) | | 6,624,953 | 6,625,615 |
| TOTAL MONEY MARKET FUNDS | | | |
| (Cost $8,051,774) | | | 8,051,774 |
| TOTAL INVESTMENT IN SECURITIES - 108.9% | | | |
| (Cost $83,989,476) | | | 76,170,147 |
| NET OTHER ASSETS (LIABILITIES) - (8.9)% | | | (6,245,946) |
| NET ASSETS - 100% | | | $69,924,201 |
| Futures Contracts | | | | | |
| | Number of contracts | Expiration Date | Notional Amount | Value | Unrealized Appreciation/(Depreciation) |
| Purchased | | | | | |
| Equity Index Contracts | | | | | |
| CME E-mini Russell 2000 Index Contracts (United States) | 12 | Sept. 2020 | $862,560 | $18,916 | $18,916 |
| CME E-mini S&P MidCap 400 Index Contracts (United States) | 5 | Sept. 2020 | 889,550 | 2,392 | 2,392 |
| TOTAL FUTURES CONTRACTS | | | | | $21,308 |
The notional amount of futures purchased as a percentage of Net Assets is 2.5%
Legend
(a) Non-income producing
(b) Security or a portion of the security is on loan at period end.
(c) Level 3 security
(d) Security exempt from registration under Rule 144A of the Securities Act of 1933. These securities may be resold in transactions exempt from registration, normally to qualified institutional buyers. At the end of the period, the value of these securities amounted to $33,397 or 0.0% of net assets.
(e) Affiliated fund that is generally available only to investment companies and other accounts managed by Fidelity Investments. The rate quoted is the annualized seven-day yield of the fund at period end. A complete unaudited listing of the fund's holdings as of its most recent quarter end is available upon request. In addition, each Fidelity Central Fund's financial statements are available on the SEC's website or upon request.
(f) Investment made with cash collateral received from securities on loan.
Affiliated Central Funds
Information regarding fiscal year to date income earned by the Fund from investments in Fidelity Central Funds is as follows:
| Fund | Income earned |
| Fidelity Cash Central Fund | $5,168 |
| Fidelity Securities Lending Cash Central Fund | 28,803 |
| Total | $33,971 |
Amounts in the income column in the above table include any capital gain distributions from underlying funds, which are presented in the corresponding line-item in the Statement of Operations, if applicable. Amount for Fidelity Securities Lending Cash Central Fund represents the income earned on investing cash collateral, less rebates paid to borrowers and any lending agent fees associated with the loan, plus any premium payments received for lending certain types of securities.
Investment Valuation
The following is a summary of the inputs used, as of June 30, 2020, involving the Fund's assets and liabilities carried at fair value. The inputs or methodology used for valuing securities may not be an indication of the risk associated with investing in those securities. For more information on valuation inputs, and their aggregation into the levels used below, please refer to the Investment Valuation section in the accompanying Notes to Financial Statements.
| | Valuation Inputs at Reporting Date: |
| Description | Total | Level 1 | Level 2 | Level 3 |
| Investments in Securities: | | | | |
| Equities: | | | | |
| Communication Services | $2,372,536 | $2,369,758 | $-- | $2,778 |
| Consumer Discretionary | 8,917,866 | 8,917,866 | -- | -- |
| Consumer Staples | 2,375,732 | 2,375,732 | -- | -- |
| Energy | 1,674,737 | 1,674,737 | -- | -- |
| Financials | 9,319,647 | 9,319,647 | -- | -- |
| Health Care | 11,278,008 | 11,278,008 | -- | -- |
| Industrials | 10,307,261 | 10,307,261 | -- | -- |
| Information Technology | 11,144,194 | 11,144,194 | -- | -- |
| Materials | 3,437,702 | 3,437,702 | -- | -- |
| Real Estate | 5,489,856 | 5,489,856 | -- | -- |
| Utilities | 1,800,834 | 1,800,834 | -- | -- |
| Money Market Funds | 8,051,774 | 8,051,774 | -- | -- |
| Total Investments in Securities: | $76,170,147 | $76,167,369 | $-- | $2,778 |
| Derivative Instruments: | | | | |
| Assets | | | | |
| Futures Contracts | $21,308 | $21,308 | $-- | $-- |
| Total Assets | $21,308 | $21,308 | $-- | $-- |
| Total Derivative Instruments: | $21,308 | $21,308 | $-- | $-- |
Value of Derivative Instruments
The following table is a summary of the Fund's value of derivative instruments by primary risk exposure as of June 30, 2020. For additional information on derivative instruments, please refer to the Derivative Instruments section in the accompanying Notes to Financial Statements.
| Primary Risk Exposure / Derivative Type | Value |
| | Asset | Liability |
| Equity Risk | | |
| Futures Contracts(a) | $21,308 | $0 |
| Total Equity Risk | 21,308 | 0 |
| Total Value of Derivatives | $21,308 | $0 |
(a) Reflects gross cumulative appreciation (depreciation) on futures contracts as presented in the Schedule of Investments. In the Statement of Assets and Liabilities, the period end daily variation margin is included in receivable or payable for daily variation margin on futures contracts, and the net cumulative appreciation (depreciation) is included in Total accumulated earnings (loss).
See accompanying notes which are an integral part of the financial statements.
VIP Extended Market Index Portfolio
Financial Statements
Statement of Assets and Liabilities
| | | June 30, 2020 (Unaudited) |
| Assets | | |
Investment in securities, at value (including securities loaned of $6,520,981) — See accompanying schedule:
Unaffiliated issuers (cost $75,937,702) | $68,118,373 | |
| Fidelity Central Funds (cost $8,051,774) | 8,051,774 | |
| Total Investment in Securities (cost $83,989,476) | | $76,170,147 |
| Segregated cash with brokers for derivative instruments | | 158,200 |
| Cash | | 90,068 |
| Foreign currency held at value (cost $92) | | 92 |
| Receivable for investments sold | | 9,142 |
| Receivable for fund shares sold | | 36,623 |
| Dividends receivable | | 66,190 |
| Distributions receivable from Fidelity Central Funds | | 11,311 |
| Receivable for daily variation margin on futures contracts | | 20,608 |
| Total assets | | 76,562,381 |
| Liabilities | | |
| Payable for investments purchased | $3,854 | |
| Payable for fund shares redeemed | 32 | |
| Accrued management fee | 4,087 | |
| Distribution and service plan fees payable | 476 | |
| Other affiliated payables | 3,503 | |
| Other payables and accrued expenses | 588 | |
| Collateral on securities loaned | 6,625,640 | |
| Total liabilities | | 6,638,180 |
| Net Assets | | $69,924,201 |
| Net Assets consist of: | | |
| Paid in capital | | $76,290,440 |
| Total accumulated earnings (loss) | | (6,366,239) |
| Net Assets | | $69,924,201 |
| Net Asset Value and Maximum Offering Price | | |
| Initial Class: | | |
| Net Asset Value, offering price and redemption price per share ($65,698,837 ÷ 6,969,354 shares) | | $9.43 |
| Service Class: | | |
| Net Asset Value, offering price and redemption price per share ($3,211,632 ÷ 341,024 shares) | | $9.42 |
| Service Class 2: | | |
| Net Asset Value, offering price and redemption price per share ($1,013,732 ÷ 107,621 shares) | | $9.42 |
See accompanying notes which are an integral part of the financial statements.
Statement of Operations
| | | Six months ended June 30, 2020 (Unaudited) |
| Investment Income | | |
| Dividends | | $518,967 |
| Interest | | 196 |
| Income from Fidelity Central Funds (including $28,803 from security lending) | | 33,971 |
| Total income | | 553,134 |
| Expenses | | |
| Management fee | $23,723 | |
| Transfer agent fees | 20,333 | |
| Distribution and service plan fees | 2,537 | |
| Independent trustees' fees and expenses | 215 | |
| Miscellaneous | 1,688 | |
| Total expenses before reductions | 48,496 | |
| Expense reductions | (710) | |
| Total expenses after reductions | | 47,786 |
| Net investment income (loss) | | 505,348 |
| Realized and Unrealized Gain (Loss) | | |
| Net realized gain (loss) on: | | |
| Investment securities: | | |
| Unaffiliated issuers | 1,743,347 | |
| Fidelity Central Funds | 342 | |
| Foreign currency transactions | (24) | |
| Futures contracts | (353,644) | |
| Total net realized gain (loss) | | 1,390,021 |
| Change in net unrealized appreciation (depreciation) on: | | |
| Investment securities: | | |
| Unaffiliated issuers | (12,366,353) | |
| Assets and liabilities in foreign currencies | (45) | |
| Futures contracts | 16,966 | |
| Total change in net unrealized appreciation (depreciation) | | (12,349,432) |
| Net gain (loss) | | (10,959,411) |
| Net increase (decrease) in net assets resulting from operations | | $(10,454,063) |
See accompanying notes which are an integral part of the financial statements.
Statement of Changes in Net Assets
| | Six months ended June 30, 2020 (Unaudited) | Year ended December 31, 2019 |
| Increase (Decrease) in Net Assets | | |
| Operations | | |
| Net investment income (loss) | $505,348 | $775,076 |
| Net realized gain (loss) | 1,390,021 | 548,251 |
| Change in net unrealized appreciation (depreciation) | (12,349,432) | 9,948,340 |
| Net increase (decrease) in net assets resulting from operations | (10,454,063) | 11,271,667 |
| Distributions to shareholders | – | (1,526,033) |
| Share transactions - net increase (decrease) | 4,059,113 | 35,348,921 |
| Total increase (decrease) in net assets | (6,394,950) | 45,094,555 |
| Net Assets | | |
| Beginning of period | 76,319,151 | 31,224,596 |
| End of period | $69,924,201 | $76,319,151 |
See accompanying notes which are an integral part of the financial statements.
Financial Highlights
VIP Extended Market Index Portfolio Initial Class
| | Six months ended (Unaudited) June 30, | Years endedDecember 31, | |
| | 2020 | 2019 | 2018 A |
| Selected Per–Share Data | | | |
| Net asset value, beginning of period | $10.87 | $8.82 | $10.00 |
| Income from Investment Operations | | | |
| Net investment income (loss)B | .07 | .15 | .11 |
| Net realized and unrealized gain (loss) | (1.51) | 2.13 | (1.21) |
| Total from investment operations | (1.44) | 2.28 | (1.10) |
| Distributions from net investment income | – | (.12) | (.08) |
| Distributions from net realized gain | – | (.11) | – |
| Total distributions | – | (.23) | (.08) |
| Net asset value, end of period | $9.43 | $10.87 | $8.82 |
| Total ReturnC,D,E | (13.25)% | 25.88% | (10.99)% |
| Ratios to Average Net AssetsF,G | | | |
| Expenses before reductions | .14%H | .13% | .13%H |
| Expenses net of fee waivers, if any | .14%H | .13% | .13%H |
| Expenses net of all reductions | .13%H | .13% | .13%H |
| Net investment income (loss) | 1.50%H | 1.47% | 1.57%H |
| Supplemental Data | | | |
| Net assets, end of period (000 omitted) | $65,699 | $73,052 | $30,342 |
| Portfolio turnover rateI | 39%H | 17% | 11%H |
A For the period April 17, 2018 (commencement of operations) to December 31, 2018.
B Calculated based on average shares outstanding during the period.
C Total returns for periods of less than one year are not annualized.
D Total returns do not reflect charges attributable to your insurance company's separate account. Inclusion of these charges would reduce the total returns shown.
E Total returns would have been lower if certain expenses had not been reduced during the applicable periods shown.
F Fees and expenses of any underlying Fidelity Central Funds are not included in the Fund's expense ratio. The Fund indirectly bears its proportionate share of the expenses of any underlying Fidelity Central Funds.
G Expense ratios reflect operating expenses of the class. Expenses before reductions do not reflect amounts reimbursed by the investment adviser or reductions from expense offset arrangements and do not represent the amount paid by the class during periods when reimbursements or reductions occur. Expenses net of fee waivers reflect expenses after reimbursement by the investment adviser but prior to reductions from expense offset arrangements. Expenses net of all reductions represent the net expenses paid by the class.
H Annualized
I Amount does not include the portfolio activity of any underlying Fidelity Central Funds.
See accompanying notes which are an integral part of the financial statements.
VIP Extended Market Index Portfolio Service Class
| | Six months ended (Unaudited) June 30, | Year endedDecember 31, |
| | 2020 | 2019 A |
| Selected Per–Share Data | | |
| Net asset value, beginning of period | $10.86 | $10.44 |
| Income from Investment Operations | | |
| Net investment income (loss)B | .06 | .12 |
| Net realized and unrealized gain (loss) | (1.50) | .53 |
| Total from investment operations | (1.44) | .65 |
| Distributions from net investment income | – | (.12) |
| Distributions from net realized gain | – | (.11) |
| Total distributions | – | (.23) |
| Net asset value, end of period | $9.42 | $10.86 |
| Total ReturnC,D,E | (13.26)% | 6.24% |
| Ratios to Average Net AssetsF,G | | |
| Expenses before reductions | .24%H | .23%H |
| Expenses net of fee waivers, if any | .24%H | .23%H |
| Expenses net of all reductions | .23%H | .23%H |
| Net investment income (loss) | 1.40%H | 1.58%H |
| Supplemental Data | | |
| Net assets, end of period (000 omitted) | $3,212 | $2,133 |
| Portfolio turnover rateI | 39%H | 17% |
A For the period April 11, 2019 (commencement of sale of shares) to December 31, 2019.
B Calculated based on average shares outstanding during the period.
C Total returns for periods of less than one year are not annualized.
D Total returns do not reflect charges attributable to your insurance company's separate account. Inclusion of these charges would reduce the total returns shown.
E Total returns would have been lower if certain expenses had not been reduced during the applicable periods shown.
F Fees and expenses of any underlying Fidelity Central Funds are not included in the Fund's expense ratio. The Fund indirectly bears its proportionate share of the expenses of any underlying Fidelity Central Funds.
G Expense ratios reflect operating expenses of the class. Expenses before reductions do not reflect amounts reimbursed by the investment adviser or reductions from expense offset arrangements and do not represent the amount paid by the class during periods when reimbursements or reductions occur. Expenses net of fee waivers reflect expenses after reimbursement by the investment adviser but prior to reductions from expense offset arrangements. Expenses net of all reductions represent the net expenses paid by the class.
H Annualized
I Amount does not include the portfolio activity of any underlying Fidelity Central Funds.
See accompanying notes which are an integral part of the financial statements.
VIP Extended Market Index Portfolio Service Class 2
| | Six months ended (Unaudited) June 30, | Years endedDecember 31, | |
| | 2020 | 2019 | 2018 A |
| Selected Per–Share Data | | | |
| Net asset value, beginning of period | $10.87 | $8.83 | $10.00 |
| Income from Investment Operations | | | |
| Net investment income (loss)B | .06 | .12 | .10 |
| Net realized and unrealized gain (loss) | (1.51) | 2.12 | (1.21) |
| Total from investment operations | (1.45) | 2.24 | (1.11) |
| Distributions from net investment income | – | (.10) | (.06) |
| Distributions from net realized gain | – | (.11) | – |
| Total distributions | – | (.20)C | (.06) |
| Net asset value, end of period | $9.42 | $10.87 | $8.83 |
| Total ReturnD,E,F | (13.34)% | 25.44% | (11.09)% |
| Ratios to Average Net AssetsG,H | | | |
| Expenses before reductions | .39%I | .38% | .38%I |
| Expenses net of fee waivers, if any | .39%I | .38% | .38%I |
| Expenses net of all reductions | .38%I | .38% | .38%I |
| Net investment income (loss) | 1.25%I | 1.22% | 1.32%I |
| Supplemental Data | | | |
| Net assets, end of period (000 omitted) | $1,014 | $1,134 | $883 |
| Portfolio turnover rateJ | 39%I | 17% | 11%I |
A For the period April 17, 2018 (commencement of operations) to December 31, 2018.
B Calculated based on average shares outstanding during the period.
C Total distributions of $.20 per share is comprised of distributions from net investment income of $.097 and distributions from net realized gain of $.105 per share.
D Total returns for periods of less than one year are not annualized.
E Total returns do not reflect charges attributable to your insurance company's separate account. Inclusion of these charges would reduce the total returns shown.
F Total returns would have been lower if certain expenses had not been reduced during the applicable periods shown.
G Fees and expenses of any underlying Fidelity Central Funds are not included in the Fund's expense ratio. The Fund indirectly bears its proportionate share of the expenses of any underlying Fidelity Central Funds.
H Expense ratios reflect operating expenses of the class. Expenses before reductions do not reflect amounts reimbursed by the investment adviser or reductions from expense offset arrangements and do not represent the amount paid by the class during periods when reimbursements or reductions occur. Expenses net of fee waivers reflect expenses after reimbursement by the investment adviser but prior to reductions from expense offset arrangements. Expenses net of all reductions represent the net expenses paid by the class.
I Annualized
J Amount does not include the portfolio activity of any underlying Fidelity Central Funds.
See accompanying notes which are an integral part of the financial statements.
VIP International Index Portfolio
Investment Summary (Unaudited)
Top Ten Stocks as of June 30, 2020
| | % of fund's net assets |
| Tencent Holdings Ltd. (Cayman Islands, Interactive Media & Services) | 1.7 |
| Alibaba Group Holding Ltd. sponsored ADR (Cayman Islands, Internet & Direct Marketing Retail) | 1.6 |
| Nestle SA (Reg. S) (Switzerland, Food Products) | 1.5 |
| Roche Holding AG (participation certificate) (Switzerland, Pharmaceuticals) | 1.1 |
| Samsung Electronics Co. Ltd. (Korea (South), Technology Hardware, Storage & Peripherals) | 1.0 |
| Novartis AG (Switzerland, Pharmaceuticals) | 1.0 |
| Taiwan Semiconductor Manufacturing Co. Ltd. (Taiwan, Semiconductors & Semiconductor Equipment) | 0.9 |
| Toyota Motor Corp. (Japan, Automobiles) | 0.8 |
| ASML Holding NV (Netherlands) (Netherlands, Semiconductors & Semiconductor Equipment) | 0.7 |
| SAP SE (Germany, Software) | 0.7 |
| | 11.0 |
Top Market Sectors as of June 30, 2020
| | % of fund's net assets |
| Financials | 19.0 |
| Industrials | 11.4 |
| Consumer Discretionary | 12.0 |
| Information Technology | 10.2 |
| Health Care | 10.2 |
| Consumer Staples | 9.1 |
| Communication Services | 7.9 |
| Materials | 6.8 |
| Energy | 4.2 |
| Utilities | 3.2 |
Geographic Diversification (% of fund's net assets)
| As of June 30, 2020 |
| | Japan | 17.9% |
| | United Kingdom | 8.6% |
| | Canada | 6.7% |
| | Cayman Islands | 6.5% |
| | Switzerland | 6.1% |
| | France | 5.7% |
| | Germany | 5.3% |
| | Australia | 4.4% |
| | United States of America* | 3.8% |
| | Other | 35.0% |
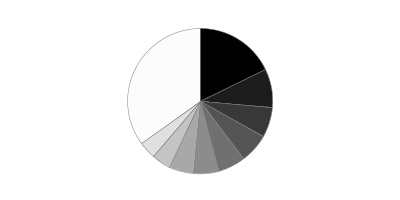
* Includes Short-Term investments and Net Other Assets (Liabilities).
Percentages are based on country or territory of incorporation and are adjusted for the effect of futures contracts, if applicable.
Asset Allocation as of June 30, 2020
| | % of fund's net assets |
| Stocks and Equity Futures | 99.8 |
| Short-Term Investments and Net Other Assets (Liabilities) | 0.2 |
VIP International Index Portfolio
Schedule of Investments June 30, 2020 (Unaudited)
Showing Percentage of Net Assets
| Common Stocks - 95.1% | | | |
| | | Shares | Value |
| Australia - 4.4% | | | |
| Afterpay Ltd. (a) | | 1,492 | $62,797 |
| AGL Energy Ltd. | | 3,945 | 46,418 |
| ALS Ltd. | | 3,231 | 14,627 |
| Altium Ltd. | | 844 | 18,918 |
| Alumina Ltd. | | 13,803 | 15,479 |
| AMP Ltd. (a) | | 21,426 | 27,428 |
| Ampol Ltd. | | 1,647 | 33,325 |
| Ansell Ltd. | | 763 | 19,324 |
| APA Group unit | | 7,786 | 59,803 |
| Aristocrat Leisure Ltd. | | 4,176 | 73,487 |
| ASX Ltd. | | 1,268 | 74,712 |
| Atlas Arteria Ltd. unit | | 6,395 | 29,215 |
| Aurizon Holdings Ltd. | | 12,294 | 41,742 |
| Australia & New Zealand Banking Group Ltd. | | 18,283 | 237,225 |
| Bank of Queensland Ltd. | | 3,217 | 13,698 |
| Beach Energy Ltd. | | 9,226 | 9,678 |
| Bendigo & Adelaide Bank Ltd. | | 3,412 | 16,506 |
| BHP Billiton Ltd. | | 18,979 | 472,537 |
| BlueScope Steel Ltd. | | 3,320 | 26,783 |
| Boral Ltd. | | 8,382 | 21,923 |
| Brambles Ltd. | | 9,812 | 73,604 |
| Carsales.com Ltd. | | 1,702 | 20,837 |
| Challenger Ltd. | | 6,006 | 18,278 |
| Charter Hall Group unit | | 2,994 | 20,021 |
| Coca-Cola Amatil Ltd. | | 3,545 | 21,353 |
| Cochlear Ltd. | | 427 | 55,673 |
| Coles Group Ltd. | | 7,702 | 91,261 |
| Commonwealth Bank of Australia | | 11,388 | 545,562 |
| Computershare Ltd. | | 3,184 | 29,114 |
| Crown Ltd. | | 2,002 | 13,360 |
| CSL Ltd. | | 2,930 | 580,312 |
| DEXUS Property Group unit | | 7,150 | 45,395 |
| Dominos Pizza Enterprises Ltd. | | 436 | 20,668 |
| Downer EDI Ltd. | | 3,334 | 10,077 |
| Evolution Mining Ltd. | | 11,389 | 44,564 |
| Fortescue Metals Group Ltd. | | 10,889 | 104,076 |
| Goodman Group unit | | 10,637 | 109,008 |
| Iluka Resources Ltd. | | 3,062 | 18,046 |
| Incitec Pivot Ltd. | | 11,614 | 15,028 |
| Insurance Australia Group Ltd. | | 14,503 | 57,749 |
| JB Hi-Fi Ltd. | | 778 | 23,103 |
| Lendlease Group unit | | 4,308 | 36,775 |
| Link Administration Holdings Ltd. | | 2,918 | 8,256 |
| Macquarie Group Ltd. | | 2,127 | 174,086 |
| Magellan Financial Group Ltd. | | 922 | 36,910 |
| Medibank Private Ltd. | | 17,305 | 35,707 |
| Mirvac Group unit | | 24,625 | 36,876 |
| National Australia Bank Ltd. | | 20,616 | 261,254 |
| Newcrest Mining Ltd. | | 5,623 | 124,685 |
| Northern Star Resources Ltd. | | 4,876 | 44,955 |
| Orica Ltd. | | 2,581 | 29,638 |
| Origin Energy Ltd. | | 11,019 | 44,409 |
| Orora Ltd. | | 5,455 | 9,562 |
| Qantas Airways Ltd. | | 9,437 | 24,617 |
| Qantas Airways Ltd. (a) | | 8,219 | 21,440 |
| QBE Insurance Group Ltd. | | 9,410 | 58,070 |
| Qube Holdings Ltd. | | 11,511 | 23,116 |
| Ramsay Health Care Ltd. | | 1,209 | 55,500 |
| realestate.com.au Ltd. | | 332 | 24,717 |
| Reliance Worldwide Corp. Ltd. | | 4,639 | 9,412 |
| Rio Tinto Ltd. | | 2,387 | 161,366 |
| Santos Ltd. | | 10,922 | 39,948 |
| Saracen Mineral Holdings Ltd. (a) | | 6,764 | 25,300 |
| Scentre Group unit | | 32,970 | 49,373 |
| SEEK Ltd. | | 2,195 | 33,158 |
| Sonic Healthcare Ltd. | | 3,084 | 64,763 |
| South32 Ltd. | | 31,750 | 44,949 |
| Spark Infrastructure Group unit | | 9,857 | 14,693 |
| Steadfast Group Ltd. | | 4,892 | 11,343 |
| Stockland Corp. Ltd. unit | | 15,083 | 34,453 |
| Suncorp Group Ltd. | | 8,266 | 52,651 |
| Sydney Airport unit | | 14,822 | 57,997 |
| Tabcorp Holdings Ltd. | | 12,836 | 29,940 |
| Telstra Corp. Ltd. | | 76,654 | 165,574 |
| The GPT Group unit | | 12,022 | 34,596 |
| The Star Entertainment Group Ltd. | | 4,681 | 9,174 |
| Transpacific Industries Group Ltd. | | 14,115 | 21,430 |
| Transurban Group unit | | 17,705 | 172,643 |
| Treasury Wine Estates Ltd. | | 4,535 | 32,798 |
| Vicinity Centres unit | | 38,976 | 38,463 |
| Wesfarmers Ltd. | | 7,230 | 223,676 |
| Westpac Banking Corp. | | 23,301 | 292,041 |
| WiseTech Global Ltd. | | 832 | 11,110 |
| Woodside Petroleum Ltd. | | 6,310 | 94,276 |
| Woolworths Group Ltd. | | 8,088 | 208,079 |
| WorleyParsons Ltd. | | 1,903 | 11,452 |
|
| TOTAL AUSTRALIA | | | 6,227,945 |
|
| Austria - 0.2% | | | |
| ams AG (a) | | 1,692 | 25,100 |
| Andritz AG | | 438 | 15,944 |
| BAWAG Group AG (b) | | 510 | 17,614 |
| BUWOG AG rights (a)(c) | | 115 | 0 |
| CA Immobilien Anlagen AG | | 433 | 14,424 |
| Erste Group Bank AG | | 1,902 | 44,768 |
| IMMOFINANZ Immobilien Anlagen AG (a) | | 514 | 8,778 |
| OMV AG (a) | | 924 | 30,894 |
| Raiffeisen International Bank-Holding AG | | 1,068 | 19,030 |
| S IMMO AG | | 289 | 5,182 |
| S&T AG (a) | | 266 | 6,814 |
| UNIQA Insurance Group AG | | 640 | 4,307 |
| Verbund AG | | 441 | 19,749 |
| Voestalpine AG | | 629 | 13,529 |
| Wienerberger AG (a) | | 871 | 18,974 |
|
| TOTAL AUSTRIA | | | 245,107 |
|
| Bailiwick of Jersey - 0.4% | | | |
| Experian PLC | | 5,917 | 207,680 |
| Ferguson PLC | | 1,523 | 124,530 |
| Glencore Xstrata PLC | | 71,602 | 152,527 |
| IWG PLC | | 4,566 | 14,993 |
| Polymetal International PLC | | 1,320 | 26,423 |
| WPP PLC | | 7,554 | 58,893 |
|
| TOTAL BAILIWICK OF JERSEY | | | 585,046 |
|
| Belgium - 0.6% | | | |
| Ackermans & Van Haaren SA | | 147 | 19,224 |
| Aedifica SA | | 173 | 18,912 |
| Aedifica SA (d) | | 140 | 390 |
| Ageas | | 1,249 | 44,259 |
| Anheuser-Busch InBev SA NV | | 5,473 | 269,799 |
| Barco NV | | 55 | 9,701 |
| Cofinimmo SA | | 162 | 22,278 |
| Elia System Operator SA/NV | | 209 | 22,683 |
| Galapagos Genomics NV (a) | | 334 | 65,924 |
| Groupe Bruxelles Lambert SA | | 549 | 46,063 |
| KBC Groep NV | | 2,215 | 127,065 |
| Proximus | | 923 | 18,811 |
| Sofina SA | | 99 | 26,138 |
| Solvay SA Class A | | 456 | 36,508 |
| UCB SA | | 817 | 94,635 |
| Umicore SA | | 1,290 | 60,893 |
| Warehouses de Pauw | | 772 | 21,076 |
|
| TOTAL BELGIUM | | | 904,359 |
|
| Bermuda - 0.3% | | | |
| Alibaba Health Information Technology Ltd. (a) | | 22,000 | 64,151 |
| Beijing Enterprises Water Group Ltd. | | 38,000 | 14,807 |
| Brilliance China Automotive Holdings Ltd. | | 18,000 | 16,118 |
| Cheung Kong Infrastructure Holdings Ltd. | | 4,500 | 23,166 |
| China Gas Holdings Ltd. | | 14,000 | 43,171 |
| China Resource Gas Group Ltd. | | 6,000 | 29,224 |
| Cosan Ltd. Class A | | 602 | 9,066 |
| Credicorp Ltd. (United States) | | 447 | 59,750 |
| Haier Electronics Group Co. Ltd. | | 8,000 | 24,205 |
| Hiscox Ltd. | | 2,080 | 20,325 |
| Hongkong Land Holdings Ltd. | | 7,315 | 30,211 |
| Jardine Matheson Holdings Ltd. | | 2,003 | 83,605 |
| Jardine Strategic Holdings Ltd. | | 1,081 | 23,296 |
| Kunlun Energy Co. Ltd. | | 26,000 | 16,840 |
| Shenzhen International Holdings Ltd. | | 3 | 5 |
|
| TOTAL BERMUDA | | | 457,940 |
|
| Brazil - 1.0% | | | |
| Ambev SA | | 29,000 | 75,405 |
| Atacadao Distribuicao Comercio e Industria Ltda | | 2,100 | 7,627 |
| B2W Companhia Global do Varejo (a) | | 1,371 | 26,988 |
| Banco Bradesco SA | | 9,892 | 34,489 |
| Banco do Brasil SA | | 7,400 | 43,749 |
| Banco Inter SA unit | | 800 | 6,061 |
| BB Seguridade Participacoes SA | | 4,400 | 22,064 |
| BM&F BOVESPA SA | | 13,400 | 135,747 |
| BR Malls Participacoes SA | | 5,100 | 9,453 |
| Brasil Foods SA (a) | | 4,700 | 18,374 |
| BTG Pactual Participations Ltd. unit | | 1,200 | 16,881 |
| CCR SA | | 7,300 | 19,465 |
| Centrais Eletricas Brasileiras SA (Electrobras) | | 2,086 | 11,891 |
| Cielo SA | | 7,200 | 6,117 |
| Companhia Brasileira de Distribuicao Grupo Pao de Acucar | | 900 | 11,747 |
| Companhia de Locacao das Americas | | 1,800 | 5,604 |
| Companhia de Saneamento Basico do Estado de Sao Paulo (SABESP) | | 2,300 | 24,404 |
| Companhia Siderurgica Nacional SA (CSN) | | 3,700 | 7,267 |
| Compania de Saneamento do Parana unit | | 1,500 | 8,691 |
| Cosan SA Industria e Comercio | | 900 | 11,737 |
| CPFL Energia SA | | 1,200 | 6,766 |
| Cyrela Brazil Realty SA | | 1,500 | 6,303 |
| Drogasil SA | | 1,600 | 32,547 |
| Embraer SA (a) | | 3,900 | 5,802 |
| Energisa SA unit | | 1,600 | 14,417 |
| ENGIE Brasil Energia SA | | 2,050 | 15,867 |
| Equatorial Energia SA | | 5,800 | 24,765 |
| Estacio Participacoes SA | | 1,500 | 9,282 |
| Hapvida Participacoes e Investimentos SA (b) | | 1,200 | 13,719 |
| Hypermarcas SA | | 2,600 | 15,921 |
| IRB Brasil Resseguros SA | | 2,500 | 5,057 |
| JBS SA | | 6,200 | 24,113 |
| Klabin SA unit | | 5,200 | 19,440 |
| Kroton Educacional SA | | 11,600 | 14,100 |
| Localiza Rent A Car SA | | 3,630 | 27,308 |
| Lojas Renner SA | | 4,970 | 38,202 |
| Magazine Luiza SA | | 4,355 | 57,380 |
| MPX Mineracao e Energia SA (a) | | 1,400 | 11,580 |
| Multiplan Empreendimentos Imobiliarios SA | | 1,700 | 6,408 |
| Natura & Co. Holding SA | | 4,700 | 34,484 |
| Natura & Co. Holding SA rights (a) | | 193 | 1,410 |
| Neoenergia SA | | 1,300 | 4,571 |
| Notre Dame Intermedica Participacoes SA (a) | | 2,800 | 35,017 |
| Petrobras Distribuidora SA | | 4,700 | 18,625 |
| Petroleo Brasileiro SA - Petrobras (ON) | | 16,600 | 68,194 |
| Qualicorp Consultoria E Corret | | 1,300 | 6,933 |
| Rumo SA (a) | | 6,700 | 27,709 |
| Sonae Sierra Brasil SA (a) | | 700 | 3,675 |
| Sul America SA unit | | 2,100 | 17,404 |
| Suzano Papel e Celulose SA (a) | | 3,300 | 22,325 |
| Terna Participacoes SA unit | | 2,700 | 13,952 |
| TIM Participacoes SA | | 4,800 | 12,534 |
| Totvs SA | | 2,700 | 11,494 |
| Ultrapar Participacoes SA | | 5,400 | 18,251 |
| Vale SA (a) | | 20,500 | 210,802 |
| Via Varejo SA (a) | | 5,151 | 14,502 |
| Weg SA | | 4,550 | 42,345 |
|
| TOTAL BRAZIL | | | 1,416,965 |
|
| Canada - 6.5% | | | |
| Agnico Eagle Mines Ltd. (Canada) | | 1,564 | 100,146 |
| Air Canada (a) | | 1,984 | 24,771 |
| Alamos Gold, Inc. | | 2,720 | 25,365 |
| Algonquin Power & Utilities Corp. | | 3,557 | 45,982 |
| Alimentation Couche-Tard, Inc. Class B (sub. vtg.) | | 5,547 | 173,936 |
| Allied Properties (REIT) | | 801 | 24,167 |
| AltaGas Ltd. | | 1,818 | 20,957 |
| ATCO Ltd. Class I (non-vtg.) | | 438 | 12,992 |
| B2Gold Corp. | | 6,486 | 36,883 |
| Bank of Montreal | | 4,152 | 220,996 |
| Bank of Nova Scotia | | 7,843 | 324,558 |
| Barrick Gold Corp. (Canada) | | 11,467 | 308,552 |
| Bausch Health Cos., Inc. (Canada) (a) | | 1,956 | 35,789 |
| BCE, Inc. | | 5,826 | 242,979 |
| BlackBerry Ltd. (a) | | 2,919 | 14,234 |
| Boyd Group Services, Inc. | | 133 | 19,796 |
| Brookfield Asset Management, Inc. (Canada) Class A | | 9,034 | 297,318 |
| CAE, Inc. | | 1,683 | 27,298 |
| Cameco Corp. | | 2,522 | 25,859 |
| Canadian Apartment Properties (REIT) unit | | 1,061 | 37,974 |
| Canadian Imperial Bank of Commerce | | 2,882 | 192,629 |
| Canadian National Railway Co. | | 4,565 | 403,876 |
| Canadian Natural Resources Ltd. | | 7,662 | 132,911 |
| Canadian Pacific Railway Ltd. | | 872 | 221,802 |
| Canadian Tire Ltd. Class A (non-vtg.) | | 365 | 31,628 |
| Canadian Utilities Ltd. Class A (non-vtg.) | | 798 | 19,868 |
| Capital Power Corp. | | 810 | 16,694 |
| CCL Industries, Inc. Class B | | 898 | 29,025 |
| Cenovus Energy, Inc. (Canada) | | 6,336 | 29,636 |
| CGI Group, Inc. Class A (sub. vtg.) (a) | | 1,476 | 92,989 |
| CI Financial Corp. | | 1,236 | 15,723 |
| Constellation Software, Inc. | | 128 | 144,527 |
| Descartes Systems Group, Inc. (Canada) (a) | | 546 | 28,824 |
| Dollarama, Inc. | | 1,924 | 64,001 |
| Element Financial Corp. | | 2,855 | 21,303 |
| Emera, Inc. | | 1,647 | 64,808 |
| Empire Co. Ltd. Class A (non-vtg.) | | 1,186 | 28,401 |
| Enbridge, Inc. | | 13,096 | 398,205 |
| Fairfax Financial Holdings Ltd. (sub. vtg.) | | 180 | 55,611 |
| Finning International, Inc. | | 1,101 | 15,011 |
| First Quantum Minerals Ltd. | | 4,384 | 34,940 |
| FirstService Corp. | | 224 | 22,563 |
| Fortis, Inc. | | 3,056 | 116,221 |
| Franco-Nevada Corp. | | 1,222 | 170,707 |
| George Weston Ltd. | | 443 | 32,452 |
| Gibson Energy, Inc. | | 1,082 | 16,841 |
| Gildan Activewear, Inc. | | 1,344 | 20,819 |
| Great-West Lifeco, Inc. | | 1,709 | 29,960 |
| Hydro One Ltd. (b) | | 2,082 | 39,153 |
| iA Financial Corp, Inc. | | 691 | 23,139 |
| IGM Financial, Inc. | | 467 | 11,348 |
| Imperial Oil Ltd. | | 1,471 | 23,664 |
| Intact Financial Corp. | | 927 | 88,228 |
| Inter Pipeline Ltd. | | 2,643 | 24,608 |
| Keyera Corp. | | 1,406 | 21,407 |
| Kinross Gold Corp. (a) | | 8,274 | 59,727 |
| Kirkland Lake Gold Ltd. | | 1,653 | 68,063 |
| Loblaw Companies Ltd. | | 1,100 | 53,566 |
| Lundin Mining Corp. | | 4,549 | 24,394 |
| Magna International, Inc. Class A (sub. vtg.) | | 1,868 | 83,190 |
| Manulife Financial Corp. | | 12,568 | 170,986 |
| Methanex Corp. | | 432 | 7,796 |
| Metro, Inc. Class A (sub. vtg.) | | 1,666 | 68,721 |
| National Bank of Canada | | 2,185 | 99,014 |
| Northland Power, Inc. | | 1,087 | 27,207 |
| Nutrien Ltd. | | 3,720 | 119,524 |
| Onex Corp. (sub. vtg.) | | 546 | 24,666 |
| Open Text Corp. | | 1,788 | 75,927 |
| Pan American Silver Corp. | | 1,298 | 39,446 |
| Parkland Corp. | | 937 | 23,266 |
| Pembina Pipeline Corp. | | 3,401 | 85,025 |
| Power Corp. of Canada (sub. vtg.) | | 3,751 | 65,980 |
| Quebecor, Inc. Class B (sub. vtg.) | | 1,141 | 24,516 |
| Restaurant Brands International, Inc. | | 1,966 | 107,003 |
| RioCan (REIT) | | 2,100 | 23,760 |
| Ritchie Bros. Auctioneers, Inc. | | 744 | 30,289 |
| Rogers Communications, Inc. Class B (non-vtg.) | | 2,291 | 92,055 |
| Royal Bank of Canada | | 9,172 | 622,299 |
| Saputo, Inc. | | 1,595 | 38,030 |
| Shaw Communications, Inc. Class B | | 3,046 | 49,675 |
| Shopify, Inc. Class A (a) | | 693 | 658,376 |
| SNC-Lavalin Group, Inc. | | 1,151 | 19,424 |
| Stantec, Inc. | | 716 | 22,103 |
| Sun Life Financial, Inc. | | 3,814 | 140,159 |
| Suncor Energy, Inc. | | 9,901 | 166,937 |
| TC Energy Corp. | | 6,083 | 259,881 |
| Teck Resources Ltd. Class B (sub. vtg.) | | 3,051 | 31,957 |
| TELUS Corp. | | 8,248 | 138,337 |
| TFI International, Inc. (Canada) | | 609 | 21,617 |
| The Toronto-Dominion Bank | | 11,640 | 519,496 |
| Thomson Reuters Corp. | | 1,112 | 75,553 |
| TMX Group Ltd. | | 316 | 31,244 |
| Toromont Industries Ltd. | | 535 | 26,549 |
| Waste Connection, Inc. (Canada) | | 1,706 | 159,831 |
| Wheaton Precious Metals Corp. | | 2,887 | 126,976 |
| WSP Global, Inc. | | 462 | 28,334 |
| Yamana Gold, Inc. | | 5,967 | 32,437 |
|
| TOTAL CANADA | | | 9,247,410 |
|
| Cayman Islands - 6.5% | | | |
| 58.com, Inc. ADR (a) | | 576 | 31,069 |
| AAC Technology Holdings, Inc. | | 4,500 | 27,608 |
| Airtac International Group | | 1,000 | 17,540 |
| Alibaba Group Holding Ltd. sponsored ADR (a) | | 10,205 | 2,201,219 |
| Anta Sports Products Ltd. | | 7,000 | 61,777 |
| ASM Pacific Technology Ltd. | | 1,800 | 18,893 |
| Autohome, Inc. ADR Class A | | 363 | 27,407 |
| Baidu.com, Inc. sponsored ADR (a) | | 1,773 | 212,565 |
| BeiGene Ltd. ADR (a) | | 160 | 30,144 |
| Bilibili, Inc. ADR (a)(e) | | 546 | 25,291 |
| Chailease Holding Co. Ltd. | | 8,465 | 35,967 |
| Cheung Kong Property Holdings Ltd. | | 16,500 | 98,355 |
| China Biologic Products Holdings, Inc. (a) | | 150 | 15,327 |
| China Conch Venture Holdings Ltd. | | 10,000 | 42,191 |
| China Mengniu Dairy Co. Ltd. | | 17,000 | 64,925 |
| China Resources Cement Holdings Ltd. | | 12,000 | 14,693 |
| China Resources Land Ltd. | | 18,000 | 68,163 |
| CIFI Holdings Group Co. Ltd. | | 20,597 | 16,051 |
| CK Hutchison Holdings Ltd. | | 17,500 | 112,444 |
| Country Garden Holdings Co. Ltd. | | 45,759 | 56,206 |
| Country Garden Services Holdings Co. Ltd. | | 7,000 | 32,514 |
| Ctrip.com International Ltd. ADR (a) | | 2,801 | 72,602 |
| ENN Energy Holdings Ltd. | | 4,900 | 55,129 |
| Evergrande Real Estate Group Ltd. | | 20,000 | 51,610 |
| GDS Holdings Ltd. ADR (a) | | 468 | 37,281 |
| Geely Automobile Holdings Ltd. | | 34,000 | 53,519 |
| Genscript Biotech Corp. (a) | | 6,000 | 12,340 |
| Hengan International Group Co. Ltd. | | 4,500 | 35,243 |
| Huazhu Group Ltd. ADR (e) | | 708 | 24,815 |
| Innovent Biologics, Inc. (a)(b) | | 5,500 | 40,804 |
| iQIYI, Inc. ADR (a)(e) | | 1,693 | 39,261 |
| JD.com, Inc. sponsored ADR (a) | | 5,691 | 342,484 |
| Kingdee International Software Group Co. Ltd. | | 15,000 | 34,875 |
| Kingsoft Corp. Ltd. | | 6,000 | 27,908 |
| Li Ning Co. Ltd. | | 13,500 | 42,849 |
| Logan Property Holdings Co. Ltd. | | 8,000 | 14,162 |
| Longfor Properties Co. Ltd. (b) | | 9,500 | 45,168 |
| Meituan Dianping Class B (a) | | 22,900 | 507,904 |
| Melco Crown Entertainment Ltd. sponsored ADR | | 1,358 | 21,076 |
| Minth Group Ltd. | | 4,000 | 11,380 |
| Momo, Inc. ADR | | 1,018 | 17,795 |
| NetEase, Inc. ADR | | 513 | 220,272 |
| New Oriental Education & Technology Group, Inc. sponsored ADR (a) | | 770 | 100,277 |
| NIO, Inc. sponsored ADR (a)(e) | | 5,248 | 40,515 |
| PagSeguro Digital Ltd. (a) | | 1,106 | 39,086 |
| Pinduoduo, Inc. ADR (a) | | 2,323 | 199,406 |
| Sands China Ltd. | | 15,200 | 59,619 |
| Sea Ltd. ADR (a) | | 1,563 | 167,616 |
| Semiconductor Manufacturing International Corp. (a) | | 21,000 | 73,667 |
| Shenzhou International Group Holdings Ltd. | | 4,700 | 56,639 |
| Shimao Property Holdings Ltd. | | 7,500 | 31,740 |
| Silergy Corp. | | 1,000 | 65,264 |
| Silicon Motion Technology Corp. sponsored ADR | | 217 | 10,583 |
| SINA Corp. (a) | | 338 | 12,138 |
| Sino Biopharmaceutical Ltd. | | 43,500 | 81,943 |
| StoneCo Ltd. Class A (a)(e) | | 694 | 26,899 |
| Sunac China Holdings Ltd. | | 16,000 | 66,989 |
| Sunny Optical Technology Group Co. Ltd. | | 4,700 | 75,195 |
| TAL Education Group ADR (a) | | 2,486 | 169,993 |
| Tencent Holdings Ltd. | | 36,900 | 2,364,461 |
| Tingyi (Cayman Islands) Holding Corp. | | 12,000 | 18,610 |
| Vipshop Holdings Ltd. ADR (a) | | 2,533 | 50,432 |
| Want Want China Holdings Ltd. | | 42,000 | 31,701 |
| Weibo Corp. sponsored ADR (a)(e) | | 380 | 12,768 |
| WH Group Ltd. (b) | | 57,500 | 49,261 |
| Wharf Real Estate Investment Co. Ltd. | | 7,000 | 33,417 |
| Wuxi Biologics (Cayman), Inc. (a)(b) | | 3,500 | 64,035 |
| Wynn Macau Ltd. | | 8,000 | 13,769 |
| Xiaomi Corp. Class B (a)(b) | | 85,200 | 141,148 |
| Xinyi Glass Holdings Ltd. | | 16,000 | 19,612 |
| Xinyi Solar Holdings Ltd. | | 22,286 | 21,106 |
| Yihai International Holding Ltd. | | 3,000 | 30,753 |
| YY, Inc. ADR (a) | | 369 | 32,675 |
| Zai Lab Ltd. ADR (a) | | 280 | 22,996 |
| Zhen Ding Technology Holding Ltd. | | 4,000 | 17,472 |
| ZTO Express (Cayman), Inc. sponsored ADR | | 2,766 | 101,540 |
|
| TOTAL CAYMAN ISLANDS | | | 9,222,151 |
|
| Chile - 0.1% | | | |
| Aguas Andinas SA | | 16,947 | 5,740 |
| Banco de Chile (a) | | 284,839 | 25,141 |
| Banco de Credito e Inversiones | | 513 | 17,425 |
| Banco Santander Chile | | 404,741 | 16,556 |
| Cencosud SA | | 7,919 | 11,087 |
| Cencosud Shopping SA | | 2,537 | 4,510 |
| Colbun SA | | 38,815 | 6,190 |
| Compania Cervecerias Unidas SA | | 873 | 6,287 |
| Compania de Petroleos de Chile SA (COPEC) | | 2,403 | 16,119 |
| Empresa Nacional de Telecomunicaciones SA (ENTEL) | | 1,016 | 6,556 |
| Empresas CMPC SA | | 6,874 | 13,658 |
| Enel Chile SA | | 164,238 | 12,277 |
| Enersis SA | | 227,835 | 34,394 |
| Parque Arauco SA | | 3,775 | 6,848 |
| S.A.C.I. Falabella | | 5,500 | 17,409 |
|
| TOTAL CHILE | | | 200,197 |
|
| China - 1.8% | | | |
| Agricultural Bank of China Ltd. (H Shares) | | 184,000 | 74,070 |
| Anhui Conch Cement Co. Ltd. (H Shares) | | 7,500 | 50,513 |
| Bank Communications Co. Ltd. (H Shares) | | 138,000 | 85,109 |
| Bank of China Ltd. (H Shares) | | 488,000 | 180,771 |
| BYD Co. Ltd. (H Shares) | | 4,000 | 30,888 |
| CGN Power Co. Ltd. (H Shares) (b) | | 69,000 | 14,244 |
| China CITIC Bank Corp. Ltd. (H Shares) | | 73,000 | 31,835 |
| China Communications Construction Co. Ltd. (H Shares) | | 29,000 | 16,351 |
| China Construction Bank Corp. (H Shares) | | 630,000 | 512,431 |
| China International Capital Corp. Ltd. (H Shares) (b) | | 9,200 | 18,066 |
| China Life Insurance Co. Ltd. (H Shares) | | 48,000 | 96,853 |
| China Merchants Bank Co. Ltd. (H Shares) | | 24,000 | 110,393 |
| China Minsheng Banking Corp. Ltd. (H Shares) | | 37,300 | 25,603 |
| China National Building Materials Co. Ltd. (H Shares) | | 24,000 | 25,547 |
| China Oilfield Services Ltd. (H Shares) | | 10,000 | 8,980 |
| China Pacific Insurance (Group) Co. Ltd. (H Shares) | | 17,200 | 45,938 |
| China Petroleum & Chemical Corp. (H Shares) | | 168,000 | 70,268 |
| China Railway Group Ltd. (H Shares) | | 22,000 | 11,297 |
| China Shenhua Energy Co. Ltd. (H Shares) | | 23,000 | 35,967 |
| China Telecom Corp. Ltd. (H Shares) | | 86,000 | 24,157 |
| China Tower Corp. Ltd. (H Shares) (b) | | 290,000 | 51,261 |
| China Vanke Co. Ltd. (H Shares) | | 9,900 | 31,295 |
| CITIC Securities Co. Ltd. (H Shares) | | 14,500 | 27,427 |
| CRRC Corp. Ltd. (H Shares) | | 26,000 | 10,970 |
| Great Wall Motor Co. Ltd. (H Shares) | | 18,000 | 11,241 |
| Guangzhou Automobile Group Co. Ltd. (H Shares) | | 16,800 | 12,117 |
| Haitong Securities Co. Ltd. (H Shares) | | 17,200 | 13,892 |
| Huatai Securities Co. Ltd. (H Shares) (b) | | 9,200 | 14,648 |
| Industrial & Commercial Bank of China Ltd. (H Shares) | | 498,000 | 301,075 |
| New China Life Insurance Co. Ltd. (H Shares) | | 5,300 | 17,745 |
| People's Insurance Co. of China Group Ltd. (H Shares) | | 47,000 | 13,705 |
| PetroChina Co. Ltd. (H Shares) | | 132,000 | 43,770 |
| PICC Property & Casualty Co. Ltd. (H Shares) | | 42,000 | 34,627 |
| Ping An Insurance Group Co. of China Ltd. (H Shares) | | 34,500 | 343,930 |
| Postal Savings Bank of China Co. Ltd. (H Shares) (b) | | 63,000 | 36,172 |
| Shandong Weigao Medical Polymer Co. Ltd. (H Shares) | | 16,000 | 35,590 |
| Sinopharm Group Co. Ltd. (H Shares) | | 8,800 | 22,527 |
| Tsingtao Brewery Co. Ltd. (H Shares) | | 2,000 | 14,838 |
| Weichai Power Co. Ltd. (H Shares) | | 12,000 | 22,357 |
| WuXi AppTec Co. Ltd. (H Shares) (b) | | 1,260 | 16,371 |
| Zijin Mining Group Co. Ltd. (H Shares) | | 32,000 | 14,905 |
| ZTE Corp. (H Shares) | | 4,200 | 12,843 |
|
| TOTAL CHINA | | | 2,572,587 |
|
| Colombia - 0.0% | | | |
| Bancolombia SA | | 1,323 | 8,449 |
| Grupo de Inversiones Suramerica SA | | 1,458 | 7,232 |
| Interconexion Electrica SA ESP | | 2,762 | 13,817 |
| Inversiones Argos SA | | 1,848 | 4,868 |
|
| TOTAL COLOMBIA | | | 34,366 |
|
| Czech Republic - 0.0% | | | |
| Ceske Energeticke Zavody A/S | | 986 | 21,031 |
| Komercni Banka A/S (a) | | 594 | 13,796 |
| MONETA Money Bank A/S (b) | | 2,409 | 5,433 |
|
| TOTAL CZECH REPUBLIC | | | 40,260 |
|
| Denmark - 1.4% | | | |
| A.P. Moller - Maersk A/S: | | | |
| Series A | | 21 | 22,797 |
| Series B | | 43 | 50,396 |
| Ambu A/S Series B | | 1,071 | 33,652 |
| Ascendis Pharma A/S sponsored ADR (a) | | 229 | 33,869 |
| Carlsberg A/S Series B | | 654 | 86,437 |
| Christian Hansen Holding A/S | | 673 | 69,406 |
| Coloplast A/S Series B | | 755 | 117,021 |
| Danske Bank A/S (a) | | 4,497 | 59,856 |
| DSV A/S | | 1,290 | 157,504 |
| Genmab A/S (a) | | 421 | 140,915 |
| GN Store Nord A/S | | 957 | 50,992 |
| ISS Holdings A/S | | 1,121 | 17,747 |
| Novo Nordisk A/S Series B | | 10,405 | 677,862 |
| Novozymes A/S Series B | | 1,322 | 76,440 |
| ORSTED A/S (b) | | 1,075 | 124,057 |
| Pandora A/S | | 624 | 33,898 |
| Royal Unibrew A/S | | 276 | 22,962 |
| SimCorp A/S | | 260 | 28,029 |
| Tryg A/S | | 767 | 22,203 |
| Vestas Wind Systems A/S | | 1,296 | 132,714 |
|
| TOTAL DENMARK | | | 1,958,757 |
|
| Egypt - 0.0% | | | |
| Commercial International Bank SAE | | 9,113 | 36,644 |
| Faroe Islands - 0.0% | | | |
| Bakkafrost (a) | | 334 | 21,011 |
| Finland - 0.8% | | | |
| Elisa Corp. (A Shares) | | 987 | 60,036 |
| Fortum Corp. | | 2,890 | 54,889 |
| Huhtamaki Oyj | | 602 | 23,699 |
| Kesko Oyj | | 1,706 | 29,172 |
| Kone OYJ (B Shares) | | 2,594 | 178,417 |
| Metso Corp. | | 799 | 26,185 |
| Neste Oyj | | 2,793 | 109,232 |
| Nokia Corp. | | 36,359 | 158,843 |
| Nokian Tyres PLC | | 931 | 20,438 |
| Nordea Bank ABP (Stockholm Stock Exchange) | | 20,948 | 145,281 |
| Orion Oyj (B Shares) | | 649 | 31,397 |
| Sampo Oyj (A Shares) | | 3,219 | 110,958 |
| Stora Enso Oyj (R Shares) | | 3,779 | 45,132 |
| UPM-Kymmene Corp. | | 3,428 | 99,057 |
| Wartsila Corp. | | 3,103 | 25,652 |
|
| TOTAL FINLAND | | | 1,118,388 |
|
| France - 5.7% | | | |
| Accor SA (a) | | 1,135 | 30,872 |
| Air Liquide SA | | 3,029 | 437,954 |
| Alstom SA | | 1,279 | 59,603 |
| Arkema SA | | 446 | 42,662 |
| Atos Origin SA (a) | | 639 | 54,490 |
| AXA SA | | 12,510 | 263,247 |
| BNP Paribas SA | | 7,395 | 295,460 |
| Bouygues SA | | 1,684 | 57,535 |
| Bureau Veritas SA | | 1,921 | 40,532 |
| Capgemini SA | | 1,035 | 118,550 |
| Carrefour SA | | 3,855 | 59,574 |
| Compagnie de St. Gobain | | 3,554 | 128,232 |
| Credit Agricole SA (a) | | 8,288 | 78,700 |
| Danone SA | | 4,149 | 287,995 |
| Dassault Systemes SA | | 881 | 152,034 |
| Edenred SA | | 1,535 | 67,138 |
| Eiffage SA (a) | | 548 | 50,116 |
| ENGIE (a) | | 12,002 | 148,327 |
| Essilor International SA | | 1,884 | 242,298 |
| Gecina SA | | 342 | 42,266 |
| Groupe Eurotunnel SA (a) | | 2,707 | 39,050 |
| Hermes International SCA | | 222 | 185,516 |
| Ingenico SA | | 415 | 66,208 |
| Kering SA | | 478 | 261,332 |
| Klepierre SA | | 1,308 | 26,062 |
| L'Oreal SA | | 1,578 | 509,294 |
| Legrand SA | | 1,713 | 130,158 |
| LVMH Moet Hennessy Louis Vuitton SE | | 1,732 | 764,670 |
| Michelin CGDE Series B | | 1,174 | 121,795 |
| Orange SA | | 12,375 | 147,980 |
| Orpea | | 315 | 36,417 |
| Pernod Ricard SA | | 1,403 | 220,757 |
| Peugeot Citroen SA | | 3,748 | 60,974 |
| Publicis Groupe SA | | 1,475 | 47,915 |
| Renault SA | | 1,294 | 32,827 |
| Safran SA (a) | | 2,125 | 213,757 |
| Sanofi SA | | 7,391 | 753,769 |
| Schneider Electric SA | | 3,558 | 395,780 |
| Societe Generale Series A | | 5,252 | 87,329 |
| Sodexo SA | | 538 | 36,387 |
| SR Teleperformance SA | | 379 | 96,190 |
| Suez Environnement SA | | 2,611 | 30,611 |
| Thales SA | | 683 | 55,157 |
| Total SA | | 15,956 | 609,055 |
| Total SA rights (a)(d) | | 15,956 | 12,190 |
| Valeo SA | | 1,486 | 39,000 |
| Veolia Environnement SA | | 3,698 | 83,505 |
| VINCI SA | | 3,287 | 304,782 |
| VINCI SA rights (a)(d) | | 3,124 | 4,387 |
| Vivendi SA | | 5,182 | 133,901 |
|
| TOTAL FRANCE | | | 8,164,340 |
|
| Germany - 5.0% | | | |
| adidas AG | | 1,190 | 313,746 |
| Allianz SE | | 2,687 | 548,705 |
| BASF AG | | 5,942 | 333,758 |
| Bayer AG | | 6,340 | 469,943 |
| Bayerische Motoren Werke AG (BMW) | | 2,071 | 132,207 |
| Bechtle AG | | 170 | 29,986 |
| Beiersdorf AG | | 639 | 72,663 |
| Brenntag AG | | 1,020 | 54,081 |
| Carl Zeiss Meditec AG | | 236 | 23,015 |
| Commerzbank AG | | 6,285 | 28,012 |
| Continental AG | | 713 | 70,096 |
| Covestro AG (b) | | 1,155 | 43,925 |
| Daimler AG (Germany) | | 5,752 | 233,582 |
| Delivery Hero AG (a)(b) | | 892 | 91,157 |
| Deutsche Bank AG (a) | | 13,367 | 127,111 |
| Deutsche Borse AG | | 1,220 | 220,746 |
| Deutsche Post AG | | 6,216 | 228,251 |
| Deutsche Telekom AG | | 20,790 | 348,840 |
| Deutsche Wohnen AG (Bearer) | | 2,306 | 103,502 |
| E.ON AG | | 14,166 | 159,901 |
| Evonik Industries AG | | 1,068 | 27,130 |
| Fresenius Medical Care AG & Co. KGaA | | 1,374 | 118,205 |
| Fresenius SE & Co. KGaA | | 2,666 | 132,150 |
| GEA Group AG | | 1,018 | 32,196 |
| Hannover Reuck SE | | 399 | 68,766 |
| HeidelbergCement AG | | 988 | 52,889 |
| Henkel AG & Co. KGaA | | 631 | 52,790 |
| Infineon Technologies AG | | 8,440 | 197,768 |
| KION Group AG | | 418 | 25,735 |
| Knorr-Bremse AG | | 304 | 30,818 |
| Lanxess AG | | 525 | 27,699 |
| LEG Immobilien AG | | 444 | 56,368 |
| Merck KGaA | | 867 | 100,622 |
| MTU Aero Engines Holdings AG | | 347 | 60,096 |
| Muenchener Rueckversicherungs-Gesellschaft AG in Muenchen | | 902 | 234,876 |
| OSRAM Licht AG (a) | | 201 | 9,575 |
| OSRAM Licht AG (a) | | 449 | 20,582 |
| Puma AG | | 571 | 44,149 |
| Rheinmetall AG | | 279 | 24,199 |
| RWE AG | | 3,736 | 130,581 |
| SAP SE | | 6,963 | 973,354 |
| Scout24 AG (b) | | 674 | 52,287 |
| Siemens AG | | 5,203 | 613,627 |
| Symrise AG | | 818 | 95,581 |
| Thyssenkrupp AG (a) | | 2,644 | 18,756 |
| TUI AG (GB) | | 2,878 | 13,583 |
| Uniper SE | | 1,130 | 36,436 |
| Vonovia SE | | 3,478 | 213,273 |
| Zalando SE (a)(b) | | 865 | 61,011 |
|
| TOTAL GERMANY | | | 7,158,329 |
|
| Greece - 0.1% | | | |
| Alpha Bank AE (a) | | 7,169 | 5,332 |
| EFG Eurobank Ergasias SA (a) | | 13,641 | 6,253 |
| Greek Organization of Football Prognostics SA | | 1,607 | 15,247 |
| Hellenic Telecommunications Organization SA | | 1,663 | 22,439 |
| Jumbo SA | | 603 | 10,840 |
| Lamda Development SA (a) | | 320 | 2,146 |
| Motor Oil (HELLAS) Corinth Refineries SA | | 375 | 5,195 |
| Mytilineos SA | | 696 | 5,693 |
| National Bank of Greece SA (a) | | 3,139 | 4,401 |
| Piraeus Bank SA (a) | | 1,781 | 3,142 |
|
| TOTAL GREECE | | | 80,688 |
|
| Hong Kong - 2.1% | | | |
| AIA Group Ltd. | | 77,600 | 726,150 |
| Bank of East Asia Ltd. | | 9,403 | 21,474 |
| Beijing Enterprises Holdings Ltd. | | 3,000 | 10,025 |
| BOC Hong Kong (Holdings) Ltd. | | 22,500 | 71,560 |
| China Everbright International Ltd. | | 20,222 | 10,671 |
| China Jinmao Holdings Group Ltd. | | 28,000 | 19,689 |
| China Merchants Holdings International Co. Ltd. | | 8,000 | 9,455 |
| China Mobile Ltd. | | 35,500 | 239,698 |
| China Overseas Land and Investment Ltd. | | 24,500 | 74,127 |
| China Resources Beer Holdings Co. Ltd. | | 8,000 | 44,591 |
| China Resources Power Holdings Co. Ltd. | | 10,000 | 11,754 |
| China Taiping Insurance Group Ltd. | | 8,600 | 13,781 |
| China Unicom Ltd. | | 42,000 | 22,852 |
| CLP Holdings Ltd. | | 11,000 | 108,034 |
| CNOOC Ltd. | | 104,000 | 116,722 |
| CSPC Pharmaceutical Group Ltd. | | 40,000 | 75,556 |
| Far East Horizon Ltd. | | 18,000 | 15,282 |
| Fosun International Ltd. | | 16,000 | 20,355 |
| Galaxy Entertainment Group Ltd. | | 17,000 | 115,702 |
| Guangdong Investment Ltd. | | 18,000 | 30,888 |
| Hang Lung Properties Ltd. | | 11,000 | 26,058 |
| Hang Seng Bank Ltd. | | 4,500 | 75,537 |
| Henderson Land Development Co. Ltd. | | 10,610 | 40,247 |
| Hong Kong & China Gas Co. Ltd. | | 66,527 | 103,394 |
| Hong Kong Exchanges and Clearing Ltd. | | 7,643 | 325,423 |
| Lenovo Group Ltd. | | 40,000 | 22,141 |
| Link (REIT) | | 12,900 | 105,440 |
| MTR Corp. Ltd. | | 9,611 | 49,788 |
| New World Development Co. Ltd. | | 9,250 | 43,920 |
| Power Assets Holdings Ltd. | | 8,500 | 46,226 |
| Sino Land Ltd. | | 18,292 | 23,011 |
| Sun Art Retail Group Ltd. | | 15,000 | 25,624 |
| Sun Hung Kai Properties Ltd. | | 9,500 | 121,365 |
| Swire Pacific Ltd. (A Shares) | | 3,000 | 15,944 |
| Swire Properties Ltd. | | 7,000 | 17,774 |
| Techtronic Industries Co. Ltd. | | 11,000 | 107,580 |
| Vitasoy International Holdings Ltd. | | 6,000 | 22,953 |
|
| TOTAL HONG KONG | | | 2,930,791 |
|
| Hungary - 0.1% | | | |
| MOL Hungarian Oil and Gas PLC Series A (For. Reg.) | | 3,482 | 20,526 |
| OTP Bank PLC | | 1,462 | 51,117 |
| Richter Gedeon PLC | | 926 | 19,156 |
|
| TOTAL HUNGARY | | | 90,799 |
|
| India - 2.1% | | | |
| Adani Ports & Special Economic Zone Ltd. | | 4,616 | 21,013 |
| Asian Paints Ltd. | | 2,976 | 66,475 |
| Avenue Supermarts Ltd. (a)(b) | | 728 | 22,330 |
| Axis Bank Ltd. | | 14,882 | 80,108 |
| Bajaj Finance Ltd. | | 1,621 | 60,746 |
| Bajaj Finserv Ltd. | | 386 | 29,866 |
| Bharat Petroleum Corp. Ltd. | | 5,453 | 26,996 |
| Bharti Airtel Ltd. (a) | | 15,511 | 114,949 |
| HDFC Bank Ltd. | | 27,385 | 384,700 |
| HDFC Standard Life Insurance Co. Ltd. (a)(b) | | 3,212 | 23,342 |
| Hindustan Unilever Ltd. | | 5,753 | 166,014 |
| Housing Development Finance Corp. Ltd. | | 11,127 | 258,442 |
| ICICI Bank Ltd. | | 41,612 | 193,895 |
| IndusInd Bank Ltd. | | 3,957 | 24,870 |
| Infosys Ltd. | | 24,142 | 234,549 |
| ITC Ltd. | | 55,311 | 142,515 |
| JSW Steel Ltd. | | 5,826 | 14,603 |
| Kotak Mahindra Bank Ltd. | | 7,948 | 143,131 |
| Larsen & Toubro Ltd. | | 8,032 | 100,330 |
| Maruti Suzuki India Ltd. | | 867 | 67,004 |
| Power Grid Corp. of India Ltd. | | 14,609 | 33,813 |
| Reliance Industries Ltd. | | 20,419 | 460,600 |
| Reliance Industries Ltd. (a) | | 1,244 | 13,134 |
| State Bank of India (a) | | 23,679 | 55,934 |
| Sun Pharmaceutical Industries Ltd. | | 6,761 | 42,327 |
| Tata Consultancy Services Ltd. | | 6,791 | 187,172 |
| Titan Co. Ltd. | | 2,610 | 32,816 |
| Ultratech Cemco Ltd. | | 703 | 36,232 |
|
| TOTAL INDIA | | | 3,037,906 |
|
| Indonesia - 0.4% | | | |
| Mitra Keluarga Karyasehat Tbk PT | | 30,200 | 4,799 |
| PT ACE Hardware Indonesia Tbk | | 45,800 | 4,841 |
| PT Adaro Energy Tbk | | 82,400 | 5,739 |
| PT Astra International Tbk | | 128,700 | 43,245 |
| PT Bank Central Asia Tbk | | 73,800 | 147,109 |
| PT Bank Mandiri (Persero) Tbk | | 118,100 | 41,008 |
| PT Bank Negara Indonesia (Persero) Tbk | | 43,400 | 13,915 |
| PT Bank Rakyat Indonesia Tbk | | 351,300 | 74,983 |
| PT Bank Tabungan Pensiunan Nasional Syariah Tbk | | 12,500 | 2,783 |
| PT Barito Pacific Tbk (a) | | 145,600 | 11,823 |
| PT Charoen Pokphand Indonesia Tbk | | 47,600 | 18,577 |
| PT Gudang Garam Tbk | | 2,500 | 8,256 |
| PT Indah Kiat Pulp & Paper Tbk | | 13,000 | 5,438 |
| PT Indocement Tunggal Prakarsa Tbk | | 11,100 | 9,169 |
| PT Indofood CBP Sukses Makmur Tbk | | 12,900 | 8,443 |
| PT Indofood Sukses Makmur Tbk | | 27,300 | 12,470 |
| PT Jasa Marga Tbk | | 10,800 | 3,327 |
| PT Kalbe Farma Tbk | | 120,500 | 12,316 |
| PT Perusahaan Gas Negara Tbk Series B | | 56,300 | 4,473 |
| PT Semen Gresik (Persero) Tbk | | 17,500 | 11,791 |
| PT Telekomunikasi Indonesia Tbk Series B | | 324,600 | 69,306 |
| PT Tower Bersama Infrastructure Tbk | | 55,200 | 4,270 |
| PT United Tractors Tbk | | 9,000 | 10,427 |
|
| TOTAL INDONESIA | | | 528,508 |
|
| Ireland - 0.6% | | | |
| Bank Ireland Group PLC | | 5,153 | 10,566 |
| CRH PLC | | 5,070 | 174,511 |
| DCC PLC (United Kingdom) | | 623 | 51,953 |
| Grafton Group PLC unit | | 1,274 | 10,419 |
| ICON PLC (a) | | 350 | 58,961 |
| James Hardie Industries PLC CDI | | 2,931 | 55,664 |
| Kerry Group PLC Class A | | 963 | 119,337 |
| Kingspan Group PLC (Ireland) | | 994 | 64,046 |
| Paddy Power Betfair PLC | | 389 | 51,069 |
| Paddy Power Betfair PLC (Ireland) | | 515 | 67,696 |
| Ryanair Holdings PLC sponsored ADR (a) | | 1,312 | 87,038 |
| Smurfit Kappa Group PLC | | 1,507 | 50,387 |
| United Drug PLC (United Kingdom) | | 1,509 | 13,425 |
|
| TOTAL IRELAND | | | 815,072 |
|
| Isle of Man - 0.0% | | | |
| Gaming VC Holdings SA | | 3,569 | 32,752 |
| NEPI Rockcastle PLC | | 2,824 | 14,445 |
|
| TOTAL ISLE OF MAN | | | 47,197 |
|
| Israel - 0.4% | | | |
| Airport City Ltd. (a) | | 429 | 4,598 |
| Alony Hetz Properties & Investments Ltd. | | 764 | 7,572 |
| Amot Investments Ltd. | | 870 | 3,941 |
| Azrieli Group | | 213 | 9,636 |
| Bank Hapoalim BM (Reg.) | | 7,757 | 46,086 |
| Bank Leumi le-Israel BM | | 10,050 | 50,222 |
| Bezeq The Israel Telecommunication Corp. Ltd. (a) | | 11,986 | 10,865 |
| Check Point Software Technologies Ltd. (a) | | 728 | 78,209 |
| CyberArk Software Ltd. (a) | | 245 | 24,321 |
| Elbit Systems Ltd. (Israel) | | 165 | 22,578 |
| First International Bank of Israel | | 322 | 6,795 |
| Gazit-Globe Ltd. | | 462 | 2,175 |
| Icl Group Ltd. | | 4,176 | 12,369 |
| Isracard Ltd. | | 308 | 699 |
| Israel Discount Bank Ltd. (Class A) | | 8,216 | 24,905 |
| Kornit Digital Ltd. (a)(e) | | 231 | 12,331 |
| Melisron Ltd. | | 112 | 4,187 |
| Mizrahi Tefahot Bank Ltd. | | 779 | 14,532 |
| NICE Systems Ltd. (a) | | 408 | 75,959 |
| Paz Oil Co. Ltd. | | 51 | 4,049 |
| Plus500 Ltd. | | 716 | 11,671 |
| Radware Ltd. (a) | | 234 | 5,520 |
| Reit 1 Ltd. | | 988 | 3,605 |
| Shikun & Binui Ltd. | | 1,210 | 4,297 |
| Shufersal Ltd. | | 987 | 6,437 |
| Strauss Group Ltd. | | 276 | 7,643 |
| Teva Pharmaceutical Industries Ltd. sponsored ADR (a) | | 7,105 | 87,605 |
| Tower Semiconductor Ltd. (a) | | 606 | 11,557 |
| Wix.com Ltd. (a) | | 304 | 77,891 |
|
| TOTAL ISRAEL | | | 632,255 |
|
| Italy - 1.2% | | | |
| A2A SpA | | 10,458 | 14,810 |
| Amplifon SpA | | 471 | 12,547 |
| Assicurazioni Generali SpA | | 7,938 | 120,130 |
| Astm SpA (a) | | 415 | 9,484 |
| Atlantia SpA (a) | | 3,151 | 50,968 |
| Azimut Holding SpA | | 628 | 10,732 |
| Banca Mediolanum S.p.A. | | 1,396 | 10,022 |
| Banco BPM SpA | | 8,867 | 13,230 |
| Davide Campari-Milano SpA | | 2,852 | 24,032 |
| Enel SpA | | 49,685 | 429,698 |
| Eni SpA | | 16,537 | 158,524 |
| FinecoBank SpA | | 3,075 | 41,509 |
| Hera SpA | | 5,603 | 21,063 |
| Infrastrutture Wireless Italiane SpA (b) | | 1,747 | 17,508 |
| Interpump Group SpA | | 515 | 15,298 |
| Intesa Sanpaolo SpA | | 101,932 | 195,882 |
| Italgas SpA | | 3,053 | 17,733 |
| Leonardo SpA | | 2,883 | 19,110 |
| Mediobanca SpA | | 4,345 | 31,377 |
| Moncler SpA | | 1,240 | 47,422 |
| Nexi SpA (a)(b) | | 1,598 | 27,648 |
| Pirelli & C. SpA (b) | | 2,431 | 10,310 |
| Poste Italiane SpA (b) | | 2,889 | 25,122 |
| Prysmian SpA | | 1,670 | 38,688 |
| Recordati SpA | | 642 | 32,061 |
| Saipem SpA | | 3,316 | 8,267 |
| Snam Rete Gas SpA | | 13,593 | 66,188 |
| Telecom Italia SpA | | 73,047 | 28,805 |
| Terna SpA | | 9,241 | 63,519 |
| UniCredit SpA | | 13,727 | 126,278 |
| Unione di Banche Italiane SCpA | | 7,047 | 23,039 |
| Unipol Gruppo SpA | | 2,895 | 11,260 |
|
| TOTAL ITALY | | | 1,722,264 |
|
| Japan - 17.9% | | | |
| ABC-MART, Inc. | | 200 | 11,688 |
| ACOM Co. Ltd. | | 2,600 | 9,897 |
| Activia Properties, Inc. | | 4 | 13,762 |
| Advance Residence Investment Corp. | | 9 | 26,798 |
| Advantest Corp. | | 1,300 | 74,192 |
| Aeon (REIT) Investment Corp. | | 9 | 9,536 |
| AEON Co. Ltd. | | 5,600 | 130,281 |
| AEON MALL Co. Ltd. | | 600 | 7,946 |
| Agc, Inc. | | 1,500 | 43,004 |
| Aica Kogyo Co. Ltd. | | 400 | 13,096 |
| Ain Holdings, Inc. | | 200 | 13,077 |
| Air Water, Inc. | | 1,400 | 19,721 |
| Aisin Seiki Co. Ltd. | | 1,200 | 34,897 |
| Ajinomoto Co., Inc. | | 3,600 | 59,742 |
| Alfresa Holdings Corp. | | 1,300 | 27,102 |
| Alps Electric Co. Ltd. | | 1,300 | 16,756 |
| Amada Co. Ltd. | | 2,600 | 21,288 |
| Amano Corp. | | 400 | 8,287 |
| Ana Holdings, Inc. | | 2,300 | 52,562 |
| Anritsu Corp. | | 800 | 18,938 |
| Aozora Bank Ltd. | | 700 | 12,206 |
| Asahi Group Holdings | | 3,000 | 105,367 |
| ASAHI INTECC Co. Ltd. | | 1,700 | 48,257 |
| Asahi Kasei Corp. | | 9,200 | 75,309 |
| Asics Corp. | | 1,100 | 12,490 |
| Astellas Pharma, Inc. | | 11,400 | 190,375 |
| Azbil Corp. | | 800 | 24,339 |
| Bandai Namco Holdings, Inc. | | 1,400 | 73,693 |
| Bank of Kyoto Ltd. | | 500 | 17,689 |
| Benesse Holdings, Inc. | | 500 | 13,383 |
| Bic Camera, Inc. | | 1,000 | 10,577 |
| Bridgestone Corp. | | 4,000 | 129,102 |
| Brother Industries Ltd. | | 1,600 | 28,777 |
| Calbee, Inc. | | 700 | 19,339 |
| Canon, Inc. | | 7,000 | 139,636 |
| Capcom Co. Ltd. | | 500 | 18,152 |
| Casio Computer Co. Ltd. | | 1,600 | 27,913 |
| Central Japan Railway Co. | | 1,300 | 201,056 |
| Chiba Bank Ltd. | | 4,900 | 23,166 |
| Chubu Electric Power Co., Inc. | | 4,500 | 56,439 |
| Chugai Pharmaceutical Co. Ltd. | | 4,200 | 224,868 |
| Chugoku Electric Power Co., Inc. | | 2,000 | 26,691 |
| Coca-Cola West Co. Ltd. | | 1,100 | 19,906 |
| Comforia Residential REIT, Inc. | | 4 | 11,929 |
| COMSYS Holdings Corp. | | 800 | 23,724 |
| Concordia Financial Group Ltd. | | 7,800 | 25,077 |
| Cosmos Pharmaceutical Corp. | | 200 | 30,637 |
| Credit Saison Co. Ltd. | | 900 | 10,341 |
| CyberAgent, Inc. | | 700 | 34,408 |
| Dai Nippon Printing Co. Ltd. | | 1,900 | 43,682 |
| Dai-ichi Mutual Life Insurance Co. | | 7,800 | 93,366 |
| Daicel Chemical Industries Ltd. | | 2,000 | 15,430 |
| Daifuku Co. Ltd. | | 800 | 69,794 |
| Daiichi Sankyo Kabushiki Kaisha | | 3,900 | 318,987 |
| Daiichikosho Co. Ltd. | | 300 | 8,960 |
| Daikin Industries Ltd. | | 1,900 | 307,420 |
| Dainippon Sumitomo Pharma Co. Ltd. | | 1,000 | 13,858 |
| Daito Trust Construction Co. Ltd. | | 500 | 45,886 |
| Daiwa House Industry Co. Ltd. | | 4,400 | 103,906 |
| Daiwa House REIT Investment Corp. | | 12 | 28,229 |
| Daiwa Office Investment Corp. | | 2 | 11,058 |
| Daiwa Securities Group, Inc. | | 10,500 | 44,109 |
| Denki Kagaku Kogyo KK | | 500 | 12,255 |
| DENSO Corp. | | 3,400 | 133,338 |
| Dentsu Group, Inc. | | 1,700 | 40,327 |
| Dic Corp. | | 500 | 12,585 |
| Disco Corp. | | 181 | 43,735 |
| Dmg Mori Co. Ltd. | | 700 | 8,473 |
| Dowa Holdings Co. Ltd. | | 400 | 12,141 |
| East Japan Railway Co. | | 2,400 | 166,309 |
| Ebara Corp. | | 500 | 11,799 |
| Eisai Co. Ltd. | | 1,900 | 150,953 |
| Electric Power Development Co. Ltd. | | 1,196 | 22,652 |
| Ezaki Glico Co. Ltd. | | 400 | 19,041 |
| FamilyMart Co. Ltd. | | 1,550 | 26,610 |
| Fancl Corp. | | 500 | 14,795 |
| Fanuc Corp. | | 1,300 | 233,051 |
| Fast Retailing Co. Ltd. | | 400 | 229,909 |
| Frontier Real Estate Investment Corp. | | 3 | 9,461 |
| Fuji Electric Co. Ltd. | | 1,100 | 30,276 |
| Fujifilm Holdings Corp. | | 2,700 | 115,565 |
| Fujitsu Ltd. | | 1,200 | 140,500 |
| Fukuoka Financial Group, Inc. | | 1,300 | 20,554 |
| Glory Ltd. | | 400 | 9,076 |
| GLP J-REIT | | 24 | 34,786 |
| GMO Payment Gateway, Inc. | | 300 | 31,229 |
| GOLDWIN, Inc. | | 200 | 13,040 |
| Hakuhodo DY Holdings, Inc. | | 1,900 | 22,541 |
| Hamamatsu Photonics K.K. | | 900 | 38,926 |
| Hankyu Hanshin Holdings, Inc. | | 1,600 | 54,013 |
| Harmonic Drive Systems, Inc. | | 300 | 16,420 |
| Haseko Corp. | | 1,700 | 21,465 |
| Hikari Tsushin, Inc. | | 100 | 22,737 |
| Hino Motors Ltd. | | 1,600 | 10,855 |
| Hirose Electric Co. Ltd. | | 200 | 21,894 |
| Hisamitsu Pharmaceutical Co., Inc. | | 600 | 32,285 |
| Hitachi Construction Machinery Co. Ltd. | | 700 | 19,445 |
| Hitachi Ltd. | | 6,300 | 200,244 |
| Hitachi Metals Ltd. | | 1,400 | 16,635 |
| Honda Motor Co. Ltd. | | 11,700 | 299,446 |
| Horiba Ltd. | | 300 | 15,781 |
| Hoshizaki Corp. | | 400 | 34,230 |
| House Foods Group, Inc. | | 500 | 16,115 |
| Hoya Corp. | | 2,400 | 228,053 |
| Hulic (REIT), Inc. | | 7 | 8,687 |
| Hulic Co. Ltd. | | 3,400 | 31,867 |
| Ibiden Co. Ltd. | | 800 | 23,302 |
| Idemitsu Kosan Co. Ltd. | | 1,687 | 36,004 |
| IHI Corp. | | 900 | 13,058 |
| Iida Group Holdings Co. Ltd. | | 1,200 | 18,349 |
| Industrial & Infrastructure Fund Investment Corp. | | 12 | 19,293 |
| INPEX Corp. | | 6,700 | 41,837 |
| Invesco Office J-REIT, Inc. | | 51 | 6,594 |
| Invincible Investment Corp. | | 35 | 9,008 |
| Isetan Mitsukoshi Holdings Ltd. | | 2,600 | 14,963 |
| Isuzu Motors Ltd. | | 3,900 | 35,441 |
| IT Holdings Corp. | | 1,600 | 33,697 |
| ITO EN Ltd. | | 400 | 22,524 |
| Itochu Corp. | | 10,100 | 218,542 |
| ITOCHU Techno-Solutions Corp. | | 600 | 22,450 |
| J. Front Retailing Co. Ltd. | | 1,600 | 10,704 |
| Japan Airlines Co. Ltd. | | 2,100 | 37,896 |
| Japan Airport Terminal Co. Ltd. | | 500 | 21,255 |
| Japan Excellent, Inc. | | 7 | 8,117 |
| Japan Exchange Group, Inc. | | 3,500 | 80,778 |
| Japan Hotel REIT Investment Corp. | | 27 | 11,128 |
| Japan Logistics Fund, Inc. | | 6 | 16,270 |
| Japan Post Holdings Co. Ltd. | | 9,700 | 69,226 |
| Japan Prime Realty Investment Corp. | | 6 | 17,560 |
| Japan Real Estate Investment Corp. | | 9 | 46,094 |
| Japan Retail Fund Investment Corp. | | 17 | 21,176 |
| Japan Tobacco, Inc. | | 7,100 | 131,867 |
| JFE Holdings, Inc. | | 3,600 | 26,026 |
| JGC Corp. | | 1,900 | 20,035 |
| JSR Corp. | | 1,200 | 23,116 |
| JTEKT Corp. | | 1,400 | 10,931 |
| JX Holdings, Inc. | | 21,200 | 75,569 |
| K's Holdings Corp. | | 1,500 | 20,394 |
| Kagome Co. Ltd. | | 500 | 14,934 |
| Kajima Corp. | | 3,100 | 37,066 |
| Kakaku.com, Inc. | | 800 | 20,220 |
| Kaken Pharmaceutical Co. Ltd. | | 300 | 15,309 |
| Kamigumi Co. Ltd. | | 700 | 13,705 |
| Kaneka Corp. | | 400 | 10,373 |
| Kansai Electric Power Co., Inc. | | 5,500 | 53,295 |
| Kansai Paint Co. Ltd. | | 1,600 | 33,682 |
| Kao Corp. | | 3,100 | 246,009 |
| Kawasaki Heavy Industries Ltd. | | 1,000 | 14,444 |
| KDDI Corp. | | 10,100 | 301,355 |
| Keihan Electric Railway Co., Ltd. | | 700 | 31,151 |
| Keihin Electric Express Railway Co. Ltd. | | 1,800 | 27,523 |
| Keio Corp. | | 800 | 45,784 |
| Keisei Electric Railway Co. | | 1,100 | 34,474 |
| Kenedix Office Investment Corp. | | 3 | 16,698 |
| Kewpie Corp. | | 700 | 13,193 |
| Keyence Corp. | | 1,200 | 500,449 |
| Kikkoman Corp. | | 1,300 | 62,787 |
| Kinden Corp. | | 1,000 | 16,476 |
| Kintetsu Group Holdings Co. Ltd. | | 1,200 | 53,846 |
| Kirin Holdings Co. Ltd. | | 5,900 | 124,371 |
| Kobayashi Pharmaceutical Co. Ltd. | | 400 | 35,119 |
| Kobe Bussan Co. Ltd. | | 400 | 22,524 |
| Koito Manufacturing Co. Ltd. | | 800 | 32,156 |
| Komatsu Ltd. | | 6,300 | 129,027 |
| Konami Holdings Corp. | | 700 | 23,358 |
| Konica Minolta, Inc. | | 4,000 | 13,911 |
| Kose Corp. | | 200 | 24,006 |
| Kubota Corp. | | 7,500 | 112,191 |
| Kuraray Co. Ltd. | | 2,500 | 26,162 |
| Kurita Water Industries Ltd. | | 700 | 19,391 |
| Kyocera Corp. | | 2,300 | 125,545 |
| Kyowa Exeo Corp. | | 700 | 16,694 |
| Kyowa Hakko Kirin Co., Ltd. | | 1,600 | 42,120 |
| Kyushu Electric Power Co., Inc. | | 3,000 | 25,145 |
| Kyushu Financial Group, Inc. | | 2,700 | 11,378 |
| Kyushu Railway Co. | | 1,000 | 25,923 |
| LaSalle Logiport REIT | | 8 | 12,314 |
| Lasertec Corp. | | 500 | 47,048 |
| Lawson, Inc. | | 300 | 15,031 |
| LINE Corp. (a) | | 400 | 20,079 |
| Lion Corp. | | 2,000 | 47,919 |
| LIXIL Group Corp. | | 1,900 | 26,501 |
| M3, Inc. | | 2,700 | 114,699 |
| Mabuchi Motor Co. Ltd. | | 400 | 12,707 |
| Maeda Road Construction Co. Ltd. | | 400 | 7,528 |
| Makita Corp. | | 1,800 | 65,265 |
| Mani, Inc. | | 400 | 10,539 |
| Marubeni Corp. | | 11,700 | 53,146 |
| Marui Group Co. Ltd. | | 1,499 | 27,116 |
| Maruichi Steel Tube Ltd. | | 500 | 12,406 |
| Matsumotokiyoshi Holdings Co. Ltd. | | 600 | 21,755 |
| Mazda Motor Corp. | | 3,800 | 22,959 |
| McDonald's Holdings Co. (Japan) Ltd. | | 400 | 21,561 |
| MCUBS MidCity Investment Corp. | | 10 | 7,242 |
| Mebuki Financial Group, Inc. | | 6,800 | 15,744 |
| Medipal Holdings Corp. | | 1,500 | 28,840 |
| Meiji Holdings Co. Ltd. | | 1,000 | 79,576 |
| Mercari, Inc. (a) | | 600 | 18,504 |
| Minebea Mitsumi, Inc. | | 2,800 | 51,037 |
| Misumi Group, Inc. | | 1,900 | 47,405 |
| Mitsubishi Chemical Holdings Corp. | | 9,500 | 55,401 |
| Mitsubishi Corp. | | 9,600 | 202,865 |
| Mitsubishi Electric Corp. | | 13,800 | 180,246 |
| Mitsubishi Estate Co. Ltd. | | 9,100 | 135,607 |
| Mitsubishi Gas Chemical Co., Inc. | | 1,400 | 21,135 |
| Mitsubishi Heavy Industries Ltd. | | 2,300 | 54,303 |
| Mitsubishi Logistics Corp. | | 500 | 12,905 |
| Mitsubishi Materials Corp. | | 900 | 19,004 |
| Mitsubishi Motors Corp. of Japan | | 4,600 | 11,401 |
| Mitsubishi UFJ Financial Group, Inc. | | 83,300 | 327,829 |
| Mitsubishi UFJ Lease & Finance Co. Ltd. | | 3,200 | 15,115 |
| Mitsui & Co. Ltd. | | 11,100 | 164,465 |
| Mitsui Chemicals, Inc. | | 1,200 | 25,099 |
| Mitsui Fudosan Co. Ltd. | | 6,400 | 113,694 |
| Mitsui Fudosan Logistics Park, Inc. | | 3 | 13,350 |
| Mitsui OSK Lines Ltd. | | 700 | 12,455 |
| Miura Co. Ltd. | | 700 | 29,076 |
| Mizuho Financial Group, Inc. | | 163,200 | 200,743 |
| MonotaRO Co. Ltd. | | 900 | 36,008 |
| Mori Hills REIT Investment Corp. | | 9 | 11,353 |
| Morinaga & Co. Ltd. | | 300 | 11,628 |
| Morinaga Milk Industry Co. Ltd. | | 300 | 13,309 |
| MS&AD Insurance Group Holdings, Inc. | | 3,200 | 88,124 |
| Murata Manufacturing Co. Ltd. | | 4,100 | 241,689 |
| Nabtesco Corp. | | 800 | 24,598 |
| Nagoya Railroad Co. Ltd. | | 1,300 | 36,661 |
| Nankai Electric Railway Co. Ltd. | | 700 | 15,987 |
| NEC Corp. | | 1,700 | 81,678 |
| New Hampshire Foods Ltd. | | 690 | 27,766 |
| Nexon Co. Ltd. | | 2,900 | 65,453 |
| NGK Insulators Ltd. | | 1,800 | 24,940 |
| NGK Spark Plug Co. Ltd. | | 1,300 | 18,589 |
| NHK Spring Co. Ltd. | | 1,800 | 11,636 |
| Nichirei Corp. | | 800 | 23,312 |
| Nidec Corp. | | 3,500 | 235,791 |
| Nifco, Inc. | | 600 | 12,775 |
| Nihon Kohden Corp. | | 600 | 20,144 |
| Nihon M&A Center, Inc. | | 900 | 40,593 |
| Nihon Unisys Ltd. | | 500 | 15,582 |
| Nikon Corp. | | 2,600 | 21,836 |
| Nintendo Co. Ltd. | | 800 | 357,655 |
| Nippon Accommodations Fund, Inc. | | 3 | 17,337 |
| Nippon Building Fund, Inc. | | 9 | 51,179 |
| Nippon Express Co. Ltd. | | 600 | 31,112 |
| Nippon Kayaku Co. Ltd. | | 1,000 | 10,461 |
| Nippon Paint Holdings Co. Ltd. | | 1,300 | 94,392 |
| Nippon REIT Investment Corp. | | 3 | 9,641 |
| Nippon Shinyaku Co. Ltd. | | 400 | 32,489 |
| Nippon Shokubai Co. Ltd. | | 200 | 10,447 |
| Nippon Steel & Sumitomo Metal Corp. | | 6,200 | 58,587 |
| Nippon Suisan Kaisha Co. Ltd. | | 1,900 | 8,270 |
| Nippon Telegraph & Telephone Corp. | | 15,800 | 368,131 |
| Nippon Yusen KK | | 1,000 | 14,153 |
| Nishi-Nippon Railroad Co. Ltd. | | 500 | 13,559 |
| Nissan Chemical Corp. | | 1,000 | 51,449 |
| Nissan Motor Co. Ltd. | | 16,000 | 59,335 |
| Nisshin Seifun Group, Inc. | | 1,700 | 25,384 |
| Nissin Food Holdings Co. Ltd. | | 500 | 44,223 |
| Nitori Holdings Co. Ltd. | | 500 | 97,824 |
| Nitto Denko Corp. | | 1,000 | 56,690 |
| NKSJ Holdings, Inc. | | 2,400 | 82,621 |
| NOF Corp. | | 500 | 17,273 |
| Nomura Holdings, Inc. | | 21,400 | 96,163 |
| Nomura Real Estate Holdings, Inc. | | 700 | 12,966 |
| Nomura Real Estate Master Fund, Inc. | | 31 | 37,151 |
| Nomura Research Institute Ltd. | | 2,500 | 67,770 |
| NSK Ltd. | | 3,400 | 25,373 |
| NTT Data Corp. | | 4,200 | 46,958 |
| NTT DOCOMO, Inc. | | 7,400 | 196,455 |
| Obayashi Corp. | | 4,500 | 42,307 |
| OBIC Co. Ltd. | | 400 | 69,905 |
| Odakyu Electric Railway Co. Ltd. | | 2,300 | 56,483 |
| Oji Holdings Corp. | | 6,300 | 29,392 |
| Olympus Corp. | | 8,400 | 161,721 |
| OMRON Corp. | | 1,300 | 87,072 |
| Ono Pharmaceutical Co. Ltd. | | 3,200 | 92,970 |
| Oracle Corp. Japan | | 200 | 23,561 |
| Oriental Land Co. Ltd. | | 1,500 | 197,824 |
| ORIX Corp. | | 8,600 | 106,788 |
| ORIX JREIT, Inc. | | 18 | 23,572 |
| Osaka Gas Co. Ltd. | | 2,600 | 51,394 |
| Otsuka Corp. | | 700 | 36,823 |
| Otsuka Holdings Co. Ltd. | | 3,600 | 156,895 |
| Pan Pacific International Hold | | 3,900 | 85,567 |
| Panasonic Corp. | | 15,200 | 133,290 |
| Park24 Co. Ltd. | | 700 | 11,961 |
| Penta-Ocean Construction Co. Ltd. | | 1,600 | 8,580 |
| PeptiDream, Inc. (a) | | 600 | 27,451 |
| Persol Holdings Co., Ltd. | | 1,100 | 15,078 |
| Pigeon Corp. | | 800 | 30,896 |
| Pola Orbis Holdings, Inc. | | 500 | 8,687 |
| Premier Investment Corp. | | 7 | 7,760 |
| Rakuten, Inc. | | 5,100 | 45,048 |
| Recruit Holdings Co. Ltd. | | 10,300 | 354,219 |
| Relo Group, Inc. | | 700 | 13,147 |
| Renesas Electronics Corp. (a) | | 6,400 | 32,659 |
| Rengo Co. Ltd. | | 1,400 | 11,384 |
| Resona Holdings, Inc. | | 14,500 | 49,617 |
| Ricoh Co. Ltd. | | 4,600 | 33,008 |
| Rinnai Corp. | | 300 | 25,006 |
| ROHM Co. Ltd. | | 600 | 39,676 |
| Rohto Pharmaceutical Co. Ltd. | | 700 | 22,172 |
| Ryohin Keikaku Co. Ltd. | | 1,700 | 24,010 |
| Sankyo Co. Ltd. (Gunma) | | 2 | 48 |
| Sankyu, Inc. | | 400 | 15,003 |
| Santen Pharmaceutical Co. Ltd. | | 2,500 | 45,913 |
| Sanwa Holdings Corp. | | 1,400 | 12,473 |
| Sapporo Holdings Ltd. | | 500 | 9,402 |
| Sawai Pharmaceutical Co. Ltd. | | 300 | 15,392 |
| SBI Holdings, Inc. Japan | | 1,400 | 30,185 |
| Screen Holdings Co. Ltd. | | 300 | 14,094 |
| SCSK Corp. | | 300 | 14,559 |
| Secom Co. Ltd. | | 1,400 | 122,840 |
| Sega Sammy Holdings, Inc. | | 1,300 | 15,531 |
| Seibu Holdings, Inc. | | 1,800 | 19,521 |
| Seiko Epson Corp. | | 2,000 | 22,911 |
| Seino Holdings Co. Ltd. | | 1,100 | 14,364 |
| Sekisui Chemical Co. Ltd. | | 2,900 | 41,415 |
| Sekisui House (REIT), Inc. | | 23 | 14,740 |
| Sekisui House Ltd. | | 4,200 | 80,187 |
| Seven & i Holdings Co. Ltd. | | 5,100 | 166,839 |
| Seven Bank Ltd. | | 5,500 | 15,027 |
| SG Holdings Co. Ltd. | | 1,600 | 52,160 |
| Sharp Corp. | | 1,600 | 16,982 |
| Shikoku Electric Power Co., Inc. | | 1,200 | 8,835 |
| Shimadzu Corp. | | 1,700 | 45,155 |
| Shimamura Co. Ltd. | | 200 | 13,522 |
| SHIMANO, Inc. | | 600 | 115,373 |
| SHIMIZU Corp. | | 4,500 | 37,071 |
| Shin-Etsu Chemical Co. Ltd. | | 2,500 | 293,404 |
| Shinsei Bank Ltd. | | 1,200 | 14,514 |
| Shionogi & Co. Ltd. | | 1,900 | 119,193 |
| Ship Healthcare Holdings, Inc. | | 300 | 12,461 |
| Shiseido Co. Ltd. | | 2,600 | 165,674 |
| Shizuoka Bank Ltd. | | 3,689 | 23,731 |
| SHO-BOND Holdings Co. Ltd. | | 300 | 13,267 |
| Shochiku Co. Ltd. | | 100 | 13,753 |
| Showa Denko K.K. | | 900 | 20,314 |
| Skylark Co. Ltd. | | 1,300 | 20,600 |
| SMC Corp. | | 480 | 245,301 |
| SoftBank Corp. | | 10,400 | 132,438 |
| SoftBank Group Corp. | | 10,700 | 539,576 |
| Sohgo Security Services Co., Ltd. | | 600 | 27,895 |
| Sojitz Corp. | | 9,200 | 20,108 |
| Sony Corp. | | 8,100 | 559,144 |
| Sony Financial Holdings, Inc. | | 1,100 | 26,559 |
| Sotetsu Holdings, Inc. | | 600 | 15,993 |
| Square Enix Holdings Co. Ltd. | | 600 | 30,229 |
| Stanley Electric Co. Ltd. | | 1,100 | 26,437 |
| Subaru Corp. | | 4,200 | 87,947 |
| Sugi Holdings Co. Ltd. | | 300 | 20,282 |
| Sumco Corp. | | 1,500 | 23,061 |
| Sumitomo Chemical Co. Ltd. | | 10,400 | 31,292 |
| Sumitomo Corp. | | 8,200 | 94,312 |
| Sumitomo Electric Industries Ltd. | | 5,300 | 61,139 |
| Sumitomo Forestry Co. Ltd. | | 1,000 | 12,531 |
| Sumitomo Heavy Industries Ltd. | | 900 | 19,684 |
| Sumitomo Metal Mining Co. Ltd. | | 1,700 | 47,889 |
| Sumitomo Mitsui Financial Group, Inc. | | 8,900 | 251,174 |
| Sumitomo Mitsui Trust Holdings, Inc. | | 2,500 | 70,451 |
| Sumitomo Realty & Development Co. Ltd. | | 3,100 | 85,568 |
| Sumitomo Rubber Industries Ltd. | | 1,100 | 10,819 |
| Sundrug Co. Ltd. | | 400 | 13,225 |
| Suntory Beverage & Food Ltd. | | 800 | 31,155 |
| Suzuken Co. Ltd. | | 500 | 18,615 |
| Suzuki Motor Corp. | | 3,000 | 102,438 |
| Sysmex Corp. | | 1,100 | 83,843 |
| T&D Holdings, Inc. | | 3,700 | 31,780 |
| Taiheiyo Cement Corp. | | 800 | 18,587 |
| Taisei Corp. | | 1,400 | 51,025 |
| Taisho Pharmaceutical Holdings Co. Ltd. | | 400 | 24,450 |
| Taiyo Nippon Sanso Corp. | | 1,400 | 23,352 |
| Taiyo Yuden Co. Ltd. | | 800 | 25,016 |
| Takara Holdings, Inc. | | 1,200 | 10,740 |
| Takashimaya Co. Ltd. | | 1,400 | 11,723 |
| Takeda Pharmaceutical Co. Ltd. | | 10,238 | 367,831 |
| TDK Corp. | | 828 | 82,429 |
| TechnoPro Holdings, Inc. | | 200 | 11,392 |
| Teijin Ltd. | | 1,300 | 20,698 |
| Terumo Corp. | | 4,470 | 170,141 |
| The Chugoku Bank Ltd. | | 1,200 | 11,091 |
| The Hachijuni Bank Ltd. | | 3,200 | 12,121 |
| THK Co. Ltd. | | 800 | 19,738 |
| Tobu Railway Co. Ltd. | | 1,300 | 42,951 |
| Toho Co. Ltd. | | 900 | 32,509 |
| Toho Gas Co. Ltd. | | 600 | 30,007 |
| Tohoku Electric Power Co., Inc. | | 3,130 | 29,742 |
| Tokai Carbon Co. Ltd. | | 1,200 | 11,340 |
| Tokio Marine Holdings, Inc. | | 4,500 | 196,979 |
| Tokuyama Corp. | | 400 | 9,464 |
| Tokyo Century Corp. | | 400 | 20,412 |
| Tokyo Electric Power Co., Inc. (a) | | 6,100 | 18,765 |
| Tokyo Electron Ltd. | | 1,000 | 246,744 |
| Tokyo Gas Co. Ltd. | | 2,600 | 62,256 |
| Tokyo Tatemono Co. Ltd. | | 1,400 | 16,114 |
| Tokyu Corp. | | 3,800 | 53,498 |
| Tokyu Fudosan Holdings Corp. | | 3,900 | 18,347 |
| Tokyu REIT, Inc. | | 5 | 6,812 |
| Toppan Printing Co. Ltd. | | 2,200 | 36,782 |
| Toray Industries, Inc. | | 11,100 | 52,392 |
| Toshiba Corp. | | 2,800 | 89,076 |
| Tosoh Corp. | | 2,200 | 30,221 |
| Toto Ltd. | | 1,000 | 38,448 |
| Toyo Seikan Group Holdings Ltd. | | 900 | 10,150 |
| Toyo Suisan Kaisha Ltd. | | 700 | 39,092 |
| Toyo Tire Corp. | | 800 | 10,677 |
| Toyota Industries Corp. | | 1,300 | 68,747 |
| Toyota Motor Corp. | | 16,800 | 1,056,453 |
| Toyota Tsusho Corp. | | 1,500 | 38,252 |
| Trend Micro, Inc. | | 800 | 44,708 |
| Tsumura & Co. | | 400 | 10,447 |
| Tsuruha Holdings, Inc. | | 200 | 27,506 |
| Ube Industries Ltd. | | 600 | 10,341 |
| Unicharm Corp. | | 2,800 | 114,619 |
| United Urban Investment Corp. | | 22 | 23,594 |
| Ushio, Inc. | | 700 | 9,303 |
| USS Co. Ltd. | | 1,500 | 23,936 |
| Welcia Holdings Co. Ltd. | | 400 | 32,193 |
| West Japan Railway Co. | | 1,300 | 72,916 |
| Workman Co. Ltd. | | 200 | 17,541 |
| Yahoo! Japan Corp. | | 17,300 | 84,904 |
| Yakult Honsha Co. Ltd. | | 1,100 | 64,691 |
| Yamada Denki Co. Ltd. | | 4,600 | 22,792 |
| Yamaha Corp. | | 1,100 | 51,882 |
| Yamaha Motor Co. Ltd. | | 2,000 | 31,500 |
| Yamato Holdings Co. Ltd. | | 2,700 | 58,610 |
| Yamazaki Baking Co. Ltd. | | 1,100 | 18,908 |
| Yaskawa Electric Corp. | | 1,800 | 62,574 |
| Yokogawa Electric Corp. | | 1,700 | 26,637 |
| Yokohama Rubber Co. Ltd. | | 800 | 11,312 |
| Zenkoku Hosho Co. Ltd. | | 300 | 11,253 |
| Zensho Holdings Co. Ltd. | | 600 | 12,092 |
| Zeon Corp. | | 1,200 | 11,014 |
| Zozo, Inc. | | 1,200 | 26,628 |
|
| TOTAL JAPAN | | | 25,499,038 |
|
| Korea (South) - 3.2% | | | |
| Alteogen, Inc. (a) | | 78 | 17,465 |
| AMOREPACIFIC Corp. | | 179 | 25,101 |
| AMOREPACIFIC Group, Inc. | | 194 | 8,421 |
| BGF Retail Co. Ltd. | | 55 | 6,392 |
| BS Financial Group, Inc. | | 1,634 | 6,881 |
| Bukwang Pharmaceutical Co. Ltd. | | 10 | 284 |
| Celltrion Healthcare Co. Ltd. | | 507 | 46,080 |
| Celltrion Pharm, Inc. | | 3 | 320 |
| Celltrion, Inc. (a) | | 698 | 179,094 |
| Cheil Industries, Inc. | | 585 | 57,050 |
| Cheil Worldwide, Inc. | | 768 | 10,627 |
| CJ CheilJedang Corp. | | 47 | 12,865 |
| CJ Corp. | | 71 | 5,143 |
| CJ O Shopping Co. Ltd. | | 63 | 5,854 |
| Com2uS Corp. | | 59 | 5,802 |
| Coway Co. Ltd. | | 361 | 21,879 |
| Daelim Industrial Co. | | 181 | 12,482 |
| Daewoo Engineering & Construction Co. Ltd. (a) | | 1,245 | 3,582 |
| Daewoo Shipbuilding & Marine Engineering Co. Ltd. (a) | | 264 | 6,030 |
| Db Insurance Co. Ltd. | | 287 | 10,319 |
| DGB Financial Group Co. Ltd. | | 2,016 | 8,691 |
| Dongbu HiTek Co. Ltd. | | 196 | 4,763 |
| Doosan Bobcat, Inc. | | 350 | 7,804 |
| DuzonBizon Co. Ltd. | | 104 | 8,908 |
| E-Mart Co. Ltd. | | 120 | 10,637 |
| EO Technics Co. Ltd. | | 47 | 3,748 |
| F&F Co. Ltd. | | 47 | 3,636 |
| Fila Holdings Corp. | | 269 | 7,958 |
| GemVax & Kael Co. Ltd. (a) | | 191 | 3,110 |
| Genexine Co. Ltd. (a) | | 94 | 7,473 |
| GS Engineering & Construction Corp. | | 401 | 8,277 |
| GS Holdings Corp. | | 284 | 8,624 |
| GS Retail Co. Ltd. | | 179 | 5,484 |
| Hana Financial Group, Inc. | | 1,908 | 43,502 |
| Hanjin Kal Corp. | | 239 | 16,083 |
| Hankook Tire Co. Ltd. | | 498 | 10,333 |
| Hanmi Pharm Co. Ltd. | | 39 | 7,978 |
| Hanmi Science Co. Ltd. | | 219 | 6,124 |
| Hanon Systems | | 1,035 | 7,864 |
| Hansol Chemical Co. Ltd. | | 47 | 5,027 |
| Hanssem Co. Ltd. | | 94 | 6,795 |
| Hanwha Aerospace Co. Ltd. (a) | | 197 | 4,071 |
| Hanwha Corp. | | 376 | 7,040 |
| Hanwha Solutions Corp. | | 712 | 11,589 |
| HDC Hyundai Development Co. | | 364 | 6,453 |
| Hite Jinro Co. Ltd. | | 190 | 6,982 |
| HLB Life Science Co. Ltd. (a) | | 226 | 3,523 |
| HLB, Inc. | | 298 | 23,084 |
| Hotel Shilla Co. | | 194 | 11,567 |
| HUGEL, Inc. (a) | | 16 | 6,314 |
| Hyundai Department Store Co. Ltd. | | 86 | 4,057 |
| Hyundai Elevator Co. Ltd. | | 159 | 9,275 |
| Hyundai Engineering & Construction Co. Ltd. | | 423 | 11,747 |
| Hyundai Fire & Marine Insurance Co. Ltd. | | 489 | 9,411 |
| Hyundai Glovis Co. Ltd. | | 145 | 12,359 |
| Hyundai Heavy Industries Co. Ltd. (a) | | 316 | 23,320 |
| Hyundai Merchant Marine Co. Ltd. (a) | | 1,895 | 7,494 |
| Hyundai Mipo Dockyard Co. Ltd. | | 155 | 4,083 |
| Hyundai Mobis | | 427 | 68,714 |
| Hyundai Motor Co. | | 860 | 70,821 |
| Hyundai Robotics Co. Ltd. | | 58 | 12,000 |
| Hyundai Steel Co. | | 513 | 8,894 |
| Iljin Materials Co. Ltd. | | 116 | 4,859 |
| Industrial Bank of Korea | | 1,635 | 11,138 |
| INNOCEAN Worldwide, Inc. | | 61 | 2,280 |
| Kakao Corp. | | 348 | 78,289 |
| Kangwon Land, Inc. | | 604 | 10,912 |
| KB Financial Group, Inc. | | 2,464 | 69,930 |
| KCC Corp. | | 26 | 2,901 |
| Kia Motors Corp. | | 1,704 | 46,162 |
| KMW Co. Ltd. (a) | | 153 | 8,193 |
| Koh Young Technology, Inc. | | 65 | 5,446 |
| Korea Aerospace Industries Ltd. | | 616 | 12,318 |
| Korea Electric Power Corp. (a) | | 1,930 | 31,553 |
| Korea Express Co. Ltd. (a) | | 48 | 6,343 |
| Korea Gas Corp. | | 265 | 5,833 |
| Korea Investment Holdings Co. Ltd. | | 278 | 10,449 |
| Korea Zinc Co. Ltd. | | 80 | 22,472 |
| Korean Air Lines Co. Ltd. | | 795 | 11,685 |
| Korean Air Lines Co. Ltd. rights 7/10/20 (a) | | 232 | 335 |
| Korean Reinsurance Co. | | 1,010 | 6,227 |
| KT&G Corp. | | 793 | 51,918 |
| Kumho Petro Chemical Co. Ltd. | | 108 | 6,771 |
| LG Chemical Ltd. | | 281 | 116,255 |
| LG Corp. | | 876 | 52,412 |
| LG Display Co. Ltd. (a) | | 1,293 | 12,411 |
| LG Electronics, Inc. | | 719 | 38,200 |
| LG Household & Health Care Ltd. | | 57 | 64,047 |
| LG Innotek Co. Ltd. | | 80 | 11,762 |
| LG Telecom Ltd. | | 1,879 | 19,250 |
| Lotte Chemical Corp. | | 105 | 14,711 |
| Lotte Confectionery Co. Ltd. | | 266 | 7,052 |
| Lotte Shopping Co. Ltd. | | 85 | 5,695 |
| LS Cable Ltd. | | 144 | 4,212 |
| Mando Corp. | | 190 | 3,584 |
| Medy-Tox, Inc. | | 24 | 2,940 |
| Meritz Securities Co. Ltd. | | 1,846 | 4,706 |
| Mezzion Pharma Co. Ltd. (a) | | 40 | 7,669 |
| Mirae Asset Daewoo Co. Ltd. | | 2,142 | 12,047 |
| NAVER Corp. | | 935 | 210,889 |
| NCSOFT Corp. | | 104 | 77,563 |
| Netmarble Corp. (a)(b) | | 241 | 20,251 |
| Nong Shim Co. Ltd. | | 30 | 9,166 |
| Oci Co. Ltd. (a) | | 106 | 3,299 |
| Orion Corp./Republic of Korea | | 134 | 15,039 |
| Ottogi Corp. | | 10 | 4,663 |
| Paradise Co. Ltd. | | 228 | 2,568 |
| Pearl Abyss Corp. (a) | | 46 | 8,390 |
| POSCO | | 466 | 68,047 |
| POSCO Chemtech Co. Ltd. | | 128 | 8,105 |
| S-Oil Corp. | | 309 | 16,515 |
| S1 Corp. | | 149 | 10,704 |
| Samsung Biologics Co. Ltd. (a)(b) | | 108 | 70,242 |
| Samsung Electro-Mechanics Co. Ltd. | | 386 | 41,983 |
| Samsung Electronics Co. Ltd. | | 33,046 | 1,466,550 |
| Samsung Engineering Co. Ltd. (a) | | 1,248 | 12,895 |
| Samsung Fire & Marine Insurance Co. Ltd. | | 206 | 30,363 |
| Samsung Heavy Industries Co. Ltd. (a) | | 3,389 | 17,011 |
| Samsung Life Insurance Co. Ltd. | | 637 | 24,010 |
| Samsung SDI Co. Ltd. | | 357 | 109,432 |
| Samsung SDS Co. Ltd. | | 247 | 35,025 |
| Samsung Securities Co. Ltd. | | 436 | 9,663 |
| Shinhan Financial Group Co. Ltd. | | 3,142 | 76,121 |
| Shinsegae Co. Ltd. | | 41 | 7,611 |
| SillaJen, Inc. (a)(c) | | 371 | 3,741 |
| SK C&C Co. Ltd. | | 248 | 60,466 |
| SK Energy Co. Ltd. | | 354 | 39,234 |
| SK Hynix, Inc. | | 3,487 | 249,593 |
| SK Telecom Co. Ltd. | | 212 | 37,431 |
| SKC Co. Ltd. | | 109 | 5,594 |
| Soulbrain Holdings Co. Ltd. (c) | | 62 | 4,956 |
| STX Pan Ocean Co. Ltd. (Korea) (a) | | 1,176 | 3,765 |
| ViroMed Co. Ltd. | | 151 | 7,759 |
| WONIK IPS Co. Ltd. (a) | | 169 | 5,078 |
| Woori Financial Group, Inc. | | 3,451 | 25,502 |
| Woori Investment & Securities Co. Ltd. | | 1,171 | 8,167 |
| Yuhan Corp. | | 305 | 12,954 |
|
| TOTAL KOREA (SOUTH) | | | 4,560,600 |
|
| Kuwait - 0.2% | | | |
| Agility Public Warehousing Co. KSC | | 5,755 | 13,724 |
| Boubyan Bank KSC | | 5,239 | 9,055 |
| Gulf Bank | | 11,083 | 7,634 |
| Kuwait Finance House KSCP | | 29,047 | 57,754 |
| Mobile Telecommunication Co. | | 13,551 | 24,434 |
| National Bank of Kuwait | | 44,242 | 118,007 |
|
| TOTAL KUWAIT | | | 230,608 |
|
| Luxembourg - 0.3% | | | |
| Aperam | | 287 | 8,003 |
| ArcelorMittal SA (Netherlands) | | 4,448 | 46,825 |
| Aroundtown SA | | 7,912 | 45,317 |
| B&M European Value Retail SA | | 5,024 | 24,745 |
| Globant SA (a) | | 255 | 38,212 |
| Millicom International Cellular SA (depository receipt) | | 723 | 18,916 |
| RTL Group SA | | 239 | 7,653 |
| SES SA (France) (depositary receipt) | | 2,209 | 15,089 |
| Spotify Technology SA (a)(e) | | 649 | 167,565 |
| Subsea 7 SA (a) | | 1,370 | 8,625 |
| Tenaris SA | | 3,366 | 21,737 |
|
| TOTAL LUXEMBOURG | | | 402,687 |
|
| Malaysia - 0.5% | | | |
| AMMB Holdings Bhd | | 10,500 | 7,622 |
| Axiata Group Bhd | | 29,799 | 24,691 |
| Bumiputra-Commerce Holdings Bhd | | 45,616 | 37,902 |
| Dialog Group Bhd | | 26,500 | 22,328 |
| DiGi.com Bhd | | 21,100 | 21,226 |
| Fraser & Neave Holdings BHD | | 900 | 6,823 |
| Gamuda Bhd | | 14,200 | 12,064 |
| Genting Bhd | | 19,700 | 18,852 |
| Genting Malaysia Bhd | | 20,200 | 11,928 |
| Hartalega Holdings Bhd | | 10,400 | 31,556 |
| Hong Leong Bank Bhd | | 5,400 | 17,746 |
| IHH Healthcare Bhd | | 20,000 | 25,674 |
| IJM Corp. Bhd | | 16,900 | 7,139 |
| Inari Amertron Bhd | | 13,600 | 5,364 |
| IOI Corp. Bhd | | 19,900 | 20,158 |
| KLCC Property Holdings Bhd | | 2,300 | 4,273 |
| Kuala Lumpur Kepong Bhd | | 4,044 | 20,954 |
| Malayan Banking Bhd | | 42,205 | 73,978 |
| Malaysia Airports Holdings Bhd | | 6,400 | 8,141 |
| Maxis Bhd | | 15,200 | 19,051 |
| MISC Bhd | | 10,400 | 18,594 |
| Nestle (Malaysia) BHD | | 400 | 13,061 |
| Petronas Chemicals Group Bhd | | 18,000 | 26,047 |
| Petronas Dagangan Bhd | | 1,900 | 9,135 |
| Petronas Gas Bhd | | 5,400 | 21,275 |
| PPB Group Bhd | | 4,900 | 20,334 |
| Press Metal Bhd | | 9,600 | 10,150 |
| Public Bank Bhd | | 19,700 | 75,867 |
| QL Resources Bhd | | 5,000 | 11,203 |
| RHB Capital Bhd | | 19,200 | 21,465 |
| Sime Darby Bhd | | 19,100 | 9,585 |
| Sime Darby Plantation Bhd | | 19,100 | 21,933 |
| Telekom Malaysia Bhd | | 9,300 | 9,008 |
| Tenaga Nasional Bhd | | 21,300 | 57,768 |
| Top Glove Corp. Bhd | | 9,200 | 34,571 |
| Westports Holdings Bhd | | 6,300 | 5,588 |
| Yinson Holdings Bhd | | 3,400 | 4,682 |
|
| TOTAL MALAYSIA | | | 767,736 |
|
| Mexico - 0.4% | | | |
| Alfa SA de CV Series A | | 16,500 | 9,296 |
| Alsea S.A.B. de CV (a) | | 2,800 | 2,754 |
| America Movil S.A.B. de CV Series L | | 153,000 | 98,186 |
| Banco Santander Mexico SA | | 6 | 4 |
| CEMEX S.A.B. de CV unit | | 96,300 | 27,150 |
| Coca-Cola FEMSA S.A.B. de CV unit | | 3,100 | 13,571 |
| Concentradora Fibra Danhos SA de CV | | 4,900 | 4,656 |
| Embotelladoras Arca S.A.B. de CV | | 3,300 | 14,465 |
| Fibra Uno Administracion SA de CV | | 17,500 | 13,895 |
| Fomento Economico Mexicano S.A.B. de CV unit | | 12,400 | 76,873 |
| Gruma S.A.B. de CV Series B | | 1,375 | 14,839 |
| Grupo Aeroportuario del Pacifico S.A.B. de CV Series B | | 2,500 | 17,976 |
| Grupo Aeroportuario del Sureste S.A.B. de CV Series B | | 1,195 | 13,344 |
| Grupo Aeroportuario Norte S.A.B. de CV (a) | | 1,900 | 8,833 |
| Grupo Bimbo S.A.B. de CV Series A | | 8,500 | 14,227 |
| Grupo Carso SA de CV Series A1 | | 2,700 | 5,265 |
| Grupo Elektra SA de CV | | 410 | 22,482 |
| Grupo Financiero Banorte S.A.B. de CV Series O | | 16,400 | 56,882 |
| Grupo Financiero Inbursa S.A.B. de CV Series O (a) | | 12,200 | 8,466 |
| Grupo Mexico SA de CV Series B | | 19,900 | 46,260 |
| Grupo Televisa SA de CV | | 16,600 | 17,427 |
| Industrias Penoles SA de CV | | 620 | 6,330 |
| Infraestructura Energetica Nova S.A.B. de CV | | 2,900 | 8,369 |
| Kimberly-Clark de Mexico SA de CV Series A | | 8,300 | 12,957 |
| Mexichem S.A.B. de CV | | 5,700 | 8,427 |
| Promotora y Operadora de Infraestructura S.A.B. de CV (a) | | 1,870 | 13,470 |
| Wal-Mart de Mexico SA de CV Series V | | 33,700 | 80,861 |
|
| TOTAL MEXICO | | | 617,265 |
|
| Multi-National - 0.0% | | | |
| HKT Trust/HKT Ltd. unit | | 23,000 | 33,652 |
| Netherlands - 3.4% | | | |
| ABN AMRO Group NV GDR (b) | | 2,720 | 23,407 |
| Adyen BV (a)(b) | | 157 | 228,513 |
| AerCap Holdings NV (a) | | 849 | 26,149 |
| Airbus Group NV | | 3,954 | 283,319 |
| Akzo Nobel NV | | 1,258 | 112,702 |
| Argenx SE (a) | | 307 | 69,103 |
| ASM International NV (Netherlands) | | 299 | 46,207 |
| ASML Holding NV (Netherlands) | | 2,741 | 1,002,694 |
| CNH Industrial NV | | 6,180 | 43,242 |
| Euronext NV (b) | | 435 | 43,618 |
| EXOR NV | | 598 | 34,157 |
| Ferrari NV | | 822 | 140,236 |
| Fiat Chrysler Automobiles NV (Italy) | | 7,226 | 72,611 |
| Heineken Holding NV | | 671 | 54,919 |
| Heineken NV (Bearer) | | 1,527 | 140,781 |
| ING Groep NV (Certificaten Van Aandelen) | | 25,331 | 176,580 |
| Koninklijke Ahold Delhaize NV | | 7,064 | 192,523 |
| Koninklijke DSM NV | | 1,168 | 161,669 |
| Koninklijke KPN NV | | 23,119 | 61,495 |
| Koninklijke Philips Electronics NV | | 5,794 | 275,810 |
| NN Group NV | | 1,789 | 60,124 |
| NXP Semiconductors NV | | 1,808 | 206,184 |
| Prosus NV | | 2,724 | 253,979 |
| QIAGEN NV (Germany) (a) | | 1,505 | 64,828 |
| Randstad NV | | 775 | 34,532 |
| STMicroelectronics NV (Italy) | | 4,228 | 115,503 |
| Takeaway.com Holding BV (a)(b) | | 707 | 73,681 |
| Unibail-Rodamco SE & WFD Unibail-Rodamco NV unit | | 919 | 51,790 |
| Unilever NV | | 9,404 | 501,400 |
| Wolters Kluwer NV | | 1,760 | 137,466 |
| X5 Retail Group NV GDR (Reg. S) | | 653 | 23,116 |
| Yandex NV Series A (a) | | 1,635 | 81,783 |
|
| TOTAL NETHERLANDS | | | 4,794,121 |
|
| New Zealand - 0.3% | | | |
| Auckland International Airport Ltd. | | 8,056 | 34,154 |
| Chorus Ltd. | | 2,451 | 11,831 |
| Contact Energy Ltd. | | 5,316 | 21,474 |
| Fisher & Paykel Healthcare Corp. | | 3,738 | 85,872 |
| Fletcher Building Ltd. | | 5,038 | 12,029 |
| Goodman Property Trust | | 7,471 | 9,787 |
| Infratil Ltd. | | 3,652 | 11,076 |
| Kiwi Property Group Ltd. | | 8,381 | 5,679 |
| Mercury Nz Ltd. | | 3,454 | 10,476 |
| Meridian Energy Ltd. | | 8,574 | 26,613 |
| Ryman Healthcare Group Ltd. | | 2,660 | 22,452 |
| Spark New Zealand Ltd. | | 11,420 | 33,604 |
| The a2 Milk Co. Ltd. (a) | | 4,860 | 63,319 |
| Xero Ltd. (a) | | 719 | 44,711 |
|
| TOTAL NEW ZEALAND | | | 393,077 |
|
| Norway - 0.4% | | | |
| Adevinta ASA Class B (a) | | 1,670 | 16,812 |
| Aker ASA (A Shares) | | 156 | 5,679 |
| Aker Bp ASA | | 633 | 11,529 |
| DNB ASA | | 5,971 | 79,698 |
| Entra ASA (b) | | 805 | 10,270 |
| Equinor ASA | | 7,199 | 102,167 |
| Gjensidige Forsikring ASA (a) | | 1,269 | 23,349 |
| Kongsberg Gruppen ASA | | 480 | 6,722 |
| Leroy Seafood Group ASA | | 1,723 | 10,340 |
| Mowi ASA | | 2,947 | 55,923 |
| Nordic VLSI ASA (a) | | 898 | 6,848 |
| Norsk Hydro ASA | | 9,414 | 26,264 |
| Norwegian Finans Holding ASA | | 803 | 5,498 |
| Orkla ASA | | 5,145 | 45,171 |
| Salmar ASA | | 397 | 18,936 |
| Scatec Solar AS (b) | | 529 | 8,596 |
| Schibsted ASA: | | | |
| (A Shares) | | 703 | 18,318 |
| (B Shares) | | 491 | 11,559 |
| Sparebank 1 Sr Bank ASA (primary capital certificate) (a) | | 1,151 | 8,359 |
| Sparebanken Midt-Norge | | 806 | 6,557 |
| Storebrand ASA (A Shares) | | 3,493 | 18,003 |
| Telenor ASA | | 4,168 | 60,856 |
| TGS Nopec Geophysical Co. ASA | | 676 | 9,787 |
| Tomra Systems ASA | | 778 | 28,541 |
| Veidekke ASA | | 561 | 6,773 |
| Yara International ASA | | 1,176 | 40,795 |
|
| TOTAL NORWAY | | | 643,350 |
|
| Pakistan - 0.0% | | | |
| Engro Corp. Ltd. | | 2,450 | 4,274 |
| Lucky Cement Ltd. | | 1,200 | 3,299 |
| Pakistan Petroleum Ltd. | | 2,800 | 1,447 |
| Pakistan State Oil Co. Ltd. | | 1,300 | 1,225 |
|
| TOTAL PAKISTAN | | | 10,245 |
|
| Papua New Guinea - 0.0% | | | |
| Oil Search Ltd. ADR | | 12,525 | 27,400 |
| Peru - 0.0% | | | |
| Compania de Minas Buenaventura SA sponsored ADR | | 1,326 | 12,120 |
| Philippines - 0.2% | | | |
| Ayala Corp. | | 2,060 | 32,180 |
| Ayala Land, Inc. | | 48,800 | 33,161 |
| Bank of the Philippine Islands (BPI) | | 14,410 | 20,859 |
| BDO Unibank, Inc. | | 13,000 | 25,613 |
| GT Capital Holdings, Inc. | | 519 | 4,739 |
| International Container Terminal Services, Inc. | | 5,720 | 11,787 |
| JG Summit Holdings, Inc. | | 21,750 | 28,357 |
| Jollibee Food Corp. | | 3,770 | 10,611 |
| Metropolitan Bank & Trust Co. | | 15,936 | 11,854 |
| Philippine Long Distance Telephone Co. | | 800 | 19,953 |
| SM Investments Corp. | | 3,900 | 73,625 |
| SM Prime Holdings, Inc. | | 74,800 | 47,897 |
| Universal Robina Corp. | | 6,930 | 18,112 |
|
| TOTAL PHILIPPINES | | | 338,748 |
|
| Poland - 0.2% | | | |
| Bank Millennium SA (a) | | 3,930 | 3,002 |
| Bank Polska Kasa Opieki SA | | 1,080 | 14,697 |
| Bank Zachodni WBK SA | | 204 | 9,044 |
| BRE Bank SA | | 67 | 3,895 |
| CD Projekt RED SA | | 416 | 41,523 |
| Cyfrowy Polsat SA | | 1,642 | 10,915 |
| Dino Polska SA (a)(b) | | 294 | 14,907 |
| Grupa Lotos SA | | 506 | 7,674 |
| KGHM Polska Miedz SA (Bearer) (a) | | 1,046 | 24,033 |
| LPP SA | | 9 | 13,672 |
| Orange Polska SA (a) | | 4,030 | 6,341 |
| Polish Oil & Gas Co. SA | | 9,292 | 10,675 |
| Polska Grupa Energetyczna SA (a) | | 4,183 | 7,268 |
| Polski Koncern Naftowy Orlen SA | | 1,834 | 29,028 |
| Powszechna Kasa Oszczednosci Bank SA | | 5,520 | 31,979 |
| Powszechny Zaklad Ubezpieczen SA | | 3,674 | 26,866 |
|
| TOTAL POLAND | | | 255,519 |
|
| Portugal - 0.1% | | | |
| Banco Comercial Portugues SA (Reg.) | | 46,275 | 5,563 |
| Energias de Portugal SA | | 16,584 | 79,187 |
| Galp Energia SGPS SA Class B | | 2,856 | 33,130 |
| Jeronimo Martins SGPS SA | | 1,651 | 28,909 |
| NOS SGPS | | 1,629 | 7,108 |
| REN - Redes Energeticas Nacionais SGPS SA | | 1,979 | 5,403 |
|
| TOTAL PORTUGAL | | | 159,300 |
|
| Qatar - 0.2% | | | |
| Industries Qatar QSC (a) | | 13,647 | 28,840 |
| Masraf al Rayan (a) | | 37,603 | 39,444 |
| Mesaieed Petrochemical Holding Co. (a) | | 28,366 | 15,734 |
| Qatar Fuel Co. (a) | | 4,954 | 21,915 |
| Qatar International Islamic Bank QSC (a) | | 7,649 | 17,055 |
| Qatar Islamic Bank (a) | | 9,938 | 42,980 |
| Qatar National Bank SAQ (a) | | 28,410 | 135,663 |
| The Commercial Bank of Qatar (a) | | 21,243 | 22,166 |
|
| TOTAL QATAR | | | 323,797 |
|
| Russia - 0.7% | | | |
| Alrosa Co. Ltd. | | 14,800 | 13,409 |
| Gazprom OAO | | 77,980 | 212,778 |
| Inter Rao Ues JSC | | 256,000 | 17,446 |
| Lukoil PJSC | | 2,641 | 196,930 |
| Magnit OJSC | | 505 | 28,572 |
| MMC Norilsk Nickel PJSC | | 387 | 102,019 |
| Mobile TeleSystems OJSC sponsored ADR | | 2,828 | 25,989 |
| NOVATEK OAO | | 6,493 | 92,440 |
| Polyus PJSC | | 174 | 29,307 |
| Sberbank of Russia | | 66,200 | 189,262 |
| Severstal PAO | | 1,202 | 14,596 |
| Surgutneftegas OJSC | | 58,300 | 31,469 |
| Tatneft PAO | | 10,506 | 81,488 |
| VTB Bank OJSC | | 37,760,000 | 18,528 |
|
| TOTAL RUSSIA | | | 1,054,233 |
|
| Saudi Arabia - 0.8% | | | |
| Abdullah Al Othaim Markets Co. | | 337 | 10,044 |
| Advanced Polypropylene Co. | | 1,370 | 19,431 |
| Al Rajhi Bank | | 14,415 | 217,512 |
| Alinma Bank | | 12,102 | 46,911 |
| Almarai Co. Ltd. | | 1,606 | 22,178 |
| Arabian Centres Co. Ltd. | | 677 | 4,003 |
| Bank Al-Jazira | | 5,482 | 16,515 |
| Bank Albilad | | 2,018 | 11,900 |
| Banque Saudi Fransi | | 4,193 | 31,914 |
| Dar Al Arkan Real Estate Development Co. (a) | | 6,042 | 11,436 |
| Emaar The Economic City (a) | | 2,466 | 4,470 |
| Etihad Etisalat Co. (a) | | 3,241 | 22,983 |
| Jarir Marketing Co. | | 533 | 20,746 |
| Mouwasat Medical Services Co. | | 274 | 6,596 |
| National Commercial Bank | | 8,888 | 88,264 |
| National Industrialization Co. (a) | | 3,193 | 8,887 |
| Riyad Bank | | 8,300 | 37,307 |
| SABIC | | 5,902 | 138,621 |
| Sahara International Petrochemical Co. | | 5,036 | 19,360 |
| Samba Financial Group | | 7,731 | 55,339 |
| Saudi Airlines Catering Co. | | 212 | 4,375 |
| Saudi Arabian Fertilizers Co. | | 1,277 | 25,363 |
| Saudi Arabian Mining Co. (a) | | 2,758 | 25,587 |
| Saudi Cement Co. | | 807 | 11,403 |
| Saudi Electricity Co. | | 5,075 | 21,133 |
| Saudi Industrial Investment Group | | 2,344 | 12,623 |
| Saudi Kayan Petrochemical Co. (a) | | 5,583 | 12,205 |
| Saudi Telecom Co. | | 3,870 | 102,141 |
| Southern Province Cement Co. | | 423 | 6,123 |
| The Co. for Cooperative Insurance (a) | | 453 | 8,587 |
| The Savola Group | | 2,137 | 23,985 |
| Yanbu National Petrochemical Co. | | 1,792 | 24,460 |
|
| TOTAL SAUDI ARABIA | | | 1,072,402 |
|
| Singapore - 0.8% | | | |
| Ascendas Real Estate Investment Trust | | 18,584 | 42,273 |
| BOC Aviation Ltd. Class A (b) | | 1,100 | 7,025 |
| CapitaCommercial Trust (REIT) | | 21,800 | 26,437 |
| CapitaLand Ltd. | | 16,600 | 34,782 |
| CapitaMall Trust | | 16,700 | 23,487 |
| City Developments Ltd. | | 4,000 | 24,168 |
| ComfortDelgro Corp. Ltd. | | 13,100 | 13,630 |
| DBS Group Holdings Ltd. | | 11,500 | 171,642 |
| Flextronics International Ltd. (a) | | 3,164 | 32,431 |
| Genting Singapore Ltd. | | 39,700 | 21,650 |
| Jardine Cycle & Carriage Ltd. | | 700 | 10,126 |
| Keppel Corp. Ltd. | | 9,100 | 38,918 |
| Keppel DC (REIT) | | 7,000 | 12,758 |
| Mapletree Commercial Trust | | 12,046 | 16,683 |
| Mapletree Greater China Commercial Trust | | 13,342 | 8,856 |
| Mapletree Industrial (REIT) | | 8,603 | 17,717 |
| Mapletree Logistics Trust (REIT) | | 18,832 | 26,216 |
| Oversea-Chinese Banking Corp. Ltd. | | 25,267 | 163,177 |
| Singapore Airlines Ltd. | | 12,650 | 33,858 |
| Singapore Airport Terminal Service Ltd. | | 4,900 | 10,056 |
| Singapore Exchange Ltd. | | 5,200 | 31,119 |
| Singapore Press Holdings Ltd. | | 9,100 | 8,293 |
| Singapore Technologies Engineering Ltd. | | 10,100 | 23,916 |
| Singapore Telecommunications Ltd. | | 53,700 | 95,527 |
| Suntec (REIT) | | 13,700 | 13,861 |
| United Overseas Bank Ltd. | | 9,000 | 131,507 |
| UOL Group Ltd. | | 3,600 | 17,540 |
| Venture Corp. Ltd. | | 1,500 | 17,415 |
| Wilmar International Ltd. | | 19,800 | 58,110 |
|
| TOTAL SINGAPORE | | | 1,133,178 |
|
| South Africa - 1.0% | | | |
| Absa Group Ltd. | | 4,671 | 22,961 |
| Anglo American Platinum Ltd. | | 346 | 25,006 |
| AngloGold Ashanti Ltd. | | 2,675 | 78,704 |
| Aspen Pharmacare Holdings Ltd. (a) | | 2,502 | 20,692 |
| Bidcorp Ltd. | | 2,127 | 34,750 |
| Bidvest Group Ltd. | | 2,638 | 21,594 |
| Capitec Bank Holdings Ltd. | | 430 | 21,279 |
| Clicks Group Ltd. | | 1,639 | 19,869 |
| Discovery Ltd. | | 3,220 | 19,401 |
| Exxaro Resources Ltd. | | 1,517 | 11,403 |
| FirstRand Ltd. | | 32,178 | 70,577 |
| Foschini Ltd. | | 1,239 | 4,583 |
| Gold Fields Ltd. | | 5,733 | 54,132 |
| Growthpoint Properties Ltd. | | 17,049 | 13,117 |
| Impala Platinum Holdings Ltd. | | 4,943 | 33,044 |
| Investec Ltd. | | 512 | 1,019 |
| Life Healthcare Group Holdings Ltd. | | 7,941 | 7,720 |
| Mr Price Group Ltd. | | 2,195 | 18,089 |
| MTN Group Ltd. | | 10,591 | 32,244 |
| MultiChoice Group Ltd. | | 3,080 | 18,863 |
| Naspers Ltd. Class N | | 2,834 | 520,834 |
| Nedbank Group Ltd. | | 2,162 | 12,652 |
| Northam Platinum Ltd. (a) | | 1,983 | 13,279 |
| Old Mutual Ltd. | | 30,227 | 21,004 |
| PSG Group Ltd. | | 1,078 | 9,839 |
| Redefine Properties Ltd. | | 33,208 | 6,334 |
| Remgro Ltd. | | 3,358 | 19,332 |
| RMB Holdings Ltd. | | 6,886 | 651 |
| Sanlam Ltd. | | 12,293 | 41,817 |
| Sasol Ltd. (a) | | 3,781 | 28,806 |
| Shoprite Holdings Ltd. | | 3,017 | 18,543 |
| Sibanye Stillwater Ltd. (a) | | 13,519 | 29,353 |
| Spar Group Ltd. | | 1,178 | 11,649 |
| Standard Bank Group Ltd. | | 8,171 | 49,207 |
| Tiger Brands Ltd. | | 1,001 | 10,291 |
| Vodacom Group Ltd. | | 4,349 | 30,815 |
| Woolworths Holdings Ltd. | | 5,843 | 11,146 |
|
| TOTAL SOUTH AFRICA | | | 1,364,599 |
|
| Spain - 1.5% | | | |
| Abertis Infraestructuras SA (a) | | 363 | 7,488 |
| ACS Actividades de Construccion y Servicios SA | | 1,709 | 43,919 |
| ACS Actividades de Construccion y Servicios SA rights 7/7/20 (a) | | 1,709 | 2,666 |
| Aena Sme SA (a)(b) | | 484 | 64,546 |
| Amadeus IT Holding SA Class A | | 2,924 | 153,516 |
| Banco Bilbao Vizcaya Argentaria SA | | 43,400 | 149,425 |
| Banco de Sabadell SA | | 32,563 | 11,308 |
| Banco Santander SA (Spain) | | 107,804 | 263,738 |
| Bankinter SA | | 4,470 | 21,319 |
| CaixaBank SA | | 22,340 | 47,792 |
| Cellnex Telecom SA (b) | | 1,735 | 105,729 |
| Enagas SA | | 1,533 | 37,461 |
| Endesa SA | | 2,088 | 51,445 |
| Ferrovial SA | | 3,137 | 83,529 |
| Gas Natural SDG SA | | 2,083 | 38,766 |
| Grifols SA | | 1,513 | 45,947 |
| Grifols SA ADR | | 2,389 | 43,575 |
| Iberdrola SA | | 39,020 | 455,546 |
| Inditex SA | | 6,881 | 182,577 |
| International Consolidated Airlines Group SA CDI | | 9,684 | 26,710 |
| Merlin Properties Socimi SA | | 2,140 | 17,744 |
| Red Electrica Corporacion SA | | 2,853 | 53,225 |
| Repsol SA | | 9,114 | 80,531 |
| Repsol SA rights 7/6/20 (a) | | 9,114 | 4,437 |
| Telefonica SA | | 29,679 | 141,948 |
| Telefonica SA rights (a) | | 28,156 | 5,539 |
|
| TOTAL SPAIN | | | 2,140,426 |
|
| Sweden - 2.0% | | | |
| AarhusKarlshamn AB | | 1,223 | 21,013 |
| AF Poyry AB (B Shares) | | 569 | 12,213 |
| Alfa Laval AB | | 1,862 | 40,844 |
| ASSA ABLOY AB (B Shares) | | 6,444 | 131,893 |
| Atlas Copco AB: | | | |
| (A Shares) | | 3,977 | 169,362 |
| (B Shares) | | 2,716 | 100,441 |
| Beijer Ref AB (B Shares) | | 401 | 12,110 |
| Billerud AB | | 1,038 | 14,866 |
| Boliden AB | | 1,694 | 38,540 |
| Castellum AB | | 1,618 | 30,222 |
| Dometic Group AB (a)(b) | | 1,962 | 17,590 |
| Electrolux AB (B Shares) | | 1,650 | 27,588 |
| Electrolux Professional AB (a) | | 1,493 | 5,417 |
| Elekta AB (B Shares) | | 2,299 | 21,381 |
| Epiroc AB: | | | |
| Class A | | 4,026 | 50,447 |
| Class B | | 2,565 | 31,367 |
| Ericsson (B Shares) | | 16,911 | 156,757 |
| Essity AB Class B | | 3,916 | 126,538 |
| Evolution Gaming Group AB (b) | | 809 | 48,237 |
| Fabege AB | | 1,969 | 23,011 |
| Fastighets AB Balder (a) | | 612 | 23,322 |
| Getinge AB (B Shares) | | 1,399 | 25,959 |
| H&M Hennes & Mauritz AB (B Shares) | | 5,094 | 73,801 |
| Hexagon AB (B Shares) (a) | | 1,818 | 106,136 |
| HEXPOL AB (B Shares) | | 1,583 | 11,722 |
| Holmen AB (B Shares) (a) | | 630 | 20,094 |
| Hufvudstaden AB (A Shares) | | 639 | 7,941 |
| Husqvarna AB (B Shares) | | 2,718 | 22,256 |
| ICA Gruppen AB | | 581 | 27,547 |
| Industrivarden AB: | | | |
| (A Shares) | | 1,162 | 26,362 |
| (C Shares) | | 1,011 | 22,904 |
| Indutrade AB (a) | | 574 | 22,669 |
| Investor AB (B Shares) | | 2,930 | 154,609 |
| Kinnevik AB (B Shares) | | 1,503 | 39,534 |
| Latour Investment AB Class B | | 913 | 16,559 |
| Lifco AB | | 320 | 20,261 |
| Loomis AB (B Shares) (a) | | 443 | 10,583 |
| Lundbergfoeretagen AB | | 410 | 18,603 |
| Lundin Petroleum AB | | 1,185 | 28,562 |
| Nibe Industrier AB (B Shares) | | 2,415 | 53,363 |
| Nordic Entertainment Group AB Class B | | 380 | 11,622 |
| Saab AB (B Shares) | | 476 | 11,882 |
| Samhallsbyggnadsbolaget I Norden AB (B Shares) | | 4,772 | 12,188 |
| Sandvik AB | | 7,202 | 134,561 |
| Securitas AB (B Shares) | | 2,079 | 28,012 |
| Skandinaviska Enskilda Banken AB (A Shares) (a) | | 10,513 | 91,048 |
| Skanska AB (B Shares) (a) | | 2,426 | 49,336 |
| SKF AB (B Shares) | | 2,518 | 46,789 |
| SSAB Svenskt Stal AB (B Shares) | | 3,614 | 9,580 |
| Svenska Cellulosa AB (SCA) (B Shares) | | 4,034 | 47,967 |
| Svenska Handelsbanken AB (A Shares) (a) | | 9,910 | 94,099 |
| Sweco AB (B Shares) | | 479 | 21,508 |
| Swedbank AB (A Shares) (a) | | 6,074 | 77,996 |
| Swedish Match Co. AB | | 1,032 | 72,542 |
| Swedish Orphan Biovitrum AB (a) | | 1,212 | 27,991 |
| Tele2 AB (B Shares) | | 3,392 | 44,975 |
| Telia Co. AB | | 16,413 | 61,404 |
| Thule Group AB (b) | | 605 | 15,271 |
| Trelleborg AB (B Shares) | | 1,574 | 22,914 |
| Volvo AB (B Shares) | | 10,613 | 166,173 |
| Wallenstam AB (B Shares) | | 1,185 | 13,722 |
| Wihlborgs Fastigheter AB | | 744 | 12,176 |
|
| TOTAL SWEDEN | | | 2,886,380 |
|
| Switzerland - 6.1% | | | |
| ABB Ltd. (Reg.) | | 12,372 | 280,633 |
| Adecco SA (Reg.) | | 1,090 | 51,378 |
| Alcon, Inc. (Switzerland) (a) | | 3,165 | 181,592 |
| Baloise Holdings AG | | 327 | 49,044 |
| Compagnie Financiere Richemont SA Series A | | 3,364 | 216,979 |
| Credit Suisse Group AG | | 15,702 | 163,377 |
| Galenica AG | | 267 | 40,172 |
| Geberit AG (Reg.) | | 238 | 119,413 |
| Givaudan SA | | 51 | 189,908 |
| Julius Baer Group Ltd. | | 1,463 | 61,442 |
| Kuehne & Nagel International AG (a) | | 329 | 54,657 |
| LafargeHolcim Ltd. (Reg.) | | 3,143 | 137,702 |
| Lindt & Spruengli AG | | 1 | 85,915 |
| Lindt & Spruengli AG (participation certificate) | | 7 | 57,628 |
| Lonza Group AG | | 479 | 253,725 |
| Nestle SA (Reg. S) | | 19,140 | 2,122,064 |
| Novartis AG | | 15,905 | 1,385,661 |
| Partners Group Holding AG | | 120 | 108,848 |
| Roche Holding AG: | | | |
| (Bearer) | | 204 | 69,977 |
| (participation certificate) | | 4,499 | 1,558,676 |
| Schindler Holding AG (participation certificate) | | 264 | 62,137 |
| SGS SA (Reg.) | | 34 | 83,076 |
| Sika AG | | 914 | 176,194 |
| Sonova Holding AG Class B | | 357 | 71,272 |
| Straumann Holding AG | | 74 | 63,577 |
| Swiss Life Holding AG | | 220 | 81,503 |
| Swiss Prime Site AG | | 468 | 43,271 |
| Swiss Re Ltd. | | 1,886 | 146,230 |
| Swisscom AG | | 163 | 85,315 |
| Temenos Group AG | | 430 | 66,784 |
| UBS Group AG | | 24,737 | 284,719 |
| Zurich Insurance Group Ltd. | | 964 | 341,575 |
|
| TOTAL SWITZERLAND | | | 8,694,444 |
|
| Taiwan - 3.2% | | | |
| Accton Technology Corp. | | 3,000 | 23,250 |
| Acer, Inc. | | 17,000 | 10,344 |
| Advantech Co. Ltd. | | 3,000 | 30,134 |
| ASE Technology Holding Co. Ltd. | | 19,000 | 43,884 |
| Asia Cement Corp. | | 15,000 | 22,231 |
| ASUSTeK Computer, Inc. | | 4,000 | 29,369 |
| AU Optronics Corp. | | 63,000 | 19,942 |
| Catcher Technology Co. Ltd. | | 5,000 | 37,731 |
| Cathay Financial Holding Co. Ltd. | | 54,341 | 77,303 |
| Chang Hwa Commercial Bank | | 40,232 | 26,462 |
| Cheng Shin Rubber Industry Co. Ltd. | | 13,000 | 14,914 |
| Chicony Electronics Co. Ltd. | | 4,010 | 11,613 |
| Chilisin Electronics Corp. | | 1,000 | 3,059 |
| China Development Finance Holding Corp. | | 82,000 | 26,368 |
| China Life Insurance Co. Ltd. | | 23,003 | 17,046 |
| China Petrochemical Development Corp. | | 150 | 42 |
| China Steel Corp. | | 82,000 | 57,697 |
| China Synthetic Rubber Corp. | | 390 | 267 |
| Chinatrust Financial Holding Co. Ltd. | | 124,000 | 85,775 |
| Chipbond Technology Corp. | | 3,000 | 6,557 |
| Chroma ATE, Inc. | | 3,000 | 15,449 |
| Chunghwa Telecom Co. Ltd. | | 28,000 | 111,524 |
| Compal Electronics, Inc. | | 29,000 | 18,976 |
| Compeq Manufacturing Co. Ltd. | | 6,000 | 9,728 |
| Delta Electronics, Inc. | | 12,000 | 68,323 |
| E.SUN Financial Holdings Co. Ltd. | | 74,117 | 70,038 |
| ECLAT Textile Co. Ltd. | | 1,000 | 11,625 |
| Elite Material Co. Ltd. | | 2,000 | 10,843 |
| EPISTAR Corp. | | 6,000 | 7,516 |
| EVA Airways Corp. | | 15,562 | 5,925 |
| Evergreen Marine Corp. (Taiwan) (a) | | 20,675 | 7,555 |
| Far Eastern Department Stores Co. Ltd. | | 6,000 | 5,078 |
| Far Eastern Textile Ltd. | | 23,000 | 21,812 |
| Far EasTone Telecommunications Co. Ltd. | | 13,000 | 30,049 |
| Feng Tay Enterprise Co. Ltd. | | 3,200 | 18,111 |
| First Financial Holding Co. Ltd. | | 65,582 | 50,492 |
| FLEXium Interconnect, Inc. | | 2,000 | 8,260 |
| Formosa Chemicals & Fibre Corp. | | 27,000 | 69,476 |
| Formosa Petrochemical Corp. | | 11,000 | 33,091 |
| Formosa Plastics Corp. | | 28,000 | 83,375 |
| Formosa Taffeta Co. Ltd. | | 5,000 | 6,186 |
| Foxconn Technology Co. Ltd. | | 5,000 | 9,603 |
| Fubon Financial Holding Co. Ltd. | | 48,000 | 71,627 |
| Genius Electronic Optical Co. Ltd. | | 1,000 | 23,794 |
| Giant Manufacturing Co. Ltd. | | 2,000 | 17,948 |
| Giga-Byte Technology Co. Ltd. | | 3,000 | 6,679 |
| GlobalWafers Co. Ltd. | | 1,000 | 13,699 |
| Great Wall Enterprise Co. Ltd. | | 4,150 | 6,016 |
| Highwealth Construction Corp. | | 5,000 | 7,402 |
| HIWIN Technologies Corp. | | 2,095 | 20,901 |
| Hon Hai Precision Industry Co. Ltd. (Foxconn) | | 79,600 | 233,505 |
| Hotai Motor Co. Ltd. | | 2,000 | 47,792 |
| Hua Nan Financial Holdings Co. Ltd. | | 61,081 | 41,525 |
| Innolux Corp. | | 55,000 | 14,769 |
| Inventec Corp. | | 18,000 | 15,357 |
| ITEQ Corp. | | 1,000 | 5,014 |
| King Yuan Electronics Co. Ltd. | | 6,000 | 7,006 |
| King's Town Bank | | 5,000 | 6,102 |
| Largan Precision Co. Ltd. | | 1,000 | 138,856 |
| Lien Hwa Industrial Corp. | | 4,150 | 5,995 |
| Lite-On Technology Corp. | | 12,000 | 18,886 |
| Macronix International Co. Ltd. | | 11,060 | 11,654 |
| Makalot Industrial Co. Ltd. | | 1,050 | 5,532 |
| MediaTek, Inc. | | 9,000 | 177,130 |
| Mega Financial Holding Co. Ltd. | | 69,000 | 72,474 |
| Merida Industry Co. Ltd. | | 2,000 | 13,665 |
| Merry Electronics Co. Ltd. | | 1,000 | 4,742 |
| Micro-Star International Co. Ltd. | | 4,000 | 14,616 |
| Nan Ya Plastics Corp. | | 36,000 | 79,051 |
| Nanya Technology Corp. | | 7,000 | 14,514 |
| Nien Made Enterprise Co. Ltd. | | 1,000 | 9,773 |
| Novatek Microelectronics Corp. | | 4,000 | 31,000 |
| OBI Pharma, Inc. (a) | | 64 | 252 |
| Pegatron Corp. | | 14,000 | 30,457 |
| Phison Electronics Corp. | | 1,000 | 9,994 |
| Pou Chen Corp. | | 18,000 | 17,621 |
| Powertech Technology, Inc. | | 5,000 | 18,186 |
| President Chain Store Corp. | | 4,000 | 40,314 |
| Qisda Corp. | | 9,000 | 5,400 |
| Quanta Computer, Inc. | | 17,000 | 41,028 |
| Radiant Opto-Electronics Corp. | | 3,000 | 12,084 |
| Realtek Semiconductor Corp. | | 3,000 | 30,491 |
| Ruentex Development Co. Ltd. | | 4,600 | 7,990 |
| Ruentex Industries Ltd. | | 2,800 | 6,739 |
| Shin Kong Financial Holding Co. Ltd. | | 80,611 | 23,565 |
| Simplo Technology Co. Ltd. | | 1,000 | 10,860 |
| SINBON Electronics Co. Ltd. | | 1,000 | 5,065 |
| Sino-American Silicon Products, Inc. | | 3,000 | 9,677 |
| Sinopac Holdings Co. | | 70,680 | 26,067 |
| Standard Foods Corp. | | 3,000 | 6,424 |
| Synnex Technology International Corp. | | 7,000 | 9,910 |
| Taichung Commercial Bank Co. Ltd. | | 14,000 | 5,544 |
| Taishin Financial Holdings Co. Ltd. | | 65,129 | 29,555 |
| Taiwan Business Bank | | 31,394 | 11,525 |
| Taiwan Cement Corp. | | 32,007 | 46,511 |
| Taiwan Cooperative Financial Holding Co. Ltd. | | 61,723 | 43,535 |
| Taiwan Fertilizer Co. Ltd. | | 4,000 | 6,764 |
| Taiwan High Speed Rail Corp. | | 13,000 | 16,129 |
| Taiwan Mobile Co. Ltd. | | 15,000 | 56,341 |
| Taiwan Semiconductor Manufacturing Co. Ltd. | | 122,000 | 1,306,688 |
| Taiwan Surface Mounting Technology Co. Ltd. | | 2,000 | 8,838 |
| Taiwan Union Technology Corp. | | 2,000 | 9,756 |
| Tatung Co. Ltd. (a) | | 10,000 | 7,138 |
| TCI Co. Ltd. | | 148 | 1,376 |
| TECO Electric & Machinery Co. Ltd. | | 10,000 | 9,195 |
| The Shanghai Commercial & Savings Bank Ltd. | | 28,000 | 43,353 |
| Tripod Technology Corp. | | 3,000 | 13,359 |
| Unified-President Enterprises Corp. | | 33,000 | 79,979 |
| Unimicron Technology Corp. | | 7,000 | 11,921 |
| United Integrated Services Co. | | 1,000 | 6,832 |
| United Microelectronics Corp. | | 69,000 | 37,413 |
| Vanguard International Semiconductor Corp. | | 5,000 | 13,223 |
| Walsin Lihwa Corp. | | 17,000 | 8,408 |
| Walsin Technology Corp. | | 2,000 | 12,169 |
| Win Semiconductors Corp. | | 2,000 | 20,327 |
| Winbond Electronics Corp. | | 18,000 | 8,168 |
| Wistron Corp. | | 17,058 | 20,758 |
| WPG Holding Co. Ltd. | | 6,920 | 9,232 |
| Yageo Corp. | | 2,000 | 25,902 |
| Yuanta Financial Holding Co. Ltd. | | 71,000 | 42,114 |
|
| TOTAL TAIWAN | | | 4,578,224 |
|
| Thailand - 0.8% | | | |
| Advanced Info Service PCL (For. Reg.) | | 6,600 | 39,515 |
| Airports of Thailand PCL | | 3,500 | 6,853 |
| Airports of Thailand PCL (For. Reg.) | | 27,500 | 53,843 |
| B. Grimm Power PCL | | 9,000 | 15,583 |
| Bangkok Bank PCL (For. Reg.) | | 12,000 | 41,553 |
| Bangkok Dusit Medical Services PCL (For. Reg.) | | 58,000 | 42,233 |
| Bangkok Expressway and Metro PCL | | 56,900 | 17,494 |
| Banpu PCL (For. Reg.) | | 36,500 | 7,206 |
| Berli Jucker PCL: | | | |
| unit | | 2,900 | 3,707 |
| (For. Reg) | | 5,000 | 6,392 |
| BTS Group Holdings PCL | | 28,200 | 10,313 |
| BTS Group Holdings PCL (For. Reg.) | | 38,444 | 14,059 |
| Bumrungrad Hospital PCL (For. Reg.) | | 3,400 | 12,819 |
| C.P. ALL PCL | | 2,800 | 6,139 |
| C.P. ALL PCL (For. Reg.) | | 37,400 | 82,002 |
| Carabao Group PCL | | 3,300 | 11,107 |
| Central Pattana PCL (For. Reg.) | | 16,600 | 26,189 |
| Central Retail Corp. PCL | | 19,041 | 20,181 |
| Charoen Pokphand Foods PCL (For. Reg.) | | 22,600 | 23,222 |
| CPN Retail Growth Leasehold REIT | | 30,900 | 26,000 |
| CPN Retail Growth Leasehold REIT rights (a) | | 2,030 | 0 |
| Delta Electronics PCL NVDR | | 3,100 | 5,392 |
| Electricity Generating PCL (For. Reg.) | | 1,500 | 11,990 |
| Energy Absolute PCL | | 9,700 | 12,321 |
| Global Power Synergy Public Co. Ltd. | | 4,746 | 11,289 |
| Gulf Energy Development PCL | | 25,500 | 31,153 |
| Hana Microelectronics PCL (For. Reg.) | | 3,400 | 3,053 |
| Home Product Center PCL (For. Reg.) | | 40,900 | 20,384 |
| Indorama Ventures PCL (For. Reg.) | | 15,200 | 13,650 |
| Intouch Holdings PCL | | 3,000 | 5,461 |
| Intouch Holdings PCL (For. Reg.) | | 11,400 | 20,752 |
| IRPC PCL (For. Reg.) | | 68,600 | 5,817 |
| Kasikornbank PCL (For. Reg.) | | 14,700 | 44,524 |
| Kiatnakin Bank PCL (For. Reg.) | | 4,200 | 5,437 |
| Krung Thai Bank PCL: | | | |
| (For. Reg.) | | 31,900 | 10,633 |
| NVDR | | 4,000 | 1,333 |
| Krungthai Card PCL (For. Reg.) | | 4,900 | 4,757 |
| Land & House PCL: | | | |
| NVDR | | 9,000 | 2,214 |
| (For. Reg.) | | 48,000 | 11,806 |
| Minor International PCL: | | | |
| rights 7/23/20 (a) | | 1,975 | 89 |
| warrants 9/30/21 (a) | | 520 | 20 |
| (For. Reg.) | | 16,200 | 10,643 |
| Muangthai Leasing PCL | | 4,300 | 7,236 |
| Osotspa PCL | | 6,400 | 7,871 |
| PTT Exploration and Production PCL | | 1,300 | 3,860 |
| PTT Exploration and Production PCL (For. Reg.) | | 8,100 | 24,051 |
| PTT Global Chemical PCL (For. Reg.) | | 14,800 | 22,152 |
| PTT PCL | | 3,500 | 4,276 |
| PTT PCL (For. Reg.) | | 86,600 | 105,798 |
| Ratchaburi Electric Generating Holding PCL (For. Reg.) | | 4,700 | 9,468 |
| Siam Cement PCL: | | | |
| (For. Reg.) | | 5,100 | 60,738 |
| NVDR unit | | 200 | 2,382 |
| Siam Commercial Bank PCL (For. Reg.) | | 16,400 | 38,479 |
| Siam Global House PCL | | 5 | 3 |
| Srisawad Corp. PCL | | 5,000 | 8,333 |
| Thai Beverage PCL | | 58,600 | 28,383 |
| Thai Oil PCL (For. Reg.) | | 6,300 | 9,022 |
| Thai Union Frozen Products PCL (For. Reg.) | | 17,100 | 7,139 |
| Thanachart Capital PCL (For. Reg.) | | 5,700 | 6,549 |
| TISCO Financial Group PCL | | 3,900 | 8,772 |
| TMB Bank PCL (For. Reg.) | | 244,212 | 8,298 |
| Total Access Communication PCL (For. Reg.) | | 2,400 | 3,049 |
| True Corp. PCL (For. Reg.) | | 61,100 | 6,723 |
| VGI Global Media PCL | | 15,300 | 3,714 |
| WHA Corp. PCL | | 45,900 | 4,932 |
|
| TOTAL THAILAND | | | 1,080,356 |
|
| Turkey - 0.2% | | | |
| Akbank TAS (a) | | 24,091 | 21,372 |
| Anadolu Efes Biracilik Ve Malt Sanayii A/S | | 1,163 | 3,618 |
| Arcelik A/S | | 1,474 | 4,280 |
| Aselsan A/S | | 1,658 | 7,858 |
| Bim Birlesik Magazalar A/S JSC | | 2,942 | 29,190 |
| Coca-Cola Icecek Sanayi A/S | | 401 | 2,539 |
| Emlak Konut Gayrimenkul Yatirim Ortakligi A/S | | 9,423 | 2,819 |
| Enka Insaat ve Sanayi A/S | | 9,474 | 8,515 |
| Eregli Demir ve Celik Fabrikalari T.A.S. | | 7,957 | 9,961 |
| Ford Otomotiv Sanayi A/S | | 410 | 4,241 |
| Haci Omer Sabanci Holding A/S | | 7,803 | 10,520 |
| Koc Holding A/S | | 8,027 | 21,082 |
| Koza Altin Isletmeleri A/S (a) | | 241 | 2,931 |
| Pegasus Hava Tasimaciligi A/S (a) | | 207 | 1,678 |
| Petkim Petrokimya Holding A/S (a) | | 6,186 | 3,854 |
| Soda Sanayii AS | | 1,699 | 1,517 |
| Sok Marketler Ticaret A/S (a) | | 1,467 | 2,868 |
| TAV Havalimanlari Holding A/S | | 1,060 | 2,996 |
| Tekfen Holding A/S | | 900 | 2,235 |
| Tofas Turk Otomobil Fabrikasi A/S | | 684 | 2,645 |
| Tupras Turkiye Petrol Rafinerileri A/S (a) | | 736 | 9,611 |
| Turk Hava Yollari AO (a) | | 4,054 | 7,406 |
| Turk Sise ve Cam Fabrikalari A/S | | 3,726 | 3,017 |
| Turkcell Iletisim Hizmet A/S | | 7,802 | 18,715 |
| Turkiye Garanti Bankasi A/S (a) | | 16,243 | 20,050 |
| Turkiye Halk Bankasi A/S (a) | | 3,771 | 3,527 |
| Turkiye Is Bankasi A/S Series C (a) | | 8,083 | 6,581 |
| Turkiye Vakiflar Bankasi TAO (a) | | 7,036 | 5,472 |
| Ulker Biskuvi Sanayi A/S (a) | | 956 | 3,390 |
| Yapi ve Kredi Bankasi A/S (a) | | 7,300 | 2,599 |
|
| TOTAL TURKEY | | | 227,087 |
|
| United Arab Emirates - 0.3% | | | |
| Abu Dhabi Commercial Bank PJSC | | 17,819 | 24,013 |
| Aldar Properties PJSC (a) | | 36,044 | 17,467 |
| Dubai Islamic Bank Pakistan Ltd. (a) | | 29,467 | 30,645 |
| Emaar Properties PJSC (a) | | 33,509 | 24,905 |
| Emirates NBD Bank PJSC | | 15,231 | 36,739 |
| Emirates Telecommunications Corp. | | 22,592 | 101,485 |
| National Bank of Abu Dhabi PJSC (a) | | 47,637 | 145,771 |
|
| TOTAL UNITED ARAB EMIRATES | | | 381,025 |
|
| United Kingdom - 8.6% | | | |
| 3i Group PLC | | 6,083 | 62,757 |
| Admiral Group PLC | | 1,543 | 43,955 |
| Amarin Corp. PLC ADR (a)(e) | | 2,666 | 18,449 |
| Anglo American PLC (United Kingdom) | | 8,847 | 204,930 |
| Antofagasta PLC | | 2,047 | 23,782 |
| Ashtead Group PLC | | 2,968 | 99,995 |
| Associated British Foods PLC | | 2,185 | 51,847 |
| AstraZeneca PLC (United Kingdom) | | 8,478 | 882,343 |
| Atlassian Corp. PLC (a) | | 814 | 146,740 |
| Auto Trader Group PLC (b) | | 6,574 | 42,802 |
| Aveva Group PLC | | 399 | 20,231 |
| Aviva PLC | | 26,571 | 90,080 |
| BAE Systems PLC | | 20,869 | 124,785 |
| Barclays PLC | | 107,004 | 150,961 |
| Barratt Developments PLC | | 6,306 | 38,748 |
| Beazley PLC | | 3,810 | 19,356 |
| Bellway PLC | | 775 | 24,449 |
| Berkeley Group Holdings PLC | | 797 | 41,132 |
| BHP Billiton PLC | | 13,687 | 280,078 |
| BP PLC | | 130,995 | 501,848 |
| British American Tobacco PLC (United Kingdom) | | 14,809 | 567,967 |
| British Land Co. PLC | | 5,948 | 28,452 |
| BT Group PLC | | 57,777 | 81,650 |
| Bunzl PLC | | 2,069 | 55,530 |
| Burberry Group PLC | | 2,560 | 50,586 |
| Carnival PLC | | 1,071 | 13,101 |
| Centrica PLC | | 38,419 | 18,255 |
| Coca-Cola European Partners PLC | | 1,405 | 53,053 |
| Compass Group PLC | | 11,684 | 160,754 |
| ConvaTec Group PLC (b) | | 9,854 | 23,883 |
| Croda International PLC | | 812 | 52,883 |
| Dechra Pharmaceuticals PLC | | 655 | 23,098 |
| Derwent London PLC | | 611 | 21,017 |
| Diageo PLC | | 15,201 | 505,241 |
| Direct Line Insurance Group PLC | | 8,743 | 29,359 |
| DS Smith PLC | | 8,504 | 34,583 |
| easyJet PLC | | 1,504 | 12,673 |
| Electrocomponents PLC | | 2,729 | 22,690 |
| Evraz PLC | | 2,998 | 10,714 |
| G4S PLC (United Kingdom) | | 9,027 | 12,746 |
| GlaxoSmithKline PLC | | 32,349 | 653,440 |
| GW Pharmaceuticals PLC ADR (a)(e) | | 225 | 27,612 |
| Halma PLC | | 2,513 | 71,712 |
| Hargreaves Lansdown PLC | | 1,689 | 34,082 |
| HomeServe PLC | | 1,689 | 27,312 |
| Howden Joinery Group PLC | | 3,844 | 26,330 |
| HSBC Holdings PLC (United Kingdom) | | 133,521 | 620,551 |
| IMI PLC | | 1,818 | 20,781 |
| Imperial Brands PLC | | 6,225 | 118,671 |
| Informa PLC | | 9,285 | 53,683 |
| InterContinental Hotel Group PLC | | 1,148 | 50,679 |
| Intermediate Capital Group PLC | | 1,877 | 29,979 |
| Intertek Group PLC | | 1,003 | 67,609 |
| Investec PLC | | 3,485 | 6,974 |
| ITV PLC | | 23,384 | 21,639 |
| J Sainsbury PLC | | 10,261 | 26,535 |
| John David Group PLC | | 2,582 | 19,906 |
| Johnson Matthey PLC | | 1,238 | 32,183 |
| Kingfisher PLC | | 13,453 | 37,012 |
| Land Securities Group PLC | | 4,698 | 32,192 |
| Legal & General Group PLC | | 38,600 | 105,655 |
| Lloyds Banking Group PLC | | 460,207 | 177,530 |
| London Stock Exchange Group PLC | | 2,045 | 212,670 |
| M&G PLC | | 16,215 | 33,664 |
| Marks & Spencer Group PLC | | 10,962 | 13,442 |
| Mediclinic International PLC | | 3,861 | 12,736 |
| Meggitt PLC | | 4,477 | 16,326 |
| Melrose Industries PLC | | 29,912 | 42,253 |
| Micro Focus International PLC | | 2,036 | 10,862 |
| Mondi PLC | | 3,424 | 64,086 |
| National Grid PLC | | 24,374 | 298,756 |
| Network International Holdings PLC (b) | | 1,341 | 7,328 |
| Next PLC | | 826 | 50,090 |
| Ninety One PLC (a) | | 1,742 | 4,447 |
| Ocado Group PLC (a) | | 3,810 | 95,741 |
| Pearson PLC | | 4,876 | 34,711 |
| Pennon Group PLC | | 2,582 | 35,801 |
| Persimmon PLC | | 1,953 | 55,320 |
| Phoenix Group Holdings PLC | | 3,365 | 26,852 |
| Prudential PLC | | 16,789 | 252,978 |
| Quilter PLC (b) | | 14,409 | 24,844 |
| Reckitt Benckiser Group PLC | | 4,759 | 437,821 |
| RELX PLC (London Stock Exchange) | | 12,864 | 298,074 |
| Rentokil Initial PLC | | 12,079 | 76,272 |
| Rightmove PLC | | 5,534 | 37,407 |
| Rio Tinto PLC | | 6,332 | 356,343 |
| Rolls-Royce Holdings PLC | | 11,756 | 41,506 |
| Royal Bank of Scotland Group PLC | | 28,399 | 42,634 |
| Royal Dutch Shell PLC: | | | |
| Class A (United Kingdom) | | 25,607 | 410,000 |
| Class B (United Kingdom) | | 24,917 | 377,749 |
| RSA Insurance Group PLC | | 6,358 | 32,285 |
| Sage Group PLC | | 7,031 | 58,528 |
| Schroders PLC | | 789 | 28,831 |
| Scottish & Southern Energy PLC | | 6,823 | 115,535 |
| Segro PLC | | 7,412 | 82,199 |
| Severn Trent PLC | | 1,469 | 45,124 |
| Smith & Nephew PLC | | 5,894 | 109,827 |
| Smiths Group PLC | | 2,427 | 42,463 |
| Spectris PLC | | 706 | 22,089 |
| Spirax-Sarco Engineering PLC | | 487 | 60,199 |
| SSP Group PLC | | 3,323 | 10,590 |
| St. James's Place Capital PLC | | 3,251 | 38,382 |
| Standard Chartered PLC (United Kingdom) | | 16,562 | 90,317 |
| Standard Life PLC | | 14,423 | 47,824 |
| Tate & Lyle PLC | | 2,686 | 22,219 |
| Taylor Wimpey PLC | | 23,512 | 41,545 |
| Tesco PLC | | 63,197 | 177,752 |
| The Weir Group PLC | | 1,522 | 20,057 |
| Travis Perkins PLC | | 1,609 | 22,439 |
| Unilever PLC | | 7,540 | 406,716 |
| Unite Group PLC | | 2,404 | 28,001 |
| United Utilities Group PLC | | 4,161 | 46,929 |
| Vistry Group PLC | | 1,203 | 10,591 |
| Vodafone Group PLC | | 173,426 | 275,706 |
| Whitbread PLC | | 1,633 | 44,961 |
| WM Morrison Supermarkets PLC | | 14,694 | 34,694 |
|
| TOTAL UNITED KINGDOM | | | 12,196,086 |
|
| United States of America - 0.1% | | | |
| Kolon TissueGene, Inc. unit (a)(c) | | 120 | 801 |
| Stratasys Ltd. (a)(e) | | 312 | 4,948 |
| Yum China Holdings, Inc. | | 2,439 | 117,243 |
|
| TOTAL UNITED STATES OF AMERICA | | | 122,992 |
|
| TOTAL COMMON STOCKS | | | |
| (Cost $142,433,694) | | | 135,497,977 |
|
| Nonconvertible Preferred Stocks - 1.0% | | | |
| Brazil - 0.4% | | | |
| Alpargatas SA (PN) | | 1,100 | 5,923 |
| Azul SA (a) | | 1,500 | 5,547 |
| Banco Bradesco SA (PN) | | 27,892 | 106,170 |
| Bradespar SA (PN) (a) | | 1,400 | 9,399 |
| Centrais Eletricas Brasileiras SA (Electrobras) (PN-B) | | 1,666 | 9,877 |
| Companhia Energetica de Minas Gerais (CEMIG) (PN) | | 7,700 | 15,604 |
| Companhia Paranaense de Energia-Copel (PN-B) | | 600 | 6,710 |
| Gerdau SA | | 7,300 | 21,492 |
| Itau Unibanco Holding SA | | 31,800 | 148,822 |
| Itausa-Investimentos Itau SA (PN) | | 30,460 | 53,716 |
| Lojas Americanas SA (PN) | | 5,037 | 29,806 |
| Metalurgica Gerdau SA (PN) | | 4,100 | 5,511 |
| Petroleo Brasileiro SA - Petrobras (PN) (non-vtg.) | | 30,000 | 118,883 |
| Telefonica Brasil SA | | 2,600 | 22,964 |
|
| TOTAL BRAZIL | | | 560,424 |
|
| Chile - 0.0% | | | |
| Sociedad Quimica y Minera de Chile SA (PN-B) | | 712 | 18,524 |
| Colombia - 0.0% | | | |
| Banco Davivienda SA | | 560 | 4,172 |
| Bancolombia SA (PN) | | 3,358 | 22,071 |
| Grupo Aval Acciones y Valores SA | | 22,147 | 4,891 |
|
| TOTAL COLOMBIA | | | 31,134 |
|
| Germany - 0.3% | | | |
| Henkel AG & Co. KGaA | | 1,156 | 107,642 |
| Porsche Automobil Holding SE (Germany) | | 1,018 | 58,961 |
| Sartorius AG (non-vtg.) | | 220 | 72,322 |
| Volkswagen AG | | 1,193 | 180,865 |
|
| TOTAL GERMANY | | | 419,790 |
|
| Italy - 0.0% | | | |
| Telecom Italia SpA (Risparmio Shares) | | 31,748 | 12,356 |
| Korea (South) - 0.2% | | | |
| Hyundai Motor Co. | | 169 | 7,844 |
| Hyundai Motor Co. Series 2 | | 269 | 12,895 |
| LG Chemical Ltd. | | 103 | 21,724 |
| Samsung Electronics Co. Ltd. | | 5,386 | 210,336 |
|
| TOTAL KOREA (SOUTH) | | | 252,799 |
|
| Russia - 0.1% | | | |
| AK Transneft OAO | | 11 | 20,735 |
| Sberbank of Russia | | 10,240 | 27,213 |
| Surgutneftegas OJSC | | 51,800 | 25,550 |
|
| TOTAL RUSSIA | | | 73,498 |
|
| TOTAL NONCONVERTIBLE PREFERRED STOCKS | | | |
| (Cost $1,728,801) | | | 1,368,525 |
|
| Money Market Funds - 3.2% | | | |
| Fidelity Cash Central Fund 0.12% (f) | | 4,313,250 | 4,314,112 |
| Fidelity Securities Lending Cash Central Fund 0.12% (f)(g) | | 323,712 | 323,744 |
| TOTAL MONEY MARKET FUNDS | | | |
| (Cost $4,637,856) | | | 4,637,856 |
| TOTAL INVESTMENT IN SECURITIES - 99.3% | | | |
| (Cost $148,800,351) | | | 141,504,358 |
| NET OTHER ASSETS (LIABILITIES) - 0.7% | | | 986,473 |
| NET ASSETS - 100% | | | $142,490,831 |
| Futures Contracts | | | | | |
| | Number of contracts | Expiration Date | Notional Amount | Value | Unrealized Appreciation/(Depreciation) |
| Purchased | | | | | |
| Equity Index Contracts | | | | | |
| ICE E-mini MSCI EAFE Index Contracts (United States) | 39 | Sept. 2020 | $3,467,880 | $23,727 | $23,727 |
| ICE E-mini MSCI Emerging Markets Index Contracts (United States) | 33 | Sept. 2020 | 1,626,405 | 15,041 | 15,041 |
| TME S&P/TSX 60 Index Contracts (Canada) | 2 | Sept. 2020 | 273,571 | 5,763 | 5,763 |
| TOTAL FUTURES CONTRACTS | | | | | $44,531 |
The notional amount of futures purchased as a percentage of Net Assets is 3.8%
Categorizations in the Schedule of Investments are based on country or territory of incorporation.
Legend
(a) Non-income producing
(b) Security exempt from registration under Rule 144A of the Securities Act of 1933. These securities may be resold in transactions exempt from registration, normally to qualified institutional buyers. At the end of the period, the value of these securities amounted to $1,916,534 or 1.3% of net assets.
(c) Level 3 security
(d) Security or a portion of the security purchased on a delayed delivery or when-issued basis.
(e) Security or a portion of the security is on loan at period end.
(f) Affiliated fund that is generally available only to investment companies and other accounts managed by Fidelity Investments. The rate quoted is the annualized seven-day yield of the fund at period end. A complete unaudited listing of the fund's holdings as of its most recent quarter end is available upon request. In addition, each Fidelity Central Fund's financial statements are available on the SEC's website or upon request.
(g) Investment made with cash collateral received from securities on loan.
Affiliated Central Funds
Information regarding fiscal year to date income earned by the Fund from investments in Fidelity Central Funds is as follows:
| Fund | Income earned |
| Fidelity Cash Central Fund | $17,546 |
| Fidelity Securities Lending Cash Central Fund | 956 |
| Total | $18,502 |
Amounts in the income column in the above table include any capital gain distributions from underlying funds, which are presented in the corresponding line-item in the Statement of Operations, if applicable. Amount for Fidelity Securities Lending Cash Central Fund represents the income earned on investing cash collateral, less rebates paid to borrowers and any lending agent fees associated with the loan, plus any premium payments received for lending certain types of securities.
Investment Valuation
The following is a summary of the inputs used, as of June 30, 2020, involving the Fund's assets and liabilities carried at fair value. The inputs or methodology used for valuing securities may not be an indication of the risk associated with investing in those securities. For more information on valuation inputs, and their aggregation into the levels used below, please refer to the Investment Valuation section in the accompanying Notes to Financial Statements.
| | Valuation Inputs at Reporting Date: |
| Description | Total | Level 1 | Level 2 | Level 3 |
| Investments in Securities: | | | | |
| Equities: | | | | |
| Communication Services | $10,842,933 | $3,966,609 | $6,876,324 | $-- |
| Consumer Discretionary | 16,469,074 | 9,402,918 | 7,066,156 | -- |
| Consumer Staples | 13,075,580 | 5,280,319 | 7,795,261 | -- |
| Energy | 6,253,032 | 3,851,219 | 2,401,813 | -- |
| Financials | 25,144,287 | 14,301,958 | 10,842,329 | -- |
| Health Care | 14,028,675 | 4,617,795 | 9,406,338 | 4,542 |
| Industrials | 16,858,654 | 8,335,380 | 8,523,274 | -- |
| Information Technology | 14,991,142 | 6,680,994 | 8,310,148 | -- |
| Materials | 10,119,118 | 5,738,749 | 4,375,413 | 4,956 |
| Real Estate | 4,360,391 | 3,721,394 | 638,997 | -- |
| Utilities | 4,723,616 | 2,970,213 | 1,753,403 | -- |
| Money Market Funds | 4,637,856 | 4,637,856 | -- | -- |
| Total Investments in Securities: | $141,504,358 | $73,505,404 | $67,989,456 | $9,498 |
| Derivative Instruments: | | | | |
| Assets | | | | |
| Futures Contracts | $44,531 | $44,531 | $-- | $-- |
| Total Assets | $44,531 | $44,531 | $-- | $-- |
| Total Derivative Instruments: | $44,531 | $44,531 | $-- | $-- |
Value of Derivative Instruments
The following table is a summary of the Fund's value of derivative instruments by primary risk exposure as of June 30, 2020. For additional information on derivative instruments, please refer to the Derivative Instruments section in the accompanying Notes to Financial Statements.
| Primary Risk Exposure / Derivative Type | Value |
| | Asset | Liability |
| Equity Risk | | |
| Futures Contracts(a) | $44,531 | $0 |
| Total Equity Risk | 44,531 | 0 |
| Total Value of Derivatives | $44,531 | $0 |
(a) Reflects gross cumulative appreciation (depreciation) on futures contracts as presented in the Schedule of Investments. In the Statement of Assets and Liabilities, the period end daily variation margin is included in receivable or payable for daily variation margin on futures contracts, and the net cumulative appreciation (depreciation) is included in Total accumulated earnings (loss).
See accompanying notes which are an integral part of the financial statements.
VIP International Index Portfolio
Financial Statements
Statement of Assets and Liabilities
| | | June 30, 2020 (Unaudited) |
| Assets | | |
Investment in securities, at value (including securities loaned of $316,923) — See accompanying schedule:
Unaffiliated issuers (cost $144,162,495) | $136,866,502 | |
| Fidelity Central Funds (cost $4,637,856) | 4,637,856 | |
| Total Investment in Securities (cost $148,800,351) | | $141,504,358 |
| Segregated cash with brokers for derivative instruments | | 494,073 |
| Foreign currency held at value (cost $276,642) | | 276,525 |
| Receivable for investments sold | | 6,768 |
| Receivable for fund shares sold | | 320,501 |
| Dividends receivable | | 358,119 |
| Distributions receivable from Fidelity Central Funds | | 733 |
| Other receivables | | 911 |
| Total assets | | 142,961,988 |
| Liabilities | | |
| Payable to custodian bank | $7,143 | |
| Payable for investments purchased | | |
| Regular delivery | 10,220 | |
| Delayed delivery | 16,967 | |
| Payable for fund shares redeemed | 80,198 | |
| Accrued management fee | 12,765 | |
| Distribution and service plan fees payable | 2,099 | |
| Payable for daily variation margin on futures contracts | 10,206 | |
| Other affiliated payables | 6,963 | |
| Other payables and accrued expenses | 821 | |
| Collateral on securities loaned | 323,775 | |
| Total liabilities | | 471,157 |
| Net Assets | | $142,490,831 |
| Net Assets consist of: | | |
| Paid in capital | | $150,173,336 |
| Total accumulated earnings (loss) | | (7,682,505) |
| Net Assets | | $142,490,831 |
| Net Asset Value and Maximum Offering Price | | |
| Initial Class: | | |
| Net Asset Value, offering price and redemption price per share ($129,441,200 ÷ 14,434,305 shares) | | $8.97 |
| Service Class: | | |
| Net Asset Value, offering price and redemption price per share ($4,731,972 ÷ 528,192 shares) | | $8.96 |
| Service Class 2: | | |
| Net Asset Value, offering price and redemption price per share ($8,317,659 ÷ 929,862 shares) | | $8.95 |
See accompanying notes which are an integral part of the financial statements.
Statement of Operations
| | | Six months ended June 30, 2020 (Unaudited) |
| Investment Income | | |
| Dividends | | $1,884,325 |
| Interest | | 970 |
| Income from Fidelity Central Funds (including $956 from security lending) | | 18,502 |
| Income before foreign taxes withheld | | 1,903,797 |
| Less foreign taxes withheld | | (203,344) |
| Total income | | 1,700,453 |
| Expenses | | |
| Management fee | $69,970 | |
| Transfer agent fees | 38,165 | |
| Distribution and service plan fees | 10,477 | |
| Independent trustees' fees and expenses | 392 | |
| Miscellaneous | 2,509 | |
| Total expenses before reductions | 121,513 | |
| Expense reductions | (258) | |
| Total expenses after reductions | | 121,255 |
| Net investment income (loss) | | 1,579,198 |
| Realized and Unrealized Gain (Loss) | | |
| Net realized gain (loss) on: | | |
| Investment securities: | | |
| Unaffiliated issuers (net of foreign taxes of $259) | (1,368,819) | |
| Fidelity Central Funds | (208) | |
| Foreign currency transactions | (6,502) | |
| Futures contracts | (305,637) | |
| Total net realized gain (loss) | | (1,681,166) |
| Change in net unrealized appreciation (depreciation) on: | | |
| Investment securities: | | |
| Unaffiliated issuers (net of decrease in deferred foreign taxes of $21,356) | (14,015,120) | |
| Assets and liabilities in foreign currencies | (2,053) | |
| Futures contracts | 6,504 | |
| Total change in net unrealized appreciation (depreciation) | | (14,010,669) |
| Net gain (loss) | | (15,691,835) |
| Net increase (decrease) in net assets resulting from operations | | $(14,112,637) |
See accompanying notes which are an integral part of the financial statements.
Statement of Changes in Net Assets
| | Six months ended June 30, 2020 (Unaudited) | Year ended December 31, 2019 |
| Increase (Decrease) in Net Assets | | |
| Operations | | |
| Net investment income (loss) | $1,579,198 | $2,527,356 |
| Net realized gain (loss) | (1,681,166) | 210,679 |
| Change in net unrealized appreciation (depreciation) | (14,010,669) | 14,144,549 |
| Net increase (decrease) in net assets resulting from operations | (14,112,637) | 16,882,584 |
| Distributions to shareholders | (28,194) | (2,817,379) |
| Share transactions - net increase (decrease) | 21,290,251 | 64,936,926 |
| Total increase (decrease) in net assets | 7,149,420 | 79,002,131 |
| Net Assets | | |
| Beginning of period | 135,341,411 | 56,339,280 |
| End of period | $142,490,831 | $135,341,411 |
See accompanying notes which are an integral part of the financial statements.
Financial Highlights
VIP International Index Portfolio Initial Class
| | Six months ended (Unaudited) June 30, | Years endedDecember 31, | |
| | 2020 | 2019 | 2018 A |
| Selected Per–Share Data | | | |
| Net asset value, beginning of period | $10.03 | $8.45 | $10.00 |
| Income from Investment Operations | | | |
| Net investment income (loss)B | .11 | .27 | .15 |
| Net realized and unrealized gain (loss) | (1.17) | 1.54 | (1.60) |
| Total from investment operations | (1.06) | 1.81 | (1.45) |
| Distributions from net investment income | – | (.21) | (.10) |
| Distributions from net realized gain | –C | (.02) | (.01) |
| Total distributions | –C | (.23) | (.10)D |
| Net asset value, end of period | $8.97 | $10.03 | $8.45 |
| Total ReturnE,F,G | (10.55)% | 21.53% | (14.47)% |
| Ratios to Average Net AssetsH,I | | | |
| Expenses before reductions | .17%J | .17% | .17%J |
| Expenses net of fee waivers, if any | .17%J | .17% | .17%J |
| Expenses net of all reductions | .17%J | .17% | .17%J |
| Net investment income (loss) | 2.50%J | 2.88% | 2.27%J |
| Supplemental Data | | | |
| Net assets, end of period (000 omitted) | $129,441 | $125,050 | $55,494 |
| Portfolio turnover rateK | 13%J | 4% | 5%J |
A For the period April 17, 2018 (commencement of operations) to December 31, 2018.
B Calculated based on average shares outstanding during the period.
C Amount represents less than $.005 per share.
D Total distributions of $.10 per share is comprised of distributions from net investment income of $.096 and distributions from net realized gain of $.007 per share.
E Total returns for periods of less than one year are not annualized.
F Total returns do not reflect charges attributable to your insurance company's separate account. Inclusion of these charges would reduce the total returns shown.
G Total returns would have been lower if certain expenses had not been reduced during the applicable periods shown.
H Fees and expenses of any underlying Fidelity Central Funds are not included in the Fund's expense ratio. The Fund indirectly bears its proportionate share of the expenses of any underlying Fidelity Central Funds.
I Expense ratios reflect operating expenses of the class. Expenses before reductions do not reflect amounts reimbursed by the investment adviser or reductions from expense offset arrangements and do not represent the amount paid by the class during periods when reimbursements or reductions occur. Expenses net of fee waivers reflect expenses after reimbursement by the investment adviser but prior to reductions from expense offset arrangements. Expenses net of all reductions represent the net expenses paid by the class.
J Annualized
K Amount does not include the portfolio activity of any underlying Fidelity Central Funds.
See accompanying notes which are an integral part of the financial statements.
VIP International Index Portfolio Service Class
| | Six months ended (Unaudited) June 30, | Year endedDecember 31, |
| | 2020 | 2019 A |
| Selected Per–Share Data | | |
| Net asset value, beginning of period | $10.02 | $9.48 |
| Income from Investment Operations | | |
| Net investment income (loss)B | .10 | .16 |
| Net realized and unrealized gain (loss) | (1.16) | .61 |
| Total from investment operations | (1.06) | .77 |
| Distributions from net investment income | – | (.20) |
| Distributions from net realized gain | –C | (.02) |
| Total distributions | –C | (.23)D |
| Net asset value, end of period | $8.96 | $10.02 |
| Total ReturnE,F,G | (10.56)% | 8.15% |
| Ratios to Average Net AssetsH,I | | |
| Expenses before reductions | .27%J | .27%J |
| Expenses net of fee waivers, if any | .27%J | .27%J |
| Expenses net of all reductions | .27%J | .27%J |
| Net investment income (loss) | 2.40%J | 2.90%J |
| Supplemental Data | | |
| Net assets, end of period (000 omitted) | $4,732 | $4,701 |
| Portfolio turnover rateK | 13%J | 4% |
A For the period April 11, 2019 (commencement of sale of shares) to December 31, 2019.
B Calculated based on average shares outstanding during the period.
C Amount represents less than $.005 per share.
D Total distributions of $.23 per share is comprised of distributions from net investment income of $.204 and distributions from net realized gain of $.021 per share.
E Total returns for periods of less than one year are not annualized.
F Total returns do not reflect charges attributable to your insurance company's separate account. Inclusion of these charges would reduce the total returns shown.
G Total returns would have been lower if certain expenses had not been reduced during the applicable periods shown.
H Fees and expenses of any underlying Fidelity Central Funds are not included in the Fund's expense ratio. The Fund indirectly bears its proportionate share of the expenses of any underlying Fidelity Central Funds.
I Expense ratios reflect operating expenses of the class. Expenses before reductions do not reflect amounts reimbursed by the investment adviser or reductions from expense offset arrangements and do not represent the amount paid by the class during periods when reimbursements or reductions occur. Expenses net of fee waivers reflect expenses after reimbursement by the investment adviser but prior to reductions from expense offset arrangements. Expenses net of all reductions represent the net expenses paid by the class.
J Annualized
K Amount does not include the portfolio activity of any underlying Fidelity Central Funds.
See accompanying notes which are an integral part of the financial statements.
VIP International Index Portfolio Service Class 2
| | Six months ended (Unaudited) June 30, | Years endedDecember 31, | |
| | 2020 | 2019 | 2018 A |
| Selected Per–Share Data | | | |
| Net asset value, beginning of period | $10.02 | $8.46 | $10.00 |
| Income from Investment Operations | | | |
| Net investment income (loss)B | .10 | .25 | .13 |
| Net realized and unrealized gain (loss) | (1.17) | 1.53 | (1.58) |
| Total from investment operations | (1.07) | 1.78 | (1.45) |
| Distributions from net investment income | – | (.20) | (.08) |
| Distributions from net realized gain | –C | (.02) | (.01) |
| Total distributions | –C | (.22) | (.09) |
| Net asset value, end of period | $8.95 | $10.02 | $8.46 |
| Total ReturnD,E,F | (10.66)% | 21.16% | (14.55)% |
| Ratios to Average Net AssetsG,H | | | |
| Expenses before reductions | .42%I | .42% | .42%I |
| Expenses net of fee waivers, if any | .42%I | .42% | .42%I |
| Expenses net of all reductions | .42%I | .42% | .42%I |
| Net investment income (loss) | 2.25%I | 2.63% | 2.02%I |
| Supplemental Data | | | |
| Net assets, end of period (000 omitted) | $8,318 | $5,590 | $846 |
| Portfolio turnover rateJ | 13%I | 4% | 5%I |
A For the period April 17, 2018 (commencement of operations) to December 31, 2018.
B Calculated based on average shares outstanding during the period.
C Amount represents less than $.005 per share.
D Total returns for periods of less than one year are not annualized.
E Total returns do not reflect charges attributable to your insurance company's separate account. Inclusion of these charges would reduce the total returns shown.
F Total returns would have been lower if certain expenses had not been reduced during the applicable periods shown.
G Fees and expenses of any underlying Fidelity Central Funds are not included in the Fund's expense ratio. The Fund indirectly bears its proportionate share of the expenses of any underlying Fidelity Central Funds.
H Expense ratios reflect operating expenses of the class. Expenses before reductions do not reflect amounts reimbursed by the investment adviser or reductions from expense offset arrangements and do not represent the amount paid by the class during periods when reimbursements or reductions occur. Expenses net of fee waivers reflect expenses after reimbursement by the investment adviser but prior to reductions from expense offset arrangements. Expenses net of all reductions represent the net expenses paid by the class.
I Annualized
J Amount does not include the portfolio activity of any underlying Fidelity Central Funds.
See accompanying notes which are an integral part of the financial statements.
Notes to Financial Statements (Unaudited)
For the period ended June 30, 2020
1. Organization.
VIP Total Market Index Portfolio, VIP Extended Market Index Portfolio and VIP International Index Portfolio (the Funds) are funds of Variable Insurance Products Fund II (the Trust). Each Fund is authorized to issue an unlimited number of shares. The Trust is registered under the Investment Company Act of 1940, as amended (the 1940 Act), as an open-end management investment company organized as a Massachusetts business trust. Shares of each Fund may only be purchased by insurance companies for the purpose of funding variable annuity or variable life insurance contracts. Each Fund offers the following classes of shares: Initial Class, Service Class and Service Class 2 shares. All classes have equal rights and voting privileges, except for matters affecting a single class.
Effective January 1, 2020:
Investment advisers Fidelity Investments Money Management, Inc., FMR Co., Inc., and Fidelity SelectCo, LLC, merged with and into Fidelity Management & Research Company. In connection with the merger transactions, the resulting, merged investment adviser was then redomiciled from Massachusetts to Delaware, changed its corporate structure from a corporation to a limited liability company, and changed its name to "Fidelity Management & Research Company LLC".
Broker-dealer Fidelity Distributors Corporation merged with and into Fidelity Investments Institutional Services Company, Inc. ("FIISC"). FIISC was then redomiciled from Massachusetts to Delaware, changed its corporate structure from a corporation to a limited liability company, and changed its name to "Fidelity Distributors Company LLC".
Fidelity Investments Institutional Operations Company, Inc. converted from a Massachusetts corporation to a Massachusetts LLC, and changed its name to "Fidelity Investments Institutional Operations Company LLC".
2. Investments in Fidelity Central Funds.
The Funds invest in Fidelity Central Funds, which are open-end investment companies generally available only to other investment companies and accounts managed by the investment adviser and its affiliates. The Funds' Schedules of Investments list each of the Fidelity Central Funds held as of period end, if any, as an investment of each Fund, but do not include the underlying holdings of each Fidelity Central Fund. As an Investing Fund, each Fund indirectly bears its proportionate share of the expenses of the underlying Fidelity Central Funds.
The Money Market Central Funds seek preservation of capital and current income and are managed by the investment adviser. Annualized expenses of the Money Market Central Funds as of their most recent shareholder report date ranged from less than .005% to .01%.
A complete unaudited list of holdings for each Fidelity Central Fund is available upon request or at the Securities and Exchange Commission (the SEC) website at www.sec.gov. In addition, the financial statements of the Fidelity Central Funds are available on the SEC website or upon request.
3. Significant Accounting Policies.
Each Fund is an investment company and applies the accounting and reporting guidance of the Financial Accounting Standards Board (FASB) Accounting Standards Codification Topic 946 Financial Services – Investments Companies. The financial statements have been prepared in conformity with accounting principles generally accepted in the United States of America (GAAP), which require management to make certain estimates and assumptions at the date of the financial statements. Actual results could differ from those estimates. Subsequent events, if any, through the date that the financial statements were issued have been evaluated in the preparation of the financial statements. The following summarizes the significant accounting policies of the Funds:
Investment Valuation. Investments are valued as of 4:00 p.m. Eastern time on the last calendar day of the period. The Board of Trustees (the Board) has delegated the day to day responsibility for the valuation of each Fund's investments to the Fair Value Committee (the Committee) established by each Fund's investment adviser. In accordance with valuation policies and procedures approved by the Board, each Fund attempts to obtain prices from one or more third party pricing vendors or brokers to value its investments. When current market prices, quotations or currency exchange rates are not readily available or reliable, investments will be fair valued in good faith by the Committee, in accordance with procedures adopted by the Board. Factors used in determining fair value vary by investment type and may include market or investment specific events. The frequency with which these procedures are used cannot be predicted and they may be utilized to a significant extent. The Committee oversees each Fund's valuation policies and procedures and reports to the Board on the Committee's activities and fair value determinations. The Board monitors the appropriateness of the procedures used in valuing each Fund's investments and ratifies the fair value determinations of the Committee.
Each Fund categorizes the inputs to valuation techniques used to value its investments into a disclosure hierarchy consisting of three levels as shown below:
- Level 1 – quoted prices in active markets for identical investments
- Level 2 – other significant observable inputs (including quoted prices for similar investments, interest rates, prepayment speeds, etc.)
- Level 3 – unobservable inputs (including the Fund's own assumptions based on the best information available)
Valuation techniques used to value each Fund's investments by major category are as follows:
Equity securities, including restricted securities, for which market quotations are readily available, are valued at the last reported sale price or official closing price as reported by a third party pricing vendor on the primary market or exchange on which they are traded and are categorized as Level 1 in the hierarchy. In the event there were no sales during the day or closing prices are not available, securities are valued at the last quoted bid price or may be valued using the last available price and are generally categorized as Level 2 in the hierarchy. For foreign equity securities, when market or security specific events arise, comparisons to the valuation of American Depositary Receipts (ADRs), futures contracts, Exchange-Traded Funds (ETFs) and certain indexes as well as quoted prices for similar securities may be used and would be categorized as Level 2 in the hierarchy. For equity securities, including restricted securities, where observable inputs are limited, assumptions about market activity and risk are used and these securities may be categorized as Level 3 in the hierarchy.
Futures contracts are valued at the settlement price established each day by the board of trade or exchange on which they are traded and are categorized as Level 1 in the hierarchy. Investments in open-end mutual funds, including the Fidelity Central Funds, are valued at their closing net asset value (NAV) each business day and are categorized as Level 1 in the hierarchy.
Changes in valuation techniques may result in transfers in or out of an assigned level within the disclosure hierarchy. The aggregate value of investments by input level as of June 30, 2020 is included at the end of each Fund's Schedule of Investments.
Foreign Currency. Foreign-denominated assets, including investment securities, and liabilities are translated into U.S. dollars at the exchange rates at period end. Purchases and sales of investment securities, income and dividends received and expenses denominated in foreign currencies are translated into U.S. dollars at the exchange rate in effect on the transaction date.
The effects of exchange rate fluctuations on investments are included with the net realized and unrealized gain (loss) on investment securities. Other foreign currency transactions resulting in realized and unrealized gain (loss) are disclosed separately.
Realized gains and losses on foreign currency transactions arise from the disposition of foreign currency, realized changes in the value of foreign currency between the trade and settlement dates on security transactions, and the difference between the amounts of dividends, interest and foreign withholding taxes recorded on transaction date and the U.S. dollar equivalent of the amounts actually received or paid. Unrealized gains and losses on assets and liabilities in foreign currencies arise from changes in the value of foreign currency, and from assets and liabilities denominated in foreign currencies, other than investments, which are held at period end.
Investment Transactions and Income. For financial reporting purposes, the Funds' investment holdings and NAV include trades executed through the end of the last business day of the period. The NAV per share for processing shareholder transactions is calculated as of the close of business of the New York Stock Exchange (NYSE), normally 4:00 p.m. Eastern time and includes trades executed through the end of the prior business day. Gains and losses on securities sold are determined on the basis of identified cost. Dividend income is recorded on the ex-dividend date, except for certain dividends from foreign securities where the ex-dividend date may have passed, which are recorded as soon as the Funds are informed of the ex-dividend date. Non-cash dividends included in dividend income, if any, are recorded at the fair market value of the securities received. Income and capital gain distributions from Fidelity Central Funds, if any, are recorded on the ex-dividend date. Certain distributions received by the Funds represent a return of capital or capital gain. The Funds determine the components of these distributions subsequent to the ex-dividend date, based upon receipt of tax filings or other correspondence relating to the underlying investment. These distributions are recorded as a reduction of cost of investments and/or as a realized gain. Interest income is accrued as earned and includes coupon interest and amortization of premium and accretion of discount on debt securities as applicable. Investment income is recorded net of foreign taxes withheld where recovery of such taxes is uncertain.
Class Allocations and Expenses. Investment income, realized and unrealized capital gains and losses, common expenses of each Fund, and certain fund-level expense reductions, if any, are allocated daily on a pro-rata basis to each class based on the relative net assets of each class to the total net assets of each Fund. Each class differs with respect to transfer agent and distribution and service plan fees incurred. Certain expense reductions may also differ by class. For the reporting period, the allocated portion of income and expenses to each class as a percent of its average net assets may vary due to the timing of recording these transactions in relation to fluctuating net assets of the classes. Expenses directly attributable to a fund are charged to that fund. Expenses attributable to more than one fund are allocated among the respective funds on the basis of relative net assets or other appropriate methods. Expense estimates are accrued in the period to which they relate and adjustments are made when actual amounts are known.
Income Tax Information and Distributions to Shareholders. Each year, each Fund intends to qualify as a regulated investment company under Subchapter M of the Internal Revenue Code, including distributing substantially all of its taxable income and realized gains. As a result, no provision for U.S. Federal income taxes is required. Each Fund files a U.S. federal tax return, in addition to state and local tax returns as required. Each Fund's federal income tax returns are subject to examination by the Internal Revenue Service (IRS) for a period of three fiscal years after they are filed. State and local tax returns may be subject to examination for an additional fiscal year depending on the jurisdiction. Foreign taxes are provided for based on each Fund's understanding of the tax rules and rates that exist in the foreign markets in which it invests. VIP International Index Portfolio is subject to a tax imposed on capital gains by certain countries in which it invests.
Distributions are declared and recorded on the ex-dividend date. Income and capital gain distributions are declared separately for each class. Income and capital gain distributions are determined in accordance with income tax regulations, which may differ from GAAP.
Capital accounts within the financial statements are adjusted for permanent book-tax differences. These adjustments have no impact on net assets or the results of operations. Capital accounts are not adjusted for temporary book-tax differences which will reverse in a subsequent period.
Book-tax differences are primarily due to futures contracts, foreign currency transactions, certain deemed distributions, certain foreign taxes, passive foreign investment companies (PFIC), market discount, partnerships, capital loss carryforwards and losses deferred due to wash sales and excise tax regulations.
As of period end, the cost and unrealized appreciation (depreciation) in securities, and derivatives if applicable, for federal income tax purposes were as follows for each Fund:
| | Tax cost | Gross unrealized appreciation | Gross unrealized depreciation | Net unrealized appreciation (depreciation) |
| VIP Total Market Index Portfolio | $174,396,970 | $31,088,081 | $(18,934,711) | $12,153,370 |
| VIP Extended Market Index Portfolio | 84,332,332 | 8,295,911 | (16,436,788) | (8,140,877) |
| VIP International Index Portfolio | 149,166,585 | 13,460,631 | (21,078,327) | (7,617,696) |
Certain of the Funds elected to defer to the next fiscal year capital losses recognized during the period November 1, 2019 to December 31, 2019. Loss deferrals were as follows:
| | Capital losses |
| VIP Extended Market Index Portfolio | $(811) |
Delayed Delivery Transactions and When-Issued Securities. During the period, certain Funds transacted in securities on a delayed delivery or when-issued basis. Payment and delivery may take place after the customary settlement period for that security. The price of the underlying securities and the date when the securities will be delivered and paid for are fixed at the time the transaction is negotiated. The securities purchased on a delayed delivery or when-issued basis are identified as such in each applicable Fund's Schedule of Investments. Losses may arise due to changes in the value of the underlying securities or if the counterparty does not perform under the contract's terms, or if the issuer does not issue the securities due to political, economic, or other factors.
Restricted Securities (including Private Placements). The Funds may invest in securities that are subject to legal or contractual restrictions on resale. These securities generally may be resold in transactions exempt from registration or to the public if the securities are registered. Disposal of these securities may involve time-consuming negotiations and expense, and prompt sale at an acceptable price may be difficult. Information regarding restricted securities is included at the end of each applicable Fund's Schedule of Investments.
4. Derivative Instruments.
Risk Exposures and the Use of Derivative Instruments. The Funds' investment objective allows the Funds to enter into various types of derivative contracts, including futures contracts. Derivatives are investments whose value is primarily derived from underlying assets, indices or reference rates and may be transacted on an exchange or over-the-counter (OTC). Derivatives may involve a future commitment to buy or sell a specified asset based on specified terms, to exchange future cash flows at periodic intervals based on a notional principal amount, or for one party to make one or more payments upon the occurrence of specified events in exchange for periodic payments from the other party.
The Funds used derivatives to increase returns and to manage exposure to certain risks as defined below. The success of any strategy involving derivatives depends on analysis of numerous economic factors, and if the strategies for investment do not work as intended, the Funds may not achieve their objectives.
The Funds' use of derivatives increased or decreased their exposure to the following risk:
| Equity Risk | Equity risk relates to the fluctuations in the value of financial instruments as a result of changes in market prices (other than those arising from interest rate risk or foreign exchange risk), whether caused by factors specific to an individual investment, its issuer, or all factors affecting all instruments traded in a market or market segment.
|
The Funds are also exposed to additional risks from investing in derivatives, such as liquidity risk and counterparty credit risk. Liquidity risk is the risk that the Funds will be unable to close out the derivative in the open market in a timely manner. Counterparty credit risk is the risk that the counterparty will not be able to fulfill its obligation to the Funds. Counterparty credit risk related to exchange-traded futures contracts may be mitigated by the protection provided by the exchange on which they trade.
Investing in derivatives may involve greater risks than investing in the underlying assets directly and, to varying degrees, may involve risk of loss in excess of any initial investment and collateral received and amounts recognized in the Statement of Assets and Liabilities. In addition, there may be the risk that the change in value of the derivative contract does not correspond to the change in value of the underlying instrument.
Futures Contracts. A futures contract is an agreement between two parties to buy or sell a specified underlying instrument for a fixed price at a specified future date. The Funds used futures contracts to manage their exposure to the stock market.
Upon entering into a futures contract, a fund is required to deposit either cash or securities (initial margin) with a clearing broker in an amount equal to a certain percentage of the face value of the contract. Futures contracts are marked-to-market daily and subsequent daily payments (variation margin) are made or received by a fund depending on the daily fluctuations in the value of the futures contracts and are recorded as unrealized appreciation or (depreciation). This receivable and/or payable, if any, is included in daily variation margin on futures contracts in the Statement of Assets and Liabilities. Realized gain or (loss) is recorded upon the expiration or closing of a futures contract. The net realized gain (loss) and change in net unrealized appreciation (depreciation) on futures contracts during the period is presented in the Statement of Operations.
Any open futures contracts at period end are presented in the Schedule of Investments under the caption "Futures Contracts". The notional amount at value reflects each contract's exposure to the underlying instrument or index at period end and is representative of volume of activity during the period. Cash deposited to meet initial margin requirements is presented as segregated cash with brokers for derivative instruments in the Statement of Assets and Liabilities.
5. Purchases and Sales of Investments.
Purchases and sales of securities, other than short-term securities, are noted in the table below.
| | Purchases ($) | Sales ($) |
| VIP Total Market Index Portfolio | 28,774,862 | 13,417,409 |
| VIP Extended Market Index Portfolio | 19,075,140 | 13,194,348 |
| VIP International Index Portfolio | 37,668,800 | 7,770,255 |
6. Fees and Other Transactions with Affiliates.
Management Fee and Expense Contract. Fidelity Management & Research Company LLC (the investment adviser) and its affiliates provide the Funds with investment management related services for which the Funds pay a monthly management fee. The management fee is based on an annual rate of .06%, .07% and .11% of VIP Total Market Index Portfolio's, VIP Extended Market Index Portfolio's and VIP International Index Portfolio's average net assets, respectively. Under the management contract, the investment adviser pays all other fund-level expenses, except the compensation of the independent Trustees and certain miscellaneous expenses such as proxy and shareholder meeting expenses.
In addition, under the expense contract, the investment adviser pays class-level expenses as necessary so that the total expenses do not exceed certain amounts of each class' average net assets on an annual basis with certain exceptions, as noted in the following table:
| | Initial Class | Service Class | Service Class 2 |
| VIP Total Market Index Portfolio | .12% | .22% | .37% |
| VIP Extended Market Index Portfolio | .13% | .23% | .38% |
| VIP International Index Portfolio | .17% | .27% | .42% |
Sub-Adviser. Geode Capital Management, LLC (Geode), serves as sub-adviser for the Funds. Geode provides discretionary investment advisory services to the Funds and is paid by the investment adviser for providing these services.
Distribution and Service Plan Fees. In accordance with Rule 12b-1 of the 1940 Act, the Funds have adopted separate 12b-1 Plans for each Service Class of shares. Each Service Class pays Fidelity Distributors Company LLC (FDC), an affiliate of the investment adviser, a service fee. For the period, the service fee is based on an annual rate of .10% of Service Class' average net assets and .25% of Service Class 2's average net assets.
For the period, total fees, all of which were reallowed to insurance companies for the distribution of shares and providing shareholder support services were as follows:
| | Service Class | Service Class 2 | Total |
| VIP Total Market Index Portfolio | $104 | $2,126 | $2,230 |
| VIP Extended Market Index Portfolio | 1,285 | 1,252 | 2,537 |
| VIP International Index Portfolio | 2,210 | 8,267 | 10,477 |
Transfer Agent Fees. Fidelity Investments Institutional Operations Company LLC (FIIOC), an affiliate of the investment adviser, is the transfer, dividend disbursing and shareholder servicing agent for each class of the Funds. For each Fund, FIIOC receives asset-based fees based on each class's average net assets for transfer agent services, typesetting, and printing and mailing of shareholder reports, excluding mailing of proxy statements. Effective February 1, 2020, the Board approved to change the fee from .065% to .064%. Under the expense contract, each class of each Fund pays a portion of the transfer agent fees equal to an annual rate of .06% of class-level average net assets. For the period, the total transfer agent fees paid by each applicable class were as follows:
| | Amount |
| VIP Total Market Index Portfolio | |
| Initial Class | $50,370 |
| Service Class | 62 |
| Service Class 2 | 510 |
| | $50,942 |
| VIP Extended Market Index Portfolio | |
| Initial Class | $19,262 |
| Service Class | 771 |
| Service Class 2 | 300 |
| | $20,333 |
| VIP International Index Portfolio | |
| Initial Class | $34,855 |
| Service Class | 1,326 |
| Service Class 2 | 1,984 |
| | $38,165 |
Interfund Trades. Funds may purchase from or sell securities to other Fidelity Funds under procedures adopted by the Board. The procedures have been designed to ensure these interfund trades are executed in accordance with Rule 17a-7 of the 1940 Act. Interfund trades are included within the respective purchases and sales amounts shown in the Purchases and Sales of Investments note.
7. Committed Line of Credit.
Certain Funds participate with other funds managed by the investment adviser or an affiliate in a $4.25 billion credit facility (the "line of credit") to be utilized for temporary or emergency purposes to fund shareholder redemptions or for other short-term liquidity purposes. The participating funds have agreed to pay commitment fees on their pro-rata portion of the line of credit, which are reflected in Miscellaneous expenses on the Statement of Operations, and are as follows:
| | Amount |
| VIP Total Market Index Portfolio | $204 |
| VIP Extended Market Index Portfolio | 88 |
| VIP International Index Portfolio | 151 |
During the period, there were no borrowings on this line of credit.
8. Security Lending.
Certain Funds lend portfolio securities from time to time in order to earn additional income. For equity securities, lending agents are used, including National Financial Services (NFS), an affiliate of the Funds. Pursuant to a securities lending agreement, NFS will receive a fee, which is capped at 9.9% of a Fund's daily lending revenue, for its services as lending agent. The Funds may lend securities to certain qualified borrowers, including NFS. On the settlement date of the loan, each applicable Fund receives collateral (in the form of U.S. Treasury obligations, letters of credit and/or cash) against the loaned securities and maintains collateral in an amount not less than 100% of the market value of the loaned securities during the period of the loan. The market value of the loaned securities is determined at the close of business of the Funds and any additional required collateral is delivered to the Funds on the next business day. The Funds or borrower may terminate the loan at any time, and if the borrower defaults on its obligation to return the securities loaned because of insolvency or other reasons, the Funds may apply collateral received from the borrower against the obligation. The Funds may experience delays and costs in recovering the securities loaned. Any cash collateral received is invested in the Fidelity Securities Lending Cash Central Fund. The value of loaned securities and cash collateral at period end are disclosed on each applicable Fund's Statement of Assets and Liabilities. Security lending income represents the income earned on investing cash collateral, less rebates paid to borrowers and any lending agent fees associated with the loan, plus any premium payments received for lending certain types of securities. Security lending income is presented on each applicable Fund's Statement of Operations as a component of income from Fidelity Central Funds. Affiliated security lending activity was as follows:
| | Total Security Lending Income Fees Paid to NFS | Security Lending Income From Securities Loaned to NFS | Value of Securities Loaned to NFS at Period End |
| VIP Total Market Index Portfolio | $587 | $199 | $16,550 |
| VIP Extended Market Index Portfolio | $1,981 | $595 | $35,199 |
| VIP International Index Portfolio | $15 | $– | $– |
9. Expense Reductions.
Through arrangements with each applicable Fund's custodian, credits realized as a result of certain uninvested cash balances were used to reduce each applicable Fund's or class' expenses. All of the applicable expense reductions are noted in the table below.
| | Custodian credits |
| VIP Total Market Index Portfolio | $37 |
| VIP Extended Market Index Portfolio | 710 |
| VIP International Index Portfolio | 258 |
10. Distributions to Shareholders.
Distributions to shareholders of each class were as follows:
| | Six months ended
June 30, 2020 | Year ended
December 31, 2019(a) |
| VIP Total Market Index Portfolio | | |
| Distributions to shareholders | | |
| Initial Class | $260,654 | $2,757,941 |
| Service Class | 159 | 1,780 |
| Service Class 2 | 2,496 | 21,452 |
| Total | $263,309 | $2,781,173 |
| VIP Extended Market Index Portfolio | | |
| Distributions to shareholders | | |
| Initial Class | $– | $1,482,712 |
| Service Class | – | 22,293 |
| Service Class 2 | – | 21,028 |
| Total | $– | $1,526,033 |
| VIP International Index Portfolio | | |
| Distributions to shareholders | | |
| Initial Class | $25,877 | $2,702,765 |
| Service Class | 953 | 2,374 |
| Service Class 2 | 1,364 | 112,240 |
| Total | $28,194 | $2,817,379 |
(a) Distributions for Service Class are for the period April 11, 2019 (commencement of sale of shares) to December 31, 2019.
11. Share Transactions.
Transactions for each class of shares were as follows:
| | Shares | Shares | Dollars | Dollars |
| | Six months ended June 30, 2020 | Year ended December 31, 2019(a) | Six months ended June 30, 2020 | Year ended December 31, 2019(a) |
| VIP Total Market Index Portfolio | | | | |
| Initial Class | | | | |
| Shares sold | 4,002,880 | 6,591,795 | $43,037,110 | $71,161,577 |
| Reinvestment of distributions | 20,472 | 231,926 | 253,854 | 2,678,740 |
| Shares redeemed | (2,798,202) | (1,043,884) | (29,419,042) | (11,354,875) |
| Net increase (decrease) | 1,225,150 | 5,779,837 | $13,871,922 | $62,485,442 |
| Service Class | | | | |
| Shares sold | 15,069 | 9,320 | $167,847 | $100,000 |
| Shares redeemed | (53) | – | (548) | – |
| Net increase (decrease) | 15,016 | 9,320 | $167,299 | $100,000 |
| Service Class 2 | | | | |
| Shares sold | 102,604 | 29,533 | $1,126,947 | $338,473 |
| Reinvestment of distributions | 64 | 342 | 796 | 3,952 |
| Shares redeemed | (47,225) | (217) | (522,349) | (2,503) |
| Net increase (decrease) | 55,443 | 29,658 | $605,394 | $339,922 |
| VIP Extended Market Index Portfolio | | | | |
| Initial Class | | | | |
| Shares sold | 1,155,392 | 3,991,788 | $10,737,663 | $40,446,991 |
| Reinvestment of distributions | – | 130,658 | – | 1,391,512 |
| Shares redeemed | (908,843) | (837,813) | (8,140,402) | (8,607,747) |
| Net increase (decrease) | 246,549 | 3,284,633 | $2,597,261 | $33,230,756 |
| Service Class | | | | |
| Shares sold | 214,013 | 196,260 | $2,020,840 | $2,072,146 |
| Reinvestment of distributions | – | 1,891 | – | 20,119 |
| Shares redeemed | (69,387) | (1,753) | (618,719) | (17,553) |
| Net increase (decrease) | 144,626 | 196,398 | $1,402,121 | $2,074,712 |
| Service Class 2 | | | | |
| Shares sold | 12,002 | 4,493 | $121,474 | $45,685 |
| Reinvestment of distributions | – | 78 | – | 828 |
| Shares redeemed | (8,666) | (286) | (61,743) | (3,060) |
| Net increase (decrease) | 3,336 | 4,285 | $59,731 | $43,453 |
| VIP International Index Portfolio | | | | |
| Initial Class | | | | |
| Shares sold | 2,870,487 | 6,475,928 | $25,485,192 | $61,068,001 |
| Reinvestment of distributions | 2,308 | 244,899 | 23,077 | 2,377,965 |
| Shares redeemed | (907,944) | (815,826) | (8,000,212) | (7,566,833) |
| Net increase (decrease) | 1,964,851 | 5,905,001 | $17,508,057 | $55,879,133 |
| Service Class | | | | |
| Shares sold | 188,275 | 469,207 | $1,582,516 | $4,695,756 |
| Reinvestment of distributions | 93 | – | 932 | – |
| Shares redeemed | (129,383) | – | (1,115,903) | – |
| Net increase (decrease) | 58,985 | 469,207 | $467,545 | $4,695,756 |
| Service Class 2 | | | | |
| Shares sold | 541,989 | 485,188 | $4,789,010 | $4,617,617 |
| Reinvestment of distributions | 117 | 9,272 | 1,164 | 89,940 |
| Shares redeemed | (170,378) | (36,326) | (1,475,525) | (345,520) |
| Net increase (decrease) | 371,728 | 458,134 | $3,314,649 | $4,362,037 |
(a) Share transactions for Service Class are for the period April 11, 2019 (commencement of sale of shares) to December 31, 2019.
12. Other.
The Funds' organizational documents provide former and current trustees and officers with a limited indemnification against liabilities arising in connection with the performance of their duties to the Funds. In the normal course of business, the Funds may also enter into contracts that provide general indemnifications. The Funds' maximum exposure under these arrangements is unknown as this would be dependent on future claims that may be made against the Funds. The risk of material loss from such claims is considered remote.
At the end of the period the investment adviser or its affiliates were owners of record of more than 10% of the outstanding shares of the following Funds:
| | Affiliated % |
| VIP Extended Market Index Portfolio | 95% |
| VIP International Index Portfolio | 88% |
| VIP Total Market Index Portfolio | 98% |
13. Coronavirus (COVID-19) Pandemic.
An outbreak of COVID-19 first detected in China during December 2019 has since spread globally and was declared a pandemic by the World Health Organization during March 2020. Developments that disrupt global economies and financial markets, such as the COVID-19 pandemic, may magnify factors that affect the Funds' performance.
Shareholder Expense Example
As a shareholder of a Fund, you incur two types of costs: (1) transaction costs and (2) ongoing costs, including management fees, distribution and/or service (12b-1) fees and other Fund expenses. This Example is intended to help you understand your ongoing costs (in dollars) of investing in the Funds and to compare these costs with the ongoing costs of investing in other mutual funds.
The Example is based on an investment of $1,000 invested at the beginning of the period and held for the entire period (January 1, 2020 to June 30, 2020).
Actual Expenses
The first line of the accompanying table for each Class of each fund provides information about actual account values and actual expenses. You may use the information in this line, together with the amount you invested, to estimate the expenses that you paid over the period. Simply divide your account value by $1,000.00 (for example, an $8,600 account value divided by $1,000.00 = 8.6), then multiply the result by the number in the first line for a Class of the fund under the heading entitled "Expenses Paid During Period" to estimate the expenses you paid on your account during this period. The estimate of expenses does not include any fees or other expenses of any variable annuity or variable life insurance product. If they were, the estimate of expenses you paid during the period would be higher, and your ending account value would be lower. In addition, each Fund, as a shareholder in the underlying Fidelity Central Funds, will indirectly bear its pro-rata share of the fees and expenses incurred by the underlying Fidelity Central Funds. These fees and expenses are not included in the Fund's annualized expense ratio used to calculate the expense estimate in the table below.
Hypothetical Example for Comparison Purposes
The second line of the accompanying table for each Class of each fund provides information about hypothetical account values and hypothetical expenses based on a Class' actual expense ratio and an assumed rate of return of 5% per year before expenses, which is not the Class' actual return. The hypothetical account values and expenses may not be used to estimate the actual ending account balance or expenses you paid for the period. You may use this information to compare the ongoing costs of investing in the Fund and other funds. To do so, compare this 5% hypothetical example with the 5% hypothetical examples that appear in the shareholder reports of the other funds. The estimate of expenses does not include any fees or other expenses of any variable annuity or variable life insurance product. If they were, the estimate of expenses you paid during the period would be higher, and your ending account value would be lower. In addition, each Fund, as a shareholder in the underlying Fidelity Central Funds, will indirectly bear its pro-rata share of the fees and expenses incurred by the underlying Fidelity Central Funds. These fees and expenses are not included in the Fund's annualized expense ratio used to calculate the expense estimate in the table below.
Please note that the expenses shown in the table are meant to highlight your ongoing costs only and do not reflect any transaction costs. Therefore, the second line of the table is useful in comparing ongoing costs only, and will not help you determine the relative total costs of owning different funds.
| | Annualized Expense Ratio-A | Beginning
Account Value
January 1, 2020 | Ending
Account Value
June 30, 2020 | Expenses Paid
During Period-B
January 1, 2020
to June 30, 2020 |
| VIP Total Market Index Portfolio | | | | |
| Initial Class | .12% | | | |
| Actual | | $1,000.00 | $963.40 | $.59 |
| Hypothetical-C | | $1,000.00 | $1,024.27 | $.60 |
| Service Class | .22% | | | |
| Actual | | $1,000.00 | $962.50 | $1.07 |
| Hypothetical-C | | $1,000.00 | $1,023.77 | $1.11 |
| Service Class 2 | .37% | | | |
| Actual | | $1,000.00 | $961.70 | $1.80 |
| Hypothetical-C | | $1,000.00 | $1,023.02 | $1.86 |
| VIP Extended Market Index Portfolio | | | | |
| Initial Class | .14% | | | |
| Actual | | $1,000.00 | $867.50 | $.65 |
| Hypothetical-C | | $1,000.00 | $1,024.17 | $.70 |
| Service Class | .24% | | | |
| Actual | | $1,000.00 | $867.40 | $1.11 |
| Hypothetical-C | | $1,000.00 | $1,023.67 | $1.21 |
| Service Class 2 | .39% | | | |
| Actual | | $1,000.00 | $866.60 | $1.81 |
| Hypothetical-C | | $1,000.00 | $1,022.92 | $1.96 |
| VIP International Index Portfolio | | | | |
| Initial Class | .17% | | | |
| Actual | | $1,000.00 | $894.50 | $.80 |
| Hypothetical-C | | $1,000.00 | $1,024.02 | $.86 |
| Service Class | .27% | | | |
| Actual | | $1,000.00 | $894.40 | $1.27 |
| Hypothetical-C | | $1,000.00 | $1,023.52 | $1.36 |
| Service Class 2 | .42% | | | |
| Actual | | $1,000.00 | $893.40 | $1.98 |
| Hypothetical-C | | $1,000.00 | $1,022.77 | $2.11 |
A Annualized expense ratio reflects expenses net of applicable fee waivers.
B Expenses are equal to each Class' annualized expense ratio, multiplied by the average account value over the period, multiplied by 182/ 366 (to reflect the one-half year period).
C 5% return per year before expenses
Board Approval of Investment Advisory Contracts and Management Fees
VIP Extended Market Index Portfolio
VIP International Index Portfolio
VIP Total Market Index Portfolio
Each year, the Board of Trustees, including the Independent Trustees (together, the Board), votes on the renewal of the management contract with Fidelity Management & Research Company LLC (FMR) and the sub-advisory agreement (Sub-Advisory Agreement) for each fund with Geode Capital Management, LLC (Geode) (together, the Advisory Contracts). FMR and Geode are referred to herein as the Investment Advisers. The Board, assisted by the advice of fund counsel and Independent Trustees' counsel, requests and considers a broad range of information relevant to the renewal of the Advisory Contracts throughout the year.
The Board meets regularly and, at each of its meetings, covers an extensive agenda of topics and materials and considers factors that are relevant to its annual consideration of the renewal of each fund's Advisory Contracts, including the services and support provided to each fund and its shareholders. The Board has established various standing committees (Committees), each composed of and chaired by Independent Trustees with varying backgrounds, to which the Board has assigned specific subject matter responsibilities in order to enhance effective decision-making by the Board. The Board, acting directly and through its Committees, requests and receives information concerning the annual consideration of the renewal of each fund's Advisory Contracts. The Board also meets as needed to review matters specifically related to the Board's annual consideration of the renewal of the Advisory Contracts. Members of the Board may also meet with trustees of other Fidelity funds through joint ad hoc committees to discuss certain matters relevant to all of the Fidelity funds.
At its January 2020 meeting, the Board unanimously determined to renew each fund's Advisory Contracts. In reaching its determination, the Board considered all factors it believed relevant, including (i) the nature, extent, and quality of the services provided to each fund and its shareholders (including the investment performance of each fund); (ii) the competitiveness of each fund's management fee and total expense ratio relative to peer funds; (iii) the total costs of the services provided by and the profits realized by Fidelity and Geode from their respective relationships with each fund; and (iv) the extent to which, if any, economies of scale exist and are realized as each fund grows, and whether any economies of scale are appropriately shared with fund shareholders.
In considering whether to renew the Advisory Contracts for each fund, the Board reached a determination, with the assistance of fund counsel and Independent Trustees' counsel and through the exercise of its business judgment, that the renewal of the Advisory Contracts was in the best interests of each fund and its shareholders and that the compensation payable under the Advisory Contracts was fair and reasonable. The Board's decision to renew the Advisory Contracts was not based on any single factor, but rather was based on a comprehensive consideration of all the information provided to the Board at its meetings throughout the year. The Board, in reaching its determination to renew the Advisory Contracts, was aware that shareholders of each fund have a broad range of investment choices available to them, including a wide choice among funds offered by Fidelity's competitors, and that each fund's shareholders, who have the opportunity to review and weigh the disclosure provided by the fund in its prospectus and other public disclosures, have chosen to invest in that fund, which is part of the Fidelity family of funds.
Nature, Extent, and Quality of Services Provided. The Board considered staffing as it relates to the funds, including the backgrounds of investment personnel of Fidelity and Geode, and also considered the funds' investment objectives, strategies, and related investment philosophies. The Independent Trustees also had discussions with senior management of Fidelity's investment operations and investment groups and with representatives of Geode. The Board considered the structure of the investment personnel compensation programs and whether the structures provide appropriate incentives to act in the best interests of each fund. Additionally, the Board considered the portfolio managers' investments, if any, in the funds that they manage.
The Trustees also discussed with representatives of Fidelity, at meetings throughout the year, Fidelity's role in, among other things, overseeing compliance with federal securities laws and other applicable requirements by Geode with respect to the funds and monitoring and overseeing the performance and investment capabilities of Geode. The Trustees considered that the Board had received from Fidelity periodic reports about its oversight and due diligence processes, as well as periodic reports regarding the performance of Geode.
The Board also considered the nature, extent and quality of services provided by Geode. The Trustees noted that under the Sub-Advisory Agreement, subject to oversight by Fidelity, Geode is responsible for, among other things, identifying investments and arranging for execution of portfolio transactions to implement each fund's investment strategy. In addition, the Trustees noted that Geode is responsible for providing such reporting as may be requested by Fidelity to fulfill its oversight responsibilities discussed above.
Resources Dedicated to Investment Management and Support Services. The Board and the Fund Oversight and Research Committees reviewed the general qualifications and capabilities of Fidelity's and Geode's investment staffs, including their size, education, experience, and resources, as well as Fidelity's and Geode's approach to recruiting, training, managing, and compensating investment personnel. The Board considered that Fidelity's and Geode's investment professionals have extensive resources, tools and capabilities so as to provide competitive investment results over time, and that those professionals also have access to sophisticated tools that permit them to assess portfolio construction and risk and performance attribution characteristics continuously. Additionally, in its deliberations, the Board considered Fidelity's and Geode's trading, risk management, compliance, and technology and operations capabilities and resources, which are integral parts of the investment management process.
Shareholder and Administrative Services. The Board considered (i) the nature, extent, quality, and cost of advisory, administrative, and shareholder services performed by the Investment Advisers and their affiliates under the Advisory Contracts and by FMR's affiliates under separate agreements covering transfer agency, pricing and bookkeeping, and securities lending services for each fund; (ii) the nature and extent of the supervision of third party service providers, principally custodians, subcustodians, and pricing vendors; and (iii) the resources devoted to, and the record of compliance with, each fund's compliance policies and procedures. The Board also reviewed the allocation of fund brokerage, including allocations to brokers affiliated with the Investment Advisers.
The Board noted that the growth of fund assets over time across the complex allows Fidelity to reinvest in the development of services designed to enhance the value and convenience of the Fidelity funds as investment vehicles. These services include 24-hour access to account information and market information over the Internet and through telephone representatives, investor education materials and asset allocation tools, and the expanded availability of Fidelity Investor Centers.
The Board noted that it and the boards of certain other Fidelity funds had formed an ad hoc Committee on Transfer Agency Fees to review the variety of transfer agency fee structures throughout the industry and Fidelity's competitive positioning with respect to industry participants.
Investment in a Large Fund Family. The Board considered the benefits to shareholders of investing in a Fidelity fund, including the benefits of investing in a fund that is part of a large family of funds offering a variety of investment disciplines and providing a large variety of mutual fund investor services. The Board noted that Fidelity had taken, or had made recommendations that resulted in the Fidelity funds taking, a number of actions over the previous year that benefited particular funds, including: (i) continuing to dedicate additional resources to Fidelity's investment research process, which includes meetings with management of issuers of securities in which the funds invest, and to the support of the senior management team that oversees asset management; (ii) continuing efforts to enhance Fidelity's global research capabilities; (iii) launching new funds and ETFs with innovative structures, strategies and pricing and making other enhancements to meet client needs; (iv) launching new share classes of existing funds; (v) eliminating purchase minimums and broadening eligibility requirements for certain funds and share classes; (vi) reducing management fees and total expenses for certain target date funds and index funds; (vii) lowering expense caps for certain existing funds and classes, and converting certain voluntary expense caps to contractual caps, to reduce expenses borne by shareholders; (viii) rationalizing product lines and gaining increased efficiencies from fund mergers, liquidations, and share class consolidations; (ix) continuing to develop, acquire and implement systems and technology to improve services to the funds and shareholders, strengthen information security, and increase efficiency; and (x) continuing to implement enhancements to further strengthen Fidelity's product line to increase investors' probability of success in achieving their investment goals, including retirement income goals.
Investment Performance. The Board considered whether each fund has operated in accordance with its investment objective, as well as its record of compliance with its investment restrictions and its performance history.
The Board took into account discussions that occur at Board meetings throughout the year with representatives of the Investment Advisers about fund investment performance. In this regard the Board noted that as part of regularly scheduled fund reviews and other reports to the Board on fund performance, the Board considers annualized return information for each fund for different time periods, measured against the securities market index the fund seeks to track. The Board also periodically considers each fund's tracking error versus its benchmark index. In its evaluation of fund investment performance, the Board gave particular attention to information indicating changes in performance of certain Fidelity funds for specific time periods and discussed with the Investment Advisers the reasons for any overperformance or underperformance.
In addition to reviewing absolute and relative fund performance, the Independent Trustees periodically consider the appropriateness of fund performance metrics in evaluating the results achieved. In general, the Independent Trustees believe that an index fund's performance should be evaluated based on net performance (after fees and expenses) of both the highest performing and lowest performing fund share classes, where applicable, compared to a fund's benchmark index, over appropriate time periods taking into account relevant factors including the following: general market conditions; the characteristics of the fund's benchmark index; the extent to which statistical sampling is employed; any securities lending revenues; and fund cash flows and other factors.
The Independent Trustees recognize that shareholders evaluate performance on a net basis over their own holding periods, for which one-, three-, and five-year periods are often used as a proxy. For this reason, the performance information reviewed by the Board also included net total return information for each fund and its benchmark index for the most recent one-year period ended June 30, 2019, as shown below. Peer groups are not shown below because each fund does not generally utilize a peer group for performance comparison purposes.
VIP Extended Market Index Portfolio
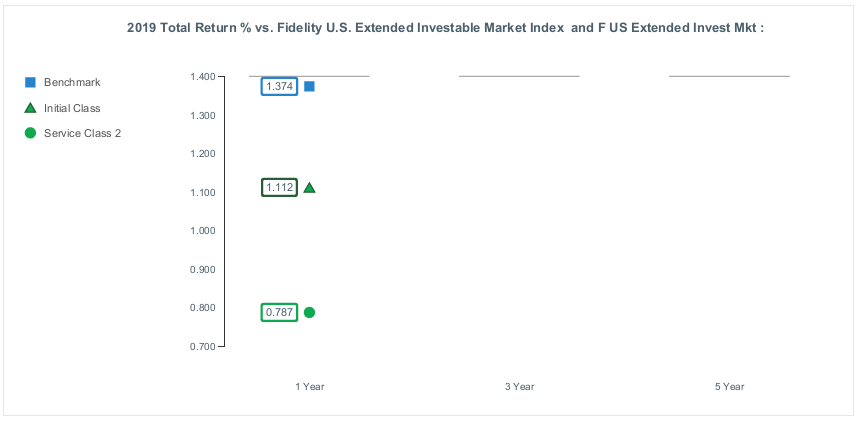
VIP International Index Portfolio
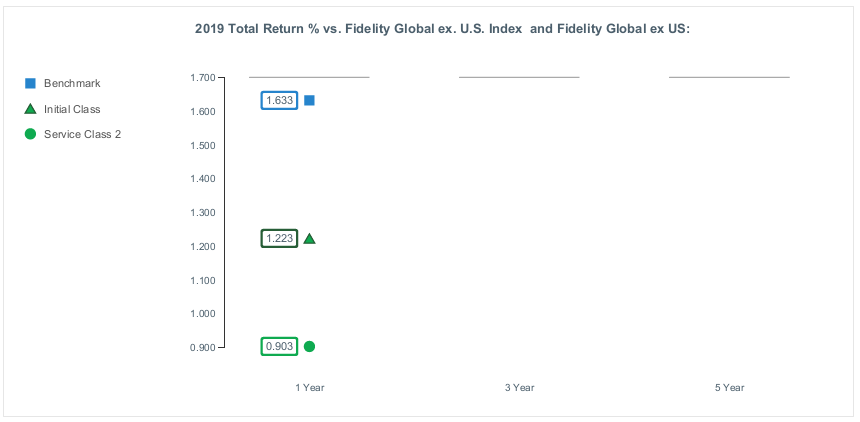
VIP Total Market Index Portfolio
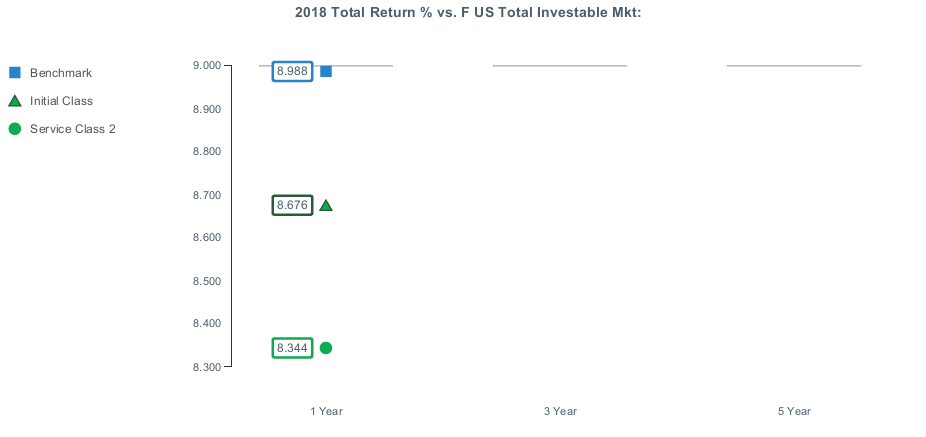
Based on its review, the Board concluded that the nature, extent, and quality of services provided to each fund under the Advisory Contracts should continue to benefit the shareholders of each fund.
Competitiveness of Management Fee and Total Expense Ratio. The Board considered each fund's management fee and total expense ratio compared to "mapped groups" of competitive funds and classes created for the purpose of facilitating the Trustees' competitive analysis of management fees and total expenses. Fidelity creates "mapped groups" by combining similar Lipper investment objective categories that have comparable investment mandates. Combining Lipper investment objective categories aids the Board's management fee and total expense ratio comparisons by broadening the competitive group used for comparison.
Management Fee. The Board considered two proprietary management fee comparisons for the 12-month (or shorter) periods ended June 30 shown in basis points (BP) in the charts below. The group of Lipper funds used by the Board for management fee comparisons is referred to below as the "Total Mapped Group." The Total Mapped Group comparison focuses on a fund's standing in terms of gross management fees before expense reimbursements or caps relative to the total universe of funds with comparable investment mandates, regardless of whether their management fee structures also are comparable. Funds with comparable investment mandates offer exposure to similar types of securities. Funds with comparable management fee structures have similar management fee contractual arrangements (
e.g., flat rate charged for advisory services, all-inclusive fee rate,
etc.). "TMG %" represents the percentage of funds in the Total Mapped Group that had management fees that were lower than a fund's. For example, a hypothetical TMG % of 20% would mean that 80% of the funds in the Total Mapped Group had higher, and 20% had lower, management fees than a fund. The funds' actual TMG %s and the number of funds in the Total Mapped Group are in the charts below. The "Asset-Sized Peer Group" (ASPG) comparison focuses on a fund's standing relative to a subset of non-Fidelity funds within the Total Mapped Group that are similar in size and management fee structure. For example, if a fund is in the first quartile of the ASPG, the fund's management fee ranks in the least expensive or lowest 25% of funds in the ASPG. The ASPG represents at least 15% of the funds in the Total Mapped Group with comparable asset size and management fee structures, subject to a minimum of 50 funds (or all funds in the Total Mapped Group if fewer than 50). Additional information, such as the ASPG quartile in which a fund's management fee rate ranked, is also included in the charts and was considered by the Board.
VIP Extended Market Index Portfolio
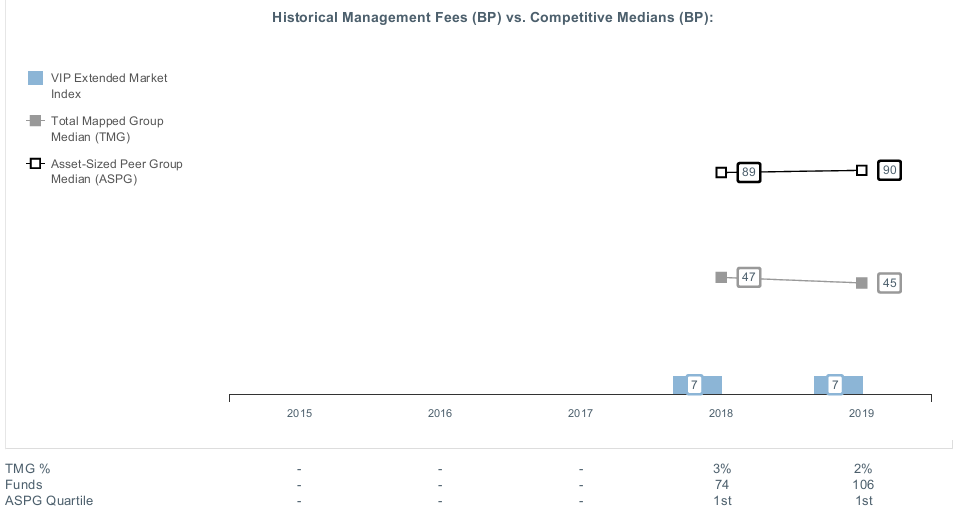
The Board noted that the fund's management fee rate ranked below the median of its Total Mapped Group and below the median of its ASPG for the 12-month period ended June 30, 2019.
VIP International Index Portfolio
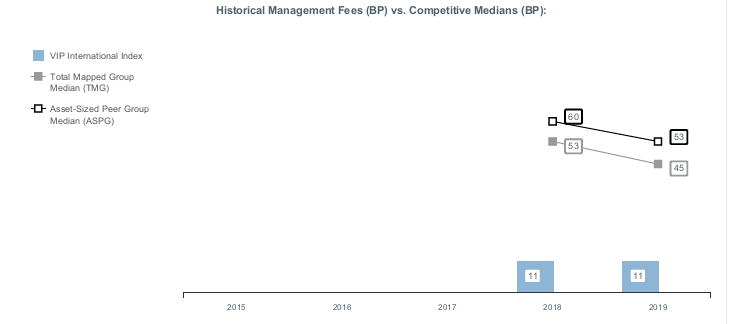
The Board noted that the fund's management fee rate ranked below the median of its Total Mapped Group and below the median of its ASPG for the 12-month period ended June 30, 2019.
VIP Total Market Index Portfolio
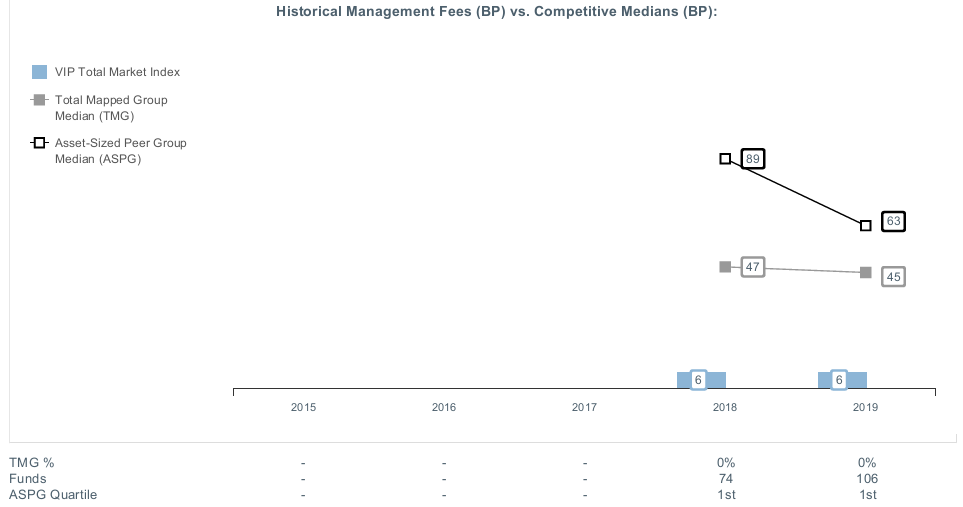
The Board noted that the fund's management fee rate ranked below the median of its Total Mapped Group and below the median of its ASPG for the 12-month period ended June 30, 2019.
The Board noted that it and the boards of other Fidelity funds formed an ad hoc Committee on Group Fee, which meets periodically, to conduct an in-depth review of the "group fee" component of the management fee of funds with such management fee structures. The Committee's focus included the mechanics of the group fee, the competitive landscape of group fee structures, Fidelity funds with no group fee component (such as the funds) and investment products not included in group fee assets. The Board also considered that, for funds subject to the group fee, FMR agreed to voluntarily waive fees over a specified period of time in amounts designed to account for assets converted from certain funds to certain collective investment trusts.
Based on its review, the Board concluded that each fund's management fee is fair and reasonable in light of the services that the fund receives and the other factors considered.
Total Expense Ratio. In its review of the total expense ratio for each class of each fund, the Board considered the fund's management fee rate as well as other "fund-level" expenses, such as pricing and bookkeeping fees and custodial, legal, and audit fees, paid by FMR under the fund's management contract. The Board also considered other "class-level" expenses, such as transfer agent fees and fund-paid 12b-1 fees. The Board also noted that Fidelity may agree to waive fees or reimburse expenses from time to time, and the extent to which, if any, it has done so for a fund. As part of its review, the Board also considered the current and historical total expense ratios of each class of each fund compared to competitive fund median expenses. Each class of each fund is compared to those funds and classes in the Total Mapped Group (used by the Board for management fee comparisons) that have a similar sales load structure.
The Board noted that the total expense ratio of each class of each fund ranked below the competitive median for the 12-month period ended June 30, 2019.
The Board considered that current contractual arrangements for the VIP Extended Market Index Portfolio oblige FMR to pay all "class-level" expenses of each class of the fund to the extent necessary to limit total operating expenses, with certain exceptions, as follows: Initial Class: 0.13%; Service Class: 0.23% and Service Class 2: 0.38%. These contractual arrangements may not be amended to increase the fees or expenses payable except by a vote of a majority of the Board.
The Board considered that current contractual arrangements for the VIP International Index Portfolio oblige FMR to pay all "class-level" expenses of each class of the fund to the extent necessary to limit total operating expenses, with certain exceptions, as follows: Initial Class: 0.17%; Service Class: 0.27%; and Service Class 2: 0.42%. These contractual arrangements may not be amended to increase the fees or expenses payable except by a vote of a majority of the Board.
The Board considered that current contractual arrangements for the VIP Total Markets Index Portfolio oblige FMR to pay all "class-level" expenses of each class of the fund to the extent necessary to limit total operating expenses, with certain exceptions, as follows: Initial Class: 0.12%; Service Class: 0.22%; and Service Class 2: 0.37%. These contractual arrangements may not be amended to increase the fees or expenses payable except by a vote of a majority of the Board.
Fees Charged to Other Clients. The Board also considered fee structures applicable to clients of Fidelity and Geode, such as other funds advised or subadvised by Fidelity or Geode, pension plan clients, and other institutional clients with similar mandates. The Board noted that a joint ad hoc committee created by it and the boards of other Fidelity funds periodically reviews and compares Fidelity's institutional investment advisory business with its business of providing services to the Fidelity funds and also noted the most recent findings of the committee. The Board noted that the committee's review included a consideration of the differences in services provided, fees charged, and costs incurred, as well as competition in the markets serving the different categories of clients.
Based on its review of total expense ratios and fees charged to other Fidelity clients, the Board concluded that total expense ratio of each class of each fund was reasonable in light of the services that each fund and its shareholders receive and the other factors considered.
Costs of the Services and Profitability. The Board considered the revenues earned and the expenses incurred by Fidelity in conducting the business of developing, marketing, distributing, managing, administering and servicing each fund and servicing each fund's shareholders. The Board also considered the level of Fidelity's profits in respect of all the Fidelity funds.
On an annual basis, Fidelity presents to the Board information about the profitability of its relationships with each fund. Fidelity calculates profitability information for each fund, as well as aggregate profitability information for groups of Fidelity funds and all Fidelity funds, using a series of detailed revenue and cost allocation methodologies which originate with the books and records of Fidelity on which Fidelity's audited financial statements are based. The Audit Committee of the Board reviews any significant changes from the prior year's methodologies and the full Board approves such changes.
PricewaterhouseCoopers LLP (PwC), auditor to Fidelity and certain Fidelity funds, has been engaged annually by the Board as part of the Board's assessment of Fidelity's profitability analysis. PwC's engagement includes the review and assessment of the methodologies used by Fidelity in determining the revenues and expenses attributable to Fidelity's mutual fund business, and completion of agreed-upon procedures in respect of the mathematical accuracy of the fund profitability information and its conformity to established allocation methodologies. After considering PwC's reports issued under the engagement and information provided by Fidelity, the Board concluded that while other allocation methods may also be reasonable, Fidelity's profitability methodologies are reasonable in all material respects.
The Board also reviewed Fidelity's and Geode's non-fund businesses and potential indirect benefits such businesses may have received as a result of their association with Fidelity's mutual fund business (i.e., fall-out benefits) as well as cases where Fidelity's and Geode's affiliates may benefit from the funds' business. The Board noted that changes to fall-out benefits year-over-year reflect business developments at Fidelity's and Geode's various businesses. The Board considered that a joint ad hoc committee created by it and the boards of other Fidelity funds had recently been established, and met periodically, to evaluate potential fall-out benefits (PFOB Committee). The Board noted that the PFOB Committee, among other things: (i) discussed the legal framework surrounding potential fall-out benefits; (ii) reviewed the Board's responsibilities and approach to potential fall-out benefits; and (iii) reviewed practices employed by competitor funds regarding the review of potential fall-out benefits.
The Board considered the costs of the services provided by and the profits realized by Fidelity in connection with the operation of each fund, including the conclusions of the PFOB Committee, and was satisfied that the profitability was not excessive.
The Board also considered information regarding the profitability of Geode's relationship with each fund.
Economies of Scale. The Board considered whether there have been economies of scale in respect of the management of the Fidelity funds, whether the Fidelity funds (including each fund) have appropriately benefited from any such economies of scale, and whether there is potential for realization of any further economies of scale. The Board considered the extent to which each fund will benefit from economies of scale as assets grow through increased services to the fund, through waivers or reimbursements, or through fee or expense ratio reductions. The Board recognized that, due to each fund's current contractual arrangements, its expense ratio will not decline if the fund's operating costs decrease as assets grow, or rise as assets decrease. The Board also noted that a committee (the Economies of Scale Committee) created by it and the boards of other Fidelity funds periodically analyzes whether Fidelity attains economies of scale in respect of the management and servicing of the Fidelity funds, whether the Fidelity funds have appropriately benefited from such economies of scale, and whether there is potential for realization of any further economies of scale.
The Board concluded, taking into account the analysis of the Economies of Scale Committee, that economies of scale, if any, are being appropriately shared between fund shareholders and Fidelity.
Additional Information Requested by the Board. In order to develop fully the factual basis for consideration of the Fidelity funds' advisory contracts, the Board requested and received additional information on certain topics, including: (i) fund flow and performance trends, in particular the underperformance of certain funds and strategies, and Fidelity's long-term strategies for certain funds; (ii) consideration of performance fees for additional funds; (iii) changes in Fidelity's non-fund businesses and the impact of such changes on the funds; (iv) metrics for evaluating index fund and ETF performance and information about ETF trading characteristics; (v) the methodology with respect to evaluating competitive fund data and peer group classifications and fee comparisons; (vi) the expense structures for different funds and classes; (vii) information regarding other accounts managed by Fidelity, including collective investment trusts and separately managed accounts; and (viii) Fidelity's philosophies and strategies for evaluating funds and classes with lower or declining asset levels.
Based on its evaluation of all of the conclusions noted above, and after considering all factors it believed relevant, the Board concluded that the advisory and sub-advisory fee arrangements are fair and reasonable, and that each fund's Advisory Contracts should be renewed.
Liquidity Risk Management Program
The Securities and Exchange Commission adopted Rule 22e-4 under the Investment Company Act of 1940 (the Liquidity Rule) to promote effective liquidity risk management throughout the open-end investment company industry, thereby reducing the risk that funds will be unable to meet their redemption obligations and mitigating dilution of the interests of fund shareholders.
The Funds have adopted and implemented a liquidity risk management program pursuant to the Liquidity Rule (the Program) effective December 1, 2018. The Program is reasonably designed to assess and manage each Fund’s liquidity risk and to comply with the requirements of the Liquidity Rule. Each Fund’s Board of Trustees (the Board) has designated each Fund’s investment adviser as administrator of the Program. The Fidelity advisers have established a Liquidity Risk Management Committee (the LRM Committee) to manage the Program for each of the Fidelity Funds. The LRM Committee monitors the adequacy and effectiveness of implementation of the Program and on a periodic basis assesses each Fund’s liquidity risk based on a variety of factors including (1) the Fund’s investment strategy, (2) portfolio liquidity and cash flow projections during normal and reasonably foreseeable stressed conditions, (3) shareholder redemptions, (4) borrowings and other funding sources and (5) in the case of exchange-traded funds, certain additional factors including the effect of the Fund’s prices and spreads, market participants, and basket compositions on the overall liquidity of the Fund’s portfolio, as applicable.
In accordance with the Program, each of the Fund’s portfolio investments is classified into one of four liquidity categories described below based on a determination of a reasonable expectation for how long it would take to convert the investment to cash (or sell or dispose of the investment) without significantly changing its market value.
- Highly liquid investments – cash or convertible to cash within three business days or less
- Moderately liquid investments – convertible to cash in three to seven calendar days
- Less liquid investments – can be sold or disposed of, but not settled, within seven calendar days
- Illiquid investments – cannot be sold or disposed of within seven calendar days
Liquidity classification determinations take into account a variety of factors including various market, trading and investment-specific considerations, as well as market depth, and generally utilize analysis from a third-party liquidity metrics service.
The Liquidity Rule places a 15% limit on a fund’s illiquid investments and requires funds that do not primarily hold assets that are highly liquid investments to determine and maintain a minimum percentage of the fund’s net assets to be invested in highly liquid investments (highly liquid investment minimum or HLIM). The Program includes provisions reasonably designed to comply with the 15% limit on illiquid investments and for determining, periodically reviewing and complying with the HLIM requirement as applicable.
At a recent meeting of the Fund’s Board of Trustees, the LRM Committee provided a written report to the Board pertaining to the operation, adequacy, and effectiveness of implementation of the Program for the annual period from December 1, 2018 through November 30, 2019. The report concluded that the Program has been implemented and is operating effectively and is reasonably designed to assess and manage the Fund’s liquidity risk.
Proxy Voting Results
A special meeting of shareholders was held on June 9, 2020. The results of votes taken among shareholders on the proposal before them are reported below. Each vote reported represents one dollar of net asset value held on the record date for the meeting.
PROPOSAL 1
To elect a Board of Trustees.
| | # of
Votes | % of
Votes |
| Dennis J. Dirks |
| Affirmative | 21,597,050,616.024 | 95.502 |
| Withheld | 1,017,240,628.578 | 4.498 |
| TOTAL | 22,614,291,244.601 | 100.000 |
| Donald F. Donahue |
| Affirmative | 21,605,904,576.366 | 95.541 |
| Withheld | 1,008,386,668.235 | 4.459 |
| TOTAL | 22,614,291,244.601 | 100.000 |
| Bettina Doulton |
| Affirmative | 21,645,998,598.109 | 95.718 |
| Withheld | 968,292,646.493 | 4.282 |
| TOTAL | 22,614,291,244.601 | 100.000 |
| Vicki L. Fuller |
| Affirmative | 21,660,928,063.243 | 95.784 |
| Withheld | 953,363,181.358 | 4.216 |
| TOTAL | 22,614,291,244.601 | 100.000 |
| Patricia L. Kampling |
| Affirmative | 21,663,944,422.383 | 95.798 |
| Withheld | 950,346,822.218 | 4.202 |
| TOTAL | 22,614,291,244.601 | 100.000 |
| Alan J. Lacy |
| Affirmative | 21,569,159,491.891 | 95.378 |
| Withheld | 1,045,131,752.710 | 4.622 |
| TOTAL | 22,614,291,244.601 | 100.000 |
| Ned C. Lautenbach |
| Affirmative | 21,469,914,492.101 | 94.940 |
| Withheld | 1,144,376,752.501 | 5.060 |
| TOTAL | 22,614,291,244.601 | 100.000 |
| Robert A. Lawrence |
| Affirmative | 21,583,601,126.100 | 95.442 |
| Withheld | 1,030,690,118.501 | 4.558 |
| TOTAL | 22,614,291,244.601 | 100.000 |
| Joseph Mauriello |
| Affirmative | 21,551,120,396.219 | 95.299 |
| Withheld | 1,063,170,848.382 | 4.701 |
| TOTAL | 22,614,291,244.601 | 100.000 |
| Cornelia M. Small |
| Affirmative | 21,592,890,757.027 | 95.483 |
| Withheld | 1,021,400,487.575 | 4.517 |
| TOTAL | 22,614,291,244.601 | 100.000 |
| Garnett A. Smith |
| Affirmative | 21,519,273,578.917 | 95.158 |
| Withheld | 1,095,017,665.685 | 4.842 |
| TOTAL | 22,614,291,244.601 | 100.000 |
| David M. Thomas |
| Affirmative | 21,574,034,388.063 | 95.400 |
| Withheld | 1,040,256,856.538 | 4.600 |
| TOTAL | 22,614,291,244.601 | 100.000 |
| Susan Tomasky |
| Affirmative | 21,607,546,330.771 | 95.548 |
| Withheld | 1,006,744,913.831 | 4.452 |
| TOTAL | 22,614,291,244.601 | 100.000 |
| Michael E. Wiley |
| Affirmative | 21,549,685,089.255 | 95.292 |
| Withheld | 1,064,606,155.346 | 4.708 |
| TOTAL | 22,614,291,244.601 | 100.000 |
|
| Proposal 1 reflects trust wide proposal and voting results. |
VIPSAI-SANN-0820
1.9891401.102
Item 2.
Code of Ethics
Not applicable.
Item 3.
Audit Committee Financial Expert
Not applicable.
Item 4.
Principal Accountant Fees and Services
Not applicable.
Item 5.
Audit Committee of Listed Registrants
Not applicable.
Item 6.
Investments
(a)
Not applicable.
(b)
Not applicable
Item 7.
Disclosure of Proxy Voting Policies and Procedures for Closed-End Management Investment Companies
Not applicable.
Item 8.
Portfolio Managers of Closed-End Management Investment Companies
Not applicable.
Item 9.
Purchase of Equity Securities by Closed-End Management Investment Company and Affiliated Purchasers
Not applicable.
Item 10.
Submission of Matters to a Vote of Security Holders
There were no material changes to the procedures by which shareholders may recommend nominees to the Variable Insurance Products Fund II’s Board of Trustees.
Item 11.
Controls and Procedures
(a)(i) The President and Treasurer and the Chief Financial Officer have concluded that the Variable Insurance Products Fund II’s (the “Trust”) disclosure controls and
procedures (as defined in Rule 30a-3(c) under the Investment Company Act) provide reasonable assurances that material information relating to the Trust is made known to them by the appropriate persons, based on their evaluation of these controls and procedures as of a date within 90 days of the filing date of this report.
(a)(ii) There was no change in the Trust’s internal control over financial reporting (as defined in Rule 30a-3(d) under the Investment Company Act) that occurred during the period covered by this report that has materially affected, or is reasonably likely to materially affect, the Trust’s internal control over financial reporting.
Item 12.
Disclosure of Securities Lending Activities for Closed-End Management
Investment Companies
Not applicable.
Item 13.
Exhibits
SIGNATURES
Pursuant to the requirements of the Securities Exchange Act of 1934 and the Investment Company Act of 1940, the registrant has duly caused this report to be signed on its behalf by the undersigned, thereunto duly authorized.
Variable Insurance Products Fund II
| |
By: | /s/Stacie M. Smith |
| Stacie M. Smith |
| President and Treasurer |
|
|
Date: | August 20, 2020 |
Pursuant to the requirements of the Securities Exchange Act of 1934 and the Investment Company Act of 1940, this report has been signed below by the following persons on behalf of the registrant and in the capacities and on the dates indicated.
| |
By: | /s/Stacie M. Smith |
| Stacie M. Smith |
| President and Treasurer |
|
|
Date: | August 20, 2020 |
| |
By: | /s/John J. Burke III |
| John J. Burke III |
| Chief Financial Officer |
|
|
Date: | August 20, 2020 |