FREEPORT-McMoRan COPPER & GOLD INC.
The accompanying unaudited consolidated financial statements have been prepared in accordance with the instructions to Form 10-Q and do not include all information and disclosures required by generally accepted accounting principles (GAAP) in the United States (U.S.). Therefore, this information should be read in conjunction with Freeport-McMoRan Copper & Gold Inc.’s (FCX) consolidated financial statements and notes contained in its 2009 Annual Report on Form 10-K. The information furnished herein reflects all adjustments which are, in the opinion of management, necessary for a fair statement of the results for the interim periods reported. All such adjustments are, in the opinion of management, of a normal recurring nature. Operating results for the three-month and six-month periods ended June 30, 2010, are not necessarily indi cative of the results that may be expected for the year ending December 31, 2010.
FCX’s basic net income per share of common stock was calculated by dividing net income attributable to common stock by the weighted-average shares of common stock outstanding during the period. Following is a reconciliation of net income and weighted-average shares of common stock outstanding for purposes of calculating diluted net income per share (in millions, except per share amounts):
FCX’s convertible instruments are excluded from the computation of diluted net income per share of common stock when including the assumed conversion of these instruments results in an anti-dilutive effect on earnings per share (see footnote b above).
Outstanding stock options with exercise prices greater than the average market price of FCX’s common stock during the period also are excluded from the computation of diluted net income per share of common stock.
Excluded amounts were approximately nine million stock options with a weighted-average exercise price of $75.56 for second-quarter 2010 and approximately six million stock options with a weighted-average exercise price of $77.55 for the six months ended June 30, 2010. Stock options for approximately eight million shares with a weighted-average exercise price of $73.00 were excluded for second-quarter 2009, and stock options for approximately nine million shares with a weighted-average exercise price of $69.73 were excluded for the six months ended June 30, 2009.
The components of net periodic benefit cost for pension and postretirement benefits follow (in millions):
Net periodic benefit costs decreased by $7 million in second-quarter 2010 mainly as a result of an increase in the expected return on plan assets ($4 million) primarily because of the 2009 gains on plan assets.
Net periodic benefit costs decreased by $3 million in the first six months of 2010 mainly as a result of an increase in the expected return on plan assets ($7 million) and a decrease in the amortization of actuarial losses ($4 million) primarily because of the 2009 gains on plan assets. These decreases were partially offset by the absence of the first-quarter 2009 gains on special retirement benefits and curtailments ($9 million) caused by workforce reductions in connection with the fourth-quarter 2008 and first-quarter 2009 revised mine operating plans.
FCX recorded charges for lower of cost or market (LCM) molybdenum inventory adjustments totaling $19 million ($19 million to net income attributable to FCX common stockholders or $0.04 per diluted share) for the first six months of 2009 resulting from lower molybdenum prices.
FCX’s income tax provision for second-quarter 2010 resulted from taxes on international operations ($382 million) and U.S. operations ($51 million). FCX’s income tax provision for the first six months of 2010 resulted from taxes on international operations ($979 million) and U.S. operations ($132 million). FCX’s consolidated effective income tax rate was 35 percent for the first six months of 2010.
FCX’s income tax provision for second-quarter 2009 resulted from taxes on international operations ($538 million) and U.S. operations ($4 million). FCX’s income tax provision for the first six months of 2009 resulted from taxes on international operations ($868 million) and U.S. operations ($5 million). During the first half of 2009, FCX did not record a benefit for losses generated in the U.S., and those losses could not be used to offset income generated from international operations. These factors combined with the high proportion of income earned in Indonesia, which was taxed at an effective tax rate of 43 percent, caused FCX’s consolidated effective income tax rate of 47 percent for the first six months of 2009 to be higher than the U.S. federal statutory rate of 35 percent.
During the second quarter of 2010, FCX purchased in the open market $85 million of its 8.25% Senior Notes due 2015 for $92 million and $193 million of its 8.375% Senior Notes due 2017 for $210 million. These open-market purchases resulted in losses on early extinguishment of debt totaling $28 million ($23 million to net income attributable to FCX common stockholders or $0.05 per diluted share). For the first six months of 2010, FCX purchased in the open market $218 million of its 8.25% Senior Notes for $237 million and $329 million of its 8.375% Senior Notes for $358 million, which resulted in losses on early extinguishment of debt totaling $55 million ($46 million to net income attributable to FCX common stockholders or $0.10 per diluted share).
On April 1, 2010, FCX redeemed all of its $1.0 billion of outstanding Senior Floating Rates Notes due 2015 for which holders received 101 percent of the principal amount together with accrued and unpaid interest. As a result of this redemption, FCX recorded a loss on early extinguishment of debt totaling $22 million ($19 million to net income attributable to FCX common stockholders or $0.04 per diluted share) in the second quarter and the six-month periods of 2010.
Consolidated interest expense (before capitalization) totaled $132 million in second-quarter 2010, $172 million in second-quarter 2009, $283 million for the first six months of 2010 and $348 million for the first six months of 2009. Capitalized interest expense totaled $10 million in second-quarter 2010, $14 million in second-quarter 2009, $16 million for the first six months of 2010 and $59 million for the first six months of 2009. Lower capitalized interest in the 2010 periods primarily reflects the completion of development activities for the initial project at FCX’s Tenke Fungurume mine, which commenced initial copper production in March 2009.
During April 2010, holders of FCX’s 6¾% Mandatory Convertible Preferred Stock elected to convert 787,158 preferred shares into 1,079,615 shares of FCX common stock (conversion rate equal to 1.3716 shares of FCX common stock). On May 1, 2010, the remaining 27,504,512 shares of FCX’s 6¾% Mandatory Convertible
Preferred Stock were automatically converted into 37,725,139 shares of FCX common stock (conversion rate equal to 1.3716 shares of FCX common stock). For the first six months of 2010, a total of 28,749,560 outstanding shares of FCX’s 6¾% Mandatory Convertible Preferred Stock were converted into 39,432,793 shares of FCX common stock (conversion rate equal to 1.3716 shares of FCX common stock).
In April 2010, FCX’s Board of Directors (Board) authorized an increase in the annual cash dividend on its common stock from $0.60 per share to $1.20 per share. On June 24, 2010, FCX declared a quarterly dividend of $0.30 per share, which was paid on August 1, 2010, to common shareholders of record at the close of business on July 15, 2010.
Total comprehensive income attributable to FCX common stockholders totaled $666 million in second-quarter 2010, $654 million in second-quarter 2009, $1,614 million for the first six months of 2010 and $825 million (including a $61 million gain related to the remeasurement of certain defined benefit plans during the first quarter of 2009) for the first six months of 2009.
In May 2000, FCX’s Board adopted a shareholder rights plan. Under the rights plan, each share of outstanding common stock included a purchase right that would become exercisable if a third party acquired (or announced it would acquire) 20 percent or more of FCX’s outstanding common stock without the approval of FCX’s Board. If such acquisition occurred, each purchase right (other than rights held by the third party) entitled its holder to purchase FCX’s securities at a substantial discount. The shareholder rights plan expired in accordance with its terms on May 16, 2010.
FCX does not purchase, hold or sell derivative financial instruments unless there is an existing asset or obligation or if it anticipates a future activity that is likely to occur and will result in exposure to market risks and FCX intends to offset or mitigate such risks. FCX does not enter into any derivative financial instruments for speculative purposes, but has entered into derivative financial instruments in limited instances to achieve specific objectives. These objectives principally relate to managing risks associated with commodity price, foreign currency and interest rate risks. The fair values of FCX’s derivative financial instruments are based on widely published market prices.
A summary of unrealized (losses) gains recognized in income before income taxes and equity in affiliated companies’ net earnings for derivative financial instruments that are designated and qualify as fair value hedge transactions, along with the unrealized gains (losses) on the related hedged item (firm sales commitments) follows (in millions):
A summary of the realized and unrealized gains (losses) recognized in income before income taxes and equity in affiliated companies’ net earnings for derivative financial instruments, including embedded derivatives, which do not qualify as hedge transactions follows (in millions):
A summary of the fair values of unsettled derivative financial instruments recorded on the consolidated balance sheets follows (in millions):
swap contracts that qualified for hedge accounting for 63 million pounds at an average price of $3.06 per pound, with maturities through July 2011.
Embedded derivatives and derivative financial instruments that do not meet the criteria to qualify for hedge accounting are discussed below.
In April 2009, FCX entered into copper forward sales contracts to lock in prices at an average of $1.86 per pound on 355 million pounds of PT Freeport Indonesia’s provisionally priced copper sales at March 31, 2009, which final priced from April 2009 through July 2009. These economic hedge transactions were intended to reduce short-term price volatility in earnings and cash flows. Gains and losses for these economic hedge transactions were recorded in revenues. FCX has not entered into additional forward sales contracts since April 2009 for its provisionally priced copper sales, but may enter into future transactions to lock in pricing on provisionally priced sales from time to time. However, FCX does not intend to change its long-standing policy of not hedging future copper production.
Fair value accounting guidance includes a fair value hierarchy that prioritizes the inputs to valuation techniques used to measure fair value. The hierarchy gives the highest priority to unadjusted quoted prices in active markets for identical assets or liabilities (Level 1 inputs) and the lowest priority to unobservable inputs (Level 3 inputs). The three levels of the fair value hierarchy are described below:
A summary of FCX’s financial assets and liabilities measured at fair value on a recurring basis follows (in millions):
Money market funds and time deposits are classified within Level 1 of the fair value hierarchy because they are valued using quoted market prices in active markets.
Fixed income securities (government and agency securities, corporate bonds, asset-backed securities and U.S. core fixed income fund) are valued using a bid evaluation or a mid evaluation. A bid evaluation is an estimated price at which a dealer would pay for a security. A mid evaluation is the average of the estimated price at which a dealer would sell a security and the estimated price at which a dealer would pay for a security. These evaluations are based on quoted prices, if available, or models that use observable inputs and, as such, are classified within Level 2 of the fair value hierarchy.
Equity securities are valued at the closing price reported on the active market on which the individual securities are traded and as such are classified within Level 1 of the fair value hierarchy.
FCX’s derivative financial instruments for copper futures and swap contracts and forward contracts are classified within Level 1 of the fair value hierarchy because they are valued using quoted market prices in active markets (refer to Note 7 for further discussion).
FCX has organized its operations into five primary divisions – North America copper mines, South America mining, Indonesia mining, Africa mining and Molybdenum operations. Notwithstanding this structure, FCX internally reports information on a mine-by-mine basis. Therefore, FCX concluded that its operating segments include individual mines. Operating segments that meet certain thresholds are reportable segments. Further discussion of the reportable segments included in FCX’s primary operating divisions, as well as FCX’s other reportable segments – Rod & Refining and Atlantic Copper Smelting & Refining – follows.
processes material on a toll basis. Toll arrangements require the tolling customer to deliver appropriate molybdenum-bearing material to FCX’s facilities for processing into a product that is returned to the customer, who pays FCX for processing its material into the specified products. The Molybdenum segment also includes FCX’s wholly owned Climax molybdenum mine in Colorado, which has been on care-and-maintenance status since 1995.
TO THE BOARD OF DIRECTORS AND STOCKHOLDERS OF
FREEPORT-McMoRan COPPER & GOLD INC.
We have reviewed the condensed consolidated balance sheet of Freeport-McMoRan Copper & Gold Inc. as of June 30, 2010, and the related consolidated statements of income for the three- and six-month periods ended June 30, 2010 and 2009, the consolidated statements of cash flows for the six-month periods ended June 30, 2010 and 2009, and the consolidated statement of equity for the six-month period ended June 30, 2010. These financial statements are the responsibility of the Company’s management.
We conducted our review in accordance with the standards of the Public Company Accounting Oversight Board (United States). A review of interim financial information consists principally of applying analytical procedures and making inquiries of persons responsible for financial and accounting matters. It is substantially less in scope than an audit conducted in accordance with the standards of the Public Company Accounting Oversight Board, the objective of which is the expression of an opinion regarding the financial statements taken as a whole. Accordingly, we do not express such an opinion.
Based on our review, we are not aware of any material modifications that should be made to the condensed consolidated financial statements referred to above for them to be in conformity with U.S. generally accepted accounting principles.
We have previously audited, in accordance with the standards of the Public Company Accounting Oversight Board (United States), the consolidated balance sheet of Freeport-McMoRan Copper & Gold Inc. as of December 31, 2009, and the related consolidated statements of operations, cash flows, and equity for the year then ended (not presented herein), and in our report dated February 26, 2010, we expressed an unqualified opinion on those consolidated financial statements and which report included an explanatory paragraph for the Company’s adoption of guidance originally issued in FASB Statement No. 160, Noncontrolling Interests in Consolidated Financial Statements (codified in FASB ASC Topic 810, Consolidation) effective J anuary 1, 2009. In our opinion, the information set forth in the accompanying condensed consolidated balance sheet as of December 31, 2009, is fairly stated, in all material respects, in relation to the consolidated balance sheet from which it has been derived.
/s/ ERNST & YOUNG LLP
Phoenix, Arizona
August 6, 2010
Item 2. Management's Discussion and Analysis of Financial Condition and Results of Operations.
OVERVIEW
In Management’s Discussion and Analysis of Financial Condition and Results of Operations, “we,” “us” and “our” refer to Freeport-McMoRan Copper & Gold Inc. (FCX) and its consolidated subsidiaries. You should read this discussion in conjunction with our financial statements, the related Management’s Discussion and Analysis of Financial Condition and Results of Operations and the discussion of our Business and Properties in our Form 10-K for the year ended December 31, 2009, filed with the United States (U.S.) Securities and Exchange Commission (SEC). The results of operations reported and summarized below are not necessarily indicative of future operating results. References to “Notes” are Notes included in our Notes to Consolidated Financial Statements. Th roughout Management's Discussion and Analysis of Financial Condition and Results of Operations all references to earnings or losses per share are on a diluted basis, unless otherwise noted.
We are one of the world’s largest copper, gold and molybdenum mining companies in terms of reserves and production. Our portfolio of assets includes the Grasberg minerals district in Indonesia, significant mining operations in North and South America, and the Tenke Fungurume minerals district in the Democratic Republic of Congo (DRC). The Grasberg minerals district contains the largest single recoverable copper reserve and the largest single gold reserve of any mine in the world based on the latest available reserve data provided by third-party industry consultants. We also operate Atlantic Copper, our wholly owned copper smelting and refining unit in Spain.
Our results for the second quarter and first six months of 2010, compared with the 2009 periods, primarily reflected higher realized metals prices, partially offset by lower copper and gold sales volumes. Refer to “Consolidated Results” for further discussion of our consolidated financial results for the quarter and six-month periods ended June 30, 2010 and 2009.
On April 1, 2010, we redeemed our $1 billion of outstanding Senior Floating Rate Notes, and during the first six months of 2010, we made open-market debt purchases totaling $547 million (refer to Note 6 for further discussion). In April 2010, our Board of Directors increased the annual cash dividend on our common stock to $1.20 per share. In addition, during second-quarter 2010, our 6¾% Mandatory Convertible Preferred Stock converted into 39 million shares of our common stock. Refer to “Capital Resources and Liquidity – Financing Activities” for further discussion.
We have significant reserves and future development opportunities within our portfolio of assets. At December 31, 2009, we had estimated consolidated recoverable proven and probable reserves of 104.2 billion pounds of copper (determined using a long-term average copper price of $1.60 per pound), with potential for greater reserves at higher prices.
We are undertaking major development projects to extend mine lives at El Abra and Grasberg, and are also advancing development activities at the Climax molybdenum mine. In addition, a number of studies are under way to evaluate expansion options at certain of our mining operations. The advancement of these studies will provide flexibility in initiating expansion projects as market conditions warrant. Refer to “Operations” for further discussion of our current operating and development activities.
We view the long-term outlook for our business positively, supported by limitations on supplies of copper and by the requirements for copper in the world’s economy, and will continue to adjust our operating strategy as market conditions change.
OUTLOOK
Consolidated sales from mines for the year 2010 are expected to approximate 3.8 billion pounds of copper, 1.8 million ounces of gold and 63 million pounds of molybdenum, including 970 million pounds of copper, 410 thousand ounces of gold and 15 million pounds of molybdenum for third-quarter 2010. Mine sequencing at Grasberg is resulting in significant fluctuations in quarterly sales of copper and gold during 2010. These sales volume estimates are dependent on the achievement of targeted mining rates, the successful operation of production facilities, the impact of weather conditions and other factors.
Assuming average prices of $1,200 per ounce of gold and $14 per pound of molybdenum for the remainder of 2010 and achievement of current 2010 sales volume and cost estimates, we estimate our consolidated unit net cash costs (net of by-product credits and including Africa mining) for our copper mining operations would average approximately $0.86 per pound of copper for the year 2010. Quarterly unit net cash costs will vary with fluctuations in sales volumes of copper and by-products. The impact of price changes on consolidated unit net cash costs in 2010 would approximate $0.01 per pound for each $50 per ounce change in the average price of gold for the remainder of 2010, and $0.005 per pound for each $2 per pound change in the average price of molybdenum for the remainder of 2010. Estimated consolidated unit net cash costs are higher, com pared with consolidated unit net cash costs of $0.55 per pound of copper in 2009, primarily because of lower projected copper and gold sales volumes from Grasberg, combined with increases in commodity-based input costs. Refer to “Consolidated Results – Production and Delivery Costs” for further discussion of consolidated unit net cash costs.
Our operating cash flows vary with prices realized from copper, gold and molybdenum sales, our production levels, production costs, cash payments for income taxes and interest, other working capital changes and other factors. Based on projected consolidated sales volumes for 2010 and assuming average prices of $3.00 per pound of copper, $1,200 per ounce of gold and $14 per pound of molybdenum for the remainder of 2010, our consolidated operating cash flows for the year 2010 are expected to exceed $5 billion, net of an estimated $0.2 billion for working capital requirements. The impact of price changes on operating cash flows in 2010 would approximate $150 million for each $0.10 per pound change in the average price of copper, $30 million for each $50 per ounce change in the average price of gold and $25 million for each $2 per pound chang e in the average price of molybdenum.
Capital expenditures for the year 2010 are expected to approximate $1.7 billion, including $0.8 billion for major projects, primarily associated with underground development activities at Grasberg, the sulfide ore project at El Abra and a new sulphur burner facility at Safford. For 2009, capital expenditures totaled $1.6 billion, which included $0.8 billion for major projects. We have resumed certain project development activities at our mining operations and a number of studies are ongoing, which may result in increased capital spending programs. Refer to “Operations” for further discussion. COPPER, GOLD AND MOLYBDENUM MARKETS
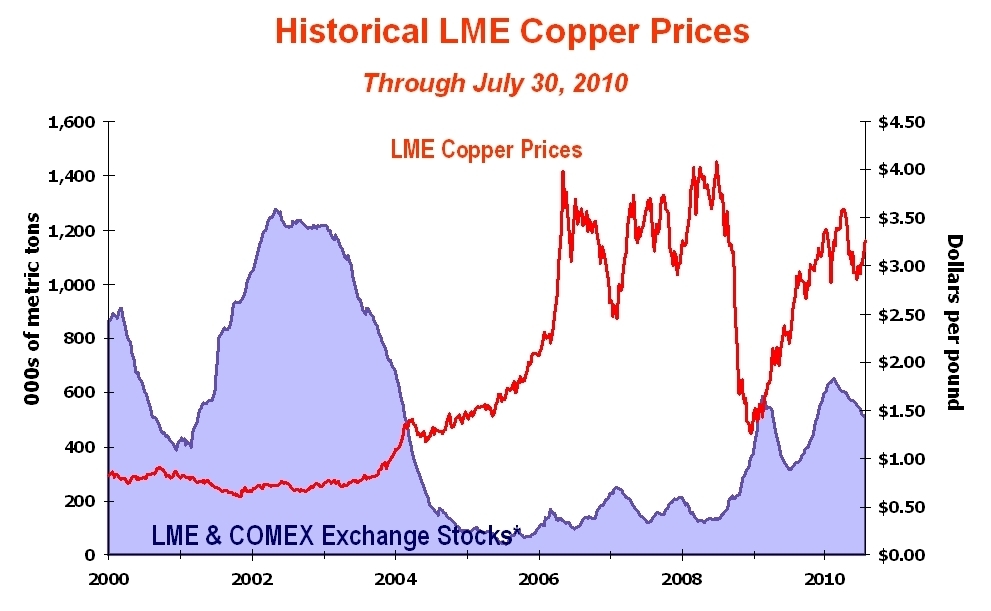
World prices for copper, gold and molybdenum have fluctuated significantly since January 2000. The London Metal Exchange (LME) spot copper price varied from a low of $0.60 per pound in 2001 to a high of $4.08 per pound in 2008, the London gold price fluctuated from a low of approximately $256 per ounce in 2001 to a new high of $1,261 per ounce in June 2010, and the Metals Week Molybdenum Dealer Oxide weekly average price ranged from $2.19 per pound in 2000 to a high of $39.25 per pound in 2005. Copper, gold and molybdenum prices are affected by numerous factors beyond our control as described further in our “Risk Factors” contained in Part I, Item 1A of our Form 10-K for the year ended December 31, 2009.
* Excludes Shanghai stocks, producer, consumer and merchant stocks.
This graph presents LME spot copper prices and reported stocks of copper at the LME and the New York Mercantile Exchange (COMEX) from January 2000 through July 2010. From 2006 through most of 2008, disruptions associated with strikes and other operational issues, combined with growing demand from China and other emerging economies, resulted in low levels of inventory. Beginning in late 2008, slowing consumption led to increases in inventory levels; however, China’s increased buying activity contributed to a decline in exchange inventories during the first half of 2009. After reaching a low for the year in July 2009, inventories grew during the second half of 2009 with combined LME and COMEX stocks ending the year at approximately 592 thousand metric tons. Inventories have decreased since the end of 2009, and at June 30, 2010, combin ed LME and COMEX stocks totaled approximately 544 thousand metric tons, which represents approximately 10 days of global consumption.
Turmoil in the U.S. financial markets and concerns about the global economy negatively impacted copper prices in late 2008, which declined to a four-year low of $1.26 per pound in December 2008; however, copper prices improved during 2009 as a result of strong Chinese import activity and supply limitations. During second-quarter 2010, LME spot copper prices declined compared to first-quarter 2010 levels, because of concerns about the Chinese growth rate, the European debt crisis and global economic recovery. Copper prices ranged from $2.76 per pound to $3.61 per pound and averaged $3.18 per pound in second-quarter 2010. While the near-term outlook is uncertain, we believe the underlying fundamentals of the copper business remain positive, supported by limited supplies from existing mines and the absence of significant new development proj ects. Future copper prices are expected to be volatile and are likely to be influenced by demand from China, economic activity in the U.S. and other industrialized countries, the timing of the development of new supplies of copper and production levels of mines and copper smelters. The LME spot copper price closed at $3.26 per pound on July 30, 2010.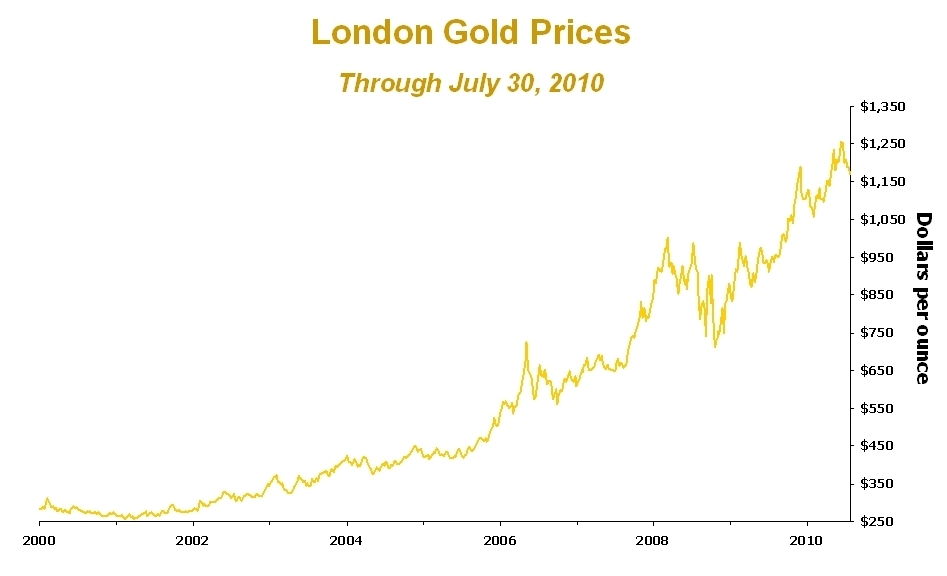
This graph presents London gold prices from January 2000 through July 2010. Continued investment demand and potential weakness in the U.S. dollar are expected to support gold prices, which reached a new high of $1,261 per ounce in June 2010. During second-quarter 2010, gold prices ranged from approximately $1,124 per ounce to $1,261 per ounce and averaged $1,197 per ounce. London gold prices closed at approximately $1,169 per ounce on July 30, 2010.
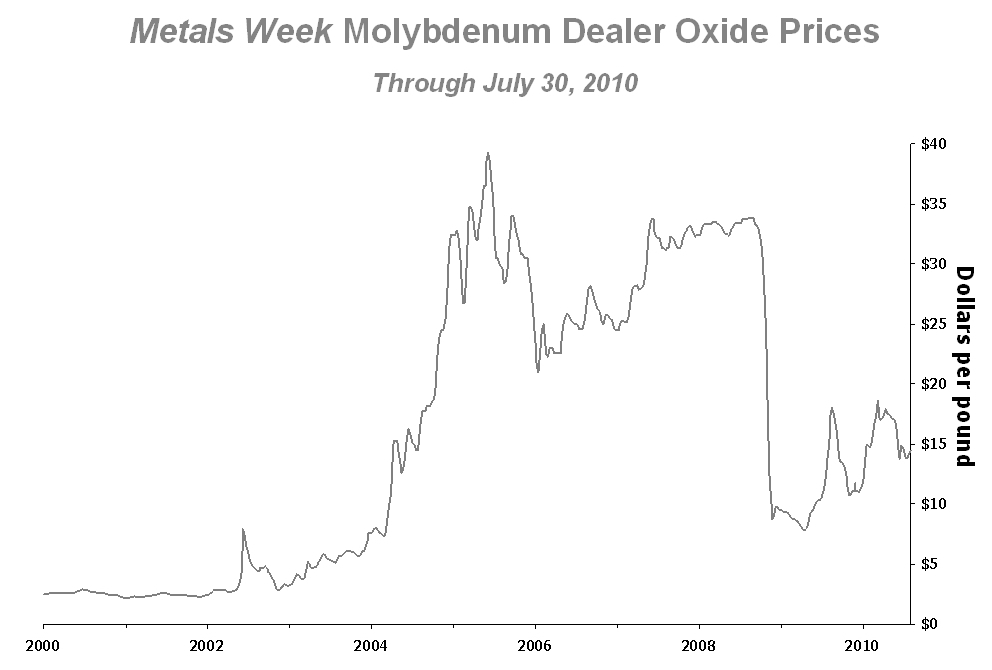
This graph presents the Metals Week Molybdenum Dealer Oxide weekly average price from January 2000 through July 2010. In late 2008, molybdenum prices declined significantly as a result of the financial market turmoil and a decline in demand; however, molybdenum prices improved during 2009 supported by Chinese imports and supply reductions. During second-quarter 2010, the weekly average price of molybdenum ranged from approximately $13.75 per pound to approximately $17.93 per pound and averaged $16.41 per pound. The weekly average Metals Week Molybdenum Dealer Oxide price was $14.13 per pound on July 30, 2010.
CONSOLIDATED RESULTS
| | Three Months Ended June 30, | | Six Months Ended June 30, | |
| | 2010 | | 2009 | | 2010 | | 2009 | |
Financial Data (in millions, except per share amounts) | | | | | | | | | | | | |
Revenuesa | $ | 3,864 | b | $ | 3,684 | b | $ | 8,227 | b | $ | 6,286 | b |
| Operating income | $ | 1,424 | b | $ | 1,508 | b | $ | 3,472 | b | $ | 2,180 | b |
| Net income | $ | 832 | | $ | 812 | | $ | 2,047 | | $ | 1,019 | |
| Net income attributable to noncontrolling interests | $ | 168 | | $ | 164 | | $ | 438 | | $ | 268 | |
Net income attributable to FCX common stockholdersc | $ | 649 | d | $ | 588 | | $ | 1,546 | d | $ | 631 | |
| Diluted net income per share attributable to FCX common stockholders | $ | 1.40 | d | $ | 1.38 | | $ | 3.40 | d | $ | 1.54 | |
| Diluted weighted-average common shares outstanding | | 473 | | | 471 | | | 474 | | | 426 | |
| | | | | | | | | | | | | |
| FCX Mining Operating Data | | | | | | | | | | | | |
Copper (recoverable) | | | | | | | | | | | | |
| Production (millions of pounds) | | 930 | | | 1,069 | | | 1,859 | | | 2,110 | |
| Sales, excluding purchases (millions of pounds) | | 914 | | | 1,102 | | | 1,874 | | | 2,122 | |
| Average realized price per pound | $ | 3.06 | | $ | 2.22 | | $ | 3.13 | | $ | 2.03 | |
Site production and delivery costs per pounde,f | $ | 1.41 | | $ | 1.04 | | $ | 1.38 | | $ | 1.05 | |
Unit net cash costs per pounde,f | $ | 0.97 | | $ | 0.43 | | $ | 0.89 | | $ | 0.54 | |
Gold (recoverable) | | | | | | | | | | | | |
| Production (thousands of ounces) | | 316 | | | 802 | | | 765 | | | 1,397 | |
| Sales, excluding purchases (thousands of ounces) | | 298 | | | 837 | | | 776 | | | 1,382 | |
| Average realized price per ounce | $ | 1,234 | | $ | 932 | | $ | 1,171 | | $ | 919 | |
Molybdenum (recoverable) | | | | | | | | | | | | |
| Production (millions of pounds) | | 17 | | | 13 | | | 34 | | | 27 | |
| Sales, excluding purchases (millions of pounds) | | 16 | | | 16 | | | 33 | | | 26 | |
| Average realized price per pound | $ | 18.18 | | $ | 10.11 | | $ | 16.62 | | $ | 10.65 | |
| a. | Includes the impact of adjustments to provisionally priced concentrate and cathode sales recognized in prior periods. Refer to “Revenues” for further discussion. |
| b. | Following is a summary of revenues and operating income (loss) by operating division (in millions): |
| | Three Months Ended June 30, 2010 | | Three Months Ended June 30, 2009 | |
| | | | | | Operating | | | | | | Operating | |
| | | | | | Income | | | | | | Income | |
| | | Revenues | | | (Loss) | | | Revenues | | | (Loss) | |
| North America copper mines | $ | 1,044 | | $ | 436 | | $ | 703 | | $ | 176 | |
| South America mining | | 849 | | | 401 | | | 884 | | | 455 | |
| Indonesia mining | | 927 | | | 420 | | | 1,610 | | | 1,095 | |
| Africa mining | | 207 | | | 81 | | | 57 | | | (49 | ) |
| Molybdenum | | 325 | | | 120 | | | 186 | | | 8 | |
| Rod & Refining | | 1,129 | | | 6 | | | 747 | | | 2 | |
| Atlantic Copper Smelting & Refining | | 616 | | | (2 | ) | | 415 | | | (18 | ) |
| Corporate, other & eliminations | | (1,233 | ) | | (38 | ) | | (918 | ) | | (161 | ) |
| Total | $ | 3,864 | | $ | 1,424 | | $ | 3,684 | | $ | 1,508 | |
| | Six Months Ended June 30, 2010 | | Six Months Ended June 30, 2009 | |
| | | | | | Operating | | | | | | Operating | |
| | | | | | Income | | | | | | Income | |
| | | Revenues | | | (Loss) | | | Revenues | | | (Loss) | |
| North America copper mines | $ | 2,098 | | $ | 944 | | $ | 1,321 | | $ | 144 | |
| South America mining | | 1,918 | | | 1,033 | | | 1,586 | | | 719 | |
| Indonesia mining | | 2,386 | | | 1,312 | | | 2,732 | | | 1,784 | |
| Africa mining | | 456 | | | 190 | | | 57 | | | (68 | ) |
| Molybdenum | | 600 | | | 193 | | | 332 | | | 4 | |
| Rod & Refining | | 2,202 | | | 10 | | | 1,366 | | | 7 | |
| Atlantic Copper Smelting & Refining | | 1,249 | | | (13 | ) | | 707 | | | (29 | ) |
| Corporate, other & eliminations | | (2,682 | ) | | (197 | ) | | (1,815 | ) | | (381 | ) |
| Total | $ | 8,227 | | $ | 3,472 | | $ | 6,286 | | $ | 2,180 | |
| c. | After net income attributable to noncontrolling interests in subsidiaries and preferred dividends. |
| d. | Includes net losses on early extinguishment of debt totaling $42 million ($0.09 per share) for second-quarter 2010 and $65 million ($0.14 per share) for the first six months of 2010. Refer to Note 6 for further discussion. |
| e. | Reflects per pound weighted-average production and delivery costs and unit net cash costs (net of by-product credits) for all copper mines, excluding net noncash and other costs, and for the 2009 periods excludes Africa mining. For reconciliations of the per pound costs by operating division to production and delivery costs applicable to sales reported in our consolidated financial statements, refer to “Operations – Unit Net Cash Costs” and to “Product Revenues and Production Costs.” |
| f. | The 2009 periods exclude the results of the Tenke Fungurume (Tenke) mine as start-up activities were still under way; the impact of including the results of the Tenke mine for the 2010 periods was $0.01 per pound of copper in second-quarter 2010 and less than $0.01 per pound of copper for the first six months of 2010. |
Revenues
Consolidated revenues include the sale of copper concentrates, copper cathodes, copper rod, gold, molybdenum and other metals by our North and South America copper mines, the sale of copper concentrates (which also contain significant quantities of gold and silver) by our Indonesia mining operation, the sale of copper cathodes and cobalt hydroxide by our Africa mining operation, the sale of molybdenum in various forms by our Molybdenum operations, and the sale of copper cathodes, copper anodes, and gold in anodes and slimes by Atlantic Copper. Consolidated revenues totaled $3.9 billion in second-quarter 2010 and $8.2 billion for the first six months of 2010, compared with $3.7 billion in second-quarter 2009 and $6.3 billion for the first six months of 2009. Following is a summary of changes in our consolidated revenues between periods (in millions):
| | Three Months Ended June 30, | | Six Months Ended June 30, | |
| Consolidated revenues – 2009 periods | $ | 3,684 | | $ | 6,286 | |
| Higher sales price realizations from mining operations: | | | | | | |
| Copper | | 768 | | | 2,005 | |
| Gold | | 90 | | | 195 | |
| Molybdenum | | 132 | | | 198 | |
| (Lower) higher sales volumes from mining operations: | | | | | | |
| Copper | | (417 | ) | | (511 | ) |
| Gold | | (502 | ) | | (557 | ) |
| Molybdenum | | 8 | | | 82 | |
| Higher purchased copper | | 28 | | | 30 | |
| Lower net adjustments for prior period/year provisionally priced sales, | | | | | | |
| including PT Freeport Indonesia’s 2009 forward copper sales contracts | | (193 | ) | | (62 | ) |
| Higher Atlantic Copper revenues | | 201 | | | 542 | |
| Other, including intercompany eliminations | | 65 | | | 19 | |
| Consolidated revenues – 2010 periods | $ | 3,864 | | $ | 8,227 | |
Consolidated revenues in the 2010 periods were favorably impacted by higher copper, gold and molybdenum prices. Realized copper prices increased to an average of $3.06 per pound in second-quarter 2010 (compared with $2.22 per pound in second-quarter 2009) and $3.13 per pound for the first six months of 2010 (compared with $2.03 per pound for the first six months of 2009). Realized gold prices increased to an average of $1,234 per ounce in second-quarter 2010 (compared with $932 per ounce in second-quarter 2009) and $1,171 per ounce for the first six months of 2010 (compared with $919 per ounce for the first six months of 2009). Realized molybdenum prices increased to an average of $18.18 per pound in second-quarter 2010 (compared with $10.11 per pound in second-quarter 2009) and $16.62 per pound for the first six months of 2010 (compared with $10.65 per pound for the first six months of 2009).
Consolidated sales volumes totaled 914 million pounds of copper, 298 thousand ounces of gold and 16 million pounds of molybdenum in second-quarter 2010, compared with 1.1 billion pounds of copper, 837 thousand ounces of gold and 16 million pounds of molybdenum in second-quarter 2009. For the first six months of 2010, consolidated sales volumes totaled 1.9 billion pounds of copper, 776 thousand ounces of gold and 33 million pounds of molybdenum, compared with 2.1 billion pounds of copper, 1.4 million ounces of gold and 26 million pounds of molybdenum for the first six months of 2009. Lower copper and gold sales volumes in the 2010 periods primarily reflect anticipated lower ore grades at Grasberg resulting from planned mine sequencing. Lower copper
sales volumes were also impacted by decreased volumes at our South America mining operations, partly offset by additional volumes provided by the Tenke mine in Africa. Higher molybdenum sales volumes reflect improved demand in the chemical sector. Refer to “Operations” for further discussion.
During the first half of 2010, approximately 47 percent of our mined copper was sold in concentrate, approximately 27 percent as cathodes and approximately 26 percent as rod from our North America operations. Substantially all concentrate and cathode sales contracts at our copper mining operations provide final copper pricing in a specified future period (generally one to four months from the shipment date) based primarily on quoted LME prices. We receive market prices based on prices in the specified future period, which results in price fluctuations recorded through revenues until the date of settlement. We record revenues and invoice customers at the time of shipment based on then-current LME prices, which results in an embedded derivative on our provisional priced concentrate and cathode sales that is adjusted to fair value through ea rnings each period, using the period-end forward prices, until the date of final pricing. To the extent final prices are higher or lower than what was recorded on a provisional basis, an increase or decrease to revenues is recorded each reporting period until the date of final pricing. Accordingly, in times of rising copper prices, our revenues benefit from higher prices received for contracts priced at current market rates and also from an increase related to the final pricing of provisionally priced sales pursuant to contracts entered into in prior periods; in times of falling copper prices, the opposite occurs.
At March 31, 2010, we had provisionally priced copper sales at our copper mining operations totaling 372 million pounds of copper (net of intercompany sales and noncontrolling interests) recorded at an average of $3.53 per pound. Lower prices during second-quarter 2010 resulted in adjustments to these prior period provisionally priced copper sales and decreased consolidated revenues by $169 million ($72 million to net income attributable to FCX common stockholders or $0.15 per share) in second-quarter 2010, compared with a net increase of $43 million ($13 million to net income attributable to FCX common stockholders or $0.03 per share) in second-quarter 2009. Additionally, adjustments to prior year provisionally priced copper sales at our copper mining operations resulted in a net decrease to consolidated revenues of $23 million ($9 milli on to net income attributable to FCX common stockholders or $0.02 per share) for the first six months of 2010, compared with a net increase of $132 million ($62 million to net income attributable to FCX common stockholders or $0.15 per share) for the first six months of 2009.
LME spot copper prices averaged $3.18 per pound in second-quarter 2010, compared with our average realized price of $3.06 per pound. At June 30, 2010, we had provisionally priced copper sales at our copper mining operations totaling 364 million pounds of copper (net of intercompany sales and noncontrolling interests) recorded at an average of $2.95 per pound, subject to final pricing over the next several months. We estimate that each $0.05 change from the June 30, 2010, average price for provisionally priced copper sales would have a net impact on our 2010 consolidated revenues of approximately $24 million ($12 million to net income attributable to FCX common stockholders). The LME spot copper price closed at $3.26 per pound on July 30, 2010.
In April 2009, we entered into forward sales contracts on certain of PT Freeport Indonesia’s provisionally priced copper sales at March 31, 2009, which final priced from April 2009 through July 2009 (refer to Note 7 for further discussion).
Production and Delivery Costs
Consolidated production and delivery costs totaled $2.1 billion in second-quarter 2010 and $4.0 billion for the first six months of 2010, compared with $1.8 billion in second-quarter 2009 and $3.4 billion for the first six months of 2009. The increase in consolidated production and delivery costs in the 2010 periods primarily reflected higher costs of concentrate purchases at Atlantic Copper associated with higher copper prices and higher commodity-based input costs at our mining operations.
Our copper mining operations require a significant amount of energy, principally electricity, diesel, coal and natural gas. For the year 2010, we expect energy costs (including Africa mining) to approximate 20 percent of our consolidated copper production costs, which reflects purchases of approximately 220 million gallons of diesel fuel; 6,200 gigawatt hours of electricity at our North America, South America and Africa copper mining operations (we generate all of our power at our Indonesia mining operation); 800 thousand metric tons of coal for our coal power plant in Indonesia; and 1 million MMBTU (million british thermal units) of natural gas at certain of our North America mines. Energy costs for 2009, which excluded Africa mining, approximated 20 percent of our consolidated copper production costs.
Consolidated site production and delivery costs for our copper mining operations, excluding net noncash and other costs, averaged $1.41 per pound of copper in second-quarter 2010 and $1.38 per pound for the first six months of 2010, compared with $1.04 per pound of copper in second-quarter 2009 and $1.05 per pound of copper for the first six months of 2009. Higher site production and delivery costs in the 2010 periods primarily reflected lower copper sales volumes at Grasberg and South America. Refer to “Operations – Unit Net Cash Costs” for further discussion of unit net cash costs associated with our operating divisions, and to “Product Revenues and Production Costs” for reconciliations of per pound costs by operating division to production and delivery costs applicable to sales reported in our consolidated financial statements.
Depreciation, Depletion and Amortization
Consolidated depreciation, depletion and amortization expense totaled $249 million in second-quarter 2010 and $520 million for the first six months of 2010, compared with $256 million in second-quarter 2009 and $488 million for the first six months of 2009. Consolidated depreciation, depletion and amortization for the 2010 periods reflected lower expense under the unit-of-production method, offset by higher expense at our Tenke Fungurume mine, which commenced initial copper production in March 2009.
Lower of Cost or Market (LCM) Inventory Adjustments
Inventories are required to be recorded at the lower of cost or market. In first-quarter 2009, we recognized charges totaling $19 million ($19 million to net income attributable to FCX common stockholders or $0.05 per share) for LCM inventory adjustments associated with our molybdenum inventories.
Selling, General and Administrative Expenses
Consolidated selling, general and administrative expenses totaled $101 million in second-quarter 2010 and $196 million for the first six months of 2010, compared with $89 million in second-quarter 2009 and $151 million for the first six months of 2009. Selling, general and administrative expenses for the 2010 periods reflected higher incentive compensation costs and charges associated with relocating our corporate offices.
Exploration and Research Expenses
Consolidated exploration and research expenses totaled $38 million in second-quarter 2010 and $69 million for the first six months of 2010, compared with $24 million in second-quarter 2009 and $54 million for the first six months of 2009. Exploration activities are being conducted near our existing mines with a focus on opportunities to expand reserves that will support the development of additional future production capacity in the large mineral districts where we currently operate. Significantly expanded drilling activities in recent years have been successful in generating reserve additions and in identifying potential additional mineral resources adjacent to existing ore bodies. Results indicate opportunities for future potential reserve additions at Morenci, Sierrita and Bagdad in North America, at Cerro Verde and El Abra in South Am erica and in the Tenke Fungurume district.
For the year 2010, exploration spending is expected to approximate $120 million. Exploration activities will continue to focus primarily on the potential in our existing mineral districts.
Restructuring and Other Charges
For the first six months of 2009, we recognized net charges of $23 million ($22 million to net income attributable to FCX common stockholders or $0.05 per share) associated with revised operating plans, including contract termination costs, other project cancellation costs and charges for employee severance and benefits, partially offset by gains for pension and postretirement special benefits and curtailments.
Interest Expense, Net
Consolidated interest expense (before capitalization) totaled $132 million in second-quarter 2010 and $283 million for the first six months of 2010, compared with $172 million in second-quarter 2009 and $348 million for the first six months of 2009. Lower interest expense in the 2010 periods primarily reflected the impact of debt repayments during 2009 and the first half of 2010.
Capitalized interest decreased to $10 million in second-quarter 2010 and $16 million for the first six months of 2010, compared with $14 million in second-quarter 2009 and $59 million for the first six months of 2009, primarily reflecting the completion of development activities for the initial project at our Tenke Fungurume mine, which commenced initial copper production in March 2009.
Losses on Early Extinguishment of Debt
We recorded losses on early extinguishment of debt totaling $50 million ($42 million to net income attributable to FCX common stockholders or $0.09 per share) in second-quarter 2010 and $77 million ($65 million to net income attributable to FCX common stockholders or $0.14 per share) for the first six months of 2010 associated with the redemption of our Senior Floating Rate Notes and open-market purchases of our 8.25% and 8.375% Senior Notes. Refer to Note 6 for further discussion.
Provision for Income Taxes
Our income tax provision for second-quarter 2010 resulted from taxes on international operations ($382 million) and U.S. operations ($51 million). Our income tax provision for the first six months of 2010 resulted from taxes on international operations ($979 million) and U.S. operations ($132 million). As presented in the table below, our consolidated effective income tax rate was 35 percent for the first six months of 2010.
Our income tax provision for second-quarter 2009 resulted from taxes on international operations ($538 million) and U.S. operations ($4 million). Our income tax provision for the first six months of 2009 resulted from taxes on international operations ($868 million) and U.S. operations ($5 million). During the first half of 2009, we did not record a benefit for losses generated in the U.S., and those losses could not be used to offset income generated from international operations. These factors combined with the high proportion of income earned in Indonesia, which was taxed at an effective tax rate of 43 percent, caused our consolidated effective income tax rate of 47 percent for the first six months of 2009, to be higher than the U.S. federal statutory rate of 35 percent.
A summary of the approximate amounts in the calculation of our consolidated provision for income taxes for the first six months of 2010 and 2009 follows (in millions, except percentages):
| | | Six Months Ended | | Six Months Ended | |
| | | June 30, 2010 | | June 30, 2009 | |
| | | | | | | | Income Tax | | | | | | | Income Tax | |
| | | Income | | | Effective | | (Provision) | | Income | | | Effective | | (Provision) | |
| | | (Loss)a | | | Tax Rate | | Benefit | | (Loss)a | | | Tax Rate | | Benefit | |
| U.S. | | $ | 586 | | | 23% | | $ | (132 | ) | $ | (318 | ) | | (2)% | | $ | (5 | ) |
| South America | | | 1,022 | | | 32% | | | (331 | ) | | 694 | | | 32% | | | (221 | ) |
| Indonesia | | | 1,349 | | | 42% | | | (570 | ) | | 1,759 | | | 43% | | | (749 | ) |
| Africa | | | 142 | | | 30% | | | (43 | ) | | (86 | ) | | 30% | | | 26 | |
| Eliminations and other | | | 50 | | | N/A | | | (24 | ) | | (175 | ) | | N/A | | | 56 | |
Annualized rate adjustment b | | | N/A | | | N/A | | | (11 | ) | | N/A | | | N/A | | | 20 | |
| Consolidated FCX | | $ | 3,149 | | | 35%c | | $ | (1,111 | ) | $ | 1,874 | | | 47% | | $ | (873 | ) |
| a. | Represents income (loss) by geographic location before income taxes and equity in affiliated companies’ net earnings. |
| b. | In accordance with applicable accounting rules, we adjust our interim provision for income taxes to equal our estimated annualized tax rate. |
| c. | Our estimated consolidated effective tax rate for the year 2010 will vary with commodity price changes and the mix of income from international and U.S. operations. Assuming average prices of $3.00 per pound of copper, $1,200 per ounce of gold and $14 per pound of molybdenum for the remainder of 2010 and current 2010 sales volume and cost estimates, we estimate our annual consolidated effective tax rate will approximate 36 percent. |
OPERATIONS
North America Copper Mines
We currently have six operating copper mines in North America – Morenci, Sierrita, Bagdad, Safford and Miami in Arizona, and Tyrone in New Mexico. All of these mining operations are wholly owned, except for Morenci, an unincorporated joint venture, in which we own an 85 percent undivided interest.
The North America copper mines include open-pit mining, sulfide ore concentrating, leaching and solution extraction/electrowinning (SX/EW) operations. In addition to copper, the Sierrita and Bagdad mines produce molybdenum as a by-product. A majority of the copper produced at our North America copper mines is cast into copper rod by our Rod & Refining operations. The remainder of our North America copper sales is primarily in the form of copper cathode or copper concentrate. Refer to Note 11 for further discussion of our reportable segment in the North America copper mines division.
Operating and Development Activities. We have restarted the Morenci mill and have commenced a staged ramp up of Morenci’s mining rates. We have also resumed certain project development activities, including restarting the Miami mine and construction on the sulphur burner at Safford. Operating plans for the North America copper mines continue to be reviewed and adjustments will be made based on market conditions.
Morenci Mill Restart and Mine Ramp-up. In March 2010, we restarted the Morenci mill to process available sulfide material currently being mined. Mill throughput averaged 28,000 metric tons of ore per day during the second quarter of 2010 and is expected to increase to approximately 50,000 metric tons per day by 2011. We have also commenced a staged ramp up at the Morenci mine from the current rate of 450,000 metric tons per day to 635,000 metric tons per day. These activities are expected to expose additional ore and enable Morenci’s annual copper production to increase by approximately 125 million pounds, beginning in 2011. Further increases to Morenci’s mining rate are being evaluated.
Miami Restart. We have initiated limited mining activities at the Miami mine to improve efficiencies of ongoing reclamation projects associated with historical mining operations at the site. During an approximate five-year mine life, we expect to ramp up production at Miami to approximately 100 million pounds of copper per year by the second half of 2011. We are investing approximately $40 million for this project, which is benefiting from the use of existing mining equipment.
Safford Sulphur Burner. We are advancing plans to construct a sulphur burner at the Safford mine, which will provide a more cost effective source of sulphuric acid used in SX/EW operations and lower transportation costs. This project is expected to be complete during 2011 at a capital investment of approximately $150 million.
Chino Restart. We are evaluating the restart of mining and milling activities at the Chino mine, which were suspended in late 2008. The preliminary economics of the project appear attractive and would increase copper production by approximately 150 million to 200 million pounds per year. As reported in our annual report on Form 10-K for the year ended December 31, 2009, Chino’s reserves, excluding metal in stockpiles, totaled 1.1 billion pounds of copper (determined using a long-term average copper price of $1.60 per pound).
Twin Buttes Acquisition. In December 2009, we purchased the Twin Buttes copper mine, which ceased operations in 1994, and is adjacent to our Sierrita mine. The purchase provides significant synergies in the Sierrita minerals district, including the potential for expanded mining activities and access to material that can be used for Sierrita tailings and stockpile reclamation purposes. Studies have commenced to incorporate the Twin Buttes resources in our development plans.
Operating Data. Following is summary operating data for the North America copper mines for the second quarters and first six months of 2010 and 2009:
| | | Three Months Ended June 30, | | Six Months Ended June 30, | |
| | | 2010 | | 2009 | | 2010 | | 2009 | |
| Operating Data, Net of Joint Venture Interest | | | | | | | | | | | | | |
Copper (millions of recoverable pounds) | | | | | | | | | | | | | |
| Production | | | 263 | | | 272 | | | 527 | | | 561 | |
| Sales, excluding purchases | | | 289 | | | 281 | | | 580 | | | 582 | |
| Average realized price per pound | | $ | 3.21 | | $ | 2.18 | | $ | 3.27 | | $ | 1.88 | |
| | | | | | | | | | | | | | |
Molybdenum (millions of recoverable pounds) | | | | | | | | | | | | | |
Productiona | | | 5 | | | 7 | | | 11 | | | 13 | |
| | | | | | | | | | | | | | |
| 100% Operating Data | | | | | | | | | | | | | |
| SX/EW operations | | | | | | | | | | | | | |
| Leach ore placed in stockpiles (metric tons per day) | | | 646,100 | | | 553,700 | | | 624,100 | | | 611,200 | |
| Average copper ore grade (percent) | | | 0.25 | | | 0.31 | | | 0.25 | | | 0.30 | |
| Copper production (millions of recoverable pounds) | | | 182 | | | 201 | | | 384 | | | 423 | |
| | | | | | | | | | | | | | |
| Mill operations | | | | | | | | | | | | | |
| Ore milled (metric tons per day) | | | 195,300 | | | 170,600 | | | 179,200 | | | 175,700 | |
| Average ore grade (percent): | | | | | | | | | | | | | |
| Copper | | | 0.32 | | | 0.31 | | | 0.31 | | | 0.33 | |
| Molybdenum | | | 0.02 | | | 0.03 | | | 0.02 | | | 0.03 | |
| Copper recovery rate (percent) | | | 81.4 | | | 84.8 | | | 83.3 | | | 85.3 | |
| Production (millions of recoverable pounds): | | | | | | | | | | | | | |
| Copper | | | 100 | | | 89 | | | 180 | | | 177 | |
| Molybdenum | | | 5 | | | 7 | | | 11 | | | 13 | |
| a. | Reflects by-product molybdenum production from the North America copper mines. Sales of by-product molybdenum are reflected in the Molybdenum division. |
Copper sales volumes from our North America copper mines totaled 289 million pounds in second-quarter 2010 and 580 million pounds for the first six months of 2010, compared with copper sales volumes of 281 million pounds in second-quarter 2009 and 582 million pounds for the first six months of 2009.
Consolidated sales volumes from our North America copper mines are expected to approximate 1.1 billion pounds of copper for the year 2010, compared with 1.2 billion pounds of copper in 2009. As discussed above in “Operating and Development Activities,” we are increasing mining and milling rates at the Morenci mine and restarting the Miami mine, which are expected to result in higher production in future periods.
Unit Net Cash Costs. Unit net cash costs per pound of copper is a measure intended to provide investors with information about the cash-generating capacity of our mining operations expressed on a basis relating to the primary metal product for our respective operations. We use this measure for the same purpose and for monitoring operating performance by our mining operations. This information differs from measures of performance determined in accordance with generally accepted accounting principles (GAAP) in the U.S. and should not be considered in isolation or as a substitute for measures of performance determined in accordance with U.S. GAAP. This measure is presented by other mining companies, although our measure may not be comparable to similarly titled measures reported by other companies.
Gross Profit per Pound of Copper and Molybdenum
The following tables summarize unit net cash costs and gross profit per pound of copper and molybdenum at the North America copper mines for the second quarters and first six months of 2010 and 2009. Refer to “Product Revenues and Production Costs” for an explanation of the “by-product” and “co-product” methods and a reconciliation of unit net cash costs to production and delivery costs applicable to sales reported in our consolidated financial statements.
| | Three Months Ended June 30, 2010 | | Three Months Ended June 30, 2009 | |
| | By- | | Co-Product Method | | By- | | Co-Product Method | |
| | Product | | | | | Molyb- | | Product | | | | | Molyb- | |
| | Method | | Copper | | denuma | | Method | | Copper | | denuma | |
| Revenues, excluding adjustments | $ | 3.21 | | $ | 3.21 | | $ | 17.34 | | $ | 2.18 | | $ | 2.18 | | $ | 8.43 | |
| | | | | | | | | | | | | | | | | | | |
| Site production and delivery, before net noncash | | | | | | | | | | | | | | | | | | |
| and other costs shown below | | 1.46 | | | 1.31 | | | 8.55 | | | 1.24 | | | 1.13 | | | 5.34 | |
By-product creditsa | | (0.38 | ) | | – | | | – | | | (0.21 | ) | | – | | | – | |
| Treatment charges | | 0.09 | | | 0.08 | | | – | | | 0.09 | | | 0.08 | | | – | |
| Unit net cash costs | | 1.17 | | | 1.39 | | | 8.55 | | | 1.12 | | | 1.21 | | | 5.34 | |
| Depreciation, depletion and amortization | | 0.23 | | | 0.22 | | | 0.64 | | | 0.21 | | | 0.21 | | | 0.36 | |
| Noncash and other costs, net | | 0.19 | | | 0.18 | | | 0.04 | | | 0.15 | | | 0.14 | | | 0.04 | |
| Total unit costs | | 1.59 | | | 1.79 | | | 9.23 | | | 1.48 | | | 1.56 | | | 5.74 | |
| Revenue adjustments, primarily for hedging | | – | | | – | | | – | | | 0.06 | | | 0.06 | | | – | |
| Idle facility and other non-inventoriable costs | | (0.08 | ) | | (0.08 | ) | | (0.01 | ) | | (0.08 | ) | | (0.08 | ) | | – | |
| Gross profit per pound | $ | 1.54 | | $ | 1.34 | | $ | 8.10 | | $ | 0.68 | | $ | 0.60 | | $ | 2.69 | |
| | | | | | | | | | | | | | | | | | | |
| Copper sales (millions of recoverable pounds) | | 288 | | | 288 | | | | | | 281 | | | 281 | | | | |
Molybdenum sales (millions of recoverable pounds)b | | | | | | | | 5 | | | | | | | | | 7 | |
| | Six Months Ended June 30, 2010 | | Six Months Ended June 30, 2009 | |
| | By- | | Co-Product Method | | By- | | Co-Product Method | |
| | Product | | | | | Molyb- | | Product | | | | | Molyb- | |
| | Method | | Copper | | denuma | | Method | | Copper | | denuma | |
| Revenues, excluding adjustments | $ | 3.27 | | $ | 3.27 | | $ | 15.71 | | $ | 1.88 | | $ | 1.88 | | $ | 9.02 | |
| | | | | | | | | | | | | | | | | | | |
| Site production and delivery, before net noncash | | | | | | | | | | | | | | | | | | |
| and other costs shown below | | 1.39 | | | 1.25 | | | 8.00 | | | 1.28 | | | 1.19 | | | 4.85 | |
By-product creditsa | | (0.32 | ) | | – | | | – | | | (0.19 | ) | | – | | | – | |
| Treatment charges | | 0.08 | | | 0.08 | | | – | | | 0.08 | | | 0.08 | | | – | |
| Unit net cash costs | | 1.15 | | | 1.33 | | | 8.00 | | | 1.17 | | | 1.27 | | | 4.85 | |
| Depreciation, depletion and amortization | | 0.25 | | | 0.24 | | | 0.63 | | | 0.23 | | | 0.22 | | | 0.29 | |
| Noncash and other costs, net | | 0.13 | | | 0.13 | | | 0.05 | | | 0.15 | | | 0.15 | | | 0.10 | |
| Total unit costs | | 1.53 | | | 1.70 | | | 8.68 | | | 1.55 | | | 1.64 | | | 5.24 | |
| Revenue adjustments, primarily for hedging | | – | | | – | | | – | | | 0.15 | | | 0.15 | | | – | |
| Idle facility and other non-inventoriable costs | | (0.08 | ) | | (0.08 | ) | | (0.01 | ) | | (0.10 | ) | | (0.11 | ) | | – | |
| Gross profit per pound | $ | 1.66 | | $ | 1.49 | | $ | 7.02 | | $ | 0.38 | | $ | 0.28 | | $ | 3.78 | |
| | | | | | | | | | | | | | | | | | | |
| Copper sales (millions of recoverable pounds) | | 579 | | | 579 | | | | | | 582 | | | 582 | | | | |
Molybdenum sales (millions of recoverable pounds)b | | | | | | | | 11 | | | | | | | | | 13 | |
| a. | Molybdenum by-product credits and revenues reflect volumes produced at market-based pricing and also include tolling revenues at Sierrita. |
| b. | Reflects molybdenum produced by the North America copper mines. |
Unit net cash costs (net of by-product credits) for our North America copper mines were $1.17 per pound of copper in second-quarter 2010 and $1.15 per pound of copper for the first six months of 2010, compared with $1.12 per pound of copper in second-quarter 2009 and $1.17 per pound of copper for the first six months of 2009. Unit net cash costs for the 2010 periods reflected higher site production and delivery costs ($0.22 per pound for the quarter and $0.11 per pound for the six month period) primarily associated with higher input costs from increased mining and milling activities. Offsetting these higher costs were higher molybdenum credits ($0.17 per pound for the quarter and $0.13 per pound for the six month period) resulting from higher molybdenum prices.
Some of our U.S. copper rod customers request a fixed market price instead of the COMEX average price in the month of shipment. We hedge this price exposure in a manner that allows us to receive market prices in the month of shipment while the customer pays the fixed price they requested. Because these contracts previously did not meet the criteria to qualify for hedge accounting, revenue adjustments in second-quarter and the first six months of 2009 primarily reflect unrealized gains on these copper derivative contracts.
Our operating North America copper mines have varying cost structures because of differences in ore grades and ore characteristics, processing costs, by-products and other factors. Based on current operating plans and assuming achievement of current 2010 sales volume and cost estimates and an average price of $14 per pound of molybdenum for the remainder of 2010, we estimate that average unit net cash costs (net of by-product credits) for our North America copper mines would approximate $1.24 per pound of copper for the year 2010, compared with $1.11 per pound in 2009. Each $2 per pound change in the average price of molybdenum during the remainder of 2010 would have an approximate $0.02 per pound impact on the North America copper mines’ 2010 unit net cash costs.
South America Mining
We have four operating copper mines in South America – Cerro Verde in Peru, and Candelaria, Ojos del Salado and El Abra in Chile. We own a 53.56 percent interest in Cerro Verde, an 80 percent interest in both Candelaria and Ojos del Salado and a 51 percent interest in El Abra.
South America mining includes open-pit and underground mines, sulfide ore concentrating, leaching and SX/EW operations. In addition to copper, the Cerro Verde mine produces molybdenum concentrates as a by-product, and the Candelaria and Ojos del Salado mines produce gold and silver as by-products. Production from our South America mines is sold as copper concentrate or copper cathode under long-term contracts. Our South America mines sell a portion of their copper concentrate and cathode inventories to Atlantic Copper, an affiliated smelter. Refer to Note 11 for further discussion of our reportable segment in the South America mining division.
Operating and Development Activities. The molybdenum circuit at Cerro Verde, which had been temporarily curtailed, resumed operations in September 2009. We have also resumed certain project development activities, including the El Abra sulfide project and the Cerro Verde mill optimization project.
El Abra Sulfide. We are engaged in construction activities associated with the development of a large sulfide deposit at El Abra to extend its mine life by over 10 years. Production from the sulfide ore, which will ramp up to approximately 300 million pounds of copper per year, is expected to begin in 2012 and will replace currently depleting oxide copper production. The aggregate capital investment for this project is expected to total $725 million through 2015, of which approximately $535 million is for the initial phase of the project expected to be completed in 2012. Aggregate project costs of $190 million have been incurred as of June 30, 2010, $115 million of which has been incurred during the first six months of 2010.
We have also initiated studies for a potential milling operation at El Abra to process additional sulfide material and to achieve higher recoveries.
Cerro Verde Expansion. We are completing a project to optimize throughput at the existing Cerro Verde concentrator. This project, which is expected to be completed by the end of 2010, is designed to add 30 million pounds of additional copper production per year by increasing mill throughput from 108,000 metric tons of ore per day to 120,000 metric tons of ore per day. The aggregate capital investment for this project is expected to total approximately $50 million.
In addition, we are evaluating the potential for a large scale concentrator expansion at Cerro Verde. Reserve additions in recent years have provided opportunities to potentially more than double the existing facility’s capacity. A feasibility study is expected to be completed in the first half of 2011.
Other Matters. As reported in Note 14 of our report on Form 10-K for the year ended December 31, 2009, Cerro Verde was notified by SUNAT, the Peruvian national tax authority, of its intent to assess mining royalties related to the minerals processed by the Cerro Verde concentrator, which was added to Cerro Verde’s processing facilities in late 2006. In August 2009, Cerro Verde received a formal assessment approximating $50 million in connection with its alleged obligations for mining royalties and fines for the period from October 2006 through December 2007. In April 2010, SUNAT issued a ruling denying Cerro Verde’s protest of the assessment; Cerro Verde plans
to appeal this decision. Also, in April 2010, Cerro Verde received a formal assessment approximating $40 million in royalties for the year 2008.
Cerro Verde is challenging these royalties because its stability agreement with the Peruvian government exempts from royalties all minerals extracted from its mining concession, irrespective of the method used for processing those minerals. No amounts have been accrued for this contingency. If Cerro Verde is ultimately found responsible for those royalties, it will also be liable for interest, which accrues at rates that range from 6 to 18 percent based on the year accrued and the currency in which the amounts would be payable.
In April 2010, there was a major earthquake in Chile that resulted in significant damages in certain regions of the country. The Chilean government proposed a temporary increase in mining royalties to help fund reconstruction activities, but it was rejected by the Chilean congress in July 2010. We will continue to monitor the activity associated with these proposals and their potential impact on our financial results.
Operating Data. Following is summary operating data for our South America mining operations for the second quarters and first six months of 2010 and 2009:
| | | Three Months Ended June 30, | | Six Months Ended June 30, | |
| | | 2010 | | 2009 | | 2010 | | 2009 | |
| | | | | | | | | | | | | | |
Copper (millions of recoverable pounds) | | | | | | | | | | | | | |
| Production | | | 329 | | | 358 | | | 651 | | | 706 | |
| Sales | | | 311 | | | 363 | | | 618 | | | 713 | |
| Average realized price per pound | | $ | 3.02 | | $ | 2.22 | | $ | 3.07 | | $ | 2.10 | |
| | | | | | | | | | | | | | |
Gold (thousands of recoverable ounces) | | | | | | | | | | | | | |
| Production | | | 20 | | | 24 | | | 39 | | | 47 | |
| Sales | | | 20 | | | 25 | | | 39 | | | 48 | |
| Average realized price per ounce | | $ | 1,221 | | $ | 928 | | $ | 1,175 | | $ | 915 | |
| | | | | | | | | | | | | | |
Molybdenum (millions of recoverable pounds) | | | | | | | | | | | | | |
Productiona | | | 1 | | | – | | | 3 | | | 1 | |
| | | | | | | | | | | | | | |
| SX/EW operations | | | | | | | | | | | | | |
| Leach ore placed in stockpiles (metric tons per day) | | | 247,400 | | | 260,200 | | | 251,600 | | | 255,400 | |
| Average copper ore grade (percent) | | | 0.42 | | | 0.44 | | | 0.43 | | | 0.45 | |
| Copper production (millions of recoverable pounds) | | | 130 | | | 141 | | | 263 | | | 278 | |
| | | | | | | | | | | | | | |
| Mill operations | | | | | | | | | | | | | |
| Ore milled (metric tons per day) | | | 187,100 | | | 186,300 | | | 183,600 | | | 184,400 | |
Average ore grade (percent):b | | | | | | | | | | | | | |
| Copper | | | 0.62 | | | 0.67 | | | 0.62 | | | 0.68 | |
| Molybdenum | | | 0.02 | | | 0.02 | | | 0.02 | | | 0.02 | |
| Copper recovery rate (percent) | | | 89.9 | | | 90.2 | | | 89.5 | | | 89.6 | |
| Production (recoverable): | | | | | | | | | | | | | |
| Copper (millions of pounds) | | | 199 | | | 217 | | | 388 | | | 428 | |
| Gold (thousands of ounces) | | | 20 | | | 24 | | | 39 | | | 47 | |
| Molybdenum (millions of pounds) | | | 1 | | | – | | | 3 | | | 1 | |
| a. | Reflects by-product molybdenum production from our Cerro Verde copper mine. Sales of by-product molybdenum are reflected in the Molybdenum division. |
| b. | Average ore grades of gold produced at our South America mining operations rounds to less than 0.001 grams per metric ton. |
Copper sales from our South America mining operations decreased to 311 million pounds in second-quarter 2010 and 618 million pounds for the first six months of 2010, compared with 363 million pounds in second-quarter 2009 and 713 million pounds for the first six months of 2009. These decreases primarily reflected lower ore grades at Candelaria and timing of shipments at Cerro Verde.
Consolidated sales volumes from South America mining are expected to approximate 1.3 billion pounds of copper and 100 thousand ounces of gold for the year 2010, compared with 1.4 billion pounds of copper and 90 thousand ounces of gold in 2009. Projected copper sales volumes for 2010 are lower than 2009 primarily reflecting
anticipated lower ore grades, principally at El Abra in connection with the depletion of the oxide ore resource and the transition to the sulfide deposit.
Unit Net Cash Costs. Unit net cash costs per pound of copper is a measure intended to provide investors with information about the cash-generating capacity of our mining operations expressed on a basis relating to the primary metal product for our respective operations. We use this measure for the same purpose and for monitoring operating performance by our mining operations. This information differs from measures of performance determined in accordance with U.S. GAAP and should not be considered in isolation or as a substitute for measures of performance determined in accordance with U.S. GAAP. This measure is presented by other mining companies, although our measure may not be comparable to similarly titled measures reported by other companies.
Gross Profit per Pound of Copper
The following tables summarize unit net cash costs and gross profit per pound of copper at the South America mining operations for the second quarters and first six months of 2010 and 2009. Unit net cash costs per pound of copper are reflected under the by-product and co-product methods as the South America mining operations also had small amounts of molybdenum, gold and silver sales. Refer to “Product Revenues and Production Costs” for an explanation of the “by-product” and “co-product” methods and a reconciliation of unit net cash costs to production and delivery costs applicable to sales reported in our consolidated financial statements.
| | Three Months Ended June 30, 2010 | | Three Months Ended June 30, 2009 | |
| | By-Product | | Co-Product | | By-Product | | Co-Product | |
| | Method | | Method | | Method | | Method | |
| Revenues, excluding adjustments | $ | 3.02 | | $ | 3.02 | | $ | 2.22 | | $ | 2.22 | |
| | | | | | | | | | | | | |
| Site production and delivery, before net noncash | | | | | | | | | | | | |
| and other costs shown below | | 1.22 | | | 1.14 | | | 1.00 | | | 0.95 | |
| By-product credits | | (0.19 | ) | | – | | | (0.10 | ) | | – | |
| Treatment charges | | 0.11 | | | 0.11 | | | 0.15 | | | 0.15 | |
| Unit net cash costs | | 1.14 | | | 1.25 | | | 1.05 | | | 1.10 | |
| Depreciation, depletion and amortization | | 0.19 | | | 0.18 | | | 0.19 | | | 0.19 | |
| Noncash and other costs, net | | 0.02 | | | 0.02 | | | (0.01 | ) | | – | |
| Total unit costs | | 1.35 | | | 1.45 | | | 1.23 | | | 1.29 | |
| Revenue adjustments, primarily for pricing on | | | | | | | | | | | | |
| prior period open sales | | (0.37 | ) | | (0.37 | ) | | 0.26 | | | 0.26 | |
| Other non-inventoriable costs | | (0.02 | ) | | (0.02 | ) | | (0.02 | ) | | (0.01 | ) |
| Gross profit per pound | $ | 1.28 | | $ | 1.18 | | $ | 1.23 | | $ | 1.18 | |
| | | | | | | | | | | | | |
| Copper sales (millions of recoverable pounds) | | 311 | | | 311 | | | 363 | | | 363 | |
| | Six Months Ended June 30, 2010 | | Six Months Ended June 30, 2009 | |
| | By-Product | | Co-Product | | By-Product | | Co-Product | |
| | Method | | Method | | Method | | Method | |
| Revenues, excluding adjustments | $ | 3.07 | | $ | 3.07 | | $ | 2.10 | | $ | 2.10 | |
| | | | | | | | | | | | | |
| Site production and delivery, before net noncash | | | | | | | | | | | | |
| and other costs shown below | | 1.21 | | | 1.14 | | | 1.00 | | | 0.94 | |
| By-product credits | | (0.18 | ) | | – | | | (0.11 | ) | | – | |
| Treatment charges | | 0.13 | | | 0.13 | | | 0.15 | | | 0.14 | |
| Unit net cash costs | | 1.16 | | | 1.27 | | | 1.04 | | | 1.08 | |
| Depreciation, depletion and amortization | | 0.19 | | | 0.18 | | | 0.19 | | | 0.18 | |
| Noncash and other costs, net | | 0.01 | | | 0.01 | | | – | | | 0.01 | |
| Total unit costs | | 1.36 | | | 1.46 | | | 1.23 | | | 1.27 | |
| Revenue adjustments, primarily for pricing on | | | | | | | | | | | | |
| prior period open sales | | (0.03 | ) | | (0.03 | ) | | 0.15 | | | 0.15 | |
| Other non-inventoriable costs | | (0.02 | ) | | (0.02 | ) | | (0.03 | ) | | (0.02 | ) |
| Gross profit per pound | $ | 1.66 | | $ | 1.56 | | $ | 0.99 | | $ | 0.96 | |
| | | | | | | | | | | | | |
| Copper sales (millions of recoverable pounds) | | 618 | | | 618 | | | 713 | | | 713 | |
Unit net cash costs (net of by-product credits) for our South America mining operations averaged $1.14 per pound of copper in second-quarter 2010 and $1.16 per pound of copper for the first six months of 2010, compared with
$1.05 per pound in second-quarter 2009 and $1.04 per pound for the first six months of 2009. The increase in unit net cash costs in the 2010 periods primarily reflected higher site production and delivery costs ($0.22 per pound for the quarter and $0.21 per pound for the six-month period) mostly associated with lower sales volumes. Partly offsetting higher site production and delivery costs were higher by-product credits ($0.09 per pound for the quarter and $0.07 per pound for the six-month period) primarily associated with higher gold and molybdenum prices, and lower treatment charges ($0.04 per pound for the quarter and $0.02 per pound for the six-month period).
Our South America mines have varying cost structures because of differences in ore grades and ore characteristics, processing costs, by-products and other factors. Assuming achievement of current 2010 sales volume and cost estimates, we estimate that average unit net cash costs (net of by-product credits) for our South America mining operations would approximate $1.18 per pound of copper in 2010, compared with $1.12 per pound in 2009.
Indonesia Mining
Indonesia mining includes PT Freeport Indonesia’s Grasberg minerals district. We own 90.64 percent of PT Freeport Indonesia, including 9.36 percent owned through our wholly owned subsidiary, PT Indocopper Investama.
PT Freeport Indonesia produces copper concentrates, which contain significant quantities of gold and silver. Substantially all of PT Freeport Indonesia’s copper concentrates are sold under long-term contracts, of which approximately one-half is sold to affiliated smelters, Atlantic Copper and PT Smelting (PT Freeport Indonesia’s 25-percent owned copper smelter and refinery in Indonesia) and the remainder to other customers.
We have established certain unincorporated joint ventures with Rio Tinto plc (Rio Tinto), under which Rio Tinto has a 40 percent interest in certain assets and future production exceeding specified annual amounts of copper, gold and silver.
Development Activities. We have several projects in progress in the Grasberg minerals district, including development of the large-scale, high-grade underground ore bodies located beneath and adjacent to the Grasberg open pit. Based on current estimates, for the years 2010 to 2014 we expect aggregate expenditures for underground mine development in the Grasberg minerals district to average $525 million per year. These costs will be shared with Rio Tinto in accordance with our joint venture agreement. Considering the long-term nature and large size of these projects, actual costs could differ materially from these estimates.
In addition to the underground mine development costs, our current mine development plans include approximately $3 billion of capital expenditures at our processing facilities to optimize the handling of underground ore types once Grasberg open-pit operations cease. Substantially all of these expenditures will be made between 2017 and 2029. We continue to review our mine development and processing plans to maximize the value of our reserves.
The following discussion provides additional information on our current Indonesia mining projects, including the continued development of the Common Infrastructure project, the Grasberg Block Cave and Big Gossan underground mines, a further expansion of the Deep Ore Zone (DOZ) underground mine and development of the Deep Mill Level Zone (DMLZ) ore body.
Common Infrastructure and Grasberg Block Cave. In 2004, PT Freeport Indonesia commenced its Common Infrastructure project to provide access to its large undeveloped underground ore bodies located in the Grasberg minerals district through a tunnel system located approximately 400 meters deeper than its existing underground tunnel system. In addition to providing access to our underground ore bodies, the tunnel system will enable PT Freeport Indonesia to conduct future exploration in prospective areas associated with currently identified ore bodies. The tunnel system has reached the Big Gossan terminal and we are proceeding with development of the lower Big Gossan infrastructure. We have also advanced development of the Grasberg spur and have completed the tunneling required to r each the Grasberg underground ore body. During second-quarter 2010, we continued development of the Grasberg Block Cave terminal infrastructure and mine access. The DMLZ spur has reached the DMLZ terminal area and development continues on terminal infrastructure and mine access.
In 2008, we completed the feasibility study for the development of the Grasberg Block Cave underground mine, which accounts for over one-third of our reserves in Indonesia. Production at the Grasberg Block Cave mine is currently scheduled to commence at the end of mining the Grasberg open pit, which is expected to continue until mid-2016. The timing of the underground Grasberg Block Cave mine development will continue to be assessed.
Based on the 2008 feasibility study, aggregate mine development capital for the Grasberg Block Cave mine and associated Common Infrastructure is expected to approximate $3.6 billion, which are expected to be incurred between 2008 and 2021, with PT Freeport Indonesia’s share totaling approximately $3.4 billion. Aggregate project costs totaling $193 million have been incurred through June 30, 2010, of which $66 million was incurred during the first six months of 2010. Targeted production rates once the Grasberg Block Cave mining operation reaches full capacity are expected to approximate 160,000 metric tons of ore per day.
Big Gossan. The Big Gossan underground mine is a high-grade deposit located near PT Freeport Indonesia’s existing milling complex. The Big Gossan mine is being developed as an open-stope mine with backfill consisting of mill tailings and cement, an established mining methodology expected to be higher cost than the block-cave method used at the DOZ mine. Production is designed to ramp up to 7,000 metric tons of ore per day by late 2012 (equal to average annual aggregate incremental production of 125 million pounds of copper and 65,000 ounces of gold, with PT Freeport Indonesia receiving 60 percent of these amounts). The aggregate capital investment for this project is currently estimated at approximately $535 million, of which $412 million has been incurred through June 30, 201 0.
DOZ Expansion. In mid-2007, PT Freeport Indonesia completed an expansion of the DOZ underground operation to allow a sustained rate of 50,000 metric tons of ore per day. PT Freeport Indonesia’s further expansion of the DOZ mine to 80,000 metric tons of ore per day is complete. The capital cost for this expansion approximated $100 million, with PT Freeport Indonesia’s 60 percent share totaling approximately $60 million. The success of the development of the DOZ mine, one of the world’s largest underground mines, provides confidence in the future development of PT Freeport Indonesia’s large-scale undeveloped underground ore bodies.
DMLZ. The DMLZ ore body lies below the DOZ mine at the 2,590-meter elevation and represents the downward continuation of mineralization in the Ertsberg East Skarn system and neighboring Ertsberg porphyry. The DMLZ feasibility study was completed in fourth-quarter 2009. We plan to mine the ore body using a block-cave method with production beginning in 2015, near completion of mining at the DOZ. Drilling efforts continue to determine the extent of this ore body. We continue to develop the Common Infrastructure project and tunnels from mill level. In 2009, we completed a portion of the spur to the DMLZ mine and reached the edge of the DMLZ terminal. Aggregate mine development capital costs for the DMLZ are expected to approximate $2.1 billion with PT Freeport Indonesia’s share t otaling approximately $1.2 billion, which are expected to be incurred from 2009 to 2020. Aggregate project costs totaling $66 million have been incurred through June 30, 2010, including $41 million during the first six months of 2010. Targeted production rates once the DMLZ mining operation reaches full capacity are expected to approximate 80,000 metric tons of ore per day.
Other Matters. Since July 2009, there have been a series of shooting incidents along the road leading to our mining and milling operations at the Grasberg minerals district (there have been no shooting incidents since January 2010). In connection with these incidents there were three fatalities in July 2009, and there have been a number of injuries. The Indonesian government has responded with additional security forces and expressed a strong commitment to protect the safety of the community and our operations. The investigation of these matters is continuing, and we have taken precautionary measures, including limiting use of the road to secured convoys. Our mining and milling activities have continued uninterrupted; however, prolonged limitations on access to the road coul d adversely affect operations at the mine. See “Risk Factors” contained in Part I, Item 1A of our Form 10-K for the year ended December 31, 2009, for further discussion of these matters.
Operating Data. Following is summary operating data for our Indonesia mining operations for the second quarters and first six months of 2010 and 2009:
| | | Three Months Ended June 30, | | Six Months Ended June 30, | |
| | | 2010 | | 2009 | | 2010 | | 2009 | |
| Consolidated Operating Data, Net of Joint Venture Interest | | | | | | | | | | | | | |
Copper (millions of recoverable pounds) | | | | | | | | | | | | | |
| Production | | | 276 | | | 403 | | | 555 | | | 807 | |
| Sales | | | 259 | | | 432 | | | 555 | | | 801 | |
| Average realized price per pound | | $ | 2.95 | | $ | 2.24 | | $ | 3.05 | | $ | 2.06 | |
| | | | | | | | | | | | | | |
Gold (thousands of recoverable ounces) | | | | | | | | | | | | | |
| Production | | | 294 | | | 778 | | | 723 | | | 1,348 | |
| Sales | | | 276 | | | 811 | | | 734 | | | 1,332 | |
| Average realized price per ounce | | $ | 1,235 | | $ | 932 | | $ | 1,171 | | $ | 919 | |
| | | | | | | | | | | | | | |
| 100% Operating Data | | | | | | | | | | | | | |
| Ore milled (metric tons per day): | | | | | | | | | | | | | |
Grasberg open pita | | | 145,400 | | | 165,300 | | | 150,200 | | | 165,200 | |
DOZ underground minea | | | 78,000 | | | 72,400 | | | 78,500 | | | 72,400 | |
| Total | | | 223,400 | | | 237,700 | | | 228,700 | | | 237,600 | |
| Average ore grade: | | | | | | | | | | | | | |
| Copper (percent) | | | 0.81 | | | 1.10 | | | 0.79 | | | 1.11 | |
| Gold (grams per metric ton) | | | 0.63 | | | 1.51 | | | 0.75 | | | 1.32 | |
| Recovery rates (percent): | | | | | | | | | | | | | |
| Copper | | | 89.1 | | | 90.6 | | | 88.7 | | | 90.6 | |
| Gold | | | 78.2 | | | 83.6 | | | 78.7 | | | 82.9 | |
| Production (recoverable): | | | | | | | | | | | | | |
| Copper (millions of pounds) | | | 305 | | | 457 | | | 613 | | | 913 | |
| Gold (thousands of ounces) | | | 319 | | | 849 | | | 785 | | | 1,468 | |
| a. | Amounts represent the approximate average daily throughput processed at PT Freeport Indonesia’s mill facilities from each producing mine. |
At the Grasberg mine, the sequencing in mining areas with varying ore grades causes fluctuations in the timing of ore production resulting in varying quarterly and annual sales of copper and gold. As expected, PT Freeport Indonesia’s share of sales decreased to 259 million pounds of copper and 276 thousand ounces of gold in second-quarter 2010 and 555 million pounds of copper and 734 thousand ounces of gold for the first six months of 2010, compared with 432 million pounds of copper and 811 thousand ounces of gold in second-quarter 2009 and 801 million pounds of copper and 1.3 million ounces of gold for the first six months of 2009, as a result of sequencing of mining in a lower ore-grade section of the Grasberg open pit.
Anticipated changes in ore grade throughout the year are expected to result in significant variability in quarterly volumes, with higher copper and gold grades expected beginning in fourth-quarter 2010. For the year 2010, PT Freeport Indonesia’s sales are expected to approximate 1.2 billion pounds of copper and 1.7 million ounces of gold, compared with 1.4 billion pounds of copper and 2.5 million ounces of gold in 2009.
In July 2010, we revised PT Freeport Indonesia’s mine plans to incorporate precautionary remedial activities and geotechnical considerations which will affect mining of a relatively high-grade section of the Grasberg open pit by deferring some production to later periods. These revised plans, which are subject to ongoing review and optimization, reflect timing differences and do not result in significant changes to reserves or ultimate production from the open pit.
Unit Net Cash Costs. Unit net cash costs per pound of copper is a measure intended to provide investors with information about the cash-generating capacity of our mining operations expressed on a basis relating to the primary metal product for our respective operations. We use this measure for the same purpose and for monitoring operating performance by our mining operations. This information differs from measures of performance determined in accordance with U.S. GAAP and should not be considered in isolation or as a substitute for measures of performance determined in accordance with U.S. GAAP. This measure is presented by other mining companies, although our measure may not be comparable to similarly titled measures reported by other companies. Gross Profit per Pound of Copper/per Ounce of Gold
The following tables summarize the unit net cash costs (credits) and gross profit per pound of copper and per ounce of gold at our Indonesia mining operations for the second quarters and first six months of 2010 and 2009. Refer to “Production Revenues and Production Costs” for an explanation of “by-product” and “co-product” methods and a reconciliation of unit net cash costs to production and delivery costs applicable to sales reported in our consolidated financial statements.
| | Three Months Ended June 30, 2010 | | Three Months Ended June 30, 2009 | |
| | By-Product | | Co-Product Method | | By-Product | | Co-Product Method | |
| | Method | | Copper | | Gold | | Method | | Copper | | Gold | |
| Revenues, excluding adjustments | $ | 2.95 | | $ | 2.95 | | $ | 1,235.26 | | $ | 2.24 | | $ | 2.24 | | $ | 932.32 | |
| | | | | | | | | | | | | | | | | | | |
| Site production and delivery, before net noncash | | | | | | | | | | | | | | | | | | |
| and other costs shown below | | 1.62 | | | 1.10 | | | 474.65 | | | 0.93 | | | 0.52 | | | 214.22 | |
| Gold and silver credits | | (1.41 | ) | | – | | | – | | | (1.80 | ) | | – | | | – | |
| Treatment charges | | 0.26 | | | 0.18 | | | 75.18 | | | 0.22 | | | 0.12 | | | 50.10 | |
| Royalty on metals | | 0.11 | | | 0.07 | | | 31.10 | | | 0.12 | | | 0.06 | | | 26.44 | |
| Unit net cash costs (credits) | | 0.58 | | | 1.35 | | | 580.93 | | | (0.53 | ) | | 0.70 | | | 290.76 | |
| Depreciation and amortization | | 0.22 | | | 0.15 | | | 63.62 | | | 0.18 | | | 0.10 | | | 41.45 | |
| Noncash and other costs, net | | 0.02 | | | 0.01 | | | 6.36 | | | 0.03 | | | 0.02 | | | 6.66 | |
| Total unit costs (credits) | | 0.82 | | | 1.51 | | | 650.91 | | | (0.32 | ) | | 0.82 | | | 338.87 | |
| Revenue adjustments, primarily for pricing on | | | | | | | | | | | | | | | | | | |
| prior period open sales | | (0.42 | ) | | (0.42 | ) | | 37.24 | | | 0.03 | | | 0.03 | | | (4.04 | ) |
| PT Smelting intercompany profit | | 0.06 | | | 0.04 | | | 18.86 | | | (0.07 | ) | | (0.04 | ) | | (16.23 | ) |
| Gross profit per pound/ounce | $ | 1.77 | | $ | 1.06 | | $ | 640.45 | | $ | 2.52 | | $ | 1.41 | | $ | 573.18 | |
| | | | | | | | | | | | | | | | | | | |
| Copper sales (millions of recoverable pounds) | | 259 | | | 259 | | | | | | 432 | | | 432 | | | | |
| Gold sales (thousands of recoverable ounces) | | | | | | | | 276 | | | | | | | | | 811 | |
| | Six Months Ended June 30, 2010 | | Six Months Ended June 30, 2009 | |
| | By-Product | | Co-Product Method | | By-Product | | Co-Product Method | |
| | Method | | Copper | | Gold | | Method | | Copper | | Gold | |
| Revenues, excluding adjustments | $ | 3.05 | | $ | 3.05 | | $ | 1,170.67 | | $ | 2.06 | | $ | 2.06 | | $ | 919.28 | |
| | | | | | | | | | | | | | | | | | | |
| Site production and delivery, before net noncash | | | | | | | | | | | | | | | | | | |
| and other costs shown below | | 1.58 | | | 1.03 | | | 397.55 | | | 0.92 | | | 0.52 | | | 233.90 | |
| Gold and silver credits | | (1.61 | ) | | – | | | – | | | (1.58 | ) | | – | | | – | |
| Treatment charges | | 0.24 | | | 0.16 | | | 60.53 | | | 0.21 | | | 0.12 | | | 53.44 | |
| Royalty on metals | | 0.11 | | | 0.08 | | | 28.90 | | | 0.09 | | | 0.05 | | | 23.48 | |
| Unit net cash costs (credits) | | 0.32 | | | 1.27 | | | 486.98 | | | (0.36 | ) | | 0.69 | | | 310.82 | |
| Depreciation and amortization | | 0.22 | | | 0.14 | | | 54.28 | | | 0.18 | | | 0.10 | | | 45.11 | |
| Noncash and other costs, net | | 0.04 | | | 0.03 | | | 10.91 | | | 0.03 | | | 0.02 | | | 7.99 | |
| Total unit costs (credits) | | 0.58 | | | 1.44 | | | 552.17 | | | (0.15 | ) | | 0.81 | | | 363.92 | |
| Revenue adjustments, primarily for pricing on | | | | | | | | | | | | | | | | | | |
| prior period open sales | | (0.01 | ) | | (0.01 | ) | | 1.82 | | | 0.07 | | | 0.07 | | | 4.12 | |
| PT Smelting intercompany profit | | 0.05 | | | 0.04 | | | 13.05 | | | (0.05 | ) | | (0.03 | ) | | (11.81 | ) |
| Gross profit per pound/ounce | $ | 2.51 | | $ | 1.64 | | $ | 633.37 | | $ | 2.23 | | $ | 1.29 | | $ | 547.67 | |
| | | | | | | | | | | | | | | | | | | |
| Copper sales (millions of recoverable pounds) | | 555 | | | 555 | | | | | | 801 | | | 801 | | | | |
| Gold sales (thousands of recoverable ounces) | | | | | | | | 734 | | | | | | | | | 1,332 | |
Because of the fixed nature of a large portion of PT Freeport Indonesia’s costs, unit costs vary significantly from period to period depending on volumes of copper and gold sold during the period. Unit net cash costs (net of gold and silver credits) for PT Freeport Indonesia averaged $0.58 per pound of copper in second-quarter 2010 and $0.32 per pound for the first six months of 2010, compared with net credits of $0.53 per pound in second-quarter 2009 and $0.36 per pound for the first six months of 2009. The increase in unit net cash costs in the 2010 periods primarily reflected higher site production and delivery costs ($0.69 per pound for the quarter and $0.66 per pound for the six-month period) mostly associated with lower copper sales volumes. The quarterly period was also impacted by lower gold credits ($0.39 per pound) as lowe r gold sales volumes more than offset higher gold prices.
Treatment charges vary with the volume of metals sold and the price of copper, and royalties vary with the volume of metals sold and the prices of copper and gold.
Because certain assets are depreciated on a straight-line basis, PT Freeport Indonesia’s unit depreciation rate varies with the level of copper production and sales.
Assuming achievement of current 2010 sales volume and cost estimates, and an average price of $1,200 per ounce of gold for the remainder of 2010, we estimate that average unit net cash costs for PT Freeport Indonesia (net of gold and silver credits) would approximate $0.14 per pound of copper in 2010, compared with a net credit of $0.49 per pound in 2009. Each $50 per ounce change in the average price of gold during the remainder of 2010 would have an approximate $0.04 per pound impact on PT Freeport Indonesia’s 2010 unit net cash costs.
Africa Mining
Africa mining includes the Tenke copper and cobalt mining concessions in the Katanga province of the DRC. We own an effective 57.75 percent interest in Tenke and are the operator of the project. The Tenke mine includes open-pit mining, leaching and SX/EW operations. Copper production from the Tenke mine is sold as copper cathode. In addition to copper, the Tenke mine produces cobalt hydroxide.
Operating and Development Activities. Construction activities for the initial development project were completed during 2009. Initial copper production commenced in late March 2009, and targeted copper production rates were achieved in September 2009. The cobalt and sulphuric acid plants were commissioned in third-quarter 2009. Start-up and quality issues continue to be addressed in the cobalt circuit and corrective actions will be implemented over the next several quarters. Based on the 10-year average of current design operations, Tenke expects to produce approximately 250 million pounds of copper and 18 million pounds of cobalt per year. However, higher grades of cobalt are expected to result in higher than average annual cobalt production in the initial years.
The milling facilities at Tenke, which were designed to produce at a capacity rate of 8,000 metric tons of ore per day, have been performing above capacity in recent months. Tenke is procuring additional equipment that will enable additional high-grade material to be mined and processed. As a result of these enhancements to the mine plan and an expected mill throughput rate of 10,000 metric tons of ore per day, we estimate the average annual copper production at Tenke will increase to approximately 290 million pounds of copper during 2011.
We continue to engage in drilling activities, exploration analyses and metallurgical testing to evaluate the potential of this highly prospective minerals district and expect Tenke’s reserves to increase significantly over time. These analyses are being incorporated in future plans to evaluate opportunities for expansion. We are completing studies to evaluate a second phase of the project, which would include optimizing the current plant and increasing capacity. Future expansions are subject to a number of factors, including economic and market conditions and the business and investment climate in the DRC.
Other Matters. We are continuing to work with the DRC government to resolve the ongoing contract review and a number of administrative disputes. We cannot predict the timing or the outcome of these matters. We believe that our mining contract is fair and equitable, complies with Congolese law and is enforceable without modifications. See “Risk Factors” contained in Part I, Item 1A of our Form 10-K for the year ended December 31, 2009, for further discussion of these matters.
We are negotiating the labor agreement covering all national Tenke Fungurume employees, which came up for review in May 2010.
Operating Data. Following is summary operating data for our Africa mining operations for the second quarters and first six months of 2010 and 2009:
| | | Three Months Ended June 30, | | Six Months Ended June 30, | |
| | | 2010 | | 2009 | | 2010 | | 2009a | |
| | | | | | | | | | | | | | |
Copper (millions of recoverable pounds) | | | | | | | | | | | | | |
| Production | | | 62 | | | 36 | | | 126 | | | 36 | |
| Sales | | | 55 | | | 26 | | | 121 | | | 26 | |
| Average realized price per pound | | $ | 2.96 | | $ | 2.20 | | $ | 3.12 | | $ | 2.20 | |
| | | | | | | | | | | | | | |
Cobalt (millions of contained pounds) | | | | | | | | | | | | | |
| Production | | | 4 | | | N/A | b | | 9 | | | N/A | b |
| Sales | | | 4 | | | N/A | b | | 7 | | | N/A | b |
| Average realized price per pound | | $ | 12.37 | | | N/A | b | $ | 11.91 | | | N/A | b |
| | | | | | | | | | | | | | |
| Ore milled (metric tons per day) | | | 8,800 | | | 6,800 | | | 9,200 | | | 6,300 | |
| Average ore grade (percent): | | | | | | | | | | | | | |
| Copper | | | 3.87 | | | 3.45 | | | 3.78 | | | 3.21 | |
| Cobalt | | | 0.35 | | | N/A | b | | 0.40 | | | N/A | b |
| Copper recovery rate (percent) | | | 90.7 | | | 92.1 | | | 91.2 | | | 92.1 | |
| a. | Represents results since March 2009. |
| b. | Comparative results for the 2009 periods have not been included as start up activities were still under way. |
Consolidated sales volumes from Tenke are expected to approximate 250 million pounds of copper and 20 million pounds of cobalt for the year 2010, compared with 130 million pounds of copper and 3 million pounds of cobalt for 2009.
Unit Net Cash Costs. Unit net cash costs per pound of copper is a measure intended to provide investors with information about the cash-generating capacity of our mining operations expressed on a basis relating to the primary metal product for our respective operations. We use this measure for the same purpose and for monitoring operating performance by our mining operations. This information differs from measures of performance determined in accordance with U.S. GAAP and should not be considered in isolation or as a substitute for measures of performance determined in accordance with U.S. GAAP. This measure is presented by other mining companies, although our measure may not be comparable to similarly titled measures reported by other companies.
Gross Profit per Pound of Copper/per Pound of Cobalt
The following table summarizes the unit net cash costs and gross profit per pound of copper and cobalt at our Africa mining operation for the second quarter and first six months of 2010. Comparative information for the 2009 periods have not been included as start up activities were still under way. Refer to “Production Revenues and Production Costs” for an explanation of “by-product” and “co-product” methods and a reconciliation of unit net cash costs to production and delivery costs applicable to sales reported in our consolidated financial statements.
| | Three Months Ended June 30, 2010 | | Six Months Ended June 30, 2010 | |
| | By-Product | | Co-Product Method | | By-Product | | Co-Product Method | |
| | Method | | Copper | | Cobalt | | Method | | Copper | | Cobalt | |
| Revenues, excluding adjustments | $ | 2.96 | | $ | 2.96 | | $ | 12.37 | | $ | 3.12 | | $ | 3.12 | | $ | 11.91 | |
| | | | | | | | | | | | | | | | | | | |
| Site production and delivery, before net noncash | | | | | | | | | | | | | | | | | | |
| and other costs shown below | | 1.27 | | | 1.15 | | | 6.63 | | | 1.32 | | | 1.25 | | | 5.73 | |
| Cobalt credits | | (0.54 | )a | | – | | | – | | | (0.46 | )a | | – | | | – | |
| Royalty on metals | | 0.06 | | | 0.05 | | | 0.20 | | | 0.07 | | | 0.05 | | | 0.21 | |
| Unit net cash costs | | 0.79 | | | 1.20 | | | 6.83 | | | 0.93 | | | 1.30 | | | 5.94 | |
| Depreciation, depletion and amortization | | 0.55 | | | 0.47 | | | 1.13 | | | 0.49 | | | 0.41 | | | 1.53 | |
| Noncash and other costs, net | | 0.04 | | | 0.03 | | | 0.08 | | | 0.03 | | | 0.03 | | | 0.09 | |
| Total unit costs | | 1.38 | | | 1.70 | | | 8.04 | | | 1.45 | | | 1.74 | | | 7.56 | |
| Revenue adjustments, primarily for pricing on | | | | | | | | | | | | | | | | | | |
| prior period open sales | | (0.01 | ) | | (0.01 | ) | | 0.35 | | | – | | | – | | | 0.51 | |
| Other non-inventoriable costs | | (0.10 | ) | | (0.09 | ) | | (0.22 | ) | | (0.10 | ) | | (0.08 | ) | | (0.30 | ) |
| Gross profit per pound | $ | 1.47 | | $ | 1.16 | | $ | 4.46 | | $ | 1.57 | | $ | 1.30 | | $ | 4.56 | |
| | | | | | | | | | | | | | | | | | | |
| Copper sales (millions of recoverable pounds) | | 55 | | | 55 | | | | | | 121 | | | 121 | | | | |
| Cobalt sales (millions of contained pounds) | | | | | | | | 4 | | | | | | | | | 7 | |
| a. | Net of cobalt downstream processing and freight costs. |
Unit net cash costs (net of cobalt credits) for Tenke averaged $0.79 per pound of copper in second-quarter 2010 and $0.93 per pound of copper for the first six months of 2010.
In July 2010, we updated our cost estimates for Tenke to incorporate changes in sulphuric acid consumption and input costs, transportation costs, and increased government fees and administrative costs associated with the complex nature of the operating environment in the DRC. Assuming achievement of 2010 sales volumes, our revised cost estimates and an average cobalt price of $12 per pound for the remainder of 2010 and the year 2011, we estimate that average unit net cash costs for Tenke (net of cobalt credits) would approximate $0.93 per pound of copper for 2010 and $0.80 per pound of copper for the year 2011. Each $2 per pound change in the average price of cobalt would have an approximate $0.10 per pound impact on Tenke’s unit net cash costs.
Molybdenum
Our Molybdenum operation is an integrated producer of molybdenum, with mining, sulfide ore concentrating, roasting and processing facilities that produce high-purity, molybdenum-based chemicals, molybdenum metal powder and metallurgical products, which are sold to customers around the world, and includes the wholly owned Henderson molybdenum mine in Colorado and related conversion facilities. The Henderson underground mine produces high-purity, chemical-grade molybdenum concentrates, which are typically further processed into value-added molybdenum chemical products. The Molybdenum operation also includes the wholly owned Climax molybdenum mine in Colorado, which has been on care-and-maintenance status since 1995; a sales company that purchases and sells molybdenum from our Henderson mine and from our North and South America copper mines that produce molybdenum as a by-product; and related conversion facilities that, at times, roast and/or process material on a toll basis. Toll arrangements require the tolling customer to deliver appropriate molybdenum-bearing material to our facilities for processing into a product that is returned to the customer, who pays us for processing their material into the specified products.
Operating and Development Activities. Beginning in fourth-quarter 2008, molybdenum markets were significantly affected by the downturn in global economic conditions, which resulted in the Henderson molybdenum mine operating at reduced rates throughout 2009. Improved market conditions have resulted in an increase in
Henderson’s rates to approximately 90 percent capacity. We will continue to review operating plans and adjust rates to reflect market conditions.
We are monitoring market conditions to determine the timing for completing construction activities associated with the Climax molybdenum project. The Climax mine would have an initial annual design capacity of 30 million pounds, with significant expansion options. We will continue activities in a controlled manner to advance the project so that we are prepared for commencement of production as market conditions improve. As of June 30, 2010, estimated remaining costs for the project approximated $500 million, including $60 million during the next several months to advance certain construction activities and provide flexibility in start-up timing options.
Operating Data. Following is summary operating data for the Molybdenum operations for the second quarters and first six months of 2010 and 2009:
| | | Three Months Ended June 30, | | Six Months Ended June 30, | |
| | | 2010 | | 2009 | | 2010 | | 2009 | |
| | | | | | | | | | | | | | |
Molybdenum (millions of recoverable pounds) | | | | | | | | | | | | | |
Productiona | | | 11 | | | 6 | | | 20 | | | 13 | |
Sales, excluding purchasesb | | | 16 | | | 16 | | | 33 | | | 26 | |
| Average realized price per pound | | $ | 18.18 | | $ | 10.11 | | $ | 16.62 | | $ | 10.65 | |
| | | | | | | | | | | | | | |
| Henderson molybdenum mine | | | | | | | | | | | | | |
| Ore milled (metric tons per day) | | | 22,800 | | | 11,700 | | | 23,000 | | | 13,400 | |
| Average molybdenum ore grade (percent) | | | 0.25 | | | 0.27 | | | 0.24 | | | 0.25 | |
| Molybdenum production (millions of recoverable pounds) | | | 11 | | | 6 | | | 20 | | | 13 | |
| a. | Reflects production at the Henderson molybdenum mine. |
| b. | Includes sales of molybdenum produced as a by-product at our North and South America copper mines. |
Molybdenum sales volumes totaled 16 million pounds in second-quarter 2010 and 33 million pounds for the first six months of 2010, compared with 16 million pounds in second-quarter 2009 and 26 million pounds for the first six months of 2009. Higher molybdenum sales volumes in 2010 reflect improved demand in the chemical sector. Molybdenum sales volumes are expected to approximate 63 million pounds for the year 2010, of which approximately 30 million pounds represents by-product production from our North and South America copper mines, compared with 58 million pounds in 2009, of which 27 million pounds represented by-product production from our North and South America copper mines.
Unit Net Cash Costs. Unit net cash costs per pound of molybdenum is a measure intended to provide investors with information about the cash-generating capacity of our mining operations expressed on a basis relating to the primary metal product for our respective operations. We use this measure for the same purpose and for monitoring operating performance by our mining operations. This information differs from measures of performance determined in accordance with U.S. GAAP and should not be considered in isolation or as a substitute for measures of performance determined in accordance with U.S. GAAP. This measure is presented by other mining companies, although our measure may not be comparable to similarly titled measures reported by other companies. Gross Profit per Pound of Molybdenum
The following table summarizes the unit net cash costs and gross profit per pound of molybdenum at our Henderson molybdenum mine for the second quarters and first six months of 2010 and 2009. Refer to “Product Revenues and Production Costs” for a reconciliation of unit net cash costs to production and delivery costs applicable to sales reported in our consolidated financial statements.
| | Three Months Ended June 30, | | Six Months Ended June 30, | |
| | 2010 | | 2009a | | 2010 | | 2009a | |
| Revenues, excluding adjustments | $ | 17.36 | | $ | 10.96 | | $ | 16.06 | | $ | 11.32 | |
| | | | | | | | | | | | | |
| Site production and delivery, before net noncash | | | | | | | | | | | | |
| and other costs shown below | | 4.65 | | | 5.99 | | | 4.57 | | | 5.78 | |
| Treatment charges and other | | 1.08 | | | 1.10 | | | 1.08 | | | 1.09 | |
| Unit net cash costs | | 5.73 | | | 7.09 | | | 5.65 | | | 6.87 | |
| Depreciation, depletion and amortization | | 0.82 | | | 1.00 | | | 0.83 | | | 0.96 | |
| Noncash and other costs, net | | 0.02 | | | 0.07 | | | 0.03 | | | 0.05 | |
| Total unit costs | | 6.57 | | | 8.16 | | | 6.51 | | | 7.88 | |
Gross profitb | $ | 10.79 | | $ | 2.80 | | $ | 9.55 | | $ | 3.44 | |
| | | | | | | | | | | | | |
Molybdenum sales (millions of recoverable pounds)c | | 11 | | | 6 | | | 20 | | | 13 | |
| a. | Revenues and costs were adjusted to include freight and downstream conversion costs in net cash costs; gross profit was not affected by these adjustments. |
| b. | Gross profit reflects sales of Henderson products based on volumes produced at market-based pricing. On a consolidated basis, the Molybdenum segment includes profits on sales as they are made to third parties and realizations based on actual contract terms. As a result, the actual gross profit realized will differ from the amounts reported in this table. |
| c. | Reflects molybdenum produced by the Henderson molybdenum mine. |
Henderson’s unit net cash costs decreased to $5.73 per pound of molybdenum in second-quarter 2010 and $5.65 for the first six months of 2010, compared with $7.09 per pound of molybdenum in second-quarter 2009 and $6.87 per pound for the first six months of 2009, primarily reflecting higher volumes. Assuming achievement of current 2010 sales volume estimates, we estimate that the 2010 average unit net cash costs for Henderson would approximate $6.25 per pound of molybdenum, compared with $6.52 per pound in 2009.
Rod & Refining
The Rod & Refining operations consist of copper conversion facilities located in North America, including a refinery, three rod mills and a specialty copper products facility. These operations process copper produced at our North America copper mines and purchased copper into copper cathode, rod and custom copper shapes. At times these operations refine copper and produce copper rod and shapes for customers on a toll basis. Toll arrangements require the tolling customer to deliver appropriate copper-bearing material to our facilities for processing into a product that is returned to the customer, who pays us for processing their material into the specified products.
During April 2010, we successfully negotiated a new three-year labor contract with certain of our employees at Bayway, our specialty copper products facility in New Jersey.
Atlantic Copper Smelting & Refining
Atlantic Copper, our wholly owned subsidiary located in Spain, smelts and refines copper concentrates and markets refined copper and precious metals in slimes. Our Indonesia mining operation sells copper concentrate and our South America mining operations sell copper concentrate and copper cathode to Atlantic Copper. Through downstream integration, we are assured placement of a significant portion of our concentrate production. During the first half of 2010, Atlantic Copper purchased approximately 30 percent of its concentrate requirements from our Indonesia mining operation and approximately 20 percent from our South America mining operations.
Smelting and refining charges consist of a base rate and, in certain contracts, price participation based on copper prices. Treatment charges for smelting and refining copper concentrates represent a cost to our Indonesia and South America mining operations, and income to Atlantic Copper and PT Smelting. Thus, higher treatment and refining charges benefit our smelter operations at Atlantic Copper and adversely affect our mining operations in
Indonesia and South America. Our North America copper mines are not significantly affected by changes in treatment and refining charges because these operations are fully integrated with our Miami smelter located in Arizona.
Atlantic Copper had operating losses of $2 million in second-quarter 2010 and $13 million for the first six months of 2010, compared with $18 million in second-quarter 2009 and $29 million for the first six months of 2009. Lower operating losses for Atlantic Copper during the 2010 periods primarily reflected higher sulphuric acid and gold revenues associated with higher prices.
We defer recognizing profits on sales from our Indonesia and South America mining operations to Atlantic Copper and on 25 percent of our Indonesia mining sales to PT Smelting until final sales to third parties occur. Our net deferred profits on our Indonesia and the South America mining operations’ inventories at Atlantic Copper and PT Smelting to be recognized in future periods’ net income after taxes and noncontrolling interests totaled $137 million at December 31, 2009, $157 million at March 31, 2010, and $93 million at June 30, 2010. Changes in these deferrals attributable to variability in intercompany volumes resulted in net additions to net income attributable to FCX common stockholders totaling $20 million ($0.04 per share) in second-quarter 2010 and net reductions of $28 million ($0.06 per share) for the first six mon ths of 2010, compared with net additions of $13 million ($0.03 per share) in second-quarter 2009 and net reductions of $3 million ($0.01 per share) for the first six months of 2009. We currently project intercompany sales will increase in third-quarter 2010, which would result in an increase in deferred profits in inventory and a corresponding decrease in net income. Quarterly variations in ore grades, the timing of intercompany shipments and changes in prices will result in variability in our net deferred profits and quarterly earnings.
CAPITAL RESOURCES AND LIQUIDITY
Our operating cash flows vary with prices realized from copper, gold and molybdenum sales, our production levels, production costs, cash payments for income taxes and interest, other working capital changes and other factors. As a result of weak economic conditions, we revised our operating plans at the end of 2008 and in early 2009 to protect liquidity while preserving our large mineral resources and growth options for the longer term. However, a strong operating performance and improved copper prices since the end of 2008 have enabled us to enhance our financial and liquidity position, reduce debt and reinstate cash dividends to shareholders, while maintaining our future growth opportunities. In addition, we have resumed certain project development activities at our mining operations (refer to “Operations” for further disc ussion). We view the long-term outlook for our business positively, supported by limitations on supplies of copper and by the requirements for copper in the world’s economy, and will continue to adjust our operating strategy as market conditions change.
Based on current mine plans and subject to future copper, gold and molybdenum prices, we expect estimated operating cash flows for the year 2010 to be greater than our budgeted capital expenditures, expected debt payments, dividends, noncontrolling interest distributions and other cash requirements.
Cash and Cash Equivalents
At June 30, 2010, we had consolidated cash and cash equivalents of $3.0 billion. The following table reflects the U.S. and international components of consolidated cash and cash equivalents at June 30, 2010, and December 31, 2009 (in billions):
| | June 30, | | December 31, | |
| | 2010 | | 2009 | |
Cash at domestic companiesa | $ | 1.0 | | $ | 1.5 | |
| Cash at international operations | | 2.0 | | | 1.2 | |
| Total consolidated cash and cash equivalents | | 3.0 | | | 2.7 | |
| Less: Noncontrolling interests’ share | | (0.6 | ) | | (0.3 | ) |
| Cash, net of noncontrolling interests’ share | | 2.4 | | | 2.4 | |
| Less: Withholding taxes and other | | (0.2 | ) | | (0.2 | ) |
| Net cash available | $ | 2.2 | | $ | 2.2 | |
| a. | Includes cash at our parent company and North America operations. |
Operating Activities
We generated operating cash flows totaling $2.9 billion for the first six months of 2010, including $107 million from working capital sources. Operating cash flows generated for the first six months of 2009 totaled $896 million, net of $926 million used for working capital requirements (which included approximately $600 million related to
settlement of final pricing with customers on 2008 provisionally priced copper sales). Higher operating cash flows for the first six months of 2010, compared with the first six months of 2009, primarily reflected higher copper prices, partially offset by lower copper and gold sales volumes.
Refer to “Outlook” for further discussion of projected operating cash flows for the year 2010.
Investing Activities
Capital expenditures, including capitalized interest, decreased to $527 million for the first six months of 2010, compared with $894 million for the first six months of 2009, primarily reflecting the effects of lower capital spending for the Tenke Fungurume development project, for which construction activities were substantially complete by mid-2009.
Refer to “Outlook” for further discussion of projected capital expenditures for 2010.
Financing Activities
Debt and Equity Transactions. At June 30, 2010, total debt approximated $4.8 billion, and we had 470 million common shares outstanding.
On April 1, 2010, we redeemed all of our $1 billion of outstanding Senior Floating Rate Notes due 2015 for which holders received 101 percent of the principal amount together with accrued and unpaid interest. In addition, during the first six months of 2010, we made open-market purchases of $547 million of our 8.25% Senior Notes and 8.375% Senior Notes at a cost of $595 million. Refer to Note 6 for further discussion.
Since January 1, 2009, we have repaid approximately $2.6 billion in debt resulting in estimated annual interest savings of $172 million. We have no significant debt maturities in the near term; however, we may consider opportunities to prepay debt in advance of scheduled maturities.
We have revolving credit facilities available through March 2012, which are composed of a (i) $1.0 billion revolving credit facility available to FCX and (ii) $0.5 billion revolving credit facility available to both FCX and PT Freeport Indonesia. At June 30, 2010, we had no borrowings and $42 million of letters of credit issued under the facilities resulting in availability of approximately $1.5 billion ($958 million of which could be used for additional letters of credit). The revolving credit facilities contain restrictions on the amount available for dividend payments, purchases of our common stock and certain debt prepayments. However, these restrictions do not apply as long as availability under the revolvers plus domestic cash exceeds $750 million. At June 30, 2010, we had availability under the revolvers plus available domestic c ash (as defined by the revolving credit facility) totaling approximately $3.1 billion.
In addition, the indenture governing certain of our senior notes contains restrictions on incurring debt, making restricted payments and selling assets. As a result of our current corporate credit rating and the ratings on our unsecured notes (investment grade), these covenants are currently suspended. However, to the extent the rating is downgraded below investment grade, the covenants would again become effective.
In February 2009, we completed a public offering of 26.8 million shares of our common stock at an average price of $28.00 per share, which generated gross proceeds of $750 million (net proceeds of $740 million after fees and expenses), which were used for general corporate purposes.
We made no purchases under our open-market share purchase program during 2009 for the first six months of 2010. There are 23.7 million shares remaining under this program. The timing of future purchases of our common stock is dependent on many factors, including our operating results; cash flows and financial position; copper, gold and molybdenum prices; the price of our common shares; and general economic and market conditions.
Cash Dividends. The declaration and payment of dividends is at the discretion of our Board of Directors (the Board). The amount of our cash dividend on our common stock is dependent upon our financial results, cash requirements, future prospects and other factors deemed relevant by the Board. Because of the deterioration in copper and molybdenum prices and in general economic conditions, in December 2008, the Board suspended the cash dividend on our common stock; accordingly, there were no common dividends paid for the first six months of 2009. In October 2009, the Board reinstated an annual cash dividend on our common stock of $0.60 per share ($0.15 per share quarterly), and in April 2010, authorized an increase in the annual cash dividend on common stock to $1.20 per share ($0.30 per share quarterly). For the first six months of 2010, common stock dividends
paid totaled $130 million. On June 24, 2010, the Board declared a quarterly dividend of $0.30 per share, which was paid on August 1, 2010, to common shareholders of record at the close of business on July 15, 2010. The Board will continue to review our financial policy on an ongoing basis.
Preferred stock dividends paid totaled $95 million for the first six months of 2010 representing dividends on our 6¾% Mandatory Convertible Preferred Stock, and $120 million for the first six months of 2009 representing dividends on our 5½% Convertible Perpetual Preferred Stock and 6¾% Mandatory Convertible Preferred Stock. During second-quarter 2010, our 6¾% Mandatory Convertible Preferred Stock converted into 39 million shares of our common stock (refer to Note 6 for further discussion). In September 2009, we redeemed our 5½% Convertible Perpetual Preferred Stock in exchange for 18 million shares of our common stock. As a result of these transactions, we no longer have requirements to pay preferred dividends.
Cash dividends paid to noncontrolling interests totaled $145 million for the first six months of 2010, which reflected dividends paid to the noncontrolling interest owners of PT Freeport Indonesia and the South America mining operations. Cash dividends paid to noncontrolling interest totaled $63 million for the first six months of 2009, which reflected dividends paid to the noncontrolling interest owners of PT Freeport Indonesia.
CONTRACTUAL OBLIGATIONS
There have been no material changes in our contractual obligations since year-end 2009. Refer to Item 7 in our report on Form 10-K for the year ended December 31, 2009, for further information regarding our contractual obligations.
ENVIRONMENTAL AND RECLAMATION MATTERS
Our mining, exploration, production and historical operating activities are subject to stringent laws and regulations governing the protection of the environment. There have been no material changes to our environmental and reclamation obligations since year-end 2009. Refer to Note 14 in our report on Form 10-K for the year ended December 31, 2009, for further information regarding our environmental and reclamation obligations.
We do not expect the impact of recently issued accounting standards to have a significant impact on our future financial statements and disclosures. PRODUCT REVENUES AND PRODUCTION COSTS
Unit net cash costs per pound of copper and molybdenum are measures intended to provide investors with information about the cash-generating capacity of our mining operations expressed on a basis relating to the primary metal product for the respective operations. We use this measure for the same purpose and for monitoring operating performance by our mining operations. This information differs from measures of performance determined in accordance with U.S. GAAP and should not be considered in isolation or as a substitute for measures of performance determined in accordance with U.S. GAAP. This measure is presented by other mining companies, although our measure may not be comparable to similarly titled measures reported by other companies.
We present gross profit per pound of copper using both a “by-product” method and a “co-product” method. We use the by-product method in our presentation of gross profit per pound of copper because (i) the majority of our revenues are copper revenues, (ii) we mine ore, which contains copper, gold, molybdenum and other metals, (iii) it is not possible to specifically assign all of our costs to revenues from the copper, gold, molybdenum and other metals we produce, (iv) it is the method used to compare mining operations in certain industry publications and
(v) it is the method used by our management and the Board to monitor operations. In the co-product method presentation below, shared costs are allocated to the different products based on their relative revenue values, which will vary to the extent our metals sales volumes and realized prices change.
In both the by-product and the co-product method calculations, we show adjustments to copper revenues for prior period open sales as separate line items. Because the copper pricing adjustments do not result from current period sales, we have reflected these separately from revenues on current period sales. Noncash and other costs consist of items such as stock-based compensation costs, LCM inventory adjustments, write-offs of equipment and/or unusual charges. They are removed from site production and delivery costs in the calculation of unit net cash costs. As discussed above, gold, molybdenum and other metal revenues at copper mines are reflected as credits against site production and delivery costs in the by-product method. Following are presentations under both the by-product and co-product methods together with reconciliations to amou nts reported in our consolidated financial statements. North America Copper Mines Product Revenues and Production Costs
| Three Months Ended June 30, 2010 | | | | |
| | By-Product | | Co-Product Method | |
| (In millions) | Method | | Copper | | Molybdenuma | | Otherb | | Total | |
| Revenues, excluding adjustments | $ | 925 | | $ | 925 | | $ | 104 | | $ | 19 | | $ | 1,048 | |
| | | | | | | | | | | | | | | | |
| Site production and delivery, before net noncash | | | | | | | | | | | | | | | |
| and other costs shown below | | 421 | | | 376 | | | 51 | | | 9 | | | 436 | |
By-product creditsa | | (108 | ) | | – | | | – | | | – | | | – | |
| Treatment charges | | 26 | | | 26 | | | – | | | – | | | 26 | |
| Net cash costs | | 339 | | | 402 | | | 51 | | | 9 | | | 462 | |
| Depreciation, depletion and amortization | | 66 | | | 62 | | | 3 | | | 1 | | | 66 | |
| Noncash and other costs, net | | 53 | | | 52 | | | 1 | | | – | | | 53 | |
| Total costs | | 458 | | | 516 | | | 55 | | | 10 | | | 581 | |
| Revenue adjustments, primarily for hedging | | (1 | ) | | (1 | ) | | – | | | – | | | (1 | ) |
| Idle facility and other non-inventoriable costs | | (21 | ) | | (21 | ) | | – | | | – | | | (21 | ) |
| Gross profit | $ | 445 | | $ | 387 | | $ | 49 | | $ | 9 | | $ | 445 | |
| | | | | | | | | | | | | | | | |
| Reconciliation to Amounts Reported | | | | | | | | | | | | | | | |
| (In millions) | | | | | | | Depreciation, | | | | | | | |
| | | | | Production | | | Depletion and | | | | | | | |
| | Revenues | | and Delivery | | | Amortization | | | | | | | |
| Totals presented above | $ | 1,048 | | $ | 436 | | $ | 66 | | | | | | | |
| Net noncash and other costs per above | | N/A | | | 53 | | | N/A | | | | | | | |
| Treatment charges per above | | N/A | | | 26 | | | N/A | | | | | | | |
| Revenue adjustments, primarily for hedging per above | | (1 | ) | | N/A | | | N/A | | | | | | | |
| Idle facility and other non-inventoriable costs per above | | N/A | | | 21 | | | N/A | | | | | | | |
| Eliminations and other | | (3 | ) | | 1 | | | 5 | | | | | | | |
| North America copper mines | | 1,044 | | | 537 | | | 71 | | | | | | | |
| South America mining | | 849 | | | 389 | | | 59 | | | | | | | |
| Indonesia mining | | 927 | | | 427 | | | 57 | | | | | | | |
| Africa mining | | 207 | | | 96 | | | 30 | | | | | | | |
| Molybdenum | | 325 | | | 190 | | | 12 | | | | | | | |
| Rod & Refining | | 1,129 | | | 1,121 | | | 2 | | | | | | | |
| Atlantic Copper Smelting & Refining | | 616 | | | 605 | | | 9 | | | | | | | |
| Corporate, other & eliminations | | (1,233 | ) | | (1,313 | ) | | 9 | | | | | | | |
| As reported in FCX’s consolidated financial statements | $ | 3,864 | | $ | 2,052 | | $ | 249 | | | | | | | |
| a. | Molybdenum by-product credits and revenues reflect volumes produced at market-based pricing and also include tolling revenues at Sierrita. |
| b. | Includes gold and silver product revenues and production costs. |
North America Copper Mines Product Revenues and Production Costs (continued)
| Three Months Ended June 30, 2009 | | | | |
| | By-Product | | Co-Product Method | |
| (In millions) | Method | | Copper | | Molybdenuma | | Otherb | | Total | |
| Revenues, excluding adjustments | $ | 615 | | $ | 615 | | $ | 60 | | $ | 10 | | $ | 685 | |
| | | | | | | | | | | | | | | | |
| Site production and delivery, before net noncash | | | | | | | | | | | | | | | |
| and other costs shown below | | 350 | | | 318 | | | 38 | | | 6 | | | 362 | |
By-product creditsa | | (58 | ) | | – | | | – | | | – | | | – | |
| Treatment charges | | 25 | | | 24 | | | – | | | 1 | | | 25 | |
| Net cash costs | | 317 | | | 342 | | | 38 | | | 7 | | | 387 | |
| Depreciation, depletion and amortization | | 60 | | | 57 | | | 3 | | | – | | | 60 | |
| Noncash and other costs, net | | 41 | | | 41 | | | – | | | – | | | 41 | |
| Total costs | | 418 | | | 440 | | | 41 | | | 7 | | | 488 | |
| Revenue adjustments, primarily for hedging | | 19 | | | 19 | | | – | | | – | | | 19 | |
| Idle facility and other non-inventoriable costs | | (24 | ) | | (24 | ) | | – | | | – | | | (24 | ) |
| Gross profit | $ | 192 | | $ | 170 | | $ | 19 | | $ | 3 | | $ | 192 | |
| | | | | | | | | | | | | | | | |
| Reconciliation to Amounts Reported | | | | | | | | | | | | | | | |
| (In millions) | | | | | | | Depreciation, | | | | | | | |
| | | | | Production | | | Depletion and | | | | | | | |
| | Revenues | | and Delivery | | | Amortization | | | | | | | |
| Totals presented above | $ | 685 | | $ | 362 | | $ | 60 | | | | | | | |
| Net noncash and other costs per above | | N/A | | | 41 | | | N/A | | | | | | | |
| Treatment charges per above | | N/A | | | 25 | | | N/A | | | | | | | |
| Revenue adjustments, primarily for hedging per above | | 19 | | | N/A | | | N/A | | | | | | | |
| Idle facility and other non-inventoriable costs per above | | N/A | | | 24 | | | N/A | | | | | | | |
| Eliminations and other | | (1 | ) | | 9 | | | 4 | | | | | | | |
| North America copper mines | | 703 | | | 461 | | | 64 | | | | | | | |
| South America mining | | 884 | | | 366 | | | 69 | | | | | | | |
| Indonesia mining | | 1,610 | | | 415 | | | 78 | | | | | | | |
| Africa mining | | 57 | | | 92 | | | 14 | | | | | | | |
| Molybdenum | | 186 | | | 162 | | | 13 | | | | | | | |
| Rod & Refining | | 747 | | | 743 | | | 2 | | | | | | | |
| Atlantic Copper Smelting & Refining | | 415 | | | 419 | | | 9 | | | | | | | |
| Corporate, other & eliminations | | (918 | ) | | (849 | ) | | 7 | | | | | | | |
| As reported in FCX’s consolidated financial statements | $ | 3,684 | | $ | 1,809 | | $ | 256 | | | | | | | |
| a. | Molybdenum by-product credits and revenues reflect volumes produced at market-based pricing and also include tolling revenues at Sierrita. |
| b. | Includes gold and silver product revenues and production costs. |
North America Copper Mines Product Revenues and Production Costs (continued)
| Six Months Ended June 30, 2010 | | | | |
| | By-Product | | Co-Product Method | |
| (In millions) | Method | | Copper | | Molybdenuma | | Otherb | | Total | |
| Revenues, excluding adjustments | $ | 1,890 | | $ | 1,890 | | $ | 181 | | $ | 31 | | $ | 2,102 | |
| | | | | | | | | | | | | | | | |
| Site production and delivery, before net noncash | | | | | | | | | | | | | | | |
| and other costs shown below | | 802 | | | 725 | | | 92 | | | 14 | | | 831 | |
By-product creditsa | | (183 | ) | | – | | | – | | | – | | | – | |
| Treatment charges | | 48 | | | 47 | | | – | | | 1 | | | 48 | |
| Net cash costs | | 667 | | | 772 | | | 92 | | | 15 | | | 879 | |
| Depreciation, depletion and amortization | | 144 | | | 136 | | | 7 | | | 1 | | | 144 | |
| Noncash and other costs, net | | 77 | | | 76 | | | 1 | | | – | | | 77 | |
| Total costs | | 888 | | | 984 | | | 100 | | | 16 | | | 1,100 | |
| Revenue adjustments, primarily for hedging | | (2 | ) | | (2 | ) | | – | | | – | | | (2 | ) |
| Idle facility and other non-inventoriable costs | | (39 | ) | | (39 | ) | | – | | | – | | | (39 | ) |
| Gross profit | $ | 961 | | $ | 865 | | $ | 81 | | $ | 15 | | $ | 961 | |
| | | | | | | | | | | | | | | | |
| Reconciliation to Amounts Reported | | | | | | | | | | | | | | | |
| (In millions) | | | | | | | Depreciation, | | | | | | | |
| | | | | Production | | | Depletion and | | | | | | | |
| | Revenues | | and Delivery | | | Amortization | | | | | | | |
| Totals presented above | $ | 2,102 | | $ | 831 | | $ | 144 | | | | | | | |
| Net noncash and other costs per above | | N/A | | | 77 | | | N/A | | | | | | | |
| Treatment charges per above | | N/A | | | 48 | | | N/A | | | | | | | |
| Revenue adjustments, primarily for hedging per above | | (2 | ) | | N/A | | | N/A | | | | | | | |
| Idle facility and other non-inventoriable costs per above | | N/A | | | 39 | | | N/A | | | | | | | |
| Eliminations and other | | (2 | ) | | 6 | | | 9 | | | | | | | |
| North America copper mines | | 2,098 | | | 1,001 | | | 153 | | | | | | | |
| South America mining | | 1,918 | | | 765 | | | 120 | | | | | | | |
| Indonesia mining | | 2,386 | | | 902 | | | 120 | | | | | | | |
| Africa mining | | 456 | | | 206 | | | 60 | | | | | | | |
| Molybdenum | | 600 | | | 375 | | | 25 | | | | | | | |
| Rod & Refining | | 2,202 | | | 2,188 | | | 4 | | | | | | | |
| Atlantic Copper Smelting & Refining | | 1,249 | | | 1,233 | | | 19 | | | | | | | |
| Corporate, other & eliminations | | (2,682 | ) | | (2,700 | ) | | 19 | | | | | | | |
| As reported in FCX’s consolidated financial statements | $ | 8,227 | | $ | 3,970 | | $ | 520 | | | | | | | |
| a. | Molybdenum by-product credits and revenues reflect volumes produced at market-based pricing and also include tolling revenues at Sierrita. |
| b. | Includes gold and silver product revenues and production costs. |
North America Copper Mines Product Revenues and Production Costs (continued)
| Six Months Ended June 30, 2009 | | | | |
| | By-Product | | Co-Product Method | |
| (In millions) | Method | | Copper | | Molybdenuma | | Otherb | | Total | |
| Revenues, excluding adjustments | $ | 1,095 | | $ | 1,095 | | $ | 119 | | $ | 16 | | $ | 1,230 | |
| | | | | | | | | | | | | | | | |
| Site production and delivery, before net noncash | | | | | | | | | | | | | | | |
| and other costs shown below | | 746 | | | 696 | | | 64 | | | 8 | | | 768 | |
By-product creditsa | | (113 | ) | | – | | | – | | | – | | | – | |
| Treatment charges | | 50 | | | 49 | | | – | | | 1 | | | 50 | |
| Net cash costs | | 683 | | | 745 | | | 64 | | | 9 | | | 818 | |
| Depreciation, depletion and amortization | | 131 | | | 126 | | | 4 | | | 1 | | | 131 | |
| Noncash and other costs, net | | 87 | | | 86 | | | 1 | | | – | | | 87 | |
| Total costs | | 901 | | | 957 | | | 69 | | | 10 | | | 1,036 | |
| Revenue adjustments, primarily for hedging | | 88 | | | 88 | | | – | | | – | | | 88 | |
| Idle facility and other non-inventoriable costs | | (62 | ) | | (62 | ) | | – | | | – | | | (62 | ) |
| Gross profit | $ | 220 | | $ | 164 | | $ | 50 | | $ | 6 | | $ | 220 | |
| | | | | | | | | | | | | | | | |
| Reconciliation to Amounts Reported | | | | | | | | | | | | | | | |
| (In millions) | | | | | | | Depreciation, | | | | | | | |
| | | | | Production | | | Depletion and | | | | | | | |
| | Revenues | | and Delivery | | | Amortization | | | | | | | |
| Totals presented above | $ | 1,230 | | $ | 768 | | $ | 131 | | | | | | | |
| Net noncash and other costs per above | | N/A | | | 87 | | | N/A | | | | | | | |
| Treatment charges per above | | N/A | | | 50 | | | N/A | | | | | | | |
| Revenue adjustments, primarily for hedging per above | | 88 | | | N/A | | | N/A | | | | | | | |
| Idle facility and other non-inventoriable costs per above | | N/A | | | 62 | | | N/A | | | | | | | |
| Eliminations and other | | 3 | | | 47 | | | 8 | | | | | | | |
| North America copper mines | | 1,321 | | | 1,014 | | | 139 | | | | | | | |
| South America mining | | 1,586 | | | 733 | | | 134 | | | | | | | |
| Indonesia mining | | 2,732 | | | 765 | | | 143 | | | | | | | |
| Africa mining | | 57 | | | 108 | | | 17 | | | | | | | |
| Molybdenum | | 332 | | | 300 | c | | 22 | | | | | | | |
| Rod & Refining | | 1,366 | | | 1,357 | | | 4 | | | | | | | |
| Atlantic Copper Smelting & Refining | | 707 | | | 712 | | | 17 | | | | | | | |
| Corporate, other & eliminations | | (1,815 | ) | | (1,599 | ) | | 12 | | | | | | | |
| As reported in FCX’s consolidated financial statements | $ | 6,286 | | $ | 3,390 | c | $ | 488 | | | | | | | |
| a. | Molybdenum by-product credits and revenues reflect volumes produced at market-based pricing and also include tolling revenues at Sierrita. |
| b. | Includes gold and silver product revenues and production costs. |
| c. | Includes LCM molybdenum inventory adjustments totaling $19 million. |
South America Mining Product Revenues and Production Costs
| Three Months Ended June 30, 2010 | | | | | | | | |
| | By-Product | | Co-Product Method | |
| (In millions) | Method | | Copper | | Other a | | Total | |
| Revenues, excluding adjustments | $ | 936 | | $ | 936 | | $ | 60 | | $ | 996 | |
| | | | | | | | | | | | | |
| Site production and delivery, before net noncash | | | | | | | | | | | | |
| and other costs shown below | | 379 | | | 356 | | | 26 | | | 382 | |
| By-product credits | | (57 | ) | | – | | | – | | | – | |
| Treatment charges | | 33 | | | 33 | | | – | | | 33 | |
| Net cash costs | | 355 | | | 389 | | | 26 | | | 415 | |
| Depreciation, depletion and amortization | | 59 | | | 57 | | | 2 | | | 59 | |
| Noncash and other costs, net | | 5 | | | 4 | | | 1 | | | 5 | |
| Total costs | | 419 | | | 450 | | | 29 | | | 479 | |
| Revenue adjustments, primarily for pricing on prior | | | | | | | | | | | | |
| period open sales | | (114 | ) | | (114 | ) | | – | | | (114 | ) |
| Other non-inventoriable costs | | (6 | ) | | (5 | ) | | (1 | ) | | (6 | ) |
| Gross profit | $ | 397 | | $ | 367 | | $ | 30 | | $ | 397 | |
| | | | | | | | | | | | | |
| Reconciliation to Amounts Reported | | | | | | | | | | | | |
| (In millions) | | | | | | Depreciation, | | | | |
| | | | | Production | | Depletion and | | | | |
| | Revenues | | and Delivery | | Amortization | | | | |
| Totals presented above | $ | 996 | | $ | 382 | | $ | 59 | | | | |
| Net noncash and other costs per above | | N/A | | | 5 | | | N/A | | | | |
| Treatment charges per above | | (33 | ) | | N/A | | | N/A | | | | |
| Revenue adjustments, primarily for pricing on prior | | | | | | | | | | | | |
| period open sales per above | | (114 | ) | | N/A | | | N/A | | | | |
| Other non-inventoriable costs per above | | N/A | | | 6 | | | N/A | | | | |
| Eliminations and other | | – | | | (4 | ) | | – | | | | |
| South America mining | | 849 | | | 389 | | | 59 | | | | |
| North America copper mines | | 1,044 | | | 537 | | | 71 | | | | |
| Indonesia mining | | 927 | | | 427 | | | 57 | | | | |
| Africa mining | | 207 | | | 96 | | | 30 | | | | |
| Molybdenum | | 325 | | | 190 | | | 12 | | | | |
| Rod & Refining | | 1,129 | | | 1,121 | | | 2 | | | | |
| Atlantic Copper Smelting & Refining | | 616 | | | 605 | | | 9 | | | | |
| Corporate, other & eliminations | | (1,233 | ) | | (1,313 | ) | | 9 | | | | |
| As reported in FCX’s consolidated financial statements | $ | 3,864 | | $ | 2,052 | | $ | 249 | | | | |
| a. | Includes gold, silver and molybdenum product revenues and production costs. |
South America Mining Product Revenues and Production Costs (continued)
| Three Months Ended June 30, 2009 | | | | | | | | |
| | By-Product | | Co-Product Method | |
| (In millions) | Method | | Copper | | Other a | | Total | |
| Revenues, excluding adjustments | $ | 803 | | $ | 803 | | $ | 40 | | $ | 843 | |
| | | | | | | | | | | | | |
| Site production and delivery, before net noncash | | | | | | | | | | | | |
| and other costs shown below | | 364 | | | 346 | | | 19 | | | 365 | |
| By-product credits | | (39 | ) | | – | | | – | | | – | |
| Treatment charges | | 54 | | | 54 | | | – | | | 54 | |
| Net cash costs | | 379 | | | 400 | | | 19 | | | 419 | |
| Depreciation, depletion and amortization | | 69 | | | 67 | | | 2 | | | 69 | |
| Noncash and other costs, net | | (2 | ) | | (1 | ) | | (1 | ) | | (2 | ) |
| Total costs | | 446 | | | 466 | | | 20 | | | 486 | |
| Revenue adjustments, primarily for pricing on prior | | | | | | | | | | | | |
| period open sales | | 95 | | | 95 | | | – | | | 95 | |
| Other non-inventoriable costs | | (8 | ) | | (5 | ) | | (3 | ) | | (8 | ) |
| Gross profit | $ | 444 | | $ | 427 | | $ | 17 | | $ | 444 | |
| | | | | | | | | | | | | |
| Reconciliation to Amounts Reported | | | | | | | | | | | | |
| (In millions) | | | | | | Depreciation, | | | | |
| | | | | Production | | Depletion and | | | | |
| | Revenues | | and Delivery | | Amortization | | | | |
| Totals presented above | $ | 843 | | $ | 365 | | $ | 69 | | | | |
| Net noncash and other costs per above | | N/A | | | (2 | ) | | N/A | | | | |
| Treatment charges per above | | (54 | ) | | N/A | | | N/A | | | | |
| Revenue adjustments, primarily for pricing on prior | | | | | | | | | | | | |
| period open sales per above | | 95 | | | N/A | | | N/A | | | | |
| Other non-inventoriable costs per above | | N/A | | | 8 | | | N/A | | | | |
| Eliminations and other | | – | | | (5 | ) | | – | | | | |
| South America mining | | 884 | | | 366 | | | 69 | | | | |
| North America copper mines | | 703 | | | 461 | | | 64 | | | | |
| Indonesia mining | | 1,610 | | | 415 | | | 78 | | | | |
| Africa mining | | 57 | | | 92 | | | 14 | | | | |
| Molybdenum | | 186 | | | 162 | | | 13 | | | | |
| Rod & Refining | | 747 | | | 743 | | | 2 | | | | |
| Atlantic Copper Smelting & Refining | | 415 | | | 419 | | | 9 | | | | |
| Corporate, other & eliminations | | (918 | ) | | (849 | ) | | 7 | | | | |
| As reported in FCX’s consolidated financial statements | $ | 3,684 | | $ | 1,809 | | $ | 256 | | | | |
| a. | Includes gold, silver and molybdenum product revenues and production costs. |
South America Mining Product Revenues and Production Costs (continued)
| Six Months Ended June 30, 2010 | | | | | | | | |
| | By-Product | | Co-Product Method | |
| (In millions) | Method | | Copper | | Other a | | Total | |
| Revenues, excluding adjustments | $ | 1,898 | | $ | 1,898 | | $ | 116 | | $ | 2,014 | |
| | | | | | | | | | | | | |
| Site production and delivery, before net noncash | | | | | | | | | | | | |
| and other costs shown below | | 746 | | | 704 | | | 49 | | | 753 | |
| By-product credits | | (108 | ) | | – | | | – | | | – | |
| Treatment charges | | 80 | | | 80 | | | – | | | 80 | |
| Net cash costs | | 718 | | | 784 | | | 49 | | | 833 | |
| Depreciation, depletion and amortization | | 119 | | | 115 | | | 5 | | | 120 | |
| Noncash and other costs, net | | 7 | | | 6 | | | 1 | | | 7 | |
| Total costs | | 844 | | | 905 | | | 55 | | | 960 | |
| Revenue adjustments, primarily for pricing on prior | | | | | | | | | | | | |
| period open sales | | (17 | ) | | (17 | ) | | – | | | (17 | ) |
| Other non-inventoriable costs | | (14 | ) | | (12 | ) | | (2 | ) | | (14 | ) |
| Gross profit | $ | 1,023 | | $ | 964 | | $ | 59 | | $ | 1,023 | |
| | | | | | | | | | | | | |
| Reconciliation to Amounts Reported | | | | | | | | | | | | |
| (In millions) | | | | | | Depreciation, | | | | |
| | | | | Production | | Depletion and | | | | |
| | Revenues | | and Delivery | | Amortization | | | | |
| Totals presented above | $ | 2,014 | | $ | 753 | | $ | 120 | | | | |
| Net noncash and other costs per above | | N/A | | | 7 | | | N/A | | | | |
| Treatment charges per above | | (80 | ) | | N/A | | | N/A | | | | |
| Revenue adjustments, primarily for pricing on prior | | | | | | | | | | | | |
| period open sales per above | | (17 | ) | | N/A | | | N/A | | | | |
| Other non-inventoriable costs per above | | N/A | | | 14 | | | N/A | | | | |
| Eliminations and other | | 1 | | | (9 | ) | | – | | | | |
| South America mining | | 1,918 | | | 765 | | | 120 | | | | |
| North America copper mines | | 2,098 | | | 1,001 | | | 153 | | | | |
| Indonesia mining | | 2,386 | | | 902 | | | 120 | | | | |
| Africa mining | | 456 | | | 206 | | | 60 | | | | |
| Molybdenum | | 600 | | | 375 | | | 25 | | | | |
| Rod & Refining | | 2,202 | | | 2,188 | | | 4 | | | | |
| Atlantic Copper Smelting & Refining | | 1,249 | | | 1,233 | | | 19 | | | | |
| Corporate, other & eliminations | | (2,682 | ) | | (2,700 | ) | | 19 | | | | |
| As reported in FCX’s consolidated financial statements | $ | 8,227 | | $ | 3,970 | | $ | 520 | | | | |
| a. | Includes gold, silver and molybdenum product revenues and production costs. |
South America Mining Product Revenues and Production Costs (continued)
| Six Months Ended June 31, 2009 | | | | | | | | |
| | By-Product | | Co-Product Method | |
| (In millions) | Method | | Copper | | Other a | | Total | |
| Revenues, excluding adjustments | $ | 1,497 | | $ | 1,497 | | $ | 84 | | $ | 1,581 | |
| | | | | | | | | | | | | |
| Site production and delivery, before net noncash | | | | | | | | | | | | |
| and other costs shown below | | 716 | | | 669 | | | 53 | | | 722 | |
| By-product credits | | (78 | ) | | – | | | – | | | – | |
| Treatment charges | | 102 | | | 102 | | | – | | | 102 | |
| Net cash costs | | 740 | | | 771 | | | 53 | | | 824 | |
| Depreciation, depletion and amortization | | 134 | | | 129 | | | 5 | | | 134 | |
| Noncash and other costs, net | | 3 | | | 4 | | | (1 | ) | | 3 | |
| Total costs | | 877 | | | 904 | | | 57 | | | 961 | |
| Revenue adjustments, primarily for pricing on prior | | | | | | | | | | | | |
| period open sales | | 106 | | | 106 | | | – | | | 106 | |
| Other non-inventoriable costs | | (17 | ) | | (13 | ) | | (4 | ) | | (17 | ) |
| Gross profit | $ | 709 | | $ | 686 | | $ | 23 | | $ | 709 | |
| | | | | | | | | | | | | |
| Reconciliation to Amounts Reported | | | | | | | | | | | | |
| (In millions) | | | | | | Depreciation, | | | | |
| | | | | Production | | Depletion and | | | | |
| | Revenues | | and Delivery | | Amortization | | | | |
| Totals presented above | $ | 1,581 | | $ | 722 | | $ | 134 | | | | |
| Net noncash and other costs per above | | N/A | | | 3 | | | N/A | | | | |
| Treatment charges per above | | (102 | ) | | N/A | | | N/A | | | | |
| Revenue adjustments, primarily for pricing on prior | | | | | | | | | | | | |
| period open sales per above | | 106 | | | N/A | | | N/A | | | | |
| Other non-inventoriable costs per above | | N/A | | | 17 | | | N/A | | | | |
| Eliminations and other | | 1 | | | (9 | ) | | – | | | | |
| South America mining | | 1,586 | | | 733 | | | 134 | | | | |
| North America copper mines | | 1,321 | | | 1,014 | | | 139 | | | | |
| Indonesia mining | | 2,732 | | | 765 | | | 143 | | | | |
| Africa mining | | 57 | | | 108 | | | 17 | | | | |
| Molybdenum | | 332 | | | 300 | b | | 22 | | | | |
| Rod & Refining | | 1,366 | | | 1,357 | | | 4 | | | | |
| Atlantic Copper Smelting & Refining | | 707 | | | 712 | | | 17 | | | | |
| Corporate, other & eliminations | | (1,815 | ) | | (1,599 | ) | | 12 | | | | |
| As reported in FCX’s consolidated financial statements | $ | 6,286 | | $ | 3,390 | b | $ | 488 | | | | |
| a. | Includes gold, silver and molybdenum product revenues and production costs. |
| b. | Includes LCM molybdenum inventory adjustments totaling $19 million. |
Indonesia Mining Product Revenues and Production Costs
| Three Months Ended June 30, 2010 | | | | |
| | By-Product | | Co-Product Method | |
| (In millions) | Method | | Copper | | Gold | | Silver | | Total | |
| Revenues, excluding adjustments | $ | 765 | | $ | 765 | | $ | 352 | | $ | 14 | | $ | 1,131 | |
| | | | | | | | | | | | | | | | |
| Site production and delivery, before net noncash | | | | | | | | | | | | | | | |
| and other costs shown below | | 422 | | | 285 | | | 132 | | | 5 | | | 422 | |
| Gold and silver credits | | (366 | ) | | – | | | – | | | – | | | – | |
| Treatment charges | | 67 | | | 45 | | | 21 | | | 1 | | | 67 | |
| Royalty on metals | | 28 | | | 19 | | | 9 | | | – | | | 28 | |
| Net cash costs | | 151 | | | 349 | | | 162 | | | 6 | | | 517 | |
| Depreciation and amortization | | 57 | | | 38 | | | 17 | | | 2 | | | 57 | |
| Noncash and other costs, net | | 5 | | | 4 | | | 1 | | | – | | | 5 | |
| Total costs | | 213 | | | 391 | | | 180 | | | 8 | | | 579 | |
| Revenue adjustments, primarily for pricing on prior | | | | | | | | | | | | | | | |
| period open sales | | (109 | ) | | (109 | ) | | – | | | – | | | (109 | ) |
| PT Smelting intercompany profit | | 17 | | | 11 | | | 5 | | | 1 | | | 17 | |
| Gross profit | $ | 460 | | $ | 276 | | $ | 177 | | $ | 7 | | $ | 460 | |
| | | | | | | | | | | | | | | | |
| Reconciliation to Amounts Reported | | | | | | | | | | | | | | | |
| (In millions) | | | | | Depreciation, | | | | | | | |
| | | | Production | | Depletion and | | | | | | | |
| | Revenues | | and Delivery | | Amortization | | | | | | | |
| Totals presented above | $ | 1,131 | | $ | 422 | | $ | 57 | | | | | | | |
| Net noncash and other costs per above | | N/A | | | 5 | | | N/A | | | | | | | |
| Treatment charges per above | | (67 | ) | | N/A | | | N/A | | | | | | | |
| Royalty on metals per above | | (28 | ) | | N/A | | | N/A | | | | | | | |
| Revenue adjustments, primarily for pricing on prior | | | | | | | | | | | | | | | |
| period open sales per above | | (109 | ) | | N/A | | | N/A | | | | | | | |
| Indonesia mining | | 927 | | | 427 | | | 57 | | | | | | | |
| North America copper mines | | 1,044 | | | 537 | | | 71 | | | | | | | |
| South America mining | | 849 | | | 389 | | | 59 | | | | | | | |
| Africa mining | | 207 | | | 96 | | | 30 | | | | | | | |
| Molybdenum | | 325 | | | 190 | | | 12 | | | | | | | |
| Rod & Refining | | 1,129 | | | 1,121 | | | 2 | | | | | | | |
| Atlantic Copper Smelting & Refining | | 616 | | | 605 | | | 9 | | | | | | | |
| Corporate, other & eliminations | | (1,233 | ) | | (1,313 | ) | | 9 | | | | | | | |
| As reported in FCX’s consolidated financial statements | $ | 3,864 | | $ | 2,052 | | $ | 249 | | | | | | | |
Indonesia Mining Product Revenues and Production Costs (continued)
| Three Months Ended June 30, 2009 | | | | |
| | By-Product | | Co-Product Method | |
| (In millions) | Method | | Copper | | Gold | | Silver | | Total | |
| Revenues, excluding adjustments | $ | 966 | | $ | 966 | | $ | 753 | | $ | 23 | | $ | 1,742 | |
| | | | | | | | | | | | | | | | |
| Site production and delivery, before net noncash | | | | | | | | | | | | | | | |
| and other costs shown below | | 401 | | | 223 | | | 172 | | | 6 | | | 401 | |
| Gold and silver credits | | (776 | ) | | – | | | – | | | – | | | – | |
| Treatment charges | | 94 | | | 53 | | | 40 | | | 1 | | | 94 | |
| Royalty on metals | | 49 | | | 28 | | | 21 | | | – | | | 49 | |
| Net cash (credits) costs | | (232 | ) | | 304 | | | 233 | | | 7 | | | 544 | |
| Depreciation and amortization | | 78 | | | 44 | | | 33 | | | 1 | | | 78 | |
| Noncash and other costs, net | | 14 | | | 7 | | | 7 | | | – | | | 14 | |
| Total (credits) costs | | (140 | ) | | 355 | | | 273 | | | 8 | | | 636 | |
| Revenue adjustments, primarily for pricing on prior | | | | | | | | | | | | | | | |
| period open sales | | 11 | | | 11 | | | – | | | – | | | 11 | |
| PT Smelting intercompany loss | | (30 | ) | | (17 | ) | | (12 | ) | | (1 | ) | | (30 | ) |
| Gross profit | $ | 1,087 | | $ | 605 | | $ | 468 | | $ | 14 | | $ | 1,087 | |
| | | | | | | | | | | | | | | | |
| Reconciliation to Amounts Reported | | | | | | | | | | | | | | | |
| (In millions) | | | | | Depreciation, | | | | | | | |
| | | | Production | | Depletion and | | | | | | | |
| | Revenues | | and Delivery | | Amortization | | | | | | | |
| Totals presented above | $ | 1,742 | | $ | 401 | | $ | 78 | | | | | | | |
| Net noncash and other costs per above | | N/A | | | 14 | | | N/A | | | | | | | |
| Treatment charges per above | | (94 | ) | | N/A | | | N/A | | | | | | | |
| Royalty on metals per above | | (49 | ) | | N/A | | | N/A | | | | | | | |
| Revenue adjustments, primarily for pricing on prior | | | | | | | | | | | | | | | |
| period open sales per above | | 11 | | | N/A | | | N/A | | | | | | | |
| Indonesia mining | | 1,610 | | | 415 | | | 78 | | | | | | | |
| North America copper mines | | 703 | | | 461 | | | 64 | | | | | | | |
| South America mining | | 884 | | | 366 | | | 69 | | | | | | | |
| Africa mining | | 57 | | | 92 | | | 14 | | | | | | | |
| Molybdenum | | 186 | | | 162 | | | 13 | | | | | | | |
| Rod & Refining | | 747 | | | 743 | | | 2 | | | | | | | |
| Atlantic Copper Smelting & Refining | | 415 | | | 419 | | | 9 | | | | | | | |
| Corporate, other & eliminations | | (918 | ) | | (849 | ) | | 7 | | | | | | | |
| As reported in FCX’s consolidated financial statements | $ | 3,684 | | $ | 1,809 | | $ | 256 | | | | | | | |
Indonesia Mining Product Revenues and Production Costs (continued)
| Six Months Ended June 30, 2010 | | | | |
| | By-Product | | Co-Product Method | |
| (In millions) | Method | | Copper | | Gold | | Silver | | Total | |
| Revenues, excluding adjustments | $ | 1,694 | | $ | 1,694 | | $ | 861 | | $ | 35 | | $ | 2,590 | |
| | | | | | | | | | | | | | | | |
| Site production and delivery, before net noncash | | | | | | | | | | | | | | | |
| and other costs shown below | | 878 | | | 574 | | | 292 | | | 12 | | | 878 | |
| Gold and silver credits | | (896 | ) | | – | | | – | | | – | | | – | |
| Treatment charges | | 134 | | | 88 | | | 44 | | | 2 | | | 134 | |
| Royalty on metals | | 64 | | | 42 | | | 21 | | | 1 | | | 64 | |
| Net cash costs | | 180 | | | 704 | | | 357 | | | 15 | | | 1,076 | |
| Depreciation and amortization | | 120 | | | 78 | | | 40 | | | 2 | | | 120 | |
| Noncash and other costs, net | | 24 | | | 16 | | | 8 | | | – | | | 24 | |
| Total costs | | 324 | | | 798 | | | 405 | | | 17 | | | 1,220 | |
| Revenue adjustments, primarily for pricing on prior | | | | | | | | | | | | | | | |
| period open sales | | (6 | ) | | (6 | ) | | – | | | – | | | (6 | ) |
| PT Smelting intercompany profit | | 29 | | | 19 | | | 9 | | | 1 | | | 29 | |
| Gross profit | $ | 1,393 | | $ | 909 | | $ | 465 | | $ | 19 | | $ | 1,393 | |
| | | | | | | | | | | | | | | | |
| Reconciliation to Amounts Reported | | | | | | | | | | | | | | | |
| (In millions) | | | | | Depreciation, | | | | | | | |
| | | | Production | | Depletion and | | | | | | | |
| | Revenues | | and Delivery | | Amortization | | | | | | | |
| Totals presented above | $ | 2,590 | | $ | 878 | | $ | 120 | | | | | | | |
| Net noncash and other costs per above | | N/A | | | 24 | | | N/A | | | | | | | |
| Treatment charges per above | | (134 | ) | | N/A | | | N/A | | | | | | | |
| Royalty on metals per above | | (64 | ) | | N/A | | | N/A | | | | | | | |
| Revenue adjustments, primarily for pricing on prior | | | | | | | | | | | | | | | |
| period open sales per above | | (6 | ) | | N/A | | | N/A | | | | | | | |
| Indonesia mining | | 2,386 | | | 902 | | | 120 | | | | | | | |
| North America copper mines | | 2,098 | | | 1,001 | | | 153 | | | | | | | |
| South America mining | | 1,918 | | | 765 | | | 120 | | | | | | | |
| Africa mining | | 456 | | | 206 | | | 60 | | | | | | | |
| Molybdenum | | 600 | | | 375 | | | 25 | | | | | | | |
| Rod & Refining | | 2,202 | | | 2,188 | | | 4 | | | | | | | |
| Atlantic Copper Smelting & Refining | | 1,249 | | | 1,233 | | | 19 | | | | | | | |
| Corporate, other & eliminations | | (2,682 | ) | | (2,700 | ) | | 19 | | | | | | | |
| As reported in FCX’s consolidated financial statements | $ | 8,227 | | $ | 3,970 | | $ | 520 | | | | | | | |
Indonesia Mining Product Revenues and Production Costs (continued)
| Six Months Ended June 30, 2009 | | | | |
| | By-Product | | Co-Product Method | |
| (In millions) | Method | | Copper | | Gold | | Silver | | Total | |
| Revenues, excluding adjustments | $ | 1,650 | | $ | 1,650 | | $ | 1,230 | | $ | 40 | | $ | 2,920 | |
| | | | | | | | | | | | | | | | |
| Site production and delivery, before net noncash | | | | | | | | | | | | | | | |
| and other costs shown below | | 740 | | | 418 | | | 312 | | | 10 | | | 740 | |
| Gold and silver credits | | (1,270 | ) | | – | | | – | | | – | | | – | |
| Treatment charges | | 169 | | | 96 | | | 71 | | | 2 | | | 169 | |
| Royalty on metals | | 74 | | | 42 | | | 31 | | | 1 | | | 74 | |
| Net cash (credits) costs | | (287 | ) | | 556 | | | 414 | | | 13 | | | 983 | |
| Depreciation and amortization | | 143 | | | 81 | | | 60 | | | 2 | | | 143 | |
| Noncash and other costs, net | | 25 | | | 14 | | | 11 | | | – | | | 25 | |
| Total (credits) costs | | (119 | ) | | 651 | | | 485 | | | 15 | | | 1,151 | |
| Revenue adjustments, primarily for pricing on prior | | | | | | | | | | | | | | | |
| period open sales | | 55 | | | 55 | | | – | | | – | | | 55 | |
| PT Smelting intercompany loss | | (37 | ) | | (21 | ) | | (15 | ) | | (1 | ) | | (37 | ) |
| Gross profit | $ | 1,787 | | $ | 1,033 | | $ | 730 | | $ | 24 | | $ | 1,787 | |
| | | | | | | | | | | | | | | | |
| Reconciliation to Amounts Reported | | | | | | | | | | | | | | | |
| (In millions) | | | | | Depreciation, | | | | | | | |
| | | | Production | | Depletion and | | | | | | | |
| | Revenues | | and Delivery | | Amortization | | | | | | | |
| Totals presented above | $ | 2,920 | | $ | 740 | | $ | 143 | | | | | | | |
| Net noncash and other costs per above | | N/A | | | 25 | | | N/A | | | | | | | |
| Treatment charges per above | | (169 | ) | | N/A | | | N/A | | | | | | | |
| Royalty on metals per above | | (74 | ) | | N/A | | | N/A | | | | | | | |
| Revenue adjustments, primarily for pricing on prior | | | | | | | | | | | | | | | |
| period open sales per above | | 55 | | | N/A | | | N/A | | | | | | | |
| Indonesia mining | | 2,732 | | | 765 | | | 143 | | | | | | | |
| North America copper mines | | 1,321 | | | 1,014 | | | 139 | | | | | | | |
| South America mining | | 1,586 | | | 733 | | | 134 | | | | | | | |
| Africa mining | | 57 | | | 108 | | | 17 | | | | | | | |
| Molybdenum | | 332 | | | 300 | a | | 22 | | | | | | | |
| Rod & Refining | | 1,366 | | | 1,357 | | | 4 | | | | | | | |
| Atlantic Copper Smelting & Refining | | 707 | | | 712 | | | 17 | | | | | | | |
| Corporate, other & eliminations | | (1,815 | ) | | (1,599 | ) | | 12 | | | | | | | |
| As reported in FCX’s consolidated financial statements | $ | 6,286 | | $ | 3,390 | a | $ | 488 | | | | | | | |
| a. | Includes LCM molybdenum inventory adjustments totaling $19 million. |
Africa Mining Product Revenues and Production Costs
| Three Months Ended June 30, 2010 | | | | | | | | |
| | By-Product | | Co-Product Method | |
| (In millions) | Method | | Copper | | Cobalt | | Total | |
| Revenues, excluding adjustments | $ | 163 | | $ | 163 | | $ | 48 | | $ | 211 | |
| | | | | | | | | | | | | |
| Site production and delivery, before net noncash | | | | | | | | | | | | |
| and other costs shown below | | 70 | | | 64 | | | 24 | | | 88 | |
| Cobalt credits | | (30 | )a | | – | | | – | | | – | |
| Royalty on metals | | 3 | | | 2 | | | 1 | | | 3 | |
| Net cash costs | | 43 | | | 66 | | | 25 | | | 91 | |
| Depreciation, depletion and amortization | | 30 | | | 26 | | | 4 | | | 30 | |
| Noncash and other costs, net | | 3 | | | 2 | | | 1 | | | 3 | |
| Total costs | | 76 | | | 94 | | | 30 | | | 124 | |
| Revenue adjustments, primarily for pricing on prior | | | | | | | | | | | | |
| period open sales | | – | | | – | | | – | | | – | |
| Other non-inventoriable costs | | (6 | ) | | (5 | ) | | (1 | ) | | (6 | ) |
| Gross profit | $ | 81 | | $ | 64 | | $ | 17 | | $ | 81 | |
| | | | | | | | | | | | | |
| Reconciliation to Amounts Reported | | | | | | | | | | | | |
| (In millions) | | | | | | Depreciation, | | | | |
| | | | | Production | | Depletion and | | | | |
| | Revenues | | and Delivery | | Amortization | | | | |
| Totals presented above | $ | 211 | | $ | 88 | | $ | 30 | | | | |
| Net noncash and other costs per above | | N/A | | | 3 | | | N/A | | | | |
| Royalty on metals per above | | (3 | ) | | N/A | | | N/A | | | | |
| Revenue adjustments, primarily for pricing on prior | | | | | | | | | | | | |
| period open sales per above | | – | | | N/A | | | N/A | | | | |
| Other non-inventoriable costs per above | | N/A | | | 6 | | | N/A | | | | |
| Eliminations and other | | (1 | ) | | (1 | ) | | – | | | | |
| Africa mining | | 207 | | | 96 | | | 30 | | | | |
| North America copper mines | | 1,044 | | | 537 | | | 71 | | | | |
| South America mining | | 849 | | | 389 | | | 59 | | | | |
| Indonesia mining | | 927 | | | 427 | | | 57 | | | | |
| Molybdenum | | 325 | | | 190 | | | 12 | | | | |
| Rod & Refining | | 1,129 | | | 1,121 | | | 2 | | | | |
| Atlantic Copper Smelting & Refining | | 616 | | | 605 | | | 9 | | | | |
| Corporate, other & eliminations | | (1,233 | ) | | (1,313 | ) | | 9 | | | | |
| As reported in FCX’s consolidated financial statements | $ | 3,864 | | $ | 2,052 | | $ | 249 | | | | |
| a. | Net of cobalt downstream processing and freight costs. |
Africa Mining Product Revenues and Production Costs (continued)
| Six Months Ended June 30, 2010 | | | | | | | | |
| | By-Product | | Co-Product Method | |
| (In millions) | Method | | Copper | | Cobalt | | Total | |
| Revenues, excluding adjustments | $ | 377 | | $ | 377 | | $ | 87 | | $ | 464 | |
| | | | | | | | | | | | | |
| Site production and delivery, before net noncash | | | | | | | | | | | | |
| and other costs shown below | | 160 | | | 151 | | | 40 | | | 191 | |
| Cobalt credits | | (56 | )a | | – | | | – | | | – | |
| Royalty on metals | | 8 | | | 7 | | | 1 | | | 8 | |
| Net cash costs | | 112 | | | 158 | | | 41 | | | 199 | |
| Depreciation, depletion and amortization | | 60 | | | 49 | | | 11 | | | 60 | |
| Noncash and other costs, net | | 4 | | | 3 | | | 1 | | | 4 | |
| Total costs | | 176 | | | 210 | | | 53 | | | 263 | |
| Revenue adjustments, primarily for pricing on prior | | | | | | | | | | | | |
| period open sales | | – | | | – | | | – | | | – | |
| Other non-inventoriable costs | | (12 | ) | | (10 | ) | | (2 | ) | | (12 | ) |
| Gross profit | $ | 189 | | $ | 157 | | $ | 32 | | $ | 189 | |
| | | | | | | | | | | | | |
| Reconciliation to Amounts Reported | | | | | | | | | | | | |
| (In millions) | | | | | | Depreciation, | | | | |
| | | | | Production | | Depletion and | | | | |
| | Revenues | | and Delivery | | Amortization | | | | |
| Totals presented above | $ | 464 | | $ | 191 | | $ | 60 | | | | |
| Net noncash and other costs per above | | N/A | | | 4 | | | N/A | | | | |
| Royalty on metals per above | | (8 | ) | | N/A | | | N/A | | | | |
| Revenue adjustments, primarily for pricing on prior | | | | | | | | | | | | |
| period open sales per above | | – | | | N/A | | | N/A | | | | |
| Other non-inventoriable costs per above | | N/A | | | 12 | | | N/A | | | | |
| Eliminations and other | | – | | | (1 | ) | | – | | | | |
| Africa mining | | 456 | | | 206 | | | 60 | | | | |
| North America copper mines | | 2,098 | | | 1,001 | | | 153 | | | | |
| South America mining | | 1,918 | | | 765 | | | 120 | | | | |
| Indonesia mining | | 2,386 | | | 902 | | | 120 | | | | |
| Molybdenum | | 600 | | | 375 | | | 25 | | | | |
| Rod & Refining | | 2,202 | | | 2,188 | | | 4 | | | | |
| Atlantic Copper Smelting & Refining | | 1,249 | | | 1,233 | | | 19 | | | | |
| Corporate, other & eliminations | | (2,682 | ) | | (2,700 | ) | | 19 | | | | |
| As reported in FCX’s consolidated financial statements | $ | 8,227 | | $ | 3,970 | | $ | 520 | | | | |
| a. | Net of cobalt downstream processing and freight costs. |
Henderson Molybdenum Mine Product Revenues and Production Costs
| | Three Months Ended June 30, | | | | |
| (In millions) | 2010 | | 2009a | | | | |
| Revenues, excluding adjustments | $ | 177 | | $ | 62 | | | | |
| | | | | | | | | | |
| Site production and delivery, before net noncash | | | | | | | | | |
| and other costs shown below | | 48 | | | 34 | | | | |
| Treatment charges and other | | 11 | | | 7 | | | | |
| Net cash costs | | 59 | | | 41 | | | | |
| Depreciation, depletion and amortization | | 8 | | | 6 | | | | |
| Noncash and other costs, net | | – | | | – | | | | |
| Total costs | | 67 | | | 47 | | | | |
Gross profitb | $ | 110 | | $ | 15 | | | | |
| | | | | | | | | | |
Reconciliation to Amounts Reported | | | | Production | | Depreciation, | |
| (In millions) | | | | and | | Depletion and | |
| | | Revenues | | Delivery | | Amortization | |
| Three Months Ended June 30, 2010 | | | | | | | | | |
| Totals presented above | $ | 177 | | $ | 48 | | $ | 8 | |
| Treatment charges and other per above | | (11 | ) | | N/A | | | N/A | |
| Net noncash and other costs per above | | N/A | | | – | | | N/A | |
| Henderson mine | | 166 | | | 48 | | | 8 | |
Other molybdenum operations and eliminationsc | | 159 | | | 142 | | | 4 | |
| Molybdenum | | 325 | | | 190 | | | 12 | |
| North America copper mines | | 1,044 | | | 537 | | | 71 | |
| South America mining | | 849 | | | 389 | | | 59 | |
| Indonesia mining | | 927 | | | 427 | | | 57 | |
| Africa mining | | 207 | | | 96 | | | 30 | |
| Rod & Refining | | 1,129 | | | 1,121 | | | 2 | |
| Atlantic Copper Smelting & Refining | | 616 | | | 605 | | | 9 | |
| Corporate, other & eliminations | | (1,233 | ) | | (1,313 | ) | | 9 | |
| As reported in FCX’s consolidated financial statements | $ | 3,864 | | $ | 2,052 | | $ | 249 | |
| | | | | | | | | | |
| Three Months Ended June 30, 2009 | | | | | | | | | |
| Totals presented above | $ | 62 | | $ | 34 | | $ | 6 | |
| Treatment charges and other per above | | (7 | ) | | N/A | | | N/A | |
| Net noncash and other costs per above | | N/A | | | – | | | N/A | |
| Henderson mine | | 55 | | | 34 | | | 6 | |
Other molybdenum operations and eliminationsc | | 131 | | | 128 | | | 7 | |
| Molybdenum | | 186 | | | 162 | | | 13 | |
| North America copper mines | | 703 | | | 461 | | | 64 | |
| South America mining | | 884 | | | 366 | | | 69 | |
| Indonesia mining | | 1,610 | | | 415 | | | 78 | |
| Africa mining | | 57 | | | 92 | | | 14 | |
| Rod & Refining | | 747 | | | 743 | | | 2 | |
| Atlantic Copper Smelting & Refining | | 415 | | | 419 | | | 9 | |
| Corporate, other & eliminations | | (918 | ) | | (849 | ) | | 7 | |
| As reported in FCX’s consolidated financial statements | $ | 3,684 | | $ | 1,809 | | $ | 256 | |
| a. | Revenues and costs were adjusted to include freight and downstream conversion costs in net cash costs; gross profit was not affected by these adjustments. |
b. | Gross profit reflects sales of Henderson products based on volumes produced at market-based pricing. On a consolidated basis, the Molybdenum segment includes profits on sales as they are made to third parties and realizations based on actual contract terms. As a result, the actual gross profit realized will differ from the amounts reported in this table. |
| c. | Primarily includes amounts associated with the molybdenum sales company, which includes sales of molybdenum produced as a by-product at our North and South America copper mines. |
Henderson Molybdenum Mine Product Revenues and Production Costs (continued)
| | Six Months Ended June 30, | | | | |
| (In millions) | 2010 | | 2009a | | | | |
| Revenues, excluding adjustments | $ | 316 | | $ | 139 | | | | |
| | | | | | | | | | |
| Site production and delivery, before net noncash | | | | | | | | | |
| and other costs shown below | | 90 | | | 71 | | | | |
| Treatment charges and other | | 21 | | | 14 | | | | |
| Net cash costs | | 111 | | | 85 | | | | |
| Depreciation, depletion and amortization | | 16 | | | 12 | | | | |
| Noncash and other costs, net | | 1 | | | – | | | | |
| Total costs | | 128 | | | 97 | | | | |
Gross profitb | $ | 188 | | $ | 42 | | | | |
| | | | | | | | | | |
Reconciliation to Amounts Reported | | | | Production | | Depreciation, | |
| (In millions) | | | | and | | Depletion and | |
| | | Revenues | | Delivery | | Amortization | |
| Six Months Ended June 30, 2010 | | | | | | | | | |
| Totals presented above | $ | 316 | | $ | 90 | | $ | 16 | |
| Treatment charges and other per above | | (21 | ) | | N/A | | | N/A | |
| Net noncash and other costs per above | | N/A | | | 1 | | | N/A | |
| Henderson mine | | 295 | | | 91 | | | 16 | |
Other molybdenum operations and eliminationsc | | 305 | | | 284 | | | 9 | |
| Molybdenum | | 600 | | | 375 | | | 25 | |
| North America copper mines | | 2,098 | | | 1,001 | | | 153 | |
| South America mining | | 1,918 | | | 765 | | | 120 | |
| Indonesia mining | | 2,386 | | | 902 | | | 120 | |
| Africa mining | | 456 | | | 206 | | | 60 | |
| Rod & Refining | | 2,202 | | | 2,188 | | | 4 | |
| Atlantic Copper Smelting & Refining | | 1,249 | | | 1,233 | | | 19 | |
| Corporate, other & eliminations | | (2,682 | ) | | (2,700 | ) | | 19 | |
| As reported in FCX’s consolidated financial statements | $ | 8,227 | | $ | 3,970 | | $ | 520 | |
| | | | | | | | | | |
| Six Months Ended June 30, 2009 | | | | | | | | | |
| Totals presented above | $ | 139 | | $ | 71 | | $ | 12 | |
| Treatment charges and other per above | | (14 | ) | | N/A | | | N/A | |
| Net noncash and other costs per above | | N/A | | | – | | | N/A | |
| Henderson mine | | 125 | | | 71 | | | 12 | |
Other molybdenum operations and eliminationsc | | 207 | | | 229 | d | | 10 | |
| Molybdenum | | 332 | | | 300 | | | 22 | |
| North America copper mines | | 1,321 | | | 1,014 | | | 139 | |
| South America mining | | 1,586 | | | 733 | | | 134 | |
| Indonesia mining | | 2,732 | | | 765 | | | 143 | |
| Africa mining | | 57 | | | 108 | | | 17 | |
| Rod & Refining | | 1,366 | | | 1,357 | | | 4 | |
| Atlantic Copper Smelting & Refining | | 707 | | | 712 | | | 17 | |
| Corporate, other & eliminations | | (1,815 | ) | | (1,599 | ) | | 12 | |
| As reported in FCX’s consolidated financial statements | $ | 6,286 | | $ | 3,390 | d | $ | 488 | |
| a. | Revenues and costs were adjusted to include freight and downstream conversion costs in net cash costs; gross profit was not affected by these adjustments. |
| b. | Gross profit reflects sales of Henderson products based on volumes produced at market-based pricing. On a consolidated basis, the Molybdenum segment includes profits on sales as they are made to third parties and realizations based on actual contract terms. As a result, the actual gross profit realized will differ from the amounts reported in this table. |
| c. | Primarily includes amounts associated with the molybdenum sales company, which includes sales of molybdenum produced as a by-product at our North and South America copper mines. |
| d. | Includes LCM molybdenum inventory adjustments totaling $19 million. |
CAUTIONARY STATEMENT
Our discussion and analysis contains forward-looking statements in which we discuss our expectations regarding future performance. Forward-looking statements are all statements other than statements of historical facts, such as those statements regarding anticipated production volumes, sales volumes, unit net cash costs, ore grades, milling rates, commodity prices, development and other capital expenditures, mine production and development plans, environmental liabilities, potential future dividend payments, reserve estimates, projected exploration efforts and results, operating cash flows, the impact of copper, gold, molybdenum and cobalt price changes, the impact of deferred intercompany profits on earnings, liquidity, other financial commitments and tax rates. The words “anticipates,” “may,” “can,” & #8220;plans,” “believes,” “estimates,” “expects,” “projects,” “intends,” “likely,” “will,” “should,” “to be” and any similar expressions and/or statements that are not historical facts, in each case as they relate to us or our management, are intended to identify those assertions as forward-looking statements.
In making any forward looking statements, the person making them believes that the expectations are based on reasonable assumptions. We caution readers that those statements are not guarantees of future performance, and our actual results may differ materially from those anticipated, projected or assumed in the forward-looking statements. Important factors that can cause our actual results to differ materially from those anticipated in the forward-looking statements include commodity prices, mine sequencing, production rates, industry risks, regulatory changes, political risks, the potential effects of the recent violence in Indonesia, potential outcomes of the contract review process and resolution of administrative disputes in the DRC, weather-related risks, labor relations, environmental risks, litigation results, currency translation risks and other factors described in more detail under the heading “Risk Factors” in our Form 10-K for the year ended December 31, 2009.
Investors are cautioned that many of the assumptions on which our forward-looking statements are based are likely to change after our forward-looking statements are made, including for example commodity prices, which we cannot control, and production volumes and costs, some aspects of which we may or may not be able to control. Further, during the quarter, we may make changes to our business plans that could or will affect our results for the quarter. We caution investors that we do not intend to update our forward-looking statements more frequently than quarterly, notwithstanding any changes in our assumptions, changes in our business plans, our actual experience, or other changes, and we undertake no obligation to update any forward-looking statements
Item 3. Quantitative and Qualitative Disclosures About Market Risk.
There have been no material changes in our market risks during the six months ended June 30, 2010. For additional information on market risks, refer to “Disclosures About Market Risks” included in Part II, Item 7A of our annual report on Form 10-K for the year ended December 31, 2009. For projected sensitivities of our operating cash flow to changes in commodity prices, refer to “Outlook” in Part I, Item 2 of this quarterly report on Form 10-Q; for projected sensitivities of our provisionally priced copper sales to changes in commodity prices refer to “Consolidated Results – Revenues” in Part I, Item 2 of this quarterly report on Form 10-Q.
Item 4. Controls and Procedures.
| (a) | Evaluation of disclosure controls and procedures. Our chief executive officer and chief financial officer, with the participation of management, have evaluated the effectiveness of our “disclosure controls and procedures” (as defined in Rules 13a-15(e) and 15(d)-15(e) under the Securities Exchange Act of 1934) as of the end of the period covered by this quarterly report on Form 10-Q. Based on their evaluation, they have concluded that our disclosure controls and procedures are effective as of the end of the period covered by this report. |
| (b) | Changes in internal control. There has been no change in our internal control over financial reporting that occurred during the quarter ended June 30, 2010, that has materially affected, or is reasonably likely to materially affect, our internal control over financial reporting. |
Environmental Proceedings
Gilt Edge Mine Site. On July 12, 2010, we received a letter from the United States (U.S.) Department of Justice, acting at the request of the U.S. Environmental Protection Agency, advising us that the U.S. is preparing to file suit in federal court against two of our wholly owned subsidiaries (Cyprus Mines Corporation and Cyprus Amax Minerals Company, Inc.) and several other parties for recovery of costs incurred or to be incurred by the U.S. in responding to the release or threatened release of hazardous substances at the Gilt Edge Mine Site in Lawrence County, South Dakota. The letter stated that the U.S. will assert that the Cyprus entities are jointly and severally liable with the other parties for all response costs incurred by the U.S. at this site under the Comprehensive Environmental Response, Compensation and Liability Act. The letter asserts that the U.S. has incurred approximately $91 million in response costs and will incur additional response costs in the future. We do not know whether the other parties could contribute materially to reimbursement of these response costs.
We have conducted a detailed investigation of this site and have concluded that the Cyprus entities were engaged only in a mineral exploration project and were not involved in the large-scale mining operation that left the site in its current condition. We believe there is a reasonable basis for apportioning the response costs based on historical records of activities at the site, so that under recent federal case law the liability of the Cyprus entities should be proportional to the actual harm done, rather than joint and several, as the government asserts. As a result, we intend to vigorously defend this matter if the government files suit.
There have been no material changes to our risk factors during the six months ended June 30, 2010. For additional information on risk factors, refer to “Risk Factors” included in Part I, Item 1A of our report on Form 10-K for the year ended December 31, 2009.
Item 2. Unregistered Sales of Equity Securities and Use of Proceeds.
| (c) | The following table sets forth information with respect to shares of FCX common stock purchased by us during the three months ended June 30, 2010: |
| | | | | | | | (c) Total Number of | | (d) Maximum Number |
| | | (a) Total Number | | (b) Average | | Shares Purchased as Part | | of Shares That May |
| | | of Shares | | Price Paid | | of Publicly Announced | | Yet Be Purchased Under |
| Period | | Purchaseda | | Per Share | | Plans or Programsb | | the Plans or Programsb |
| April 1-30, 2010 | | – | | $ | – | | – | | 23,685,500 |
| May 1-31, 2010 | | – | | $ | – | | – | | 23,685,500 |
| June 1-30, 2010 | | – | | $ | – | | – | | 23,685,500 |
| Total | | – | | $ | – | | – | | 23,685,500 |
| | | | | | | | | | |
| a. | Consists of shares repurchased under FCX’s applicable stock incentive plans, which were repurchased to satisfy tax obligations on restricted stock awards and to cover the cost of option exercises. |
| b. | On July 21, 2008, our Board of Directors approved an increase in our open-market share purchase program for up to 30 million shares. This program does not have an expiration date. |
The exhibits to this report are listed in the Exhibit Index beginning on Page E-1 hereof. FREEPORT-McMoRan COPPER & GOLD INC.
Pursuant to the requirements of the Securities Exchange Act of 1934, the registrant has duly caused this report to be signed on its behalf by the undersigned hereunto duly authorized.
FREEPORT-McMoRan COPPER & GOLD INC.
By: /s/ C. Donald Whitmire, Jr.
C. Donald Whitmire, Jr.
Vice President and
Controller – Financial Reporting
(authorized signatory and
Principal Accounting Officer)
Date: August 6, 2010
| FREEPORT-McMoRan COPPER & GOLD INC. |
|
| | | Filed | |
| Exhibit | | with this | Incorporated by Reference |
| | | | | |
| Composite Certificate of Incorporation of FCX. | X | | | |
| 3.2 | Amended and Restated By-Laws of FCX, as amended through February 2, 2010. | | 8-K | 001-11307-01 | 02/05/2010 |
| 10.1* | FCX Amended and Restated 2006 Stock Incentive Plan. | | 8-K | 001-11307-01 | 6/14/2010 |
| 10.2* | Form of Notice of Grant of Nonqualified Stock Options and Restricted Stock Units under the 2006 Stock Incentive Plan. | | 8-K | 001-11307-01 | 6/14/2010 |
| FCX 2004 Director Compensation Plan, as amended and restated. | X | | | |
| Letter from Ernst & Young LLP regarding unaudited interim financial statements. | X | | | |
| Certification of Principal Executive Officer pursuant to Rule 13a-14(a)/15d – 14(a). | X | | | |
| Certification of Principal Financial Officer pursuant to Rule 13a-14(a)/15d – 14(a). | X | | | |
| Certification of Principal Executive Officer pursuant to 18 U.S.C. Section 1350. | X | | | |
| Certification of Principal Financial Officer pursuant to 18 U.S.C Section 1350. | X | | | |
| 101.INS | XBRL Instance Document. | X | | | |
| 101.SCH | XBRL Taxonomy Extension Schema. | X | | | |
| 101.CAL | XBRL Taxonomy Extension Calculation Linkbase. | X | | | |
| 101.DEF | XBRL Taxonomy Extension Definition Linkbase. | X | | | |
| 101.LAB | XBRL Taxonomy Extension Label Linkbase. | X | | | |
| 101.PRE | XBRL Taxonomy Extension Presentation Linkbase. | X | | | |
* Indicates management contract or compensatory plan or arrangement.
E-1