The accompanying unaudited consolidated financial statements have been prepared in accordance with the instructions to Form 10-Q and do not include all information and disclosures required by generally accepted accounting principles (GAAP) in the United States (U.S.). Therefore, this information should be read in conjunction with Freeport-McMoRan Copper & Gold Inc.’s (FCX) consolidated financial statements and notes contained in its 2010 Annual Report on Form 10-K. The information furnished herein reflects all adjustments that are, in the opinion of management, necessary for a fair statement of the results for the interim periods reported. All such adjustments are, in the opinion of management, of a normal recurring nature. Operating results for the three-month period ended March 31, 2011, are not necessarily indicative of the results that may be expected for the year ending December 31, 2011.
In December 2010, FCX’s Board of Directors declared a two-for-one split of its common stock in the form of a stock dividend on issued and outstanding shares, with the additional shares issued on February 1, 2011, to common shareholders of record at the close of business on January 15, 2011. All references to shares of common stock and per share amounts have been retroactively adjusted to reflect the two-for-one stock split.
FCX’s basic net income per share of common stock was calculated by dividing net income attributable to common stock by the weighted-average shares of common stock outstanding during the period. Following is a reconciliation of net income and weighted-average shares of common stock outstanding for purposes of calculating diluted net income per share (in millions, except per share amounts):
Outstanding stock options with exercise prices greater than the average market price of FCX’s common stock during the period are excluded from the computation of diluted net income per share of common stock. Excluded amounts were less than 1 million stock options with a weighted-average exercise price of $57.86 per option for first-quarter 2011 and approximately 3 million stock options with a weighted-average exercise price of $44.10 per option for first-quarter 2010.
The components of net periodic benefit costs for pension and postretirement benefits follow (in millions):
FCX’s first-quarter 2011 income tax provision resulted from taxes on international operations ($846 million) and U.S. operations ($138 million). FCX’s first-quarter 2010 income tax provision resulted from taxes on international operations ($597 million) and U.S. operations ($81 million). FCX’s consolidated effective income tax rate is a function of the combined effective tax rates for the jurisdictions in which it operates and totaled 35 percent for first-quarter 2011 and 36 percent for first-quarter 2010. Variations in the relative proportions of jurisdictional income result in fluctuations to FCX’s consolidated effective income tax rate.
FCX entered into a new senior unsecured revolving credit facility on March 30, 2011, which replaced the existing revolving credit facilities that were scheduled to mature on March 19, 2012. During the first quarter of 2011, FCX recognized a loss on early extinguishment of debt totaling $7 million ($6 million to net income attributable to FCX common shareholders or $0.01 per diluted share) associated with the revolving credit facilities that were replaced by the new senior unsecured revolving credit facility. This revolving credit facility is available until March 30, 2016, in an aggregate principal amount of $1.5 billion, with $500 million available to PT Freeport Indonesia. At March 31, 2011, FCX had no borrowings and $43 million of letters of credit issued under the revolving credit facility, resulting in availability of approximately $1.5 billion, of which $957 million could be used for additional letters of credit.
Interest on the revolving credit facility is generally based on the London Interbank Offered Rate (LIBOR) plus 2.00 percent, subject to an increase or decrease in the interest rate margin based on the credit ratings assigned by Standard & Poor’s Rating Services and Moody’s Investors Service to FCX’s senior unsecured debt.
The obligations of FCX and PT Freeport Indonesia under the revolving credit facility are not guaranteed by any subsidiaries and are unsecured; however, FCX may at any time designate any subsidiary (other than PT Freeport Indonesia) as a subsidiary guarantor. The revolving credit facility and FCX’s senior notes contain certain restrictive covenants that vary among the instruments, but include limitations on the incurrence of debt, liens and certain asset sales.
On February 24, 2011, FCX announced its intent to redeem the remaining $1.1 billion of its outstanding 8.25% Senior Notes due 2015. On March 30, 2011, FCX transferred funds totaling $1.2 billion to a restricted cash account to pay the holders of the 8.25% Senior Notes (principal and premium amounts together with accrued and unpaid interest). On April 1, 2011, holders of these senior notes received 104.125 percent of the principal amount together with accrued and unpaid interest. As a result of this redemption, FCX expects to record a loss on early extinguishment of debt totaling $56 million ($49 million to net income attributable to FCX common stockholders) in the second quarter of 2011.
Consolidated interest expense (before capitalization) totaled $123 million in first-quarter 2011 and $151 million in first-quarter 2010. Capitalized interest totaled $25 million in first-quarter 2011 and $6 million in first-quarter 2010.
On March 31, 2011, FCX declared a quarterly dividend of $0.25 per share, which was paid on May 1, 2011, to common shareholders of record at the close of business on April 15, 2011.
During the first quarter of 2010, FCX purchased in the open market $133 million of its 8.25% Senior Notes for $145 million and $136 million of its 8.375% Senior Notes for $148 million. These open-market purchases resulted in losses on early extinguishment of debt totaling $27 million ($23 million to net income attributable to FCX common shareholders or $0.02 per diluted share).
On May 1, 2010, the outstanding shares of FCX’s 6¾% Mandatory Convertible Preferred Stock were automatically converted into shares of FCX common stock (refer to Note 11 in FCX’s 2010 Annual Report on Form 10-K for further discussion).
Total comprehensive income attributable to FCX common stockholders totaled $1,504 million in first-quarter 2011 and $948 million in first-quarter 2010.
FCX does not purchase, hold or sell derivative financial instruments unless there are risks associated with an existing asset or obligation or if it anticipates a future activity that is likely to occur and will result in exposure to market risks and FCX intends to offset or mitigate such risks. FCX does not enter into any derivative financial instruments for speculative purposes, but has entered into derivative financial instruments in limited instances to achieve specific objectives. These objectives principally relate to managing risks associated with commodity price, foreign currency and interest rate risks. The fair values of FCX’s derivative financial instruments are based on widely published market prices.
A summary of gains (losses) recognized in revenues for derivative financial instruments related to commodity contracts that are designated and qualify as fair value hedge transactions, along with the unrealized gains (losses) on the related hedged item (firm sales commitments) follows (in millions):
A summary of the realized and unrealized gains (losses) recognized in income before income taxes and equity in affiliated companies’ net earnings for commodity contracts that do not qualify as hedge transactions, including embedded derivatives, follows (in millions):
A summary of the fair values of unsettled derivative financial instruments recorded on the consolidated balance sheets follows (in millions):
Fair value accounting guidance includes a fair value hierarchy that prioritizes the inputs to valuation techniques used to measure fair value. The hierarchy gives the highest priority to unadjusted quoted prices in active markets for identical assets or liabilities (Level 1 inputs) and the lowest priority to unobservable inputs (Level 3 inputs). FCX did not have any significant transfers in or out of Levels 1, 2, or 3 for first-quarter 2011.
A summary of FCX’s financial assets and liabilities measured at fair value on a recurring basis follows (in millions):
Money market funds, time deposits and U.S. government treasury funds are classified within Level 1 of the fair value hierarchy because they are valued using quoted market prices in active markets.
Fixed income securities (government and agency securities, corporate bonds, asset-backed securities and U.S. core fixed income funds) are valued using a bid evaluation or a mid evaluation. A bid evaluation is an estimated price at which a dealer would pay for a security. A mid evaluation is the average of the estimated price at which a dealer would sell a security and the estimated price at which a dealer would pay for a security. These evaluations are based on quoted prices, if available, or models that use observable inputs and, as such, are classified within Level 2 of the fair value hierarchy.
Equity securities are valued at the closing price reported on the active market on which the individual securities are traded and as such are classified within Level 1 of the fair value hierarchy.
FCX’s embedded derivatives on provisional copper concentrate, copper cathode and gold purchases and sales are valued using quoted market prices based on the forward LME or COMEX prices (copper) and the London Bullion Market Association price (gold) and, as such, are classified within Level 1 of the fair value hierarchy. FCX’s embedded derivatives on provisional molybdenum purchases are valued based on the latest average weekly
FCX’s derivative financial instruments for copper futures and swap contracts and forward contracts are classified within Level 1 of the fair value hierarchy because they are valued using quoted market prices in active markets (refer to Note 7 for further discussion).
The techniques described above may produce a fair value calculation that may not be indicative of net realizable value or reflective of future fair values. Furthermore, while FCX believes its valuation techniques are appropriate and consistent with other market participants, the use of different techniques or assumptions to determine fair value of certain financial instruments could result in a different fair value measured at the reporting date. There have been no changes in the techniques used at March 31, 2011.
In October 2010, the government of the DRC announced the conclusion of the review of Tenke Fungurume Mining S.A.R.L.’s (TFM) contracts, and confirmed that TFM’s existing mining contracts are in good standing and acknowledged the rights and benefits granted under those contracts. In connection with the review, TFM made several commitments that have been reflected in amendments to its mining contracts, which were signed by the parties in December 2010. In March 2011, the amendments were approved by a ministerial council, and a Presidential Decree signed by the President and Prime Minister of the DRC was issued in April 2011. After giving effect to the modifications that will be made to TFM’s bylaws to reflect the agreement of the parties, FCX’s effective ownership percentage in the project will be 56.0 percent prospectively, compared to its current ownership interest of 57.75 percent.
On April 20, 2011, FCX’s Board of Directors declared a supplemental common stock dividend of $0.50 per share to be paid on June 1, 2011, to common shareholders of record at the close of business on May 15, 2011.
FCX evaluated events after March 31, 2011, and through the date the consolidated financial statements were issued, and determined any events or transactions occurring during this period that would require recognition or disclosure are appropriately addressed in these consolidated financial statements.
FCX has organized its operations into five primary divisions – North America copper mines, South America mining, Indonesia mining, Africa mining and Molybdenum operations. Notwithstanding this structure, FCX internally reports information on a mine-by-mine basis. Therefore, FCX concluded that its operating segments include individual mines. Operating segments that meet certain thresholds are reportable segments.
REPORT OF INDEPENDENT REGISTERED PUBLIC ACCOUNTING FIRM
TO THE BOARD OF DIRECTORS AND STOCKHOLDERS OF
FREEPORT-McMoRan COPPER & GOLD INC.
We have reviewed the condensed consolidated balance sheet of Freeport-McMoRan Copper & Gold Inc. as of March 31, 2011, and the related consolidated statements of income and cash flows for the three-month periods ended March 31, 2011 and 2010, and the consolidated statement of equity for the three-month period ended March 31, 2011. These financial statements are the responsibility of the Company’s management.
We conducted our review in accordance with the standards of the Public Company Accounting Oversight Board (United States). A review of interim financial information consists principally of applying analytical procedures and making inquiries of persons responsible for financial and accounting matters. It is substantially less in scope than an audit conducted in accordance with the standards of the Public Company Accounting Oversight Board, the objective of which is the expression of an opinion regarding the financial statements taken as a whole. Accordingly, we do not express such an opinion.
Based on our review, we are not aware of any material modifications that should be made to the condensed consolidated financial statements referred to above for them to be in conformity with U.S. generally accepted accounting principles.
We have previously audited, in accordance with the standards of the Public Company Accounting Oversight Board (United States), the consolidated balance sheet of Freeport-McMoRan Copper & Gold Inc. as of December 31, 2010, and the related consolidated statements of operations, cash flows, and equity for the year then ended (not presented herein), and in our report dated February 25, 2011, we expressed an unqualified opinion on those consolidated financial statements. In our opinion, the information set forth in the accompanying condensed consolidated balance sheet as of December 31, 2010, is fairly stated, in all material respects, in relation to the consolidated balance sheet from which it has been derived.
ERNST & YOUNG LLP
Phoenix, Arizona
May 6, 2011
Item 2. Management's Discussion and Analysis of Financial Condition and Results of Operations.
OVERVIEW
In Management’s Discussion and Analysis of Financial Condition and Results of Operations, “we,” “us” and “our” refer to Freeport-McMoRan Copper & Gold Inc. (FCX) and its consolidated subsidiaries. You should read this discussion in conjunction with our financial statements, the related Management’s Discussion and Analysis of Financial Condition and Results of Operations and the discussion of our Business and Properties in our Annual Report on Form 10-K for the year ended December 31, 2010, filed with the United States (U.S.) Securities and Exchange Commission (SEC). The results of operations reported and summarized below are not necessarily indicative of future operating results. References to “Notes” are Notes included in our Notes to Consolidated Financial Statements. Throughout Management's Discussion and Analysis of Financial Condition and Results of Operations all references to earnings or losses per share are on a diluted basis, unless otherwise noted, and have been retroactively adjusted to reflect the February 1, 2011, two-for-one stock split.
We are one of the world’s largest copper, gold and molybdenum mining companies in terms of reserves and production. Our portfolio of assets includes the Grasberg minerals district in Indonesia, significant mining operations in North and South America, and the Tenke Fungurume (Tenke) minerals district in the Democratic Republic of Congo (DRC). The Grasberg minerals district contains the largest single recoverable copper reserve and the largest single gold reserve of any mine in the world based on the latest available reserve data provided by third-party industry consultants. We also operate Atlantic Copper, our wholly owned copper smelting and refining unit in Spain.
Our results for first-quarter 2011, compared with first-quarter 2010, primarily reflected higher realized copper and gold prices, partly offset by lower copper sales volumes. Refer to “Consolidated Results” for further discussion of our consolidated financial results for the first quarters of 2011 and 2010.
At March 31, 2011, we had $4.1 billion in consolidated cash and cash equivalents and $4.8 billion in total debt. On April 1, 2011, we redeemed the remaining $1.1 billion of the outstanding 8.25% Senior Notes (refer to Note 6 for further discussion). After taking into account the April 1, 2011, redemption, which was funded with restricted cash, total debt approximated $3.7 billion. We have no significant debt maturities in the near term; however, we may consider additional opportunities to prepay debt in advance of scheduled maturities. Refer to “Capital Resources and Liquidity – Financing Activities” for further discussion.
In December 2010, our Board of Directors (the Board) authorized a two-for-one common stock split effected on February 1, 2011 (refer to Note 1 for further discussion). All references to our common stock, per share amounts and dividends on common stock herein have been retroactively adjusted to reflect the two-for-one stock split. Refer to “Capital Resources and Liquidity – Financing Activities” for further discussion of common stock dividends.
In December 2010, the Board declared a $0.50 per share supplemental common stock dividend that was paid on December 30, 2010. In April 2011, the Board declared an additional $0.50 per share supplemental common stock dividend to be paid on June 1, 2011, to shareholders of record on May 15, 2011.
In October 2010, the government of the DRC announced the conclusion of the review of Tenke Fungurume Mining S.A.R.L.’s (TFM) contracts, and confirmed that TFM’s existing mining contracts are in good standing and acknowledged the rights and benefits granted under those contracts. In connection with the review, TFM made several commitments that have been reflected in amendments to its mining contracts, which were signed by the parties in December 2010 (refer to Note 14 in our Annual Report on Form 10-K for the year ended December 31, 2010, for further discussion). In March 2011, the amendments were approved by a ministerial council, and a Presidential Decree signed by the President and Prime Minister of the DRC was issued in April 2011. After giving effect to the modifications that will be made to TFM’s bylaws to reflect the agreement of the parties, our effective ownership interest in the project will be 56.0 percent prospectively, compared to our current ownership interest of 57.75 percent.
OUTLOOK
We view the long-term outlook for our business positively, supported by limitations on supplies of copper and by the requirements for copper in the world’s economy.
Our financial results can vary significantly as a result of fluctuations in the market prices of copper and, to a lesser extent, gold and molybdenum. World market prices for these commodities have fluctuated historically and are affected by numerous factors beyond our control. Because we cannot control the price of our products, the key measures that management focuses on in operating our business are sales volumes, unit net cash costs and operating cash flow. Discussion of the outlook for each of these measures follows.
Sales Volumes. Our projected sales volumes depend on the achievement of targeted mining rates, the successful operation of production facilities, the impact of weather conditions and other factors. Consolidated sales from mines for the year 2011 are expected to approximate 3.9 billion pounds of copper, 1.6 million ounces of gold and 73 million pounds of molybdenum, including 965 million pounds of copper, 365 thousand ounces of gold and 17 million pounds of molybdenum for second-quarter 2011.
Unit Net Cash Costs. Quarterly unit net cash costs vary with fluctuations in sales volumes. Quarterly unit net cash costs for the remainder of 2011 are expected to be higher than first-quarter 2011 consolidated unit net cash costs of $0.79 per pound. Assuming average prices of $1,400 per ounce of gold and $15 per pound of molybdenum for the remainder of 2011, and achievement of current 2011 sales volumes and cost estimates, we estimate our consolidated unit net cash costs (net of by-product credits) for our copper mining operations would average approximately $1.04 per pound of copper for the year 2011. The impact of price changes on consolidated unit net cash costs would approximate $0.02 per pound for each $50 per ounce change in the average price of gold for the remainder of 2011, and $0.02 per pound for each $2 per pound change in the average price of molybdenum for the remainder of 2011. Refer to “Consolidated Results – Production and Delivery Costs” for further discussion of consolidated production and delivery costs.
Operating Cash Flows. Our operating cash flows vary with prices realized from copper, gold and molybdenum sales, our sales volumes, production costs, income taxes and other working capital changes and other factors. Based on projected consolidated sales volumes and unit net cash costs for 2011, and assuming average prices of $4.25 per pound of copper, $1,400 per ounce of gold and $15 per pound of molybdenum for the remainder of 2011, we estimate consolidated operating cash flows will approximate $8.3 billion for the year 2011, net of an estimated $60 million for working capital requirements. Our estimate of operating cash flows for the year 2011 also reflect estimated taxes of $3.9 billion (refer to “Consolidated Results – Provision for Income Taxes” for further discussion of our projected annual consolidated effective annual tax rate for 2011). The impact of price changes for the remainder of 2011 on operating cash flows would approximate $125 million for each $0.05 per pound change in the average price of copper, $50 million for each $50 per ounce change in the average price of gold and $60 million for each $2 per pound change in the average price of molybdenum.
COPPER, GOLD AND MOLYBDENUM MARKETS
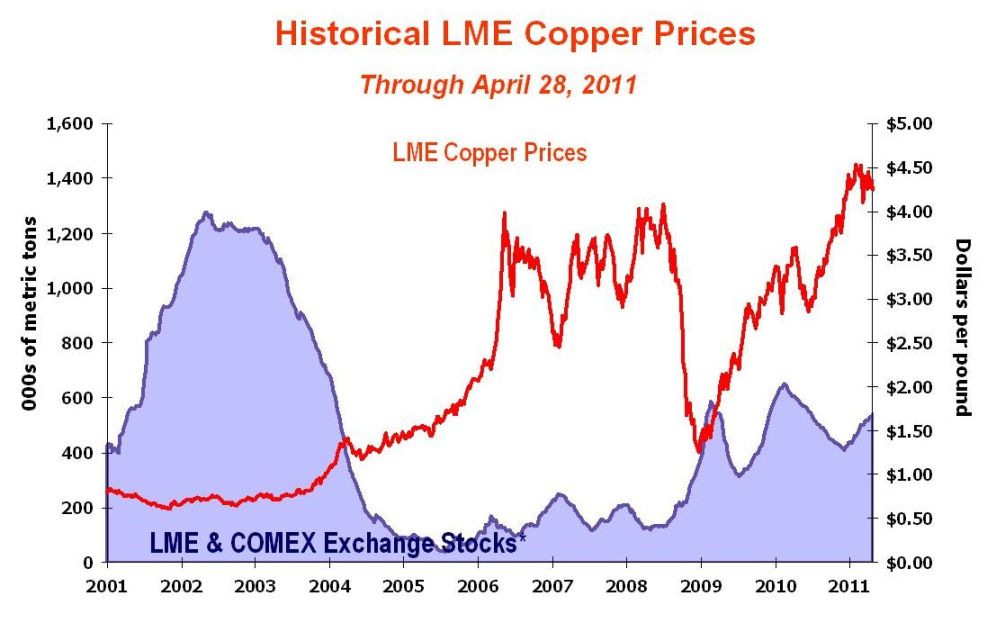
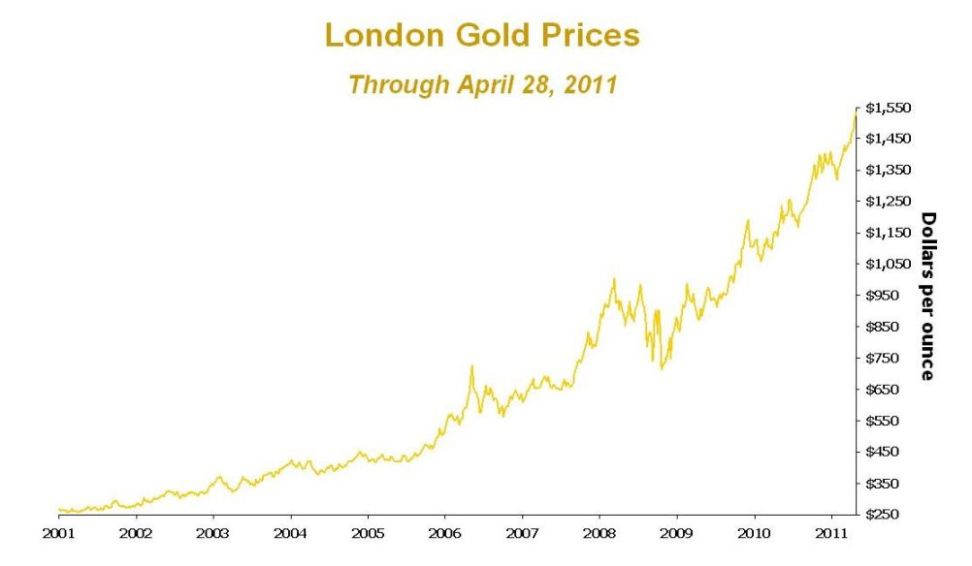
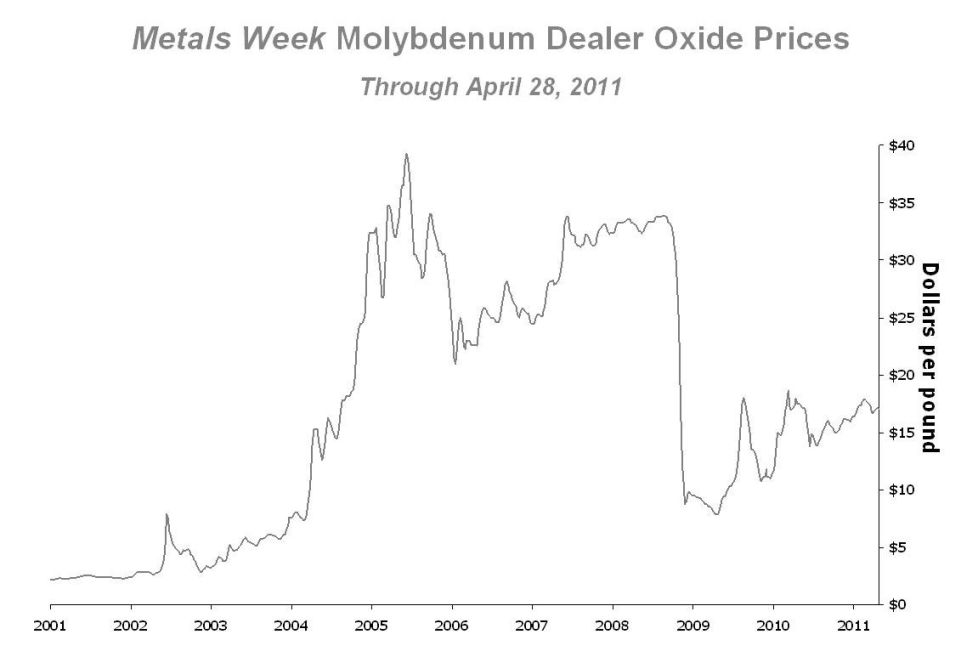
World prices for copper, gold and molybdenum can fluctuate significantly. During the period from January 2001 through April 2011, the London Metal Exchange (LME) spot copper price varied from a low of $0.60 per pound in 2001 to a record high of $4.60 per pound in February 2011, the London gold price fluctuated from a low of $256 per ounce in 2001 to a record high of $1,536 per ounce in April 2011, and the Metals Week Molybdenum Dealer Oxide weekly average price ranged from a low of $2.19 per pound in 2001 to a high of $39.25 per pound in 2005. Copper, gold and molybdenum prices are affected by numerous factors beyond our control as described further in our “Risk Factors” contained in Part I, Item 1A of our Annual Report on Form 10-K for the year ended December 31, 2010.
* Excludes Shanghai stocks, producer, consumer and merchant stocks.
This graph presents LME spot copper prices and reported stocks of copper at the LME and the New York Mercantile Exchange (COMEX) from January 2001 through April 2011. From 2006 through most of 2008, limited supplies, combined with growing demand from China and other emerging economies resulted in high copper prices and low levels of inventories. In late 2008, slowing consumption, turmoil in the U.S. financial markets and concerns about the global economy led to a sharp decline in copper prices, which reached a four-year low of $1.26 per pound in December 2008. Copper prices have since improved significantly, attributable to a combination of an improved global economic outlook, strong demand from emerging markets, recovering demand in the western world and limitations of available supply. During first-quarter 2011, LME spot copper prices ranged from $4.07 per pound to a record high of $4.60 per pound and averaged $4.38 per pound. Combined LME and COMEX inventories have risen somewhat in 2011, compared to year-end 2010 levels, as a result of reduced Chinese imports.
We believe the underlying fundamentals of the copper business remain positive, supported by limited supplies from existing mines and the absence of significant new development projects. Future copper prices are expected to be volatile and are likely to be influenced by demand from China, economic activity in the U.S. and other industrialized countries, the timing of the development of new supplies of copper and production levels of mines and copper smelters. The LME spot copper price closed at $4.25 per pound on April 28, 2011.
This graph presents London gold prices from January 2001 through April 2011. Gold prices reached a record high of $1,536 per ounce in April 2011, supported by investment demand and weakness in the U.S. dollar. During first-quarter 2011, gold prices ranged from approximately $1,319 per ounce to $1,447 per ounce and averaged $1,386 per ounce. London gold prices closed at approximately $1,536 per ounce on April 28, 2011.
This graph presents the Metals Week Molybdenum Dealer Oxide weekly average prices from January 2001 through April 2011. In late 2008, molybdenum prices declined significantly as a result of the financial market turmoil and a decline in demand; however, molybdenum prices have since increased, which we believe is supported by improved economic conditions and increased demand in the chemical and metallurgical sectors. During first-quarter 2011, the weekly average price of molybdenum ranged from $16.40 per pound to $17.88 per pound and averaged $17.24 per pound. The weekly average Metals Week Molybdenum Dealer Oxide weekly average price was $17.03 per pound on April 28, 2011.
CONSOLIDATED RESULTS
| | Three Months Ended March 31, | |
| | 2011 | | 2010 | |
Financial Data (in millions, except per share amounts) | | | | | | |
Revenuesa,b | $ | 5,709 | | $ | 4,363 | |
Operating incomeb | $ | 2,936 | | $ | 2,048 | |
| Net income attributable to FCX common stockholders | $ | 1,499 | c | $ | 897 | d |
| Diluted net income per share attributable to FCX common stockholders | $ | 1.57 | c | $ | 1.00 | d,e |
| Diluted weighted-average common shares outstanding | | 955 | | | 947 | e |
| | | | | | | |
| Mining Operating Data | | | | | | |
Copper (recoverable) | | | | | | |
| Production (millions of pounds) | | 950 | | | 929 | |
| Sales, excluding purchases (millions of pounds) | | 926 | | | 960 | |
| Average realized price per pound | $ | 4.31 | | $ | 3.42 | |
Site production and delivery costs per poundf | $ | 1.61 | | $ | 1.35 | |
Unit net cash costs per poundf | $ | 0.79 | | $ | 0.82 | |
Gold (recoverable) | | | | | | |
| Production (thousands of ounces) | | 466 | | | 449 | |
| Sales, excluding purchases (thousands of ounces) | | 480 | | | 478 | |
| Average realized price per ounce | $ | 1,399 | | $ | 1,110 | |
Molybdenum (recoverable) | | | | | | |
| Production (millions of pounds) | | 20 | | | 17 | |
| Sales, excluding purchases (millions of pounds) | | 20 | | | 17 | |
| Average realized price per pound | $ | 18.10 | | $ | 15.09 | |
| a. | Includes the impact of adjustments to provisionally priced concentrate and cathode sales recognized in the prior years (refer to “Revenues” for further discussion). |
| b. | Following is a summary of revenues and operating income (loss) by division (in millions): |
| | Three Months Ended March 31, 2011 | | Three Months Ended March 31, 2010 | |
| | | | | | Operating | | | | | | Operating | |
| | | | | | Income | | | | | | Income | |
| | | Revenues | | | (Loss) | | | Revenues | | | (Loss) | |
| North America copper mines | $ | 1,348 | | $ | 714 | | $ | 1,054 | | $ | 508 | |
| South America mining | | 1,402 | | | 932 | | | 1,069 | | | 632 | |
| Indonesia mining | | 1,730 | | | 1,104 | | | 1,459 | | | 892 | |
| Africa mining | | 309 | | | 155 | | | 249 | | | 109 | |
| Molybdenum | | 374 | | | 115 | | | 275 | | | 73 | |
| Rod & Refining | | 1,487 | | | 4 | | | 1,073 | | | 4 | |
| Atlantic Copper Smelting & Refining | | 762 | | | (19 | ) | | 633 | | | (11 | ) |
| Corporate, other & eliminations | | (1,703 | ) | | (69 | ) | | (1,449 | ) | | (159 | ) |
| Total FCX | $ | 5,709 | | $ | 2,936 | | $ | 4,363 | | $ | 2,048 | |
Refer to Note 11 for further discussion of our operating divisions and business segments.
| c. | Includes losses on early extinguishment of debt totaling $6 million ($0.01 per share) associated with the revolving credit facilities that were replaced in March 2011 (refer to Note 6 for further discussion). |
| d. | Includes losses on early extinguishment of debt totaling $23 million ($0.02 per share) associated with open-market purchases of our 8.25% and 8.375% Senior Notes (refer to Note 6 for further discussion). |
| e. | Amounts have been adjusted to reflect the February 1, 2011, two-for-one stock split. |
| f. | Reflects per pound weighted-average production and delivery costs and unit net cash costs (net of by-product credits) for all copper mines, excluding net noncash and other costs. For reconciliations of the per pound costs by operating division to production and delivery costs applicable to sales reported in our consolidated financial statements, refer to “Operations – Unit Net Cash Costs” and to “Product Revenues and Production Costs.” |
Revenues
Consolidated revenues, which totaled $5.7 billion in first-quarter 2011 and $4.4 billion in first-quarter 2010, include the sale of copper concentrates, copper cathodes, copper rod, gold, molybdenum and other metals by our North and South America mines, the sale of copper concentrates (which also contain significant quantities of gold and silver) by our Indonesia mining operations, the sale of copper cathodes and cobalt hydroxide by our Africa mining operations, the sale of molybdenum in various forms by our Molybdenum operations, and the sale of copper cathodes, copper anodes, and gold in anodes and slimes by Atlantic Copper.
Following is a summary of changes in our consolidated revenues between periods (in millions):
| First-quarter 2010 consolidated revenues | $ | 4,363 | |
| Higher price realizations from mining operations: | | | |
| Copper | | 824 | |
| Gold | | 139 | |
| Molybdenum | | 59 | |
| (Lower) higher sales volumes from mining operations: | | | |
| Copper | | (117 | ) |
| Gold | | 2 | |
| Molybdenum | | 44 | |
| Cobalt | | 28 | |
| Lower net adjustments primarily for prior year provisionally priced sales | | (22 | ) |
| Higher purchased copper | | 273 | |
| Higher Atlantic Copper revenues | | 129 | |
| Other, including intercompany eliminations | | (13 | ) |
| First-quarter 2011 consolidated revenues | $ | 5,709 | |
Price Realizations
Our consolidated revenues can vary significantly as a result of fluctuations in the market prices of copper and, to a lesser extent, gold and molybdenum. Consolidated revenues in first-quarter 2011 reflected higher price realizations, compared with first-quarter 2010. Realized copper prices averaged $4.31 per pound in first-quarter 2011, compared with $3.42 per pound in first-quarter 2010; realized gold prices averaged $1,399 per ounce in first-quarter 2011, compared with $1,110 per ounce in first-quarter 2010; and realized molybdenum prices averaged $18.10 per pound in first-quarter 2011, compared with $15.09 per pound in first-quarter 2010.
Sales Volumes
Consolidated sales volumes totaled 926 million pounds of copper, 480 thousand ounces of gold and 20 million pounds of molybdenum in first-quarter 2011, compared with 960 million pounds of copper, 478 thousand ounces of gold and 17 million pounds of molybdenum in first-quarter 2010. Lower copper sales volumes in first-quarter 2011 primarily related to timing of shipments in North America and Indonesia. Higher consolidated molybdenum sales volumes in first-quarter 2011 reflected improved demand in the chemical and metallurgical sectors. Refer to “Operations” for further discussion of sales volumes at our operating divisions.
Provisionally Priced Sales
During first-quarter 2011, 57 percent of our mined copper was sold in concentrate, 22 percent as rod (from our North America operations) and 21 percent as cathodes. Substantially all of our copper concentrate and cathode sales contracts provide final copper pricing in a specified future period (generally one to four months from the shipment date) based primarily on quoted LME monthly average spot prices. We receive market prices based on prices in the specified future period, which results in price fluctuations recorded through revenues until the date of settlement. We record revenues and invoice customers at the time of shipment based on then-current LME prices, which results in an embedded derivative on our provisional priced concentrate and cathode sales that is adjusted to fair value through earnings each period, using the period-end forward prices, until the date of final pricing. To the extent final prices are higher or lower than what was recorded on a provisional basis, an increase or decrease to revenues is recorded each reporting period until the date of final pricing. Accordingly, in times of rising copper prices, our revenues benefit from higher prices received for contracts priced at current market rates and also from an increase related to the final pricing of provisionally priced sales pursuant to contracts entered into in prior periods; in times of falling copper prices, the opposite occurs.
At December 31, 2010, we had provisionally priced copper sales totaling 417 million pounds of copper at our copper mining operations (net of intercompany sales and noncontrolling interests) recorded at an average of $4.36 per pound. Adjustments to the December 31, 2010, provisionally priced copper sales resulted in a net decrease to consolidated revenues of $10 million ($4 million to net income attributable to FCX common stockholders or less than $0.01 per share) in first-quarter 2011. Adjustments to the December 31, 2009, provisionally priced copper sales resulted in a net decrease of $4 million ($2 million to net income attributable to FCX common stockholders or less than $0.01 per share) in first-quarter 2010.
At March 31, 2011, we had provisionally priced copper sales at our copper mining operations totaling 464 million pounds of copper (net of intercompany sales and noncontrolling interests) recorded at an average of $4.27 per pound, subject to final pricing over the next several months. We estimate that each $0.05 change in the price realized from the March 31, 2011, provisional price recorded would have a net impact on our 2011 consolidated revenues of approximately $31 million ($15 million to net income attributable to FCX common stockholders). The LME spot copper price closed at $4.25 per pound on April 28, 2011.
Purchased Copper
From time to time we purchase copper cathode to be processed by our Rod & Refining operations when production from our North America copper mines does not meet customer demand. Accordingly, the increase in purchased copper in first-quarter 2011, compared with first-quarter 2010, resulted from higher customer demand and prices.
Atlantic Copper Revenues
The increase in Atlantic Copper’s revenues in first-quarter 2011, compared with first-quarter 2010, primarily reflected higher copper revenues associated with higher prices. Refer to “Operations” for further discussion of Atlantic Copper Smelting & Refining.
Production and Delivery Costs
Consolidated production and delivery costs totaled $2.4 billion in first-quarter 2011, compared with $1.9 billion in first-quarter 2010. Higher production and delivery costs for first-quarter 2011 primarily reflected higher input costs at our mining operations and higher costs of concentrate purchases at Atlantic Copper associated with higher copper prices.
Consolidated unit site production and delivery costs for our copper mining operations averaged $1.61 per pound of copper in first-quarter 2011, compared with $1.35 per pound of copper in first-quarter 2010. Higher site production and delivery costs in first-quarter 2011 primarily reflected increased input costs, including materials, labor and energy. Refer to “Operations – Unit Net Cash Costs” for further discussion of unit net cash costs associated with our operating divisions, and to “Product Revenues and Production Costs” for reconciliations of per pound costs by operating division to production and delivery costs applicable to sales reported in our consolidated financial statements.
Our copper mining operations require significant energy, principally diesel, electricity, coal and natural gas. For the year 2011, we expect energy costs to approximate 22 percent of our consolidated copper production costs, which reflects purchases of approximately 250 million gallons of diesel fuel; 6,660 gigawatt hours of electricity at our North America, South America and Africa copper mining operations (we generate all of our power at our Indonesia mining operation); 735 thousand metric tons of coal for our coal power plant in Indonesia; and 1 million MMBTU (million british thermal units) of natural gas at certain of our North America mines. Energy costs for 2010 approximated 20 percent of our consolidated copper production costs.
Depreciation, Depletion and Amortization
Consolidated depreciation, depletion and amortization expense totaled $232 million in first-quarter 2011, compared with $271 million in first-quarter 2010. Lower depreciation, depletion and amortization expense in first-quarter 2011 primarily reflected lower expense under the units-of-production method as a result of lower copper sales volumes.
Selling, General and Administrative Expenses
Consolidated selling, general and administrative expenses increased to $114 million in first-quarter 2011, compared with $95 million in first-quarter 2010, primarily reflecting higher incentive compensation costs associated with improved operating results.
Exploration and Research Expenses
Consolidated exploration and research expenses totaled $50 million in first-quarter 2011, compared with $31 million in first-quarter 2010. We are conducting exploration activities near our existing mines with a focus on opportunities to expand reserves that will support additional future production capacity in the large mineral districts where we currently operate. Favorable exploration results indicate opportunities for significant future potential reserve additions in North and South America and in the Tenke minerals district. The drilling data in North America continues to indicate the potential for expanded sulfide production.
For the year 2011, exploration and research expenditures are expected to total $285 million, including approximately $225 million for exploration. Exploration activities will continue to focus primarily on the potential for future reserve additions in our existing mineral districts.
Interest Expense, Net
Consolidated interest expense (before capitalization) totaled $123 million in first-quarter 2011 and $151 million in first-quarter 2010. Lower interest expense in first-quarter 2011 primarily reflected the impact of debt repayments during 2010.
Capitalized interest is primarily related to our development projects and totaled $25 million in first-quarter 2011 and $6 million in first-quarter 2010. Refer to “Operations” for further discussion of current development projects.
Losses on Early Extinguishment of Debt
During first-quarter 2011, we recorded losses on early extinguishment of debt totaling $7 million ($6 million to net income attributable to FCX common stockholders or $0.01 per share) related to the revolving credit facilities that were replaced in March 2011 by a new senior unsecured revolving credit facility.
During first-quarter 2010, we recorded losses on early extinguishment of debt totaling $27 million ($23 million to net income attributable to FCX common stockholders or $0.02 per share) associated with open-market purchases of our 8.25% and 8.375% Senior Notes.
On April 1, 2011, we redeemed the remaining $1.1 billion of our outstanding 8.25% Senior Notes due 2015. In second-quarter 2011, we expect to record a loss on early extinguishment of debt of $56 million ($49 million to net income attributable to FCX common stockholders) in connection with this redemption.
Refer to Note 6 for further discussion of these transactions.
Provision for Income Taxes
Our first-quarter 2011 income tax provision resulted from taxes on international operations ($846 million) and U.S. operations ($138 million). Our first-quarter 2010 income tax provision resulted from taxes on international operations ($597 million) and U.S. operations ($81 million). A summary of the approximate amounts in the calculation of our consolidated provision for income taxes for the first quarters of 2011 and 2010 follow (in millions, except percentages):
| | | Three Months Ended March 31, 2011 | | Three Months Ended March 31, 2010 | |
| | | | | | | | Income Tax | | | | | | | Income Tax | |
| | | | | | Effective | | (Provision) | | Income | | | Effective | | (Provision) | |
| | | Incomea | | | Tax Rate | | Benefit | | (Loss)a | | | Tax Rate | | Benefit | |
| U.S. | | $ | 647 | | | 21% | | $ | (138 | ) | $ | 329 | | | 25% | | $ | (81 | ) |
| South America | | | 914 | | | 33% | | | (306 | ) | | 623 | | | 32% | | | (197 | ) |
| Indonesia | | | 1,161 | | | 44% | | | (507 | ) | | 909 | | | 43% | | | (393 | ) |
| Africa | | | 104 | | | 38% | | | (40 | ) | | 85 | | | 30% | | | (25 | ) |
| Eliminations and other | | | 15 | | | N/A | | | 7 | | | (58 | ) | | N/A | | | 18 | |
| Consolidated FCX | | $ | 2,841 | | | 35%b | | $ | (984 | ) | $ | 1,888 | | | 36%b | | $ | (678 | ) |
| a. | Represents income (loss) by geographic location before income taxes and equity in affiliated companies’ net earnings. |
| b. | Our consolidated effective income tax rate is a function of the combined effective tax rates for the jurisdictions in which we operate. Accordingly, variations in the relative proportions of jurisdictional income result in fluctuations to our consolidated effective income tax rate. Assuming average prices of $4.25 per pound for copper, $1,400 per ounce for gold and $15 per |
| | pound for molybdenum for the remainder of 2011 and current sales estimates, we estimate our annual consolidated effective tax rate will approximate 35 percent. |
OPERATIONS
North America Copper Mines
We currently operate seven copper mines in North America – Morenci, Bagdad, Safford, Sierrita and Miami in Arizona, and Tyrone and Chino in New Mexico. All of these mining operations are wholly owned, except for Morenci, an unincorporated joint venture, in which we own an 85 percent undivided interest.
The North America copper mines include open-pit mining, sulfide ore concentrating, leaching and solution extraction/electrowinning (SX/EW) operations. Molybdenum is also produced by Morenci, Bagdad and Sierrita. A majority of the copper produced at our North America copper mines is cast into copper rod by our Rod & Refining operations. The remainder of our North America copper sales is primarily in the form of copper cathode or copper concentrate.
Operating and Development Activities.
Morenci Mine Ramp-up and Mill Restart. In March 2011, we reached our targeted mining rate of 635,000 metric tons per day after commencing a staged ramp-up at the Morenci mine from the 2009 rate of 450,000 metric tons per day. In addition, in March 2010, we restarted the Morenci mill to process available sulfide material currently being mined. Mill throughput averaged 48,300 metric tons of ore per day in first-quarter 2011 and is expected to increase to approximately 50,000 metric tons per day by the second half of 2011. These activities are expected to enable copper production to increase by approximately 125 million pounds per year beginning in 2011.
During first-quarter 2011, we also commenced a feasibility study to add additional mining and milling capacity at Morenci to process additional sulfide ore identified through positive exploratory drilling over the last few years. This project, which would require significant investment, would increase milling rates to approximately 115,000 metric tons per day and target incremental annual copper production of 150 to 200 million pounds within a two to three year time frame. The study is expected to be completed in the second half of 2011.
Miami Restart. We initiated limited mining activities at the Miami mine to improve efficiencies of ongoing reclamation projects associated with historical mining operations at the site. During an approximate five-year mine life, we expect to ramp up production at Miami to approximately 100 million pounds of copper per year by 2012.
Chino Restart. We are restarting mining and milling activities at the Chino mine, which were suspended in late 2008. The ramp up of mining and milling activities will significantly increase copper production at Chino, which is currently producing small amounts of copper from existing leach stockpiles. The start-up is on schedule, with planned mining and milling rates expected to be achieved by the end of 2013. Incremental annual copper production is expected to be 100 million pounds in 2012 and 2013 and 200 million pounds in 2014. Costs for the project associated with equipment and mill refurbishment are expected to approximate $150 million.
Safford Sulphur Burner. We have completed construction of the $150 million sulphur burner project at the Safford mine, which will provide a more cost-effective source of sulphuric acid used in SX/EW operations and lower transportation costs.
Twin Buttes. In December 2009, we purchased the Twin Buttes copper mine, which ceased operations in 1994 and is adjacent to our Sierrita mine. The purchase provides significant synergies in the Sierrita minerals district, including the potential for expanded mining activities and access to material that can be used for Sierrita tailings and stockpile reclamation purposes. We are conducting drilling on the property and metallurgical studies to support a feasibility study expected to commence in late 2011.
Operating Data. Following is summary operating data for the North America copper mines for the first quarters of 2011 and 2010:
| | | Three Months Ended March 31, | |
| | | 2011 | | 2010 | |
| Operating Data, Net of Joint Venture Interest | | | | | | | |
Copper (millions of recoverable pounds) | | | | | | | |
| Production | | | 282 | | | 264 | |
| Sales, excluding purchases | | | 276 | | | 291 | |
| Average realized price per pound | | $ | 4.40 | | $ | 3.32 | |
| | | | | | | | |
Molybdenum (millions of recoverable pounds) | | | | | | | |
Productiona | | | 7 | | | 6 | |
| | | | | | | | |
| 100% Operating Data | | | | | | | |
| SX/EW operations | | | | | | | |
| Leach ore placed in stockpiles (metric tons per day) | | | 811,700 | | | 601,900 | |
| Average copper ore grade (percent) | | | 0.24 | | | 0.24 | |
| Copper production (millions of recoverable pounds) | | | 182 | | | 202 | |
| | | | | | | | |
| Mill operations | | | | | | | |
| Ore milled (metric tons per day) | | | 213,400 | | | 162,900 | |
| Average ore grade (percent): | | | | | | | |
| Copper | | | 0.36 | | | 0.30 | |
| Molybdenum | | | 0.03 | | | 0.02 | |
| Copper recovery rate (percent) | | | 81.8 | | | 85.7 | |
| Production (millions of recoverable pounds): | | | | | | | |
| Copper | | | 122 | | | 80 | |
| Molybdenum | | | 7 | | | 6 | |
| a. | Reflects molybdenum production from certain of our North America copper mines. Sales of molybdenum are reflected in the Molybdenum division. |
Copper production from our North America copper mines was higher in first-quarter 2011, compared with first-quarter 2010, primarily reflecting increased mining and milling activities at Morenci. However, copper sales volumes from our North America copper mines decreased to 276 million pounds in first-quarter 2011, compared with 291 million pounds in first-quarter 2010, primarily because of timing of shipments.
For the year 2011, copper sales volumes from our North America copper mines are expected to approximate 1.2 billion pounds, compared with 1.1 billion pounds of copper in 2010. The restart of the Miami and Chino mines and potential expansion of the Morenci mine are expected to further increase production in future periods. Molybdenum production from our North America copper mines is expected to approximate 34 million pounds for the year 2011.
Unit Net Cash Costs. Unit net cash costs per pound of copper is a measure intended to provide investors with information about the cash-generating capacity of our mining operations expressed on a basis relating to the primary metal product for our respective operations. We use this measure for the same purpose and for monitoring operating performance by our mining operations. This information differs from measures of performance determined in accordance with generally accepted accounting principles (GAAP) in the U.S. and should not be considered in isolation or as a substitute for measures of performance determined in accordance with U.S. GAAP. This measure is presented by other metals mining companies, although our measure may not be comparable to similarly titled measures reported by other companies.
Gross Profit per Pound of Copper and Molybdenum
The following table summarizes unit net cash costs and gross profit per pound at the North America copper mines for the first quarters of 2011 and 2010. Refer to “Product Revenues and Production Costs” for an explanation of the “by-product” and “co-product” methods and a reconciliation of unit net cash costs per pound to production and delivery costs applicable to sales reported in our consolidated financial statements.
| | Three Months Ended March 31, 2011 | | Three Months Ended March 31, 2010 | |
| | By- | | Co-Product Method | | By- | | Co-Product Method | |
| | Product | | | | | Molyb- | | Product | | | | | Molyb- | |
| | Method | | Copper | | denuma | | Method | | Copper | | denuma | |
| Revenues, excluding adjustments | $ | 4.40 | | $ | 4.40 | | $ | 16.87 | | $ | 3.32 | | $ | 3.32 | | $ | 13.93 | |
| | | | | | | | | | | | | | | | | | | |
| Site production and delivery, before net noncash | | | | | | | | | | | | | | | | | | |
| and other costs shown below | | 1.75 | | | 1.57 | | | 7.08 | | | 1.31 | | | 1.20 | | | 7.40 | |
By-product creditsa | | (0.49 | ) | | - | | | - | | | (0.26 | ) | | - | | | - | |
| Treatment charges | | 0.11 | | | 0.10 | | | - | | | 0.08 | | | 0.08 | | | - | |
| Unit net cash costs | | 1.37 | | | 1.67 | | | 7.08 | | | 1.13 | | | 1.28 | | | 7.40 | |
| Depreciation, depletion and amortization | | 0.20 | | | 0.19 | | | 0.43 | | | 0.27 | | | 0.25 | | | 0.63 | |
| Noncash and other costs, net | | 0.15 | | | 0.15 | | | 0.12 | | | 0.08 | | | 0.08 | | | 0.05 | |
| Total unit costs | | 1.72 | | | 2.01 | | | 7.63 | | | 1.48 | | | 1.61 | | | 8.08 | |
| Revenue adjustments | | - | | | - | | | - | | | - | | | - | | | - | |
| Idle facility and other non-inventoriable costs | | (0.03 | ) | | (0.03 | ) | | (0.02 | ) | | (0.06 | ) | | (0.06 | ) | | - | |
| Gross profit per pound | $ | 2.65 | | $ | 2.36 | | $ | 9.22 | | $ | 1.78 | | $ | 1.65 | | $ | 5.85 | |
| | | | | | | | | | | | | | | | | | | |
| Copper sales (millions of recoverable pounds) | | 275 | | | 275 | | | | | | 291 | | | 291 | | | | |
Molybdenum sales (millions of recoverable pounds)b | | | | | | | | 7 | | | | | | | | | 6 | |
| a. | Molybdenum by-product credits and revenues reflect volumes produced at market-based pricing and also include tolling revenues at Sierrita. |
| b. | Reflects molybdenum produced by the North America copper mines. |
Unit net cash costs (net of by-product credits) for our North America copper mines increased to $1.37 per pound of copper in first-quarter 2011, compared with $1.13 per pound of copper in first-quarter 2010, primarily reflecting higher site production and delivery costs ($0.44 per pound) resulting from increased mining and milling activities and higher input costs, partly offset by higher molybdenum credits ($0.23 per pound) resulting from higher molybdenum volumes and prices.
The decrease in depreciation, depletion and amortization in first-quarter 2011 primarily reflects lower straight-line expense, and the increase in net noncash and nonrecurring costs for first-quarter 2011 primarily reflects the restart of mining and milling activities at the Chino mine.
Our operating North America copper mines have varying cost structures because of differences in ore grades and characteristics, processing costs, by-products and other factors. Based on current operating plans, and assuming achievement of current 2011 sales volume and cost estimates and an average price of $15 per pound of molybdenum for the remainder of 2011, we estimate that average unit net cash costs (net of by-product credits) for our North America copper mines would approximate $1.47 per pound of copper for the year 2011, compared with $1.24 per pound in 2010. Each $2 per pound change in the average price of molybdenum during the remainder of 2011 would have an approximate $0.04 per pound impact on the North America copper mines’ 2011 average unit net cash costs.
South America Mining
We operate four copper mines in South America – Cerro Verde in Peru, and El Abra, Candelaria and Ojos del Salado in Chile. We own a 53.56 percent interest in Cerro Verde, a 51 percent interest in El Abra, and an 80 percent interest in both Candelaria and Ojos del Salado.
South America mining includes open-pit and underground mining, sulfide ore concentrating, leaching and SX/EW operations. In addition to copper, the Cerro Verde mine produces molybdenum concentrates, and the Candelaria and Ojos del Salado mines produce gold and silver. Production from our South America mines is sold as copper concentrate or copper cathode under long-term contracts. Our South America mines sell a portion of their copper concentrate and cathode inventories to Atlantic Copper, an affiliated smelter.
Operating and Development Activities.
El Abra Sulfide. During first-quarter 2011, we commenced production from El Abra’s newly commissioned stacking and leaching facilities to transition from oxide to sulfide ores. Production from the sulfide ore, which is projected to reach design levels in the second half of 2011, would approximate 300 million pounds of copper per year and substantially replaces the currently depleting oxide copper production. The aggregate capital investment for this project is expected to total $725 million through 2015, of which approximately $565 million is for the initial phase of the project expected to be complete in 2011. Project costs of $422 million have been incurred as of March 31, 2011 ($61 million during first-quarter 2011).
We are also engaged in pre-feasibility studies for a potential large-scale milling operation at El Abra to process additional sulfide material and to achieve higher recoveries.
Cerro Verde Expansion. During fourth-quarter 2010, we completed the $50 million project to increase throughput at the Cerro Verde concentrator. This project increased mill throughput from 108,000 metric tons of ore per day to 120,000 metric tons of ore per day resulting in incremental annual copper production of approximately 30 million pounds of copper.
We are progressing our evaluation of a large-scale concentrator expansion at Cerro Verde. Significant reserve additions in recent years have provided opportunities to significantly expand the existing facility’s capacity. A range of expansion options have been considered and we are targeting a project to increase mill throughput from 120,000 metric tons per day to 360,000 metric tons per day. Following the completion of the feasibility study in second-quarter 2011, we expect to file an environmental impact assessment during the second half of 2011.
Candelaria Water Plant. As part of our overall strategy to supply water to the Candelaria mine, we recently completed construction of a pipeline to bring water from a nearby water treatment facility. In addition, we have started engineering for a desalination plant that will supply all of Candelaria’s longer term water needs. The plant is expected to be completed by the end of 2012 at a capital investment of $280 million. Project costs of $30 million have been incurred as of March 31, 2011 ($24 million during first-quarter 2011).
Other Matters. As reported in Note 13 of our Annual Report on Form 10-K for the year ended December 31, 2010, Cerro Verde has received assessments from SUNAT, the Peruvian national tax authority, in connection with its alleged obligations for mining royalties related to the minerals processed by its concentrator, which was added to Cerro Verde’s processing facilities in late 2006. These assessments relate to the period from October 2006 through December 2007, and for the year 2008. SUNAT has issued rulings denying Cerro Verde’s protest of the assessments, and Cerro Verde has appealed these decisions to the Peruvian Tax Court. Cerro Verde is challenging these royalties because its stability agreement with the Peruvian government exempts from royalties all minerals extracted from its mining concession, irrespective of the method used for processing those minerals. If Cerro Verde is ultimately found responsible for these royalties, it will also be liable for interest, which accrues at rates that range from 7 to 18 percent based on the year accrued and the currency in which the amounts would be payable. At March 31, 2011, the aggregate amount of the assessments, including interest approximated $122 million. This amount will continue to increase at varying interest rates. Cerro Verde has also received a request for information for mining royalties covering the year 2009. SUNAT may continue to assess mining royalties annually until this matter is resolved by the Tax Court.
As reported in Note 14 of our Annual Report on Form 10-K for the year ended December 31, 2010, during 2006, the Peruvian government announced that all mining companies operating in Peru would be required to make annual contributions to local development funds for a five-year period (covering the years 2006 through 2010) when copper prices exceeded certain levels that were adjusted annually. The contribution was equal to 3.75 percent of after-tax profits, and totaled $41 million for the year 2010. It is not certain whether the contribution will be extended, abandoned, or replaced by a tax or different mechanism. We will continue to monitor the activity associated with this matter.
Operating Data. Following is summary operating data for our South America mining operations for the first quarters of 2011 and 2010:
| | | Three Months Ended March 31, | |
| | | 2011 | | 2010 | |
Copper (millions of recoverable pounds) | | | | | | | |
| Production | | | 317 | | | 322 | |
| Sales | | | 312 | | | 307 | |
| Average realized price per pound | | $ | 4.31 | | $ | 3.46 | |
| | | | | | | | |
Gold (thousands of recoverable ounces) | | | | | | | |
| Production | | | 24 | | | 19 | |
| Sales | | | 24 | | | 19 | |
| Average realized price per ounce | | $ | 1,394 | | $ | 1,113 | |
| | | | | | | | |
Molybdenum (millions of recoverable pounds) | | | | | | | |
Productiona | | | 3 | | | 2 | |
| | | | | | | | |
| SX/EW operations | | | | | | | |
| Leach ore placed in stockpiles (metric tons per day) | | | 262,200 | | | 255,800 | |
| Average copper ore grade (percent) | | | 0.43 | | | 0.44 | |
| Copper production (millions of recoverable pounds) | | | 90 | | | 133 | |
| | | | | | | | |
| Mill operations | | | | | | | |
| Ore milled (metric tons per day) | | | 191,800 | | | 180,100 | |
Average ore grade (percent):b | | | | | | | |
| Copper | | | 0.68 | | | 0.62 | |
| Molybdenum | | | 0.02 | | | 0.02 | |
| Copper recovery rate (percent) | | | 91.4 | | | 89.2 | |
| Production (recoverable): | | | | | | | |
| Copper (millions of pounds) | | | 227 | | | 189 | |
| Gold (thousands of ounces) | | | 24 | | | 19 | |
| Molybdenum (millions of pounds) | | | 3 | | | 2 | |
| a. | Reflects molybdenum production from our Cerro Verde copper mine. Sales of molybdenum are reflected in the Molybdenum division. |
| b. | Average ore grades of gold produced at our South America mining operations rounds to less than 0.001 grams per metric ton. |
Copper sales from our South America mining operations increased to 312 million pounds in first-quarter 2011, compared with 307 million pounds in first-quarter 2010, primarily reflecting higher ore grades at Candelaria and increased mill throughput at Cerro Verde, partly offset by anticipated lower mining rates at El Abra as it transitions from oxide to sulfide ores.
Consolidated sales volumes from South America mining are expected to approximate 1.3 billion pounds of copper and 100 thousand ounces of gold in 2011, compared with 1.3 billion pounds of copper and 93 thousand ounces of gold in 2010. Molybdenum production from South America mining is expected to approximate 11 million pounds for the year 2011.
Unit Net Cash Costs. Unit net cash costs per pound of copper is a measure intended to provide investors with information about the cash-generating capacity of our mining operations expressed on a basis relating to the primary metal product for our respective operations. We use this measure for the same purpose and for monitoring operating performance by our mining operations. This information differs from measures of performance determined in accordance with U.S. GAAP and should not be considered in isolation or as a substitute for measures of performance determined in accordance with U.S. GAAP. This measure is presented by other metals mining companies, although our measure may not be comparable to similarly titled measures reported by other companies.
Gross Profit per Pound of Copper
The following table summarizes unit net cash costs and gross profit per pound at the South America mining operations for the first quarters of 2011 and 2010. Unit net cash costs per pound of copper are reflected under the by-product and co-product methods as the South America mining operations also had small amounts of molybdenum, gold and silver sales. Refer to “Product Revenues and Production Costs” for an explanation of the “by-product” and “co-product” methods and a reconciliation of unit net cash costs per pound to production and delivery costs applicable to sales reported in our consolidated financial statements.
| | Three Months Ended March 31, 2011 | | Three Months Ended March 31, 2010 | |
| | By-Product | | Co-Product | | By-Product | | Co-Product | |
| | Method | | Method | | Method | | Method | |
| Revenues, excluding adjustments | $ | 4.31 | | $ | 4.31 | | $ | 3.46 | | $ | 3.46 | |
| | | | | | | | | | | | | |
| Site production and delivery, before net noncash | | | | | | | | | | | | |
| and other costs shown below | | 1.30 | | | 1.20 | | | 1.20 | | | 1.14 | |
| By-product credits | | (0.36 | ) | | - | | | (0.17 | ) | | - | |
| Treatment charges | | 0.19 | | | 0.19 | | | 0.15 | | | 0.15 | |
| Unit net cash costs | | 1.13 | | | 1.39 | | | 1.18 | | | 1.29 | |
| Depreciation, depletion and amortization | | 0.18 | | | 0.17 | | | 0.19 | | | 0.19 | |
| Noncash and other costs, net | | 0.01 | | | 0.01 | | | 0.01 | | | 0.01 | |
| Total unit costs | | 1.32 | | | 1.57 | | | 1.38 | | | 1.49 | |
| Revenue adjustments, primarily for pricing on | | | | | | | | | | | | |
| prior period open sales | | 0.03 | | | (0.03 | ) | | (0.01 | ) | | (0.01 | ) |
| Other non-inventoriable costs | | (0.05 | ) | | (0.04 | ) | | (0.03 | ) | | (0.02 | ) |
| Gross profit per pound | $ | 2.97 | | $ | 2.67 | | $ | 2.04 | | $ | 1.94 | |
| | | | | | | | | | | | | |
| Copper sales (millions of recoverable pounds) | | 312 | | | 312 | | | 307 | | | 307 | |
Unit net cash costs (net of by-product credits) for our South America mining operations decreased to $1.13 per pound of copper in first-quarter 2011, compared with $1.18 per pound in first-quarter 2010, primarily reflecting higher by-product credits ($0.19 per pound) associated with higher gold and molybdenum prices and volumes, partly offset by higher site production and delivery costs ($0.10 per pound) associated with higher input costs, including materials, energy and currency exchange rates, partly offset by higher volumes.
Our South America mines have varying cost structures because of differences in ore grades and characteristics, processing costs, by-products and other factors. Assuming achievement of current sales volume and cost estimates and an average price of $1,400 per ounce of gold for the remainder of 2011 and an average price of $15 per pound of molybdenum for the remainder of 2011, we estimate that average unit net cash costs (net of by-product credits) for our South America mining operations would approximate $1.19 per pound of copper for the year 2011, compared with $1.15 per pound in 2010.
Indonesia Mining
Indonesia mining includes PT Freeport Indonesia’s Grasberg minerals district. We own 90.64 percent of PT Freeport Indonesia, including 9.36 percent owned through our wholly owned subsidiary, PT Indocopper Investama.
PT Freeport Indonesia produces copper concentrates, which contain significant quantities of gold and silver. Substantially all of PT Freeport Indonesia’s copper concentrates are sold under long-term contracts, of which approximately one-half is sold to affiliated smelters, Atlantic Copper and PT Smelting (PT Freeport Indonesia’s 25-percent owned copper smelter and refinery in Indonesia) and the remainder to other customers.
We have established certain unincorporated joint ventures with Rio Tinto plc (Rio Tinto), under which Rio Tinto has a 40 percent interest in certain assets and future production exceeding specified annual amounts of copper, gold and silver.
Development Activities. We have several projects in progress in the Grasberg minerals district, including development of the large-scale, high-grade underground ore bodies located beneath and nearby the Grasberg open pit. Over the next five years, aggregate capital spending on these projects is expected to average $600 million per year ($470 million per year net to PT Freeport Indonesia). Considering the long-term nature and large size of these projects, actual costs could differ materially from these estimates.
The following provides additional information on these projects, including the continued development of the Common Infrastructure project, the Grasberg Block Cave and Big Gossan underground mines and development of the Deep Mill Level Zone (DMLZ) ore body, that lies below the Deep Ore Zone (DOZ) underground mine, which completed an expansion to 80,000 metric tons of ore per day in first-quarter 2010.
Common Infrastructure and Grasberg Block Cave. In 2004, PT Freeport Indonesia commenced its Common Infrastructure project to provide access to its large undeveloped underground ore bodies located in the Grasberg minerals district through a tunnel system located approximately 400 meters deeper than its existing underground tunnel system. In addition to providing access to our underground ore bodies, the tunnel system will enable PT Freeport Indonesia to conduct future exploration in prospective areas associated with currently identified ore bodies. The tunnel system has reached the Big Gossan terminal and development of the lower Big Gossan infrastructure is ongoing. We have also advanced development of the Grasberg spur and have completed the tunneling required to reach the Grasberg underground ore body. Development continues on the Grasberg Block Cave terminal infrastructure and mine access.
The Grasberg Block Cave underground mine accounts for over one-third of our reserves in Indonesia. Production at the Grasberg Block Cave mine is currently scheduled to commence at the end of mining the Grasberg open pit, which is currently expected to continue until mid-2016. The timing of the transition to underground Grasberg Block Cave mine development will continue to be assessed.
Aggregate mine development capital for the Grasberg Block Cave mine and associated Common Infrastructure is expected to approximate $3.7 billion (incurred between 2008 and 2021), with PT Freeport Indonesia’s share totaling approximately $3.4 billion. Aggregate project costs totaling $320 million have been incurred through March 31, 2011 ($60 million during first-quarter 2011). Targeted production rates once the Grasberg Block Cave mining operation reaches full capacity are expected to approximate 160,000 metric tons of ore per day.
Big Gossan. The Big Gossan underground mine is a high-grade deposit located near PT Freeport Indonesia’s existing milling complex. The Big Gossan mine is being developed as an open-stope mine with backfill consisting of mill tailings and cement, an established mining methodology. Production, which began in fourth-quarter 2010, is designed to ramp up to 7,000 metric tons of ore per day by the end of 2012 (equal to average annual aggregate incremental production of 125 million pounds of copper and 65,000 ounces of gold, with PT Freeport Indonesia receiving 60 percent of these amounts). The aggregate capital investment for this project is currently estimated at approximately $535 million, with PT Freeport Indonesia’s share totaling approximately $500 million. Aggregate project costs of $458 million have been incurred through March 31, 2011 ($14 million during first-quarter 2011).
DMLZ. The DMLZ ore body lies below the DOZ mine at the 2,590-meter elevation and represents the downward continuation of mineralization in the Ertsberg East Skarn system and neighboring Ertsberg porphyry. We plan to mine the ore body using a block-cave method with production beginning in 2015, near completion of mining at the DOZ. Drilling efforts continue to determine the extent of this ore body. We continue to develop the Common Infrastructure project and tunnels from mill level. In 2009, we completed a portion of the spur to the DMLZ mine and reached the edge of the DMLZ terminal and development continued on terminal infrastructure and mine access in 2010. Aggregate mine development capital costs for the DMLZ are expected to approximate $2.0 billion (incurred from 2009 to 2020), with PT Freeport Indonesia’s share totaling approximately $1.2 billion. Aggregate project costs totaling $139 million have been incurred through March 31, 2011 ($36 million during first-quarter 2011). Targeted production rates once the DMLZ mining operation reaches full capacity are expected to approximate 80,000 metric tons of ore per day.
Other Matters. As reported in Note 13 of our Annual Report on Form 10-K for the year ended December 31, 2010, in October 2010, PT Freeport Indonesia received an assessment from the Indonesian tax authorities for additional taxes approximating $106 million and interest approximating $52 million related to various audit exceptions for 2005. PT Freeport Indonesia has filed objections to these assessments because it believes that it has properly paid taxes for the year 2005 and is working with the Indonesian tax authorities to resolve this matter.
As reported in Note 13 of our Annual Report on Form 10-K for the year ended December 31, 2010, in December 2009, PT Freeport Indonesia was notified by the Large Taxpayer’s Office of the Government of Indonesia of its view that PT Freeport Indonesia is obligated to pay value added taxes on certain goods imported after the year 2000. The amount of taxes and penalties would be significant. PT Freeport Indonesia believes that, pursuant to the terms of its Contract of Work, it is only required to pay value added taxes on these types of goods imported
after December 30, 2009. PT Freeport Indonesia has not received an assessment and is working with the applicable government authorities to resolve this matter.
As reported in “Risk Factors” contained in Part I, Item 1A of our report on Form 10-K for the year ended December 31, 2010, between July 2009 and January 2010 there were a series of shooting incidents along the road leading to our mining and milling operations at the Grasberg mining complex which resulted in three fatalities and several injuries. In early April 2011, there were two additional shooting incidents that resulted in two fatalities and two injuries to PT Freeport Indonesia employees. The Indonesian government has responded with additional security forces and expressed a strong commitment to protect the safety of the community and our operations. The investigation of these matters is continuing, and we have taken precautionary measures, including limiting use of the road to secured convoys. Our mining and milling activities have continued uninterrupted; however, prolonged limitations on access to the road could adversely affect operations at the mine.
Operating Data. Following is summary operating data for our Indonesia mining operations for the first quarters of 2011 and 2010:
| | | Three Months Ended March 31, | |
| | | 2011 | | 2010 | |
| Operating Data, Net of Joint Venture Interest | | | | | | | |
Copper (millions of recoverable pounds) | | | | | | | |
| Production | | | 284 | | | 279 | |
| Sales | | | 278 | | | 296 | |
| Average realized price per pound | | $ | 4.26 | | $ | 3.51 | |
| | | | | | | | |
Gold (thousands of recoverable ounces) | | | | | | | |
| Production | | | 441 | | | 429 | |
| Sales | | | 454 | | | 458 | |
| Average realized price per ounce | | $ | 1,400 | | $ | 1,110 | |
| | | | | | | | |
| 100% Operating Data | | | | | | | |
Ore milled (metric tons per day):a | | | | | | | |
| Grasberg open pit | | | 140,300 | | | 155,100 | |
| DOZ underground mine | | | 80,100 | | | 78,900 | |
| Big Gossan underground mine | | | 1,800 | | | - | |
| Total | | | 222,200 | | | 234,000 | |
| Average ore grade: | | | | | | | |
| Copper (percent) | | | 0.77 | | | 0.78 | |
| Gold (grams per metric ton) | | | 0.89 | | | 0.87 | |
| Recovery rates (percent): | | | | | | | |
| Copper | | | 87.3 | | | 88.2 | |
| Gold | | | 82.0 | | | 79.0 | |
| Production (recoverable): | | | | | | | |
| Copper (millions of pounds) | | | 284 | | | 308 | |
| Gold (thousands of ounces) | | | 459 | | | 466 | |
| a. | Amounts represent the approximate average daily throughput processed at PT Freeport Indonesia’s mill facilities from each producing mine. |
Copper sales from our Indonesia mining operations decreased to 278 million pounds of copper in first-quarter 2011, compared with 296 million pounds of copper in first-quarter 2010, primarily because of timing of shipments. Gold sales volumes from our Indonesia mining operations in first-quarter 2011 of 454 thousand ounces approximated first-quarter 2010 volumes of 458 thousand ounces.
At the Grasberg mine, the sequencing in mining areas with varying ore grades causes fluctuations in the timing of ore production resulting in varying quarterly and annual sales of copper and gold. Because of recent revisions to Grasberg’s mine plans, projected sales from our Indonesia mining operations for 2011 are expected to approximate 1.1 billion pounds of copper and 1.5 million ounces of gold, compared with 1.2 billion pounds of copper and 1.8 million ounces of gold in 2010.
Unit Net Cash Costs. Unit net cash costs per pound of copper is a measure intended to provide investors with information about the cash-generating capacity of our mining operations expressed on a basis relating to the primary metal product for our respective operations. We use this measure for the same purpose and for
monitoring operating performance by our mining operations. This information differs from measures of performance determined in accordance with U.S. GAAP and should not be considered in isolation or as a substitute for measures of performance determined in accordance with U.S. GAAP. This measure is presented by other metals mining companies, although our measure may not be comparable to similarly titled measures reported by other companies.
Gross Profit per Pound of Copper and per Ounce of Gold
The following table summarizes the unit net cash costs (credits) and gross profit per pound of copper and per ounce of gold at our Indonesia mining operations for the first quarters of 2011 and 2010. Refer to “Production Revenues and Production Costs” for an explanation of “by-product” and “co-product” methods and a reconciliation of unit net cash costs per pound to production and delivery costs applicable to sales reported in our consolidated financial statements.
| | Three Months Ended March 31, 2011 | | Three Months Ended March 31, 2010 | |
| | By-Product | | Co-Product Method | | By-Product | | Co-Product Method | |
| | Method | | Copper | | Gold | | Method | | Copper | | Gold | |
| Revenues, excluding adjustments | $ | 4.26 | | $ | 4.26 | | $ | 1,400 | | $ | 3.51 | | $ | 3.51 | | $ | 1,110 | |
| | | | | | | | | | | | | | | | | | | |
| Site production and delivery, before net noncash | | | | | | | | | | | | | | | | | | |
| and other costs shown below | | 1.84 | | | 1.18 | | | 386 | | | 1.54 | | | 1.02 | | | 323 | |
| Gold and silver credits | | (2.34 | ) | | - | | | - | | | (1.79 | ) | | - | | | - | |
| Treatment charges | | 0.18 | | | 0.11 | | | 37 | | | 0.23 | | | 0.15 | | | 47 | |
| Royalty on metals | | 0.16 | | | 0.10 | | | 34 | | | 0.12 | | | 0.08 | | | 26 | |
| Unit net cash (credits) costs | | (0.16 | ) | | 1.39 | | | 457 | | | 0.10 | | | 1.25 | | | 396 | |
| Depreciation and amortization | | 0.21 | | | 0.13 | | | 43 | | | 0.21 | | | 0.14 | | | 45 | |
| Noncash and other costs, net | | 0.05 | | | 0.04 | | | 12 | | | 0.06 | | | 0.04 | | | 13 | |
| Total unit costs | | 0.10 | | | 1.56 | | | 512 | | | 0.37 | | | 1.43 | | | 454 | |
| Revenue adjustments, primarily for pricing on | | | | | | | | | | | | | | | | | | |
| prior period open sales | | (0.03 | ) | | (0.03 | ) | | (38 | ) | | (0.03 | ) | | (0.03 | ) | | 2 | |
| PT Smelting intercompany profit | | 0.17 | | | 0.11 | | | 36 | | | 0.04 | | | 0.03 | | | 8 | |
| Gross profit per pound/ounce | $ | 4.30 | | $ | 2.78 | | $ | 886 | | $ | 3.15 | | $ | 2.08 | | $ | 666 | |
| | | | | | | | | | | | | | | | | | | |
| Copper sales (millions of recoverable pounds) | | 278 | | | 278 | | | | | | 296 | | | 296 | | | | |
| Gold sales (thousands of recoverable ounces) | | | | | | | | 454 | | | | | | | | | 458 | |
Because of the fixed nature of a large portion of PT Freeport Indonesia’s costs, unit costs vary significantly from period to period depending on volumes of copper and gold sold during the period. Unit net cash costs (net of gold and silver credits) for PT Freeport Indonesia decreased to a net credit of $0.16 per pound of copper in first-quarter 2011, compared with a net cost of $0.10 per pound in first-quarter 2010, primarily reflecting higher gold and silver credits ($0.55 per pound) mostly related to higher gold prices, partly offset by higher site production and delivery costs ($0.30 per pound) reflecting higher maintenance and other input costs.
Treatment charges vary with the volume of metals sold and the price of copper, and royalties vary with the volume of metals sold and the prices of copper and gold.
Assuming achievement of current sales volume and cost estimates, and an average gold price of $1,400 per ounce for the remainder of 2011, we estimate that average unit net cash costs for PT Freeport Indonesia (net of gold and silver credits) would approximate $0.38 per pound of copper for the year 2011, compared with a net credit of $0.04 per pound in 2010. Each $50 per ounce change in the average price of gold during the remainder of 2011 would have an approximate $0.06 per pound impact on PT Freeport Indonesia’s 2011 average unit net cash costs.
Africa Mining
Africa mining includes the Tenke copper and cobalt mining concessions in the Katanga province of the DRC. The Tenke mine includes surface mining, leaching and SX/EW operations. Copper production from the Tenke mine is sold as copper cathode. In addition to copper, the Tenke mine produces cobalt hydroxide.
In October 2010, the government of the DRC announced the conclusion of the review of TFM’s contracts, and confirmed that TFM’s existing mining contracts are in good standing and acknowledged the rights and benefits granted under those contracts. In connection with the review, TFM made several commitments that have been reflected in amendments to its mining contracts, which were signed by the parties in December 2010 (refer to Note 14 in our Annual Report on Form 10-K for the year ended December 31, 2010, for further discussion). In March 2011, the amendments were approved by a ministerial council, and a Presidential Decree signed by the President and Prime Minister of the DRC was issued in April 2011. After giving effect to the modifications that will be made to TFM’s bylaws to reflect the agreement of the parties, our effective ownership interest in the project will be 56.0 percent prospectively, compared to our current ownership interest of 57.75 percent.
Operating and Development Activities. Pursuant to our agreement with Lundin Mining Corporation, we were responsible for funding 70 percent of the project development costs and 100 percent of certain cost overruns on the initial project. Of the approximate $2 billion we invested in the initial project, we have been repaid approximately $500 million as of March 31, 2011.
The milling facilities at Tenke, which were designed to produce at a capacity rate of 8,000 metric tons of ore per day, continue to perform above capacity, with first-quarter 2011 throughput averaging 10,800 metric tons of ore per day. Tenke has also procured additional equipment, which is enabling additional high-grade material to be mined and processed in 2011. As a result of these enhancements to the mine plan and an expected mill throughput rate of 10,000 metric tons of ore per day, we estimate the average annual copper production at Tenke will approximate 290 million pounds of copper.
We continue to engage in drilling activities, exploration analyses and metallurgical testing to evaluate the potential of the highly prospective minerals district at Tenke. These analyses are being incorporated in future plans to evaluate opportunities for expansion. We are planning a second phase of the project, which would include optimizing the current plant and increasing capacity. As part of the second phase, we are completing studies to expand the mill rate to 14,000 metric tons per day and to construct related processing facilities that would target the addition of approximately 150 million pounds of copper per year in an approximate two-year timeframe. We expect production volumes from the project to expand significantly over time. Future expansions are subject to a number of factors, including economic and market conditions and the business and investment climate in the DRC.
Operating Data. Following is summary operating data for our Africa mining operations for the first quarters of 2011 and 2010:
| | | Three Months Ended March 31, | |
| | | 2011 | | 2010 | |
Copper (millions of recoverable pounds) | | | | | | | |
| Production | | | 67 | | | 64 | |
| Sales | | | 60 | | | 66 | |
Average realized price per pounda | | $ | 4.19 | | $ | 3.26 | |
| | | | | | | | |
Cobalt (millions of contained pounds) | | | | | | | |
| Production | | | 6 | | | 5 | |
| Sales | | | 6 | | | 3 | |
| Average realized price per pound | | $ | 10.99 | | $ | 10.94 | |
| | | | | | | | |
| Ore milled (metric tons per day) | | | 10,800 | | | 9,700 | |
| Average ore grade (percent): | | | | | | | |
| Copper | | | 3.42 | | | 3.70 | |
| Cobalt | | | 0.38 | | | 0.46 | |
| Copper recovery rate (percent) | | | 91.7 | | | 91.7 | |
| a. | Includes adjustments for point-of-sale transportation costs as negotiated in customer contracts. |
Copper sales volumes from the Tenke mine decreased to 60 million pounds of copper in first-quarter 2011, compared with 66 million pounds of copper in first-quarter 2010, primarily because of timing of shipments.
Consolidated sales volumes from Tenke are expected to approximate 285 million pounds of copper and over 20 million pounds of cobalt for the year 2011, compared with 262 million pounds of copper and 20 million pounds of cobalt in 2010.
Unit Net Cash Costs. Unit net cash costs per pound of copper is a measure intended to provide investors with information about the cash-generating capacity of our mining operations expressed on a basis relating to the primary metal product for our respective operations. We use this measure for the same purpose and for monitoring operating performance by our mining operations. This information differs from measures of performance determined in accordance with U.S. GAAP and should not be considered in isolation or as a substitute for measures of performance determined in accordance with U.S. GAAP. This measure is presented by other metals mining companies, although our measure may not be comparable to similarly titled measures reported by other companies.
Gross Profit per Pound of Copper and Cobalt
The following table summarizes the unit net cash costs and gross profit per pound of copper and cobalt at our Africa mining operations for first quarters of 2011 and 2010. Refer to “Production Revenues and Production Costs” for an explanation of “by-product” and “co-product” methods and a reconciliation of unit net cash costs per pound to production and delivery costs applicable to sales reported in our consolidated financial statements.
| | Three Months Ended March 31, 2011 | | Three Months Ended March 31, 2010 | |
| | By-Product | | Co-Product Method | | By-Product | | Co-Product Method | |
| | Method | | Copper | | Cobalt | | Method | | Copper | | Cobalt | |
Revenues, excluding adjustmentsa | $ | 4.19 | | $ | 4.19 | | $ | 10.99 | | $ | 3.26 | | $ | 3.26 | | $ | 10.94 | |
| | | | | | | | | | | | | | | | | | | |
| Site production and delivery, before net noncash | | | | | | | | | | | | | | | | | | |
| and other costs shown below | | 1.51 | | | 1.35 | | | 5.45 | | | 1.37 | | | 1.33 | | | 4.69 | |
Cobalt creditsb | | (0.75 | ) | | - | | | - | | | (0.40 | ) | | - | | | - | |
| Royalty on metals | | 0.10 | | | 0.07 | | | 0.19 | | | 0.07 | | | 0.06 | | | 0.21 | |
| Unit net cash costs | | 0.86 | | | 1.42 | | | 5.64 | | | 1.04 | | | 1.39 | | | 4.90 | |
| Depreciation and amortization | | 0.47 | | | 0.40 | | | 0.78 | | | 0.46 | | | 0.36 | | | 2.00 | |
| Noncash and other costs, net | | 0.16 | | | 0.13 | | | 0.26 | | | 0.01 | | | 0.02 | | | 0.10 | |
| Total unit costs | | 1.49 | | | 1.95 | | | 6.68 | | | 1.51 | | | 1.77 | | | 7.00 | |
| Revenue adjustments, primarily for pricing on | | | | | | | | | | | | | | | | | | |
| prior period open sales | | (0.01 | ) | | (0.01 | ) | | 0.39 | | | - | | | - | | | 1.13 | |
| Other non-inventoriable costs | | (0.05 | ) | | (0.04 | ) | | (0.08 | ) | | (0.09 | ) | | (0.07 | ) | | (0.40 | ) |
| Gross profit per pound | $ | 2.64 | | $ | 2.19 | | $ | 4.62 | | $ | 1.66 | | $ | 1.42 | | $ | 4.67 | |
| | | | | | | | | | | | | | | | | | | |
| Copper sales (millions of recoverable pounds) | | 60 | | | 60 | | | | | | 66 | | | 66 | | | | |
| Cobalt sales (millions of contained pounds) | | | | | | | | 6 | | | | | | | | | 3 | |
| a. | Includes adjustments for point-of-sale transportation costs as negotiated in customer contracts. |
| b. | Net of cobalt downstream processing and freight costs. |
Unit net cash costs (net of cobalt credits) for Tenke averaged $0.86 per pound of copper for first-quarter 2011, compared with $1.04 per pound of copper in first-quarter 2010, primarily reflecting higher cobalt credits ($0.35 per pound) because of higher cobalt volumes, partly offset by higher site production and delivery costs ($0.14 per pound) mostly associated with increased mining and milling activity and higher input costs.
Assuming achievement of current sales volumes and cost estimates and an average cobalt price of $14 per pound for the remainder of 2011, we estimate that average unit net cash costs for Tenke (net of cobalt credits) would approximate $0.93 per pound of copper for the year 2011, compared with $0.90 per pound in 2010. Each $2 per pound change in the average price of cobalt during the remainder of 2011 would have an approximate $0.06 per pound impact on Tenke’s 2011 average unit net cash costs.
Molybdenum
Our Molybdenum operations are an integrated producer of molybdenum, with mining, sulfide ore concentrating, roasting and processing facilities that produce high-purity, molybdenum-based chemicals, molybdenum metal powder and metallurgical products, which are sold to customers around the world, and include the wholly owned Henderson molybdenum mine in Colorado and related conversion facilities. The Henderson underground mine produces high-purity, chemical-grade molybdenum concentrates, which are typically further processed into value-
added molybdenum chemical products. The Molybdenum operations also include the wholly owned Climax molybdenum mine in Colorado, for which construction activities in preparation to restart mining activities are ongoing; a sales company that purchases and sells molybdenum from our Henderson mine and from certain of our North and South America mines that produce molybdenum; and related conversion facilities that, at times, roast and/or process material on a toll basis for third-parties. Toll arrangements require the tolling customer to deliver appropriate molybdenum-bearing material to our facilities for processing into a product that is returned to the customer, who pays us for processing their material into the specified products.
Development Activities. Construction activities at the Climax molybdenum mine are approximately 60 percent complete. Recent activities include continuation of mill equipment assembly, commencement of flotation cell placement and refurbishment of the primary crusher. We plan to continue advancing construction and conduct mine preparation activities during 2011, with construction expected to be complete in early 2012. The timing for start up of mining and milling activities will be dependent on market conditions. The Climax mine would have an initial design capacity of 30 million pounds of molybdenum annually, with significant expansion options. Total estimated costs for the project approximate $700 million, of which approximately $334 million has been incurred through March 31, 2011 ($80 million during first-quarter 2011).
Other Matters. We are negotiating the renewal of the labor agreement covering certain employees at Rotterdam, our molybdenum conversion facility in the Netherlands, which expired in March 2011.
Operating Data. Following is summary operating data for the Molybdenum operations for the first quarters of 2011 and 2010:
| | | First Quarter | |
| | | 2011 | | 2010 | |
Molybdenum (millions of recoverable pounds) | | | | | | | |
Productiona | | | 10 | | | 9 | |
Sales, excluding purchasesb | | | 20 | | | 17 | |
| Average realized price per pound | | $ | 18.10 | | $ | 15.09 | |
| | | | | | | | |
| Henderson molybdenum mine | | | | | | | |
| Ore milled (metric tons per day) | | | 23,400 | | | 23,200 | |
| Average molybdenum ore grade (percent) | | | 0.24 | | | 0.23 | |
| Molybdenum production (millions of recoverable pounds) | | | 10 | | | 9 | |
| a. | Reflects production at the Henderson molybdenum mine. |
| b. | Includes sales of molybdenum produced at our North and South America mines. |
Molybdenum sales volumes increased to 20 million pounds in first-quarter 2011, compared with 17 million pounds in first-quarter 2010, primarily reflecting improved demand in the chemical and metallurgical sectors.
Molybdenum sales volumes are expected to approximate 73 million pounds for the year 2011 (of which approximately 45 million pounds represents molybdenum production from our North and South America mines) compared with 67 million pounds in 2010 (of which 32 million pounds represented molybdenum production from our North and South America mines).
Unit Net Cash Costs. Unit net cash costs per pound of molybdenum is a measure intended to provide investors with information about the cash-generating capacity of our mining operations expressed on a basis relating to the primary metal product for our respective operations. We use this measure for the same purpose and for monitoring operating performance by our mining operations. This information differs from measures of performance determined in accordance with U.S. GAAP and should not be considered in isolation or as a substitute for measures of performance determined in accordance with U.S. GAAP. This measure is presented by other metals mining companies, although our measure may not be comparable to similarly titled measures reported by other companies.
Gross Profit per Pound of Molybdenum
The following table summarizes the unit net cash costs and gross profit per pound of molybdenum at our Henderson molybdenum mine for the first quarters of 2011 and 2010. Refer to “Product Revenues and Production Costs” for a reconciliation of unit net cash costs per pound to production and delivery costs applicable to sales reported in our consolidated financial statements.
| | Three Months Ended March 31, | |
| | 2011 | | 2010 | |
| Revenues, excluding adjustments | $ | 17.37 | | $ | 14.66 | |
| | | | | | | |
| Site production and delivery, before net noncash | | | | | | |
| and other costs shown below | | 5.25 | | | 4.48 | |
| Treatment charges and other | | 0.88 | | | 1.08 | |
| Unit net cash costs | | 6.13 | | | 5.56 | |
| Depreciation, depletion and amortization | | 0.88 | | | 0.84 | |
| Noncash and other costs, net | | 0.03 | | | 0.04 | |
| Total unit costs | | 7.04 | | | 6.44 | |
Gross profita | $ | 10.33 | | $ | 8.22 | |
| | | | | | | |
Molybdenum sales (millions of recoverable pounds)b | | 10 | | | 9 | |
| a. | Gross profit reflects sales of Henderson products based on volumes produced at market-based pricing. On a consolidated basis, the Molybdenum division includes profits on sales as they are made to third parties and realizations based on actual contract terms. As a result, the actual gross profit realized will differ from the amounts reported in this table. |
| b. | Reflects molybdenum produced by the Henderson molybdenum mine. |
Henderson’s unit net cash costs were $6.13 per pound of molybdenum in first-quarter 2011, compared with $5.56 per pound of molybdenum in first-quarter 2010, primarily reflecting increased input costs, including labor and materials.
Assuming achievement of current sales volume and cost estimates, we estimate that the 2011 average unit net cash costs for Henderson would approximate $7.25 per pound of molybdenum, compared with $5.90 per pound in 2010.
Atlantic Copper Smelting & Refining
Atlantic Copper, our wholly owned subsidiary located in Spain, smelts and refines copper concentrates and markets refined copper and precious metals in slimes. Our Indonesia mining operation sells copper concentrate and our South America mining operations sell copper concentrate and copper cathode to Atlantic Copper. Through downstream integration, we are assured placement of a significant portion of our concentrate production. During first-quarter 2011, Atlantic Copper purchased approximately 54 percent of its concentrate requirements from our Indonesia mining operations and approximately 18 percent from our South America mining operations.
Smelting and refining charges consist of a base rate and, in certain contracts, price participation based on copper prices. Treatment charges for smelting and refining copper concentrates represent a cost to our Indonesia and our South America mining operations, and income to Atlantic Copper and PT Smelting, our 25 percent owned smelter and refinery in Gresik, Indonesia. Thus, higher treatment and refining charges benefit our smelter operations and adversely affect our mining operations in Indonesia and South America. Our North America copper mines are not significantly affected by changes in treatment and refining charges because these operations are fully integrated with our Miami smelter located in Arizona.
In April 2011, Atlantic Copper began a 26-day scheduled maintenance shutdown; Atlantic Copper’s last major shutdown was in 2007.
Atlantic Copper had operating losses of $19 million in first-quarter 2011 and $11 million in first-quarter 2010. The decline in Atlantic Copper’s operating results in first-quarter 2011 primarily reflects higher operating costs mainly associated with an acceleration of certain costs related to the April 2011 scheduled shutdown and higher general and administrative expense, partly offset by higher copper recoveries.
We defer recognizing profits on sales from our Indonesia and South America mining operations to Atlantic Copper and on 25 percent of our Indonesia mining sales to PT Smelting until final sales to third parties occur. Our net deferred profits on our Indonesia and South America mining operations’ inventories at Atlantic Copper and PT Smelting to be recognized in future periods’ net income after taxes and noncontrolling interests totaled $249 million at March 31, 2011. Changes in these net deferrals attributable to variability in intercompany volumes resulted in net reductions to net income attributable to FCX common stockholders totaling $15 million ($0.02 per share) in first-quarter 2011, compared with net reductions of $48 million ($0.05 per share) in first-quarter 2010. Quarterly variations in ore grades, the timing of intercompany shipments and changes in prices will result in variability in our net deferred profits and quarterly earnings.
CAPITAL RESOURCES AND LIQUIDITY
Our operating cash flows vary with prices realized from copper, gold and molybdenum sales, our sales volumes, production costs, income taxes and other working capital changes and other factors. Strong operating performance and copper prices have enabled us to enhance our financial and liquidity position, reduce debt and reinstate cash dividends to shareholders, while maintaining our future growth opportunities. We view the long-term outlook for our business positively, supported by limitations on supplies of copper and by the requirements for copper in the world’s economy, and will continue to adjust our operating strategy as market conditions change.
Based on current mine plans and subject to future copper, gold and molybdenum prices, we expect estimated operating cash flows for the year 2011 to be greater than our budgeted capital expenditures, expected debt payments, dividends, noncontrolling interest distributions and other cash requirements.
Cash and Cash Equivalents
At March 31, 2011, we had consolidated cash and cash equivalents of $4.1 billion. The following table reflects the U.S. and international components of consolidated cash and cash equivalents at March 31, 2011, and December 31, 2010 (in billions):
| | March 31, | | December 31, | |
| | 2011 | | 2010 | |
Cash at domestic companiesa | $ | 1.9 | | $ | 1.9 | |
| Cash at international operations | | 2.2 | | | 1.8 | |
| Total consolidated cash and cash equivalents | | 4.1 | b | | 3.7 | |
| Less: Noncontrolling interests’ share | | (0.7 | ) | | (0.4 | ) |
| Cash, net of noncontrolling interests’ share | | 3.4 | | | 3.3 | |
| Less: Withholding taxes and other | | (0.2 | ) | | (0.2 | ) |
| Net cash available to FCX | $ | 3.2 | | $ | 3.1 | |
| a. | Includes cash at our parent company and other North America operations. |
| b. | Excludes restricted cash of $1.2 billion for the April 1, 2011, redemption of our 8.25% Senior Notes (refer to Note 6 for further discussion). |
Operating Activities
Our operating cash flows vary with prices realized from copper, gold and molybdenum sales, our sales volumes, production costs, income taxes and other working capital changes and other factors. We generated operating cash flows totaling $2.4 billion in first-quarter 2011, including $114 million from working capital sources, compared with operating cash flows totaling $1.8 billion in first-quarter 2010, including $280 million from working capital sources. Higher operating cash flows for first-quarter 2011, compared with first-quarter 2010, primarily reflected higher copper and gold price realizations.
Refer to “Outlook” for further discussion of projected operating cash flows for the year 2011.
Investing Activities
Capital expenditures, including capitalized interest, increased to $505 million in first-quarter 2011, compared with $231 million in first-quarter 2010, primarily reflecting higher capital spending associated with our development projects, including increased spending for construction on the Climax molybdenum mine, the sulfide ore project at El Abra and the underground development projects at Grasberg.
Capital expenditures for the year 2011 are expected to approximate $2.5 billion (including $1.3 billion for major projects), which primarily includes underground development activities at Grasberg, construction activities at the
Climax molybdenum mine and completion of the initial phase of the sulfide ore project at El Abra. We are also considering additional investments at several of our sites. Capital spending plans will continue to be reviewed and adjusted in response to changes in market conditions and other factors. Refer to “Operations” for further discussion.
Financing Activities
Debt and Equity Transactions. Total debt approximated $4.8 billion at March 31, 2011, and December 31, 2010. On April 1, 2011, we redeemed the remaining $1.1 billion of our outstanding 8.25% Senior Notes due 2015. In second-quarter 2011, we expect to record a loss on early extinguishment of debt of $56 million ($49 million to net income attributable to FCX common stockholders) in connection with this redemption (refer to Note 6 for further discussion).
During first-quarter 2010, we had open-market purchases of $269 million of our 8.25% and 8.375% Senior Notes for $293 million (refer to Note 6 for further discussion).
After taking into account the April 1, 2011, redemption of our 8.25% Senior Notes, we have repaid approximately $3.7 billion, or approximately 50 percent of our outstanding debt, since January 1, 2009, resulting in estimated annual interest savings of approximately $260 million based on current interest rates.
We have no significant debt maturities in the near term; however, we may consider opportunities to prepay debt in advance of scheduled maturities. We have $3.0 billion in 8.375% Senior Notes that are redeemable in whole or in part, at our option, at make-whole redemption prices prior to April 2012, and afterwards at stated redemption prices.
On March 30, 2011, we entered into a new senior revolving credit facility, which replaced the revolving credit facilities that were scheduled to expire on March 19, 2012. This revolving credit facility is available until March 30, 2016, in an aggregate principal amount of $1.5 billion, with $500 million available to PT Freeport Indonesia. At March 31, 2011, we had no borrowings and $43 million in letters of credit issued under the revolving credit facility, resulting in availability of approximately $1.5 billion (of which $957 million could be used for additional letters of credit). Refer to Note 6 for further discussion.
The revolving credit facility and our senior notes contain certain restrictive covenants that vary among the instruments, but include limitations on the incurrence of debt, liens and certain asset sales.
We have an open-market share purchase program for up to 30 million shares. We made no purchases under this program during 2010 or the first quarter of 2011. There are 23.7 million shares remaining under this program, and the timing of future purchases of our common stock is dependent on many factors, including our operating results; cash flows and financial position; copper, gold and molybdenum prices; the price of our common shares; and general economic and market conditions.
Dividends. Common stock dividends paid totaled $238 million in first-quarter 2011, compared with $66 million in first-quarter 2010. After being suspended in late 2008, the Board reinstated a cash dividend on our common stock in October 2009 at an annual rate of $0.30 per share ($0.075 per share quarterly). In April 2010, the Board authorized an increase in the annual cash dividend to an annual rate of $0.60 per share ($0.15 per share quarterly) and in October 2010, the Board authorized another increase in the cash dividend to an annual rate of $1.00 per share ($0.25 per share quarterly). On March 31, 2011, the Board declared a regular quarterly dividend of $0.25 per share, which was paid on May 1, 2011, to common shareholders of record at the close of business on April 15, 2011.
In April 2011, the Board also declared a supplemental common stock dividend of $0.50 per share to be paid on June 1, 2011, to shareholders of record as of May 15, 2011. The supplemental dividend represents an addition to the regular quarterly common stock dividend of $0.25 per share. Based on approximately 947 million shares outstanding at March 31, 2011, the supplemental dividend payment will approximate $474 million.
The declaration of dividends is at the discretion of the Board. The amount of cash dividends on our common stock is dependent upon our financial results, cash requirements, future prospects and other factors deemed relevant by the Board. The Board will continue to review our financial policy on an ongoing basis.
Preferred stock dividends paid totaled $49 million in first-quarter 2010 representing dividends on our 6¾% Mandatory Convertible Preferred Stock. During 2010, our 6¾% Mandatory Convertible Preferred Stock automatically converted into 78.9 million shares of our common stock (refer to Note 6 for further discussion). As a result of this transactions we no longer have requirements to pay preferred stock dividends.
Cash dividends paid to noncontrolling interests totaled $133 million in first-quarter 2011 and $75 million in first-quarter 2010, reflecting dividends paid to the noncontrolling interest owners of PT Freeport Indonesia and our South America mines.
CONTRACTUAL OBLIGATIONS
There have been no material changes in our contractual obligations since year-end 2010. Refer to Item 7 in our Annual Report on Form 10-K for the year ended December 31, 2010, for further information regarding our contractual obligations.
ENVIRONMENTAL AND RECLAMATION MATTERS
Our mining, exploration, production and historical operating activities are subject to stringent laws and regulations governing the protection of the environment. There have been no material changes to our environmental and reclamation obligations since year-end 2010. Refer to Note 13 in our Annual Report on Form 10-K for the year ended December 31, 2010, for further information regarding our environmental and reclamation obligations.
We do not expect the impact of recently issued accounting standards to have a significant impact on our future financial statements and disclosures.
PRODUCT REVENUES AND PRODUCTION COSTS
Unit net cash costs per pound of copper and molybdenum are measures intended to provide investors with information about the cash-generating capacity of our mining operations expressed on a basis relating to the primary metal product for the respective operations. We use this measure for the same purpose and for monitoring operating performance by our mining operations. This information differs from measures of performance determined in accordance with U.S. GAAP and should not be considered in isolation or as a substitute for measures of performance determined in accordance with U.S. GAAP. This measure is presented by other metals mining companies, although our measures may not be comparable to similarly titled measures reported by other companies.
We present gross profit per pound of copper in the following tables using both a “by-product” method and a “co-product” method. We use the by-product method in our presentation of gross profit per pound of copper because (i) the majority of our revenues are copper revenues, (ii) we mine ore, which contains copper, gold, molybdenum, cobalt and other metals, (iii) it is not possible to specifically assign all of our costs to revenues from the copper, gold, molybdenum, cobalt and other metals we produce, (iv) it is the method used to compare mining operations in certain industry publications and (v) it is the method used by our management and the Board to monitor operations. In the co-product method presentation below, shared costs are allocated to the different products based on their relative revenue values, which will vary to the extent our metals sales volumes and realized prices change.
We show adjustments for prior period open sales as separate line items. Because the copper pricing adjustments do not result from current period sales, we have reflected these separately from revenues on current period sales. Noncash and other costs consist of items such as stock-based compensation costs, write-offs of equipment and/or unusual charges. They are removed from site production and delivery costs in the calculation of unit net cash costs. As discussed above, gold, molybdenum and other metal revenues at copper mines are reflected as credits against site production and delivery costs in the by-product method. Following are presentations under both the by-product and co-product methods together with reconciliations to amounts reported in our consolidated financial statements.
North America Copper Mines Product Revenues and Production Costs
| Three Months Ended March 31, 2011 | | | | |
| (In millions) | By-Product | | Co-Product Method | |
| | Method | | Copper | | Molybdenuma | | Otherb | | Total | |
| Revenues, excluding adjustments | $ | 1,211 | | $ | 1,211 | | $ | 124 | | $ | 21 | | $ | 1,356 | |
| | | | | | | | | | | | | | | | |
| Site production and delivery, before net noncash | | | | | | | | | | | | | | | |
| and other costs shown below | | 481 | | | 432 | | | 52 | | | 8 | | | 492 | |
By-product creditsa | | (134 | ) | | - | | | - | | | - | | | - | |
| Treatment charges | | 29 | | | 28 | | | - | | | 1 | | | 29 | |
| Net cash costs | | 376 | | | 460 | | | 52 | | | 9 | | | 521 | |
| Depreciation, depletion and amortization | | 56 | | | 52 | | | 3 | | | 1 | | | 56 | |
| Noncash and other costs, net | | 41 | | | 40 | | | 1 | | | - | | | 41 | |
| Total costs | | 473 | | | 552 | | | 56 | | | 10 | | | 618 | |
| Revenue adjustments | | 1 | | | 1 | | | - | | | - | | | 1 | |
| Idle facility and other non-inventoriable costs | | (11 | ) | | (11 | ) | | - | | | - | | | (11 | ) |
| Gross profit | $ | 728 | | $ | 649 | | $ | 68 | | $ | 11 | | $ | 728 | |
| | | | | | | | | | | | | | | | |
| Reconciliation to Amounts Reported | | | | | | | | | | | | | | | |
| | | | | | | | Depreciation, | | | | | | | |
| | | | | Production | | | Depletion and | | | | | | | |
| | Revenues | | and Delivery | | | Amortization | | | | | | | |
| Totals presented above | $ | 1,356 | | $ | 492 | | $ | 56 | | | | | | | |
| Treatment charges per above | | N/A | | | 29 | | | N/A | | | | | | | |
| Net noncash and other costs per above | | N/A | | | 41 | | | N/A | | | | | | | |
| Revenue adjustments per above | | 1 | | | N/A | | | N/A | | | | | | | |
| Idle facility and other non-inventoriable costs per above | | N/A | | | 11 | | | N/A | | | | | | | |
| Eliminations and other | | (9 | ) | | 2 | | | 2 | | | | | | | |
| North America copper mines | | 1,348 | | | 575 | | | 58 | | | | | | | |
| South America mining | | 1,402 | | | 411 | | | 57 | | | | | | | |
| Indonesia mining | | 1,730 | | | 526 | | | 57 | | | | | | | |
| Africa mining | | 309 | | | 124 | | | 28 | | | | | | | |
| Molybdenum | | 374 | | | 240 | | | 14 | | | | | | | |
| Rod & Refining | | 1,487 | | | 1,481 | | | 2 | | | | | | | |
| Atlantic Copper Smelting & Refining | | 762 | | | 763 | | | 10 | | | | | | | |
| Corporate, other & eliminations | | (1,703 | ) | | (1,743 | ) | | 6 | | | | | | | |
| As reported in FCX’s consolidated financial statements | $ | 5,709 | | $ | 2,377 | | $ | 232 | | | | | | | |
| a. | Molybdenum by-product credits and revenues reflect volumes produced at market-based pricing and also include tolling revenues at Sierrita. |
| b. | Includes gold and silver product revenues and production costs. |
North America Copper Mines Product Revenues and Production Costs (continued)
| Three Months Ended March 31, 2010 | | | | |
| (In millions) | By-Product | | Co-Product Method | |
| | Method | | Copper | | Molybdenuma | | Otherb | | Total | |
| Revenues, excluding adjustments | $ | 965 | | $ | 965 | | $ | 77 | | $ | 12 | | $ | 1,054 | |
| | | | | | | | | | | | | | | | |
| Site production and delivery, before net noncash | | | | | | | | | | | | | | | |
| and other costs shown below | | 381 | | | 349 | | | 41 | | | 5 | | | 395 | |
By-product creditsa | | (75 | ) | | - | | | - | | | - | | | - | |
| Treatment charges | | 22 | | | 21 | | | - | | | 1 | | | 22 | |
| Net cash costs | | 328 | | | 370 | | | 41 | | | 6 | | | 417 | |
| Depreciation, depletion and amortization | | 78 | | | 74 | | | 4 | | | - | | | 78 | |
| Noncash and other costs, net | | 24 | | | 24 | | | - | | | - | | | 24 | |
| Total costs | | 430 | | | 468 | | | 45 | | | 6 | | | 519 | |
| Revenue adjustments | | (1 | ) | | (1 | ) | | - | | | - | | | (1 | ) |
| Idle facility and other non-inventoriable costs | | (18 | ) | | (18 | ) | | - | | | - | | | (18 | ) |
| Gross profit | $ | 516 | | $ | 478 | | $ | 32 | | $ | 6 | | $ | 516 | |
| | | | | | | | | | | | | | | | |
| Reconciliation to Amounts Reported | | | | | | | | | | | | | | | |
| | | | | | | | Depreciation, | | | | | | | |
| | | | | Production | | | Depletion and | | | | | | | |
| | Revenues | | and Delivery | | | Amortization | | | | | | | |
| Totals presented above | $ | 1,054 | | $ | 395 | | $ | 78 | | | | | | | |
| Treatment charges per above | | N/A | | | 22 | | | N/A | | | | | | | |
| Net noncash and other costs per above | | N/A | | | 24 | | | N/A | | | | | | | |
| Revenue adjustments per above | | (1 | ) | | N/A | | | N/A | | | | | | | |
| Idle facility and other non-inventoriable costs per above | | N/A | | | 18 | | | N/A | | | | | | | |
| Eliminations and other | | 1 | | | 5 | | | 4 | | | | | | | |
| North America copper mines | | 1,054 | | | 464 | | | 82 | | | | | | | |
| South America mining | | 1,069 | | | 376 | | | 61 | | | | | | | |
| Indonesia mining | | 1,459 | | | 475 | | | 63 | | | | | | | |
| Africa mining | | 249 | | | 110 | | | 30 | | | | | | | |
| Molybdenum | | 275 | | | 185 | | | 13 | | | | | | | |
| Rod & Refining | | 1,073 | | | 1,067 | | | 2 | | | | | | | |
| Atlantic Copper Smelting & Refining | | 633 | | | 628 | | | 10 | | | | | | | |
| Corporate, other & eliminations | | (1,449 | ) | | (1,387 | ) | | 10 | | | | | | | |
| As reported in FCX’s consolidated financial statements | $ | 4,363 | | $ | 1,918 | | $ | 271 | | | | | | | |
| a. | Molybdenum by-product credits and revenues reflect volumes produced at market-based pricing and also include tolling revenues at Sierrita. |
| b. | Includes gold and silver product revenues and production costs. |
South America Mining Product Revenues and Production Costs
| Three Months Ended March 31, 2011 | | | | | | | | |
| (In millions) | By-Product | | Co-Product Method | |
| | Method | | Copper | | Other a | | Total | |
| Revenues, excluding adjustments | $ | 1,345 | | $ | 1,345 | | $ | 119 | | $ | 1,464 | |
| | | | | | | | | | | | | |
| Site production and delivery, before net noncash | | | | | | | | | | | | |
| and other costs shown below | | 406 | | | 375 | | | 37 | | | 412 | |
| By-product credits | | (113 | ) | | - | | | - | | | - | |
| Treatment charges | | 59 | | | 59 | | | - | | | 59 | |
| Net cash costs | | 352 | | | 434 | | | 37 | | | 471 | |
| Depreciation, depletion and amortization | | 57 | | | 53 | | | 4 | | | 57 | |
| Noncash and other costs, net | | 5 | | | 5 | | | - | | | 5 | |
| Total costs | | 414 | | | 492 | | | 41 | | | 533 | |
| Revenue adjustments, primarily for pricing on prior | | | | | | | | | | | | |
| period open sales | | 11 | | | (8 | ) | | 19 | | | 11 | |
| Other non-inventoriable costs | | (14 | ) | | (13 | ) | | (1 | ) | | (14 | ) |
| Gross profit | $ | 928 | | $ | 832 | | $ | 96 | | $ | 928 | |
| | | | | | | | | | | | | |
| Reconciliation to Amounts Reported | | | | | | | | | | | | |
| | | | | | | Depreciation, | | | | |
| | | | | Production | | Depletion and | | | | |
| | Revenues | | and Delivery | | Amortization | | | | |
| Totals presented above | $ | 1,464 | | $ | 412 | | $ | 57 | | | | |
| Treatment charges per above | | (59 | ) | | N/A | | | N/A | | | | |
| Net noncash and other costs per above | | N/A | | | 5 | | | N/A | | | | |
| Revenue adjustments, primarily for pricing on prior | | | | | | | | | | | | |
| period open sales per above | | 11 | | | N/A | | | N/A | | | | |
| Other non-inventoriable costs per above | | N/A | | | 14 | | | N/A | | | | |
| Eliminations and other | | (14 | ) | | (20 | ) | | - | | | | |
| South America mining | | 1,402 | | | 411 | | | 57 | | | | |
| North America copper mines | | 1,348 | | | 575 | | | 58 | | | | |
| Indonesia mining | | 1,730 | | | 526 | | | 57 | | | | |
| Africa mining | | 309 | | | 124 | | | 28 | | | | |
| Molybdenum | | 374 | | | 240 | | | 14 | | | | |
| Rod & Refining | | 1,487 | | | 1,481 | | | 2 | | | | |
| Atlantic Copper Smelting & Refining | | 762 | | | 763 | | | 10 | | | | |
| Corporate, other & eliminations | | (1,703 | ) | | (1,743 | ) | | 6 | | | | |
| As reported in FCX’s consolidated financial statements | $ | 5,709 | | $ | 2,377 | | $ | 232 | | | | |
| a. | Includes molybdenum, gold and silver product revenues and production costs. |
South America Mining Product Revenues and Production Costs (continued)
| Three Months Ended March 31, 2010 | | | | | | | | |
| (In millions) | By-Product | | Co-Product Method | |
| | Method | | Copper | | Other a | | Total | |
| Revenues, excluding adjustments | $ | 1,061 | | $ | 1,061 | | $ | 56 | | $ | 1,117 | |
| | | | | | | | | | | | | |
| Site production and delivery, before net noncash | | | | | | | | | | | | |
| and other costs shown below | | 367 | | | 348 | | | 23 | | | 371 | |
| By-product credits | | (51 | ) | | - | | | - | | | - | |
| Treatment charges | | 47 | | | 47 | | | - | | | 47 | |
| Net cash costs | | 363 | | | 395 | | | 23 | | | 418 | |
| Depreciation, depletion and amortization | | 60 | | | 58 | | | 3 | | | 61 | |
| Noncash and other costs, net | | 2 | | | 2 | | | - | | | 2 | |
| Total costs | | 425 | | | 455 | | | 26 | | | 481 | |
| Revenue adjustments, primarily for pricing on prior | | | | | | | | | | | | |
| period open sales | | (2 | ) | | (2 | ) | | - | | | (2 | ) |
| Other non-inventoriable costs | | (8 | ) | | (7 | ) | | (1 | ) | | (8 | ) |
| Gross profit | $ | 626 | | $ | 597 | | $ | 29 | | $ | 626 | |
| | | | | | | | | | | | | |
| Reconciliation to Amounts Reported | | | | | | | | | | | | |
| | | | | | | Depreciation, | | | | |
| | | | | Production | | Depletion and | | | | |
| | Revenues | | and Delivery | | Amortization | | | | |
| Totals presented above | $ | 1,117 | | $ | 371 | | $ | 61 | | | | |
| Treatment charges per above | | (47 | ) | | N/A | | | N/A | | | | |
| Net noncash and other costs per above | | N/A | | | 2 | | | N/A | | | | |
| Revenue adjustments, primarily for pricing on prior | | | | | | | | | | | | |
| period open sales per above | | (2 | ) | | N/A | | | N/A | | | | |
| Other non-inventoriable costs per above | | N/A | | | 8 | | | N/A | | | | |
| Eliminations and other | | 1 | | | (5 | ) | | - | | | | |
| South America mining | | 1,069 | | | 376 | | | 61 | | | | |
| North America copper mines | | 1,054 | | | 464 | | | 82 | | | | |
| Indonesia mining | | 1,459 | | | 475 | | | 63 | | | | |
| Africa mining | | 249 | | | 110 | | | 30 | | | | |
| Molybdenum | | 275 | | | 185 | | | 13 | | | | |
| Rod & Refining | | 1,073 | | | 1,067 | | | 2 | | | | |
| Atlantic Copper Smelting & Refining | | 633 | | | 628 | | | 10 | | | | |
| Corporate, other & eliminations | | (1,449 | ) | | (1,387 | ) | | 10 | | | | |
| As reported in FCX’s consolidated financial statements | $ | 4,363 | | $ | 1,918 | | $ | 271 | | | | |
| a. | Includes molybdenum, gold and silver product revenues and production costs. |
Indonesia Mining Product Revenues and Production Costs
| Three Months Ended March 31, 2011 | | | | |
| (In millions) | By-Product | | Co-Product Method | |
| | Method | | Copper | | Gold | | Silver | | Total | |
| Revenues, excluding adjustments | $ | 1,184 | | $ | 1,184 | | $ | 636 | | $ | 32 | | $ | 1,852 | |
| | | | | | | | | | | | | | | | |
| Site production and delivery, before net noncash | | | | | | | | | | | | | | | |
| and other costs shown below | | 511 | | | 327 | | | 175 | | | 9 | | | 511 | |
| Gold and silver credits | | (650 | ) | | - | | | - | | | - | | | - | |
| Treatment charges | | 49 | | | 31 | | | 17 | | | 1 | | | 49 | |
| Royalty on metals | | 45 | | | 29 | | | 16 | | | - | | | 45 | |
| Net cash (credits) costs | | (45 | ) | | 387 | | | 208 | | | 10 | | | 605 | |
| Depreciation and amortization | | 57 | | | 36 | | | 20 | | | 1 | | | 57 | |
| Noncash and other costs, net | | 15 | | | 10 | | | 4 | | | 1 | | | 15 | |
| Total costs | | 27 | | | 433 | | | 232 | | | 12 | | | 677 | |
| Revenue adjustments, primarily for pricing on prior | | | | | | | | | | | | | | | |
| period open sales | | (10 | ) | | (10 | ) | | (17 | ) | | (1 | ) | | (28 | ) |
| PT Smelting intercompany loss | | 48 | | | 31 | | | 16 | | | 1 | | | 48 | |
| Gross profit | $ | 1,195 | | $ | 772 | | $ | 403 | | $ | 20 | | $ | 1,195 | |
| | | | | | | | | | | | | | | | |
| Reconciliation to Amounts Reported | | | | | | | | | | | | | | | |
| (In millions) | | | | | Depreciation, | | | | | | | |
| | | | Production | | Depletion and | | | | | | | |
| | Revenues | | and Delivery | | Amortization | | | | | | | |
| Totals presented above | $ | 1,852 | | $ | 511 | | $ | 57 | | | | | | | |
| Treatment charges per above | | (49 | ) | | N/A | | | N/A | | | | | | | |
| Royalty on metals per above | | (45 | ) | | N/A | | | N/A | | | | | | | |
| Net noncash and other costs per above | | N/A | | | 15 | | | N/A | | | | | | | |
| Revenue adjustments, primarily for pricing on prior | | | | | | | | | | | | | | | |
| period open sales per above | | (28 | ) | | N/A | | | N/A | | | | | | | |
| Indonesia mining | | 1,730 | | | 526 | | | 57 | | | | | | | |
| North America copper mines | | 1,348 | | | 575 | | | 58 | | | | | | | |
| South America mining | | 1,402 | | | 411 | | | 57 | | | | | | | |
| Africa mining | | 309 | | | 124 | | | 28 | | | | | | | |
| Molybdenum | | 374 | | | 240 | | | 14 | | | | | | | |
| Rod & Refining | | 1,487 | | | 1,481 | | | 2 | | | | | | | |
| Atlantic Copper Smelting & Refining | | 762 | | | 763 | | | 10 | | | | | | | |
| Corporate, other & eliminations | | (1,703 | ) | | (1,743 | ) | | 6 | | | | | | | |
| As reported in FCX’s consolidated financial statements | $ | 5,709 | | $ | 2,377 | | $ | 232 | | | | | | | |
Indonesia Mining Product Revenues and Production Costs (continued)
| Three Months Ended March 31, 2010 | | | | |
| (In millions) | By-Product | | Co-Product Method | |
| | Method | | Copper | | Gold | | Silver | | Total | |
| Revenues, excluding adjustments | $ | 1,039 | | $ | 1,039 | | $ | 508 | | $ | 22 | | $ | 1,569 | |
| | | | | | | | | | | | | | | | |
| Site production and delivery, before net noncash | | | | | | | | | | | | | | | |
| and other costs shown below | | 456 | | | 302 | | | 148 | | | 6 | | | 456 | |
| Gold and silver credits | | (530 | ) | | - | | | - | | | - | | | - | |
| Treatment charges | | 67 | | | 44 | | | 21 | | | 2 | | | 67 | |
| Royalty on metals | | 36 | | | 24 | | | 12 | | | - | | | 36 | |
| Net cash costs | | 29 | | | 370 | | | 181 | | | 8 | | | 559 | |
| Depreciation and amortization | | 63 | | | 42 | | | 21 | | | - | | | 63 | |
| Noncash and other costs, net | | 19 | | | 13 | | | 6 | | | - | | | 19 | |
| Total costs | | 111 | | | 425 | | | 208 | | | 8 | | | 641 | |
| Revenue adjustments, primarily for pricing on prior | | | | | | | | | | | | | | | |
| period open sales | | (7 | ) | | (7 | ) | | 1 | | | (1 | ) | | (7 | ) |
| PT Smelting intercompany loss | | 12 | | | 8 | | | 4 | | | - | | | 12 | |
| Gross profit | $ | 933 | | $ | 615 | | $ | 305 | | $ | 13 | | $ | 933 | |
| | | | | | | | | | | | | | | | |
| Reconciliation to Amounts Reported | | | | | | | | | | | | | | | |
| | | | | | Depreciation, | | | | | | | |
| | | | Production | | Depletion and | | | | | | | |
| | Revenues | | and Delivery | | Amortization | | | | | | | |
| Totals presented above | $ | 1,569 | | $ | 456 | | $ | 63 | | | | | | | |
| Treatment charges per above | | (67 | ) | | N/A | | | N/A | | | | | | | |
| Royalty on metals per above | | (36 | ) | | N/A | | | N/A | | | | | | | |
| Net noncash and other costs per above | | N/A | | | 19 | | | N/A | | | | | | | |
| Revenue adjustments, primarily for pricing on prior | | | | | | | | | | | | | | | |
| period open sales per above | | (7 | ) | | N/A | | | N/A | | | | | | | |
| Indonesia mining | | 1,459 | | | 475 | | | 63 | | | | | | | |
| North America copper mines | | 1,054 | | | 464 | | | 82 | | | | | | | |
| South America mining | | 1,069 | | | 376 | | | 61 | | | | | | | |
| Africa mining | | 249 | | | 110 | | | 30 | | | | | | | |
| Molybdenum | | 275 | | | 185 | | | 13 | | | | | | | |
| Rod & Refining | | 1,073 | | | 1,067 | | | 2 | | | | | | | |
| Atlantic Copper Smelting & Refining | | 633 | | | 628 | | | 10 | | | | | | | |
| Corporate, other & eliminations | | (1,449 | ) | | (1,387 | ) | | 10 | | | | | | | |
| As reported in FCX’s consolidated financial statements | $ | 4,363 | | $ | 1,918 | | $ | 271 | | | | | | | |
Africa Mining Product Revenues and Production Costs
| Three Months Ended March 31, 2011 | | | | | | | | |
| (In millions) | By-Product | | Co-Product Method | |
| | Method | | Copper | | Cobalt | | Total | |
Revenues, excluding adjustmentsa | $ | 249 | | $ | 249 | | $ | 64 | | $ | 313 | |
| | | | | | | | | | | | | |
| Site production and delivery, before net noncash | | | | | | | | | | | | |
| and other costs shown below | | 90 | | | 80 | | | 32 | | | 112 | |
Cobalt creditsb | | (45 | ) | | - | | | - | | | - | |
| Royalty on metals | | 6 | | | 5 | | | 1 | | | 6 | |
| Net cash costs | | 51 | | | 85 | | | 33 | | | 118 | |
| Depreciation, depletion and amortization | | 28 | | | 23 | | | 5 | | | 28 | |
| Noncash and other costs, net | | 9 | | | 8 | | | 1 | | | 9 | |
| Total costs | | 88 | | | 116 | | | 39 | | | 155 | |
| Revenue adjustments, primarily for pricing on prior | | | | | | | | | | | | |
| period open sales | | (1 | ) | | (1 | ) | | 3 | | | 2 | |
| Other non-inventoriable costs | | (3 | ) | | (2 | ) | | (1 | ) | | (3 | ) |
| Gross profit | $ | 157 | | $ | 130 | | $ | 27 | | $ | 157 | |
| | | | | | | | | | | | | |
| Reconciliation to Amounts Reported | | | | | | | | | | | | |
| | | | | | | Depreciation, | | | | |
| | | | | Production | | Depletion and | | | | |
| | Revenues | | and Delivery | | Amortization | | | | |
| Totals presented above | $ | 313 | | $ | 112 | | $ | 28 | | | | |
| Royalty on metals per above | | (6 | ) | | N/A | | | N/A | | | | |
| Net noncash and other costs per above | | N/A | | | 9 | | | N/A | | | | |
| Revenue adjustments, primarily for pricing on prior | | | | | | | | | | | | |
| period open sales per above | | 2 | | | N/A | | | N/A | | | | |
| Other non-inventoriable costs per above | | N/A | | | 3 | | | N/A | | | | |
| Africa mining | | 309 | | | 124 | | | 28 | | | | |
| North America copper mines | | 1,348 | | | 575 | | | 58 | | | | |
| South America mining | | 1,402 | | | 411 | | | 57 | | | | |
| Indonesia mining | | 1,730 | | | 526 | | | 57 | | | | |
| Molybdenum | | 374 | | | 240 | | | 14 | | | | |
| Rod & Refining | | 1,487 | | | 1,481 | | | 2 | | | | |
| Atlantic Copper Smelting & Refining | | 762 | | | 763 | | | 10 | | | | |
| Corporate, other & eliminations | | (1,703 | ) | | (1,743 | ) | | 6 | | | | |
| As reported in FCX’s consolidated financial statements | $ | 5,709 | | $ | 2,377 | | $ | 232 | | | | |
| a. | Includes adjustments for point-of-sale transportation costs as negotiated in customer contracts. |
| b. | Net of cobalt downstream processing and freight costs. |
Africa Mining Product Revenues and Production Costs (continued)
| Three Months Ended March 31, 2010 | | | | | | | | |
| (In millions) | By-Product | | Co-Product Method | |
| | Method | | Copper | | Cobalt | | Total | |
Revenues, excluding adjustmentsa | $ | 214 | | $ | 214 | | $ | 35 | | $ | 249 | |
| | | | | | | | | | | | | |
| Site production and delivery, before net noncash | | | | | | | | | | | | |
| and other costs shown below | | 90 | | | 87 | | | 16 | | | 103 | |
Cobalt creditsb | | (26 | ) | | - | | | - | | | - | |
| Royalty on metals | | 5 | | | 5 | | | - | | | 5 | |
| Net cash costs | | 69 | | | 92 | | | 16 | | | 108 | |
| Depreciation, depletion and amortization | | 30 | | | 23 | | | 7 | | | 30 | |
| Noncash and other costs, net | | 1 | | | 1 | | | - | | | 1 | |
| Total costs | | 100 | | | 116 | | | 23 | | | 139 | |
| Revenue adjustments, primarily for pricing on prior | | | | | | | | | | | | |
| period open sales | | - | | | - | | | 4 | | | 4 | |
| Other non-inventoriable costs | | (6 | ) | | (5 | ) | | (1 | ) | | (6 | ) |
| Gross profit | $ | 108 | | $ | 93 | | $ | 15 | | $ | 108 | |
| | | | | | | | | | | | | |
| Reconciliation to Amounts Reported | | | | | | | | | | | | |
| | | | | | | Depreciation, | | | | |
| | | | | Production | | Depletion and | | | | |
| | Revenues | | and Delivery | | Amortization | | | | |
| Totals presented above | $ | 249 | | $ | 103 | | $ | 30 | | | | |
| Royalty on metals per above | | (5 | ) | | N/A | | | N/A | | | | |
| Net noncash and other costs per above | | N/A | | | 1 | | | N/A | | | | |
| Revenue adjustments, primarily for pricing on prior | | | | | | | | | | | | |
| period open sales per above | | 4 | | | N/A | | | N/A | | | | |
| Other non-inventoriable costs per above | | N/A | | | 6 | | | N/A | | | | |
| Eliminations and other | | 1 | | | - | | | - | | | | |
| Africa mining | | 249 | | | 110 | | | 30 | | | | |
| North America copper mines | | 1,054 | | | 464 | | | 82 | | | | |
| South America mining | | 1,069 | | | 376 | | | 61 | | | | |
| Indonesia mining | | 1,459 | | | 475 | | | 63 | | | | |
| Molybdenum | | 275 | | | 185 | | | 13 | | | | |
| Rod & Refining | | 1,073 | | | 1,067 | | | 2 | | | | |
| Atlantic Copper Smelting & Refining | | 633 | | | 628 | | | 10 | | | | |
| Corporate, other & eliminations | | (1,449 | ) | | (1,387 | ) | | 10 | | | | |
| As reported in FCX’s consolidated financial statements | $ | 4,363 | | $ | 1,918 | | $ | 271 | | | | |
| a. | Includes adjustments for point-of-sale transportation costs as negotiated in customer contracts. |
| b. | Net of cobalt downstream processing and freight costs. |
Henderson Molybdenum Mine Product Revenues and Production Costs
| | Three Months Ended March 31, | | | | |
| (In millions) | 2011 | | 2010 | | | | |
| Revenues, excluding adjustments | $ | 172 | | $ | 139 | | | | |
| | | | | | | | | | |
| Site production and delivery, before net noncash | | | | | | | | | |
| and other costs shown below | | 52 | | | 42 | | | | |
| Treatment charges and other | | 9 | | | 10 | | | | |
| Net cash costs | | 61 | | | 52 | | | | |
| Depreciation, depletion and amortization | | 9 | | | 8 | | | | |
| Noncash and other costs, net | | - | | | 1 | | | | |
| Total costs | | 70 | | | 61 | | | | |
Gross profita | $ | 102 | | $ | 78 | | | | |
| | | | | | | | | | |
Reconciliation to Amounts Reported | | | | Production | | Depreciation, | |
| | | | | and | | Depletion and | |
| | | Revenues | | Delivery | | Amortization | |
| Three Months Ended March 31, 2011 | | | | | | | | | |
| Totals presented above | $ | 172 | | $ | 52 | | $ | 9 | |
| Treatment charges and other per above | | (9 | ) | | N/A | | | N/A | |
| Net noncash and other costs per above | | N/A | | | - | | | N/A | |
| Henderson mine | | 163 | | | 52 | | | 9 | |
Other molybdenum operations and eliminationsb | | 211 | | | 188 | | | 5 | |
| Molybdenum | | 374 | | | 240 | | | 14 | |
| North America copper mines | | 1,348 | | | 575 | | | 58 | |
| South America mining | | 1,402 | | | 411 | | | 57 | |
| Indonesia mining | | 1,730 | | | 526 | | | 57 | |
| Africa mining | | 309 | | | 124 | | | 28 | |
| Rod & Refining | | 1,487 | | | 1,481 | | | 2 | |
| Atlantic Copper Smelting & Refining | | 762 | | | 763 | | | 10 | |
| Corporate, other & eliminations | | (1,703 | ) | | (1,743 | ) | | 6 | |
| As reported in FCX’s consolidated financial statements | $ | 5,709 | | $ | 2,377 | | $ | 232 | |
| | | | | | | | | | |
| Three Months Ended March 31, 2010 | | | | | | | | | |
| Totals presented above | $ | 139 | | $ | 42 | | $ | 8 | |
| Treatment charges and other per above | | (10 | ) | | N/A | | | N/A | |
| Net noncash and other costs per above | | N/A | | | 1 | | | N/A | |
| Henderson mine | | 129 | | | 43 | | | 8 | |
Other molybdenum operations and eliminationsb | | 146 | | | 142 | | | 5 | |
| Molybdenum | | 275 | | | 185 | | | 13 | |
| North America copper mines | | 1,054 | | | 464 | | | 82 | |
| South America mining | | 1,069 | | | 376 | | | 61 | |
| Indonesia mining | | 1,459 | | | 475 | | | 63 | |
| Africa mining | | 249 | | | 110 | | | 30 | |
| Rod & Refining | | 1,073 | | | 1,067 | | | 2 | |
| Atlantic Copper Smelting & Refining | | 633 | | | 628 | | | 10 | |
| Corporate, other & eliminations | | (1,449 | ) | | (1,387 | ) | | 10 | |
| As reported in FCX’s consolidated financial statements | $ | 4,363 | | $ | 1,918 | | $ | 271 | |
| a. | Gross profit reflects sales of Henderson products based on volumes produced at market-based pricing. On a consolidated basis, the Molybdenum division includes profits on sales as they are made to third parties and realizations based on actual contract terms. As a result, the actual gross profit realized will differ from the amounts reported in this table. |
| b. | Primarily includes amounts associated with the molybdenum sales company, which includes sales of molybdenum produced by our North and South America copper mines. |
CAUTIONARY STATEMENT
Our discussion and analysis contains forward-looking statements in which we discuss factors we believe may affect our future performance. Forward-looking statements are all statements other than statements of historical facts, such as those statements regarding projected ore grades and milling rates, projected production and sales volumes, projected unit net cash costs, projected operating cash flows, projected capital expenditures, exploration efforts and results, mine production and development plans, the impact of deferred intercompany profits on earnings, liquidity, other financial commitments and tax rates, the impact of copper, gold, molybdenum and cobalt price changes, potential prepayments of debt, future dividend payments and potential share purchases. The words “anticipates,” “may,” “can,” “plans,” “believes,” “estimates,” “expects,” “projects,” “intends,” “likely,” “will,” “should,” “to be,” and any similar expressions are intended to identify those assertions as forward-looking statements. The declaration of dividends is at the discretion of our Board and will depend on our financial results, cash requirements, future prospects, and other factors deemed relevant by the Board.
In making any forward-looking statements, we believe that the expectations are based on reasonable assumptions. We caution readers that those statements are not guarantees of future performance and our actual results may differ materially from those anticipated, projected or assumed in the forward-looking statements. Important factors that can cause our actual results to differ materially from those anticipated in the forward-looking statements include commodity prices, mine sequencing, production rates, industry risks, regulatory changes, political risks, the potential effects of violence in Indonesia, the resolution of administrative disputes in the Democratic Republic of Congo, weather-related risks, labor relations, environmental risks, litigation results, currency translation risks and other factors described in more detail under the heading “Risk Factors” in our Annual Report on Form 10-K for the year ended December 31, 2010, filed with the SEC.
Investors are cautioned that many of the assumptions on which our forward-looking statements are based are likely to change after our forward-looking statements are made, including for example commodity prices, which we cannot control, and production volumes and costs, some aspects of which we may or may not be able to control. Further, we may make changes to our business plans that could or will affect our results. We caution investors that we do not intend to update our forward-looking statements notwithstanding any changes in our assumptions, changes in our business plans, our actual experience, or other changes, and we undertake no obligation to update any forward-looking statements more frequently than quarterly.
Item 3. Quantitative and Qualitative Disclosures About Market Risk.
There have been no material changes in our market risks during the three months ended March 31, 2011. For additional information on market risks, refer to “Disclosures About Market Risks” included in Part II, Item 7A of our annual report on Form 10-K for the year ended December 31, 2010. For projected sensitivities of our operating cash flow to changes in commodity prices, refer to “Outlook” in Part I, Item 2 of this quarterly report on Form 10-Q; for projected sensitivities of our provisionally priced copper sales to changes in commodity prices refer to “Consolidated Results – Revenues” in Part I, Item 2 of this quarterly report on Form 10-Q.
Item 4. Controls and Procedures.
| (a) | Evaluation of disclosure controls and procedures. Our chief executive officer and chief financial officer, with the participation of management, have evaluated the effectiveness of our “disclosure controls and procedures” (as defined in Rules 13a-15(e) and 15(d)-15(e) under the Securities Exchange Act of 1934) as of the end of the period covered by this quarterly report on Form 10-Q. Based on their evaluation, they have concluded that our disclosure controls and procedures are effective as of the end of the period covered by this report. |
| (b) | Changes in internal control. There has been no change in our internal control over financial reporting that occurred during the quarter ended March 31, 2011, that has materially affected, or is reasonably likely to materially affect, our internal control over financial reporting. |
PART II. OTHER INFORMATION
Item 1. Legal Proceedings.
We are involved in various legal proceedings that arise in the ordinary course of our business or are associated with environmental issues arising from legacy operations conducted over the years by Phelps Dodge Corporation and its affiliates. We are also involved from time to time in other reviews, investigations and proceedings by government agencies, some of which may result in adverse judgments, settlements, fines, penalties, injunctions or other relief. There have been no new material legal proceedings and no material changes to the information included in Part I, Item 3. “Legal Proceedings,” of our report on Form 10-K for the year ended December 31, 2010. Management does not believe, based on currently available information, that the outcome of any proceeding reported in “Legal Proceedings” in our report on Form 10-K for the year ended December 31, 2010, will have a material adverse effect on our financial condition, although individual outcomes could be material to our operating results for a particular period, depending on the nature and magnitude of the outcome and the operating results for the period.
There have been no material changes to our risk factors during the three months ended March 31, 2011. For additional information on risk factors, refer to Part I, Item 1A. “Risk Factors” in our report on Form 10-K for the year ended December 31, 2010.
Item 2. Unregistered Sales of Equity Securities and Use of Proceeds.
| (c) | The following table sets forth information with respect to shares of Freeport-McMoRan Copper & Gold Inc. (FCX) common stock purchased by us during the three months ended March 31, 2011: |
| | | | | | | (c) Total Number of | | (d) Maximum Number |
| | | (a) Total Number | | (b) Average | | Shares Purchased as Part | | of Shares That May |
| | | of Shares | | Price Paid | | of Publicly Announced | | Yet Be Purchased Under |
| Period | | Purchaseda | | Per Share | | Plans or Programsb | | the Plans or Programsb |
| January 1-31, 2011 | | - | | $ | - | | - | | 23,685,500 |
| February 1-28, 2011 | | 328,497 | | $ | 56.26 | | - | | 23,685,500 |
| March 1-31, 2011 | | - | | $ | - | | - | | 23,685,500 |
| Total | | 328,497 | | $ | 56.26 | | - | | 23,685,500 |
| | | | | | | | | | |
| a. | Consists of shares repurchased under FCX’s applicable stock incentive plans, which were repurchased to satisfy tax obligations on restricted stock awards and to cover the cost of option exercises. |
| b. | On July 21, 2008, our Board of Directors approved an increase in our open-market share purchase program for up to 30 million shares. This program does not have an expiration date. |
Item 4. Mine Safety Disclosure.
The safety and health of all our employees are of the highest priority. Management believes that safety and health considerations are integral to, and compatible with, all other functions in the organization and that proper safety and health management will enhance production and reduce costs. Our approach towards the health and safety of our workforce is to continuously improve performance through implementing robust management systems and providing adequate training, safety incentive and occupational health programs. Refer to Exhibit 99.1 for mine safety disclosures required to be disclosed in accordance with Section 1503(a) of the Dodd-Frank Wall Street Reform and Consumer Protection Act.
The exhibits to this report are listed in the Exhibit Index beginning on Page E-1 hereof.
FREEPORT-McMoRan COPPER & GOLD INC.
SIGNATURE
Pursuant to the requirements of the Securities Exchange Act of 1934, the registrant has duly caused this report to be signed on its behalf by the undersigned hereunto duly authorized.
FREEPORT-McMoRan COPPER & GOLD INC.
By: /s/ C. Donald Whitmire, Jr.
C. Donald Whitmire, Jr.
Vice President and
Controller – Financial Reporting
(authorized signatory and
Principal Accounting Officer)
Date: May 6, 2011
FREEPORT-McMoRan COPPER & GOLD INC. |
| EXHIBIT INDEX |
| | | Filed | |
| Exhibit | | with this | Incorporated by Reference |
| | | | | |
| 3.1 | Composite Certificate of Incorporation of FCX. | | 10-Q | 001-11307-01 | 08/06/2010 |
| 3.2 | Amended and Restated By-Laws of FCX, as amended through February 2, 2010. | | 8-K | 001-11307-01 | 02/05/2010 |
| Credit Agreement dated as of March 30, 2011, among FCX, the Lenders party thereto, the Issuing Banks party thereto, JPMorgan Chase Bank, N.A. as Administrative Agent and Bank of America, N.A., as Syndication Agent. | X | | | |
| 10.2* | Amendment to Amended and Restated Executive Employment Agreement by and between Freeport-McMoRan Copper & Gold Inc. and Richard C. Adkerson. | | 8-K | 001-11307-01 | 04/28/2011 |
| 10.3* | Amendment to Amended and Restated Executive Employment Agreement by and between Freeport-McMoRan Copper & Gold Inc. and Kathleen L. Quirk. | | 8-K | 001-11307-01 | 04/28/2011 |
| Addendum No. 1 to the Amended and Restated Shareholders Agreement dated as of September 28, 2005, among La Générale des Carrières et des Mines and TF Holdings Limited, Chui Ltd., Faru Ltd., Mboko Ltd., Mofia Ltd., Tembo Ltd., and Tenke Fungurume Mining S.A.R.L., dated as of December 11, 2010. | X | | | |
| Addendum No. 1 to the Amended and Restated Mining Convention dated as of September 28, 2005, among the Democratic Republic of Congo, La Générale des Carrières et des Mines, TF Holdings Limited and Tenke Fungurume Mining S.A.R.L., dated as of December 11, 2010. | X | | | |
| FCX Director Compensation. | X | | | |
| Letter from Ernst & Young LLP regarding unaudited interim financial statements. | X | | | |
| Certification of Principal Executive Officer pursuant to Rule 13a-14(a)/15d – 14(a). | X | | | |
| Certification of Principal Financial Officer pursuant to Rule 13a-14(a)/15d – 14(a). | X | | | |
| Certification of Principal Executive Officer pursuant to 18 U.S.C. Section 1350. | X | | | |
| Certification of Principal Financial Officer pursuant to 18 U.S.C Section 1350. | X | | | |
| Mine Safety and Health Administration Safety Data. | X | | | |
| 101.INS | XBRL Instance Document. | X | | | |
| 101.SCH | XBRL Taxonomy Extension Schema. | X | | | |
| 101.CAL | XBRL Taxonomy Extension Calculation Linkbase. | X | | | |
| 101.DEF | XBRL Taxonomy Extension Definition Linkbase. | X | | | |
| 101.LAB | XBRL Taxonomy Extension Label Linkbase. | X | | | |
| 101.PRE | XBRL Taxonomy Extension Presentation Linkbase. | X | | | |
(*) Indicates management contract or compensatory plan or arrangement.