Barings Participation Investors
TO OUR SHAREHOLDERS
July 31, 2018
We are pleased to present the June 30, 2018 Quarterly Report of Barings Participation Investors (the "Trust").
The Board of Trustees declared a quarterly dividend of $0.27 per share, payable on August 17, 2018 to shareholders of record on August 6, 2018. The Trust paid a $0.27 per share dividend for the preceding quarter. The Trust earned $0.26 per share of net investment income for the first quarter of 2018, compared to $0.26 per share, including $0.01 per share of non-recurring income, in the previous quarter.
During the second quarter, the net assets of the Trust decreased to $143,947,536 or $13.72 per share compared to $145,920,470 or $13.93 per share on March 31, 2018. This translates into a 0.4% total return for the quarter, based on the change in the Trust's net assets assuming the reinvestment of all dividends. Longer term, the Trust returned 6.2%, 7.8%, 9.8%, 9.9% and 11.6% for the 1, 3, 5, 10, and 25-year periods, respectively, based on the change in the Trust's net assets assuming the reinvestment of all dividends.
The Trust's share price was unchanged during the quarter, from $14.70 per share as of March 31, 2018 to $14.70 per share as of June 30, 2018, which resulted in a total return of 1.9%. The Trust's market price of $14.70 per share equates to a 7.1% premium over the June 30, 2018 net asset value per share of $13.72. The Trust's average quarter-end premium for the 3, 5 and 10-year periods was 4.3%, 1.8% and 6.3%, respectively U.S. equity markets, as approximated by the Russell 2000 Index, increased 7.8% for the quarter. U.S. fixed income markets, as approximated by the Bloomberg Barclays U.S. Corporate High Yield Index, increased 1.0% for the quarter.
The Trust closed five new private placement investments and four add-on investments to existing portfolio companies during the second quarter. The five new investments were in Cadence, Inc., Discovery Education, E.S.P. Associates, Trident Maritime Systems and VP Holding Company. The four add-on investments were in CORA Health Services, CTM Holding, Inc., ECG Consulting Group and Hollandia Produce LLC. A brief description of these investments can be found in the Consolidated Schedule of Investments. The total amount invested by the Trust in these transactions was $10,385,166.
It was a strong quarter for the Trust in terms of new investments. As noted above, the Trust closed five new investments and four add-on investments. The expansion of the Trust's target investment criteria in late 2017 into a broader set of the middle market private debt market along with the expansion of Barings', the Trust's investment adviser, private debt platform, have been key contributors to new investment volume. Overall, market conditions remain extremely competitive with purchase price and leverage multiples remaining at or near historical highs, and there continues to be a large supply of debt capital seeking middle-market investment opportunities. As always, we've continued to be selective in our investment choices and maintain our underwriting discipline.
The Trust's remaining portfolio remains in good condition. There were four private debt investment exits during the quarter, all of which resulted in realized gains. In addition, one company fully prepaid and two companies partially prepaid debt held by the Trust. There are several companies in which the Trust has outstanding investments that are in the process of being sold and we are cautiously optimistic about realization activity over the next few quarters.
The Trust was able to maintain its $0.27 per share quarterly dividend in the first quarter. However, the Trust's recurring investment income was not sufficient to cover this quarter's dividend. As discussed in prior reports, generally since 2013, recurring investment income alone has not been sufficient to fully fund the current dividend rate principally due to the considerable reduction in the number of private debt securities in the portfolio resulting from the high level of exits and prepayment activity that occurred from 2013 through 2015, combined with generally lower investment returns available due to market and competitive dynamics over the past several years. As referenced above, the Trust's expansion of its target investment criteria in 2017 has allowed for increased private debt investment opportunities, and as a result, higher recurring investment income than the Trust has experienced over the past several years. Also, with the elimination of the Trust's fundamental investment restrictions relating to credit ratings (See Note 9) the Trust is now permitted to invest in opportunities that such restrictions would have precluded, which could result in higher recurring investment income. However, recurring investment income still fell slightly lower than this quarter's dividend. The level of expected recurring investment income generated by the Trust in 2018, combined with the availability of earnings carry forwards and other non-recurring income, is expected to be sufficient to maintain the current dividend rate over the next several quarters. However, until recurring investment income consistently reaches a level equal to the current dividend rate, there is the risk that the dividend may need to be reduced in the future.
(Continued)
Thank you for your continued interest in and support of Barings Participation Investors.
Sincerely,
Robert M. Shettle
President
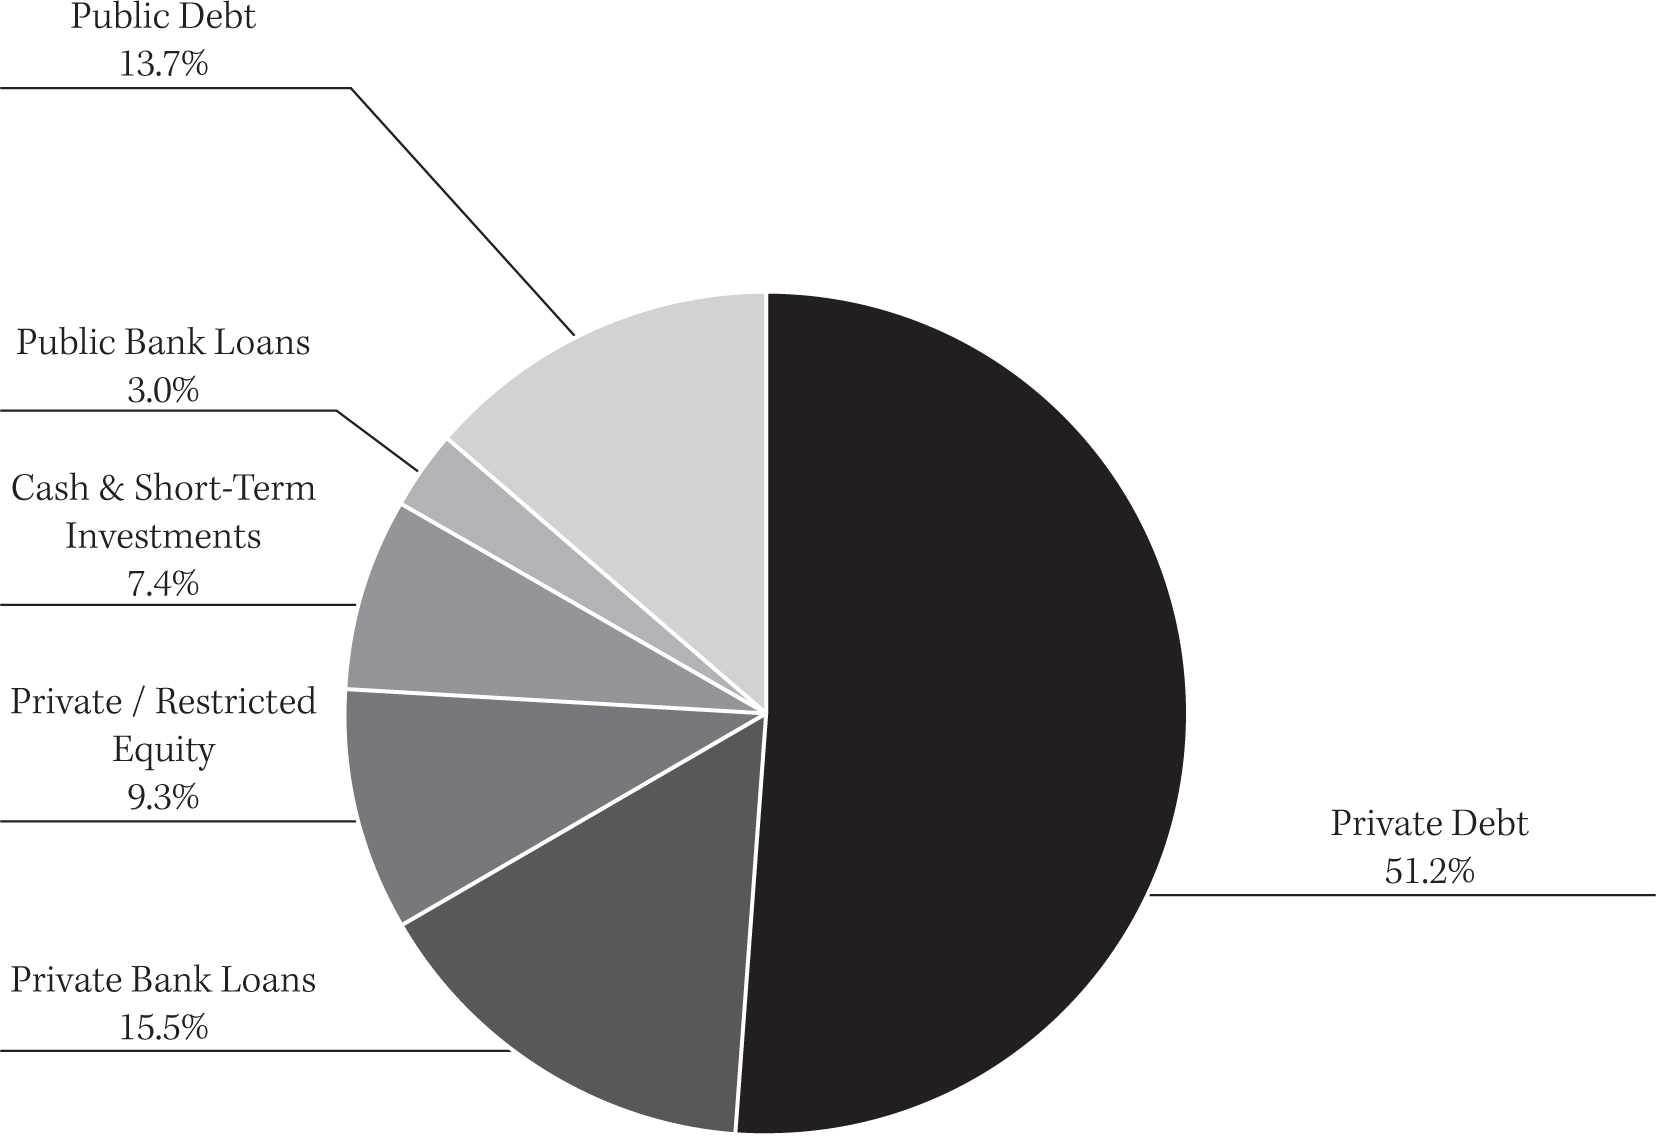
Portfolio Composition as of 6/30/18*
* Based on market value of total investments (including cash)
Cautionary Notice: Certain statements contained in this report may be "forward looking" statements. Investors are cautioned not to place undue reliance on forward-looking statements, which speak only as of the date on which they are made and which reflect management's current estimates, projections, expectations or beliefs, and which are subject to risks and uncertainties that may cause actual results to differ materially. These statements are subject to change at any time based upon economic, market or other conditions and may not be relied upon as investment advice or an indication of the Trust's trading intent. References to specific securities are not recommendations of such securities, and may not be representative of the Trust's current or future investments. We undertake no obligation to publicly update forward looking statements, whether as a result of new information, future events, or otherwise.
Barings Participation Investors
CONSOLIDATED STATEMENT OF ASSETS AND LIABILITIES
June 30, 2018
(Unaudited)
| | | | |
| Assets: | | | |
Investments (See Consolidated Schedule of Investments) | | | |
Corporate restricted securities at fair value
(Cost - $109,561,085) | | $ | 105,436,956 | |
Corporate restricted securities at market value
(Cost - $15,329,617) | | | 15,090,480 | |
Corporate public securities at market value
(Cost - $26,639,962) | | | 26,435,516 | |
| | | | | |
| Total investments (Cost - $151,530,664) | | | 146,962,952 | |
| Cash | | | 12,494,002 | |
| Interest receivable | | | 1,135,605 | |
| Other assets | | | 120,137 | |
| | | | | |
| Total assets | | | 160,712,696 | |
| | | | | |
| | | | | |
| Liabilities: | | | | |
| Note payable | | | 15,000,000 | |
| Payable for investments purchased | | | 809,537 | |
| Deferred tax liability | | | 448,095 | |
| Investment advisory fee payable | | | 323,882 | |
| Interest payable | | | 27,267 | |
| Accrued expenses | | | 156,379 | |
| | | | | |
| Total liabilities | | | 16,765,160 | |
| | | | | |
| Commitments and Contingencies (See Note 8) | | | | |
| Total net assets | | $ | 143,947,536 | |
| | | | | |
| | | | | |
| Net Assets: | | | | |
| Common shares, par value $.01 per share | | $ | 104,935 | |
| Additional paid-in capital | | | 94,989,278 | |
| Retained net realized gain on investments, prior years | | | 44,296,000 | |
| Undistributed net investment income | | | 3,353,269 | |
| Accumulated net realized gain on investments | | | 6,219,861 | |
| Net unrealized depreciation of investments | | | (5,015,807 | ) |
| | | | | |
| Total net assets | | $ | 143,947,536 | |
| | | | | |
| Common shares issued and outstanding (14,787,750 authorized) | | | 10,493,532 | |
| | | | | |
| Net asset value per share | | $ | 13.72 | |
| | | | | |
See Notes to Consolidated Financial Statements
CONSOLIDATED STATEMENT OF OPERATIONS
For the six months ended June 30, 2018
(Unaudited)
| Investment Income: | | | |
| Interest | | $ | 6,508,364 | |
| Dividends | | | 180,183 | |
| Other | | | 63,713 | |
| | | | | |
| Total investment income | | | 6,752,260 | |
| | | | | |
| | | | | |
| Expenses: | | | | |
| Investment advisory fees | | | 652,203 | |
| Interest | | | 306,750 | |
| Trustees' fees and expenses | | | 120,000 | |
| Professional fees | | | 111,130 | |
| Reports to shareholders | | | 48,000 | |
| Custodian fees | | | 12,000 | |
| Other | | | 50,589 | |
| | | | | |
| Total expenses | | | 1,300,672 | |
| | | | | |
| Investment income - net | | | 5,451,588 | |
| | | | | |
| | | | | |
| Net realized and unrealized loss on investments: | | | | |
| Net realized gain on investments before taxes | | | 4,190,415 | |
| Income tax expense | | | (288,488 | ) |
| | | | | |
| | | | | |
| Net realized gain on investments after taxes | | | 3,901,927 | |
| | | | | |
| Net increase (decrease) in unrealized appreciation (depreciation) of investments before taxes | | | (8,880,857 | ) |
| Net (increase) decrease in deferred income tax expense | | | 321,618 | |
| | | | | |
| | | | | |
| Net increase (decrease) in unrealized appreciation (depreciation) of investments after taxes | | | (8,559,239 | ) |
| | | | | |
| Net loss on investments | | | (4,657,312 | ) |
| | | | | |
| Net increase in net assets resulting from operations | | $ | 794,276 | |
| | | | | |
See Notes to Consolidated Financial Statements
Barings Participation Investors
CONSOLIDATED STATEMENT OF CASH FLOWS
For the six months ended June 30, 2018
(Unaudited)
| Net increase in cash: | | | |
| Cash flows from operating activities: | | | |
| Purchases/Proceeds/Maturities from short-term portfolio securities, net | | $ | 6,084,599 | |
| Purchases of portfolio securities | | | (22,735,203 | ) |
| Proceeds from disposition of portfolio securities | | | 26,240,390 | |
| Interest, dividends and other income received | | | 5,684,461 | |
| Interest expense paid | | | (306,750 | ) |
| Operating expenses paid | | | (994,326 | ) |
| Income taxes paid | | | (2,101,837 | ) |
| Net cash provided by operating activities | | | 11,871,334 | |
| | | | | |
| Cash flows from financing activities: | | | | |
| Cash dividends paid from net investment income | | | (5,652,336 | ) |
| Receipts for shares issued on reinvestment of dividends | | | 501,827 | |
| Net cash used for financing activities | | | (5,150,509 | ) |
| Net increase in cash | | | 6,720,825 | |
| Cash - beginning of period | | | 5,773,177 | |
| Cash - end of period | | $ | 12,494,002 | |
| | | | | |
| | | | | |
Reconciliation of net increase in net assets to net cash provided by operating activities: | | | | |
| | | | | |
| Net increase in net assets resulting from operations | | $ | 794,276 | |
| Decrease in investments | | | 12,337,669 | |
| Decrease in interest receivable | | | 159,346 | |
| Increase in other assets | | | (94,123 | ) |
| Increase in payable for investments purchased | | | 809,537 | |
| Decrease in deferred tax liability | | | (321,618 | ) |
| Decrease in investment advisory fee payable | | | (3,448 | ) |
| Increase in accrued expenses | | | 3,044 | |
| Decrease in tax payable | | | (1,813,349 | ) |
| Total adjustments to net assets from operations | | | 11,077,058 | |
| Net cash provided by operating activities | | $ | 11,871,334 | |
| | | | | |
See Notes to Consolidated Financial Statements
CONSOLIDATED STATEMENTS OF CHANGES IN NET ASSETS
| | | For the six
months ended
6/30/2018
(Unaudited) | | | For the
year ended
12/31/2017 | |
| Increase in net assets: | | | | | | |
| Operations: | | | | | | |
| Investment income - net | | $ | 5,451,588 | | | $ | 11,340,081 | |
| Net realized gain on investments after taxes | | | 3,901,927 | | | | 2,280,108 | |
| Net change in unrealized (depreciation) appreciation of investments after taxes | | | (8,559,239 | ) | | | 5,517,329 | |
| Net increase in net assets resulting from operations | | | 794,276 | | | | 19,137,518 | |
| | | | | | | | | |
| Increase from common shares issued on reinvestment of dividends | | | | | | | | |
| Common shares issued (2018 - 35,370; 2017 - 71,989) | | | 501,827 | | | | 1,001,726 | |
| | | | | | | | | |
| Dividends to shareholders from: | | | | | | | | |
| Net investment income (2018 - $0.27 per share; 2017 - $1.08 per share) | | | (2,828,632 | ) | | | (11,265,910 | ) |
| Total (decrease) / increase in net assets | | | (1,532,529 | ) | | | 8,873,334 | |
| | | | | | | | | |
| Net assets, beginning of period/year | | | 145,480,065 | | | | 136,606,731 | |
| | | | | | | | | |
| | | | | | | | | |
Net assets, end of period/year (including undistributed net investment income of $3,353,269 and $730,313, respectively) | | $ | 143,947,536 | | | $ | 145,480,065 | |
| | | | | | | | | |
See Notes to Consolidated Financial Statements
Barings Participation Investors
CONSOLIDATED SELECTED FINANCIAL HIGHLIGHTS
Selected data for each share of beneficial interest outstanding:
| | | For the six
months ended
6/30/2018
(Unaudited) | | | For the years ended December 31, | |
| | | | | 2017 | | | 2016 | | | 2015 | | | 2014 | |
| Net asset value: | | | | | | | | | | | | | | | |
| Beginning of period/year | | $ | 13.91 | | | $ | 13.15 | | | $ | 13.10 | | | $ | 13.35 | | | $ | 12.83 | |
| | | | | | | | | | | | | | | | | | | | | |
| Net investment income (a) | | | 0.52 | | | | 1.09 | | | | 1.00 | | | | 0.95 | | | | 1.04 | |
| Net realized and unrealized gain (loss) on investments | | | (0.44 | ) | | | 0.75 | | | | 0.13 | | | | (0.12 | ) | | | 0.57 | |
| | | | | | | | | | | | | | | | | | | | | |
| Total from investment operations | | | 0.08 | | | | 1.84 | | | | 1.13 | | | | 0.83 | | | | 1.61 | |
| | | | | | | | | | | | | | | | | | | | | |
| Dividends from net investment income to common shareholders | | | (0.27 | ) | | | (1.08 | ) | | | (1.08 | ) | | | (1.08 | ) | | | (0.96 | ) |
| Dividends from realized gain on investments to common shareholders | | | — | | | | — | | | | — | | | | — | | | | (0.12 | ) |
| Increase from dividends reinvested | | | (0.00 | )(b) | | | (0.00 | )(b) | | | (0.00 | )(b) | | | (0.00 | )(b) | | | (0.01 | ) |
| | | | | | | | | | | | | | | | | | | | | |
| Total dividends | | | (0.27 | ) | | | (1.08 | ) | | | (1.08 | ) | | | (1.08 | ) | | | (1.09 | ) |
| | | | | | | | | | | | | | | | | | | | | |
| Net asset value: | | | | | | | | | | | | | | | | | | | | |
| End of period/year | | $ | 13.72 | | | $ | 13.91 | | | $ | 13.15 | | | $ | 13.10 | | | $ | 13.35 | |
| | | | | | | | | | | | | | | | | | | | | |
| Per share market value: | | | | | | | | | | | | | | | | | | | | |
| End of period/year | | $ | 14.70 | | | $ | 14.10 | | | $ | 14.20 | | | $ | 13.75 | | | $ | 13.23 | |
| | | | | | | | | | | | | | | | | | | | | |
| Total investment return | | | | | | | | | | | | | | | | | | | | |
| Net asset value (c) | | | 0.57% | | | | 14.29% | | | | 8.75% | | | | 6.23% | | | | 13.61% | |
| Market value (c) | | | 6.21% | | | | 7.21% | | | | 11.45% | | | | 12.66% | | | | 12.54% | |
| | | | | | | | | | | | | | | | | | | | | |
| Net assets (in millions): | | | | | | | | | | | | | | | | | | | | |
| End of period/year | | $ | 143.95 | | | $ | 145.48 | | | $ | 136.61 | | | $ | 135.35 | | | $ | 137.57 | |
| Ratio of total expenses to average net assets | | | 2.20% | (d) | | | 3.23% | | | | 2.26% | | | | 2.17% | | | | 2.84% | |
| Ratio of operating expenses to average net assets | | | 1.38% | (d) | | | 1.49% | | | | 1.35% | | | | 1.49% | | | | 1.49% | |
| Ratio of interest expense to average net assets | | | 0.42% | (d) | | | 0.43% | | | | 0.44% | | | | 0.44% | | | | 0.45% | |
| Ratio of income tax expense to average net assets | | | 0.40% | (d) | | | 1.31% | | | | 0.47% | | | | 0.24% | | | | 0.90% | |
| Ratio of net investment income to average net assets | | | 7.54% | (d) | | | 7.92% | | | | 7.45% | | | | 6.95% | | | | 7.82% | |
| Portfolio turnover | | | 16% | | | | 24% | | | | 31% | | | | 30% | | | | 32% | |
| (a) | Calculated using average shares. |
| (b) | Rounds to less than $0.01 per share. |
| (c) | Net asset value return represents portfolio returns based on change in the Trust's net asset value assuming the reinvestment of all dividends and distributions which differs from the total investment return based on the Trust's market value due to the difference between the Trust's net asset value and the market value of its shares outstanding; past performance is no guarantee of future results. |
| Senior borrowings: | | | | | | | | | | | | | | | |
| Total principal amount (in millions) | | $ | 15 | | | $ | 15 | | | $ | 15 | | | $ | 15 | | | $ | 15 | |
| Asset coverage per $1,000 of indebtedness | | $ | 10,597 | | | $ | 10,699 | | | $ | 10,107 | | | $ | 10,023 | | | $ | 10,171 | |
See Notes to Consolidated Financial Statements
CONSOLIDATED SCHEDULE OF INVESTMENTS
June 30, 2018
(Unaudited)
| Corporate Restricted Securities - 83.73%: (A) | | Principal Amount,
Shares, Units or
Ownership Percentage | | | Acquisition
Date | | | Cost | | | Fair Value | |
| | |
| Private Placement Investments - 73.25%: (C) | |
| | |
| 1A Smart Start, Inc. | |
| A designer, distributor and lessor of ignition interlock devices ("IIDs"). IIDs are sophisticated breathalyzers wired to a vehicles ignition system. | |
10.34% Second Lien Term Loan due 12/22/2022 (LIBOR + 8.250%) | | $ | 1,725,000 | | | 12/21/17 | | | $ | 1,694,369 | | | $ | 1,695,762 | |
| | | | | | | | | | | | | | | | |
| | | | | | | | | | | | | | | | |
| ABC Industries, Inc. | | | | | | | | | | | | | | | |
| A manufacturer of mine and tunneling ventilation products in the U.S. | |
| 13% Senior Subordinated Note due 07/31/2019 | | $ | 109,335 | | | 08/01/12 | | | | 106,689 | | | | 109,129 | |
| Preferred Stock Series A (B) | | 125,000 shs. | | | 08/01/12 | | | | 125,000 | | | | 228,498 | |
Warrant, exercisable until 2022, to purchase common stock at $.02 per share (B) | | 22,414 shs. | | | 08/01/12 | | | | 42,446 | | | | 39,528 | |
| | | | | | | | | | | 274,135 | | | | 377,155 | |
| | | | | | | | | | | | | | | | |
| | | | | | | | | | | | | | | | |
| Advanced Manufacturing Enterprises LLC | | | | | | | | | | | | | | | |
| A designer and manufacturer of large, custom gearing products for a number of critical customer applications. | |
| Limited Liability Company Unit (B) | | 1,945 uts. | | | | * | | | | 207,911 | | | | 5,612 | |
| | | | | | | | | | | | | | | | | |
| * 12/07/12, 07/11/13 and 06/30/15. | | | | | | | | | | | | | | | | |
| | | | | | | | | | | | | | | | | |
| | | | | | | | | | | | | | | | | |
| AFC - Dell Holding Corporation | | | | | | | | | | | | | | | | |
| A distributor and provider of inventory management services for "C-Parts" used by OEMs in their manufacturing and production facilities. | |
12.5% (1% PIK) Senior Subordinated Note
due 09/27/2020 | | $ | 1,221,493 | | | 03/27/15 | | | | 1,209,853 | | | | 1,203,685 | |
| Preferred Stock (B) | | 1,122 shs. | | | 03/27/15 | | | | 112,154 | | | | 120,155 | |
| Common Stock (B) | | 346 shs. | | | 03/27/15 | | | | 346 | | | | — | |
| | | | | | | | | | | | 1,322,353 | | | | 1,323,840 | |
| | | | | | | | | | | | | | | | | |
| | | | | | | | | | | | | | | | | |
| AM Conservation Holding Corp. | | | | | | | | | | | | | | | | |
| A supplier of energy efficiency ("EE") products, including lighting, shower heads and aerators, and weatherization products such as door seals and weather stripping. | |
11.5% (1.5% PIK) Senior Subordinated Note
due 04/30/2023 | | $ | 1,568,182 | | | 10/31/16 | | | | 1,544,039 | | | | 1,584,384 | |
11.5% (1.25% PIK) Senior Subordinated Note
due 04/30/2023 | | $ | 206,039 | | | 10/06/17 | | | | 202,325 | | | | 207,709 | |
| Common Stock (B) | | 156,818 shs. | | | 10/31/16 | | | | 156,818 | | | | 164,613 | |
| | | | | | | | | | | | 1,903,182 | | | | 1,956,706 | |
| | | | | | | | | | | | | | | | | |
| | | | | | | | | | | | | | | | | |
| AMS Holding LLC | | | | | | | | | | | | | | | | |
| A leading multi-channel direct marketer of high-value collectible coins and proprietary-branded jewelry and watches. | |
Limited Liability Company Unit Class A Preferred (B)(F) | | 114 uts. | | | 10/04/12 | | | | 113,636 | | | | 206,006 | |
| | | | | | | | | | | | | | | | | |
See Notes to Consolidated Financial Statements
Barings Participation Investors
CONSOLIDATED SCHEDULE OF INVESTMENTS (CONTINUED)
June 30, 2018
(Unaudited)
Corporate Restricted Securities: (A) (Continued) | | Principal Amount,
Shares, Units or
Ownership Percentage | | | Acquisition
Date | | | Cost | | | Fair Value | |
| | | | | | | | | | | | | |
| API Technologies Corp. | | | | | | | | | | | | |
| A designer, developer and manufacturer of electronic systems, subsystems, modules and secure communications for technically demanding defense, aerospace and commercial applications in the U.S. and internationally. | |
| Limited Liability Company Unit (B) | | 0.40% int. | | | 04/20/16 | | | $ | 240,741 | | | $ | 358,800 | |
| | | | | | | | | | | | | | | |
| | | | | | | | | | | | | | | |
| ARI Holding Corporation | | | | | | | | | | | | | | |
| A leading national supplier of products used primarily by specialty contractors. | |
11.5% (0.5% PIK) Senior Subordinated Note due 02/01/2020 | | $ | 1,726,001 | | | | * | | | | 1,716,436 | | | | 1,726,000 | |
| Limited Partnership Interest | | 524 uts. | | | 08/01/14 | | | | 523,950 | | | | 1,070,422 | |
| * 05/21/13 and 08/01/14. | | | | | | | | | | | 2,240,386 | | | | 2,796,422 | |
| | | | | | | | | | | | | | | | | |
| | | | | | | | | | | | | | | | | |
| ASC Holdings, Inc. | | | | | | | | | | | | | | | | |
| A manufacturer of capital equipment used by corrugated box manufacturers. | |
13% (1% PIK) Senior Subordinated Note due 05/18/2021 | | $ | 759,984 | | | 11/19/15 | | | | 750,909 | | | | 726,571 | |
| Limited Liability Company Unit (B) | | 111,100 uts. | | | 11/18/15 | | | | 111,100 | | | | 11,332 | |
| | | | | | | | | | | | 862,009 | | | | 737,903 | |
| | | | | | | | | | | | | | | | | |
| | |
| Aurora Parts & Accessories LLC | |
| A distributor of aftermarket over-the-road semi-trailer parts and accessories sold to customers across North America. | |
| 11% Senior Subordinated Note due 02/17/2022 | | $ | 1,515,400 | | | 08/17/15 | | | | 1,495,995 | | | | 1,465,175 | |
| Preferred Stock (B) | | 210 shs. | | | 08/17/15 | | | | 209,390 | | | | 122,927 | |
| Common Stock (B) | | 210 shs. | | | 08/17/15 | | | | 210 | | | | — | |
| | | | | | | | | | | | 1,705,595 | | | | 1,588,102 | |
| | | | | | | | | | | | | | | | | |
| | |
| Avantech Testing Services LLC | |
| A manufacturer of custom Non-Destructive Testing ("NDT") systems and provider of NDT and inspections services primarily to the oil country tubular goods market. | |
15% (3.75% PIK) Senior Subordinated Note due 03/31/2021 (D) | | $ | 6,777 | | | 07/31/14 | | | | 6,650 | | | | — | |
| Limited Liability Company Unit (B)(F) | | 45,504 uts. | | | | * | | | | — | | | | — | |
Limited Liability Company Unit Class C Preferred (B)(F) | | 78,358 uts. | | | 09/29/17 | | | | 484,578 | | | | — | |
| * 07/31/14 and 10/14/15. | | | | | | | | | | | 491,228 | | | | — | |
| | | | | | | | | | | | | | | | | |
See Notes to Consolidated Financial Statements
CONSOLIDATED SCHEDULE OF INVESTMENTS (CONTINUED)
June 30, 2018
(Unaudited)
Corporate Restricted Securities: (A) (Continued) | | Principal Amount,
Shares, Units or
Ownership Percentage | | | | Acquisition
Date | | | Cost | | | Fair Value | |
| | |
| BCC Software, Inc. | |
| A provider of software and data solutions which enhance mail processing to help direct mail marketers realize discounts from the U.S. Postal Service, avoid penalties associated with mailing errors, and improve the accuracy and efficiency of marketing campaigns. | |
12% (1% PIK) Senior Subordinated Note due 04/11/2023 | | $ | 1,502,651 | | | | 10/11/17 | | | $ | 1,475,709 | | | $ | 1,470,116 | |
| Preferred Stock Series A (B) | | 23 shs. | | | | 10/11/17 | | | | 232,373 | | | | 228,800 | |
| Common Stock Class A (B) | | 735 shs. | | | | 10/11/17 | | | | 735 | | | | — | |
| | | | | | | | | | | | 1,708,817 | | | | 1,698,916 | |
| | | | | | | | | | | | | | | | | |
| | |
| BEI Precision Systems & Space Company, Inc. | |
| A provider of advanced design, manufacturing, and testing for custom optical encoder-based positioning systems, precision accelerometers, and micro scanners. | |
12% (1% PIK) Senior Subordinated Note due 04/28/2024 | | $ | 1,466,059 | | | | 04/28/17 | | | | 1,440,388 | | | | 1,445,553 | |
| Limited Liability Company Unit (B)(F) | | 2,760 uts. | | | | 04/28/17 | | | | 276,000 | | | | 139,513 | |
| | | | | | | | | | | | 1,716,388 | | | | 1,585,066 | |
| | | | | | | | | | | | | | | | | |
| | |
| Blue Wave Products, Inc. | |
| A distributor of pool supplies. | |
| 10% Senior Secured Term Note due 09/30/2018 | | $ | 19,858 | | | | 10/12/12 | | | | 19,838 | | | | 19,858 | |
13% (1% PIK) Senior Subordinated Note due 09/30/2019 | | $ | 336,418 | | | | 10/12/12 | | | | 330,361 | | | | 336,418 | |
| Common Stock (B) | | 51,064 shs. | | | | 10/12/12 | | | | 51,064 | | | | 264,514 | |
Warrant, exercisable until 2022, to purchase
common stock at $.01 per share (B) | | 20,216 shs. | | | | 10/12/12 | | | | 20,216 | | | | 104,720 | |
| | | | | | | | | | | | 421,479 | | | | 725,510 | |
| | | | | | | | | | | | | | | | | |
| | |
| BlueSpire Holding, Inc. | |
| A marketing services firm that integrates strategy, technology, and content to deliver customized marketing solutions for clients in the senior living, financial services and healthcare end markets. | |
| Common Stock (B) | | 29,560 shs. | | | | 06/30/15 | | | | 937,438 | | | | — | |
| | | | | | | | | | | | | | | | | |
| | | | | | | | | | | | | | | | | |
| Cadence, Inc. | |
| A full-service contract manufacturer ("CMO") and supplier of advanced products, technologies, and services to medical device, life science, and industrial companies. | |
6.59% Lien Term Loan due 04/30/2025
(LIBOR + 4.500%) | | $ | 811,823 | | | | 05/14/18 | | | | 795,847 | | | | 795,024 | |
| | | | | | | | | | | | | | | | | |
See Notes to Consolidated Financial Statements
Barings Participation Investors
CONSOLIDATED SCHEDULE OF INVESTMENTS (CONTINUED)
June 30, 2018
(Unaudited)
Corporate Restricted Securities: (A) (Continued) | | Principal Amount,
Shares, Units or
Ownership Percentage | | | Acquisition
Date | | | Cost | | | Fair Value | |
| | |
| CHG Alternative Education Holding Company | |
| A leading provider of publicly-funded, for profit pre-K-12 education services targeting special needs children at therapeutic day schools and "at risk" youth through alternative education programs. | |
13.5% (1.5% PIK) Senior Subordinated Note due 06/19/2020 | | $ | 797,800 | | | 01/19/11 | | | $ | 792,807 | | | $ | 791,169 | |
14% (2% PIK) Senior Subordinated Note due 06/19/2020 | | $ | 211,307 | | | 08/03/12 | | | | 210,173 | | | | 207,374 | |
| Common Stock (B) | | 375 shs. | | | 01/19/11 | | | | 37,500 | | | | 32,777 | |
Warrant, exercisable until 2021, to purchase common stock at $.01 per share (B) | | 295 shs. | | | 01/19/11 | | | | 29,250 | | | | 25,764 | |
| | | | | | | | | | | 1,069,730 | | | | 1,057,084 | |
| | | | | | | | | | | | | | | | |
| | |
| Clarion Brands Holding Corp. | |
| A portfolio of six over-the-counter (OTC) pharmaceutical brands whose products are used to treat tinnitus or ringing of the ear, excessive sweating, urinary tract infections, muscle pain, and skin conditions. | |
12.5% (1.5% PIK) Senior Subordinated Note due 04/01/2021 | | $ | 2,069,396 | | | | * | | | | 2,046,190 | | | | 2,061,334 | |
| Limited Liability Company Unit (B) | | 1,853 uts. | | | 07/18/16 | | | | 189,267 | | | | 168,942 | |
| * 10/01/14 and 07/18/16. | | | | | | | | | | | 2,235,457 | | | | 2,230,276 | |
| | | | | | | | | | | | | | | | | |
| | | | | | | | | | | | | | | | | |
| Clubessential LLC | |
| A leading SaaS platform for private clubs and resorts. | |
7% (5% PIK) Senior Subordinated Note
due 01/12/24 | | $ | 1,764,755 | | | 01/16/18 | | | | 1,731,896 | | | | 1,728,752 | |
| | | | | | | | | | | | | | | | | |
| | | | | | | | | | | | | | | | | |
| Compass Chemical International LLC | |
| A manufacturer and supplier of standard and specialty formulated chemicals, primarily phosphoric acid derivatives called phosphonates. | |
| Limited Liability Company Unit (B)(F) | | 230 uts. | | | 03/04/15 | | | | 147,305 | | | | 193,699 | |
| | | | | | | | | | | | | | | | | |
| | | | | | | | | | | | | | | | | |
| CORA Health Services, Inc. | |
| A provider of outpatient rehabilitation therapy services. | |
| 11% (1% PIK) Term Loan due 05/05/2025 | | $ | 2,082,773 | | | 05/01/18 | | | | 1,459,403 | | | | 1,416,913 | |
| Preferred Stock Series A (B) | | 758 shs. | | | 06/30/16 | | | | 38,258 | | | | 88,419 | |
| Common Stock Class A (B) | | 3,791 shs. | | | 06/30/16 | | | | 3,791 | | | | 20,960 | |
| | | | | | | | | | | | 1,501,452 | | | | 1,526,292 | |
| | | | | | | | | | | | | | | | | |
See Notes to Consolidated Financial Statements
CONSOLIDATED SCHEDULE OF INVESTMENTS (CONTINUED)
June 30, 2018
(Unaudited)
Corporate Restricted Securities: (A) (Continued) | | Principal Amount,
Shares, Units or
Ownership Percentage | | | Acquisition
Date | | | Cost | | | Fair Value | |
| | |
| CTM Holding, Inc. | |
| A leading owner and operator of coin-operated children's rides, penny presses and candy kiosks in the U.S. | |
15% (3% PIK) Senior Subordinated Note due 12/31/2020 | | $ | 1,356,347 | | | 11/22/13 | | | $ | 1,348,286 | | | $ | 1,356,347 | |
14% (2% PIK) Senior Subordinated Note due 06/04/2020 | | $ | 336,116 | | | 05/08/18 | | | | 325,735 | | | | 330,563 | |
| Common Stock (B) | | 90 shs. | | | | * | | | | 514,284 | | | | 649,068 | |
Warrant, exercisable until 2028, to purchase common stock at $.01 per share (B) | | 2 shs. | | | 05/08/18 | | | | — | | | | 14,424 | |
| * 11/22/13 and 09/16/16. | | | | | | | | | | | 2,188,305 | | | | 2,350,402 | |
| | | | | | | | | | | | | | | | | |
| | | | | | | | | | | | | | | | | |
| Del Real LLC | | | | | | | | | | | | | | | | |
| A manufacturer and distributor of fully-prepared fresh refrigerated Hispanic entrees as well as side dishes that are typically sold on a heat-and-serve basis at retail grocers. | |
| 11% Senior Subordinated Note due 04/06/2023 | | $ | 1,420,588 | | | 10/07/16 | | | | 1,397,863 | | | | 1,389,696 | |
| Limited Liability Company Unit (B)(F) | | 304,412 uts. | | | 10/07/16 | | | | 304,412 | | | | 231,353 | |
| | | | | | | | | | | | 1,702,275 | | | | 1,621,049 | |
| | | | | | | | | | | | | | | | | |
| | |
| Discovery Education, Inc. | |
| A provider of standards-based, digital education content for K-12 schools. | |
| 6.41% Term Loan due 04/30/2024 (LIBOR + 4.750%) | | $ | 1,941,000 | | | 04/20/18 | | | | 1,903,278 | | | | 1,900,466 | |
| | | | | | | | | | | | | | | | | |
| | | | | | | | | | | | | | | | | |
| DPL Holding Corporation | | | | | | | | | | | | | | | | |
| A distributor and manufacturer of aftermarket undercarriage parts for medium and heavy duty trucks and trailers. | |
14% (2% PIK) Senior Subordinated Note due 11/04/2020 | | $ | 1,446,609 | | | 05/04/12 | | | | 1,438,674 | | | | 1,437,345 | |
| Preferred Stock (B) | | 25 shs. | | | 05/04/12 | | | | 252,434 | | | | 224,520 | |
| Common Stock (B) | | 25 shs. | | | 05/04/12 | | | | 28,048 | | | | — | |
| | | | | | | | | | | | 1,719,156 | | | | 1,661,865 | |
| | | | | | | | | | | | | | | | | |
| | | | | | | | | | | | | | | | | |
| Dunn Paper | | | | | | | | | | | | | | | | |
| A provider of specialty paper for niche product applications. | |
10.84% Second Lien Term Loan due 08/26/2023 (LIBOR + 8.750%) | | $ | 1,725,000 | | | 09/28/16 | | | | 1,699,101 | | | | 1,725,000 | |
| | | | | | | | | | | | | | | | | |
See Notes to Consolidated Financial Statements
Barings Participation Investors
CONSOLIDATED SCHEDULE OF INVESTMENTS (CONTINUED)
June 30, 2018
(Unaudited)
Corporate Restricted Securities: (A) (Continued) | | Principal Amount,
Shares, Units or
Ownership Percentage | | | Acquisition
Date | | | Cost | | | Fair Value | |
| | | | | | | | | | | | | | |
| ECG Consulting Group | | | | | | | | | | | | | |
| A healthcare management consulting company who provides strategic, financial, operational, and technology related consulting services to healthcare providers. | |
11.5% (0.5% PIK) Senior Subordinated Note due 06/20/2025 | | $ | 757,771 | | | | 06/20/18 | | | $ | 742,682 | | | $ | 757,411 | |
11.5% (0.75% PIK) Senior Subordinated Note due 06/20/2025 | | $ | 1,326,922 | | | | 11/21/14 | | | | 1,312,492 | | | | 1,326,292 | |
| Limited Liability Company Unit (B)(F) | | 230 uts. | | | | 11/19/14 | | | | 36,199 | | | | 98,315 | |
| | | | | | | | | | | | 2,091,373 | | | | 2,182,018 | |
| | | | | | | | | | | | | | | | | |
| | | | | | | | | | | | | | | | | |
| Elite Sportwear Holding, LLC | | | | | | | | | | | | | | | | |
| A designer and manufacturer of gymnastics, competitive cheerleading and swimwear apparel in the U.S. and internationally. | |
11.5% (1% PIK) Senior Subordinated Note due 01/14/2022 | | $ | 1,588,640 | | | | 10/14/16 | | | | 1,568,694 | | | | 1,429,776 | |
| Limited Liability Company Unit (B)(F) | | 101 uts. | | | | 10/14/16 | | | | 159,722 | | | | 43,642 | |
| | | | | | | | | | | | 1,728,416 | | | | 1,473,418 | |
| | | | | | | | | | | | | | | | | |
| | | | | | | | | | | | | | | | | |
| English Color & Supply LLC | | | | | | | | | | | | | | | | |
| A distributor of aftermarket automotive paint and related products to collision repair shops, auto dealerships and fleet customers through a network of stores in the Southern U.S. | |
11.5% (0.5% PIK) Senior Subordinated Note due 12/31/2023 | | $ | 1,333,954 | | | | 06/30/17 | | | | 1,310,337 | | | | 1,304,759 | |
| Limited Liability Company Unit (B)(F) | | 397,695 uts. | | | | 06/30/17 | | | | 397,695 | | | | 385,764 | |
| | | | | | | | | | | | 1,708,032 | | | | 1,690,523 | |
| | | | | | | | | | | | | | | | | |
| | | | | | | | | | | | | | | | | |
| E.S.P. Associates, P.A. | | | | | | | | | | | | | | | | |
| A professional services firm providing engineering, surveying and planning services to infrastructure projects. | |
12% (1% PIK) Senior Subordinated Note due 10/4/2023 | | $ | 688,505 | | | | 04/04/18 | | | | 675,196 | | | | 681,902 | |
| Limited Liability Company Unit (B) | | 229 uts. | | | | 04/04/18 | | | | 228,955 | | | | 196,611 | |
| | | | | | | | | | | | 904,151 | | | | 878,513 | |
| | | | | | | | | | | | | | | | | |
| | | | | | | | | | | | | | | | | |
| F F C Holding Corporation | | | | | | | | | | | | | | | | |
| A leading U.S. manufacturer of private label frozen novelty and ice cream products. | |
| Limited Liability Company Unit Preferred (B) | | 171 uts. | | | | 09/27/10 | | | | 58,345 | | | | 76,193 | |
| Limited Liability Company Unit Common (B) | | 171 uts. | | | | 09/27/10 | | | | 17,073 | | | | — | |
| | | | | | | | | | | | 75,418 | | | | 76,193 | |
| | | | | | | | | | | | | | | | | |
See Notes to Consolidated Financial Statements
CONSOLIDATED SCHEDULE OF INVESTMENTS (CONTINUED)
June 30, 2018
(Unaudited)
Corporate Restricted Securities: (A) (Continued) | | Principal Amount,
Shares, Units or
Ownership Percentage | | | Acquisition
Date | | | Cost | | | Fair Value | |
| | | | | | | | | | | | | | |
| F G I Equity LLC | | | | | | | | | | | | | |
| A manufacturer of a broad range of filters and related products that are used in commercial, light industrial, healthcare, gas turbine, nuclear, laboratory, clean room, hotel, educational system, and food processing settings. | |
| Limited Liability Company Unit Preferred (B) | | 80,559 uts. | | | | 04/15/14 | | | $ | — | | | $ | 80,559 | |
| Limited Liability Company Unit Class B-1 (B) | | 65,789 uts. | | | | 12/15/10 | | | | 65,789 | | | | 377,015 | |
| Limited Liability Company Unit Class B-2 (B) | | 8,248 uts. | | | | 12/15/10 | | | | 8,248 | | | | 47,267 | |
| Limited Liability Company Unit Class B-3 (B) | | 6,522 uts. | | | | 08/30/12 | | | | 15,000 | | | | 39,070 | |
| Limited Liability Company Unit Class C (B) | | 1,575 uts. | | | | 12/20/10 | | | | 16,009 | | | | 61,878 | |
| | | | | | | | | | | 105,046 | | | | 605,789 | |
| | | | | | | | | | | | | | | | |
| | | | | | | | | | | | | | | | |
| GD Dental Services LLC | | | | | | | | | | | | | | | |
| A provider of convenient "onestop" general, specialty, and cosmetic dental services with 21 offices located throughout South and Central Florida. | |
| Limited Liability Company Unit Preferred (B) | | 76 uts. | | | | 10/05/12 | | | | 75,920 | | | | — | |
| Limited Liability Company Unit Common (B) | | 767 uts. | | | | 10/05/12 | | | | 767 | | | | — | |
| | | | | | | | | | | 76,687 | | | | — | |
| | | | | | | | | | | | | | | | |
| | | | | | | | | | | | | | | | |
| gloProfessional Holdings, Inc. | | | | | | | | | | | | | | | |
| A marketer and distributor of premium mineral-based cosmetics, cosmeceuticals and professional hair care products to the professional spa and physician's office channels. | |
14% (2% PIK) Senior Subordinated Note due 03/27/2019 | | $ | 1,393,046 | | | | 03/27/13 | | | | 1,389,119 | | | | 1,253,741 | |
| Common Stock (B) | | 1,181 shs. | | | | 03/27/13 | | | | 118,110 | | | | 7,723 | |
| | | | | | | | | | | | 1,507,229 | | | | 1,261,464 | |
| | | | | | | | | | | | | | | | | |
| | | | | | | | | | | | | | | | | |
| Glynlyon Holding Companies, Inc. | | | | | | | | | | | | | | | | |
| A technology-enabled curriculum provider of K-12 and support services predominantly to small and medium public school districts. | |
| Common Stock (B) | | 147 shs. | | | | 01/15/16 | | | | 103,205 | | | | 209,414 | |
| | | | | | | | | | | | | | | | | |
| | | | | | | | | | | | | | | | | |
| GlynnDevins Acquisition Corporation | | | | | | | | | | | | | | | | |
| A marketing communications agency that services senior living facilities. | | | | | | | | | |
| Preferred Stock Series A (B) | | 342 shs. | | | | 06/19/15 | | | | 70,683 | | | | 87,596 | |
| Common Stock (B) | | 342 shs. | | | | 06/19/15 | | | | 2,945 | | | | 110,789 | |
| | | | | | | | | | | | 73,628 | | | | 198,385 | |
| | | | | | | | | | | | | | | | | |
| | | | | | | | | | | | | | | | | |
| Grakon Parent | | | | | | | | | | | | | | | | |
| The leading designer and manufacturer of highly-engineered and customized LED and incandescent lighting systems for transportation-based markets. | |
| Common Stock (B) | | 175 shs. | | | | 10/31/14 | | | | 174,831 | | | | 275,711 | |
| | | | | | | | | | | | | | | | | |
| | | | | | | | | | | | | | | | | |
| GraphPad Software, Inc. | | | | | | | | | | | | | | | | |
| A provider of data analysis, statistics and graphing software solution for scientific research applications, with a focus on the life sciences and academic end-markets. | |
| 8.09% Term Loan due 12/21/2022 (LIBOR + 6.000%) | | $ | 2,452,675 | | | | 12/19/17 | | | | 2,407,932 | | | | 2,411,607 | |
| | | | | | | | | | | | | | | | | |
See Notes to Consolidated Financial Statements
Barings Participation Investors
CONSOLIDATED SCHEDULE OF INVESTMENTS (CONTINUED)
June 30, 2018
(Unaudited)
Corporate Restricted Securities: (A) (Continued) | | Principal Amount,
Shares, Units or
Ownership Percentage | | | Acquisition
Date | | | Cost | | | Fair Value | |
| | | | | | | | | | | | | |
| GTI Holding Company | | | | | | | | | | | | |
| A designer, developer, and marketer of precision specialty hand tools and handheld test instruments. | |
| 12% Senior Subordinated Note due 05/22/2023 | | $ | 727,865 | | | 02/05/14 | | | $ | 705,906 | | | $ | 727,865 | |
| Common Stock (B) | | 1,046 shs. | | | | * | | | | 104,636 | | | | 120,090 | |
Warrant, exercisable until 2027, to purchase common stock at $.01 per share (B) | | 397 shs. | | | 02/05/14 | | | | 36,816 | | | | 45,579 | |
| * 02/05/14 and 11/22/17. | | | | | | | | | | | 847,358 | | | | 893,534 | |
| | | | | | | | | | | | | | | | | |
| | | | | | | | | | | | | | | | | |
| Handi Quilter Holding Company (Premier Needle Arts) | | | | | | | | | | | | | |
| A designer and manufacturer of long-arm quilting machines and related components for the consumer quilting market. | |
12% (1% PIK) Senior Subordinated Note due 06/19/2021 | | $ | 1,725,000 | | | | * | | | | 1,704,768 | | | | 1,712,708 | |
| Limited Liability Company Unit Preferred (B) | | 372 uts. | | | | ** | | | | 371,644 | | | | 462,423 | |
| Limited Liability Company Unit Common Class A (B) | | 3,594 uts. | | | 12/19/14 | | | | — | | | | 52,716 | |
| * 12/19/14 and 02/21/17. | | | | | | | | | | | 2,076,412 | | | | 2,227,847 | |
| * *12/19/14 and 04/29/16. | | | | | | | | | | | | | | | | |
| | | | | | | | | | | | | | | | | |
| | | | | | | | | | | | | | | | | |
| Happy Floors Acquisition, Inc. | | | | | | | | | | | | | | | | |
| A wholesale importer and value-added distributor of premium European flooring tile to residential and commercial end markets. | |
12.5% (1% PIK) Senior Subordinated Note due 07/01/2022 | | $ | 991,417 | | | 07/01/16 | | | | 976,696 | | | | 1,001,331 | |
| Common Stock (B) | | 150 shs. | | | 07/01/16 | | | | 149,500 | | | | 215,621 | |
| | | | | | | | | | | | 1,126,196 | | | | 1,216,952 | |
| | | | | | | | | | | | | | | | | |
| | | | | | | | | | | | | | | | | |
| Hartland Controls Holding Corporation | | | | | | | | | | | | | | | | |
| A manufacturer and distributor of electronic and electromechanical components. | |
14% (2% PIK) Senior Subordinated Note due 08/14/2020 | | $ | 1,139,988 | | | 02/14/14 | | | | 1,131,968 | | | | 1,139,988 | |
| 12% Senior Subordinated Note due 08/14/2020 | | $ | 431,250 | | | 06/22/15 | | | | 429,392 | | | | 430,852 | |
| Common Stock (B) | | 821 shs. | | | 02/14/14 | | | | 822 | | | | 240,499 | |
| | | | | | | | | | | | 1,562,182 | | | | 1,811,339 | |
| | | | | | | | | | | | | | | | | |
| | | | | | | | | | | | | | | | | |
| HHI Group, LLC | | | | | | | | | | | | | | | | |
| A developer, marketer, and distributor of hobby-grade radio control products. | |
14% (2% PIK) Senior Subordinated Note due 11/26/2020 | | $ | 1,667,440 | | | 01/17/14 | | | | 1,655,290 | | | | 1,667,440 | |
| Limited Liability Company Unit (B)(F) | | 102 uts. | | | 01/17/14 | | | | 101,563 | | | | 47,017 | |
| | | | | | | | | | | | 1,756,853 | | | | 1,714,457 | |
| | | | | | | | | | | | | | | | | |
See Notes to Consolidated Financial Statements
CONSOLIDATED SCHEDULE OF INVESTMENTS (CONTINUED)
June 30, 2018
(Unaudited)
Corporate Restricted Securities: (A) (Continued) | | Principal Amount,
Shares, Units or
Ownership Percentage | | | Acquisition
Date | | | Cost | | | Fair Value | |
| | | | | | | | | | | | | |
| Hollandia Produce LLC | | | | | | | | | | | | |
| A hydroponic greenhouse producer of branded root vegetables. | |
14.25% (2.75% PIK) Senior Subordinated Note due 12/11/2020 | | $ | 1,423,140 | | | | * | | | $ | 1,407,684 | | | $ | 1,209,669 | |
| 10% Term Loan due 12/12/2020 (LIBOR + 8.000%) | | $ | 109,916 | | | 04/06/18 | | | | 109,916 | | | | 109,867 | |
| 10% Term Loan due 12/11/2020 (LIBOR + 8.000%) | | $ | 146,780 | | | 04/06/18 | | | | 146,780 | | | | 146,715 | |
| * 12/30/15 and 12/23/16. | | | | | | | | | | | 1,664,380 | | | | 1,466,251 | |
| | | | | | | | | | | | | | | | | |
| | | | | | | | | | | | | | | | | |
| HOP Entertainment LLC | | | | | | | | | | | | | | | | |
| A provider of post production equipment and services to producers of television shows and motion pictures. | |
| Limited Liability Company Unit Class F (B)(F) | | 47 uts. | | | 10/14/11 | | | | — | | | | — | |
| Limited Liability Company Unit Class G (B)(F) | | 114 uts. | | | 10/14/11 | | | | — | | | | — | |
| Limited Liability Company Unit Class H (B)(F) | | 47 uts. | | | 10/14/11 | | | | — | | | | — | |
| Limited Liability Company Unit Class I (B)(F) | | 47 uts. | | | 10/14/11 | | | | — | | | | — | |
| | | | | | | | | | | | — | | | | — | |
| | | | | | | | | | | | | | | | | |
| | | | | | | | | | | | | | | | | |
| Hospitality Mints Holding Company | | | | | | | | | | | | | | | | |
| A manufacturer of individually-wrapped imprinted promotional mints. | |
| 12% Senior Subordinated Note due 10/01/2019 | | $ | 1,098,837 | | | 08/19/08 | | | | 1,097,723 | | | | 1,098,837 | |
| Common Stock (B) | | 251 shs. | | | 08/19/08 | | | | 251,163 | | | | — | |
Warrant, exercisable until 2018, to purchase common stock at $.01 per share (B) | | 65 shs. | | | 08/19/08 | | | | 60,233 | | | | — | |
| | | | | | | | | | | | 1,409,119 | | | | 1,098,837 | |
| | | | | | | | | | | | | | | | | |
| | | | | | | | | | | | | | | | | |
| Impact Confections | | | | | | | | | | | | | | | | |
An independent manufacturer and marketer of confectionery products including Warheads® brand sour candies, Melster® brand classic candies, and co-manufactured/private label classic candies. | |
15%(15% PIK) Senior Subordinated Note due 11/10/2020 | | $ | 1,259,368 | | | 11/10/14 | | | | 1,248,964 | | | | — | |
| Common Stock (B) | | 2,300 shs. | | | 11/10/14 | | | | 230,000 | | | | — | |
| | | | | | | | | | | | 1,478,964 | | | | — | |
| | | | | | | | | | | | | | | | | |
| | | | | | | | | | | | | | | | | |
| JMH Investors LLC | | | | | | | | | | | | | | | | |
| A developer and manufacturer of custom formulations for a wide variety of foods. | |
| Limited Liability Company Unit (B)(F) | | 1,038,805 uts. | | | 12/05/12 | | | | 232,207 | | | | — | |
| Limited Liability Company Unit Class A-1 (B)(F) | | 159,048 uts. | | | 10/31/16 | | | | 159,048 | | | | 283,360 | |
| Limited Liability Company Unit Class A-2 (B)(F) | | 1,032,609 uts. | | | 10/31/16 | | | | — | | | | 155,934 | |
| | | | | | | | | | | | 391,255 | | | | 439,294 | |
| | | | | | | | | | | | | | | | | |
See Notes to Consolidated Financial Statements
Barings Participation Investors
CONSOLIDATED SCHEDULE OF INVESTMENTS (CONTINUED)
June 30, 2018
(Unaudited)
Corporate Restricted Securities: (A) (Continued) | | Principal Amount,
Shares, Units or
Ownership Percentage | | | Acquisition
Date | | | Cost | | | Fair Value | |
| | | | | | | | | | | | | |
| K P I Holdings, Inc. | | | | | | | | | | | | |
| The largest player in the U.S. non-automotive, non-ferrous die casting segment. | |
| Limited Liability Company Unit Class C Preferred (B) | | 40 uts. | | | 06/30/15 | | | $ | — | | | $ | 90,498 | |
| Common Stock (B) | | 353 shs. | | | 07/15/08 | | | | 285,619 | | | | 359,696 | |
| | | | | | | | | | 285,619 | | | | 450,194 | |
| | | | | | | | | | | | | | | |
| | | | | | | | | | | | | | | |
| Manhattan Beachwear Holding Company | | | | | | | | | | | | | | |
| A designer and distributor of women's swimwear. | |
| 12.5% Senior Subordinated Note due 04/30/2019 (D) | | $ | 419,971 | | | 01/15/10 | | | | 404,121 | | | | 377,974 | |
15% (2.5% PIK) Senior Subordinated Note due 04/30/2019 (D) | | $ | 115,253 | | | 10/05/10 | | | | 114,604 | | | | 103,727 | |
| Common Stock (B) | | 35 shs. | | | 10/05/10 | | | | 35,400 | | | | — | |
| Common Stock Class B (B) | | 118 shs. | | | 01/15/10 | | | | 117,647 | | | | — | |
Warrant, exercisable until 2019, to purchase common stock at $.01 per share (B) | | 104 shs. | | | 10/05/10 | | | | 94,579 | | | | — | |
| | | | | | | | | | | 766,351 | | | | 481,701 | |
| | | | | | | | | | | | | | | | |
| | | | | | | | | | | | | | | | |
| Master Cutlery LLC | | | | | | | | | | | | | | | |
| A designer and marketer of a wide assortment of knives and swords. | |
| 13% Senior Subordinated Note due 04/17/2020 | | $ | 868,102 | | | 04/17/15 | | | | 863,781 | | | | 486,137 | |
| Limited Liability Company Unit | | 5 uts. | | | 04/17/15 | | | | 678,329 | | | | — | |
| | | | | | | | | | | 1,542,110 | | | | 486,137 | |
| | | | | | | | | | | | | | | | |
| | | | | | | | | | | | | | | | |
| Merex Holding Corporation | | | | | | | | | | | | | | | |
| A provider of after-market spare parts and components, as well as maintenance, repair and overhaul services for "out of production" or "legacy" aerospace and defense systems that are no longer effectively supported by the original equipment manufacturers. | |
| 16% Senior Subordinated Note due 10/30/2019 (D) | | $ | 454,295 | | | 09/22/11 | | | | 449,013 | | | | 227,148 | |
| 15% PIK Senior Subordinated Note due 04/30/2022 (D) | | $ | 23,839 | | | 08/18/15 | | | | 23,839 | | | | — | |
| 14% PIK Senior Subordinated Note due 06/30/2019 | | $ | 66,394 | | | | * | | | | 66,394 | | | | 66,023 | |
| Common Stock Class A (B) | | 83,080 shs. | | | | ** | | | | 170,705 | | | | — | |
| * 10/21/16, 01/27/17 and 10/13/17. | | | | | | | | | | | 709,951 | | | | 293,171 | |
| ** 08/18/15, 10/20/16 and 01/27/17. | | | | | | | | | | | | | | | | |
| | | | | | | | | | | | | | | | | |
| | | | | | | | | | | | | | | | | |
| MES Partners, Inc. | | | | | | | | | | | | | | | | |
| An industrial service business offering an array of cleaning and environmental services to the Gulf Coast region of the U.S. | |
12% (1% PIK) Senior Subordinated Note due 09/30/2021 | | $ | 1,123,340 | | | 09/30/14 | | | | 1,111,012 | | | | 1,123,340 | |
| 12% Senior Subordinated Note due 09/30/2021 | | $ | 301,791 | | | 02/28/18 | | | | 296,239 | | | | 309,283 | |
| Common Stock Class B (B) | | 259,252 shs. | | | | * | | | | 244,163 | | | | 193,908 | |
| * 09/30/14 and 02/28/18. | | | | | | | | | | | 1,651,414 | | | | 1,626,531 | |
| | | | | | | | | | | | | | | | | |
See Notes to Consolidated Financial Statements
CONSOLIDATED SCHEDULE OF INVESTMENTS (CONTINUED)
June 30, 2018
(Unaudited)
Corporate Restricted Securities: (A) (Continued) | | Principal Amount,
Shares, Units or
Ownership Percentage | | | Acquisition
Date | | | Cost | | | Fair Value | |
| | | | | | | | | | | | | | |
| MeTEOR Education LLC | | | | | | | | | | | | | |
| A leading provider of classroom and common area design services, furnishings, equipment and instructional support to K-12 schools. | |
| 12% Senior Subordinated Note due 6/20/23 | | $ | 915,819 | | | | 03/09/18 | | | $ | 898,498 | | | $ | 909,404 | |
| Limited Liability Company Unit (B)(F) | | 182 uts. | | | | 03/09/18 | | | | 183,164 | | | | 77,898 | |
| | | | | | | | | | | | 1,081,662 | | | | 987,302 | |
| | | | | | | | | | | | | | | | | |
| | | | | | | | | | | | | | | | | |
| Midwest Industrial Rubber, Inc. | | | | | | | | | | | | | | | | |
| A supplier of industrial maintenance, repair, and operations ("MRO") products, specializing in the fabrication and distribution of lightweight conveyor belting and related conveyor components and accessories. | |
12% (1% PIK) Senior Subordinated Note due 12/02/2022 | | $ | 1,578,363 | | | | 12/02/16 | | | | 1,553,385 | | | | 1,571,422 | |
| Preferred Stock (B) | | 1,711 shs. | | | | 12/02/16 | | | | 171,116 | | | | 155,955 | |
| Common Stock (B) | | 242 shs. | | | | 12/02/16 | | | | 242 | | | | — | |
| | | | | | | | | | | | 1,724,743 | | | | 1,727,377 | |
| | | | | | | | | | | | | | | | | |
| | | | | | | | | | | | | | | | | |
| MNX Holding Company | | | | | | | | | | | | | | | | |
| An international third party logistics company providing customized logistics services to customers across the globe. | |
14% (2% PIK) Senior Subordinated Note due 05/02/2020 | | $ | 1,349,554 | | | | 11/02/12 | | | | 1,342,313 | | | | 1,349,554 | |
| Common Stock (B) | | 45 shs. | | | | 11/02/12 | | | | 44,643 | | | | 96,445 | |
| | | | | | | | | | | | 1,386,956 | | | | 1,445,999 | |
| | | | | | | | | | | | | | | | | |
| | | | | | | | | | | | | | | | | |
| Money Mailer Equity LLC | | | | | | | | | | | | | | | | |
| A leading provider of hyperlocal shared direct mail advertising as well as interactive and online advertising solutions through its nationwide production and distribution network. | |
12% (1% PIK) Senior Subordinated Note due 10/29/2021 | | $ | 1,761,346 | | | | 04/29/16 | | | | 1,737,736 | | | | 1,624,375 | |
| | | | | | | | | | | | | | | | | |
| | | | | | | | | | | | | | | | | |
| Motion Controls Holdings | | | | | | | | | | | | | | | | |
| A manufacturer of high performance mechanical motion control and linkage products. | | | | | | | | | |
14.25% (1.75% PIK) Senior Subordinated Note due 08/15/2020 | | $ | 286,691 | | | | 11/30/10 | | | | 285,284 | | | | 280,243 | |
| Limited Liability Company Unit Class B-1 (B)(F) | | 75,000 uts. | | | | 11/30/10 | | | | — | | | | 45,808 | |
| Limited Liability Company Unit Class B-2 (B)(F) | | 6,801 uts. | | | | 11/30/10 | | | | — | | | | 4,154 | |
| | | | | | | | | | | | 285,284 | | | | 330,205 | |
| | | | | | | | | | | | | | | | | |
| | | | | | | | | | | | | | | | | |
| New Mountain Learning, LLC | | | | | | | | | | | | | | | | |
| A leading provider of blended learning solutions to the K-12 and post-secondary school market. | | | | | |
| 7.83% Term Loan due 3/16/2024 (LIBOR + 5.500%) | | $ | 1,792,448 | | | | 03/15/18 | | | | 1,384,536 | | | | 1,383,447 | |
| | | | | | | | | | | | | | | | | |
See Notes to Consolidated Financial Statements
Barings Participation Investors
CONSOLIDATED SCHEDULE OF INVESTMENTS (CONTINUED)
June 30, 2018
(Unaudited)
Corporate Restricted Securities: (A) (Continued) | | Principal Amount,
Shares, Units or
Ownership Percentage | | | Acquisition
Date | | | Cost | | | Fair Value | |
| | | | | | | | | | | | | |
| NSi Industries Holdings, Inc. | | | | | | | | | | | | |
| A manufacturer and distributer of electrical components and accessories to small to mid-sized electrical wholesalers. | |
12.75% (1.75% PIK) Senior Subordinated Note due 05/17/2023 | | $ | 1,527,814 | | | 06/30/16 | | | $ | 1,504,074 | | | $ | 1,519,610 | |
| Common Stock (B) | | 207 shs. | | | 05/17/16 | | | | 207,000 | | | | 244,843 | |
| | | | | | | | | | | 1,711,074 | | | | 1,764,453 | |
| | | | | | | | | | | | | | | | |
| | | | | | | | | | | | | | | | |
| PANOS Brands LLC | | | | | | | | | | | | | | | |
| A marketer and distributor of branded consumer foods in the specialty, natural, better-for-you, "free from" healthy and gluten-free categories. | |
12% (1% PIK) Senior Subordinated Note due 08/17/2022 | | $ | 1,775,705 | | | 02/17/17 | | | | 1,751,152 | | | | 1,760,351 | |
| Common Stock Class B (B) | | 380,545 shs. | | | | * | | | | 380,545 | | | | 578,843 | |
| * 01/29/16 and 02/17/17. | | | | | | | | | | | 2,131,697 | | | | 2,339,194 | |
| | | | | | | | | | | | | | | | | |
| | | | | | | | | | | | | | | | | |
| Pegasus Transtech Corporation | | | | | | | | | | | | | | | | |
| A provider of end-to-end document, driver and logistics management solutions, which enable its customers (carriers, brokers, and drivers) to operate more efficiently, reduce manual overhead, enhance compliance, and shorten cash conversion cycles. | |
| 11.25% Term Loan due 11/16/2022 | | $ | 356,610 | | | 11/14/17 | | | | 347,610 | | | | 347,421 | |
| 8.34% Term Loan due 11/17/2024 (LIBOR + 6.250%) | | $ | 2,117,675 | | | 11/14/17 | | | | 1,933,917 | | | | 1,937,525 | |
| | | | | | | | | | | | 2,281,527 | | | | 2,284,946 | |
| | | | | | | | | | | | | | | | | |
| | | | | | | | | | | | | | | | | |
| Petroplex Inv Holdings LLC | | | | | | | | | | | | | | | | |
| A leading provider of acidizing services to E&P customers in the Permian Basin. | | | | | | | | | |
| Limited Liability Company | | 0.40% int. | | | | * | | | | 175,339 | | | | 19,216 | |
| * 11/29/12 and 12/20/16. | | | | | | | | | | | 175,339 | | | | 19,216 | |
| | | | | | | | | | | | | | | | | |
| | | | | | | | | | | | | | | | | |
| Polytex Holdings LLC | | | | | | | | | | | | | | | | |
| A manufacturer of water based inks and related products serving primarily the wall covering market. | |
13.9% (1% PIK) Senior Subordinated Note due 01/31/2020 | | $ | 1,134,642 | | | 07/31/14 | | | | 1,126,398 | | | | 850,981 | |
| Limited Liability Company Unit | | 148,096 uts. | | | 07/31/14 | | | | 148,096 | | | | — | |
| Limited Liability Company Unit Class F | | 36,976 uts. | | | | * | | | | 24,802 | | | | — | |
| * 09/28/17 and 02/15/18. | | | | | | | | | | | 1,299,296 | | | | 850,981 | |
| | | | | | | | | | | | | | | | | |
| | | | | | | | | | | | | | | | | |
| Power Stop Holdings LLC | | | | | | | | | | | | | | | | |
| A supplier of performance upgrade aftermarket brake products. | |
| Limited Liability Company Unit Preferred (B)(F) | | 1,149 uts. | | | 05/29/15 | | | | 114,900 | | | | 119,086 | |
| Limited Liability Company Unit Common (B)(F) | | 1,149 uts. | | | 05/29/15 | | | | — | | | | 143,166 | |
| | | | | | | | | | | | 114,900 | | | | 262,252 | |
| | | | | | | | | | | | | | | | | |
See Notes to Consolidated Financial Statements
CONSOLIDATED SCHEDULE OF INVESTMENTS (CONTINUED)
June 30, 2018
(Unaudited)
Corporate Restricted Securities: (A) (Continued) | | Principal Amount,
Shares, Units or
Ownership Percentage | | | Acquisition
Date | | | Cost | | | Fair Value | |
| | | | | | | | | | | | | |
| PPC Event Services | | | | | | | | | | | | |
| A special event equipment rental business. | |
14% (2% PIK) Senior Subordinated Note due 05/20/2020 | | $ | 1,202,340 | | | 11/20/14 | | | | 1,192,754 | | | | 1,202,340 | |
| Limited Liability Company Unit (B) | | 3,450 uts. | | | 11/20/14 | | | | 172,500 | | | | 294,266 | |
| Limited Liability Company Unit Series A-1 (B) | | 339 uts. | | | 03/16/16 | | | | 42,419 | | | | 29,806 | |
| | | | | | | | | | | 1,407,673 | | | | 1,526,412 | |
| | | | | | | | | | | | | | | | |
| | | | | | | | | | | | | | | | |
| Randy's Worldwide Automotive | | | | | | | | | | | | | | | |
| A designer and distributor of automotive aftermarket parts. | |
| Common Stock (B) | | 118 shs. | | | 05/12/15 | | | | 118,476 | | | | 318,092 | |
| | | | | | | | | | | | | | | | |
| | | | | | | | | | | | | | | | |
| ReelCraft Industries, Inc. | | | | | | | | | | | | | | | |
| A designer and manufacturer of heavy-duty reels for diversified industrial, mobile equipment OEM, auto aftermarket, government/military and other end markets. | |
10.5% (0.5% PIK) Senior Subordinated Note due 02/28/2023 | | $ | 1,435,959 | | | 11/13/17 | | | | 1,435,959 | | | | 1,407,959 | |
| Limited Liability Company Unit Class B | | 293,617 uts. | | | 11/13/17 | | | | 293,617 | | | | 365,886 | |
| | | | | | | | | | | 1,729,576 | | | | 1,773,845 | |
| | | | | | | | | | | | | | | | |
| | | | | | | | | | | | | | | | |
| Signature Systems Holding Company | | | | | | | | | | | | | | | |
| A seller and installer of a variety of modular surfaces, industrial matting and related products used for ground protection. | |
| Common Stock (B) | | 76 shs. | | | 03/15/13 | | | | 75,509 | | | | 175,658 | |
Warrant, exercisable until 2023, to purchase common stock A at $.01 per share (B) | | 31 shs. | | | 03/15/13 | | | | 28,316 | | | | 71,766 | |
| | | | | | | | | | | 103,825 | | | | 247,424 | |
| | | | | | | | | | | | | | | | |
| | | | | | | | | | | | | | | | |
| Smart Source Holdings LLC | | | | | | | | | | | | | | | |
| A short-term computer rental company. | |
| Limited Liability Company Unit (B) | | 328 uts. | | | | * | | | | 261,262 | | | | 449,021 | |
Warrant, exercisable until 2020, to purchase common stock at $.01 per share (B) | | 83 shs. | | | | * | | | | 67,467 | | | | 113,737 | |
| * 08/31/07 and 03/06/08. | | | | | | | | | | | 328,729 | | | | 562,758 | |
| | | | | | | | | | | | | | | | | |
| | | | | | | | | | | | | | | | | |
| SMB Machinery Holdings, Inc. | | | | | | | | | | | | | | | | |
| A reseller of used, rebuilt and refurbished packaging and processing equipment, primarily serving the bottling and food manufacturing industries. | |
14% (2% PIK) Senior Subordinated Note due 10/18/2019 (D) | | $ | 738,694 | | | 10/18/13 | | | | 726,147 | | | | — | |
| Common Stock (B) | | 841 shs. | | | 10/18/13 | | | | 84,100 | | | | — | |
| | | | | | | | | | | | 810,247 | | | | — | |
| | | | | | | | | | | | | | | | | |
| | | | | | | | | | | | | | | | | |
| Software Paradigms International Group, LLC | | | | | | | | | | | | | | | | |
| An outsourced IT services provider focused on the retail industry. | |
12.5% (1.5% PIK) Senior Subordinated Note due 11/23/2021 | | $ | 1,725,000 | | | 05/23/16 | | | | 1,700,962 | | | | 1,716,531 | |
| | | | | | | | | | | | | | | | | |
See Notes to Consolidated Financial Statements
Barings Participation Investors
CONSOLIDATED SCHEDULE OF INVESTMENTS (CONTINUED)
June 30, 2018
(Unaudited)
Corporate Restricted Securities: (A) (Continued) | | Principal Amount,
Shares, Units or
Ownership Percentage | | | Acquisition
Date | | | Cost | | | Fair Value | |
| | | | | | | | | | | | | |
| SR Smith LLC | | | | | | | | | | | | |
| A manufacturer of mine and tunneling ventilation products in the United States. | |
| 11% Senior Subordinated Note due 03/27/2022 | | $ | 867,652 | | | 03/27/17 | | | $ | 859,003 | | | $ | 859,541 | |
| Limited Liability Company Unit Series A (B)(F) | | 14 uts. | | | 03/27/17 | | | | 846,631 | | | | 854,343 | |
| | | | | | | | | | | 1,705,634 | | | | 1,713,884 | |
| | | | | | | | | | | | | | | | |
| | | | | | | | | | | | | | | | |
| Strahman Holdings Inc | | | | | | | | | | | | | | | |
| A manufacturer of industrial valves and wash down equipment for a variety of industries, including chemical, petrochemical, polymer, pharmaceutical, food processing, beverage and mining. | |
| Preferred Stock Series A (B) | | 158,967 shs. | | | 12/13/13 | | | | 158,967 | | | | 247,476 | |
| Preferred Stock Series A-2 (B) | | 26,543 shs. | | | 09/10/15 | | | | 29,994 | | | | 41,322 | |
| | | | | | | | | | | 188,961 | | | | 288,798 | |
| | | | | | | | | | | | | | | | |
| | | | | | | | | | | | | | | | |
| Strategic Insight, Inc. | | | | | | | | | | | | | | | |
| A provider of largely proprietary data, market research, and business intelligence to the global asset management industry. | |
11.58% Second Lien Term Loan due 12/21/2024 (LIBOR + 9.250%) | | $ | 1,725,000 | | | 12/28/17 | | | | 1,688,989 | | | | 1,691,385 | |
| | | | | | | | | | | | | | | | |
| | | | | | | | | | | | | | | | |
| Sunrise Windows Holding Company | | | | | | | | | | | | | | | |
| A manufacturer and marketer of premium vinyl windows exclusively selling to the residential remodeling and replacement market. | |
| 16% Senior Subordinated Note due 01/31/2019 (D) | | $ | 1,428,470 | | | | * | | | | 1,358,229 | | | | 1,214,199 | |
| Common Stock (B) | | 38 shs. | | | 12/14/10 | | | | 38,168 | | | | — | |
Warrant, exercisable until 2020, to purchase common stock at $.01 per share (B) | | 37 shs. | | | 12/14/10 | | | | 37,249 | | | | — | |
| * 12/14/10, 08/17/12 and 03/31/16. | | | | | | | | | | | 1,433,646 | | | | 1,214,199 | |
| | | | | | | | | | | | | | | | | |
| | | | | | | | | | | | | | | | | |
| Sunvair Aerospace Group Inc. | | | | | | | | | | | | | | | | |
| An aerospace maintenance, repair, and overhaul provider servicing landing gears on narrow body aircraft. | |
12% (1% PIK) Senior Subordinated Note due 07/31/2021 | | $ | 1,357,891 | | | 07/31/15 | | | | 1,343,702 | | | | 896,208 | |
| Common Stock (B) | | 68 shs. | | | | * | | | | 104,986 | | | | — | |
| * 07/31/15 and 11/08/17. | | | | | | | | | | | 1,448,688 | | | | 896,208 | |
| | | | | | | | | | | | | | | | | |
| | | | | | | | | | | | | | | | | |
| Team Drive-Away Holdings LLC | | | | | | | | | | | | | | | | |
| An asset-light provider of over the road driveaway services for class 8 trucks and specialized equipment. | |
| Limited Liability Company Unit (B) | | 95,800 uts. | | | 10/15/15 | | | | 95,800 | | | | 184,894 | |
| | | | | | | | | | | | | | | | | |
See Notes to Consolidated Financial Statements
CONSOLIDATED SCHEDULE OF INVESTMENTS (CONTINUED)
June 30, 2018
(Unaudited)
Corporate Restricted Securities: (A) (Continued) | | Principal Amount,
Shares, Units or
Ownership Percentage | | | Acquisition
Date | | | Cost | | | Fair Value | |
| | | | | | | | | | | | | | |
| Therma-Stor Holdings LLC | | | | | | | | | | | | | |
| A designer and manufacturer of dehumidifiers and water damage restoration equipment for residential and commercial applications. | |
10.5% (0.5% PIK) Senior Subordinated Note due 11/30/2023 | | $ | 1,369,649 | | | | 11/30/17 | | | $ | 1,369,649 | | | $ | 1,340,874 | |
| Limited Liability Company Unit | | 359,375 uts. | | | | 11/30/17 | | | | 342,851 | | | | 286,441 | |
| | | | | | | | | | | | 1,712,500 | | | | 1,627,315 | |
| | | | | | | | | | | | | | | | | |
| | | | | | | | | | | | | | | | | |
| Torrent Group Holdings, Inc. | | | | | | | | | | | | | | | | |
| A contractor specializing in the sales and installation of engineered drywells for the retention and filtration of stormwater and nuisance water flow. | |
15% (7.5% PIK) Senior Subordinated Note due 12/05/2020 | | $ | 46,250 | | | | 12/05/13 | | | | 90,925 | | | | 46,250 | |
Warrant, exercisable until 2023, to purchase common stock at $.01 per share (B) | | 28,079 shs. | | | | 12/05/13 | | | | — | | | | 22,744 | |
| | | | | | | | | | | | 90,925 | | | | 68,994 | |
| | | | | | | | | | | | | | | | | |
| | | | | | | | | | | | | | | | | |
| Trident Maritime Systems | | | | | | | | | | | | | | | | |
| A leading provider of turnkey marine vessel systems and solutions for government and commercial new ship construction as well as repair, refurbishment, and retrofit markets worldwide. | |
| 7.83% Term Loan due 04/30/2024 (LIBOR + 5.500%) | | $ | 2,465,000 | | | | 05/14/18 | | | | 2,410,232 | | | | 2,407,516 | |
| | | | | | | | | | | | | | | | | |
| | | | | | | | | | | | | | | | | |
| Tristar Global Energy Solutions, Inc. | | | | | | | | | | | | | | | | |
| A hydrocarbon and decontamination services provider serving refineries worldwide. | |
12.5% (1.5% PIK) Senior Subordinated Note due 07/31/2020 | | $ | 1,169,359 | | | | 01/23/15 | | | | 1,158,797 | | | | 1,127,832 | |
| | | | | | | | | | | | | | | | | |
| | | | | | | | | | | | | | | | | |
| U.S. Retirement and Benefit Partners, Inc. | | | | | | | | | | | | | | | | |
| A leading independent provider of outsourced benefit design and administration and retirement services, primarily to K-12 school districts, employee unions, and governmental agencies. | |
10.83% Second Lien Term Loan due 2/14/2023 (LIBOR + 8.500%) | | $ | 1,725,000 | | | | 03/05/18 | | | | 1,346,955 | | | | 1,346,443 | |
| | | | | | | | | | | | | | | | | |
| | | | | | | | | | | | | | | | | |
| Velocity Technology Solutions, Inc | | | | | | | | | | | | | | | | |
| A provider of outsourced hosting services for enterprise resource planning software applications and information technology infrastructure to mid and large-sized enterprises. | |
8.33% Lien Term Loan due 12/07/2023 (LIBOR + 6.000%) | | $ | 2,089,500 | | | | 12/07/17 | | | | 2,070,535 | | | | 2,076,442 | |
| | | | | | | | | | | | | | | | | |
See Notes to Consolidated Financial Statements
Barings Participation Investors
CONSOLIDATED SCHEDULE OF INVESTMENTS (CONTINUED)
June 30, 2018
(Unaudited)
Corporate Restricted Securities: (A) (Continued) | | Principal Amount,
Shares, Units or
Ownership Percentage | | | Acquisition
Date | | | Cost | | | Fair Value | |
| | | | | | | | | | | | | |
| Veritext Corporation | | | | | | | | | | | | |
| A provider of stenographic staffing and other services used during the legal deposition process. | |
11.33% Second Lien Term Loan due 01/29/2023 (LIBOR + 9.000%) | | $ | 2,012,500 | | | | * | | | $ | 1,985,486 | | | $ | 1,993,221 | |
| * 01/21/16 and 02/23/17. | | | | | | | | | | | | | | | | |
| | | | | | | | | | | | | | | | | |
| | | | | | | | | | | | | | | | | |
| VP Holding Company | | | | | | | | | | | | | | | | |
| A provider of school transportation services for special-needs and homeless children in Massachusetts and Connecticut. | |
7.83% Lien Term Loan due 05/22/2024 (LIBOR + 5.500%) | | $ | 2,465,000 | | | 05/17/18 | | | | 1,546,282 | | | | 1,542,798 | |
| | | | | | | | | | | | | | | | | |
| | | | | | | | | | | | | | | | | |
| Wellborn Forest Holding Company | | | | | | | | | | | | | | | | |
| A manufacturer of semi-custom kitchen and bath cabinetry. | |
| 10% Senior Subordinated Note due 09/30/2019 (D) | | $ | 1,778,423 | | | 11/30/06 | | | | 1,224,918 | | | | 1,778,423 | |
| Common Stock (B) | | 101 shs. | | | 11/30/06 | | | | 101,250 | | | | 1,366 | |
Warrant, exercisable until 2019, to purchase common stock at $.01 per share (B) | | 51 shs. | | | 11/30/06 | | | | 45,790 | | | | 682 | |
| | | | | | | | | | | | 1,371,958 | | | | 1,780,471 | |
| | | | | | | | | | | | | | | | | |
| | | | | | | | | | | | | | | | | |
| Westminster Acquisition LLC | | | | | | | | | | | | | | | | |
| A manufacturer of premium, all-natural oyster cracker products sold under the Westminster and Olde Cape Cod brands. | |
12% (1% PIK) Senior Subordinated Note due 02/03/2021 | | $ | 381,153 | | | 08/03/15 | | | | 377,195 | | | | 371,305 | |
| Limited Liability Company Unit (B)(F) | | 370,241 uts. | | | 08/03/15 | | | | 370,241 | | | | 295,204 | |
| | | | | | | | | | | | 747,436 | | | | 666,509 | |
| | | | | | | | | | | | | | | | | |
| | | | | | | | | | | | | | | | | |
| Whitebridge Pet Brands Holdings, LLC | | | | | | | | | | | | | | | | |
| A portfolio of natural treats and foods for dogs and cats. | |
11.5% (0.5% PIK) Senior Subordinated Note due 08/18/2021 | | $ | 1,489,997 | | | 04/18/17 | | | | 1,472,843 | | | | 1,472,319 | |
| Limited Liability Company Unit Class A (B)(F) | | 123 uts. | | | 04/18/17 | | | | 148,096 | | | | 138,949 | |
| Limited Liability Company Unit Class B (B)(F) | | 123 uts. | | | 04/18/17 | | | | — | | | | 5,767 | |
| | | | | | | | | | | | 1,620,939 | | | | 1,617,035 | |
| | | | | | | | | | | | | | | | | |
| | | | | | | | | | | | | | | | | |
| Wolf-Gordon, Inc. | | | | | | | | | | | | | | | | |
| A designer and specialty distributor of wallcoverings and related building products, including textiles, paint, and writeable surfaces. | |
12.5% (1.5% PIK) Senior Subordinated Note due 07/22/2021 | | $ | 1,626,572 | | | 01/22/16 | | | | 1,606,472 | | | | 1,636,409 | |
| Common Stock (B) | | 157 shs. | | | 01/22/16 | | | | 156,818 | | | | 195,678 | |
| | | | | | | | | | | | 1,763,290 | | | | 1,832,087 | |
| | | | | | | | | | | | | | | | | |
See Notes to Consolidated Financial Statements
CONSOLIDATED SCHEDULE OF INVESTMENTS (CONTINUED)
June 30, 2018
(Unaudited)
Corporate Restricted Securities: (A) (Continued) | | Principal Amount,
Shares, Units or
Ownership Percentage | | | Acquisition
Date | | | Cost | | | Fair Value | |
| | | | | | | | | | | | | |
| WP Supply Holding Corporation | | | | | | | | | | | | |
| A distributor of fresh fruits and vegetables to grocery wholesalers and foodservice distributors in the upper Midwest. | |
14.5% (2.5% PIK) Senior Subordinated Note due 06/12/2020 | | $ | 1,003,501 | | | 11/03/11 | | | $ | 1,002,213 | | | $ | 1,001,657 | |
| Common Stock (B) | | 1,500 shs. | | | 11/03/11 | | | | 150,000 | | | | 126,532 | |
| | | | | | | | | | | 1,152,213 | | | | 1,128,189 | |
| | | | | | | | | | | | | | | | |
| | | | | | | | | | | | | | | | |
| York Wall Holding Company | | | | | | | | | | | | | | | |
| A designer, manufacturer and marketer of wall covering products for both residential and commercial wall coverings. | |
14.5% (1.5% PIK) Senior Subordinated Note due 03/04/2021 (D) | | $ | 1,946,834 | | | 03/04/15 | | | | 1,549,582 | | | | 1,752,938 | |
| Common Stock (B) | | 2,046 shs. | | | | * | | | | 200,418 | | | | — | |
| * 03/04/15 and 02/07/18 | | | | | | | | | | | 1,750,000 | | | | 1,752,938 | |
| | | | | | | | | | | | | | | | | |
| | | | | | | | | | | | | | | | | |
| Total Private Placement Investments (E) | | | | | | | | | | $ | 109,561,085 | | | $ | 105,436,956 | |
See Notes to Consolidated Financial Statements
Barings Participation Investors
CONSOLIDATED SCHEDULE OF INVESTMENTS (CONTINUED)
June 30, 2018
(Unaudited)
Corporate Restricted Securities: (A) (Continued) | | Interest
Rate | | Maturity
Date | | Principal
Amount | | | Cost | | | Market Value | |
| | | | | | | | | | | | | | |
| Rule 144A Securities - 10.48%: | | | | | | | | | | | | | |
| | | | | | | | | | | | | | |
| Bonds - 10.48% | | | | | | | | | | | | | |
| Alliance Residential Company | | 7.500 | % | 05/01/25 | | $ | 500,000 | | | $ | 519,546 | | | $ | 532,500 | |
| Altice Financing S.A. | | 7.500 | | 05/15/26 | | | 400,000 | | | | 400,000 | | | | 386,880 | |
| Amsted Industries | | 5.375 | | 09/15/24 | | | 240,000 | | | | 240,000 | | | | 238,200 | |
| AmWINS Group, Inc. | | 7.750 | | 07/01/26 | | | 187,000 | | | | 187,000 | | | | 189,805 | |
| Avantor Inc. | | 6.000 | | 10/01/24 | | | 406,000 | | | | 406,000 | | | | 401,615 | |
| Beacon Roofing Supply, Inc. | | 4.875 | | 11/01/25 | | | 406,000 | | | | 406,000 | | | | 373,276 | |
| Boyne USA, Inc. | | 7.250 | | 05/01/25 | | | 167,000 | | | | 167,000 | | | | 174,098 | |
| Cimpress N.V. | | 7.000 | | 06/15/26 | | | 500,000 | | | | 500,000 | | | | 510,625 | |
| CITGO Petroleum Corporation | | 6.250 | | 08/15/22 | | | 425,000 | | | | 425,000 | | | | 423,002 | |
| CVR Partners, LP. | | 9.250 | | 06/15/23 | | | 500,000 | | | | 490,352 | | | | 515,000 | |
| Dell Inc. | | 4.420 | | 06/15/21 | | | 600,000 | | | | 618,230 | | | | 608,772 | |
| EP Energy LLC / Everest Acquisition Finance Inc. | | 9.375 | | 05/01/24 | | | 406,000 | | | | 245,803 | | | | 332,920 | |
| First Quantum Minerals Ltd. | | 7.500 | | 04/01/25 | | | 500,000 | | | | 484,070 | | | | 493,450 | |
| Flex Acquisition Co Inc. | | 7.875 | | 07/15/26 | | | 386,000 | | | | 386,000 | | | | 384,495 | |
| Hertz Corporation | | 7.625 | | 06/01/22 | | | 500,000 | | | | 500,000 | | | | 480,000 | |
| Hilcorp Energy Company | | 5.000 | | 12/01/24 | | | 335,000 | | | | 335,000 | | | | 324,950 | |
| IAMGOLD Corporation | | 7.000 | | 04/15/25 | | | 500,000 | | | | 500,000 | | | | 509,850 | |
| JBS USA Lux S.A. | | 6.750 | | 02/15/28 | | | 476,000 | | | | 476,000 | | | | 449,677 | |
| Jupiter Resources Inc. | | 8.500 | | 10/01/22 | | | 500,000 | | | | 470,376 | | | | 205,000 | |
| LBC Tank Terminals Holding Netherlands B.V. | | 6.875 | | 05/15/23 | | | 663,000 | | | | 675,492 | | | | 669,630 | |
| Mattel, Inc. | | 6.750 | | 12/31/25 | | | 500,000 | | | | 481,463 | | | | 486,875 | |
| Moog Inc. | | 5.250 | | 12/01/22 | | | 500,000 | | | | 502,533 | | | | 510,000 | |
| New Enterprise Stone & Lime Co., Inc. | | 6.250 | | 03/15/26 | | | 500,000 | | | | 508,634 | | | | 505,000 | |
| New Gold Inc. | | 6.250 | | 11/15/22 | | | 500,000 | | | | 501,994 | | | | 505,000 | |
| OPE KAG Finance Sub | | 7.875 | | 07/31/23 | | | 500,000 | | | | 516,956 | | | | 510,000 | |
| Penske Corporation | | 4.875 | | 07/11/22 | | | 500,000 | | | | 498,901 | | | | 519,879 | |
| Prime Security Services Borrower | | 9.250 | | 05/15/23 | | | 608,000 | | | | 618,406 | | | | 647,338 | |
| Sinclair Broadcast Group, Inc. | | 5.875 | | 03/15/26 | | | 204,000 | | | | 204,000 | | | | 198,390 | |
| Sinclair Television Group, Inc. | | 5.125 | | 02/15/27 | | | 500,000 | | | | 500,000 | | | | 460,000 | |
| Suncoke Energy | | 7.500 | | 06/15/25 | | | 500,000 | | | | 493,042 | | | | 508,750 | |
| Teine Energy Ltd. | | 6.875 | | 09/30/22 | | | 500,000 | | | | 506,250 | | | | 505,000 | |
| Topaz Marine S.A. | | 9.125 | | 07/26/22 | | | 500,000 | | | | 500,000 | | | | 503,160 | |
| Valeant Pharmaceuticals International | | 7.000 | | 03/15/24 | | | 173,000 | | | | 173,000 | | | | 181,382 | |
| Virgin Media Secured Finance PLC | | 5.250 | | 01/15/26 | | | 500,000 | | | | 501,569 | | | | 462,500 | |
| VRX Escrow Corp. | | 6.125 | | 04/15/25 | | | 182,000 | | | | 182,000 | | | | 167,668 | |
| Warrior Met Coal, Inc. | | 8.000 | | 11/01/24 | | | 209,000 | | | | 209,000 | | | | 215,793 | |
| | | | | | | | | | | | | | | | | |
| Total Bonds | | | | | | | | | | | 15,329,617 | | | | 15,090,480 | |
| | | | | | | | | | | | | | | | | |
| Common Stock - 0.00% | | | | | | | | | | | | | | | | |
| TherOX, Inc. (B) | | | | | | | 2 | | | | — | | | | — | |
| Touchstone Health Partnership (B) | | | | | | | 292 | | | | — | | | | — | |
| | | | | | | | | | | | | | | | | |
| Total Common Stock | | | | | | | | | | | — | | | | — | |
| | | | | | | | | | | | | | | | | |
| Total Rule 144A Securities | | | | | | | | | | | 15,329,617 | | | | 15,090,480 | |
| | | | | | | | | | | | | | | | | |
See Notes to Consolidated Financial Statements
CONSOLIDATED SCHEDULE OF INVESTMENTS (CONTINUED)
June 30, 2018
(Unaudited)
| Corporate Public Securities - 18.36%: (A) | | LIBOR
Spread | | Interest
Rate | | Maturity
Date | | Principal
Amount | | | Cost | | | Market
Value | |
| | | | | | | | | | | | | | | | |
| Bank Loans - 3.25% | | | | | | | | | | | | | | | |
| Big River Steel LLC. | | 5.000 | % | 7.334 | % | 08/23/23 | | $ | 118,472 | | | $ | 117,452 | | | $ | 119,879 | |
| BMC Software Finance, Inc. | | 4.250 | | 6.586 | | 06/26/25 | | | 500,000 | | | | 495,000 | | | | 496,875 | |
| Coronado Coal LLC | | 6.500 | | 8.834 | | 03/14/25 | | | 253,207 | | | | 245,813 | | | | 254,789 | |
| Coronado Coal LLC | | 6.500 | | 8.834 | | 03/21/25 | | | 69,229 | | | | 67,220 | | | | 69,662 | |
| Edelman Financial Services | | 6.750 | | 9.086 | | 06/08/26 | | | 128,178 | | | | 127,537 | | | | 128,900 | |
| Focus Financial Partners, LLC | | 7.500 | | 9.594 | | 05/22/25 | | | 400,000 | | | | 409,000 | | | | 402,000 | |
| Gulf Finance, LLC | | 5.250 | | 7.590 | | 08/25/23 | | | 252,136 | | | | 250,304 | | | | 217,046 | |
| ION Trading Technologies Sarl | | 4.000 | | 6.336 | | 11/21/24 | | | 276,939 | | | | 270,015 | | | | 274,169 | |
| Murray Energy Corporation | | 7.250 | | 9.344 | | 04/16/20 | | | 291,867 | | | | 259,920 | | | | 274,495 | |
| OCI Beaumont LLC | | 4.000 | | 6.337 | | 02/14/25 | | | 121,980 | | | | 121,834 | | | | 122,820 | |
| PowerSchool | | 7.000 | | 9.336 | | 05/29/26 | | | 500,000 | | | | 495,000 | | | | 500,000 | |
| Prospect Medical Holdings, Inc. | | 5.500 | | 7.500 | | 02/13/24 | | | 255,441 | | | | 250,620 | | | | 254,803 | |
| PS Logistics LLC | | 5.250 | | 7.297 | | 03/01/25 | | | 500,000 | | | | 504,853 | | | | 502,500 | |
| Seadrill Partners Finco, LLC | | 6.000 | | 8.334 | | 02/21/21 | | | 487,245 | | | | 325,929 | | | | 435,612 | |
| STS Operating, Inc. | | 8.000 | | 10.094 | | 04/25/26 | | | 500,000 | | | | 505,000 | | | | 502,500 | |
| Summit Midstream Holdings, LLC | | 6.000 | | 8.094 | | 05/13/22 | | | 123,393 | | | | 122,461 | | | | 124,704 | |
| | | | | | | | | | | | | | | | | | | |
| Total Bank Loans | | | | | | | | | | | | | 4,567,958 | | | | 4,680,754 | |
| | | Interest
Rate | | Maturity
Date | | Principal
Amount | | | Cost | | | Market Value | |
| | | | | | | | | | | | | | |
| Bonds - 15.11% | | | | | | | | | | | | | |
| Air Lease Corp. | | 3.000 | % | 09/15/23 | | $ | 600,000 | | | $ | 593,826 | | | $ | 568,555 | |
| AMC Entertainment Holdings Inc. | | 6.125 | | 05/15/27 | | | 500,000 | | | | 487,141 | | | | 485,000 | |
| Anchorage Capital Group, L.L.C. | | 9.598 | | 01/15/29 | | | 500,000 | | | | 517,188 | | | | 509,875 | |
| Anglogold Holdings PLC | | 5.375 | | 04/15/20 | | | 600,000 | | | | 601,469 | | | | 611,369 | |
| Anixter, Inc. | | 5.125 | | 10/01/21 | | | 165,000 | | | | 165,000 | | | | 167,888 | |
| A. Schulman Inc. | | 6.875 | | 06/01/23 | | | 500,000 | | | | 504,864 | | | | 526,500 | |
| Beazer Homes USA, Inc. | | 8.750 | | 03/15/22 | | | 160,000 | | | | 160,000 | | | | 170,000 | |
| Brunswick Corporation | | 7.125 | | 08/01/27 | | | 500,000 | | | | 503,590 | | | | 583,628 | |
| Bunge Limited Finance Corp. | | 3.250 | | 08/15/26 | | | 600,000 | | | | 601,844 | | | | 547,635 | |
| Clearwater Paper Corporation | | 4.500 | | 02/01/23 | | | 489,000 | | | | 486,437 | | | | 457,215 | |
| Crown Castle International Corp | | 5.250 | | 01/15/23 | | | 600,000 | | | | 655,240 | | | | 628,703 | |
| CubeSmart, L.P. | | 4.000 | | 11/15/25 | | | 500,000 | | | | 505,874 | | | | 491,478 | |
| CVR Refining LLC | | 6.500 | | 11/01/22 | | | 350,000 | | | | 343,215 | | | | 357,000 | |
| CVS Health Corp | | 4.300 | | 03/25/28 | | | 345,000 | | | | 340,094 | | | | 340,311 | |
| Discovery Communications | | 4.900 | | 03/11/26 | | | 600,000 | | | | 646,054 | | | | 615,394 | |
| Dish DBS Corporation | | 7.750 | | 07/01/26 | | | 500,000 | | | | 540,183 | | | | 438,125 | |
| Expedia Inc. | | 4.500 | | 08/15/24 | | | 600,000 | | | | 622,649 | | | | 599,262 | |
| Ferrellgas Partners, L.P. | | 6.750 | | 01/15/22 | | | 265,000 | | | | 267,199 | | | | 239,825 | |
| Ferrellgas Partners, L.P. | | 8.625 | | 06/15/20 | | | 650,000 | | | | 650,269 | | | | 625,625 | |
| Ford Motor Credit Co. LLC | | 4.375 | | 08/06/23 | | | 600,000 | | | | 637,881 | | | | 603,169 | |
See Notes to Consolidated Financial Statements
Barings Participation Investors
CONSOLIDATED SCHEDULE OF INVESTMENTS (CONTINUED)
June 30, 2018
(Unaudited)
Corporate Public Securities : (A) (Continued) | | Interest
Rate | | Maturity
Date | | Principal
Amount | | | Cost | | | Market Value | |
| | | | | | | | | | | | | | | | | |
| General Motors Financial Co. Inc. | | 4.000 | % | 01/15/25 | | $ | 500,000 | | | $ | 507,219 | | | $ | 484,715 | |
| Genesis Energy, L.P. | | 5.625 | | 06/15/24 | | | 500,000 | | | | 471,863 | | | | 467,500 | |
| Hospital Corporation of America | | 5.375 | | 02/01/25 | | | 100,000 | | | | 101,326 | | | | 98,470 | |
| Hospital Corporation of America | | 5.250 | | 06/15/26 | | | 174,000 | | | | 174,000 | | | | 172,817 | |
| Hewlett Packard Enterprise Company | | 4.900 | | 10/15/25 | | | 500,000 | | | | 498,766 | | | | 510,348 | |
| Hughes Satellite Systems Corporation | | 6.625 | | 08/01/26 | | | 500,000 | | | | 496,961 | | | | 462,500 | |
| Laboratory Corporation of America Holdings | | 3.600 | | 02/01/25 | | | 500,000 | | | | 499,446 | | | | 488,259 | |
| Laredo Petroleum, Inc. | | 5.625 | | 01/15/22 | | | 500,000 | | | | 480,378 | | | | 493,125 | |
| Lazard Group LLC | | 4.250 | | 11/14/20 | | | 500,000 | | | | 499,387 | | | | 509,787 | |
| LyondellBasell Industries N.V. | | 5.750 | | 04/15/24 | | | 500,000 | | | | 576,128 | | | | 540,126 | |
| M/I Homes, Inc. | | 5.625 | | 08/01/25 | | | 500,000 | | | | 475,289 | | | | 467,499 | |
| MPLX LP | | 4.875 | | 12/01/24 | | | 500,000 | | | | 500,000 | | | | 515,484 | |
| NRG Energy, Inc. | | 7.250 | | 05/15/26 | | | 500,000 | | | | 502,790 | | | | 532,500 | |
| Oasis Petroleum Inc. | | 6.875 | | 03/15/22 | | | 474,000 | | | | 454,653 | | | | 482,158 | |
| PBF Holding Company LLC | | 6.997 | | 11/15/23 | | | 33,000 | | | | 33,000 | | | | 34,155 | |
| PBF Holding Company LLC | | 7.250 | | 06/15/25 | | | 500,000 | | | | 517,202 | | | | 525,625 | |
| Pitney Bowes Inc. | | 3.625 | | 10/01/21 | | | 500,000 | | | | 499,153 | | | | 470,025 | |
| Reinsurance Group of America | | 3.950 | | 09/15/26 | | | 500,000 | | | | 502,742 | | | | 489,949 | |
| SM Energy Company | | 6.750 | | 09/15/26 | | | 750,000 | | | | 744,602 | | | | 751,875 | |
| Sprint Corporation | | 7.125 | | 06/15/24 | | | 155,000 | | | | 155,000 | | | | 156,486 | |
| Steelcase, Inc. | | 6.375 | | 02/15/21 | | | 500,000 | | | | 502,782 | | | | 531,779 | |
| Suburban Propane Partners, L.P. | | 5.750 | | 03/01/25 | | | 500,000 | | | | 500,000 | | | | 479,688 | |
| Time Warner Cable, Inc. | | 5.000 | | 02/01/20 | | | 500,000 | | | | 498,000 | | | | 510,439 | |
| Trinity Acquisition Plc | | 4.400 | | 03/15/26 | | | 500,000 | | | | 514,409 | | | | 495,097 | |
| William Lyon Homes | | 7.000 | | 08/15/22 | | | 500,000 | | | | 500,000 | | | | 509,375 | |
| WPX Energy, Inc. | | 5.250 | | 09/15/24 | | | 425,000 | | | | 425,000 | | | | 418,094 | |
| Xlit Ltd | | 4.450 | | 03/31/25 | | | 600,000 | | | | 611,891 | | | | 590,330 | |
| | | | | | | | | | | | | | | | | |
| Total Bonds | | | | | | | | | | | 22,072,004 | | | | 21,754,762 | |
| | | | | | | | | | | | | | | | | |
| | | | | | | | | | | | | | | | | |
| Total Corporate Public Securities | | | | | | | | | | $ | 26,639,962 | | | $ | 26,435,516 | |
| | | | | | | | | | | | | | | | | |
| | | | | | | | | | | | | | | | | |
| Total Investments | | 102.09 | % | | | | | | | $ | 151,530,664 | | | $ | 146,962,952 | |
| | | | | | | | | | | | | | | | | |
| | | | | | | | | | | | | | | | | |
| Other Assets | | 9.55 | | | | | | | | | | | | | 13,749,744 | |
| | | | | | | | | | | | | | | | | |
| Liabilities | | (11.64 | ) | | | | | | | | | | | | (16,765,160 | ) |
| | | | | | | | | | | | | | | | | |
| Total Net Assets | | 100.00 | % | | | | | | | | | | | $ | 143,947,536 | |
| | | | | | | | | | | | | | | | | |
| (A) | In each of the convertible note, warrant, and common stock investments, the issuer has agreed to provide certain registration rights. |
| (B) | Non-income producing security. |
| (C) | Security valued at fair value using methods determined in good faith by or under the direction of the Board of Trustees. |
| (D) | Defaulted security; interest not accrued. |
| (E) | Illiquid security. As of June 30, 2018, the values of these securities amounted to $105,436,956 or 73.25% of net assets. |
| (F) | Held in PI Subsidiary Trust |
PIK - Payment-in-kind
See Notes to Consolidated Financial Statements
CONSOLIDATED SCHEDULE OF INVESTMENTS (CONTINUED)
June 30, 2018
(Unaudited)
| Industry Classification: | | Fair Value/
Market Value | |
| | | | |
| AEROSPACE & DEFENSE - 3.85% | | | |
| API Technologies Corp. | | $ | 358,800 | |
BEI Precision Systems & Space Company, Inc. | | | 1,585,066 | |
| Merex Holding Corporation | | | 293,171 | |
| Sunvair Aerospace Group Inc. | | | 896,208 | |
| Trident Maritime Systems | | | 2,407,516 | |
| | | | 5,540,761 | |
| | | | | |
| AUTOMOTIVE - 5.14% | | | | |
| Aurora Parts & Accessories LLC | | | 1,588,102 | |
| DPL Holding Corporation | | | 1,661,865 | |
| English Color & Supply LLC | | | 1,690,523 | |
| Ford Motor Credit Co. LLC | | | 603,169 | |
| General Motors Financial Co. Inc. | | | 484,715 | |
| Grakon Parent | | | 275,711 | |
| Moog Inc. | | | 510,000 | |
| Power Stop Holdings LLC | | | 262,252 | |
| Randy's Worldwide Automotive | | | 318,092 | |
| | | | 7,394,429 | |
| | | | | |
BROKERAGE, ASSET MANAGERS & EXCHANGES - 0.35% | |
| Lazard Group LLC | | | 509,787 | |
| | | | | |
| BUILDING MATERIALS - 8.19% | | | | |
| ARI Holding Corporation | | | 2,796,422 | |
| Beacon Roofing Supply, Inc. | | | 373,276 | |
| Happy Floors Acquisition, Inc. | | | 1,216,952 | |
| New Enterprise Stone & Lime Co., Inc. | | | 505,000 | |
| NSi Industries Holdings, Inc. | | | 1,764,453 | |
| Signature Systems Holding Company | | | 247,424 | |
| Sunrise Windows Holding Company | | | 1,214,199 | |
| Torrent Group Holdings, Inc. | | | 68,994 | |
| Wellborn Forest Holding Company | | | 1,780,471 | |
| Wolf-Gordon, Inc. | | | 1,832,087 | |
| | | | 11,799,278 | |
| | | | | |
| CABLE & SATELLITE - 1.00% | | | | |
| Hughes Satellite Systems Corporation | | | 462,500 | |
| Time Warner Cable, Inc. | | | 510,439 | |
| Virgin Media Secured Finance PLC | | | 462,500 | |
| | | | 1,435,439 | |
| | | | | |
| | | Fair Value/
Market Value | |
| | | | |
| CHEMICALS - 2.38% | | | |
| A. Schulman Inc. | | $ | 526,500 | |
| Compass Chemical International LLC | | | 193,699 | |
| CVR Partners, LP. | | | 515,000 | |
LBC Tank Terminals Holding Netherlands B.V. | | | 669,630 | |
| LyondellBasell Industries N.V. | | | 540,126 | |
| OCI Beaumont LLC | | | 122,820 | |
| Polytex Holdings LLC | | | 850,981 | |
| | | | 3,418,756 | |
| | | | | |
| CONSUMER CYCLICAL SERVICES - 3.28% | |
CHG Alternative Education Holding Company | | | 1,057,084 | |
| MeTEOR Education LLC | | | 987,302 | |
| PPC Event Services | | | 1,526,412 | |
| Prime Security Services Borrower | | | 647,338 | |
| PS Logistics LLC | | | 502,500 | |
| | | | 4,720,636 | |
| | | | | |
| CONSUMER PRODUCTS - 10.22% | | | | |
| AMS Holding LLC | | | 206,006 | |
| Blue Wave Products, Inc. | | | 725,510 | |
| Elite Sportwear Holding, LLC | | | 1,473,418 | |
| gloProfessional Holdings, Inc. | | | 1,261,464 | |
| GTI Holding Company | | | 893,534 | |
| Handi Quilter Holding Company | | | 2,227,847 | |
| HHI Group, LLC | | | 1,714,457 | |
| Manhattan Beachwear Holding Company | | | 481,701 | |
| Master Cutlery LLC | | | 486,137 | |
| Mattel, Inc. | | | 486,875 | |
| New Mountain Learning, LLC | | | 1,383,447 | |
| Whitebridge Pet Brands Holdings, LLC | | | 1,617,035 | |
| York Wall Holding Company | | | 1,752,938 | |
| | | | 14,710,369 | |
| | | | | |
| DIVERSIFIED MANUFACTURING - 5.15% | |
| ABC Industries, Inc. | | | 377,155 | |
| Advanced Manufacturing Enterprises LLC | | | 5,612 | |
| Amsted Industries | | | 238,200 | |
| F G I Equity LLC | | | 605,789 | |
| K P I Holdings, Inc. | | | 450,194 | |
| Motion Controls Holdings | | | 330,205 | |
See Notes to Consolidated Financial Statements
Barings Participation Investors
CONSOLIDATED SCHEDULE OF INVESTMENTS (CONTINUED)
June 30, 2018
(Unaudited)
| Industry Classification: (Continued) | | Fair Value/
Market Value | |
| | | | | |
| Reelcraft Industries, Inc. | | $ | 1,773,845 | |
| SR Smith LLC | | | 1,713,884 | |
| Strahman Holdings Inc | | | 288,798 | |
| Therma-Stor Holdings LLC | | | 1,627,315 | |
| | | | 7,410,997 | |
| | | | | |
| ELECTRIC - 1.73% | | | | |
| AM Conservation Holding Corp. | | | 1,956,706 | |
| NRG Energy, Inc. | | | 532,500 | |
| | | | 2,489,206 | |
| | | | | |
| FINANCE COMPANIES - 0.39% | | | | |
| Air Lease Corp. | | | 568,555 | |
| | | | | |
| FINANCIAL OTHER - 2.83% | | | | |
| Anchorage Capital Group, L.L.C. | | | 509,875 | |
| Edelman Financial Services | | | 128,900 | |
| Focus Financial Partners, LLC. | | | 402,000 | |
| Strategic Insight, Inc. | | | 1,691,385 | |
| U.S. Retirement and Benefit Partners, Inc. | | | 1,346,443 | |
| | | | 4,078,603 | |
| | | | | |
| FOOD & BEVERAGE - 6.83% | | | | |
| Bunge Limited Finance Corp. | | | 547,635 | |
| Del Real LLC | | | 1,621,049 | |
| F F C Holding Corporation | | | 76,193 | |
| Hollandia Produce LLC | | | 1,466,251 | |
| Hospitality Mints Holding Company | | | 1,098,837 | |
| Impact Confections | | | — | |
| JBS USA Lux S.A. | | | 449,677 | |
| JMH Investors LLC | | | 439,294 | |
| PANOS Brands LLC | | | 2,339,194 | |
| Westminster Acquisition LLC | | | 666,509 | |
| WP Supply Holding Corporation | | | 1,128,189 | |
| | | | 9,832,828 | |
| | | | | |
| GAMING - 1.63% | | | | |
| CTM Holding, Inc. | | | 2,350,402 | |
| | | | | |
| HEALTHCARE - 4.35% | | | | |
| Avantor Inc. | | | 401,615 | |
| Cadence, Inc. | | | 795,024 | |
| CORA Health Services, Inc. | | | 1,526,292 | |
| ECG Consulting Group | | | 2,182,018 | |
| | | Fair Value/
Market Value | |
| | | | | |
| GD Dental Services LLC | | $ | — | |
| Hospital Corporation of America | | | 271,287 | |
Laboratory Corporation of America Holdings | | | 488,259 | |
| Prospect Medical Holdings, Inc. | | | 254,803 | |
| TherOX, Inc. | | | — | |
| Touchstone Health Partnership | | | — | |
| Valeant Pharmaceuticals International | | | 181,382 | |
| VRX Escrow Corp. | | | 167,668 | |
| | | | 6,268,348 | |
| | | | | |
| HEALTH INSURANCE - 0.34% | | | | |
| Reinsurance Group of America | | | 489,949 | |
| | | | | |
| HOME CONSTRUCTION - 0.80% | | | | |
| Beazer Homes USA, Inc. | | | 170,000 | |
| M/I Homes, Inc. | | | 467,499 | |
| William Lyon Homes | | | 509,375 | |
| | | | 1,146,874 | |
| | | | | |
| INDEPENDENT - 1.34% | | | | |
| Jupiter Resources Inc. | | | 205,000 | |
| Laredo Petroleum, Inc. | | | 493,125 | |
| Oasis Petroleum Inc. | | | 482,158 | |
| SM Energy Company | | | 751,875 | |
| | | | 1,932,158 | |
| | | | | |
| INDUSTRIAL OTHER - 5.50% | | | | |
| AFC - Dell Holding Corporation | | | 1,323,840 | |
| Brunswick Corporation | | | 583,628 | |
| E.S.P. Associates, P.A. | | | 878,513 | |
| Hartland Controls Holding Corporation | | | 1,811,339 | |
| Midwest Industrial Rubber, Inc. | | | 1,727,377 | |
| Smart Source Holdings LLC | | | 562,758 | |
| SMB Machinery Holdings, Inc. | | | — | |
| Steelcase, Inc. | | | 531,779 | |
| STS Operating, Inc. | | | 502,500 | |
| | | | 7,921,734 | |
| | | | | |
| MEDIA & ENTERTAINMENT - 4.59% | | | | |
| AMC Entertainment Holdings Inc. | | | 485,000 | |
| BlueSpire Holding, Inc. | | | — | |
| Boyne USA, Inc. | | | 174,098 | |
| Cimpress N.V. | | | 510,625 | |
See Notes to Consolidated Financial Statements
CONSOLIDATED SCHEDULE OF INVESTMENTS (CONTINUED)
June 30, 2018
(Unaudited)
| Industry Classification: (Continued) | | Fair Value/
Market Value | |
| | | | | |
| Discovery Communications | | $ | 615,394 | |
| Discovery Education, Inc. | | | 1,900,466 | |
| Dish DBS Corporation | | | 438,125 | |
| GlynnDevins Acquisition Corporation | | | 198,385 | |
| HOP Entertainment LLC | | | — | |
| Money Mailer Equity LLC | | | 1,624,375 | |
| Sinclair Broadcast Group, Inc. | | | 198,390 | |
| Sinclair Television Group, Inc. | | | 460,000 | |
| | | | 6,604,858 | |
| | | | | |
| METALS & MINING - 2.85% | | | | |
| Alliance Residential Company | | | 532,500 | |
| Anglogold Holdings PLC | | | 611,369 | |
| Big River Steel LLC. | | | 119,879 | |
| Coronado Coal LLC | | | 324,451 | |
| First Quantum Minerals Ltd. | | | 493,450 | |
| IAMGOLD Corporation | | | 509,850 | |
| Murray Energy Corporation | | | 274,495 | |
| New Gold Inc. | | | 505,000 | |
| Suncoke Energy | | | 508,750 | |
| Warrior Met Coal, Inc. | | | 215,793 | |
| | | | 4,095,537 | |
| | | | | |
| MIDSTREAM - 1.59% | | | | |
| CVR Refining LLC | | | 357,000 | |
| Ferrellgas Partners, L.P. | | | 865,450 | |
| Genesis Energy, L.P. | | | 467,500 | |
| Suburban Propane Partners, L.P. | | | 479,688 | |
| Summit Midstream Holdings, LLC | | | 124,704 | |
| | | | 2,294,342 | |
| | | | | |
| OIL FIELD SERVICES - 1.91% | | | | |
| Avantech Testing Services LLC | | | — | |
EP Energy LLC / Everest Acquisition Finance Inc. | | | 332,920 | |
| Gulf Finance, LLC | | | 217,046 | |
| Hilcorp Energy Company | | | 324,950 | |
| Petroplex Inv Holdings LLC | | | 19,216 | |
| Seadrill Partners Finco, LLC | | | 435,612 | |
| Teine Energy Ltd. | | | 505,000 | |
| Topaz Marine S.A. | | | 503,160 | |
| WPX Energy, Inc. | | | 418,094 | |
| | | | 2,755,998 | |
| | | | | |
| | | Fair Value/
Market Value | |
| | | | |
| OTHER - REITS - 0.34% | | | |
| CubeSmart, L.P. | | $ | 491,478 | |
| | | | | |
| PACKAGING - 0.78% | | | | |
| ASC Holdings, Inc. | | | 737,903 | |
| Flex Acquisition Co Inc. | | | 384,495 | |
| | | | 1,122,398 | |
| | | | | |
| PAPER - 1.52% | | | | |
| Clearwater Paper Corporation | | | 457,215 | |
| Dunn Paper | | | 1,725,000 | |
| | | | 2,182,215 | |
| | | | | |
| PHARMACEUTICALS - 1.79% | | | | |
| Clarion Brands Holding Corp. | | | 2,230,276 | |
| CVS Health Corp | | | 340,311 | |
| | | | 2,570,587 | |
| | | | | |
| PROPERTY & CASUALTY - 0.89% | | | | |
| AmWINS Group, Inc. | | | 189,805 | |
| Trinity Acquisition Plc | | | 495,097 | |
| Xlit Ltd | | | 590,330 | |
| | | | 1,275,232 | |
| | | | | |
| REFINING - 2.95% | | | | |
| CITGO Petroleum Corporation | | | 423,002 | |
| MES Partners, Inc. | | | 1,626,531 | |
| MPLX LP | | | 515,484 | |
| PBF Holding Company LLC | | | 559,780 | |
| Tristar Global Energy Solutions, Inc. | | | 1,127,832 | |
| | | | 4,252,629 | |
| | | | | |
| TECHNOLOGY - 11.92% | | | | |
| 1A Smart Start, Inc. | | | 1,695,762 | |
| Anixter, Inc. | | | 167,888 | |
| BCC Software, Inc. | | �� | 1,698,916 | |
| BMC Software Finance, Inc. | | | 496,875 | |
| Clubessential LLC | | | 1,728,752 | |
| Dell Inc. | | | 608,772 | |
| Expedia Inc. | | | 599,262 | |
| Glynlyon Holding Companies, Inc. | | | 209,414 | |
| GraphPad Software, Inc. | | | 2,411,607 | |
| Hewlett Packard Enterprise Company | | | 510,348 | |
| ION Trading Technologies Sarl | | | 274,169 | |
| Pitney Bowes Inc. | | | 470,025 | |
| PowerSchool | | | 500,000 | |
See Notes to Consolidated Financial Statements
Barings Participation Investors
CONSOLIDATED SCHEDULE OF INVESTMENTS (CONTINUED)
June 30, 2018
(Unaudited)
| Industry Classification: (Continued) | | Fair Value/
Market Value | |
| | | | | |
Software Paradigms International Group, LLC | | $ | 1,716,531 | |
| Velocity Technology Solutions, Inc | | | 2,076,442 | |
| Veritext Corporation | | | 1,993,221 | |
| | | | 17,157,984 | |
| | | | | |
| TELECOMMUNICATIONS - 0.27% | | | | |
| Altice Financing S.A. | | | 386,880 | |
| | | | | |
| TRANSPORTATION SERVICES - 4.84% | |
| Hertz Corporation | | | 480,000 | |
| MNX Holding Company | | | 1,445,999 | |
| OPE KAG Finance Sub | | | 510,000 | |
| Penske Corporation | | | 519,879 | |
| Pegasus Transtech Corporation | | | 2,284,946 | |
| Team Drive-Away Holdings LLC | | | 184,894 | |
| VP Holding Company | | | 1,542,798 | |
| | | | 6,968,516 | |
| | | | | |
| WIRELESS - 0.55% | | | | |
| Crown Castle International Corp | | | 628,703 | |
| Sprint Corporation | | | 156,486 | |
| | | | 785,189 | |
| | | | | |
Total Investments - 102.09%
(Cost - $151,530,664) | | $ | 146,962,952 | |
| | | | | |
See Notes to Consolidated Financial Statements
NOTES TO CONSOLIDATED FINANCIAL STATEMENTS
(Unaudited)
Barings Participation Investors (the "Trust") was organized as a Massachusetts business trust under the laws of the Commonwealth of Massachusetts pursuant to a Declaration of Trust dated April 7, 1988.
The Trust is a diversified closed-end management investment company. Barings LLC ("Barings"), a wholly-owned indirect subsidiary of Massachusetts Mutual Life Insurance Company ("MassMutual"), acts as its investment adviser. The Trust's investment objective is to maximize total return by providing a high level of current income, the potential for growth of income, and capital appreciation. The Trust's principal investments are privately placed, below-investment grade, long-term debt obligations purchased directly from their issuers, which tend to be smaller companies. The Trust will also invest in publicly traded debt securities (including high yield securities), and in convertible preferred stocks and, subject to certain limitations, readily marketable equity securities. Below-investment grade or high yield securities have predominantly speculative characteristics with respect to the capacity of the issuer to pay interest and repay capital. In addition, the Trust may invest in high quality, readily marketable securities.
On January 27, 1998, the Board of Trustees authorized the formation of a wholly-owned subsidiary of the Trust ("PI Subsidiary Trust") for the purpose of holding certain investments. The results of the PI Subsidiary Trust are consolidated in the accompanying financial statements. Footnote 2.D below discusses the Federal tax consequences of the PI Subsidiary Trust.
| 2. | Significant Accounting Policies |
The following is a summary of significant accounting policies followed consistently by the Trust in the preparation of its consolidated financial statements in conformity with accounting principles generally accepted in the United States of America ("U.S. GAAP").
The Trustees have determined that the Trust is an investment company in accordance with Accounting Standards Codification ("ASC") 946, Financial Services – Investment Companies, for the purpose of financial reporting.
A. Fair Value Measurements:
Under U.S. GAAP, fair value represents the price that should be received to sell an asset (exit price) in an orderly transaction between willing market participants at the measurement date.
Determination of Fair Value
The determination of the fair value of the Trust's investments is the responsibility of the Trust's Board of Trustees (the "Trustees"). The Trustees have adopted procedures for the valuation of the Trust's securities and have delegated responsibility for applying those procedures to Barings. Barings has established a Pricing Committee which is responsible for setting the guidelines used in following the
procedures adopted by the Trustees ensuring that those guidelines are being followed. Barings considers all relevant factors that are reasonably available, through either public information or information available to Barings, when determining the fair value of a security. The Trustees meet at least once each quarter to approve the value of the Trust's portfolio securities as of the close of business on the last business day of the preceding quarter. This valuation requires the approval of a majority of the Trustees of the Trust, including a majority of the Trustees who are not interested persons of the Trust or of Barings. In approving valuations, the Trustees will consider reports by Barings analyzing each portfolio security in accordance with the procedures and guidelines referred to above, which include the relevant factors referred to below. Barings has agreed to provide such reports to the Trust at least quarterly. The consolidated financial statements include private placement restricted securities valued at $105,436,956 (73.25% of net assets) as of June 30, 2018 whose values have been estimated by the Trustees based on the process described above in the absence of readily ascertainable market values. Due to the inherent uncertainty of valuation, those estimated values may differ significantly from the values that would have been used had a ready market for the securities existed, and the differences could be material.
Following is a description of valuation methodologies used for assets recorded at fair value.
Corporate Public Securities – Bank Loans, Corporate Bonds, Preferred Stocks and Common Stocks
The Trust uses external independent third-party pricing services to determine the fair values of its Corporate Public Securities. At June 30, 2018, 100% of the carrying value of these investments was from external pricing services. In the event that the primary pricing service does not provide a price, the Trust utilizes the pricing provided by a secondary pricing service.
Public debt securities generally trade in the over-the-counter market rather than on a securities exchange. The Trust's pricing services use multiple valuation techniques to determine fair value. In instances where significant market activity exists, the pricing services may utilize a market based approach through which quotes from market makers are used to determine fair value. In instances where significant market activity may not exist or is limited, the pricing services also utilize proprietary valuation models which may consider market characteristics such as benchmark yield curves, option adjusted spreads, credit spreads, estimated default rates, coupon rates, anticipated timing of principal underlying prepayments, collateral, and other unique security features in order to estimate the relevant cash flows, which are then discounted to calculate the fair value.
The Trust's investments in bank loans are normally valued at the bid quotation obtained from dealers in loans by an independent pricing service in accordance with the Trust's valuation policies and procedures approved by the Trustees.
Barings Participation Investors
NOTES TO CONSOLIDATED FINANCIAL STATEMENTS (CONTINUED)
(Unaudited)
Public equity securities listed on an exchange or on the NASDAQ National Market System are valued at the last quoted sales price of that day.
Annually, Barings conducts reviews of the primary pricing vendors to validate that the inputs used in that vendors' pricing process are deemed to be market observable as defined in the standard. While Barings is not provided access to proprietary models of the vendors, the reviews have included on-site walk-throughs of the pricing process, methodologies and control procedures for each asset class and level for which prices are provided. The review also includes an examination of the underlying inputs and assumptions for a sample of individual securities across asset classes, credit rating levels and various durations, a process Barings continues to perform annually. In addition, the pricing vendors have an established challenge process in place for all security valuations, which facilitates identification and resolution of prices that fall outside expected ranges. Barings believes that the prices received from the pricing vendors are representative of prices that would be received to sell the assets at the measurement date (exit prices) and are classified appropriately in the hierarchy.
Corporate Restricted Securities – Corporate Bonds
The fair value of certain notes is determined using an internal model that discounts the anticipated cash flows of those notes using a specific discount rate. Changes to that discount rate are driven by changes in general interest rates, probabilities of default and credit adjustments. The discount rate used within the models to discount the future anticipated cash flows is considered a significant unobservable input. Increases/(decreases) in the discount rate would result in a (decrease)/increase to the notes' fair value.
The fair value of certain distressed notes is based on an enterprise waterfall methodology which is discussed in the equity security valuation section below.
Corporate Restricted Securities – Common Stock, Preferred Stock and Partnerships & LLC's
The fair value of equity securities is determined using an enterprise waterfall methodology. Under this methodology, the enterprise value of the company is first estimated and that value is then allocated to the company's outstanding debt and equity securities based on the documented priority of each class of securities in the capital structure. Generally, the waterfall proceeds from senior debt tranches of the capital structure to senior then junior subordinated debt, followed by each class of preferred stock and finally the common stock.
To estimate a company's enterprise value, the company's trailing twelve months earnings before interest, taxes, depreciation and amortization ("EBITDA") is multiplied by a valuation multiple.
Both the company's EBITDA and valuation multiple are considered significant unobservable inputs. Increases/(decreases) to the company's EBITDA and/or valuation multiple would result in increases/(decreases) to the equity value.
Short-Term Securities
Short-term securities, of sufficient credit quality, with more than sixty days to maturity are valued at fair value, using external independent third-party services. Short-term securities having a maturity of sixty days or less are valued at amortized cost, which approximates fair value.
NOTES TO CONSOLIDATED FINANCIAL STATEMENTS (CONTINUED)
(Unaudited)
Quantitative Information about Level 3 Fair Value Measurements
The following table represents quantitative information about Level 3 fair value measurements as of June 30, 2018:
| | Fair Value | Valuation Technique | Unobservable Inputs | Range | Weighted |
| Bank Loans | $2,479,803 | Broker Quote | Single Broker | 99.0% to 100.0% | 100.0% |
| | | | | | |
| | $23,202,551 | Discounted Cash Flows | Discount Rate | 5.3% to 12.8% | 7.7% |
| | | | | | |
| Corporate Bonds | $54,751,038 | Discounted Cash Flows | Discount Rate | 9.6% to 19.4% | 12.6% |
| | | | | | |
| | $10,973,070 | Market Approach | Valuation Multiple | 3.8x to 9.4x | 6.7x |
| | | | | | |
| | | | EBITDA | $0 million to $15.9 million | $5.7 million |
| | | | | | |
| Equity Securities | $14,785,297 | Market Approach | Valuation Multiple | 3.8x to 14.1x | 8.7x |
| | | | | | |
| | | | EBITDA | $0 million to $222.3 million | $30.1 million |
Fair Value Hierarchy
The Trust categorizes its investments measured at fair value in three levels, based on the inputs and assumptions used to determine fair value. These levels are as follows:
Level 1 – quoted prices in active markets for identical securities
Level 2 – other significant observable inputs (including quoted prices for similar securities, interest rates, prepayment speeds, credit risk, etc.)
Level 3 – significant unobservable inputs (including the Trust's own assumptions in determining the fair value of investments)
Barings Participation Investors
NOTES TO CONSOLIDATED FINANCIAL STATEMENTS (CONTINUED)
(Unaudited)
The following table summarizes the levels in the fair value hierarchy into which the Trust's financial instruments are categorized as of June 30, 2018.
The fair values of the Trust's investments disaggregated into the three levels of the fair value hierarchy based upon the lowest level of significant input used in the valuation as of June 30, 2018 are as follows:
| Assets: | | Total | | | Level 1 | | | Level 2 | | | Level 3 | |
| Restricted Securities | | | | | | | | | | | | |
| Corporate Bonds | | $ | 80,814,588 | | | $ | — | | | $ | 15,090,480 | | | $ | 65,724,108 | |
| Bank Loans | | | 24,927,551 | | | | — | | | | — | | | | 24,927,551 | |
| Common Stock—U.S. | | | 5,041,786 | | | | — | | | | — | | | | 5,041,786 | |
| Preferred Stock | | | 1,545,668 | | | | — | | | | — | | | | 1,545,668 | |
| Partnerships and LLCs | | | 8,197,843 | | | | — | | | | — | | | | 8,197,843 | |
| Public Securities | | | | | | | | | | | | | | | | |
| Bank Loans | | | 4,680,754 | | | | — | | | | 3,925,951 | | | | 754,803 | |
| Corporate Bonds | | | 21,754,762 | | | | — | | | | 21,754,762 | | | | — | |
| Common Stock—U.S. | | | — | | | | — | | | | — | | | | — | |
| Preferred Stock | | | — | | | | — | | | | — | | | | — | |
| Short-term Securities | | | — | | | | — | | | | — | | | | — | |
| Total | | $ | 146,962,952 | | | $ | — | | | $ | 40,771,193 | | | $ | 106,191,759 | |
| See information disaggregated by security type and industry classification in the Consolidated Schedule of Investments. | |
Following is a reconciliation of Level 3 assets for which significant unobservable inputs were used to determine fair value:
| Assets: | | Beginning
balance at
12/31/2017 | | | Included in
earnings | | | Purchases | | | Sales | | | Prepayments | | | Transfers
into Level 3 | | | Transfers out of Level 3 | | | Ending
balance at
6/30/2018 | |
| Restricted Securities | | | | | | | | | | | | | | | | | | | | | | | | |
| Corporate Bonds | | $ | 68,182,386 | | | $ | (1,208,827 | ) | | $ | 4,560,735 | | | $ | (1,285,143 | ) | | $ | (4,525,043 | ) | | $ | — | | | $ | — | | | $ | 65,724,108 | |
| Bank Loans | | | 15,737,992 | | | | 12,242 | | | | 11,107,510 | | | | — | | | | (1,930,193 | ) | | | — | | | | — | | | | 24,927,551 | |
| Common Stock - U.S. | | | 6,911,240 | | | | 410,027 | | | | 968,769 | | | | (3,248,250 | ) | | | — | | | | — | | | | — | | | | 5,041,786 | |
| Preferred Stock | | | 2,525,813 | | | | (799,776 | ) | | | (146,594 | ) | | | (33,775 | ) | | | — | | | | — | | | | — | | | | 1,545,668 | |
| Partnerships and LLCs | | | 14,061,127 | | | | (1,435,985 | ) | | | 422,647 | | | | (4,849,946 | ) | | | — | | | | — | | | | — | | | | 8,197,843 | |
| Public Securities | | | | | | | | | | | | | | | | | | | | | | | | | | | | | | | | |
| Bank Loans | | | 523,461 | | | | 17,614 | | | | 1,564,339 | | | | (196,999 | ) | | | (14,027 | ) | | | 333,949 | | | | (1,473,534 | ) | | | 754,803 | |
| | | $ | 107,942,019 | | | $ | (3,004,705 | ) | | $ | 18,477,406 | | | $ | (9,614,113 | ) | | $ | (6,469,263 | ) | | $ | 333,949 | | | $ | (1,473,534 | ) | | $ | 106,191,759 | |
NOTES TO CONSOLIDATED FINANCIAL STATEMENTS (CONTINUED)
(Unaudited)
Income, Gains and Losses on Level 3 assets included in Net Increase in Net Assets resulting from Operations for the year are presented in the following accounts on the Statement of Operations:
| | | Net Increase in Net Assets Resulting from
Operations | | | Change in
Unrealized
Gains &
(Losses) in
Net Assets
from assets
still held | |
| Interest (Amortization) | | $ | 342,089 | | | | — | |
Net realized gain on investments before taxes | | $ | 3,969,083 | | | | — | |
Net change in unrealized appreciation of investments before taxes | | $ | (7,315,877 | ) | | | (4,366,748 | ) |
B. Accounting for Investments:
Investment transactions are accounted for on the trade date. Dividend income is recorded on the ex-dividend date. Interest income is recorded on the accrual basis, including the amortization of premiums and accretion of discounts on bonds held using the yield-to-maturity method. The Trust does not accrue income when payment is delinquent and when management believes payment is questionable.
Realized gains and losses on investment transactions and unrealized appreciation and depreciation of investments are reported for financial statement and Federal income tax purposes on the identified cost method.
C. Use of Estimates:
The preparation of financial statements in conformity with U.S. GAAP requires management to make estimates and assumptions that affect the reported amounts of assets and liabilities, disclosure of contingent assets and liabilities and the reported amounts of revenues and expenses during the reporting period. Actual results could differ from those estimates and the differences could be material.
D. Federal Income Taxes:
The Trust has elected to be taxed as a "regulated investment company" under the Internal Revenue Code, and intends to maintain this qualification and to distribute substantially all of its net taxable income to its shareholders. In any year when net long-term capital gains are realized by the Trust, management, after evaluating the prevailing economic conditions, will recommend that Trustees either designate the net realized long-term gains as undistributed and pay the federal capital gains taxes thereon, or distribute all or a portion of such net gains.
The Trust is taxed as a regulated investment company and is therefore limited as to the amount of non-qualified income that it may receive as the result of operating a trade or
business, e.g. the Trust's pro rata share of income allocable to the Trust by a partnership operating company. The Trust's violation of this limitation could result in the loss of its status as a regulated investment company, thereby subjecting all of its net income and capital gains to corporate taxes prior to distribution to its shareholders. The Trust, from time-to-time, identifies investment opportunities in the securities of entities that could cause such trade or business income to be allocable to the Trust. The PI Subsidiary Trust (described in Footnote 1, above) was formed in order to allow investment in such securities without adversely affecting the Trust's status as a regulated investment company.
The PI Subsidiary Trust is not taxed as a regulated investment company. Accordingly, prior to the Trust receiving any distributions from the PI Subsidiary Trust, all of the PI Subsidiary Trust's taxable income and realized gains, including non-qualified income and realized gains, is subject to taxation at prevailing corporate tax rates. As of June 30, 2018, the PI Subsidiary Trust has incurred income tax expense of $288,488.
Deferred tax assets and liabilities are recognized for the future tax consequences attributable to differences between the financial statement carrying amounts of the existing assets and liabilities and their respective tax basis. As of June 30, 2018, the PI Subsidiary Trust has a deferred tax liability of $448,095.
E. Distributions to Shareholders:
The Trust records distributions to shareholders from net investment income and net realized gains, if any, on the ex-dividend date. The Trust's net investment income dividend is declared four times per year, in April, July, October, and December. The Trust's net realized capital gain distribution, if any, is declared in December.
| 3. | Investment Advisory and Administrative Services Contract |
A. Services:
Under an Investment Advisory and Administrative Services Contract (the "Contract") with the Trust, Barings has agreed to use its best efforts to present to the Trust a continuing and suitable investment program consistent with the investment objectives and policies of the Trust. Barings represents the Trust in any negotiations with issuers, investment banking firms, securities brokers or dealers and other institutions or investors relating to the Trust's investments. Under the Contract, Barings also provides administration of the day-to-day operations of the Trust and provides the Trust with office space and office equipment, accounting and bookkeeping services, and necessary executive, clerical and secretarial personnel for the performance of the foregoing services.
B. Fee:
For its services under the Contract, Barings is paid a quarterly investment advisory fee equal to 0.225% of the value of the
Barings Participation Investors
NOTES TO CONSOLIDATED FINANCIAL STATEMENTS (CONTINUED)
(Unaudited)
Trust's net assets as of the last business day of each fiscal quarter, an amount approximately equivalent to 0.90% on an annual basis. A majority of the Trustees, including a majority of the Trustees who are not interested persons of the Trust or of Barings, approve the valuation of the Trust's net assets as of such day.
C. Basis for Board Renewal of Contract:
At a meeting of the Trustees held on April 25, 2018, the Trustees (including a majority of the Trustees who are not "interested persons" of the Trust or Barings) unanimously approved a one year continuance of the Contract.
Prior to the meeting, the Trustees requested and received from Ropes & Gray LLP, counsel to the Trust, a memorandum describing the Trustees' legal responsibilities in connection with their review and re-approval of the Contract. The Trustees also requested and received from Barings extensive written and oral information regarding, among other matters: the principal terms of the Contract; the reasons why Barings was proposing the continuance of the Contract; Barings and its personnel; the Trust's investment performance, including comparative performance information; the nature and quality of the services provided by Barings to the Trust; financial results and condition of Barings; the fee arrangements between Barings and the Trust; fee and expense information, including comparative fee and expense information; profitability of the advisory arrangement to Barings; and "fallout" benefits to Barings resulting from the Contract.
In connection with their deliberations regarding the continuation of the Contract, the Trustees, including the independent Trustees, considered such information and factors as they believed, in light of the legal advice furnished to them and their own business judgment, to be relevant. The Trustees' conclusion as to the continuance of the Contract was based on a comprehensive consideration of all information provided to the Trustees and not the result of any single factor. Some of the factors that figured particularly in the Trustees' deliberations are described below, although individual Trustees may have evaluated the information presented differently from one another, giving different weights to various factors. It is also important to recognize that the fee arrangements between Barings and the Trust are the result of years of review and discussion between the independent Trustees and Barings, that certain aspects of such arrangements may receive greater scrutiny in some years than in others, and that the Trustees' conclusions may be based, in part, on their consideration of these same arrangements during the course of the year and in prior years.
Nature, Extent and Quality of Services to be Provided by Barings to the Trust
In evaluating the scope and quality of the services provided by Barings to the Trust, the Trustees considered, among other factors: (i) the scope of services required to be provided by Barings under the Contract; (ii) Barings' ability to find and negotiate private placement securities having equity
features that are consistent with the stated investment objectives of the Trust; (iii) the experience and quality of Barings' staff; (iv) the strength of Barings' financial condition; (v) the nature of the private placement market compared to public markets (including the fact that finding, analyzing, negotiating and servicing private placement securities is more labor-intensive than buying and selling public securities and the administration of private placement securities is more extensive, expensive, and requires greater time and expertise than a portfolio of only public securities); (vi) the potential advantages afforded to the Trust by its ability to co-invest in negotiated private placements with MassMutual and its affiliates; and (vii) the expansion of the scope of services provided by Barings as a result of recent regulatory and legislative initiatives that have required increased legal, compliance and business attention and diligence. Based on such considerations, the Trustees concluded that, overall, they are satisfied with the nature, extent and quality of services provided by Barings, and expected to be provided in the future, under the renewed Contract.
Investment Performance
The Trustees also examined the Trust's short-term, intermediate-term, and long-term performance as compared against various benchmark indices presented at the meeting, which showed that the Trust had outperformed such indices for the 1-, 3-, 5- and 10-year periods. In addition, the Trustees considered comparisons of the Trust's performance with the performance of (i) selected closed-end investment companies and funds that may invest in private placement securities and/or bank loans; (ii) selected business development companies with comparable types of investments; and (iii) investment companies included in the Broadridge closed-end bond universe. The Trustees considered that, while such comparisons are helpful in judging performance, they are not directly comparable in terms of types of investments, and because business development companies often report returns based on market value, which is affected by factors other than the performance of the underlying portfolio investments. Based on these considerations and the detailed performance information provided to the Trustees at the regular Board meetings each quarter, the Trustees concluded that the Trust's absolute and relative performance over time have been sufficient to warrant renewal of the Contract.
Advisory Fee/Cost of Services Provided and Profitability/ Manager's "Fall-Out" Benefits
In connection with the Trustees' consideration of the advisory fee paid by the Trust to Barings under the Contract, Barings noted that it was unaware of any registered closed-end investment companies that are directly comparable to the Trust in terms of the types of investments and percentages invested in private placement securities (which require more extensive advisory and administrative services than a portfolio of publicly traded securities, as previously discussed) other than Barings Corporate Investors, which is
NOTES TO CONSOLIDATED FINANCIAL STATEMENTS (CONTINUED)
(Unaudited)
also advised by Barings. Under the terms of its Investment Services Contract, Barings Corporate Investors is charged a quarterly investment advisory fee of 0.3125% of net asset value as of the end of each quarter, which is approximately equal to 1.25% annually. In considering the fee rate provided in the Contract, the Trustees noted the advisory fee charged by Barings to Tower Square Capital Partners, L.P. and Tower Square Capital Partners II, III and IV, L.P., each a private mezzanine fund also managed by Barings, and that the fee Barings Corporate Investors charged compares favorably to the Trust's advisory fee.
At the request of the Trustees, Barings provided information concerning the profitability of Barings' advisory relationship with the Trust. The Trustees also considered the non-economic benefits Barings and its affiliates derived from its relationship with the Trust, including the reputational benefits derived from having the Trust listed on the New York Stock Exchange, and the de minimis amount of commissions resulting from the Trust's portfolio transactions used by Barings for third-party soft dollar arrangements. The Trustees recognized that Barings should be entitled to earn a reasonable level of profit for services provided to the Trust and, based on their review, concluded that they were satisfied that Barings' historical level of profitability from its relationship with the Trust was not excessive and that the advisory fee structure under the Contract is reasonable.
Economies of Scale
The Trustees considered the concept of economies of scale and possible advisory fee reductions if the Trust were to grow in assets. Given that the Trust is not continuously offering shares, such growth comes principally from retained net realized gain on investments and dividend reinvestment. The Trustees also examined the breakpoint features of selected competitive funds and noted that the minimum starting point for fee reductions in those funds was at least $200 million whereas the Trust's current net assets are near $140 million. The Trustees concluded that the absence of breakpoints in the fee schedule under the Contract was currently acceptable given the Trust's current size and closed-end fund structure.
MassMutual holds the Trust's $15,000,000 Senior Fixed Rate Convertible Note (the "Note") issued by the Trust on December 13, 2011. The Note is due December 13, 2023 and accrues interest at 4.09% per annum. MassMutual, at its option, can convert the principal amount of the Note into common shares. The dollar amount of principal would be converted into an equivalent dollar amount of common shares based upon the average price of the common shares for ten business days prior to the notice of conversion. For the six months ended June 30, 2018, the Trust incurred total interest expense on the Note of $306,750.
The Trust may redeem the Note, in whole or in part, at the principal amount proposed to be redeemed together with the accrued and unpaid interest thereon through the
redemption date plus the Make Whole Premium. The Make Whole Premium equals the excess of (i) the present value of the scheduled payments of principal and interest which the Trust would have paid but for the proposed redemption, discounted at the rate of interest of U.S. Treasury obligations whose maturity approximates that of the Note plus 0.50% over (ii) the principal of the Note proposed to be redeemed.
| 5. | Purchases and Sales of Investments |
| | | For the six
months ended
06/30/2018 | |
| | | Cost of
Investments
Acquired | | | Proceeds
from
Sales or
Maturities | |
| Corporate restricted securities | | $ | 19,128,067 | | | $ | 18,772,453 | |
| Corporate public securities | | | 4,416,673 | | | | 7,467,937 | |
The aggregate cost of investments is substantially the same for financial reporting and Federal income tax purposes as of June 30, 2018. The net unrealized depreciation of investments for financial reporting and Federal tax purposes as of June 30, 2018 is $(4,567,712) and consists of $6,701,593 appreciation and $11,269,305 depreciation.
Net unrealized depreciation of investments on the Statement of Assets and Liabilities reflects the balance net of a deferred tax liability of $448,095 on net unrealized gains on the PI Subsidiary Trust.
| 6. | Quarterly Results of Investment Operations |
| | | March 31, 2018 | |
| | | | | | | |
| | | Amount | | | Per Share | |
| Investment income | | $ | 3,392,477 | | | | |
| Net investment income | | | 2,738,514 | | | $ | 0.26 | |
Net realized and unrealized loss on investments (net of taxes) | | | (2,552,957 | ) | | | (0.24 | ) |
| | | June 30, 2018 | |
| | | | | | | |
| | | Amount | | | Per Share | |
| Investment income | | $ | 3,359,783 | | | | |
| Net investment income | | | 2,713,074 | | | $ | 0.26 | |
Net realized and unrealized loss on investments (net of taxes) | | | (2,104,355 | ) | | | (0.20 | ) |
In the normal course of its business, the Trust trades various financial instruments and enters into certain investment activities with investment risks. These risks include: (i) market risk, (ii) volatility risk and (iii) credit, counterparty and liquidity risk. It is the Trust's policy to identify, measure and monitor risk through various mechanisms including risk management strategies and credit policies. These include monitoring risk guidelines and diversifying exposures across a variety of instruments, markets and counterparties. There can be no assurance that the Trust will be able to implement its credit
Barings Participation Investors
NOTES TO CONSOLIDATED FINANCIAL STATEMENTS (CONTINUED)
(Unaudited)
guidelines or that its risk monitoring strategies will be successful.
| 8. | Commitments and Contingencies |
During the normal course of business, the Trust may enter into contracts and agreements that contain a variety of representations and warranties. The exposure, if any, to the Trust under these arrangements is unknown as this would involve future claims that may or may not be made against the Trust and which have not yet occurred. The Trust has no history of prior claims related to such contracts and agreements.
At June 30, 2018, the Trust had the following unfunded commitments:
| Investment | | Unfunded Amount | |
| VP Holding Company | | $ | 870,000 | |
| CORA Health Services, Inc. | | $ | 623,370 | |
| New Mountain Learning, LLC | | $ | 373,448 | |
| U.S. Retirement & Benefit Partners | | $ | 345,000 | |
| Pegasus Transtech Corporation | | $ | 136,944 | |
| Polytex Holdings LLC | | $ | 14,274 | |
| 9. | Results of Shareholder Meeting |
The Annual Meeting of Shareholders was held on Wednesday, April 25, 2018. The shareholders were asked to vote to re-elect as Trustees Edward P. Grace, III and Clifford M. Noreen each for a three-year term. The shareholders approved the proposal. The Trust's other Trustees, Michael H. Brown, Barbara M. Ginader, Robert E. Joyal, Susan B. Sweeney and Maleyne M. Syracuse continued to serve their respective terms following the April 25, 2018 Annual Shareholder Meeting. The results of the voting are set forth below.
| Shares for | | Withheld | | Total | | % of
Shares
Voted for |
Edward P. Grace, III 9,119,885 | | 276,598 | | 9,396,483 | | 97.057% |
| | | | | | | |
Clifford M. Noreen 9,145,669 | | 250,815 | | 9,396,483 | | 97.331% |
The Trust also held a Special Meeting of Shareholders on Wednesday, April 25, 2018. The shareholders were asked to vote to eliminate two non-fundamental investment restrictions (i) concerning the Trust's maximum level of investment in non-investment grade securities and (ii) prohibiting investment by the Trust in debt securities rated below B or determined by Barings to be of a comparable quality at the time of acquisition. Since a quorum was not present at the time of the Special Meeting, the meeting was adjourned until Tuesday, May 8, 2018 to permit the further solicitation of proxies. At the reconvened Special Meeting on May 8, 2018, the shareholders approved the proposals. The results of the voting are set forth below.
| Shares for | | Against | | Total | | % of
Shares
Voted for |
Proposal 1 - Elimination of the Trust's non-fundamental investment restriction concerning the Trust's maximum level of investment in non-investment securities |
| 3,626,436 | | 628,525 | | 5,342,267 | | 67.882% |
Proposal 2 - Elimination of the Trust's non-fundamental investment restriction prohibiting investment by the Trust in debt securities rated below B or determined by Barings to be of a comparable quality at the time of acquisition |
| 3,619,041 | | 622,056 | | 5,342,267 | | 67.744% |
THIS PRIVACY NOTICE IS BEING PROVIDED ON BEHALF OF BARINGS LLC AND ITS AFFILIATES: BARINGS SECURITIES LLC; BARINGS AUSTRALIA PTY LTD; BARINGS ADVISERS (JAPAN) KK; BARINGS INVESTMENT ADVISERS (HONG KONG) LIMITED; BARINGS FUNDS TRUST; BARINGS GLOBAL SHORT DURATION HIGH YIELD FUND; BARINGS CORPORATE INVESTORS AND BARINGS PARTICIPATION INVESTORS (TOGETHER, FOR PURPOSES OF THIS PRIVACY NOTICE, "BARINGS").
When you use Barings you entrust us not only with your hard-earned assets but also with your personal and financial data. We consider your data to be private and confidential, and protecting its confidentiality is important to us. Our policies and procedures regarding your personal information are summarized below.
We may collect non-public personal information about you from:
| • | Applications or other forms, interviews, or by other means; |
| • | Consumer or other reporting agencies, government agencies, employers or others; |
| • | Your transactions with us, our affiliates, or others; and |
We may share the financial information we collect with our financial service affiliates, such as insurance companies, investment companies and securities broker-dealers. Additionally, so that we may continue to offer you products and services that best meet your investment needs and to effect transactions that you request or authorize, we may disclose the information we collect, as described above, to companies that perform administrative or marketing services on our behalf, such as transfer agents, custodian banks, service providers or printers and mailers that assist us in the distribution of investor materials or that provide operational support to Barings. These companies are required to protect this information and will use this information only for the services for which we hire them, and are not permitted to use or share this information for any other purpose. Some of these companies may perform such services in jurisdictions other than the United States. We may share some or all of the information we collect with other financial institutions with whom we jointly market products. This may be done only if it is permitted by the state in which you live. Some disclosures may be limited to your name, contact and transaction information with us or our affiliates.
Any disclosures will be only to the extent permitted by federal and state law. Certain disclosures may require us to get an "opt-in" or "opt-out" from you. If this is required, we will do so before information is shared. Otherwise, we do not share any personal information about our customers or former customers unless authorized by the customer or as permitted by law.
We restrict access to personal information about you to those employees who need to know that information to provide products and services to you. We maintain physical, electronic and procedural safeguards that comply with legal standards to guard your personal information. As an added measure, we do not include personal or account information in non-secure e-mails that we send you via the Internet without your prior consent. We advise you not to send such information to us in non-secure e-mails.
This joint notice describes the privacy policies of Barings, the Funds and Barings Securities LLC. It applies to all Barings and the Funds accounts you presently have, or may open in the future, using your social security number or federal taxpayer identification number – whether or not you remain a shareholder of our Funds or as an advisory client of Barings. As mandated by rules issued by the Securities and Exchange Commission, we will be sending you this notice annually, as long as you own shares in the Funds or have an account with Barings.
Barings Securities LLC is a member of the Financial Industry Regulatory Authority (FINRA) and the Securities Investor Protection Corporation (SIPC). Investors may obtain information about SIPC including the SIPC brochure by contacting SIPC online at www.sipc.org or calling (202)-371-8300. Investors may obtain information about FINRA including the FINRA Investor Brochure by contacting FINRA online at www.finra.org or by calling (800) 289-9999.
January 2017
Members of the Board of Trustees Michael H. Brown* Barbara M. Ginader* Edward P. Grace III* Robert E. Joyal Clifford M. Noreen Susan B. Sweeney* Maleyne M. Syracuse* *Member of the Audit Committee Officers Clifford M. Noreen Chairman Robert M. Shettle President James M. Roy Vice President & Chief Financial
Officer Janice M. Bishop Vice President, Secretary & Chief
Legal Officer Sean Feeley Vice President Christopher D. Hanscom Treasurer Melissa M. LaGrant Chief Compliance Officer Kristin Goodchild Associate Secretary | DIVIDEND REINVESTMENT AND CASH PURCHASE PLAN Barings Participation Investors (the "Trust") offers a Dividend Reinvestment and Cash Purchase Plan (the "Plan"). The Plan provides a simple and automatic way for shareholders to add to their holdings in the Trust through the receipt of dividend shares issued by the Trust or through the reinvestment of cash dividends in Trust shares purchased in the open market. The dividends of each shareholder will be automatically reinvested in the Trust by DST Systems, Inc., the Transfer Agent, in accordance with the Plan, unless such shareholder elects not to participate by providing written notice to the Transfer Agent. A shareholder may terminate his or her participation by notifying the Transfer Agent in writing. Participating shareholders may also make additional contributions to the Plan from their own funds. Such contributions may be made by personal check or other means in an amount not less than $100 nor more than $5,000 per quarter. Cash contributions must be received by the Transfer Agent at least five days (but no more then 30 days) before the payment date of a dividend or distribution. Whenever the Trust declares a dividend payable in cash or shares, the Transfer Agent, acting on behalf of each participating shareholder, will take the dividend in shares only if the net asset value is lower than the market price plus an estimated brokerage commission as of the close of business on the valuation day. The valuation day is the last day preceding the day of dividend payment. When the dividend is to be taken in shares, the number of shares to be received is determined by dividing the cash dividend by the net asset value as of the close of business on the valuation date or, if greater than net asset value, 95% of the closing share price. If the net asset value of the shares is higher than the market value plus an estimated commission, the Transfer Agent, consistent with obtaining the best price and execution, will buy shares on the open market at current prices promptly after the dividend payment date. The reinvestment of dividends does not, in any way, relieve participating shareholders of any federal, state or local tax. For federal income tax purposes, the amount reportable in respect of a dividend received in newly-issued shares of the Trust will be the fair market value of the shares received, which will be reportable as ordinary income and/or capital gains. As compensation for its services, the Transfer Agent receives a fee of 5% of any dividend and cash contribution (in no event in excess of $2.50 per distribution per shareholder.) Any questions regarding the Plan should be addressed to DST Systems, Inc., Transfer Agent for Barings Participation Investors' Dividend Reinvestment and Cash Purchase Plan, P.O. Box 219086, Kansas City, MO 64121-9086. |
ITEM 2. CODE OF ETHICS.
Not applicable for this filing.
ITEM 3. AUDIT COMMITTEE FINANCIAL EXPERT.
Not applicable for this filing
ITEM 4. PRINCIPAL ACCOUNTANT FEES AND SERVICES.
Not applicable for this filing.
ITEM 5. AUDIT COMMITTEE OF LISTED REGISTRANTS.
Not applicable for this filing.
ITEM 6. SCHEDULE OF INVESTMENTS.
| (a) | A schedule of investments for the Registrant is included as part of this report to shareholders under Item 1 of this Form N-CSR. |
| (b) | Not applicable for this filing. |
ITEM 7. DISCLOSURE OF PROXY VOTING POLICIES AND PROCEDURES FOR CLOSED-END MANAGEMENT INVESTMENT COMPANIES.
Not applicable for this filing.
ITEM 8. PORTFOLIO MANAGERS OF CLOSED-END MANAGEMENT INVESTMENT COMPANIES.
Not applicable for this filing.
ITEM 9. PURCHASES OF EQUITY SECURITIES BY CLOSED-END MANAGEMENT INVESTMENT COMPANY AND AFFILIATED PURCHASERS.
Not applicable for this filing.
ITEM 10. SUBMISSION OF MATTERS TO A VOTE OF SECURITY HOLDERS.
Not applicable for this filing.
ITEM 11. CONTROLS AND PROCEDURES.
| (a) | The principal executive officer and principal financial officer of the Registrant evaluated the effectiveness of the Registrant's disclosure controls and procedures (as defined in Rule 30a-3(c) under the Investment Company Act of 1940 (the "Act")) as of a date within 90 days of the filing date of this report and based on that evaluation have concluded that such disclosure controls and procedures are effective to provide reasonable assurance that material information required to be disclosed by the Registrant on Form N-CSR is recorded, processed, summarized and reported within the time periods specified in the Securities and Exchange Commission's rules and forms. |
| (b) | There were no changes in the Registrant's internal control over financial reporting (as defined in Rule 30a-3(d) under the Act) during the Registrant's second fiscal half year that have materially affected, or are reasonably likely to materially affect, the Registrant's internal control over financial reporting. |
ITEM 12. SECURITIES LENDING ACTIVITIES FOR CLOSED-END MANAGEMENT INVESTMENT COMPANIES.
ITEM 13. EXHIBITS.
| (a)(1) | ANY CODE OF ETHICS, OR AMENDMENTS THERETO, THAT IS THE SUBJECT OF DISCLOSURE REQUIRED BY ITEM 2, TO THE EXTENT THAT THE REGISTRANT INTENDS TO SATISFY THE ITEM 2 REQUIREMENTS THROUGH THE FILING OF AN EXHIBIT. |
Not applicable for this filing.
| (a)(2) | A SEPARATE CERTIFICATION FOR EACH PRINCIPAL EXECUTIVE OFFICER AND PRINCIPAL FINANCIAL OFFICER OF THE REGISTRANT AS REQUIRED BY RULE 30a-2 UNDER THE ACT. |
Attached hereto as EX-99.31.1
Attached hereto as EX-99.31.2
| (a)(3) | ANY WRITTEN SOLICITATION TO PURCHASE SECURITIES UNDER RULE 23c-1 UNDER THE ACT (17 CFR 270.23c-1) SENT OR GIVEN DURING THE PERIOD COVERED BY THE REPORT BY OR ON BEHALF OF THE REGISTRANT TO 10 OR MORE PERSONS. |
Not applicable for this filing.
(b) CERTIFICATIONS PURSUANT TO RULE 302-2(b) UNDER THE ACT.
Attached hereto as EX-99.32
SIGNATURES
Pursuant to the requirements of the Securities Exchange Act of 1934 and the Investment Company Act of 1940, the Registrant has duly caused this report to be signed on its behalf by the undersigned, thereunto duly authorized.
(Registrant): | Barings Participation Investors | |
| | |
| | |
By: | /s/ Robert M. Shettle | |
| Robert M. Shettle, President | |
| | |
Date: | September 7, 2018 | |
| | |
Pursuant to the requirements of the Securities Exchange Act of 1934 and the Investment Company Act of 1940, this report has been signed below by the following persons on behalf of the Registrant and in the capacities and on the dates indicated.
By: | /s/ Robert M. Shettle | |
| Robert M. Shettle, President | |
| | |
Date: | September 7, 2018 | |
| | |
| | |
By: | /s/ James M. Roy | |
| James M. Roy, Vice President and Chief Financial Officer | |
| | |
Date: | September 7, 2018 | |