UNITED STATES
SECURITIES AND EXCHANGE COMMISSION
Washington, D.C. 20549
FORM N-CSR
CERTIFIED SHAREHOLDER REPORT OF REGISTERED
MANAGEMENT INVESTMENT COMPANIES
Investment Company Act file number: 811-05547
Laudus Trust
(Exact name of registrant as specified in charter)
211 Main Street, San Francisco, California 94105
(Address of principal executive offices) (Zip code)
Marie Chandoha
Laudus Trust
211 Main Street, San Francisco, California 94105
(Name and address of agent for service)
Registrant’s telephone number, including area code: (415) 636-7000
Date of fiscal year end: March 31
Date of reporting period: March 31, 2017
| Item 1: | Report(s) to Shareholders. |
Annual Report | March 31, 2017
Laudus Mondrian Funds™
Laudus Mondrian International Equity Fund
Laudus Mondrian Emerging Markets Fund
Laudus Mondrian International Government Fixed Income Fund
Laudus Mondrian Global Government Fixed Income Fund
Adviser
Charles Schwab Investment Management, Inc.
Subadviser
Mondrian Investment Partners Limited
This page is intentionally left blank.
Fund investment adviser: Charles Schwab Investment Management, Inc. (CSIM).
Distributor: ALPS Distributors, Inc.
The industry/sector classification of certain funds’ portfolio holdings uses the Global Industry Classification Standard (GICS) which was developed by and is the exclusive property of MSCI and Standard & Poor’s. GICS is a service mark of MSCI and S&P and has been licensed for use by CSIM and certain affiliates. Charles Schwab & Co, Inc. and ALPS Distributors, Inc. are unaffiliated entities.
Laudus Mondrian Funds | Annual Report
The performance data quoted represents past performance. Past performance does not guarantee future results. Investment returns and principal value of an investment will fluctuate so that an investor’s shares may be worth more or less than their original cost. Current performance may be lower or higher than performance data quoted. To obtain performance information current to the most recent month end, please visit www.csimfunds.com.
| Total Return for the 12 Months Ended March 31, 2017 |
| Laudus Mondrian International Equity Fund1 | |
| Investor Shares (Ticker Symbol: LIEQX) | 10.37% |
| Select Shares (Ticker Symbol: LIEFX) | 10.51% |
| Institutional Shares (Ticker Symbol: LIEIX) | 10.78% |
| MSCI EAFE Index® (Net) | 11.67% |
| MSCI EAFE® Value Index (Net) | 15.98% |
| Performance Details | pages 7-10 |
| |
| Laudus Mondrian Emerging Markets Fund1 | |
| Investor Shares (Ticker Symbol: LEMIX) | 12.11% |
| Select Shares (Ticker Symbol: LEMSX) | 12.46% |
| Institutional Shares (Ticker Symbol: LEMNX) | 12.57% |
| MSCI Emerging Markets Index (Net) | 17.22% |
| Performance Details | pages 11-14 |
| |
| Laudus Mondrian International Government Fixed Income Fund (Ticker Symbol: LIFNX) | -5.48% |
| Citigroup non-US Dollar World Government Bond Index | -4.79% |
| Performance Details | pages 15-17 |
| |
| Laudus Mondrian Global Government Fixed Income Fund (Ticker Symbol: LMGDX) | -1.64% |
| Custom Composite Index2 | -1.91% |
| Citigroup World Government Bond Index | -3.65% |
| Performance Details | pages 18-20 |
All fund and index figures on this page assume dividends and distributions were reinvested. Index figures do not include trading and management costs, which would lower performance. Indices are unmanaged and cannot be invested in directly. Performance results less than one year are not annualized.
For index definitions, please see the Glossary.
Fund expenses may have been partially absorbed by CSIM. Without these reductions, the funds’ returns would have been lower. These returns do not reflect the deduction of taxes that a shareholder would pay on fund distributions or the redemption of fund shares.
There are risks associated with investing in securities of foreign issuers, such as erratic market conditions, economic and political instability, fluctuations in currency and exchange rates, and an increased risk of price volatility associated with less uniformity in accounting and reporting requirements. Investing in emerging markets accentuates these risks. Investments in emerging markets may be more likely to experience political turmoil or rapid changes in market or economic conditions than more developed countries.
Bond funds are subject to increased risk of loss of principal during periods of volatile interest rates. When interest rates rise, bond prices fall which may impact the value of a bond fund's shares.
Please see prospectus for further detail and investor eligibility requirements.
| 1 | The fund's performance relative to the indices may be affected by fair-value pricing, see financial note 2 for more information. |
| 2 | The Custom Composite Index is composed of the Citigroup World Government Bond Index from the Fund’s inception until the close of business on 3/31/13, and a blend of 80% Citigroup World Government Bond Index/20% Citigroup Custom Emerging Markets Government Bond Index from 4/1/2013 forward. |
Laudus Mondrian Funds | Annual Report
Marie Chandoha
President and CEO of
Charles Schwab Investment
Management, Inc. and the
funds covered in this report.
Dear Shareholder,
As tax season wraps up, I’ve been reflecting on the importance of process in our financial lives. Filing taxes can be challenging for those who don’t have a sound approach for handling their returns, and investing is the same way: your goals can be easier to attain when you have a disciplined and deliberate plan that you follow. At Charles Schwab Investment Management, we believe the Laudus Mondrian Funds (the funds) can help with that process and can complement index funds in a diversified portfolio–and here’s why.
With no shortage of opinion in the current climate about the future direction of markets across the globe, we believe that an allocation to active managers within a diversified portfolio can help investors to stay on track. Actively managed strategies can help investors take advantage of the skills of market professionals as these managers sift through the constant stream of information and news developments that have the potential to push some investors off course. We believe a good active manager should be able to process all these details, and filter out the noise. With this in mind, we believe that active managers can be a valuable part of an investor’s financial strategy, and we’re pleased that you have chosen the funds in pursuit of your own financial goals.
At Charles Schwab Investment Management, we believe that certain active managers are especially able to add value by identifying investment opportunities through extensive research and regional specialization. Mondrian Investment Partners Limited, the funds’ subadviser, analyzes factors such as interest rate trends, money supply, and demographic developments when selecting securities, and regularly evaluates how changes in these factors could impact the portfolio. We believe that this degree of flexibility could prove beneficial in the months ahead and may potentially help investors stick to their own investment plans and processes.
In other news, I’m excited to report that the Laudus Mondrian International Equity Fund (Institutional Shares) recently received two Best-In-Class Lipper awards for their consistently strong, risk-adjusted performance relative to their peers.1 The Laudus Mondrian International Equity Fund (Institutional Shares) was named best-in-class over three years among 33 International Large-Cap Value Funds and best-in-class over five years among 32 International Large-Cap Value Funds for the periods ending November 30,
| 1 | The Thomson Reuters Lipper Fund Awards, granted annually, highlight funds and fund companies that have excelled in delivering consistently strong risk-adjusted performance relative to their peers. The Lipper Fund Awards are based on the Lipper Leader for Consistent Return rating, which is a risk-adjusted performance measure calculated over 36, 60 and 120 months. The fund with the highest Lipper Leader for Consistent Return (Effective Return) value in each eligible classification wins the Lipper Fund Award. For more information, see www.lipperfundawards.com. Although Lipper makes reasonable efforts to ensure the accuracy and reliability of the data contained herein, the accuracy is not guaranteed by Lipper. |
Laudus Mondrian Funds | Annual Report
From the President (continued)
“ In other news, I’m excited to report that the Laudus Mondrian International Equity Fund (Institutional Shares) recently received two Best-In-Class Lipper awards for their consistently strong, risk-adjusted performance relative to their peers.”
2016. These awards are a reflection of our commitment to delivering strong investment results over the long-term, as well as our continued dedication to putting you, our investors, first.
Thank you for investing with Charles Schwab Investment Management, and for trusting us to help you achieve your financial goals. For more information about the funds, please continue reading this report. In addition, you can find further details about the funds by visiting our website at www.csimfunds.com. We are also happy to hear from you at 1-877-824-5615.
Sincerely,
Past performance cannot guarantee future results.
Laudus Mondrian Funds | Annual Report
The Investment Environment
Over the 12-month reporting period ended March 31, 2017, most global equity markets generated positive returns, while bond yields rose and many returns fell into negative territory (bond yields and bond prices move in opposite directions). The United Kingdom (U.K.) voted in June to leave the European Union (Brexit) and the U.S. elected a new president in November, both contributing to periods of heightened volatility. Central bank policies remained largely accommodative, despite two short-term interest rate hikes in the U.S., and the global economic outlook generally improved. Rising oil and commodity prices supported many emerging markets, which performed well over the 12 months even with a strengthening U.S. dollar. Throughout the reporting period, negative interest rates in Japan and the eurozone continued to contribute to historically low yields on many international government-backed securities. In this environment, the MSCI EAFE Index (Net), a broad measure of developed international equity performance, returned 11.67% for the 12-month reporting period, while the MSCI Emerging Markets Index (Net) returned 17.22%. In global fixed-income securities, the Citigroup non-US Dollar World Government Bond Index returned -4.79% over the same period.
U.S. short-term interest rates remained low over the reporting period, although the Federal Reserve (Fed) took steps toward a more normalized interest rate environment. With unsteady global economic growth, low inflation, and room for improvement in the labor market, the Fed left the federal funds rate unchanged at each of its meetings through November. Then in December, with progress in several key economic measurements, the Fed raised short-term interest rates for only the second time in 10 years. As global growth continued to show signs of stability and labor market conditions strengthened, combined with an uptick in inflation, the Fed raised short-term interest rates again in March. As both of these rate hikes were already priced into global equity markets, the response to these changes was muted. However, the Fed’s moves confirmed its confidence in the health and direction of the U.S. economy.
Outside the U.S., many central banks maintained or stepped up accommodative policy measures to spur economic growth and inflation. The European Central Bank (ECB) left its main interest rate at 0.00% and its deposit rate in negative territory. The ECB also extended its bond purchase program until at least December 2017 and announced it would loosen the restrictions on the types of bonds it can purchase. Meanwhile, facing a weakening growth outlook after Brexit, the Bank of England revived its government bond buying program and cut its main interest rate to an all-time low in August. In Asia, the Bank of Japan (BOJ) maintained its negative interest rate policy and expanded its asset-buying program. With these tools potentially reaching the limits of their effectiveness, the BOJ shifted focus in September and introduced yield curve management as a policy tool, targeting interest rates on government bonds to achieve its inflation goal. Stock markets in Europe and Japan rallied toward the end of the reporting period, suggesting that these monetary policies were possibly beginning to achieve their intended results.
Most markets steadied over the reporting period, despite brief periods of volatility tied in part to political developments around the globe. The results of the Brexit referendum triggered a global stock selloff and sent the price of oil sharply downward, while the British pound depreciated significantly versus the U.S. dollar. Most markets stabilized in the days and weeks that followed, and concerns surrounding the future of the U.K. lessened in early 2017 as a feasible exit plan began to take shape. Meanwhile, U.S. election-related volatility picked up in the middle of the reporting period and through Election Day in early November, when U.S. equity futures dropped sharply soon after the election results were announced. Stock markets rebounded almost immediately the following day, however, and generally maintained an upward trajectory throughout the remainder of the reporting period. Expectations for new policies from the Trump administration supported a positive growth outlook, and contributed to the solid performance of both U.S. and international stock markets over the reporting period.
Laudus Mondrian Funds | Annual Report
The Investment Environment (continued)
Global economic growth generally improved over the 12-month reporting period, due in part to accommodative central bank policies and rising oil and commodity prices. Economic activity in the eurozone slowed in the second quarter of 2016 and was flat in the third quarter, but surprisingly robust fourth quarter estimates indicated a turnaround for that region, driven by strong numbers from Germany, Spain, and France. At the same time, the U.K. economy performed better than expected in the months following the Brexit vote with progress toward an exit plan, while the entire eurozone bloc had exited deflation by the end of January 2017. In Japan, economic growth accelerated and consumer prices fell at a slower pace, with inflation on track to hit the target of 2% in the next two years. Generally increasing oil and commodity prices supported a rebound in many oil-exporting emerging markets, including Russia and Brazil. The price of Brent crude oil (a global crude oil benchmark) rose from less than $40 per barrel in April 2016 to over $50 per barrel at the end of March 2017, providing a substantial tailwind for the performance of many companies in these countries. In China, despite slower economic growth in 2016 than in prior years, concerns lessened around this subdued pace as many economic indicators showed signs of strength toward the end of the reporting period.
Over the 12-month reporting period, U.S. bond yields generally rose but remained relatively low compared to long-term averages. Short-term yields climbed in response to both Fed interest rate increases in December and March. Meanwhile longer-term yields, which are generally influenced by economic growth and inflation expectations, rose after the U.S. presidential election in anticipation of changes in key economic policies. In this environment, the yield on the benchmark 10-year Treasury note began the reporting period at 1.79% and finished at 2.40%. Despite low bond yields in the U.S., negative interest rates and other central bank monetary policies resulted in even lower yields on many international government-backed securities, with some yielding below 0.00%.
Index figures assume dividends and distributions were reinvested. Index figures do not include trading and management costs, which would lower performance. Indices are unmanaged and cannot be invested in directly. Performance results less than one year are not annualized. Past performance is not an indication of future results.
For index definitions, please see the Glossary.
Nothing in this report represents a recommendation of a security by the investment adviser.
Management views may have changed since the report date.
Laudus Mondrian Funds | Annual Report
Laudus Mondrian International Equity Fund
The Laudus Mondrian International Equity Fund (the fund) seeks long-term capital appreciation. The fund pursues its investment objective by investing primarily in equity securities of non-U.S. large-capitalization issuers, including the securities of emerging market companies, that, in the subadviser’s opinion, are undervalued at the time of purchase based on fundamental value analysis employed by the subadviser. For more information concerning the fund’s investment objective, strategies, and risks, please see the prospectus.
Market Highlights. International stocks from developed markets generated positive returns over the 12-month reporting period ended March 31, 2017. Concerns around the potential economic and political repercussions after the United Kingdom’s vote to leave the European Union (Brexit) weighed on markets in mid-2016, sending global stocks and the British pound downward, though many stocks rebounded in the weeks and months that followed. Donald Trump was elected to the U.S. presidency in November, while the Federal Reserve raised short-term interest rates in both December 2016 and March 2017 amid generally strong economic measurements in the U.S and an uptick in inflation. Meanwhile, the eurozone economy showed signs of improvement, notably in Spain and in Germany. Undercapitalized banks and non-performing loans continued to plague Italy over the reporting period, though an approved bailout package from the Italian government provided some support. Positive changes in several key economic indicators lessened concerns around the slower pace of growth in China, while expanded stimulative monetary policy measures in Japan finally appeared to be working as intended. The U.S. dollar generally strengthened over the 12 months, most notably against the British pound and Swedish krona. However, the Japanese yen appreciated against the U.S. dollar over the reporting period, generally enhancing returns on Japanese investments in U.S. dollar terms.
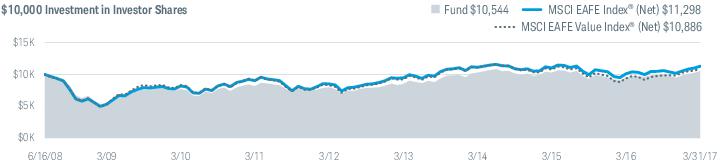
Performance. The fund’s Investor Shares returned 10.37% for the 12-month reporting period ended March 31, 2017. For performance comparisons, the fund uses the MSCI EAFE Index (Net) (the index), which returned 11.67% over the same period.
Positioning and Strategies. Over the 12-month reporting period, stock selection within countries and the fund’s sector allocations detracted from the fund’s overall performance. However, stock selection within sectors and country allocation decisions added to the relative investment returns of the fund.
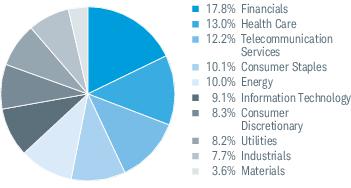
Stock selection within countries held back the fund’s relative returns over the reporting period. Although the fund benefited from strong stock selection in Japan, Italy, France, and Germany, this was more than offset by the impact of the fund’s holdings in the U.K. and in Sweden. At the sector level, allocation between sectors also held back relative returns. The positive impact of the overweight position in the strong Energy sector was more than offset by the impact of the overweight position in the weak Telecommunication Services sector and the underweight position in the strong Materials sector. Strong stock selection within sectors, however, added to the fund’s relative return, led by the returns of stocks in the Health Care, Industrials, and Utilities sectors.
The fund’s position in Tesco plc, the U.K. food retailer, detracted from relative performance, returning approximately -16% over the reporting period. Brexit-related inflationary pressures weighed on the U.K. food retail sector, as did an uncertain U.K. consumer outlook. The fund’s holdings of Telia Company AB, the Swedish telecommunication services provider, also detracted from relative performance with returns of approximately -13%. Telia Company AB was hurt by the weak Swedish krona and lingering concerns over the sale of its Eurasian assets, as well as by a fine leveraged by the U.S. Department of Justice.
By comparison, the fund benefitted from its investment in Zurich Insurance Group AG, the Swiss insurance company, which gained approximately 32%. Zurich recovered from a period of unexpectedly high insurance claims and a failed acquisition bid, among other things, to regain market confidence over the 12-month reporting period. Rising interest rates supported this recovery, as did the announcement of a sound business plan that included a commitment to maintaining the company’s dividend payout ratio. In addition, the fund’s investment in Tokio Marine Holdings, Inc. rose approximately 29%, as this company benefitted from a relatively low level of natural disasters, ongoing growth in net premiums, and continued strength in its international business.
The fund’s stock selection within sectors also contributed to the fund’s relative return. The fund’s holdings in the Energy sector rose approximately 19%, boosted by a recovery in oil prices over the reporting period, and none of the fund’s holdings in this sector detracted from the fund’s performance. The fund’s investment in U.K. energy company BP plc especially benefitted from the rebound in oil prices, returning approximately 22%. In contrast, the fund’s stock selection in the Materials sector detracted from relative performance. Though the fund’s only holding in this sector, Syngenta AG, returned approximately 10%, the strong performance of the Materials sector overall in the index weighed on the fund’s relative performance.
Country allocation decisions also added to the fund’s relative returns. The fund’s overweights to Spain and Italy contributed, and helped to offset the impact of the fund’s underweight to the strong Australian market. In contrast, currency allocation held back relative investment returns for the fund, driven by an underweight position in the strong Japanese yen and an overweight position in the weak British pound.
| Fund Characteristics | |
| Number of Companies1 | 37 |
| Weighted Average Market Cap (millions) | $75,853 |
| Price/Earnings Ratio (P/E) | 20.53 |
| Price/Book Ratio (P/B) | 1.65 |
Portfolio Turnover
(One year trailing) | 34% |
| Fund Overview | | | |
| | Investor Shares | Select Shares | Institutional Shares |
| Minimum Initial Investment | $100 | $50,000 | $500,000 |
| Inception Date | 6/16/2008 | 6/16/2008 | 6/16/2008 |
| Ticker Symbol | LIEQX | LIEFX | LIEIX |
| Cusip | 51855Q614 | 51855Q564 | 51855Q580 |
| NAV | $6.06 | $6.10 | $6.12 |
Management views and portfolio holdings may have changed since the report date.
| 1 | Short-term investments are not included. |
Laudus Mondrian Funds | Annual Report
Laudus Mondrian International Equity Fund
Performance and Fund Facts as of 3/31/17
Past performance does not guarantee future results. The performance data quoted represents past performance, and current returns may be lower or higher. The performance information does not reflect the deduction of taxes that a shareholder would pay on fund distributions or the redemption of fund shares. The investment return and principal value of an investment will fluctuate so that an investor’s shares, when redeemed, may be worth more or less than the original cost. To obtain performance information current to the most recent month end, visit www.csimfunds.com.
Performance of Hypothetical Investment (June 16, 2008 – March 31, 2017)1
| 1 | Fund expenses may have been partially absorbed by CSIM. Without these reductions, the fund’s returns would have been lower. These returns do not reflect the deduction of taxes that a shareholder would pay on fund distributions or the redemption of fund shares. |
Laudus Mondrian Funds | Annual Report
Laudus Mondrian International Equity Fund
Performance and Fund Facts as of 3/31/17 (continued)
Average Annual Total Returns1
| Class and Inception Date | 1 Year | 5 Years | Since Inception |
| Investor Shares (6/16/08) | 10.37% | 5.74% | 0.60% |
| Select Shares (6/16/08) | 10.51% | 5.99% | 0.84% |
| Institutional Shares (6/16/08) | 10.78% | 6.06% | 0.92% |
| MSCI EAFE Index® (Net) | 11.67% | 5.83% | 1.40% |
| MSCI EAFE® Value Index (Net) | 15.98% | 5.56% | 0.97% |
| Fund Expense Ratios2: Investor Shares: Net 1.26%; Gross 1.41% / Select Shares: Net 1.03%; Gross 1.18% / Institutional Shares: Net 0.90%; Gross 1.05% |
All total returns on this page assume dividends and distributions were reinvested. Index figures do not include trading and management costs, which would lower performance. Indices are unmanaged and cannot be invested in directly. Performance results less than one year are not annualized.
For index definitions, please see the Glossary.
| 1 | Fund expenses may have been partially absorbed by CSIM. Without these reductions, the fund’s returns would have been lower. These returns do not reflect the deduction of taxes that a shareholder would pay on fund distributions or the redemption of fund shares. |
| 2 | As stated in the prospectus. Net Expenses: The adviser has agreed to limit the total annual fund operating expenses (excluding interest, taxes and certain non-routine expenses) of the fund to 0.90%, 1.05%, and 1.30% for the Institutional, Select, and Investor classes, respectively, until at least 7/30/2018. Gross Expenses: Reflects the total annual fund operating expenses without the effect of contractual fee waivers. For actual rates during the period, refer to the Financial Highlights section of the Financial Statements. |
Laudus Mondrian Funds | Annual Report
Laudus Mondrian International Equity Fund
Performance and Fund Facts as of 3/31/17 (continued)
Country Weightings % of Investments
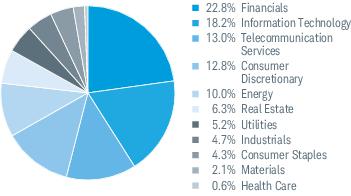
Sector Weightings % of Equities
Top Equity Holdings % of Net Assets1
There are risks associated with investing in foreign companies, such as erratic market conditions, economic and political instability, fluctuations in currency and exchange rates, and an increased risk of price volatility associated with less uniformity in accounting and reporting requirements.
Portfolio holdings may have changed since the report date.
| 1 | This list is not a recommendation of any security by the investment adviser or subadviser. |
Laudus Mondrian Funds | Annual Report
Laudus Mondrian Emerging Markets Fund
The Laudus Mondrian Emerging Markets Fund (the fund) seeks long-term capital appreciation. The fund is an international fund and generally invests in large-capitalization equity securities of emerging market companies that, in the subadviser’s opinion, are undervalued at the time of purchase based on fundamental value analysis employed by the subadviser. For more information concerning the fund’s investment objective, strategies, and risks, please see the prospectus.
Market Highlights. Emerging market stocks generated positive returns over the 12-month reporting period ended March 31, 2017 amid a rebound in oil and commodity prices and an overall improving global outlook. Concerns around the potential economic and political repercussions after the United Kingdom’s vote to leave the European Union (Brexit) weighed on markets in mid-2016, sending global stocks and the British pound downward, though many stocks rebounded in the weeks and months that followed. Donald Trump was elected to the U.S. presidency in November, and the Federal Reserve raised short-term interest rates in both December 2016 and March 2017. Positive changes in several key economic indicators lessened concerns around the slower pace of growth in China, resulting in the People’s Bank of China scaling back some accommodative monetary policy measures in the second half of the reporting period. Meanwhile, the Indian economy showed unexpected resilience in light of Prime Minister Modi’s announcement in November to demonetize the country’s highest denominated currency notes, and political developments and generally rising oil prices helped to lift investor sentiment in the commodity-linked countries of Brazil and Peru. The U.S. dollar generally strengthened over the 12 months, most notably against the British pound and the Mexican peso. However several currencies, including the Brazilian real and the South African Rand, appreciated against the U.S. dollar over the reporting period.
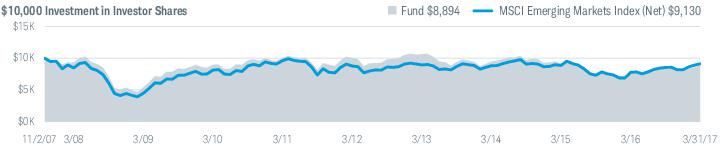
Performance. The fund’s Investor Shares returned 12.11% for the 12-month reporting period ended March 31, 2017. For performance comparisons, the fund uses the MSCI Emerging Markets Index (Net) (the index), which returned 17.22% over the same period.
Positioning and Strategies. During the 12-month reporting period, negative sector allocation and stock selection across a number of markets were the primary drivers of the fund’s relative underperformance. A recovery in commodity prices led to the Energy and Materials sectors being among the better performing sectors in the index, and the fund’s underweight allocation to both of these sectors detracted from relative returns. The Information Technology sector benefitted from cyclical and secular growth drivers, with negative stock selection in this sector driven both by the outperformance of growth-orientated stocks not held by the fund, and by the underperformance of some of the fund’s holdings. For example, the fund had no position in Chinese companies Tencent Holdings Ltd. or Alibaba Group Holding Ltd., which both returned over 35% during the reporting period.
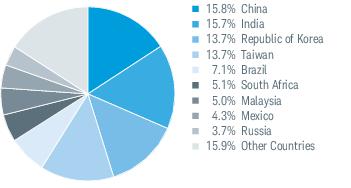
Stock selection in both China and Latin America detracted from relative returns. In China, in addition to zero exposure to Tencent Holdings Ltd. and Alibaba Group Holding Ltd., the underperformance of snack food producer Want Want China Holdings Limited and telecom China Mobile Ltd. detracted from the fund’s relative return. Latin America was one of the top performing regions within the index, driven by the positive performance of Brazil. Political developments and the commodity price rally improved investor sentiment in Brazil, and the fund’s limited exposure to this stronger-performing country weighed on relative returns. Stock selection in Mexico, Taiwan, and the Philippines also detracted.
By comparison, strong stock selection in India helped to partially offset the negative impacts of the fund’s holdings in Latin America and China. Oil and gas exploration company Cairn India Ltd. was a notable outperformer, in part due to anticipation of its merger with natural resources company Vedanta Ltd. The fund’s holdings of Indian bank Housing Development Finance Corporation Limited also contributed to relative return.
Top-down allocation was negative overall, with both country allocation and currency effects negatively impacting the fund’s relative return. In Asia, the fund’s relative performance was hindered by an overweight to Malaysia through both the underperformance of the local market and the depreciation of the Malaysian ringgit. The fund’s underweight to the outperforming Chinese market also detracted, though this was largely offset by a positive currency effect. In Latin America, top-down allocation was a slight detractor, with the underweight to Brazil partially offset by the overweight allocation to Peru. Meanwhile, the Brazilian real benefitted from a strong link to rising commodity prices, appreciating against the U.S. dollar over the reporting period. With this appreciation, the fund’s underweight allocation to the Brazilian real detracted from the fund’s total return.
| Fund Characteristics | |
| Number of Companies1 | 50 |
| Weighted Average Market Cap (millions) | $45,540 |
| Price/Earnings Ratio (P/E) | 11.26 |
| Price/Book Ratio (P/B) | 1.37 |
Portfolio Turnover
(One year trailing) | 32% |
| Fund Overview | | | |
| | Investor Shares | Select Shares | Institutional Shares |
| Minimum Initial Investment | $100 | $50,000 | $500,000 |
| Inception Date | 11/2/2007 | 11/2/2007 | 11/2/2007 |
| Ticker Symbol | LEMIX | LEMSX | LEMNX |
| Cusip | 51855Q648 | 51855Q630 | 51855Q622 |
| NAV | $7.72 | $7.72 | $7.71 |
Management views and portfolio holdings may have changed since the report date.
| 1 | Short-term investments are not included. |
Laudus Mondrian Funds | Annual Report
Laudus Mondrian Emerging Markets Fund
Performance and Fund Facts as of 3/31/17
Past performance does not guarantee future results. The performance data quoted represents past performance, and current returns may be lower or higher. The performance information does not reflect the deduction of taxes that a shareholder would pay on fund distributions or the redemption of fund shares. The investment return and principal value of an investment will fluctuate so that an investor’s shares, when redeemed, may be worth more or less than the original cost. To obtain performance information current to the most recent month end, visit www.csimfunds.com.
Performance of Hypothetical Investment (November 2, 2007 – March 31, 2017)1
| 1 | Fund expenses may have been partially absorbed by CSIM. Without these reductions, the fund’s returns would have been lower. These returns do not reflect the deduction of taxes that a shareholder would pay on fund distributions or the redemption of fund shares. |
Laudus Mondrian Funds | Annual Report
Laudus Mondrian Emerging Markets Fund
Performance and Fund Facts as of 3/31/17 (continued)
Average Annual Total Returns1
| Class and Inception Date | 1 Year | 5 Years | Since Inception |
| Investor Shares (11/2/07) | 12.11% | -2.40% | -1.24% |
| Select Shares (11/2/07) | 12.46% | -2.11% | -0.94% |
| Institutional Shares (11/2/07) | 12.57% | -2.02% | -0.87% |
| MSCI Emerging Markets Index (Net) | 17.22% | 0.81% | -0.96% |
| Fund Expense Ratios2: Investor Shares: Net 1.60%; Gross 1.61% / Select Shares: Net 1.29%; Gross 1.30% / Institutional Shares: Net 1.20%; Gross 1.21% |
All total returns on this page assume dividends and distributions were reinvested. Index figures do not include trading and management costs, which would lower performance. Indices are unmanaged and cannot be invested in directly. Performance results less than one year are not annualized.
For index definitions, please see the Glossary.
| 1 | Fund expenses may have been partially absorbed by CSIM. Without these reductions, the fund’s returns would have been lower. These returns do not reflect the deduction of taxes that a shareholder would pay on fund distributions or the redemption of fund shares. |
| 2 | As stated in the prospectus. Net Expenses: The adviser has agreed to limit the total annual fund operating expenses (excluding interest, taxes and certain non-routine expenses) of the fund to 1.20%, 1.35%, and 1.60% for the Institutional, Select, and Investor classes, respectively, until at least 7/30/2018. Gross Expenses: Reflects the total annual fund operating expenses without the effect of contractual fee waivers. For actual rates during the period, refer to the Financial Highlights section of the Financial Statements. |
Laudus Mondrian Funds | Annual Report
Laudus Mondrian Emerging Markets Fund
Performance and Fund Facts as of 3/31/17 (continued)
Country Weightings % of Investments
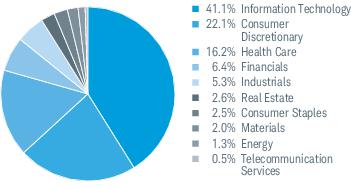
Sector Weightings % of Equities
Top Equity Holdings % of Net Assets1
There are risks associated with investing in foreign companies, such as erratic market conditions, economic and political instability, fluctuations in currency and exchange rates, and an increased risk of price volatility associated with less uniformity in accounting and reporting requirements. Investing in emerging markets accentuates these risks. Investments in emerging markets may be more likely to experience political turmoil or rapid changes in market or economic conditions than more developed countries.
Portfolio holdings may have changed since the report date.
| 1 | This list is not a recommendation of any security by the investment adviser or subadviser. |
Laudus Mondrian Funds | Annual Report
Laudus Mondrian International Government Fixed Income Fund
The Laudus Mondrian International Government Fixed Income Fund (the fund) seeks long-term total return consistent with its value-oriented investment approach. The fund invests primarily in fixed income securities that may also provide the potential for capital appreciation. The fund is an international fund that invests primarily in issuers that are organized, have a majority of their assets, or derive most of their operating income outside of the U.S. As such, the fund may invest primarily in securities issued in any currency and may hold foreign currency. For more information concerning the fund’s investment objective, strategies, and risks, please see the prospectus.
Market Highlights. International bond indexes generated negative overall returns for the 12-month reporting period. The Federal Reserve raised short-term interest rates twice over the reporting period, while many other central banks maintained or increased accommodative policy measures. South Africa avoided a ratings agency downgrade that looked probable in early 2016, and the election of Donald Trump to the U.S. presidency increased concerns surrounding the potential renegotiation of the North American Free Trade Agreement (NAFTA) and the possible effects on member countries. Though the U.S. dollar generally strengthened over the reporting period, most notably against the British pound and the Mexican peso, several currencies, including the South African rand, Brazilian real, and Japanese yen, appreciated against the U.S. dollar and returns from these countries were generally enhanced in U.S. dollar terms.
Performance. The fund returned -5.48% for the 12-month reporting period ended March 31, 2017. For performance comparisons, the fund uses the Citigroup non-US Dollar World Government Bond Index (the index), which returned -4.79% over the same period.
Positioning and Strategies. The fund’s overweight to Mexico detracted from the fund’s performance relative to the index. Fixed-income securities from Mexico produced positive returns in local-currency terms, but the depreciation of the Mexican peso versus the U.S. dollar resulted in negative returns in U.S. dollar terms. The fund’s overweight to Sweden and a modest overweight to Malaysia also detracted. These negative positions, however, were offset by the slight overweight to Japan early in the reporting period, as well as by the underweight to the eurozone, which both contributed to relative performance. Positioning within the eurozone also added to the fund’s performance relative to the index, with the underweight to Italy in particular contributing notably.
Due to changes in Mondrian’s proprietary valuation models over the 12-month reporting period, the fund’s subadviser increased exposure to the eurozone, Japan, the British pound, and Australia (fully hedged in to U.S. dollars). These positions were offset by reductions in exposure to Malaysia, the United Kingdom, and Canada.
Other strategies used by the subadviser included buying fully covered, defensive forward currency contracts. Such contracts are used to hedge what the subadviser believes to be overvalued currencies, based on proprietary currency models. The notional value of these currency contracts ranged from approximately 8% to 11% of the fund’s net assets, and had a mixed effect on performance.
| Fund Characteristics | |
| Number of Issues1 | 43 |
| Weighted Average Maturity2 | 9.7 Yrs |
| Weighted Average Duration2 | 8.2 Yrs |
Portfolio Turnover
(One year trailing) | 98% |
| Fund Overview | |
| | Fund |
| Minimum Initial Investment | $100 |
| Inception Date | 11/2/2007 |
| Ticker Symbol | LIFNX |
| Cusip | 51855Q655 |
| NAV | $9.32 |
Management views and portfolio holdings may have changed since the report date.
| 1 | Short-term investments are not included. |
| 2 | See Glossary for definitions of maturity and duration. |
Laudus Mondrian Funds | Annual Report
Laudus Mondrian International Government Fixed Income Fund
Performance and Fund Facts as of 3/31/17
Past performance does not guarantee future results. The performance data quoted represents past performance, and current returns may be lower or higher. The performance information does not reflect the deduction of taxes that a shareholder would pay on fund distributions or the redemption of fund shares. The investment return and principal value of an investment will fluctuate so that an investor’s shares, when redeemed, may be worth more or less than the original cost. To obtain performance information current to the most recent month end, visit www.csimfunds.com.
Performance of Hypothetical Investment (November 2, 2007 – March 31, 2017)1,2
Average Annual Total Returns1,2
| Fund and Inception Date | 1 Year | 5 Years | Since Inception |
| Laudus Mondrian International Government Fixed Income Fund (11/2/07) | -5.48% | -2.45% | 1.80% |
| Citigroup non-US Dollar World Government Bond Index | -4.79% | -1.50% | 1.90% |
| Fund Expense Ratios3: Net 0.75%; Gross 0.81% |
All total returns on this page assume dividends and distributions were reinvested. Index figures do not include trading and management costs, which would lower performance. Indices are unmanaged and cannot be invested in directly. Performance results less than one year are not annualized.
For index definitions, please see the Glossary.
| 1 | Fund expenses may have been partially absorbed by CSIM. Without these reductions, the fund’s returns would have been lower. These returns do not reflect the deduction of taxes that a shareholder would pay on fund distributions or the redemption of fund shares. |
| 2 | On July 27, 2009, the Investor Share class, Select Share class and Institutional Share class of the fund were combined into a single class of shares of the fund. The performance and financial history of the fund is that of the fund’s former Institutional Shares. Accordingly, the past performance shown is that of the fund’s former Institutional Shares. |
| 3 | As stated in the prospectus. Net Expenses: The adviser has agreed to limit the total annual fund operating expenses (excluding interest, taxes and certain non-routine expenses) of the fund to 0.75% until at least 7/30/2018. Gross Expenses: Reflects the total annual fund operating expenses without the effect of contractual fee waivers. For actual rates during the period, refer to the Financial Highlights section of the Financial Statements. |
Laudus Mondrian Funds | Annual Report
Laudus Mondrian International Government Fixed Income Fund
Performance and Fund Facts as of 3/31/17 (continued)
Country Weightings % of Investments1
Currency Weightings % of Investments3
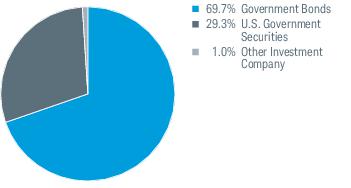
Sector Weightings % of Investments
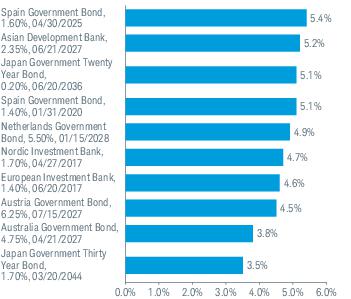
Top Holdings % of Net Assets5
There are risks associated with investing in foreign companies, such as erratic market conditions, economic and political instability, fluctuations in currency and exchange rates, and an increased risk of price volatility associated with less uniformity in accounting and reporting requirements.
Portfolio holdings may have changed since the report date.
| 1 | Country weights may include issues via Samurai bonds issued in Japanese yen by non-Japanese entities and/or Yankee bonds issued in U.S. dollars by non-U.S. entities. |
| 2 | Supranational bonds represent the debt of international organizations or institutions such as the World Bank, the International Monetary Fund, regional multilateral development banks and others. Bonds are issued and held in Japanese yen and euro. |
| 3 | Includes forward foreign currency exchange contracts exposure, which may results in negative exposure to a particular currency. |
| 4 | Amount is less than 0.05% |
| 5 | This list is not a recommendation of any security by the investment adviser or subadviser. |
Laudus Mondrian Funds | Annual Report
Laudus Mondrian Global Government Fixed Income Fund
The Laudus Mondrian Global Government Fixed Income Fund (the fund) seeks long-term total return consistent with its value-oriented investment approach. The fund invests primarily in fixed income securities that may also provide the potential for capital appreciation. The fund is a global fund that invests in issuers located throughout the world, including in emerging markets. As such, the fund may invest in securities issued in any currency and may hold foreign currency. For more information concerning the fund’s investment objective, strategies, and risks, please see the prospectus.
Market Highlights. Global bond indexes generated negative overall returns for the 12-month reporting period. The Federal Reserve raised short-term interest rates twice over the reporting period, while many other central banks maintained or increased accommodative policy measures. South Africa avoided a ratings agency downgrade that looked probable in early 2016, and the election of Donald Trump to the U.S. presidency increased concerns surrounding the potential renegotiation of the North American Free Trade Agreement (NAFTA) and the possible effects on member countries. Though the U.S. dollar generally strengthened over the reporting period, most notably against the British pound and the Mexican peso, several currencies, including the South African rand, Brazilian real, and Japanese yen, appreciated against the U.S. dollar and returns from these countries were generally enhanced in U.S. dollar terms.
Performance. For the 12-month reporting period ended March 31, 2017, the fund returned -1.64%. By comparison, the Custom Composite Index (the index) returned -1.91%1 over the same period.
Positioning and Strategies. The fund’s overweight to Brazil contributed to the fund’s outperformance relative to the index during the reporting period. Brazil’s economy remained weak over the reporting period, but the political backdrop improved, supporting a significant rise in the local bond market. Also contributing to the performance of the fund was an overweight to South Africa. The appreciation of the Brazilian real and the South African rand compared to the U.S. dollar increased returns in U.S. dollar terms, adding to the fund’s performance.
In contrast, an overweight to bonds from Mexico detracted from the fund’s performance. Returns on Mexican bonds fell in the weeks leading up to and immediately following the U.S. presidential election in November, in part due to concerns surrounding the potential renegotiation of NAFTA after Donald Trump’s victory. Mexico was further hindered by the sharp depreciation of the Mexican peso against the U.S. dollar, generally reducing returns from Mexico in U.S. dollar terms.
Due to changes in Mondrian’s proprietary valuation models over the 12-month reporting period, the fund’s subadviser reduced exposure to South Africa, Brazil, Colombia, the Canadian dollar, and the Japanese yen, and removed exposure to Singapore. These changes were offset by increased exposure to the eurozone, Hungary, Poland, Russia, Turkey, Mexico, and Australia (on a fully hedged basis).
Other strategies used by the subadviser included buying fully covered, defensive forward currency contracts. Such contracts are used to hedge what the subadviser believes to be overvalued currencies, based on proprietary currency models. The notional value of these currency contracts ranged from approximately 21% to 24% of the fund’s net assets, and had a positive overall effect on performance.
| Fund Characteristics | |
| Number of Issues2 | 73 |
| Weighted Average Maturity3 | 8.5 Yrs |
| Weighted Average Duration3 | 6.7 Yrs |
Portfolio Turnover
(One year trailing) | 63% |
| Fund Overview | |
| | Fund |
| Minimum Initial Investment | $100 |
| Inception Date | 7/10/2012 |
| Ticker Symbol | LMGDX |
| Cusip | 51855Q119 |
| NAV | $9.01 |
Management views and portfolio holdings may have changed since the report date.
| 1 | The Custom Composite Index is composed of the Citigroup World Government Bond Index from the Fund’s inception until the close of business on 3/31/13, and a blend of 80% Citigroup World Government Bond Index/20% Citigroup Custom Emerging Markets Government Bond Index from 4/1/2013 forward. |
| 2 | Short-term investments are not included. |
| 3 | See Glossary for definitions of maturity and duration. |
Laudus Mondrian Funds | Annual Report
Laudus Mondrian Global Government Fixed Income Fund
Performance and Fund Facts as of 3/31/17
Past performance does not guarantee future results. The performance data quoted represents past performance, and current returns may be lower or higher. The performance information does not reflect the deduction of taxes that a shareholder would pay on fund distributions or the redemption of fund shares. The investment return and principal value of an investment will fluctuate so that an investor’s shares, when redeemed, may be worth more or less than the original cost. To obtain performance information current to the most recent month end, visit www.csimfunds.com.
Performance of Hypothetical Investment (July 10, 2012 – March 31, 2017)1
Average Annual Total Returns1
| Fund and Inception Date | 1 Year | Since Inception |
| Laudus Mondrian Global Government Fixed Income Fund (7/10/12) | -1.64% | -1.84% |
| Custom Composite Index2 | -1.91% | -1.01% |
| Citigroup World Government Bond Index | -3.65% | -0.76% |
| Fund Expense Ratios3: Net 0.85%; Gross 2.23% |
All total returns on this page assume dividends and distributions were reinvested. Index figures do not include trading and management costs, which would lower performance. Indices are unmanaged and cannot be invested in directly. Performance results less than one year are not annualized.
For index definitions, please see the Glossary.
| 1 | Fund expenses may have been partially absorbed by CSIM. Without these reductions, the fund’s returns would have been lower. These returns do not reflect the deduction of taxes that a shareholder would pay on fund distributions or the redemption of fund shares. |
| 2 | The Custom Composite Index is composed of the Citigroup World Government Bond Index from the Fund’s inception until the close of business on 3/31/13, and a blend of 80% Citigroup World Government Bond Index/20% Citigroup Custom Emerging Markets Government Bond Index from 4/1/2013 forward. |
| 3 | As stated in the prospectus. Net Expenses: The adviser has agreed to limit the total annual fund operating expenses (excluding interest, taxes and certain non-routine expenses) of the fund to 0.85% until at least 7/30/2018. Gross Expenses: Reflects the total annual fund operating expenses without the effect of contractual fee waivers. For actual rates during the period, refer to the Financial Highlights section of the Financial Statements. |
Laudus Mondrian Funds | Annual Report
Laudus Mondrian Global Government Fixed Income Fund
Performance and Fund Facts as of 3/31/17 (continued)
Country Weightings % of Investments1
Currency Weightings % of Investments2
Sector Weightings % of Investments
Top Holdings % of Net Assets4
There are risks associated with investing in foreign companies, such as erratic market conditions, economic and political instability, fluctuations in currency and exchange rates, and an increased risk of price volatility associated with less uniformity in accounting and reporting requirements.
Portfolio holdings may have changed since the report date.
| 1 | Country weights may include issues via Samurai bonds issued in Japanese yen by non-Japanese entities and/or Yankee bonds issued in U.S. dollars by non-U.S. entities. |
| 2 | Includes forward foreign currency exchange contracts exposure, which may results in negative exposure to a particular currency. |
| 3 | Amount is less than 0.05% |
| 4 | This list is not a recommendation of any security by the investment adviser or subadviser. |
Laudus Mondrian Funds | Annual Report
Fund Expenses (Unaudited)
Examples for a $1,000 Investment
As a fund shareholder, you may incur two types of costs: (1) transaction costs; and (2) ongoing costs, including management fees, transfer agent and shareholder services fees, and other fund expenses.
The expense examples below are intended to help you understand your ongoing cost (in dollars) of investing in a fund and to compare this cost with the ongoing cost of investing in other mutual funds. These examples are based on an investment of $1,000 invested for the period beginning October 1, 2016 and held through March 31, 2017.
Actual Return lines in the table below provide information about actual account values and actual expenses. You may use this information, together with the amount you invested, to estimate the expenses that you paid over the period. To do so, simply divide your account value by $1,000 (for example, an $8,600 account value ÷ $1,000 = 8.6), then multiply the result by the number given for your fund or share class under the heading entitled “Expenses Paid During Period.”
Hypothetical Return lines in the table below provide information about hypothetical account values and hypothetical expenses based on a fund’s or share class’ actual expense ratio and an assumed return of 5% per year before expenses. Because the return used is not an actual return, it may not be used to estimate the actual ending account value or expenses you paid for the period.
You may use this information to compare the ongoing costs of investing in a fund and other funds. To do so, compare this 5% hypothetical example with the 5% hypothetical examples that appear in the shareholder reports of the other funds.
Please note that the expenses shown in the table are meant to highlight your ongoing costs only, and do not reflect any transactional costs. Therefore, the hypothetical return lines of the table are useful in comparing ongoing costs only, and will not help you determine the relative total costs of owning different funds. In addition, if these transactional costs were included, your costs would have been higher.
| | Expense Ratio
(Annualized)1 | Beginning
Account Value
at 10/1/16 | Ending
Account Value
(Net of Expenses)
at 3/31/17 | Expenses Paid
During Period
10/1/16-3/31/172 |
| Laudus Mondrian International Equity Fund | | | | |
| Investor Shares | | | | |
| Actual Return | 1.27% | $1,000.00 | $1,055.00 | $6.51 |
| Hypothetical 5% Return | 1.27% | $1,000.00 | $1,018.57 | $6.39 |
| Select Shares | | | | |
| Actual Return | 1.03% | $1,000.00 | $1,056.70 | $5.28 |
| Hypothetical 5% Return | 1.03% | $1,000.00 | $1,019.76 | $5.19 |
| Institutional Shares | | | | |
| Actual Return | 0.90% | $1,000.00 | $1,057.60 | $4.62 |
| Hypothetical 5% Return | 0.90% | $1,000.00 | $1,020.41 | $4.53 |
| Laudus Mondrian Emerging Markets Fund | | | | |
| Investor Shares | | | | |
| Actual Return | 1.60% | $1,000.00 | $1,052.30 | $8.19 |
| Hypothetical 5% Return | 1.60% | $1,000.00 | $1,016.92 | $8.05 |
| Select Shares | | | | |
| Actual Return | 1.25% | $1,000.00 | $1,054.30 | $6.40 |
| Hypothetical 5% Return | 1.25% | $1,000.00 | $1,018.67 | $6.29 |
| Institutional Shares | | | | |
| Actual Return | 1.20% | $1,000.00 | $1,055.20 | $6.15 |
| Hypothetical 5% Return | 1.20% | $1,000.00 | $1,018.92 | $6.04 |
| Laudus Mondrian International Government Fixed Income Fund | | | | |
| Actual Return | 0.75% | $1,000.00 | $ 914.80 | $3.58 |
| Hypothetical 5% Return | 0.75% | $1,000.00 | $1,021.16 | $3.78 |
| Laudus Mondrian Global Government Fixed Income Fund | | | | |
| Actual Return | 0.85% | $1,000.00 | $ 948.40 | $4.13 |
| Hypothetical 5% Return | 0.85% | $1,000.00 | $1,020.66 | $4.28 |
| 1 | Based on the most recent six-month expense ratio; may differ from the expense ratio provided in the Financial Highlights which covers a 12- month period. |
| 2 | Expenses for each fund or share class are equal to its annualized expense ratio, multiplied by the average account value over the period, multiplied by the 182 days of the period, and divided by the 365 days of the fiscal year. |
Laudus Mondrian Funds | Annual Report
Laudus Mondrian International Equity Fund
Financial Statements
Financial Highlights
| Investor Shares | 4/1/16–
3/31/17 | 4/1/15–
3/31/16 | 4/1/14–
3/31/15 | 4/1/13–
3/31/14 | 4/1/12–
3/31/13 | |
| Per-Share Data |
| Net asset value at beginning of period | $5.63 | $6.45 | $8.76 | $7.43 | $7.19 | |
| Income (loss) from investment operations: | | | | | | |
| Net investment income (loss)1 | 0.16 | 0.12 | 0.16 | 0.29 | 0.21 | |
| Net realized and unrealized gains (losses) | 0.41 | (0.59) | (0.31) | 1.25 | 0.26 | |
| Total from investment operations | 0.57 | (0.47) | (0.15) | 1.54 | 0.47 | |
| Less distributions: | | | | | | |
| Distributions from net investment income | (0.14) | (0.13) | (0.88) | (0.21) | (0.22) | |
| Distributions from net realized gains | — | (0.22) | (1.28) | — | (0.01) | |
| Total distributions | (0.14) | (0.35) | (2.16) | (0.21) | (0.23) | |
| Net asset value at end of period | $6.06 | $5.63 | $6.45 | $8.76 | $7.43 | |
| Total return | 10.37% | (7.20%) | (0.02%) | 20.86% | 6.79% | |
| Ratios/Supplemental Data |
| Ratios to average net assets: | | | | | | |
| Net operating expenses | 1.25% | 1.26% | 1.17% | 1.27% | 1.40% | |
| Gross operating expenses | 1.32% | 1.42% | 1.33% | 1.29% | 1.51% | |
| Net investment income (loss) | 2.71% | 1.99% | 2.08% | 3.56% | 3.03% | |
| Portfolio turnover rate | 34% | 29% | 36% 2 | 25% | 29% | |
| Net assets, end of period (x 1,000) | $7,250 | $5,187 | $3,486 | $1,185 | $926 | |
| |
| Select Shares | 4/1/16–
3/31/17 | 4/1/15–
3/31/16 | 4/1/14–
3/31/15 | 4/1/13–
3/31/14 | 4/1/12–
3/31/13 | |
| Per-Share Data |
| Net asset value at beginning of period | $5.67 | $6.48 | $8.79 | $7.45 | $7.20 | |
| Income (loss) from investment operations: | | | | | | |
| Net investment income (loss)1 | 0.17 | 0.13 | 0.20 | 0.37 | 0.24 | |
| Net realized and unrealized gains (losses) | 0.41 | (0.58) | (0.35) | 1.19 | 0.26 | |
| Total from investment operations | 0.58 | (0.45) | (0.15) | 1.56 | 0.50 | |
| Less distributions: | | | | | | |
| Distributions from net investment income | (0.15) | (0.14) | (0.88) | (0.22) | (0.24) | |
| Distributions from net realized gains | — | (0.22) | (1.28) | — | (0.01) | |
| Total distributions | (0.15) | (0.36) | (2.16) | (0.22) | (0.25) | |
| Net asset value at end of period | $6.10 | $5.67 | $6.48 | $8.79 | $7.45 | |
| Total return | 10.51% | (6.84%) | 0.04% | 21.17% | 7.18% | |
| Ratios/Supplemental Data |
| Ratios to average net assets: | | | | | | |
| Net operating expenses | 1.02% | 1.04% | 1.08% 3 | 1.07% | 1.12% | |
| Gross operating expenses | 1.09% | 1.19% | 1.23% | 1.08% | 1.26% | |
| Net investment income (loss) | 2.88% | 2.14% | 2.56% | 4.53% | 3.37% | |
| Portfolio turnover rate | 34% | 29% | 36% 2 | 25% | 29% | |
| Net assets, end of period (x 1,000) | $6,092 | $4,465 | $2,981 | $2,238 | $768 | |
1
Calculated based on the average shares outstanding during the period.
2
Portfolio turnover excludes the impact of investment activity from a merger with another fund.
3
Effective October 1, 2014, the annual operating expense was reduced. The ratio presented for period ended 3/31/15 is a blended ratio.
Laudus Mondrian Funds | Annual Report
Laudus Mondrian International Equity Fund
Financial Highlights continued
| Institutional Shares | 4/1/16–
3/31/17 | 4/1/15–
3/31/16 | 4/1/14–
3/31/15 | 4/1/13–
3/31/14 | 4/1/12–
3/31/13 | |
| Per-Share Data |
| Net asset value at beginning of period | $5.68 | $6.50 | $8.81 | $7.46 | $7.22 | |
| Income (loss) from investment operations: | | | | | | |
| Net investment income (loss)1 | 0.18 | 0.16 | 0.27 | 0.35 | 0.23 | |
| Net realized and unrealized gains (losses) | 0.42 | (0.61) | (0.41) | 1.22 | 0.27 | |
| Total from investment operations | 0.60 | (0.45) | (0.14) | 1.57 | 0.50 | |
| Less distributions: | | | | | | |
| Distributions from net investment income | (0.16) | (0.15) | (0.89) | (0.22) | (0.25) | |
| Distributions from net realized gains | — | (0.22) | (1.28) | — | (0.01) | |
| Total distributions | (0.16) | (0.37) | (2.17) | (0.22) | (0.26) | |
| Net asset value at end of period | $6.12 | $5.68 | $6.50 | $8.81 | $7.46 | |
| Total return | 10.78% | (6.88%) | 0.11% | 21.31% | 7.10% | |
| Ratios/Supplemental Data |
| Ratios to average net assets: | | | | | | |
| Net operating expenses | 0.90% | 0.91% 2 | 1.01% 3 | 1.05% | 1.05% | |
| Gross operating expenses | 0.96% | 1.06% | 1.07% | 1.07% | 1.11% | |
| Net investment income (loss) | 3.10% | 2.53% | 3.28% | 4.24% | 3.22% | |
| Portfolio turnover rate | 34% | 29% | 36% 4 | 25% | 29% | |
| Net assets, end of period (x 1,000) | $92,312 | $110,873 | $91,981 | $162,366 | $127,709 | |
| |
1
Calculated based on the average shares outstanding during the period.
2
The ratio of net operating expenses would have been 0.90%, if certain non-routine expenses had not been incurred.
3
Effective October 1, 2014, the annual operating expense was reduced. The ratio presented for period ended 3/31/15 is a blended ratio.
4
Portfolio turnover excludes the impact of investment activity from a merger with another fund.
Laudus Mondrian Funds | Annual Report
Laudus Mondrian International Equity Fund
Portfolio Holdings as of March 31, 2017
This section shows all the securities in the fund's portfolio and their values as of the report date.
The fund files its complete schedule of portfolio holdings with the SEC for the first and third quarters of each fiscal year on Form N-Q. The fund's Form N-Q is available on the SEC's website at www.sec.gov and may be viewed and copied at the SEC's Public Reference Room in Washington, D.C. Call 1-800-SEC-0330 for information on the operation of the Public Reference Room. The fund also makes available its complete schedule of portfolio holdings 15-20 days after calendar quarters on the fund's website at www.csimfunds.com/laudusfunds_prospectus.
| Holdings by Category | Cost ($) | Value ($) |
| 98.7% | Common Stock | 85,736,120 | 104,287,792 |
| 0.8% | Other Investment Company | 869,962 | 869,962 |
| 99.5% | Total Investments | 86,606,082 | 105,157,754 |
| 0.5% | Other Assets and Liabilities, Net | | 496,537 |
| 100.0% | Net Assets | | 105,654,291 |
| Security | Number
of Shares | Value ($) |
| Common Stock 98.7% of net assets |
| |
| Australia 1.9% |
| Insurance 1.9% |
| QBE Insurance Group Ltd. | 202,837 | 1,996,895 |
| |
| China 2.3% |
| Telecommunication Services 2.3% |
| China Mobile Ltd. | 217,000 | 2,386,458 |
| |
| France 6.4% |
| Capital Goods 2.7% |
| Compagnie de Saint-Gobain | 56,703 | 2,909,250 |
| Pharmaceuticals, Biotechnology & Life Sciences 3.7% |
| Sanofi | 42,862 | 3,874,519 |
| | | 6,783,769 |
| |
| Germany 10.0% |
| Automobiles & Components 2.0% |
| Daimler AG — Reg'd | 29,058 | 2,144,466 |
| Insurance 2.4% |
| Allianz SE — Reg'd | 13,819 | 2,562,680 |
| Software & Services 3.7% |
| SAP SE | 39,480 | 3,873,302 |
| Telecommunication Services 1.9% |
| Deutsche Telekom AG — Reg'd | 116,226 | 2,036,585 |
| | | 10,617,033 |
| |
| Italy 6.1% |
| Energy 3.3% |
| Eni S.p.A. | 210,691 | 3,449,703 |
| Utilities 2.8% |
| Enel S.p.A. | 629,491 | 2,962,046 |
| | | 6,411,749 |
| |
| Japan 14.7% |
| Automobiles & Components 3.7% |
| Honda Motor Co., Ltd. | 117,000 | 3,532,118 |
| Sumitomo Electric Industries Ltd. | 20,900 | 347,428 |
| | | 3,879,546 |
| Capital Goods 1.6% |
| Mitsubishi Electric Corp. | 119,500 | 1,721,790 |
| Security | Number
of Shares | Value ($) |
| Insurance 3.3% |
| Tokio Marine Holdings, Inc. | 81,700 | 3,452,996 |
| Pharmaceuticals, Biotechnology & Life Sciences 3.5% |
| Takeda Pharmaceutical Co., Ltd. | 79,700 | 3,752,046 |
| Technology Hardware & Equipment 2.6% |
| Canon, Inc. | 86,700 | 2,707,524 |
| | | 15,513,902 |
| |
| Netherlands 2.6% |
| Food & Staples Retailing 2.6% |
| Koninklijke Ahold Delhaize N.V. | 127,572 | 2,726,189 |
| |
| Singapore 5.3% |
| Banks 3.0% |
| United Overseas Bank Ltd. | 201,897 | 3,189,017 |
| Telecommunication Services 2.3% |
| Singapore Telecommunications Ltd. | 859,300 | 2,408,044 |
| | | 5,597,061 |
| |
| Spain 7.0% |
| Banks 1.3% |
| Banco Santander S.A. | 222,672 | 1,363,043 |
| Telecommunication Services 2.6% |
| Telefonica S.A. | 246,304 | 2,756,961 |
| Utilities 3.1% |
| Iberdrola S.A. | 461,807 | 3,299,560 |
| | | 7,419,564 |
| |
| Sweden 3.0% |
| Telecommunication Services 3.0% |
| Telia Co. AB | 743,468 | 3,116,868 |
| |
| Switzerland 14.4% |
| Capital Goods 3.1% |
| ABB Ltd. — Reg'd * | 143,025 | 3,347,569 |
| Food, Beverage & Tobacco 2.4% |
| Nestle S.A. — Reg'd | 32,726 | 2,511,777 |
| Insurance 2.9% |
| Zurich Insurance Group AG | 11,462 | 3,058,755 |
| Materials 3.6% |
| Syngenta AG — Reg'd | 8,564 | 3,782,209 |
| Pharmaceuticals, Biotechnology & Life Sciences 2.4% |
| Novartis AG — Reg'd | 33,826 | 2,511,835 |
| | | 15,212,145 |
| |
| Taiwan 2.7% |
| Semiconductors & Semiconductor Equipment 2.7% |
| Taiwan Semiconductor Manufacturing Co., Ltd. | 463,154 | 2,904,269 |
| |
Laudus Mondrian Funds | Annual Report
Laudus Mondrian International Equity Fund
Portfolio Holdings as of March 31, 2017 (continued)
| Security | Number
of Shares | Value ($) |
| United Kingdom 22.3% |
| Banks 2.8% |
| Lloyds Banking Group plc | 3,586,845 | 2,983,108 |
| Energy 6.6% |
| BP plc | 597,708 | 3,440,476 |
| Royal Dutch Shell plc, A Shares (a) | 7,679 | 202,405 |
| Royal Dutch Shell plc, A Shares (a) | 6,851 | 180,376 |
| Royal Dutch Shell plc, B Shares | 115,180 | 3,166,230 |
| | | 6,989,487 |
| Food & Staples Retailing 2.9% |
| Tesco plc * | 1,330,391 | 3,096,304 |
| Household & Personal Products 2.1% |
| Unilever plc | 44,591 | 2,199,552 |
| Pharmaceuticals, Biotechnology & Life Sciences 3.2% |
| GlaxoSmithKline plc | 164,375 | 3,417,840 |
| Retailing 2.5% |
| Kingfisher plc | 641,633 | 2,625,300 |
| Utilities 2.2% |
| National Grid plc | 180,519 | 2,290,299 |
| | | 23,601,890 |
| Total Common Stock |
| (Cost $85,736,120) | | 104,287,792 |
|
| Other Investment Company 0.8% of net assets |
| |
| United States 0.8% |
| State Street Institutional U.S. Government Money Market Fund, Premier Class 0.62% (b) | 869,962 | 869,962 |
| Total Other Investment Company |
| (Cost $869,962) | | 869,962 |
End of Investments.
At 03/31/17, the tax basis cost of the fund's investments was $89,758,647 and the unrealized appreciation and depreciation were $16,470,829 and ($1,071,722), respectively, with a net unrealized appreciation of $15,399,107.
At 03/31/17, the values of certain foreign securities held by the fund aggregating $104,287,792 were adjusted from their closing market values in accordance with international fair valuation procedures approved by the fund's Board of Trustees. (See financial note 2(a) for additional information).
| * | Non-income producing security. |
| (a) | Securities are traded on separate exchanges for the same entity. |
| (b) | The rate shown is the 7-day yield. |
| | |
The following is a summary of the inputs used to value the fund’s investments as of March 31, 2017 (see financial note 2(a) for additional information):
| Description | Quoted Prices in
Active Markets for
Identical Assets
(Level 1) | Other Significant
Observable Inputs
(Level 2) | Significant
Unobservable Inputs
(Level 3) | Total | |
| Common Stock1 | $— | $104,287,792 | $— | $104,287,792 | |
| Other Investment Company1 | 869,962 | — | — | 869,962 | |
| Total | $869,962 | $104,287,792 | $— | $105,157,754 | |
| 1 | As categorized in Portfolio Holdings. |
The fund’s policy is to recognize transfers between Level 1, Level 2 and Level 3 as of the beginning of the fiscal year. There were no transfers between Level 1, Level 2 and Level 3 for the period ended March 31, 2017.
Laudus Mondrian Funds | Annual Report
Laudus Mondrian International Equity Fund
Statement of Assets and Liabilities
As of March 31, 2017
| Assets |
| Investments, at value (cost $86,606,082) | | $105,157,754 |
| Foreign currency, at value (cost $153,296) | | 153,749 |
| Receivables: | | |
| Investments sold | | 217,809 |
| Dividends | | 490,239 |
| Foreign tax reclaims | | 327,137 |
| Fund shares sold | | 13,207 |
| Prepaid expenses | + | 17,483 |
| Total assets | | 106,377,378 |
| Liabilities |
| Payables: | | |
| Investments bought | | 397,216 |
| Fund shares redeemed | | 148,965 |
| Investment adviser fees | | 77,590 |
| Distribution and shareholder services fees | | 1,528 |
| Accrued expenses | + | 97,788 |
| Total liabilities | | 723,087 |
| Net Assets |
| Total assets | | 106,377,378 |
| Total liabilities | – | 723,087 |
| Net assets | | $105,654,291 |
| Net Assets by Source | | |
| Capital received from investors | | 91,889,147 |
| Net investment income not yet distributed | | 625,774 |
| Net realized capital losses | | (5,392,973) |
| Net unrealized capital appreciation | | 18,532,343 |
| Net Asset Value (NAV) by Shares Class | |
| Share Class | Net Assets | ÷ | Shares
Outstanding | = | NAV |
| Investor Shares | $7,250,440 | | 1,196,441 | | $6.06 |
| Select Shares | $6,091,629 | | 999,022 | | $6.10 |
| Institutional Shares | $92,312,222 | | 15,089,731 | | $6.12 |
| | | | | | |
Laudus Mondrian Funds | Annual Report
Laudus Mondrian International Equity Fund
Statement of Operations
For the period April 1, 2016 through March 31, 2017
| Investment Income |
| Dividends (net of foreign withholding tax of $452,632) | | $5,480,588 |
| Expenses |
| Investment adviser fees | | 1,028,618 |
| Custodian fees | | 63,819 |
| Professional fees | | 59,834* |
| Registration fees | | 51,158 |
| Transfer agent fees | | 50,101 |
| Accounting and administration fees | | 29,982 |
| Distribution and shareholder services fees (Investor Shares) | | 16,373 |
| Independent trustees' fees | | 14,009 |
| Shareholder reports | | 6,597 |
| Interest expense | | 732 |
| Sub-accounting and sub-transfer agent fees: | | |
| Investor Shares | | 6,613 |
| Select Shares | | 7,409 |
| Other expenses | + | 16,640 |
| Total expenses | | 1,351,885 |
| Expense reduction by adviser | – | 86,143 |
| Net expenses | – | 1,265,742 |
| Net investment income | | 4,214,846 |
| Realized and Unrealized Gains (Losses) |
| Net realized losses on investments | | (1,370,232) |
| Net realized gains on foreign currency transactions | + | 55,581 |
| Net realized losses | | (1,314,651) |
| Net change in unrealized appreciation (depreciation) on investments | | 10,800,596 |
| Net change in unrealized appreciation (depreciation) on foreign currency translations | + | (9,392) |
| Net change in unrealized appreciation (depreciation) | + | 10,791,204 |
| Net realized and unrealized gains | | 9,476,553 |
| Increase in net assets resulting from operations | | $13,691,399 |
| * | Includes professional fees of $8,945 associated with the filing of tax claims in the European Union deemed to be non-routine expenses of the fund. See financial notes 2 (d) and 4 for additional information. |
Laudus Mondrian Funds | Annual Report
Laudus Mondrian International Equity Fund
Statement of Changes in Net Assets
For the current and prior report periods
| Operations | |
| | 4/1/16-3/31/17 | 4/1/15-3/31/16 |
| Net investment income | | $4,214,846 | $2,647,333 |
| Net realized losses | | (1,314,651) | (1,230,047) |
| Net change in unrealized appreciation (depreciation) | + | 10,791,204 | (8,523,533) |
| Increase (decrease) in net assets from operations | | 13,691,399 | (7,106,247) |
| Distributions to Shareholders | |
| Distributions from net investment income | | | |
| Investor Shares | | (174,166) | (110,750) |
| Select Shares | | (168,191) | (96,876) |
| Institutional Shares | + | (3,635,958) | (2,254,767) |
| Total distributions from net investment income | | (3,978,315) | (2,462,393) |
| Distributions from net realized gains | | | |
| Investor Shares | | — | (181,863) |
| Select Shares | | — | (148,581) |
| Institutional Shares | + | — | (3,300,543) |
| Total distributions from net realized gains | | — | (3,630,987) |
| Total distributions | | ($3,978,315) | ($6,093,380) |
| Transactions in Fund Shares | | | |
| | | 4/1/16-3/31/17 | 4/1/15-3/31/16 |
| | | SHARES | VALUE | SHARES | VALUE |
| Shares Sold | | | | | |
| Investor Shares | | 754,099 | $4,346,911 | 543,636 | $3,390,344 |
| Select Shares | | 894,507 | 5,229,138 | 890,456 | 5,274,509 |
| Institutional Shares | + | 7,135,778 | 41,577,906 | 8,502,777 | 50,178,920 |
| Total shares sold | | 8,784,384 | $51,153,955 | 9,936,869 | $58,843,773 |
| Shares Reinvested | | | | | |
| Investor Shares | | 26,886 | $151,100 | 49,697 | $276,317 |
| Select Shares | | 24,300 | 137,291 | 42,104 | 234,938 |
| Institutional Shares | + | 325,293 | 1,844,411 | 849,088 | 4,754,894 |
| Total shares reinvested | | 376,479 | $2,132,802 | 940,889 | $5,266,149 |
| Shares Redeemed | | | | | |
| Investor Shares | | (505,190) | ($2,904,993) | (213,159) | ($1,280,378) |
| Select Shares | | (707,653) | (4,070,851) | (604,700) | (3,413,755) |
| Institutional Shares | + | (11,874,216) | (70,894,657) | (3,996,629) | (24,139,801) |
| Total shares redeemed | | (13,087,059) | ($77,870,501) | (4,814,488) | ($28,833,934) |
| Net transactions in fund shares | | (3,926,196) | ($24,583,744) | 6,063,270 | $35,275,988 |
| Shares Outstanding and Net Assets | | | |
| | | 4/1/16-3/31/17 | 4/1/15-3/31/16 |
| | | SHARES | NET ASSETS | SHARES | NET ASSETS |
| Beginning of period | | 21,211,390 | $120,524,951 | 15,148,120 | $98,448,590 |
| Total increase or decrease | + | (3,926,196) | (14,870,660) | 6,063,270 | 22,076,361 |
| End of period | | 17,285,194 | $105,654,291 | 21,211,390 | $120,524,951 |
| Net investment income not yet distributed | | | $625,774 | | $333,662 |
Laudus Mondrian Funds | Annual Report
Laudus Mondrian Emerging Markets Fund
Financial Statements
Financial Highlights
| Investor Shares | 4/1/16–
3/31/17 | 4/1/15–
3/31/16 | 4/1/14–
3/31/15 | 4/1/13–
3/31/14 | 4/1/12–
3/31/13 | |
| Per-Share Data |
| Net asset value at beginning of period | $7.04 | $8.18 | $8.69 | $9.84 | $9.48 | |
| Income (loss) from investment operations: | | | | | | |
| Net investment income (loss)1 | 0.11 | 0.11 | 0.14 | 0.11 | 0.12 | |
| Net realized and unrealized gains (losses) | 0.73 | (1.19) | (0.45) | (1.18) | 0.42 | |
| Total from investment operations | 0.84 | (1.08) | (0.31) | (1.07) | 0.54 | |
| Less distributions: | | | | | | |
| Distributions from net investment income | (0.16) | (0.06) | (0.20) | (0.08) | (0.18) | |
| Distributions from net realized gains | — | — | — | (0.00) 2 | — | |
| Total distributions | (0.16) | (0.06) | (0.20) | (0.08) | (0.18) | |
| Net asset value at end of period | $7.72 | $7.04 | $8.18 | $8.69 | $9.84 | |
| Total return | 12.11% | (13.21%) | (3.46%) | (10.89%) | 5.79% | |
| Ratios/Supplemental Data |
| Ratios to average net assets: | | | | | | |
| Net operating expenses | 1.59% | 1.59% | 1.71% 3 | 1.80% | 1.80% | |
| Gross operating expenses | 1.61% | 1.61% | 1.77% | 1.86% | 1.89% | |
| Net investment income (loss) | 1.51% | 1.48% | 1.56% | 1.25% | 1.33% | |
| Portfolio turnover rate | 32% | 28% | 30% 4 | 69% | 59% | |
| Net assets, end of period (x 1,000) | $2,884 | $3,299 | $5,426 | $7,499 | $11,716 | |
| |
| Select Shares | 4/1/16–
3/31/17 | 4/1/15–
3/31/16 | 4/1/14–
3/31/15 | 4/1/13–
3/31/14 | 4/1/12–
3/31/13 | |
| Per-Share Data |
| Net asset value at beginning of period | $7.04 | $8.18 | $8.70 | $9.85 | $9.49 | |
| Income (loss) from investment operations: | | | | | | |
| Net investment income (loss)1 | 0.14 | 0.13 | 0.17 | 0.13 | 0.12 | |
| Net realized and unrealized gains (losses) | 0.72 | (1.19) | (0.46) | (1.17) | 0.45 | |
| Total from investment operations | 0.86 | (1.06) | (0.29) | (1.04) | 0.57 | |
| Less distributions: | | | | | | |
| Distributions from net investment income | (0.18) | (0.08) | (0.23) | (0.11) | (0.21) | |
| Distributions from net realized gains | — | — | — | (0.00) 2 | — | |
| Total distributions | (0.18) | (0.08) | (0.23) | (0.11) | (0.21) | |
| Net asset value at end of period | $7.72 | $7.04 | $8.18 | $8.70 | $9.85 | |
| Total return | 12.46% | (12.88%) | (3.26%) | (10.57%) | 6.15% | |
| Ratios/Supplemental Data |
| Ratios to average net assets: | | | | | | |
| Net operating expenses | 1.27% | 1.29% | 1.45% 3 | 1.52% | 1.52% | |
| Gross operating expenses | 1.29% | 1.30% | 1.51% | 1.59% | 1.66% | |
| Net investment income (loss) | 1.91% | 1.82% | 1.92% | 1.47% | 1.24% | |
| Portfolio turnover rate | 32% | 28% | 30% 4 | 69% | 59% | |
| Net assets, end of period (x 1,000) | $4,645 | $5,888 | $10,446 | $15,849 | $18,340 | |
1
Calculated based on the average shares outstanding during the period.
2
Per-share amount was less than $0.005.
3
Effective October 1, 2014, the annual operating expense was reduced. The ratio presented for period ended 3/31/15 is a blended ratio.
4
Portfolio turnover excludes the impact of investment activity from a merger with another fund.
Laudus Mondrian Funds | Annual Report
Laudus Mondrian Emerging Markets Fund
Financial Highlights continued
| Institutional Shares | 4/1/16–
3/31/17 | 4/1/15–
3/31/16 | 4/1/14–
3/31/15 | 4/1/13–
3/31/14 | 4/1/12–
3/31/13 | |
| Per-Share Data |
| Net asset value at beginning of period | $7.03 | $8.18 | $8.69 | $9.85 | $9.49 | |
| Income (loss) from investment operations: | | | | | | |
| Net investment income (loss)1 | 0.14 | 0.14 | 0.12 | 0.14 | 0.16 | |
| Net realized and unrealized gains (losses) | 0.72 | (1.20) | (0.39) | (1.19) | 0.42 | |
| Total from investment operations | 0.86 | (1.06) | (0.27) | (1.05) | 0.58 | |
| Less distributions: | | | | | | |
| Distributions from net investment income | (0.18) | (0.09) | (0.24) | (0.11) | (0.22) | |
| Distributions from net realized gains | — | — | — | (0.00) 2 | — | |
| Total distributions | (0.18) | (0.09) | (0.24) | (0.11) | (0.22) | |
| Net asset value at end of period | $7.71 | $7.03 | $8.18 | $8.69 | $9.85 | |
| Total return | 12.57% | (12.87%) | (3.03%) | (10.62%) | 6.21% | |
| Ratios/Supplemental Data |
| Ratios to average net assets: | | | | | | |
| Net operating expenses | 1.20% | 1.20% | 1.29% 3 | 1.45% | 1.45% | |
| Gross operating expenses | 1.22% | 1.21% | 1.31% | 1.52% | 1.49% | |
| Net investment income (loss) | 1.92% | 1.87% | 1.42% | 1.55% | 1.70% | |
| Portfolio turnover rate | 32% | 28% | 30% 4 | 69% | 59% | |
| Net assets, end of period (x 1,000) | $336,896 | $406,462 | $559,347 | $121,795 | $141,536 | |
| |
1
Calculated based on the average shares outstanding during the period.
2
Per-share amount was less than $0.005.
3
Effective October 1, 2014, the annual operating expense was reduced. The ratio presented for period ended 3/31/15 is a blended ratio.
4
Portfolio turnover excludes the impact of investment activity from a merger with another fund.
Laudus Mondrian Funds | Annual Report
Laudus Mondrian Emerging Markets Fund
Portfolio Holdings as of March 31, 2017
This section shows all the securities in the fund's portfolio and their values as of the report date.
The fund files its complete schedule of portfolio holdings with the SEC for the first and third quarters of each fiscal year on Form N-Q. The fund's Form N-Q is available on the SEC's website at www.sec.gov and may be viewed and copied at the SEC's Public Reference Room in Washington, D.C. Call 1-800-SEC-0330 for information on the operation of the Public Reference Room. The fund also makes available its complete schedule of portfolio holdings 15-20 days after calendar quarters on the fund's website at www.csimfunds.com/laudusfunds_prospectus.
| Holdings by Category | Cost ($) | Value ($) |
| 97.1% | Common Stock | 323,106,340 | 334,341,233 |
| 2.0% | Preferred Stock | 5,377,025 | 7,046,360 |
| 99.1% | Total Investments | 328,483,365 | 341,387,593 |
| 0.9% | Other Assets and Liabilities, Net | | 3,036,817 |
| 100.0% | Net Assets | | 344,424,410 |
| Security | Number
of Shares | Value ($) |
| Common Stock 97.1% of net assets |
| |
| Brazil 5.0% |
| Food, Beverage & Tobacco 0.9% |
| Ambev S.A. ADR | 531,500 | 3,061,440 |
| Software & Services 2.0% |
| Cielo S.A. | 754,130 | 6,819,594 |
| Transportation 2.1% |
| CCR S.A. | 1,254,181 | 7,231,191 |
| | | 17,112,225 |
| |
| China 15.6% |
| Banks 3.0% |
| China Construction Bank Corp., H Shares | 12,779,000 | 10,296,137 |
| Capital Goods 1.2% |
| Beijing Enterprises Holdings Ltd. | 815,000 | 4,218,326 |
| Consumer Durables & Apparel 1.6% |
| Belle International Holdings Ltd. | 8,279,848 | 5,385,290 |
| Food, Beverage & Tobacco 3.4% |
| WH Group Ltd. | 13,413,000 | 11,566,298 |
| Pharmaceuticals, Biotechnology & Life Sciences 0.6% |
| CSPC Pharmaceutical Group Ltd. | 1,638,000 | 2,145,966 |
| Telecommunication Services 3.0% |
| China Mobile Ltd. | 951,500 | 10,464,123 |
| Utilities 2.8% |
| China Resources Power Holdings Co., Ltd. | 5,403,291 | 9,754,558 |
| | | 53,830,698 |
| |
| Hong Kong 1.5% |
| Consumer Services 1.5% |
| Sands China Ltd. | 1,143,200 | 5,299,406 |
| |
| India 15.6% |
| Automobiles & Components 2.7% |
| Bajaj Auto Ltd. | 218,715 | 9,450,340 |
| Banks 3.0% |
| Axis Bank Ltd. | 446,892 | 3,378,411 |
| Housing Development Finance Corp., Ltd. | 294,889 | 6,822,373 |
| | | 10,200,784 |
| Capital Goods 1.4% |
| Larsen & Toubro Ltd. | 197,124 | 4,781,326 |
| Security | Number
of Shares | Value ($) |
| Energy 5.3% |
| Cairn India Ltd. | 2,287,112 | 10,773,376 |
| Reliance Industries Ltd. | 363,744 | 7,399,644 |
| | | 18,173,020 |
| Software & Services 3.2% |
| HCL Technologies Ltd. | 511,340 | 6,887,973 |
| Infosys Ltd. | 226,505 | 3,570,874 |
| Infosys Ltd. ADR | 42,200 | 666,760 |
| | | 11,125,607 |
| | | 53,731,077 |
| |
| Indonesia 2.3% |
| Banks 2.3% |
| PT Bank Mandiri (Persero) Tbk | 3,413,500 | 2,997,856 |
| PT Bank Rakyat Indonesia (Persero) Tbk | 5,196,800 | 5,060,220 |
| | | 8,058,076 |
| |
| Kazakhstan 1.0% |
| Energy 1.0% |
| KazMunaiGas Exploration Production JSC GDR * | 334,343 | 3,343,430 |
| |
| Malaysia 5.0% |
| Banks 2.1% |
| AMMB Holdings Berhad | 6,777,300 | 7,122,378 |
| Consumer Services 1.7% |
| Genting Malaysia Berhad | 4,679,500 | 5,761,924 |
| Utilities 1.2% |
| Tenaga Nasional Berhad | 1,392,700 | 4,316,046 |
| | | 17,200,348 |
| |
| Mexico 4.3% |
| Banks 1.1% |
| Grupo Financiero Santander Mexico S.A.B. de C.V., Class B ADR | 399,073 | 3,603,629 |
| Real Estate 3.2% |
| Fibra Uno Administracion S.A. de C.V. | 6,515,800 | 11,164,623 |
| | | 14,768,252 |
| |
| Peru 1.5% |
| Banks 1.5% |
| Credicorp Ltd. | 30,519 | 4,983,753 |
| |
| Philippines 1.8% |
| Telecommunication Services 1.8% |
| PLDT, Inc. ADR | 196,673 | 6,325,004 |
| |
| Qatar 1.9% |
| Banks 1.9% |
| Qatar National Bank SAQ | 164,788 | 6,612,158 |
| |
Laudus Mondrian Funds | Annual Report
Laudus Mondrian Emerging Markets Fund
Portfolio Holdings as of March 31, 2017 (continued)
| Security | Number
of Shares | Value ($) |
| Republic of Korea 13.6% |
| Automobiles & Components 2.8% |
| Hyundai Mobis Co., Ltd. | 44,917 | 9,662,413 |
| Banks 2.4% |
| Shinhan Financial Group Co., Ltd. | 196,786 | 8,199,494 |
| Technology Hardware & Equipment 3.9% |
| Samsung Electronics Co., Ltd. | 7,400 | 13,619,068 |
| Telecommunication Services 3.4% |
| SK Telecom Co., Ltd. | 51,809 | 11,706,256 |
| Utilities 1.1% |
| Korea Electric Power Corp. | 89,615 | 3,730,253 |
| | | 46,917,484 |
| |
| Russia 3.6% |
| Energy 3.6% |
| Gazprom PJSC ADR | 1,871,791 | 8,413,701 |
| Lukoil PJSC ADR | 77,336 | 4,103,448 |
| | | 12,517,149 |
| |
| South Africa 5.1% |
| Real Estate 1.2% |
| Growthpoint Properties Ltd. | 2,072,866 | 3,995,738 |
| Retailing 2.3% |
| Woolworths Holdings Ltd. | 1,545,363 | 8,060,692 |
| Telecommunication Services 1.6% |
| MTN Group Ltd. | 593,727 | 5,396,192 |
| | | 17,452,622 |
| |
| Taiwan 13.5% |
| Banks 2.6% |
| Mega Financial Holding Co., Ltd. | 11,013,153 | 8,886,861 |
| Semiconductors & Semiconductor Equipment 6.4% |
| MediaTek, Inc. | 998,000 | 7,071,585 |
| Taiwan Semiconductor Manufacturing Co., Ltd. | 2,428,719 | 15,229,605 |
| | | 22,301,190 |
| Technology Hardware & Equipment 2.4% |
| Asustek Computer, Inc. | 834,000 | 8,245,893 |
| Telecommunication Services 2.1% |
| Taiwan Mobile Co., Ltd. | 1,954,000 | 7,178,674 |
| | | 46,612,618 |
| |
| Thailand 1.8% |
| Banks 1.8% |
| Kasikornbank PCL NVDR | 1,092,900 | 6,014,154 |
| |
| Security | Number
of Shares | Value ($) |
| Turkey 2.1% |
| Banks 1.2% |
| Turkiye Garanti Bankasi A/S | 1,631,603 | 3,978,842 |
| Telecommunication Services 0.9% |
| Turk Telekomunikasyon A/S | 1,955,087 | 3,174,138 |
| | | 7,152,980 |
| |
| United Arab Emirates 1.9% |
| Real Estate 1.9% |
| Emaar Malls PJSC | 8,908,057 | 6,409,799 |
| Total Common Stock |
| (Cost $323,106,340) | | 334,341,233 |
|
| Preferred Stock 2.0% of net assets |
| |
| Brazil 2.0% |
| Materials 2.0% |
| Suzano Papel e Celulose S.A. | 1,663,600 | 7,046,360 |
| Total Preferred Stock |
| (Cost $5,377,025) | | 7,046,360 |
End of Investments.
At 03/31/17, the tax basis cost of the fund's investments was $347,114,678 and the unrealized appreciation and depreciation were $25,912,840 and ($31,639,925), respectively, with a net unrealized depreciation of ($5,727,085).
At 03/31/17, the values of certain foreign securities held by the fund aggregating $268,012,502 were adjusted from their closing market values in accordance with international fair valuation procedures approved by the fund's Board of Trustees. (See financial note 2(a) for additional information).
| * | Non-income producing security. |
| | |
| ADR — | American Depositary Receipt |
| GDR — | Global Depositary Receipt |
| NVDR — | Non-Voting Depositary Receipt |
Laudus Mondrian Funds | Annual Report
Laudus Mondrian Emerging Markets Fund
Portfolio Holdings as of March 31, 2017 (continued)
The following is a summary of the inputs used to value the fund’s investments as of March 31, 2017 (see financial note 2(a) for additional information):
| Description | Quoted Prices in
Active Markets for
Identical Assets
(Level 1) | Other Significant
Observable Inputs
(Level 2) | Significant
Unobservable Inputs
(Level 3) | Total | |
| Common Stock1 | $— | $214,948,185 | $— | $214,948,185 | |
| Brazil 1 | 17,112,225 | — | — | 17,112,225 | |
| India 1 | — | 42,605,470 | — | 42,605,470 | |
| Software & Services | 666,760 | 10,458,847 | — | 11,125,607 | |
| Kazakhstan 1 | 3,343,430 | — | — | 3,343,430 | |
| Mexico 1 | 14,768,252 | — | — | 14,768,252 | |
| Peru 1 | 4,983,753 | — | — | 4,983,753 | |
| Philippines 1 | 6,325,004 | — | — | 6,325,004 | |
| Qatar 1 | 6,612,158 | — | — | 6,612,158 | |
| Russia 1 | 12,517,149 | — | — | 12,517,149 | |
| Preferred Stock | | | | | |
| Brazil 1 | 7,046,360 | — | — | 7,046,360 | |
| Total | $73,375,091 | $268,012,502 | $— | $341,387,593 | |
| 1 | As categorized in Portfolio Holdings. |
The fund’s policy is to recognize transfers between Level 1, Level 2 and Level 3 as of the beginning of the fiscal year. There were security transfers in the amount of $8,818,827 from Level 2 to Level 1 for the period ended March 31, 2017. The transfers between Level 1 and Level 2 were primarily due to the use of international fair valuation by the fund. There were no transfers in or out of Level 3 during the period.
Laudus Mondrian Funds | Annual Report
Laudus Mondrian Emerging Markets Fund
Statement of Assets and Liabilities
As of March 31, 2017
| Assets |
| Investments, at value (cost $328,483,365) | | $341,387,593 |
| Foreign currency, at value (cost $160,661) | | 149,452 |
| Receivables: | | |
| Investments sold | | 6,748,777 |
| Dividends | | 1,043,261 |
| Foreign tax reclaims | | 36,686 |
| Fund shares sold | | 17,860 |
| Prepaid expenses | + | 29,870 |
| Total assets | | 349,413,499 |
| Liabilities |
| Payables: | | |
| Investments bought | | 2,458,075 |
| Due to custodian | | 1,964,062 |
| Investment adviser fees | | 288,652 |
| Foreign capital gains tax | | 60,313 |
| Fund shares redeemed | | 9,832 |
| Distribution and shareholder services fees | | 606 |
| Accrued expenses | + | 207,549 |
| Total liabilities | | 4,989,089 |
| Net Assets |
| Total assets | | 349,413,499 |
| Total liabilities | – | 4,989,089 |
| Net assets | | $344,424,410 |
| Net Assets by Source | | |
| Capital received from investors | | 453,968,055 |
| Distributions in excess of net investment income | | (1,208,817) |
| Net realized capital losses | | (121,203,611) |
| Net unrealized capital appreciation | | 12,868,783 |
| Net Asset Value (NAV) by Shares Class | |
| Share Class | Net Assets | ÷ | Shares
Outstanding | = | NAV |
| Investor Shares | $2,883,764 | | 373,403 | | $7.72 |
| Select Shares | $4,645,036 | | 601,568 | | $7.72 |
| Institutional Shares | $336,895,610 | | 43,702,773 | | $7.71 |
| | | | | | |
Laudus Mondrian Funds | Annual Report
Laudus Mondrian Emerging Markets Fund
Statement of Operations
For the period April 1, 2016 through March 31, 2017
| Investment Income |
| Dividends (net of foreign withholding tax of $1,336,383) | | $12,149,326 |
| Expenses |
| Investment adviser fees | | 3,892,331 |
| Custodian fees | | 563,772 |
| Accounting and administration fees | | 61,831 |
| Professional fees | | 54,470 |
| Registration fees | | 53,954 |
| Transfer agent fees | | 44,530 |
| Independent trustees' fees | | 19,835 |
| Shareholder reports | | 9,326 |
| Distribution and shareholder services fees (Investor Shares) | | 7,791 |
| Interest expense | | 3,351 |
| Sub-accounting and sub-transfer agent fees: | | |
| Investor Shares | | 4,373 |
| Select Shares | | 3,374 |
| Other expenses | + | 45,030 |
| Total expenses | | 4,763,968 |
| Expense reduction by adviser | – | 73,789 |
| Net expenses | – | 4,690,179 |
| Net investment income | | 7,459,147 |
| Realized and Unrealized Gains (Losses) |
| Net realized losses on investments | | (27,799,822) |
| Net realized losses on foreign currency transactions | + | (140,949) |
| Net realized losses | | (27,940,771) |
| Net change in unrealized appreciation (depreciation) on investments (net of change in foreign capital gains tax of ($215,481)) | | 62,251,934 |
| Net change in unrealized appreciation (depreciation) on foreign currency translations | + | (34,056) |
| Net change in unrealized appreciation (depreciation) | + | 62,217,878 |
| Net realized and unrealized gains | | 34,277,107 |
| Increase in net assets resulting from operations | | $41,736,254 |
Laudus Mondrian Funds | Annual Report
Laudus Mondrian Emerging Markets Fund
Statement of Changes in Net Assets
For the current and prior report periods
| Operations | |
| | 4/1/16-3/31/17 | 4/1/15-3/31/16 |
| Net investment income | | $7,459,147 | $8,767,830 |
| Net realized losses | | (27,940,771) | (65,327,921) |
| Net change in unrealized appreciation (depreciation) | + | 62,217,878 | (14,792,601) |
| Increase (decrease) in net assets from operations | | 41,736,254 | (71,352,692) |
| Distributions to Shareholders | |
| Distributions from net investment income | | | |
| Investor Shares | | (66,046) | (29,408) |
| Select Shares | | (112,696) | (74,419) |
| Institutional Shares | + | (9,365,136) | (5,425,809) |
| Total distributions from net investment income | | ($9,543,878) | ($5,529,636) |
| Transactions in Fund Shares | | | |
| | | 4/1/16-3/31/17 | 4/1/15-3/31/16 |
| | | SHARES | VALUE | SHARES | VALUE |
| Shares Sold | | | | | |
| Investor Shares | | 46,601 | $338,038 | 65,801 | $483,685 |
| Select Shares | | 36,751 | 267,197 | 107,904 | 822,947 |
| Institutional Shares | + | 6,004,591 | 43,359,379 | 8,572,939 | 59,514,635 |
| Total shares sold | | 6,087,943 | $43,964,614 | 8,746,644 | $60,821,267 |
| Shares Reinvested | | | | | |
| Investor Shares | | 9,047 | $62,870 | 4,485 | $29,155 |
| Select Shares | | 15,230 | 105,697 | 11,320 | 73,468 |
| Institutional Shares | + | 1,291,515 | 8,950,205 | 811,531 | 5,258,720 |
| Total shares reinvested | | 1,315,792 | $9,118,772 | 827,336 | $5,361,343 |
| Shares Redeemed | | | | | |
| Investor Shares | | (150,769) | ($1,086,698) | (265,059) | ($1,924,472) |
| Select Shares | | (286,761) | (2,091,380) | (559,375) | (4,050,008) |
| Institutional Shares | + | (21,407,200) | (153,322,505) | (19,963,395) | (142,895,727) |
| Total shares redeemed | | (21,844,730) | ($156,500,583) | (20,787,829) | ($148,870,207) |
| Net transactions in fund shares | | (14,440,995) | ($103,417,197) | (11,213,849) | ($82,687,597) |
| Shares Outstanding and Net Assets | | | |
| | | 4/1/16-3/31/17 | 4/1/15-3/31/16 |
| | | SHARES | NET ASSETS | SHARES | NET ASSETS |
| Beginning of period | | 59,118,739 | $415,649,231 | 70,332,588 | $575,219,156 |
| Total decrease | + | (14,440,995) | (71,224,821) | (11,213,849) | (159,569,925) |
| End of period | | 44,677,744 | $344,424,410 | 59,118,739 | $415,649,231 |
| Distributions in excess of net investment income/Net investment income not yet distributed | | | ($1,208,817) | | $846,178 |
Laudus Mondrian Funds | Annual Report
Laudus Mondrian International Government Fixed Income Fund
Financial Statements
Financial Highlights
| | 4/1/16–
3/31/17 | 4/1/15–
3/31/16 | 4/1/14–
3/31/15 | 4/1/13–
3/31/14 | 4/1/12–
3/31/13 | |
| Per-Share Data |
| Net asset value at beginning of period | $9.93 | $9.45 | $10.89 | $11.01 | $11.61 | |
| Income (loss) from investment operations: | | | | | | |
| Net investment income (loss) | 0.09 1 | 0.11 1 | 0.15 1 | 0.16 1 | 0.15 | |
| Net realized and unrealized gains (losses) | (0.64) | 0.56 | (1.14) | (0.21) | (0.53) | |
| Total from investment operations | (0.55) | 0.67 | (0.99) | (0.05) | (0.38) | |
| Less distributions: | | | | | | |
| Distributions from net investment income | (0.00) 2 | — | — | — | (0.15) | |
| Distributions from net realized gains | (0.06) | (0.19) | (0.45) | (0.07) | (0.07) | |
| Total distributions | (0.06) | (0.19) | (0.45) | (0.07) | (0.22) | |
| Net asset value at end of period | $9.32 | $9.93 | $9.45 | $10.89 | $11.01 | |
| Total return | (5.48%) | 7.27% | (9.37%) | (0.49%) | (3.41%) | |
| Ratios/Supplemental Data |
| Ratios to average net assets: | | | | | | |
| Net operating expenses | 0.75% | 0.75% | 0.74% | 0.69% | 0.69% | |
| Gross operating expenses | 0.79% | 0.81% | 0.76% | 0.69% | 0.69% | |
| Net investment income (loss) | 0.87% | 1.21% | 1.39% | 1.48% | 1.27% | |
| Portfolio turnover rate | 98% | 31% | 50% | 52% | 44% | |
| Net assets, end of period (x 1,000) | $95,565 | $119,938 | $187,388 | $652,647 | $741,235 | |
| |
1
Calculated based on the average shares outstanding during the period.
2
Per-share amount was less than $0.005.
Laudus Mondrian Funds | Annual Report
Laudus Mondrian International Government Fixed Income Fund
Portfolio Holdings as of March 31, 2017
This section shows all the securities in the fund's portfolio and their values as of the report date.
The fund files its complete schedule of portfolio holdings with the SEC for the first and third quarters of each fiscal year on Form N-Q. The fund's Form N-Q is available on the SEC's website at www.sec.gov and may be viewed and copied at the SEC's Public Reference Room in Washington, D.C. Call 1-800-SEC-0330 for information on the operation of the Public Reference Room. The fund also makes available its complete schedule of portfolio holdings 15-20 days after calendar quarters on the fund's website at www.csimfunds.com/laudusfunds_prospectus.
For fixed-rate obligations, the rate shown is the interest rate (the rate established when the obligation was issued). For variable-rate obligations, the rate shown is the rate as of the report date. The maturity date shown for all the securities is the final legal maturity.
| Holdings by Category | Cost ($) | Value ($) |
| 88.5% | Government Bonds | 85,987,029 | 84,575,660 |
| 14.5% | Supranational | 15,333,719 | 13,831,015 |
| 1.5% | Other Investment Company | 1,453,618 | 1,453,618 |
| 104.5% | Total Investments | 102,774,366 | 99,860,293 |
| (4.5%) | Other Assets and Liabilities, Net | | (4,294,869) |
| 100.0% | Net Assets | | 95,565,424 |
Security
Rate, Maturity Date | Face Amount
(local currency) | Value ($) |
| Government Bonds 88.5% of net assets |
| |
| Australia 6.1% |
| Australia Government Bond |
| 5.75%, 05/15/21 (AUD) | 1,000,000 | 874,089 |
| 3.25%, 04/21/25 (AUD) | 1,650,000 | 1,322,134 |
| 4.75%, 04/21/27 (AUD) | 4,000,000 | 3,605,804 |
| | | 5,802,027 |
| |
| Austria 4.5% |
| Austria Government Bond |
| 6.25%, 07/15/27 (EUR) | 2,563,000 | 4,312,086 |
| |
| Canada 3.1% |
| Canada Government International Bond |
| 3.50%, 01/13/20 (EUR) | 2,540,000 | 2,997,832 |
| |
| France 8.3% |
| France Government Bond OAT |
| 0.00%, 05/25/20 (EUR) (a) | 2,365,000 | 2,546,236 |
| 0.50%, 05/25/25 (EUR) | 1,000,000 | 1,050,468 |
| 5.75%, 10/25/32 (EUR) | 775,000 | 1,329,528 |
| 1.25%, 05/25/36 (EUR) | 850,000 | 845,135 |
| 3.25%, 05/25/45 (EUR) | 1,560,000 | 2,123,313 |
| | | 7,894,680 |
| |
| Germany 2.0% |
| Bundesobligation |
| 0.00%, 10/08/21 (EUR) (a) | 200,000 | 218,029 |
| Bundesrepublik Deutschland |
| 0.00%, 08/15/26 (EUR) (a) | 1,600,000 | 1,666,771 |
| | | 1,884,800 |
| |
| Japan 20.2% |
| Japan Government Ten Year Bond |
| 0.60%, 03/20/24 (JPY) | 136,000,000 | 1,277,636 |
| 0.10%, 06/20/26 (JPY) | 312,000,000 | 2,818,792 |
Security
Rate, Maturity Date | Face Amount
(local currency) | Value ($) |
| Japan Government Thirty Year Bond |
| 2.40%, 12/20/34 (JPY) | 275,000,000 | 3,261,414 |
| 1.70%, 03/20/44 (JPY) | 306,400,000 | 3,361,422 |
| 0.30%, 06/20/46 (JPY) | 180,000,000 | 1,400,681 |
| Japan Government Twenty Year Bond |
| 1.60%, 06/20/30 (JPY) | 219,000,000 | 2,315,385 |
| 0.20%, 06/20/36 (JPY) | 590,000,000 | 4,913,222 |
| | | 19,348,552 |
| |
| Malaysia 3.3% |
| Malaysia Government Bond |
| 4.05%, 09/30/21 (MYR) | 4,200,000 | 957,663 |
| 4.18%, 07/15/24 (MYR) | 8,980,000 | 2,037,363 |
| 4.25%, 05/31/35 (MYR) | 670,000 | 144,267 |
| | | 3,139,293 |
| |
| Mexico 5.1% |
| Mexico Government Bond |
| 6.50%, 06/10/21 (MXN) | 33,000,000 | 1,742,250 |
| 7.50%, 06/03/27 (MXN) | 20,500,000 | 1,126,593 |
| 7.75%, 11/23/34 (MXN) | 36,280,000 | 2,007,601 |
| | | 4,876,444 |
| |
| Netherlands 4.9% |
| Netherlands Government Bond |
| 5.50%, 01/15/28 (EUR) | 2,908,490 | 4,716,084 |
| |
| New Zealand 4.8% |
| New Zealand Government Bond |
| 5.00%, 03/15/19 (NZD) | 200,000 | 147,800 |
| 5.50%, 04/15/23 (NZD) | 1,605,000 | 1,293,920 |
| 4.50%, 04/15/27 (NZD) | 4,059,000 | 3,163,139 |
| | | 4,604,859 |
| |
| Poland 5.0% |
| Poland Government Bond |
| 1.50%, 04/25/20 (PLN) | 3,120,000 | 768,258 |
| 2.50%, 07/25/26 (PLN) | 7,650,000 | 1,797,577 |
| 5.75%, 04/25/29 (PLN) | 7,100,000 | 2,184,051 |
| | | 4,749,886 |
| |
| Spain 12.8% |
| Spain Government Bond |
| 1.40%, 01/31/20 (EUR) | 4,400,000 | 4,892,772 |
| 1.60%, 04/30/25 (EUR) | 4,700,000 | 5,137,649 |
| 4.20%, 01/31/37 (EUR) | 1,613,000 | 2,181,678 |
| | | 12,212,099 |
| |
Laudus Mondrian Funds | Annual Report
Laudus Mondrian International Government Fixed Income Fund
Portfolio Holdings as of March 31, 2017 (continued)
Security
Rate, Maturity Date | Face Amount
(local currency) | Value ($) |
| Sweden 4.9% |
| Sweden Government Bond |
| 3.75%, 08/12/17 (SEK) | 23,485,000 | 2,662,786 |
| 5.00%, 12/01/20 (SEK) | 15,100,000 | 2,014,524 |
| | | 4,677,310 |
| |
| United Kingdom 3.5% |
| United Kingdom Gilt |
| 1.75%, 07/22/19 (GBP) | 700,000 | 910,145 |
| 3.75%, 09/07/21 (GBP) | 985,000 | 1,419,904 |
| 2.75%, 09/07/24 (GBP) | 720,000 | 1,029,659 |
| | | 3,359,708 |
| Total Government Bonds |
| (Cost $85,987,029) | | 84,575,660 |
|
| Supranational* 14.5% of net assets |
| Asian Development Bank |
| 2.35%, 06/21/27 (JPY) | 440,000,000 | 4,923,739 |
| European Investment Bank |
| 1.40%, 06/20/17 (JPY) | 490,000,000 | 4,412,531 |
| Nordic Investment Bank |
| 1.70%, 04/27/17 (JPY) | 500,000,000 | 4,494,745 |
| Total Supranational |
| (Cost $15,333,719) | | 13,831,015 |
| Security | Number
of Shares | Value ($) |
| Other Investment Company 1.5% of net assets |
| |
| United States 1.5% |
| State Street Institutional U.S. Government Money Market Fund, Premier Class 0.62% (b) | 1,453,618 | 1,453,618 |
| Total Other Investment Company |
| (Cost $1,453,618) | | 1,453,618 |
End of Investments.
At 03/31/17, the tax basis cost of the fund's investments was $104,679,816 and the unrealized appreciation and depreciation were $1,665,135 and ($6,484,658), respectively, with a net unrealized depreciation of ($4,819,523).
| * | Supranational bonds represent the debt of international organizations or institutions such as the World Bank, the International Monetary Fund, regional multilateral development banks and others. |
| (a) | Zero Coupon Bond. |
| (b) | The rate shown is the 7-day yield. |
| | |
| AUD — | Australian dollar |
| EUR — | euro currency |
| GBP — | Great British pound |
| JPY — | Japanese yen |
| MXN — | Mexican peso |
| MYR — | Malaysian ringgit |
| NZD — | New Zealand dollar |
| PLN — | Polish zloty |
| SEK — | Swedish krona |
| USD — | U.S. dollar |
Laudus Mondrian Funds | Annual Report
Laudus Mondrian International Government Fixed Income Fund
Portfolio Holdings as of March 31, 2017 (continued)
In addition to the above, the fund held the following at 03/31/17:
| Expiration Date | Counterparty | Currency
to be
Received | Amount of
Currency
to be
Received | Currency
to be
Delivered | Amount of
Currency
to be
Delivered | Unrealized
Appreciation
(Depreciation)
($) |
| Forward Foreign Currency Exchange Contracts | | | | | | |
| 04/27/2017 | State Street Bank & Trust Co. | GBP | 4,763,500 | USD | 5,964,169 | 7,228 |
| 04/27/2017 | State Street Bank & Trust Co. | GBP | 185,500 | USD | 230,809 | 1,729 |
| 04/27/2017 | State Street Bank & Trust Co. | GBP | 289,000 | USD | 366,147 | (3,864) |
| 04/27/2017 | State Street Bank & Trust Co. | GBP | 4,173,500 | USD | 5,207,071 | 24,717 |
| 04/27/2017 | State Street Bank & Trust Co. | NZD | 66,000 | USD | 47,751 | (1,513) |
| 04/27/2017 | State Street Bank & Trust Co. | NZD | 399,500 | USD | 286,965 | (7,082) |
| 04/27/2017 | State Street Bank & Trust Co. | USD | 5,807,721 | AUD | 7,609,000 | (3,150) |
| 04/27/2017 | State Street Bank & Trust Co. | USD | 238,771 | GBP | 191,000 | (662) |
| 04/27/2017 | State Street Bank & Trust Co. | USD | 236,679 | GBP | 188,500 | 380 |
| 04/27/2017 | State Street Bank & Trust Co. | USD | 378,522 | GBP | 300,500 | 1,823 |
| 04/27/2017 | State Street Bank & Trust Co. | USD | 55,331 | NZD | 77,000 | 1,386 |
| 04/27/2017 | State Street Bank & Trust Co. | USD | 4,986,611 | NZD | 6,959,000 | 111,243 |
| Net Unrealized Appreciation on Forward Foreign Currency Exchange Contracts | 132,235 |
The following is a summary of the inputs used to value the fund’s investments as of March 31, 2017 (see financial note 2(a) for additional information):
Assets Valuation Input
| Description | Quoted Prices in
Active Markets for
Identical Assets
(Level 1) | Other Significant
Observable Inputs
(Level 2) | Significant
Unobservable Inputs
(Level 3) | Total | |
| Government Bonds1 | $— | $84,575,660 | $— | $84,575,660 | |
| Supranational | — | 13,831,015 | — | 13,831,015 | |
| Other Investment Company1 | 1,453,618 | — | — | 1,453,618 | |
| Total | $1,453,618 | $98,406,675 | $— | $99,860,293 | |
| Other Financial Instruments | | | | | |
| Forward Foreign Currency Exchange Contracts2 | $— | $148,506 | $— | $148,506 | |
Liabilities Valuation Input
| | | | | |
| | | | | |
| Other Financial Instruments | | | | | |
| Forward Foreign Currency Exchange Contracts2 | $— | ($16,271) | $— | ($16,271) | |
| 1 | As categorized in Portfolio Holdings. |
| 2 | Forward foreign currency exchange contracts are not included in Investments in the schedule of portfolio holdings and are valued at unrealized appreciation or depreciation. |
The fund’s policy is to recognize transfers between Level 1, Level 2 and Level 3 as of the beginning of the fiscal year. There were no transfers between Level 1, Level 2 and Level 3 for the period ended March 31, 2017.
Laudus Mondrian Funds | Annual Report
Laudus Mondrian International Government Fixed Income Fund
Statement of Assets and Liabilities
As of March 31, 2017
| Assets |
| Investments, at value (cost $102,774,366) | | $99,860,293 |
| Foreign currency, at value (cost $61,616) | | 61,628 |
| Receivables: | | |
| Interest | | 1,011,921 |
| Fund shares sold | | 11,268 |
| Dividends | | 613 |
| Unrealized appreciation on forward foreign currency exchange contracts | | 148,506 |
| Prepaid expenses | + | 11,115 |
| Total assets | | 101,105,344 |
| Liabilities |
| Payables: | | |
| Fund shares redeemed | | 5,349,852 |
| Investment adviser fees | | 57,539 |
| Unrealized depreciation on forward foreign currency exchange contracts | | 16,271 |
| Accrued expenses | + | 116,258 |
| Total liabilities | | 5,539,920 |
| Net Assets |
| Total assets | | 101,105,344 |
| Total liabilities | – | 5,539,920 |
| Net assets | | $95,565,424 |
| Net Assets by Source | | |
| Capital received from investors | | 103,579,418 |
| Net investment loss | | (4,835,789) |
| Net realized capital losses | | (404,934) |
| Net unrealized capital depreciation | | (2,773,271) |
| Net Asset Value (NAV) |
| Net Assets | ÷ | Shares
Outstanding | = | NAV |
| $95,565,424 | | 10,248,493 | | $9.32 |
| | | | | |
Laudus Mondrian Funds | Annual Report
Laudus Mondrian International Government Fixed Income Fund
Statement of Operations
For the period April 1, 2016 through March 31, 2017
| Investment Income |
| Dividends | | $5,777 |
| Interest | + | 2,101,270 |
| Total investment income | | 2,107,047 |
| Expenses |
| Investment adviser fees | | 781,119 |
| Professional fees | | 60,745 |
| Custodian fees | | 56,926 |
| Transfer agent fees | | 55,473 |
| Accounting and administration fees | | 21,901 |
| Registration fees | | 21,350 |
| Independent trustees' fees | | 14,048 |
| Shareholder reports | | 11,527 |
| Interest expense | | 1,520 |
| Other expenses | + | 5,682 |
| Total expenses | | 1,030,291 |
| Expense reduction by adviser | – | 52,325 |
| Net expenses | – | 977,966 |
| Net investment income | | 1,129,081 |
| Realized and Unrealized Gains (Losses) |
| Net realized losses on investments | | (4,197,819) |
| Net realized losses on foreign currency transactions | + | (615,193) |
| Net realized losses | | (4,813,012) |
| Net change in unrealized appreciation (depreciation) on investments | | (4,088,284) |
| Net change in unrealized appreciation (depreciation) on foreign currency translations | + | 162,819 |
| Net change in unrealized appreciation (depreciation) | + | (3,925,465) |
| Net realized and unrealized losses | | (8,738,477) |
| Decrease in net assets resulting from operations | | ($7,609,396) |
Laudus Mondrian Funds | Annual Report
Laudus Mondrian International Government Fixed Income Fund
Statement of Changes in Net Assets
For the current and prior report periods
| Operations | |
| | 4/1/16-3/31/17 | 4/1/15-3/31/16 |
| Net investment income | | $1,129,081 | $1,753,040 |
| Net realized losses | | (4,813,012) | (11,732,258) |
| Net change in unrealized appreciation (depreciation) | + | (3,925,465) | 17,935,563 |
| Increase (decrease) in net assets from operations | | (7,609,396) | 7,956,345 |
| Distributions to Shareholders | |
| Distributions from net investment income | | (14,676) | — |
| Distributions from net realized gains | + | (761,942) | (2,596,705) |
| Total distributions | | ($776,618) | ($2,596,705) |
| Transactions in Fund Shares | | | |
| | | 4/1/16-3/31/17 | 4/1/15-3/31/16 |
| | | SHARES | VALUE | SHARES | VALUE |
| Shares sold | | 8,151,717 | $81,286,242 | 2,097,487 | $19,711,390 |
| Shares reinvested | | 56,636 | 506,323 | 203,273 | 1,843,682 |
| Shares redeemed | + | (10,038,045) | (97,779,218) | (10,046,401) | (94,364,938) |
| Net transactions in fund shares | | (1,829,692) | ($15,986,653) | (7,745,641) | ($72,809,866) |
| Shares Outstanding and Net Assets | | | |
| | | 4/1/16-3/31/17 | 4/1/15-3/31/16 |
| | | SHARES | NET ASSETS | SHARES | NET ASSETS |
| Beginning of period | | 12,078,185 | $119,938,091 | 19,823,826 | $187,388,317 |
| Total decrease | + | (1,829,692) | (24,372,667) | (7,745,641) | (67,450,226) |
| End of period | | 10,248,493 | $95,565,424 | 12,078,185 | $119,938,091 |
| Net investment loss | | | ($4,835,789) | | ($3,194,113) |
Laudus Mondrian Funds | Annual Report
Laudus Mondrian Global Government Fixed Income Fund
Financial Statements
Financial Highlights
| | 4/1/16–
3/31/17 | 4/1/15–
3/31/16 | 4/1/14–
3/31/15 | 4/1/13–
3/31/14 | 7/10/12 1–
3/31/13 | |
| Per-Share Data |
| Net asset value at beginning of period | $9.16 | $8.71 | $9.30 | $9.61 | $10.00 | |
| Income (loss) from investment operations: | | | | | | |
| Net investment income (loss) | 0.21 2 | 0.19 2 | 0.17 2 | 0.13 2 | 0.11 | |
| Net realized and unrealized gains (losses) | (0.36) | 0.26 | (0.76) | (0.38) | (0.40) | |
| Total from investment operations | (0.15) | 0.45 | (0.59) | (0.25) | (0.29) | |
| Less distributions: | | | | | | |
| Distributions from net investment income | — | — | — | (0.03) | (0.09) | |
| Distributions from net realized gains | — | — | — | (0.03) | (0.01) | |
| Total distributions | — | — | — | (0.06) | (0.10) | |
| Net asset value at end of period | $9.01 | $9.16 | $8.71 | $9.30 | $9.61 | |
| Total return | (1.64%) | 5.17% | (6.34%) | (2.60%) | (2.95%) 3 | |
| Ratios/Supplemental Data |
| Ratios to average net assets: | | | | | | |
| Net operating expenses | 0.85% | 0.86% 4 | 0.85% | 0.85% | 0.22% 5,6 | |
| Gross operating expenses | 2.32% | 2.24% | 1.76% | 1.74% | 1.28% 5 | |
| Net investment income (loss) | 2.29% | 2.22% | 1.80% | 1.40% | 1.56% 5 | |
| Portfolio turnover rate | 63% | 42% | 62% | 42% | 73% 3 | |
| Net assets, end of period (x 1,000) | $7,911 | $9,279 | $13,394 | $18,575 | $29,074 | |
| |
1
Commencement of operations.
2
Calculated based on the average shares outstanding during the period.
3
Not annualized.
4
The ratio of net operating expenses would have been 0.85% if certain non-routine expenses had not been incurred.
5
Annualized.
6
Effective July 11, 2012 through January 10, 2013, the net operating expense limitation was 0.00%. The ratio presented for the period ended 3/31/13 is a blended ratio.
Laudus Mondrian Funds | Annual Report
Laudus Mondrian Global Government Fixed Income Fund
Portfolio Holdings as of March 31, 2017
This section shows all the securities in the fund's portfolio and their values as of the report date.
The fund files its complete schedule of portfolio holdings with the SEC for the first and third quarters of each fiscal year on Form N-Q. The fund's Form N-Q is available on the SEC's website at www.sec.gov and may be viewed and copied at the SEC's Public Reference Room in Washington, D.C. Call 1-800-SEC-0330 for information on the operation of the Public Reference Room. The fund also makes available its complete schedule of portfolio holdings 15-20 days after calendar quarters on the fund's website at www.csimfunds.com/laudusfunds_prospectus.
For fixed rate obligations, the rate shown is the interest rate (the rate established when the obligation was issued). For variable-rate obligations, the rate shown is the rate as of the report date. The maturity date shown for all the securities is the final legal maturity.
| Holdings by Category | Cost ($) | Value ($) |
| 69.7% | Government Bonds | 5,709,867 | 5,512,619 |
| 29.3% | U.S. Government Securities | 2,316,524 | 2,318,518 |
| 1.0% | Other Investment Company | 76,426 | 76,426 |
| 100.0% | Total Investments | 8,102,817 | 7,907,563 |
| 0.0% | Other Assets and Liabilities, Net | | 2,967 |
| 100.0% | Net Assets | | 7,910,530 |
Security
Rate, Maturity Date | Face Amount
(local currency) | Value ($) |
| Government Bonds 69.7% of net assets |
| |
| Australia 3.6% |
| Australia Government Bond |
| 5.75%, 05/15/21 (AUD) | 95,000 | 83,038 |
| 3.25%, 04/21/25 (AUD) | 150,000 | 120,194 |
| 4.75%, 04/21/27 (AUD) | 90,000 | 81,131 |
| | | 284,363 |
| |
| Brazil 3.0% |
| Brazil Notas do Tesouro Nacional |
| 10.00%, 01/01/23 (BRL) | 160,000 | 51,356 |
| 10.00%, 01/01/25 (BRL) | 404,000 | 129,266 |
| 10.00%, 01/01/27 (BRL) | 166,000 | 53,009 |
| | | 233,631 |
| |
| Chile 1.1% |
| Bonos de la Tesoreria de la Republica en pesos |
| 4.50%, 02/28/21 (CLP) | 55,000,000 | 86,362 |
| |
| Colombia 1.6% |
| Colombian TES |
| 5.00%, 11/21/18 (COP) | 151,000,000 | 51,880 |
| 10.00%, 07/24/24 (COP) | 3,000,000 | 1,254 |
| 6.00%, 04/28/28 (COP) | 230,000,000 | 75,638 |
| | | 128,772 |
| |
| France 5.0% |
| France Government Bond OAT |
| 0.00%, 05/25/20 (EUR) (a) | 117,100 | 126,074 |
| 3.00%, 04/25/22 (EUR) | 13,100 | 16,031 |
| 0.50%, 05/25/25 (EUR) | 192,000 | 201,690 |
| 4.75%, 04/25/35 (EUR) | 31,400 | 50,397 |
| | | 394,192 |
| |
| Hungary 0.8% |
| Hungary Government Bond |
| 6.50%, 06/24/19 (HUF) | 16,150,000 | 63,488 |
| |
Security
Rate, Maturity Date | Face Amount
(local currency) | Value ($) |
| Indonesia 0.8% |
| Indonesia Treasury Bond |
| 8.38%, 09/15/26 (IDR) | 260,000,000 | 21,238 |
| 8.38%, 03/15/34 (IDR) | 540,000,000 | 43,037 |
| | | 64,275 |
| |
| Japan 16.1% |
| Japan Government Five Year Bond |
| 0.10%, 06/20/21 (JPY) | 15,500,000 | 140,676 |
| Japan Government Ten Year Bond |
| 1.40%, 03/20/18 (JPY) | 11,450,000 | 104,508 |
| 0.80%, 09/20/20 (JPY) | 22,900,000 | 212,554 |
| 0.60%, 03/20/24 (JPY) | 27,000,000 | 253,648 |
| 0.10%, 06/20/26 (JPY) | 11,650,000 | 105,253 |
| Japan Government Thirty Year Bond |
| 1.70%, 03/20/44 (JPY) | 22,200,000 | 243,550 |
| Japan Government Twenty Year Bond |
| 0.20%, 06/20/36 (JPY) | 25,900,000 | 215,682 |
| | | 1,275,871 |
| |
| Malaysia 6.5% |
| Malaysia Government Bond |
| 3.31%, 10/31/17 (MYR) | 410,000 | 92,664 |
| 3.76%, 03/15/19 (MYR) | 220,000 | 49,961 |
| 3.62%, 11/30/21 (MYR) | 130,000 | 29,068 |
| 3.42%, 08/15/22 (MYR) | 120,000 | 26,451 |
| 3.80%, 09/30/22 (MYR) | 100,000 | 22,421 |
| 3.80%, 08/17/23 (MYR) | 210,000 | 46,834 |
| 4.18%, 07/15/24 (MYR) | 432,000 | 98,011 |
| 3.96%, 09/15/25 (MYR) | 682,000 | 151,559 |
| | | 516,969 |
| |
| Mexico 7.4% |
| Mexico Government Bond |
| 4.75%, 06/14/18 (MXN) | 1,000,000 | 52,347 |
| 6.50%, 06/10/21 (MXN) | 3,484,000 | 183,940 |
| 8.00%, 12/07/23 (MXN) | 2,420,000 | 136,376 |
| 7.50%, 06/03/27 (MXN) | 1,370,000 | 75,289 |
| 10.00%, 11/20/36 (MXN) | 1,975,000 | 133,427 |
| | | 581,379 |
| |
| New Zealand 3.1% |
| New Zealand Government Bond |
| 5.50%, 04/15/23 (NZD) | 243,000 | 195,902 |
| 4.50%, 04/15/27 (NZD) | 66,000 | 51,433 |
| | | 247,335 |
| |
Laudus Mondrian Funds | Annual Report
Laudus Mondrian Global Government Fixed Income Fund
Portfolio Holdings as of March 31, 2017 (continued)
Security
Rate, Maturity Date | Face Amount
(local currency) | Value ($) |
| Peru 1.2% |
| Peru Government Bond |
| 6.95%, 08/12/31 (PEN) | 95,000 | 31,436 |
| 6.90%, 08/12/37 (PEN) | 160,000 | 52,756 |
| 6.85%, 02/12/42 (PEN) | 20,000 | 6,482 |
| | | 90,674 |
| |
| Poland 6.5% |
| Poland Government Bond |
| 2.50%, 07/25/18 (PLN) | 95,000 | 24,233 |
| 1.50%, 04/25/20 (PLN) | 400,000 | 98,495 |
| 5.25%, 10/25/20 (PLN) | 170,000 | 46,914 |
| 2.00%, 04/25/21 (PLN) | 150,000 | 36,924 |
| 5.75%, 09/23/22 (PLN) | 240,000 | 69,040 |
| 2.50%, 07/25/26 (PLN) | 148,000 | 34,777 |
| 5.75%, 04/25/29 (PLN) | 670,000 | 206,101 |
| | | 516,484 |
| |
| Russia 1.7% |
| Russian Federal Bond — OFZ |
| 7.50%, 08/18/21 (RUB) | 500,000 | 8,786 |
| 7.00%, 08/16/23 (RUB) | 2,000,000 | 34,080 |
| 8.15%, 02/03/27 (RUB) | 4,900,000 | 89,616 |
| | | 132,482 |
| |
| South Africa 1.9% |
| South Africa Government Bond |
| 7.75%, 02/28/23 (ZAR) | 400,000 | 29,076 |
| 10.50%, 12/21/26 (ZAR) | 500,000 | 41,245 |
| 8.25%, 03/31/32 (ZAR) | 530,000 | 35,880 |
| 6.25%, 03/31/36 (ZAR) | 800,000 | 42,486 |
| | | 148,687 |
| |
| Spain 5.6% |
| Spain Government Bond |
| 5.85%, 01/31/22 (EUR) | 137,000 | 184,349 |
| 1.60%, 04/30/25 (EUR) | 142,000 | 155,223 |
| 4.20%, 01/31/37 (EUR) | 77,000 | 104,147 |
| | | 443,719 |
| |
| Turkey 3.8% |
| Turkey Government Bond |
| 6.30%, 02/14/18 (TRY) | 427,000 | 113,463 |
| 8.70%, 07/11/18 (TRY) | 365,000 | 97,792 |
| 10.50%, 01/15/20 (TRY) | 125,000 | 34,169 |
| 10.70%, 02/17/21 (TRY) | 110,000 | 30,024 |
| 9.20%, 09/22/21 (TRY) | 110,000 | 28,488 |
| | | 303,936 |
| Total Government Bonds |
| (Cost $5,709,867) | | 5,512,619 |
|
| U.S. Government Securities 29.3% of net assets |
| |
| United States 29.3% |
| U.S. Treasury Bond |
| 3.38%, 05/15/44 (USD) | 330,000 | 352,243 |
Security
Rate, Maturity Date | Face Amount
(local currency) | Value ($) |
| U.S. Treasury Notes |
| 3.63%, 08/15/19 (USD) | 230,000 | 242,259 |
| 2.13%, 08/31/20 (USD) | 243,000 | 246,863 |
| 3.63%, 02/15/21 (USD) | 494,300 | 529,297 |
| 2.13%, 08/15/21 (USD) | 275,000 | 278,287 |
| 2.50%, 08/15/23 (USD) | 119,100 | 121,531 |
| 2.50%, 05/15/24 (USD) | 413,600 | 421,088 |
| 1.63%, 02/15/26 (USD) | 135,000 | 126,950 |
| Total U.S. Government Securities |
| (Cost $2,316,524) | | 2,318,518 |
| Security | Number
of Shares | Value ($) |
| Other Investment Company 1.0% of net assets |
| |
| United States 1.0% |
| State Street Institutional U.S. Government Money Market Fund, Premier Class 0.62% (b) | 76,426 | 76,426 |
| Total Other Investment Company |
| (Cost $76,426) | | 76,426 |
End of Investments.
At 03/31/17, the tax basis cost of the fund's investments was $8,219,761 and the unrealized appreciation and depreciation were $216,515 and ($528,713), respectively, with a net unrealized depreciation of ($312,198).
| (a) | Zero Coupon Bond. |
| (b) | The rate shown is the 7-day yield. |
| | |
| AUD — | Australian dollar |
| BRL — | Brazilian real |
| CLP — | Chilean peso |
| COP — | Colombian peso |
| EUR — | euro currency |
| GBP — | Great British pound |
| HUF — | Hungarian forint |
| IDR — | Indonesian rupiah |
| JPY — | Japanese yen |
| MXN — | Mexican peso |
| MYR — | Malaysian ringgit |
| NZD — | New Zealand dollar |
| PEN — | Peruvian nuevo sol |
| PLN — | Polish zloty |
| RUB — | Russian ruble |
| SEK — | Swedish krona |
| TRY — | Turkish lira |
| USD — | U.S. dollar |
| ZAR — | South African rand |
Laudus Mondrian Funds | Annual Report
Laudus Mondrian Global Government Fixed Income Fund
Portfolio Holdings as of March 31, 2017 (continued)
In addition to the above, the fund held the following at 03/31/17:
| Expiration Date | Counterparty | Currency
to be
Received | Amount of
Currency
to be
Received | Currency
to be
Delivered | Amount of
Currency
to be
Delivered | Unrealized
Appreciation
(Depreciation)
($) |
| Forward Foreign Currency Exchange Contracts | | | | | | |
| 04/27/2017 | Barclays Capital, Inc. | CLP | 27,695,500 | USD | 41,979 | (57) |
| 04/27/2017 | Barclays Capital, Inc. | USD | 43,127 | CLP | 27,695,500 | 1,205 |
| 04/27/2017 | State Street Bank & Trust Co. | EUR | 484,500 | USD | 522,041 | (4,644) |
| 04/27/2017 | State Street Bank & Trust Co. | EUR | 127,000 | USD | 136,074 | (451) |
| 04/27/2017 | State Street Bank & Trust Co. | GBP | 533,000 | USD | 665,398 | 2,757 |
| 04/27/2017 | State Street Bank & Trust Co. | SEK | 3,222,500 | USD | 365,886 | (5,873) |
| 04/27/2017 | State Street Bank & Trust Co. | USD | 284,318 | AUD | 372,500 | (154) |
| 04/27/2017 | State Street Bank & Trust Co. | USD | 32,085 | EUR | 30,000 | 48 |
| 04/27/2017 | State Street Bank & Trust Co. | USD | 253,136 | NZD | 353,000 | 5,830 |
| 04/27/2017 | State Street Bank & Trust Co. | USD | 2,456 | NZD | 3,500 | 4 |
| Net Unrealized Depreciation on Forward Foreign Currency Exchange Contracts | (1,335) |
The following is a summary of the inputs used to value the fund’s investments as of March 31, 2017 (see financial note 2(a) for additional information):
Assets Valuation Input
| Description | Quoted Prices in
Active Markets for
Identical Assets
(Level 1) | Other Significant
Observable Inputs
(Level 2) | Significant
Unobservable Inputs
(Level 3) | Total | |
| Government Bonds1 | $— | $5,512,619 | $— | $5,512,619 | |
| U.S. Government Securities1 | — | 2,318,518 | — | 2,318,518 | |
| Other Investment Company1 | 76,426 | — | — | 76,426 | |
| Total | $76,426 | $7,831,137 | $— | $7,907,563 | |
| Other Financial Instruments | | | | | |
| Forward Foreign Currency Exchange Contracts2 | $— | $9,844 | $— | $9,844 | |
Liabilities Valuation Input
| | | | | |
| | | | | |
| Other Financial Instruments | | | | | |
| Forward Foreign Currency Exchange Contracts2 | $— | ($11,179) | $— | ($11,179) | |
| 1 | As categorized in Portfolio Holdings. |
| 2 | Forward foreign currency exchange contracts are not included in Investments in the schedule of portfolio holdings and are valued at unrealized appreciation or depreciation. |
The fund’s policy is to recognize transfers between Level 1, Level 2 and Level 3 as of the beginning of the fiscal year. There were no transfers between Level 1, Level 2 and Level 3 for the period ended March 31, 2017.
Laudus Mondrian Funds | Annual Report
Laudus Mondrian Global Government Fixed Income Fund
Statement of Assets and Liabilities
As of March 31, 2017
| Assets |
| Investments, at value (cost $8,102,817) | | $7,907,563 |
| Foreign currency, at value (cost $4,628) | | 4,569 |
| Receivables: | | |
| Investments sold | | 8,887 |
| Interest | | 82,407 |
| Due from investment adviser | | 211 |
| Dividends | | 43 |
| Unrealized appreciation on forward foreign currency exchange contracts | | 9,844 |
| Prepaid expenses | + | 6,133 |
| Total assets | | 8,019,657 |
| Liabilities |
| Payables: | | |
| Fund shares redeemed | | 9,019 |
| Foreign capital gains tax | | 2,119 |
| Unrealized depreciation on forward foreign currency exchange contracts | | 11,179 |
| Accrued expenses and other liabilities | + | 86,810 |
| Total liabilities | | 109,127 |
| Net Assets |
| Total assets | | 8,019,657 |
| Total liabilities | – | 109,127 |
| Net assets | | $7,910,530 |
| Net Assets by Source | | |
| Capital received from investors | | 8,435,925 |
| Net investment loss | | (301,749) |
| Net realized capital losses | | (26,231) |
| Net unrealized capital depreciation | | (197,415) |
| Net Asset Value (NAV) |
| Net Assets | ÷ | Shares
Outstanding | = | NAV |
| $7,910,530 | | 877,822 | | $9.01 |
| | | | | |
Laudus Mondrian Funds | Annual Report
Laudus Mondrian Global Government Fixed Income Fund
Statement of Operations
For the period April 1, 2016 through March 31, 2017
| Investment Income |
| Dividends | | $325 |
| Interest (net of foreign withholding taxes of $2,894) | + | 275,703 |
| Total investment income | | 276,028 |
| Expenses |
| Investment adviser fees | | 59,746 |
| Professional fees | | 56,514 |
| Accounting and administration fees | | 23,105 |
| Registration fees | | 18,908 |
| Independent trustees' fees | | 11,416 |
| Custodian fees | | 11,031 |
| Sub-accounting and sub-transfer agent fees | | 8,493 |
| Shareholder reports | | 8,143 |
| Transfer agent fees | | 3,014 |
| Interest expense | | 33 |
| Other expenses | + | 3,819 |
| Total expenses | | 204,222 |
| Expense reduction by adviser | – | 129,308 |
| Net expenses | – | 74,914 |
| Net investment income | | 201,114 |
| Realized and Unrealized Gains (Losses) |
| Net realized losses on investments (net of foreign capital gain tax paid of $1,422) | | (190,033) |
| Net realized losses on foreign currency transactions | + | (20,950) |
| Net realized losses | | (210,983) |
| Net change in unrealized appreciation (depreciation) on investments (net of change in foreign capital gains tax of $1,384) | | (49,694) |
| Net change in unrealized appreciation (depreciation) on foreign currency translations | + | (88,899) |
| Net change in unrealized appreciation (depreciation) | + | (138,593) |
| Net realized and unrealized losses | | (349,576) |
| Decrease in net assets resulting from operations | | ($148,462) |
Laudus Mondrian Funds | Annual Report
Laudus Mondrian Global Government Fixed Income Fund
Statement of Changes in Net Assets
For the current and prior report periods
| Operations | |
| | 4/1/16-3/31/17 | 4/1/15-3/31/16 |
| Net investment income | | $201,114 | $258,895 |
| Net realized losses | | (210,983) | (1,140,876) |
| Net change in unrealized appreciation (depreciation) | + | (138,593) | 1,323,649 |
| Increase (decrease) in net assets from operations | | (148,462) | 441,668 |
| Transactions in Fund Shares | | | |
| | | 4/1/16-3/31/17 | 4/1/15-3/31/16 |
| | | SHARES | VALUE | SHARES | VALUE |
| Shares sold | | 11,962 | $111,660 | 10,458 | $92,078 |
| Shares redeemed | + | (147,322) | (1,331,597) | (535,829) | (4,648,880) |
| Net transactions in fund shares | | (135,360) | ($1,219,937) | (525,371) | ($4,556,802) |
| Shares Outstanding and Net Assets | | | |
| | | 4/1/16-3/31/17 | 4/1/15-3/31/16 |
| | | SHARES | NET ASSETS | SHARES | NET ASSETS |
| Beginning of period | | 1,013,182 | $9,278,929 | 1,538,553 | $13,394,063 |
| Total decrease | + | (135,360) | (1,368,399) | (525,371) | (4,115,134) |
| End of period | | 877,822 | $7,910,530 | 1,013,182 | $9,278,929 |
| Net investment loss | | | ($301,749) | | ($700,150) |
Laudus Mondrian Funds | Annual Report
1. Business Structure of the Funds:
Each of the funds in this report is a series of Laudus Trust (the trust), a no-load, open-end management investment company. The trust is organized as a Massachusetts business trust and is registered under the Investment Company Act of 1940, as amended (the 1940 Act). The list below shows all the funds in the trust as of the end of the period, including the funds discussed in this report, which are highlighted:
| LAUDUS TRUST (ORGANIZED APRIL 1, 1988) |
| Laudus Mondrian International Equity Fund | |
| Laudus Mondrian Emerging Markets Fund | |
| Laudus Mondrian International Government Fixed Income Fund | |
| Laudus Mondrian Global Government Fixed Income Fund | |
| Laudus U.S. Large Cap Growth Fund | |
Each fund in this report, with the exception of Laudus Mondrian International Government Fixed Income Fund and Laudus Mondrian Global Government Fixed Income Fund, which have one share class, offers three share classes: Investor Shares, Select Shares and Institutional Shares.
Each class of shares generally has identical rights and preferences, except that each class is subject to different eligibility conditions, bears different distribution and sub-transfer agent expenses, and separate voting rights on matters pertaining solely to that class of shares.
Shares are bought and sold (subject to a redemption fee, see financial note 10) at closing net asset value per share (NAV), which is the price for all outstanding shares of the funds.
Each fund maintains its own account for purposes of holding assets and accounting, and is considered a separate entity for tax purposes. Within its account, each fund may also keep certain assets in segregated accounts, as required by securities law.
2. Significant Accounting Policies:
The following is a summary of the significant accounting policies the funds use in their preparation of financial statements. The funds follow the investment company accounting and reporting guidance of the Financial Accounting Standards Board (FASB) Accounting Standard Codification Topic 946 Financial Services — Investment Companies. The accounting policies are in conformity with accounting principles generally accepted in the United States of America (GAAP).
The funds invest in certain other investment companies (underlying funds). For more information about the underlying funds’ operations and policies, please refer to those funds’ semiannual and annual reports, which are filed with the U.S. Securities and Exchange Commission (SEC).
(a) Security Valuation:
Under procedures approved by the funds’ Board of Trustees (the Board), the investment adviser has formed a Pricing Committee to administer the pricing and valuation of portfolio securities and other assets and to ensure that prices used for internal purposes or provided by third parties reasonably reflect fair market value. Among other things, these procedures allow the funds to utilize independent pricing services, quotations from securities and financial instrument dealers and other market sources to determine fair value.
The funds value the securities in their portfolios every business day. The funds use the following policies to value various types of securities:
• Securities traded on an exchange or over-the-counter: Traded securities are valued at the closing value for the day, or, on days when no closing value has been reported, at the mean of the most recent bid and ask quotes. Securities that are primarily traded on foreign exchanges are valued at the official closing price or the last sales price on the exchange where the securities are principally traded with these values then translated into U.S. dollars at the current exchange rate, unless these securities are fair valued as discussed below.
• Securities for which no quoted value is available: The Board has adopted procedures to fair value each fund’s securities when market prices are not “readily available” or are unreliable. For example, a fund may fair value a security when it is de-listed or its trading is halted or suspended; when a security’s primary pricing source is unable or unwilling to provide a price; or when a security’s primary trading market is closed during regular market hours. Each fund makes fair value determinations in good faith in accordance with the fund’s valuation procedures. The Pricing Committee considers a number
Laudus Mondrian Funds | Annual Report
Financial Notes (continued)
2. Significant Accounting Policies (continued):
of factors, including unobservable market inputs when arriving at fair value. The Pricing Committee may employ techniques such as the review of related or comparable assets or liabilities, related market activities, recent transactions, market multiples, book values, transactional back-testing, disposition analysis and other relevant information. The Pricing Committee regularly reviews these inputs and assumptions to calibrate the valuations. Due to the subjective and variable nature of fair value pricing, there can be no assurance that a fund could obtain the fair value assigned to the security upon the sale of such security. The Board convenes on a regular basis to review fair value determinations made by the funds pursuant to the valuation procedures.
• Bonds and notes: Bonds and notes are valued at the mean of the most recent bid and ask quotes or, if such quotes are unavailable, at prices for securities of comparable maturity, credit quality and type. Valuations for bonds and notes are provided by independent bond-pricing services.
• Foreign equity security fair valuation: The Board has adopted procedures to fair value foreign equity securities that are traded in markets that close prior to the funds valuing their holdings. By fair valuing securities whose prices may have been affected by events occurring after the close of trading, each fund seeks to establish prices that investors might expect to realize upon the current sales of these securities. This methodology is designed to deter “arbitrage” market timers, who seek to exploit delays between the change in the value of a fund’s portfolio holdings and the NAV of the fund’s shares, and seeks to help ensure that the prices at which the fund’s shares are purchased and redeemed are fair and do not result in dilution of shareholder interest or other harm to shareholders. When fair value pricing is used at the open or close of a reporting period, it may cause a temporary divergence between the return of a fund and that of its comparative index or benchmark. The Board regularly reviews fair value determinations made by the funds pursuant to these procedures.
• Forward foreign currency exchange contracts (forwards): Forwards are valued based on that day’s forward exchange rates or by using an interpolated forward exchange rate for contracts with interim settlement dates.
• Underlying funds: Mutual funds are valued at their respective NAVs.
In accordance with the authoritative guidance on fair value measurements and disclosures under GAAP, the funds disclose the fair value of their investments in a hierarchy that prioritizes the significant inputs to valuation techniques used to measure the fair value. The hierarchy gives the highest priority to valuations based upon unadjusted quoted prices in active markets for identical assets or liabilities (Level 1 measurements) and the lowest priority to valuations based upon unobservable inputs that are significant to the valuation (Level 3 measurements). If inputs used to measure the financial instruments fall within different levels of the hierarchy, the categorization is based on the lowest level input that is significant to the valuation. If the funds determine that either the volume and/or level of activity for an asset or liability has significantly decreased (from normal conditions for that asset or liability) or price quotations or observable inputs are not associated with orderly transactions, increased analysis and management judgment will be required to estimate fair value.
The three levels of the fair value hierarchy are as follows:
• Level 1—quoted prices in active markets for identical securities—Investments whose values are based on quoted market prices in active markets, and whose values are therefore classified as Level 1 prices, include active listed equities. Investments in mutual funds are valued daily at their NAVs, which are classified as Level 1 prices, without consideration to the classification level of the specific investments held by an underlying fund.
• Level 2—other significant observable inputs (including quoted prices for similar securities, interest rates, prepayment speeds, credit risk, etc.)—Investments that trade in markets that are not considered to be active, but whose values are based on quoted market prices, dealer quotations or valuations provided by alternative pricing sources supported by observable inputs are classified as Level 2 prices. These generally include U.S. government and sovereign obligations, most government agency securities, investment-grade corporate bonds, certain mortgage products, less liquid listed equities, and state, municipal and provincial obligations. In addition, international securities whose markets close hours before the funds value their holdings may require fair valuations due to significant movement in the U.S. markets occurring after the daily close of the foreign markets. The Board has approved a vendor that calculates fair valuations of international equity securities based on a number of factors that appear to correlate to the movements in the U.S. markets.
• Level 3—significant unobservable inputs (including the funds’ own assumptions in determining the fair value of investments)—Investments whose values are classified as Level 3 prices have significant unobservable inputs, as they may trade infrequently or not at all. When observable prices are not available for these securities, the funds use one or more valuation techniques for which sufficient and reliable data is available. The inputs used by the funds in estimating the value of Level 3 prices may include the original transaction price, quoted prices for similar securities or assets in active markets,
Laudus Mondrian Funds | Annual Report
Financial Notes (continued)
2. Significant Accounting Policies (continued):
completed or pending third-party transactions in the underlying investment or comparable issuers, and changes in financial ratios or cash flows. Level 3 prices may also be adjusted to reflect illiquidity and/or non-transferability, with the amount of such discount estimated by the funds in the absence of market information. Assumptions used by the funds due to the lack of observable inputs may significantly impact the resulting fair value and therefore the funds’ results of operations.
The inputs or methodology used for valuing securities are not necessarily an indication of the risk associated with investing in those securities.
The levels associated with valuing the funds’ investments as of March 31, 2017 are disclosed in the Portfolio Holdings.
(b) Accounting Policies for certain Portfolio Investments (if held):
Forward Foreign Currency Exchange Contracts: Forwards are contracts to buy and sell a currency at a set price on a future date. The value of the forwards is accounted for as unrealized appreciation or depreciation until the contracts settle, at which time the gains or losses are realized.
(c) Security Transactions:
Security transactions are recorded as of the date the order to buy or sell the security is executed. Realized gains and losses from security transactions are based on the identified costs of the securities involved.
Assets and liabilities denominated in foreign currencies are reported in U.S. dollars. For assets and liabilities held on a given date, the dollar value is based on market exchange rates in effect on that date. Transactions involving foreign currencies, including purchases, sales, income receipts and expense payments, are calculated using exchange rates in effect on the transaction date. Realized foreign exchange gains or losses arise from sales of foreign currencies, currency gains or losses realized between the trade and settlement dates on securities transactions and the differences between the recorded amounts of dividends, interest, and foreign withholding taxes and the U.S. dollar equivalent of the amounts actually received or paid. Net unrealized foreign exchange appreciation or depreciation arises from changes in foreign exchange rates on foreign denominated assets and liabilities other than investments in securities held at the end of the reporting period. These realized and unrealized foreign exchange gains or losses are reported in foreign currency transactions or translations on the Statement of Operations. The funds do not isolate the portion of the fluctuations on investments resulting from changes in foreign currency exchange rates from the fluctuations in market prices of investments held. Such fluctuations are included with the net realized and unrealized gain or loss from investments.
Gains realized by the funds on the sale of securities in certain foreign countries may be subject to non-U.S. taxes. In those instances, the funds record a liability based on unrealized appreciation to provide for potential non-U.S. taxes payable upon the sale of these securities.
When a fund closes out a forwards position, it calculates the difference between the value of the position at the beginning and at the end of the contract, and records a realized gain or loss accordingly.
(d) Investment Income:
Interest income is recorded as it accrues. If a fund buys a debt security at a discount (less than face value) or a premium (more than face value), it amortizes premiums and accretes discounts from the purchase settlement date up to maturity. The fund then increases (in the case of discounts) or reduces (in the case of premiums) the income it records from the security. If the security is callable (meaning that the issuer has the option to pay it off before its maturity date), then the fund amortizes the premium and accretes discounts to the security’s call date and price, rather than the maturity date and price. Dividends and distributions from portfolio securities and underlying funds are recorded on the date they are effective (the ex-dividend date), although the funds record certain foreign security dividends on the day they learn of the ex-dividend date. Any distributions from underlying funds are recorded in accordance with the character of the distributions as designated by the underlying funds.
Income received from foreign sources may result in withholding tax. Withholding taxes are accrued at the same time as the related income if the tax rate is fixed and known, unless a tax withheld is reclaimable from the local tax authorities in which case it is recorded as a receivable. If the tax rate is not known or estimable, such expense or reclaim receivable is recorded when the net proceeds are received.
Laudus Mondrian Funds | Annual Report
Financial Notes (continued)
2. Significant Accounting Policies (continued):
In 2016, the Laudus International Equity Fund filed claims to recover taxes previously withheld in certain European Union countries on the basis that those countries had purportedly violated certain provisions in the Treaty on the Functioning of the European Union. These filings are subject to various administrative and judicial proceedings within these countries, and all professional fees associated with these filings have been paid by CSIM. No other amounts for additional tax reclaims are reflected in the financial statements due to the uncertainty surrounding the ultimate resolution of proceedings, the likelihood of receipt of these claims, and the potential timing of payment.
(e) Expenses:
Expenses that are specific to a fund are charged directly to the fund. Expenses that are common to all funds within the trust generally are allocated among the funds in proportion to their average daily net assets.
For funds offering multiple share classes, the net investment income, other than class specific expenses, and the realized and unrealized gains or losses, are allocated daily to each class in proportion to their average daily net assets.
(f) Distributions to Shareholders:
The funds make distributions from net realized gains, if any, once a year. The Laudus Mondrian International Equity Fund and Laudus Mondrian Emerging Markets Fund make distributions from net investment income, if any, once a year, while the Laudus Mondrian International Government Fixed Income Fund and Laudus Mondrian Global Government Fixed Income Fund make distributions from net investment income, if any, quarterly.
(g) Custody Credit:
The funds have an arrangement with their custodian bank, State Street Bank and Trust Company (State Street), under which the funds may receive a credit for their uninvested cash balance to offset their custody fees and accounting fees. The credit amounts, if any, are disclosed in the Statement of Operations as a reduction to the funds’ operating expenses.
(h) Accounting Estimates:
The accounting policies described in this report conform to GAAP. Notwithstanding this, shareholders should understand that in order to follow these principles, fund management has to make estimates and assumptions that affect the information reported in the financial statements. It’s possible that once the results are known, they may turn out to be different from these estimates and these differences may be material.
(i) Federal Income Taxes:
The funds intend to meet federal income and excise tax requirements for regulated investment companies under subchapter M of the Internal Revenue Code, as amended. Accordingly, the funds distribute substantially all of their net investment income and net realized capital gains, if any, to their respective shareholders each year. As long as a fund meets the tax requirements, it is not required to pay federal income tax.
(j) Foreign Taxes:
The funds may be subject to foreign taxes (a portion of which may be reclaimable) on income, corporate events, foreign currency exchanges and capital gains on investments. All foreign taxes are recorded in accordance with the applicable foreign tax regulations and rates that exist in foreign markets in which the funds invest. These foreign taxes, if any, are paid by the funds and are disclosed in the Statement of Operations. Foreign taxes payable as of March 31, 2017, if any, are reflected in each fund’s Statement of Assets and Liabilities.
(k) Indemnification:
Under the funds’ organizational documents, the officers and trustees are indemnified against certain liabilities arising out of the performance of their duties to the funds. In addition, in the normal course of business the funds enter into contracts with their vendors and others that provide general indemnifications. The funds’ maximum exposure under these arrangements is unknown as this would involve future claims that may be made against the funds. However, based on experience, the funds expect the risk of loss attributable to these arrangements to be remote.
Laudus Mondrian Funds | Annual Report
Financial Notes (continued)
3. Risk Factors:
Investing in the funds may involve certain risks, as discussed in the funds’ prospectus, including, but not limited to, those described below. Any of these risks could cause an investor to lose money.
• Market Risk. Equity and fixed income markets rise and fall daily. As with any investment whose performance is tied to these markets, the value of an investment in the fund will fluctuate, which means that an investor could lose money.
• Management risk. As with all actively managed funds, a fund is subject to the risk that its sub-adviser will select investments or allocate assets in a manner that could cause the fund to underperform or otherwise not meet its objective. Poor stock or bond selection or a focus on securities in a particular sector or region may cause a fund to underperform its benchmark or other funds with a similar investment objective.
• Equity Risk. The prices of equity securities rise and fall daily. These price movements may result from factors affecting individual companies, industries or the securities market as a whole. In addition, equity markets tend to move in cycles, which may cause stock prices to fall over short or extended periods of time.
• Large-Cap Risk. A fund’s investments in large-cap stocks will reflect the risks associated with the large-cap segment of the stock market. Large-cap stocks tend to go in and out of favor based on market and economic conditions. During a period when large-cap stocks fall behind other types of investments—mid- or small-cap stocks, for instance—the performance of the fund’s investments in large-cap securities will lag these investments.
• Foreign Investment Risk. A fund’s investments in securities of foreign issuers may involve certain risks that are greater than those associated with investments in securities of U.S. issuers. These include risks of adverse changes in foreign economic, political, regulatory and other conditions; changes in currency exchange rates or exchange control regulations (including limitations on currency movements and exchanges); the imposition of economic sanctions or other government restrictions; differing accounting, auditing, financial reporting and legal standards and practices; differing securities market structures; and higher transaction costs. These risks may negatively impact the value or liquidity of a fund’s investments, and could impair a fund’s ability to meet its investment objective or invest in accordance with its investment strategy. These risks may be heightened in connection with investments in emerging markets.
• Emerging Markets Risk. Emerging market countries may be more likely to experience political turmoil or rapid changes in market or economic conditions than more developed countries. Emerging market countries often have less uniformity in accounting and reporting requirements and greater risk associated with the custody of securities. In addition, the financial stability of issuers (including governments) in emerging market countries may be more precarious than in developed countries. As a result, there will tend to be an increased risk of price volatility associated with the fund’s investments in emerging market countries, which may be magnified by currency fluctuations relative to the U.S. dollar, and, at times, it may be difficult to value such investments.
• Currency risk. As a result of a fund’s investments in securities denominated in, and/or receiving revenues in, foreign currencies, the fund will be subject to currency risk. This is the risk that those currencies will decline in value relative to the U.S. dollar, or, in the case of hedging positions, that the U.S. dollar will decline in value relative to the currency hedged. In either event, the dollar value of an investment in the fund would be adversely affected. Forward contracts on foreign currencies are not traded on exchanges; rather, a bank or dealer will act as agent or as principal in order to make or take future delivery of a specified lot of a particular currency or the fund’s account. The fund is subject to the risk of a principal’s failure, inability or refusal to perform with respect to such contracts.
• Derivatives Risk. A fund’s use of derivative instruments involves risks different from, or possibly greater than, the risks associated with investing directly in securities and other traditional investments. A fund’s use of derivatives could reduce the fund’s performance, increase its volatility, and could cause the fund to lose more than the initial amount invested. In addition, investments in derivatives may involve leverage, which means a small percentage of assets invested in derivatives can have a disproportionately large impact on a fund. Examples of derivatives are options, futures, options on futures, swaps and warrants. The Laudus Mondrian Global Government Fixed Income Fund may use non-deliverable forwards, which are cash-settled contracts on thinly traded or non-convertible foreign currencies.
• Fixed Income Risk. Interest rates rise and fall over time, which will affect a fund’s yield and share price. Certain countries have recently experienced negative interest rates on certain fixed-income instruments. A change in a central bank’s monetary policy or improving economic conditions may result in an increase in interest rates. Rising interest rates may decrease liquidity in the fixed income securities markets, making it more difficult for the fund to sell its fixed income securities holdings at a time when the sub-adviser might wish to sell such securities. In addition, decreased market liquidity also may make it more difficult to value some or all of the fund’s fixed income securities holdings. In general, changing interest rates, including rates that fall
Laudus Mondrian Funds | Annual Report
Financial Notes (continued)
3. Risk Factors (continued):
below zero, could have unpredictable effects on markets and may expose fixed-income and related markets to heightened volatility. The credit quality of a portfolio investment could also cause the fund’s share price to fall. A fund could lose money if the issuer or guarantor of a portfolio investment or the counterparty to a derivatives contract fails to make timely principal or interest payments or otherwise honor its obligations. Fixed income securities may be paid off earlier or later than expected. Either situation could cause the fund to hold securities paying lower than market rates of interest, which could hurt the fund’s yield or share price. Below investment-grade bonds (junk bonds) involve greater risks than investment-grade securities.
• Leverage risk. Certain fund transactions, such as derivatives, may give rise to a form of leverage and may expose a fund to greater risk. Leverage tends to magnify the effect of any increase or decrease in the value of a fund’s portfolio securities, which means even a small amount of leverage can have a disproportionately large impact on the fund.
• Liquidity risk. The fund may be unable to sell certain securities, such as illiquid securities, readily at a favorable time or price, or the fund may have to sell them at a loss. Liquidity risk also includes the risk that market conditions or large shareholder redemptions may impact the ability of a fund to meet redemption requests within the required time period. In order to meet such redemption requests, the fund may be forced to sell securities at inopportune times or prices.
Please refer to the funds’ prospectus for a more complete description of the principal risks of investing in the funds.
4. Affiliates and Affiliated Transactions:
Investment Advisory Fees
Charles Schwab Investment Management, Inc. (CSIM or the investment adviser), a wholly owned subsidiary of The Charles Schwab Corporation, serves as each fund’s investment adviser pursuant to an Investment Advisory Agreement (Advisory Agreement) between CSIM and the trust. Mondrian Investment Partners Limited (Mondrian), the funds’ sub-adviser, provides day-to-day portfolio management services to the funds, subject to the supervision of CSIM.
For its advisory services to the following funds, CSIM is entitled to receive an annual fee, payable monthly, based on a percentage of each fund’s average daily net assets described as follows:
| Laudus Mondrian International Equity Fund | 0.75% |
| Laudus Mondrian Emerging Markets Fund | 1.00% |
| Laudus Mondrian International Government Fixed Income Fund | 0.60% |
| Laudus Mondrian Global Government Fixed Income Fund | 0.68% |
CSIM (not the funds) pays a portion of the advisory fees it receives to Mondrian in return for its services.
Expense Limitation
CSIM has contractually agreed, until at least July 30, 2018, to limit the total annual fund operating expenses charged, excluding interest, taxes and certain non-routine expenses as follows:
| | Laudus Mondrian
International
Equity Fund | Laudus Mondrian
Emerging
Markets Fund |
| Investor Shares | 1.30% | 1.60% |
| Select Shares | 1.05% | 1.35% |
| Institutional Shares | 0.90% | 1.20% |
In addition to the funds listed above, CSIM has contractually agreed, until at least July 30, 2018 to limit the total annual fund operating expenses charged, excluding interest, taxes and certain non-routine expenses, of the Laudus Mondrian International Government Fixed Income Fund and the Laudus Mondrian Global Government Fixed Income Fund to 0.75% and 0.85%, respectively.
Any amounts waived or reimbursed in a particular fiscal year will be subject to repayment through the next two fiscal years, to the extent that the repayment will not cause the funds’ net expenses to exceed the limit (as stated in CSIM’s contractual undertaking) during the respective year. For the period ended March 31, 2017, the funds did not make any repayments of prior years’ waived amounts.
Laudus Mondrian Funds | Annual Report
Financial Notes (continued)
4. Affiliates and Affiliated Transactions (continued):
As of March 31, 2017, the balance of recoupable waivers and the respective years of expiration are as follows:
| Expiration Date | Laudus Mondrian
International
Equity Fund | | Laudus Mondrian
Emerging
Markets Fund | | Laudus Mondrian
International
Government Fixed
Income Fund | | Laudus Mondrian
Global
Government Fixed
Income Fund |
| March 31, 2018 | $160,233 | | $54,879 | | $78,310 | | $160,921 |
| March 31, 2019 | 77,198 | | 73,686 | | 52,325 | | 129,308 |
| Total | $237,431 | | $128,565 | | $130,635 | | $290,229 |
As of March 31, 2017, the Laudus Mondrian International Equity Fund, Laudus Mondrian Emerging Markets Fund, Laudus Mondrian International Government Fixed Income Fund and Laudus Mondrian Global Government Fixed Income Fund had recoupable waivers expire in the amount of $82,359, $53,246, $63,797 and $149,778, respectively.
Shareholder Concentration
Certain accounts or CSIM affiliates may from time to time own (beneficially or of record) or control a significant percentage of a fund’s shares. Redemptions by these shareholders of their holdings in a fund may impact the fund’s liquidity and NAV. These redemptions may also force the fund to sell securities, which may negatively impact the fund’s brokerage costs. Please refer to note 3 for more information on liquidity risk. As of March 31, 2017, 1 shareholder of the Laudus Mondrian Global Government Fixed Income Fund owned 23% of the fund’s outstanding shares.
Investments from Affiliated Funds
Certain Schwab funds may own shares of other Schwab funds. The table below reflects the percentages of shares of each fund in this report that are owned by other Schwab funds as of March 31, 2017, as applicable:
| | Underlying Funds |
| | Laudus Mondrian
International
Equity Fund | Laudus Mondrian
Emerging
Markets Fund |
| Schwab Target 2010 Fund | 0.3% | —% |
| Schwab Target 2015 Fund | 0.4% | —% |
| Schwab Target 2020 Fund | 4.2% | 0.4% |
| Schwab Target 2025 Fund | 3.6% | 1.1% |
| Schwab Target 2030 Fund | 6.3% | 3.5% |
| Schwab Target 2035 Fund | 2.4% | 2.2% |
| Schwab Target 2040 Fund | 3.1% | 6.7% |
| Schwab Target 2045 Fund | 0.3% | 0.9% |
| Schwab Target 2050 Fund | 0.2% | 0.8% |
| Schwab Target 2055 Fund | 0.1% | 0.5% |
| Schwab Target 2060 Fund | 0.0%* | 0.0%* |
Other Affiliated Transactions
The professional fees related to foreign withholding tax claims discussed in financial note 2 were non-routine expenses. However, the investment adviser agreed to pay these professional fees for this reporting period, subject to reimbursement by the Laudus International Equity Fund to the extent the fund is able to successfully recover taxes withheld in the future. As of March 31, 2017, the balance of professional fees related to foreign withholding tax subject to future reimbursement by the fund to the investment adviser was $8,945 for Laudus Mondrian International Equity Fund.
5. Distribution and Shareholder Services:
The trust has a Distribution and Shareholder Service Plan with respect to its Investor Shares pursuant to Rule 12b-1 under the 1940 Act. The Investor Shares of the funds are sold on a continuous basis by the trust’s distributor, ALPS Distributors, Inc. Under the Distribution and Shareholder Services Plan, the funds pay distribution and shareholder servicing fees in connection with the sale
Laudus Mondrian Funds | Annual Report
Financial Notes (continued)
5. Distribution and Shareholder Services (continued):
and servicing of the Investor Shares. The annual Distribution and Shareholder Service Fee consists of up to 0.25% of the respective average daily net assets of the Investor Shares. In addition, the trustees have authorized the Laudus Mondrian International Equity Fund and Laudus Mondrian Emerging Markets Fund to reimburse, out of the Investor and Select Shares assets of the funds, financial intermediaries that provide sub-accounting and sub-transfer agency services in connection with Investor or Select Shares an amount of up to 0.15% of the average daily net assets of that class on an annual basis. Further, the trustees have authorized the Laudus Mondrian Global Government Fixed Income Fund to reimburse, out of the assets of the fund, financial intermediaries that provide sub-accounting and sub-transfer agency services in connection with the fund’s shares in an amount of up to 0.10% of the average daily net assets of the fund on an annual basis.
6. Board of Trustees:
The trust’s Board of Trustees oversees the general conduct of the trust and the funds.
The Board may include people who are officers and/or directors of CSIM or its affiliates. Federal securities law limits the percentage of such “interested persons” who may serve on a trust’s board, and the trust was in compliance with these limitations throughout the report period. The trust did not pay any of these interested persons for their services as trustees, but it did pay non-interested persons (independent trustees), as noted in each fund’s Statement of Operations. For information regarding the trustees, please refer to Trustees and Officers table at the end of this report.
7. Borrowing from Banks:
During the period, the funds were participants with other U.S. registered investment companies managed by CSIM in a joint, syndicated, committed $530 million line of credit (the Credit Facility), which matured on October 6, 2016. Under the terms of the Credit Facility, in addition to the interest charged on any borrowings by a fund, each fund paid a commitment fee of 0.125% per annum on its proportionate share of the unused portion of the Credit Facility. On October 6, 2016, the Credit Facility was amended to run for a new 364 day period with an increased line of $555 million and a commitment fee of 0.15% per annum. There were no borrowings from any of the lines of credit during the period.
The funds also have access to custodian overdraft facilities. A fund may have utilized the overdraft facility and incurred an interest expense, which is disclosed on the fund’s Statement of Operations, if any. The interest expense is determined based on a negotiated rate above the current Federal Funds Rate.
8. Purchases and Sales/Maturities of Investment Securities:
For the period ended March 31, 2017, purchases and sales/maturities of securities (excluding short-term obligations) were as follows:
| | Purchases
of Securities | Sales/Maturities
of Securities |
| Laudus Mondrian International Equity Fund | $44,865,175 | $69,401,013 |
| Laudus Mondrian Emerging Markets Fund | 122,370,956 | 224,592,717 |
| Laudus Mondrian International Government Fixed Income Fund | 122,639,514 | 131,647,896 |
| Laudus Mondrian Global Government Fixed Income Fund | 5,432,905* | 6,394,031* |
| * | Includes purchases and sales/maturities of long-term U.S. Government securities of $2,052,659 and $2,340,331 respectively. |
Laudus Mondrian Funds | Annual Report
Financial Notes (continued)
9. Derivatives:
The funds invested in forwards during the report period to hedge part of the funds’ exposure to certain currencies. Refer to financial note 2(b) for the funds’ accounting policies with respect to forwards and financial note 3 for disclosures concerning the risks of investing in forwards. During the period ended March 31, 2017, the month-end average forward foreign currency notional amount and the month-end average unrealized appreciation (depreciation) were as follows:
| | Forward Foreign Currency
Exchange Contract
Notional Amount | Net Unrealized
Appreciation (Depreciation) |
| Laudus Mondrian International Equity Fund | $27,038 | ($185) |
| Laudus Mondrian Emerging Markets Fund | 97,389 | 1,761 |
| Laudus Mondrian International Government Fixed Income Fund | 17,470,920 | 19,324 |
| Laudus Mondrian Global Government Fixed Income Fund | 2,379,994 | 2,199 |
The fair value of forwards held by the funds is presented as unrealized appreciation (depreciation) on forward foreign currency exchange contracts on the Statement of Assets and Liabilities as follows:
| | Laudus Mondrian
International
Equity Fund | Laudus Mondrian
Emerging
Markets Fund | Laudus Mondrian
International
Government Fixed
Income Fund | Laudus Mondrian
Global
Government Fixed
Income Fund |
| Asset Derivatives | Fair Value | | | | |
| Forward Foreign Currency Exchange Contracts1 | $— | $— | $148,506 | $9,844 |
| Liability Derivatives | Fair Value | | | | |
| Forward Foreign Currency Exchange Contracts2 | $— | $— | ($16,271) | ($11,179) |
| 1 | Statement of Assets and Liabilities location: Unrealized appreciation on forward foreign currency exchange contracts. |
| 2 | Statement of Assets and Liabilities location: Unrealized depreciation on forward foreign currency exchange contracts. |
The effects of the forwards held by the funds in the Statement of Operations for the period ended March 31, 2017 were:
| | Forward Foreign Currency Exchange Contracts |
| | Laudus Mondrian
International
Equity Fund | Laudus Mondrian
Emerging
Markets Fund | Laudus Mondrian
International
Government Fixed
Income Fund | Laudus Mondrian
Global
Government Fixed
Income Fund |
| Realized Gains (Losses)1 | $21,808 | $97,217 | ($576,042) | $13,663 |
| Change in Unrealized Appreciation (Depreciation)2 | — | — | 200,859 | (87,112) |
| 1 | Statement of Operations location: Net realized gains (losses) on foreign currency transactions. |
| 2 | Statement of Operations location: Net change in unrealized appreciation (depreciation) on foreign currency translations. |
The funds’ forwards are entered into pursuant to International Swaps and Derivatives Association, Inc. (ISDA) agreements which govern certain terms of derivative transactions. ISDA agreements typically contain, among other things, master netting provisions in the event of a default or other termination event. Master netting provisions allow the funds and the counterparty, in the event of a default or other termination event, to offset payable and receivable amounts for each party related to derivative contracts to one net amount payable by either the funds or the counterparty. The funds’ forwards which are reported gross in the Statement of Assets and Liabilities, are presented in the tables below. The following tables present the funds’ forwards, net of amounts available for offset under a master netting agreement and net of any related collateral received by the funds for assets and pledged by the funds for liabilities as of March 31, 2017.
Laudus Mondrian Funds | Annual Report
Financial Notes (continued)
9. Derivatives (continued):
Laudus Mondrian International Government Fixed Income Fund
| | | | Gross Amounts Not Offset in the
Statement of Assets & Liabilities |
| Counterparty | Net Amounts of Assets
Presented in the
Statement of Assets and Liabilities | | Financial
Instruments | | Cash Collateral
Received | | Net
Amounts(a) |
| State Street Bank & Trust Co. | $148,506 | | ($16,271) | | $— | | $132,235 |
| Total | $148,506 | | ($16,271) | | $— | | $132,235 |
| Counterparty | Net Amounts of Liabilities
Presented in the
Statement of Assets and Liabilities | | Financial
Instruments | | Cash Collateral
Pledged | | Net
Amounts(b) |
| State Street Bank & Trust Co. | ($16,271) | | $16,271 | | $— | | $— |
| Total | ($16,271) | | $16,271 | | $— | | $— |
Laudus Mondrian Global Government Fixed Income Fund
| | | | Gross Amounts Not Offset in the
Statement of Assets & Liabilities |
| Counterparty | Net Amounts of Assets
Presented in the
Statement of Assets and Liabilities | | Financial
Instruments | | Cash Collateral
Received | | Net
Amounts(a) |
| Barclays Capital, Inc. | $1,205 | | ($57) | | $— | | $1,148 |
| State Street Bank & Trust Co. | 8,639 | | (8,639) | | — | | — |
| Total | $9,844 | | ($8,696) | | $— | | $1,148 |
| Counterparty | Net Amounts of Liabilities
Presented in the
Statement of Assets and Liabilities | | Financial
Instruments | | Cash Collateral
Pledged | | Net
Amounts(b) |
| Barclays Capital, Inc. | ($57) | | $57 | | $— | | $— |
| State Street Bank & Trust Co. | (11,122) | | 8,639 | | — | | (2,483) |
| Total | ($11,179) | | $8,696 | | $— | | ($2,483) |
| a | Represents the net amount due from the counterparty in the event of default. |
| b | Represents the net amount due to the counterparty in the event of default. |
10. Redemption Fee:
Prior to February 28, 2017, the funds charged a 2.00% redemption fee on shares sold or exchanged within 30 days of the original purchase date. Such amounts are netted against redemption proceeds on the Statement of Changes in Net Assets. Effective February 28, 2017, the funds no longer charge redemption fees. The redemption fees charged during the current and prior periods were as follows:
| | Current Period
(4/1/16-3/31/17) | Prior Period
(4/1/15-3/31/16) |
| Laudus Mondrian International Equity Fund | $5,510 | $1,649 |
| Laudus Mondrian Emerging Markets Fund | 262 | 54,245 |
| Laudus Mondrian International Government Fixed Income Fund | 6,652 | 2,422 |
| Laudus Mondrian Global Government Fixed Income Fund | 17 | 2 |
Laudus Mondrian Funds | Annual Report
Financial Notes (continued)
11. Federal Income Taxes:
As of March 31, 2017, the components of distributable earnings on a tax-basis were as follows:
| | Laudus Mondrian
International
Equity Fund | | Laudus Mondrian
Emerging
Markets Fund | | Laudus Mondrian
International
Government Fixed
Income Fund | | Laudus Mondrian
Global
Government Fixed
Income Fund |
| Undistributed ordinary income | $625,286 | | $1,747,125 | | $— | | $— |
| Undistributed long-term capital gains | — | | — | | — | | — |
| Unrealized appreciation on investments | 16,470,829 | | 25,912,840 | | 1,665,135 | | 216,515 |
| Unrealized depreciation on investments | (1,071,722) | | (31,639,925) | | (6,484,658) | | (528,713) |
| Other unrealized appreciation (depreciation) | (18,841) | | (35,445) | | 8,567 | | (787) |
| Net unrealized appreciation (depreciation) | $15,380,266 | | ($5,762,530) | | ($4,810,956) | | ($312,985) |
The primary difference between book-basis and tax-basis unrealized appreciation or unrealized depreciation of investments is the tax deferral of losses on wash sales and the realization for tax purposes of unrealized gains on investments in Passive Foreign Investment Companies (PFIC).
Capital loss carryforwards may be used to offset future realized capital gains for federal income tax purposes. As of March 31, 2017, the funds had capital loss carryforwards available to offset future net capital gains as follows:
| Expiration Date | Laudus Mondrian
International
Equity Fund | Laudus Mondrian
Emerging
Markets Fund | Laudus Mondrian
International
Government Fixed
Income Fund | Laudus Mondrian
Global
Government Fixed
Income Fund |
| No expiration | $2,240,408 | $105,528,240 | $— | $20,167 |
The Laudus Mondrian Emerging Markets Fund had an ownership change as a result of a reorganization which subjects the fund to certain annual limitations under Internal Revenue Code Section 382 in regard to the availability of capital loss carryforwards to offset potential future capital gains.
For tax purposes, net realized capital losses and late-year ordinary losses incurred after October 31 may be deferred and treated as occurring on the first day of the following fiscal year. For the year ended March 31, 2017, the funds had capital and late-year ordinary losses deferred and capital loss carryforwards utilized as follows:
| | Laudus Mondrian
International
Equity Fund | Laudus Mondrian
Emerging
Markets Fund | Laudus Mondrian
International
Government Fixed
Income Fund | Laudus Mondrian
Global
Government Fixed
Income Fund |
| Capital losses deferred | $— | $— | $194,980 | $— |
| Late-year ordinary losses deferred | — | — | 3,008,058 | 192,243 |
| Capital loss carryforwards utilized | — | — | — | 42,304 |
The tax-basis components of distributions paid during the current and prior fiscal years were:
| | Laudus Mondrian
International
Equity Fund | Laudus Mondrian
Emerging
Markets Fund | Laudus Mondrian
International
Government Fixed
Income Fund | Laudus Mondrian
Global
Government Fixed
Income Fund |
| Current period distributions | | | | |
| Ordinary income | $3,978,315 | $9,543,878 | $14,676 | $— |
| Long-term capital gains | — | — | 761,942 | — |
| Prior period distributions | | | | |
| Ordinary income | $2,556,153 | $5,529,636 | $— | $— |
| Long-term capital gains | 3,537,227 | — | 2,596,705 | — |
Laudus Mondrian Funds | Annual Report
Financial Notes (continued)
11. Federal Income Taxes (continued):
Distributions paid to shareholders are based on net investment income and net realized gains determined on a tax basis, which may differ from net investment income and net realized gains for financial reporting purposes. These differences reflect the differing character of certain income items and net realized gains and losses for financial statement and tax purposes, and may result in reclassification among certain capital accounts on the financial statements.
Permanent book and tax basis differences may result in reclassifications between components of net assets as required. The adjustments will have no impact on net assets or the results of operations. As of March 31, 2017, the funds made the following reclassifications:
| | Laudus Mondrian
International
Equity Fund | Laudus Mondrian
Emerging
Markets Fund | Laudus Mondrian
International
Government Fixed
Income Fund | Laudus Mondrian
Global
Government Fixed
Income Fund |
| Capital shares | $— | $— | ($2,325,650) | ($456,722) |
| Undistributed net investment income | 55,581 | 29,736 | (2,756,081) | 197,287 |
| Net realized capital gains (losses) | (55,581) | (29,736) | 5,081,731 | 259,435 |
As of March 31, 2017, management has reviewed the tax positions for open periods (for federal purposes, three years from the date of filing and for state purposes, four years from the date of filing) as applicable to the funds, and has determined that no provision for income tax is required in the funds’ financial statements. The funds recognize interest and penalties, if any, related to unrecognized tax benefits as income tax expense in the Statement of Operations. During the period ended March 31, 2017, the funds did not incur any interest or penalties.
12. Recent Regulatory Development:
In October 2016, the U.S. Securities and Exchange Commission adopted new rules and amended existing rules (together, “final rules”) intended to modernize the reporting and disclosure of information by registered investment companies. In part, the final rules amend Regulation S-X and require standardized, enhanced disclosure about derivatives in investment company financial statements, as well as other amendments. The compliance date for the amendments to Regulation S-X is August 1, 2017. Management is currently evaluating the impact that the adoption of the amendments to Regulation S-X will have on the funds’ financial statements and related disclosures.
13. Subsequent Events:
Management has determined there are no subsequent events or transactions through the date the financial statements were issued that would have materially impacted the financial statements as presented.
Laudus Mondrian Funds | Annual Report
Report of Independent Registered Public Accounting Firm
To the Board of Trustees of Laudus Trust and Shareholders of Laudus Mondrian International Equity Fund, Laudus Mondrian Emerging Markets Fund, Laudus Mondrian International Government Fixed Income Fund, and Laudus Mondrian Global Government Fixed Income Fund
In our opinion, the accompanying statements of assets and liabilities, including the portfolio holdings, and the related statements of operations and of changes in net assets and the financial highlights present fairly, in all material respects, the financial position of the Laudus Mondrian International Equity Fund, Laudus Mondrian Emerging Markets Fund, Laudus Mondrian International Government Fixed Income Fund, and Laudus Mondrian Global Government Fixed Income Fund (four of the funds constituting the Laudus Trust, hereafter referred to as the “Funds”) as of March 31, 2017, the results of each of their operations for the year then ended, the changes in each of their net assets for each of the two years in the period then ended and the financial highlights for each of the periods indicated, in conformity with accounting principles generally accepted in the United States of America. These financial statements and financial highlights (hereafter referred to as “financial statements”) are the responsibility of the Funds’ management. Our responsibility is to express an opinion on these financial statements based on our audits. We conducted our audits of these financial statements in accordance with the standards of the Public Company Accounting Oversight Board (United States). Those standards require that we plan and perform the audit to obtain reasonable assurance about whether the financial statements are free of material misstatement. An audit includes examining, on a test basis, evidence supporting the amounts and disclosures in the financial statements, assessing the accounting principles used and significant estimates made by management, and evaluating the overall financial statement presentation. We believe that our audits, which included confirmation of securities as of March 31, 2017 by correspondence with the custodian and brokers, or by other appropriate auditing procedures where replies from brokers were not received, provide a reasonable basis for our opinion.
PricewaterhouseCoopers LLP
San Francisco, California
May 17, 2017
Laudus Mondrian Funds | Annual Report
Other Federal Tax Information (unaudited)
The funds elect to pass through under section 853(a) of the Internal Revenue Code foreign tax credit to its shareholders for the year ended March 31, 2017, and the respective foreign source income on the funds as follows:
| | Foreign Tax Credit | Foreign Source Income |
| Laudus Mondrian International Equity Fund | $452,632 | $5,930,106 |
| Laudus Mondrian Emerging Markets Fund | 1,268,391 | 13,217,997 |
| Laudus Mondrian International Government Fixed Income Fund | — | — |
| Laudus Mondrian Global Government Fixed Income Fund | — | — |
For corporate shareholders, the following percentage of the funds dividend distributions paid during the fiscal year ended March 31, 2017, qualify for the corporate dividends received deduction:
| | Percentage |
| Laudus Mondrian International Equity Fund | — |
| Laudus Mondrian Emerging Markets Fund | 2.42 |
| Laudus Mondrian International Government Fixed Income Fund | — |
| Laudus Mondrian Global Government Fixed Income Fund | — |
For the fiscal year ended March 31, 2017, the funds designate the following amounts of the dividend distributions as qualified dividends for the purpose of the maximum rate under section 1(h)(11) of the Internal Revenue Code. Shareholders will be notified in January 2018 via IRS form 1099 of the amounts for use in preparing their 2017 income tax return.
| Laudus Mondrian International Equity Fund | $4,430,947 |
| Laudus Mondrian Emerging Markets Fund | 5,672,624 |
| Laudus Mondrian International Government Fixed Income Fund | — |
| Laudus Mondrian Global Government Fixed Income Fund | — |
Under section 852(b)(3)(C) of the Internal Revenue Code, certain funds hereby designate the following amounts as long-term capital gain dividends for the fiscal year ended March 31, 2017:
| Laudus Mondrian International Equity Fund | $— |
| Laudus Mondrian Emerging Markets Fund | — |
| Laudus Mondrian International Government Fixed Income Fund | 761,942 |
| Laudus Mondrian Global Government Fixed Income Fund | — |
Laudus Mondrian Funds | Annual Report
Trustees and Officers
The tables below give information about the trustees and officers of Laudus Trust, which includes the funds covered in this report. The “Fund Complex” includes The Charles Schwab Family of Funds, Schwab Capital Trust, Schwab Investments, Schwab Annuity Portfolios, Schwab Strategic Trust and Laudus Trust. The Fund Complex includes 110 funds.
The address for all trustees and officers is 211 Main Street, San Francisco, CA 94105. You can find more information about the trustees and officers in the funds’ Statement of Additional Information, which is available free by calling 1-877-824-5615.
| Independent Trustees |
Name, Year of Birth, and
Position(s) with the trust
(Terms of office, and
length of Time Served1) | Principal Occupations
During the Past Five Years | Number of
Portfolios in
Fund Complex
Overseen by
the Trustee | Other Directorships |
Robert W. Burns
1959
Trustee
(Trustee of Schwab Strategic Trust since 2009; The Charles Schwab Family of Funds, Schwab Investments, Schwab Capital Trust, Schwab Annuity Portfolios and Laudus Trust since 2016) | Retired/Private Investor (Jan. 2009 – present). Formerly, Managing Director, Pacific Investment Management Company, LLC (PIMCO) and President, PIMCO Funds. | 110 | Director, PS Business Parks, Inc. (2005 – 2012) |
John F. Cogan
1947
Trustee
(Trustee of The Charles Schwab Family of Funds, Schwab Investments, Schwab Capital Trust and Schwab Annuity Portfolios since 2008; Laudus Trust since 2010; Schwab Strategic Trust since 2016) | Senior Fellow, The Hoover Institution at Stanford University (Oct. 1979 – present); Senior Fellow, Stanford Institute for Economic Policy Research (2000 – present); Professor of Public Policy, Stanford University (1994 – 2015). | 110 | Director, Gilead Sciences, Inc. (2005 – present) |
Stephen Timothy Kochis
1946
Trustee
(Trustee of Schwab Strategic Trust since 2012; The Charles Schwab Family of Funds, Schwab Investments, Schwab Capital Trust, Schwab Annuity Portfolios and Laudus Trust since 2016) | CEO and Owner, Kochis Global (wealth management consulting) (May 2012 – present); Chairman and CEO, Aspiriant, LLC (wealth management) (Jan. 2008 – Apr. 2012). | 110 | None |
David L. Mahoney
1954
Trustee
(Trustee of The Charles Schwab Family of Funds, Schwab Investments, Schwab Capital Trust, Schwab Annuity Portfolios and Laudus Trust since 2011; Schwab Strategic Trust since 2016) | Private Investor. | 110 | Director, Symantec Corporation (2003 – present)
Director, Corcept Therapeutics Incorporated (2004 – present)
Director, Adamas Pharmaceuticals, Inc. (2009 – present) |
Laudus Mondrian Funds | Annual Report
| Independent Trustees (continued) |
Name, Year of Birth, and
Position(s) with the trust
(Terms of office, and
length of Time Served1) | Principal Occupations
During the Past Five Years | Number of
Portfolios in
Fund Complex
Overseen by
the Trustee | Other Directorships |
Kiran M. Patel
1948
Trustee
(Trustee of The Charles Schwab Family of Funds, Schwab Investments, Schwab Capital Trust, Schwab Annuity Portfolios and Laudus Trust since 2011; Schwab Strategic Trust since 2016) | Retired. Executive Vice President and General Manager of Small Business Group, Intuit, Inc. (financial software and services firm for consumers and small businesses) (Dec. 2008 – Sept. 2013). | 110 | Director, KLA-Tencor Corporation (2008 – present) |
Kimberly S. Patmore
1956
Trustee
(Trustee of The Charles Schwab Family of Funds, Schwab Investments, Schwab Capital Trust, Schwab Annuity Portfolios, Schwab Strategic Trust and Laudus Trust since 2016) | Consultant, Patmore Management Consulting (management consulting) (2008 – present). | 110 | None |
Charles A. Ruffel
1956
Trustee
(Trustee of Schwab Strategic Trust since 2009; The Charles Schwab Family of Funds, Schwab Investments, Schwab Capital Trust, Schwab Annuity Portfolios and Laudus Trust since 2015) | Co-Chief Executive Officer, Kudu Investment Management, LLC (financial services) (Jan. 2015 – present); Partner, Kudu Advisors, LLC (financial services) (June 2008 – Jan. 2015); Advisor, Asset International, Inc. (publisher of financial services information) (Aug. 2008 – Jan. 2015). | 110 | None |
Gerald B. Smith
1950
Trustee
(Trustee of The Charles Schwab Family of Funds, Schwab Investments, Schwab Capital Trust and Schwab Annuity Portfolios since 2000; Laudus Trust since 2010; Schwab Strategic Trust since 2016) | Chairman, Chief Executive Officer and Founder of Smith Graham & Co. (investment advisors) (Mar. 1990 – present). | 110 | Director, Eaton (2012 – present)
Director and Chairman of the Audit Committee, Oneok Partners LP (2003 – 2013)
Director, Oneok, Inc. (2009 – 2013)
Lead Independent Director, Board of Cooper Industries (2002 – 2012) |
Joseph H. Wender
1944
Trustee
(Trustee of The Charles Schwab Family of Funds, Schwab Investments, Schwab Capital Trust and Schwab Annuity Portfolios since 2008; Laudus Trust since 2010; Schwab Strategic Trust since 2016) | Senior Consultant, Goldman Sachs & Co., Inc. (investment banking and securities firm) (Jan. 2008 – present); Partner, Colgin Partners, LLC (vineyards) (Feb. 1998 – present). | 110 | Board Member and Chairman of the Audit Committee, Ionis Pharmaceuticals (1994 – present)
Lead Independent Director and Chair of Audit Committee, OUTFRONT Media Inc. (2014 – present) |
Laudus Mondrian Funds | Annual Report
| Interested Trustees |
Name, Year of Birth, and
Position(s) with the trust
(Terms of office, and
length of Time Served1) | Principal Occupations
During the Past Five Years | Number of
Portfolios in
Fund Complex
Overseen by
the Trustee | Other Directorships |
Walter W. Bettinger II2
1960
Chairman and Trustee
(Trustee of The Charles Schwab Family of Funds, Schwab Investments, Schwab Capital Trust and Schwab Annuity Portfolios since 2008; Schwab Strategic Trust since 2009; Laudus Trust since 2010) | Director, President and Chief Executive Officer, The Charles Schwab Corporation (Oct. 2008 – present); President and Chief Executive Officer (Oct. 2008 – present), Director (May 2008 – present), Charles Schwab & Co., Inc.; Director, Charles Schwab Bank (Apr. 2006 – present); Director, Schwab Holdings, Inc. (May 2008 – present); and Director, Charles Schwab Investment Management, Inc. (July 2016 – present). | 110 | Director, The Charles Schwab Corporation (2008 – present) |
Marie A. Chandoha2
1961
Trustee
(Trustee of The Charles Schwab Family of Funds, Schwab Investments, Schwab Capital Trust, Schwab Annuity Portfolios, Schwab Strategic Trust and Laudus Trust since 2016) | Director, President and Chief Executive Officer (Dec. 2010 – present), Chief Investment Officer (Sept. 2010 – Oct. 2011), Charles Schwab Investment Management, Inc.; Trustee (Jan. 2016 – present), President, Chief Executive Officer (Dec. 2010 – present), and Chief Investment Officer (Sept. 2010 – Oct. 2011), Schwab Funds, Laudus Funds and Schwab ETFs; Director, Charles Schwab Worldwide Funds plc and Charles Schwab Asset Management (Ireland) Limited (Jan. 2011 – present); Global Head of Fixed Income Business Division, BlackRock, Inc. (formerly Barclays Global Investors) (Mar. 2007 – Aug. 2010). | 110 | None |
Joseph R. Martinetto2
1962
Trustee
(Trustee of The Charles Schwab Family of Funds, Schwab Investments, Schwab Capital Trust, Schwab Annuity Portfolios, Schwab Strategic Trust and Laudus Trust since 2016) | Senior Executive Vice President and Chief Financial Officer, The Charles Schwab Corporation and Charles Schwab & Co., Inc. (July 2015 – present); Executive Vice President and Chief Financial Officer of The Charles Schwab Corporation and Charles Schwab & Co., Inc. (May 2007 – July 2015); Director, Charles Schwab & Co., Inc. (May 2007 – present); Director (Apr. 2010 – present) and Chief Executive Officer (July 2013 – Apr. 2015), Charles Schwab Bank; Director, Executive Vice President and Chief Financial Officer (May 2007 – present), Senior Executive Vice President (Feb. 2016 – present), and Executive Vice President (May 2007 – Feb. 2016), Schwab Holdings, Inc. | 110 | None |
| Officers of the Trust |
Name, Year of Birth, and Position(s) with the trust
(Terms of office, and length of Time Served3) | Principal Occupations During the Past Five Years |
Marie A. Chandoha
1961
President and Chief Executive Officer
(Officer of The Charles Schwab Family of Funds, Schwab Investments, Schwab Capital Trust, Schwab Annuity Portfolios, Schwab Strategic Trust and Laudus Trust since 2010) | Director, President and Chief Executive Officer (Dec. 2010 – present), Chief Investment Officer (Sept. 2010 – Oct. 2011), Charles Schwab Investment Management, Inc.; Trustee (Jan. 2016 – present), President, Chief Executive Officer (Dec. 2010 – present), and Chief Investment Officer (Sept. 2010 – Oct. 2011), Schwab Funds, Laudus Funds and Schwab ETFs; Director, Charles Schwab Worldwide Funds plc and Charles Schwab Asset Management (Ireland) Limited (Jan. 2011 – present); Global Head of Fixed Income Business Division, BlackRock, Inc. (formerly Barclays Global Investors) (Mar. 2007 – Aug. 2010). |
Mark Fischer
1970
Treasurer and Chief Financial Officer
(Officer of The Charles Schwab Family of Funds, Schwab Investments, Schwab Capital Trust, Schwab Annuity Portfolios, Schwab Strategic Trust and Laudus Trust since 2013) | Treasurer and Chief Financial Officer, Schwab Funds, Laudus Funds and Schwab ETFs (Jan. 2016 – present); Assistant Treasurer, Schwab Funds and Laudus Funds (Dec. 2013 – Dec. 2015), Schwab ETFs (Nov. 2013 – Dec. 2015); Vice President, Charles Schwab Investment Management, Inc. (Oct. 2013 – present); Executive Director, J.P. Morgan Investor Services (Apr. 2011 – Sept. 2013); Assistant Treasurer, Massachusetts Financial Service Investment Management (May 2005 – Mar. 2011). |
Laudus Mondrian Funds | Annual Report
| Officers of the Trust (continued) |
Name, Year of Birth, and Position(s) with the trust
(Terms of office, and length of Time Served3) | Principal Occupations During the Past Five Years |
George Pereira
1964
Senior Vice President and Chief Operating Officer
(Officer of The Charles Schwab Family of Funds, Schwab Investments, Schwab Capital Trust and Schwab Annuity Portfolios since 2004; Laudus Trust since 2006; Schwab Strategic Trust since 2009) | Senior Vice President and Chief Financial Officer (Nov. 2004 – present), Chief Operating Officer (Jan. 2011 – present), Charles Schwab Investment Management, Inc.; Senior Vice President and Chief Operating Officer (Jan. 2016 – present), Treasurer and Chief Financial Officer, Laudus Funds (June 2006 – Dec. 2015); Treasurer and Principal Financial Officer, Schwab Funds (Nov. 2004 – Dec. 2015) and Schwab ETFs (Oct. 2009 – Dec. 2015); Director, Charles Schwab Worldwide Funds plc and Charles Schwab Asset Management (Ireland) Limited (Apr. 2005 – present). |
Omar Aguilar
1970
Senior Vice President and Chief Investment Officer – Equities and Multi-Asset Strategies
(Officer of The Charles Schwab Family of Funds, Schwab Investments, Schwab Capital Trust, Schwab Annuity Portfolios, Schwab Strategic Trust and Laudus Trust since 2011) | Senior Vice President and Chief Investment Officer – Equities and Multi-Asset Strategies, Charles Schwab Investment Management, Inc. (Apr. 2011 – present); Senior Vice President and Chief Investment Officer – Equities, Schwab Funds, Laudus Funds and Schwab ETFs (June 2011 – present); Head of the Portfolio Management Group and Vice President of Portfolio Management, Financial Engines, Inc. (May 2009 – Apr. 2011); Head of Quantitative Equity, ING Investment Management (July 2004 – Jan. 2009). |
Brett Wander
1961
Senior Vice President and Chief Investment Officer – Fixed Income
(Officer of The Charles Schwab Family of Funds, Schwab Investments, Schwab Capital Trust, Schwab Annuity Portfolios, Schwab Strategic Trust and Laudus Trust since 2011) | Senior Vice President and Chief Investment Officer – Fixed Income, Charles Schwab Investment Management, Inc. (Apr. 2011 – present); Senior Vice President and Chief Investment Officer – Fixed Income, Schwab Funds, Laudus Funds and Schwab ETFs (June 2011 – present); Senior Managing Director, Global Head of Active Fixed-Income Strategies, State Street Global Advisors (Jan. 2008 – Oct. 2010); Director of Alpha Strategies Loomis, Sayles & Company (Apr. 2006 – Jan. 2008). |
David Lekich
1964
Chief Legal Officer and Secretary, Schwab Funds and Schwab ETFs
Vice President and Assistant Clerk, Laudus Funds
(Officer of The Charles Schwab Family of Funds, Schwab Investments, Schwab Capital Trust, Schwab Annuity Portfolios, Schwab Strategic Trust and Laudus Trust since 2011) | Senior Vice President (Sept. 2011 – present), Vice President (Mar. 2004 – Sept. 2011), Charles Schwab & Co., Inc.; Senior Vice President and Chief Counsel (Sept. 2011 – present), Vice President (Jan. 2011 – Sept. 2011), Charles Schwab Investment Management, Inc.; Secretary (Apr. 2011 – present) and Chief Legal Officer (Dec. 2011 – present), Schwab Funds; Vice President and Assistant Clerk, Laudus Funds (Apr. 2011 – present); Secretary (May 2011 – present) and Chief Legal Officer (Nov. 2011 – present), Schwab ETFs. |
Catherine MacGregor
1964
Vice President and Assistant Secretary, Schwab Funds and Schwab ETFs
Chief Legal Officer, Vice President and Clerk, Laudus Funds
(Officer of The Charles Schwab Family of Funds, Schwab Investments, Schwab Capital Trust, Schwab Annuity Portfolios and Laudus Trust since 2005; Schwab Strategic Trust since 2009) | Vice President, Charles Schwab & Co., Inc., Charles Schwab Investment Management, Inc. (July 2005 – present); Vice President (Dec. 2005 – present), Chief Legal Officer and Clerk (Mar. 2007 – present), Laudus Funds; Vice President (Nov. 2005 – present) and Assistant Secretary (June 2007 – present), Schwab Funds; Vice President and Assistant Secretary, Schwab ETFs (Oct. 2009 – present). |
| 1 | Each Trustee shall hold office until the election and qualification of his or her successor, or until he or she dies, resigns or is removed. The retirement policy requires that each independent trustee retire by December 31 of the year in which the Trustee turns 74 or the Trustee’s twentieth year of service as an independent trustee on any trust in the Fund Complex, whichever occurs first. |
| 2 | Mr. Bettinger, Ms. Chandoha, and Mr. Martinetto are Interested Trustees because they own stock of The Charles Schwab Corporation, the parent company of the investment adviser. |
| 3 | The President, Treasurer and Secretary/Clerk hold office until their respective successors are chosen and qualified or until he or she sooner dies, resigns, is removed or becomes disqualified. Each of the other officers serves at the pleasure of the Board. |
Laudus Mondrian Funds | Annual Report
Bond is a security representing a loan from the investor to the issuer. A bond typically pays interest at a fixed rate (the coupon rate) until a specified date (the maturity date), at which time the issuer returns the money borrowed (principal or face value) to the bondholder. Because of their structure, bonds are sometimes called “fixed income securities” or “debt securities.”
An individual bond is subject to the credit risk of the issuer. Bond credit ratings are measured on a scale that generally ranges from AAA (highest) to D (lowest). Changes in interest rates can affect a bond’s market value prior to call or maturity. There is no guarantee that a bond’s yield to call or maturity will provide a positive return over the rate of inflation.
Citigroup Custom Emerging Markets Government Bond Index is an index that measures the performance of the government bonds of those countries designated as Emerging Markets by the International Monetary Fund; excluding the Philippines.
Citigroup non-US Dollar World Government Bond Index A market capitalization index that measures the total rate of return performance for the government bonds of 22 countries, excluding the U.S., with a remaining maturity of at least 1 year.
Citigroup World Government Bond Index A market capitalization index that measures the total rate of return performance for the government bonds of 23 countries, including the U.S., with a remaining maturity of at least 1 year.
Dividend yield is an expression of a stock’s market value in relationship to its dividend amount as a percentage. It is calculated by dividing the stock’s annual dividends by the market price of the stock.
Duration A measure of an individual bond’s sensitivity to interest rates. Calculations of duration generally take into account the bond’s yield, interest payments, maturity date and call features.
Weighted Average Duration A measure of the duration of all bonds in a fund’s portfolio, based on the market value weighted average duration of each bond in the portfolio.
Maturity The maturity of a bond will generally be determined using a portfolio security’s final maturity date (date on which the final principal payment of a bond is scheduled to be paid); however, for securitized products, such as mortgage-backed securities and certain other asset-backed securities, maturity will be determined on an average life basis (weighted average time to receipt of all principal payments) by the investment adviser. Because pre-payment rates of individual mortgage pools vary widely, the average life of a particular pool cannot be predicted precisely. For securities with embedded demand features,
such as puts or calls, either the demand date or the final maturity date will be used depending on interest rates, yields and other market conditions. The weighted average maturity (WAM) of a fund is dollar-weighted based upon the market value of a fund’s securities at the time of the calculation.
MSCI EAFE Index (Net) A free float-adjusted market capitalization index that is designed to measure the equity market performance of developed markets in Europe, Australasia, and the Far East. The Net version of the index reflects reinvested dividends net of withholding taxes, but reflects no deductions for expenses or other taxes; returns are calculated applying dividend withholding rates applicable to non-resident persons who do not benefit from double taxation treaties.
MSCI EAFE Value Index (Net) A free float-adjusted market capitalization index that is designed to measure large- and mid-cap securities exhibiting overall value style characteristics across developed markets countries around the world, excluding the U.S. and Canada. The value investment style characteristics for index construction are defined using three variables: book value to price, 12-month forward earnings to price and dividend yield. This series approximates the minimum possible dividend reinvestment. The returns are calculated applying dividend withholding rates applicable to non-resident persons who do not benefit from double taxation treaties.
MSCI Emerging Markets Index (Net) A free float-adjusted market capitalization weighted index that is designed to measure equity market performance in the global emerging markets. This series approximates the minimum possible dividend reinvestment. The returns are calculated applying dividend withholding rates applicable to non-resident persons who do not benefit from double taxation treaties.
Price to earnings ratio is the price of a stock divided by its historical earnings per share.
Price to book ratio compares the stock’s market value to the value of the total assets less the total liabilities.
Sovereign debt refers to debt issued by a national government within a given country and denominated in a foreign currency.
Trading Activity is one of several risk factors commonly used to attribute a portfolio’s return relative to its benchmark. Specifically, trading activity measures a stock’s trailing 12 month trading volume relative to its total shares outstanding. It measures how actively traded a stock has been in the last 12 months.
Weighted Average Market Cap A measure of the size of the companies in which a fund invests, based upon the market value of a fund’s securities each weighted according to its percent of the portfolio.
Laudus Mondrian Funds | Annual Report
PRIVACY NOTICE
THIS IS NOT PART OF THE SHAREHOLDER REPORT
A Commitment to Your Privacy
Your Privacy Is Not for Sale
We do not and will not sell your personal information to anyone, for any reason.
We are committed to protecting the privacy of information we maintain about you. Below are details about our commitment, including the types of information we collect and how we use and share that information. This Privacy Notice applies to you only if you are an individual who invests directly in the funds by placing orders through the funds’ transfer agent. If you place orders through your brokerage account at Charles Schwab & Co., Inc. or an account with another broker-dealer, investment advisor, 401(k) plan, employee benefit plan, administrator, bank or other financial intermediary, you are covered by the privacy policies of that financial institution and should consult those policies.
How We Collect Information About You
We collect personal information about you in a number of ways.
• APPLICATION AND REGISTRATION
INFORMATION.
We collect personal information from you when you open an account or utilize one of our services. We may also collect information about you from third parties such as consumer reporting agencies to verify your identity. The information we collect may include personal information, including your Social Security number, as well as details about your interests, investments and investment experience.
• TRANSACTION AND EXPERIENCE
INFORMATION.
Once your account has been opened, we collect and maintain personal information about your account activity, including your transactions, balances, positions and history. This information allows us to administer your account and provide the services you have requested.
• WEBSITE USAGE.
When you visit our websites, we may use devices known as “cookies,” graphic interchange format files (GIFs), or other similar web tools to enhance your web experience. These tools help us to recognize you, maintain your web session, and provide a more personalized experience. To learn more, please click the Privacy link on our website.
How We Share and Use Your Information
We provide access to information about you to our affiliated companies, outside companies and other third parties in certain limited circumstances, including:
• to help us process transactions for your account;
• when we use other companies to provide services for us, such as printing and mailing your account statements;
• when we believe that disclosure is required or permitted under law (for example, to cooperate with regulators or law enforcement, resolve consumer disputes, perform credit/authentication checks, or for risk control).
State Laws
We will comply with state laws that apply to the disclosure or use of information about you.
Safeguarding Your Information — Security Is a
Partnership
We take precautions to ensure the information we collect about you is protected and is accessed only by authorized individuals or organizations.
Companies we use to provide support services are not allowed to use information about our shareholders for their own purposes and are contractually obligated to maintain strict confidentiality. We limit their use of information to the performance of the specific services we have requested. We restrict access to personal information by our employees and agents. Our employees are trained about privacy and are required to safeguard personal information.
We maintain physical, electronic and procedural safeguards that comply with federal standards to guard your nonpublic personal information.
Contact Us
To provide us with updated information, report suspected fraud or identity theft, or for any other questions, please call the number below.
Laudus Funds® direct investors: 1-877-824-5615
© 2016 Laudus Funds. All rights reserved.
Laudus Mondrian Funds | Annual Report
Access to a select group of investment managers –
all in one fund family.
Laudus Funds offer investors access to some of the world's leading investment managers. With a rigorous manager selection process and ongoing oversight by Charles Schwab Investment Management, Laudus Funds offer single and multi-manager strategies as a complement to other funds managed by Charles Schwab Investment Management. The list below shows all currently available Laudus Funds.
An investor should consider a fund’s investment objectives, risks, charges and expenses carefully before investing or sending money. This and other important information can be found in the fund’s prospectus or, if available, the summary prospectus. Please call 1-877-824-5615 for a prospectus and brochure for any Laudus Fund. Please read the prospectus carefully before you invest. This report must be preceded or accompanied by a current prospectus.
Proxy Voting Policies, Procedures and Results
A description of the proxy voting policies and procedures used to determine how to vote proxies on behalf of the funds is available without charge, upon request, by visiting the Laudus Funds’ website at www.csimfunds.com/laudusfunds_prospectus, the SEC’s website at www.sec.gov, or by contacting Laudus Funds at 1-877-824-5615.
Information regarding how a fund voted proxies relating to portfolio securities during the most recent twelve-month period ended June 30 is available, without charge, by visiting the fund’s website at www.csimfunds.com/laudusfunds_prospectus or the SEC’s website at www.sec.gov.
The Laudus Funds®
Laudus U.S. Large Cap Growth
Laudus U.S. Large Cap Growth Fund
Laudus MarketMasters Funds®
Laudus International MarketMasters Fund™
Laudus Small-Cap MarketMasters Fund™
Laudus Mondrian Funds™
Laudus Mondrian International Equity Fund
Laudus Mondrian Emerging Markets Fund
Laudus Mondrian International Government Fixed Income Fund
Laudus Mondrian Global Government Fixed Income Fund
Investment Adviser
Charles Schwab Investment Management, Inc.
211 Main Street, San Francisco, CA 94105
Funds
Laudus Funds
1-877-824-5615
Printed on recycled paper.
Charles Schwab Investment Management, Inc. (CSIM) is the investment advisor for Laudus Funds. The Laudus Group of Funds includes the Laudus Mondrian Funds and Laudus U.S. Large Cap Growth Fund, which are part of the Laudus Trust and distributed by ALPS Distributors, Inc. (ALPS); and the Laudus MarketMasters Funds, which are part of the Schwab Capital Trust and distributed by Charles Schwab & Co., Inc. (Schwab), Member SIPC. Schwab and CSIM, affiliates and subsidiaries of The Charles Schwab Corporation, are not affiliated with ALPS.
This page is intentionally left blank.
Annual Report | March 31, 2017
Laudus U.S. Large Cap Growth Fund
Adviser
Charles Schwab Investment Management, Inc.
Subadviser
BlackRock Investment Management, LLC
This page is intentionally left blank.
Fund investment adviser: Charles Schwab Investment Management, Inc. (CSIM).
Distributor: ALPS Distributors, Inc.
The industry/sector classification of the fund’s portfolio holdings uses the Global Industry Classification Standard (GICS) which was developed by and is the exclusive property of MSCI and Standard & Poor’s. GICS is a service mark of MSCI and S&P and has been licensed for use by CSIM and certain affiliates. Charles Schwab & Co, Inc. and ALPS Distributors, Inc. are unaffiliated entities.
Laudus U.S. Large Cap Growth Fund | Annual Report
Laudus U.S. Large Cap Growth Fund
The performance data quoted represents past performance. Past performance does not guarantee future results. Investment returns and principal value of an investment will fluctuate so that an investor’s shares may be worth more or less than their original cost. Current performance may be lower or higher than performance data quoted. To obtain performance information current to the most recent month end, please visit www.csimfunds.com.
| Total Return for the 12 Months Ended March 31, 2017 |
| Laudus U.S. Large Cap Growth Fund (Ticker Symbol: LGILX) | 16.85% |
| Russell 1000® Growth Index | 15.76% |
| Performance Details | pages 6-8 |
All fund and index figures on this page assume dividends and distributions were reinvested. Index figures do not include trading and management costs, which would lower performance. Indices are unmanaged and cannot be invested in directly. Performance results less than one year are not annualized.
For index definitions, please see the Glossary.
Fund expenses may have been partially absorbed by CSIM. Without these reductions, the fund’s return would have been lower. This return does not reflect the deduction of taxes that a shareholder would pay on fund distributions or the redemption of fund shares.
Please see prospectus for further detail and investor eligibility requirements.
Laudus U.S. Large Cap Growth Fund | Annual Report
Laudus U.S. Large Cap Growth Fund
Marie Chandoha
President and CEO of
Charles Schwab Investment
Management, Inc. and the
fund covered in this report.
Dear Shareholder,
As tax season wraps up, I’ve been reflecting on the importance of process in our financial lives. Filing taxes can be challenging for those who don’t have a sound approach for handling their returns, and investing is the same way: your goals can be easier to attain when you have a disciplined and deliberate plan that you follow. At Charles Schwab Investment Management, we believe the Laudus U.S. Large Cap Growth Fund (the fund) can help with that process and can complement index funds in a diversified portfolio – and here’s why.
With no shortage of opinion in the current climate about whether the U.S. stock market will continue its strong run (it’s now in the eighth year of a bull run), we believe that active strategies may help distinguish between winners and losers during challenging market periods. We believe a good active manager should be able to process the constant stream of information, and filter out the noise. Active managers often have the flexibility to respond to changing markets: the manager can search for stocks that outperform the broader market index, or, in rough markets, adopt a more conservative posture and play defense. As a result, we believe that active managers can be a valuable part of an investor’s financial strategy, and we’re pleased that you have chosen the fund in pursuit of your own financial goals.
Blackrock Investment Management, LLC, the fund’s subadviser, has a reputation for disciplined and analytical approaches to fund management. The principal focus of the fund’s management team is to identify stocks whose intrinsic value is not yet fully recognized by the market. The stocks they select enjoy some form of inherent competitive advantage, such as a dominant market position, the potential to take market share in a relatively new industry, a differentiated patent portfolio, or another unique resource. Once those securities are in the fund’s portfolio, they’re subjected to regular analysis of factors such as earnings and sales trends to confirm that their perceived advantage remains intact.
Thank you for investing with Charles Schwab Investment Management, and for trusting us to help you achieve your financial goals. For more information about the fund, please continue reading this report. In addition, you can find further details about the fund by visiting our website at www.csimfunds.com. We are also happy to hear from you at 1-877-824-5615.
Sincerely,
“ With no shortage of opinion in the current climate about whether the U.S. stock market will continue its strong run (it’s now in the eighth year of a bull run), we believe that active strategies may help distinguish between winners and losers during challenging market periods.”
Charles Schwab & Co, Inc., BlackRock Investment Management, LLC, and ALPS Distributors, Inc. are unaffiliated entities.
Laudus U.S. Large Cap Growth Fund | Annual Report
Laudus U.S. Large Cap Growth Fund
The Investment Environment
Over the 12-month reporting period ended March 31, 2017, U.S. equities generated positive returns as the U.S. economy generally improved and market volatility quieted down. The Federal Reserve (Fed) raised the federal funds rate twice during the reporting period in December and in March, while expectations for increased infrastructure spending, tax reform, and reduced regulation from the Trump administration helped fuel a post-election stock market rally. In this environment, the S&P 500® Index, a bellwether for the overall U.S. stock market, returned 17.17%, while the Russell 1000® Growth Index and the Russell 1000® Value Index returned 15.76% and 19.22% respectively.
U.S. economic data was largely positive over the reporting period, especially toward the end of 2016 and in early 2017. Wage growth continued to trend upwards and outside of a sharp drop in May, nonfarm payroll numbers came in near or above expectations. The unemployment rate fell to below 5% in May, and in November, dropped further to the lowest level since before the 2008 financial crisis. Consumer confidence, as measured by the Conference Board Consumer Confidence Index®, also grew over the reporting period, hitting a 16-year high in March amid post-election optimism for U.S. economic growth. Meanwhile, the consumer-price index, a broad measure of inflation, moved above 2% in early 2017 for the first time in over two years.
Most markets steadied over the reporting period, despite brief periods of volatility tied in part to political developments around the globe. The United Kingdom’s (U.K.) June decision to leave the European Union (Brexit) triggered a global stock selloff and sent the price of oil sharply downward, while the British pound depreciated significantly versus the U.S. dollar. Most markets stabilized in the days and weeks that followed, and concerns surrounding the future of the U.K. lessened in early 2017 as a feasible exit plan began to take shape. Meanwhile, U.S. election-related volatility picked up in the middle of the reporting period and through Election Day in early November, when U.S. equity futures dropped sharply shortly after the election results were announced. Stock markets rebounded almost immediately the following day, however, and generally maintained an upward trajectory throughout the remainder of the reporting period. Expectations for new policies from the Trump administration supported a positive growth outlook, and contributed to the solid performance of many U.S. stocks.
U.S. short-term interest rates remained low over the reporting period, although the Fed took steps toward a more normalized interest rate environment. With unsteady global economic growth, low inflation, and room for improvement in the labor market, the Fed left the federal funds rate unchanged at each of its meetings through November. Then in December, with progress in several key economic measurements, the Fed raised the federal funds rate for only the second time in 10 years. As global growth continued to show signs of stability and labor market conditions strengthened, combined with an uptick in inflation, the Fed again raised the federal funds rate in March. As both of these rate hikes were already priced into global equity markets, the response to these changes was muted. However, the Fed’s moves confirmed its confidence in the health and direction of the U.S. economy.
Economic growth outside the U.S. began to show signs of improvement toward the end of the reporting period, suggesting that accommodative monetary policies from central banks in both Europe and Asia were working as hoped. Eurozone economic activity slowed in the second quarter of 2016 and was flat in the third quarter, but surprisingly robust fourth quarter estimates indicated a turnaround for that region, driven by strong numbers from Germany, Spain, and France. At the same time, the U.K. economy performed better than expected in the months following the Brexit vote as a feasible exit plan materialized, and the entire eurozone bloc had exited deflation by the end of January 2017. In Japan, economic growth accelerated and consumer prices fell at a slower pace, with inflation on track to hit the target of 2% in the next two years.
Laudus U.S. Large Cap Growth Fund | Annual Report
Laudus U.S. Large Cap Growth Fund
The Investment Environment (continued)
Over the reporting period, most sectors generated positive returns. The Financials sector was the top performer in the Russell 1000® Growth Index. Many companies in this sector benefitted from the Fed’s two federal funds rate increases in December and in March, as well as from potential policy changes regarding reduced regulation, fiscal stimulus, and tax reform from the Trump administration. In contrast, the only sector with negative returns in the Russell 1000® Growth Index was the Telecommunication Services sector, as rising interest rates lessened the relative appeal of traditional dividend-paying sectors.
Index figures assume dividends and distributions were reinvested. Index figures do not include trading and management costs, which would lower performance. Indices are unmanaged and cannot be invested in directly. Performance results less than one year are not annualized. Past performance is not an indication of future results.
For index definitions, please see the Glossary.
Nothing in this report represents a recommendation of a security by the investment adviser.
Management views may have changed since the report date.
Laudus U.S. Large Cap Growth Fund | Annual Report
Laudus U.S. Large Cap Growth Fund
The Laudus U.S. Large Cap Growth Fund (the fund) seeks long-term capital appreciation. Under normal circumstances, the fund invests at least 80% of its net assets (plus borrowings for investment purposes, if any) in equity securities of U.S. large-capitalization companies. For more information concerning the fund’s investment objective, strategies, and risks, please see the prospectus.
Market Highlights. U.S. stocks performed well over the reporting period, due in large part to a post-election rally fueled by expectations of tax reform, increased infrastructure spending, and financial deregulation from the Trump administration. Oil and commodity prices stabilized, and concerns surrounding China’s decelerating economy and Brexit subsided. The Federal Reserve raised the federal funds rate twice over the reporting period amid generally solid U.S. economic measures and a slight uptick in inflation. Overall, large-cap stocks underperformed small-cap stocks, while value stocks generally outperformed growth stocks. From a sector perspective, stocks in the Financials and Energy sectors were some of the better performers in the Russell 1000® Growth Index, while Telecommunication Services and Consumer Staples stocks underperformed by comparison.
Performance. The fund returned 16.85% for the 12-month reporting period ended March 31, 2017. For performance comparisons, the fund uses the Russell 1000 Growth Index (the index), which returned 15.76% for the same period.
Positioning and Strategies. Over the reporting period, decisions to overweight or underweight certain stocks or sectors contributed to the fund’s outperformance relative to the index. In addition, overall stock selection also positively contributed.
The fund’s overweight position in Amazon.com, Inc. was among the largest contributors to the fund’s relative performance. The fund’s holdings of Amazon returned approximately 49%, as the persistent underperformance of traditional brick and mortar retailers kept investors’ focus on Amazon’s strong market position and continued growth opportunities. Netflix, Inc. also contributed to the fund’s performance relative to the index, with the fund’s overweight position in Netflix returning approximately 45% over the reporting period. Netflix performed well as the company solidified its position as a global leader in subscription video on-demand. More recently, the company issued subscriber guidance that far exceeded expectations and generated strong financial results that included an upward revised growth outlook for the first quarter of 2017.
By comparison, the fund’s underweight position in Apple, Inc. was among the largest detractors from the fund’s performance relative to the index. Apple, Inc. returned approximately 35% for both the fund and the index over the reporting period, and so the fund’s underweight position in Apple, Inc. detracted from the fund’s relative performance. Anheuser-Busch InBev SA/NV was another detractor from the fund’s performance relative to the index, and also detracted from the fund’s total return. This stock is not included in the index, and so the 12% return of the fund’s holdings of sponsored American depositary receipts of Anheuser-Busch InBev SA/NV weighed on relative performance. (Please note the investment adviser sold this position prior to the end of the reporting period.)
From a sector perspective, stock selection within the Consumer Discretionary sector contributed the most to the fund’s relative performance, with the fund’s holdings in this sector returning approximately 24%. The fund’s overweight position in the Energy sector relative to the benchmark also contributed. In contrast, both stock selection and the fund’s slight overweight to the Health Care sector detracted from relative performance, with the fund’s holdings in this sector returning approximately 7%. Stock selection within the Information Technology sector also detracted.
Over the reporting period, the subadviser made several changes to the fund’s positioning. Due to a combination of portfolio trading activity and market movements during the reporting period, the subadviser increased the fund’s weighting in the Consumer Discretionary sector. The subadviser also increased the fund’s exposure to the Health Care sector, and significantly decreased the fund’s exposure to the Consumer Staples sector.
| Fund Characteristics | |
| Number of Securities1 | 55 |
| Weighted Average Market Cap (millions) | $199,581 |
| Price/Earnings Ratio (P/E) | 33.66 |
| Price/Book Ratio (P/B) | 4.87 |
Portfolio Turnover
(One year trailing) | 73% |
| Fund Overview | |
| | Fund |
| Minimum Initial Investment | $100 |
| Inception Date | 10/14/1997 * |
| Ticker Symbol | LGILX |
| Cusip | 51855Q549 |
| NAV | $18.12 |
Management views and portfolio holdings may have changed since the report date.
| * | Inception date is that of the fund’s predecessor fund, the Y Class of the UBS U.S. Large Cap Growth Fund. |
| 1 | Short-term investments are not included. |
Laudus U.S. Large Cap Growth Fund | Annual Report
Laudus U.S. Large Cap Growth Fund
Performance and Fund Facts as of 3/31/17
Past performance does not guarantee future results. The performance data quoted represents past performance, and current returns may be lower or higher. The performance information does not reflect the deduction of taxes that a shareholder would pay on fund distributions or the redemption of fund shares. The investment return and principal value of an investment will fluctuate so that an investor’s shares, when redeemed, may be worth more or less than the original cost. To obtain performance information current to the most recent month end, visit www.csimfunds.com.
Performance of Hypothetical Investment (March 31, 2007 – March 31, 2017)1
Average Annual Total Returns
| Fund and Inception Date | 1 Year | 5 Years | 10 Years |
| Laudus U.S. Large Cap Growth Fund (10/14/97)1 | 16.85% | 11.86% | 10.08% |
| Russell 1000® Growth Index | 15.76% | 13.32% | 9.13% |
| Fund Expense Ratio2: 0.75% |
Total returns include change in share price and reinvestment of distributions. Total returns may reflect the waiver of a portion of the fund’s advisory fees for certain periods since the inception date. In such instances, and without the waiver of fees, total returns would have been lower. Performance results less than one year are not annualized.
For index definitions, please see the Glossary.
| 1 | The Laudus U.S. Large Cap Growth Fund was launched on 7/13/09. The fund was formerly known as UBS U.S. Large Cap Growth Fund. The performance and returns prior to 7/13/09 reflect the returns of UBS U.S. Large Cap Growth Fund, Class Y Shares. |
| 2 | As stated in the prospectus. Please see the prospectus for more information. For actual rates during the period, refer to the Financial Highlights section of the Financial Statements. |
Laudus U.S. Large Cap Growth Fund | Annual Report
Laudus U.S. Large Cap Growth Fund
Performance and Fund Facts as of 3/31/17 (continued)
Sector Weightings % of Equities
Top Equity Holdings % of Net Assets1
Portfolio holdings may have changed since the report date.
| 1 | This list is not a recommendation of any security by the investment adviser or subadviser. |
Laudus U.S. Large Cap Growth Fund | Annual Report
Laudus U.S. Large Cap Growth Fund
Fund Expenses (Unaudited)
Examples for a $1,000 Investment
As a fund shareholder, you may incur two types of costs: (1) transaction costs; and (2) ongoing costs, including management fees, transfer agent and shareholder services fees, and other fund expenses.
The expense examples below are intended to help you understand your ongoing cost (in dollars) of investing in the fund and to compare this cost with the ongoing cost of investing in other mutual funds. These examples are based on an investment of $1,000 invested for the period beginning October 1, 2016 and held through March 31, 2017.
Actual Return lines in the table below provide information about actual account values and actual expenses. You may use this information, together with the amount you invested, to estimate the expenses that you paid over the period. To do so, simply divide your account value by $1,000 (for example, an $8,600 account value ÷ $1,000 = 8.6), then multiply the result by the number given for your fund under the heading entitled “Expenses Paid During Period.”
Hypothetical Return lines in the table below provide information about hypothetical account values and hypothetical expenses based on the fund’s actual expense ratio and an assumed return of 5% per year before expenses. Because the return used is not an actual return, it may not be used to estimate the actual ending account value or expenses you paid for the period.
You may use this information to compare the ongoing costs of investing in the fund and other funds. To do so, compare this 5% hypothetical example with the 5% hypothetical examples that appear in the shareholder reports of the other funds.
Please note that the expenses shown in the table are meant to highlight your ongoing costs only, and do not reflect any transactional costs. Therefore, the hypothetical return lines of the table are useful in comparing ongoing costs only, and will not help you determine the relative total costs of owning different funds. In addition, if these transactional costs were included, your costs would have been higher.
| | Expense Ratio
(Annualized)1 | Beginning
Account Value
at 10/1/16 | Ending
Account Value
(Net of Expenses)
at 3/31/17 | Expenses Paid
During Period
10/1/16-3/31/172 |
| Laudus U.S. Large Cap Growth Fund | | | | |
| Actual Return | 0.75% | $1,000.00 | $1,071.90 | $3.87 |
| Hypothetical 5% Return | 0.75% | $1,000.00 | $1,021.16 | $3.78 |
| 1 | Based on the most recent six-month expense ratio; may differ from the expense ratio provided in the Financial Highlights which covers a 12- month period. |
| 2 | Expenses for the fund are equal to its annualized expense ratio, multiplied by the average account value over the period, multiplied by the 182 days of the period, and divided by the 365 days of the fiscal year. |
Laudus U.S. Large Cap Growth Fund | Annual Report
Laudus U.S. Large Cap Growth Fund
Financial Statements
Financial Highlights
| | 4/1/16–
3/31/17 | 4/1/15–
3/31/16 | 4/1/14–
3/31/15 | 4/1/13–
3/31/14 | 4/1/12–
3/31/13 | |
| Per-Share Data |
| Net asset value at beginning of period | $15.76 | $17.22 | $18.19 | $15.58 | $14.83 | |
| Income (loss) from investment operations: | | | | | | |
| Net investment income (loss)1 | 0.00 2 | (0.01) | (0.01) | (0.02) | 0.02 | |
| Net realized and unrealized gains (losses) | 2.63 | (0.37) | 2.44 | 3.85 | 1.01 | |
| Total from investment operations | 2.63 | (0.38) | 2.43 | 3.83 | 1.03 | |
| Less distributions: | | | | | | |
| Distributions from net investment income | — | — | — | — | (0.02) | |
| Distributions from net realized gains | (0.27) | (1.08) | (3.40) | (1.22) | (0.26) | |
| Total distributions | (0.27) | (1.08) | (3.40) | (1.22) | (0.28) | |
| Net asset value at end of period | $18.12 | $15.76 | $17.22 | $18.19 | $15.58 | |
| Total return | 16.85% | (2.50%) | 14.99% | 24.81% | 7.09% | |
| Ratios/Supplemental Data |
| Ratios to average net assets: | | | | | | |
| Net operating expenses | 0.76% | 0.75% | 0.77% | 0.78% 3 | 0.78% | |
| Gross operating expenses | 0.76% | 0.75% | 0.77% | 0.78% | 0.82% | |
| Net investment income (loss) | 0.03% | (0.04%) | (0.06%) | (0.12%) | 0.13% | |
| Portfolio turnover rate | 73% | 82% | 102% | 124% | 76% | |
| Net assets, end of period (x 1,000) | $1,667,059 | $1,969,169 | $2,171,783 | $2,122,365 | $1,695,291 | |
| |
1
Calculated based on the average shares outstanding during the period.
2
Per-share amount was less than $0.005.
3
The ratio of net operating expenses would have been 0.77%, if certain non-routine expenses had not been incurred.
Laudus U.S. Large Cap Growth Fund | Annual Report
Laudus U.S. Large Cap Growth Fund
Portfolio Holdings as of March 31, 2017
This section shows all the securities in the fund's portfolio and their values as of the report date.
The fund files its complete schedule of portfolio holdings with the SEC for the first and third quarters of each fiscal year on Form N-Q. The fund's Form N-Q is available on the SEC's website at www.sec.gov and may be viewed and copied at the SEC's Public Reference Room in Washington, D.C. Call 1-800-SEC-0330 for information on the operation of the Public Reference Room. The fund also makes available its complete schedule of portfolio holdings 30 days after calendar quarters on the fund's website at www.csimfunds.com/laudusfunds_prospectus.
| Holdings by Category | Cost ($) | Value ($) |
| 99.6% | Common Stock | 1,278,848,320 | 1,661,378,981 |
| 0.4% | Other Investment Company | 6,298,694 | 6,298,694 |
| 100.0% | Total Investments | 1,285,147,014 | 1,667,677,675 |
| (0.0%) | Other Assets and Liabilities, Net | | (618,339) |
| 100.0% | Net Assets | | 1,667,059,336 |
| Security | Number
of Shares | Value ($) |
| Common Stock 99.6% of net assets |
| |
| Banks 4.9% |
| Bank of America Corp. | 1,512,527 | 35,680,512 |
| Citigroup, Inc. | 233,815 | 13,986,813 |
| First Republic Bank | 116,264 | 10,906,726 |
| SunTrust Banks, Inc. | 112,489 | 6,220,642 |
| Wells Fargo & Co. | 275,868 | 15,354,813 |
| | | 82,149,506 |
| |
| Capital Goods 3.8% |
| Acuity Brands, Inc. | 139,463 | 28,450,452 |
| Roper Technologies, Inc. | 90,313 | 18,648,731 |
| TransDigm Group, Inc. | 70,305 | 15,478,349 |
| | | 62,577,532 |
| |
| Commercial & Professional Supplies 1.5% |
| Equifax, Inc. | 186,733 | 25,533,870 |
| |
| Consumer Durables & Apparel 3.0% |
| NIKE, Inc., Class B | 885,465 | 49,346,965 |
| |
| Consumer Services 1.5% |
| Chipotle Mexican Grill, Inc. * | 13,853 | 6,171,788 |
| Domino's Pizza, Inc. | 103,529 | 19,080,395 |
| | | 25,252,183 |
| |
| Diversified Financials 1.5% |
| Berkshire Hathaway, Inc., Class B * | 148,410 | 24,736,979 |
| |
| Energy 1.3% |
| EOG Resources, Inc. | 68,950 | 6,726,072 |
| Pioneer Natural Resources Co. | 83,786 | 15,603,467 |
| | | 22,329,539 |
| |
| Food, Beverage & Tobacco 2.5% |
| Constellation Brands, Inc., Class A | 256,083 | 41,503,372 |
| |
| Health Care Equipment & Services 8.5% |
| Becton, Dickinson & Co. | 135,017 | 24,767,518 |
| Boston Scientific Corp. * | 873,190 | 21,716,235 |
| Security | Number
of Shares | Value ($) |
| Humana, Inc. | 104,242 | 21,488,446 |
| UnitedHealth Group, Inc. | 448,449 | 73,550,121 |
| | | 141,522,320 |
| |
| Materials 2.0% |
| Monsanto Co. | 88,686 | 10,039,255 |
| The Sherwin-Williams Co. | 76,798 | 23,821,972 |
| | | 33,861,227 |
| |
| Pharmaceuticals, Biotechnology & Life Sciences 7.6% |
| Alexion Pharmaceuticals, Inc. * | 437,668 | 53,062,868 |
| Biogen, Inc. * | 111,631 | 30,522,148 |
| Celgene Corp. * | 142,133 | 17,685,609 |
| Regeneron Pharmaceuticals, Inc. * | 32,236 | 12,491,773 |
| Zoetis, Inc. | 256,145 | 13,670,459 |
| | | 127,432,857 |
| |
| Real Estate 2.6% |
| Equinix, Inc. | 51,017 | 20,425,677 |
| SBA Communications Corp. * | 186,422 | 22,439,616 |
| | | 42,865,293 |
| |
| Retailing 17.5% |
| Amazon.com, Inc. * | 143,397 | 127,127,176 |
| Dollar Tree, Inc. * | 87,410 | 6,858,188 |
| Netflix, Inc. * | 368,616 | 54,485,131 |
| The Home Depot, Inc. | 240,614 | 35,329,354 |
| The Priceline Group, Inc. * | 30,413 | 54,134,228 |
| Ulta Salon, Cosmetics & Fragrance, Inc. * | 51,508 | 14,691,627 |
| | | 292,625,704 |
| |
| Semiconductors & Semiconductor Equipment 4.4% |
| ASML Holding N.V. — Reg’d | 281,872 | 37,432,601 |
| Broadcom Ltd. | 130,822 | 28,644,785 |
| NVIDIA Corp. | 66,934 | 7,291,121 |
| | | 73,368,507 |
| |
| Software & Services 33.8% |
| Activision Blizzard, Inc. | 647,785 | 32,298,560 |
| Adobe Systems, Inc. * | 182,556 | 23,756,012 |
| Alibaba Group Holding Ltd. ADR * | 153,773 | 16,581,342 |
| Alphabet, Inc., Class A * | 140,560 | 119,166,768 |
| Autodesk, Inc. * | 290,873 | 25,151,788 |
| Cognizant Technology Solutions Corp., Class A * | 284,114 | 16,910,465 |
| Facebook, Inc., Class A * | 365,648 | 51,940,298 |
| FleetCor Technologies, Inc. * | 124,988 | 18,926,933 |
| Global Payments, Inc. | 367,101 | 29,617,709 |
| Microsoft Corp. | 1,303,667 | 85,859,509 |
| salesforce.com, Inc. * | 196,576 | 16,215,554 |
| Snap, Inc., Class A * | 370,373 | 8,344,504 |
| Tencent Holdings Ltd. | 1,571,400 | 45,271,254 |
Laudus U.S. Large Cap Growth Fund | Annual Report
Laudus U.S. Large Cap Growth Fund
Portfolio Holdings as of March 31, 2017 (continued)
| Security | Number
of Shares | Value ($) |
| Vantiv, Inc., Class A * | 311,164 | 19,951,836 |
| Visa, Inc., Class A | 607,416 | 53,981,060 |
| | | 563,973,592 |
| |
| Technology Hardware & Equipment 2.7% |
| Apple, Inc. | 311,302 | 44,721,645 |
| |
| Telecommunication Services 0.5% |
| Zayo Group Holdings, Inc. * | 230,331 | 7,577,890 |
| Total Common Stock |
| (Cost $1,278,848,320) | | 1,661,378,981 |
|
| Other Investment Company 0.4% of net assets |
| |
| Money Market Fund 0.4% |
| State Street Institutional U.S. Government Money Market Fund, Premier Class 0.62% (a) | 6,298,694 | 6,298,694 |
| Total Other Investment Company |
| (Cost $6,298,694) | | 6,298,694 |
End of Investments.
At 03/31/17, the tax basis cost of the fund's investments was $1,289,491,934 and the unrealized appreciation and depreciation were $380,459,848 and ($2,274,107), respectively, with a net unrealized appreciation of $378,185,741.
At 03/31/17, the value of a foreign security held by the fund totaling $45,271,254 was adjusted from its closing market value in accordance with international fair valuation procedures approved by the fund's Board of Trustees. (See financial note 2(a) for additional information).
| * | Non-income producing security. |
| (a) | The rate shown is the 7-day yield. |
| | |
| ADR — | American Depositary Receipt |
| Reg'd — | Registered |
The following is a summary of the inputs used to value the fund’s investments as of March 31, 2017 (see financial note 2(a) for additional information):
| Description | Quoted Prices in
Active Markets for
Identical Assets
(Level 1) | Other Significant
Observable Inputs
(Level 2) | Significant
Unobservable Inputs
(Level 3) | Total | |
| Common Stock1 | $1,097,405,389 | $— | $— | $1,097,405,389 | |
| Software & Services | 518,702,338 | 45,271,254 | — | 563,973,592 | |
| Other Investment Company1 | 6,298,694 | — | — | 6,298,694 | |
| Total | $1,622,406,421 | $45,271,254 | $— | $1,667,677,675 | |
| 1 | As categorized in Portfolio Holdings. |
The fund’s policy is to recognize transfers between Level 1, Level 2 and Level 3 as of the beginning of the fiscal year. There were no transfers between Level 1, Level 2 and Level 3 for the period ended March 31, 2017.
Laudus U.S. Large Cap Growth Fund | Annual Report
Laudus U.S. Large Cap Growth Fund
Statement of Assets and Liabilities
As of March 31, 2017
| Assets |
| Investments, at value (cost $1,285,147,014) | | $1,667,677,675 |
| Foreign currency, at value (cost $46) | | 46 |
| Receivables: | | |
| Fund shares sold | | 1,211,676 |
| Dividends | | 389,597 |
| Prepaid expenses | + | 33,274 |
| Total assets | | 1,669,312,268 |
| Liabilities |
| Payables: | | |
| Fund shares redeemed | | 1,005,293 |
| Investment adviser fees | | 911,659 |
| Due to custodian | | 352 |
| Accrued expenses | + | 335,628 |
| Total liabilities | | 2,252,932 |
| Net Assets |
| Total assets | | 1,669,312,268 |
| Total liabilities | – | 2,252,932 |
| Net assets | | $1,667,059,336 |
| Net Assets by Source | | |
| Capital received from investors | | 1,155,446,616 |
| Net investment loss | | (11,474) |
| Net realized capital gains | | 129,093,533 |
| Net unrealized capital appreciation | | 382,530,661 |
| Net Asset Value (NAV) |
| Net Assets | ÷ | Shares
Outstanding | = | NAV |
| $1,667,059,336 | | 92,011,977 | | $18.12 |
| | | | | |
Laudus U.S. Large Cap Growth Fund | Annual Report
Laudus U.S. Large Cap Growth Fund
Statement of Operations
For the period April 1, 2016 through March 31, 2017
| Investment Income |
| Dividends (net of foreign withholding tax of $248,033) | | $14,513,642 |
| Expenses |
| Investment adviser fees | | 11,723,622 |
| Sub-accounting and sub-transfer agent fees | | 1,476,911 |
| Transfer agent fees | | 306,191 |
| Registration fees | | 84,777 |
| Custodian fees | | 75,088 |
| Accounting and administration fees | | 74,780 |
| Shareholder reports | | 68,664 |
| Professional fees | | 59,777 |
| Independent trustees' fees | | 52,802 |
| Interest expense | | 16,881 |
| Other expenses | + | 39,064 |
| Total expenses | – | 13,978,557 |
| Net investment income | | 535,085 |
| Realized and Unrealized Gains (Losses) |
| Net realized gains on investments | | 167,375,646 |
| Net realized gains on foreign currency transactions | + | 1,274 |
| Net realized gains | | 167,376,920 |
| Net change in unrealized appreciation (depreciation) on investments | | 108,508,473 |
| Net change in unrealized appreciation (depreciation) on foreign currency translations | + | (678) |
| Net change in unrealized appreciation (depreciation) | + | 108,507,795 |
| Net realized and unrealized gains | | 275,884,715 |
| Increase in net assets resulting from operations | | $276,419,800 |
Laudus U.S. Large Cap Growth Fund | Annual Report
Laudus U.S. Large Cap Growth Fund
Statement of Changes in Net Assets
For the current and prior report periods
| Operations | |
| | 4/1/16-3/31/17 | 4/1/15-3/31/16 |
| Net investment income (loss) | | $535,085 | ($832,463) |
| Net realized gains | | 167,376,920 | 35,121,575 |
| Net change in unrealized appreciation (depreciation) | + | 108,507,795 | (85,429,573) |
| Increase (decrease) in net assets from operations | | 276,419,800 | (51,140,461) |
| Distributions to Shareholders | |
| Distributions from net realized gains | | ($28,536,521) | ($135,764,007) |
| Transactions in Fund Shares | | | |
| | | 4/1/16-3/31/17 | 4/1/15-3/31/16 |
| | | SHARES | VALUE | SHARES | VALUE |
| Shares sold | | 12,060,635 | $201,863,903 | 28,513,967 | $480,079,820 |
| Shares reinvested | | 1,481,964 | 24,659,880 | 8,112,711 | 134,103,107 |
| Shares redeemed | + | (46,461,188) | (776,516,242) | (37,818,691) | (629,893,215) |
| Net transactions in fund shares | | (32,918,589) | ($549,992,459) | (1,192,013) | ($15,710,288) |
| Shares Outstanding and Net Assets | | | |
| | | 4/1/16-3/31/17 | 4/1/15-3/31/16 |
| | | SHARES | NET ASSETS | SHARES | NET ASSETS |
| Beginning of period | | 124,930,566 | $1,969,168,516 | 126,122,579 | $2,171,783,272 |
| Total decrease | + | (32,918,589) | (302,109,180) | (1,192,013) | (202,614,756) |
| End of period | | 92,011,977 | $1,667,059,336 | 124,930,566 | $1,969,168,516 |
| Net investment loss | | | ($11,474) | | ($186,198) |
Laudus U.S. Large Cap Growth Fund | Annual Report
Laudus U.S. Large Cap Growth Fund
1. Business Structure of the Funds:
Laudus U.S. Large Cap Growth Fund is a series of Laudus Trust (the trust), a no-load, open-end management investment company. The trust is organized as a Massachusetts business trust and is registered under the Investment Company Act of 1940, as amended (the 1940 Act). The list below shows all the funds in the trust as of the end of the period, including the fund discussed in this report, which is highlighted:
| LAUDUS TRUST (ORGANIZED APRIL 1, 1988) |
| Laudus U.S. Large Cap Growth Fund | |
| Laudus Mondrian International Equity Fund | |
| Laudus Mondrian Emerging Markets Fund | |
| Laudus Mondrian International Government Fixed Income Fund | |
| Laudus Mondrian Global Government Fixed Income Fund | |
The Laudus U.S. Large Cap Growth Fund offers one share class. Shares are bought and sold (subject to a redemption fee, see financial note 9) at closing net asset value per share (NAV), which is the price for all outstanding shares of the fund.
The fund maintains its own account for purposes of holding assets and accounting, and is considered a separate entity for tax purposes. Within its account, the fund may also keep certain assets in segregated accounts, as required by securities law.
2. Significant Accounting Policies:
The following is a summary of the significant accounting policies the fund uses in its preparation of financial statements. The fund follows the investment company accounting and reporting guidance of the Financial Accounting Standards Board (FASB) Accounting Standard Codification Topic 946 Financial Services — Investment Companies. The accounting policies are in conformity with accounting principles generally accepted in the United States of America (GAAP).
The fund invests in certain other investment companies (underlying funds). For more information about the underlying funds’ operations and policies, please refer to those funds’ semiannual and annual reports, which are filed with the U.S. Securities and Exchange Commission (SEC).
(a) Security Valuation:
Under procedures approved by the fund’s Board of Trustees (the Board), the investment adviser has formed a Pricing Committee to administer the pricing and valuation of portfolio securities and other assets and to ensure that prices used for internal purposes or provided by third parties reasonably reflect fair market value. Among other things, these procedures allow the fund to utilize independent pricing services, quotations from securities and financial instrument dealers and other market sources to determine fair value.
The fund values the securities in its portfolio every business day. The fund uses the following policies to value various types of securities:
• Securities traded on an exchange or over-the-counter: Traded securities are valued at the closing value for the day, or, on days when no closing value has been reported, at the mean of the most recent bid and ask quotes. Securities that are primarily traded on foreign exchanges are valued at the official closing price or the last sales price on the exchange where the securities are principally traded with these values then translated into U.S. dollars at the current exchange rate, unless these securities are fair valued as discussed below.
• Securities for which no quoted value is available: The Board has adopted procedures to fair value the fund’s securities when market prices are not “readily available” or are unreliable. For example, the fund may fair value a security when it is de-listed or its trading is halted or suspended; when a security’s primary pricing source is unable or unwilling to provide a price; or when a security’s primary trading market is closed during regular market hours. The fund makes fair value determinations in good faith in accordance with the fund’s valuation procedures. The Pricing Committee considers a number of factors, including unobservable market inputs when arriving at fair value. The Pricing Committee may employ techniques such as the review of related or comparable assets or liabilities, related market activities, recent transactions, market multiples, book values, transactional back-testing, disposition analysis and other relevant information. The Pricing Committee regularly reviews these inputs and assumptions to calibrate the valuations. Due to the subjective and variable nature of fair value pricing, there can be no assurance that the fund could obtain the fair value assigned to the security upon the sale of such security. The Board convenes on a regular basis to review fair value determinations made by the fund pursuant to the valuation procedures.
Laudus U.S. Large Cap Growth Fund | Annual Report
Laudus U.S. Large Cap Growth Fund
Financial Notes (continued)
2. Significant Accounting Policies (continued):
• Foreign equity security fair valuation: The Board has adopted procedures to fair value foreign equity securities that are traded in markets that close prior to the fund valuing its holdings. By fair valuing securities whose prices may have been affected by events occurring after the close of trading, the fund seeks to establish prices that investors might expect to realize upon the current sales of these securities. This methodology is designed to deter “arbitrage” market timers, who seek to exploit delays between the change in the value of the fund’s portfolio holdings and the NAV of the fund’s shares, and seeks to help ensure that the prices at which the fund’s shares are purchased and redeemed are fair and do not result in dilution of shareholder interest or other harm to shareholders. When fair value pricing is used at the open or close of a reporting period, it may cause a temporary divergence between the return of the fund and that of its comparative index or benchmark. The Board regularly reviews fair value determinations made by the fund pursuant to these procedures.
• Underlying funds: Mutual funds are valued at their respective NAVs.
In accordance with the authoritative guidance on fair value measurements and disclosures under GAAP, the fund discloses the fair value of its investments in a hierarchy that prioritizes the significant inputs to valuation techniques used to measure the fair value. The hierarchy gives the highest priority to valuations based upon unadjusted quoted prices in active markets for identical assets or liabilities (Level 1 measurements) and the lowest priority to valuations based upon unobservable inputs that are significant to the valuation (Level 3 measurements). If inputs used to measure the financial instruments fall within different levels of the hierarchy, the categorization is based on the lowest level input that is significant to the valuation. If the fund determines that either the volume and/or level of activity for an asset or liability has significantly decreased (from normal conditions for that asset or liability) or price quotations or observable inputs are not associated with orderly transactions, increased analysis and management judgment will be required to estimate fair value.
The three levels of the fair value hierarchy are as follows:
• Level 1—quoted prices in active markets for identical securities—Investments whose values are based on quoted market prices in active markets, and whose values are therefore classified as Level 1 prices, include active listed equities. Investments in mutual funds are valued daily at their NAVs, which are classified as Level 1 prices, without consideration to the classification level of the specific investments held by an underlying fund.
• Level 2—other significant observable inputs (including quoted prices for similar securities, interest rates, prepayment speeds, credit risk, etc.)—Investments that trade in markets that are not considered to be active, but whose values are based on quoted market prices, dealer quotations or valuations provided by alternative pricing sources supported by observable inputs are classified as Level 2 prices. These generally include U.S. government and sovereign obligations, most government agency securities, investment-grade corporate bonds, certain mortgage products, less liquid listed equities, and state, municipal and provincial obligations. In addition, international securities whose markets close hours before the fund values its holdings may require fair valuations due to significant movement in the U.S. markets occurring after the daily close of the foreign markets. The Board has approved a vendor that calculates fair valuations of international equity securities based on a number of factors that appear to correlate to the movements in the U.S. markets.
• Level 3—significant unobservable inputs (including the fund’s own assumptions in determining the fair value of investments)—Investments whose values are classified as Level 3 prices have significant unobservable inputs, as they may trade infrequently or not at all. When observable prices are not available for these securities, the fund uses one or more valuation techniques for which sufficient and reliable data is available. The inputs used by the fund in estimating the value of Level 3 prices may include the original transaction price, quoted prices for similar securities or assets in active markets, completed or pending third-party transactions in the underlying investment or comparable issuers, and changes in financial ratios or cash flows. Level 3 prices may also be adjusted to reflect illiquidity and/or non-transferability, with the amount of such discount estimated by the fund in the absence of market information. Assumptions used by the fund due to the lack of observable inputs may significantly impact the resulting fair value and therefore the fund’s results of operations.
The inputs or methodology used for valuing securities are not necessarily an indication of the risk associated with investing in those securities.
The levels associated with valuing the fund’s investments as of March 31, 2017 are disclosed in the Portfolio Holdings.
(b) Security Transactions:
Security transactions are recorded as of the date the order to buy or sell the security is executed. Realized gains and losses from security transactions are based on the identified costs of the securities involved.
Laudus U.S. Large Cap Growth Fund | Annual Report
Laudus U.S. Large Cap Growth Fund
Financial Notes (continued)
2. Significant Accounting Policies (continued):
Assets and liabilities denominated in foreign currencies are reported in U.S. dollars. For assets and liabilities held on a given date, the dollar value is based on market exchange rates in effect on that date. Transactions involving foreign currencies, including purchases, sales, income receipts and expense payments, are calculated using exchange rates in effect on the transaction date. Realized foreign exchange gains or losses arise from sales of foreign currencies, currency gains or losses realized between the trade and settlement dates on securities transactions and the differences between the recorded amounts of dividends, interest, and foreign withholding taxes and the U.S. dollar equivalent of the amounts actually received or paid. Net unrealized foreign exchange appreciation or depreciation arises from changes in foreign exchange rates on foreign denominated assets and liabilities other than investments in securities held at the end of the reporting period. These realized and unrealized foreign exchange gains or losses are reported in foreign currency transactions or translations on the Statement of Operations. The fund does not isolate the portion of the fluctuations on investments resulting from changes in foreign currency exchange rates from the fluctuations in market prices of investments held. Such fluctuations are included with the net realized and unrealized gain or loss from investments.
Gains realized by the fund on the sale of securities in certain foreign countries may be subject to non-U.S. taxes. In those instances, the fund records a liability based on unrealized appreciation to provide for potential non-U.S. taxes payable upon the sale of these securities.
(c) Investment Income:
Interest income is recorded as it accrues. Dividends and distributions from portfolio securities and underlying funds are recorded on the date they are effective (the ex-dividend date), although the fund records certain foreign security dividends on the day it learns of the ex-dividend date. Any distributions from underlying funds are recorded in accordance with the character of the distributions as designated by the underlying funds.
Income received from foreign sources may result in withholding tax. Withholding taxes are accrued at the same time as the related income if the tax rate is fixed and known, unless a tax withheld is reclaimable from the local tax authorities in which case it is recorded as receivable. If the tax rate is not known or estimable, such expense or reclaim receivable is recorded when the net proceeds are received.
(d) Expenses:
Expenses that are specific to the fund are charged directly to the fund. Expenses that are common to all funds within the trust generally are allocated among the funds in proportion to their average daily net assets.
(e) Distributions to Shareholders:
The fund makes distributions from net investment income and net realized capital gains, if any, once a year.
(f) Custody Credit:
The fund has an arrangement with its custodian bank, State Street Bank and Trust Company (State Street), under which the fund may receive a credit for its uninvested cash balance to offset its custody fees and accounting fees. The credit amounts, if any, are disclosed in the Statement of Operations as a reduction to the fund’s operating expenses.
(g) Accounting Estimates:
The accounting policies described in this report conform to GAAP. Notwithstanding this, shareholders should understand that in order to follow these principles, fund management has to make estimates and assumptions that affect the information reported in the financial statements. It’s possible that once the results are known, they may turn out to be different from these estimates and these differences may be material.
(h) Federal Income Taxes:
The fund intends to meet federal income and excise tax requirements for regulated investment companies under subchapter M of the Internal Revenue Code, as amended. Accordingly, the fund distributes substantially all of its net investment income and net realized capital gains, if any, to its respective shareholders each year. As long as the fund meets the tax requirements, it is not required to pay federal income tax.
Laudus U.S. Large Cap Growth Fund | Annual Report
Laudus U.S. Large Cap Growth Fund
Financial Notes (continued)
2. Significant Accounting Policies (continued):
(i) Foreign Taxes:
The fund may be subject to foreign taxes (a portion of which may be reclaimable) on income, corporate events, foreign currency exchanges and capital gains on investments. All foreign taxes are recorded in accordance with the applicable foreign tax regulations and rates that exist in foreign markets in which the fund invests. These foreign taxes, if any, are paid by the fund and are disclosed in the Statement of Operations. Foreign taxes payable as of March 31, 2017, if any, are reflected in the fund’s Statement of Assets and Liabilities.
(j) Indemnification:
Under the fund’s organizational documents, the officers and trustees are indemnified against certain liabilities arising out of the performance of their duties to the fund. In addition, in the normal course of business the fund enters into contracts with its vendors and others that provide general indemnifications. The fund’s maximum exposure under these arrangements is unknown as this would involve future claims that may be made against the fund. However, based on experience, the fund expects the risk of loss attributable to these arrangements to be remote.
3. Risk Factors:
Investing in the fund may involve certain risks, as described in the fund’s prospectus, including, but not limited to, those described below. Any of these risks could cause an investor to lose money.
• Market Risk. Equity markets rise and fall daily. As with any investment whose performance is tied to these markets, the value of an investment in the fund will fluctuate, which means that an investor could lose money.
• Management risk. As an actively managed mutual fund, the fund is subject to the risk that its subadviser will select investments or allocate assets in a manner that could cause the fund to underperform or otherwise not meet its objective. The fund’s subadviser applies its own investment techniques and risk analyses in making investment decisions for the fund, but there can be no guarantee that they will produce the desired results.
• Equity Risk. The prices of equity securities rise and fall daily. These price movements may result from factors affecting individual companies, industries or the securities market as a whole. In addition, equity markets tend to move in cycles, which may cause stock prices to fall over short or extended periods of time.
• Large-Cap Risk. The fund will principally invest in large-cap segments of the U.S. stock market. Large-cap stocks tend to go in and out of favor based on market and economic conditions. During a period when large-cap U.S. stocks fall behind other types of investments—mid-or small-cap stocks, for instance—the performance of the fund’s investments in large-cap securities will lag these investments.
• Growth Investing Risk. Growth stocks can be volatile. Growth companies usually invest a high portion of earnings in their businesses and may lack the dividends of value stocks that can cushion stock prices in a falling market. The prices of growth stocks are based largely on projections of the issuer’s future earnings and revenues. If a company’s earnings or revenues fall short of expectations, its stock price may fall dramatically. Growth stocks may also be more expensive relative to their earnings or assets compared to value or other stocks.
• Foreign investment risk. The fund’s investments in securities of foreign issuers may involve certain risks that are greater than those associated with investments in securities of U.S. issuers. These include risks of adverse changes in foreign economic, political, regulatory and other conditions; changes in currency exchange rates or exchange control regulations (including limitations on currency movements and exchanges); the imposition of economic sanctions or other government restrictions; differing accounting, auditing, financial reporting and legal standards and practices; differing securities market structures; and higher transaction costs. These risks may negatively impact the value or liquidity of the fund’s investments, and could impair the fund’s ability to meet its investment objective or invest in accordance with its investment strategy. These risks may be heightened in connection with investments in emerging markets.
• Derivatives Risk. The fund’s use of derivative instruments involves risks different from, or possibly greater than, the risks associated with investing directly in securities and other traditional investments. The fund’s use of derivatives could reduce the fund’s performance, increase the fund’s volatility, and could cause the fund to lose more than the initial amount invested. In addition, investments in derivatives may involve leverage, which means a small percentage of assets invested in derivatives can have a disproportionately large impact on the fund.
Laudus U.S. Large Cap Growth Fund | Annual Report
Laudus U.S. Large Cap Growth Fund
Financial Notes (continued)
3. Risk Factors (continued):
• Leverage risk. Certain fund transactions, such as derivatives, may give rise to a form of leverage and may expose the fund to greater risk. Leverage tends to magnify the effect of any increase or decrease in the value of the fund’s portfolio securities, which means even a small amount of leverage can have a disproportionately large impact on the fund.
• Liquidity risk. The fund may be unable to sell certain securities, such as illiquid securities, readily at a favorable time or price, or the fund may have to sell them at a loss.
Please refer to the fund’s prospectus for a more complete description of the principal risks of investing in the fund.
4. Affiliates and Affiliated Transactions:
Investment Advisory Fees
Charles Schwab Investment Management, Inc. (CSIM or the investment adviser), a wholly owned subsidiary of The Charles Schwab Corporation, serves as the fund’s investment adviser pursuant to an Investment Advisory Agreement (Advisory Agreement) between CSIM and the trust. BlackRock Investment Management, LLC (BlackRock), the fund’s subadviser, provides day-to-day portfolio management services to the fund, subject to the supervision of CSIM.
For its advisory services to the fund, CSIM is entitled to receive an annual fee, payable monthly, based on a percentage of the fund’s average daily net assets described as follows:
| Average daily net assets | |
| First $500 million | 0.700% |
| $500 million to $1 billion | 0.650% |
| $1 billion to $1.5 billion | 0.600% |
| $1.5 billion to $2 billion | 0.575% |
| Over $2 billion | 0.550% |
For the period ended March 31, 2017, the aggregate net advisory fee paid to CSIM was 0.64% for the fund, as a percentage of the fund’s average daily net assets.
CSIM (not the fund) pays a portion of the advisory fees it receives to BlackRock in return for its services.
Expense Limitation
CSIM has contractually agreed, until at least July 30, 2018, to limit the total annual fund operating expenses charged, excluding interest, taxes and certain non-routine expenses of the fund to 0.77%.
Investments from Affiliated Funds
Certain Schwab funds may own shares of other Schwab funds. The table below reflects the percentage of shares of the fund that are owned by other Schwab funds as of March 31, 2017:
| Schwab Target 2010 Fund | 0.1% |
| Schwab Target 2015 Fund | 0.2% |
| Schwab Target 2020 Fund | 1.4% |
| Schwab Target 2025 Fund | 1.6% |
| Schwab Target 2030 Fund | 3.6% |
| Schwab Target 2035 Fund | 1.9% |
| Schwab Target 2040 Fund | 4.9% |
| Schwab Target 2045 Fund | 0.6% |
| Schwab Target 2050 Fund | 0.5% |
| Schwab Target 2055 Fund | 0.3% |
| Schwab Target 2060 Fund | 0.0%* |
| Schwab Balanced Fund | 2.8% |
Laudus U.S. Large Cap Growth Fund | Annual Report
Laudus U.S. Large Cap Growth Fund
Financial Notes (continued)
5. Shareholders Services:
The trustees have authorized the fund to reimburse, out of the assets of the fund, financial intermediaries that provide sub-accounting and sub-transfer agency services in connection with the fund’s shares in an amount of up to 0.10% of the average daily net assets of the fund on an annual basis.
6. Board of Trustees:
The trust’s Board oversees the general conduct of the trust and the fund.
The Board may include people who are officers and/or directors of CSIM or its affiliates. Federal securities law limits the percentage of such “interested persons” who may serve on a trust’s board, and the trust was in compliance with these limitations throughout the report period. The trust did not pay any of these interested persons for their services as trustees, but it did pay non-interested persons (independent trustees), as noted in the fund’s Statement of Operations. For information regarding the trustees, please refer to Trustees and Officers table at the end of this report.
7. Borrowing from Banks:
During the period, the fund was a participant with other U.S. registered investment companies managed by CSIM in a joint, syndicated, committed $530 million line of credit (the Credit Facility), which matured on October 6, 2016. Under the terms of the Credit Facility, in addition to the interest charged on any borrowings by the fund, the fund paid a commitment fee of 0.125% per annum on its proportionate share of the unused portion of the Credit Facility.On October 6, 2016, the Credit Facility was amended to run for a new 364 day period with an increased line of $555 million and a commitment fee of 0.15% per annum. There were no borrowings from the line of credit during the period.
The fund also has access to custodian overdraft facilities. The fund may have utilized the overdraft facility and incurred an interest expense, which is disclosed on the fund’s Statement of Operations, if any. The interest expense is determined based on a negotiated rate above the current Federal Funds Rate.
8. Purchases and Sales/Maturities of Investment Securities:
For the period ended March 31, 2017, purchases and sales/maturities of securities (excluding short-term obligations) were as follows:
Purchases
of Securities | Sales/Maturities
of Securities |
| $1,330,889,841 | $1,912,841,920 |
9. Redemption Fee:
Prior to February 28, 2017, the fund charged a 2.00% redemption fee on shares sold or exchanged within 30 days of the original purchase date. Such amounts are netted against redemption proceeds on the Statement of Changes in Net Assets. Effective February 28, 2017, the fund no longer charges redemption fees. The redemption fees charged during the current and prior periods were as follows:
Current Period
(4/1/16-3/31/17) | Prior Period
(4/1/15-3/31/16) |
| $25,896 | $42,063 |
Laudus U.S. Large Cap Growth Fund | Annual Report
Laudus U.S. Large Cap Growth Fund
Financial Notes (continued)
10. Federal Income Taxes:
As of March 31, 2017, the components of distributable earnings on a tax-basis were as follows:
| Undistributed ordinary income | $2,930,357 |
| Undistributed long-term capital gains | 130,508,096 |
| Unrealized appreciation on investments | 380,459,848 |
| Unrealized depreciation on investments | (2,274,107) |
| Net unrealized appreciation (depreciation) | $378,185,741 |
The primary difference between book-basis and tax-basis unrealized appreciation or unrealized depreciation of investments is the tax deferral of losses on wash sales.
Capital loss carryforwards may be used to offset future realized capital gains for federal income tax purposes. As of March 31, 2017, the fund had no capital loss carryforwards.
For tax purposes, net realized capital losses and late-year ordinary losses incurred after October 31 may be deferred and treated as occurring on the first day of the following fiscal year. For the year ended March 31, 2017, the fund had no capital losses deferred and late-year ordinary losses deferred of 11,474.
The tax-basis components of distributions paid during the current and prior fiscal years were:
| Current period distributions | |
| Ordinary income | $— |
| Long-term capital gains | 28,536,521 |
| Prior period distributions | |
| Ordinary income | $— |
| Long-term capital gains | 135,764,007 |
Distributions paid to shareholders are based on net investment income and net realized gains determined on a tax basis, which may differ from net investment income and net realized gains for financial reporting purposes. These differences reflect the differing character of certain income items and net realized gains and losses for financial statement and tax purposes, and may result in reclassification among certain capital accounts on the financial statements.
Permanent book and tax basis differences may result in reclassifications between components of net assets as required. The adjustments will have no impact on net assets or the results of operations. As of March 31, 2017, the fund made the following reclassifications:
| Capital shares | ($197,258) |
| Undistributed net investment income | (360,361) |
| Net realized capital gains (losses) | 557,619 |
As of March 31, 2017, management has reviewed the tax positions for open periods (for federal purposes, three years from the date of filing and for state purposes, four years from the date of filing) as applicable to the fund, and has determined that no provision for income tax is required in the fund’s financial statements. The fund recognizes interest and penalties, if any, related to unrecognized tax benefits as income tax expense in the Statement of Operations. During the period ended March 31, 2017, the fund did not incur any interest or penalties.
11. Recent Regulatory Development:
In October 2016, the U.S. Securities and Exchange Commission adopted new rules and amended existing rules (together, “final rules”) intended to modernize the reporting and disclosure of information by registered investment companies. In part, the final rules amend Regulation S-X and require standardized, enhanced disclosure about derivatives in investment company financial statements, as well as other amendments. The compliance date for the amendments to Regulation S-X is August 1, 2017. Management is currently evaluating the impact that the adoption of the amendments to Regulation S-X will have on the fund’s financial statements and related disclosures.
Laudus U.S. Large Cap Growth Fund | Annual Report
Laudus U.S. Large Cap Growth Fund
Financial Notes (continued)
12. Subsequent Events:
Management has determined there are no subsequent events or transactions through the date the financial statements were issued that would have materially impacted the financial statements as presented.
Laudus U.S. Large Cap Growth Fund | Annual Report
Laudus U.S. Large Cap Growth Fund
Report of Independent Registered Public Accounting Firm
To the Board of Trustees of Laudus Trust and Shareholders of Laudus U.S. Large Cap Growth Fund
In our opinion, the accompanying statement of assets and liabilities, including the portfolio holdings, and the related statements of operations and of changes in net assets and the financial highlights present fairly, in all material respects, the financial position of the Laudus U.S. Large Cap Growth Fund (one of the funds constituting the Laudus Trust, hereafter referred to as the “Fund”) as of March 31, 2017, the results of its operations for the year then ended, the changes in its net assets for each of the two years in the period then ended and the financial highlights for each of the five years in the period then ended, in conformity with accounting principles generally accepted in the United States of America. These financial statements and financial highlights (hereafter referred to as “financial statements”) are the responsibility of the Fund's management. Our responsibility is to express an opinion on these financial statements based on our audits. We conducted our audits of these financial statements in accordance with the standards of the Public Company Accounting Oversight Board (United States). Those standards require that we plan and perform the audit to obtain reasonable assurance about whether the financial statements are free of material misstatement. An audit includes examining, on a test basis, evidence supporting the amounts and disclosures in the financial statements, assessing the accounting principles used and significant estimates made by management, and evaluating the overall financial statement presentation. We believe that our audits, which included confirmation of securities as of March 31, 2017 by correspondence with the custodian and brokers, or by other appropriate auditing procedures where replies from brokers were not received, provide a reasonable basis for our opinion.
PricewaterhouseCoopers LLP
San Francisco, California
May 17, 2017
Laudus U.S. Large Cap Growth Fund | Annual Report
Laudus U.S. Large Cap Growth Fund
Other Federal Tax Information (unaudited)
Under section 852(b)(3)(C) of the Internal Revenue Code, the fund hereby designates $28,536,521 as long-term capital gain dividends for the fiscal year ended March 31, 2017.
Laudus U.S. Large Cap Growth Fund | Annual Report
Laudus U.S. Large Cap Growth Fund
Trustees and Officers
The tables below give information about the trustees and officers of Laudus Trust, which includes the fund covered in this report. The “Fund Complex” includes The Charles Schwab Family of Funds, Schwab Capital Trust, Schwab Investments, Schwab Annuity Portfolios, Schwab Strategic Trust and Laudus Trust. The Fund Complex includes 110 funds.
The address for all trustees and officers is 211 Main Street, San Francisco, CA 94105. You can find more information about the trustees and officers in the Statement of Additional Information, which is available free by calling 1-877-824-5615.
| Independent Trustees |
Name, Year of Birth, and
Position(s) with the trust
(Terms of office, and
length of Time Served1) | Principal Occupations
During the Past Five Years | Number of
Portfolios in
Fund Complex
Overseen by
the Trustee | Other Directorships |
Robert W. Burns
1959
Trustee
(Trustee of Schwab Strategic Trust since 2009; The Charles Schwab Family of Funds, Schwab Investments, Schwab Capital Trust, Schwab Annuity Portfolios and Laudus Trust since 2016) | Retired/Private Investor (Jan. 2009 – present). Formerly, Managing Director, Pacific Investment Management Company, LLC (PIMCO) and President, PIMCO Funds. | 110 | Director, PS Business Parks, Inc. (2005 – 2012) |
John F. Cogan
1947
Trustee
(Trustee of The Charles Schwab Family of Funds, Schwab Investments, Schwab Capital Trust and Schwab Annuity Portfolios since 2008; Laudus Trust since 2010; Schwab Strategic Trust since 2016) | Senior Fellow, The Hoover Institution at Stanford University (Oct. 1979 – present); Senior Fellow, Stanford Institute for Economic Policy Research (2000 – present); Professor of Public Policy, Stanford University (1994 – 2015). | 110 | Director, Gilead Sciences, Inc. (2005 – present) |
Stephen Timothy Kochis
1946
Trustee
(Trustee of Schwab Strategic Trust since 2012; The Charles Schwab Family of Funds, Schwab Investments, Schwab Capital Trust, Schwab Annuity Portfolios and Laudus Trust since 2016) | CEO and Owner, Kochis Global (wealth management consulting) (May 2012 – present); Chairman and CEO, Aspiriant, LLC (wealth management) (Jan. 2008 – Apr. 2012). | 110 | None |
David L. Mahoney
1954
Trustee
(Trustee of The Charles Schwab Family of Funds, Schwab Investments, Schwab Capital Trust, Schwab Annuity Portfolios and Laudus Trust since 2011; Schwab Strategic Trust since 2016) | Private Investor. | 110 | Director, Symantec Corporation (2003 – present)
Director, Corcept Therapeutics Incorporated (2004 – present)
Director, Adamas Pharmaceuticals, Inc. (2009 – present) |
Laudus U.S. Large Cap Growth Fund | Annual Report
Laudus U.S. Large Cap Growth Fund
| Independent Trustees (continued) |
Name, Year of Birth, and
Position(s) with the trust
(Terms of office, and
length of Time Served1) | Principal Occupations
During the Past Five Years | Number of
Portfolios in
Fund Complex
Overseen by
the Trustee | Other Directorships |
Kiran M. Patel
1948
Trustee
(Trustee of The Charles Schwab Family of Funds, Schwab Investments, Schwab Capital Trust, Schwab Annuity Portfolios and Laudus Trust since 2011; Schwab Strategic Trust since 2016) | Retired. Executive Vice President and General Manager of Small Business Group, Intuit, Inc. (financial software and services firm for consumers and small businesses) (Dec. 2008 – Sept. 2013). | 110 | Director, KLA-Tencor Corporation (2008 – present) |
Kimberly S. Patmore
1956
Trustee
(Trustee of The Charles Schwab Family of Funds, Schwab Investments, Schwab Capital Trust, Schwab Annuity Portfolios, Schwab Strategic Trust and Laudus Trust since 2016) | Consultant, Patmore Management Consulting (management consulting) (2008 – present). | 110 | None |
Charles A. Ruffel
1956
Trustee
(Trustee of Schwab Strategic Trust since 2009; The Charles Schwab Family of Funds, Schwab Investments, Schwab Capital Trust, Schwab Annuity Portfolios and Laudus Trust since 2015) | Co-Chief Executive Officer, Kudu Investment Management, LLC (financial services) (Jan. 2015 – present); Partner, Kudu Advisors, LLC (financial services) (June 2008 – Jan. 2015); Advisor, Asset International, Inc. (publisher of financial services information) (Aug. 2008 – Jan. 2015). | 110 | None |
Gerald B. Smith
1950
Trustee
(Trustee of The Charles Schwab Family of Funds, Schwab Investments, Schwab Capital Trust and Schwab Annuity Portfolios since 2000; Laudus Trust since 2010; Schwab Strategic Trust since 2016) | Chairman, Chief Executive Officer and Founder of Smith Graham & Co. (investment advisors) (Mar. 1990 – present). | 110 | Director, Eaton (2012 – present)
Director and Chairman of the Audit Committee, Oneok Partners LP (2003 – 2013)
Director, Oneok, Inc. (2009 – 2013)
Lead Independent Director, Board of Cooper Industries (2002 – 2012) |
Joseph H. Wender
1944
Trustee
(Trustee of The Charles Schwab Family of Funds, Schwab Investments, Schwab Capital Trust and Schwab Annuity Portfolios since 2008; Laudus Trust since 2010; Schwab Strategic Trust since 2016) | Senior Consultant, Goldman Sachs & Co., Inc. (investment banking and securities firm) (Jan. 2008 – present); Partner, Colgin Partners, LLC (vineyards) (Feb. 1998 – present). | 110 | Board Member and Chairman of the Audit Committee, Ionis Pharmaceuticals (1994 – present)
Lead Independent Director and Chair of Audit Committee, OUTFRONT Media Inc. (2014 – present) |
Laudus U.S. Large Cap Growth Fund | Annual Report
Laudus U.S. Large Cap Growth Fund
| Interested Trustees |
Name, Year of Birth, and
Position(s) with the trust
(Terms of office, and
length of Time Served1) | Principal Occupations
During the Past Five Years | Number of
Portfolios in
Fund Complex
Overseen by
the Trustee | Other Directorships |
Walter W. Bettinger II2
1960
Chairman and Trustee
(Trustee of The Charles Schwab Family of Funds, Schwab Investments, Schwab Capital Trust and Schwab Annuity Portfolios since 2008; Schwab Strategic Trust since 2009; Laudus Trust since 2010) | Director, President and Chief Executive Officer, The Charles Schwab Corporation (Oct. 2008 – present); President and Chief Executive Officer (Oct. 2008 – present), Director (May 2008 – present), Charles Schwab & Co., Inc.; Director, Charles Schwab Bank (Apr. 2006 – present); Director, Schwab Holdings, Inc. (May 2008 – present); and Director, Charles Schwab Investment Management, Inc. (July 2016 – present). | 110 | Director, The Charles Schwab Corporation (2008 – present) |
Marie A. Chandoha2
1961
Trustee
(Trustee of The Charles Schwab Family of Funds, Schwab Investments, Schwab Capital Trust, Schwab Annuity Portfolios, Schwab Strategic Trust and Laudus Trust since 2016) | Director, President and Chief Executive Officer (Dec. 2010 – present), Chief Investment Officer (Sept. 2010 – Oct. 2011), Charles Schwab Investment Management, Inc.; Trustee (Jan. 2016 – present), President, Chief Executive Officer (Dec. 2010 – present), and Chief Investment Officer (Sept. 2010 – Oct. 2011), Schwab Funds, Laudus Funds and Schwab ETFs; Director, Charles Schwab Worldwide Funds plc and Charles Schwab Asset Management (Ireland) Limited (Jan. 2011 – present); Global Head of Fixed Income Business Division, BlackRock, Inc. (formerly Barclays Global Investors) (Mar. 2007 – Aug. 2010). | 110 | None |
Joseph R. Martinetto2
1962
Trustee
(Trustee of The Charles Schwab Family of Funds, Schwab Investments, Schwab Capital Trust, Schwab Annuity Portfolios, Schwab Strategic Trust and Laudus Trust since 2016) | Senior Executive Vice President and Chief Financial Officer, The Charles Schwab Corporation and Charles Schwab & Co., Inc. (July 2015 – present); Executive Vice President and Chief Financial Officer of The Charles Schwab Corporation and Charles Schwab & Co., Inc. (May 2007 – July 2015); Director, Charles Schwab & Co., Inc. (May 2007 – present); Director (Apr. 2010 – present) and Chief Executive Officer (July 2013 – Apr. 2015), Charles Schwab Bank; Director, Executive Vice President and Chief Financial Officer (May 2007 – present), Senior Executive Vice President (Feb. 2016 – present), and Executive Vice President (May 2007 – Feb. 2016), Schwab Holdings, Inc. | 110 | None |
| Officers of the Trust |
Name, Year of Birth, and Position(s) with the trust
(Terms of office, and length of Time Served3) | Principal Occupations During the Past Five Years |
Marie A. Chandoha
1961
President and Chief Executive Officer
(Officer of The Charles Schwab Family of Funds, Schwab Investments, Schwab Capital Trust, Schwab Annuity Portfolios, Schwab Strategic Trust and Laudus Trust since 2010) | Director, President and Chief Executive Officer (Dec. 2010 – present), Chief Investment Officer (Sept. 2010 – Oct. 2011), Charles Schwab Investment Management, Inc.; Trustee (Jan. 2016 – present), President, Chief Executive Officer (Dec. 2010 – present), and Chief Investment Officer (Sept. 2010 – Oct. 2011), Schwab Funds, Laudus Funds and Schwab ETFs; Director, Charles Schwab Worldwide Funds plc and Charles Schwab Asset Management (Ireland) Limited (Jan. 2011 – present); Global Head of Fixed Income Business Division, BlackRock, Inc. (formerly Barclays Global Investors) (Mar. 2007 – Aug. 2010). |
Mark Fischer
1970
Treasurer and Chief Financial Officer
(Officer of The Charles Schwab Family of Funds, Schwab Investments, Schwab Capital Trust, Schwab Annuity Portfolios, Schwab Strategic Trust and Laudus Trust since 2013) | Treasurer and Chief Financial Officer, Schwab Funds, Laudus Funds and Schwab ETFs (Jan. 2016 – present); Assistant Treasurer, Schwab Funds and Laudus Funds (Dec. 2013 – Dec. 2015), Schwab ETFs (Nov. 2013 – Dec. 2015); Vice President, Charles Schwab Investment Management, Inc. (Oct. 2013 – present); Executive Director, J.P. Morgan Investor Services (Apr. 2011 – Sept. 2013); Assistant Treasurer, Massachusetts Financial Service Investment Management (May 2005 – Mar. 2011). |
Laudus U.S. Large Cap Growth Fund | Annual Report
Laudus U.S. Large Cap Growth Fund
| Officers of the Trust (continued) |
Name, Year of Birth, and Position(s) with the trust
(Terms of office, and length of Time Served3) | Principal Occupations During the Past Five Years |
George Pereira
1964
Senior Vice President and Chief Operating Officer
(Officer of The Charles Schwab Family of Funds, Schwab Investments, Schwab Capital Trust and Schwab Annuity Portfolios since 2004; Laudus Trust since 2006; Schwab Strategic Trust since 2009) | Senior Vice President and Chief Financial Officer (Nov. 2004 – present), Chief Operating Officer (Jan. 2011 – present), Charles Schwab Investment Management, Inc.; Senior Vice President and Chief Operating Officer (Jan. 2016 – present), Treasurer and Chief Financial Officer, Laudus Funds (June 2006 – Dec. 2015); Treasurer and Principal Financial Officer, Schwab Funds (Nov. 2004 – Dec. 2015) and Schwab ETFs (Oct. 2009 – Dec. 2015); Director, Charles Schwab Worldwide Funds plc and Charles Schwab Asset Management (Ireland) Limited (Apr. 2005 – present). |
Omar Aguilar
1970
Senior Vice President and Chief Investment Officer – Equities and Multi-Asset Strategies
(Officer of The Charles Schwab Family of Funds, Schwab Investments, Schwab Capital Trust, Schwab Annuity Portfolios, Schwab Strategic Trust and Laudus Trust since 2011) | Senior Vice President and Chief Investment Officer – Equities and Multi-Asset Strategies, Charles Schwab Investment Management, Inc. (Apr. 2011 – present); Senior Vice President and Chief Investment Officer – Equities, Schwab Funds, Laudus Funds and Schwab ETFs (June 2011 – present); Head of the Portfolio Management Group and Vice President of Portfolio Management, Financial Engines, Inc. (May 2009 – Apr. 2011); Head of Quantitative Equity, ING Investment Management (July 2004 – Jan. 2009). |
Brett Wander
1961
Senior Vice President and Chief Investment Officer – Fixed Income
(Officer of The Charles Schwab Family of Funds, Schwab Investments, Schwab Capital Trust, Schwab Annuity Portfolios, Schwab Strategic Trust and Laudus Trust since 2011) | Senior Vice President and Chief Investment Officer – Fixed Income, Charles Schwab Investment Management, Inc. (Apr. 2011 – present); Senior Vice President and Chief Investment Officer – Fixed Income, Schwab Funds, Laudus Funds and Schwab ETFs (June 2011 – present); Senior Managing Director, Global Head of Active Fixed-Income Strategies, State Street Global Advisors (Jan. 2008 – Oct. 2010); Director of Alpha Strategies Loomis, Sayles & Company (Apr. 2006 – Jan. 2008). |
David Lekich
1964
Chief Legal Officer and Secretary, Schwab Funds and Schwab ETFs
Vice President and Assistant Clerk, Laudus Funds
(Officer of The Charles Schwab Family of Funds, Schwab Investments, Schwab Capital Trust, Schwab Annuity Portfolios, Schwab Strategic Trust and Laudus Trust since 2011) | Senior Vice President (Sept. 2011 – present), Vice President (Mar. 2004 – Sept. 2011), Charles Schwab & Co., Inc.; Senior Vice President and Chief Counsel (Sept. 2011 – present), Vice President (Jan. 2011 – Sept. 2011), Charles Schwab Investment Management, Inc.; Secretary (Apr. 2011 – present) and Chief Legal Officer (Dec. 2011 – present), Schwab Funds; Vice President and Assistant Clerk, Laudus Funds (Apr. 2011 – present); Secretary (May 2011 – present) and Chief Legal Officer (Nov. 2011 – present), Schwab ETFs. |
Catherine MacGregor
1964
Vice President and Assistant Secretary, Schwab Funds and Schwab ETFs
Chief Legal Officer, Vice President and Clerk, Laudus Funds
(Officer of The Charles Schwab Family of Funds, Schwab Investments, Schwab Capital Trust, Schwab Annuity Portfolios and Laudus Trust since 2005; Schwab Strategic Trust since 2009) | Vice President, Charles Schwab & Co., Inc., Charles Schwab Investment Management, Inc. (July 2005 – present); Vice President (Dec. 2005 – present), Chief Legal Officer and Clerk (Mar. 2007 – present), Laudus Funds; Vice President (Nov. 2005 – present) and Assistant Secretary (June 2007 – present), Schwab Funds; Vice President and Assistant Secretary, Schwab ETFs (Oct. 2009 – present). |
| 1 | Each Trustee shall hold office until the election and qualification of his or her successor, or until he or she dies, resigns or is removed. The retirement policy requires that each independent trustee retire by December 31 of the year in which the Trustee turns 74 or the Trustee’s twentieth year of service as an independent trustee on any trust in the Fund Complex, whichever occurs first. |
| 2 | Mr. Bettinger, Ms. Chandoha, and Mr. Martinetto are Interested Trustees because they own stock of The Charles Schwab Corporation, the parent company of the investment adviser. |
| 3 | The President, Treasurer and Secretary/Clerk hold office until their respective successors are chosen and qualified or until he or she sooner dies, resigns, is removed or becomes disqualified. Each of the other officers serves at the pleasure of the Board. |
Laudus U.S. Large Cap Growth Fund | Annual Report
Laudus U.S. Large Cap Growth Fund
Dividend yield is an expression of a stock’s market value in relationship to its dividend amount as a percentage. It is calculated by dividing the stock’s annual dividends by the market price of the stock.
Price to earnings ratio is the price of a stock divided by its historical earnings per share.
Price to book ratio compares the stock’s market value to the value of the total assets less the total liabilities.
Russell 1000 Growth Index An index that measures the performance of those Russell 1000 companies with higher price-to-book ratios and higher forecasted growth values.
Russell 1000 Value Index An index that measures the performance of the large-cap value segment of the U.S. equity universe. It includes those Russell 1000 Index companies with lower price-to-book ratios and lower expected growth values.
Russell 2000 Index An index that measures the performance of the 2,000 smallest companies in the Russell 3000 Index. The Russell 3000 Index measures the performance of the largest 3,000 U.S. companies representing approximately 98% of the investable U.S. equity market.
S&P 500 Index An index that is designed to measure the performance of 500 leading publicly traded companies from a broad range of industries.
Sovereign debt refers to debt issued by a national government within a given country and denominated in a foreign currency.
Trading Activity is one of several risk factors commonly used to attribute a portfolio’s return relative to its benchmark. Specifically, trading activity measures a stock’s trailing 12 month trading volume relative to its total shares outstanding. It measures how actively traded a stock has been in the last 12 months.
Weighted Average Market Cap A measure of the size of the companies in which a fund invests, based upon the market value of a fund’s securities each weighted according to its percent of the portfolio.
Laudus U.S. Large Cap Growth Fund | Annual Report
Laudus U.S. Large Cap Growth Fund
PRIVACY NOTICE
THIS IS NOT PART OF THE SHAREHOLDER REPORT
A Commitment to Your Privacy
Your Privacy Is Not for Sale
We do not and will not sell your personal information to anyone, for any reason.
We are committed to protecting the privacy of information we maintain about you. Below are details about our commitment, including the types of information we collect and how we use and share that information. This Privacy Notice applies to you only if you are an individual who invests directly in the funds by placing orders through the funds’ transfer agent. If you place orders through your brokerage account at Charles Schwab & Co., Inc. or an account with another broker-dealer, investment advisor, 401(k) plan, employee benefit plan, administrator, bank or other financial intermediary, you are covered by the privacy policies of that financial institution and should consult those policies.
How We Collect Information About You
We collect personal information about you in a number of ways.
• APPLICATION AND REGISTRATION
INFORMATION.
We collect personal information from you when you open an account or utilize one of our services. We may also collect information about you from third parties such as consumer reporting agencies to verify your identity. The information we collect may include personal information, including your Social Security number, as well as details about your interests, investments and investment experience.
• TRANSACTION AND EXPERIENCE
INFORMATION.
Once your account has been opened, we collect and maintain personal information about your account activity, including your transactions, balances, positions and history. This information allows us to administer your account and provide the services you have requested.
• WEBSITE USAGE.
When you visit our websites, we may use devices known as “cookies,” graphic interchange format files (GIFs), or other similar web tools to enhance your web experience. These tools help us to recognize you, maintain your web session, and provide a more personalized experience. To learn more, please click the Privacy link on our website.
How We Share and Use Your Information
We provide access to information about you to our affiliated companies, outside companies and other third parties in certain limited circumstances, including:
• to help us process transactions for your account;
• when we use other companies to provide services for us, such as printing and mailing your account statements;
• when we believe that disclosure is required or permitted under law (for example, to cooperate with regulators or law enforcement, resolve consumer disputes, perform credit/authentication checks, or for risk control).
State Laws
We will comply with state laws that apply to the disclosure or use of information about you.
Safeguarding Your Information — Security Is a
Partnership
We take precautions to ensure the information we collect about you is protected and is accessed only by authorized individuals or organizations.
Companies we use to provide support services are not allowed to use information about our shareholders for their own purposes and are contractually obligated to maintain strict confidentiality. We limit their use of information to the performance of the specific services we have requested. We restrict access to personal information by our employees and agents. Our employees are trained about privacy and are required to safeguard personal information.
We maintain physical, electronic and procedural safeguards that comply with federal standards to guard your nonpublic personal information.
Contact Us
To provide us with updated information, report suspected fraud or identity theft, or for any other questions, please call the number below.
Laudus Funds® direct investors: 1-877-824-5615
© 2016 Laudus Funds. All rights reserved.
Laudus U.S. Large Cap Growth Fund | Annual Report
Laudus U.S. Large Cap Growth Fund
Access to a select group of investment managers –
all in one fund family.
Laudus Funds offer investors access to some of the world's leading investment managers. With a rigorous manager selection process and ongoing oversight by Charles Schwab Investment Management, Laudus Funds offer single and multi-manager strategies as a complement to other funds managed by Charles Schwab Investment Management. The list below shows all currently available Laudus Funds.
An investor should consider a fund’s investment objectives, risks, charges and expenses carefully before investing or sending money. This and other important information can be found in the fund’s prospectus or, if available, the summary prospectus. Please call 1-877-824-5615 for a prospectus and brochure for any Laudus Fund. Please read the prospectus carefully before you invest. This report must be preceded or accompanied by a current prospectus.
Proxy Voting Policies, Procedures and Results
A description of the proxy voting policies and procedures used to determine how to vote proxies on behalf of the funds is available without charge, upon request, by visiting the Laudus Funds’ website at www.csimfunds.com/laudusfunds_prospectus, the SEC’s website at www.sec.gov, or by contacting Laudus Funds at 1-877-824-5615.
Information regarding how a fund voted proxies relating to portfolio securities during the most recent twelve-month period ended June 30 is available, without charge, by visiting the fund’s website at www.csimfunds.com/laudusfunds_prospectus or the SEC’s website at www.sec.gov.
The Laudus Funds®
Laudus U.S. Large Cap Growth
Laudus U.S. Large Cap Growth Fund
Laudus MarketMasters Funds®
Laudus International MarketMasters Fund™
Laudus Small-Cap MarketMasters Fund™
Laudus Mondrian Funds™
Laudus Mondrian International Equity Fund
Laudus Mondrian Emerging Markets Fund
Laudus Mondrian International Government Fixed Income Fund
Laudus Mondrian Global Government Fixed Income Fund
Investment Adviser
Charles Schwab Investment Management, Inc.
211 Main Street, San Francisco, CA 94105
Funds
Laudus Funds
1-877-824-5615
Printed on recycled paper.
Charles Schwab Investment Management, Inc. (CSIM) is the investment advisor for Laudus Funds. The Laudus Group of Funds includes the Laudus Mondrian Funds and Laudus U.S. Large Cap Growth Fund, which are part of the Laudus Trust and distributed by ALPS Distributors, Inc. (ALPS); and the Laudus MarketMasters Funds, which are part of the Schwab Capital Trust and distributed by Charles Schwab & Co., Inc. (Schwab), Member SIPC. Schwab and CSIM, affiliates and subsidiaries of The Charles Schwab Corporation, are not affiliated with ALPS.
This page is intentionally left blank.
| (a) | Registrant has adopted a code of ethics that applies to its principal executive officer, principal financial officer, and any other persons who perform a similar function, regardless of whether these individuals are employed by Registrant or a third party. |
| (c) | During the period covered by the report, no amendments were made to the provisions of this code of ethics. |
| (d) | During the period covered by the report, Registrant did not grant any waivers, including implicit waivers, from the provisions of this code of ethics. |
| (f)(1) | Registrant has filed this code of ethics as an exhibit pursuant to Item 11(a)(1) of Form N-CSR. |
| Item 3: | Audit Committee Financial Expert. |
Registrant’s Board of Trustees has determined that Kiran M. Patel, Robert W. Burns and Kimberly S. Patmore, each currently serving on its audit, compliance and valuation committee, are each an “audit committee financial expert,” as such term is defined in Item 3 of Form N-CSR. Each member of Registrant’s audit, compliance and valuation committee is “independent” under the standards set forth in Item 3 of Form N-CSR.
The designation of each of Mr. Patel, Mr. Burns and Ms. Patmore as an “audit committee financial expert” pursuant to Item 3 of Form N-CSR does not (i) impose upon such individual any duties, obligations, or liability that are greater than the duties, obligations and liability imposed upon such individual as a member of Registrant’s audit, compliance and valuation committee or Board of Trustees in the absence of such designation; and (ii) affect the duties, obligations or liability of any other member of Registrant’s audit, compliance and valuation committee or Board of Trustees.
| Item 4: | Principal Accountant Fees and Services. |
Registrant is composed of five series which all have a fiscal year-end of March 31, whose annual financial statements are reported in Item 1. Principal accountant fees disclosed in Items 4(a)-(d) and 4(g) include fees billed for services rendered to each of the five series, based on their respective 2017 and 2016 fiscal years, as applicable.
The following table presents fees billed by the principal accountant in each of the last two fiscal years for the services rendered to the Funds:
| | | | | | | | | | | | | | |
(a) Audit Fees | | (b)Audit-Related Fees1 | | (c) Tax Fees2 | | (d) All Other Fees3 |
Fiscal Year 2017 | | Fiscal Year 2016 | | Fiscal Year 2017 | | Fiscal Year 2016 | | Fiscal Year 2017 | | Fiscal Year 2016 | | Fiscal Year 2017 | | Fiscal Year 2016 |
$241,876 | | $241,876 | | $0 | | $0 | | $29,379 | | $29,379 | | $0 | | $0 |
| 1 | The nature of the services includes assurance and related services reasonably related to the performance of the audit of financial statements not included in Audit Fees. |
| 2 | The nature of the services includes tax compliance, tax advice and tax planning. |
| 3 | The nature of the services include agreed upon procedures relating to Charles Schwab Investment Management., Inc.’s, (“CSIM”) expenses for purposes of Section 15(c) of the Investment Company Act of 1940. |
(e)(1) Registrant’s audit committee does not have pre-approval policies and procedures as described in paragraph (c)(7) of Rule 2-01 of Regulation S-X.
(2) There were no services described in each of paragraphs (b) through (d) above (including services required to be approved by Registrant’s audit committee pursuant to paragraph (c)(7)(ii) of Rule 2-01 of Regulation S-X) that were approved by Registrant’s audit committee pursuant to paragraph (c)(7)(i)(C) of Rule 2-01 of Regulation S-X.
(f) Not applicable.
(g) Below are the aggregate non-audit fees billed in each of the last two fiscal years by Registrant’s principal accountant for services rendered to Registrant, to Registrant’s investment adviser, and to any entity controlling, controlled by, or under common control with Registrant’s investment adviser that provides ongoing services to Registrant.
2017: $29,379 2016: $29,379
Although not required to be included in the amounts disclosed under this paragraph (g) or any other paragraph of this Item 4, below are the aggregate fees billed in each of the last two fiscal years by Registrant’s principal accountant for tax compliance services rendered to U.S. Trust, an entity under common control with Registrant’s investment adviser that does not provide services to Registrant.
2017: NONE 2016: NONE
(h) During the past fiscal year, all non-audit services provided by Registrant’s principal accountant to either Registrant’s investment adviser or to any entity controlling, controlled by, or under common control with Registrant’s investment adviser that provides ongoing services to Registrant were pre-approved. Included in the audit committee’s pre-approval was the review and consideration as to whether the provision of these non-audit services is compatible with maintaining the principal accountant’s independence.
| Item 5: | Audit Committee of Listed Registrants. |
Not applicable.
| Item 6: | Schedule of Investments. |
The schedules of investments are included as part of the report to shareholders filed under Item 1 of this Form.
| Item 7: | Disclosure of Proxy Voting Policies and Procedures for Closed-End Management Investment Companies. |
Not applicable.
| Item 8: | Portfolio Managers of Closed-End Management Investment Companies. |
Not applicable.
| Item 9: | Purchases of Equity Securities by Closed-End Management Investment Company and Affiliated Purchasers. |
Not applicable.
| Item 10: | Submission of Matters to a Vote of Security Holders. |
Not applicable.
| Item 11: | Controls and Procedures. |
(a) Based on their evaluation of Registrant’s disclosure controls and procedures, as of a date within 90 days of the filing date, Registrant’s Chief Executive Officer, Marie Chandoha and Registrant’s Chief Financial Officer, Mark Fischer, have concluded that Registrant’s disclosure controls and procedures
are: (i) reasonably designed to ensure that information required to be disclosed in this report is appropriately communicated to Registrant’s officers to allow timely decisions regarding disclosures required in this report; (ii) reasonably designed to ensure that information required to be disclosed in this report is recorded, processed, summarized and reported in a timely manner; and (iii) are effective in achieving the goals described in (i) and (ii) above.
(b) During the second fiscal quarter of the period covered by this report, there have been no changes in Registrant’s internal control over financial reporting that the above officers believe to have materially affected, or to be reasonably likely to materially affect, Registrant’s internal control over financial reporting.
| (a) (1) Registrant’s | code of ethics (that is the subject of the disclosure required by Item 2(a)) is attached. |
| | (2) | Separate certifications for Registrant’s principal executive officer and principal financial officer, as required by Rule 30a-2(a) under the 1940 Act, are attached. |
| (b) | A certification for Registrant’s principal executive officer and principal financial officer, as required by Rule 30a-2(b) under the 1940 Act, is attached. This certification is being furnished to the Securities and Exchange Commission solely pursuant to 18 U.S.C. section 1350 and is not being filed as part of the Form N-CSR with the Commission. |
Pursuant to the requirements of the Securities Exchange Act of 1934 and the Investment Company Act of 1940, the registrant has duly caused this report to be signed on its behalf by the undersigned, thereunto duly authorized.
(Registrant) Laudus Trust
| | |
| By: | | /s/ Marie Chandoha |
| | Marie Chandoha |
| | President and Chief Executive Officer |
| |
| Date: | | 05/15/2017 |
Pursuant to the requirements of the Securities Exchange Act of 1934 and the Investment Company Act of 1940, this report has been signed below by the following persons on behalf of the registrant and in the capacities and on the dates indicated.
| | |
| By: | | /s/ Marie Chandoha |
| | Marie Chandoha |
| | President and Chief Executive Officer |
| |
| Date: | | 05/15/2017 |
| |
| By: | | /s/ Mark Fischer |
| | Mark Fischer |
| | Chief Financial Officer |
| |
| Date: | | 05/15/2017 |