UNITED STATES
SECURITIES AND EXCHANGE COMMISSION
Washington, D.C. 20549
FORM N-CSR
CERTIFIED SHAREHOLDER REPORT OF REGISTERED
MANAGEMENT INVESTMENT COMPANIES
Investment Company Act file number: 811-05547
Laudus Trust
(Exact name of registrant as specified in charter)
| | |
| 211 Main Street, San Francisco, California 94105 |
| (Address of principal executive offices) (Zip code) |
Marie Chandoha
Laudus Trust
211 Main Street, San Francisco, California 94105
(Name and address of agent for service)
Registrant’s telephone number, including area code: (415) 636-7000
Date of fiscal year end: March 31
Date of reporting period: March 31, 2018
| Item 1: | Report(s) to Shareholders. |
Annual Report | March 31, 2018
Laudus Mondrian Funds™
Laudus Mondrian International Equity Fund
Laudus Mondrian Emerging Markets Fund
Laudus Mondrian International Government Fixed Income Fund
Adviser
Charles Schwab Investment Management, Inc.
Subadviser
Mondrian Investment Partners Limited
Fund investment adviser: Charles Schwab Investment Management, Inc. (CSIM)
Distributor: ALPS Distributors, Inc. (ALPS)
The industry/sector classification of certain funds’ portfolio holdings uses the Global Industry Classification Standard (GICS) which was developed by and is the exclusive property of MSCI Inc. (MSCI) and Standard & Poor’s (S&P). GICS is a service mark of MSCI and S&P and has been licensed for use by CSIM and certain affiliates. Charles Schwab & Co, Inc. and ALPS are unaffiliated entities.
Laudus Mondrian Funds | Annual Report
The performance data quoted represents past performance. Past performance does not guarantee future results. Investment returns and principal value of an investment will fluctuate so that an investor’s shares may be worth more or less than their original cost. Current performance may be lower or higher than performance data quoted. To obtain performance information current to the most recent month end, please visit www.schwabfunds.com/laudusfunds_prospectus.
| Total Return for the 12 Months Ended March 31, 2018 |
| Laudus Mondrian International Equity Fund1,2 (Ticker Symbol: LIEIX) | 11.22% |
| MSCI EAFE® Index (Net)3 | 14.80% |
| MSCI EAFE® Value Index (Net)3 | 12.19% |
| Performance Details | pages 7-10 |
| |
| Laudus Mondrian Emerging Markets Fund1,2 (Ticker Symbol: LEMNX) | 14.55% |
| MSCI Emerging Markets Index (Net)3 | 24.93% |
| Performance Details | pages 11-13 |
| |
| Laudus Mondrian International Government Fixed Income Fund (Ticker Symbol: LIFNX) | 12.03% |
| Citigroup Non-U.S. Dollar World Government Bond Index | 12.93% |
| Performance Details | pages 14-16 |
| |
| Minimum Initial Investment4 | $ 100 |
All fund and index figures on this page assume dividends and distributions were reinvested. Index figures do not include trading and management costs, which would lower performance. Indices are unmanaged and cannot be invested in directly. Performance results less than one year are not annualized.
The first index listed for each fund is the fund’s primary benchmark, as shown in the prospectus. Additional indices shown are provided for comparative purposes.
For index definitions, please see the Glossary.
Fund expenses may have been partially absorbed by CSIM. Without these reductions, the funds’ returns would have been lower. These returns do not reflect the deduction of taxes that a shareholder would pay on fund distributions or the redemption of fund shares.
There are risks associated with investing in securities of foreign issuers, such as erratic market conditions, economic and political instability, fluctuations in currency and exchange rates, and an increased risk of price volatility associated with less uniformity in accounting and reporting requirements. Investing in emerging markets accentuates these risks. Investments in emerging markets may be more likely to experience political turmoil or rapid changes in market or economic conditions than more developed countries.
Bond funds are subject to increased risk of loss of principal during periods of volatile interest rates. When interest rates rise, bond prices fall which may impact the value of a bond fund’s shares.
| 1 | The fund’s performance relative to the indices may be affected by fair-value pricing, see financial note 2 for more information. |
| 2 | On July 25, 2017, the Investor Share class, Select Share class and Institutional Share class of the fund were consolidated into a single class of shares of the fund. The performance and financial history of the fund is that of the fund’s former Institutional Shares. Accordingly, the past performance shown is that of the fund’s former Institutional Shares. |
| 3 | The net version of the index reflects reinvested dividends net of withholding taxes, but reflects no deductions for expenses or other taxes. |
| 4 | Please see prospectus for further detail and eligibility requirements. There is no minimum initial investment for Laudus Mondrian International Equity Fund and Laudus Mondrian Emerging Markets Fund. |
Laudus Mondrian Funds | Annual Report
Marie Chandoha
President and CEO of
Charles Schwab Investment
Management, Inc. and the
funds covered in this report.
Dear Shareholder,
For investors who grew accustomed to the market’s smooth ride since the financial crisis, recent months must have felt like off-roading. After historically low volatility during most of the reporting period, the stock market began experiencing bigger swings starting in February, and many stock prices came under pressure. No one can predict what comes next, of course, but the increased market volatility may very well continue.
Higher volatility can tempt investors to veer from their financial plans. Sudden moves might be tempting in the moment but can often lead to unintended results. For example, those who sold out of stocks after the global financial crisis and failed to get back in missed the current bull market, which turned nine years old in March. Investors who instead stayed invested benefited from the eventual recovery and may have seen further gains as the rally continued.
At Charles Schwab Investment Management, we believe that a period of heightened volatility can be an opportune time to check on your portfolio and evaluate whether your investments are positioned to help you achieve your financial goals. We work hard to help shareholders build better portfolios, and for many investors, that may mean including exposure to actively managed strategies.
In recent years, it has been challenging for many active managers to keep up with the rising market. In addition, certain styles, such as a focus on value stocks, have been out of favor. For example, although the Laudus Mondrian Funds all had double digit returns in the 12-month period ended March 31, 2018, the funds underperformed their benchmarks due to their disciplined, value-orienting approach to selecting stocks. Consistent with the funds’ investment strategies, the funds avoided certain large growth-oriented companies, such as Chinese technology stocks, resulting in the funds falling behind broader indices that include these companies based on market capitalization.
Still, the spike in volatility this year can serve as a reminder of why it can make sense to maintain exposure to funds that aren’t designed to track an index. Stock selection decisions that may detract from relative performance as a market rallies may benefit the portfolio in a more turbulent or declining market. Actively managed funds may help smooth out market swings because they can take greater account of the underlying value of a security and can adjust their holdings as conditions warrant.
We believe that clear objectives, a commitment to transparency, and a consistent approach to investing can provide investors with quality and value
Laudus Mondrian Funds | Annual Report
From the President (continued)
“ Earlier this year, we were proud to receive three Thomson Reuters Lipper Fund Awards. One was for the Laudus Mondrian International Equity Fund, which was recognized for consistent investment returns over the five-year period ended November 30, 2017.”
in ever-changing market conditions. And others who track our industry share that view. Earlier this year, we were proud to receive three Thomson Reuters Lipper Fund Awards. One was for the Laudus Mondrian International Equity Fund, which was recognized for consistent investment returns over the five-year period ended November 30, 2017.1 The fund was named best-in-class among 11 International Large-Cap Value Funds over that time.
We know it can be difficult to stand firm when volatility spikes, but we believe having a well-diversified portfolio can help give you confidence that you’re on the right track. We’re here to serve you over the long-term—with funds that seek consistent, repeatable performance and are built with your needs in mind.
Thank you for investing with Charles Schwab Investment Management. For more information about the Laudus Mondrian Funds, please continue reading this report. In addition, you can find further details about these funds by visiting our website at www.schwabfunds.com. We are also happy to hear from you at 1-877-824-5615.
Sincerely,
Past performance cannot guarantee future results.
Management views may have changed since the report date.
Charles Schwab & Co, Inc., Mondrian Investment Partners Limited, and ALPS Distributors, Inc. are unaffiliated entities.
| 1 | The Thomson Reuters Lipper Fund Awards, granted annually, highlight funds and fund companies that have excelled in delivering consistently strong risk-adjusted performance relative to their peers. The Lipper Fund Awards are based on the Lipper Leader for Consistent Return rating, which is a risk-adjusted performance measure calculated over 36, 60 and 120 months. The fund with the highest Lipper Leader for Consistent Return (Effective Return) value in each eligible classification wins the Lipper Fund Award. For more information, see www.lipperfundawards.com. Although Lipper makes reasonable efforts to ensure the accuracy and reliability of the data contained herein, the accuracy is not guaranteed by Lipper. |
Laudus Mondrian Funds | Annual Report
The Investment Environment
Over the 12-month reporting period ended March 31, 2018, global equities produced positive returns, while U.S. bonds and international bonds generated differentiated performance as bond yields in the U.S. rose more quickly than those abroad (bond prices and bond yields move in opposite directions). Synchronized global growth and accommodative monetary policies supported stock markets, as did upbeat consumer sentiment. However, market volatility made a sudden return in February and March, driven largely by fears of quickly rising inflation, a potential trade war between the U.S. and China, and a technology industry selloff. Meanwhile, the U.S. dollar generally weakened against a basket of international currencies over the 12-month reporting period, enhancing returns on overseas investments in U.S. dollar terms. The S&P 500® Index, a bellwether for the overall U.S. stock market, returned 13.99%, and the MSCI EAFE® Index (Net)*, a broad measure of developed international equity performance, returned 14.80% for the reporting period. In fixed income, the Bloomberg Barclays US Aggregate Bond Index returned 1.20% and the Citigroup Non-U.S. Dollar World Government Bond Index returned 12.93% over the same period.
Global economic growth strengthened over the reporting period, supporting equities and contributing to rising bond yields. In the U.S., consumer confidence measured at or near record highs, and the labor market improved further with low unemployment and solid job growth. Industrial production picked up in the second half of the reporting period after earlier slowing due to Hurricanes Harvey and Irma, while corporate earnings were generally strong, especially toward the end of 2017 due to various one-time effects from the Tax Cuts and Jobs Act passed in December. Overall, U.S. quarterly gross domestic product (GDP) numbers exceeded expectations, reinforcing a solid economic picture. Outside the U.S., eurozone consumer confidence climbed to a near all-time high amid increased household spending and rising wages. The eurozone also benefitted from a recovering labor market, strong exports, and continued accommodative monetary policies which contributed to strengthening GDP numbers in 2017. Germany led the eurozone recovery, due to buoyant exports, a budget surplus, and a rise in business investment. France also played a role, supported by a consumer confidence boost due to Emmanuel Macron’s presidential win and his subsequent pro-business policy changes. In Japan, increasing exports, easy monetary policies, and rising consumption resulted in eight straight quarters of growth for this country by the end of the fourth quarter of 2017—Japan’s longest stretch of economic growth in 28 years. Meanwhile, emerging-market economies continued to solidify as commodities stabilized and domestic fundamentals improved. Brazil exited its worst recession on record in 2017, and in China, economic growth remained solid despite softening slightly during the reporting period.
Laudus Mondrian Funds | Annual Report
The Investment Environment (continued)
Many central banks stepped back from stimulative measures over the reporting period, though global monetary policies remained generally accommodative. In the U.S., the Federal Reserve (Fed) raised short-term interest rates in June, December, and March, each time by 0.25%. The federal funds rate ended the reporting period in a target range of 1.50% to 1.75%, with market expectations for approximately two additional increases in 2018. The Fed also began the process of unwinding its $4.5 trillion balance sheet by slowly allowing securities to mature without reinvesting the proceeds. This process began in October, and as expected, proved to be uneventful in terms of market impact in late 2017 and early 2018. Outside the U.S., the European Central Bank scaled down its quantitative easing program by reducing the pace of bond purchases, although it extended the program through at least September 2018. The Bank of England raised its benchmark interest rate for the first time in 10 years while indicating that additional tightening would be gradual and limited. Also, the Bank of Japan continued reducing the amount of its bond purchases as part of its yield curve management policy. Meanwhile, the People’s Bank of China followed the Fed’s path and raised several key interest rates over the reporting period—part of its plan to address an overleveraged financial system without creating significant drag on growth.
During the 12-month reporting period, the U.S. Treasury yield curve generally flattened as short-term yields rose more quickly than longer-term yields. Short-term yields rose in response to the federal funds rate hikes in June, December, and March. Meanwhile, longer-term yields were relatively stable through the end of 2017 and then climbed in early 2018 as more concrete signs of inflation materialized early in the year. In this environment, the yield on the benchmark 10-year Treasury note began the reporting period at 2.35% and finished at 2.77%. Meanwhile, many bond yields outside the U.S., including the yields on 10-year government bonds in Germany and the U.K., generally rose but remained comparatively low over the reporting period.
In the last two months of the reporting period, significant volatility returned to global markets. Rising inflation measurements in February contributed to fears that the Fed would raise short-term rates faster than expected, driving up bond yields and sending stocks downward. In March, President Trump announced plans for a 25% tariff on steel imports and a 10% tariff on aluminum imports, resulting in threats of retaliation from countries across the globe and weighing on shares of U.S. companies dependent on these metals. As the month continued, several countries negotiated exemptions to these tariffs, though tensions escalated between the U.S. and China and led to concerns of a potential trade war.
Index figures assume dividends and distributions were reinvested. Index figures do not include trading and management costs, which would lower performance. Indices are unmanaged and cannot be invested in directly. Performance results less than one year are not annualized. Past performance is not an indication of future results.
For index definitions, please see the Glossary.
Nothing in this report represents a recommendation of a security by the investment adviser.
Management views may have changed since the report date.
| * | The net version of the index reflects reinvested dividends net of withholding taxes, but reflects no deductions for expenses or other taxes. |
Laudus Mondrian Funds | Annual Report
Laudus Mondrian International Equity Fund as of March 31, 2018
The Laudus Mondrian International Equity Fund (the fund) seeks long-term capital appreciation. The fund pursues its investment objective by investing primarily in equity securities of non-U.S. large capitalization issuers, including the securities of emerging market companies, that, in the subadviser’s opinion, are undervalued at the time of purchase based on fundamental value analysis employed by the subadviser. For more information concerning the fund’s investment objective, strategies, and risks, please see the prospectus.
Market Highlights. International stocks from developed markets generated positive returns over the 12-month reporting period ended March 31, 2018. Global equity markets experienced continued calm for most of the reporting period, and then saw a change in course as heightened volatility returned in February and March. Synchronized global economic growth also benefitted most equity markets, with all 45 economies tracked by the Organization for Economic Cooperation and Development growing together for the first time in a decade. In Asia Pacific, Singapore benefitted from improving economic growth and increased expectations of monetary tightening, while solid Chinese growth and rising U.S. interest rates supported many Hong Kong banks. In Japan, markets reacted positively to Prime Minister Abe’s convincing victory in Lower House elections, providing his party with a renewed mandate to pursue reflationary policies. In Europe, Brexit-related uncertainty and domestic political concerns continued in the United Kingdom (U.K.). Meanwhile, election results in Italy left both the center-right coalition and the largest party, the populist Five Star Movement, unable to form a government in the short term. Over the 12-month reporting period, the U.S. dollar generally weakened against most international currencies, enhancing returns on overseas investments in U.S. dollar terms.
Performance. The fund returned 11.22% for the 12-month reporting period ended March 31, 2018. For performance comparisons, the fund uses the MSCI EAFE® Index (Net) (the index), which returned 14.80% over the same period.
Positioning and Strategies. Over the 12-month reporting period, overall stock selection and the fund’s country and sector allocations detracted from the fund’s relative return, while the fund’s currency allocation decisions generally enhanced relative performance.
In Asia Pacific, the fund’s underweight positions in Hong Kong and Japan weighed on relative performance, while overweights to Taiwan and Singapore added to relative investment returns. In Europe, stock selection in the U.K. was positive for the fund’s relative return, though the fund’s overweight detracted. Despite the ongoing Brexit-related challenges, the fund’s subadviser continues to believe that the U.K. market remains attractively valued, particularly in some of the more domestically-oriented segments. Meanwhile, the Italian equity market generated the highest returns among major markets in the region, and the fund benefitted from an overweight to this country. Stock selection in the Swiss equity market contributed to relative investment returns, although this was more than offset by negative stock selection in France.
Currencies made a significant contribution to returns over the reporting period. Following an announcement in October, the European Central Bank began reducing asset purchases, albeit very slowly, from the beginning of 2018, which supported euro appreciation. The British pound continued to rise from extremely oversold levels following the Brexit referendum result. The Japanese yen, however, was weak on a relative basis as the Bank of Japan maintained its loose monetary policy stance, and the Australian dollar appreciated slightly, although less than other major currencies, over the reporting period. Currency allocation effects added to the fund’s relative return, driven by the underweight positions in the Australian dollar and Japanese yen, and the overweight position in the British pound.
Sector positioning generally weighed on relative investment returns, as defensive sectors mostly lagged. The Information Technology sector led returns for the index amid strong demand for semiconductors and strong earnings expectations. Although the fund benefitted from the overweight position in the sector, this was mostly offset by stock selection.
Index returns from the Materials and Energy sectors were also strong over the reporting period. Oil prices fell in the second quarter of 2017 before changing direction and rising on improving fundamentals. Materials sector returns were supported by rising bulk commodities and metals prices amid resilient economic data globally and supply side measures in China, although fears around a U.S. – China trade war in the first quarter of 2018 weighed on the sector. Although stock selection within the Materials sector added to relative returns, this was more than offset by the impact of the fund’s underweight position in this sector. The Telecommunication Services sector generated the weakest returns over the reporting period. Operators struggled against competitive pressures and as a result, the fund’s overweight positioning in this sector weighed on relative returns.
Laudus Mondrian Funds | Annual Report
Laudus Mondrian International Equity Fund
Performance and Fund Facts as of March 31, 2018
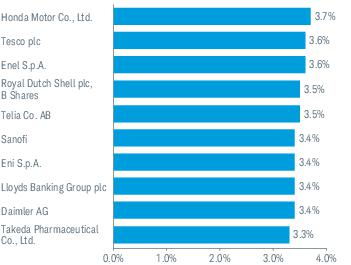
From a portfolio holdings standpoint, the fund’s relative return was held back by the position in French pharmaceuticals manufacturer, Sanofi, which fell amid competitive pressures on the diabetes franchise. QBE Insurance Group Limited, the Australian insurance provider, declined following a profit warning which was partly the result of high catastrophe losses. China Mobile Limited, the Hong Kong-listed telecommunications company, also fell over the reporting period, due in part to pressure from the government to reduce mobile data tariff levels.
By comparison, the fund benefitted from its holdings in Singaporean bank, United Overseas Bank Ltd., which rose amid improved economic growth, increased expectations of monetary tightening, and strong capital levels. Taiwan Semiconductor Manufacturing Co., Ltd. gained over the reporting period on strong demand growth and pricing power as capacity remains constrained, and Italian integrated utility, Enel SpA, also rose as strong execution of management’s long-term strategy led to an upgrade in earnings and dividend targets.
| Fund Characteristics | |
| Number of Companies1 | 38 |
| Weighted Average Market Cap (millions) | $74,811 |
| Price/Earnings Ratio (P/E) | 14.14 |
| Price/Book Ratio (P/B) | 1.41 |
Portfolio Turnover
(One year trailing) | 23% |
| Fund Overview | |
| | Fund |
| Inception Date | 6/16/2008 |
| Ticker Symbol | LIEIX |
| Cusip | 51855Q580 |
| NAV | $6.57 |
Management views and portfolio holdings may have changed since the report date.
| 1 | Short-term investments are not included. |
Laudus Mondrian Funds | Annual Report
Laudus Mondrian International Equity Fund
Performance and Fund Facts as of March 31, 2018 (continued)
Past performance does not guarantee future results. The performance data quoted represents past performance, and current returns may be lower or higher. The performance information does not reflect the deduction of taxes that a shareholder would pay on fund distributions or the redemption of fund shares. The investment return and principal value of an investment will fluctuate so that an investor’s shares, when redeemed, may be worth more or less than the original cost. To obtain performance information current to the most recent month end, visit www.schwabfunds.com/laudusfunds_prospectus.
Performance of Hypothetical Investment (June 16, 2008 – March 31, 2018)1,2
Average Annual Total Returns1,2
| Fund and Inception Date | 1 Year | 5 Years | Since Inception |
| Laudus Mondrian International Equity Fund (6/16/08) | 11.22% | 6.86% | 1.93% |
| MSCI EAFE® Index (Net)3 | 14.80% | 6.50% | 2.69% |
| MSCI EAFE® Value Index (Net)3 | 12.19% | 5.78% | 2.06% |
| Fund Expense Ratios4: Net 0.90%; Gross 0.96% |
All total returns on this page assume dividends and distributions were reinvested. Index figures do not include trading and management costs, which would lower performance. Indices are unmanaged and cannot be invested in directly. Performance results less than one year are not annualized.
The first index listed for the fund is the fund’s primary benchmark, as shown in the prospectus. Additional indices shown are provided for comparative purposes.
For index definitions, please see the Glossary.
| 1 | Fund expenses may have been partially absorbed by CSIM. Without these reductions, the fund’s returns would have been lower. These returns do not reflect the deduction of taxes that a shareholder would pay on fund distributions or the redemption of fund shares. |
| 2 | On July 25, 2017, the Investor Share class, Select Share class and Institutional Share class of the fund were consolidated into a single class of shares of the fund. The performance and financial history of the fund is that of the fund’s former Institutional Shares. Accordingly, the past performance shown is that of the fund’s former Institutional Shares. |
| 3 | The net version of the index reflects reinvested dividends net of withholding taxes, but reflects no deductions for expenses or other taxes. |
| 4 | As stated in the prospectus. Net Expenses: The adviser has agreed to limit the total annual fund operating expenses (excluding interest, taxes and certain non-routine expenses) of the fund to 0.90% until at least July 30, 2019. Gross Expenses: Reflects the total annual fund operating expenses without the effect of contractual fee waivers. For actual rates during the period, refer to the Financial Highlights section of the Financial Statements. |
Laudus Mondrian Funds | Annual Report
Laudus Mondrian International Equity Fund
Performance and Fund Facts as of March 31, 2018 (continued)
Country Weightings % of Investments1
Sector Weightings % of Equities
Top Equity Holdings % of Net Assets2
There are risks associated with investing in foreign companies, such as erratic market conditions, economic and political instability, fluctuations in currency and exchange rates, and an increased risk of price volatility associated with less uniformity in accounting and reporting requirements.
Portfolio holdings may have changed since the report date.
| 1 | The percentage may differ from the Portfolio Holdings because the above calculation is based on a percentage of total investments, whereas the calculation in the Portfolio Holdings is based on a percentage of net assets. |
| 2 | This list is not a recommendation of any security by the investment adviser or subadviser. |
Laudus Mondrian Funds | Annual Report
Laudus Mondrian Emerging Markets Fund as of March 31, 2018
The Laudus Mondrian Emerging Markets Fund (the fund) seeks long-term capital appreciation. The fund is an international fund and generally invests in large capitalization equity securities of emerging market companies that, in the subadviser’s opinion, are undervalued at the time of purchase based on fundamental value analysis employed by the subadviser. For more information concerning the fund’s investment objective, strategies, and risks, please see the prospectus.
Market Highlights. Stocks from emerging markets generated positive returns over the 12-month reporting period ended March 31, 2018 amid synchronized global growth and investor appetite for higher-risk assets. Global central bank policies remained generally accommodative, and though the Federal Reserve continued on its path of short-term interest rate normalization, strong fundamentals in emerging markets provided stability. Meanwhile, despite continued political uncertainty, Brazil exited its worst recession on record in 2017, in large part due to strength in the agriculture sector. Concerns surrounding the potential negative impact of slowing growth in China virtually disappeared over the reporting period, and Moody’s decision to keep South Africa’s investment-grade credit rating and revise the country’s credit outlook from negative to stable provided a boost to local equities. Over the 12-month reporting period, the U.S. dollar generally weakened against most international currencies, enhancing returns on overseas investments in U.S. dollar terms.
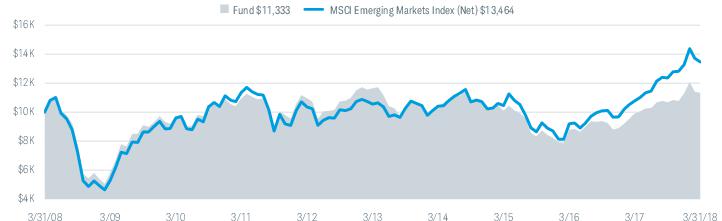
Performance. The fund returned 14.55% for the 12-month reporting period ended March 31, 2018. For performance comparisons, the fund uses the MSCI Emerging Markets Index (Net) (the index), which returned 24.93% over the same period.
Positioning and Strategies. The fund underperformed the index over the reporting period. A key theme over this period was the outperformance of Asia, driven by the robust performance of a small number of Information Technology stocks (namely Chinese firms Baidu, Inc., Alibaba Group Holding Ltd., and Tencent Holdings Ltd., and South African-listed Naspers Limited). This outperformance occurred alongside the sustained outperformance of growth over value. Over the reporting period, the MSCI Emerging Markets Growth Index (Net) rose 31.7%, compared to the MSCI Emerging Markets Value Index (Net) which only gained 18.1%. Due to the subadviser’s disciplined value style, the fund had no exposure to any of the IT stocks mentioned above, and as such, the fund’s underweight positioning to the Information Technology sector was a meaningful detractor from relative performance. Meanwhile, the typically more defensive Telecommunication Services and Utilities sectors, where the fund is more heavily exposed, significantly underperformed the benchmark and thus detracted further from relative returns.
Top-down allocation was negative overall, with both country allocation and currency effects having a negative impact. In Asia, as previously mentioned, the fund’s underweight positioning in the Chinese market weighed on relative performance. The overweight allocation to Malaysia also detracted, as did the overweight exposure to India through both the underperformance of the local market and the Indian rupee. In Latin America, top-down allocation was positive overall, driven by the overweight allocation to the Brazilian market, somewhat offset by the depreciation of the Brazilian real. In Europe, the Middle East, and Africa (EMEA), overweight allocations to the underperforming Middle East region through Qatar and the United Arab Emirates dragged on relative returns, as did the overweight exposure to the weak Turkish lira.
Stock selection, most notably in Asia, detracted from relative returns. In China, aside from the lack of exposure to the previously mentioned IT names Tencent Holdings Ltd. and Alibaba Group Holding Ltd.,telecommunications company China Mobile Limited underperformed and weighed on relative returns as it faced uncertain regulatory headwinds. South Korean stock selection was another notable detractor during the reporting period. SK Telecom Co., Ltd. underperformed in line with the broader Telecommunication Services sector, while electric utility company Korea Electric Power Corporation lagged amid increased input costs from a sustained higher thermal coal price. In Latin America, Brazilian stock selection was slightly positive. The fund’s positions in pulp and paper producer Suzano Papel e Celulose SA and in financial company Itau Unibanco Holding S.A, and jet manufacturer Embraer S.A., were among the best performing individual stocks in the fund. Suzano Papel e Celulose SA rose substantially after announcing the acquisition of Fibria Celulose S.A., which would create the largest pulp producer in the world, Itau Unibanco Holding S.A. benefitted from the official end of Brazil’s recession and the arrival of Apple Pay for its customers, Embraer S.A. rose after The Boeing Company confirmed it had entered negotiations for a possible takeover. Partially offsetting this, however, was the disappointing performance of infrastructure operator CCR S.A. and payment processor Cielo. Elsewhere, Mexican REIT Fibra Uno Administracion SA de CV underperformed after announcing a capital raise to fund new property investments. In EMEA, despite South African stock selection being negative overall due in large part to the impact of not owning Naspers Limited, financial institution Barclays Africa Group Limited strongly outperformed following the election of Cyril Ramaphosa as President of the ruling African National Congress party, and subsequently replacing Jacob Zuma as the President of South Africa.
| Fund Characteristics | |
| Number of Companies1 | 51 |
| Weighted Average Market Cap (millions) | $66,630 |
| Price/Earnings Ratio (P/E) | 10.97 |
| Price/Book Ratio (P/B) | 1.26 |
Portfolio Turnover
(One year trailing) | 39% |
| Fund Overview | |
| | Fund |
| Inception Date | 11/2/2007 |
| Ticker Symbol | LEMNX |
| Cusip | 51855Q622 |
| NAV | $8.59 |
Management views and portfolio holdings may have changed since the report date.
| 1 | Short-term investments are not included. |
Laudus Mondrian Funds | Annual Report
Laudus Mondrian Emerging Markets Fund
Performance and Fund Facts as of March 31, 2018
Past performance does not guarantee future results. The performance data quoted represents past performance, and current returns may be lower or higher. The performance information does not reflect the deduction of taxes that a shareholder would pay on fund distributions or the redemption of fund shares. The investment return and principal value of an investment will fluctuate so that an investor’s shares, when redeemed, may be worth more or less than the original cost. To obtain performance information current to the most recent month end, visit www.schwabfunds.com/laudusfunds_prospectus.
Performance of Hypothetical Investment (March 31, 2008 – March 31, 2018)1,2
Average Annual Total Returns1,2
| Fund and Inception Date | 1 Year | 5 Years | 10 Years |
| Laudus Mondrian Emerging Markets Fund (11/2/07) | 14.55% | -0.53% | 1.26% |
| MSCI Emerging Markets Index (Net)3 | 24.93% | 4.99% | 3.02% |
| Fund Expense Ratios4: Net 1.20%; Gross 1.22% |
All total returns on this page assume dividends and distributions were reinvested. Index figures do not include trading and management costs, which would lower performance. Indices are unmanaged and cannot be invested in directly. Performance results less than one year are not annualized.
For index definitions, please see the Glossary.
| 1 | Fund expenses may have been partially absorbed by CSIM. Without these reductions, the fund’s returns would have been lower. These returns do not reflect the deduction of taxes that a shareholder would pay on fund distributions or the redemption of fund shares. |
| 2 | On July 25, 2017, the Investor Share class, Select Share class and Institutional Share class of the fund were consolidated into a single class of shares of the fund. The performance and financial history of the fund is that of the fund’s former Institutional Shares. Accordingly, the past performance shown is that of the fund’s former Institutional Shares. |
| 3 | The net version of the index reflects reinvested dividends net of withholding taxes, but reflects no deductions for expenses or other taxes. |
| 4 | As stated in the prospectus. Net Expenses: The adviser has agreed to limit the total annual fund operating expenses (excluding interest, taxes and certain non-routine expenses) of the fund to 1.20% until at least July 30, 2019. Gross Expenses: Reflects the total annual fund operating expenses without the effect of contractual fee waivers. For actual rates during the period, refer to the Financial Highlights section of the Financial Statements. |
Laudus Mondrian Funds | Annual Report
Laudus Mondrian Emerging Markets Fund
Performance and Fund Facts as of March 31, 2018 (continued)
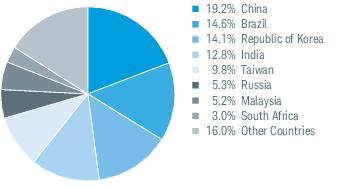
Country Weightings % of Investments1
Sector Weightings % of Equities
Top Equity Holdings % of Net Assets2
There are risks associated with investing in foreign companies, such as erratic market conditions, economic and political instability, fluctuations in currency and exchange rates, and an increased risk of price volatility associated with less uniformity in accounting and reporting requirements. Investing in emerging markets accentuates these risks. Investments in emerging markets may be more likely to experience political turmoil or rapid changes in market or economic conditions than more developed countries.
Portfolio holdings may have changed since the report date.
| 1 | The percentage may differ from the Portfolio Holdings because the above calculation is based on a percentage of total investments, whereas the calculation in the Portfolio Holdings is based on a percentage of net assets. |
| 2 | This list is not a recommendation of any security by the investment adviser or subadviser. |
Laudus Mondrian Funds | Annual Report
Laudus Mondrian International Government Fixed Income Fund as of March 31, 2018
The Laudus Mondrian International Government Fixed Income Fund (the fund) seeks long-term total return consistent with its value-oriented investment approach. The fund invests primarily in fixed income securities that may also provide the potential for capital appreciation. The fund is an international fund that invests primarily in issuers that are organized, have a majority of their assets or derive most of their operating income outside of the United States. As such, the fund may invest primarily in securities issued in any currency and may hold foreign currency. For more information concerning the fund’s investment objective, strategies, and risks, please see the prospectus.
Market Highlights. International bond indices generated positive overall returns for the 12-month reporting period. Global monetary policies remained generally accommodative, though some central banks, including the European Central Bank and the Bank of England, took measured steps toward tighter policy stances. South Africa was downgraded to sub-investment grade by Standard and Poor’s in late 2017, though following the election of Cyril Ramaphosa and a more constructive national budget, Moody’s decided against removing the country’s investment grade status. Meanwhile, over the 12-month reporting period, the U.S. dollar generally weakened against most international currencies, enhancing returns on overseas investments in U.S. dollar terms.
Performance. The fund returned 12.03% for the 12-month reporting period ended March 31, 2018. For performance comparisons, the fund uses the Citigroup Non-U.S. Dollar World Government Bond Index (the index), which returned 12.93% over the same period.
Positioning and Strategies. The fund’s relative underperformance over the reporting period was due in large part to an underweight to the eurozone, and the overweight to Mexico and underweight to South Africa also played a role. Overall, other positioning within the fund was positive, particularly the overweights to Australian and New Zealand bonds (both on a fully currency-hedged basis), Poland, Malaysia and U.K. sterling.
Over the reporting period, the fund’s strategy included holding overweights to Poland, Mexico, and Malaysia, as well as to the Swedish krona. On a fully currency-hedged basis, the fund was overweight to Singapore, New Zealand, and Australia. The fund was also generally neutral to Japan, underweight to U.K. bonds and overweight the U.K. sterling, and underweight to the eurozone with a defensive tilt away from peripheral countries. The fund’s duration was also generally shorter than that of the index, and the fund had zero exposure to corporate credit.
Due to changes in Mondrian’s proprietary valuation models over the 12-month reporting period, the fund’s subadviser slowly reduced and then eliminated exposure to Poland, and pared back the fund’s overweight to U.K. sterling. The fund’s subadviser also reduced exposure to Spain and Japan, and removed exposure to the Swedish krona. These moves were offset by increasing exposure to Canada and to the eurozone overall.
Other strategies used by the subadviser included buying fully covered, defensive forward currency contracts. Such contracts are used to hedge what the subadviser believes to be overvalued currencies, and gain exposure to fundamentally undervalued currencies based on proprietary valuation models. Overall these forward currency exposures had a positive effect on performance.
| Fund Characteristics1 | |
| Number of Issues2 | 49 |
| Weighted Average Maturity3 | 9.4 Yrs |
| Weighted Average Duration3 | 8.1 Yrs |
Portfolio Turnover
(One year trailing) | 52% |
| Fund Overview | |
| | Fund |
| Inception Date | 11/2/2007 |
| Ticker Symbol | LIFNX |
| Cusip | 51855Q655 |
| NAV | $10.44 |
Management views and portfolio holdings may have changed since the report date.
| 1 | Excludes derivatives. |
| 2 | Short-term investments are not included. |
| 3 | See Glossary for definitions of maturity and duration. |
Laudus Mondrian Funds | Annual Report
Laudus Mondrian International Government Fixed Income Fund
Performance and Fund Facts as of March 31, 2018
Past performance does not guarantee future results. The performance data quoted represents past performance, and current returns may be lower or higher. The performance information does not reflect the deduction of taxes that a shareholder would pay on fund distributions or the redemption of fund shares. The investment return and principal value of an investment will fluctuate so that an investor’s shares, when redeemed, may be worth more or less than the original cost. To obtain performance information current to the most recent month end, visit www.schwabfunds.com/laudusfunds_prospectus.
Performance of Hypothetical Investment (March 31, 2008 – March 31, 2018)1,2
Average Annual Total Returns1,2
| Fund and Inception Date | 1 Year | 5 Years | 10 Years |
| Laudus Mondrian International Government Fixed Income Fund (11/2/07) | 12.03% | 0.49% | 1.56% |
| Citigroup Non-U.S. Dollar World Government Bond Index | 12.93% | 1.36% | 1.82% |
| Fund Expense Ratios3: Net 0.75%; Gross 0.79% |
All total returns on this page assume dividends and distributions were reinvested. Index figures do not include trading and management costs, which would lower performance. Indices are unmanaged and cannot be invested in directly. Performance results less than one year are not annualized.
For index definitions, please see the Glossary.
| 1 | Fund expenses may have been partially absorbed by CSIM. Without these reductions, the fund’s returns would have been lower. These returns do not reflect the deduction of taxes that a shareholder would pay on fund distributions or the redemption of fund shares. |
| 2 | On July 27, 2009, the Investor Share class, Select Share class and Institutional Share class of the fund were consolidated into a single class of shares of the fund. The performance and financial history of the fund is that of the fund’s former Institutional Shares. Accordingly, the past performance shown is that of the fund’s former Institutional Shares. |
| 3 | As stated in the prospectus. Net Expenses: The adviser has agreed to limit the total annual fund operating expenses (excluding interest, taxes and certain non-routine expenses) of the fund to 0.75% until at least July 30, 2019. Gross Expenses: Reflects the total annual fund operating expenses without the effect of contractual fee waivers. For actual rates during the period, refer to the Financial Highlights section of the Financial Statements. |
Laudus Mondrian Funds | Annual Report
Laudus Mondrian International Government Fixed Income Fund
Performance and Fund Facts as of March 31, 2018 (continued)
Country Weightings % of Investments1,2
Currency Weightings % of Investments4
Sector Weightings % of Investments6
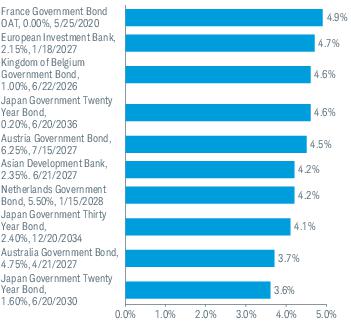
Top Holdings % of Net Assets7
There are risks associated with investing in foreign companies, such as erratic market conditions, economic and political instability, fluctuations in currency and exchange rates, and an increased risk of price volatility associated with less uniformity in accounting and reporting requirements.
Portfolio holdings may have changed since the report date.
| 1 | The percentage may differ from the Portfolio Holdings because the above calculation is based on a percentage of total investments, excluding derivatives, whereas the calculation in the Portfolio Holdings is based on a percentage of net assets. |
| 2 | Country weights may include issues via Samurai bonds issued in Japanese yen by non-Japanese entities and/or Yankee bonds issued in U.S. dollars by non-U.S. entities. |
| 3 | Supranational bonds represent the debt of international organizations or institutions such as the World Bank, the International Monetary Fund, regional multilateral development banks and others. Bonds are issued and held in Japanese yen and euro. |
| 4 | Includes forward foreign currency exchange contracts exposure, which may results in negative exposure to a particular currency. |
| 5 | Amount is less than 0.05% |
| 6 | Excludes derivatives. |
| 7 | This list is not a recommendation of any security by the investment adviser or subadviser. |
Laudus Mondrian Funds | Annual Report
Fund Expenses (Unaudited)
Examples for a $1,000 Investment
As a fund shareholder, you may incur two types of costs: (1) transaction costs; and (2) ongoing costs, including management fees, transfer agent and shareholder services fees, and other fund expenses.
The expense examples below are intended to help you understand your ongoing cost (in dollars) of investing in a fund and to compare this cost with the ongoing cost of investing in other mutual funds. These examples are based on an investment of $1,000 invested for the period beginning October 1, 2017 and held through March 31, 2018.
Actual Return lines in the table below provide information about actual account values and actual expenses. You may use this information, together with the amount you invested, to estimate the expenses that you paid over the period. To do so, simply divide your account value by $1,000 (for example, an $8,600 account value ÷ $1,000 = 8.6), then multiply the result by the number given for your fund or share class under the heading entitled “Expenses Paid During Period.”
Hypothetical Return lines in the table below provide information about hypothetical account values and hypothetical expenses based on a fund’s or share class’ actual expense ratio and an assumed return of 5% per year before expenses. Because the return used is not an actual return, it may not be used to estimate the actual ending account value or expenses you paid for the period.
You may use this information to compare the ongoing costs of investing in a fund and other funds. To do so, compare this 5% hypothetical example with the 5% hypothetical examples that appear in the shareholder reports of the other funds.
Please note that the expenses shown in the table are meant to highlight your ongoing costs only, and do not reflect any transactional costs. Therefore, the hypothetical return lines of the table are useful in comparing ongoing costs only, and will not help you determine the relative total costs of owning different funds. In addition, if these transactional costs were included, your costs would have been higher.
| | Expense Ratio
(Annualized)1 | Beginning
Account Value
at 10/1/17 | Ending
Account Value
(Net of Expenses)
at 3/31/18 | Expenses Paid
During Period
10/1/17-3/31/182 |
| Laudus Mondrian International Equity Fund | | | | |
| Actual Return | 0.90% | $1,000.00 | $1,020.50 | $4.53 |
| Hypothetical 5% Return | 0.90% | $1,000.00 | $1,020.41 | $4.53 |
| Laudus Mondrian Emerging Markets Fund | | | | |
| Actual Return | 1.20% | $1,000.00 | $1,061.50 | $6.17 |
| Hypothetical 5% Return | 1.20% | $1,000.00 | $1,018.92 | $6.04 |
| Laudus Mondrian International Government Fixed Income Fund | | | | |
| Actual Return | 0.75% | $1,000.00 | $1,052.60 | $3.84 |
| Hypothetical 5% Return | 0.75% | $1,000.00 | $1,021.16 | $3.78 |
| 1 | Based on the most recent six-month expense ratio; may differ from the expense ratio provided in the Financial Highlights which covers a 12-month period. This ratio does not include certain non-routine expenses, such as custody out-of-pocket fee reimbursement. |
| 2 | Expenses for each fund are equal to its annualized expense ratio, multiplied by the average account value over the period, multiplied by the 182 days of the period, and divided by the 365 days of the fiscal year. |
Laudus Mondrian Funds | Annual Report
Laudus Mondrian International Equity Fund
Financial Statements
Financial Highlights
| | 4/1/17–
3/31/181 | 4/1/16–
3/31/17 | 4/1/15–
3/31/16 | 4/1/14–
3/31/15 | 4/1/13–
3/31/14 | |
| Per-Share Data |
| Net asset value at beginning of period | $6.12 | $5.68 | $6.50 | $8.81 | $7.46 | |
| Income (loss) from investment operations: | | | | | | |
| Net investment income (loss)2 | 0.16 | 0.18 | 0.16 | 0.27 | 0.35 | |
| Net realized and unrealized gains (losses) | 0.53 | 0.42 | (0.61) | (0.41) | 1.22 | |
| Total from investment operations | 0.69 | 0.60 | (0.45) | (0.14) | 1.57 | |
| Less distributions: | | | | | | |
| Distributions from net investment income | (0.18) | (0.16) | (0.15) | (0.89) | (0.22) | |
| Distributions from net realized gains | (0.06) | — | (0.22) | (1.28) | — | |
| Total distributions | (0.24) | (0.16) | (0.37) | (2.17) | (0.22) | |
| Net asset value at end of period | $6.57 | $6.12 | $5.68 | $6.50 | $8.81 | |
| Total return | 11.22% | 10.78% | (6.88%) | 0.11% | 21.31% | |
| Ratios/Supplemental Data |
| Ratios to average net assets: | | | | | | |
| Net operating expenses | 0.89% 3 | 0.90% | 0.91% 4 | 1.01% 5 | 1.05% | |
| Gross operating expenses | 0.98% 3 | 0.96% | 1.06% | 1.07% | 1.07% | |
| Net investment income (loss) | 2.37% 3 | 3.10% | 2.53% | 3.28% | 4.24% | |
| Portfolio turnover rate | 23% | 34% | 29% | 36% 6 | 25% | |
| Net assets, end of period (x 1,000) | $117,694 | $92,312 | $110,873 | $91,981 | $162,366 | |
| |
1
Effective July 25, 2017, the Investor Share class, the Select Share class, and the Institutional Share class were consolidated into a single class of shares of the fund. The financial history as shown in the financial highlights is that of the former Institutional Shares (see financial note 1).
2
Calculated based on the average shares outstanding during the period.
3
The ratio of net operating expenses and gross operating expenses would have been 0.90% and 0.99%, respectively, and the ratio of net investment income would have been 2.36%, if the custody out-of-pocket fee reimbursement had not been included (see financial note 12).
4
The ratio of net operating expenses would have been 0.90%, if certain non-routine expenses had not been incurred.
5
Effective October 1, 2014, the annual operating expense was reduced. The ratio presented for period ended 3/31/15 is a blended ratio.
6
Portfolio turnover excludes the impact of investment activity from a merger with another fund.
Laudus Mondrian Funds | Annual Report
Laudus Mondrian International Equity Fund
Portfolio Holdings as of March 31, 2018
This section shows all the securities in the fund’s portfolio and their values as of the report date.
The fund files its complete schedule of portfolio holdings with the SEC for the first and third quarters of each fiscal year on Form N-Q. The fund’s Form N-Q is available on the SEC’s website at www.sec.gov and may be viewed and copied at the SEC’s Public Reference Room in Washington, D.C. Call 1-800-SEC-0330 for information on the operation of the Public Reference Room. The fund also makes available its complete schedule of portfolio holdings 15-20 days after calendar quarters on the fund’s website at www.schwabfunds.com/laudusfunds_prospectus.
| Security | Number
of Shares | Value ($) |
| Common Stock 99.0% of net assets |
| |
| Australia 1.7% |
| QBE Insurance Group Ltd. | 262,819 | 1,960,821 |
| |
| China 2.9% |
| China Mobile Ltd. | 369,500 | 3,386,612 |
| |
| France 5.9% |
| Compagnie de Saint-Gobain | 55,741 | 2,943,403 |
| Sanofi | 50,545 | 4,055,732 |
| | | 6,999,135 |
| |
| Germany 9.9% |
| Allianz SE | 13,621 | 3,079,124 |
| Daimler AG | 47,042 | 4,007,979 |
| Deutsche Telekom AG | 119,770 | 1,959,521 |
| SAP SE | 24,674 | 2,590,319 |
| | | 11,636,943 |
| |
| Hong Kong 2.9% |
| CK Hutchison Holdings Ltd. | 283,000 | 3,400,319 |
| |
| Italy 7.0% |
| Enel S.p.A. | 683,023 | 4,179,562 |
| Eni S.p.A. | 230,051 | 4,052,405 |
| | | 8,231,967 |
| |
| Japan 15.0% |
| Canon, Inc. | 40,700 | 1,476,526 |
| FUJIFILM Holdings Corp. | 24,300 | 970,388 |
| Honda Motor Co., Ltd. | 125,500 | 4,344,381 |
| Isuzu Motors Ltd. | 63,500 | 972,913 |
| Mitsubishi Electric Corp. | 141,600 | 2,298,246 |
| Takeda Pharmaceutical Co., Ltd. | 79,700 | 3,886,271 |
| Tokio Marine Holdings, Inc. | 82,900 | 3,758,922 |
| | | 17,707,647 |
| |
| Netherlands 3.2% |
| Koninklijke Ahold Delhaize N.V. | 160,231 | 3,796,820 |
| |
| Singapore 5.1% |
| Singapore Telecommunications Ltd. | 867,100 | 2,239,457 |
| United Overseas Bank Ltd. | 177,622 | 3,737,558 |
| | | 5,977,015 |
| |
| Security | Number
of Shares | Value ($) |
| Spain 6.6% |
| Banco Santander S.A. | 238,132 | 1,558,664 |
| Iberdrola S.A. | 465,690 | 3,424,400 |
| Telefonica S.A. | 281,996 | 2,793,690 |
| | | 7,776,754 |
| |
| Sweden 3.5% |
| Telia Co. AB | 862,639 | 4,064,524 |
| |
| Switzerland 7.9% |
| ABB Ltd. | 130,857 | 3,111,542 |
| Novartis AG | 37,659 | 3,045,893 |
| Zurich Insurance Group AG | 9,518 | 3,139,630 |
| | | 9,297,065 |
| |
| Taiwan 3.2% |
| Taiwan Semiconductor Manufacturing Co., Ltd. | 450,154 | 3,812,894 |
| |
| United Kingdom 24.2% |
| BP plc | 561,972 | 3,790,558 |
| GlaxoSmithKline plc | 168,858 | 3,279,398 |
| Kingfisher plc | 813,469 | 3,337,094 |
| Lloyds Banking Group plc | 4,436,343 | 4,035,412 |
| National Grid plc | 158,274 | 1,781,608 |
| Royal Dutch Shell plc, B Shares | 128,231 | 4,126,275 |
| SSE plc | 69,377 | 1,244,578 |
| Tesco plc | 1,454,360 | 4,209,220 |
| WPP plc | 171,570 | 2,726,528 |
| | | 28,530,671 |
| Total Common Stock |
| (Cost $93,784,328) | | 116,579,187 |
|
| Other Investment Company 0.3% of net assets |
| |
| United States 0.3% |
| State Street Institutional U.S. Government Money Market Fund, Premier Class 1.58% (a) | 343,117 | 343,117 |
| Total Other Investment Company |
| (Cost $343,117) | | 343,117 |
At March 31, 2018, the values of certain foreign securities held by the fund aggregating $116,579,187 were adjusted from their closing market values in accordance with international fair valuation procedures approved by the fund’s Board of Trustees. (See financial note 2(a) for additional information).
| (a) | The rate shown is the 7-day yield. |
Laudus Mondrian Funds | Annual Report
Laudus Mondrian International Equity Fund
Portfolio Holdings as of March 31, 2018 (continued)
The following is a summary of the inputs used to value the fund’s investments as of March 31, 2018 (see financial note 2(a) for additional information):
| Description | Quoted Prices in
Active Markets for
Identical Assets
(Level 1) | Other Significant
Observable Inputs
(Level 2) | Significant
Unobservable Inputs
(Level 3) | Total | |
| Assets | | | | | |
| Common Stock1 | $— | $116,579,187 | $— | $116,579,187 | |
| Other Investment Company1 | 343,117 | — | — | 343,117 | |
| Total | $343,117 | $116,579,187 | $— | $116,922,304 | |
| 1 | As categorized in Portfolio Holdings. |
The fund’s policy is to recognize transfers between Level 1, Level 2 and Level 3 as of the beginning of the fiscal year. There were no transfers between Level 1, Level 2 and Level 3 for the period ended March 31, 2018. Fund investments in underlying mutual funds are classified as Level 1, without consideration to the classification level of the investments held by the underlying mutual funds, which could be Level 1, Level 2 or Level 3.
Laudus Mondrian Funds | Annual Report
Laudus Mondrian International Equity Fund
Statement of Assets and Liabilities
As of March 31, 2018
| Assets |
| Investments in unaffiliated issuers, at value (cost $94,127,445) | | $116,922,304 |
| Foreign currency, at value (cost $124,712) | | 124,511 |
| Receivables: | | |
| Investments sold | | 184,000 |
| Foreign tax reclaims | | 275,310 |
| Dividends | | 246,504 |
| Fund shares sold | | 80,356 |
| Prepaid expenses | + | 11,644 |
| Total assets | | 117,844,629 |
| Liabilities |
| Payables: | | |
| Investment adviser fees | | 65,357 |
| Fund shares redeemed | | 1,255 |
| Accrued expenses | + | 83,741 |
| Total liabilities | | 150,353 |
| Net Assets |
| Total assets | | 117,844,629 |
| Total liabilities | – | 150,353 |
| Net assets | | $117,694,276 |
| Net Assets by Source | | |
| Capital received from investors | | 96,332,792 |
| Net investment income not yet distributed | | 354,869 |
| Net realized capital losses | | (1,794,634) |
| Net unrealized capital appreciation | | 22,801,249 |
| Net Asset Value (NAV) |
| Net Assets | ÷ | Shares
Outstanding | = | NAV |
| $117,694,276 | | 17,909,368 | | $6.57 |
| | | | | |
Laudus Mondrian Funds | Annual Report
Laudus Mondrian International Equity Fund
Statement of Operations
For the period April 1, 2017 through March 31, 2018
| Investment Income |
| Dividends (net of foreign withholding tax of $363,037) | | $3,662,778 |
| Income from non-cash dividends | + | 215,400 |
| Total investment income | | 3,878,178 |
| Expenses |
| Investment adviser fees | | 868,694 |
| Custodian fees | | 53,168 |
| Registration fees | | 52,719 |
| Professional fees | | 47,396 |
| Transfer agent fees | | 47,214 |
| Accounting and administration fees | | 28,228 |
| Independent trustees’ fees | | 14,877 |
| Shareholder reports | | 11,587 |
| Distribution and shareholder services fees (Investor Shares)1 | | 5,441 |
| Interest expense | | 4,016 |
| Sub-accounting and sub-transfer agent fees: | | |
| Investor Shares1 | | 2,395 |
| Select Shares1 | | 2,460 |
| Custody out-of-pocket fee reimbursement | | (15,458)* |
| Other expenses | + | 20,786 |
| Total expenses | | 1,143,523 |
| Expense reduction by adviser | – | 102,612 |
| Net expenses | – | 1,040,911 |
| Net investment income | | 2,837,267 |
| Realized and Unrealized Gains (Losses) |
| Net realized gains on investments | | 4,708,209 |
| Net realized losses on foreign currency transactions | + | (1,601) |
| Net realized gains | | 4,706,608 |
| Net change in unrealized appreciation (depreciation) on investments | | 4,243,187 |
| Net change in unrealized appreciation (depreciation) on foreign currency translations | + | 25,719 |
| Net change in unrealized appreciation (depreciation) | + | 4,268,906 |
| Net realized and unrealized gains | | 8,975,514 |
| Increase in net assets resulting from operations | | $11,812,781 |
| * | See financial note 12 for additional information. |
| 1 | Effective July 25, 2017, all outstanding Investor Shares and Select Shares were consolidated into the Institutional Shares, resulting in a single class of shares of the fund (see financial note 1). |
Laudus Mondrian Funds | Annual Report
Laudus Mondrian International Equity Fund
Statement of Changes in Net Assets
For the current and prior report periods
| Operations | |
| | 4/1/17-3/31/18 | 4/1/16-3/31/17 |
| Net investment income | | $2,837,267 | $4,214,846 |
| Net realized gains (losses) | | 4,706,608 | (1,314,651) |
| Net change in unrealized appreciation (depreciation) | + | 4,268,906 | 10,791,204 |
| Increase in net assets from operations | | 11,812,781 | 13,691,399 |
| Distributions to Shareholders1 | |
| Distributions from net investment income | | | |
| Investor Shares | | — | (174,166) |
| Select Shares | | — | (168,191) |
| Institutional Shares | + | (3,106,572) | (3,635,958) |
| Total distributions from net investment income | | (3,106,572) | (3,978,315) |
| Distributions from net realized gains | | | |
| Institutional Shares | + | (1,109,869) | — |
| Total distributions from net realized gains | | (1,109,869) | — |
| Total distributions | | ($4,216,441) | ($3,978,315) |
| Transactions in Fund Shares1 | | | |
| | | 4/1/17-3/31/18 | 4/1/16-3/31/17 |
| | | SHARES | VALUE | SHARES | VALUE |
| Shares Sold | | | | | |
| Investor Shares | | 62,863 | $392,981 | 754,099 | $4,346,911 |
| Select Shares | | 111,157 | 699,654 | 894,507 | 5,229,138 |
| Institutional Shares | + | 6,667,842 | 43,817,466 | 7,135,778 | 41,577,906 |
| Total shares sold | | 6,841,862 | $44,910,101 | 8,784,384 | $51,153,955 |
| Shares Reinvested | | | | | |
| Investor Shares | | — | $— | 26,886 | $151,100 |
| Select Shares | | — | — | 24,300 | 137,291 |
| Institutional Shares | + | 353,343 | 2,335,599 | 325,293 | 1,844,411 |
| Total shares reinvested | | 353,343 | $2,335,599 | 376,479 | $2,132,802 |
| Shares Redeemed | | | | | |
| Investor Shares | | (1,259,304) | ($8,016,406) | (505,190) | ($2,904,993) |
| Select Shares | | (1,110,179) | (7,119,869) | (707,653) | (4,070,851) |
| Institutional Shares | + | (4,201,548) | (27,665,780) | (11,874,216) | (70,894,657) |
| Total shares redeemed | | (6,571,031) | ($42,802,055) | (13,087,059) | ($77,870,501) |
| Net transactions in fund shares | | 624,174 | $4,443,645 | (3,926,196) | ($24,583,744) |
| Shares Outstanding and Net Assets | | | |
| | | 4/1/17-3/31/18 | 4/1/16-3/31/17 |
| | | SHARES | NET ASSETS | SHARES | NET ASSETS |
| Beginning of period | | 17,285,194 | $105,654,291 | 21,211,390 | $120,524,951 |
| Total increase or decrease | + | 624,174 | 12,039,985 | (3,926,196) | (14,870,660) |
| End of period | | 17,909,368 | $117,694,276 | 17,285,194 | $105,654,291 |
| Net investment income not yet distributed | | | $354,869 | | $625,774 |
| 1 | Effective July 25, 2017, all outstanding Investor Shares (758,820 shares valued at $4,844,685) and Select Shares (993,528 shares valued at $6,386,298) were consolidated into the Institutional Shares, resulting in a single class of shares of the fund (see financial note 1). |
Laudus Mondrian Funds | Annual Report
Laudus Mondrian Emerging Markets Fund
Financial Statements
Financial Highlights
| | 4/1/17–
3/31/181 | 4/1/16–
3/31/17 | 4/1/15–
3/31/16 | 4/1/14–
3/31/15 | 4/1/13–
3/31/14 | |
| Per-Share Data |
| Net asset value at beginning of period | $7.71 | $7.03 | $8.18 | $8.69 | $9.85 | |
| Income (loss) from investment operations: | | | | | | |
| Net investment income (loss)2 | 0.19 | 0.14 | 0.14 | 0.12 | 0.14 | |
| Net realized and unrealized gains (losses) | 0.92 | 0.72 | (1.20) | (0.39) | (1.19) | |
| Total from investment operations | 1.11 | 0.86 | (1.06) | (0.27) | (1.05) | |
| Less distributions: | | | | | | |
| Distributions from net investment income | (0.23) | (0.18) | (0.09) | (0.24) | (0.11) | |
| Distributions from net realized gains | — | — | — | — | (0.00) 3 | |
| Total distributions | (0.23) | (0.18) | (0.09) | (0.24) | (0.11) | |
| Net asset value at end of period | $8.59 | $7.71 | $7.03 | $8.18 | $8.69 | |
| Total return | 14.55% | 12.57% | (12.87%) | (3.03%) | (10.62%) | |
| Ratios/Supplemental Data |
| Ratios to average net assets: | | | | | | |
| Net operating expenses | 1.19% 4 | 1.20% | 1.20% | 1.29% 5 | 1.45% | |
| Gross operating expenses | 1.21% 4 | 1.22% | 1.21% | 1.31% | 1.52% | |
| Net investment income (loss) | 2.30% 4 | 1.92% | 1.87% | 1.42% | 1.55% | |
| Portfolio turnover rate | 39% | 32% | 28% | 30% 6 | 69% | |
| Net assets, end of period (x 1,000) | $314,259 | $336,896 | $406,462 | $559,347 | $121,795 | |
| |
1
Effective July 25, 2017, the Investor Share class, the Select Share class, and the Institutional Share class were consolidated into a single class of shares of the fund. The financial history as shown in the financial highlights is that of the former Institutional Shares (see financial note 1).
2
Calculated based on the average shares outstanding during the period.
3
Per-share amount was less than ($0.005).
4
The ratio of net operating expenses and gross operating expenses would have been 1.20% and 1.22%, respectively, and the ratio of net investment income would have been 2.29%, if the custody out-of-pocket fee reimbursement had not been included (see financial note 12).
5
Effective October 1, 2014, the annual operating expense was reduced. The ratio presented for period ended 3/31/15 is a blended ratio.
6
Portfolio turnover excludes the impact of investment activity from a merger with another fund.
Laudus Mondrian Funds | Annual Report
Laudus Mondrian Emerging Markets Fund
Portfolio Holdings as of March 31, 2018
This section shows all the securities in the fund’s portfolio and their values as of the report date.
The fund files its complete schedule of portfolio holdings with the SEC for the first and third quarters of each fiscal year on Form N-Q. The fund’s Form N-Q is available on the SEC’s website at www.sec.gov and may be viewed and copied at the SEC’s Public Reference Room in Washington, D.C. Call 1-800-SEC-0330 for information on the operation of the Public Reference Room. The fund also makes available its complete schedule of portfolio holdings 15-20 days after calendar quarters on the fund’s website at www.schwabfunds.com/laudusfunds_prospectus.
| Security | Number
of Shares | Value ($) |
| Common Stock 98.6% of net assets |
| |
| Brazil 14.6% |
| CCR S.A. | 1,442,981 | 5,463,436 |
| Cielo S.A. | 409,936 | 2,569,046 |
| Embraer S.A. ADR | 453,668 | 11,795,368 |
| Hypera S.A. | 294,700 | 3,227,779 |
| Itau Unibanco Holding S.A. ADR | 647,543 | 10,101,671 |
| Kroton Educacional S.A. | 982,400 | 4,046,901 |
| Suzano Papel e Celulose S.A. | 847,500 | 8,563,692 |
| | | 45,767,893 |
| |
| China 19.1% |
| China Construction Bank Corp., Class H | 13,610,000 | 14,215,698 |
| China Medical System Holdings Ltd. | 796,000 | 1,823,542 |
| China Mobile Ltd. | 1,179,500 | 10,810,579 |
| China Resources Power Holdings Co., Ltd. | 4,161,291 | 7,629,483 |
| Dongfeng Motor Group Co., Ltd., Class H | 5,520,000 | 6,444,269 |
| Ping An Insurance Group Co. of China Ltd., Class H | 1,015,500 | 10,470,484 |
| WH Group Ltd. | 8,083,000 | 8,660,819 |
| | | 60,054,874 |
| |
| Hong Kong 1.4% |
| Sands China Ltd. | 796,000 | 4,325,730 |
| |
| India 12.3% |
| Bajaj Auto Ltd. | 150,212 | 6,351,391 |
| HCL Technologies Ltd. | 421,993 | 6,266,970 |
| Housing Development Finance Corp., Ltd. | 226,315 | 6,374,861 |
| Indiabulls Housing Finance Ltd. | 59,580 | 1,140,545 |
| Infosys Ltd. | 21,674 | 379,256 |
| Infosys Ltd. ADR | 146,487 | 2,614,793 |
| Larsen & Toubro Ltd. | 201,285 | 4,070,613 |
| Lupin Ltd. | 372,708 | 4,226,528 |
| Reliance Industries Ltd. | 36,669 | 500,509 |
| Vedanta Ltd. | 1,603,894 | 6,855,444 |
| | | 38,780,910 |
| |
| Indonesia 1.6% |
| PT Bank Rakyat Indonesia (Persero) Tbk | 18,447,900 | 4,841,458 |
| |
| Malaysia 5.2% |
| AMMB Holdings Berhad | 5,914,200 | 5,959,457 |
| Genting Malaysia Berhad | 5,174,900 | 6,503,681 |
| Tenaga Nasional Berhad | 952,500 | 3,985,836 |
| | | 16,448,974 |
| |
| Mexico 2.5% |
| Fibra Uno Administracion S.A. de C.V. | 5,190,407 | 7,811,306 |
| |
| Security | Number
of Shares | Value ($) |
| Peru 1.4% |
| Credicorp Ltd. | 18,887 | 4,288,104 |
| |
| Philippines 1.1% |
| PLDT, Inc. ADR | 121,338 | 3,442,359 |
| |
| Qatar 1.4% |
| Qatar National Bank SAQ | 124,463 | 4,458,929 |
| |
| Republic of Korea 14.0% |
| Korea Electric Power Corp. | 127,035 | 3,933,072 |
| Korea Zinc Co., Ltd. | 10,715 | 4,865,804 |
| Samsung Electronics Co., Ltd. | 7,105 | 16,600,662 |
| Samsung SDI Co., Ltd. | 32,461 | 5,885,227 |
| Shinhan Financial Group Co., Ltd. | 167,935 | 7,163,985 |
| SK Telecom Co., Ltd. | 26,058 | 5,650,327 |
| | | 44,099,077 |
| |
| Russia 5.3% |
| Gazprom PJSC ADR | 2,018,472 | 9,951,067 |
| Lukoil PJSC ADR | 43,312 | 2,998,057 |
| MMC Norilsk Nickel PJSC ADR | 202,287 | 3,782,767 |
| | | 16,731,891 |
| |
| South Africa 3.0% |
| Sasol Ltd. | 108,625 | 3,705,866 |
| Woolworths Holdings Ltd. | 1,108,722 | 5,620,494 |
| | | 9,326,360 |
| |
| Taiwan 9.8% |
| Asustek Computer, Inc. | 512,000 | 4,803,626 |
| Mega Financial Holding Co., Ltd. | 8,656,153 | 7,486,497 |
| Taiwan Mobile Co., Ltd. | 701,000 | 2,627,445 |
| Taiwan Semiconductor Manufacturing Co., Ltd. | 1,860,719 | 15,760,659 |
| | | 30,678,227 |
| |
| Thailand 2.0% |
| Kasikornbank PCL NVDR | 926,000 | 6,301,559 |
| |
| Turkey 2.4% |
| Turkiye Garanti Bankasi A/S | 1,264,005 | 3,504,873 |
| Turkiye Halk Bankasi A/S | 1,803,823 | 4,158,306 |
| | | 7,663,179 |
| |
| United Arab Emirates 1.5% |
| Emaar Malls PJSC | 7,952,227 | 4,654,793 |
| Total Common Stock |
| (Cost $268,700,600) | | 309,675,623 |
|
Laudus Mondrian Funds | Annual Report
Laudus Mondrian Emerging Markets Fund
Portfolio Holdings as of March 31, 2018 (continued)
| Security | Number
of Shares | Value ($) |
| Preferred Stock 0.4% of net assets |
| |
| India 0.4% |
| Vedanta Ltd. 7.50% | 8,985,240 | 1,370,758 |
| Total Preferred Stock |
| (Cost $1,401,644) | | 1,370,758 |
|
| Other Investment Company 0.7% of net assets |
| |
| United States 0.7% |
| State Street Institutional U.S. Government Money Market Fund, Premier Class 1.58% (a) | 2,245,094 | 2,245,094 |
| Total Other Investment Company |
| (Cost $2,245,094) | | 2,245,094 |
At March 31, 2018, the values of certain foreign securities held by the fund aggregating $218,097,514 were adjusted from their closing market values in accordance with international fair valuation procedures approved by the fund’s Board of Trustees. (See financial note 2(a) for additional information).
| (a) | The rate shown is the 7-day yield. |
| | |
| ADR — | American Depositary Receipt |
| NVDR — | Non-Voting Depositary Receipt |
The following is a summary of the inputs used to value the fund’s investments as of March 31, 2018 (see financial note 2(a) for additional information):
| Description | Quoted Prices in
Active Markets for
Identical Assets
(Level 1) | Other Significant
Observable Inputs
(Level 2) | Significant
Unobservable Inputs
(Level 3) | Total | |
| Assets | | | | | |
| Common Stock1 | $— | $188,198,367 | $— | $188,198,367 | |
| Brazil | 45,767,893 | — | — | 45,767,893 | |
| India | 8,881,763 | 29,899,147 | — | 38,780,910 | |
| Mexico | 7,811,306 | — | — | 7,811,306 | |
| Peru | 4,288,104 | — | — | 4,288,104 | |
| Philippines | 3,442,359 | — | — | 3,442,359 | |
| Russia | 16,731,891 | — | — | 16,731,891 | |
| United Arab Emirates | 4,654,793 | — | — | 4,654,793 | |
| Preferred Stock1 | 1,370,758 | — | — | 1,370,758 | |
| Other Investment Company1 | 2,245,094 | — | — | 2,245,094 | |
| Total | $95,193,961 | $218,097,514 | $— | $313,291,475 | |
| 1 | As categorized in Portfolio Holdings. |
The funds policy is to recognize transfers between Level 1, Level 2 and Level 3 as of the beginning of the fiscal year. There were security transfers in the amount of $6,612,158 and $13,297,772 from Level 1 to Level 2 and from Level 2 to Level 1, respectively, for the period ended March 31, 2018. The transfers between Level 1 and Level 2 were primarily due to the use of international fair valuation by the fund. There were no transfers in or out of Level 3 during the period. Fund investments in underlying mutual funds are classified as Level 1, without consideration to the classification level of the investments held by the underlying mutual funds, which could be Level 1, Level 2 or Level 3.
Laudus Mondrian Funds | Annual Report
Laudus Mondrian Emerging Markets Fund
Statement of Assets and Liabilities
As of March 31, 2018
| Assets |
| Investments in unaffiliated issuers, at value (cost $272,347,338) | | $313,291,475 |
| Foreign currency, at value (cost $1,200,441) | | 1,202,689 |
| Receivables: | | |
| Investments sold | | 2,280,990 |
| Dividends | | 677,873 |
| Foreign tax reclaims | | 32,726 |
| Fund shares sold | | 11,955 |
| Prepaid expenses | + | 16,063 |
| Total assets | | 317,513,771 |
| Liabilities |
| Payables: | | |
| Investments bought | | 2,397,563 |
| Foreign capital gains tax | | 356,649 |
| Investment adviser fees | | 295,173 |
| Fund shares redeemed | | 22,398 |
| Accrued expenses | + | 182,826 |
| Total liabilities | | 3,254,609 |
| Net Assets |
| Total assets | | 317,513,771 |
| Total liabilities | – | 3,254,609 |
| Net assets | | $314,259,162 |
| Net Assets by Source | | |
| Capital received from investors | | 387,160,250 |
| Distributions in excess of net investment income | | (233,515) |
| Net realized capital losses | | (113,264,997) |
| Net unrealized capital appreciation | | 40,597,424 |
| Net Asset Value (NAV) |
| Net Assets | ÷ | Shares
Outstanding | = | NAV |
| $314,259,162 | | 36,602,508 | | $8.59 |
| | | | | |
Laudus Mondrian Funds | Annual Report
Laudus Mondrian Emerging Markets Fund
Statement of Operations
For the period April 1, 2017 through March 31, 2018
| Investment Income |
| Dividends (net of foreign withholding tax of $1,221,644) | | $11,321,645 |
| Expenses |
| Investment adviser fees | | 3,235,003 |
| Custodian fees | | 442,865 |
| Accounting and administration fees | | 62,340 |
| Professional fees | | 54,283 |
| Registration fees | | 45,147 |
| Transfer agent fees | | 33,847 |
| Independent trustees’ fees | | 19,724 |
| Interest expense | | 9,362 |
| Shareholder reports | | 3,158 |
| Distribution and shareholder services fees (Investor Shares)1 | | 2,311 |
| Sub-accounting and sub-transfer agent fees: | | |
| Investor Shares1 | | 1,403 |
| Select Shares1 | | 1,389 |
| Custody out-of-pocket fee reimbursement | | (34,658)* |
| Other expenses | + | 34,852 |
| Total expenses | | 3,911,026 |
| Expense reduction by adviser | – | 49,435 |
| Net expenses | – | 3,861,591 |
| Net investment income | | 7,460,054 |
| Realized and Unrealized Gains (Losses) |
| Net realized gains on investments | | 10,050,037 |
| Net realized losses on foreign currency transactions | | (226,905) |
| Net realized gains on forward foreign currency exchange contracts | + | 43,735 |
| Net realized gains | | 9,866,867 |
| Net change in unrealized appreciation (depreciation) on investments (net of change in foreign capital gains tax of $296,336) | | 27,743,573 |
| Net change in unrealized appreciation (depreciation) on foreign currency translations | + | (14,932) |
| Net change in unrealized appreciation (depreciation) | + | 27,728,641 |
| Net realized and unrealized gains | | 37,595,508 |
| Increase in net assets resulting from operations | | $45,055,562 |
| * | See financial note 12 for additional information. |
| 1 | Effective July 25, 2017, all outstanding Investor Shares and Select Shares were consolidated into the Institutional Shares, resulting in a single class of shares of the fund (see financial note 1). |
Laudus Mondrian Funds | Annual Report
Laudus Mondrian Emerging Markets Fund
Statement of Changes in Net Assets
For the current and prior report periods
| Operations | |
| | 4/1/17-3/31/18 | 4/1/16-3/31/17 |
| Net investment income | | $7,460,054 | $7,459,147 |
| Net realized gains (losses) | | 9,866,867 | (27,940,771) |
| Net change in unrealized appreciation (depreciation) | + | 27,728,641 | 62,217,878 |
| Increase in net assets from operations | | 45,055,562 | 41,736,254 |
| Distributions to Shareholders1 | |
| Distributions from net investment income | | | |
| Investor Shares | | — | (66,046) |
| Select Shares | | — | (112,696) |
| Institutional Shares | + | (8,413,005) | (9,365,136) |
| Total distributions from net investment income | | ($8,413,005) | ($9,543,878) |
| Transactions in Fund Shares1 | | | |
| | | 4/1/17-3/31/18 | 4/1/16-3/31/17 |
| | | SHARES | VALUE | SHARES | VALUE |
| Shares Sold | | | | | |
| Investor Shares | | 20,821 | $165,883 | 46,601 | $338,038 |
| Select Shares | | 6,912 | 55,245 | 36,751 | 267,197 |
| Institutional Shares | + | 4,735,721 | 39,224,764 | 6,004,591 | 43,359,379 |
| Total shares sold | | 4,763,454 | $39,445,892 | 6,087,943 | $43,964,614 |
| Shares Reinvested | | | | | |
| Investor Shares | | — | $— | 9,047 | $62,870 |
| Select Shares | | — | — | 15,230 | 105,697 |
| Institutional Shares | + | 990,646 | 8,123,300 | 1,291,515 | 8,950,205 |
| Total shares reinvested | | 990,646 | $8,123,300 | 1,315,792 | $9,118,772 |
| Shares Redeemed | | | | | |
| Investor Shares | | (394,224) | ($3,271,281) | (150,769) | ($1,086,698) |
| Select Shares | | (608,480) | (5,038,003) | (286,761) | (2,091,380) |
| Institutional Shares | + | (12,826,632) | (106,067,713) | (21,407,200) | (153,322,505) |
| Total shares redeemed | | (13,829,336) | ($114,376,997) | (21,844,730) | ($156,500,583) |
| Net transactions in fund shares | | (8,075,236) | ($66,807,805) | (14,440,995) | ($103,417,197) |
| Shares Outstanding and Net Assets | | | |
| | | 4/1/17-3/31/18 | 4/1/16-3/31/17 |
| | | SHARES | NET ASSETS | SHARES | NET ASSETS |
| Beginning of period | | 44,677,744 | $344,424,410 | 59,118,739 | $415,649,231 |
| Total decrease | + | (8,075,236) | (30,165,248) | (14,440,995) | (71,224,821) |
| End of period | | 36,602,508 | $314,259,162 | 44,677,744 | $344,424,410 |
| Distributions in excess of net investment income | | | ($233,515) | | ($1,208,817) |
| 1 | Effective July 25, 2017, all outstanding Investor Shares (350,481 shares valued at $2,921,115) and Select Shares (490,116 shares valued at $4,088,249) were consolidated into the Institutional Shares, resulting in a single class of shares of the fund (see financial note 1). |
Laudus Mondrian Funds | Annual Report
Laudus Mondrian International Government Fixed Income Fund
Financial Statements
Financial Highlights
| | 4/1/17–
3/31/18 | 4/1/16–
3/31/17 | 4/1/15–
3/31/16 | 4/1/14–
3/31/15 | 4/1/13–
3/31/14 | |
| Per-Share Data |
| Net asset value at beginning of period | $9.32 | $9.93 | $9.45 | $10.89 | $11.01 | |
| Income (loss) from investment operations: | | | | | | |
| Net investment income (loss)1 | 0.08 | 0.09 | 0.11 | 0.15 | 0.16 | |
| Net realized and unrealized gains (losses) | 1.04 | (0.64) | 0.56 | (1.14) | (0.21) | |
| Total from investment operations | 1.12 | (0.55) | 0.67 | (0.99) | (0.05) | |
| Less distributions: | | | | | | |
| Distributions from net investment income | (0.00) 2 | (0.00) 2 | — | — | — | |
| Distributions from net realized gains | — | (0.06) | (0.19) | (0.45) | (0.07) | |
| Total distributions | (0.00) 2 | (0.06) | (0.19) | (0.45) | (0.07) | |
| Net asset value at end of period | $10.44 | $9.32 | $9.93 | $9.45 | $10.89 | |
| Total return | 12.03% | (5.48%) | 7.27% | (9.37%) | (0.49%) | |
| Ratios/Supplemental Data |
| Ratios to average net assets: | | | | | | |
| Net operating expenses | 0.74% 3 | 0.75% | 0.75% | 0.74% | 0.69% | |
| Gross operating expenses | 0.81% 3 | 0.79% | 0.81% | 0.76% | 0.69% | |
| Net investment income (loss) | 0.84% 3 | 0.87% | 1.21% | 1.39% | 1.48% | |
| Portfolio turnover rate | 52% | 98% | 31% | 50% | 52% | |
| Net assets, end of period (x 1,000) | $84,330 | $95,565 | $119,938 | $187,388 | $652,647 | |
| |
1
Calculated based on the average shares outstanding during the period.
2
Per-share amount was less than ($0.005).
3
The ratio of net operating expenses and gross operating expenses would have been 0.75% and 0.82%, respectively, and the ratio of net investment income would have been 0.83%, if the custody out-of-pocket fee reimbursement had not been included (See financial note 12).
Laudus Mondrian Funds | Annual Report
Laudus Mondrian International Government Fixed Income Fund
Portfolio Holdings as of March 31, 2018
This section shows all the securities in the fund’s portfolio and their values as of the report date.
The fund files its complete schedule of portfolio holdings with the SEC for the first and third quarters of each fiscal year on Form N-Q. The fund’s Form N-Q is available on the SEC’s website at www.sec.gov and may be viewed and copied at the SEC’s Public Reference Room in Washington, D.C. Call 1-800-SEC-0330 for information on the operation of the Public Reference Room. The fund also makes available its complete schedule of portfolio holdings 15-20 days after calendar quarters on the fund’s website at www.schwabfunds.com/laudusfunds_prospectus.
For fixed-rate obligations, the rate shown is the interest rate (the rate established when the obligation was issued). For variable-rate obligations, the rate shown is the rate as of the report date based on each security’s rate reset date. The reference rate and spread used is shown parenthetically in the security description, if available; if not, the reference rate is described in a footnote. The maturity date shown for all the securities is the final legal maturity.
Security
Rate, Maturity Date | Face Amount
(local currency) | Value ($) |
| Government Bonds 88.5% of net assets |
| |
| Australia 7.7% |
| Australia Government Bond |
| 5.75%, 05/15/21 (AUD) | 610,000 | 519,571 |
| 3.25%, 04/21/25 (AUD) | 2,986,000 | 2,405,103 |
| 4.75%, 04/21/27 (AUD) | 3,500,000 | 3,156,863 |
| 3.00%, 03/21/47 (AUD) | 600,000 | 444,203 |
| | | 6,525,740 |
| |
| Austria 4.5% |
| Austria Government Bond |
| 6.25%, 07/15/27 (EUR) | 2,048,000 | 3,824,696 |
| |
| Belgium 4.6% |
| Kingdom of Belgium Government Bond |
| 1.00%, 06/22/26 (EUR) | 3,030,000 | 3,877,334 |
| |
| Canada 4.0% |
| Canadian Government Bond |
| 0.75%, 09/01/21 (CAD) | 1,500,000 | 1,119,665 |
| 1.50%, 06/01/26 (CAD) | 1,950,000 | 1,448,814 |
| 5.00%, 06/01/37 (CAD) | 730,000 | 813,649 |
| | | 3,382,128 |
| |
| Finland 4.6% |
| Finland Government Bond |
| 1.63%, 09/15/22 (EUR) | 1,800,000 | 2,387,480 |
| 0.50%, 09/15/27 (EUR) | 1,200,000 | 1,463,905 |
| | | 3,851,385 |
| |
| France 15.6% |
| France Government Bond OAT |
| 0.00%, 05/25/20 (EUR) (a) | 3,350,000 | 4,165,337 |
| 0.50%, 05/25/25 (EUR) | 1,650,000 | 2,058,546 |
| 5.75%, 10/25/32 (EUR) | 775,000 | 1,574,081 |
| 1.25%, 05/25/36 (EUR) | 1,500,000 | 1,855,706 |
| 3.25%, 05/25/45 (EUR) | 710,000 | 1,220,914 |
| French Republic Government Bond OAT |
| 0.50%, 11/25/19 (EUR) | 1,300,000 | 1,628,217 |
| 1.50%, 05/25/31 (EUR) | 500,000 | 657,097 |
| | | 13,159,898 |
| |
| Germany 7.8% |
| Bundesobligation |
| 0.00%, 10/08/21 (EUR) (a) | 1,000,000 | 1,246,922 |
Security
Rate, Maturity Date | Face Amount
(local currency) | Value ($) |
| Bundesrepublik Deutschland |
| 0.00%, 08/15/26 (EUR) (a) | 1,500,000 | 1,797,916 |
| 0.50%, 08/15/27 (EUR) | 500,000 | 619,059 |
| Bundesschatzanweisungen |
| 0.00%, 06/14/19 (EUR) (a) | 300,000 | 372,107 |
| Kreditanstalt fuer Wiederaufbau |
| 2.05%, 02/16/26 (JPY) | 230,000,000 | 2,524,834 |
| | | 6,560,838 |
| |
| Japan 16.1% |
| Japan Government Five Year Bond |
| 0.10%, 06/20/21 (JPY) | 124,000,000 | 1,173,880 |
| Japan Government Ten Year Bond |
| 0.10%, 06/20/26 (JPY) | 212,000,000 | 2,013,814 |
| Japan Government Thirty Year Bond |
| 2.40%, 12/20/34 (JPY) | 275,000,000 | 3,441,582 |
| Japan Government Twenty Year Bond |
| 1.60%, 06/20/30 (JPY) | 274,000,000 | 3,032,044 |
| 0.20%, 06/20/36 (JPY) | 430,000,000 | 3,875,338 |
| | | 13,536,658 |
| |
| Malaysia 2.9% |
| Malaysia Government Bond |
| 4.05%, 09/30/21 (MYR) | 2,420,000 | 635,844 |
| 4.18%, 07/15/24 (MYR) | 6,350,000 | 1,667,187 |
| 4.25%, 05/31/35 (MYR) | 670,000 | 166,542 |
| | | 2,469,573 |
| |
| Mexico 4.1% |
| Mexico Government Bond |
| 6.50%, 06/10/21 (MXN) | 22,780,000 | 1,228,441 |
| 7.50%, 06/03/27 (MXN) | 9,600,000 | 534,964 |
| 7.75%, 11/23/34 (MXN) | 29,410,000 | 1,653,447 |
| | | 3,416,852 |
| |
| Netherlands 4.7% |
| Netherlands Government Bond |
| 0.00%, 01/15/22 (EUR) (a) | 388,000 | 482,488 |
| 5.50%, 01/15/28 (EUR) | 1,938,490 | 3,519,875 |
| | | 4,002,363 |
| |
| New Zealand 4.4% |
| New Zealand Government Bond |
| 5.00%, 03/15/19 (NZD) | 200,000 | 149,000 |
| 5.50%, 04/15/23 (NZD) | 1,605,000 | 1,336,182 |
Laudus Mondrian Funds | Annual Report
Laudus Mondrian International Government Fixed Income Fund
Portfolio Holdings as of March 31, 2018 (continued)
Security
Rate, Maturity Date | Face Amount
(local currency) | Value ($) |
| 4.50%, 04/15/27 (NZD) | 2,075,000 | 1,712,798 |
| 2.75%, 04/15/37 (NZD) | 750,000 | 498,332 |
| | | 3,696,312 |
| |
| Singapore 4.5% |
| Singapore Government Bond |
| 2.00%, 07/01/20 (SGD) | 1,100,000 | 841,223 |
| 2.38%, 06/01/25 (SGD) | 2,350,000 | 1,811,139 |
| 2.88%, 09/01/30 (SGD) | 1,420,000 | 1,132,838 |
| | | 3,785,200 |
| |
| Spain 3.0% |
| Spain Government Bond |
| 1.40%, 01/31/20 (EUR) | 550,000 | 698,645 |
| 1.60%, 04/30/25 (EUR) | 675,000 | 885,965 |
| 4.20%, 01/31/37 (EUR) | 550,000 | 937,695 |
| | | 2,522,305 |
| Total Government Bonds |
| (Cost $69,331,193) | | 74,611,282 |
|
| Supranational* 9.6% of net assets |
| Asian Development Bank |
| 2.35%, 06/21/27 (JPY) | 310,000,000 | 3,531,392 |
| European Financial Stability Facility |
| 0.95%, 02/14/28 (EUR) | 500,000 | 625,802 |
| European Investment Bank |
| 2.15%, 01/18/27 (JPY) | 350,000,000 | 3,925,839 |
| Total Supranational |
| (Cost $7,844,033) | | 8,083,033 |
| Security | Number
of Shares | Value ($) |
| Other Investment Company 0.9% of net assets |
| |
| United States 0.9% |
| State Street Institutional U.S. Government Money Market Fund, Premier Class 1.58% (b) | 811,947 | 811,947 |
| Total Other Investment Company |
| (Cost $811,947) | | 811,947 |
| * | Supranational bonds represent the debt of international organizations or institutions such as the World Bank, the International Monetary Fund, regional multilateral development banks and others. |
| (a) | Zero Coupon Bond. |
| (b) | The rate shown is the 7-day yield. |
| | |
| AUD — | Australian dollar |
| CAD — | Canadian dollar |
| EUR — | euro currency |
| GBP — | Great British pound |
| JPY — | Japanese yen |
| MXN — | Mexican peso |
| MYR — | Malaysian ringgit |
| NZD — | New Zealand dollar |
| SGD — | Singapore dollar |
| USD — | U.S. dollar |
In addition to the above, the fund held the following at 03/31/18:
| Expiration Date | Counterparty | Currency
to be
Received | Amount of
Currency
to be
Received | Currency
to be
Delivered | Amount of
Currency
to be
Delivered | Unrealized
Appreciation
(Depreciation)
($) |
| Forward Foreign Currency Exchange Contracts | | | | | | |
| 04/27/2018 | State Street Bank & Trust Co. | EUR | 1,455,000 | USD | 1,812,610 | (19,379) |
| 04/27/2018 | State Street Bank & Trust Co. | EUR | 401,000 | USD | 501,300 | (7,083) |
| 04/27/2018 | State Street Bank & Trust Co. | EUR | 361,000 | USD | 441,264 | 3,655 |
| 04/27/2018 | State Street Bank & Trust Co. | EUR | 456,500 | USD | 563,583 | (965) |
| 04/27/2018 | State Street Bank & Trust Co. | GBP | 7,707,000 | USD | 10,874,269 | (50,786) |
| 04/27/2018 | State Street Bank & Trust Co. | GBP | 121,000 | USD | 166,767 | 3,162 |
| 04/27/2018 | State Street Bank & Trust Co. | SGD | 39,000 | USD | 29,880 | (119) |
| 04/27/2018 | State Street Bank & Trust Co. | SGD | 31,500 | USD | 23,883 | 155 |
| 04/27/2018 | State Street Bank & Trust Co. | SGD | 27,000 | USD | 20,561 | 43 |
| 04/27/2018 | State Street Bank & Trust Co. | USD | 4,990,999 | AUD | 6,166,500 | 254,815 |
| 04/27/2018 | State Street Bank & Trust Co. | USD | 53,449 | AUD | 69,000 | 454 |
| 04/27/2018 | State Street Bank & Trust Co. | USD | 1,753,242 | AUD | 2,260,000 | 17,448 |
| 04/27/2018 | State Street Bank & Trust Co. | USD | 190,804 | EUR | 153,000 | 2,237 |
| 04/27/2018 | State Street Bank & Trust Co. | USD | 721,443 | EUR | 580,000 | 6,615 |
| 04/27/2018 | State Street Bank & Trust Co. | USD | 195,595 | EUR | 157,500 | 1,483 |
| 04/27/2018 | State Street Bank & Trust Co. | USD | 3,722,855 | NZD | 5,083,500 | 49,207 |
| 04/27/2018 | State Street Bank & Trust Co. | USD | 49,553 | NZD | 68,000 | 412 |
| 04/27/2018 | State Street Bank & Trust Co. | USD | 3,656,644 | SGD | 4,783,000 | 6,710 |
| 04/27/2018 | State Street Bank & Trust Co. | USD | 190,198 | SGD | 250,000 | (579) |
| Net Unrealized Appreciation on Forward Foreign Currency Exchange Contracts | 267,485 |
Laudus Mondrian Funds | Annual Report
Laudus Mondrian International Government Fixed Income Fund
Portfolio Holdings as of March 31, 2018 (continued)
The following is a summary of the inputs used to value the fund’s investments as of March 31, 2018 (see financial note 2(a) for additional information):
| Description | Quoted Prices in
Active Markets for
Identical Assets
(Level 1) | Other Significant
Observable Inputs
(Level 2) | Significant
Unobservable Inputs
(Level 3) | Total | |
| Assets | | | | | |
| Government Bonds1 | $— | $74,611,282 | $— | $74,611,282 | |
| Supranational | — | 8,083,033 | — | 8,083,033 | |
| Other Investment Company1 | 811,947 | — | — | 811,947 | |
| Forward Foreign Currency Exchange Contracts2 | — | 346,396 | — | 346,396 | |
| Liabilities | | | | | |
| Forward Foreign Currency Exchange Contracts2 | — | (78,911) | — | (78,911) | |
| Total | $811,947 | $82,961,800 | $— | $83,773,747 | |
| 1 | As categorized in Portfolio Holdings. |
| 2 | Forward foreign currency exchange contracts are valued at unrealized appreciation or depreciation. |
The fund’s policy is to recognize transfers between Level 1, Level 2 and Level 3 as of the beginning of the fiscal year. There were no transfers between Level 1, Level 2 and Level 3 for the period ended March 31, 2018. Fund investments in underlying mutual funds are classified as Level 1, without consideration to the classification level of the investments held by the underlying mutual funds, which could be Level 1, Level 2 or Level 3.
Laudus Mondrian Funds | Annual Report
Laudus Mondrian International Government Fixed Income Fund
Statement of Assets and Liabilities
As of March 31, 2018
| Assets |
| Investments in unaffiliated issuers, at value (cost $77,987,173) | | $83,506,262 |
| Foreign currency, at value (cost $12,663) | | 12,663 |
| Receivables: | | |
| Interest | | 668,715 |
| Fund shares sold | | 211,877 |
| Dividends | | 1,327 |
| Unrealized appreciation on forward foreign currency exchange contracts | | 346,396 |
| Prepaid expenses | + | 10,842 |
| Total assets | | 84,758,082 |
| Liabilities |
| Payables: | | |
| Fund shares redeemed | | 222,465 |
| Investment adviser fees | | 41,670 |
| Unrealized depreciation on forward foreign currency exchange contracts | | 78,911 |
| Accrued expenses | + | 84,865 |
| Total liabilities | | 427,911 |
| Net Assets |
| Total assets | | 84,758,082 |
| Total liabilities | – | 427,911 |
| Net assets | | $84,330,171 |
| Net Assets by Source | | |
| Capital received from investors | | 80,340,720 |
| Net investment loss | | (1,971,079) |
| Net realized capital gains | | 161,372 |
| Net unrealized capital appreciation | | 5,799,158 |
| Net Asset Value (NAV) |
| Net Assets | ÷ | Shares
Outstanding | = | NAV |
| $84,330,171 | | 8,075,260 | | $10.44 |
| | | | | |
Laudus Mondrian Funds | Annual Report
Laudus Mondrian International Government Fixed Income Fund
Statement of Operations
For the period April 1, 2017 through March 31, 2018
| Investment Income |
| Dividends | | $9,475 |
| Interest | + | 1,397,745 |
| Total investment income | | 1,407,220 |
| Expenses |
| Investment adviser fees | | 535,584 |
| Professional fees | | 57,621 |
| Custodian fees | | 30,184 |
| Transfer agent fees | | 25,843 |
| Accounting and administration fees | | 21,607 |
| Registration fees | | 20,364 |
| Shareholder reports | | 16,822 |
| Independent trustees’ fees | | 14,277 |
| Interest expense | | 773 |
| Custody out-of-pocket fee reimbursement | | (13,445)* |
| Other expenses | + | 9,467 |
| Total expenses | | 719,097 |
| Expense reduction by adviser | – | 62,289 |
| Net expenses | – | 656,808 |
| Net investment income | | 750,412 |
| Realized and Unrealized Gains (Losses) |
| Net realized losses on investments | | (58,376) |
| Net realized losses on foreign currency transactions | | (271,905) |
| Net realized gains on forward foreign currency exchange contracts | + | 1,172,660 |
| Net realized gains | | 842,379 |
| Net change in unrealized appreciation (depreciation) on investments | | 8,433,162 |
| Net change in unrealized appreciation (depreciation) on foreign currency translations | | 4,017 |
| Net change in unrealized appreciation (depreciation) on forward foreign currency exchange contracts | + | 135,250 |
| Net change in unrealized appreciation (depreciation) | + | 8,572,429 |
| Net realized and unrealized gains | | 9,414,808 |
| Increase in net assets resulting from operations | | $10,165,220 |
| * | See financial note 12 for additional information. |
Laudus Mondrian Funds | Annual Report
Laudus Mondrian International Government Fixed Income Fund
Statement of Changes in Net Assets
For the current and prior report periods
| Operations | |
| | 4/1/17-3/31/18 | 4/1/16-3/31/17 |
| Net investment income | | $750,412 | $1,129,081 |
| Net realized gains (losses) | | 842,379 | (4,813,012) |
| Net change in unrealized appreciation (depreciation) | + | 8,572,429 | (3,925,465) |
| Increase (decrease) in net assets from operations | | 10,165,220 | (7,609,396) |
| Distributions to Shareholders | |
| Distributions from net investment income | | (12,784) | (14,676) |
| Distributions from net realized gains | + | — | (761,942) |
| Total distributions | | ($12,784) | ($776,618) |
| Transactions in Fund Shares | | | |
| | | 4/1/17-3/31/18 | 4/1/16-3/31/17 |
| | | SHARES | VALUE | SHARES | VALUE |
| Shares sold | | 665,839 | $6,608,676 | 8,151,717 | $81,286,242 |
| Shares reinvested | | 938 | 9,308 | 56,636 | 506,323 |
| Shares redeemed | + | (2,840,010) | (28,005,673) | (10,038,045) | (97,779,218) |
| Net transactions in fund shares | | (2,173,233) | ($21,387,689) | (1,829,692) | ($15,986,653) |
| Shares Outstanding and Net Assets | | | |
| | | 4/1/17-3/31/18 | 4/1/16-3/31/17 |
| | | SHARES | NET ASSETS | SHARES | NET ASSETS |
| Beginning of period | | 10,248,493 | $95,565,424 | 12,078,185 | $119,938,091 |
| Total decrease | + | (2,173,233) | (11,235,253) | (1,829,692) | (24,372,667) |
| End of period | | 8,075,260 | $84,330,171 | 10,248,493 | $95,565,424 |
| Net investment loss | | | ($1,971,079) | | ($4,835,789) |
Laudus Mondrian Funds | Annual Report
1. Business Structure of the Funds:
Each of the funds in this report is a series of Laudus Trust (the trust), a no-load, open-end management investment company. The trust is organized as a Massachusetts business trust and is registered under the Investment Company Act of 1940, as amended (the 1940 Act). The list below shows all the funds in the trust as of the end of the period, including the funds discussed in this report, which are highlighted:
| LAUDUS TRUST (ORGANIZED APRIL 1, 1988) |
| Laudus Mondrian International Equity Fund | |
| Laudus Mondrian Emerging Markets Fund | |
| Laudus Mondrian International Government Fixed Income Fund | |
| Laudus U.S. Large Cap Growth Fund | |
Prior to July 25, 2017, Laudus Mondrian International Equity Fund and Laudus Mondrian Emerging Markets Fund each offered three share classes: Investor Shares, Select Shares and Institutional Shares.
Effective July 25, 2017, all outstanding Investor Shares and Select Shares of Laudus Mondrian International Equity Fund and Laudus Mondrian Emerging Markets Fund were consolidated into the Institutional Shares of each respective fund and each fund in this report no longer offers separate share classes.
Shares are bought and sold at closing net asset value per share (NAV), which is the price for all outstanding shares of a fund.
Each fund maintains its own account for purposes of holding assets and accounting, and is considered a separate entity for tax purposes. Within its account, each fund may also keep certain assets in segregated accounts, as required by securities law.
2. Significant Accounting Policies:
The following is a summary of the significant accounting policies the funds use in their preparation of financial statements. The funds follow the investment company accounting and reporting guidance of the Financial Accounting Standards Board (FASB) Accounting Standard Codification Topic 946 Financial Services — Investment Companies. The accounting policies are in conformity with accounting principles generally accepted in the United States of America (GAAP).
The funds invest in certain other investment companies (underlying funds). For more information about the underlying funds’ operations and policies, please refer to those funds’ semiannual and annual reports, which are filed with the U.S. Securities and Exchange Commission (SEC).
Effective August 1, 2017, the funds adopted disclosure requirement changes for SEC Regulation S-X. The adopted changes are reflected throughout this report.
(a) Security Valuation:
Under procedures approved by the funds’ Board of Trustees (the Board), the investment adviser has formed a Pricing Committee to administer the pricing and valuation of portfolio securities and other assets and to ensure that prices used for internal purposes or provided by third parties reasonably reflect fair market value. Among other things, these procedures allow the funds to utilize independent pricing services, quotations from securities and financial instrument dealers and other market sources to determine fair value.
The funds value the securities in their portfolios every business day. The funds use the following policies to value various types of securities:
• Securities traded on an exchange or over-the-counter: Traded securities are valued at the closing value for the day, or, on days when no closing value has been reported, at the mean of the most recent bid and ask quotes. Securities that are primarily traded on foreign exchanges are valued at the official closing price or the last sales price on the exchange where the securities are principally traded with these values then translated into U.S. dollars at the current exchange rate, unless these securities are fair valued as discussed below.
• Securities for which no quoted value is available: The Board has adopted procedures to fair value each fund’s securities when market prices are not “readily available” or are unreliable. For example, a fund may fair value a security when it is de-listed or its trading is halted or suspended; when a security’s primary pricing source is unable or unwilling to provide a price; or when a security’s primary trading market is closed during regular market hours. Each fund makes fair value determinations in good faith in accordance with the fund’s valuation procedures. The Pricing Committee considers a number of factors, including unobservable market inputs when arriving at fair value. The Pricing Committee may employ techniques
Laudus Mondrian Funds | Annual Report
Financial Notes (continued)
2. Significant Accounting Policies (continued):
such as the review of related or comparable assets or liabilities, related market activities, recent transactions, market multiples, book values, transactional back-testing, disposition analysis and other relevant information. The Pricing Committee regularly reviews these inputs and assumptions to calibrate the valuations. Due to the subjective and variable nature of fair value pricing, there can be no assurance that a fund could obtain the fair value assigned to the security upon the sale of such security. The Board convenes on a regular basis to review fair value determinations made by the funds pursuant to the valuation procedures.
• Bonds and notes: Fixed income investments are generally valued using an evaluated price at the mid-point of the bid/ask spread provided by an approved, independent pricing service (mid-price). To determine the evaluated mid-price, a pricing service may use a variety of techniques and inputs. Techniques may include, but are not limited to, spread models that calculate an investment-specific price relative to a benchmark or yield curve models that establish a price based on yields of comparable bonds along a range of maturities. Inputs differ by valuation approach and technique, as appropriate, and examples of inputs may include, but are not limited to, interest rates, market conditions, comparable bonds, market trades, projected cash flows, credit reviews and issuer news.
• Foreign equity security fair valuation: The Board has adopted procedures to fair value foreign equity securities that are traded in markets that close prior to the funds valuing their holdings. By fair valuing securities whose prices may have been affected by events occurring after the close of trading, each fund seeks to establish prices that investors might expect to realize upon the current sales of these securities. This methodology is designed to deter “arbitrage” market timers, who seek to exploit delays between the change in the value of a fund’s portfolio holdings and the NAV of the fund’s shares, and seeks to help ensure that the prices at which the fund’s shares are purchased and redeemed are fair and do not result in dilution of shareholder interest or other harm to shareholders. When fair value pricing is used at the open or close of a reporting period, it may cause a temporary divergence between the return of a fund and that of its comparative index or benchmark. The Board regularly reviews fair value determinations made by the funds pursuant to these procedures.
• Forward foreign currency exchange contracts (forwards): Forwards are valued based on that day’s forward exchange rates or by using an interpolated forward exchange rate for contracts with interim settlement dates.
• Underlying funds: Mutual funds are valued at their respective NAVs.
In accordance with the authoritative guidance on fair value measurements and disclosures under GAAP, the funds disclose the fair value of their investments in a hierarchy that prioritizes the significant inputs to valuation techniques used to measure the fair value. The hierarchy gives the highest priority to valuations based upon unadjusted quoted prices in active markets for identical assets or liabilities (Level 1 measurements) and the lowest priority to valuations based upon unobservable inputs that are significant to the valuation (Level 3 measurements). If inputs used to measure the financial instruments fall within different levels of the hierarchy, the categorization is based on the lowest level input that is significant to the valuation. If the funds determine that either the volume and/or level of activity for an asset or liability has significantly decreased (from normal conditions for that asset or liability) or price quotations or observable inputs are not associated with orderly transactions, increased analysis and management judgment will be required to estimate fair value.
The three levels of the fair value hierarchy are as follows:
• Level 1—quoted prices in active markets for identical securities—Investments whose values are based on quoted market prices in active markets, and whose values are therefore classified as Level 1 prices, include active listed equities. Investments in mutual funds are valued daily at their NAVs, which are classified as Level 1 prices, without consideration to the classification level of the specific investments held by an underlying fund.
• Level 2—other significant observable inputs (including quoted prices for similar securities, interest rates, prepayment speeds, credit risk, etc.)—Investments that trade in markets that are not considered to be active, but whose values are based on quoted market prices, dealer quotations or valuations provided by alternative pricing sources supported by observable inputs are classified as Level 2 prices. These generally include U.S. government and sovereign obligations, most government agency securities, investment-grade corporate bonds, certain mortgage products, less liquid listed equities, and state, municipal and provincial obligations. In addition, international securities whose markets close hours before the funds value their holdings may require fair valuations due to significant movement in the U.S. markets occurring after the daily close of the foreign markets. The Board has approved a vendor that calculates fair valuations of international equity securities based on a number of factors that appear to correlate to the movements in the U.S. markets.
Laudus Mondrian Funds | Annual Report
Financial Notes (continued)
2. Significant Accounting Policies (continued):
• Level 3—significant unobservable inputs (including the funds’ own assumptions in determining the fair value of investments)—Investments whose values are classified as Level 3 prices have significant unobservable inputs, as they may trade infrequently or not at all. When observable prices are not available for these securities, the funds use one or more valuation techniques for which sufficient and reliable data is available. The inputs used by the funds in estimating the value of Level 3 prices may include the original transaction price, quoted prices for similar securities or assets in active markets, completed or pending third-party transactions in the underlying investment or comparable issuers, and changes in financial ratios or cash flows. Level 3 prices may also be adjusted to reflect illiquidity and/or non-transferability, with the amount of such discount estimated by the funds in the absence of market information. Assumptions used by the funds due to the lack of observable inputs may significantly impact the resulting fair value and therefore the funds’ results of operations.
The inputs or methodology used for valuing securities are not necessarily an indication of the risk associated with investing in those securities.
The levels associated with valuing the funds’ investments as of March 31, 2018 are disclosed in the Portfolio Holdings.
(b) Accounting Policies for certain Portfolio Investments (if held):
Forward Foreign Currency Exchange Contracts: Forwards are contracts to buy and sell a currency at a set price on a future date. The value of the forwards is accounted for as unrealized appreciation or depreciation until the contracts settle, at which time the gains or losses are realized.
Passive Foreign Investment Companies: Certain funds may own shares in certain foreign corporations that meet the Internal Revenue Code definition of a passive foreign investment company (PFIC). The funds may elect for tax purposes to mark-to-market annually the shares of each PFIC lot held and would be required to distribute as ordinary income to shareholders any such marked-to-market gains (as well as any gains realized on sale).
(c) Security Transactions:
Security transactions are recorded as of the date the order to buy or sell the security is executed. Realized gains and losses from security transactions are based on the identified costs of the securities involved.
Assets and liabilities denominated in foreign currencies are reported in U.S. dollars. For assets and liabilities held on a given date, the dollar value is based on market exchange rates in effect on that date. Transactions involving foreign currencies, including purchases, sales, income receipts and expense payments, are calculated using exchange rates in effect on the transaction date. Realized foreign exchange gains or losses arise from sales of foreign currencies, currency gains or losses realized between the trade and settlement dates on securities transactions and the differences between the recorded amounts of dividends, interest, and foreign withholding taxes and the U.S. dollar equivalent of the amounts actually received or paid. Net unrealized foreign exchange appreciation or depreciation arises from changes in foreign exchange rates on foreign denominated assets and liabilities other than investments in securities held at the end of the reporting period. These realized and unrealized foreign exchange gains or losses are reported in foreign currency transactions or translations on the Statement of Operations. The funds do not isolate the portion of the fluctuations on investments resulting from changes in foreign currency exchange rates from the fluctuations in market prices of investments held. Such fluctuations are included with the net realized and unrealized gain or loss from investments.
Gains realized by the funds on the sale of securities in certain foreign countries may be subject to non-U.S. taxes. In those instances, the funds record a liability based on unrealized appreciation to provide for potential non-U.S. taxes payable upon the sale of these securities.
When a fund closes out a forwards position, it calculates the difference between the value of the position at the beginning and at the end of the contract, and records a realized gain or loss accordingly.
(d) Investment Income:
Interest income is recorded as it accrues. If a fund buys a debt security at a discount (less than face value) or a premium (more than face value), it amortizes premiums and accretes discounts from the purchase settlement date up to maturity. The fund then increases (in the case of discounts) or reduces (in the case of premiums) the income it records from the security. Certain securities may be callable (meaning that the issuer has the option to pay it off before its maturity date). The fund amortizes the premium and accretes the discount on each callable security to the security’s maturity date, except when the purchase price is higher than the call price at the security’s call date (in which case the premium is amortized to the call date). Dividends, in the form of cash or
Laudus Mondrian Funds | Annual Report
Financial Notes (continued)
2. Significant Accounting Policies (continued):
non-cash income such as in the form of additional securities, and distributions from portfolio securities and underlying funds are recorded on the date they are effective (the ex-dividend date), although the funds record certain foreign security dividends on the day they learn of the ex-dividend date. Any distributions from underlying funds are recorded in accordance with the character of the distributions as designated by the underlying funds.
Income received from foreign sources may result in withholding tax. Withholding taxes are accrued at the same time as the related income if the tax rate is fixed and known, unless a tax withheld is reclaimable from the local tax authorities in which case it is recorded as a receivable. If the tax rate is not known or estimable, such expense or reclaim receivable is recorded when the net proceeds are received.
In 2016, the Laudus International Equity Fund filed claims to recover taxes previously withheld in certain European Union countries on the basis that those countries had purportedly violated certain provisions in the Treaty on the Functioning of the European Union. These filings are subject to various administrative and judicial proceedings within these countries, and all professional fees associated with these filings have been paid by CSIM.
(e) Expenses:
Expenses that are specific to a fund are charged directly to the fund. Expenses that are common to all funds within the trust generally are allocated among the funds in proportion to their average daily net assets.
Prior to July 25, 2017, for the funds that offered multiple share classes, the net investment income, other than class specific expenses, and the realized and unrealized gains or losses, were allocated daily to each class in proportion to their average daily net assets.
(f) Distributions to Shareholders:
The funds make distributions from net realized gains, if any, once a year. The Laudus Mondrian International Equity Fund and Laudus Mondrian Emerging Markets Fund make distributions from net investment income, if any, once a year, while the Laudus Mondrian International Government Fixed Income Fund makes distributions from net investment income, if any, quarterly.
(g) Custody Credit:
The funds have an arrangement with their custodian bank, State Street Bank and Trust Company (State Street), under which the funds may receive a credit for their uninvested cash balance to offset their custody fees and accounting fees. The credit amounts, if any, are disclosed in the Statement of Operations as a reduction to the funds’ operating expenses.
(h) Accounting Estimates:
The accounting policies described in this report conform to GAAP. Notwithstanding this, shareholders should understand that in order to follow these principles, fund management has to make estimates and assumptions that affect the information reported in the financial statements. It’s possible that once the results are known, they may turn out to be different from these estimates and these differences may be material.
(i) Federal Income Taxes:
The funds intend to meet federal income and excise tax requirements for regulated investment companies under subchapter M of the Internal Revenue Code, as amended. Accordingly, the funds distribute substantially all of their net investment income and net realized capital gains, if any, to their respective shareholders each year. As long as a fund meets the tax requirements, it is not required to pay federal income tax.
(j) Foreign Taxes:
The funds may be subject to foreign taxes (a portion of which may be reclaimable) on income, corporate events, foreign currency exchanges and capital gains on investments. All foreign taxes are recorded in accordance with the applicable foreign tax regulations and rates that exist in foreign markets in which the funds invest. These foreign taxes, if any, are paid by the funds and are disclosed in the Statement of Operations. Foreign taxes payable as of March 31, 2018, if any, are reflected in each fund’s Statement of Assets and Liabilities.
(k) Indemnification:
Under the funds’ organizational documents, the officers and trustees are indemnified against certain liabilities arising out of the performance of their duties to the funds. In addition, in the normal course of business the funds enter into contracts with their
Laudus Mondrian Funds | Annual Report
Financial Notes (continued)
2. Significant Accounting Policies (continued):
vendors and others that provide general indemnifications. The funds’ maximum exposure under these arrangements is unknown as this would involve future claims that may be made against the funds. However, based on experience, the funds expect the risk of loss attributable to these arrangements to be remote.
(l) Recent Accounting Standards:
In March 2017, the Financial Accounting Standards Board issued Accounting Standards Update “Premium Amortization on Purchased Callable Debt Securities” which amends the amortization period for a callable debt security held at a premium from the maturity date to the earliest call date. The guidance is effective for annual periods beginning after December 15, 2018, and interim periods within those annual periods. At this time, management is evaluating the implications of these changes on the funds.
3. Risk Factors:
Investing in the funds may involve certain risks, as discussed in the funds’ prospectus, including, but not limited to, those described below. Any of these risks could cause an investor to lose money.
• Market Risk. Financial markets rise and fall in response to a variety of factors, sometimes rapidly and unpredictably. As with any investment whose performance is tied to these markets, the value of an investment in the fund will fluctuate, which means that an investor could lose money over short or long periods.
• Management Risk. As with all actively managed funds, a fund is subject to the risk that its sub-adviser will select investments or allocate assets in a manner that could cause the fund to underperform or otherwise not meet its objective. Poor stock or bond selection or a focus on securities in a particular sector or region may cause a fund to underperform its benchmark or other funds with a similar investment objective.
• Equity Risk. The prices of equity securities rise and fall daily. These price movements may result from factors affecting individual companies, industries or the securities market as a whole. In addition, equity markets tend to move in cycles, which may cause stock prices to fall over short or extended periods of time.
• Market Capitalization Risk. Securities issued by companies of different market capitalizations tend to go in and out of favor based on market and economic conditions. During a period when securities of a particular market capitalization fall behind other types of investments, a fund’s performance could be impacted.
• Large-Cap Company Risk. Large-cap companies are generally more mature and the securities issued by these companies may not be able to reach the same levels of growth as the securities issued by small- or mid-cap companies.
• Foreign Investment Risk. A fund’s investments in securities of foreign issuers involve certain risks that may be greater than those associated with investments in securities of U.S. issuers. These include risks of adverse changes in foreign economic, political, regulatory and other conditions; changes in currency exchange rates or exchange control regulations (including limitations on currency movements and exchanges); the imposition of economic sanctions or other government restrictions; differing accounting, auditing, financial reporting and legal standards and practices; differing securities market structures; and higher transaction costs. These risks may negatively impact the value or liquidity of a fund’s investments, and could impair a fund’s ability to meet its investment objective or invest in accordance with its investment strategy. There is a risk that investments in securities denominated in, and/or receiving revenues in, foreign currencies will decline in value relative to the U.S. dollar or, in the case of hedging positions, that the U.S. dollar will decline in value relative to the currency hedged, resulting in the dollar value of the fund’s investment being adversely affected. Foreign securities also include American Depositary receipts (ADRs), Global Depositary receipts (GDRs) and European Depositary receipts (EDRs) which may be less liquid than the underlying shares in their primary trading market and GDRs, many of which are issued by companies in emerging markets, may be more volatile. These risks may be heightened in connection with investments in emerging markets or securities of issuers that conduct their business in emerging markets.
• Emerging Markets Risk. Emerging market countries may be more likely to experience political turmoil or rapid changes in market or economic conditions than more developed countries. Emerging market countries often have less uniformity in accounting and reporting requirements and greater risk associated with the custody of securities. In addition, the financial stability of issuers (including governments) in emerging market countries may be more precarious than in developed countries. As a result, there may be an increased risk of illiquidity and price volatility associated with the fund’s investments in emerging market countries, which may be magnified by currency fluctuations relative to the U.S. dollar, and, at times, it may be difficult to value such investments.
Laudus Mondrian Funds | Annual Report
Financial Notes (continued)
3. Risk Factors (continued):
• Currency Risk. A fund’s investments in securities denominated in, and/or receiving revenues in, foreign currencies, will subject the fund to the risk that those currencies will decline in value relative to the U.S. dollar, or, in the case of hedging positions, that the U.S. dollar will decline in value relative to the currency hedged. In either event, the dollar value of an investment in the fund would be adversely affected. Forward contracts on foreign currencies are not traded on exchanges; rather, a bank or dealer will act as agent or as principal in order to make or take future delivery of a specified lot of a particular currency for the fund’s account. The fund is subject to the risk of a counterparty’s failure, inability or refusal to perform with respect to such contracts.
• Derivatives Risk. A fund’s use of derivative instruments involves risks different from, or possibly greater than, the risks associated with investing directly in securities and other traditional investments. A fund’s use of derivatives could reduce the fund’s performance, increase the fund’s volatility, and could cause the fund to lose more than the initial amount invested. In addition, investments in derivatives may involve leverage, which means a small percentage of assets invested in derivatives can have a disproportionately large impact on a fund.
• Fixed Income Risk. Interest rates rise and fall over time, which will affect a fund’s yield and share price. A change in a central bank’s monetary policy or improving economic conditions may result in an increase in interest rates. A sharp rise in interest rates could cause the fund to lose value. The credit quality of a portfolio investment could also cause the fund’s share price to fall. A fund could lose money if the issuer or guarantor of a portfolio investment or the counterparty to a derivatives contract fails to make timely principal or interest payments or otherwise honor its obligations. Fixed income securities may be paid off earlier or later than expected. Either situation could cause the fund to hold securities paying lower than market rates of interest, which could hurt the fund’s yield or share price. Below investment-grade bonds (junk bonds) involve greater risks than investment-grade securities.
• Leverage Risk. Certain fund transactions, such as derivatives, may give rise to a form of leverage and may expose a fund to greater risk. Leverage tends to magnify the effect of any increase or decrease in the value of a fund’s portfolio securities, which means even a small amount of leverage can have a disproportionately large impact on the fund.
• Liquidity Risk. The fund may be unable to sell certain securities, such as illiquid securities, readily at a favorable time or price, or the fund may have to sell them at a loss.
Please refer to the funds’ prospectus for a more complete description of the principal risks of investing in the funds.
4. Affiliates and Affiliated Transactions:
Investment Adviser
Charles Schwab Investment Management, Inc. (CSIM or the investment adviser), a wholly owned subsidiary of The Charles Schwab Corporation, serves as each fund’s investment adviser pursuant to an Investment Advisory Agreement (Advisory Agreement) between CSIM and the trust. Mondrian Investment Partners Limited (Mondrian), the funds’ sub-adviser, provides day-to-day portfolio management services to the funds, subject to the supervision of CSIM.
For its advisory services to the following funds, CSIM is entitled to receive an annual fee, payable monthly, based on a percentage of each fund’s average daily net assets described as follows:
| Laudus Mondrian International Equity Fund | 0.75% |
| Laudus Mondrian Emerging Markets Fund | 1.00% |
| Laudus Mondrian International Government Fixed Income Fund | 0.60% |
CSIM (not the funds) pays a portion of the advisory fees it receives to Mondrian in return for its services.
Expense Limitation
CSIM has contractually agreed, until at least July 30, 2019, to limit the total annual fund operating expenses charged, excluding interest, taxes and certain non-routine expenses as follows:
| Laudus Mondrian International Equity Fund | 0.90% |
| Laudus Mondrian Emerging Markets Fund | 1.20% |
| Laudus Mondrian International Government Fixed Income Fund | 0.75% |
Laudus Mondrian Funds | Annual Report
Financial Notes (continued)
4. Affiliates and Affiliated Transactions (continued):
Prior to July 25, 2017, the expense limitations for funds that offered multiple share classes were:
| | Laudus Mondrian
International
Equity Fund | Laudus Mondrian
Emerging
Markets Fund |
| Investor Shares | 1.30% | 1.60% |
| Select Shares | 1.05% | 1.35% |
| Institutional Shares | 0.90% | 1.20% |
Any amounts waived or reimbursed in a particular fiscal year will be subject to repayment through the next two fiscal years, to the extent that the repayment will not cause the funds’ net expenses to exceed the limit (as stated in CSIM’s contractual undertaking) during the respective year. For the period ended March 31, 2018, the funds did not make any repayments of prior years’ waived amounts.
As of March 31, 2018, the balance of recoupable waivers and the respective years of expiration are as follows:
| Expiration Date | Laudus Mondrian
International
Equity Fund | | Laudus Mondrian
Emerging
Markets Fund | | Laudus Mondrian
International
Government Fixed
Income Fund |
| March 31, 2019 | $70,113 | | $72,219 | | $52,325 |
| March 31, 2020 | 98,250 | | 48,471 | | 62,289 |
| Total | $168,363 | | $120,690 | | $114,614 |
As of March 31, 2018, the Laudus Mondrian International Equity Fund, Laudus Mondrian Emerging Markets Fund and Laudus Mondrian International Government Fixed Income Fund had recoupable waivers expire in the amount of $146,935, $52,987, and $78,310, respectively.
Investments from Affiliates
Certain Schwab funds may own shares of other Schwab funds. The table below reflects the percentages of shares of each fund in this report that are owned by other Schwab funds as of March 31, 2018, as applicable:
| | Underlying Funds |
| | Laudus Mondrian
Mondrian
Emerging
Markets Fund | Laudus Mondrian
International
Government Fixed
Income Fund |
| Schwab Target 2010 Fund | —% | 0.6% |
| Schwab Target 2015 Fund | —% | 1.0% |
| Schwab Target 2020 Fund | 0.3% | 8.9% |
| Schwab Target 2025 Fund | 1.1% | 7.8% |
| Schwab Target 2030 Fund | 3.8% | 13.4% |
| Schwab Target 2035 Fund | 2.5% | 5.1% |
| Schwab Target 2040 Fund | 7.5% | 6.7% |
| Schwab Target 2045 Fund | 1.2% | 0.6% |
| Schwab Target 2050 Fund | 1.1% | 0.5% |
| Schwab Target 2055 Fund | 0.7% | 0.2% |
| Schwab Target 2060 Fund | 0.1% | 0.0%* |
Laudus Mondrian Funds | Annual Report
Financial Notes (continued)
4. Affiliates and Affiliated Transactions (continued):
Other Affiliated Transactions
The professional fees related to foreign withholding tax claims discussed in financial note 2 were non-routine expenses. However, the investment adviser agreed to pay these professional fees for this reporting period, subject to reimbursement by the Laudus International Equity Fund to the extent the fund is able to successfully recover taxes withheld in the future. As of March 31, 2018, the balance of professional fees related to foreign withholding tax subject to future reimbursement by the fund to the investment adviser was $8,945 for Laudus Mondrian International Equity Fund.
No other amounts for additional tax reclaims are reflected in the financial statements due to the uncertainty surrounding the ultimate resolution of proceedings, the likelihood of receipt of these claims, and the potential timing of payment.
5. Distribution and Shareholder Services:
Effective July 25, 2017, none of the funds in this report are subject to a distribution and shareholder service fee.
Prior to July 25, 2017, the trust had a Distribution and Shareholder Service Plan with respect to its Investor Shares pursuant to Rule 12b-1 under the 1940 Act. The Investor Shares of the funds were sold on a continuous basis by the trust’s distributor, ALPS Distributors, Inc. Under the Distribution and Shareholder Services Plan, the funds paid distribution and shareholder servicing fees in connection with the sale and servicing of the Investor Shares. The annual Distribution and Shareholder Service Fee consisted of up to 0.25% of the respective average daily net assets of the Investor Shares. In addition, the trustees had authorized the Laudus Mondrian International Equity Fund and Laudus Mondrian Emerging Markets Fund to reimburse, out of the Investor and Select Shares assets of the funds, financial intermediaries that provide sub-accounting and sub-transfer agency services in connection with Investor or Select Shares an amount of up to 0.15% of the average daily net assets of that class on an annual basis.
6. Board of Trustees:
The trust’s Board of Trustees oversees the general conduct of the trust and the funds.
The Board may include people who are officers and/or directors of CSIM or its affiliates. Federal securities law limits the percentage of such “interested persons” who may serve on a trust’s board, and the trust was in compliance with these limitations throughout the report period. The trust did not pay any of these interested persons for their services as trustees, but it did pay non-interested persons (independent trustees), as noted in each fund’s Statement of Operations. For information regarding the trustees, please refer to Trustees and Officers table at the end of this report.
7. Borrowing from Banks:
During the period, the funds were participants with other U.S. registered investment companies managed by CSIM in a joint, syndicated, committed $555 million line of credit (the Syndicated Credit Facility), which matured on October 5, 2017. On October 5, 2017, the Syndicated Credit Facility was amended with an increased line of $605 million to run for a new 364 day period, maturing on October 4, 2018. Under the terms of the Syndicated Credit Facility, in addition to the interest charged on any borrowings by a fund, each fund paid a commitment fee of 0.15% per annum on its proportionate share of the unused portion of the Syndicated Credit Facility.
Effective December 1, 2017, the funds are participants with other U.S. registered investment companies managed by CSIM in a joint, unsecured, uncommitted $500 million line of credit (the Uncommitted Credit Facility), with State Street Bank and Trust Company, which matures on November 30, 2018. Under the terms of the Uncommitted Credit Facility, each fund pays interest on the amount it borrows. There were no borrowings from either line of credit during the period.
The funds also have access to custodian overdraft facilities. A fund may have utilized the overdraft facility and incurred an interest expense, which is disclosed on the fund’s Statement of Operations, if any. The interest expense is determined based on a negotiated rate above the current Federal Funds Rate.
Laudus Mondrian Funds | Annual Report
Financial Notes (continued)
8. Purchases and Sales/Maturities of Investment Securities:
For the period ended March 31, 2018, purchases and sales/maturities of securities (excluding short-term obligations) were as follows:
| | Purchases
of Securities | Sales/Maturities
of Securities |
| Laudus Mondrian International Equity Fund | $28,889,689 | $25,750,824 |
| Laudus Mondrian Emerging Markets Fund | 124,183,695 | 187,007,766 |
| Laudus Mondrian International Government Fixed Income Fund | 45,864,408 | 69,343,201 |
9. Derivatives:
The funds invested in forwards during the report period to hedge part of the funds’ exposure to certain currencies. Refer to financial note 2(b) for the funds’ accounting policies with respect to forwards and financial note 3 for disclosures concerning the risks of investing in forwards. During the period ended March 31, 2018, the month-end average forward foreign currency notional amount and the month-end average unrealized appreciation (depreciation) were as follows:
| | Forward Foreign Currency
Exchange Contract
Notional Amount | Net Unrealized
Appreciation (Depreciation) |
| Laudus Mondrian International Equity Fund | $— | $— |
| Laudus Mondrian Emerging Markets Fund | 92,117 | 47 |
| Laudus Mondrian International Government Fixed Income Fund | 28,287,335 | 147,194 |
The fair value of forwards held by the funds is presented as unrealized appreciation (depreciation) on forward foreign currency exchange contracts on the Statement of Assets and Liabilities as follows:
| | Laudus Mondrian
International
Equity Fund | Laudus Mondrian
Emerging
Markets Fund | Laudus Mondrian
International
Government Fixed
Income Fund |
| Asset Derivatives | Fair Value | | | |
| Forward Foreign Currency Exchange Contracts1 | $— | $— | $346,396 |
| Liability Derivatives | Fair Value | | | |
| Forward Foreign Currency Exchange Contracts2 | $— | $— | ($78,911) |
| 1 | Statement of Assets and Liabilities location: Unrealized appreciation on forward foreign currency exchange contracts. |
| 2 | Statement of Assets and Liabilities location: Unrealized depreciation on forward foreign currency exchange contracts. |
The effects of the forwards held by the funds in the Statement of Operations for the period ended March 31, 2018 were:
| | Forward Foreign Currency Exchange Contracts |
| | Laudus Mondrian
International
Equity Fund | Laudus Mondrian
Emerging
Markets Fund | Laudus Mondrian
International
Government Fixed
Income Fund | |
| Realized Gains (Losses) | $— | $43,735 | $1,172,660 | |
| Change in Unrealized Appreciation (Depreciation) | — | — | 135,250 | |
The funds’ forwards are entered into pursuant to International Swaps and Derivatives Association, Inc. (ISDA) agreements which govern certain terms of derivative transactions. ISDA agreements typically contain, among other things, master netting provisions in the event of a default or other termination event. Master netting provisions allow the funds and the counterparty, in the event of a default or other termination event, to offset payable and receivable amounts for each party related to derivative contracts to one net amount payable by either the funds or the counterparty. The funds’ forwards which are reported gross in the Statement of Assets and Liabilities, are presented in the tables below. The following tables present the funds’ forwards, net of amounts available for offset under a master netting agreement and net of any related collateral received by the funds for assets and pledged by the funds for liabilities as of March 31, 2018.
Laudus Mondrian Funds | Annual Report
Financial Notes (continued)
9. Derivatives (continued):
Laudus Mondrian International Government Fixed Income Fund
| | | | Gross Amounts Not Offset in the
Statement of Assets & Liabilities |
| Counterparty | Net Amounts of Assets
Presented in the
Statement of Assets and Liabilities | | Financial
Instruments | | Cash Collateral
Received | | Net
Amounts(a) |
| State Street Bank & Trust Co. | $346,396 | | ($78,911) | | $— | | $267,485 |
| Total | $346,396 | | ($78,911) | | $— | | $267,485 |
| Counterparty | Net Amounts of Liabilities
Presented in the
Statement of Assets and Liabilities | | Financial
Instruments | | Cash Collateral
Pledged | | Net
Amounts(b) |
| State Street Bank & Trust Co. | ($78,911) | | $78,911 | | $— | | $— |
| Total | ($78,911) | | $78,911 | | $— | | $— |
| a | Represents the net amount due from the counterparty in the event of default. |
| b | Represents the net amount due to the counterparty in the event of default. |
10. Redemption Fee:
Prior to February 28, 2017, the funds charged a 2.00% redemption fee on shares sold or exchanged within 30 days of the original purchase date. Such amounts are netted against redemption proceeds on the Statement of Changes in Net Assets. The redemption fees charged during the prior period were as follows:
| | Prior Period
(4/1/16-3/31/17) |
| Laudus Mondrian International Equity Fund | $5,510 |
| Laudus Mondrian Emerging Markets Fund | 262 |
| Laudus Mondrian International Government Fixed Income Fund | 6,652 |
11. Federal Income Taxes:
As of March 31, 2018, the tax basis cost of the funds’ investments and gross unrealized appreciation and depreciation were as follows:
| | Laudus Mondrian
International
Equity Fund | | Laudus Mondrian
Emerging
Markets Fund | | Laudus Mondrian
International
Government Fixed
Income Fund |
| Tax cost | $97,031,595 | | $285,784,816 | | $80,153,697 |
| Gross unrealized appreciation | $21,455,065 | | $46,809,063 | | $3,828,686 |
| Gross unrealized depreciation | (1,564,356) | | (19,302,404) | | (208,636) |
| Net unrealized appreciation (depreciation) | $19,890,709 | | $27,506,659 | | $3,620,050 |
Laudus Mondrian Funds | Annual Report
Financial Notes (continued)
11. Federal Income Taxes (continued):
As of March 31, 2018, the components of distributable earnings on a tax basis were as follows:
| | Laudus Mondrian
International
Equity Fund | | Laudus Mondrian
Emerging
Markets Fund | | Laudus Mondrian
International
Government Fixed
Income Fund |
| Undistributed ordinary income | $354,869 | | $2,884,344 | | $— |
| Undistributed long-term capital gains | 1,109,516 | | — | | 356,817 |
| Net unrealized appreciation (depreciation) on investments | 19,890,709 | | 27,506,659 | | 3,620,050 |
| Net other unrealized appreciation (depreciation) | 6,390 | | (346,713) | | 12,584 |
| Total | $21,361,484 | | $30,044,290 | | $3,989,451 |
The primary difference between book basis and tax basis unrealized appreciation or unrealized depreciation of investments is the tax deferral of losses on wash sales and the realization for tax purposes of unrealized gains on investments in PFICs. The tax cost of the funds’ investments, disclosed above, have been adjusted from their book amounts to reflect these unrealized appreciation or depreciation differences, as applicable.
Capital loss carryforwards may be used to offset future realized capital gains for federal income tax purposes. As of March 31, 2018, the funds had capital loss carryforwards available to offset future net capital gains as follows:
| Expiration Date | Laudus Mondrian
International
Equity Fund | Laudus Mondrian
Emerging
Markets Fund | Laudus Mondrian
International
Government Fixed
Income Fund |
| No expiration | $— | $102,945,378 | $— |
For tax purposes, net realized capital losses and late-year ordinary losses incurred after October 31 may be deferred and treated as occurring on the first day of the following fiscal year. For the year ended March 31, 2018, the funds had no capital or late-year ordinary losses deferred. The funds had capital loss carryforwards utilized as follows:
| | Laudus Mondrian
International
Equity Fund | Laudus Mondrian
Emerging
Markets Fund | Laudus Mondrian
International
Government Fixed
Income Fund |
| Capital loss carryforwards utilized | $2,240,408 | $2,582,862 | $— |
The tax basis components of distributions paid during the current and prior fiscal years were:
| | Laudus Mondrian
International
Equity Fund | Laudus Mondrian
Emerging
Markets Fund | Laudus Mondrian
International
Government Fixed
Income Fund |
| Current period distributions | | | |
| Ordinary income | $3,106,572 | $8,413,005 | $12,784 |
| Long-term capital gains | 1,109,869 | — | — |
| Prior period distributions | | | |
| Ordinary income | $3,978,315 | $9,543,878 | $14,676 |
| Long-term capital gains | — | — | 761,942 |
Distributions paid to shareholders are based on net investment income and net realized gains determined on a tax basis, which may differ from net investment income and net realized gains for financial reporting purposes. These differences reflect the differing character of certain income items and net realized gains and losses for financial statement and tax purposes, and may result in reclassification among certain capital accounts on the financial statements.
Laudus Mondrian Funds | Annual Report
Financial Notes (continued)
11. Federal Income Taxes (continued):
Permanent book and tax basis differences may result in reclassifications between components of net assets as required. The adjustments will have no impact on net assets or the results of operations. As of March 31, 2018, the funds made the following reclassifications:
| | Laudus Mondrian
International
Equity Fund | Laudus Mondrian
Emerging
Markets Fund | Laudus Mondrian
International
Government Fixed
Income Fund |
| Capital shares | $— | $— | ($1,851,009) |
| Undistributed net investment income | (1,600) | 1,928,253 | 2,127,082 |
| Net realized capital gains (losses) | 1,600 | (1,928,253) | (276,073) |
As of March 31, 2018, management has reviewed the tax positions for open periods (for federal purposes, three years from the date of filing and for state purposes, four years from the date of filing) as applicable to the funds, and has determined that no provision for income tax is required in the funds’ financial statements. The funds recognize interest and penalties, if any, related to unrecognized tax benefits as income tax expense in the Statement of Operations. During the period ended March 31, 2018, the funds did not incur any interest or penalties.
12. Custody Out-of-Pocket Fee Reimbursement:
In December 2015, State Street, the funds’ custodian, identified inconsistencies in the way in which clients were invoiced for categories of expenses, particularly those deemed out-of-pocket costs, during an 18-year period going back to 1998. The issue was the result of inaccurate billing rates that were not subsequently reviewed or adjusted. The amount of the difference in what was charged and what should have been charged, plus interest, was paid to the funds during the period ended March 31, 2018 as a reimbursement. The amounts applied to each fund were recognized as a change in accounting estimate. This resulted in a decrease in Net expenses and an overall increase in Net assets. This payment is presented in the fund’s Statement of Operations as Custody out-of-pocket fee reimbursement.
13. Subsequent Events:
Management has determined there are no subsequent events or transactions through the date the financial statements were issued that would have materially impacted the financial statements as presented.
Laudus Mondrian Funds | Annual Report
Report of Independent Registered Public Accounting Firm
To the Board of Trustees of Laudus Trust and Shareholders of Laudus Mondrian International Equity Fund, Laudus Mondrian Emerging Markets Fund and Laudus Mondrian International Government Fixed Income Fund
Opinions on the Financial Statements
We have audited the accompanying statements of assets and liabilities, including the portfolio holdings, of Laudus Mondrian International Equity Fund, Laudus Mondrian Emerging Markets Fund and Laudus Mondrian International Government Fixed Income Fund (three of the funds constituting Laudus Trust, hereafter collectively referred to as the “Funds”) as of March 31, 2018, the related statements of operations for the year ended March 31, 2018, the statements of changes in net assets for each of the two years in the period ended March 31, 2018, including the related notes, and the financial highlights for each of the five years in the period ended March 31, 2018 (collectively referred to as the “financial statements”). In our opinion, the financial statements present fairly, in all material respects, the financial position of each of the Funds as of March 31, 2018, the results of each of their operations for the year then ended, the changes in each of their net assets for each of the two years in the period ended March 31, 2018 and the financial highlights for each of the five years in the period ended March 31, 2018 in conformity with accounting principles generally accepted in the United States of America.
Basis for Opinions
These financial statements are the responsibility of the Funds’ management. Our responsibility is to express an opinion on the Funds’ financial statements based on our audits. We are a public accounting firm registered with the Public Company Accounting Oversight Board (United States) (“PCAOB”) and are required to be independent with respect to the Funds in accordance with the U.S. federal securities laws and the applicable rules and regulations of the Securities and Exchange Commission and the PCAOB.
We conducted our audits of these financial statements in accordance with the standards of the PCAOB. Those standards require that we plan and perform the audit to obtain reasonable assurance about whether the financial statements are free of material misstatement, whether due to error or fraud.
Our audits included performing procedures to assess the risks of material misstatement of the financial statements, whether due to error or fraud, and performing procedures that respond to those risks. Such procedures included examining, on a test basis, evidence regarding the amounts and disclosures in the financial statements. Our audits also included evaluating the accounting principles used and significant estimates made by management, as well as evaluating the overall presentation of the financial statements. Our procedures included confirmation of securities owned as of March 31, 2018 by correspondence with the custodian and brokers; when replies were not received from brokers, we performed other auditing procedures. We believe that our audits provide a reasonable basis for our opinions.
PricewaterhouseCoopers LLP
San Francisco, California
May 17, 2018
We have served as the auditor of one or more investment companies in the Schwab Funds Complex since 1989.
Laudus Mondrian Funds | Annual Report
Other Federal Tax Information (unaudited)
The funds elect to pass through under section 853(a) of the Internal Revenue Code foreign tax credit to its shareholders for the year ended March 31, 2018, and the respective foreign source income on the funds as follows:
| | Foreign Tax Credit | Foreign Source Income |
| Laudus Mondrian International Equity Fund | $363,037 | $4,234,433 |
| Laudus Mondrian Emerging Markets Fund | 1,051,039 | 12,501,705 |
| Laudus Mondrian International Government Fixed Income Fund | — | — |
For the fiscal year ended March 31, 2018, the funds designate the following amounts of the dividend distributions as qualified dividends for the purpose of the maximum rate under section 1(h)(11) of the Internal Revenue Code. Shareholders will be notified in January 2019 via IRS Form 1099 of the amounts for use in preparing their 2018 income tax return.
| Laudus Mondrian International Equity Fund | $3,469,409 |
| Laudus Mondrian Emerging Markets Fund | 5,101,775 |
| Laudus Mondrian International Government Fixed Income Fund | — |
Under section 852(b)(3)(C) of the Internal Revenue Code, certain funds hereby designate the following amounts as long-term capital gain dividends for the fiscal year ended March 31, 2018:
| Laudus Mondrian International Equity Fund | $1,109,869 |
| Laudus Mondrian Emerging Markets Fund | — |
| Laudus Mondrian International Government Fixed Income Fund | — |
Laudus Mondrian Funds | Annual Report
Trustees and Officers
The tables below give information about the trustees and officers of Laudus Trust, which includes the funds covered in this report. The “Fund Complex” includes The Charles Schwab Family of Funds, Schwab Capital Trust, Schwab Investments, Schwab Annuity Portfolios, Schwab Strategic Trust and Laudus Trust. The Fund Complex includes 108 funds.
The address for all trustees and officers is 211 Main Street, San Francisco, CA 94105. You can find more information about the trustees and officers in the funds’ Statement of Additional Information, which is available free by calling 1-877-824-5615.
| Independent Trustees |
Name, Year of Birth, and
Position(s) with the trust
(Terms of office, and
length of Time Served1) | Principal Occupations
During the Past Five Years | Number of
Portfolios in
Fund Complex
Overseen by
the Trustee | Other Directorships |
Robert W. Burns
1959
Trustee
(Trustee of Schwab Strategic Trust since 2009; The Charles Schwab Family of Funds, Schwab Investments, Schwab Capital Trust, Schwab Annuity Portfolios and Laudus Trust since 2016) | Retired/Private Investor (Jan. 2009 – present). Formerly, Managing Director, Pacific Investment Management Company, LLC (PIMCO) (investment management firm) and President, PIMCO Funds. | 108 | Director, PS Business Parks, Inc. (2005 – 2012) |
John F. Cogan
1947
Trustee
(Trustee of The Charles Schwab Family of Funds, Schwab Investments, Schwab Capital Trust and Schwab Annuity Portfolios since 2008; Laudus Trust since 2010; Schwab Strategic Trust since 2016) | Senior Fellow, The Hoover Institution at Stanford University (public policy think tank) (Oct. 1979 – present); Senior Fellow, Stanford Institute for Economic Policy Research (2000 – present); Professor of Public Policy, Stanford University (1994 – 2015). | 108 | Director, Gilead Sciences, Inc. (2005 – present) |
Stephen Timothy Kochis
1946
Trustee
(Trustee of Schwab Strategic Trust since 2012; The Charles Schwab Family of Funds, Schwab Investments, Schwab Capital Trust, Schwab Annuity Portfolios and Laudus Trust since 2016) | CEO and Owner, Kochis Global (wealth management consulting) (May 2012 – present); Chairman and CEO, Aspiriant, LLC (wealth management) (Jan. 2008 – Apr. 2012). | 108 | None |
David L. Mahoney
1954
Trustee
(Trustee of The Charles Schwab Family of Funds, Schwab Investments, Schwab Capital Trust, Schwab Annuity Portfolios and Laudus Trust since 2011; Schwab Strategic Trust since 2016) | Private Investor. | 108 | Director, Symantec Corporation (2003 – present)
Director, Corcept Therapeutics Incorporated (2004 – present)
Director, Adamas Pharmaceuticals, Inc. (2009 – present) |
Laudus Mondrian Funds | Annual Report
| Independent Trustees (continued) |
Name, Year of Birth, and
Position(s) with the trust
(Terms of office, and
length of Time Served1) | Principal Occupations
During the Past Five Years | Number of
Portfolios in
Fund Complex
Overseen by
the Trustee | Other Directorships |
Kiran M. Patel
1948
Trustee
(Trustee of The Charles Schwab Family of Funds, Schwab Investments, Schwab Capital Trust, Schwab Annuity Portfolios and Laudus Trust since 2011; Schwab Strategic Trust since 2016) | Retired. Executive Vice President and General Manager of Small Business Group, Intuit, Inc. (financial software and services firm for consumers and small businesses) (Dec. 2008 – Sept. 2013). | 108 | Director, KLA-Tencor Corporation (2008 – present) |
Kimberly S. Patmore
1956
Trustee
(Trustee of The Charles Schwab Family of Funds, Schwab Investments, Schwab Capital Trust, Schwab Annuity Portfolios, Schwab Strategic Trust and Laudus Trust since 2016) | Consultant, Patmore Management Consulting (management consulting) (2008 – present). | 108 | None |
Charles A. Ruffel
1956
Trustee
(Trustee of Schwab Strategic Trust since 2009; The Charles Schwab Family of Funds, Schwab Investments, Schwab Capital Trust, Schwab Annuity Portfolios and Laudus Trust since 2015) | Co-Chief Executive Officer, Kudu Investment Management, LLC (financial services) (Jan. 2015 – present); Partner, Kudu Advisors, LLC (financial services) (June 2008 – Jan. 2015); Advisor, Asset International, Inc. (publisher of financial services information) (Aug. 2008 – Jan. 2015). | 108 | None |
Gerald B. Smith
1950
Trustee
(Trustee of The Charles Schwab Family of Funds, Schwab Investments, Schwab Capital Trust and Schwab Annuity Portfolios since 2000; Laudus Trust since 2010; Schwab Strategic Trust since 2016) | Chairman, Chief Executive Officer and Founder of Smith Graham & Co. (investment advisors) (Mar. 1990 – present). | 108 | Director, Eaton (2012 – present)
Director and Chairman of the Audit Committee, Oneok Partners LP (2003 – 2013)
Director, Oneok, Inc. (2009 – 2013)
Lead Independent Director, Board of Cooper Industries (2002 – 2012) |
Joseph H. Wender
1944
Trustee
(Trustee of The Charles Schwab Family of Funds, Schwab Investments, Schwab Capital Trust and Schwab Annuity Portfolios since 2008; Laudus Trust since 2010; Schwab Strategic Trust since 2016) | Senior Consultant, Goldman Sachs & Co., Inc. (investment banking and securities firm) (Jan. 2008 – present); Co-CEO, Colgin Cellars, LLC (vineyards) (Feb. 1998 – present). | 108 | Board Member and Chairman of the Audit Committee, Ionis Pharmaceuticals (1994 – present)
Lead Independent Director and Chair of Audit Committee, OUTFRONT Media Inc. (2014 – present) |
Laudus Mondrian Funds | Annual Report
| Interested Trustees |
Name, Year of Birth, and
Position(s) with the trust
(Terms of office, and
length of Time Served1) | Principal Occupations
During the Past Five Years | Number of
Portfolios in
Fund Complex
Overseen by
the Trustee | Other Directorships |
Walter W. Bettinger II2
1960
Chairman and Trustee
(Trustee of The Charles Schwab Family of Funds, Schwab Investments, Schwab Capital Trust and Schwab Annuity Portfolios since 2008; Schwab Strategic Trust since 2009; Laudus Trust since 2010) | Director, President and Chief Executive Officer, The Charles Schwab Corporation (Oct. 2008 – present); President and Chief Executive Officer (Oct. 2008 – present), Director (May 2008 – present), Charles Schwab & Co., Inc.; Director, Charles Schwab Bank (Apr. 2006 – present); Director (May 2008 – present), President and Chief Executive Officer (Aug. 2017 – present), Schwab Holdings, Inc.; and Director, Charles Schwab Investment Management, Inc. (July 2016 – present). | 108 | Director, The Charles Schwab Corporation (2008 – present) |
Marie A. Chandoha2
1961
Trustee
(Trustee of The Charles Schwab Family of Funds, Schwab Investments, Schwab Capital Trust, Schwab Annuity Portfolios, Schwab Strategic Trust and Laudus Trust since 2016) | Director, President and Chief Executive Officer (Dec. 2010 – present), Chief Investment Officer (Sept. 2010 – Oct. 2011), Charles Schwab Investment Management, Inc.; Trustee (Jan. 2016 – present), President, Chief Executive Officer (Dec. 2010 – present), and Chief Investment Officer (Sept. 2010 – Oct. 2011), Schwab Funds, Laudus Funds and Schwab ETFs; Director, Charles Schwab Worldwide Funds plc and Charles Schwab Asset Management (Ireland) Limited (Jan. 2011 – present); Global Head of Fixed Income Business Division, BlackRock, Inc. (formerly Barclays Global Investors) (investment management firm) (Mar. 2007 – Aug. 2010). | 108 | None |
Joseph R. Martinetto2
1962
Trustee
(Trustee of The Charles Schwab Family of Funds, Schwab Investments, Schwab Capital Trust, Schwab Annuity Portfolios, Schwab Strategic Trust and Laudus Trust since 2016) | Chief Operating Officer (Feb. 2018 – present), Senior Executive Vice President (July 2015 – Feb. 2018), The Charles Schwab Corporation; Senior Executive Vice President, Charles Schwab & Co., Inc. (July 2015 – present); Chief Financial Officer (July 2015 – Aug. 2017), Executive Vice President and Chief Financial Officer (May 2007 – July 2015), The Charles Schwab Corporation and Charles Schwab & Co., Inc.; Director, Charles Schwab & Co., Inc. (May 2007 – present); Director (Apr. 2010 – present) and Chief Executive Officer (July 2013 – Apr. 2015), Charles Schwab Bank; Director (May 2007 – present), Chief Financial Officer (May 2007 – Aug. 2017), Senior Executive Vice President (Feb. 2016 – present), and Executive Vice President (May 2007 – Feb. 2016), Schwab Holdings, Inc. | 108 | None |
| Officers of the Trust |
Name, Year of Birth, and Position(s) with the trust
(Terms of office, and length of Time Served3) | Principal Occupations During the Past Five Years |
Marie A. Chandoha
1961
President and Chief Executive Officer
(Officer of The Charles Schwab Family of Funds, Schwab Investments, Schwab Capital Trust, Schwab Annuity Portfolios, Schwab Strategic Trust and Laudus Trust since 2010) | Director, President and Chief Executive Officer (Dec. 2010 – present), Chief Investment Officer (Sept. 2010 – Oct. 2011), Charles Schwab Investment Management, Inc.; Trustee (Jan. 2016 – present), President, Chief Executive Officer (Dec. 2010 – present), and Chief Investment Officer (Sept. 2010 – Oct. 2011), Schwab Funds, Laudus Funds and Schwab ETFs; Director, Charles Schwab Worldwide Funds plc and Charles Schwab Asset Management (Ireland) Limited (Jan. 2011 – present); Global Head of Fixed Income Business Division, BlackRock, Inc. (formerly Barclays Global Investors) (investment management firm) (Mar. 2007 – Aug. 2010). |
Laudus Mondrian Funds | Annual Report
| Officers of the Trust (continued) |
Name, Year of Birth, and Position(s) with the trust
(Terms of office, and length of Time Served3) | Principal Occupations During the Past Five Years |
Mark Fischer
1970
Treasurer and Chief Financial Officer
(Officer of The Charles Schwab Family of Funds, Schwab Investments, Schwab Capital Trust, Schwab Annuity Portfolios, Schwab Strategic Trust and Laudus Trust since 2013) | Treasurer and Chief Financial Officer, Schwab Funds, Laudus Funds and Schwab ETFs (Jan. 2016 – present); Assistant Treasurer, Schwab Funds and Laudus Funds (Dec. 2013 – Dec. 2015), Schwab ETFs (Nov. 2013 – Dec. 2015); Vice President, Charles Schwab Investment Management, Inc. (Oct. 2013 – present); Executive Director, J.P. Morgan Investor Services (Apr. 2011 – Sept. 2013); Assistant Treasurer, Massachusetts Financial Service Investment Management (May 2005 – Mar. 2011). |
George Pereira
1964
Senior Vice President and Chief Operating Officer
(Officer of The Charles Schwab Family of Funds, Schwab Investments, Schwab Capital Trust and Schwab Annuity Portfolios since 2004; Laudus Trust since 2006; Schwab Strategic Trust since 2009) | Senior Vice President and Chief Financial Officer (Nov. 2004 – present), Chief Operating Officer (Jan. 2011 – present), Charles Schwab Investment Management, Inc.; Senior Vice President and Chief Operating Officer (Jan. 2016 – present), Treasurer and Chief Financial Officer, Laudus Funds (June 2006 – Dec. 2015); Treasurer and Principal Financial Officer, Schwab Funds (Nov. 2004 – Dec. 2015) and Schwab ETFs (Oct. 2009 – Dec. 2015); Director, Charles Schwab Worldwide Funds plc and Charles Schwab Asset Management (Ireland) Limited (Apr. 2005 – present). |
Omar Aguilar
1970
Senior Vice President and Chief Investment Officer – Equities and Multi-Asset Strategies
(Officer of The Charles Schwab Family of Funds, Schwab Investments, Schwab Capital Trust, Schwab Annuity Portfolios, Schwab Strategic Trust and Laudus Trust since 2011) | Senior Vice President and Chief Investment Officer – Equities and Multi-Asset Strategies, Charles Schwab Investment Management, Inc. (Apr. 2011 – present); Senior Vice President and Chief Investment Officer – Equities, Schwab Funds, Laudus Funds and Schwab ETFs (June 2011 – present); Head of the Portfolio Management Group and Vice President of Portfolio Management, Financial Engines, Inc. (investment management firm) (May 2009 – Apr. 2011); Head of Quantitative Equity, ING Investment Management (July 2004 – Jan. 2009). |
Brett Wander
1961
Senior Vice President and Chief Investment Officer – Fixed Income
(Officer of The Charles Schwab Family of Funds, Schwab Investments, Schwab Capital Trust, Schwab Annuity Portfolios, Schwab Strategic Trust and Laudus Trust since 2011) | Senior Vice President and Chief Investment Officer – Fixed Income, Charles Schwab Investment Management, Inc. (Apr. 2011 – present); Senior Vice President and Chief Investment Officer – Fixed Income, Schwab Funds, Laudus Funds and Schwab ETFs (June 2011 – present); Senior Managing Director, Global Head of Active Fixed-Income Strategies, State Street Global Advisors (Jan. 2008 – Oct. 2010); Director of Alpha Strategies Loomis, Sayles & Company (investment management firm) (Apr. 2006 – Jan. 2008). |
David Lekich
1964
Chief Legal Officer and Secretary, Schwab Funds and Schwab ETFs
Vice President and Assistant Clerk, Laudus Funds
(Officer of The Charles Schwab Family of Funds, Schwab Investments, Schwab Capital Trust, Schwab Annuity Portfolios, Schwab Strategic Trust and Laudus Trust since 2011) | Senior Vice President (Sept. 2011 – present), Vice President (Mar. 2004 – Sept. 2011), Charles Schwab & Co., Inc.; Senior Vice President and Chief Counsel (Sept. 2011 – present), Vice President (Jan. 2011 – Sept. 2011), Charles Schwab Investment Management, Inc.; Secretary (Apr. 2011 – present) and Chief Legal Officer (Dec. 2011 – present), Schwab Funds; Vice President and Assistant Clerk, Laudus Funds (Apr. 2011 – present); Secretary (May 2011 – present) and Chief Legal Officer (Nov. 2011 – present), Schwab ETFs. |
Catherine MacGregor
1964
Vice President and Assistant Secretary, Schwab Funds and Schwab ETFs
Chief Legal Officer, Vice President and Clerk, Laudus Funds
(Officer of The Charles Schwab Family of Funds, Schwab Investments, Schwab Capital Trust, Schwab Annuity Portfolios and Laudus Trust since 2005; Schwab Strategic Trust since 2009) | Vice President, Charles Schwab & Co., Inc., Charles Schwab Investment Management, Inc. (July 2005 – present); Vice President (Dec. 2005 – present), Chief Legal Officer and Clerk (Mar. 2007 – present), Laudus Funds; Vice President (Nov. 2005 – present) and Assistant Secretary (June 2007 – present), Schwab Funds; Vice President and Assistant Secretary, Schwab ETFs (Oct. 2009 – present). |
| 1 | Each Trustee shall hold office until the election and qualification of his or her successor, or until he or she dies, resigns or is removed. The retirement policy requires that each independent trustee retire by December 31 of the year in which the Trustee turns 74 or the Trustee’s twentieth year of service as an independent trustee on any trust in the Fund Complex, whichever occurs first. |
| 2 | Mr. Bettinger, Ms. Chandoha and Mr. Martinetto are Interested Trustees. Mr. Bettinger is an Interested Trustee because he owns stock of The Charles Schwab Corporation (CSC), the parent company of Charles Schwab Investment Management, Inc. (CSIM), the investment adviser for the trusts in the Fund Complex, is an employee and director of Charles Schwab & Co., Inc. (CS&Co), the principal underwriter for The Charles Schwab Family of Funds, Schwab Investments, Schwab Capital Trust and Schwab Annuity Portfolios, and is a director of CSIM. Ms. Chandoha is an Interested Trustee because she owns stock of CSC and is an employee and director of CSIM. Mr. Martinetto is an Interested Trustee because he owns stock of CSC and is an employee and director of CS&Co. |
| 3 | The President, Treasurer and Secretary/Clerk hold office until their respective successors are chosen and qualified or until he or she sooner dies, resigns, is removed or becomes disqualified. Each of the other officers serves at the pleasure of the Board. |
Laudus Mondrian Funds | Annual Report
Bond is a security representing a loan from the investor to the issuer. A bond typically pays interest at a fixed rate (the coupon rate) until a specified date (the maturity date), at which time the issuer returns the money borrowed (principal or face value) to the bondholder. Because of their structure, bonds are sometimes called “fixed income securities” or “debt securities.”
An individual bond is subject to the credit risk of the issuer. Bond credit ratings are measured on a scale that generally ranges from AAA (highest) to D (lowest). Changes in interest rates can affect a bond’s market value prior to call or maturity. There is no guarantee that a bond’s yield to call or maturity will provide a positive return over the rate of inflation.
Citigroup Non-U.S. Dollar World Government Bond Index A market capitalization index that measures the total rate of return performance for the government bonds of 22 countries, excluding the U.S., with a remaining maturity of at least 1 year.
Dividend yield is an expression of a stock’s market value in relationship to its dividend amount as a percentage. It is calculated by dividing the stock’s annual dividends by the market price of the stock.
Duration A measure of an individual bond’s sensitivity to interest rates. Calculations of duration generally take into account the bond’s yield, interest payments, maturity date and call features.
Weighted Average Duration A measure of the duration of all bonds in a fund’s portfolio, based on the market value weighted average duration of each bond in the portfolio.
Maturity The maturity of a bond will generally be determined using a portfolio security’s final maturity date (date on which the final principal payment of a bond is scheduled to be paid); however, for securitized products, such as mortgage-backed securities and certain other asset-backed securities, maturity will be determined on an average life basis (weighted average time to receipt of all principal payments) by the investment adviser. Because pre-payment rates of individual mortgage pools vary widely, the average life of a particular pool cannot be predicted precisely. For securities with embedded demand features, such as puts or calls, either the demand date or the final maturity date will be used depending on interest rates, yields and other market conditions. The weighted average maturity (WAM) of a fund is dollar-weighted based upon the market value of a fund’s securities at the time of the calculation.
MSCI EAFE Index (Net) A free float-adjusted market capitalization index that is designed to measure the equity market performance of developed markets in Europe, Australasia, and the Far East. The Net version of the index reflects reinvested dividends net of withholding taxes, but reflects no deductions for expenses or other taxes; returns are calculated applying dividend withholding rates applicable to non-resident persons who do not benefit from double taxation treaties.
MSCI EAFE Value Index (Net) A free float-adjusted market capitalization index that is designed to measure large- and mid-cap securities exhibiting overall value style characteristics across developed markets countries around the world, excluding the U.S. and Canada. The value investment style characteristics for index construction are defined using three variables: book value to price, 12-month forward earnings to price and dividend yield. This series approximates the minimum possible dividend reinvestment. The returns are calculated applying dividend withholding rates applicable to non-resident persons who do not benefit from double taxation treaties.
MSCI Emerging Markets Index (Net) A free float-adjusted market capitalization weighted index that is designed to measure equity market performance in the global emerging markets. This series approximates the minimum possible dividend reinvestment. The returns are calculated applying dividend withholding rates applicable to non-resident persons who do not benefit from double taxation treaties.
Price to earnings ratio is the price of a stock divided by its historical earnings per share.
Price to book ratio compares the stock’s market value to the value of the total assets less the total liabilities.
Sovereign debt refers to debt issued by a national government within a given country and denominated in a foreign currency.
Trading Activity is one of several risk factors commonly used to attribute a portfolio’s return relative to its benchmark. Specifically, trading activity measures a stock’s trailing 12 month trading volume relative to its total shares outstanding. It measures how actively traded a stock has been in the last 12 months.
Weighted Average Market Cap A measure of the size of the companies in which a fund invests, based upon the market value of a fund’s securities each weighted according to its percent of the portfolio.
Laudus Mondrian Funds | Annual Report
PRIVACY NOTICE
THIS IS NOT PART OF THE SHAREHOLDER REPORT
A Commitment to Your Privacy
Your Privacy Is Not for Sale
We do not and will not sell your personal information to anyone, for any reason.
We are committed to protecting the privacy of information we maintain about you. Below are details about our commitment, including the types of information we collect and how we use and share that information. This Privacy Notice applies to you only if you are an individual who invests directly in the funds by placing orders through the funds’ transfer agent. If you place orders through your brokerage account at Charles Schwab & Co., Inc. or an account with another broker-dealer, investment advisor, 401(k) plan, employee benefit plan, administrator, bank or other financial intermediary, you are covered by the privacy policies of that financial institution and should consult those policies.
How We Collect Information About You
We collect personal information about you in a number of ways.
• APPLICATION AND REGISTRATION
INFORMATION.
We collect personal information from you when you open an account or utilize one of our services. We may also collect information about you from third parties such as consumer reporting agencies to verify your identity. The information we collect may include personal information, including your Social Security number, as well as details about your interests, investments and investment experience.
• TRANSACTION AND EXPERIENCE
INFORMATION.
Once your account has been opened, we collect and maintain personal information about your account activity, including your transactions, balances, positions and history. This information allows us to administer your account and provide the services you have requested.
• WEBSITE USAGE.
When you visit our websites, we may use devices known as “cookies,” graphic interchange format files (GIFs), or other similar web tools to enhance your web experience. These tools help us to recognize you, maintain your web session, and provide a more personalized experience. To learn more, please click the Privacy link on our website.
How We Share and Use Your Information
We provide access to information about you to our affiliated companies, outside companies and other third parties in certain limited circumstances, including:
• to help us process transactions for your account;
• when we use other companies to provide services for us, such as printing and mailing your account statements;
• when we believe that disclosure is required or permitted under law (for example, to cooperate with regulators or law enforcement, resolve consumer disputes, perform credit/authentication checks, or for risk control).
State Laws
We will comply with state laws that apply to the disclosure or use of information about you.
Safeguarding Your Information — Security Is a
Partnership
We take precautions to ensure the information we collect about you is protected and is accessed only by authorized individuals or organizations.
Companies we use to provide support services are not allowed to use information about our shareholders for their own purposes and are contractually obligated to maintain strict confidentiality. We limit their use of information to the performance of the specific services we have requested. We restrict access to personal information by our employees and agents. Our employees are trained about privacy and are required to safeguard personal information.
We maintain physical, electronic and procedural safeguards that comply with federal standards to guard your nonpublic personal information.
Contact Us
To provide us with updated information, report suspected fraud or identity theft, or for any other questions, please call the number below.
Laudus Funds® direct investors: 1-877-824-5615
© 2017 Laudus Funds. All rights reserved.
Laudus Mondrian Funds | Annual Report
Laudus Funds®
Laudus Funds offer investors access to some of the world’s leading investment managers. With a rigorous manager selection process and ongoing oversight by Charles Schwab Investment Management, Laudus Funds offer single and multi-manager strategies as a complement to other funds managed by Charles Schwab Investment Management. The list below shows all currently available Laudus Funds.
An investor should consider a fund’s investment objectives, risks, charges and expenses carefully before investing or sending money. This and other important information can be found in the fund’s prospectus or, if available, the summary prospectus. Please call 1-877-824-5615 for a prospectus for any Laudus Fund. Please read the prospectus carefully before you invest. This report must be preceded or accompanied by a current prospectus.
Proxy Voting Policies, Procedures and Results
A description of the proxy voting policies and procedures used to determine how to vote proxies on behalf of the funds is available without charge, upon request, by visiting the Laudus Funds’ website at www.schwabfunds.com/laudusfunds_prospectus, the SEC’s website at www.sec.gov, or by contacting Laudus Funds at 1-877-824-5615.
Information regarding how a fund voted proxies relating to portfolio securities during the most recent twelve-month period ended June 30 is available, without charge, by visiting the fund’s website at www.schwabfunds.com/laudusfunds_prospectus or the SEC’s website at www.sec.gov.
Laudus U.S. Large Cap Growth
Laudus U.S. Large Cap Growth Fund
Laudus MarketMasters Funds®
Laudus International MarketMasters Fund™
Laudus Small-Cap MarketMasters Fund™
Laudus Mondrian Funds™
Laudus Mondrian International Equity Fund
Laudus Mondrian Emerging Markets Fund
Laudus Mondrian International Government Fixed Income Fund
Investment Adviser
Charles Schwab Investment Management, Inc.
211 Main Street, San Francisco, CA 94105
Funds
Laudus Funds
1-877-824-5615
Printed on recycled paper.
Charles Schwab Investment Management, Inc. (CSIM) is the investment adviser for Laudus Funds. The Laudus Group of Funds includes the Laudus Mondrian Funds and Laudus U.S. Large Cap Growth Fund, which are part of the Laudus Trust and distributed by ALPS Distributors, Inc. (ALPS); and the Laudus MarketMasters Funds, which are part of the Schwab Capital Trust and distributed by Charles Schwab & Co., Inc. (Schwab), Member SIPC. Schwab and CSIM, affiliates and subsidiaries of The Charles Schwab Corporation, are not affiliated with ALPS.
This page is intentionally left blank.
Annual Report | March 31, 2018
Laudus U.S. Large Cap Growth Fund
Adviser
Charles Schwab Investment Management, Inc.
Subadviser
BlackRock Investment Management, LLC
This page is intentionally left blank.
Fund investment adviser: Charles Schwab Investment Management, Inc. (CSIM)
Distributor: ALPS Distributors, Inc. (ALPS)
The industry/sector classification of the fund’s portfolio holdings uses the Global Industry Classification Standard (GICS) which was developed by and is the exclusive property of MSCI Inc. (MSCI) and Standard & Poor’s (S&P). GICS is a service mark of MSCI and S&P and has been licensed for use by CSIM and certain affiliates. Charles Schwab & Co, Inc. and ALPS are unaffiliated entities. The Industry classifications used in the schedules of Portfolio Holdings are sub-categories of Sector classifications.
Laudus U.S. Large Cap Growth Fund | Annual Report
Laudus U.S. Large Cap Growth Fund
The performance data quoted represents past performance. Past performance does not guarantee future results. Investment returns and principal value of an investment will fluctuate so that an investor’s shares may be worth more or less than their original cost. Current performance may be lower or higher than performance data quoted. To obtain performance information current to the most recent month end, please visit www.schwabfunds.com/laudusfunds_prospectus.
| Total Return for the 12 Months Ended March 31, 2018 |
| Laudus U.S. Large Cap Growth Fund (Ticker Symbol: LGILX) | 28.52% |
| Russell 1000® Growth Index | 21.25% |
| Performance Details | pages 5-7 |
| |
| Minimum Initial Investment1 | $ 100 |
All fund and index figures on this page assume dividends and distributions were reinvested. Index figures do not include trading and management costs, which would lower performance. Indices are unmanaged and cannot be invested in directly. Performance results less than one year are not annualized.
For index definitions, please see the Glossary.
Fund expenses may have been partially absorbed by CSIM. Without these reductions, the fund’s return would have been lower. This return does not reflect the deduction of taxes that a shareholder would pay on fund distributions or the redemption of fund shares.
| 1 | Please see prospectus for further detail and eligibility requirements. |
Laudus U.S. Large Cap Growth Fund | Annual Report
Laudus U.S. Large Cap Growth Fund
Marie Chandoha
President and CEO of
Charles Schwab Investment
Management, Inc. and the
fund covered in this report.
Dear Shareholder,
For investors who grew accustomed to the market’s smooth ride since the financial crisis, recent months must have felt like off-roading. After historically low volatility during most of the reporting period, the stock market began experiencing bigger swings starting in February, and many stock prices came under pressure. No one can predict what comes next, of course, but the increased market volatility may very well continue.
Higher volatility can tempt investors to veer from their financial plans. Some may even be enticed to try out new investments that purport to profit when volatility spikes. Such moves might be tempting in the moment, but can often lead to unintended results. For example, those who sold out of stocks after the global financial crisis and failed to get back in missed out on the current historic bull market run, which turned nine years old in March. Investors who instead stayed invested were more likely to benefit from the eventual recovery and may have seen further gains as the rally continued.
At Charles Schwab Investment Management, we believe that a period of heightened volatility can be an opportune time to check in on your portfolio and evaluate whether your investments are positioned to help you achieve your financial goals. We work hard to help shareholders build better portfolios, and for many investors, that may mean including exposure to actively managed strategies.
In recent years, it has been challenging for many active managers to keep up with the rising market. But the more recent spike in volatility has reminded many of us why it may make sense to maintain exposure to funds that aren’t designed to track an index. The Laudus U.S. Large Cap Growth Fund is one example in our active product lineup that outperformed its benchmark during the broader stock market rally and during the recent market turmoil.
We believe that offering clear and focused objectives, a commitment to transparency, and a consistent approach to investing can provide investors with quality and value in ever-changing market conditions. We know it can be difficult to stand firm when volatility spikes, but we believe having a well-diversified portfolio that includes an allocation to active strategies can help give you confidence that you’re on the right track. We’re here to serve you over the long-term—with funds that seek consistent, repeatable performance and are built with your needs in mind.
Thank you for investing with Charles Schwab Investment Management. For more information about the Laudus U.S. Large Cap Growth Fund, please continue reading this report. In addition, you can find further details about this fund by visiting our website at www.schwabfunds.com. We are also happy to hear from you at 1-877-824-5615.
Sincerely,
“ The Laudus U.S. Large Cap Growth Fund is one example in our active product lineup that outperformed its benchmark during the broader stock market rally and during the recent market turmoil.”
Management views may have changed since the report date.
Laudus U.S. Large Cap Growth Fund | Annual Report
Laudus U.S. Large Cap Growth Fund
The Investment Environment
Over the 12-month reporting period ended March 31, 2018, U.S. equities generated positive returns. Strong corporate earnings, solid economic data, and upbeat consumer sentiment helped drive several indices to record highs during the reporting period, and the passage of the Tax Cuts and Jobs Act (TCJA) in December also played a role. Growth stocks outperformed value stocks, largely due to the strong showing by the FAANG stocks (Facebook, Inc., Amazon.com, Inc., Apple, Inc., Netflix, and Google, Inc. parent, Alphabet, Inc.) through January. However, market volatility made a sudden return in February and March, driven largely by fears of quickly rising inflation, a potential trade war between the U.S. and China, and a technology industry selloff. Meanwhile, the Federal Reserve (Fed) raised short-term interest rates three times during the reporting period, with plans for two additional rate hikes in 2018. As the Fed continued to raise rates, traditionally yield-sensitive defensive sectors like Consumer Staples and Telecommunication Services underperformed while pro-cyclical sectors, such as Information Technology and Financials, outperformed. In this environment, the S&P 500® Index, a bellwether for the overall U.S. stock market, returned 13.99%, while the Russell 1000® Growth Index and the Russell 1000® Value Index returned 21.25% and 6.95% respectively.
U.S. economic growth strengthened over the reporting period, generally supporting equities. Consumer confidence measured at or near record highs, and the labor market improved further with low unemployment and solid job growth. Industrial production picked up in the second half of the reporting period after earlier slowing from Hurricanes Harvey and Irma, while corporate earnings were generally strong, especially toward the end of 2017 due to various one-time effects from the TCJA passed in December. Overall, U.S. quarterly gross domestic product (GDP) numbers exceeded expectations, reinforcing a solid economic picture. Outside the U.S., eurozone consumer confidence climbed to a near all-time high amid increased household spending and rising wages. The eurozone also benefitted from a recovering labor market, strong exports, and continued accommodative monetary policies which contributed to strengthening GDP numbers in 2017. In Asia, increasing exports, easy monetary policies, and rising consumption resulted in eight straight quarters of growth for Japan by the end of the fourth quarter of 2017, and in China, economic growth remained solid despite softening slightly during the reporting period.
Many central banks, including the Fed, stepped back from stimulative measures over the reporting period, though global monetary policies remained generally accommodative. The Fed raised short-term interest rates in June, December, and March, each time by 0.25%. The federal funds rate ended the reporting period in a target range of 1.50% to 1.75%, with market expectations for approximately two additional increases in 2018. The Fed also began the process of unwinding its $4.5 trillion balance sheet by slowly allowing securities to mature without reinvesting the proceeds. This process began in October, and as expected, proved to be uneventful in terms of market impact in late 2017 and early 2018. Toward the end of the reporting period, the Fed also saw a change in leadership with Jerome Powell replacing Janet Yellen as Fed Chairman. Chairman Powell is expected to follow a similar path as his predecessor, making only gradual and highly telegraphed changes to monetary policy. His first meeting in March held up to these expectations, as the Fed increased short-term interest rates as anticipated.
In the last two months of the reporting period, significant volatility returned to equity markets. Rising inflation measurements in February contributed to fears that the Fed would raise short-term rates faster than expected, driving up bond yields and sending stocks downward. In March, President Trump announced plans for a 25% tariff on steel imports and a 10% tariff on aluminum imports, resulting in threats of retaliation from countries across the globe and weighing on shares of U.S. companies dependent on these metals. As the month continued, several countries negotiated exemptions to these tariffs, though tensions escalated between the U.S. and China and increased concerns of a potential trade war. Meanwhile, after leading the U.S. stock market for much of 2017, U.S. technology companies fell sharply in March amid increased attention from regulators and negative consumer sentiment. Among other events, Facebook, Inc. faced criticism after news surfaced regarding a third party’s access to millions of users’ data without explicit consent, President Trump voiced disapproval with Amazon.com, Inc.’s U.S. Postal Service contract via Twitter, and two separate fatal accidents involving self-driving vehicles brought renewed scrutiny on Tesla, Inc. and Uber Technologies Inc.
Index figures assume dividends and distributions were reinvested. Index figures do not include trading and management costs, which would lower performance. Indices are unmanaged and cannot be invested in directly. Performance results less than one year are not annualized. Past performance is not an indication of future results.
For index definitions, please see the Glossary.
Nothing in this report represents a recommendation of a security by the investment adviser.
Management views may have changed since the report date.
Laudus U.S. Large Cap Growth Fund | Annual Report
Laudus U.S. Large Cap Growth Fund as of March 31, 2018
The Laudus U.S. Large Cap Growth Fund (the fund) seeks long-term capital appreciation. Under normal circumstances, the fund invests at least 80% of its net assets (plus borrowings for investment purposes, if any) in equity securities of U.S. large-capitalization companies. For more information concerning the fund’s investment objective, strategies, and risks, please see the prospectus.
Market Highlights. U.S. equities performed well over the reporting period, with large cap stocks generally outperforming small cap stocks and growth outperforming value. The U.S. stock market continued its nine-year bull run amid synchronized global growth and generally accommodative monetary policies, as well as high levels of consumer confidence. However, after a prolonged absence, market volatility made a dramatic return in early February. Concerns about quickly rising inflation and a potential trade war between the U.S. and China drove much of the broader market’s movements, while a series of public missteps by several Information Technology companies contributed to volatility within this sector. From a sector perspective, stocks in the Information Technology and Consumer Discretionary sectors were some of the better performers in the Russell 1000® Growth Index, while Financials and Industrials stocks underperformed by comparison.
Performance. The fund returned 28.52% for the 12-month reporting period ended March 31, 2018. For performance comparisons, the fund uses the Russell 1000 Growth Index (the index), which returned 21.25% for the same period.
Positioning and Strategies. Over the reporting period, overall stock selection contributed to the fund’s outperformance relative to the index. In addition, decisions to overweight or underweight certain stocks or sectors positively contributed.
From a sector perspective, the Information Technology and Consumer Discretionary sectors were the largest contributors to relative performance. Stock selection decisions within Internet software & services accounted for the majority of the outperformance in Information Technology, while Internet & direct marketing retail holdings and an underweight to media companies drove relative gains within the Consumer Discretionary sector. Stock selection within and an underweight to the Consumer Staples sector also contributed to the fund’s relative performance. Conversely, the Industrials and Financials sectors detracted from relative performance during the reporting period. Weakness among electrical equipment and professional services holdings, coupled with an underweight to aerospace & defense companies, held back results in the Industrials sector. Within the Financials sector, banks were the main drag on relative performance. The fund’s overweight to the Energy sector also detracted, although to a lesser degree.
Looking at specific stocks, the largest individual contributors were Tencent Holdings Ltd. and Amazon.com Inc. Tencent Holdings Ltd. outperformed due in large part to several quarters of accelerating revenue growth and exceeding expectations in almost every segment (payments, mobile games, advertising and cloud), supporting the subadviser’s belief of multiple years of outsized growth for Tencent Holdings Ltd.’s WeChat communication platform. Amazon.com outperformed as continued underperformance among traditional retailers focused investors on its share gain opportunities. The company delivered a series of strong earnings reports, with notable acceleration in North America, International, Prime and advertising. Further, Amazon Web Services continued its impressive growth.
Netflix, Inc. also added value over the reporting period. The company outperformed amid strong financial results throughout the 12-month reporting period. Netflix, Inc. exceeded 23 million global net subscriber additions for 2017, ahead of forecasts. Overall, Netflix, Inc. continued to benefit from a recurring cycle whereby the company continued to grow subscribers globally, enabling it to invest in more content, which, in turn, drove more subscribers to the platform.
Individual detractors over the reporting period included Equifax Inc. and Ulta Beauty Inc. Equifax Inc. declined after the company disclosed that data tied to 145 million Americans had been stolen by criminals due to failure by Equifax Inc. to properly maintain its software. The fund’s subadviser believes that it is likely that the long-term impact of this breach on Equifax Inc. will be minimal, though the near-term costs, including potential litigation or remediation expenses, are uncertain. Ulta Beauty Inc. underperformed amid ongoing fears surrounding long-term pressure from Amazon.com, and that brick-and-mortar competitors will drive elevated promotional activity.
An overweight to LED-lighting specialist Acuity Brands, Inc. also weighed on results over the reporting period. Acuity Brands, Inc. underperformed after a series of earnings disappointments due to an industry slowing in short-cycle projects, as well as a weak volume and pricing outlook. (Please note that the fund’s position in Acuity Brands, Inc. was sold by the end of the reporting period.)
Due to a combination of portfolio trading activity and market movement, the fund’s weighting increased in the Industrials sector over the reporting period, particularly road & rail. Materials exposure also increased, namely within construction materials. The largest decrease over the reporting period was in the Health Care sector, where exposure to biotechnology declined. The Real Estate sector, notably real estate investment trusts (REITs) also saw reductions.
| Fund Characteristics | |
| Number of Securities1 | 54 |
| Weighted Average Market Cap (millions) | $250,055 |
| Price/Earnings Ratio (P/E) | 36.59 |
| Price/Book Ratio (P/B) | 5.90 |
Portfolio Turnover
(One year trailing) | 49% |
| Fund Overview | |
| | Fund |
| Inception Date | 10/14/1997 * |
| Ticker Symbol | LGILX |
| Cusip | 51855Q549 |
| NAV | $20.47 |
Management views and portfolio holdings may have changed since the report date.
| * | Inception date is that of the fund’s predecessor fund, the Y Class of the UBS U.S. Large Cap Growth Fund. |
| 1 | Short-term investments are not included. |
Laudus U.S. Large Cap Growth Fund | Annual Report
Laudus U.S. Large Cap Growth Fund
Performance and Fund Facts as of March 31, 2018
Past performance does not guarantee future results. The performance data quoted represents past performance, and current returns may be lower or higher. The performance information does not reflect the deduction of taxes that a shareholder would pay on fund distributions or the redemption of fund shares. The investment return and principal value of an investment will fluctuate so that an investor’s shares, when redeemed, may be worth more or less than the original cost. To obtain performance information current to the most recent month end, visit www.schwabfunds.com/laudusfunds_prospectus.
Performance of Hypothetical Investment (March 31, 2008 – March 31, 2018)1
Average Annual Total Returns
| Fund and Inception Date | 1 Year | 5 Years | 10 Years |
| Laudus U.S. Large Cap Growth Fund (10/14/97)1 | 28.52% | 16.01% | 12.06% |
| Russell 1000® Growth Index | 21.25% | 15.53% | 11.34% |
| Fund Expense Ratio2: 0.76% |
Total returns include change in share price and reinvestment of distributions. Total returns may reflect the waiver of a portion of the fund’s advisory fees for certain periods since the inception date. In such instances, and without the waiver of fees, total returns would have been lower. Performance results less than one year are not annualized.
For index definitions, please see the Glossary.
| 1 | The Laudus U.S. Large Cap Growth Fund was launched on 7/13/09. The fund was formerly known as UBS U.S. Large Cap Growth Fund. The performance and returns prior to 7/13/09 reflect the returns of UBS U.S. Large Cap Growth Fund, Class Y Shares. |
| 2 | As stated in the prospectus. Please see the prospectus for more information. For actual rates during the period, refer to the Financial Highlights section of the Financial Statements. |
Laudus U.S. Large Cap Growth Fund | Annual Report
Laudus U.S. Large Cap Growth Fund
Performance and Fund Facts as of March 31, 2018 (continued)
Sector Weightings % of Equities
Top Equity Holdings % of Net Assets1
Portfolio holdings may have changed since the report date.
| 1 | This list is not a recommendation of any security by the investment adviser or subadviser. |
Laudus U.S. Large Cap Growth Fund | Annual Report
Laudus U.S. Large Cap Growth Fund
Fund Expenses (Unaudited)
Examples for a $1,000 Investment
As a fund shareholder, you may incur two types of costs: (1) transaction costs; and (2) ongoing costs, including management fees, transfer agent and shareholder services fees, and other fund expenses.
The expense examples below are intended to help you understand your ongoing cost (in dollars) of investing in the fund and to compare this cost with the ongoing cost of investing in other mutual funds. These examples are based on an investment of $1,000 invested for the period beginning October 1, 2017 and held through March 31, 2018.
Actual Return lines in the table below provide information about actual account values and actual expenses. You may use this information, together with the amount you invested, to estimate the expenses that you paid over the period. To do so, simply divide your account value by $1,000 (for example, an $8,600 account value ÷ $1,000 = 8.6), then multiply the result by the number given for your fund under the heading entitled “Expenses Paid During Period.”
Hypothetical Return lines in the table below provide information about hypothetical account values and hypothetical expenses based on the fund’s actual expense ratio and an assumed return of 5% per year before expenses. Because the return used is not an actual return, it may not be used to estimate the actual ending account value or expenses you paid for the period.
You may use this information to compare the ongoing costs of investing in the fund and other funds. To do so, compare this 5% hypothetical example with the 5% hypothetical examples that appear in the shareholder reports of the other funds.
Please note that the expenses shown in the table are meant to highlight your ongoing costs only, and do not reflect any transactional costs. Therefore, the hypothetical return lines of the table are useful in comparing ongoing costs only, and will not help you determine the relative total costs of owning different funds. In addition, if these transactional costs were included, your costs would have been higher.
| | Expense Ratio
(Annualized)1 | Beginning
Account Value
at 10/1/17 | Ending
Account Value
(Net of Expenses)
at 3/31/18 | Expenses Paid
During Period
10/1/17-3/31/182 |
| Laudus U.S. Large Cap Growth Fund | | | | |
| Actual Return | 0.75% | $1,000.00 | $1,138.80 | $4.00 |
| Hypothetical 5% Return | 0.75% | $1,000.00 | $1,021.16 | $3.78 |
| 1 | Based on the most recent six-month expense ratio; may differ from the expense ratio provided in the Financial Highlights which covers a 12- month period. This ratio does not include certain non-routine expenses, such as custody out-of-pocket fee reimbursement. |
| 2 | Expenses for the fund are equal to its annualized expense ratio, multiplied by the average account value over the period, multiplied by the 182 days of the period, and divided by the 365 days of the fiscal year. |
Laudus U.S. Large Cap Growth Fund | Annual Report
Laudus U.S. Large Cap Growth Fund
Financial Statements
Financial Highlights
| | 4/1/17–
3/31/18 | 4/1/16–
3/31/17 | 4/1/15–
3/31/16 | 4/1/14–
3/31/15 | 4/1/13–
3/31/14 | |
| Per-Share Data |
| Net asset value at beginning of period | $18.12 | $15.76 | $17.22 | $18.19 | $15.58 | |
| Income (loss) from investment operations: | | | | | | |
| Net investment income (loss)1 | 0.00 2 | 0.00 2 | (0.01) | (0.01) | (0.02) | |
| Net realized and unrealized gains (losses) | 4.99 | 2.63 | (0.37) | 2.44 | 3.85 | |
| Total from investment operations | 4.99 | 2.63 | (0.38) | 2.43 | 3.83 | |
| Less distributions: | | | | | | |
| Distributions from net realized gains | (2.64) | (0.27) | (1.08) | (3.40) | (1.22) | |
| Net asset value at end of period | $20.47 | $18.12 | $15.76 | $17.22 | $18.19 | |
| Total return | 28.52% | 16.85% | (2.50%) | 14.99% | 24.81% | |
| Ratios/Supplemental Data |
| Ratios to average net assets: | | | | | | |
| Net operating expenses | 0.75% 3 | 0.76% | 0.75% | 0.77% | 0.78% 4 | |
| Gross operating expenses | 0.75% 3 | 0.76% | 0.75% | 0.77% | 0.78% | |
| Net investment income (loss) | 0.01% 3 | 0.03% | (0.04%) | (0.06%) | (0.12%) | |
| Portfolio turnover rate | 49% | 73% | 82% | 102% | 124% | |
| Net assets, end of period (x 1,000) | $1,953,049 | $1,667,059 | $1,969,169 | $2,171,783 | $2,122,365 | |
| |
1
Calculated based on the average shares outstanding during the period.
2
Per-share amount was less than $0.005.
3
The ratio of net operating expenses and gross operating expenses would have been 0.76% and 0.76%, respectively, and the ratio of net investment income would have been less than 0.005%, if the custody out-of-pocket fee reimbursement had not been included (see financial note 11).
4
The ratio of net operating expenses would have been 0.77%, if certain non-routine expenses had not been incurred.
Laudus U.S. Large Cap Growth Fund | Annual Report
Laudus U.S. Large Cap Growth Fund
Portfolio Holdings as of March 31, 2018
This section shows all the securities in the fund’s portfolio and their values as of the report date.
The fund files its complete schedule of portfolio holdings with the SEC for the first and third quarters of each fiscal year on Form N-Q. The fund’s Form N-Q is available on the SEC’s website at www.sec.gov and may be viewed and copied at the SEC’s Public Reference Room in Washington, D.C. Call 1-800-SEC-0330 for information on the operation of the Public Reference Room. The fund also makes available its complete schedule of portfolio holdings 30 days after the end of the calendar quarter on the fund’s website at www.schwabfunds.com/laudusfunds_prospectus.
| Security | Number
of Shares | Value ($) |
| Common Stock 97.8% of net assets |
| |
| Automobiles & Components 0.6% |
| Tesla, Inc. * | 43,740 | 11,640,526 |
| |
| Banks 3.5% |
| Bank of America Corp. | 1,637,478 | 49,107,965 |
| First Republic Bank | 200,690 | 18,585,901 |
| | | 67,693,866 |
| |
| Capital Goods 4.1% |
| Caterpillar, Inc. | 84,687 | 12,481,170 |
| Honeywell International, Inc. | 126,138 | 18,228,202 |
| Rockwell Automation, Inc. | 55,709 | 9,704,508 |
| Roper Technologies, Inc. | 71,056 | 19,944,709 |
| TransDigm Group, Inc. | 62,957 | 19,324,021 |
| | | 79,682,610 |
| |
| Commercial & Professional Services 2.5% |
| CoStar Group, Inc. * | 63,501 | 23,030,543 |
| Equifax, Inc. | 220,094 | 25,929,274 |
| | | 48,959,817 |
| |
| Consumer Durables & Apparel 2.1% |
| Mohawk Industries, Inc. * | 60,783 | 14,115,028 |
| NIKE, Inc., Class B | 421,653 | 28,014,626 |
| | | 42,129,654 |
| |
| Consumer Services 1.1% |
| Domino’s Pizza, Inc. | 92,551 | 21,616,212 |
| |
| Diversified Financials 3.1% |
| Berkshire Hathaway, Inc., Class B * | 165,157 | 32,945,518 |
| S&P Global, Inc. | 148,095 | 28,295,031 |
| | | 61,240,549 |
| |
| Food, Beverage & Tobacco 3.4% |
| Constellation Brands, Inc., Class A | 210,245 | 47,919,040 |
| Dr Pepper Snapple Group, Inc. | 150,168 | 17,776,888 |
| | | 65,695,928 |
| |
| Health Care Equipment & Services 7.4% |
| Becton, Dickinson & Co. | 130,884 | 28,362,563 |
| Boston Scientific Corp. * | 1,216,866 | 33,244,779 |
| UnitedHealth Group, Inc. | 390,791 | 83,629,274 |
| | | 145,236,616 |
| |
| Security | Number
of Shares | Value ($) |
| Materials 3.3% |
| DowDuPont, Inc. | 242,990 | 15,480,893 |
| The Sherwin-Williams Co. | 62,378 | 24,459,661 |
| Vulcan Materials Co. | 214,046 | 24,437,632 |
| | | 64,378,186 |
| |
| Pharmaceuticals, Biotechnology & Life Sciences 4.5% |
| Alexion Pharmaceuticals, Inc. * | 186,985 | 20,841,348 |
| Illumina, Inc. * | 119,919 | 28,351,250 |
| Vertex Pharmaceuticals, Inc. * | 112,912 | 18,402,398 |
| Zoetis, Inc. | 233,287 | 19,481,797 |
| | | 87,076,793 |
| |
| Retailing 18.3% |
| Amazon.com, Inc. * | 109,996 | 159,201,611 |
| Booking Holdings, Inc. * | 33,460 | 69,609,849 |
| Netflix, Inc. * | 211,251 | 62,392,983 |
| The Home Depot, Inc. | 167,361 | 29,830,425 |
| Ulta Salon, Cosmetics & Fragrance, Inc. * | 180,011 | 36,770,847 |
| | | 357,805,715 |
| |
| Semiconductors & Semiconductor Equipment 5.5% |
| Applied Materials, Inc. | 383,890 | 21,348,123 |
| ASML Holding N.V. | 155,806 | 30,936,839 |
| Broadcom Ltd. | 97,244 | 22,915,549 |
| NVIDIA Corp. | 139,767 | 32,368,639 |
| | | 107,569,150 |
| |
| Software & Services 35.3% |
| Activision Blizzard, Inc. | 235,251 | 15,870,032 |
| Adobe Systems, Inc. * | 198,463 | 42,883,885 |
| Alibaba Group Holding Ltd. ADR * | 79,105 | 14,518,932 |
| Alphabet, Inc., Class A * | 93,841 | 97,326,255 |
| Autodesk, Inc. * | 254,930 | 32,014,109 |
| Electronic Arts, Inc. * | 283,109 | 34,324,135 |
| Facebook, Inc., Class A * | 345,363 | 55,185,554 |
| MasterCard, Inc., Class A * | 197,539 | 34,600,931 |
| MercadoLibre, Inc. | 78,020 | 27,805,548 |
| Microsoft Corp. | 1,221,844 | 111,517,702 |
| PayPal Holdings, Inc. * | 409,462 | 31,065,882 |
| salesforce.com, Inc. * | 195,178 | 22,699,201 |
| Tencent Holdings Ltd. | 1,272,000 | 68,280,373 |
| Visa, Inc., Class A | 754,164 | 90,213,098 |
| Workday, Inc., Class A * | 88,478 | 11,246,438 |
| | | 689,552,075 |
| |
| Technology Hardware & Equipment 0.6% |
| Flex Ltd. * | 678,805 | 11,084,886 |
| |
| Telecommunication Services 0.4% |
| Zayo Group Holdings, Inc. * | 229,884 | 7,852,837 |
| |
Laudus U.S. Large Cap Growth Fund | Annual Report
Laudus U.S. Large Cap Growth Fund
Portfolio Holdings as of March 31, 2018 (continued)
| Security | Number
of Shares | Value ($) |
| Transportation 2.1% |
| Union Pacific Corp. | 302,034 | 40,602,431 |
| Total Common Stock |
| (Cost $1,261,262,078) | | 1,909,817,851 |
|
| Other Investment Company 2.3% of net assets |
| |
| Money Market Fund 2.3% |
| State Street Institutional U.S. Government Money Market Fund, Premier Class 1.58% (a) | 44,275,019 | 44,275,019 |
| Total Other Investment Company |
| (Cost $44,275,019) | | 44,275,019 |
At March 31, 2018, the value of a foreign security held by the fund totaling $68,280,373 was adjusted from its closing market value in accordance with international fair valuation procedures approved by the fund’s Board of Trustees. (See financial note 2(a) for additional information).
| * | Non-income producing security. |
| (a) | The rate shown is the 7-day yield. |
| | |
| ADR — | American Depositary Receipt |
The following is a summary of the inputs used to value the fund’s investments as of March 31, 2018 (see financial note 2(a) for additional information):
| Description | Quoted Prices in
Active Markets for
Identical Assets
(Level 1) | Other Significant
Observable Inputs
(Level 2) | Significant
Unobservable Inputs
(Level 3) | Total | |
| Assets | | | | | |
| Common Stock1 | $1,220,265,776 | $— | $— | $1,220,265,776 | |
| Software & Services | 621,271,702 | 68,280,373 | — | 689,552,075 | |
| Other Investment Company1 | 44,275,019 | — | — | 44,275,019 | |
| Total | $1,885,812,497 | $68,280,373 | $— | $1,954,092,870 | |
| 1 | As categorized in Portfolio Holdings. |
The fund’s policy is to recognize transfers between Level 1, Level 2 and Level 3 as of the beginning of the fiscal year. There were no transfers between Level 1, Level 2 and Level 3 for the period ended March 31, 2018. Fund investments in underlying mutual funds are classified as Level 1, without consideration to the classification level of the investments held by the underlying mutual funds, which could be Level 1, Level 2 or Level 3.
Laudus U.S. Large Cap Growth Fund | Annual Report
Laudus U.S. Large Cap Growth Fund
Statement of Assets and Liabilities
As of March 31, 2018
| Assets |
| Investments in unaffiliated issuers, at value (cost $1,305,537,097) | | $1,954,092,870 |
| Foreign currency, at value (cost $38) | | 38 |
| Cash | | 644,684 |
| Receivables: | | |
| Fund shares sold | | 3,177,463 |
| Dividends | | 310,838 |
| Prepaid expenses | + | 43,281 |
| Total assets | | 1,958,269,174 |
| Liabilities |
| Payables: | | |
| Investments bought | | 2,975,171 |
| Investment adviser fees | | 1,074,230 |
| Fund shares redeemed | | 889,646 |
| Accrued expenses | + | 280,760 |
| Total liabilities | | 5,219,807 |
| Net Assets |
| Total assets | | 1,958,269,174 |
| Total liabilities | – | 5,219,807 |
| Net assets | | $1,953,049,367 |
| Net Assets by Source | | |
| Capital received from investors | | 1,220,566,272 |
| Net realized capital gains | | 83,927,322 |
| Net unrealized capital appreciation | | 648,555,773 |
| Net Asset Value (NAV) |
| Net Assets | ÷ | Shares
Outstanding | = | NAV |
| $1,953,049,367 | | 95,423,492 | | $20.47 |
| | | | | |
Laudus U.S. Large Cap Growth Fund | Annual Report
Laudus U.S. Large Cap Growth Fund
Statement of Operations
For the period April 1, 2017 through March 31, 2018
| Investment Income |
| Dividends (net of foreign withholding tax of $46,038) | | $13,740,202 |
| Expenses |
| Investment adviser fees | | 11,499,237 |
| Sub-accounting and sub-transfer agent fees | | 1,485,509 |
| Transfer agent fees | | 300,071 |
| Accounting and administration fees | | 72,579 |
| Registration fees | | 66,258 |
| Professional fees | | 57,093 |
| Custodian fees | | 55,761 |
| Shareholder reports | | 54,765 |
| Independent trustees’ fees | | 52,839 |
| Interest expense | | 369 |
| Custody out-of-pocket fee reimbursement | | (148,032)* |
| Other expenses | + | 32,311 |
| Total expenses | – | 13,528,760 |
| Net investment income | | 211,442 |
| Realized and Unrealized Gains (Losses) |
| Net realized gains on investments | | 177,849,324 |
| Net realized losses on foreign currency transactions | + | (899) |
| Net realized gains | | 177,848,425 |
| Net change in unrealized appreciation (depreciation) on investments | + | 266,025,112 |
| Net realized and unrealized gains | | 443,873,537 |
| Increase in net assets resulting from operations | | $444,084,979 |
| * | See financial note 11 for additional information. |
Laudus U.S. Large Cap Growth Fund | Annual Report
Laudus U.S. Large Cap Growth Fund
Statement of Changes in Net Assets
For the current and prior report periods
| Operations | |
| | 4/1/17-3/31/18 | 4/1/16-3/31/17 |
| Net investment income | | $211,442 | $535,085 |
| Net realized gains | | 177,848,425 | 167,376,920 |
| Net change in unrealized appreciation (depreciation) | + | 266,025,112 | 108,507,795 |
| Increase in net assets from operations | | 444,084,979 | 276,419,800 |
| Distributions to Shareholders | |
| Distributions from net realized gains | | ($223,214,604) | ($28,536,521) |
| Transactions in Fund Shares | | | |
| | | 4/1/17-3/31/18 | 4/1/16-3/31/17 |
| | | SHARES | VALUE | SHARES | VALUE |
| Shares sold | | 19,592,935 | $398,082,826 | 12,060,635 | $201,863,903 |
| Shares reinvested | | 9,937,601 | 190,503,813 | 1,481,964 | 24,659,880 |
| Shares redeemed | + | (26,119,021) | (523,466,983) | (46,461,188) | (776,516,242) |
| Net transactions in fund shares | | 3,411,515 | $65,119,656 | (32,918,589) | ($549,992,459) |
| Shares Outstanding and Net Assets | | | |
| | | 4/1/17-3/31/18 | 4/1/16-3/31/17 |
| | | SHARES | NET ASSETS | SHARES | NET ASSETS |
| Beginning of period | | 92,011,977 | $1,667,059,336 | 124,930,566 | $1,969,168,516 |
| Total increase or decrease | + | 3,411,515 | 285,990,031 | (32,918,589) | (302,109,180) |
| End of period | | 95,423,492 | $1,953,049,367 | 92,011,977 | $1,667,059,336 |
| Net investment loss | | | $— | | ($11,474) |
Laudus U.S. Large Cap Growth Fund | Annual Report
Laudus U.S. Large Cap Growth Fund
1. Business Structure of the Funds:
Laudus U.S. Large Cap Growth Fund is a series of Laudus Trust (the trust), a no-load, open-end management investment company. The trust is organized as a Massachusetts business trust and is registered under the Investment Company Act of 1940, as amended (the 1940 Act). The list below shows all the funds in the trust as of the end of the period, including the fund discussed in this report, which is highlighted:
| LAUDUS TRUST (ORGANIZED APRIL 1, 1988) |
| Laudus U.S. Large Cap Growth Fund | |
| Laudus Mondrian International Equity Fund | |
| Laudus Mondrian Emerging Markets Fund | |
| Laudus Mondrian International Government Fixed Income Fund | |
The Laudus U.S. Large Cap Growth Fund offers one share class. Shares are bought and sold at closing net asset value per share (NAV), which is the price for all outstanding shares of the fund.
The fund maintains its own account for purposes of holding assets and accounting, and is considered a separate entity for tax purposes. Within its account, the fund may also keep certain assets in segregated accounts, as required by securities law.
2. Significant Accounting Policies:
The following is a summary of the significant accounting policies the fund uses in its preparation of financial statements. The fund follows the investment company accounting and reporting guidance of the Financial Accounting Standards Board (FASB) Accounting Standard Codification Topic 946 Financial Services — Investment Companies. The accounting policies are in conformity with accounting principles generally accepted in the United States of America (GAAP).
The fund invests in certain other investment companies (underlying funds). For more information about the underlying funds’ operations and policies, please refer to those funds’ semiannual and annual reports, which are filed with the U.S. Securities and Exchange Commission (SEC).
Effective August 1, 2017, the fund adopted disclosure requirement changes for SEC Regulation S-X. The adopted changes are reflected throughout this report.
(a) Security Valuation:
Under procedures approved by the fund’s Board of Trustees (the Board), the investment adviser has formed a Pricing Committee to administer the pricing and valuation of portfolio securities and other assets and to ensure that prices used for internal purposes or provided by third parties reasonably reflect fair market value. Among other things, these procedures allow the fund to utilize independent pricing services, quotations from securities and financial instrument dealers and other market sources to determine fair value.
The fund values the securities in its portfolio every business day. The fund uses the following policies to value various types of securities:
• Securities traded on an exchange or over-the-counter: Traded securities are valued at the closing value for the day, or, on days when no closing value has been reported, at the mean of the most recent bid and ask quotes. Securities that are primarily traded on foreign exchanges are valued at the official closing price or the last sales price on the exchange where the securities are principally traded with these values then translated into U.S. dollars at the current exchange rate, unless these securities are fair valued as discussed below.
• Securities for which no quoted value is available: The Board has adopted procedures to fair value the fund’s securities when market prices are not “readily available” or are unreliable. For example, the fund may fair value a security when it is de-listed or its trading is halted or suspended; when a security’s primary pricing source is unable or unwilling to provide a price; or when a security’s primary trading market is closed during regular market hours. The fund makes fair value determinations in good faith in accordance with the fund’s valuation procedures. The Pricing Committee considers a number of factors, including unobservable market inputs when arriving at fair value. The Pricing Committee may employ techniques such as the review of related or comparable assets or liabilities, related market activities, recent transactions, market multiples, book values, transactional back-testing, disposition analysis and other relevant information. The Pricing Committee regularly reviews these inputs and assumptions to calibrate the valuations. Due to the subjective and variable nature of fair value pricing, there can be no assurance that the fund could obtain the fair value assigned to the security upon the sale of such security. The Board convenes on a regular basis to review fair value determinations made by the fund pursuant to the valuation procedures.
Laudus U.S. Large Cap Growth Fund | Annual Report
Laudus U.S. Large Cap Growth Fund
Financial Notes (continued)
2. Significant Accounting Policies (continued):
• Foreign equity security fair valuation: The Board has adopted procedures to fair value foreign equity securities that are traded in markets that close prior to the fund valuing its holdings. By fair valuing securities whose prices may have been affected by events occurring after the close of trading, the fund seeks to establish prices that investors might expect to realize upon the current sales of these securities. This methodology is designed to deter “arbitrage” market timers, who seek to exploit delays between the change in the value of the fund’s portfolio holdings and the NAV of the fund’s shares, and seeks to help ensure that the prices at which the fund’s shares are purchased and redeemed are fair and do not result in dilution of shareholder interest or other harm to shareholders. When fair value pricing is used at the open or close of a reporting period, it may cause a temporary divergence between the return of the fund and that of its comparative index or benchmark. The Board regularly reviews fair value determinations made by the fund pursuant to these procedures.
• Underlying funds: Mutual funds are valued at their respective NAVs.
In accordance with the authoritative guidance on fair value measurements and disclosures under GAAP, the fund discloses the fair value of its investments in a hierarchy that prioritizes the significant inputs to valuation techniques used to measure the fair value. The hierarchy gives the highest priority to valuations based upon unadjusted quoted prices in active markets for identical assets or liabilities (Level 1 measurements) and the lowest priority to valuations based upon unobservable inputs that are significant to the valuation (Level 3 measurements). If inputs used to measure the financial instruments fall within different levels of the hierarchy, the categorization is based on the lowest level input that is significant to the valuation. If the fund determines that either the volume and/or level of activity for an asset or liability has significantly decreased (from normal conditions for that asset or liability) or price quotations or observable inputs are not associated with orderly transactions, increased analysis and management judgment will be required to estimate fair value.
The three levels of the fair value hierarchy are as follows:
• Level 1—quoted prices in active markets for identical securities—Investments whose values are based on quoted market prices in active markets, and whose values are therefore classified as Level 1 prices, include active listed equities. Investments in mutual funds are valued daily at their NAVs, which are classified as Level 1 prices, without consideration to the classification level of the specific investments held by an underlying fund.
• Level 2—other significant observable inputs (including quoted prices for similar securities, interest rates, prepayment speeds, credit risk, etc.)—Investments that trade in markets that are not considered to be active, but whose values are based on quoted market prices, dealer quotations or valuations provided by alternative pricing sources supported by observable inputs are classified as Level 2 prices. These generally include U.S. government and sovereign obligations, most government agency securities, investment-grade corporate bonds, certain mortgage products, less liquid listed equities, and state, municipal and provincial obligations. In addition, international securities whose markets close hours before the fund values its holdings may require fair valuations due to significant movement in the U.S. markets occurring after the daily close of the foreign markets. The Board has approved a vendor that calculates fair valuations of international equity securities based on a number of factors that appear to correlate to the movements in the U.S. markets.
• Level 3—significant unobservable inputs (including the fund’s own assumptions in determining the fair value of investments)—Investments whose values are classified as Level 3 prices have significant unobservable inputs, as they may trade infrequently or not at all. When observable prices are not available for these securities, the fund uses one or more valuation techniques for which sufficient and reliable data is available. The inputs used by the fund in estimating the value of Level 3 prices may include the original transaction price, quoted prices for similar securities or assets in active markets, completed or pending third-party transactions in the underlying investment or comparable issuers, and changes in financial ratios or cash flows. Level 3 prices may also be adjusted to reflect illiquidity and/or non-transferability, with the amount of such discount estimated by the fund in the absence of market information. Assumptions used by the fund due to the lack of observable inputs may significantly impact the resulting fair value and therefore the fund’s results of operations.
The inputs or methodology used for valuing securities are not necessarily an indication of the risk associated with investing in those securities.
The levels associated with valuing the fund’s investments as of March 31, 2018 are disclosed in the Portfolio Holdings.
(b) Security Transactions:
Security transactions are recorded as of the date the order to buy or sell the security is executed. Realized gains and losses from security transactions are based on the identified costs of the securities involved.
Laudus U.S. Large Cap Growth Fund | Annual Report
Laudus U.S. Large Cap Growth Fund
Financial Notes (continued)
2. Significant Accounting Policies (continued):
Assets and liabilities denominated in foreign currencies are reported in U.S. dollars. For assets and liabilities held on a given date, the dollar value is based on market exchange rates in effect on that date. Transactions involving foreign currencies, including purchases, sales, income receipts and expense payments, are calculated using exchange rates in effect on the transaction date. Realized foreign exchange gains or losses arise from sales of foreign currencies, currency gains or losses realized between the trade and settlement dates on securities transactions and the differences between the recorded amounts of dividends, interest, and foreign withholding taxes and the U.S. dollar equivalent of the amounts actually received or paid. Net unrealized foreign exchange appreciation or depreciation arises from changes in foreign exchange rates on foreign denominated assets and liabilities other than investments in securities held at the end of the reporting period. These realized and unrealized foreign exchange gains or losses are reported in foreign currency transactions or translations on the Statement of Operations. The fund does not isolate the portion of the fluctuations on investments resulting from changes in foreign currency exchange rates from the fluctuations in market prices of investments held. Such fluctuations are included with the net realized and unrealized gain or loss from investments.
Gains realized by the fund on the sale of securities in certain foreign countries may be subject to non-U.S. taxes. In those instances, the fund records a liability based on unrealized appreciation to provide for potential non-U.S. taxes payable upon the sale of these securities.
(c) Investment Income:
Interest income is recorded as it accrues. Dividends and distributions from portfolio securities and underlying funds are recorded on the date they are effective (the ex-dividend date), although the fund records certain foreign security dividends on the day it learns of the ex-dividend date. Any distributions from underlying funds are recorded in accordance with the character of the distributions as designated by the underlying funds.
Income received from foreign sources may result in withholding tax. Withholding taxes are accrued at the same time as the related income if the tax rate is fixed and known, unless a tax withheld is reclaimable from the local tax authorities in which case it is recorded as receivable. If the tax rate is not known or estimable, such expense or reclaim receivable is recorded when the net proceeds are received.
(d) Expenses:
Expenses that are specific to the fund are charged directly to the fund. Expenses that are common to all funds within the trust generally are allocated among the funds in proportion to their average daily net assets.
(e) Distributions to Shareholders:
The fund makes distributions from net investment income and net realized capital gains, if any, once a year.
(f) Custody Credit:
The fund has an arrangement with its custodian bank, State Street Bank and Trust Company (State Street), under which the fund may receive a credit for its uninvested cash balance to offset its custody fees and accounting fees. The credit amounts, if any, are disclosed in the Statement of Operations as a reduction to the fund’s operating expenses.
(g) Accounting Estimates:
The accounting policies described in this report conform to GAAP. Notwithstanding this, shareholders should understand that in order to follow these principles, fund management has to make estimates and assumptions that affect the information reported in the financial statements. It’s possible that once the results are known, they may turn out to be different from these estimates and these differences may be material.
(h) Federal Income Taxes:
The fund intends to meet federal income and excise tax requirements for regulated investment companies under subchapter M of the Internal Revenue Code, as amended. Accordingly, the fund distributes substantially all of its net investment income and net realized capital gains, if any, to its respective shareholders each year. As long as the fund meets the tax requirements, it is not required to pay federal income tax.
Laudus U.S. Large Cap Growth Fund | Annual Report
Laudus U.S. Large Cap Growth Fund
Financial Notes (continued)
2. Significant Accounting Policies (continued):
(i) Foreign Taxes:
The fund may be subject to foreign taxes (a portion of which may be reclaimable) on income, corporate events, foreign currency exchanges and capital gains on investments. All foreign taxes are recorded in accordance with the applicable foreign tax regulations and rates that exist in foreign markets in which the fund invests. These foreign taxes, if any, are paid by the fund and are disclosed in the Statement of Operations. Foreign taxes payable as of March 31, 2018, if any, are reflected in the fund’s Statement of Assets and Liabilities.
(j) Indemnification:
Under the fund’s organizational documents, the officers and trustees are indemnified against certain liabilities arising out of the performance of their duties to the fund. In addition, in the normal course of business the fund enters into contracts with its vendors and others that provide general indemnifications. The fund’s maximum exposure under these arrangements is unknown as this would involve future claims that may be made against the fund. However, based on experience, the fund expects the risk of loss attributable to these arrangements to be remote.
3. Risk Factors:
Investing in the fund may involve certain risks, as described in the fund’s prospectus, including, but not limited to, those described below. Any of these risks could cause an investor to lose money.
• Market Risk. Financial markets rise and fall in response to a variety of factors, sometimes rapidly and unpredictably. As with any investment whose performance is tied to these markets, the value of an investment in the fund will fluctuate, which means that an investor could lose money over short or long periods.
• Management Risk. As with all actively managed funds, the fund is subject to the risk that its subadviser will select investments or allocate assets in a manner that could cause the fund to underperform or otherwise not meet its objective. The fund’s subadviser applies its own investment techniques and risk analyses in making investment decisions for the fund, but there can be no guarantee that they will produce the desired results.
• Equity Risk. The prices of equity securities rise and fall daily. These price movements may result from factors affecting individual companies, industries or the securities market as a whole. In addition, equity markets tend to move in cycles, which may cause stock prices to fall over short or extended periods of time.
• Market Capitalization Risk. Securities issued by companies of different market capitalizations tend to go in and out of favor based on market and economic conditions. During a period when securities of a particular market capitalization fall behind other types of investments, the fund’s performance could be impacted.
• Large-Cap Company Risk. Large-cap companies are generally more mature and the securities issued by these companies may not be able to reach the same levels of growth as the securities issued by small- or mid-cap companies.
• Growth Investing Risk. Growth stocks can be volatile. Growth companies usually invest a high portion of earnings in their businesses and may lack the dividends of value stocks that can cushion stock prices in a falling market. The prices of growth stocks are based largely on projections of the issuer’s future earnings and revenues. If a company’s earnings or revenues fall short of expectations, its stock price may fall dramatically. Growth stocks may also be more expensive relative to their earnings or assets compared to value or other stocks.
• Foreign Investment Risk. The fund’s investments in securities of foreign issuers involve certain risks that may be greater than those associated with investments in securities of U.S. issuers. These include risks of adverse changes in foreign economic, political, regulatory and other conditions; changes in currency exchange rates or exchange control regulations (including limitations on currency movements and exchanges); the imposition of economic sanctions or other government restrictions; differing accounting, auditing, financial reporting and legal standards and practices; differing securities market structures; and higher transaction costs. These risks may negatively impact the value or liquidity of the fund’s investments, and could impair the fund’s ability to meet its investment objective or invest in accordance with its investment strategy. There is a risk that investments in securities denominated in, and/or receiving revenues in, foreign currencies will decline in value relative to the U.S. dollar or, in the case of hedging positions, that the U.S. dollar will decline in value relative to the currency hedged, resulting in the dollar value of the fund’s investment being adversely affected. Foreign securities also include American Depositary receipts (ADRs), Global Depositary receipts (GDRs) and European Depositary receipts (EDRs) which may be less
Laudus U.S. Large Cap Growth Fund | Annual Report
Laudus U.S. Large Cap Growth Fund
Financial Notes (continued)
3. Risk Factors (continued):
liquid than the underlying shares in their primary trading market and GDRs, many of which are issued by companies in emerging markets, may be more volatile. These risks may be heightened in connection with investments in emerging markets or securities of issuers that conduct their business in emerging markets.
• Derivatives Risk. The fund’s use of derivative instruments involves risks different from, or possibly greater than, the risks associated with investing directly in securities and other traditional investments. The fund’s use of derivatives could reduce the fund’s performance, increase the fund’s volatility, and could cause the fund to lose more than the initial amount invested. In addition, investments in derivatives may involve leverage, which means a small percentage of assets invested in derivatives can have a disproportionately large impact on the fund.
• Leverage Risk. Certain fund transactions, such as derivatives, may give rise to a form of leverage and may expose the fund to greater risk. Leverage tends to magnify the effect of any increase or decrease in the value of the fund’s portfolio securities, which means even a small amount of leverage can have a disproportionately large impact on the fund.
• Liquidity Risk. The fund may be unable to sell certain securities, such as illiquid securities, readily at a favorable time or price, or the fund may have to sell them at a loss.
Please refer to the fund’s prospectus for a more complete description of the principal risks of investing in the fund.
4. Affiliates and Affiliated Transactions:
Investment Adviser
Charles Schwab Investment Management, Inc. (CSIM or the investment adviser), a wholly owned subsidiary of The Charles Schwab Corporation, serves as the fund’s investment adviser pursuant to an Investment Advisory Agreement (Advisory Agreement) between CSIM and the trust. BlackRock Investment Management, LLC (BlackRock), the fund’s subadviser, provides day-to-day portfolio management services to the fund, subject to the supervision of CSIM.
For its advisory services to the fund, CSIM is entitled to receive an annual fee, payable monthly, based on a percentage of the fund’s average daily net assets described as follows:
| Average daily net assets | |
| First $500 million | 0.700% |
| $500 million to $1 billion | 0.650% |
| $1 billion to $1.5 billion | 0.600% |
| $1.5 billion to $2 billion | 0.575% |
| Over $2 billion | 0.550% |
For the period ended March 31, 2018, the aggregate net advisory fee paid to CSIM was 0.64% for the fund, as a percentage of the fund’s average daily net assets.
CSIM (not the fund) pays a portion of the advisory fees it receives to BlackRock in return for its services.
Expense Limitation
CSIM has contractually agreed, until at least July 30, 2019, to limit the total annual fund operating expenses charged, excluding interest, taxes and certain non-routine expenses of the fund to 0.77%.
Laudus U.S. Large Cap Growth Fund | Annual Report
Laudus U.S. Large Cap Growth Fund
Financial Notes (continued)
4. Affiliates and Affiliated Transactions (continued):
Investments from Affiliates
Certain Schwab funds may own shares of other Schwab funds. The table below reflects the percentage of shares of the fund that are owned by other Schwab funds as of March 31, 2018:
| Schwab Target 2020 Fund | 0.1% |
| Schwab Target 2025 Fund | 0.4% |
| Schwab Target 2030 Fund | 1.3% |
| Schwab Target 2035 Fund | 0.9% |
| Schwab Target 2040 Fund | 2.7% |
| Schwab Target 2045 Fund | 0.4% |
| Schwab Target 2050 Fund | 0.4% |
| Schwab Target 2055 Fund | 0.3% |
| Schwab Target 2060 Fund | 0.0%* |
| Schwab Balanced Fund | 3.1% |
5. Shareholders Services:
The trustees have authorized the fund to reimburse, out of the assets of the fund, financial intermediaries that provide sub-accounting and sub-transfer agency services in connection with the fund’s shares in an amount of up to 0.10% of the average daily net assets of the fund on an annual basis.
6. Board of Trustees:
The trust’s Board oversees the general conduct of the trust and the fund.
The Board may include people who are officers and/or directors of CSIM or its affiliates. Federal securities law limits the percentage of such “interested persons” who may serve on a trust’s board, and the trust was in compliance with these limitations throughout the report period. The trust did not pay any of these interested persons for their services as trustees, but it did pay non-interested persons (independent trustees), as noted in the fund’s Statement of Operations. For information regarding the trustees, please refer to Trustees and Officers table at the end of this report.
7. Borrowing from Banks:
During the period, the fund was a participant with other U.S. registered investment companies managed by CSIM in a joint, syndicated, committed $555 million line of credit (the Syndicated Credit Facility), which matured on October 5, 2017. On October 5, 2017, the Syndicated Credit Facility was amended with an increased line of $605 million to run for a new 364 day period, maturing on October 4, 2018. Under the terms of the Syndicated Credit Facility, in addition to the interest charged on any borrowings by the fund, the fund paid a commitment fee of 0.15% per annum on its proportionate share of the unused portion of the Syndicated Credit Facility.
Effective December 1, 2017, the fund is a participant with other U.S. registered investment companies managed by CSIM in a joint, unsecured, uncommitted $500 million line of credit (the Uncommitted Credit Facility), with State Street Bank and Trust Company, which matures on November 30, 2018. Under the terms of the Uncommitted Credit Facility, the fund pays interest on the amount it borrows. There were no borrowings from either line of credit during the period.
The fund also has access to custodian overdraft facilities. The fund may have utilized the overdraft facility and incurred an interest expense, which is disclosed on the fund’s Statement of Operations, if any. The interest expense is determined based on a negotiated rate above the current Federal Funds Rate.
Laudus U.S. Large Cap Growth Fund | Annual Report
Laudus U.S. Large Cap Growth Fund
Financial Notes (continued)
8. Purchases and Sales of Investment Securities:
For the period ended March 31, 2018, purchases and sales of securities (excluding short-term obligations) were as follows:
Purchases
of Securities | Sales
of Securities |
| $866,199,255 | $1,061,634,102 |
9. Redemption Fee:
Prior to February 28, 2017, the fund charged a 2.00% redemption fee on shares sold or exchanged within 30 days of the original purchase date. Such amounts are netted against redemption proceeds on the Statement of Changes in Net Assets. The redemption fees charged during the period 4/1/16 to 3/31/17 were $25,896.
10. Federal Income Taxes:
As of March 31, 2018, the tax basis cost of the fund’s investments and gross unrealized appreciation and depreciation were as follows:
| Tax cost | $1,306,396,959 |
| Gross unrealized appreciation | $664,763,844 |
| Gross unrealized depreciation | (17,067,933) |
| Net unrealized appreciation (depreciation) | $647,695,911 |
As of March 31, 2018, the components of distributable earnings on a tax basis were as follows:
| Undistributed ordinary income | $12,608,062 |
| Undistributed long-term capital gains | 72,179,122 |
| Net unrealized appreciation (depreciation) on investments | 647,695,911 |
| Total | $732,483,095 |
The primary difference between book basis and tax basis unrealized appreciation or unrealized depreciation of investments is the tax deferral of losses on wash sales. The tax cost of the fund’s investments, disclosed above, have been adjusted from its book amounts to reflect these unrealized appreciation or depreciation differences, as applicable.
Capital loss carryforwards may be used to offset future realized capital gains for federal income tax purposes. As of March 31, 2018, the fund had no capital loss carryforwards.
For tax purposes, net realized capital losses and late-year ordinary losses incurred after October 31 may be deferred and treated as occurring on the first day of the following fiscal year. For the year ended March 31, 2018, the fund had no capital losses or late-year ordinary losses deferred.
The tax basis components of distributions paid during the current and prior fiscal years were:
| Current period distributions | |
| Ordinary income | $17,834,505 |
| Long-term capital gains | 205,380,099 |
| Prior period distributions | |
| Ordinary income | $— |
| Long-term capital gains | 28,536,521 |
Distributions paid to shareholders are based on net investment income and net realized gains determined on a tax basis, which may differ from net investment income and net realized gains for financial reporting purposes. These differences reflect the differing character of certain income items and net realized gains and losses for financial statement and tax purposes, and may result in reclassification among certain capital accounts on the financial statements.
Laudus U.S. Large Cap Growth Fund | Annual Report
Laudus U.S. Large Cap Growth Fund
Financial Notes (continued)
10. Federal Income Taxes (continued):
Permanent book and tax basis differences may result in reclassifications between components of net assets as required. The adjustments will have no impact on net assets or the results of operations. As of March 31, 2018, the fund made the following reclassifications:
| Capital shares | $— |
| Undistributed net investment income | (199,968) |
| Net realized capital gains (losses) | 199,968 |
As of March 31, 2018, management has reviewed the tax positions for open periods (for federal purposes, three years from the date of filing and for state purposes, four years from the date of filing) as applicable to the fund, and has determined that no provision for income tax is required in the fund’s financial statements. The fund recognizes interest and penalties, if any, related to unrecognized tax benefits as income tax expense in the Statement of Operations. During the period ended March 31, 2018, the fund did not incur any interest or penalties.
11. Custody Out-of-Pocket Fee Reimbursement:
In December 2015, State Street, the fund’s custodian, identified inconsistencies in the way in which clients were invoiced for categories of expenses, particularly those deemed out-of-pocket costs, during an 18-year period going back to 1998. The issue was the result of inaccurate billing rates that were not subsequently reviewed or adjusted. The amount of the difference in what was charged and what should have been charged, plus interest, was paid to the fund during the period ended March 31, 2018 as a reimbursement. The amount applied to the fund was recognized as a change in accounting estimate. This resulted in a decrease in Net expenses and an overall increase in Net assets. This payment is presented in the fund’s Statement of Operations as Custody out-of-pocket fee reimbursement.
12. Subsequent Events:
Management has determined there are no subsequent events or transactions through the date the financial statements were issued that would have materially impacted the financial statements as presented.
Laudus U.S. Large Cap Growth Fund | Annual Report
Laudus U.S. Large Cap Growth Fund
Report of Independent Registered Public Accounting Firm
To the Board of Trustees of Laudus Trust and Shareholders of Laudus U.S. Large Cap Growth Fund
Opinion on the Financial Statements
We have audited the accompanying statement of assets and liabilities, including the portfolio holdings, of Laudus U.S. Large Cap Growth Fund (one of the funds constituting Laudus Trust, referred to hereafter to as the “Fund”) as of March 31, 2018, the related statement of operations for the year ended March 31, 2018, the statement of changes in net assets for each of the two years in the period ended March 31, 2018, including the related notes, and the financial highlights for each of the five years in the period ended March 31, 2018 (collectively referred to as the “financial statements”). In our opinion, the financial statements present fairly, in all material respects, the financial position of the Fund as of March 31, 2018, the results of its operations for the year then ended, the changes in its net assets for each of the two years in the period ended March 31, 2018 and the financial highlights for each of the five years in the period ended March 31, 2018 in conformity with accounting principles generally accepted in the United States of America.
Basis for Opinion
These financial statements are the responsibility of the Fund’s management. Our responsibility is to express an opinion on the Fund’s financial statements based on our audits. We are a public accounting firm registered with the Public Company Accounting Oversight Board (United States) (“PCAOB”) and are required to be independent with respect to the Fund in accordance with the U.S. federal securities laws and the applicable rules and regulations of the Securities and Exchange Commission and the PCAOB.
We conducted our audits of these financial statements in accordance with the standards of the PCAOB. Those standards require that we plan and perform the audit to obtain reasonable assurance about whether the financial statements are free of material misstatement, whether due to error or fraud.
Our audits included performing procedures to assess the risks of material misstatement of the financial statements, whether due to error or fraud, and performing procedures that respond to those risks. Such procedures included examining, on a test basis, evidence regarding the amounts and disclosures in the financial statements. Our audits also included evaluating the accounting principles used and significant estimates made by management, as well as evaluating the overall presentation of the financial statements. Our procedures included confirmation of securities owned as of March 31, 2018 by correspondence with the custodian and brokers; when replies were not received from brokers, we performed other auditing procedures. We believe that our audits provide a reasonable basis for our opinion.
PricewaterhouseCoopers LLP
San Francisco, California
May 17, 2018
We have served as the auditor of one or more investment companies in the Schwab Funds Complex since 1989.
Laudus U.S. Large Cap Growth Fund | Annual Report
Laudus U.S. Large Cap Growth Fund
Other Federal Tax Information (unaudited)
For corporate shareholders, 49.50% of the fund dividends distributions paid during the fiscal year ended March 31, 2018, qualify for the corporate dividends received deduction.
For the fiscal year ended March 31, 2018, the fund designates $9,307,842 of the dividend distributions as qualified dividends for the purpose of the maximum rate under section 1(h)(11) of the Internal Revenue Code. Shareholders will be notified in January 2019 via IRS Form 1099 of the amounts for use in preparing their 2018 income tax return.
Under section 852(b)(3)(C) of the Internal Revenue Code, the fund hereby designates $205,380,099 as long-term capital gain dividends for the fiscal year ended March 31, 2018.
Laudus U.S. Large Cap Growth Fund | Annual Report
Laudus U.S. Large Cap Growth Fund
Approval of Amendment to Sub-Advisory Agreement
The Investment Company Act of 1940 (the 1940 Act) requires that initial approval of, as well as the continuation of, a fund’s investment advisory agreements be specifically approved (1) by the vote of the trustees or by a vote of the shareholders of the fund, and (2) by the vote of a majority of the trustees who are not parties to the investment advisory agreements or “interested persons” of any party (the Independent Trustees), cast in person at a meeting called for the purpose of voting on such approval. In connection with such approvals, the fund’s trustees must request and evaluate, and the investment adviser is required to furnish, such information as may be reasonably necessary to evaluate the terms of the investment advisory agreements.
At a meeting held on February 27, 2018, the Board, including a majority of the Independent Trustees, considered information specifically relating to its consideration of the approval of an amendment (Amendment) to the sub-advisory agreement between Charles Schwab Investment Management, Inc. (CSIM) and BlackRock Investment Management, LLC (BlackRock), the sub-adviser to Laudus U.S. Large Cap Growth Fund (Fund) (the BlackRock Sub-Advisory Agreement). The purpose of the Amendment was to reflect a reduction in the fees paid to
BlackRock by CSIM. The Board reviewed the materials provided relating to the Amendment and also took into account the extensive information that it reviewed and the conclusions it reached at its April 19, 2017 and June 6, 2017 meetings, in connection with its annual consideration and approval of the continuation of the BlackRock Sub-Advisory Agreement. Because the Board had conducted a full review of the BlackRock Sub-Advisory Agreement at its April 19, 2017 and June 6, 2017 meetings, and intends to conduct another such review at its April 26, 2018 and June 5, 2018 meetings, it limited its discussions at the February 27, 2018 meeting primarily to the proposed change to the agreement.
Based on the Trustees’ deliberation and their evaluation of the information described above, the Board, including a majority of the Independent Trustees, approved the Amendment to the BlackRock Sub-Advisory Agreement effective March 1, 2018 and concluded that the compensation payable by CSIM to BlackRock is fair and reasonable in light of the services BlackRock renders to the Fund and such other matters as the Trustees considered to be relevant in the exercise of their reasonable judgment.
Laudus U.S. Large Cap Growth Fund | Annual Report
Laudus U.S. Large Cap Growth Fund
Trustees and Officers
The tables below give information about the trustees and officers of Laudus Trust, which includes the fund covered in this report. The “Fund Complex” includes The Charles Schwab Family of Funds, Schwab Capital Trust, Schwab Investments, Schwab Annuity Portfolios, Schwab Strategic Trust and Laudus Trust. The Fund Complex includes 108 funds.
The address for all trustees and officers is 211 Main Street, San Francisco, CA 94105. You can find more information about the trustees and officers in the Statement of Additional Information, which is available free by calling 1-877-824-5615.
| Independent Trustees |
Name, Year of Birth, and
Position(s) with the trust
(Terms of office, and
length of Time Served1) | Principal Occupations
During the Past Five Years | Number of
Portfolios in
Fund Complex
Overseen by
the Trustee | Other Directorships |
Robert W. Burns
1959
Trustee
(Trustee of Schwab Strategic Trust since 2009; The Charles Schwab Family of Funds, Schwab Investments, Schwab Capital Trust, Schwab Annuity Portfolios and Laudus Trust since 2016) | Retired/Private Investor (Jan. 2009 – present). Formerly, Managing Director, Pacific Investment Management Company, LLC (PIMCO) (investment management firm) and President, PIMCO Funds. | 108 | Director, PS Business Parks, Inc. (2005 – 2012) |
John F. Cogan
1947
Trustee
(Trustee of The Charles Schwab Family of Funds, Schwab Investments, Schwab Capital Trust and Schwab Annuity Portfolios since 2008; Laudus Trust since 2010; Schwab Strategic Trust since 2016) | Senior Fellow, The Hoover Institution at Stanford University (public policy think tank) (Oct. 1979 – present); Senior Fellow, Stanford Institute for Economic Policy Research (2000 – present); Professor of Public Policy, Stanford University (1994 – 2015). | 108 | Director, Gilead Sciences, Inc. (2005 – present) |
Stephen Timothy Kochis
1946
Trustee
(Trustee of Schwab Strategic Trust since 2012; The Charles Schwab Family of Funds, Schwab Investments, Schwab Capital Trust, Schwab Annuity Portfolios and Laudus Trust since 2016) | CEO and Owner, Kochis Global (wealth management consulting) (May 2012 – present); Chairman and CEO, Aspiriant, LLC (wealth management) (Jan. 2008 – Apr. 2012). | 108 | None |
David L. Mahoney
1954
Trustee
(Trustee of The Charles Schwab Family of Funds, Schwab Investments, Schwab Capital Trust, Schwab Annuity Portfolios and Laudus Trust since 2011; Schwab Strategic Trust since 2016) | Private Investor. | 108 | Director, Symantec Corporation (2003 – present)
Director, Corcept Therapeutics Incorporated (2004 – present)
Director, Adamas Pharmaceuticals, Inc. (2009 – present) |
Laudus U.S. Large Cap Growth Fund | Annual Report
Laudus U.S. Large Cap Growth Fund
| Independent Trustees (continued) |
Name, Year of Birth, and
Position(s) with the trust
(Terms of office, and
length of Time Served1) | Principal Occupations
During the Past Five Years | Number of
Portfolios in
Fund Complex
Overseen by
the Trustee | Other Directorships |
Kiran M. Patel
1948
Trustee
(Trustee of The Charles Schwab Family of Funds, Schwab Investments, Schwab Capital Trust, Schwab Annuity Portfolios and Laudus Trust since 2011; Schwab Strategic Trust since 2016) | Retired. Executive Vice President and General Manager of Small Business Group, Intuit, Inc. (financial software and services firm for consumers and small businesses) (Dec. 2008 – Sept. 2013). | 108 | Director, KLA-Tencor Corporation (2008 – present) |
Kimberly S. Patmore
1956
Trustee
(Trustee of The Charles Schwab Family of Funds, Schwab Investments, Schwab Capital Trust, Schwab Annuity Portfolios, Schwab Strategic Trust and Laudus Trust since 2016) | Consultant, Patmore Management Consulting (management consulting) (2008 – present). | 108 | None |
Charles A. Ruffel
1956
Trustee
(Trustee of Schwab Strategic Trust since 2009; The Charles Schwab Family of Funds, Schwab Investments, Schwab Capital Trust, Schwab Annuity Portfolios and Laudus Trust since 2015) | Co-Chief Executive Officer, Kudu Investment Management, LLC (financial services) (Jan. 2015 – present); Partner, Kudu Advisors, LLC (financial services) (June 2008 – Jan. 2015); Advisor, Asset International, Inc. (publisher of financial services information) (Aug. 2008 – Jan. 2015). | 108 | None |
Gerald B. Smith
1950
Trustee
(Trustee of The Charles Schwab Family of Funds, Schwab Investments, Schwab Capital Trust and Schwab Annuity Portfolios since 2000; Laudus Trust since 2010; Schwab Strategic Trust since 2016) | Chairman, Chief Executive Officer and Founder of Smith Graham & Co. (investment advisors) (Mar. 1990 – present). | 108 | Director, Eaton (2012 – present)
Director and Chairman of the Audit Committee, Oneok Partners LP (2003 – 2013)
Director, Oneok, Inc. (2009 – 2013)
Lead Independent Director, Board of Cooper Industries (2002 – 2012) |
Joseph H. Wender
1944
Trustee
(Trustee of The Charles Schwab Family of Funds, Schwab Investments, Schwab Capital Trust and Schwab Annuity Portfolios since 2008; Laudus Trust since 2010; Schwab Strategic Trust since 2016) | Senior Consultant, Goldman Sachs & Co., Inc. (investment banking and securities firm) (Jan. 2008 – present); Co-CEO, Colgin Cellars, LLC (vineyards) (Feb. 1998 – present). | 108 | Board Member and Chairman of the Audit Committee, Ionis Pharmaceuticals (1994 – present)
Lead Independent Director and Chair of Audit Committee, OUTFRONT Media Inc. (2014 – present) |
Laudus U.S. Large Cap Growth Fund | Annual Report
Laudus U.S. Large Cap Growth Fund
| Interested Trustees |
Name, Year of Birth, and
Position(s) with the trust
(Terms of office, and
length of Time Served1) | Principal Occupations
During the Past Five Years | Number of
Portfolios in
Fund Complex
Overseen by
the Trustee | Other Directorships |
Walter W. Bettinger II2
1960
Chairman and Trustee
(Trustee of The Charles Schwab Family of Funds, Schwab Investments, Schwab Capital Trust and Schwab Annuity Portfolios since 2008; Schwab Strategic Trust since 2009; Laudus Trust since 2010) | Director, President and Chief Executive Officer, The Charles Schwab Corporation (Oct. 2008 – present); President and Chief Executive Officer (Oct. 2008 – present), Director (May 2008 – present), Charles Schwab & Co., Inc.; Director, Charles Schwab Bank (Apr. 2006 – present); Director (May 2008 – present), President and Chief Executive Officer (Aug. 2017 – present), Schwab Holdings, Inc.; and Director, Charles Schwab Investment Management, Inc. (July 2016 – present). | 108 | Director, The Charles Schwab Corporation (2008 – present) |
Marie A. Chandoha2
1961
Trustee
(Trustee of The Charles Schwab Family of Funds, Schwab Investments, Schwab Capital Trust, Schwab Annuity Portfolios, Schwab Strategic Trust and Laudus Trust since 2016) | Director, President and Chief Executive Officer (Dec. 2010 – present), Chief Investment Officer (Sept. 2010 – Oct. 2011), Charles Schwab Investment Management, Inc.; Trustee (Jan. 2016 – present), President, Chief Executive Officer (Dec. 2010 – present), and Chief Investment Officer (Sept. 2010 – Oct. 2011), Schwab Funds, Laudus Funds and Schwab ETFs; Director, Charles Schwab Worldwide Funds plc and Charles Schwab Asset Management (Ireland) Limited (Jan. 2011 – present); Global Head of Fixed Income Business Division, BlackRock, Inc. (formerly Barclays Global Investors) (investment management firm) (Mar. 2007 – Aug. 2010). | 108 | None |
Joseph R. Martinetto2
1962
Trustee
(Trustee of The Charles Schwab Family of Funds, Schwab Investments, Schwab Capital Trust, Schwab Annuity Portfolios, Schwab Strategic Trust and Laudus Trust since 2016) | Chief Operating Officer (Feb. 2018 – present), Senior Executive Vice President (July 2015 – Feb. 2018), The Charles Schwab Corporation; Senior Executive Vice President, Charles Schwab & Co., Inc. (July 2015 – present); Chief Financial Officer (July 2015 – Aug. 2017), Executive Vice President and Chief Financial Officer (May 2007 – July 2015), The Charles Schwab Corporation and Charles Schwab & Co., Inc.; Director, Charles Schwab & Co., Inc. (May 2007 – present); Director (Apr. 2010 – present) and Chief Executive Officer (July 2013 – Apr. 2015), Charles Schwab Bank; Director (May 2007 – present), Chief Financial Officer (May 2007 – Aug. 2017), Senior Executive Vice President (Feb. 2016 – present), and Executive Vice President (May 2007 – Feb. 2016), Schwab Holdings, Inc. | 108 | None |
| Officers of the Trust |
Name, Year of Birth, and Position(s) with the trust
(Terms of office, and length of Time Served3) | Principal Occupations During the Past Five Years |
Marie A. Chandoha
1961
President and Chief Executive Officer
(Officer of The Charles Schwab Family of Funds, Schwab Investments, Schwab Capital Trust, Schwab Annuity Portfolios, Schwab Strategic Trust and Laudus Trust since 2010) | Director, President and Chief Executive Officer (Dec. 2010 – present), Chief Investment Officer (Sept. 2010 – Oct. 2011), Charles Schwab Investment Management, Inc.; Trustee (Jan. 2016 – present), President, Chief Executive Officer (Dec. 2010 – present), and Chief Investment Officer (Sept. 2010 – Oct. 2011), Schwab Funds, Laudus Funds and Schwab ETFs; Director, Charles Schwab Worldwide Funds plc and Charles Schwab Asset Management (Ireland) Limited (Jan. 2011 – present); Global Head of Fixed Income Business Division, BlackRock, Inc. (formerly Barclays Global Investors) (investment management firm) (Mar. 2007 – Aug. 2010). |
Laudus U.S. Large Cap Growth Fund | Annual Report
Laudus U.S. Large Cap Growth Fund
| Officers of the Trust (continued) |
Name, Year of Birth, and Position(s) with the trust
(Terms of office, and length of Time Served3) | Principal Occupations During the Past Five Years |
Mark Fischer
1970
Treasurer and Chief Financial Officer
(Officer of The Charles Schwab Family of Funds, Schwab Investments, Schwab Capital Trust, Schwab Annuity Portfolios, Schwab Strategic Trust and Laudus Trust since 2013) | Treasurer and Chief Financial Officer, Schwab Funds, Laudus Funds and Schwab ETFs (Jan. 2016 – present); Assistant Treasurer, Schwab Funds and Laudus Funds (Dec. 2013 – Dec. 2015), Schwab ETFs (Nov. 2013 – Dec. 2015); Vice President, Charles Schwab Investment Management, Inc. (Oct. 2013 – present); Executive Director, J.P. Morgan Investor Services (Apr. 2011 – Sept. 2013); Assistant Treasurer, Massachusetts Financial Service Investment Management (May 2005 – Mar. 2011). |
George Pereira
1964
Senior Vice President and Chief Operating Officer
(Officer of The Charles Schwab Family of Funds, Schwab Investments, Schwab Capital Trust and Schwab Annuity Portfolios since 2004; Laudus Trust since 2006; Schwab Strategic Trust since 2009) | Senior Vice President and Chief Financial Officer (Nov. 2004 – present), Chief Operating Officer (Jan. 2011 – present), Charles Schwab Investment Management, Inc.; Senior Vice President and Chief Operating Officer (Jan. 2016 – present), Treasurer and Chief Financial Officer, Laudus Funds (June 2006 – Dec. 2015); Treasurer and Principal Financial Officer, Schwab Funds (Nov. 2004 – Dec. 2015) and Schwab ETFs (Oct. 2009 – Dec. 2015); Director, Charles Schwab Worldwide Funds plc and Charles Schwab Asset Management (Ireland) Limited (Apr. 2005 – present). |
Omar Aguilar
1970
Senior Vice President and Chief Investment Officer – Equities and Multi-Asset Strategies
(Officer of The Charles Schwab Family of Funds, Schwab Investments, Schwab Capital Trust, Schwab Annuity Portfolios, Schwab Strategic Trust and Laudus Trust since 2011) | Senior Vice President and Chief Investment Officer – Equities and Multi-Asset Strategies, Charles Schwab Investment Management, Inc. (Apr. 2011 – present); Senior Vice President and Chief Investment Officer – Equities, Schwab Funds, Laudus Funds and Schwab ETFs (June 2011 – present); Head of the Portfolio Management Group and Vice President of Portfolio Management, Financial Engines, Inc. (investment management firm) (May 2009 – Apr. 2011); Head of Quantitative Equity, ING Investment Management (July 2004 – Jan. 2009). |
Brett Wander
1961
Senior Vice President and Chief Investment Officer – Fixed Income
(Officer of The Charles Schwab Family of Funds, Schwab Investments, Schwab Capital Trust, Schwab Annuity Portfolios, Schwab Strategic Trust and Laudus Trust since 2011) | Senior Vice President and Chief Investment Officer – Fixed Income, Charles Schwab Investment Management, Inc. (Apr. 2011 – present); Senior Vice President and Chief Investment Officer – Fixed Income, Schwab Funds, Laudus Funds and Schwab ETFs (June 2011 – present); Senior Managing Director, Global Head of Active Fixed-Income Strategies, State Street Global Advisors (Jan. 2008 – Oct. 2010); Director of Alpha Strategies Loomis, Sayles & Company (investment management firm) (Apr. 2006 – Jan. 2008). |
David Lekich
1964
Chief Legal Officer and Secretary, Schwab Funds and Schwab ETFs
Vice President and Assistant Clerk, Laudus Funds
(Officer of The Charles Schwab Family of Funds, Schwab Investments, Schwab Capital Trust, Schwab Annuity Portfolios, Schwab Strategic Trust and Laudus Trust since 2011) | Senior Vice President (Sept. 2011 – present), Vice President (Mar. 2004 – Sept. 2011), Charles Schwab & Co., Inc.; Senior Vice President and Chief Counsel (Sept. 2011 – present), Vice President (Jan. 2011 – Sept. 2011), Charles Schwab Investment Management, Inc.; Secretary (Apr. 2011 – present) and Chief Legal Officer (Dec. 2011 – present), Schwab Funds; Vice President and Assistant Clerk, Laudus Funds (Apr. 2011 – present); Secretary (May 2011 – present) and Chief Legal Officer (Nov. 2011 – present), Schwab ETFs. |
Catherine MacGregor
1964
Vice President and Assistant Secretary, Schwab Funds and Schwab ETFs
Chief Legal Officer, Vice President and Clerk, Laudus Funds
(Officer of The Charles Schwab Family of Funds, Schwab Investments, Schwab Capital Trust, Schwab Annuity Portfolios and Laudus Trust since 2005; Schwab Strategic Trust since 2009) | Vice President, Charles Schwab & Co., Inc., Charles Schwab Investment Management, Inc. (July 2005 – present); Vice President (Dec. 2005 – present), Chief Legal Officer and Clerk (Mar. 2007 – present), Laudus Funds; Vice President (Nov. 2005 – present) and Assistant Secretary (June 2007 – present), Schwab Funds; Vice President and Assistant Secretary, Schwab ETFs (Oct. 2009 – present). |
| 1 | Each Trustee shall hold office until the election and qualification of his or her successor, or until he or she dies, resigns or is removed. The retirement policy requires that each independent trustee retire by December 31 of the year in which the Trustee turns 74 or the Trustee’s twentieth year of service as an independent trustee on any trust in the Fund Complex, whichever occurs first. |
| 2 | Mr. Bettinger, Ms. Chandoha and Mr. Martinetto are Interested Trustees. Mr. Bettinger is an Interested Trustee because he owns stock of The Charles Schwab Corporation (CSC), the parent company of Charles Schwab Investment Management, Inc. (CSIM), the investment adviser for the trusts in the Fund Complex, is an employee and director of Charles Schwab & Co., Inc. (CS&Co), the principal underwriter for The Charles Schwab Family of Funds, Schwab Investments, Schwab Capital Trust and Schwab Annuity Portfolios, and is a director of CSIM. Ms. Chandoha is an Interested Trustee because she owns stock of CSC and is an employee and director of CSIM. Mr. Martinetto is an Interested Trustee because he owns stock of CSC and is an employee and director of CS&Co. |
| 3 | The President, Treasurer and Secretary/Clerk hold office until their respective successors are chosen and qualified or until he or she sooner dies, resigns, is removed or becomes disqualified. Each of the other officers serves at the pleasure of the Board. |
Laudus U.S. Large Cap Growth Fund | Annual Report
Laudus U.S. Large Cap Growth Fund
Dividend yield is an expression of a stock’s market value in relationship to its dividend amount as a percentage. It is calculated by dividing the stock’s annual dividends by the market price of the stock.
Price to earnings ratio is the price of a stock divided by its historical earnings per share.
Price to book ratio compares the stock’s market value to the value of the total assets less the total liabilities.
Russell 1000 Growth Index An index that measures the performance of those Russell 1000 companies with higher price-to-book ratios and higher forecasted growth values.
Russell 1000 Value Index An index that measures the performance of the large-cap value segment of the U.S. equity universe. It includes those Russell 1000 Index companies with lower price-to-book ratios and lower expected growth values.
Russell 2000 Index An index that measures the performance of the 2,000 smallest companies in the Russell 3000 Index. The Russell 3000 Index measures the performance of the largest 3,000 U.S. companies representing approximately 98% of the investable U.S. equity market.
S&P 500 Index An index that is designed to measure the performance of 500 leading publicly traded companies from a broad range of industries.
Sovereign debt refers to debt issued by a national government within a given country and denominated in a foreign currency.
Trading Activity is one of several risk factors commonly used to attribute a portfolio’s return relative to its benchmark. Specifically, trading activity measures a stock’s trailing 12 month trading volume relative to its total shares outstanding. It measures how actively traded a stock has been in the last 12 months.
Weighted Average Market Cap A measure of the size of the companies in which a fund invests, based upon the market value of a fund’s securities each weighted according to its percent of the portfolio.
Laudus U.S. Large Cap Growth Fund | Annual Report
Laudus U.S. Large Cap Growth Fund
PRIVACY NOTICE
THIS IS NOT PART OF THE SHAREHOLDER REPORT
A Commitment to Your Privacy
Your Privacy Is Not for Sale
We do not and will not sell your personal information to anyone, for any reason.
We are committed to protecting the privacy of information we maintain about you. Below are details about our commitment, including the types of information we collect and how we use and share that information. This Privacy Notice applies to you only if you are an individual who invests directly in the funds by placing orders through the funds’ transfer agent. If you place orders through your brokerage account at Charles Schwab & Co., Inc. or an account with another broker-dealer, investment advisor, 401(k) plan, employee benefit plan, administrator, bank or other financial intermediary, you are covered by the privacy policies of that financial institution and should consult those policies.
How We Collect Information About You
We collect personal information about you in a number of ways.
• APPLICATION AND REGISTRATION
INFORMATION.
We collect personal information from you when you open an account or utilize one of our services. We may also collect information about you from third parties such as consumer reporting agencies to verify your identity. The information we collect may include personal information, including your Social Security number, as well as details about your interests, investments and investment experience.
• TRANSACTION AND EXPERIENCE
INFORMATION.
Once your account has been opened, we collect and maintain personal information about your account activity, including your transactions, balances, positions and history. This information allows us to administer your account and provide the services you have requested.
• WEBSITE USAGE.
When you visit our websites, we may use devices known as “cookies,” graphic interchange format files (GIFs), or other similar web tools to enhance your web experience. These tools help us to recognize you, maintain your web session, and provide a more personalized experience. To learn more, please click the Privacy link on our website.
How We Share and Use Your Information
We provide access to information about you to our affiliated companies, outside companies and other third parties in certain limited circumstances, including:
• to help us process transactions for your account;
• when we use other companies to provide services for us, such as printing and mailing your account statements;
• when we believe that disclosure is required or permitted under law (for example, to cooperate with regulators or law enforcement, resolve consumer disputes, perform credit/authentication checks, or for risk control).
State Laws
We will comply with state laws that apply to the disclosure or use of information about you.
Safeguarding Your Information — Security Is a
Partnership
We take precautions to ensure the information we collect about you is protected and is accessed only by authorized individuals or organizations.
Companies we use to provide support services are not allowed to use information about our shareholders for their own purposes and are contractually obligated to maintain strict confidentiality. We limit their use of information to the performance of the specific services we have requested. We restrict access to personal information by our employees and agents. Our employees are trained about privacy and are required to safeguard personal information.
We maintain physical, electronic and procedural safeguards that comply with federal standards to guard your nonpublic personal information.
Contact Us
To provide us with updated information, report suspected fraud or identity theft, or for any other questions, please call the number below.
Laudus Funds® direct investors: 1-877-824-5615
© 2017 Laudus Funds. All rights reserved.
Laudus U.S. Large Cap Growth Fund | Annual Report
Laudus U.S. Large Cap Growth Fund
Laudus Funds®
Laudus Funds offer investors access to some of the world’s leading investment managers. With a rigorous manager selection process and ongoing oversight by Charles Schwab Investment Management, Laudus Funds offer single and multi-manager strategies as a complement to other funds managed by Charles Schwab Investment Management. The list below shows all currently available Laudus Funds.
An investor should consider a fund’s investment objectives, risks, charges and expenses carefully before investing or sending money. This and other important information can be found in the fund’s prospectus or, if available, the summary prospectus. Please call 1-877-824-5615 for a prospectus for any Laudus Fund. Please read the prospectus carefully before you invest. This report must be preceded or accompanied by a current prospectus.
Proxy Voting Policies, Procedures and Results
A description of the proxy voting policies and procedures used to determine how to vote proxies on behalf of the funds is available without charge, upon request, by visiting the Laudus Funds’ website at www.schwabfunds.com/laudusfunds_prospectus, the SEC’s website at www.sec.gov, or by contacting Laudus Funds at 1-877-824-5615.
Information regarding how a fund voted proxies relating to portfolio securities during the most recent twelve-month period ended June 30 is available, without charge, by visiting the fund’s website at www.schwabfunds.com/laudusfunds_prospectus or the SEC’s website at www.sec.gov.
Laudus U.S. Large Cap Growth
Laudus U.S. Large Cap Growth Fund
Laudus MarketMasters Funds®
Laudus International MarketMasters Fund™
Laudus Small-Cap MarketMasters Fund™
Laudus Mondrian Funds™
Laudus Mondrian International Equity Fund
Laudus Mondrian Emerging Markets Fund
Laudus Mondrian International Government Fixed Income Fund
Investment Adviser
Charles Schwab Investment Management, Inc.
211 Main Street, San Francisco, CA 94105
Funds
Laudus Funds
1-877-824-5615
Printed on recycled paper.
Charles Schwab Investment Management, Inc. (CSIM) is the investment adviser for Laudus Funds. The Laudus Group of Funds includes the Laudus Mondrian Funds and Laudus U.S. Large Cap Growth Fund, which are part of the Laudus Trust and distributed by ALPS Distributors, Inc. (ALPS); and the Laudus MarketMasters Funds, which are part of the Schwab Capital Trust and distributed by Charles Schwab & Co., Inc. (Schwab), Member SIPC. Schwab and CSIM, affiliates and subsidiaries of The Charles Schwab Corporation, are not affiliated with ALPS.
This page is intentionally left blank.
| (a) | Registrant has adopted a code of ethics that applies to its principal executive officer, principal financial officer, and any other persons who perform a similar function, regardless of whether these individuals are employed by Registrant or a third party. |
| (c) | During the period covered by the report, no amendments were made to the provisions of this code of ethics. |
| (d) | During the period covered by the report, Registrant did not grant any waivers, including implicit waivers, from the provisions of this code of ethics. |
| (f)(1) | Registrant has filed this code of ethics as an exhibit pursuant to Item 12(a)(1) of Form N-CSR. |
| Item 3: | Audit Committee Financial Expert. |
Registrant’s Board of Trustees has determined that Kiran M. Patel, Robert W. Burns and Kimberly S. Patmore, each currently serving on its audit, compliance and valuation committee, are each an “audit committee financial expert,” as such term is defined in Item 3 of Form N-CSR. Each member of Registrant’s audit, compliance and valuation committee is “independent” under the standards set forth in Item 3 of Form N-CSR.
The designation of each of Mr. Patel, Mr. Burns and Ms. Patmore as an “audit committee financial expert” pursuant to Item 3 of Form N-CSR does not (i) impose upon such individual any duties, obligations, or liability that are greater than the duties, obligations and liability imposed upon such individual as a member of Registrant’s audit, compliance and valuation committee or Board of Trustees in the absence of such designation; and (ii) affect the duties, obligations or liability of any other member of Registrant’s audit, compliance and valuation committee or Board of Trustees.
| Item 4: | Principal Accountant Fees and Services. |
Registrant is composed of four series which all have a fiscal year-end of March 31, whose annual financial statements are reported in Item 1. Principal accountant fees disclosed in Items 4(a)-(d) and 4(g) include fees billed for services rendered to each of the four series, based on their respective 2018 and 2017 fiscal years, as applicable. The registrant was composed of five series in the 2017 fiscal year.
The following table presents fees billed by the principal accountant in each of the last two fiscal years for the services rendered to the Funds:
| | | | | | | | | | | | | | | | | | | | | | | | | | | | | | |
| (a) Audit Fees | | | (b) Audit-Related Fees1 | | | (c) Tax Fees2 | | | (d) All Other Fees3 | |
Fiscal
Year 2018 | | | Fiscal
Year 2017 | | | Fiscal
Year
2018 | | | Fiscal Year
2017 | | | Fiscal
Year
2018 | | | Fiscal
Year
2017 | | | Fiscal
Year
2018 | | | Fiscal
Year
2017 | |
| $ | 188,071 | | | $ | 241,876 | | | $ | 0 | | | $ | 0 | | | $ | 38,079 | | | $ | 29,379 | | | $ | 0 | | | $ | 0 | |
| 1 | The nature of the services includes assurance and related services reasonably related to the performance of the audit of financial statements not included in Audit Fees. |
| 2 | The nature of the services includes tax compliance, tax advice and tax planning. |
| 3 | The nature of the services include agreed upon procedures relating to Charles Schwab Investment Management., Inc.’s, (“CSIM”) expenses for purposes of Section 15(c) of the Investment Company Act of 1940. |
(e)(1) Registrant’s audit committee does not have pre-approval policies and procedures as described in paragraph (c)(7) of Rule 2-01 of Regulation S-X.
(2) There were no services described in each of paragraphs (b) through (d) above (including services required to be approved by Registrant’s audit committee pursuant to paragraph (c)(7)(ii) of Rule 2-01 of Regulation S-X) that were approved by Registrant’s audit committee pursuant to paragraph (c)(7)(i)(C) of Rule 2-01 of Regulation S-X.
(f) Not applicable.
(g) Below are the aggregate non-audit fees billed in each of the last two fiscal years by Registrant’s principal accountant for services rendered to Registrant, to Registrant’s investment adviser, and to any entity controlling, controlled by, or under common control with Registrant’s investment adviser that provides ongoing services to Registrant.
2018: $38,079 2017: $29,379
Although not required to be included in the amounts disclosed under this paragraph (g) or any other paragraph of this Item 4, below are the aggregate fees billed in each of the last two fiscal years by Registrant’s principal accountant for tax compliance services rendered to U.S. Trust, an entity under common control with Registrant’s investment adviser that does not provide services to Registrant.
2018: NONE 2017: NONE
(h) During the past fiscal year, all non-audit services provided by Registrant’s principal accountant to either Registrant’s investment adviser or to any entity controlling, controlled by, or under common control with Registrant’s investment adviser that provides ongoing services to Registrant were pre-approved. Included in the audit committee’s pre-approval was the review and consideration as to whether the provision of these non-audit services is compatible with maintaining the principal accountant’s independence.
| Item 5: | Audit Committee of Listed Registrants. |
Not applicable.
| Item 6: | Schedule of Investments. |
The schedules of investments are included as part of the report to shareholders filed under Item 1 of this Form.
Item 7: Disclosure of Proxy Voting Policies and Procedures for Closed-End Management Investment Companies.
Not applicable.
| Item 8: | Portfolio Managers of Closed-End Management Investment Companies. |
Not applicable.
Item 9: Purchases of Equity Securities by Closed-End Management Investment Company and Affiliated Purchasers.
Not applicable.
| Item 10: | Submission of Matters to a Vote of Security Holders. |
Not applicable.
| Item 11: | Controls and Procedures. |
(a) Based on their evaluation of Registrant’s disclosure controls and procedures, as of a date within 90 days of the filing date, Registrant’s Chief Executive Officer, Marie Chandoha and Registrant’s Chief Financial Officer, Mark Fischer, have concluded that Registrant’s disclosure controls and procedures
are: (i) reasonably designed to ensure that information required to be disclosed in this report is appropriately communicated to Registrant’s officers to allow timely decisions regarding disclosures required in this report; (ii) reasonably designed to ensure that information required to be disclosed in this report is recorded, processed, summarized and reported in a timely manner; and (iii) are effective in achieving the goals described in (i) and (ii) above.
| (b) | During the second fiscal quarter of the period covered by this report, there have been no changes in Registrant’s internal control over financial reporting that the above officers believe to have materially affected, or to be reasonably likely to materially affect, Registrant’s internal control over financial reporting. |
| (a) (1) | Registrant’s code of ethics (that is the subject of the disclosure required by Item 2(a)) is attached. |
| (2) | Separate certifications for Registrant’s principal executive officer and principal financial officer, as required by Rule 30a-2(a) under the 1940 Act, are attached. |
| (b) | A certification for Registrant’s principal executive officer and principal financial officer, as required by Rule 30a-2(b) under the 1940 Act, is attached. This certification is being furnished to the Securities and Exchange Commission solely pursuant to 18 U.S.C. section 1350 and is not being filed as part of the Form N-CSR with the Commission. |
Pursuant to the requirements of the Securities Exchange Act of 1934 and the Investment Company Act of 1940, the registrant has duly caused this report to be signed on its behalf by the undersigned, thereunto duly authorized.
| | |
| (Registrant) Laudus Trust |
| |
| By: | | /s/ Marie Chandoha |
| | Marie Chandoha |
| | President and Chief Executive Officer |
| |
| Date: | | May 17, 2018 |
Pursuant to the requirements of the Securities Exchange Act of 1934 and the Investment Company Act of 1940, this report has been signed below by the following persons on behalf of the registrant and in the capacities and on the dates indicated.
| | |
| By: | | /s/ Marie Chandoha |
| | Marie Chandoha |
| | President and Chief Executive Officer |
| |
| Date: | | May 17, 2018 |
| |
| By: | | /s/ Mark Fischer |
| | Mark Fischer |
| | Chief Financial Officer |
| |
| Date: | | May 17, 2018 |