UNITED STATES
SECURITIES AND EXCHANGE COMMISSION
Washington, D.C. 20549
FORM N-CSR
CERTIFIED SHAREHOLDER REPORT OF REGISTERED
MANAGEMENT INVESTMENT COMPANIES
Investment Company Act file number: 811-05547
Laudus Trust
(Exact name of registrant as specified in charter)
211 Main Street, San Francisco, California 94105
(Address of principal executive offices) (Zip code)
Jonathan de St. Paer
Laudus Trust
211 Main Street, San Francisco, California 94105
(Name and address of agent for service)
Registrant’s telephone number, including area code: (415) 636-7000
Date of fiscal year end: March 31
Date of reporting period: March 31, 2021
| Item 1: | Report(s) to Shareholders. |
Annual Report | March 31, 2021
Laudus® U.S. Large Cap Growth Fund
Adviser
Charles Schwab Investment Management, Inc.
Subadviser
BlackRock Investment Management, LLC
This page is intentionally left blank.
Fund investment adviser: Charles Schwab Investment Management, Inc. (CSIM)
Distributor: Charles Schwab & Co., Inc. (Schwab)
The industry/sector classification of the fund’s portfolio holdings uses the Global Industry Classification Standard (GICS) which was developed by and is the exclusive property of MSCI Inc. (MSCI) and Standard & Poor’s (S&P). GICS is a service mark of MSCI and S&P and has been licensed for use by Schwab. The Industry classifications used in the schedules of Portfolio Holdings are sub-categories of Sector classifications.
Laudus U.S. Large Cap Growth Fund | Annual Report
Laudus U.S. Large Cap Growth Fund
The performance data quoted represents past performance. Past performance does not guarantee future results. Investment returns and principal value of an investment will fluctuate so that an investor’s shares may be worth more or less than their original cost. Current performance may be lower or higher than performance data quoted. To obtain performance information current to the most recent month end, please visit www.schwabassetmanagement.com/laudusfunds_prospectus.
| Total Return for the 12 Months Ended March 31, 2021 |
| Laudus U.S. Large Cap Growth Fund (Ticker Symbol: LGILX) | 56.98% |
| Russell 1000® Growth Index | 62.74% |
| Performance Details | pages 5-7 |
All fund and index figures on this page assume dividends and distributions were reinvested. Index figures do not include trading and management costs, which would lower performance. Indices are unmanaged and cannot be invested in directly. Performance results less than one year are not annualized.
For index definitions, please see the Glossary.
Fund expenses may have been partially absorbed by CSIM. Without these reductions, the fund’s return would have been lower. This return does not reflect the deduction of taxes that a shareholder would pay on fund distributions or the redemption of fund shares.
Laudus U.S. Large Cap Growth Fund | Annual Report
Laudus U.S. Large Cap Growth Fund
Jonathan de St. Paer
President of Charles Schwab
Investment Management, Inc.
and the fund covered
in this report.
Dear Shareholder,
The COVID-19 pandemic shook the entire world over the 12-months ended March 31, 2021, dramatically reshaping daily life. As much as we might now like to turn our focus elsewhere, the COVID-19 pandemic remains a central issue today. How it unfolds in the coming months will continue to have implications for how we will live our lives and invest for our futures. Thankfully, while equities suffered their fastest decline ever in March 2020, U.S. markets have rallied. The S&P 500® Index, a bellwether for the overall U.S. stock market, rose by more than 50% over the reporting period, repeatedly reaching new record highs. Economic growth followed a similar pattern. After contracting in the first and second quarters of 2020, U.S. gross domestic product (GDP) rebounded, posting gains in the third and fourth quarters of 2020. For the 12-months ended March 31, 2021, the S&P 500® Index returned 56.4%.
At Charles Schwab Investment Management, we believe in the importance of staying invested and having a long-term investing plan that reflects your risk tolerance and long-term financial goals. The Laudus U.S. Large Cap Growth Fund is designed to provide investors exposure to large-cap growth stocks that can be used to create diversified portfolios. BlackRock Investment Management, LLC (BlackRock), the fund’s subadviser, has a unique and disciplined approach for investing in U.S. large-cap growth stocks. The BlackRock portfolio management team seeks to identify and invest in companies that provide a mix of Superior, Durable, and Periodic growth characteristics. The terms Durable, Superior, and Periodic are used, in this context, to denote three distinct categories of growth stocks as viewed by BlackRock. They are not indicators of individual security performance or that of the fund. Superior growth firms consist of those industry leaders with persistent advantages and growing market share, Durable growth firms are those that have sustainable business models and are more mature in their life cycle, and Periodic growth firms are those that thrive in expanding economies, but where margins are volatile. BlackRock allocates the fund’s portfolio among stocks with these growth characteristics, with the goal of balancing growth and risk.
Thank you for investing with Charles Schwab Investment Management. For more information about the Laudus U.S. Large Cap Growth Fund, please continue reading this report. In addition, you can find further details about this fund by visiting our website at www.schwabassetmanagement.com. We are also happy to hear from you at 1-877-824-5615.
Sincerely,
“ The Laudus U.S. Large Cap Growth Fund is designed to provide investors exposure to large-cap growth stocks that can be used to create diversified portfolios.”
Past performance cannot guarantee future results.
Diversification and asset allocation strategies do not ensure a profit and cannot protect against losses in a declining market.
Management views may have changed since the report date.
Charles Schwab Investment Management, Inc. and BlackRock Investment Management, LLC are unaffiliated entities.
Laudus U.S. Large Cap Growth Fund | Annual Report
Laudus U.S. Large Cap Growth Fund
The Investment Environment
For the 12-month reporting period ended March 31, 2021, U.S. equity markets generated strong returns in an impressive recovery from their steep slide in late February and March of 2020 when the COVID-19 pandemic began to wreak havoc on the U.S. economy. Even in the face of persisting COVID-19 pandemic-driven stresses to the economy—including widespread business disruptions, high unemployment, and prolonged stay-at-home orders—the extensive emergency rescue and fiscal stimulus measures enacted by the U.S. Federal Reserve (Fed) and U.S. Congress prompted equity markets to rally throughout the reporting period. Despite a resurgence of COVID-19 cases in the fall and winter, markets were buoyed by the initial distribution of COVID-19 vaccines in December 2020 and the expanded rollout into 2021. The COVID-19 vaccine rollout helped to fuel the early stages of a shift in the market towards cyclical sectors, beginning in November and December 2020 and continuing through the remainder of the reporting period. Major market indices achieved repeated record highs over the second half of the reporting period. For the 12-month reporting period, the S&P 500® Index, a bellwether for the overall U.S. stock market, returned 56.35%. U.S. small-cap stocks outperformed U.S. large-cap stocks by a large margin, with the Russell 2000® Index and Russell 1000® Index returning 94.85% and 60.59%, respectively. Among U.S. large-cap stocks, growth stocks outperformed value stocks, with the Russell 1000® Growth Index and Russell 1000® Value Index returning 62.74% and 56.09%, respectively.
Bolstered by the extensive emergency rescue and fiscal stimulus measures passed by the Fed and U.S. Congress, the U.S. economy has held up relatively well, especially given the intensity of the COVID-19 pandemic’s economic impact. After falling by an annualized rate of 31.4% in the second quarter of 2020, U.S. gross domestic product (GDP) jumped by an annualized rate of 33.4% for the third quarter of 2020, reflecting pent-up consumer demand and government support. GDP grew at an annualized rate of 4.3% in the fourth quarter of 2020. For the full year 2020, GDP decreased by 3.5%. Unemployment skyrocketed in April 2020, rising to the highest level since the Great Depression, but declined over the remainder of the reporting period, dropping below double digits beginning in August 2020. Inflation remained well below the Fed’s traditional target of 2%, although inflation concerns rose toward the end of the reporting period when the yield on the 10-year U.S. Treasury spiked in March 2021 to its highest level in more than a year.
Central banks around the world, including the Fed, enacted or maintained low—and for some international central banks, negative—interest rates instituted prior to, and in response to, the COVID-19 pandemic. In the U.S., the federal funds rate remained in a range of 0.00% to 0.25% throughout the reporting period. In addition, other Fed-driven emergency measures remained in effect, including large purchases of U.S. Treasuries and other securities to support smooth market function, facilitating the flow of credit to municipalities, financing for employers, consumers, and businesses, and the provision of facilities to support credit to businesses and consumers alike. In August 2020, the Fed announced that it was shifting its interest rate policy to allow inflation to rise above its previous 2% target for periods of time, even in times of rising employment.
Among the sectors in the Russell 1000® Growth Index, all posted double-digit returns for the reporting period. The largest contributor to the return of the index was the information technology sector driven by a surge in spending to accommodate remote working, including spending in hardware and software, personal devices and online payment services. Strong fundamentals and balance sheets also supported the sector. The consumer discretionary sector also contributed to the return of the index, up initially on a surge in home improvement spending and e-commerce sales spurred by stay-at-home orders and stimulus efforts, and then by a recovery in even hard-hit industries like apparel and hotels later in the reporting period as COVID-19 vaccine distribution expanded and social and travel restrictions began to loosen. The utilities and energy sectors contributed the least to the return of the index, largely as a result of the small weight to these sectors in the index.
Index figures assume dividends and distributions were reinvested. Index figures do not include trading and management costs, which would lower performance. Indices are unmanaged and cannot be invested in directly. Performance results less than one year are not annualized. Past performance is not an indication of future results.
For index definitions, please see the Glossary.
Nothing in this report represents a recommendation of a security by the investment adviser.
Management views may have changed since the report date.
Laudus U.S. Large Cap Growth Fund | Annual Report
Laudus U.S. Large Cap Growth Fund as of March 31, 2021
The Laudus U.S. Large Cap Growth Fund (the fund) seeks long-term capital appreciation. Under normal circumstances, the fund invests at least 80% of its net assets (including, for this purpose, any borrowings for investment purposes) in equity securities of U.S. large-capitalization companies. For more information concerning the fund’s investment objective, strategies, and risks, please see the prospectus.
Market Highlights. For the 12-month reporting period ended March 31, 2021, U.S. equity markets generated strong returns in an impressive recovery from their steep slide in late February and March of 2020 when the COVID-19 pandemic began to wreak havoc on the U.S. economy. Even in the face of persisting COVID-19 pandemic-driven stresses to the economy—including widespread business disruptions, high unemployment, and prolonged stay-at-home orders—the extensive emergency rescue and fiscal stimulus measures enacted by the U.S. Federal Reserve (Fed) and U.S. Congress prompted equity markets to rally throughout the reporting period. Despite a resurgence of COVID-19 cases in the fall and winter, markets were buoyed by the initial distribution of COVID-19 vaccines in December 2020 and the expanded rollout into 2021. The COVID-19 vaccine rollout helped to fuel the early stages of a shift in the market towards cyclical sectors, beginning in November and December 2020 and continuing through the remainder of the reporting period. Major market indices achieved repeated record highs over the second half of the reporting period.
Performance. The fund returned 56.98% for the 12-month reporting period ended March 31, 2021. For performance comparisons, the fund uses the Russell 1000® Growth Index (the index), which returned 62.74% for the same period.
Positioning and Strategies. Over the reporting period, stock selection in the information technology, consumer discretionary, and financials sectors detracted from relative performance while stock selection in the communication services sector as well as allocation in the consumer staples sector contributed to performance.
The largest detractor from relative performance over the reporting period was the information technology sector, where stock selection drove underperformance largely as a result of an underweight position to Apple Inc. which outperformed during the reporting period and an overweight to Visa, Inc. which experienced temporary disruption due to COVID-19 headwinds. Additionally, an underweight position in NVIDIA Corp., which outperformed during the reporting period, detracted from relative performance. A second key detractor from relative performance was stock selection in the consumer discretionary sector, driven by the fund not holding Tesla, Inc. Multiple expansion, rather than fundamentals, drove share prices of Tesla, Inc. higher. Lastly, stock selection in the financials sector, specifically the fund’s position in CME Group, Inc. also detracted from relative performance. CME Group, Inc. was a non-index stock. The fund sold its holdings of CME Group, Inc. prior to the end of the reporting period. An overweight to S&P Global, Inc., which underperformed after it announced its merger with IHS Markit as a result of investor uncertainty around the quality of IHS Markit assets, also detracted from relative performance. Another notable detractor from relative performance over the reporting period was an overweight to SBA Communications Corp.
The largest contributor to relative performance over the reporting period was the communication services sector. Snap, Inc. was a contributor to relative performance as COVID-19 social distancing policies increased usage of mobile communications apps like Snapchat. Snap, Inc. was a non-index stock. Additionally, an overweight position in IAC/InterActiveCorp. also contributed to relative performance. The fund sold its holdings of IAC/InterActiveCorp. prior to the end of the reporting period. The second key contributor to relative performance was allocation in the consumer staples sector. In this sector, avoiding traditional defensive industries and names added to results. Other notable contributors to relative performance over the reporting period include an allocation to e-commerce giant, MercadoLibre, Inc., as the company experienced increased usage of their e-commerce platform and services due to the pandemic. MercadoLibre, Inc. was a non-index stock. An allocation to the semiconductor company, ASML Holding N.V. also contributed to relative performance as the company’s long-term growth opportunity as a semiconductor supplier enabled it to benefit from broad-based demand. Another notable contributor to relative performance over the reporting period was an allocation to Shopify, Inc.
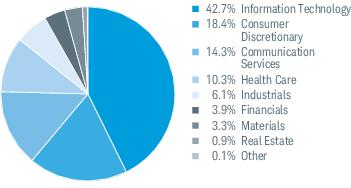
Due to a combination of portfolio trading activity and market movements during the reporting period, the largest increases in active sector weights were in the materials and communication services sectors, driven by adding exposure to the chemicals industry in the materials sector and adding exposure to the interactive media & services industry in the communication services sector. Conversely, the largest reductions in active sector weights were in the consumer discretionary and health care sectors, driven by reducing exposure to the internet & direct marketing retail industry and reducing exposure to the biotechnology industry, respectively. At the end of the reporting period, the largest sector overweight relative to the index was to the materials sector, followed by the communication services and financials sectors. The largest sector underweight relative to the index were to the consumer staples, health care, and information technology sectors.
| Fund Characteristics | |
| Number of Securities | 53 |
| Weighted Average Market Cap (millions) | $549,956 |
| Price/Earnings Ratio (P/E) | 44.65 |
| Price/Book Ratio (P/B) | 9.36 |
Portfolio Turnover
(One year trailing) | 37% |
| Fund Overview | |
| | Fund |
| Inception Date | 10/14/1997 * |
| Ticker Symbol | LGILX |
| Cusip | 51855Q549 |
| NAV | $29.23 |
Management views and portfolio holdings may have changed since the report date.
| * | Inception date is that of the fund’s predecessor fund, the Class Y Shares of the UBS U.S. Large Cap Growth Fund. |
Laudus U.S. Large Cap Growth Fund | Annual Report
Laudus U.S. Large Cap Growth Fund
Performance and Fund Facts as of March 31, 2021
Past performance does not guarantee future results. The performance data quoted represents past performance, and current returns may be lower or higher. The performance information does not reflect the deduction of taxes that a shareholder would pay on fund distributions or the redemption of fund shares. The investment return and principal value of an investment will fluctuate so that an investor’s shares, when redeemed, may be worth more or less than the original cost. To obtain performance information current to the most recent month end, visit www.schwabassetmanagement.com/laudusfunds_prospectus.
Performance of Hypothetical Investment (March 31, 2011 – March 31, 2021)1
Average Annual Total Returns
| Fund and Inception Date | 1 Year | 5 Years | 10 Years |
| Laudus U.S. Large Cap Growth Fund (10/14/97)1 | 56.98% | 21.58% | 16.29% |
| Russell 1000® Growth Index | 62.74% | 21.05% | 16.63% |
| Fund Expense Ratio2: 0.74% |
Total returns include change in share price and reinvestment of distributions. Total returns may reflect the waiver of a portion of the fund’s advisory fees for certain periods since the inception date. In such instances, and without the waiver of fees, total returns would have been lower. Performance results less than one year are not annualized.
For index definitions, please see the Glossary.
| 1 | Inception date is that of the fund’s predecessor fund, the Class Y Shares of the UBS U.S. Large Cap Growth Fund. |
| 2 | As stated in the prospectus. Reflects the total annual fund operating expenses without contractual fee waivers. For actual expense ratios during the period, refer to the Financial Highlights section of the Financial Statements. |
Laudus U.S. Large Cap Growth Fund | Annual Report
Laudus U.S. Large Cap Growth Fund
Performance and Fund Facts as of March 31, 2021 (continued)
Sector Weightings % of Investments
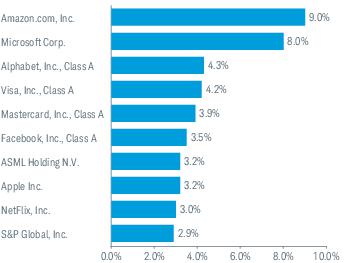
Top Equity Holdings % of Net Assets1
Portfolio holdings may have changed since the report date.
| 1 | This list is not a recommendation of any security by the investment adviser or subadviser. |
Laudus U.S. Large Cap Growth Fund | Annual Report
Laudus U.S. Large Cap Growth Fund
Fund Expenses (Unaudited)
Examples for a $1,000 Investment
As a fund shareholder, you may incur two types of costs: (1) transaction costs; and (2) ongoing costs, including management fees, transfer agent and shareholder services fees, and other fund expenses.
The expense examples below are intended to help you understand your ongoing cost (in dollars) of investing in the fund and to compare this cost with the ongoing cost of investing in other mutual funds. These examples are based on an investment of $1,000 invested for the period beginning October 1, 2020 and held through March 31, 2021.
Actual Return lines in the table below provide information about actual account values and actual expenses. You may use this information, together with the amount you invested, to estimate the expenses that you paid over the period. To do so, simply divide your account value by $1,000 (for example, an $8,600 account value ÷ $1,000 = 8.6), then multiply the result by the number given for your fund under the heading entitled “Expenses Paid During Period.”
Hypothetical Return lines in the table below provide information about hypothetical account values and hypothetical expenses based on the fund’s actual expense ratio and an assumed return of 5% per year before expenses. Because the return used is not an actual return, it may not be used to estimate the actual ending account value or expenses you paid for the period.
You may use this information to compare the ongoing costs of investing in the fund and other funds. To do so, compare this 5% hypothetical example with the 5% hypothetical examples that appear in the shareholder reports of the other funds.
Please note that the expenses shown in the table are meant to highlight your ongoing costs only, and do not reflect any transactional costs. Therefore, the hypothetical return lines of the table are useful in comparing ongoing costs only, and will not help you determine the relative total costs of owning different funds. In addition, if these transactional costs were included, your costs would have been higher.
| | Expense Ratio
(Annualized)1 | Beginning
Account Value
at 10/1/20 | Ending
Account Value
(Net of Expenses)
at 3/31/21 | Expenses Paid
During Period
10/1/20-3/31/212 |
| Laudus U.S. Large Cap Growth Fund | | | | |
| Actual Return | 0.71% | $1,000.00 | $1,100.60 | $3.72 |
| Hypothetical 5% Return | 0.71% | $1,000.00 | $1,021.36 | $3.58 |
| 1 | Based on the most recent six-month expense ratio; may differ from the expense ratio provided in the Financial Highlights. |
| 2 | Expenses for the fund are equal to its annualized expense ratio, multiplied by the average account value over the period, multiplied by the 182 days of the period, and divided by the 365 days of the fiscal year. |
Laudus U.S. Large Cap Growth Fund | Annual Report
Laudus U.S. Large Cap Growth Fund
Financial Statements
Financial Highlights
| | 4/1/20–
3/31/21 | 4/1/19–
3/31/20 | 4/1/18–
3/31/19 | 4/1/17–
3/31/18 | 4/1/16–
3/31/17 | |
| Per-Share Data |
| Net asset value at beginning of period | $19.61 | $21.31 | $20.47 | $18.12 | $15.76 | |
| Income (loss) from investment operations: | | | �� | | | |
| Net investment income (loss)1 | (0.07) | (0.04) | 0.02 | 0.00 2 | 0.00 2 | |
| Net realized and unrealized gains (losses) | 11.21 | 0.23 | 2.35 | 4.99 | 2.63 | |
| Total from investment operations | 11.14 | 0.19 | 2.37 | 4.99 | 2.63 | |
| Less distributions: | | | | | | |
| Distributions from net investment income | — | (0.02) | — | — | — | |
| Distributions from net realized gains | (1.52) | (1.87) | (1.53) | (2.64) | (0.27) | |
| Total distributions | (1.52) | (1.89) | (1.53) | (2.64) | (0.27) | |
| Net asset value at end of period | $29.23 | $19.61 | $21.31 | $20.47 | $18.12 | |
| Total return | 56.98% | (0.06%) | 12.78% | 28.52% | 16.85% | |
| Ratios/Supplemental Data |
| Ratios to average net assets: | | | | | | |
| Net operating expenses | 0.72% | 0.74% | 0.75% | 0.75% 3 | 0.76% | |
| Gross operating expenses | 0.72% | 0.74% | 0.75% | 0.75% 3 | 0.76% | |
| Net investment income (loss) | (0.25%) | (0.18%) | 0.07% | 0.01% 3 | 0.03% | |
| Portfolio turnover rate | 37% | 40% | 53% | 49% | 73% | |
| Net assets, end of period (x 1,000) | $2,942,805 | $1,980,826 | $2,250,995 | $1,953,049 | $1,667,059 | |
| |
1
Calculated based on the average shares outstanding during the period.
2
Per-share amount was less than $0.005.
3
The ratio of net operating expenses and gross operating expenses would have been 0.76% and 0.76%, respectively, and the ratio of net investment income would have been less than 0.005%, excluding a custody out-of-pocket fee reimbursement from the custodian.
Laudus U.S. Large Cap Growth Fund | Annual Report
Laudus U.S. Large Cap Growth Fund
Portfolio Holdings as of March 31, 2021
This section shows all the securities in the fund’s portfolio and their values as of the report date.
The fund files its complete schedule of portfolio holdings with the U.S. Securities and Exchange Commission (SEC) for the first and third quarters of each fiscal year on Form N-PORT Part F. The fund’s Form N-PORT Part F is available on the SEC’s website at www.sec.gov. You can also obtain this information at no cost on the fund’s website at www.schwabassetmanagement.com/laudusfunds_prospectus, by calling 1-866-414-6349, or by sending an email request to orders@mysummaryprospectus.com. The fund also makes available its complete schedule of portfolio holdings 30 days after the end of the calendar quarter on the fund’s website.
| Security | Number
of Shares | Value ($) |
| Common Stock 100.1% of net assets |
| |
| Capital Goods 2.3% |
| Roper Technologies, Inc. | 117,209 | 47,275,078 |
| TransDigm Group, Inc. * | 36,603 | 21,519,636 |
| | | 68,794,714 |
| |
| Commercial & Professional Services 3.0% |
| CoStar Group, Inc. * | 66,860 | 54,951,565 |
| TransUnion | 373,740 | 33,636,600 |
| | | 88,588,165 |
| |
| Consumer Durables & Apparel 2.8% |
| LVMH Moet Hennessy Louis Vuitton SE ADR | 187,931 | 25,152,685 |
| NIKE, Inc., Class B | 420,645 | 55,899,514 |
| | | 81,052,199 |
| |
| Consumer Services 0.5% |
| Domino’s Pizza, Inc. | 43,274 | 15,915,744 |
| |
| Diversified Financials 3.9% |
| Morgan Stanley | 369,500 | 28,695,370 |
| S&P Global, Inc. | 242,180 | 85,458,057 |
| | | 114,153,427 |
| |
| Health Care Equipment & Services 7.4% |
| Abbott Laboratories | 244,065 | 29,248,750 |
| Boston Scientific Corp. * | 1,287,992 | 49,780,891 |
| Danaher Corp. | 93,376 | 21,017,070 |
| Humana, Inc. | 102,645 | 43,033,916 |
| Intuitive Surgical, Inc. * | 27,178 | 20,082,911 |
| UnitedHealth Group, Inc. | 143,904 | 53,542,361 |
| | | 216,705,899 |
| |
| Materials 3.3% |
| Ball Corp. | 216,425 | 18,339,854 |
| Freeport-McMoRan, Inc. * | 544,814 | 17,940,725 |
| International Flavors & Fragrances, Inc. | 107,002 | 14,938,549 |
| Linde plc | 25,221 | 7,065,411 |
| The Sherwin-Williams Co. | 53,253 | 39,301,247 |
| | | 97,585,786 |
| |
| Media & Entertainment 14.4% |
| Alphabet, Inc., Class A * | 60,840 | 125,483,717 |
| Facebook, Inc., Class A * | 350,367 | 103,193,593 |
| NetFlix, Inc. * | 169,779 | 88,566,913 |
| Security | Number
of Shares | Value ($) |
| Snap, Inc., Class A * | 1,374,746 | 71,885,468 |
| Tencent Holdings Ltd. ADR | 422,603 | 33,723,719 |
| | | 422,853,410 |
| |
| Pharmaceuticals, Biotechnology & Life Sciences 3.0% |
| AstraZeneca plc ADR | 511,171 | 25,415,422 |
| Lonza Group AG | 323,636 | 18,023,289 |
| Zoetis, Inc. | 275,516 | 43,388,260 |
| | | 86,826,971 |
| |
| Real Estate 0.9% |
| SBA Communications Corp. | 96,421 | 26,761,649 |
| |
| Retailing 15.2% |
| Amazon.com, Inc. * | 85,613 | 264,893,471 |
| Dollar Tree, Inc. * | 330,362 | 37,813,235 |
| Lowe’s Cos., Inc. | 206,845 | 39,337,782 |
| MercadoLibre, Inc. * | 48,187 | 70,938,010 |
| The TJX Cos., Inc. | 510,002 | 33,736,632 |
| | | 446,719,130 |
| |
| Semiconductors & Semiconductor Equipment 8.8% |
| Analog Devices, Inc. | 456,586 | 70,807,357 |
| ASML Holding N.V. | 154,086 | 95,126,533 |
| Marvell Technology Group Ltd. | 1,202,126 | 58,880,131 |
| NVIDIA Corp. | 65,075 | 34,745,495 |
| | | 259,559,516 |
| |
| Software & Services 30.7% |
| Adobe, Inc. * | 135,419 | 64,374,130 |
| Autodesk, Inc. * | 150,186 | 41,624,050 |
| Fidelity National Information Services, Inc. | 223,212 | 31,385,839 |
| Intuit, Inc. | 188,600 | 72,245,116 |
| Mastercard, Inc., Class A | 325,619 | 115,936,645 |
| Microsoft Corp. | 995,411 | 234,688,052 |
| PayPal Holdings, Inc. * | 181,387 | 44,048,019 |
| RingCentral, Inc., Class A * | 97,984 | 29,187,474 |
| ServiceNow, Inc. * | 164,062 | 82,049,047 |
| Shopify, Inc., Class A * | 27,630 | 30,572,595 |
| Visa, Inc., Class A | 580,548 | 122,919,428 |
| Wix.com Ltd. * | 122,010 | 34,067,632 |
| | | 903,098,027 |
| |
| Technology Hardware & Equipment 3.2% |
| Apple Inc. | 773,462 | 94,478,383 |
| |
| Transportation 0.7% |
| Union Pacific Corp. | 100,177 | 22,080,013 |
| Total Common Stock |
| (Cost $1,527,695,169) | | 2,945,173,033 |
|
Laudus U.S. Large Cap Growth Fund | Annual Report
Laudus U.S. Large Cap Growth Fund
Portfolio Holdings as of March 31, 2021 (continued)
| Security | Number
of Shares | Value ($) |
| Other Investment Company 0.1% of net assets |
| |
| Money Market Fund 0.1% |
| State Street Institutional U.S. Government Money Market Fund, Premier Class 0.04% (a) | 2,418,452 | 2,418,452 |
| Total Other Investment Company |
| (Cost $2,418,452) | | 2,418,452 |
| * | Non-income producing security. |
| (a) | The rate shown is the 7-day yield. |
| | |
| ADR — | American Depositary Receipt |
The following is a summary of the inputs used to value the fund’s investments as of March 31, 2021 (see financial note 2(a) for additional information):
| Description | Quoted Prices in
Active Markets for
Identical Assets
(Level 1) | Other Significant
Observable Inputs
(Level 2) | Significant
Unobservable Inputs
(Level 3) | Total | |
| Assets | | | | | |
| Common Stock1 | $2,945,173,033 | $— | $— | $2,945,173,033 | |
| Other Investment Company1 | 2,418,452 | — | — | 2,418,452 | |
| Total | $2,947,591,485 | $— | $— | $2,947,591,485 | |
| 1 | As categorized in Portfolio Holdings. |
Fund investments in mutual funds are classified as Level 1, without consideration to the classification level of the underlying securities held by the mutual funds, which could be Level 1, Level 2 or Level 3.
Laudus U.S. Large Cap Growth Fund | Annual Report
Laudus U.S. Large Cap Growth Fund
Statement of Assets and Liabilities
As of March 31, 2021
| Assets |
| Investments in securities of unaffiliated issuers, at value (cost $1,530,113,621) | | $2,947,591,485 |
| Receivables: | | |
| Investments sold | | 8,343,350 |
| Fund shares sold | | 2,978,058 |
| Dividends | | 301,776 |
| Foreign tax reclaims | | 209,085 |
| Prepaid expenses | + | 35,230 |
| Total assets | | 2,959,458,984 |
| Liabilities |
| Payables: | | |
| Investments bought | | 6,928,324 |
| Investment adviser fees | | 1,504,608 |
| Sub-accounting and sub-transfer agent fees | | 255,259 |
| Fund shares redeemed | | 7,774,235 |
| Accrued expenses | + | 191,542 |
| Total liabilities | | 16,653,968 |
| Net Assets |
| Total assets | | 2,959,458,984 |
| Total liabilities | – | 16,653,968 |
| Net assets | | $2,942,805,016 |
| Net Assets by Source | | |
| Capital received from investors | | 1,312,457,750 |
| Total distributable earnings | | 1,630,347,266 |
| Net Asset Value (NAV) |
| Net Assets | ÷ | Shares
Outstanding | = | NAV |
| $2,942,805,016 | | 100,673,318 | | $29.23 |
| | | | | |
Laudus U.S. Large Cap Growth Fund | Annual Report
Laudus U.S. Large Cap Growth Fund
Statement of Operations
For the period April 1, 2020 through March 31, 2021
| Investment Income |
| Dividends received from securities of unaffiliated issuers (net of foreign withholding tax of $115,739) | | $13,062,209 |
| Expenses |
| Investment adviser fees | | 16,758,599 |
| Sub-accounting and sub-transfer agent fees | | 2,580,179 |
| Accounting and administration fees | | 88,384 |
| Independent trustees’ fees | | 87,458 |
| Registration fees | | 79,560 |
| Shareholder reports | | 62,735 |
| Professional fees | | 61,500 |
| Custodian fees | | 45,744 |
| Transfer agent fees | | 19,326 |
| Other expenses | + | 33,250 |
| Total expenses | – | 19,816,735 |
| Net investment loss | | (6,754,526) |
| Realized and Unrealized Gains (Losses) |
| Net realized gains on securities of unaffiliated issuers | | 291,071,501 |
| Net change in unrealized appreciation (depreciation) on securities of unaffiliated issuers | + | 845,317,794 |
| Net realized and unrealized gains | | 1,136,389,295 |
| Increase in net assets resulting from operations | | $1,129,634,769 |
Laudus U.S. Large Cap Growth Fund | Annual Report
Laudus U.S. Large Cap Growth Fund
Statement of Changes in Net Assets
For the current and prior report periods
| Operations | |
| | 4/1/20-3/31/21 | 4/1/19-3/31/20 |
| Net investment loss | | ($6,754,526) | ($4,122,288) |
| Net realized gains | | 291,071,501 | 151,141,629 |
| Net change in unrealized appreciation (depreciation) | + | 845,317,794 | (136,156,573) |
| Increase in net assets from operations | | 1,129,634,769 | 10,862,768 |
| Distributions to Shareholders | |
| Total distributions | | ($151,866,592) | ($181,686,564) |
| Transactions in Fund Shares | | | |
| | | 4/1/20-3/31/21 | 4/1/19-3/31/20 |
| | | SHARES | VALUE | SHARES | VALUE |
| Shares sold | | 21,504,281 | $570,122,715 | 19,200,070 | $423,306,088 |
| Shares reinvested | | 4,381,621 | 125,708,707 | 6,926,774 | 151,488,563 |
| Shares redeemed | + | (26,212,855) | (711,620,716) | (30,736,201) | (674,139,965) |
| Net transactions in fund shares | | (326,953) | ($15,789,294) | (4,609,357) | ($99,345,314) |
| Shares Outstanding and Net Assets | | | |
| | | 4/1/20-3/31/21 | 4/1/19-3/31/20 |
| | | SHARES | NET ASSETS | SHARES | NET ASSETS |
| Beginning of period | | 101,000,271 | $1,980,826,133 | 105,609,628 | $2,250,995,243 |
| Total increase (decrease) | + | (326,953) | 961,978,883 | (4,609,357) | (270,169,110) |
| End of period | | 100,673,318 | $2,942,805,016 | 101,000,271 | $1,980,826,133 |
Laudus U.S. Large Cap Growth Fund | Annual Report
Laudus U.S. Large Cap Growth Fund
1. Business Structure of the Fund:
Laudus U.S. Large Cap Growth Fund is the only series of Laudus Trust (the trust), a no-load, open-end management investment company organized April 1, 1988. The trust is organized as a Massachusetts business trust and is registered under the Investment Company Act of 1940, as amended (the 1940 Act).
The Laudus U.S. Large Cap Growth Fund offers one share class. Shares are bought and sold at closing net asset value per share (NAV), which is the price for all outstanding shares of the fund.
The fund maintains its own account for purposes of holding assets and accounting, and is considered a separate entity for tax purposes. Within its account, the fund may also keep certain assets in segregated accounts, as required by securities law.
2. Significant Accounting Policies:
The following is a summary of the significant accounting policies the fund uses in its preparation of financial statements. The fund follows the investment company accounting and reporting guidance of the Financial Accounting Standards Board (FASB) Accounting Standard Codification Topic 946 Financial Services — Investment Companies. The accounting policies are in conformity with accounting principles generally accepted in the United States of America (GAAP).
The fund may invest in certain other mutual funds referred to as “underlying funds”. For more information about the underlying funds’ operations and policies, please refer to those funds’ semiannual and annual reports, which are filed with the U.S. Securities and Exchange Commission (SEC) and are available on the SEC’s website at www.sec.gov.
(a) Security Valuation:
Under procedures approved by the fund’s Board of Trustees (the Board), the investment adviser has formed a Pricing Committee to administer the pricing and valuation of portfolio securities and other assets and to ensure that prices used for internal purposes or provided by third parties reasonably reflect fair value. Among other things, these procedures allow the fund to utilize independent pricing services, quotations from securities and financial instrument dealers and other market sources to determine fair value.
The fund values the securities in its portfolio every business day. The fund uses the following policies to value various types of securities:
• Securities traded on an exchange or over-the-counter: Traded securities are valued at the closing value for the day, or, on days when no closing value has been reported, at the mean of the most recent bid and ask quotes. Securities that are primarily traded on foreign exchanges are valued at the official closing price or the last sales price on the exchange where the securities are principally traded with these values then translated into U.S. dollars at the current exchange rate, unless these securities are fair valued as discussed below.
• Securities for which no quoted value is available: The Board has adopted procedures to fair value the fund’s securities when market prices are not “readily available” or are unreliable. For example, the fund may fair value a security when it is de-listed or its trading is halted or suspended; when a security’s primary pricing source is unable or unwilling to provide a price; or when a security’s primary trading market is closed during regular market hours. The fund makes fair value determinations in good faith in accordance with the fund’s valuation procedures. The Pricing Committee considers a number of factors, including unobservable market inputs when arriving at fair value. The Pricing Committee may employ techniques such as the review of related or comparable assets or liabilities, related market activities, recent transactions, market multiples, book values, transactional back-testing, disposition analysis and other relevant information. The Pricing Committee regularly reviews these inputs and assumptions to calibrate the valuations. Due to the subjective and variable nature of fair value pricing, there can be no assurance that the fund could obtain the fair value assigned to the security upon the sale of such security. The Board convenes on a regular basis to review fair value determinations made by the fund pursuant to the valuation procedures.
• Foreign equity security fair valuation: The Board has adopted procedures to fair value foreign equity securities that are traded in markets that close prior to the fund valuing its holdings. By fair valuing securities whose prices may have been affected by events occurring after the close of trading, the fund seeks to establish prices that investors might expect to realize upon the current sales of these securities. This methodology is designed to deter “arbitrage” market timers, who seek to exploit delays between the change in the value of the fund’s portfolio holdings and the NAV of the fund’s shares, and seeks to help ensure that the prices at which the fund’s shares are purchased and redeemed are fair and do not result in dilution of shareholder interest or other harm to shareholders. When fair value pricing is used at the open or close of a reporting period, it may cause a temporary divergence between the return of the fund and that of its comparative index or benchmark. The Board regularly reviews fair value determinations made by the fund pursuant to these procedures.
Laudus U.S. Large Cap Growth Fund | Annual Report
Laudus U.S. Large Cap Growth Fund
Financial Notes (continued)
2. Significant Accounting Policies (continued):
• Mutual funds: Mutual funds are valued at their respective NAVs.
In accordance with the authoritative guidance on fair value measurements and disclosures under GAAP, the fund discloses the fair value of its investments in a hierarchy that prioritizes the significant inputs to valuation techniques used to measure the fair value. The hierarchy gives the highest priority to valuations based upon unadjusted quoted prices in active markets for identical assets or liabilities (Level 1 measurements) and the lowest priority to valuations based upon unobservable inputs that are significant to the valuation (Level 3 measurements). If inputs used to measure the financial instruments fall within different levels of the hierarchy, the categorization is based on the lowest level input that is significant to the valuation. If the fund determines that either the volume and/or level of activity for an asset or liability has significantly decreased (from normal conditions for that asset or liability) or price quotations or observable inputs are not associated with orderly transactions, increased analysis and management judgment will be required to estimate fair value.
The three levels of the fair value hierarchy are as follows:
• Level 1—quoted prices in active markets for identical securities—Investments whose values are based on quoted market prices in active markets, and whose values are therefore classified as Level 1 prices, include active listed equities. Investments in mutual funds are valued daily at their NAVs, which are classified as Level 1 prices, without consideration to the classification level of the underlying securities held by an underlying fund.
• Level 2—other significant observable inputs (including quoted prices for similar securities, interest rates, prepayment speeds, credit risk, etc.)—Investments that trade in markets that are not considered to be active, but whose values are based on quoted market prices, dealer quotations or valuations provided by alternative pricing sources supported by observable inputs are classified as Level 2 prices. These generally include U.S. government and sovereign obligations, most government agency securities, investment-grade corporate bonds, certain mortgage products, less liquid listed equities, and state, municipal and provincial obligations. In addition, international securities whose markets close hours before the fund values its holdings may require fair valuations due to significant movement in the U.S. markets occurring after the daily close of the foreign markets. The Board has approved a vendor that calculates fair valuations of international equity securities based on a number of factors that appear to correlate to the movements in the U.S. markets.
• Level 3—significant unobservable inputs (including the fund’s own assumptions in determining the fair value of investments)—Investments whose values are classified as Level 3 prices have significant unobservable inputs, as they may trade infrequently or not at all. When observable prices are not available for these securities, the fund uses one or more valuation techniques for which sufficient and reliable data is available. The inputs used by the fund in estimating the value of Level 3 prices may include the original transaction price, quoted prices for similar securities or assets in active markets, completed or pending third-party transactions in the underlying investment or comparable issuers, and changes in financial ratios or cash flows. Level 3 prices may also be adjusted to reflect illiquidity and/or non-transferability, with the amount of such discount estimated by the fund in the absence of market information. Assumptions used by the fund due to the lack of observable inputs may significantly impact the resulting fair value and therefore the fund’s results of operations.
The inputs or methodology used for valuing securities are not necessarily an indication of the risk associated with investing in those securities.
The levels associated with valuing the fund’s investments as of March 31, 2021 are disclosed in the Portfolio Holdings.
(b) Security Transactions:
Security transactions are recorded as of the date the order to buy or sell the security is executed. Realized gains and losses from security transactions are based on the identified costs of the securities involved.
Assets and liabilities denominated in foreign currencies are reported in U.S. dollars. For assets and liabilities held on a given date, the dollar value is based on market exchange rates in effect on that date. Transactions involving foreign currencies, including purchases, sales, income receipts and expense payments, are calculated using exchange rates in effect on the transaction date. Realized foreign exchange gains or losses arise from sales of foreign currencies, currency gains or losses realized between the trade and settlement dates on securities transactions and the differences between the recorded amounts of dividends, interest, and foreign withholding taxes and the U.S. dollar equivalent of the amounts actually received or paid. Net unrealized foreign exchange appreciation or depreciation arises from changes in foreign exchange rates on foreign denominated assets and liabilities other than investments in securities held at the end of the reporting period. These realized and unrealized foreign exchange gains or losses are
Laudus U.S. Large Cap Growth Fund | Annual Report
Laudus U.S. Large Cap Growth Fund
Financial Notes (continued)
2. Significant Accounting Policies (continued):
reported in foreign currency transactions or translations on the Statement of Operations. The fund does not isolate the portion of the fluctuations on investments resulting from changes in foreign currency exchange rates from the fluctuations in market prices of investments held. Such fluctuations are included with the net realized and unrealized gain or loss from investments.
Gains realized by the fund on the sale of securities in certain foreign countries may be subject to non-U.S. taxes. In those instances, the fund records a liability based on unrealized appreciation to provide for potential non-U.S. taxes payable upon the sale of these securities.
(c) Investment Income:
Interest income is recorded as it accrues. Dividends and distributions from portfolio securities and underlying funds are recorded on the date they are effective (the ex-dividend date), although the fund records certain foreign security dividends on the date the ex-dividend date is confirmed. Any distributions from underlying funds are recorded in accordance with the character of the distributions as designated by the underlying funds.
Income received from foreign sources may result in withholding tax. Withholding taxes are accrued at the same time as the related income if the tax rate is fixed and known, unless a tax withheld is reclaimable from the local tax authorities in which case it is recorded as receivable. If the tax rate is not known or estimable, such expense or reclaim receivable is recorded when the net proceeds are received.
(d) Expenses:
Expenses that are specific to the fund are charged directly to the fund. Expenses that are common to more than one fund in the trusts generally are allocated among those funds in proportion to their average daily net assets.
(e) Distributions to Shareholders:
The fund makes distributions from net investment income and net realized capital gains, if any, once a year.
(f) Accounting Estimates:
The accounting policies described in this report conform to GAAP. Notwithstanding this, shareholders should understand that in order to follow these principles, fund management has to make estimates and assumptions that affect the information reported in the financial statements. It’s possible that once the results are known, they may turn out to be different from these estimates and these differences may be material.
(g) Federal Income Taxes:
The fund intends to meet federal income and excise tax requirements for regulated investment companies under subchapter M of the Internal Revenue Code, as amended. Accordingly, the fund distributes substantially all of its net investment income and net realized capital gains, if any, to its respective shareholders each year. As long as the fund meets the tax requirements, it is not required to pay federal income tax.
(h) Foreign Taxes:
The fund may be subject to foreign taxes (a portion of which may be reclaimable) on income, corporate events, foreign currency exchanges and capital gains on investments. All foreign taxes are recorded in accordance with the applicable foreign tax regulations and rates that exist in foreign markets in which the fund invests. These foreign taxes, if any, are paid by the fund and are disclosed in the Statement of Operations. Foreign taxes accrued as of March 31, 2021, if any, are reflected in the fund’s Statement of Assets and Liabilities.
(i) Indemnification:
Under the fund’s organizational documents, the officers and trustees are indemnified against certain liabilities arising out of the performance of their duties to the fund. In addition, in the normal course of business the fund enters into contracts with its vendors and others that provide general indemnifications. The fund’s maximum exposure under these arrangements is unknown as this would involve future claims that may be made against the fund. However, based on experience, the fund expects the risk of loss attributable to these arrangements to be remote.
Laudus U.S. Large Cap Growth Fund | Annual Report
Laudus U.S. Large Cap Growth Fund
Financial Notes (continued)
3. Risk Factors:
Investing in the fund may involve certain risks, as described in the fund’s prospectus, including, but not limited to, those described below. Any of these risks could cause an investor to lose money.
• Market Risk. Financial markets rise and fall in response to a variety of factors, sometimes rapidly and unpredictably. Markets may be impacted by economic, political, regulatory and other conditions, including economic sanctions and other government actions. In addition, the occurrence of global events, such as war, terrorism, environmental disasters, natural disasters and epidemics, may also negatively affect the financial markets. As with any investment whose performance is tied to these markets, the value of an investment in the fund will fluctuate, which means that an investor could lose money over short or long periods.
• Management Risk. As with all actively managed funds, the fund is subject to the risk that its subadviser will select investments or allocate assets in a manner that could cause the fund to underperform or otherwise not meet its investment objective. The fund’s subadviser applies its own investment techniques and risk analyses in making investment decisions for the fund, but there can be no guarantee that they will produce the desired results.
• Equity Risk. The prices of equity securities rise and fall daily. These price movements may result from factors affecting individual companies, industries or the securities market as a whole. In addition, equity markets tend to move in cycles, which may cause stock prices to fall over short or extended periods of time.
• Market Capitalization Risk. Securities issued by companies of different market capitalizations tend to go in and out of favor based on market and economic conditions. During a period when securities of a particular market capitalization fall behind other types of investments, the fund’s performance could be impacted.
• Large-Cap Company Risk. Large-cap companies are generally more mature and the securities issued by these companies may not be able to reach the same levels of growth as the securities issued by small- or mid-cap companies.
• Growth Investing Risk. Growth stocks can be volatile. Growth companies usually invest a high portion of earnings in their businesses and may lack the dividends of value stocks that can cushion stock prices in a falling market. The prices of growth stocks are based largely on projections of the issuer’s future earnings and revenues. If a company’s earnings or revenues fall short of expectations, its stock price may fall dramatically. Growth stocks may also be more expensive relative to their earnings or assets compared to value or other stocks.
• Foreign Investment Risk. The fund’s investments in securities of foreign issuers involve certain risks that may be greater than those associated with investments in securities of U.S. issuers. These include risks of adverse changes in foreign economic, political, regulatory and other conditions; changes in currency exchange rates or exchange control regulations (including limitations on currency movements and exchanges); the imposition of economic sanctions or other government restrictions; differing accounting, auditing, financial reporting and legal standards and practices; differing securities market structures; and higher transaction costs. These risks may negatively impact the value or liquidity of the fund’s investments, and could impair the fund’s ability to meet its investment objective or invest in accordance with its investment strategy. There is a risk that investments in securities denominated in, and/or receiving revenues in, foreign currencies will decline in value relative to the U.S. dollar or, in the case of hedging positions, that the U.S. dollar will decline in value relative to the currency hedged, resulting in the dollar value of the fund’s investment being adversely affected. Foreign securities also include American Depositary receipts (ADRs), Global Depositary receipts (GDRs) and European Depositary receipts (EDRs) which may be less liquid than the underlying shares in their primary trading market and GDRs, many of which are issued by companies in emerging markets, may be more volatile. These risks may be heightened in connection with investments in emerging markets or securities of issuers that conduct their business in emerging markets.
• Derivatives Risk. The fund’s use of derivative instruments involves risks different from, or possibly greater than, the risks associated with investing directly in securities and other traditional investments. The fund’s use of derivatives could reduce the fund’s performance, increase the fund’s volatility, and could cause the fund to lose more than the initial amount invested. In addition, investments in derivatives may involve leverage, which means a small percentage of assets invested in derivatives can have a disproportionately large impact on the fund.
• Leverage Risk. Certain fund transactions, such as derivatives transactions, may give rise to a form of leverage and may expose the fund to greater risk. Leverage tends to magnify the effect of any increase or decrease in the value of the fund’s portfolio securities, which means even a small amount of leverage can have a disproportionately large impact on the fund.
• Liquidity Risk. The fund may be unable to sell certain securities, such as illiquid securities, readily at a favorable time or price, or the fund may have to sell them at a loss.
Laudus U.S. Large Cap Growth Fund | Annual Report
Laudus U.S. Large Cap Growth Fund
Financial Notes (continued)
3. Risk Factors (continued):
Please refer to the fund’s prospectus for a more complete description of the principal risks of investing in the fund.
4. Affiliates and Affiliated Transactions:
Investment Adviser
Charles Schwab Investment Management, Inc. (CSIM or the investment adviser), a wholly owned subsidiary of The Charles Schwab Corporation, serves as the fund’s investment adviser pursuant to an Investment Advisory Agreement (Advisory Agreement) between CSIM and the trust. BlackRock Investment Management, LLC (BlackRock), the fund’s subadviser, provides day-to-day portfolio management services to the fund, subject to the supervision of CSIM.
For its advisory services to the fund, CSIM is entitled to receive an annual fee, payable monthly, based on a percentage of the fund’s average daily net assets described as follows:
| Average daily net assets | |
| First $500 million | 0.700% |
| $500 million to $1 billion | 0.650% |
| $1 billion to $1.5 billion | 0.600% |
| $1.5 billion to $2 billion | 0.575% |
| Over $2 billion | 0.550% |
For the period ended March 31, 2021, the aggregate net advisory fee paid to CSIM was 0.61% for the fund, as a percentage of the fund’s average daily net assets.
CSIM (not the fund) pays a portion of the advisory fees it receives to BlackRock in return for its portfolio management services.
Shareholders Services
The trustees have authorized the fund to reimburse, out of the assets of the fund, financial intermediaries, including Charles Schwab & Co., Inc. (a broker-dealer affiliate of CSIM, Schwab) (together, “service providers”) that provide sub-accounting and sub-transfer agency services in connection with the fund’s shares in an amount of up to 0.10% of the average daily net assets of the fund on an annual basis. The sub-accounting and sub-transfer agency fee paid to a particular service provider is made pursuant to its written agreement with Schwab, as distributor of the fund (or, in the case of payments made to Schwab acting as a service provider, pursuant to Schwab’s written agreement with the fund), and the fund will pay no more than 0.10% of the average annual daily net asset value of the fund shares owned by shareholders holding shares through such service provider. Payments are made as described above without regard to whether the fee is more or less than the service provider’s actual cost of providing the services, and if more, such excess may be retained as profit by the service provider.
Expense Limitation
CSIM has contractually agreed, until at least July 30, 2022, to limit the total annual fund operating expenses charged, excluding interest, taxes and certain non-routine expenses of the fund to 0.77%.
Laudus U.S. Large Cap Growth Fund | Annual Report
Laudus U.S. Large Cap Growth Fund
Financial Notes (continued)
4. Affiliates and Affiliated Transactions (continued):
Investments from Affiliates
Certain funds in the Fund Complex (for definition refer to Trustees and Officers section) may own shares of other funds in the Fund Complex. The table below reflects the percentage of shares of the fund that are owned by other funds in the Fund Complex as of March 31, 2021:
| Schwab Target 2025 Fund | 0.2% |
| Schwab Target 2030 Fund | 0.7% |
| Schwab Target 2035 Fund | 0.6% |
| Schwab Target 2040 Fund | 1.7% |
| Schwab Target 2045 Fund | 0.4% |
| Schwab Target 2050 Fund | 0.5% |
| Schwab Target 2055 Fund | 0.3% |
| Schwab Target 2060 Fund | 0.1% |
| Schwab Target 2065 Fund | 0.0%* |
| Schwab Balanced Fund | 3.5% |
5. Board of Trustees:
The trust’s Board oversees the general conduct of the trust and the fund.
The Board may include people who are officers and/or directors of CSIM or its affiliates. Federal securities law limits the percentage of such “interested persons” who may serve on a trust’s board, and the trust was in compliance with these limitations throughout the report period. The trust did not pay any of these interested persons for their services as trustees, but it did pay non-interested persons (independent trustees), as noted in the fund’s Statement of Operations. For information regarding the trustees, please refer to Trustees and Officers table at the end of this report.
6. Borrowing from Banks:
During the period, the fund was a participant with other funds in the Fund Complex in a joint, syndicated, committed $750 million line of credit (the Syndicated Credit Facility), which matured on October 1, 2020. On October 1, 2020, the Syndicated Credit Facility was further amended to run for a new 364 day period with a line of credit of $850 million, maturing on September 30, 2021. Under the terms of the Syndicated Credit Facility, in addition to the interest charged on any borrowings by the fund, the fund paid a commitment fee of 0.15% per annum on its proportionate share of the unused portion of the Syndicated Credit Facility.
During the period, the fund was a participant with other funds in the Fund Complex in a joint, unsecured, uncommitted $500 million line of credit (the Uncommitted Credit Facility), with State Street Bank and Trust Company, which was scheduled to mature on November 27, 2020. However, on October 1, 2020, the Uncommitted Credit Facility was amended to run for a new 364 day period with a line of credit of $400 million, maturing on September 30, 2021. Under the terms of the Uncommitted Credit Facility, the fund pays interest on the amount it borrows. There were no borrowings from either line of credit during the period.
The fund also has access to custodian overdraft facilities. The fund may have utilized the overdraft facility and incurred an interest expense, which is paid by the fund. The interest expense is determined based on a negotiated rate above the current Federal Funds Rate.
7. Purchases and Sales of Investment Securities:
For the period ended March 31, 2021, purchases and sales of securities (excluding short-term obligations) were as follows:
Purchases
of Securities | Sales
of Securities |
| $993,916,511 | $1,122,267,717 |
Laudus U.S. Large Cap Growth Fund | Annual Report
Laudus U.S. Large Cap Growth Fund
Financial Notes (continued)
8. Federal Income Taxes:
As of March 31, 2021, the tax basis cost of the fund’s investments and gross unrealized appreciation and depreciation were as follows:
| Tax cost | $1,532,065,714 |
| Gross unrealized appreciation | $1,426,953,782 |
| Gross unrealized depreciation | (11,428,011) |
| Net unrealized appreciation (depreciation) | $1,415,525,771 |
As of March 31, 2021, the components of distributable earnings on a tax basis were as follows:
| Undistributed ordinary income | $14,751,631 |
| Undistributed long-term capital gains | 200,069,864 |
| Net unrealized appreciation (depreciation) on investments | 1,415,525,771 |
| Total | $1,630,347,266 |
The primary difference between book basis and tax basis unrealized appreciation or unrealized depreciation of investments is the tax deferral of losses on wash sales. The tax cost of the fund’s investments, disclosed above, have been adjusted from its book amounts to reflect these unrealized appreciation or depreciation differences, as applicable.
Capital loss carryforwards may be used to offset future realized capital gains for federal income tax purposes. As of March 31, 2021, the fund had no capital loss carryforwards.
The tax basis components of distributions paid during the current and prior fiscal years ended were:
| Current fiscal year end distributions | |
| Ordinary income | $— |
| Long-term capital gains | 151,866,592 |
| Prior fiscal year end distributions | |
| Ordinary income | $1,559,402 |
| Long-term capital gains | 180,127,162 |
Distributions paid to shareholders are based on net investment income and net realized gains determined on a tax basis, which may differ from net investment income and net realized gains for financial reporting purposes. These differences reflect the differing character of certain income items and net realized gains and losses for financial statement and tax purposes, and may result in reclassification among certain capital accounts on the financial statements.
Permanent book and tax basis differences may result in reclassifications between components of net assets as required. The adjustments will have no impact on net assets or the results of operations.
As of March 31, 2021, management has reviewed the tax positions for open periods (for federal purposes, three years from the date of filing and for state purposes, four years from the date of filing) as applicable to the fund, and has determined that no provision for income tax is required in the fund’s financial statements. The fund recognizes interest and penalties, if any, related to unrecognized tax benefits as income tax expense in the Statement of Operations. During the fiscal year ended March 31, 2021, the fund did not incur any interest or penalties.
9. Independent Registered Public Accounting Firm:
On June 8, 2020, the Audit, Compliance and Valuation Committee of the Board approved, and on June 9, 2020, the Board approved, Deloitte & Touche LLP as the independent registered accounting firm of the Schwab Funds Complex for fiscal periods ending after June 8, 2020.
On June 8, 2020, PricewaterhouseCoopers LLP (the “Prior Auditor”) resigned as the independent registered public accounting firm of the Schwab Funds Complex. The Prior Auditor’s reports on the financial statements of the fund for the past two fiscal years, the years ended March 31, 2019 and March 31, 2020, did not contain an adverse opinion or disclaimer of opinion, and were not qualified or modified as to uncertainty, audit scope or accounting principles. During the last two fiscal year-ends and through June 8, 2020, there were no (1) disagreements with the Prior Auditor on any matter of accounting principles or practices, financial statement disclosure, or auditing scope or procedure, which disagreements, if not resolved to the Prior Auditor’s satisfaction, would
Laudus U.S. Large Cap Growth Fund | Annual Report
Laudus U.S. Large Cap Growth Fund
Financial Notes (continued)
9. Independent Registered Public Accounting Firm (continued):
have caused it to make reference to that matter in connection with its reports on the fund’s financial statements for such periods; or (2) “reportable events,” as that term is defined in Item 304 (a)(1)(v) of Regulation S-K under the Securities Exchange Act of 1934.
10. Subsequent Events:
Management has determined there are no subsequent events or transactions through the date the financial statements were issued that would have materially impacted the financial statements as presented.
Laudus U.S. Large Cap Growth Fund | Annual Report
Laudus U.S. Large Cap Growth Fund
Report of Independent Registered Public Accounting Firm
To the Board of Trustees of Laudus Trust and Shareholders of Laudus U.S. Large Cap Growth Fund:
Opinion on the Financial Statements and Financial Highlights
We have audited the accompanying statement of assets and liabilities, including the portfolio holdings, of Laudus U.S. Large Cap Growth Fund (the “Fund”), one of the funds constituting Laudus Trust, as of March 31, 2021, the related statement of operations, statement of changes in net assets, and the financial highlights for the year then ended, and the related notes. In our opinion, the financial statements and financial highlights present fairly, in all material respects, the financial position of the Fund as of March 31, 2021, and the results of its operations, the changes in its net assets, and the financial highlights for the year then ended in conformity with accounting principles generally accepted in the United States of America. The statement of changes in net assets for the year ended March 31, 2020 and the financial highlights for each of the four years in the period ended March 31, 2020 were audited by other auditors, whose report, dated May 18, 2020, expressed an unqualified opinion on such statement of changes in net assets and financial highlights.
Basis for Opinion
These financial statements and financial highlights are the responsibility of the Fund’s management. Our responsibility is to express an opinion on the Fund’s financial statements and financial highlights based on our audit. We are a public accounting firm registered with the Public Company Accounting Oversight Board (United States) (PCAOB) and are required to be independent with respect to the Fund in accordance with the U.S. federal securities laws and the applicable rules and regulations of the Securities and Exchange Commission and the PCAOB.
We conducted our audit in accordance with the standards of the PCAOB. Those standards require that we plan and perform the audit to obtain reasonable assurance about whether the financial statements and financial highlights are free of material misstatement, whether due to error or fraud. The Fund is not required to have, nor were we engaged to perform, an audit of its internal control over financial reporting. As part of our audit we are required to obtain an understanding of internal control over financial reporting but not for the purpose of expressing an opinion on the effectiveness of the Fund’s internal control over financial reporting. Accordingly, we express no such opinion.
Our audit included performing procedures to assess the risks of material misstatement of the financial statements and financial highlights, whether due to error or fraud, and performing procedures that respond to those risks. Such procedures included examining, on a test basis, evidence regarding the amounts and disclosures in the financial statements and financial highlights. Our audit also included evaluating the accounting principles used and significant estimates made by management, as well as evaluating the overall presentation of the financial statements and financial highlights. Our procedures included confirmation of securities owned as of March 31, 2021 by correspondence with the custodian and brokers; when replies were not received from brokers, we performed other auditing procedures. We believe that our audit provides a reasonable basis for our opinion.
Deloitte & Touche LLP
Denver, Colorado
May 17, 2021
We have served as the auditor of one or more investment companies in the Schwab Funds Complex since 2020.
Laudus U.S. Large Cap Growth Fund | Annual Report
Laudus U.S. Large Cap Growth Fund
Other Federal Tax Information (unaudited)
Under section 852(b)(3)(C) of the Internal Revenue Code, the fund hereby designates $151,866,592 as long-term capital gain dividends for the fiscal year ended March 31, 2021.
Laudus U.S. Large Cap Growth Fund | Annual Report
Laudus U.S. Large Cap Growth Fund
Trustees and Officers
The tables below give information about the trustees and officers of Laudus Trust, which includes the fund covered in this report. The “Fund Complex” includes The Charles Schwab Family of Funds, Schwab Capital Trust, Schwab Investments, Schwab Annuity Portfolios, Schwab Strategic Trust and Laudus Trust. The Fund Complex includes 103 funds.
The address for all trustees and officers is 211 Main Street, San Francisco, CA 94105. You can find more information about the trustees and officers in the Statement of Additional Information, which is available free by calling 1-877-824-5615.
| Independent Trustees |
Name, Year of Birth, and
Position(s) with the trust
(Terms of office, and
length of Time Served1) | Principal Occupations
During the Past Five Years | Number of
Portfolios in
Fund Complex
Overseen by
the Trustee | Other Directorships |
Robert W. Burns
1959
Trustee
(Trustee of Schwab Strategic Trust since 2009; The Charles Schwab Family of Funds, Schwab Investments, Schwab Capital Trust, Schwab Annuity Portfolios and Laudus Trust since 2016) | Retired/Private Investor (Jan. 2009 – present). Formerly, Managing Director, Pacific Investment Management Company, LLC (PIMCO) (investment management firm) and President, PIMCO Funds. | 103 | None |
John F. Cogan
1947
Trustee
(Trustee of The Charles Schwab Family of Funds, Schwab Investments, Schwab Capital Trust and Schwab Annuity Portfolios since 2008; Laudus Trust since 2010; Schwab Strategic Trust since 2016) | Senior Fellow (Oct. 1979 – present), The Hoover Institution at Stanford University (public policy think tank); Senior Fellow (2000 – present), Stanford Institute for Economic Policy Research; Professor of Public Policy (1994 – 2015), Stanford University. | 103 | Director (2005 – 2020), Gilead Sciences, Inc. |
Nancy F. Heller
1956
Trustee
(Trustee of The Charles Schwab Family of Funds, Schwab Investments, Schwab Capital Trust, Schwab Annuity Portfolios, Schwab Strategic Trust and Laudus Trust since 2018) | Retired. President and Chairman (2014 – 2016), TIAA Charitable (financial services); Senior Managing Director (2003 – 2016), TIAA (financial services). | 103 | None |
David L. Mahoney
1954
Trustee
(Trustee of The Charles Schwab Family of Funds, Schwab Investments, Schwab Capital Trust, Schwab Annuity Portfolios and Laudus Trust since 2011; Schwab Strategic Trust since 2016) | Private Investor. | 103 | Director (2004 – present), Corcept Therapeutics Incorporated
Director (2009 – present), Adamas Pharmaceuticals, Inc.
Director (2003 – 2019), Symantec Corporation |
Jane P. Moncreiff
1961
Trustee
(Trustee of The Charles Schwab Family of Funds, Schwab Investments, Schwab Capital Trust, Schwab Annuity Portfolios, Schwab Strategic Trust and Laudus Trust since 2019) | Consultant (2018 – present), Fulham Advisers LLC (management consulting); Chief Investment Officer (2009 – 2017), CareGroup Healthcare System, Inc. (healthcare). | 103 | None |
Laudus U.S. Large Cap Growth Fund | Annual Report
Laudus U.S. Large Cap Growth Fund
| Independent Trustees (continued) |
Name, Year of Birth, and
Position(s) with the trust
(Terms of office, and
length of Time Served1) | Principal Occupations
During the Past Five Years | Number of
Portfolios in
Fund Complex
Overseen by
the Trustee | Other Directorships |
Kiran M. Patel
1948
Trustee
(Trustee of The Charles Schwab Family of Funds, Schwab Investments, Schwab Capital Trust, Schwab Annuity Portfolios and Laudus Trust since 2011; Schwab Strategic Trust since 2016) | Retired. Executive Vice President and General Manager of Small Business Group (Dec. 2008 – Sept. 2013), Intuit, Inc. (financial software and services firm for consumers and small businesses). | 103 | Director (2008 – present), KLA-Tencor Corporation |
Kimberly S. Patmore
1956
Trustee
(Trustee of The Charles Schwab Family of Funds, Schwab Investments, Schwab Capital Trust, Schwab Annuity Portfolios, Schwab Strategic Trust and Laudus Trust since 2016) | Consultant (2008 – present), Patmore Management Consulting (management consulting). | 103 | None |
| Interested Trustees |
Name, Year of Birth, and
Position(s) with the trust
(Terms of office, and
length of Time Served1) | Principal Occupations
During the Past Five Years | Number of
Portfolios in
Fund Complex
Overseen by
the Trustee | Other Directorships |
Walter W. Bettinger II2
1960
Chairman and Trustee
(Trustee of The Charles Schwab Family of Funds, Schwab Investments, Schwab Capital Trust and Schwab Annuity Portfolios since 2008; Schwab Strategic Trust since 2009; Laudus Trust since 2010) | Director, President and Chief Executive Officer (Oct. 2008 – present), The Charles Schwab Corporation; President and Chief Executive Officer (Oct. 2008 – present) and Director (May 2008 – present), Charles Schwab & Co., Inc.; Director (Apr. 2006 – present), Charles Schwab Bank, SSB; Director (Nov. 2017 – present), Charles Schwab Premier Bank, SSB; Director (July 2019 – present), Charles Schwab Trust Bank; Director (May 2008 – present) and President and Chief Executive Officer (Aug. 2017 – present), Schwab Holdings, Inc.; Director (Oct. 2020 – present), TD Ameritrade Holding Corporation; Director (July 2016 – present), Charles Schwab Investment Management, Inc. | 103 | Director (2008 – present), The Charles Schwab Corporation |
Joseph R. Martinetto2
1962
Trustee
(Trustee of The Charles Schwab Family of Funds, Schwab Investments, Schwab Capital Trust, Schwab Annuity Portfolios, Schwab Strategic Trust and Laudus Trust since 2016) | Chief Operating Officer (Feb. 2018 – present) and Senior Executive Vice President (July 2015 – Feb. 2018), The Charles Schwab Corporation; Senior Executive Vice President (July 2015 – present), Charles Schwab & Co., Inc.; Chief Financial Officer (July 2015 – Aug. 2017) and Executive Vice President and Chief Financial Officer (May 2007 – July 2015), The Charles Schwab Corporation and Charles Schwab & Co., Inc.; Director (May 2007 – present), Charles Schwab & Co., Inc.; Director (Apr. 2010 – present) and Chief Executive Officer (July 2013 – Apr. 2015), Charles Schwab Bank, SSB; Director (Nov. 2017 – present), Charles Schwab Premier Bank, SSB; Director (May 2007 – present), Chief Financial Officer (May 2007 – Aug. 2017), Senior Executive Vice President (Feb. 2016 – present), and Executive Vice President (May 2007 – Feb. 2016), Schwab Holdings, Inc.; Director (Oct. 2020 – present), TD Ameritrade Holding Corporation. | 103 | None |
Laudus U.S. Large Cap Growth Fund | Annual Report
Laudus U.S. Large Cap Growth Fund
| Officers of the Trust |
Name, Year of Birth, and Position(s) with the trust
(Terms of office, and length of Time Served3) | Principal Occupations During the Past Five Years |
Jonathan de St. Paer
1973
President and Chief Executive Officer
(Officer of The Charles Schwab Family of Funds, Schwab Investments, Schwab Capital Trust, Schwab Annuity Portfolios, Schwab Strategic Trust and Laudus Trust since 2018) | Director (Apr. 2019 – present), President (Oct. 2018 – present), Chief Operating Officer (Jan. 2020 – present), and Chief Executive Officer (Apr. 2019 – Nov. 2019), Charles Schwab Investment Management, Inc.; Senior Vice President (June 2020 – present) and Chief Operating Officer (Jan. 2020 – present), Charles Schwab Investment Advisory, Inc.; Chief Executive Officer (Apr. 2019 – present), President (Nov. 2018 – present) and Trustee (Apr. 2019 – Dec. 2020), Schwab Funds, Laudus Funds and Schwab ETFs; Director (Apr. 2019 – present), Charles Schwab Worldwide Funds plc and Charles Schwab Asset Management (Ireland) Limited; Senior Vice President (Apr. 2019 – present), Senior Vice President – Strategy and Product Development (CSIM) (Jan. 2014 – Mar. 2019), and Vice President (Jan. 2009 – Dec. 2013), Charles Schwab & Co., Inc. |
Mark Fischer
1970
Treasurer, Chief Financial Officer and Chief Operating Officer
(Officer of The Charles Schwab Family of Funds, Schwab Investments, Schwab Capital Trust, Schwab Annuity Portfolios, Schwab Strategic Trust and Laudus Trust since 2013) | Treasurer and Chief Financial Officer (Jan. 2016 – present) and Chief Operating Officer (Dec. 2020 – present), Schwab Funds, Laudus Funds and Schwab ETFs; Assistant Treasurer (Dec. 2013 – Dec. 2015), Schwab Funds and Laudus Funds; Assistant Treasurer (Nov. 2013 – Dec. 2015), Schwab ETFs; Chief Financial Officer (Mar. 2020 – present) and Vice President (Oct. 2013 – present), Charles Schwab Investment Management, Inc.; Executive Director (Apr. 2011 – Sept. 2013), J.P. Morgan Investor Services; Assistant Treasurer (May 2005 – Mar. 2011), Massachusetts Financial Service Investment Management. |
Omar Aguilar
1970
Senior Vice President and Chief Investment Officer – Equities and Multi-Asset Strategies
(Officer of The Charles Schwab Family of Funds, Schwab Investments, Schwab Capital Trust, Schwab Annuity Portfolios, Schwab Strategic Trust and Laudus Trust since 2011) | Senior Vice President and Chief Investment Officer (Apr. 2011 – present), Charles Schwab Investment Management, Inc.; Senior Vice President and Chief Investment Officer – Equities and Multi-Asset Strategies (June 2011 – present), Schwab Funds, Laudus Funds and Schwab ETFs; Head of the Portfolio Management Group and Vice President of Portfolio Management (May 2009 – Apr. 2011), Financial Engines, Inc. (investment management firm); Head of Quantitative Equity (July 2004 – Jan. 2009), ING Investment Management. |
Brett Wander
1961
Senior Vice President and Chief Investment Officer – Fixed Income
(Officer of The Charles Schwab Family of Funds, Schwab Investments, Schwab Capital Trust, Schwab Annuity Portfolios, Schwab Strategic Trust and Laudus Trust since 2011) | Senior Vice President and Chief Investment Officer (Apr. 2011 – present), Charles Schwab Investment Management, Inc.; Senior Vice President and Chief Investment Officer – Fixed Income (June 2011 – present), Schwab Funds, Laudus Funds and Schwab ETFs; Senior Managing Director and Global Head of Active Fixed-Income Strategies (Jan. 2008 – Oct. 2010), State Street Global Advisors; Director of Alpha Strategies (Apr. 2006 – Jan. 2008), Loomis, Sayles & Company (investment management firm). |
David Lekich
1964
Chief Legal Officer and Secretary, Schwab Funds and Schwab ETFs
Vice President and Assistant Clerk, Laudus Funds
(Officer of The Charles Schwab Family of Funds, Schwab Investments, Schwab Capital Trust, Schwab Annuity Portfolios, Schwab Strategic Trust and Laudus Trust since 2011) | Senior Vice President (Sept. 2011 – present) and Vice President (Mar. 2004 – Sept. 2011), Charles Schwab & Co., Inc.; Senior Vice President and Chief Counsel (Sept. 2011 – present) and Vice President (Jan. 2011 – Sept. 2011), Charles Schwab Investment Management, Inc.; Secretary (Apr. 2011 – present) and Chief Legal Officer (Dec. 2011 – present), Schwab Funds; Vice President and Assistant Clerk (Apr. 2011 – present), Laudus Funds; Secretary (May 2011 – present) and Chief Legal Officer (Nov. 2011 – present), Schwab ETFs. |
Catherine MacGregor
1964
Vice President and Assistant Secretary, Schwab Funds and Schwab ETFs
Chief Legal Officer, Vice President and Clerk, Laudus Funds
(Officer of The Charles Schwab Family of Funds, Schwab Investments, Schwab Capital Trust, Schwab Annuity Portfolios and Laudus Trust since 2005; Schwab Strategic Trust since 2009) | Vice President (July 2005 – present), Charles Schwab & Co., Inc.; Vice President (Sept. 2005 – present), Charles Schwab Investment Management, Inc.; Vice President (Dec. 2005 – present) and Chief Legal Officer and Clerk (Mar. 2007 – present), Laudus Funds; Vice President (Nov. 2005 – present) and Assistant Secretary (June 2007 – present), Schwab Funds; Vice President and Assistant Secretary (Oct. 2009 – present), Schwab ETFs. |
| 1 | Each Trustee shall hold office until the election and qualification of his or her successor, or until he or she dies, resigns or is removed. The retirement policy requires that each independent trustee retire by December 31 of the year in which the Trustee turns 74 or the Trustee’s twentieth year of service as an independent trustee on any trust in the Fund Complex, whichever occurs first. |
| 2 | Mr. Bettinger and Mr. Martinetto are Interested Trustees. Mr. Bettinger is an Interested Trustee because he owns stock of The Charles Schwab Corporation (CSC), the parent company of Charles Schwab Investment Management, Inc. (CSIM), the investment adviser for the trusts in the Fund Complex, is an employee and director of Charles Schwab & Co., Inc. (CS&Co), the principal underwriter for The Charles Schwab Family of Funds, Schwab Investments, Schwab Capital Trust, Schwab Annuity Portfolios and Laudus Trust, and is a director of CSIM. Mr. Martinetto is an Interested Trustee because he owns stock of CSC and is an employee and director of CS&Co. |
| 3 | The President, Treasurer and Secretary/Clerk hold office until their respective successors are chosen and qualified or until he or she sooner dies, resigns, is removed or becomes disqualified. Each of the other officers serves at the pleasure of the Board. |
Laudus U.S. Large Cap Growth Fund | Annual Report
Laudus U.S. Large Cap Growth Fund
Dividend yield is an expression of a stock’s market value in relationship to its dividend amount as a percentage. It is calculated by dividing the stock’s annual dividends by the market price of the stock.
Price to earnings ratio is the price of a stock divided by its historical earnings per share.
Price to book ratio compares the stock’s market value to the value of the total assets less the total liabilities.
Russell 1000 Growth Index An index that measures the performance of those Russell 1000 Index companies with higher price-to-book ratios and higher forecasted growth values.
Russell 1000 Index An index that measures the performance of the 1,000 largest companies in the Russell 3000 Index, and represents approximately 92% of the total market capitalization of the Russell 3000 Index. The Russell 3000 Index measures the performance of the largest 3,000 U.S. companies representing approximately 98% of the investable U.S. equity market.
Russell 1000 Value Index An index that measures the performance of the large-cap value segment of the U.S. equity universe. It includes those Russell 1000 Index companies with lower price-to-book ratios and lower expected growth values.
Russell 2000 Index An index that measures the performance of the 2,000 smallest companies in the Russell 3000 Index. The Russell 3000 Index measures the performance of the largest 3,000 U.S. companies representing approximately 98% of the investable U.S. equity market.
S&P 500 Index An index that is designed to measure the performance of 500 leading publicly traded companies from a broad range of industries.
Sovereign debt refers to debt issued by a national government within a given country and denominated in a foreign currency.
Trading Activity is one of several risk factors commonly used to attribute a portfolio’s return relative to its benchmark. Specifically, trading activity measures a stock’s trailing 12 month trading volume relative to its total shares outstanding. It measures how actively traded a stock has been in the last 12 months.
Weighted Average Market Cap A measure of the size of the companies in which a fund invests, based upon the market value of a fund’s securities each weighted according to its percent of the portfolio.
Laudus U.S. Large Cap Growth Fund | Annual Report
Laudus U.S. Large Cap Growth Fund
Laudus Funds®
Laudus Funds offer investors access to some of the world’s leading investment managers. With a rigorous manager selection process and ongoing oversight by Charles Schwab Investment Management, Laudus Funds offer single and multi-manager strategies as a complement to other funds managed by Charles Schwab Investment Management. The list below shows all currently available Laudus Funds.
An investor should consider a fund’s investment objectives, risks, charges and expenses carefully before investing or sending money. This and other important information can be found in the fund’s prospectus or, if available, the summary prospectus. Please call 1-877-824-5615 for a prospectus for any Laudus Fund. Please read the prospectus carefully before you invest. This report must be preceded or accompanied by a current prospectus.
Proxy Voting Policies, Procedures and Results
A description of the proxy voting policies and procedures used to determine how to vote proxies on behalf of the funds is available without charge, upon request, by visiting the Laudus Funds’ website at www.schwabassetmanagement.com/laudusfunds_prospectus, the SEC’s website at www.sec.gov, or by contacting Laudus Funds at 1-877-824-5615.
Information regarding how a fund voted proxies relating to portfolio securities during the most recent twelve-month period ended June 30 is available, without charge, by visiting the fund’s website at www.schwabassetmanagement.com/laudusfunds_prospectus or the SEC’s website at www.sec.gov.
Laudus® U.S. Large Cap Growth Fund
Laudus International MarketMasters Fund™
Investment Adviser
Charles Schwab Investment Management, Inc.
211 Main Street, San Francisco, CA 94105
Fund
Laudus® U.S. Large Cap Growth Fund
1-877-824-5615
Printed on recycled paper.
This page is intentionally left blank.
Item 2: Code of Ethics.
| (a) | Registrant has adopted a code of ethics that applies to its principal executive officer, principal financial officer, and any other persons who perform a similar function, regardless of whether these individuals are employed by Registrant or a third party. |
| (c) | During the period covered by the report, no amendments were made to the provisions of this code of ethics. |
| (d) | During the period covered by the report, Registrant did not grant any waivers, including implicit waivers, from the provisions of this code of ethics. |
| (f)(1) | Registrant has filed this code of ethics as an exhibit pursuant to Item 13(a)(1) of Form N-CSR. |
Item 3: Audit Committee Financial Expert.
Registrant’s Board of Trustees has determined that Kiran M. Patel and Kimberly S. Patmore, each currently serving on its audit, compliance and valuation committee, are each an “audit committee financial expert,” as such term is defined in Item 3 of Form N-CSR. Each member of Registrant’s audit, compliance and valuation committee is “independent” under the standards set forth in Item 3 of Form N-CSR.
The designation of each of Mr. Patel and Ms. Patmore as an “audit committee financial expert” pursuant to Item 3 of Form N-CSR does not (i) impose upon such individual any duties, obligations, or liability that are greater than the duties, obligations and liability imposed upon such individual as a member of Registrant’s audit, compliance and valuation committee or Board of Trustees in the absence of such designation; and (ii) affect the duties, obligations or liability of any other member of Registrant’s audit, compliance and valuation committee or Board of Trustees.
Item 4: Principal Accountant Fees and Services.
Registrant is composed of one series which has a fiscal year-end of March 31, whose annual financial statements are reported in Item 1. Principal accountant fees disclosed in Items 4(a)-(d) and 4(g) include fees billed for services rendered to the operational series during 2021 and 2020 fiscal years, as applicable.
The following table presents fees billed by the principal accountant in each of the last two fiscal years for the services rendered to the Funds:
| | | | | | | | | | | | | | | | | | | | | | | | | | | | |
| (a) Audit Fees | | | (b) Audit-Related Fees | | | (c) Tax Fees1 | | | (d) All Other Fees | |
Fiscal Year
2021 | | Fiscal Year
2020 | | | Fiscal Year 2021 | | | Fiscal Year 2020 | | | Fiscal Year 2021 | | | Fiscal Year 2020 | | | Fiscal Year 2021 | | | Fiscal Year 2020 | |
| $31,080 | | $ | 38,890 | | | $ | 0 | | | $ | 0 | | | $ | 3,100 | | | $ | 7,451 | | | $ | 0 | | | $ | 0 | |
| 1 | The nature of the services includes tax compliance, tax advice and tax planning. |
(e)(1) Registrant’s audit, compliance and valuation committee does not have pre-approval policies and procedures as described in paragraph (c)(7) of Rule 2-01 of Regulation S-X.
(2) There were no services described in each of paragraphs (b) through (d) above (including services required to be approved by Registrant’s audit, compliance and valuation committee pursuant to paragraph (c)(7)(ii) of Rule 2-01 of Regulation S-X) that were approved by Registrant’s audit, compliance and valuation committee pursuant to paragraph (c)(7)(i)(C) of Rule 2-01 of Regulation S-X.
(f) Not applicable.
(g) Below are the aggregate non-audit fees billed in each of the last two fiscal years by Registrant’s principal accountant for services rendered to Registrant, to Registrant’s investment adviser, and to any entity controlling, controlled by, or under common control with Registrant’s investment adviser that provides ongoing services to Registrant.
| | | | | | | | | | | | |
2021: | | $ | 4,663,610 | | | | 2020: | | | $ | 7,451 | |
(h) During the past fiscal year, all non-audit services provided by Registrant’s principal accountant to either Registrant’s investment adviser or to any entity controlling, controlled by, or under common control with Registrant’s investment adviser that provides ongoing services to Registrant were pre-approved. Included in the audit, compliance and valuation committee’s pre-approval was the review and consideration as to whether the provision of these non-audit services is compatible with maintaining the principal accountant’s independence.
Item 5: Audit Committee of Listed Registrants.
Not applicable.
Item 6: Schedule of Investments.
The schedules of investments are included as part of the report to shareholders filed under Item 1 of this Form.
Item 7: Disclosure of Proxy Voting Policies and Procedures for Closed-End Management Investment Companies.
Not applicable.
Item 8: Portfolio Managers of Closed-End Management Investment Companies.
Not applicable.
Item 9: Purchases of Equity Securities by Closed-End Management Investment Company and Affiliated Purchasers.
Not applicable.
Item 10: Submission of Matters to a Vote of Security Holders.
Not applicable.
Item 11: Controls and Procedures.
(a) Based on their evaluation of Registrant’s disclosure controls and procedures, as of a date within 90 days of the filing date, Registrant’s Chief Executive Officer, Jonathan de St. Paer and Registrant’s Chief Financial Officer, Mark Fischer, have concluded that Registrant’s disclosure controls and procedures are: (i) reasonably designed to ensure that information required to be disclosed in this report is appropriately communicated to Registrant’s officers to allow timely decisions regarding disclosures required in this report; (ii) reasonably designed to ensure that information required to be disclosed in this report is recorded, processed, summarized and reported in a timely manner; and (iii) are effective in achieving the goals described in (i) and (ii) above.
(b) During the period covered by this report, there have been no changes in Registrant’s internal control over financial reporting that the above officers believe to have materially affected, or to be reasonably likely to materially affect, Registrant’s internal control over financial reporting.
Item 12: Disclosure of Securities Lending Activities for Closed-End Management Investment Companies.
Not applicable.
Item 13: Exhibits.
Pursuant to the requirements of the Securities Exchange Act of 1934 and the Investment Company Act of 1940, the registrant has duly caused this report to be signed on its behalf by the undersigned, thereunto duly authorized.
| | |
| (Registrant) Laudus Trust |
| |
| By: | | /s/ Jonathan de St. Paer |
| | Jonathan de St. Paer |
| | Chief Executive Officer |
| |
| Date: | | May 17, 2021 |
Pursuant to the requirements of the Securities Exchange Act of 1934 and the Investment Company Act of 1940, this report has been signed below by the following persons on behalf of the registrant and in the capacities and on the dates indicated.
| | |
| |
| By: | | /s/ Jonathan de St. Paer |
| | Jonathan de St. Paer |
| | Chief Executive Officer |
| |
| Date: | | May 17, 2021 |
| |
| By: | | /s/ Mark Fischer |
| | Mark Fischer |
| | Chief Financial Officer |
| |
| Date: | | May 17, 2021 |