UNITED STATES
SECURITIES AND EXCHANGE COMMISSION
Washington, D.C. 20549
FORM N-CSR
CERTIFIED SHAREHOLDER REPORT OF REGISTERED
MANAGEMENT INVESTMENT COMPANIES
Investment Company Act file number
811-05549
Reynolds Funds, Inc.
(Exact name of registrant as specified in charter)
c/o U.S. Bancorp Fund Services, LLC
615 E. Michigan Street
Milwaukee, WI 53202
(Address of principal executive offices) (Zip code)
Frederick L. Reynolds
Reynolds Capital Management
290 S. Ulukoa Place
Lahaina, Hawaii 96761
(Name and address of agent for service)
(808) 661-1661
Registrant's telephone number, including area code:
Date of fiscal year end: September 30
Date of reporting period: September 30, 2007
Item 1. Reports to Stockholders.
ANNUAL REPORT
September 30, 2007
REYNOLDS BLUE CHIP GROWTH FUND Seeking Long-Term Capital Appreciation |
A No-Load Mutual Fund
1-800-773-9665
www.reynoldsfunds.com
REYNOLDS BLUE CHIP GROWTH FUND
October 30, 2007
Dear Fellow Shareholders:
The U.S. economy is growing at about a 2.3% rate in terms of GDP. This is toward the low end of a usually ideal rate, of about 2-4%. Many other developed countries in the world are growing somewhat faster. For example, the average growth in 2007 of France, Italy, Germany and the United Kingdom is about 2.7%; India is growing at about a 9% rate and China is growing at about an 11% rate. Many worldwide larger multinational companies are well positioned to benefit from this worldwide growth. To the extent that these companies’ U.S. earnings are growing a little slower, this is offset by their stronger foreign earnings. The strategy of the Reynolds Blue Chip Growth Fund is to be structured to benefit from this strong worldwide growth by investing in many of these worldwide leading multinational growth companies.
The past year can be characterized as a period of many crosscurrents in the U.S. economy including: (1) strength in the service and labor sectors somewhat offsetting weakness in the housing and auto sectors; (2) interest rates flattish and now recently declining amid volatility in financial markets; (3) recent productivity growth stronger than expected, after growing at a lower rate than previously; (4) low unemployment accompanied by slowing then recent strong job growth; (5) declining consumer confidence and a recent slowing of consumer spending, although consumer confidence is still positive; (6) a continued weakening U.S. dollar; and (7) rising oil and gold and other commodity prices. Gross Domestic Product (GDP) is still showing good growth, but is growing at a slower rate in 2007 than the last few years. GDP is estimated to increase 2.3% in calendar 2007 after increasing 2.9% in calendar 2006 and 3.1% in 2005. Inflation, as measured by the Consumer Price Index, is estimated to increase 2.7% in calendar 2007 after increasing 3.2% in 2006 and 3.4% in 2005. Although inflation is moderating, it is still above the range of 1-2% that the Federal Reserve (the Fed) is comfortable with. In addition, higher oil, gold and other commodity prices may result in higher overall inflation. As a result, the Fed has two main worries: (1) a possible future weakening U.S. economy, and (2) the threat of higher inflation.
Opportunistic Investing in Companies of Various Sizes
The Reynolds Blue Chip Growth Fund (“Blue Chip Fund”) invests in companies of various sizes as classified by their market capitalizations. The Fund usually emphasizes investments in larger companies. A company’s market capitalization is calculated by taking the number of shares the company has outstanding multiplied by its current market price. This is one way that the Blue Chip Fund differentiates its investment style. Other considerations in selecting companies for the Fund include revenue growth rates, product innovations, financial strength, management’s knowledge and experience plus the overall economic and geopolitical environments and interest rates.
Portfolio as of September 30, 2007
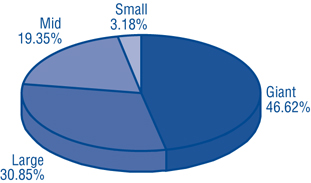
Source: Morningstar web site and Morningstar Market Cap Breakpoints
- 1 -
Morningstar separates stock portfolio holdings into five market-capitalization groups: Giant, Large, Mid, Small and Micro. Of the 5,000 largest domestic stocks in the equities database, the top 1% are categorized as Giant, the next 4% are Large, the next 15% are Mid, the next 30% are Small, and the remaining 50% are Micro. Stocks outside of the largest 5,000 are also classified as Micro.
Market caps are the minimum in each cap group; therefore, the minimum large market cap is the large-mid breakpoint and mid is the mid-small breakpoint, etc.. As of September 30, 2007 the minimums in each cap group are as follows:
| (in millions) | |
| Giant | $54,115.40 |
| Large | $12,538.77 |
| Mid | $2,267.34 |
| Small | $591.48 |
| Micro | <$591.48 |
The long-term strategy of the Blue Chip Fund is to emphasize investment in “blue chip” growth companies. In the long-term these companies build value as their earnings grow. This growth in value should ultimately be recognized in higher stock prices for these companies. The Blue Chip Fund paid an ordinary income dividend of $0.210445 per share to shareholders of record on November 5, 2007.
Performance highlights (as of September 30, 2007)
Cumulative Total Return | Average Annual Total Return | |
| One Year | 10.59% | 10.59% |
| Three years | 18.79% | 5.91% |
| Five Years | 63.44% | 10.32% |
| Ten Years | 3.19% | 0.31% |
| Since inception (August 12, 1988) | 263.56% | 6.98% |
Low Long-Term Interest Rates by Historical Standards are a Significant Positive for Stock Valuations
Long-term interest rates remain near historically low levels. Low long-term interest rates usually result in higher stock valuations for many reasons including:
| (1) | Long-term borrowing costs of corporations are lower resulting in higher business confidence and profits. |
| (2) | Long-term borrowing costs of individuals are lower which increases consumer confidence and spending. |
| (3) | A company’s stock is usually valued by placing a present value on that company’s future stream of earnings and dividends. The present value is higher when interest and inflation rates are low. |
Economic Discussion
The World Economy
Foreign economic growth remains generally strong in 2007 as macroeconomic policy generally remains supportive of good growth. Monetary policy is not overly restrictive and globalization is helping to raise real income in many foreign companies. Strong growth in the rest of the world is helping U.S. export growth. The Blue Chip Fund is positioned to participate in long-term worldwide growth trends through their investments in multinational U.S. headquartered companies. In addition, the Fund generally has investments in leading foreign headquartered companies, whose stocks or American Depositary Receipts (ADRs) trade in the United States. These ADR’s are denominated in dollars and they must use GAAP accounting to qualify as an ADR.
- 2 -
The U.S. Economy
The U.S. economy grew at a 2.7% rate in the first nine months of 2007. This was a slower rate of growth than has been the case in the last three years. However, a number of companies reported strong quarterly earnings, particularly ones with higher foreign components to their business. Some economic positives are that: (1) a scenario for a soft economic landing may be unfolding; (2) capacity utilization and capital costs remain favorable; and (3) the efficiencies of the economy resulting from such things as technology enhancements and productivity increases are quite positive. Some economic negatives are that: (1) the weak housing market and high oil prices should remain a significant drag on the U.S. economy for awhile; (2) spending for autos and other big-ticket items has been moderating; (3) the credit crunch; and (4) consumer spending may weaken further.
Consumer spending represents approximately 65% of GDP. It has been weakening, however, it remains a continued positive. Consumer spending growth should benefit from continued real income gains. GDP increased 2.9% in 2006 after increasing 3.1% in 2005, 3.9% in 2004, 2.7% in 2003, 1.9% in 2002, 0.8% in 2001 and 3.7% in 2000. GDP is estimated to increase 2.3% in 2007.
U.S. inflation increased 2.5% in the first nine months of 2007. U.S. inflation is low relative to many past years due to such factors as: (1) a slowing U.S. economy, (2) global competition, (3) advances in technology resulting in increasing productivity, and (4) technology innovations that are helping to lower production and distribution costs. U.S. inflation, as measured by the Consumer Price Index, increased 3.2% in 2006, after increasing 3.4% in 2005, 2.7% in 2004, 2.3% in 2003, 1.6% in 2002, 2.8% in 2001 and 3.4% in 2000. U.S. inflation is estimated to increase 2.7% in 2007. This is a moderating rate versus the year before. However, inflation is still above the range of 1-2% growth that the Fed is comfortable with. Inflation remains one of the Fed’s primary policy concerns along with worries regarding credit matters.
Investment Outlook
There are several investment positives. Among them are: (1) the economy is growing although at a slower rate; (2) corporate profits are still good, particularly for companies with higher overseas exposure; (3) the Fed recently lowered interest rates; (4) U.S. industry is more competitive than at any time in the past quarter century and U.S. companies are the leaders in the majority of industries worldwide; (5) although consumer spending and confidence have weakened they remain positive; (6) U. S. productivity continues to increase although at a slower rate; (7) unit labor costs have recently slowed; (8) the Internet is beginning to produce efficiencies; and (9) corporate cost cutting has been very successful.
Some possible investment negatives, which we are watching are: (1) the possibility of higher inflation resulting in such things as higher interest rates; (2) high energy prices; (3) large federal spending and federal deficits; (4) the housing slowdown including credit problems; (5) possible weakening consumer confidence; (6) the possibility that the economy slows further from here and we do not have a soft landing; (7) the possibility that the weak dollar could eventually push long- term interest rates higher; (8) a possible U.S. and/or global credit crisis; (9) efforts to slow China’s economic boom; (10) problems in Iraq; and (11) terrorism around the world. The Blue Chip Fund has temporarily adopted a more defensive position by temporarily raising the level of cash in the Fund.
Linked Money Market Fund
The First American Treasury Obligations Fund is a money market fund offered by U.S. Bancorp Fund Services, LLC, an affiliate of our Transfer Agent. This Fund is offered as a money market alternative to our shareholders. The First American Treasury Obligations Fund offers many free shareholder conveniences including automatic investment and withdrawal plans and check writing access to your funds and is linked to your holdings in the Blue Chip Fund. This Fund is also included on your quarterly statements.
Closing of the Reynolds Opportunity and Reynolds Fund
The Reynolds Opportunity Fund and Reynolds Fund were each closed and liquidated on September 6, 2007. These two Funds were liquidated because each Fund’s assets were too small to operate efficiently. The Opportunity Fund paid a short-
- 3 -
term and long-term capital gain distribution of $0.94777 and $4.7561 per share, respectively on June 15, 2007 and a special liquidating dividend of a total of $0.134 per share was paid on September 4, 2007, which consisted of an income dividend of $0.0211 and a short-term capital gain of $0.1129 before the Fund was closed and liquidated. A special liquidating income dividend of $0.00689 per share for the Reynolds Fund was paid on September 4, 2007 before the Fund was closed and liquidated.
Information about the Reynolds Blue Chip Growth Fund and the First American Treasury Obligations Fund
Reynoldsfunds.com website: You can access current information about your investment holdings via our website, reynoldsfunds.com. You must first request a personal identification number (PIN) by calling our shareholder service representatives at (800) 773-9665. You will be able to view your account list, account detail (including balances), transaction history, distributions, and the current Reynolds Blue Chip Growth Fund net asset value. Additional information available (PIN number not needed) includes quarterly updates of the returns of the Blue Chip Fund, top ten holdings and industry percentages. Also, detailed statistics and graphs of past performances from a link to MSN Money for the Blue Chip Fund.
For automatic current daily net asset values: Call 1-800-773-9665 (1-800-7REYNOLDS) twenty-four hours-a-day, seven days a week and press “any key” then “1”. The updated current net asset value for the Blue Chip Fund is usually available each business day after 5 P.M. (PST).
For First American Treasury Obligations Fund current one and seven day yields: Call 1-800-773-9665 and press “any key” then “1”.
For shareholders to automatically access their current account information: Call 1-800-773-9665 (twenty-four hours-a-day, seven days a week), press “any key” then “2” and enter your 16 digit account number which appears at the top right of your statement.
To speak to a Fund representative regarding the current daily net asset value, current account information and any other questions: Call 1-800-773-9665 and press “0” from 6 A.M. to 5 P.M. (PST).
Shareholder statement frequency: Consolidated statements summarizing the Blue Chip Fund and First American Treasury Obligations Fund accounts held by a shareholder are sent quarterly. In addition, individual Blue Chip Fund statements are sent whenever a transaction occurs. These transactions are: (1) statements are sent for the Blue Chip or First American Treasury Obligations Fund when a shareholder purchases or redeems shares; (2) Blue Chip Fund statements are sent twice a year if, and when, any ordinary income or capital gains are distributed.
Tax reporting: Individual 1099 forms, which summarize any dividend income and any long- or short-term capital gains, are sent annually to shareholders each January. The percentage of income earned from various government securities, if any, for the Blue Chip and the First American Treasury Obligations Fund are also reported in January.
Minimum investment: $1,000 for regular and retirement accounts ($100 for additional investments for all accounts – except for the Automatic Investment Plan, which is $50 for regular and retirement plan accounts).
Prototype plans for retirement plans: All types are offered including the Roth IRA, Coverdell Education Savings Account, SIMPLE IRA Plan, 401(k), SEP IRA, 403b and Fund Sponsored Qualified Retirement Plans.
Automatic Investment Plan: There is no charge to automatically debit your checking account to invest in the Blue Chip Fund or the First American Treasury Obligations Fund ($50 minimum for either of these Funds) at periodic intervals to make automatic purchases in either of these Funds. This is useful for dollar cost averaging for the Blue Chip Fund.
Systematic Withdrawal Plan: For shareholders with a $10,000 minimum starting balance, there is no charge to automatically redeem shares ($100 minimum) in the Blue Chip Fund or the First American Treasury Obligations Fund as often as monthly and send a check to you or transfer funds to your bank account.
- 4 -
Free Check Writing: Free check writing ($100 minimum) is offered for accounts invested in the First American Treasury Obligations Fund.
Exchanges or regular redemptions between the Blue Chip Fund and the First American Treasury Obligations Fund: As often as desired – no charge.
NASDAQ symbols: Reynolds Blue Chip Growth Fund – RBCGX and First American Treasury Obligations Fund – FATXX.
Portfolio Manager: Frederick Reynolds is the portfolio manager of the Reynolds Blue Chip Growth Fund.
The Blue Chip Fund and the First American Treasury Obligations Fund are No-Load: No front-end sales commissions or deferred sales charges (“loads”) are charged. Over 40% of all mutual funds impose these marketing charges that are ultimately paid by the shareholder. These marketing charges are either: (1) a front-end fee or “load” in which up to 5% of a shareholder’s assets are deducted from the original investment (some funds even charge a fee when a shareholder reinvests capital gains or dividends); or (2) a back-end penalty fee or “load” which is typically deducted from a shareholder’s account if a shareholder redeems within five years of the original investment. These fees reduce a shareholder’s return. The Blue Chip Fund and First American Treasury Obligations Fund are No-Load as they do not have these extra charges.
We appreciate your continued confidence in the Reynolds Blue Chip Growth Fund and would like to welcome our new shareholders. We look forward to strong results in the future.
Sincerely,

Frederick L. Reynolds
President
This report is not authorized for use as an offer of sale or a solicitation of an offer to buy shares of the Reynolds Blue Chip Growth Fund unless accompanied or preceded by the Fund’s current prospectus. Performance data quoted represents past performance; past performance does not guarantee future results. The investment return and principal value of an investment will fluctuate so that an investor’s shares, when redeemed, may be worth more or less than their original cost. Current performance of the Fund may be lower or higher than the performance quoted. Performance data current to the most recent month end may be obtained by visiting www.reynoldsfunds.com.
- 5 -
Reynolds Blue Chip Growth Fund
COST DISCUSSION
As a shareholder of the Reynolds Blue Chip Growth Fund, you do not incur (except as described below) transaction costs, including sales charges (loads) on purchase payments, reinvested dividends, or other distributions; redemption fees; and exchange fees, but do incur ongoing costs, including management fees; distribution [and/or service] (12b-1) fees; and other Fund expenses. This example is intended to help you understand your ongoing costs (in dollars) of investing in the Fund and to compare these costs with the ongoing costs of investing in other mutual funds.
The examples are based on an investment of $1,000 invested at the beginning of the period and held for the entire period from April 1, 2007 through September 30, 2007.
Actual Expenses
The first line of the table below provides information about actual account values and actual expenses. You may use the information in this line, together with the amount you invested, to estimate the expenses that you paid over the period. Simply divide your account value by $1,000 (for example, an $8,600 account value divided by $1,000 = 8.6), then multiply the result by the number in the first line under the heading entitled “Expenses Paid During Period” to estimate the expenses you paid on your account during this period.
In addition to the costs highlighted and described below, the only Fund transaction costs you might currently incur would be wire fees ($15 per wire), if you choose to have proceeds from a redemption wired to your bank account instead of receiving a check. Additionally, U.S. Bank charges an annual processing fee ($15) if you maintain an IRA account with the Fund. To determine your total costs of investing in the Fund, you would need to add any applicable wire or IRA processing fees you’ve incurred during the period to the costs provided in the example below.
Hypothetical Example for Comparison Purposes
The second line of the table below provides information about hypothetical account values and hypothetical expenses based on the Fund’s actual expense ratio and an assumed rate of return of 5% per year before expenses, which is not the Fund’s actual return. The hypothetical account values and expenses may not be used to estimate the actual ending account balance or expenses you paid for the period. You may use this information to compare the ongoing costs of investing in the Fund and other funds. To do so, compare this 5% hypothetical example with the 5% hypothetical examples that appear in the shareholder reports of the other funds.
Please note that the expenses shown in the table are meant to highlight your ongoing costs only and do not reflect any transactional costs, such as sales charges (loads), redemption or exchange fees. Therefore, the second line of the table is useful in comparing ongoing costs only, and will not help you determine the relative total costs of owning different funds. In addition, if these transactional costs were included, your costs would have been higher.
| Beginning Account | Ending Account | Expenses Paid During | |
Value 4/1/07 | Value 9/30/07 | Period* 4/1/07-9/30/07 | |
| Reynolds Blue Chip Growth Fund Actual | $1,000.00 | $1,062.70 | $10.50 |
| Hypothetical (5% return before expenses) | $1,000.00 | $1,014.90 | $10.25 |
| * | Expenses are equal to the Fund’s annualized expense ratio of 2.03% multiplied by the average account value over the period, multiplied by 183/365 (to reflect the one-half year period between April 1, 2007 and September 30, 2007). |
- 6 -
Reynolds Blue Chip Growth Fund
MANAGEMENT’S DISCUSSION OF FUND PERFORMANCE
The Reynolds Blue Chip Growth Fund’s performance was positively affected in its fiscal year ended September 30, 2007 by, among other things, strong worldwide economies and corporate earnings and the Federal Reserve’s recent lowering of interest rates. The Fund’s performance was negatively affected by, among other things; high energy costs, worries regarding credit, flat to declining home prices and geopolitical events. The Blue Chip Fund was particularly helped by its emphasis on growth stocks in industries with stronger long-term outlooks, including: (1) Communications such as Nokia; (2) Defense such as General Dynamics; (3) Entertainment/Media such as Apple, Inc.; (4) Financial Services such as Goldman Sachs; (5) Internet such as Google Inc.; (6) Restaurants such as McDonald’s; and (7) some Retail Stores such as Costco. The Blue Chip Fund was negatively affected by, among other things, its holdings in: (1) Building Materials Retailers such as Home Depot; and (2) some Retail Stores such as Wal-Mart Stores. During the twelve months ended September 30, 2007 the S&P 500 increased 16.44% and the Blue Chip Fund increased 10.59%. The Blue Chip Fund underperformed the S&P 500 during this period due to underperforming allocations among some industries and individual companies and a higher than normal cash allocation as the Fund went to a temporary defensive position.
COMPARISON OF CHANGE IN VALUE OF $10,000 INVESTMENT IN REYNOLDS BLUE CHIP GROWTH FUND AND S&P 500 INDEX(1) | ||
 | ||
Past performance does not predict future performance. The graph and the table do not reflect the deduction of taxes that a shareholder would pay on Fund distributions or the redemption of Fund shares. |
| AVERAGE ANNUAL TOTAL RETURN | ||
| 1-YEAR | 5-YEAR | 10-YEAR |
| 10.59% | 10.32% | 0.31% |
| (1) | The S&P 500 is an unmanaged market capitalization-weighted index which is comprised of 500 of the largest U.S. domiciled companies and includes the reinvestment of all dividends. Investors cannot invest directly in an index or benchmark. |
- 7 -
Reynolds Blue Chip Growth Fund
STATEMENT OF NET ASSETS
September 30, 2007
Shares | Value | ||||||
COMMON STOCKS — 93.8% (a) | |||||||
Aerospace — 5.0% | |||||||
| 3,500 | Boeing Co. | $ | 367,465 | ||||
| 2,500 | General Dynamics Corp. | 211,175 | |||||
| 1,000 | Honeywell International Inc. | 59,470 | |||||
| 1,000 | Northrop Grumman Corp. | 78,000 | |||||
| 3,000 | Raytheon Co. | 191,460 | |||||
| 1,500 | Rockwell Collins, Inc. | 109,560 | |||||
| 4,000 | United Technologies Corp. | 321,920 | |||||
| 1,339,050 | |||||||
Aluminum — 0.2% | |||||||
| 1,500 | Alcoa Inc. | 58,680 | |||||
Apparel — 0.4% | |||||||
| 1,500 | Crocs, Inc.* | 100,875 | |||||
Application Software — 1.4% | |||||||
| 2,000 | Advent Software, Inc.* | 93,940 | |||||
| 1,000 | BMC Software, Inc.* | 31,230 | |||||
| 5,500 | Oracle Corp.* | 119,075 | |||||
| 2,000 | SAP AG SP-ADR | 117,340 | |||||
| 361,585 | |||||||
Banks — 0.7% | |||||||
| 2,500 | Toronto-Dominion Bank | 191,700 | |||||
Beverages — 2.7% | |||||||
| 3,000 | The Coca-Cola Co. | 172,410 | |||||
| 1,000 | Diageo PLC - SP-ADR | 87,730 | |||||
| 3,400 | Hansen Natural Corp.* | 192,712 | |||||
| 3,500 | PepsiCo, Inc. | 256,410 | |||||
| 709,262 | |||||||
Biotechnology — 0.9% | |||||||
| 1,000 | Amgen Inc.* | 56,570 | |||||
| 1,000 | Genentech, Inc.* | 78,020 | |||||
| 2,500 | Gilead Sciences, Inc.* | 102,175 | |||||
| 236,765 | |||||||
Business Software & Services — 1.4% | |||||||
| 1,000 | Automatic Data Processing, Inc. | 45,930 | |||||
| 3,500 | BEA Systems, Inc.* | 48,545 | |||||
| 3,000 | Cognizant Technology | ||||||
| Solutions Corp.* | 239,310 | ||||||
| 1,000 | Fiserv, Inc.* | 50,860 | |||||
| 384,645 | |||||||
Chemicals — 4.0% | |||||||
| 4,000 | 3M Co. | 374,320 | |||||
| 3,500 | Air Products and Chemicals, Inc. | 342,160 | |||||
| 4,000 | Monsanto Co. | 342,960 | |||||
| 1,059,440 | |||||||
Chemicals-Specialty — 0.8% | |||||||
| 3,000 | Airgas, Inc. | 154,890 | |||||
| 1,000 | International Flavors & | ||||||
| Fragrances Inc. | 52,860 | ||||||
| 207,750 | |||||||
Communication Equipment — 1.6% | |||||||
| 7,500 | Cisco Systems Inc.* | 248,325 | |||||
| 4,000 | QUALCOMM Inc. | 169,040 | |||||
| 417,365 | |||||||
Computer & Peripherals — 2.7% | |||||||
| 3,000 | Dell Inc.* | 82,800 | |||||
| 5,500 | EMC Corp.* | 114,400 | |||||
| 3,500 | Hewlett-Packard Co. | 174,265 | |||||
| 3,000 | International Business | ||||||
| Machines Corp. | 353,400 | ||||||
| 724,865 | |||||||
Computer Software & Services — 0.7% | |||||||
| 2,500 | Ariba, Inc.* | 26,950 | |||||
| 1,000 | Autodesk, Inc.* | 49,970 | |||||
| 3,000 | Citrix Systems, Inc.* | 120,960 | |||||
| 197,880 | |||||||
Drugs — 1.6% | |||||||
| 1,500 | Celgene Corp.* | 106,965 | |||||
| 2,000 | Merck & Co. Inc. | 103,380 | |||||
| 1,000 | Novo Nordisk A/S - SP-ADR | 121,040 | |||||
| 1,500 | Pfizer Inc. | 36,645 | |||||
| 1,500 | Schering-Plough Corp. | 47,445 | |||||
| 415,475 | |||||||
Electrical Equipment — 1.0% | |||||||
| 3,000 | Emerson Electric Co. | 159,660 | |||||
| 1,000 | General Electric Co. | 41,400 | |||||
| 1,000 | Rockwell Automation, Inc. | 69,510 | |||||
| 270,570 | |||||||
Energy-Services — 5.2% | |||||||
| 1,000 | Baker Hughes Inc. | 90,370 | |||||
| 2,000 | Cameron International Corp.* | 184,580 | |||||
- 8 -
Reynolds Blue Chip Growth Fund
STATEMENT OF NET ASSETS (Continued)
September 30, 2007
Shares | Value | ||||||
COMMON STOCKS — 93.8% (a) (Continued) | |||||||
Energy-Services — 5.2% (Continued) | |||||||
| 500 | Core Laboratories N.V.* | $ | 63,695 | ||||
| 2,000 | Diamond Offshore Drilling, Inc. | 226,580 | |||||
| 1,000 | Halliburton Co. | 38,400 | |||||
| 1,000 | Helmerich & Payne, Inc. | 32,830 | |||||
| 500 | National-Oilwell Varco Inc.* | 72,250 | |||||
| 1,000 | Noble Corp. | 49,050 | |||||
| 3,000 | Schlumberger Ltd. | 315,000 | |||||
| 3,000 | Smith International, Inc. | 214,200 | |||||
| 1,000 | Transocean Inc.* | 113,050 | |||||
| 1,400,005 | |||||||
Engineering/Construction — 1.0% | |||||||
| 1,000 | Fluor Corp. | 143,980 | |||||
| 1,000 | Foster Wheeler Ltd.* | 131,280 | |||||
| 275,260 | |||||||
Entertainment/Media — 6.9% | |||||||
| 10,000 | Apple, Inc.* | 1,535,400 | |||||
| 1,500 | The Walt Disney Co. | 51,585 | |||||
| 4,000 | GameStop Corp.* | 225,400 | |||||
| 1,500 | News Corp. Cl A | 32,985 | |||||
| 1,845,370 | |||||||
Financial Services — 3.8% | |||||||
| 500 | Dun & Bradstreet Corp. | 49,305 | |||||
| 2,000 | Goldman Sachs Group, Inc. | 433,480 | |||||
| 1,000 | Lehman Brothers | ||||||
| Holdings Inc. | 61,730 | ||||||
| 500 | MasterCard, Inc. | 73,985 | |||||
| 1,000 | Merrill Lynch & Co., Inc. | 71,280 | |||||
| 2,500 | Nasdaq Stock Market Inc.* | 94,200 | |||||
| 1,000 | NYSE Euronext | 79,170 | |||||
| 3,500 | Charles Schwab Corp. | 75,600 | |||||
| 1,000 | State Street Corp. | 68,160 | |||||
| 1,006,910 | |||||||
Foods — 0.5% | |||||||
| 1,000 | Campbell Soup Co. | 37,000 | |||||
| 1,500 | Kellogg Co. | 84,000 | |||||
| 121,000 | |||||||
Gold & Silver — 0.9% | |||||||
| 1,500 | Barrick Gold Corp. | 60,420 | |||||
| 4,000 | Newmont Mining Corp. | 178,920 | |||||
| 239,340 | |||||||
Grocery Stores — 0.4% | |||||||
| 1,500 | Safeway Inc. | 49,665 | |||||
| 1,000 | Whole Foods Market, Inc. | 48,960 | |||||
| 98,625 | |||||||
Home Appliances — 0.3% | |||||||
| 1,000 | Black & Decker Corp. | 83,300 | |||||
Hotel — 0.7% | |||||||
| 1,000 | Marriott International, Inc. | 43,470 | |||||
| 2,500 | Starwood Hotels & | ||||||
| Resorts Worldwide, Inc.* | 151,875 | ||||||
| 195,345 | |||||||
Household Products — 2.7% | |||||||
| 3,000 | Chattem, Inc.* | 211,560 | |||||
| 1,000 | Clorox Co. | 60,990 | |||||
| 3,500 | Colgate-Palmolive Co. | 249,620 | |||||
| 3,000 | Procter & Gamble Co. | 211,020 | |||||
| 733,190 | |||||||
Industrial Equipment & Components — 0.2% | |||||||
| 500 | Parker Hannifin Corp. | 55,915 | |||||
Industrial Metals & Minerals — 2.0% | |||||||
| 1,500 | Allegheny Technologies, Inc. | 164,925 | |||||
| 2,000 | RTI International Metals, Inc.* | 158,520 | |||||
| 6,500 | Titanium Metals Corp.* | 218,140 | |||||
| 541,585 | |||||||
Instruments — 0.5% | |||||||
| 500 | Garmin Ltd. | 59,700 | |||||
| 1,000 | Waters Corp.* | 66,920 | |||||
| 126,620 | |||||||
Insurance — 1.1% | |||||||
| 1,000 | American International | ||||||
| Group, Inc. | 67,650 | ||||||
| 2,500 | China Life Insurance | ||||||
| Company, Ltd. ADR | 215,550 | ||||||
| 283,200 | |||||||
Integrated Oil & Gas — 1.2% | |||||||
| 1,000 | ConocoPhillips | 87,770 | |||||
| 1,000 | Noble Energy, Inc. | 70,040 | |||||
| 1,000 | Occidental Petroleum Corp. | 64,080 | |||||
| 1,000 | Suncor Energy, Inc. | 94,810 | |||||
| 316,700 | |||||||
- 9 -
Reynolds Blue Chip Growth Fund
STATEMENT OF NET ASSETS (Continued)
September 30, 2007
Shares | Value | ||||||
COMMON STOCKS — 93.8% (a) (Continued) | |||||||
Internet Information Providers — 6.4% | |||||||
| 2,550 | Google Inc.* | $ | 1,446,539 | ||||
| 3,500 | Sohu.com Inc.* | 131,985 | |||||
| 4,500 | Yahoo! Inc.* | 120,780 | |||||
| 1,699,304 | |||||||
Internet Software & Services — 0.4% | |||||||
| 2,000 | SINA Corp* | 95,700 | |||||
Machinery — 1.7% | |||||||
| 3,500 | Caterpillar Inc. | 274,505 | |||||
| 500 | Cummins Inc. | 63,945 | |||||
| 500 | Deere & Co. | 74,210 | |||||
| 1,000 | Joy Global Inc. | 50,860 | |||||
| 463,520 | |||||||
Medical Services — 2.3% | |||||||
| 1,000 | Aetna Inc. | 54,270 | |||||
| 2,000 | Humana Inc.* | 139,760 | |||||
| 2,000 | Medco Health Solutions, Inc.* | 180,780 | |||||
| 1,500 | WellCare Health Plans Inc.* | 158,145 | |||||
| 1,000 | WellPoint Inc.* | 78,920 | |||||
| 611,875 | |||||||
Medical Supplies — 3.3% | |||||||
| 2,000 | Abbott Laboratories | 107,240 | |||||
| 1,000 | Baxter International Inc. | 56,280 | |||||
| 2,000 | Becton, Dickinson & Co. | 164,100 | |||||
| 1,500 | C. R. Bard, Inc. | 132,285 | |||||
| 4,500 | Johnson & Johnson | 295,650 | |||||
| 1,000 | McKesson Corp. | 58,790 | |||||
| 1,000 | Medtronic, Inc. | 56,410 | |||||
| 870,755 | |||||||
Metals & Mining — 1.5% | |||||||
| 1,000 | Freeport-McMoRan | ||||||
| Copper & Gold, Inc. | 104,890 | ||||||
| 4,000 | Northern Orion Resources Inc.* | 25,720 | |||||
| 2,000 | Potash Corporation | ||||||
| of Saskatchewan Inc. | 211,400 | ||||||
| 500 | Southern Copper Corp. | 61,915 | |||||
| 403,925 | |||||||
Natural Gas — 1.1% | |||||||
| 2,000 | Devon Energy Corp. | 166,400 | |||||
| 1,000 | EOG Resources, Inc. | 72,330 | |||||
| 1,000 | XTO Energy, Inc. | 61,840 | |||||
| 300,570 | |||||||
Oil & Gas Refining & Marketing — 0.9% | |||||||
| 1,000 | Murphy Oil Corp. | 69,890 | |||||
| 700 | Sunoco, Inc. | 49,546 | |||||
| 1,000 | Tesoro Corp. | 46,020 | |||||
| 1,000 | Valero Energy Corp. | 67,180 | |||||
| 232,636 | |||||||
Recreation — 0.6% | |||||||
| 500 | Las Vegas Sands Corp.* | 66,710 | |||||
| 1,000 | MGM MIRAGE* | 89,440 | |||||
| 156,150 | |||||||
Restaurants — 2.0% | |||||||
| 2,500 | Chipotle Mexican Grill, Inc.* | 295,325 | |||||
| 2,000 | Darden Restaurants, Inc. | 83,720 | |||||
| 1,500 | McDonald’s Corp. | 81,705 | |||||
| 2,500 | Yum! Brands, Inc. | 84,575 | |||||
| 545,325 | |||||||
Retail-Specialty — 3.2% | |||||||
| 1,000 | Abercrombie & Fitch Co. | 80,700 | |||||
| 2,000 | Amazon.com, Inc.* | 186,300 | |||||
| 1,000 | American Eagle Outfitters, Inc. | 26,310 | |||||
| 500 | AutoZone, Inc.* | 58,070 | |||||
| 500 | Best Buy Co., Inc. | 23,010 | |||||
| 5,500 | eBay Inc.* | 214,610 | |||||
| 1,500 | Limited Brands, Inc. | 34,335 | |||||
| 2,000 | NIKE, Inc. Cl B | 117,320 | |||||
| 1,000 | OfficeMax Inc. | 34,270 | |||||
| 1,500 | Overstock.com, Inc.* | 43,200 | |||||
| 1,000 | Walgreen Co. | 47,240 | |||||
| 865,365 | |||||||
Retail Stores — 1.1% | |||||||
| 1,000 | Costco Wholesale Corp. | 61,370 | |||||
| 2,000 | J.C. Penney Company, Inc. | 126,740 | |||||
| 1,000 | Longs Drug Stores Corp. | 49,670 | |||||
| 500 | Nordstrom, Inc. | 23,445 | |||||
| 1,000 | Wal-Mart Stores, Inc. | 43,650 | |||||
| 304,875 | |||||||
Semiconductor Capital Spending — 0.2% | |||||||
| 1,500 | Novellus Systems, Inc.* | 40,890 | |||||
- 10 -
Reynolds Blue Chip Growth Fund
STATEMENT OF NET ASSETS (Continued)
September 30, 2007
Shares | Value | ||||||
COMMON STOCKS — 93.8% (a) (Continued) | |||||||
Semiconductors — 2.2% | |||||||
| 4,000 | Intel Corp. | $ | 103,440 | ||||
| 6,000 | NVIDIA Corp.* | 217,440 | |||||
| 8,000 | ON Semiconductor Corp.* | 100,480 | |||||
| 4,000 | RF Micro Devices, Inc.* | 26,920 | |||||
| 4,000 | Texas Instruments Inc. | 146,360 | |||||
| 594,640 | |||||||
Services — 1.9% | |||||||
| 1,500 | Expedia, Inc.* | 47,820 | |||||
| 1,000 | Expeditors International | ||||||
| of Washington, Inc. | 47,300 | ||||||
| 1,500 | ITT Educational Services, Inc.* | 182,535 | |||||
| 2,500 | Priceline.com Inc.* | 221,875 | |||||
| 499,530 | |||||||
Steels — 2.5% | |||||||
| 2,000 | ArcelorMittal – NYS | 156,720 | |||||
| 1,500 | Commercial Metals Co. | 47,475 | |||||
| 4,000 | Companhia Vale | ||||||
| do Rio Doce ADR | 135,720 | ||||||
| 1,000 | Nucor Corp. | 59,470 | |||||
| 2,500 | United States Steel Corp. | 264,850 | |||||
| 664,235 | |||||||
System Software — 0.3% | |||||||
| 1,500 | Infosys Technologies | ||||||
| Ltd. SP-ADR | 72,585 | ||||||
Telephone Services — 1.3% | |||||||
| 4,500 | AT&T Inc. | 190,395 | |||||
| 3,500 | Verizon Communications Inc. | 154,980 | |||||
| 345,375 | |||||||
Transportation — 0.3% | |||||||
| 1,000 | PACCAR Inc | 85,250 | |||||
Utilities — 0.3% | |||||||
| 1,000 | Constellation Energy Group | 85,790 | |||||
Wireless Communication — 7.8% | |||||||
| 3,000 | Brightpoint, Inc.* | 45,030 | |||||
| 3,000 | China Mobile Ltd. SP-ADR | 246,120 | |||||
| 2,500 | Motorola, Inc. | 46,325 | |||||
| 5,500 | Nokia Corp. SP-ADR | 208,615 | |||||
| 13,100 | Research In Motion Ltd.* | 1,291,005 | |||||
| 1,500 | Vimpel-Communications | ||||||
| SP-ADR | 40,560 | ||||||
| 5,500 | Vodafone Group PLC - SP-ADR | 199,650 | |||||
| 2,077,305 | |||||||
| Total common stocks | |||||||
| (cost $23,042,510) | 25,013,872 | ||||||
Principal Amount | |||||||
SHORT-TERM INVESTMENTS — 21.1% (a) | |||||||
Variable Rate Demand Notes — 21.1% | |||||||
| $ | 1,500,000 | American Family | |||||
| Financial Services, 4.24% | 1,500,000 | ||||||
| 2,632,555 | U.S. Bank, N.A., 4.88% | 2,632,555 | |||||
| 1,500,000 | Wisconsin Corporate Central | ||||||
| Credit Union, 4.80% | 1,500,000 | ||||||
| Total short-term investments | |||||||
| (cost $5,632,555) | 5,632,555 | ||||||
| Total investments | |||||||
| (cost $28,675,065) | 30,646,427 | ||||||
| Liabilities, less cash and | |||||||
receivables — (14.9%) (a) | (3,976,654 | ) | |||||
Net Assets | $ | 26,669,773 | |||||
| Net Asset Value Per Share | |||||||
| ($0.01 par value, 40,000,000 | |||||||
| shares authorized), offering | |||||||
| and redemption price | |||||||
| ($26,669,773 Ö 832,064 | |||||||
| shares outstanding) | $ | 32.05 | |||||
| * | Non-income producing security. |
| (a) | Percentages for the various classifications relate to net assets. |
ADR – American Depositary Receipts
SP-ADR – Sponsored American Depositary Receipts
N.V. – Netherlands Antillies Limited Liability Corp.
NYS – New York Registered Shares
The accompanying notes to financial statements are an integral part of this statement.
- 11 -
Reynolds Blue Chip Growth Fund
STATEMENT OF OPERATIONS
For the Year Ended September 30, 2007
INCOME: | ||||
| Dividends | $ | 167,526 | ||
| Interest | 631,891 | |||
| Total income | 799,417 | |||
EXPENSES: | ||||
| Management fees | 310,901 | |||
| Transfer agent fees | 103,998 | |||
| Administrative and accounting services | 64,652 | |||
| Professional fees | 45,839 | |||
| Printing and postage expense | 38,718 | |||
| Insurance expense | 31,134 | |||
| Custodian fees | 27,499 | |||
| Distribution fees | 25,205 | |||
| Registration fees | 22,063 | |||
| Board of Directors fees | 11,000 | |||
| Other expenses | 17,862 | |||
| Total expenses before reimbursement | 698,871 | |||
| Less expenses reimbursed by adviser | (70,714 | ) | ||
| Net expenses | 628,157 | |||
NET INVESTMENT INCOME | 171,260 | |||
NET REALIZED GAIN ON INVESTMENTS | 2,019,471 | |||
NET CHANGE IN UNREALIZED APPRECIATION ON INVESTMENTS | 1,043,048 | |||
NET GAIN ON INVESTMENTS | 3,062,519 | |||
NET INCREASE IN NET ASSETS RESULTING FROM OPERATIONS | $ | 3,233,779 | ||
The accompanying notes to financial statements are an integral part of this statement.
- 12 -
Reynolds Blue Chip Growth Fund
STATEMENTS OF CHANGES IN NET ASSETS
For the Years Ended September 30, 2007 and 2006
2007 | 2006 | |||||||
OPERATIONS: | ||||||||
| Net investment income (loss) | $ | 171,260 | $ | (256,831 | ) | |||
| Net realized gain on investments | 2,019,471 | 9,832,798 | ||||||
| Net increase (decrease) in unrealized appreciation on investments | 1,043,048 | (9,881,632 | ) | |||||
| Net increase (decrease) in net assets resulting from operations | 3,233,779 | (305,665 | ) | |||||
FUND SHARE ACTIVITIES: | ||||||||
| Proceeds from shares issued (129,647 and 93,795 shares, respectively) | 4,063,442 | 2,815,296 | ||||||
| Cost of shares redeemed (618,779 and 619,340 shares, respectively) | (18,914,965 | ) | (18,663,544 | ) | ||||
| Net decrease in net assets derived from Fund share activities | (14,851,523 | ) | (15,848,248 | ) | ||||
| TOTAL DECREASE | (11,617,744 | ) | (16,153,913 | ) | ||||
| NET ASSETS AT THE BEGINNING OF THE YEAR | 38,287,517 | 54,441,430 | ||||||
| NET ASSETS AT THE END OF THE YEAR (Includes accumulated | ||||||||
| net investment income (loss) of $171,260 and $(256,831), respectively) | $ | 26,669,773 | $ | 38,287,517 | ||||
The accompanying notes to financial statements are an integral part of these statements.
- 13 -
Reynolds Blue Chip Growth Fund
FINANCIAL HIGHLIGHTS
(Selected data for each share of the Fund outstanding throughout each year)
Years Ended September 30, | ||||||||||||||||||||
2007 | 2006 | 2005 | 2004 | 2003 | ||||||||||||||||
PER SHARE OPERATING PERFORMANCE: | ||||||||||||||||||||
| Net asset value, beginning of year | $ | 28.98 | $ | 29.48 | $ | 26.98 | $ | 27.93 | $ | 19.61 | ||||||||||
| Income from investment operations: | ||||||||||||||||||||
| Net investment income (loss) | 0.17 | (0.17 | ) | (0.34 | ) | (0.40 | ) | (0.22 | ) | |||||||||||
| Net realized and unrealized gains (losses) on investments | 2.90 | (0.33 | ) | 2.84 | (0.55 | )* | 8.54 | |||||||||||||
| Total from investment operations | 3.07 | (0.50 | ) | 2.50 | (0.95 | ) | 8.32 | |||||||||||||
| Less distributions: | ||||||||||||||||||||
| Distributions from net investment income | — | — | — | — | — | |||||||||||||||
| Distributions from net realized gains | — | — | — | — | — | |||||||||||||||
| Total from distributions | — | — | — | — | — | |||||||||||||||
| Net asset value, end of year | $ | 32.05 | $ | 28.98 | $ | 29.48 | $ | 26.98 | $ | 27.93 | ||||||||||
TOTAL RETURN | 10.59% | (1.70% | ) | 9.27% | (3.44% | ) | 42.43% | |||||||||||||
RATIOS/SUPPLEMENTAL DATA: | ||||||||||||||||||||
| Net assets, end of year (in 000’s $) | 26,670 | 38,288 | 54,441 | 84,210 | 138,903 | |||||||||||||||
| Ratio of expenses (after reimbursement) to average net assets** | 2.02% | 2.01% | 1.80% | 1.63% | 1.74% | |||||||||||||||
| Ratio of net investment income (loss) to average net assets*** | 0.55% | (0.55% | ) | (1.18% | ) | (1.33% | ) | (0.88% | ) | |||||||||||
| Portfolio turnover rate | 313.0% | 280.9% | 167.6% | 94.0% | 83.7% | |||||||||||||||
| * | The amount shown may not correlate with the aggregate gains and losses of portfolio securities due to the timing of subscriptions and redemptions of Fund shares. |
| ** | Computed after giving effect to adviser’s expense limitation undertaking. If the Fund had paid all of its expenses for the year ended September 30, 2007, the ratio would have been 2.25%. |
| *** | If the Fund had paid all of its expenses for the year ended September 30,2007, the ratio would have been 0.32%. |
The accompanying notes to financial statements are an integral part of this statement.
- 14 -
Reynolds Blue Chip Growth Fund
NOTES TO FINANCIAL STATEMENTS
September 30, 2007
(1) Summary of Significant Accounting Policies —
The following is a summary of significant accounting policies of the Reynolds Funds, Inc. (the "Company"), which is registered as a diversified, open-end management investment company under the Investment Company Act of 1940, as amended. This Company consists of one fund: the Reynolds Blue Chip Growth Fund (the "Fund"). The Company was incorporated under the laws of Maryland on April 28,1988.
The investment objective of the Fund is to produce long-term growth of capital by investing in a diversified portfolio of common stocks issued by well-established growth companies commonly referred to as "blue chip" companies.
(a) Each security, excluding short-term investments, is valued at the last sale price reported by the principal security exchange on which the issue is traded, or if no sale is reported, the latest bid price. Securities which are traded on the Nasdaq National Markets are valued at the Nasdaq Official Closing Price, or if no sale is reported, the latest bid price. Short-term investments with maturities of 60 days or less are valued at amortized cost which approximates value. Securities for which quotations are not readily available are valued at fair value as determined by the investment adviser under the supervision of the Board of Directors. The fair value of a security is the amount which the Fund might receive upon a current sale. The fair value of a security may differ from the last quoted price and the Fund may not be able to sell a security at the fair value. Market quotations may not be available, for example, if trading in particular securities was halted during the day and not resumed prior to the close of trading on the New York Stock Exchange. For financial reporting purposes, investment transactions are recorded on the trade date.
In September 2006, the Financial Accounting Standards Board ("FASB") issued Statement of Financial Accounting Standards ("SFAS") No. 157, "Fair Value Measurements." This standard establishes a single authoritative definition of fair value, sets out a framework for measuring fair value and requires additional disclosures about fair value measurements. SFAS No. 157 applies to fair value measurements already required or permitted by existing standards. SFAS No. 157 is effective for financial statements issued for fiscal years beginning after November 15, 2007 and interim periods within those fiscal years. The changes to current generally accepted accounting principles from the application of this standard relate to the definition of fair value, the methods used to measure fair value, and the expanded disclosures about fair value measurements. The Fund does not believe the adoption of SFAS No. 157 will impact the financial statement amounts; however, additional disclosures may be required about the inputs used to develop the measurements and the effect of certain of the measurements included within the Statement of Operations for the period.
(b) Net realized gains and losses on sales of securities are computed on the identified cost basis.
(c) The Fund records dividend income on the ex-dividend date and interest income on an accrual basis.
(d) The Fund has investments in short-term variable rate demand notes, which are unsecured instruments. The Fund may be susceptible to credit risk with respect to these notes to the extent the issuer defaults on its payment obligation. The Fund’s policy is to monitor the creditworthiness of the issuer and nonperformance by these issuers is not anticipated.
(e) Accounting principles generally accepted in the United States of America ("GAAP") require that permanent differences between income for financial reporting and tax purposes be reclassified in the capital accounts.
(f) The preparation of financial statements in conformity with GAAP requires management to make estimates and assumptions that affect the reported amounts of assets and liabilities and disclosure of contingent assets and liabilities at the date of the financial statements and the reported amounts of revenues and expenses during the reporting period. Actual results could differ from these estimates.
(g) No provision has been made for Federal income taxes since the Fund has elected to be taxed as a "regulated investment company" and intends to distribute substantially all net investment company taxable income and net capital gains to shareholders and otherwise comply with the provisions of the Internal Revenue Code applicable to regulated investment companies.
- 15 -
Reynolds Blue Chip Growth Fund
NOTES TO FINANCIAL STATEMENTS (Continued)
September 30, 2007
(1) Summary of Significant Accounting Policies — (Continued)
On July 13, 2006, the FASB released SFAS Interpretation No. 48 "Accounting for Uncertainty in Income Taxes" ("FIN 48"). FIN 48 provides guidance for how uncertain tax positions should be recognized, measured, presented and disclosed in the financial statements. FIN 48 requires the evaluation of tax positions taken or expected to be taken in the course of preparing the Fund’s tax return to determine whether the tax positions are "more-likely-than-not" of being sustained by the applicable tax authority. Tax positions not deemed to meet the more-likely-than-not threshold would be recorded as a tax benefit or expense in the current year. Adoption of FIN 48 is required for fiscal years beginning after December 15, 2006 and is to be applied to all open tax years as of the effective date. Recent SEC guidance allows funds to delay implementing FIN 48 into NAV calculations until the fund’s last NAV calculations in the first required financial statement reporting period. As a result, the Fund must begin to incorporate FIN 48 into its NAV calculations by March 31, 2008. At this time, management is continuing to evaluate the implications of FIN 48 and does not expect the adoption of FIN 48 will have a significant impact on the net assets or results of operations of the Fund.
(2) Investment Adviser and Management Agreement and Transactions With Related Parties —
The Fund has a management agreement with Reynolds Capital Management ("RCM"), with whom an officer and a director of the Fund is affiliated, to serve as investment adviser and manager. Under the terms of the agreement, the Fund will pay RCM a monthly management fee at the annual rate of 1% of the daily net assets.
For the year ended September 30, 2007, RCM reimbursed the Fund for expenses over 2.00% of the Fund’s daily net assets totaling $70,714. Reimbursements exclude interest expense on borrowings from the credit facility.
The Fund has adopted a Service and Distribution Plan (the "Plan") pursuant to Rule 12b-1 under the Investment Company Act of 1940. The Plan provides that the Fund adopting it may incur certain costs which may not exceed a maximum amount equal to 0.25% per annum of such Fund’s average daily net assets. Payments made pursuant to the Plan may only be used to pay distribution expenses incurred in the current year.
In the normal course of business the Fund enters into contracts with service providers that contain general indemnification clauses. The Fund’s maximum exposure under these arrangements is unknown as this would involve future claims that may be made against the Fund that have not yet occurred. However, based on experience, the Fund expects the risk of loss to be remote.
(3) Credit Facility —
U.S. Bank, N.A. had made available to the Fund a credit facility pursuant to the Credit Agreement dated August 7, 2000 for the purpose of having cash available to satisfy redemption requests. The Credit Agreement expired on July 31, 2007. The terms of the agreement were as follows:
| Payment Terms | Due in 45 days |
| Interest | Prime Rate - 1% |
| Unused Line Fees | 0.10% |
| Credit Limit | $5,000,000 |
| Average Daily Balance Outstanding | $10,359 |
| Maximum Amount Outstanding | $1,407,000 |
| Interest Expense | $4,848 |
(4) Distributions to Shareholders —
Net investment income and net realized gains, if any, for the Fund are distributed to shareholders at least annually. On November 6, 2007, the Fund distributed $171,260 from net investment income ($0.210445 per share). The distribution was paid on November 7, 2007 to shareholders of record on November 5, 2007.
- 16 -
Reynolds Blue Chip Growth Fund
NOTES TO FINANCIAL STATEMENTS (Continued)
September 30, 2007
(5) Investment Transactions —
For the year ended September 30, 2007, purchases and proceeds of sales of investment securities (excluding short-term securities) were $58,570,280 and $62,705,588, respectively.
(6) Accounts Payable and Accrued Liabilities —
As of September 30, 2007, liabilities of the Fund included the following:
| Payable to brokers for investments purchased | $4,325,212 |
| Payable to shareholders for redemptions | 30,321 |
| Payable to RCM for management fees | 22,270 |
| Due to custodian | 13,292 |
| Other liabilities | 13,061 |
(7) Sources of Net Assets —
As of September 30, 2007, the sources of net assets were as follows:
| Fund shares issued and outstanding | $ | 117,095,404 | ||
| Net unrealized appreciation on investments | 1,971,362 | |||
| Accumulated net realized loss on investments | (92,568,253 | ) | ||
| Undistributed net investment income | 171,260 | |||
| $ | 26,669,773 |
(8) Income Tax Information —
The following information for the Fund is presented on an income tax basis as of September 30, 2007:
Gross | Gross | Net Unrealized | Distributable | Distributable | |
Cost of | Unrealized | Unrealized | Appreciation | Ordinary | Long-Term |
Investments | Appreciation | Depreciation | on Investments | Income | Capital Gains |
| $28,702,728 | $2,130,799 | $187,100 | $1,943,699 | $171,260 | $ — |
The difference, if any, between the cost amount for financial statement and federal income tax purposes is due primarily to timing differences in recognizing certain gains and losses in security transactions.
The tax components of dividends paid during the year ended September 30, 2007, capital loss carryovers, which may be used to offset future capital gains, subject to Internal Revenue Code limitations (expiring in varying amounts through 2013), as of September 30, 2007, and tax basis post-October losses as of September 30, 2007, which are not recognized for tax purposes until the first day of the following fiscal year are:
September 30, 2007 | September 30, 2006 | |||||
Ordinary | Long-Term | Net Capital | Ordinary | Long-Term | ||
Income | Capital Gains | Loss | Post-October | Income | Capital Gains | |
Distributions | Distributions | Carryovers | Losses | Distributions | Distributions | |
| — | — | $92,540,590 | — | — | — | |
The Fund has utilized $2,047,134 of its capital loss carryovers during the year ended September 30, 2007.
Since there were no ordinary distributions paid for the year ended September 30, 2007 for the Fund, there are no distributions designated as qualifying for the dividends received deduction for corporate shareholders nor as qualified dividend income under the Jobs and Growth Tax Relief Act of 2003 (unaudited).
- 17 -
REPORT OF INDEPENDENT REGISTERED PUBLIC ACCOUNTING FIRM
To the Board of Directors and Shareholders
of Reynolds Funds, Inc.
In our opinion, the accompanying statement of net assets and the related statements of operations and of changes in net assets and the financial highlights present fairly, in all material respects, the financial position of Reynolds Blue Chip Growth Fund (the “Fund” a series of the Reynolds Funds, Inc.) at September 30, 2007, the results of its operations for the year then ended, the changes in its net assets for each of the two years in the period then ended and the financial highlights for each of the five years in the period then ended, in conformity with accounting principles generally accepted in the United States of America. These financial statements and financial highlights (hereafter referred to as “financial statements”) are the responsibility of the Fund’s management; our responsibility is to express an opinion on these financial statements based on our audits. We conducted our audits of these financial statements in accordance with the standards of the Public Company Accounting Oversight Board (United States). Those standards require that we plan and perform the audit to obtain reasonable assurance about whether the financial statements are free of material misstatement. An audit includes examining, on a test basis, evidence supporting the amounts and disclosures in the financial statements, assessing the accounting principles used and significant estimates made by management, and evaluating the overall financial statement presentation. We believe that our audits, which included confirmation of securities at September 30, 2007 by correspondence with the custodian and brokers, provide a reasonable basis for our opinion.
Milwaukee, Wisconsin
November 15, 2007
- 18 -
Reynolds Blue Chip Growth Fund
DIRECTORS AND OFFICERS
Other | |||||
Term of | # of Funds | Directorships | |||
Position | Office and | in Complex | Held by | ||
Name, Age | Held with | Length of | Principal Occupation(s) | Overseen | Director |
and Address | the Fund | Time Served | During Past Five Years | by Director | or Officer |
Non-Interested Directors: | |||||
| Dennis N. Moser, 65 | Director | Indefinite Term | Mr. Moser is a partner in Glenbrook Partner, | 1 | None |
| 77 Stockbridge | Since January | LLC, a payments consulting firm. From 2001 to | |||
| Atherton, CA 94026 | 2002 | 2005 he was an independent consultant, and | |||
| from 2000 to 2001 he was the Chief Information | |||||
| Officer of Schoolpop, Inc., a fund raising firm. | |||||
| Robert E. Stauder, 77 | Director | Indefinite Term | Mr. Stauder is retired. He was a principal of | 1 | None |
| 5 Marsh Drive | Since 1988 | Robinson Mills + Williams, an architectural | |||
| Mill Valley, CA 94941 | and interior design firm, from 1991 until 1996. | ||||
Interested Director: | |||||
| Frederick L. Reynolds,* 65 | Director, | Indefinite Term | Mr. Reynolds is the sole proprietor of | 1 | None |
| 2580 Kekaa Drive #115 | Since 1988 | the Adviser, which business commenced in 1985. | |||
| Lahaina, HI 96761 | President | One Year Term | |||
| and | Since 1988 | ||||
| Treasurer | |||||
Other Officers: | |||||
| N. Lynn Bowley, 49 | Chief | At Discretion | Mr. Bowley has been a Compliance Officer for | ||
| Fund Compliance | Compliance | of Board | Fund Compliance Services, LLC since 2007. | N/A | None |
| Services, LLC | Officer | Since October | From 2002 to 2006 he was Vice-President of | ||
| 4020 S. 147th Street | 2007 | Investment Support Services for Mutual of | |||
| Omaha, NE 68137 | Omaha Companies. |
__________
| * | Mr. Reynolds is the only interested director of the Company as that term is defined in the Investment Company Act of 1940. Mr. Reynolds is an interested director of the Company by reason of his being an officer of the Company and the sole proprietor of the investment adviser. |
For additional information about the Directors and Officers or for a description of the policies and procedures that the Fund uses to determine how to vote proxies relating to portfolio securities, please call (800) 773-9665 and request a Statement of Additional Information. One will be mailed to you free of charge. The Statement of Additional Information is also available on the website of the Securities and Exchange Commission (the "Commission") at http://www.sec.gov. Information on how the Fund voted proxies relating to portfolio securities during the twelve month period ending June 30, 2007 is available on the Fund’s website at http://www.reynoldsfunds.com or the website of the Commission. The Fund files its complete schedule of portfolio holdings with the Commission for the first and third quarters of each fiscal year on Form N-Q. The Fund’s Form N-Q is available on the Commission’s website. The Fund’s Form N-Q may be reviewed and copied at the Commission’s Public Reference Room in Washington, DC, and that information on the operation of the Public Reference Room may be obtained by calling 1-800-SEC-0330.
- 19 -
REYNOLDS BLUE CHIP GROWTH FUND
c/o U.S. BANCORP FUND SERVICES, LLC
615 East Michigan Street
Milwaukee, Wisconsin 53202
www.reynoldsfunds.com
Board of Directors
DENNIS N. MOSER
FREDERICK L. REYNOLDS
ROBERT E. STAUDER
Investment Adviser
REYNOLDS CAPITAL MANAGEMENT
2580 Kekaa Drive, #115
Lahaina, Hawaii 96761
Administrator
FIDUCIARY MANAGEMENT, INC.
100 East Wisconsin Avenue, Suite 2200
Milwaukee, Wisconsin 53202
Transfer Agent and
Dividend Disbursing Agent
U.S. BANCORP FUND SERVICES, LLC
615 East Michigan Street
Milwaukee, Wisconsin 53202
1-800-773-9665
or 1-800-7REYNOLDS
1-414-765-4124
Custodian
U.S. Bank, N.A.
1555 North RiverCenter Drive, Suite 302
Milwaukee, Wisconsin 53212
Independent Registered Public Accounting Firm
PRICEWATERHOUSECOOPERS LLP
100 East Wisconsin Avenue
Suite 1800
Milwaukee, Wisconsin 53202
Legal Counsel
FOLEY & LARDNER LLP
777 East Wisconsin Avenue
Milwaukee, Wisconsin 53202
Item 2. Code of Ethics.
Registrant has adopted a code of ethics. See attached Exhibit 12 (a).
Item 3. Audit Committee Financial Expert.
Registrant’s Board of Directors has determined that it does not have an “audit committee financial expert” serving on its audit committee. While Registrant believes that each of the members of its audit committee has sufficient knowledge of accounting principles and financial statements to serve on the audit committee, none has the requisite experience to qualify as an “audit committee financial expert” as such term is defined by the Securities and Exchange Commission.
Item 4. Principal Accountant Fees and Services.
(a) Audit Fees
$22,100 (FY 2007) and $37,499 (FY 2006) are the aggregate fees billed for each of the last two fiscal years for professional services rendered by the principal accountant to the registrant for the audit of the registrant’s annual financial statements or services that are normally provided by the accountant in connection with statutory and regulatory filings or engagements for those fiscal years.
(b) Audit-Related Fees
There were no fees billed in each of the last two fiscal years for Audit-Related Fees.
(c) Tax Fees
$24,450 (FY 2007) and $25,800 (FY 2006) are the aggregate fees billed in each of the last two fiscal years for professional services rendered by the principal accountant to the registrant for tax compliance, tax advice, tax planning and tax return preparation. The tax fees reported above for FY 2007 include estimated fees of $10,000 for services related to the liquidation of two funds and FY 2006 include fees of $6,000 for services related to the liquidation of one fund.
There were no fees billed in each of the last two fiscal years for professional services rendered by the principal accountant to registrant’s investment adviser for tax compliance, tax advice and tax planning that were required to be approved by the audit committee pursuant to paragraph (c)(7)(ii) of Rule 2-01 of Regulation S-X.
(d) All Other Fees
There were no fees billed in each of the last two fiscal years for products and services provided by the principal accountant to the registrant, other than the services reported in paragraphs (a) – (c) of this Item 4.
There were no fees billed in each of the last two fiscal years for products and services provided by the principal accountant to registrant’s investment adviser, which were required to be approved by the audit committee pursuant to paragraph (c)(7)(ii) or Rule 2-01 or Regulation S-X.
(e) (1) None
(e) (2) None
(f) Not applicable.
(g) See the tax fees disclosed in paragraph (c) of this Item 4.
(h) Not applicable, as no non-audit services were provided to registrant’s investment adviser.
Item 5. Audit Committee of Listed Registrants.
Not applicable.
Item 6. Schedule of Investments.
Not applicable.
Item 7. Disclosure of Proxy Voting Policies and Procedures for Closed-End Management Investment Companies.
Not applicable.
Item 8. Portfolio Managers of Closed-End Management Investment Companies.
Not applicable.
Item 9. Purchases of Equity Securities By Closed-End Management Investment Company and Affiliated Purchasers.
Not applicable.
Item 10. Submission of Matters to a Vote of Security Holders.
None.
Item 11. Controls and Procedures.
| (a) | The disclosure controls and procedures of the Reynolds Funds, Inc. are periodically evaluated. As of October 1, 2007, the date of the last evaluation, we concluded that our disclosure controls and procedures are adequate. |
| (b) | The internal controls of the Reynolds Funds, Inc. are periodically evaluated. There were no changes to Reynolds Funds’ internal control over financial reporting that occurred during the second fiscal quarter of the period covered by this report that have materially affected, or are reasonably likely to materially affect, such controls. |
Item 12. Exhibits.
(a) | Any code of ethics or amendment thereto. Filed herewith. |
(b) | Certifications pursuant to Section 302 of the Sarbanes-Oxley Act of 2002. Filed herewith. |
(c) | Certification pursuant to Section 906 of the Sarbanes-Oxley Act of 2002. Filed herewith. |
SIGNATURES
Pursuant to the requirements of the Securities Exchange Act of 1934 and the Investment Company Act of 1940, the registrant has duly caused this report to be signed on its behalf by the undersigned, thereunto duly authorized.
Reynolds Funds, Inc.
Registrant
By /s/Frederick L. Reynolds
Frederick L. Reynolds, Principal Executive Officer
Date December 7, 2007
Pursuant to the requirements of the Securities Exchange Act of 1934 and the Investment Company Act of 1940, this report has been signed below by the following persons on behalf of the registrant and in the capacities and on the dates indicated.
Reynolds Funds, Inc.
Registrant
By /s/Frederick L. Reynolds
Frederick L. Reynolds, Principal Financial OfficerDate December 7, 2007