UNITED STATES
SECURITIES AND EXCHANGE COMMISSION
Washington, D.C. 20549
FORM N-CSR
CERTIFIED SHAREHOLDER REPORT OF REGISTERED
MANAGEMENT INVESTMENT COMPANIES
Investment Company Act file number
811-05549
Reynolds Funds, Inc.
(Exact name of registrant as specified in charter)
c/o U.S. Bancorp Fund Services, LLC
615 E. Michigan Street
Milwaukee, WI 53202
(Address of principal executive offices) (Zip code)
Frederick L. Reynolds
Reynolds Capital Management
2580 Kekaa Drive #115
Lahaina, Hawaii 96761
(Name and address of agent for service)
(415) 461-7860
Registrant's telephone number, including area code:
Date of fiscal year end: September 30
Date of reporting period: September 30, 2008
Item 1. Reports to Stockholders.
ANNUAL REPORT
September 30, 2008
REYNOLDS
BLUE CHIP
GROWTH FUND
Seeking Long-Term Capital Appreciation
A No-Load Mutual Fund
1-800-773-9665
www.reynoldsfunds.com
REYNOLDS BLUE CHIP GROWTH FUND
November 1, 2008
Dear Fellow Shareholders:
The performance of the Reynolds Blue Chip Growth Fund for the twelve months ended September 30, 2008 was a negative 0.0007%. The performance of the Standard & Poor’s 500 Index(1) during this period was a negative 21.98%.
October 1, 2007 through September 30, 2008 |
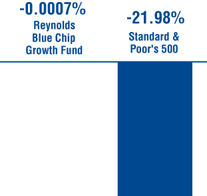 |
Twelve Month Returns
Investment Strategy
In the last twelve months we implemented a strong defensive strategy by temporarily raising the cash in the Reynolds Blue Chip Growth Fund to a high level. We are closely watching events unfold and will invest this cash when we believe it is appropriate.
Economic Discussion
The U.S. Economy
Many negatives have affected the U.S. economy and investments in the last year. They include: (1) declining home prices and record-high home foreclosures have affected homeowners and financial institutions such as Fannie Mae, Freddie Mac and banks; (2) higher oil prices have affected the spending power of consumers and profits in many industries; (3) consumer confidence as measured by the Reuters/University of Michigan Survey of Consumers has fallen to its lowest level since 1982 – a 26 year low (consumer spending accounts for about 70% of every dollar of U.S. Gross Domestic Product) and retail spending is weak; (4) it has been difficult to value certain assets in complicated financial instruments and to determine how creditworthy certain financial institutions and certain nonfinancial businesses are; (5) financial institutions have become quite hesitant to lend to each other and to many individuals and corporations; (6) the credit crisis has created difficult capital markets, and the credit markets’ problems have spilled over into the rest of the economy; (7) concern about corporate profits and forecasts for corporate profits that may be too high; (8) nonfarm employment has declined for nine straight months; (9) corporate capital spending has been weakening; (10) some areas of the economy have too much leverage; (11) the U.S. economy is probably in a recession at the present time; (12) many foreign economies are having some of the same financial problems as the U.S.; and (13) problems in the middle East.
There are many potential economic and investment positives which include: (1) the domestic economy should be helped by the Federal Reserve (“the Fed”) having lowered interest rates nine times since August 2007; (2) the Treasury’s Troubled Asset Relief Program (TARP) will allow the Treasury to infuse $700 Billion into banks and other financial institutions; (3) the U.S. government has been doing many other things to instill confidence and increase liquidity in the financial system such as raising the level of FDIC insurance, guaranteeing bank debt, putting FNMA and Freddie Mac in a conservatorship, providing a facility to purchase commercial paper, and temporarily insuring existing deposits as of September 19 in money market funds; (4) inflation is moderating; (5) oil prices and other commodity prices have been declining; (6) the efficiencies of the economy resulting from such things as technology enhancements and productivity increases are a positive; (7) a second stimulus package probably will be implemented which should help the economy; and (8) we may be approaching a point where most of the bad news is known and the stock market may begin anticipating an eventual resumption of economic growth.
| (1) | The Standard & Poor’s 500 Index consists of 500 selected common stocks, most of which are listed on the New York Stock Exchange. The Standard & Poor’s Ratings Group designates the stocks to be included in the Index on a statistical basis. A particular stock’s weighting in the Index is based on its relative total market value (i.e. its market price per share times the number of shares outstanding.) Stocks may be added or deleted from the Index from time to time. |
- 1 -
Gross Domestic Product (GDP) is estimated to increase 0.5% in 2008. However, the next few quarters may show negative growth. GDP increased 2.2% in calendar 2007, 2.9% in calendar 2006, 3.1% in 2005, 3.9% in 2004, 2.7% in 2003, 1.9% in 2002, 0.8% in 2001 and 3.7% in 2000.
U.S. inflation, as measured by the Consumer Price Index, is estimated to increase 4.0% in 2008. However, recent inflation has been lower. Inflation increased 2.9% in 2007, 3.2% in 2006, 3.4% in 2005, 2.7% in 2004, 2.3% in 2003, 1.6% in 2002, 2.8% in 2001 and 3.4% in 2000. U.S. inflation numbers have been helped in the last few years by such factors as: (1) a slowing U.S. economy; (2) global competition; (3) advances in technology resulting in increasing productivity; and (4) technology innovations that are helping to lower production and distribution costs. Annual inflation has been above the range of 1-2% that the Fed is comfortable with. However, the current weak economy should help to hold inflation in check.
The World Economy
Foreign economic growth has also slowed considerably in the last few months. Some countries are in or entering a recession and their next few quarters will be down. Many foreign countries are having some of the same economic problems as the U.S., such as dislocations in credit markets. As a result, many foreign governments are implementing some of the same financial policies and procedures as the U.S. Additionally, the International Monetary Fund (IMF) is providing loans to some developing foreign countries that are in relatively better financial shape than other developing foreign countries. Most foreign central banks had not been as aggressive as the Fed in easing policy. However, in the last few months they have changed their stance. A coordinated interest rate cut was recently implemented by many foreign countries along with the U.S. The average GDP growth of France, Italy, and Germany was 2.6% in 2007 and is forecast to grow at a 1.1% rate in 2008. The United Kingdom grew at a 3.1% rate in 2007 and is forecast to grow 0.8% in 2008. The next few quarters probably will have negative economic growth for many of these countries. Many developing countries in the world have been growing faster than the U.S. in the last few years. Their growth is also starting to slow. However, many of their economies are still growing faster than the U.S. Brazil grew at a 5.4% rate in 2007 and is forecast to grow 4.5% in 2008, India grew at an 8.6% rate in 2007 and is forecast to grow 6.5% in 2008, and China grew at an 11.4% rate in 2007 and is forecast to grow 8% in 2008. Many worldwide larger multinational companies should be well positioned to benefit long-term from worldwide growth. To the extent that these companies’ U.S. earnings are growing slower, this could be somewhat offset by their possible stronger foreign earnings. The long-term strategy of the Reynolds Blue Chip Growth Fund is to be structured to benefit from this worldwide growth by investing in many of these worldwide leading multinational growth companies.
The Blue Chip Fund is normally positioned to participate in long-term worldwide growth trends through investments in multinational U.S. headquartered companies. In addition, the Fund may have investments in leading foreign headquartered companies, whose stocks or American Depositary Receipts (ADRs) trade in the United States. These ADR’s are denominated in dollars and they must use GAAP (Generally Accepted Accounting Principles) accounting to qualify as an ADR. The Board of Directors of the Reynolds Blue Chip Growth Fund recently approved an increase in the maximum percentage of ADR’s that may be held in the Blue Chip Fund to 25% from 15%.
Opportunistic Investing in Companies of Various Sizes
The Reynolds Blue Chip Growth Fund usually invests in companies of various sizes as classified by their market capitalizations. The Fund emphasizes investments in larger companies. A company’s market capitalization is calculated by taking the number of shares the company has outstanding multiplied by its current market price. Other considerations in selecting companies for the Fund include revenue growth rates, product innovations, financial strength, management’s knowledge and experience plus the overall economic and geopolitical environments and interest rates.
- 2 -
Portfolio as of September 30, 2008

Source: Morningstar web site and Morningstar Market Cap Breakpoints
Morningstar separates stock portfolio holdings into five market-capitalization groups: Giant, Large, Mid, Small and Micro. Of the 5,000 largest domestic stocks in the equities database, the top 1% are categorized as Giant, the next 4% are Large, the next 15% are Mid, the next 30% are Small, and the remaining 50% are Micro. Stocks outside of the largest 5,000 are also classified as Micro.
Market caps are the minimum in each cap group; therefore, the minimum large market cap is the large-mid breakpoint and mid is the mid-small breakpoint, etc. As of September 30, 2008 the minimums in each cap group are as follows:
| (in millions) | |
| Giant | $44,037.06 |
| Large | $ 9,949.41 |
| Mid | $ 1,925.95 |
| Small | $ 533.20 |
| Micro | <$ 533.20 |
The long-term strategy of the Blue Chip Fund is to emphasize investment in “blue chip” growth companies. In the long-term these companies build value as their earnings grow. This growth in value should ultimately be recognized in higher stock prices for these companies.
Performance highlights (as of September 30, 2008)
| Cumulative Total Return | Average Annual Total Return | |||||||
| One Year | -0.00 | % | -0.00 | % | ||||
| Three years | 8.72 | % | 2.83 | % | ||||
| Five Years | 14.71 | % | 2.78 | % | ||||
| Ten Years | -11.78 | % | -1.25 | % | ||||
| Since inception (August 12, 1988) | 263.56 | % | 6.62 | % | ||||
The performance of the Blue Chip Fund was a negative 2.42% for the nine months ended September 30, 2008.
Low Long-Term Interest Rates by Historical Standards are a Significant Positive for Stock Valuations
Long-term interest rates remain near historically low levels. Low long-term interest rates usually result in higher stock valuations for many reasons including:
| (1) | Long-term borrowing costs of corporations are lower resulting in higher business confidence and profits. |
| (2) | Long-term borrowing costs of individuals are lower which increases consumer confidence and spending. |
| (3) | A company’s stock is usually valued by placing a present value on that company’s future stream of earnings and dividends. The present value is higher when interest and inflation rates are low. |
- 3 -
Linked Money Market Fund
The First American Treasury Obligations Fund is a money market fund offered by an affiliate of our transfer agent, U.S. Bancorp Fund Services, LLC. This Fund is offered as a money market alternative to our shareholders. The First American Treasury Obligations Fund offers many free shareholder conveniences including automatic investment and withdrawal plans and check writing access to your funds and is linked to your holdings in the Reynolds Blue Chip Growth Fund. This Fund is also included on your quarterly statements.
Information about the Reynolds Blue Chip Growth Fund and the First American Treasury Obligations Fund
Reynoldsfunds.com website: You can access current information about your investment holdings via our website, reynoldsfunds.com. You must first request a personal identification number (PIN) by calling our shareholder service representatives at (800) 773-9665. You will be able to view your account list, account detail (including balances), transaction history, distributions, and the current Reynolds Blue Chip Growth Fund net asset value. Additional information available (PIN number not needed) includes quarterly updates of the returns of the Blue Chip Fund, top ten holdings and industry percentages. Also, detailed statistics and graphs of past performances from a link to Morningstar for the Blue Chip Fund.
For automatic current daily net asset values: Call 1-800-773-9665 (1-800-7REYNOLDS) twenty-four hours a day, seven days a week and press “any key” then “1”. The updated current net asset value for the Blue Chip Fund is usually available each business day after 5 P.M. (PST).
For First American Treasury Obligations Fund current one and seven day yields: Call 1-800-773-9665 and press “any key” then “1”.
For shareholders to automatically access their current account information: Call 1-800-773-9665 (twenty-four hours a day, seven days a week), press “any key” then “2” and enter your 16 digit account number which appears at the top right of your statement.
To speak to a Fund representative regarding the current daily net asset value, current account information and any other questions: Call 1-800-773-9665 and press “0” from 6 A.M. to 5 P.M. (PST).
Shareholder statement frequency: Consolidated statements summarizing the Blue Chip Fund and First American Treasury Obligations Fund accounts held by a shareholder are sent quarterly. In addition, individual Blue Chip Fund statements are sent whenever a transaction occurs. These transactions are: (1) statements are sent for the Blue Chip Fund or First American Treasury Obligations Fund when a shareholder purchases or redeems shares; (2) Blue Chip Fund statements are sent twice a year if, and when, any ordinary income or capital gains are distributed.
Tax reporting: Individual 1099 forms, which summarize any dividend income and any long- or short-term capital gains, are sent annually to shareholders each January. The percentage of income earned from various government securities, if any, for the Blue Chip Fund and the First American Treasury Obligations Fund are also reported in January.
Minimum investment: $1,000 for regular and retirement accounts ($100 for additional investments for all accounts – except for the Automatic Investment Plan, which is $50 for regular and retirement plan accounts).
Retirement plans: All types are offered including Traditional IRA, Roth IRA, Coverdell Education Savings Account, SIMPLE IRA Plan, and SEP IRA.
Automatic Investment Plan: There is no charge to automatically debit your checking account to invest in the Blue Chip Fund or the First American Treasury Obligations Fund ($50 minimum for either of these Funds) at periodic intervals to make automatic purchases in either of these Funds. This is useful for dollar cost averaging for the Blue Chip Fund.
Systematic Withdrawal Plan: For shareholders with a $10,000 minimum starting balance, there is no charge to automatically redeem shares ($100 minimum) in the Blue Chip Fund or the First American Treasury Obligations Fund as often as monthly and send a check to you or transfer funds to your bank account.
- 4 -
Free Check Writing: Free check writing ($100 minimum) is offered for accounts invested in the First American Treasury Obligations Fund.
Exchanges or regular redemptions between the Blue Chip Fund and the First American Treasury Obligations Fund: As often as desired – no charge.
NASDAQ symbols: Reynolds Blue Chip Growth Fund – RBCGX and First American Treasury Obligations Fund – FATXX.
Portfolio Manager: Frederick Reynolds is the portfolio manager of the Reynolds Blue Chip Growth Fund.
The Reynolds Blue Chip Growth Fund and the First American Treasury Obligations Fund are No-Load: No front-end sales commissions or deferred sales charges (“loads”) are charged. Over 40% of all mutual funds impose these marketing charges that are ultimately paid by the shareholder. These marketing charges are either: (1) a front-end fee or “load” in which up to 5% of a shareholder’s assets are deducted from the original investment (some funds even charge a fee when a shareholder reinvests capital gains or dividends); or (2) a back-end penalty fee or “load” which is typically deducted from a shareholder’s account if a shareholder redeems within five years of the original investment. These fees reduce a shareholder’s return. The Blue Chip Fund and First American Treasury Obligations Fund are No-Load as they do not have these extra charges.
We appreciate your continued confidence in the Reynolds Blue Chip Growth Fund and would like to welcome our new shareholders. We look forward to strong results in the future.
Sincerely,

Frederick L. Reynolds
President
This report is not authorized for use as an offer of sale or a solicitation of an offer to buy shares of the Reynolds Blue Chip Growth Fund unless accompanied or preceded by the Fund’s current prospectus. Performance data quoted represents past performance; past performance does not guarantee future results. The investment return and principal value of an investment will fluctuate so that an investor’s shares, when redeemed, may be worth more or less than their original cost. Current performance of the Fund may be lower or higher than the performance quoted. Performance data current to the most recent month end may be obtained by visiting www.reynoldsfunds.com.
- 5 -
Reynolds Blue Chip Growth Fund
COST DISCUSSION
As a shareholder of the Reynolds Blue Chip Growth Fund, you do not incur (except as described below) transaction costs, including sales charges (loads) on purchase payments, reinvested dividends, or other distributions; redemption fees; and exchange fees, but do incur ongoing costs, including management fees; distribution [and/or service] (12b-1) fees; and other Fund expenses. This example is intended to help you understand your ongoing costs (in dollars) of investing in the Fund and to compare these costs with the ongoing costs of investing in other mutual funds.
The example is based on an investment of $1,000 invested at the beginning of the period and held for the entire period from April 1, 2008 through September 30, 2008.
Actual Expenses
The first line of the table below provides information about actual account values and actual expenses. You may use the information in this line, together with the amount you invested, to estimate the expenses that you paid over the period. Simply divide your account value by $1,000 (for example, an $8,600 account value divided by $1,000 = 8.6), then multiply the result by the number in the first line under the heading entitled “Expenses Paid During Period” to estimate the expenses you paid on your account during this period.
In addition to the costs highlighted and described below, the only Fund transaction costs you might currently incur would be wire fees ($15 per wire), if you choose to have proceeds from a redemption wired to your bank account instead of receiving a check. Additionally, U.S. Bank charges an annual processing fee ($15) if you maintain an IRA account with the Fund. To determine your total costs of investing in the Fund, you would need to add any applicable wire or IRA processing fees you’ve incurred during the period to the costs provided in the example below.
Hypothetical Example for Comparison Purposes
The second line of the table below provides information about hypothetical account values and hypothetical expenses based on the Fund’s actual expense ratio and an assumed rate of return of 5% per year before expenses, which is not the Fund’s actual return. The hypothetical account values and expenses may not be used to estimate the actual ending account balance or expenses you paid for the period. You may use this information to compare the ongoing costs of investing in the Fund and other funds. To do so, compare this 5% hypothetical example with the 5% hypothetical examples that appear in the shareholder reports of the other funds.
Please note that the expenses shown in the table are meant to highlight your ongoing costs only and do not reflect any transactional costs, such as sales charges (loads), redemption or exchange fees. Therefore, the second line of the table is useful in comparing ongoing costs only, and will not help you determine the relative total costs of owning different funds. In addition, if these transactional costs were included, your costs would have been higher.
| Beginning Account | Ending Account | Expenses Paid During | ||||||||||
| Value 4/1/08 | Value 9/30/08 | Period* 4/1/08-9/30/08 | ||||||||||
| Reynolds Blue Chip Growth Fund Actual | $ | 1,000.00 | $ | 1,002.20 | $ | 10.01 | ||||||
| Hypothetical (5% return before expenses) | $ | 1,000.00 | $ | 1,015.00 | $ | 10.07 | ||||||
| * | Expenses are equal to the Fund’s annualized expense ratio of 2.00% multiplied by the average account value over the period, multiplied by 183/366 (to reflect the one-half year period between April 1, 2008 and September 30, 2008). |
- 6 -
Reynolds Blue Chip Growth Fund
MANAGEMENT’S DISCUSSION OF FUND PERFORMANCE
The Reynolds Blue Chip Growth Fund’s performance was positively affected in its fiscal year ended September 30, 2008 because the Fund moved to a temporary strong defensive position during the fiscal year. This was accomplished by selling equities and maintaining the proceeds in a high cash position. This selling process was largely completed by the end of the Fund’s first fiscal quarter ended December 31, 2007. Some sales were made in the Fund’s second fiscal quarter ended March 31, 2008. The Fund then maintained a very high cash position in the second half of the fiscal year ended September 30, 2008.
COMPARISON OF CHANGE IN VALUE OF $10,000 INVESTMENT IN REYNOLDS BLUE CHIP GROWTH FUND AND S&P 500 INDEX(1) | ||
 | ||
Past performance does not predict future performance. The graph and the table do not reflect the deduction of taxes that a shareholder would pay on Fund distributions or the redemption of Fund shares. | ||
| (1) | The S&P 500 is the Standard & Poor’s Composite Index of 500 stocks, a widely recognized unmanaged index of common stock prices and includes the reinvestment of all dividends. Investors cannot invest directly in an index or benchmark. |
| AVERAGE ANNUAL TOTAL RETURN | ||
| 1-YEAR | 5-YEAR | 10-YEAR |
| -0.00% | 2.78% | -1.25% |
- 7 -
Reynolds Blue Chip Growth Fund
STATEMENT OF ASSETS AND LIABILITIES
September 30, 2008
| ASSETS: | ||||
| Investments in securities, at value (cost $22,098,362) | $ | 22,179,317 | ||
| Dividends and interest receivable | 8,949 | |||
| Receivable from shareholders for purchases | 200 | |||
| Total assets | $ | 22,188,466 | ||
| LIABILITIES: | ||||
| Payable to adviser for management fees | $ | 18,211 | ||
| Payable to shareholders for redemptions | 13,162 | |||
| Other liabilities | 6,268 | |||
| Total liabilities | 37,641 | |||
| NET ASSETS: | ||||
| Capital Stock, $0.01 par value; 40,000,000 shares authorized; 695,471 shares outstanding | 112,736,233 | |||
| Net unrealized appreciation on investments | 80,955 | |||
| Accumulated net realized loss on investments | (90,666,363 | ) | ||
| Net assets | 22,150,825 | |||
| Total liabilities and net assets | $ | 22,188,466 | ||
| CALCULATION OF NET ASSET VALUE PER SHARE: | ||||
| Net asset value, offering and redemption price per share ($22,150,825 ÷ 695,471 shares outstanding) | $ | 31.85 | ||
The accompanying notes to financial statements are an integral part of this statement.
SCHEDULE OF INVESTMENTS
September 30, 2008
| Shares/Principal Amount | Value | ||||||
| COMMON STOCKS — 0.6% (a) | |||||||
| Computer & Peripherals — 0.2% | |||||||
| 400 | Apple, Inc.* | $ | 45,464 | ||||
| Internet — 0.4% | |||||||
| 200 | Google Inc.* | 80,104 | |||||
| Total common stocks | |||||||
| (cost $40,221) | 125,568 | ||||||
| SHORT-TERM INVESTMENTS — 99.5% (a) | |||||||
| U.S. Treasury Securities — 67.6% | |||||||
| $ | 10,000,000 | U.S. Treasury Bills, | |||||
| 0.29%, due 10/30/08 | 9,997,664 | ||||||
| 5,000,000 | U.S. Treasury Bills, | ||||||
| 0.30%, due 12/26/08 | 4,992,025 | ||||||
| Total U.S. treasury securities | |||||||
| (cost $14,994,081) | 14,989,689 | ||||||
Variable Rate Demand Notes — 31.9% | |||||||
| 1,080,000 | American Family | ||||||
| Financial Services, 2.24% | 1,080,000 | ||||||
| 4,904,060 | U.S. Bank, N.A., 3.68% | 4,904,060 | |||||
| 1,080,000 | Wisconsin Corporate Central | ||||||
| Credit Union, 3.60% | 1,080,000 | ||||||
| Total variable rate demand | |||||||
| notes (cost $7,064,060) | 7,064,060 | ||||||
| Total short-term investments | |||||||
| (cost $22,058,141) | 22,053,749 | ||||||
| Total investments — 100.1% | |||||||
| (cost $22,098,362) | 22,179,317 | ||||||
| Liabilities, less cash and | |||||||
receivables — (0.1%) (a) | (28,492 | ) | |||||
TOTAL NET | |||||||
| ASSETS — 100.0% | $ | 22,150,825 | |||||
| * | Non-income producing security. |
| (a) | Percentages for the various classifications relate to net assets. |
The accompanying notes to financial statements are an integral part of this schedule.
- 8 -
Reynolds Blue Chip Growth Fund
STATEMENT OF OPERATIONS
For the Year Ended September 30, 2008
| INCOME: | ||||
| Dividends | $ | 18,025 | ||
| Interest | 455,294 | |||
| Total income | 473,319 | |||
| EXPENSES: | ||||
| Management fees | 240,163 | |||
| Transfer agent fees | 91,230 | |||
| Professional fees | 65,234 | |||
| Administrative and accounting services | 54,572 | |||
| Insurance expense | 43,096 | |||
| Printing and postage expense | 38,901 | |||
| Registration fees | 26,713 | |||
| Chief Compliance Officer fees | 20,000 | |||
| Board of Directors fees | 18,000 | |||
| Distribution fees | 15,987 | |||
| Custodian fees | 15,243 | |||
| Other expenses | 12,176 | |||
| Total expenses before reimbursement | 641,315 | |||
| Less expenses reimbursed by adviser | (160,893 | ) | ||
| Net expenses | 480,422 | |||
| NET INVESTMENT LOSS | (7,103 | ) | ||
| NET REALIZED GAIN ON INVESTMENTS | 1,901,890 | |||
| NET DECREASE IN UNREALIZED APPRECIATION ON INVESTMENTS | (1,890,407 | ) | ||
| NET GAIN ON INVESTMENTS | 11,483 | |||
| NET INCREASE IN NET ASSETS RESULTING FROM OPERATIONS | $ | 4,380 | ||
The accompanying notes to financial statements are an integral part of this statement.
- 9 -
Reynolds Blue Chip Growth Fund
STATEMENTS OF CHANGES IN NET ASSETS
For the Years Ended September 30, 2008 and 2007
| 2008 | 2007 | |||||||
| OPERATIONS: | ||||||||
| Net investment (loss) income | $ | (7,103 | ) | $ | 171,260 | |||
| Net realized gain on investments | 1,901,890 | 2,019,471 | ||||||
| Net change in unrealized appreciation on investments | (1,890,407 | ) | 1,043,048 | |||||
| Net increase in net assets resulting from operations | 4,380 | 3,233,779 | ||||||
| DISTRIBUTIONS TO SHAREHOLDERS: | ||||||||
| Distributions from net investment income ($0.210445 per share) | (171,260 | ) | — | |||||
| FUND SHARE ACTIVITIES: | ||||||||
| Proceeds from shares issued (17,522 and 129,647 shares, respectively) | 610,010 | 4,063,442 | ||||||
| Net asset value of shares issued in distributions reinvested (4,918 shares) | 164,990 | — | ||||||
| Cost of shares redeemed (159,033 and 618,779 shares, respectively) | (5,127,068 | ) | (18,914,965 | ) | ||||
| Net decrease in net assets derived from Fund share activities | (4,352,068 | ) | (14,851,523 | ) | ||||
| TOTAL DECREASE | (4,518,948 | ) | (11,617,744 | ) | ||||
| NET ASSETS AT THE BEGINNING OF THE YEAR | 26,669,773 | 38,287,517 | ||||||
| NET ASSETS AT THE END OF THE YEAR (Includes accumulated | ||||||||
| net investment income of $0 and $171,260, respectively) | $ | 22,150,825 | $ | 26,669,773 | ||||
FINANCIAL HIGHLIGHTS
(Selected data for each share of the Fund outstanding throughout each year)
| Years Ended September 30, | ||||||||||||||||||||
| 2008 | 2007 | 2006 | 2005 | 2004 | ||||||||||||||||
| PER SHARE OPERATING PERFORMANCE: | ||||||||||||||||||||
| Net asset value, beginning of year | $ | 32.05 | $ | 28.98 | $ | 29.48 | $ | 26.98 | $ | 27.93 | ||||||||||
| Income from investment operations: | ||||||||||||||||||||
| Net investment (loss) income | (0.01 | ) | 0.17 | (0.17 | ) | (0.34 | ) | (0.40 | ) | |||||||||||
| Net realized and unrealized gains (losses) on investments | 0.02 | 2.90 | (0.33 | ) | 2.84 | (0.55 | )* | |||||||||||||
| Total from investment operations | 0.01 | 3.07 | (0.50 | ) | 2.50 | (0.95 | ) | |||||||||||||
| Less distributions: | ||||||||||||||||||||
| Distributions from net investment income | (0.21 | ) | — | — | — | — | ||||||||||||||
| Distributions from net realized gains | — | — | — | — | — | |||||||||||||||
| Total from distributions | (0.21 | ) | — | — | — | — | ||||||||||||||
| Net asset value, end of year | $ | 31.85 | $ | 32.05 | $ | 28.98 | $ | 29.48 | $ | 26.98 | ||||||||||
| TOTAL RETURN | (0.00% | ) | 10.59% | (1.70% | ) | 9.27% | (3.44% | ) | ||||||||||||
| RATIOS/SUPPLEMENTAL DATA: | ||||||||||||||||||||
| Net assets, end of year (in 000’s $) | 22,151 | 26,670 | 38,288 | 54,441 | 84,210 | |||||||||||||||
| Ratio of expenses (after reimbursement) to average net assets** | 2.00% | 2.02% | 2.01% | 1.80% | 1.63% | |||||||||||||||
| Ratio of net investment (loss) income to average net assets*** | (0.03% | ) | 0.55% | (0.55% | ) | (1.18% | ) | (1.33% | ) | |||||||||||
| Portfolio turnover rate | 364% | 313% | 281% | 168% | 94% | |||||||||||||||
| * | The amount shown may not correlate with the aggregate gains and losses of portfolio securities due to the timing of subscriptions and redemptions of Fund shares. |
| ** | Computed after giving effect to adviser’s expense limitation undertaking. If the Fund had paid all of its expenses for the years ended September 30, 2008 and 2007, the ratios would have been 2.67% and 2.25%, respectively. |
| *** | If the Fund had paid all of its expenses for the years ended September 30, 2008 and 2007, the ratios would have been (0.70%) and 0.32%, respectively. |
The accompanying notes to financial statements are an integral part of these statements.
- 10 -
Reynolds Blue Chip Growth Fund
NOTES TO FINANCIAL STATEMENTS
September 30, 2008
| (1) | Summary of Significant Accounting Policies — |
| The following is a summary of significant accounting policies of the Reynolds Funds, Inc. (the “Company”), which is registered as a diversified, open-end management investment company under the Investment Company Act of 1940, as amended. This Company consists of one fund: the Reynolds Blue Chip Growth Fund (the “Fund”). The Company was incorporated under the laws of Maryland on April 28, 1988. |
| The investment objective of the Fund is to produce long-term growth of capital by investing in a diversified portfolio of common stocks issued by well-established growth companies commonly referred to as “blue chip” companies. |
(a) Each security, excluding short-term investments, is valued at the last sale price reported by the principal security exchange on which the issue is traded, or if no sale is reported, the latest bid price. Securities which are traded on the Nasdaq National Markets are valued at the Nasdaq Official Closing Price, or if no sale is reported, the latest bid price. Short-term investments with maturities of 60 days or less are valued at amortized cost which approximates value. Securities for which quotations are not readily available are valued at fair value as determined by the investment adviser under the supervision of the Board of Directors. The fair value of a security is the amount which the Fund might receive upon a current sale. The fair value of a security may differ from the last quoted price and the Fund may not be able to sell a security at the fair value. Market quotations may not be available, for example, if trading in particular securities was halted during the day and not resumed prior to the close of trading on the New York Stock Exchange. Variable rate demand notes are recorded at par value which approximates market value. For financial reporting purposes, investment transactions are recorded on the trade date.
In September 2006, the Financial Accounting Standards Board (“FASB”) issued Statement of Financial Accounting Standards (“SFAS”) No. 157, “Fair Value Measurements.” This standard establishes a single authoritative definition of fair value, sets out a framework for measuring fair value and requires additional disclosures about fair value measurements. SFAS No. 157 applies to fair value measurements already required or permitted by existing standards. SFAS No. 157 is effective for financial statements issued for fiscal years beginning after November 15, 2007 and interim periods within those fiscal years. The changes to current generally accepted accounting principles from the application of this standard relate to the definition of fair value, the methods used to measure fair value, and the expanded disclosures about fair value measurements. The adoption of SFAS No. 157 will not impact the financial statement amounts; however, additional disclosures will be required regarding the inputs used to develop the measurements and the effect of certain of the measurements included within the Statement of Operations.
(b) Net realized gains and losses on sales of securities are computed on the identified cost basis.
(c) The Fund records dividend income on the ex-dividend date and interest income on an accrual basis.
(d) The Fund has investments in short-term variable rate demand notes, which are unsecured instruments. The Fund may be susceptible to credit risk with respect to these notes to the extent the issuer defaults on its payment obligation. The Fund’s policy is to monitor the creditworthiness of the issuer and nonperformance by these issuers is not anticipated.
(e) Accounting principles generally accepted in the United States of America (“GAAP”) require that permanent differences between income for financial reporting and tax purposes be reclassified in the capital accounts.
(f) The preparation of financial statements in conformity with GAAP requires management to make estimates and assumptions that affect the reported amounts of assets and liabilities and disclosure of contingent assets and liabilities at the date of the financial statements and the reported amounts of revenues and expenses during the reporting period. Actual results could differ from these estimates.
(g) No provision has been made for Federal income taxes since the Fund has elected to be taxed as a “regulated investment company” and intends to distribute substantially all net investment company taxable income and net capital gains to shareholders and otherwise comply with the provisions of the Internal Revenue Code applicable to regulated investment companies.
- 11 -
Reynolds Blue Chip Growth Fund
NOTES TO FINANCIAL STATEMENTS (Continued)
September 30, 2008
| (1) | Summary of Significant Accounting Policies — (Continued) |
(h) Effective March 31, 2008, the Fund adopted FASB Interpretation No. 48 (FIN 48), “Accounting for Uncertainty in Income Taxes”. FIN 48 requires the evaluation of tax positions taken on previously filed tax returns or expected to be taken on future returns. These positions must meet a “more-likely-than-not” standard that, based on the technical merits, have a more than fifty percent likelihood of being sustained upon examination. In evaluating whether a tax position has met the recognition threshold, the Fund must presume that the position will be examined by the appropriate taxing authority that has full knowledge of all relevant information. Tax positions not deemed to meet the “more-likely-than-not” threshold are recorded as a tax expense in the current year.
FIN 48 requires the Fund to analyze all open tax years, as defined by the Statute of Limitations, for all major jurisdictions. Open tax years are those that are open for exam by taxing authorities. Major jurisdictions for the Fund include Federal and the state of Maryland. As of September 30, 2008, open Federal and Maryland tax years include the tax years ended September 30, 2005 through 2008. The Fund has no examinations in progress.
The Fund has reviewed all open tax years and major jurisdictions and concluded that the adoption of FIN 48 resulted in no effect to the Fund’s financial position or results of operations. There is no tax liability resulting from unrecognized tax benefits relating to uncertain income tax positions taken or expected to be taken on the tax return for the fiscal year-end September 30, 2008. The Fund is also not aware of any tax positions for which it is reasonably possible that the total amounts of unrecognized tax benefits will significantly change in the next twelve months.
| (2) | Investment Adviser and Management Agreement and Transactions With Related Parties — |
The Fund has a management agreement with Reynolds Capital Management (“RCM”), with whom an officer and a director of the Fund is affiliated, to serve as investment adviser and manager. Under the terms of the agreement, the Fund will pay RCM a monthly management fee at the annual rate of 1% of the daily net assets.
For the year ended September 30, 2008, RCM reimbursed the Fund for expenses over 2.00% of the Fund’s daily net assets totaling $160,893.
The Fund has adopted a Service and Distribution Plan (the “Plan”) pursuant to Rule 12b-1 under the Investment Company Act of 1940. The Plan provides that the Fund may incur certain costs which may not exceed a maximum amount equal to 0.25% per annum of the Fund’s average daily net assets. Payments made pursuant to the Plan may only be used to pay distribution expenses incurred in the current year.
Under the Fund’s organizational documents, each Director, officer, employee or other agent of the Fund (including the Fund’s investment manager) is indemnified, to the extent permitted by the Act, against certain liabilities that may arise out of performance of their duties to the Fund. Additionally, in the normal course of business, the Fund enters into contracts that contain a variety of indemnification clauses. The Fund’s maximum exposure under these arrangements is unknown as this would involve future claims that may be made against the Fund that have not yet occurred. However, the Fund has not had prior claims or losses pursuant to these contracts and believes the risk of loss to be remote.
| (3) | Distributions to Shareholders — |
Net investment income and net realized gains, if any, for the Fund are distributed to shareholders at least annually.
| (4) | Investment Transactions — |
For the year ended September 30, 2008, purchases and proceeds of sales of investment securities (excluding short-term securities) were $11,441,644 and $36,236,158, respectively.
- 12 -
Reynolds Blue Chip Growth Fund
NOTES TO FINANCIAL STATEMENTS (Continued)
September 30, 2008
| (5) | Income Tax Information — |
The following information for the Fund is presented on an income tax basis as of September 30, 2008:
| Gross | Gross | Net Unrealized | Distributable | Distributable | ||||||
| Cost of | Unrealized | Unrealized | Appreciation | Ordinary | Long-Term | |||||
| Investments | Appreciation | Depreciation | on Investments | Income | Capital Gains | |||||
| $22,098,362 | $85,347 | $4,392 | $80,955 | $ — | $ — |
The difference, if any, between the cost amount for financial statement and federal income tax purposes is due primarily to timing differences in recognizing certain gains and losses in security transactions.
The tax components of dividends paid during the year ended September 30, 2008, capital loss carryovers, which may be used to offset future capital gains, subject to Internal Revenue Code limitations (expiring in varying amounts through 2013), as of September 30, 2008, and tax basis post-October losses as of September 30, 2008, which are not recognized for tax purposes until the first day of the following fiscal year are:
| September 30, 2008 | September 30, 2007 | |||||||||
| Ordinary | Long-Term | Net Capital | Ordinary | Long-Term | ||||||
| Income | Capital Gains | Loss | Post-October | Income | Capital Gains | |||||
| Distributions | Distributions | Carryovers | Losses | Distributions | Distributions | |||||
| $171,260 | — | $90,666,363 | — | — | — | |||||
The Fund has utilized $1,865,914 of its capital loss carryovers during the year ended September 30, 2008.
For corporate shareholders in the Fund, the percentage of dividend income distributed for the year ended September 30, 2008, which is designated as qualifying for the dividends received deduction is 79% (unaudited).
For the shareholders in the Fund, the percentage of dividend income distributed for the year ended September 30, 2008, which is designated as qualified dividend income under the Jobs and Growth Tax Relief Act of 2003, is 79% (unaudited).
- 13 -
REPORT OF INDEPENDENT REGISTERED PUBLIC ACCOUNTING FIRM
To the Board of Directors and Shareholders
of Reynolds Funds, Inc.
In our opinion, the accompanying statement of assets and liabilities, including the schedule of investments, and the related statements of operations and of changes in net assets and the financial highlights present fairly, in all material respects, the financial position of Reynolds Blue Chip Growth Fund (the “Fund” a series of the Reynolds Funds, Inc.) at September 30, 2008, the results of its operations for the year then ended, the changes in its net assets for each of the two years in the period then ended and the financial highlights for each of the five years in the period then ended, in conformity with accounting principles generally accepted in the United States of America. These financial statements and financial highlights (hereafter referred to as “financial statements”) are the responsibility of the Fund’s management; our responsibility is to express an opinion on these financial statements based on our audits. We conducted our audits of these financial statements in accordance with the standards of the Public Company Accounting Oversight Board (United States). Those standards require that we plan and perform the audit to obtain reasonable assurance about whether the financial statements are free of material misstatement. An audit includes examining, on a test basis, evidence supporting the amounts and disclosures in the financial statements, assessing the accounting principles used and significant estimates made by management, and evaluating the overall financial statement presentation. We believe that our audits, which included confirmation of securities at September 30, 2008 by correspondence with the custodian, provide a reasonable basis for our opinion.

Milwaukee, Wisconsin
November 7, 2008
- 14 -
Reynolds Blue Chip Growth Fund
DIRECTORS AND OFFICERS
| Other | |||||
| Term of | # of Funds | Directorships | |||
| Position | Office and | in Complex | Held by | ||
| Name, Age | Held with | Length of | Principal Occupation(s) | Overseen | Director |
| and Address | the Fund | Time Served | During Past Five Years | by Director | or Officer |
| Non-Interested Directors: | |||||
| Dennis N. Moser, 66 | Director | Indefinite Term | Mr. Moser is a partner in Glenbrook Partner, | 1 | None |
| 77 Stockbridge | Since 2002 | LLC, a payments consulting firm. | |||
| Atherton, CA 94027 | |||||
| Robert E. Stauder, 78 | Director | Indefinite Term | Mr. Stauder is retired. He was a principal of | 1 | None |
| 436 Cassabonne Lane | Since 1988 | Robinson Mills + Williams, an architectural | |||
| Sonoma, CA 95476 | and interior design firm, from 1991 until 1996. | ||||
| Interested Director: | |||||
| Frederick L. Reynolds,* 66 | Director, | Indefinite Term | Mr. Reynolds is the sole proprietor of | 1 | None |
| 2580 Kekaa Drive #115 | Since 1988 | the Adviser, which business commenced in 1985. | |||
| Lahaina, HI 96761 | President | One Year Term | |||
| and | Since 1988 | ||||
| Treasurer | |||||
| Other Officers: | |||||
| N. Lynn Bowley, 50 | Chief | At Discretion | Mr. Bowley has been a Compliance Officer for | N/A | None |
| Northern Lights | Compliance | of Board | Northern Lights Compliance Services, LLC, | ||
| Compliance Services, LLC | Officer | Since October | (f/k/a) Fund Compliance Services, LLC, since | ||
| 4020 S. 147th Street | 2007 | 2007. From 2002 to 2006 he was Vice-President | |||
| Omaha, NE 68137 | of Investment Support Services for Mutual of | ||||
| Omaha Companies. | |||||
__________
* Mr. Reynolds is the only interested director of the Company as that term is defined in the Investment Company Act of 1940. Mr. Reynolds is an interested director of the Company by reason of his being an officer of the Company and the sole proprietor of the investment adviser.
For additional information about the Directors and Officers or for a description of the policies and procedures that the Fund uses to determine how to vote proxies relating to portfolio securities, please call (800) 773-9665 and request a Statement of Additional Information. One will be mailed to you free of charge. The Statement of Additional Information is also available on the website of the Securities and Exchange Commission (the “Commission”) at http://www.sec.gov. Information on how the Fund voted proxies relating to portfolio securities is available on the Fund’s website at http://www.reynoldsfunds.com or the website of the Commission no later than August 31 for the prior 12 months ending June 30. The Fund files its complete schedule of portfolio holdings with the Commission for the first and third quarters of each fiscal year on Form N-Q. The Fund’s Form N-Q is available on the Commission’s website. The Fund’s Form N-Q may be reviewed and copied at the Commission’s Public Reference Room in Washington, D.C., and that information on the operation of the Public Reference Room may be obtained by calling 1-800-SEC-0330.
- 15 -
REYNOLDS BLUE CHIP GROWTH FUND
c/o U.S. BANCORP FUND SERVICES, LLC
615 East Michigan Street
Milwaukee, Wisconsin 53202
www.reynoldsfunds.com
Board of Directors
DENNIS N. MOSER
FREDERICK L. REYNOLDS
ROBERT E. STAUDER
Investment Adviser
REYNOLDS CAPITAL MANAGEMENT
2580 Kekaa Drive, #115
Lahaina, Hawaii 96761
Administrator
FIDUCIARY MANAGEMENT, INC.
100 East Wisconsin Avenue, Suite 2200
Milwaukee, Wisconsin 53202
Transfer Agent and
Dividend Disbursing Agent
U.S. BANCORP FUND SERVICES, LLC
615 East Michigan Street
Milwaukee, Wisconsin 53202
1-800-773-9665
or 1-800-7REYNOLDS
1-414-765-4124
Custodian
U.S. Bank, N.A.
1555 North RiverCenter Drive, Suite 302
Milwaukee, Wisconsin 53212
Independent Registered Public Accounting Firm
PRICEWATERHOUSECOOPERS LLP
100 East Wisconsin Avenue
Suite 1800
Milwaukee, Wisconsin 53202
Legal Counsel
FOLEY & LARDNER LLP
777 East Wisconsin Avenue
Milwaukee, Wisconsin 53202
Item 2. Code of Ethics.
Registrant has adopted a code of ethics. See attached Exhibit 12 (a).
Item 3. Audit Committee Financial Expert.
Registrant’s Board of Directors has determined that it does not have an “audit committee financial expert” serving on its audit committee. While Registrant believes that each of the members of its audit committee has sufficient knowledge of accounting principles and financial statements to serve on the audit committee, none has the requisite experience to qualify as an “audit committee financial expert” as such term is defined by the Securities and Exchange Commission.
Item 4. Principal Accountant Fees and Services.
(a) Audit Fees
$26,472 (FY 2008) and $19,620 (FY 2007) are the aggregate fees billed for each of the last two fiscal years for professional services rendered by the principal accountant to the registrant for the audit of the registrant’s annual financial statements or services that are normally provided by the accountant in connection with statutory and regulatory filings or engagements for those fiscal years.
(b) Audit-Related Fees
There were no fees billed in each of the last two fiscal years for Audit-Related Fees.
| (c) | Tax Fees |
$0 (FY 2008) and $15,400 (FY 2007) are the aggregate fees billed in each of the last two fiscal years for professional services rendered by the principal accountant to the registrant for tax compliance, tax advice, tax planning and tax return preparation. The tax fees reported above for FY 2007 include fees of $9,250 for services related to the liquidation of two funds.
There were no fees billed in each of the last two fiscal years for professional services rendered by the principal accountant to registrant’s investment adviser for tax compliance, tax advice and tax planning that were required to be approved by the audit committee pursuant to paragraph (c)(7)(ii) of Rule 2-01 of Regulation S-X.
(d) All Other Fees
There were no fees billed in each of the last two fiscal years for products and services provided by the principal accountant to the registrant, other than the services reported in paragraphs (a) – (c) of this Item 4.
There were no fees billed in each of the last two fiscal years for products and services provided by the principal accountant to registrant’s investment adviser, which were required to be approved by the audit committee pursuant to paragraph (c)(7)(ii) or Rule 2-01 or Regulation S-X.
(e) (1) None
(e) (2) None
(f) Not applicable.
(g) See the tax fees disclosed in paragraph (c) of this Item 4.
(h) Not applicable, as no non-audit services were provided to registrant’s investment adviser.
Item 5. Audit Committee of Listed Registrants.
Not applicable.
Item 6. Schedule of Investments.
The schedule of investments in securities of unaffiliated issuers is included as part of the report to shareholders filed under Item 1.
Item 7. Disclosure of Proxy Voting Policies and Procedures for Closed-End Management Investment Companies.
Not applicable.
Item 8. Portfolio Managers of Closed-End Management Investment Companies.
Not applicable.
Item 9. Purchases of Equity Securities By Closed-End Management Investment Company and Affiliated Purchasers.
Not applicable.
Item 10. Submission of Matters to a Vote of Security Holders.
None.
Item 11. Controls and Procedures.
| (a) | The disclosure controls and procedures of the Reynolds Funds, Inc. are periodically evaluated. As of October 1, 2008, the date of the last evaluation, we concluded that our disclosure controls and procedures are adequate. |
| (b) | The internal controls of the Reynolds Funds, Inc. are periodically evaluated. There were no changes to Reynolds Funds’ internal control over financial reporting that occurred during the second fiscal quarter of the period covered by this report that have materially affected, or are reasonably likely to materially affect, such controls. |
Item 12. Exhibits.
| (a) | Any code of ethics or amendment thereto. Filed herewith. |
| (b) | Certifications pursuant to Section 302 of the Sarbanes-Oxley Act of 2002. Filed herewith. |
| (c) | Certification pursuant to Section 906 of the Sarbanes-Oxley Act of 2002. Filed herewith. |
SIGNATURES
Pursuant to the requirements of the Securities Exchange Act of 1934 and the Investment Company Act of 1940, the registrant has duly caused this report to be signed on its behalf by the undersigned, thereunto duly authorized.
Reynolds Funds, Inc.
Registrant
By /s/Frederick L. Reynolds
Frederick L. Reynolds, Principal Executive Officer
Date November 25, 2008
Pursuant to the requirements of the Securities Exchange Act of 1934 and the Investment Company Act of 1940, this report has been signed below by the following persons on behalf of the registrant and in the capacities and on the dates indicated.
Reynolds Funds, Inc.
Registrant
By /s/Frederick L. Reynolds
Frederick L. Reynolds, Principal Financial Officer
Date November 25, 2008