UNITED STATES
SECURITIES AND EXCHANGE COMMISSION
Washington, D.C. 20549
FORM N-CSR
CERTIFIED SHAREHOLDER REPORT OF REGISTERED
MANAGEMENT INVESTMENT COMPANIES
Investment Company Act file number 811-05549
Reynolds Funds, Inc.
(Exact name of registrant as specified in charter)
c/o U.S. Bancorp Fund Services, LLC
615 E. Michigan Street
Milwaukee, WI 53202
(Address of principal executive offices) (Zip code)
Frederick L. Reynolds
Reynolds Capital Management
2580 Kekaa Drive #115
Lahaina, Hawaii 96761
(Name and address of agent for service)
(415) 265-7167
Registrant's telephone number, including area code:
Date of fiscal year end: September 30
Date of reporting period: September 30, 2011
Item 1. Reports to Stockholders.
ANNUAL REPORT
September 30, 2011
REYNOLDS BLUE CHIP GROWTH FUND |
| Seeking Long-Term Capital Appreciation |
A No-Load Mutual Fund
1-800-773-9665
www.reynoldsfunds.com
REYNOLDS BLUE CHIP GROWTH FUND
November 23, 2011
Dear Fellow Shareholders:
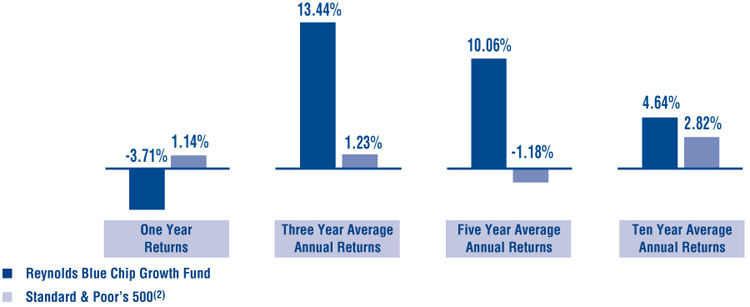
Performance highlights (September 30, 2011)
The Reynolds Blue Chip Growth Fund has a 5 Star(1) overall rating from Morningstar. This is Morningstar’s highest overall mutual fund rating. The performance of the Reynolds Blue Chip Growth Fund (the “Fund” or the “Blue Chip Fund”) in the twelve months ended September 30, 2011 was -3.71%. The performance of the Standard & Poor’s 500 Index(2) during that same period was +1.14%. The annualized average total returns of the Reynolds Blue Chip Growth Fund for the 3-year, 5-year and 10-year periods through September 30, 2011 were + 13.44%, +10.06%, and +4.64%, respectively. The annualized average total returns for the Fund’s benchmark, the Standard & Poor’s 500, for the 3-year, 5-year and 10-year periods through September 30, 2011 were +1.23%, -1.18%, and +2.82%, respectively.
 |
| (1) | The Reynolds Blue Chip Growth Fund has an Overall Morningstar Rating of 5 Stars. This is out of 1,479 funds in Morningstar’s Large Growth Category which is the Fund’s Morningstar Category. The Overall Morningstar Rating for a fund is derived from a weighted-average of the performance figures associated with its three-, five-, and ten -year (if applicable) ratings, based on risk-adjusted returns. For each fund with at least a three-year history, Morningstar calculates a Morningstar Rating™ based on a Morningstar Risk-Adjusted Return measure that accounts for variation in a fund’s monthly performance (including the effects of sales charges, loads, and redemption fees), placing more emphasis on downward variations and rewarding consistent performance. The top 10% of funds in each category receive 5 stars, the next 22.5% receive 4 stars, the next 35% receive 3 stars, the next 22.5% receive 2 stars and the bottom 10% receive 1 star. Past performance is no guarantee of future results. |
| (2) | The Standard & Poor’s 500 Index consists of 500 selected common stocks, most of which are listed on the New York Stock Exchange. The Standard & Poor’s Ratings Group designates the stocks to be included in the Index on a statistical basis. A particular stock’s weighting in the Index is based on its relative total market value (i.e. its market price per share times the number of shares outstanding.) Stocks may be added or deleted from the Index from time to time. |
Investment Strategy
Ideally I would always invest in stocks for the long-term and have low turnover. However, it is very important to closely analyze intermediate-term potential economic cycles and resulting stock market problems or positives. In October 2007, I became increasingly concerned regarding several potential economic problems. I believed that one of these potential problems was high housing prices, and the increasingly speculative financial instruments that had evolved in this segment of the economy. As a result, I began implementing a strong “defensive investment strategy” for the Reynolds Blue Chip Growth Fund by selling equities held in the Fund and raising the cash position. The beginning of the implementation of this defensive investment strategy coincided within a few days of the intermediate top of the stock market in October 2007. I began purchasing equities for the Blue Chip Fund in March 2009, as I believed that the prices of many high
1
quality equities had declined to attractive long-term buying ranges and the massive amount of stimulus that was being implemented worldwide would be a positive. The beginning of the implementation of this more “normal investment strategy” also coincided within a few days of the intermediate bottom of the stock market.
The U.S. Economy
The U.S. economic recovery that started in mid-2009 has continued so far in 2011. The U.S. economy is growing, but at a lower than ideal rate. For example, growth of 3% or better is needed to begin meaningfully reducing unemployment which is at 9%. In the last two months the economy has been growing faster than was forecast a few months ago. U.S. Gross Domestic Product (GDP) is estimated to have expanded at an inflation-adjusted annual rate of 2.5% in the quarter ended September 30, 2011 helped by stronger than expected consumer spending and business investment. Americans spent more on services such as health care, restaurants and finance. This is the most robust quarterly performance in a year and eased anxiety that the recovery may be stalling. U.S. GDP is forecast to expand at a 2.2% rate in the quarter ended December 31, 2011. U.S. GDP increased at a 1.3% rate in the quarter ended June 30, 2011; at a 0.4% rate in the quarter ended March 31, 2011; at a 2.3% rate in the quarter ended December 31, 2010; at a 2.5% rate in the quarter ended September 30, 2010; at a 3.8% rate in the quarter ended June 30, 2010; at a 3.9% rate in the quarter ended March 31, 2010, at a 5.0% rate in the quarter ended December 31, 2009; and at a 1.6% rate in the quarter ended September 30, 2009. Prior to that, the economy decreased for four consecutive quarters. For the next six months the outlook remains for good but less than ideal growth accompanied by high unemployment, modest inflation pressures and no change in the Federal Reserve policy on the federal funds rate. The economy will continue to be characterized by large fiscal deficits. The Fed completed the second round of economic stimulus in June 2011. The Fed recently began “Operation Twist” by purchasing longer term maturity Treasury Bonds and selling shorter term maturity Treasury Bonds. This tends to moderately lower longer term interest rates. This should add a moderate amount to economic growth.
There are some current and potential economic and investment negatives at the present time including: (1) hiring continues cautious and unemployment at 9% is still high, more than two and one half years after the economy started growing; (2) high oil prices including higher gasoline prices continue to negatively affect economic growth, although prices have recently declined; (3) mortgage rates are low, but mortgage credit is still somewhat tight; (4) federal, state and local government spending remains weak; (5) inflation, while modest, continues to creep upward; (6) the U.S. deficit needs to be reduced; (7) there are major economic problems with some individual Euro-zone countries such as Greece, Italy, Ireland, Portugal, and Spain which may spread to other countries; (8) the European Commission recently lowered its Euro-zone forecast for 2012 to 0.5% from 1.8%; (9) the Euro-zone economy may slip into a recession in the near term; (10) Euro-zone problems and uncertainties may continue for some time; and (11) economic problems in Europe may negatively affect U.S. economic growth.
Some current and potential economic and investment positives are: (1) the Conference Board’s confidence gauge and the Thomson/Reuters/University of Michigan index of consumer sentiment recently improved; (2) consumer spending, which accounts for about 71% of the economy, has recently increased; (3) manufacturing demand and output are showing gains; (4) capital spending on equipment and software has been increasing; (5) employment and payrolls are increasing although at a modest rate; (6) there is modest growth in commercial and residential construction; (7) near term energy costs including gasoline have recently decreased; (8) there has recently been a modest increase in new home sales; (9) productivity has recently increased; (10) there has been an increase in the willingness of companies to commit capital as evidenced by the increase in merger and acquisition activity; (11) the economy has grown in the last eight quarters through the September 30, 2011 quarter and growth should continue in the near term; (12) growth in the service sector is broadening; (13) businesses have been able to use the credit markets to strengthen their balance sheets; (14) short-term interest rates remain low helped by a low Fed Funds rate; (15) long-term Treasury rates have fallen in response to the problems in Europe; (16) many companies reported revenue growth, not just earnings growth from cutting expenses in the most recent quarters; (17) European leaders agreed to expand a bailout fund; (18) the European Central Bank (ECB) recently cut its benchmark interest rate by 0.25% to 1.25% to boost growth; and (19) the current valuation of stocks is at the low end of historical ranges.
The U.S. economic recovery continues to be affected by a number of secular factors that are altering the pace and composition of growth. The economy in 2011 is being affected by greater prudence and less speculation in lending, high unemployment and less leverage for consumer spending. GDP increased 3.0% in 2010 after decreasing 3.6% in calendar 2009, after no change (0.0%) in calendar 2008, and increasing 2.1% in 2007, 2.8% in 2006, 3.1% in 2005, 3.9% in 2004, 2.7% in 2003, 1.9% in 2002, 0.8% in 2001 and 3.7% in 2000. GDP is forecast to increase 1.65% in 2011 and 2.7% in 2012.
U.S. inflation numbers have been helped in the last few years by such factors as: (1) global competition; (2) advances in technology resulting in increasing productivity; and (3) technology innovations that are helping to lower production and distribution costs. Inflation, as measured by the Consumer Price Index, increased 1.6% in 2010 after decreasing 0.3% in 2009, and increasing 3.8% in 2008, 2.9% in
2
2007, 3.2% in 2006, 3.4% in 2005, 2.7% in 2004, 2.3% in 2003, 1.6% in 2002, 2.8% in 2001 and 3.4% in 2000. U.S. inflation is forecast to increase 1.85% in 2011 and 1.75% in 2012.
The World Economy
The global economic recovery that started in mid-2009 has continued in 2011. Growth is slowing, but outside of Europe, most economies do not appear to be contracting. The expansion today, except for the Euro-zone, appears to be more sustainable than it was a year ago because domestic demand is better in many economies and accommodative financial conditions remain largely in place in most countries. Recovery is strongest in Asia with China having the strongest growth. However, China’s growth rate has recently slowed to 9%. Other Asian countries are having good growth rates as well. Recovery is also occurring in Latin America and Brazil. Some developing countries in the world have been growing faster than the U.S. in the last few years. Their economies continued to grow faster than the U.S. during the most recent worldwide economic slowdown and their economies are continuing to grow faster. The biggest risk to Euro-zone economic growth is related to the potential sovereign government debt crises that have appeared. Europe needs significant fiscal retrenchment in the next few years which is slowing their economic growth. The Euro-zone may slip into a recession and real GDP may decrease 1% over the next two quarters.
The World Economy increased 4.8% in 2010 after decreasing 0.8% in 2009 and is forecast to increase 3.4% in 2011 and 3.1% in 2012. Among “advanced economies”: (1) Japan increased 4.0% in 2010 after decreasing 5.2% in 2009 and is forecast to decrease 0.7% in 2011 and increase 1.8% in 2012; (2) the Euro-zone increased 1.7% in 2010 after decreasing 4.0% in 2009 and is forecast to increase 1.5% in 2011 and 0.5% in 2012; (3) the United Kingdom increased 1.3% in 2010 after decreasing 4.9% in 2009 and is forecast to increase 0.8% in 2011 and 1.0% in 2012; (4) Canada increased 3.1% in 2010 after decreasing 2.6% in 2009 and is forecast to increase 2.2% in 2011 and 2.1% in 2012; and (5) Korea increased 6.2% in 2010 after increasing 0.2% in 2009 and is forecast to increase 3.7% in 2011 and 3.8% in 2012.
The biggest developing economies are many times referred to as the “BRIC” economies, which is short for Brazil, Russia, India, and China. China’s population is approximately 19% of the world’s total population of approximately seven billion. Many economists believe that China has a particularly good long-term outlook. In the second quarter of 2010 China overtook Japan and became the world’s second largest economy after the U.S. It is the world’s fastest growing major economy. China was one of the first countries to show a pickup in growth as the recession was ending in 2009 and it helped to lead the world out of recession. China’s strong growth is resulting in policy makers withdrawing record fiscal and monetary stimulus. For example, bank lending has been tightened and interest rates have been raised several times. GDP increased 10.4% in 2010 after increasing 8.5% in 2009 and is forecast to increase 9.1% in 2011 and 8.1% in 2012.
India’s population is approximately 17% of the world’s population. It is the world’s second fastest growing economy. India’s economy increased 8.4% in 2010 after increasing 6.8% in 2009 and is forecast to increase 7.3% in 2011 and 7.4% in 2012.
Brazil is Latin America’s biggest economy. Brazil emerged from its first recession since 2003 in the second quarter of 2009. GDP increased 7.5% in 2010 after decreasing 0.2% in 2009 and is forecast to increase 3.2% in 2011 and 3.5% in 2012. Russia’s economy grew at 4.0% in 2010 after decreasing 7.9% in 2009 and is forecast to increase 4.0% in 2011 and 3.2% in 2012.
Many worldwide larger multinational companies should be well positioned to benefit long-term from worldwide growth. To the extent that some of these companies’ U.S. earnings are growing slower, this could be somewhat offset by their possible stronger foreign earnings. The long-term strategy of the Reynolds Blue Chip Growth Fund is to be structured to benefit from this worldwide growth by investing in many of these leading multinational growth companies.
The Blue Chip Fund is positioned to participate in long-term worldwide growth trends through investments in multinational U.S. headquartered companies. In addition, the Fund has investments in leading foreign headquartered companies, whose stocks or American Depositary Receipts (ADRs) trade in the United States. These ADRs are denominated in dollars and they must use GAAP (Generally Accepted Accounting Principles) accounting to qualify as an ADR. The Blue Chip Fund may hold up to 35% of its assets in ADRs.
Opportunistic Investing in Companies of Various Sizes and Diversified Among Various Industries
The Reynolds Blue Chip Growth Fund usually invests in companies of various sizes as classified by their market capitalizations. A company’s market capitalization is calculated by taking the number of shares the company has outstanding multiplied by its current market price. Other considerations in selecting companies for the Fund include revenue growth rates, product innovations, financial strength, management’s knowledge and experience plus the overall economic and geopolitical environments and interest rates. The Fund’s investments are diversified among various industries.
The long-term strategy of the Reynolds Blue Chip Growth Fund is to emphasize investment in worldwide “blue chip” growth companies. These companies are defined as companies with a minimum market capitalization of $1 billion. In the long-term these companies build value as their earnings grow. This growth in value should ultimately be recognized in higher stock prices for these companies.
3
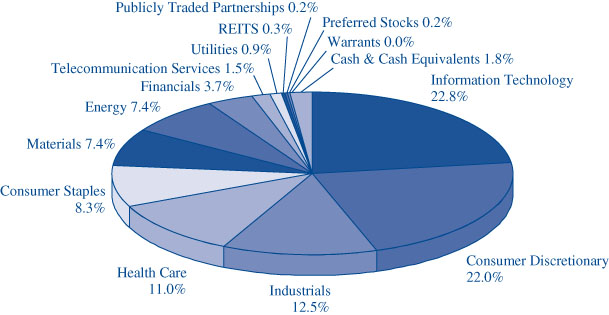
Industry Sectors(3) as of September 30, 2011
 |
| (3) | The Global Industry Classification Standard (“GICS®”) was developed by and/or is the exclusive property of MSCI, Inc. and Standard & Poor’s Financial Services LLC (“S&P”). GICS® is a service mark of MSCI and S&P and has been licensed for use by U.S. Bancorp Fund Services, LLC. |
Low Long-Term Interest Rates by Historical Standards are a Significant Positive for Stock Valuations
Long-term interest rates remain near historically low levels. Low long-term interest rates usually result in higher stock valuations for many reasons including:
| (1) | Long-term borrowing costs of corporations are lower resulting in higher business confidence and profits. |
| (2) | Long-term borrowing costs of individuals are lower which increases consumer confidence and spending. |
| (3) | A company’s stock is usually valued by placing a present value on that company’s future stream of earnings and dividends. The present value is higher when interest and inflation rates are low. |
Linked Money Market Fund
The First American Treasury Obligations Fund is a money market fund offered by an affiliate of our transfer agent, U.S. Bancorp Fund Services, LLC. This Fund is offered as a money market alternative to our shareholders. The First American Treasury Obligations Fund offers many free shareholder conveniences including automatic investment and withdrawal plans and check writing access to your funds and is linked to your holdings in the Reynolds Blue Chip Growth Fund. This Fund is also included on your quarterly statements.
Information about the Reynolds Blue Chip Growth Fund and the First American Treasury Obligations Fund
Reynoldsfunds.com website: You can access current information about your investment holdings via our website, reynoldsfunds.com. You must first request a personal identification number (PIN) by calling our shareholder service representatives at (800) 773-9665. You will be able to view your account list, account detail (including balances), transaction history, distributions, and the current Reynolds Blue Chip Growth Fund net asset value. Additional information available (PIN number not needed) includes quarterly updates of the returns of the Blue Chip Fund, top ten holdings and industry percentages. Also, detailed statistics and graphs of past performances from a link to Morningstar for the Blue Chip Fund.
For automatic current daily net asset values: Call 1-800-773-9665 (1-800-7REYNOLDS) twenty-four hours a day, seven days a week and press “any key” then “1”. The updated current net asset value for the Blue Chip Fund is usually available each business day after 5 P.M. (PST).
For the Reynolds Blue Chip Growth Fund shareholders to automatically access their current account information: Call 1-800-773-9665 (twenty-four hours a day, seven days a week), press “any key” then “2” and enter your 16 digit account number which appears at the top right of your statement.
To speak to a Fund representative regarding the current daily net asset value, current account information and any other questions: Call 1-800-773-9665 and press “0” from 6 A.M. to 5 P.M. (PST).
Shareholder statement frequency: Consolidated statements summarizing the Blue Chip Fund and First American Treasury Obligations Fund accounts held by a shareholder are sent quarterly. In addition, individual Blue Chip Fund statements are sent whenever a transaction
4
occurs. These transactions are: (1) statements are sent for the Blue Chip Fund or First American Treasury Obligations Fund when a shareholder purchases or redeems shares; (2) Blue Chip Fund statements are sent twice a year if, and when, any ordinary income or capital gains are distributed.
Tax reporting: Individual 1099 forms, which summarize any dividend income and any long- or short-term capital gains, are sent annually to shareholders each January. The percentage of income earned from various government securities, if any, for the Blue Chip Fund and the First American Treasury Obligations Fund are also reported in January.
Minimum investment: $1,000 for regular and retirement accounts ($100 for additional investments for all accounts – except for the Automatic Investment Plan, which is $50 for regular and retirement plan accounts).
Retirement plans: All types are offered including Traditional IRA, Roth IRA, Coverdell Education Savings Account, SIMPLE IRA Plan, and SEP IRA.
Automatic Investment Plan: There is no charge to automatically debit your checking account to invest in the Blue Chip Fund or the First American Treasury Obligations Fund ($50 minimum for either of these Funds) at periodic intervals to make automatic purchases in either of these Funds. This is useful for dollar cost averaging for the Blue Chip Fund.
Systematic Withdrawal Plan: For shareholders with a $10,000 minimum starting balance, there is no charge to automatically redeem shares ($100 minimum) in the Blue Chip Fund or the First American Treasury Obligations Fund as often as monthly and send a check to you or transfer funds to your bank account.
Free Check Writing: Free check writing ($100 minimum) is offered for accounts invested in the First American Treasury Obligations Fund.
Exchanges or regular redemptions between the Blue Chip Fund and the First American Treasury Obligations Fund: As often as desired – no charge.
NASDAQ symbols: Reynolds Blue Chip Growth Fund – RBCGX and First American Treasury Obligations Fund – FATXX.
Portfolio Manager: Frederick Reynolds is the portfolio manager of the Reynolds Blue Chip Growth Fund.
The Reynolds Blue Chip Growth Fund and the First American Treasury Obligations Fund are No-Load: No front-end sales commissions or deferred sales charges (“loads”) are charged. Over 40% of all mutual funds impose these marketing charges that are ultimately paid by the shareholder. These marketing charges are either: (1) a front-end fee or “load” in which up to 5% of a shareholder’s assets are deducted from the original investment (some funds even charge a fee when a shareholder reinvests capital gains or dividends); or (2) a back-end penalty fee or “load” which is typically deducted from a shareholder’s account if a shareholder redeems within five years of the original investment. These fees reduce a shareholder’s return. The Blue Chip Fund and First American Treasury Obligations Fund are No-Load as they do not have these extra charges.
We appreciate your continued confidence in the Reynolds Blue Chip Growth Fund and would like to welcome our new shareholders. We look forward to strong results in the future.
Sincerely,
 |
Frederick L. Reynolds President |
This report is not authorized for use as an offer of sale or a solicitation of an offer to buy shares of the Reynolds Blue Chip Growth Fund unless accompanied or preceded by the Fund’s current prospectus. Performance data quoted represents past performance; past performance does not guarantee future results. The investment return and principal value of an investment will fluctuate so that an investor’s shares, when redeemed, may be worth more or less than their original cost. Current performance of the Fund may be lower or higher than the performance quoted. Performance data current to the most recent month end may be obtained by visiting www.reynoldsfunds.com.
This shareholder letter is unaudited.
5
Reynolds Blue Chip Growth Fund
COST DISCUSSION (Unaudited)
As a shareholder of the Reynolds Blue Chip Growth Fund, you do not incur (except as described below) transaction costs, including sales charges (loads) on purchase payments, reinvested dividends, or other distributions; redemption fees; and exchange fees, but do incur ongoing costs, including management fees; distribution [and/or service] (12b-1) fees; and other Fund expenses. This example is intended to help you understand your ongoing costs (in dollars) of investing in the Fund and to compare these costs with the ongoing costs of investing in other mutual funds.
The example is based on an investment of $1,000 invested at the beginning of the period and held for the entire period from April 1, 2011 through September 30, 2011.
Actual Expenses
The first line of the table below provides information about actual account values and actual expenses. You may use the information in this line, together with the amount you invested, to estimate the expenses that you paid over the period. Simply divide your account value by $1,000 (for example, an $8,600 account value divided by $1,000 = 8.6), then multiply the result by the number in the first line under the heading entitled “Expenses Paid During Period” to estimate the expenses you paid on your account during this period.
In addition to the costs highlighted and described below, the only Fund transaction costs you might currently incur would be wire fees ($15 per wire), if you choose to have proceeds from a redemption wired to your bank account instead of receiving a check. Additionally, U.S. Bank charges an annual processing fee ($15) if you maintain an IRA account with the Fund. To determine your total costs of investing in the Fund, you would need to add any applicable wire or IRA processing fees you’ve incurred during the period to the costs provided in the example below.
Hypothetical Example for Comparison Purposes
The second line of the table below provides information about hypothetical account values and hypothetical expenses based on the Fund’s actual expense ratio and an assumed rate of return of 5% per year before expenses, which is not the Fund’s actual return. The hypothetical account values and expenses may not be used to estimate the actual ending account balance or expenses you paid for the period. You may use this information to compare the ongoing costs of investing in the Fund and other funds. To do so, compare this 5% hypothetical example with the 5% hypothetical examples that appear in the shareholder reports of the other funds.
Please note that the expenses shown in the table are meant to highlight your ongoing costs only and do not reflect any transactional costs, such as sales charges (loads), redemption or exchange fees. Therefore, the second line of the table is useful in comparing ongoing costs only, and will not help you determine the relative total costs of owning different funds. In addition, if these transactional costs were included, your costs would have been higher.
| Beginning Account | Ending Account | Expenses Paid During | |
| Value 4/01/11 | Value 9/30/11 | Period* 4/01/11-9/30/11 | |
| Reynolds Blue Chip Growth Fund Actual | $1,000.00 | $ 792.80 | $6.92 |
| Hypothetical (5% return before expenses) | $1,000.00 | $1,017.30 | $7.79 |
| * | Expenses are equal to the Fund’s annualized expense ratio of 1.54% multiplied by the average account value over the period, multiplied by 183/365 (to reflect the one-half year period between April 1, 2011 and September 30, 2011). |
6
Reynolds Blue Chip Growth Fund
MANAGEMENT’S DISCUSSION OF FUND PERFORMANCE (Unaudited)
The Reynolds Blue Chip Growth Fund and the Standard & Poor’s 500 Index both appreciated in the first half of the Fund’s fiscal year ended March 31, 2011. This was due to several reasons including: (1) interest rates were at historically low levels; (2) the continued positive effects of the stimulus program; (3) Gross Domestic Product (GDP) and corporate profits increased during this period; and (4) the consensus economic forecast was for continued moderate growth. The Reynolds Blue Chip Growth Fund outperformed the Standard & Poor’s 500 Index (the Fund’s benchmark) during this period. One reason for this was that many of the Fund’s largest holdings outperformed the benchmark. Some of these largest holdings were: (1) Amazon; (2) Apple; (3) AutoZone; (4) Baidu; (5) Caterpillar; (6) Coca-Cola; (7) Costco; (8) Deere; (9) Hansen Natural; (10) McDonalds; (11) Nordstrom; and (12) Whole Foods Market. In addition, good individual stock selection in general was an important contributor to this good performance. Examples were: (1) Chipotle Mexican Grill; (2) Citrix Systems; (3) Dollar Tree; (4) Herbalife; (5) IBM; (6) Joy Global; (7) Norfolk and Southern; (8) Priceline; (9) Ross Stores; (10) Tempur-Pedic; (11) Union Pacific; (12) VM Ware; (13) VeriFone; and (14) Whiting Petroleum. Also, Financial Services companies were underweighted in the Fund and they underperformed the Index.
In the second half of the Reynolds Blue Chip Growth Fund’s fiscal year ended September 30, 2011, the stock market was in a correction mode and the Fund and the Standard & Poor’s 500 Index both depreciated. This was due to several reasons including: (1) the second stimulus program expired on June 30, 2011; (2) near term GDP and some industry and company forecasts were lowered; (3) heightened concern about Greece’s problems; and (4) increased concern about other Euro-zone problems. The Blue Chip Fund underperformed the S&P 500 benchmark during this period. The main reason for this underperformance was that many of the same stocks held in the Fund that outperformed in the first half underperformed the benchmark in the second half. Most of these companies that outperformed the benchmark in the first half are high quality growth companies whose earnings are growing faster than the overall market. As a result, more is expected of these companies. They can be more volatile than the market during correction periods and they were during this period.
COMPARISON OF CHANGE IN VALUE OF $10,000 INVESTMENT IN REYNOLDS BLUE CHIP GROWTH FUND AND S&P 500 INDEX(1) | ||
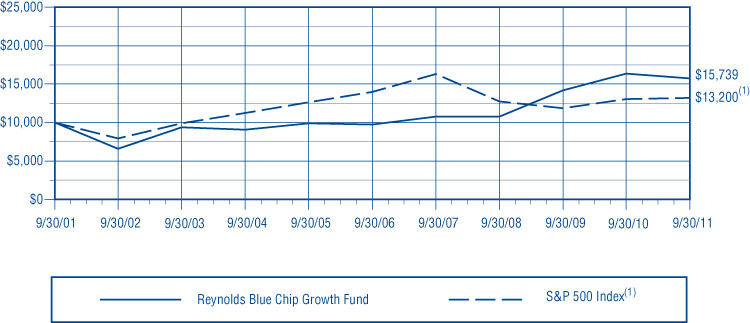 | ||
| Past performance does not predict future performance. The graph and the table do not reflect the deduction of taxes that a shareholder would pay on Fund distributions or the redemption of Fund shares. | ||
| AVERAGE ANNUAL TOTAL RETURN | ||
| 1-YEAR | 5-YEAR | 10-YEAR |
| -3.71% | 10.06% | 4.64% |
| (1) | The S&P 500 is the Standard & Poor’s Composite Index of 500 stocks, a widely recognized unmanaged index of common stock prices and includes the reinvestment of all dividends. Investors cannot invest directly in an index or benchmark. |
7
Reynolds Blue Chip Growth Fund
STATEMENT OF ASSETS AND LIABILITIES
September 30, 2011
| ASSETS: | ||||
| Investments in securities, at value (cost $216,592,689) | $ | 195,661,758 | ||
| Cash | 1,006,934 | |||
| Receivable from investments sold | 3,223,078 | |||
| Receivable from shareholders for purchases | 345,492 | |||
| Dividends receivable | 158,944 | |||
| Total assets | $ | 200,396,206 | ||
| LIABILITIES: | ||||
| Payable to shareholders for redemptions | $ | 916,281 | ||
| Payable to adviser for management fees | 178,722 | |||
| Payable for distribution expenses | 34,000 | |||
| Other liabilities | 84,664 | |||
| Total liabilities | 1,213,667 | |||
| NET ASSETS: | ||||
| Capital Stock, $0.01 par value; 40,000,000 shares authorized; 4,283,447 shares outstanding | 225,677,270 | |||
| Net unrealized depreciation on investments | (20,930,931 | ) | ||
| Accumulated net realized loss on investments | (5,563,800 | ) | ||
| Net assets | 199,182,539 | |||
| Total liabilities and net assets | $ | 200,396,206 | ||
| CALCULATION OF NET ASSET VALUE PER SHARE: | ||||
| Net asset value, offering and redemption price per share ($199,182,539 ÷ 4,283,447 shares outstanding) | $ | 46.50 | ||
The accompanying notes to financial statements are an integral part of this statement.
SCHEDULE OF INVESTMENTS
September 30, 2011
| Shares | Value | ||||||
| LONG-TERM INVESTMENTS — 98.2% (a) | |||||||
| COMMON STOCKS — 97.5% (a) | |||||||
| Aerospace & Defense — 1.9% | |||||||
| 7,400 | BE Aerospace, Inc.* | $ | 245,014 | ||||
| 7,200 | The Boeing Co. | 435,672 | |||||
| 600 | Embraer S.A. - SP-ADR | 15,222 | |||||
| 1,200 | Esterline Technologies Corp.* | 62,208 | |||||
| 3,300 | General Dynamics Corp. | 187,737 | |||||
| 4,600 | Goodrich Corp. | 555,128 | |||||
| 9,400 | Hexcel Corp.* | 208,304 | |||||
| 5,300 | Honeywell International Inc. | 232,723 | |||||
| 1,000 | ITT Corporation | 42,000 | |||||
| 2,300 | L-3 Communications Holdings, Inc. | 142,531 | |||||
| 1,300 | Lockheed Martin Corp. | 94,432 | |||||
| 2,600 | Northrop Grumman Corp. | 135,616 | |||||
| 600 | Precision Castparts Corp. | 93,276 | |||||
| 1,500 | Raytheon Co. | 61,305 | |||||
| 1,900 | Rockwell Collins, Inc. | 100,244 | |||||
| 1,600 | Spirit AeroSystems Holdings Inc.* | 25,520 | |||||
| 4,600 | TransDigm Group, Inc.* | 375,682 | |||||
| 4,600 | Triumph Group, Inc. | 224,204 | |||||
| 6,400 | United Technologies Corp. | 450,304 | |||||
| 3,687,122 | |||||||
The accompanying notes to financial statements are an integral part of this schedule.
8
Reynolds Blue Chip Growth Fund
SCHEDULE OF INVESTMENTS (Continued)
September 30, 2011
| Shares | Value | ||||||
| LONG-TERM INVESTMENTS — 98.2% (a) (Continued) | |||||||
| COMMON STOCKS — 97.5% (a) (Continued) | |||||||
| Air Freight & Logistics — 0.5% | |||||||
| 2,900 | C. H. Robinson Worldwide, Inc. | $ | 198,563 | ||||
| 4,200 | Expeditors International | ||||||
| of Washington, Inc. | 170,310 | ||||||
| 3,400 | FedEx Corp. | 230,112 | |||||
| 5,200 | United Parcel Service, Inc. Cl B | 328,380 | |||||
| 927,365 | |||||||
| Airlines — 0.3% | |||||||
| 1,700 | Alaska Air Group, Inc.* | 95,693 | |||||
| 2,200 | Allegiant Travel Co.* | 103,686 | |||||
| 3,800 | AMR Corp.* | 11,248 | |||||
| 2,700 | China Eastern Airlines | ||||||
| Corporation Ltd. - SP-ADR* | 41,688 | ||||||
| 8,700 | China Southern Airlines | ||||||
| Company Ltd. - SP-ADR* | 196,011 | ||||||
| 4,500 | Delta Air Lines, Inc.* | 33,750 | |||||
| 5,400 | Hawaiian Holdings, Inc.* | 22,734 | |||||
| 4,000 | JetBlue Airways Corp.* | 16,400 | |||||
| 5,900 | Southwest Airlines Co. | 47,436 | |||||
| 1,200 | United Continental Holdings Inc.* | 23,256 | |||||
| 2,800 | US Airways Group, Inc.* | 15,400 | |||||
| 607,302 | |||||||
| Auto Components — 0.6% | |||||||
| 6,900 | BorgWarner, Inc.* | 417,657 | |||||
| 1,900 | China Automotive Systems, Inc.* | 8,968 | |||||
| 18,330 | The Goodyear Tire & Rubber Co.* | 184,950 | |||||
| 3,300 | Johnson Controls, Inc. | 87,021 | |||||
| 700 | Magna International Inc. | 23,079 | |||||
| 8,000 | Tenneco Inc.* | 204,880 | |||||
| 4,900 | TRW Automotive Holdings Corp.* | 160,377 | |||||
| 1,086,932 | |||||||
| Automobiles — 0.5% | |||||||
| 18,100 | Ford Motor Co.* | 175,027 | |||||
| 2,200 | General Motors Co.* | 44,396 | |||||
| 6,400 | Harley-Davidson, Inc. | 219,712 | |||||
| 2,800 | Honda Motor Co., Ltd. - SP-ADR | 81,620 | |||||
| 15,800 | Tata Motors Ltd. - SP-ADR | 243,004 | |||||
| 2,200 | Tesla Motors, Inc.* | 53,658 | |||||
| 1,200 | Toyota Motor Corp. - SP-ADR | 81,912 | |||||
| 899,329 | |||||||
| Beverages — 2.5% | |||||||
| 2,000 | Anheuser-Busch | ||||||
| InBev N.V. - SP-ADR | 105,960 | ||||||
| 3,200 | The Boston Beer Company, Inc.* | 232,640 | |||||
| 17,200 | The Coca-Cola Co. | 1,162,032 | |||||
| 6,100 | Coca-Cola Enterprises Inc. | 151,768 | |||||
| 4,000 | Coca-Cola Femsa, S.A.B. | ||||||
| de C.V. - SP-ADR | 354,920 | ||||||
| 1,900 | Compania Cervecerias | ||||||
| Unidas S.A. - SP-ADR | 98,135 | ||||||
| 5,600 | Constellation Brands, Inc.* | 100,800 | |||||
| 18,600 | Cott Corp.* | 126,666 | |||||
| 1,700 | Craft Brewers Alliance Inc.* | 9,537 | |||||
| 4,100 | Diageo PLC - SP-ADR | 311,313 | |||||
| 6,200 | Dr Pepper Snapple Group, Inc. | 240,436 | |||||
| 6,100 | Fomento Economico Mexicano, | ||||||
| S.A.B. de C.V. - SP-ADR | 395,402 | ||||||
| 9,800 | Hansen Natural Corp.* | 855,442 | |||||
| 1,200 | Heineken N. V. - ADR | 26,556 | |||||
| 2,700 | Molson Coors Brewing Co. | 106,947 | |||||
| 11,600 | PepsiCo, Inc. | 718,040 | |||||
| 4,996,594 | |||||||
| Biotechnology — 1.5% | |||||||
| 7,400 | Alexion Pharmaceuticals, Inc.* | 474,044 | |||||
| 6,300 | Alkermes PLC* | 96,138 | |||||
| 3,400 | Amgen Inc. | 186,830 | |||||
| 4,800 | Amylin Pharmaceuticals, Inc.* | 44,304 | |||||
| 39,300 | ARIAD Pharmaceuticals, Inc.* | 345,447 | |||||
| 4,400 | Biogen Idec Inc.* | 409,860 | |||||
| 3,500 | Celgene Corp.* | 216,720 | |||||
| 11,000 | Cell Therapeutics, Inc.* | 11,660 | |||||
| 6,600 | Dendreon Corp.* | 59,400 | |||||
| 5,700 | Gilead Sciences, Inc.* | 221,160 | |||||
| 6,700 | Human Genome Sciences, Inc.* | 85,023 | |||||
| 20,200 | Incyte Corp.* | 282,194 | |||||
| 2,900 | InterMune, Inc.* | 58,580 | |||||
| 1,500 | Myriad Genetics, Inc.* | 28,110 | |||||
| 2,000 | Onyx Pharmaceuticals, Inc.* | 60,020 | |||||
| 500 | Pharmasset, Inc.* | 41,185 | |||||
| 10,300 | SciClone Pharmaceuticals, Inc.* | 39,243 | |||||
| 5,500 | Seattle Genetics, Inc.* | 104,830 | |||||
| 3,100 | United Therapeutics Corporation* | 116,219 | |||||
The accompanying notes to financial statements are an integral part of this schedule.
9
Reynolds Blue Chip Growth Fund
SCHEDULE OF INVESTMENTS (Continued)
September 30, 2011
| Shares | Value | ||||||
| LONG-TERM INVESTMENTS — 98.2% (a) (Continued) | |||||||
| COMMON STOCKS — 97.5% (a) (Continued) | |||||||
| Biotechnology — 1.5% (Continued) | |||||||
| 1,800 | Vertex Pharmaceuticals Inc.* | $ | 80,172 | ||||
| 8,700 | Vical Inc.* | 21,576 | |||||
| 2,982,715 | |||||||
| Building Products — 0.1% | |||||||
| 8,600 | Masco Corp. | 61,232 | |||||
| 3,300 | Owens Corning Inc.* | 71,544 | |||||
| 132,776 | |||||||
| Capital Markets — 1.2% | |||||||
| 1,100 | Affiliated Managers Group, Inc.* | 85,855 | |||||
| 900 | Ameriprise Financial, Inc. | 35,424 | |||||
| 1,400 | The Bank of New York Mellon Corp. | 26,026 | |||||
| 3,600 | BGC Partners, Inc. | 21,708 | |||||
| 2,100 | Deutsche Bank AG | 72,681 | |||||
| 7,300 | E*Trade Financial Corp.* | 66,503 | |||||
| 5,900 | Financial Engines, Inc.* | 106,849 | |||||
| 2,500 | Franklin Resources, Inc. | 239,100 | |||||
| 5,000 | The Goldman Sachs Group, Inc. | 472,750 | |||||
| 2,300 | Invesco Limited | 35,673 | |||||
| 11,100 | Janus Capital Group Inc. | 66,600 | |||||
| 2,100 | Legg Mason, Inc. | 53,991 | |||||
| 4,700 | Morgan Stanley | 63,450 | |||||
| 2,400 | Piper Jaffray Companies, Inc.* | 43,032 | |||||
| 6,000 | T. Rowe Price Group Inc. | 286,620 | |||||
| 4,700 | Raymond James Financial, Inc. | 122,012 | |||||
| 2,000 | Safeguard Scientifics, Inc.* | 30,000 | |||||
| 3,500 | The Charles Schwab Corporation | 39,445 | |||||
| 1,200 | SEI Investments Co. | 18,456 | |||||
| 2,600 | State Street Corp. | 83,616 | |||||
| 10,800 | TD Ameritrade Holding Corp. | 158,814 | |||||
| 4,500 | Virtus Investment Partners Inc.* | 241,290 | |||||
| 3,900 | Waddell & Reed Financial, Inc. | 97,539 | |||||
| 2,467,434 | |||||||
| Chemicals — 3.0% | |||||||
| 3,700 | Agrium Inc. | 246,642 | |||||
| 800 | Airgas, Inc. | 51,056 | |||||
| 3,500 | Albemarle Corporation | 141,400 | |||||
| 1,000 | Celanese Corporation | 32,530 | |||||
| 1,300 | CF Industries Holdings, Inc. | 160,407 | |||||
| 8,600 | The Dow Chemical Co. | 193,156 | |||||
| 7,100 | E.I. du Pont de Nemours and Co. | 283,787 | |||||
| 2,900 | Eastman Chemical Co. | 198,737 | |||||
| 5,900 | Ferro Corporation* | 36,285 | |||||
| 4,300 | FMC Corporation | 297,388 | |||||
| 8,300 | W.R. Grace & Co.* | 276,390 | |||||
| 2,600 | Huntsman Corporation | 25,142 | |||||
| 10,100 | International Flavors | ||||||
| & Fragrances Inc. | 567,822 | ||||||
| 8,900 | Intrepid Potash, Inc.* | 221,343 | |||||
| 4,200 | Koppers Holdings, Inc. | 107,562 | |||||
| 7,000 | Kraton Performance Polymers, Inc.* | 113,260 | |||||
| 7,300 | Kronos Worldwide, Inc. | 117,384 | |||||
| 6,800 | LyondellBasell Industries N.V. | 166,124 | |||||
| 7,600 | Monsanto Company | 456,304 | |||||
| 7,100 | The Mosaic Company | 347,687 | |||||
| 3,100 | Nalco Holding Co. | 108,438 | |||||
| 600 | NewMarket Corporation | 91,122 | |||||
| 8,100 | Olin Corp. | 145,881 | |||||
| 7,000 | Potash Corporation | ||||||
| of Saskatchewan Inc. | 302,540 | ||||||
| 4,800 | PPG Industries, Inc. | 339,168 | |||||
| 3,100 | Praxair, Inc. | 289,788 | |||||
| 6,200 | RPM International, Inc. | 115,940 | |||||
| 1,700 | The Scotts Miracle-Gro Company | 75,820 | |||||
| 3,800 | Sigma-Aldrich Corp. | 234,802 | |||||
| 7,500 | Solutia Inc.* | 96,375 | |||||
| 3,200 | The Valspar Corp. | 99,872 | |||||
| 500 | Yara International ASA - SP-ADR | 19,350 | |||||
| 5,959,502 | |||||||
| Commercial Banks — 0.6% | |||||||
| 2,400 | Banco Santander S.A. - SP-ADR | 19,296 | |||||
| 1,100 | Bank of Hawaii Corp. | 40,040 | |||||
| 1,089 | Bank of Montreal | 60,821 | |||||
| 6,000 | Bank of the Ozarks, Inc. | 125,580 | |||||
| 3,000 | Barclays PLC - SP-ADR | 29,340 | |||||
| 2,200 | BB&T Corp. | 46,926 | |||||
| 7,200 | East West Bancorp, Inc. | 107,352 | |||||
| 10,700 | Fifth Third Bancorp | 108,070 | |||||
| 3,000 | Hudson City Bancorp, Inc. | 16,980 | |||||
| 18,500 | Huntington Bancshares Inc. | 88,800 | |||||
The accompanying notes to financial statements are an integral part of this schedule.
10
Reynolds Blue Chip Growth Fund
SCHEDULE OF INVESTMENTS (Continued)
September 30, 2011
| Shares | Value | ||||||
| LONG-TERM INVESTMENTS — 98.2% (a) (Continued) | |||||||
| COMMON STOCKS — 97.5% (a) (Continued) | |||||||
| Commercial Banks — 0.6% (Continued) | |||||||
| 9,600 | KeyCorp | $ | 56,928 | ||||
| 24,300 | Regions Financial Corp. | 80,919 | |||||
| 5,600 | SunTrust Banks, Inc. | 100,520 | |||||
| 5,000 | Synovus Financial Corp. | 5,350 | |||||
| 1,100 | The Toronto-Dominion Bank | 78,045 | |||||
| 3,800 | U.S. Bancorp | 89,452 | |||||
| 5,900 | Wells Fargo & Co. | 142,308 | |||||
| 3,400 | Zions Bancorporation | 47,838 | |||||
| 1,244,565 | |||||||
| Commercial Services & Supplies — 0.9% | |||||||
| 7,600 | Copart, Inc.* | 297,312 | |||||
| 10,800 | A. T. Cross Company* | 121,824 | |||||
| 1,800 | R. R. Donnelley & Sons Company | 25,416 | |||||
| 6,200 | Iron Mountain Incorporated | 196,044 | |||||
| 4,600 | KAR Auction Services Inc.* | 55,706 | |||||
| 3,900 | Herman Miller, Inc. | 69,654 | |||||
| 1,700 | Pitney Bowes Inc. | 31,960 | |||||
| 2,300 | Progressive Waste Solutions Ltd. | 47,334 | |||||
| 13,400 | RINO International Corp.* | 2,412 | |||||
| 12,750 | Rollins, Inc. | 238,552 | |||||
| 25,600 | The Standard Register Co. | 64,768 | |||||
| 1,500 | Stericycle, Inc.* | 121,080 | |||||
| 11,400 | Waste Connections, Inc. | 385,548 | |||||
| 3,400 | Waste Management, Inc. | 110,704 | |||||
| 1,768,314 | |||||||
| Communications Equipment — 2.3% | |||||||
| 3,100 | Acme Packet, Inc.* | 132,029 | |||||
| 4,100 | ADTRAN, Inc. | 108,486 | |||||
| 6,600 | Alcatel-Lucent - SP-ADR* | 18,678 | |||||
| 13,900 | Aruba Networks Inc.* | 290,649 | |||||
| 14,700 | Brocade Communications | ||||||
| Systems, Inc.* | 63,504 | ||||||
| 22,400 | Ciena Corp.* | 250,880 | |||||
| 12,300 | Cisco Systems, Inc. | 190,527 | |||||
| 16,000 | L. M. Ericsson Telephone Co. | 152,800 | |||||
| 6,700 | F5 Networks, Inc.* | 476,035 | |||||
| 34,175 | Finisar Corp.* | 599,429 | |||||
| 1,000 | Harris Corp. | 34,170 | |||||
| 7,600 | Infinera Corporation* | 58,672 | |||||
| 4,500 | Ituran Location and Control Ltd. | 52,425 | |||||
| 43,700 | JDS Uniphase Corp.* | 435,689 | |||||
| 6,700 | Juniper Networks, Inc.* | 115,642 | |||||
| 1,820 | Loral Space & Communications Inc.* | 91,182 | |||||
| 2,200 | Motorola Solutions, Inc. | 92,180 | |||||
| 7,000 | NETGEAR, Inc.* | 181,230 | |||||
| 3,200 | Plantronics, Inc. | 91,040 | |||||
| 8,100 | Polycom, Inc.* | 148,797 | |||||
| 10,500 | QUALCOMM, Inc. | 510,615 | |||||
| 1,600 | Research In Motion Limited* | 32,480 | |||||
| 9,400 | Riverbed Technology, Inc.* | 187,624 | |||||
| 5,500 | Sierra Wireless Inc.* | 37,675 | |||||
| 5,100 | Tellabs, Inc. | 21,879 | |||||
| 3,800 | ViaSat, Inc.* | 126,578 | |||||
| 9,900 | Westell Technologies, Inc.* | 21,384 | |||||
| 4,522,279 | |||||||
| Computers & Peripherals — 5.6% | |||||||
| 22,750 | Apple Inc.* | 8,671,845 | |||||
| 9,200 | Dell Inc.* | 130,180 | |||||
| 7,600 | Electronics for Imaging, Inc.* | 102,372 | |||||
| 16,000 | EMC Corp.* | 335,840 | |||||
| 1,300 | Hewlett-Packard Co. | 29,185 | |||||
| 3,600 | International Business | ||||||
| Machines Corp. | 630,108 | ||||||
| 2,600 | Lexmark International, Inc.* | 70,278 | |||||
| 6,700 | NetApp, Inc.* | 227,398 | |||||
| 3,800 | QLogic Corp.* | 48,184 | |||||
| 10,300 | SanDisk Corp.* | 415,605 | |||||
| 11,900 | Seagate Technology PLC | 122,332 | |||||
| 4,800 | Silicon Graphics | ||||||
| International Corporation* | 57,216 | ||||||
| 2,100 | STEC Inc.* | 21,294 | |||||
| 2,900 | Teradata Corp.* | 155,237 | |||||
| 6,600 | Western Digital Corp.* | 169,752 | |||||
| 11,186,826 | |||||||
| Construction & Engineering — 0.4% | |||||||
| 5,800 | Chicago Bridge & Iron | ||||||
| Company N. V. NYS | 166,054 | ||||||
| 10,300 | Fluor Corp. | 479,465 | |||||
| 7,900 | Foster Wheeler AG* | 140,541 | |||||
The accompanying notes to financial statements are an integral part of this schedule.
11
Reynolds Blue Chip Growth Fund
SCHEDULE OF INVESTMENTS (Continued)
September 30, 2011
| Shares | Value | ||||||
| LONG-TERM INVESTMENTS — 98.2% (a) (Continued) | |||||||
| COMMON STOCKS — 97.5% (a) (Continued) | |||||||
| Construction & | |||||||
| Engineering — 0.4% (Continued) | |||||||
| 2,000 | Jacobs Engineering Group Inc.* | $ | 64,580 | ||||
| 1,400 | The Shaw Group Inc.* | 30,436 | |||||
| 881,076 | |||||||
| Construction Materials — 0.0% | |||||||
| 1,200 | Vulcan Materials Company | 33,072 | |||||
| Consumer Finance — 0.6% | |||||||
| 11,430 | American Express Co. | 513,207 | |||||
| 2,800 | Capital One Financial Corp. | 110,964 | |||||
| 23,900 | Discover Financial Services | 548,266 | |||||
| 1,172,437 | |||||||
| Consumer Services – Diversified — 0.2% | |||||||
| 7,700 | Coinstar, Inc.* | 308,000 | |||||
| 2,300 | H&R Block, Inc. | 30,613 | |||||
| 2,000 | New Oriental Education & | ||||||
| Technology Group, Inc. - SP-ADR* | 45,940 | ||||||
| 1,000 | Sotheby’s | 27,570 | |||||
| 412,123 | |||||||
| Containers & Packaging — 0.3% | |||||||
| 5,200 | Ball Corp. | 161,304 | |||||
| 30,700 | Boise, Inc. | 158,719 | |||||
| 7,500 | Crown Holdings, Inc.* | 229,575 | |||||
| 1,200 | Owens-Illinois, Inc.* | 18,144 | |||||
| 2,500 | Sealed Air Corp. | 41,750 | |||||
| 1,000 | Sonoco Products Company | 28,230 | |||||
| 637,722 | |||||||
| Distributors — 0.1% | |||||||
| 5,600 | Genuine Parts Co. | 284,480 | |||||
| Electric Utilities — 0.2% | |||||||
| 1,400 | Duke Energy Corporation | 27,986 | |||||
| 1,200 | El Paso Electric Company | 38,508 | |||||
| 2,000 | Exelon Corporation | 85,220 | |||||
| 1,000 | NextEra Energy, Inc. | 54,020 | |||||
| 1,600 | Progress Energy, Inc. | 82,752 | |||||
| 100 | Westar Energy, Inc. | 2,642 | |||||
| 291,128 | |||||||
| Electrical Equipment — 1.0% | |||||||
| 4,900 | The Babcock & Wilcox Co.* | 95,795 | |||||
| 3,800 | Cooper Industries PLC | 175,256 | |||||
| 4,200 | Emerson Electric Co. | 173,502 | |||||
| 1,500 | Harbin Electric, Inc.* | 30,975 | |||||
| 5,900 | Hubbell Incorporated, CL B | 292,286 | |||||
| 3,500 | Polypore International, Inc.* | 197,820 | |||||
| 4,700 | Rockwell Automation, Inc. | 263,200 | |||||
| 4,200 | Roper Industries, Inc. | 289,422 | |||||
| 7,000 | Sensata Technologies Holding N.V.* | 185,220 | |||||
| 2,400 | A. O. Smith Corp. | 76,872 | |||||
| 4,000 | Thomas & Betts Corp.* | 159,640 | |||||
| 1,939,988 | |||||||
| Electronic Equipment, Instruments | |||||||
| & Components — 1.1% | |||||||
| 7,900 | Agilent Technologies, Inc.* | 246,875 | |||||
| 1,700 | Arrow Electronics, Inc.* | 47,226 | |||||
| 3,400 | Coherent, Inc.* | 146,064 | |||||
| 3,900 | Corning Inc. | 48,204 | |||||
| 3,500 | Fabrinet* | 65,450 | |||||
| 8,200 | Flextronics International Ltd.* | 46,166 | |||||
| 3,900 | FLIR Systems, Inc. | 97,695 | |||||
| 4,400 | Hitachi, Ltd. | 217,448 | |||||
| 6,400 | Jabil Circuit, Inc. | 113,856 | |||||
| 10,900 | LeCroy Corporation* | 86,110 | |||||
| 1,400 | Littelfuse, Inc. | 56,294 | |||||
| 1,100 | Maxwell Technologies, Inc.* | 20,251 | |||||
| 4,000 | Molex Inc. | 81,480 | |||||
| 3,600 | OSI Systems, Inc.* | 120,672 | |||||
| 10,600 | Sanmina-SCI Corp.* | 70,808 | |||||
| 4,200 | TE Connectivity Limited | 118,188 | |||||
| 3,800 | Tech Data Corp.* | 164,274 | |||||
| 3,100 | Trimble Navigation Ltd.* | 104,005 | |||||
| 1,700 | Universal Display Corporation* | 81,498 | |||||
| 14,200 | Vishay Intertechnology, Inc.* | 118,712 | |||||
| 2,600 | Vishay Precision Group Inc.* | 34,268 | |||||
| 2,085,544 | |||||||
| Energy Equipment & Services — 2.7% | |||||||
| 4,700 | Atwood Oceanics, Inc.* | 161,492 | |||||
| 6,200 | Baker Hughes Inc. | 286,192 | |||||
| 8,700 | Cameron International Corp.* | 361,398 | |||||
| 11,100 | CGG-Veritas - SP-ADR* | 195,582 | |||||
The accompanying notes to financial statements are an integral part of this schedule.
12
Reynolds Blue Chip Growth Fund
SCHEDULE OF INVESTMENTS (Continued)
September 30, 2011
| Shares | Value | ||||||
| LONG-TERM INVESTMENTS — 98.2% (a) (Continued) | |||||||
| COMMON STOCKS — 97.5% (a) (Continued) | |||||||
| Energy Equipment & | |||||||
| Services — 2.7% (Continued) | |||||||
| 1,200 | Complete Production Services, Inc.* | $ | 22,620 | ||||
| 3,900 | Diamond Offshore Drilling, Inc. | 213,486 | |||||
| 4,000 | Dresser-Rand Group, Inc.* | 162,120 | |||||
| 1,300 | Dril-quip, Inc.* | 70,083 | |||||
| 1,000 | Ensco PLC - SP-ADR | 40,430 | |||||
| 4,800 | FMC Technologies, Inc.* | 180,480 | |||||
| 11,500 | Halliburton Co. | 350,980 | |||||
| 5,300 | Helmerich & Payne, Inc. | 215,180 | |||||
| 2,700 | Hercules Offshore, Inc.* | 7,884 | |||||
| 3,800 | Lufkin Industries, Inc. | 202,198 | |||||
| 10,000 | Nabors Industries Ltd.* | 122,600 | |||||
| 7,500 | National-Oilwell Varco Inc. | 384,150 | |||||
| 2,500 | Newpark Resources, Inc.* | 15,225 | |||||
| 54 | Ocean Rig UDW, Inc.* | 825 | |||||
| 1,800 | Oil States International, Inc.* | 91,656 | |||||
| 17,200 | Parker Drilling Co.* | 75,508 | |||||
| 12,100 | Patterson-UTI Energy, Inc. | 209,814 | |||||
| 3,100 | Pioneer Drilling Company* | 22,258 | |||||
| 12,400 | Precision Drilling Corporation* | 102,796 | |||||
| 10,000 | Rowan Companies, Inc.* | 301,900 | |||||
| 3,900 | RPC, Inc. | 63,648 | |||||
| 15,789 | Schlumberger Ltd. | 943,077 | |||||
| 5,700 | Tenaris S.A. - SP-ADR | 145,065 | |||||
| 7,100 | Transocean Ltd. | 338,954 | |||||
| 3,800 | Weatherford International Ltd.* | 46,398 | |||||
| 5,333,999 | |||||||
| Financial Services – Diversified — 0.5% | |||||||
| 9,200 | Bank of America Corp. | 56,304 | |||||
| 1,900 | Citigroup Inc. | 48,678 | |||||
| 400 | CME Group Inc. | 98,560 | |||||
| 3,200 | ING Groep N.V. - SP-ADR* | 22,560 | |||||
| 10,000 | JPMorgan Chase & Co. | 301,200 | |||||
| 7,200 | Leucadia National Corporation | 163,296 | |||||
| 3,000 | Moody’s Corporation | 91,350 | |||||
| 3,500 | The NASDAQ OMX Group, Inc.* | 80,990 | |||||
| 13,800 | NewStar Financial, Inc.* | 128,892 | |||||
| 1,400 | NYSE Euronext | 32,536 | |||||
| 1,024,366 | |||||||
| Food & Staples Retailing — 2.0% | |||||||
| 1,800 | Casey’s General Stores, Inc. | 78,570 | |||||
| 20,300 | Costco Wholesale Corp. | 1,667,036 | |||||
| 9,100 | CVS Caremark Corp. | 305,578 | |||||
| 13,800 | The Great Atlantic & | ||||||
| Pacific Tea Company, Inc.* | 2,415 | ||||||
| 8,800 | PriceSmart, Inc. | 548,416 | |||||
| 4,400 | Safeway Inc. | 73,172 | |||||
| 12,700 | SUPERVALU Inc. | 84,582 | |||||
| 6,100 | United Natural Foods, Inc.* | 225,944 | |||||
| 3,900 | Walgreen Co. | 128,271 | |||||
| 1,200 | Wal-Mart Stores, Inc. | 62,280 | |||||
| 12,000 | Whole Foods Market, Inc. | 783,720 | |||||
| 1,600 | Winn-Dixie Stores, Inc.* | 9,472 | |||||
| 3,969,456 | |||||||
| Food Products — 1.7% | |||||||
| 11,700 | B & G Foods Inc. | 195,156 | |||||
| 1,600 | Bunge Limited | 93,264 | |||||
| 1,000 | Campbell Soup Company | 32,370 | |||||
| 3,200 | Chiquita Brands International, Inc.* | 26,688 | |||||
| 4,700 | Dean Foods Company* | 41,689 | |||||
| 3,400 | Diamond Foods, Inc. | 271,286 | |||||
| 1,200 | General Mills, Inc. | 46,164 | |||||
| 3,800 | Green Mountain | ||||||
| Coffee Roasters, Inc.* | 353,172 | ||||||
| 11,000 | The Hain Celestial Group, Inc.* | 336,050 | |||||
| 6,900 | The Hershey Co. | 408,756 | |||||
| 2,500 | Hormel Foods Corporation | 67,550 | |||||
| 1,100 | Kellogg Co. | 58,509 | |||||
| 2,800 | Kraft Foods Inc. | 94,024 | |||||
| 4,000 | McCormick & Company, Inc. | 184,640 | |||||
| 3,700 | Mead Johnson Nutrition Company | 254,671 | |||||
| 1,200 | Ralcorp Holdings, Inc.* | 92,052 | |||||
| 4,600 | Sara Lee Corp. | 75,210 | |||||
| 5,800 | The J. M. Smucker Co. | 422,762 | |||||
| 1,700 | TreeHouse Foods, Inc.* | 105,128 | |||||
| 7,400 | Unilever PLC - SP-ADR | 230,806 | |||||
| 3,389,947 | |||||||
| Gas Utilities — 0.3% | |||||||
| 9,800 | ONEOK, Inc. | 647,192 | |||||
The accompanying notes to financial statements are an integral part of this schedule.
13
Reynolds Blue Chip Growth Fund
SCHEDULE OF INVESTMENTS (Continued)
September 30, 2011
| Shares | Value | ||||||
| LONG-TERM INVESTMENTS — 98.2% (a) (Continued) | |||||||
| COMMON STOCKS — 97.5% (a) (Continued) | |||||||
| Health Care Equipment & Supplies — 2.0% | |||||||
| 3,400 | C.R. Bard, Inc. | $ | 297,636 | ||||
| 8,300 | Baxter International Inc. | 465,962 | |||||
| 1,900 | Becton, Dickinson & Co. | 139,308 | |||||
| 2,900 | CareFusion Corporation* | 69,455 | |||||
| 3,100 | Cyberonics, Inc.* | 87,730 | |||||
| 1,200 | DENTSPLY International Inc. | 36,828 | |||||
| 3,400 | Edwards Lifesciences Corp.* | 242,352 | |||||
| 4,200 | Endologix, Inc.* | 42,168 | |||||
| 820 | Gen-Probe Incorporated* | 46,945 | |||||
| 4,900 | Haemonetics Corporation* | 286,552 | |||||
| 6,200 | Hologic, Inc.* | 94,302 | |||||
| 3,800 | IDEXX Laboratories, Inc.* | 262,086 | |||||
| 300 | Intuitive Surgical, Inc.* | 109,284 | |||||
| 700 | MAKO Surgical Corp.* | 23,954 | |||||
| 5,700 | Medtronic, Inc. | 189,468 | |||||
| 1,600 | ResMed Inc.* | 46,064 | |||||
| 3,200 | Sirona Dental Systems, Inc.* | 135,712 | |||||
| 7,800 | St. Jude Medical, Inc. | 282,282 | |||||
| 4,300 | Stryker Corp. | 202,659 | |||||
| 7,400 | Varian Medical Systems, Inc.* | 385,984 | |||||
| 2,100 | Zimmer Holdings, Inc.* | 112,350 | |||||
| 10,000 | Zoll Medical Corporation* | 377,400 | |||||
| 3,936,481 | |||||||
| Health Care Providers & Services — 3.0% | |||||||
| 5,100 | Aetna Inc. | 185,385 | |||||
| 2,700 | AMERIGROUP Corporation* | 105,327 | |||||
| 6,300 | AmerisourceBergen Corp. | 234,801 | |||||
| 3,800 | Cardinal Health, Inc. | 159,144 | |||||
| 800 | Catalyst Health Solutions, Inc.* | 46,152 | |||||
| 2,400 | Centene Corporation* | 68,808 | |||||
| 9,100 | CIGNA Corp. | 381,654 | |||||
| 1,500 | Community Health Systems Inc.* | 24,960 | |||||
| 1,400 | CorVel Corporation* | 59,500 | |||||
| 11,700 | Coventry Health Care, Inc.* | 337,077 | |||||
| 2,600 | The Ensign Group, Inc. | 60,086 | |||||
| 2,000 | Express Scripts, Inc.* | 74,140 | |||||
| 9,700 | Fresenius Medical Care | ||||||
| AG & Co. KGaA - SP-ADR | 655,041 | ||||||
| 16,400 | Health Management Associates, Inc.* | 113,488 | |||||
| 3,900 | Health Net Inc.* | 92,469 | |||||
| 3,500 | HEALTHSOUTH Corp.* | 52,255 | |||||
| 5,400 | Healthspring, Inc.* | 196,884 | |||||
| 9,400 | Humana Inc. | 683,662 | |||||
| 1,100 | Laboratory Corporation | ||||||
| of America Holdings* | 86,955 | ||||||
| 1,600 | Lincare Holdings Inc. | 36,000 | |||||
| 1,600 | Magellan Health Services, Inc.* | 77,280 | |||||
| 4,200 | McKesson Corp. | 305,340 | |||||
| 1,700 | Medco Health Solutions, Inc.* | 79,713 | |||||
| 11,800 | Molina Healthcare Inc.* | 182,192 | |||||
| 2,900 | Owens & Minor, Inc. | 82,592 | |||||
| 5,800 | Patterson Companies Inc. | 166,054 | |||||
| 4,400 | PSS World Medical, Inc.* | 86,636 | |||||
| 2,200 | Quest Diagnostics Inc. | 108,592 | |||||
| 5,100 | Henry Schein, Inc.* | 316,251 | |||||
| 17,500 | Tenet Healthcare Corp.* | 72,275 | |||||
| 5,200 | UnitedHealth Group Inc. | 239,824 | |||||
| 2,200 | Universal Health Services, Inc. | 74,800 | |||||
| 8,500 | WellCare Health Plans Inc.* | 322,830 | |||||
| 4,200 | WellPoint Inc. | 274,176 | |||||
| 6,042,343 | |||||||
| Health Care Technology — 0.7% | |||||||
| 2,000 | Allscripts Healthcare Solutions, Inc.* | 36,040 | |||||
| 1,300 | athenahealth Inc.* | 77,415 | |||||
| 8,800 | Cerner Corp.* | 602,976 | |||||
| 1,600 | Omnicell, Inc.* | 22,048 | |||||
| 5,700 | Quality Systems, Inc. | 552,900 | |||||
| 1,291,379 | |||||||
| Home Building — 0.1% | |||||||
| 3,400 | KB Home | 19,924 | |||||
| 4,000 | Lennar Corp. | 54,160 | |||||
| 9,500 | Pulte Group Inc.* | 37,525 | |||||
| 8,100 | The Ryland Group, Inc. | 86,265 | |||||
| 5,100 | Toll Brothers, Inc.* | 73,593 | |||||
| 271,467 | |||||||
| Hotels, Restaurants & Leisure — 5.3% | |||||||
| 900 | 7 Days Group Holdings | ||||||
| Ltd. - SP-ADR* | 11,394 | ||||||
| 7,200 | Arcos Dorados Holdings, Inc. | 166,968 | |||||
The accompanying notes to financial statements are an integral part of this schedule.
14
Reynolds Blue Chip Growth Fund
SCHEDULE OF INVESTMENTS (Continued)
September 30, 2011
| Shares | Value | ||||||
| LONG-TERM INVESTMENTS — 98.2% (a) (Continued) | |||||||
| COMMON STOCKS — 97.5% (a) (Continued) | |||||||
| Hotels, Restaurants & | |||||||
| Leisure — 5.3% (Continued) | |||||||
| 1,000 | Bob Evans Farms, Inc. | $ | 28,520 | ||||
| 19,900 | Boyd Gaming Corp.* | 97,510 | |||||
| 6,100 | Brinker International, Inc. | 127,612 | |||||
| 2,300 | Buffalo Wild Wings Inc.* | 137,540 | |||||
| 17,200 | Caribou Coffee Company, Inc.* | 203,304 | |||||
| 4,200 | Carnival Corp. | 127,260 | |||||
| 7,000 | The Cheesecake Factory Inc.* | 172,550 | |||||
| 2,000 | Chipotle Mexican Grill, Inc.* | 605,900 | |||||
| 9,200 | Ctrip.com International, | ||||||
| Ltd. - SP-ADR* | 295,872 | ||||||
| 6,800 | Darden Restaurants, Inc. | 290,700 | |||||
| 2,900 | DineEquity, Inc.* | 111,621 | |||||
| 23,700 | Domino’s Pizza, Inc.* | 645,825 | |||||
| 4,700 | Home Inns & Hotels | ||||||
| Management, Inc. - SP-ADR* | 121,119 | ||||||
| 5,500 | Hyatt Hotels Corp.* | 172,535 | |||||
| 2,000 | InterContinental Hotels | ||||||
| Group PLC - SP-ADR | 32,160 | ||||||
| 4,700 | International Game Technology | 68,291 | |||||
| 57,630 | Jamba, Inc.* | 74,343 | |||||
| 25,250 | Krispy Kreme Doughnuts, Inc.* | 172,205 | |||||
| 24,300 | Las Vegas Sands Corp.* | 931,662 | |||||
| 1,200 | LIFE TIME FITNESS, Inc.* | 44,220 | |||||
| 6,700 | Marriott International Inc. | 182,508 | |||||
| 9,300 | McDonald’s Corp. | 816,726 | |||||
| 3,600 | Melco Crown Entertainment | ||||||
| Ltd. - SP-ADR* | 29,916 | ||||||
| 31,000 | MGM Resorts International* | 287,990 | |||||
| 6,500 | P.F. Chang’s China Bistro, Inc. | 177,060 | |||||
| 4,000 | Panera Bread Co.* | 415,760 | |||||
| 9,200 | Papa John’s International, Inc.* | 279,680 | |||||
| 8,800 | Peet’s Coffee & Tea Inc.* | 489,632 | |||||
| 4,100 | Royal Caribbean Cruises Ltd.* | 88,724 | |||||
| 34,690 | Ruth’s Hospitality Group Inc.* | 148,820 | |||||
| 13,000 | Starbucks Corp. | 484,770 | |||||
| 6,400 | Starwood Hotels & | ||||||
| Resorts Worldwide, Inc. | 248,448 | ||||||
| 12,100 | Tim Hortons, Inc. | 559,988 | |||||
| 2,900 | The Wendy’s Company | 13,311 | |||||
| 8,900 | Wyndham Worldwide Corp. | 253,739 | |||||
| 6,450 | Wynn Resorts Ltd. | 742,266 | |||||
| 11,900 | Yum! Brands, Inc. | 587,741 | |||||
| 10,446,190 | |||||||
| Household Durables — 1.2% | |||||||
| 1,800 | Ethan Allen Interiors Inc. | 24,498 | |||||
| 800 | Fortune Brands, Inc. | 43,264 | |||||
| 2,300 | Garmin Ltd. | 73,071 | |||||
| 3,200 | Harman International Industries, Inc. | 91,456 | |||||
| 5,300 | iRobot Corporation* | 133,348 | |||||
| 14,500 | La-Z-Boy Inc.* | 107,445 | |||||
| 1,200 | Leggett & Platt, Incorporated | 23,748 | |||||
| 1,600 | M.D.C. Holdings, Inc. | 27,104 | |||||
| 9,700 | Newell Rubbermaid Inc. | 115,139 | |||||
| 1,800 | Panasonic Corporation | 17,136 | |||||
| 10,400 | SodaStream International Ltd.* | 343,720 | |||||
| 3,700 | Sony Corp. - SP-ADR | 70,300 | |||||
| 4,330 | Stanley Black & Decker Inc. | 212,603 | |||||
| 14,100 | Tempur-Pedic International Inc.* | 741,801 | |||||
| 7,100 | Tupperware Brands Corp. | 381,554 | |||||
| 2,406,187 | |||||||
| Household Products — 0.7% | |||||||
| 5,200 | Church & Dwight Co., Inc. | 229,840 | |||||
| 2,600 | The Clorox Co. | 172,458 | |||||
| 1,600 | Colgate-Palmolive Co. | 141,888 | |||||
| 2,600 | Energizer Holdings, Inc.* | 172,744 | |||||
| 4,100 | Kimberly-Clark Corp. | 291,141 | |||||
| 4,900 | The Procter & Gamble Co. | 309,582 | |||||
| 2,900 | WD-40 Co. | 115,536 | |||||
| 1,433,189 | |||||||
| Independent Power Producers | |||||||
| & Energy Traders — 0.1% | |||||||
| 4,700 | Constellation Energy Group Inc. | 178,882 | |||||
| Industrial Conglomerates — 0.5% | |||||||
| 4,700 | 3M Co. | 337,413 | |||||
| 16,100 | General Electric Co. | 245,364 | |||||
| 1,038 | Koninklijke Philips | ||||||
| Electronics N.V. NYS | 18,622 | ||||||
The accompanying notes to financial statements are an integral part of this schedule.
15
Reynolds Blue Chip Growth Fund
SCHEDULE OF INVESTMENTS (Continued)
September 30, 2011
| Shares | Value | ||||||
| LONG-TERM INVESTMENTS — 98.2% (a) (Continued) | |||||||
| COMMON STOCKS — 97.5% (a) (Continued) | |||||||
| Industrial | |||||||
| Conglomerates — 0.5% (Continued) | |||||||
| 11,700 | McDermott International, Inc.* | $ | 125,892 | ||||
| 700 | Siemens AG - SP-ADR | 62,853 | |||||
| 10,400 | Textron Inc. | 183,456 | |||||
| 973,600 | |||||||
| Insurance — 0.8% | |||||||
| 1,200 | Aflac, Inc. | 41,940 | |||||
| 700 | The Allstate Corporation | 16,583 | |||||
| 25,000 | Ambac Financial Group, Inc.* | 1,600 | |||||
| 1,600 | Berkshire Hathaway Inc. Cl B* | 113,664 | |||||
| 1,700 | Brown & Brown, Inc. | 30,260 | |||||
| 2,700 | China Life Insurance | ||||||
| Company, Ltd. - SP-ADR | 95,877 | ||||||
| 1,900 | The Chubb Corporation | 113,981 | |||||
| 8,900 | Genworth Financial Inc.* | 51,086 | |||||
| 1,400 | The Hartford Financial | ||||||
| Services Group, Inc. | 22,596 | ||||||
| 5,000 | Marsh & McLennan Companies, Inc. | 132,700 | |||||
| 19,900 | MBIA Inc.* | 144,673 | |||||
| 1,400 | MetLife, Inc. | 39,214 | |||||
| 5,700 | Prudential Financial, Inc. | 267,102 | |||||
| 7,950 | Torchmark Corp. | 277,137 | |||||
| 4,100 | The Travelers Companies, Inc. | 199,793 | |||||
| 1,548,206 | |||||||
| Internet & Catalog Retail — 1.4% | |||||||
| 6,100 | Amazon.com, Inc.* | 1,319,003 | |||||
| 1,200 | Blue Nile, Inc.* | 42,336 | |||||
| 10,300 | Expedia, Inc. | 265,225 | |||||
| 4,100 | Netflix Inc.* | 463,956 | |||||
| 1,300 | Priceline.com Inc.* | 584,298 | |||||
| 3,000 | Shutterfly, Inc.* | 123,540 | |||||
| 2,798,358 | |||||||
| Internet Software & Services — 3.4% | |||||||
| 3,600 | Akamai Technologies, Inc.* | 71,568 | |||||
| 3,700 | Ancestry.com, Inc.* | 86,950 | |||||
| 18,000 | Baidu, Inc. - SP-ADR* | 1,924,380 | |||||
| 1,400 | Digital River, Inc.* | 29,022 | |||||
| 15,500 | eBay Inc.* | 457,095 | |||||
| 1,200 | Google Inc.* | 617,256 | |||||
| 8,000 | IAC/InterActiveCorp* | 316,400 | |||||
| 14,300 | Internet Initiative | ||||||
| Japan Inc. - SP-ADR | 163,163 | ||||||
| 1,200 | LinkedIn Corporation* | 93,696 | |||||
| 1,400 | Liquidity Services Inc.* | 44,898 | |||||
| 1,400 | LogMeIn, Inc.* | 46,494 | |||||
| 3,000 | MercadoLibre Inc. | 161,250 | |||||
| 7,100 | Monster Worldwide, Inc.* | 50,978 | |||||
| 5,200 | NetEase.com Inc. - SP-ADR* | 198,432 | |||||
| 1,000 | Open Text Corporation* | 52,120 | |||||
| 4,800 | OpenTable, Inc.* | 220,848 | |||||
| 6,200 | Rackspace Hosting, Inc.* | 211,668 | |||||
| 8,900 | Rediff.com India Limited - SP-ADR* | 58,473 | |||||
| 2,000 | Renren, Inc.* | 10,200 | |||||
| 9,500 | SINA Corp.* | 680,295 | |||||
| 7,100 | Sohu.com Inc.* | 342,220 | |||||
| 7,200 | Travelzoo Inc.* | 158,328 | |||||
| 20,100 | ValueClick, Inc.* | 312,756 | |||||
| 4,000 | VeriSign, Inc. | 114,440 | |||||
| 4,800 | VistaPrint N.V.* | 129,744 | |||||
| 1,000 | WebMD Health Corp.* | 30,150 | |||||
| 6,900 | Yahoo! Inc.* | 90,804 | |||||
| 3,400 | Youku.com Inc.* | 55,624 | |||||
| 2,800 | Zillow, Inc.* | 76,580 | |||||
| 6,805,832 | |||||||
| IT Services — 2.1% | |||||||
| 2,600 | Accenture PLC | 136,968 | |||||
| 800 | Alliance Data Systems Corporation* | 74,160 | |||||
| 4,100 | Automatic Data Processing, Inc. | 193,315 | |||||
| 2,800 | CACI International Inc.* | 139,832 | |||||
| 4,400 | CIBER, Inc.* | 13,332 | |||||
| 8,900 | Cognizant Technology | ||||||
| Solutions Corp.* | 558,030 | ||||||
| 1,400 | Computer Sciences Corporation | 37,590 | |||||
| 4,900 | DST Systems, Inc. | 214,767 | |||||
| 1,400 | Fidelity National | ||||||
| Information Services, Inc. | 34,048 | ||||||
| 2,300 | Fiserv, Inc.* | 116,771 | |||||
| 9,200 | Gartner, Inc.* | 320,804 | |||||
| 1,200 | Genpact Limited* | 17,268 | |||||
The accompanying notes to financial statements are an integral part of this schedule.
16
Reynolds Blue Chip Growth Fund
SCHEDULE OF INVESTMENTS (Continued)
September 30, 2011
| Shares | Value | ||||||
| LONG-TERM INVESTMENTS — 98.2% (a) (Continued) | |||||||
| COMMON STOCKS — 97.5% (a) (Continued) | |||||||
| IT Services — 2.1% (Continued) | |||||||
| 3,100 | The Hackett Group, Inc.* | $ | 11,563 | ||||
| 6,800 | Infosys Ltd. - SP-ADR | 347,276 | |||||
| 1,000 | Mastercard, Inc. | 317,160 | |||||
| 2,400 | MAXIMUS, Inc. | 83,760 | |||||
| 3,600 | Paychex, Inc. | 94,932 | |||||
| 15,800 | Sapient Corp. | 160,212 | |||||
| 10,300 | Satyam Computer | ||||||
| Services Ltd. - SP-ADR* | 28,119 | ||||||
| 22,300 | VeriFone Systems, Inc.* | 780,946 | |||||
| 6,200 | Visa Inc. | 531,464 | |||||
| 4,212,317 | |||||||
| Leisure Equipment & Products — 0.3% | |||||||
| 40,900 | Eastman Kodak Co.* | 31,906 | |||||
| 11,900 | Mattel, Inc. | 308,091 | |||||
| 10,500 | Sturm, Ruger & Company, Inc. | 272,790 | |||||
| 612,787 | |||||||
| Life Sciences Tools & Services — 0.7% | |||||||
| 17,400 | Affymetrix, Inc.* | 85,260 | |||||
| 10,600 | Bruker Corp.* | 143,418 | |||||
| 2,400 | Complete Genomics Inc.* | 14,088 | |||||
| 5,300 | Illumina, Inc.* | 216,876 | |||||
| 1,500 | Life Technologies Corporation* | 57,645 | |||||
| 1,000 | Mettler-Toledo International Inc.* | 139,960 | |||||
| 9,300 | Parexel International Corp.* | 176,049 | |||||
| 1,400 | PerkinElmer, Inc. | 26,894 | |||||
| 6,900 | Sequenom Inc.* | 35,121 | |||||
| 1,800 | Thermo Fisher Scientific, Inc.* | 91,152 | |||||
| 4,400 | Waters Corp.* | 332,156 | |||||
| 1,318,619 | |||||||
| Machinery — 4.0% | |||||||
| 3,700 | AGCO Corporation* | 127,909 | |||||
| 3,900 | Alamo Group Inc. | 81,081 | |||||
| 1,400 | Barnes Group Inc. | 26,950 | |||||
| 21,000 | Caterpillar Inc. | 1,550,640 | |||||
| 1,400 | CNH Global N.V.* | 36,736 | |||||
| 4,300 | Crane Co. | 153,467 | |||||
| 5,300 | Cummins Inc. | 432,798 | |||||
| 2,000 | Danaher Corp. | 83,880 | |||||
| 16,600 | Deere & Co. | 1,071,862 | |||||
| 4,400 | Donaldson Company, Inc. | 241,120 | |||||
| 2,700 | Dover Corporation | 125,820 | |||||
| 4,600 | Eaton Corp. | 163,300 | |||||
| 900 | FreightCar America Inc.* | 12,969 | |||||
| 5,900 | Gardner Denver Inc. | 374,945 | |||||
| 4,700 | IDEX Corporation | 146,452 | |||||
| 6,500 | Illinois Tool Works Inc. | 270,400 | |||||
| 9,500 | Ingersoll-Rand PLC | 266,855 | |||||
| 12,400 | Joy Global Inc. | 773,512 | |||||
| 4,000 | Kennametal Inc. | 130,960 | |||||
| 3,600 | Navistar International Corp.* | 115,632 | |||||
| 2,100 | Nordson Corporation | 83,454 | |||||
| 1,700 | Oshkosh Corporation* | 26,758 | |||||
| 1,800 | PACCAR Inc. | 60,876 | |||||
| 7,300 | Pall Corp. | 309,520 | |||||
| 6,200 | Parker Hannifin Corp. | 391,406 | |||||
| 2,000 | Pentair, Inc. | 64,020 | |||||
| 3,700 | Robbins & Myers, Inc. | 128,427 | |||||
| 1,000 | Sauer-Danfoss, Inc.* | 28,900 | |||||
| 5,900 | Snap-On, Inc. | 261,960 | |||||
| 7,100 | Terex Corp.* | 72,846 | |||||
| 4,900 | The Timken Company | 160,818 | |||||
| 4,600 | Titan International, Inc. | 69,000 | |||||
| 1,500 | Valmont Industries, Inc. | 116,910 | |||||
| 1,000 | Wabtec Corporation | 52,870 | |||||
| 8,015,053 | |||||||
| Media — 2.7% | |||||||
| 11,700 | Belo Corp. | 57,213 | |||||
| 19,700 | CBS Corp. Cl B Non-Voting | 401,486 | |||||
| 12,000 | Comcast Corp. | 250,800 | |||||
| 10,500 | DIRECTV* | 443,625 | |||||
| 2,600 | Discovery Communications, Inc.* | 97,812 | |||||
| 3,500 | DISH Network Corp.* | 87,710 | |||||
| 13,300 | The Walt Disney Co. | 401,128 | |||||
| 10,900 | Entercom Communications Corp.* | 57,225 | |||||
| 13,200 | Focus Media Holding Limited - ADR* | 221,628 | |||||
| 6,600 | Gannett Co., Inc. | 62,898 | |||||
| 3,000 | Grupo Televisa S.A. - SP-ADR | 55,170 | |||||
| 11,300 | IMAX Corp.* | 163,624 | |||||
| 10,400 | The Interpublic Group | ||||||
| of Companies, Inc. | 74,880 | ||||||
The accompanying notes to financial statements are an integral part of this schedule.
17
Reynolds Blue Chip Growth Fund
SCHEDULE OF INVESTMENTS (Continued)
September 30, 2011
| Shares | Value | ||||||
| LONG-TERM INVESTMENTS — 98.2% (a) (Continued) | |||||||
| COMMON STOCKS — 97.5% (a) (Continued) | |||||||
| Media — 2.7% (Continued) | |||||||
| 8,500 | Liberty Media Corporation* | $ | 562,020 | ||||
| 7,300 | Live Nation Entertainment, Inc.* | 58,473 | |||||
| 5,600 | The McGraw-Hill Companies, Inc. | 229,600 | |||||
| 7,500 | Morningstar, Inc. | 423,300 | |||||
| 22,300 | The New York Times Co.* | 129,563 | |||||
| 10,000 | News Corp. Cl B | 155,900 | |||||
| 2,900 | Omnicom Group Inc. | 106,836 | |||||
| 1,600 | Pandora Media Inc.* | 23,440 | |||||
| 189,100 | Sirius XM Radio Inc.* | 285,541 | |||||
| 6,000 | Time Warner Cable Inc. | 376,020 | |||||
| 3,500 | Time Warner Inc. | 104,895 | |||||
| 11,600 | Viacom, Inc. Cl B | 449,384 | |||||
| 6,800 | Virgin Media Inc. | 165,580 | |||||
| 5,445,751 | |||||||
| Metals & Mining — 3.7% | |||||||
| 1,100 | Agnico-Eagle Mines Ltd. | 65,472 | |||||
| 9,900 | Alcoa Inc. | 94,743 | |||||
| 3,300 | Allegheny Technologies, Inc. | 122,067 | |||||
| 1,500 | AngloGold Ashanti Ltd. - SP-ADR | 62,040 | |||||
| 5,700 | ArcelorMittal NYS | 90,687 | |||||
| 13,100 | AuRico Gold Inc.* | 123,140 | |||||
| 5,600 | Avalon Rare Metals, Inc.* | 15,064 | |||||
| 7,600 | Barrick Gold Corp. | 354,540 | |||||
| 4,500 | BHP Billiton Ltd. - SP-ADR | 298,980 | |||||
| 23,200 | China Precision Steel, Inc.* | 12,066 | |||||
| 5,100 | Cliffs Natural Resources Inc. | 260,967 | |||||
| 10,200 | Coeur d’ Alene Mines Corp.* | 218,688 | |||||
| 1,700 | Compass Minerals International, Inc. | 113,526 | |||||
| 8,100 | Eldorado Gold Corp. | 138,834 | |||||
| 18,300 | Freeport-McMoRan | ||||||
| Copper & Gold Inc. | 557,235 | ||||||
| 9,800 | Gold Fields Ltd. - SP-ADR | 150,136 | |||||
| 5,620 | Goldcorp, Inc. | 256,497 | |||||
| 24,900 | Golden Star Resources Ltd.* | 46,314 | |||||
| 14,900 | Harmony Gold Mining | ||||||
| Company Ltd. - SP-ADR | 174,777 | ||||||
| 17,700 | Hecla Mining Co.* | 94,872 | |||||
| 9,000 | IAMGOLD Corp. | 178,020 | |||||
| 3,630 | Ivanhoe Mines Ltd.* | 49,731 | |||||
| 9,200 | Kinross Gold Corp. | 135,976 | |||||
| 5,800 | Molycorp, Inc.* | 190,646 | |||||
| 13,900 | New Gold Inc.* | 142,475 | |||||
| 4,400 | Newmont Mining Corp. | 276,760 | |||||
| 41,300 | Northgate Minerals Corp.* | 136,290 | |||||
| 23,300 | NovaGold Resources Inc.* | 150,285 | |||||
| 4,100 | Nucor Corp. | 129,724 | |||||
| 8,400 | Pan American Silver Corp. | 224,868 | |||||
| 11,500 | Paramount Gold and | ||||||
| Silver Corporation* | 27,140 | ||||||
| 1,175 | Pilot Gold Inc.* | 1,346 | |||||
| 700 | Randgold Resources Ltd. | 67,704 | |||||
| 9,000 | Rare Element Resources Ltd.* | 45,720 | |||||
| 5,300 | Rio Tinto PLC - SP-ADR | 233,624 | |||||
| 8,600 | RTI International Metals, Inc.* | 200,552 | |||||
| 10,900 | Silver Standard Resources Inc.* | 200,015 | |||||
| 13,100 | Silver Wheaton Corp. | 385,795 | |||||
| 3,000 | Silvercorp Metals Inc. | 23,730 | |||||
| 8,500 | Southern Copper Corp. | 212,415 | |||||
| 2,500 | Steel Dynamics, Inc. | 24,800 | |||||
| 17,500 | Taseko Mines Ltd.* | 44,625 | |||||
| 2,800 | Teck Resources Ltd. Cl B | 81,732 | |||||
| 1,200 | Ternium S.A. - SP-ADR | 24,996 | |||||
| 7,600 | Titanium Metals Corp. | 113,848 | |||||
| 8,800 | United States Steel Corp. | 193,688 | |||||
| 11,500 | Vale S.A. - SP-ADR | 262,200 | |||||
| 3,100 | Walter Energy, Inc. | 186,031 | |||||
| 17,400 | Yamana Gold Inc. | 237,684 | |||||
| 7,433,065 | |||||||
| Multiline Retail — 1.9% | |||||||
| 4,400 | Big Lots, Inc.* | 153,252 | |||||
| 14,500 | Dillard’s, Inc. | 630,460 | |||||
| 6,700 | Dollar General Corp.* | 252,992 | |||||
| 10,900 | Dollar Tree, Inc.* | 818,699 | |||||
| 6,700 | Family Dollar Stores, Inc. | 340,762 | |||||
| 2,900 | Kohl’s Corp. | 142,390 | |||||
| 12,400 | Macy’s, Inc. | 326,368 | |||||
| 16,300 | Nordstrom, Inc. | 744,584 | |||||
| 2,500 | J. C. Penney Company, Inc. | 66,950 | |||||
| 27,500 | Saks, Inc.* | 240,625 | |||||
| 2,900 | Target Corp. | 142,216 | |||||
The accompanying notes to financial statements are an integral part of this schedule.
18
Reynolds Blue Chip Growth Fund
SCHEDULE OF INVESTMENTS (Continued)
September 30, 2011
| Shares | Value | ||||||
| LONG-TERM INVESTMENTS — 98.2% (a) (Continued) | |||||||
| COMMON STOCKS — 97.5% (a) (Continued) | |||||||
| Multiline Retail — 1.9% (Continued) | |||||||
| 3,900 | Tuesday Morning Corp.* | $ | 13,728 | ||||
| 3,873,026 | |||||||
| Multi-Utilities — 0.2% | |||||||
| 3,200 | CMS Energy Corporation | 63,328 | |||||
| 1,000 | Consolidated Edison, Inc. | 57,020 | |||||
| 1,000 | Dominion Resources, Inc. | 50,770 | |||||
| 11,400 | NiSource Inc. | 243,732 | |||||
| 300 | Wisconsin Energy Corporation | 9,387 | |||||
| 424,237 | |||||||
| Office Electronics — 0.0% | |||||||
| 2,600 | Zebra Technologies Corporation* | 80,444 | |||||
| Oil, Gas & Consumable Fuels — 4.7% | |||||||
| 8,700 | Alpha Natural Resources, Inc.* | 153,903 | |||||
| 4,300 | Anadarko Petroleum Corp. | 271,115 | |||||
| 2,700 | Apache Corp. | 216,648 | |||||
| 1,500 | Arch Coal, Inc. | 21,870 | |||||
| 26,300 | Brigham Exploration Co.* | 664,338 | |||||
| 10,000 | Cabot Oil & Gas Corp. | 619,100 | |||||
| 8,000 | Canadian Natural Resources Ltd. | 234,160 | |||||
| 2,600 | Carrizo Oil & Gas, Inc.* | 56,030 | |||||
| 4,100 | Cenovus Energy Inc. | 125,911 | |||||
| 2,400 | Chesapeake Energy Corp. | 61,320 | |||||
| 4,100 | Chevron Corp. | 379,332 | |||||
| 1,200 | Cimarex Energy Co. | 66,840 | |||||
| 400 | CNOOC Ltd. | 64,120 | |||||
| 4,000 | Concho Resources Inc.* | 284,560 | |||||
| 5,100 | ConocoPhillips | 322,932 | |||||
| 2,600 | Continental Resources, Inc.* | 125,762 | |||||
| 2,200 | Devon Energy Corp. | 121,968 | |||||
| 15,200 | El Paso Corp. | 265,696 | |||||
| 9,800 | Enbridge Inc. | 312,914 | |||||
| 3,500 | EnCana Corp. | 67,235 | |||||
| 2,100 | EOG Resources, Inc. | 149,121 | |||||
| 1,800 | EQT Corporation | 96,048 | |||||
| 2,525 | Exxon Mobil Corp. | 183,391 | |||||
| 6,900 | GeoResources, Inc.* | 122,751 | |||||
| 1,400 | Gulfport Energy Corporation* | 33,852 | |||||
| 3,000 | Hess Corp. | 157,380 | |||||
| 18,698 | HollyFrontier Corporation | 490,262 | |||||
| 25,500 | Ivanhoe Energy, Inc.* | 27,285 | |||||
| 22,100 | Kodiak Oil & Gas Corp.* | 115,141 | |||||
| 4,100 | Marathon Oil Corp. | 88,478 | |||||
| 3,050 | Marathon Petroleum Corporation | 82,533 | |||||
| 2,400 | McMoRan Exploration Co.* | 23,832 | |||||
| 1,800 | Murphy Oil Corp. | 79,488 | |||||
| 1,900 | Newfield Exploration Co.* | 75,411 | |||||
| 3,500 | Noble Energy, Inc. | 247,800 | |||||
| 1,500 | Oasis Petroleum Inc.* | 33,495 | |||||
| 4,400 | Occidental Petroleum Corp. | 314,600 | |||||
| 10,300 | Patriot Coal Corp.* | 87,138 | |||||
| 9,400 | Peabody Energy Corp. | 318,472 | |||||
| 600 | PetroChina Company Ltd. | 72,294 | |||||
| 2,400 | Petroleo Brasileiro S.A. - SP-ADR | 53,880 | |||||
| 2,600 | Pioneer Natural Resources Co. | 171,002 | |||||
| 1,800 | Plains Exploration & | ||||||
| Production Company* | 40,878 | ||||||
| 1,400 | Range Resources Corp. | 81,844 | |||||
| 1,000 | Royal Dutch Shell PLC - SP-ADR | 61,520 | |||||
| 24,200 | SandRidge Energy Inc.* | 134,552 | |||||
| 2,600 | Southwestern Energy Co.* | 86,658 | |||||
| 4,000 | Stone Energy Corporation* | 64,840 | |||||
| 3,600 | Suncor Energy, Inc. | 91,584 | |||||
| 3,500 | Sunoco, Inc. | 108,535 | |||||
| 12,300 | Tesoro Corp.* | 239,481 | |||||
| 15,300 | TransGlobe Energy Corp.* | 122,706 | |||||
| 13,030 | Valero Energy Corp. | 231,673 | |||||
| 4,400 | Western Refining, Inc.* | 54,824 | |||||
| 10,500 | Whiting Petroleum Corp.* | 368,340 | |||||
| 1,900 | Clayton Williams Energy, Inc.* | 81,339 | |||||
| 5,700 | The Williams Companies, Inc. | 138,738 | |||||
| 9,366,920 | |||||||
| Paper & Forest Products — 0.3% | |||||||
| 6,800 | P.H. Glatfelter Co. | 89,828 | |||||
| 12,800 | International Paper Co. | 297,600 | |||||
| 15,300 | Louisiana-Pacific Corp.* | 78,030 | |||||
| 7,600 | MeadWestvaco Corporation | 186,656 | |||||
| 652,114 | |||||||
The accompanying notes to financial statements are an integral part of this schedule.
19
Reynolds Blue Chip Growth Fund
SCHEDULE OF INVESTMENTS (Continued)
September 30, 2011
| Shares | Value | ||||||
| LONG-TERM INVESTMENTS — 98.2% (a) (Continued) | |||||||
| COMMON STOCKS — 97.5% (a) (Continued) | |||||||
| Personal Products — 1.0% | |||||||
| 12,800 | Elizabeth Arden, Inc.* | $ | 364,032 | ||||
| 17,100 | Herbalife Ltd. | 916,560 | |||||
| 3,600 | The Estee Lauder Companies Inc. | 316,224 | |||||
| 3,000 | Medifast, Inc.* | 48,450 | |||||
| 900 | Nu Skin Enterprises, Inc. | 36,468 | |||||
| 6,900 | Revlon, Inc.* | 85,008 | |||||
| 4,600 | Weight Watchers International, Inc. | 267,950 | |||||
| 2,034,692 | |||||||
| Pharmaceuticals — 3.2% | |||||||
| 1,800 | Abbott Laboratories | 92,052 | |||||
| 3,600 | Allergan, Inc. | 296,568 | |||||
| 1,800 | AstraZeneca PLC - SP-ADR | 79,848 | |||||
| 1,000 | Bayer AG - SP-ADR | 54,810 | |||||
| 12,000 | Bristol-Myers Squibb Co. | 376,560 | |||||
| 3,500 | Dr. Reddy’s Laboratories | ||||||
| Ltd. - SP-ADR | 104,300 | ||||||
| 47,000 | Elan Corporation PLC - SP-ADR* | 494,910 | |||||
| 2,300 | Endo Pharmaceuticals Holdings Inc.* | 64,377 | |||||
| 5,230 | Forest Laboratories, Inc.* | 161,032 | |||||
| 2,700 | Generex Biotechnology Corp.* | 246 | |||||
| 3,300 | GlaxoSmithKline-PLC - SP-ADR | 136,257 | |||||
| 12,000 | Jazz Pharmaceuticals, Inc.* | 498,240 | |||||
| 4,300 | Johnson & Johnson | 273,953 | |||||
| 4,200 | Eli Lilly and Co. | 155,274 | |||||
| 1,500 | The Medicines Company* | 22,320 | |||||
| 7,800 | Medicis Pharmaceutical Corp. | 284,544 | |||||
| 8,800 | Merck & Co., Inc. | 287,848 | |||||
| 12,700 | Mylan, Inc.* | 215,900 | |||||
| 800 | Novartis AG - SP-ADR | 44,616 | |||||
| 1,500 | Novo Nordisk A/S - SP-ADR | 149,280 | |||||
| 5,000 | Perrigo Co. | 485,550 | |||||
| 11,600 | Pfizer Inc. | 205,088 | |||||
| 12,500 | Questcor Pharmaceuticals, Inc.* | 340,750 | |||||
| 4,300 | Shire PLC- SP-ADR | 403,899 | |||||
| 900 | Teva Pharmaceutical Industries Ltd. | 33,498 | |||||
| 6,180 | Valeant Pharmaceuticals | ||||||
| International, Inc. | 229,402 | ||||||
| 6,900 | ViroPharma Inc.* | 124,683 | |||||
| 8,000 | VIVUS Inc.* | 64,560 | |||||
| 2,000 | Warner Chilcott PLC* | 28,600 | |||||
| 8,900 | Watson Pharmaceuticals, Inc.* | 607,425 | |||||
| 6,316,390 | |||||||
| Professional Services — 0.4% | |||||||
| 6,200 | 51job, Inc. - SP-ADR* | 247,380 | |||||
| 3,000 | The Dun & Bradstreet Corporation | 183,780 | |||||
| 2,400 | IHS Inc.* | 179,544 | |||||
| 200 | Korn/Ferry International* | 2,438 | |||||
| 2,900 | Manpower Inc. | 97,498 | |||||
| 13,000 | On Assignment, Inc.* | 91,910 | |||||
| 1,500 | Robert Half International, Inc. | 31,830 | |||||
| 834,380 | |||||||
| Real Estate Management | |||||||
| & Development — 0.0% | |||||||
| 4,500 | CB Richard Ellis Group, Inc.* | 60,570 | |||||
| 1,800 | The St. Joe Company* | 26,982 | |||||
| 87,552 | |||||||
| Road & Rail — 2.0% | |||||||
| 5,200 | Avis Budget Group, Inc.* | 50,284 | |||||
| 4,800 | Canadian National Railway Company | 319,584 | |||||
| 700 | Canadian Pacific Railway Limited | 33,663 | |||||
| 34,200 | CSX Corp. | 638,514 | |||||
| 3,620 | Dollar Thrifty | ||||||
| Automotive Group, Inc.* | 203,806 | ||||||
| 1,900 | Genesee & Wyoming, Inc.* | 88,388 | |||||
| 16,400 | Hertz Global Holdings, Inc.* | 145,960 | |||||
| 3,100 | J. B. Hunt Transportation | ||||||
| Services, Inc. | 111,972 | ||||||
| 9,400 | Kansas City Southern* | 469,624 | |||||
| 9,700 | Norfolk Southern Corp. | 591,894 | |||||
| 5,600 | Old Dominion Freight Line, Inc.* | 162,232 | |||||
| 2,000 | RailAmerica Inc.* | 26,060 | |||||
| 8,000 | Ryder Systems, Inc. | 300,080 | |||||
| 3,000 | Swift Transportation Co.* | 19,320 | |||||
| 8,500 | Union Pacific Corp. | 694,195 | |||||
| 1,100 | Zipcar, Inc.* | 19,800 | |||||
| 3,875,376 | |||||||
| Semiconductors & Semiconductor | |||||||
| Equipment — 3.4% | |||||||
| 13,500 | Advanced Micro Devices, Inc.* | 68,580 | |||||
The accompanying notes to financial statements are an integral part of this schedule.
20
Reynolds Blue Chip Growth Fund
SCHEDULE OF INVESTMENTS (Continued)
September 30, 2011
| Shares | Value | ||||||
| LONG-TERM INVESTMENTS — 98.2% (a) (Continued) | |||||||
| COMMON STOCKS — 97.5% (a) (Continued) | |||||||
| Semiconductors & Semiconductor | |||||||
| Equipment — 3.4% (Continued) | |||||||
| 7,100 | Altera Corp. | $ | 223,863 | ||||
| 3,300 | Analog Devices, Inc. | 103,125 | |||||
| 12,000 | Applied Materials, Inc. | 124,200 | |||||
| 9,200 | ARM Holdings PLC - SP-ADR | 234,600 | |||||
| 4,400 | ASM International N.V. | 108,812 | |||||
| 2,200 | ASML Holding N.V. NYS | 75,988 | |||||
| 21,900 | Atmel Corp.* | 176,733 | |||||
| 5,000 | Avago Technologies Ltd. | 163,850 | |||||
| 7,000 | Broadcom Corp. | 233,030 | |||||
| 4,000 | Cavium Inc.* | 108,040 | |||||
| 8,900 | Cirrus Logic, Inc.* | 131,186 | |||||
| 2,600 | Cree, Inc.* | 67,548 | |||||
| 21,700 | Cypress Semiconductor Corp. | 324,849 | |||||
| 16,100 | Entegris Inc.* | 102,718 | |||||
| 10,200 | Entropic Communications, Inc.* | 42,126 | |||||
| 2,400 | EZchip Semiconductor Ltd.* | 79,728 | |||||
| 12,500 | Fairchild Semiconductor | ||||||
| International, Inc.* | 135,000 | ||||||
| 3,500 | GT Advanced Technologies Inc.* | 24,570 | |||||
| 7,100 | Integrated Device Technology, Inc.* | 36,565 | |||||
| 5,600 | Intel Corporation | 119,448 | |||||
| 8,900 | KLA-Tencor Corp. | 340,692 | |||||
| 4,500 | Kopin Corporation* | 15,435 | |||||
| 16,000 | Kulicke and Soffa Industries, Inc.* | 119,360 | |||||
| 6,400 | Lam Research Corp.* | 243,072 | |||||
| 35,100 | Lattice Semiconductor Corp.* | 184,275 | |||||
| 2,600 | Linear Technology Corporation | 71,890 | |||||
| 24,500 | LSI Corp.* | 126,910 | |||||
| 5,399 | LTX-Credence Corporation* | 28,561 | |||||
| 6,400 | Marvell Technology Group Ltd.* | 92,992 | |||||
| 6,400 | Maxim Integrated Products, Inc. | 149,312 | |||||
| 6,100 | Microchip Technology Inc. | 189,771 | |||||
| 34,000 | Micron Technology, Inc.* | 171,360 | |||||
| 8,300 | Mindspeed Technologies Inc.* | 43,160 | |||||
| 14,500 | MIPS Technologies, Inc.* | 70,180 | |||||
| 2,500 | Nanometrics Incorporated* | 36,250 | |||||
| 7,200 | Novellus Systems, Inc.* | 196,272 | |||||
| 17,000 | NVIDIA Corp.* | 212,500 | |||||
| 4,500 | OmniVision Technologies, Inc.* | 63,180 | |||||
| 42,200 | ON Semiconductor Corp.* | 302,574 | |||||
| 2,500 | Rambus Inc.* | 35,000 | |||||
| 18,600 | RF Micro Devices, Inc.* | 117,924 | |||||
| 1,400 | Semtech Corporation* | 29,540 | |||||
| 23,500 | Skyworks Solutions, Inc.* | 421,590 | |||||
| 2,800 | Spreadtrum Communications, | ||||||
| Inc. - SP-ADR | 50,260 | ||||||
| 2,000 | Standard Microsystems Corp.* | 38,800 | |||||
| 22,500 | Teradyne, Inc.* | 247,725 | |||||
| 3,200 | Texas Instruments Incorporated | 85,280 | |||||
| 22,600 | TriQuint Semiconductor, Inc.* | 113,452 | |||||
| 4,100 | Veeco Instruments Inc.* | 100,040 | |||||
| 8,800 | Xilinx, Inc. | 241,472 | |||||
| 6,823,388 | |||||||
| Software — 4.9% | |||||||
| 5,300 | Adobe Systems Inc.* | 128,101 | |||||
| 8,800 | Advent Software, Inc.* | 183,480 | |||||
| 25,000 | Ariba Inc.* | 692,750 | |||||
| 10,000 | Autodesk, Inc.* | 277,800 | |||||
| 3,400 | BMC Software, Inc.* | 131,104 | |||||
| 4,500 | CA, Inc. | 87,345 | |||||
| 12,300 | Check Point Software | ||||||
| Technologies Ltd.* | 648,948 | ||||||
| 9,800 | Citrix Systems, Inc.* | 534,394 | |||||
| 14,600 | Compuware Corp.* | 111,836 | |||||
| 5,700 | Electronic Arts Inc.* | 116,565 | |||||
| 2,200 | FactSet Research Systems Inc. | 195,734 | |||||
| 5,000 | Fair Isaac Corp. | 109,150 | |||||
| 25,000 | Fortinet Inc.* | 420,000 | |||||
| 16,800 | Glu Mobile Inc.* | 35,448 | |||||
| 9,400 | Jack Henry & Associates, Inc. | 272,412 | |||||
| 9,400 | Informatica Corp.* | 384,930 | |||||
| 8,400 | Intuit Inc.* | 398,496 | |||||
| 4,700 | JDA Software Group, Inc.* | 110,168 | |||||
| 9,600 | Mentor Graphics Corporation* | 92,352 | |||||
| 5,600 | MICROS Systems, Inc.* | 245,896 | |||||
| 4,700 | Microsoft Corp. | 116,983 | |||||
| 9,000 | NetSuite Inc.* | 243,090 | |||||
| 1,200 | NICE Systems Limited - SP-ADR* | 36,420 | |||||
The accompanying notes to financial statements are an integral part of this schedule.
21
Reynolds Blue Chip Growth Fund
SCHEDULE OF INVESTMENTS (Continued)
September 30, 2011
| Shares | Value | ||||||
| LONG-TERM INVESTMENTS — 98.2% (a) (Continued) | |||||||
| COMMON STOCKS — 97.5% (a) (Continued) | |||||||
| Software — 4.9% (Continued) | |||||||
| 2,400 | Nuance Communications, Inc.* | $ | 48,864 | ||||
| 15,600 | Oracle Corp. | 448,344 | |||||
| 3,900 | Parametric Technology Corp.* | 59,982 | |||||
| 4,500 | Progress Software Corporation* | 78,975 | |||||
| 1,700 | RealPage, Inc.* | 34,765 | |||||
| 6,000 | Red Hat, Inc.* | 253,560 | |||||
| 3,200 | Rosetta Stone, Inc.* | 29,280 | |||||
| 7,800 | Rovi Corporation* | 335,244 | |||||
| 4,000 | Salesforce.com, Inc.* | 457,120 | |||||
| 7,900 | SAP AG - SP-ADR | 399,898 | |||||
| 2,700 | Solera Holdings Inc. | 136,350 | |||||
| 2,200 | SuccessFactors, Inc.* | 50,578 | |||||
| 6,000 | Symantec Corp.* | 97,800 | |||||
| 3,100 | Synopsys, Inc.* | 75,516 | |||||
| 18,500 | TIBCO Software Inc.* | 414,215 | |||||
| 7,300 | The Ultimate Software Group, Inc.* | 341,056 | |||||
| 8,500 | VMware Inc.* | 683,230 | |||||
| 33,000 | Wave Systems Corp.* | 77,220 | |||||
| 4,000 | Websense, Inc.* | 69,200 | |||||
| 9,664,599 | |||||||
| Solar — 0.1% | |||||||
| 2,300 | First Solar, Inc.* | 145,383 | |||||
| 17,000 | JA Solar Holdings Co., | ||||||
| Ltd. - SP-ADR* | 30,260 | ||||||
| 4,800 | LDK Solar Co. Ltd. - SP-ADR* | 14,976 | |||||
| 190,619 | |||||||
| Specialty Retail — 5.3% | |||||||
| 2,400 | Aarons, Inc. | 60,600 | |||||
| 7,400 | Abercrombie & Fitch Co. | 455,544 | |||||
| 1,900 | Advance Auto Parts, Inc. | 110,390 | |||||
| 7,100 | Ann Inc.* | 162,164 | |||||
| 12,200 | AutoNation, Inc.* | 399,916 | |||||
| 3,000 | AutoZone, Inc.* | 957,570 | |||||
| 2,200 | Barnes & Noble, Inc. | 26,026 | |||||
| 2,400 | bebe stores, inc. | 16,128 | |||||
| 6,000 | Bed Bath & Beyond Inc.* | 343,860 | |||||
| 3,700 | Best Buy Co., Inc. | 86,210 | |||||
| 36,000 | Borders Group, Inc.* | 864 | |||||
| 5,900 | CarMax, Inc.* | 140,715 | |||||
| 18,100 | Chico’s FAS, Inc. | 206,883 | |||||
| 5,100 | The Children’s Place | ||||||
| Retail Stores, Inc.* | 237,303 | ||||||
| 27,600 | Coldwater Creek Inc.* | 34,500 | |||||
| 3,200 | Collective Brands, Inc.* | 41,472 | |||||
| 16,320 | Cost Plus, Inc.* | 102,816 | |||||
| 10,100 | Dick’s Sporting Goods, Inc.* | 337,946 | |||||
| 4,515 | DSW, Inc. | 208,503 | |||||
| 3,500 | Express, Inc. | 71,015 | |||||
| 7,500 | The Finish Line, Inc. | 149,925 | |||||
| 9,600 | Foot Locker, Inc. | 192,864 | |||||
| 4,200 | GameStop Corp.* | 97,020 | |||||
| 3,700 | The Gap, Inc. | 60,088 | |||||
| 3,100 | GNC Acquisition Holdings Inc.* | 62,372 | |||||
| 3,400 | Guess?, Inc. | 96,866 | |||||
| 14,000 | The Home Depot, Inc. | 460,180 | |||||
| 400 | Hot Topic, Inc. | 3,052 | |||||
| 13,900 | Limited Brands, Inc. | 535,289 | |||||
| 4,500 | Lithia Motors, Inc. | 64,710 | |||||
| 11,200 | Lowe’s Companies, Inc. | 216,608 | |||||
| 40,600 | Office Depot, Inc.* | 83,636 | |||||
| 6,100 | OfficeMax Inc.* | 29,585 | |||||
| 6,900 | O’Reilly Automotive, Inc.* | 459,747 | |||||
| 9,400 | The Pep Boys-Manny Moe & Jack | 92,778 | |||||
| 9,900 | PetSmart, Inc. | 422,235 | |||||
| 49,100 | Pier 1 Imports, Inc.* | 480,198 | |||||
| 1,800 | RadioShack Corporation | 20,916 | |||||
| 8,800 | Rent-A-Center, Inc. | 241,560 | |||||
| 5,200 | Ross Stores, Inc. | 409,188 | |||||
| 1,900 | The Sherwin-Williams Co. | 141,208 | |||||
| 3,800 | Signet Jewelers Ltd.* | 128,440 | |||||
| 4,200 | Staples, Inc. | 55,860 | |||||
| 7,000 | Stein Mart, Inc. | 43,750 | |||||
| 2,900 | The Talbots, Inc.* | 7,830 | |||||
| 6,500 | Tiffany & Co. | 395,330 | |||||
| 6,500 | The TJX Companies, Inc. | 360,555 | |||||
| 8,300 | Tractor Supply Company | 519,165 | |||||
| 4,800 | Ulta Salon, Cosmetics | ||||||
| & Fragrance, Inc.* | 298,704 | ||||||
| 4,100 | Urban Outfitters, Inc.* | 91,512 | |||||
The accompanying notes to financial statements are an integral part of this schedule.
22
Reynolds Blue Chip Growth Fund
SCHEDULE OF INVESTMENTS (Continued)
September 30, 2011
| Shares | Value | ||||||
| LONG-TERM INVESTMENTS — 98.2% (a) (Continued) | |||||||
| COMMON STOCKS — 97.5% (a) (Continued) | |||||||
| Specialty Retail — 5.3% (Continued) | |||||||
| 1,000 | Vitamin Shoppe, Inc.* | $ | 37,440 | ||||
| 7,300 | Williams-Sonoma, Inc. | 224,767 | |||||
| 1,900 | Zumiez Inc.* | 33,269 | |||||
| 10,517,072 | |||||||
| Telecommunication Services – | |||||||
| Diversified — 0.9% | |||||||
| 29,700 | 8x8, Inc.* | 120,879 | |||||
| 1,200 | AT&T Inc. | 34,224 | |||||
| 8,200 | BT Group PLC - SP-ADR | 218,448 | |||||
| 7,010 | CenturyLink, Inc. | ||||||
| (F/K/A CenturyTel, Inc.) | 232,171 | ||||||
| 2,100 | China Telecom Corporation | ||||||
| Limited - SP-ADR | 129,969 | ||||||
| 11,600 | China Unicom (Hong Kong) | ||||||
| Ltd. - SP-ADR | 236,640 | ||||||
| 5,300 | Chunghwa Telecom Co., | ||||||
| Ltd. - SP-ADR | 174,900 | ||||||
| 4,200 | City Telecom (H. K.) Ltd. - SP-ADR | 39,690 | |||||
| 3,300 | Cogent Communications Group, Inc.* | 44,385 | |||||
| 79,600 | Level 3 Communications, Inc.* | 118,604 | |||||
| 1,700 | magicJack VocalTec Ltd.* | 39,440 | |||||
| 12,700 | tw telecom inc.* | 209,804 | |||||
| 5,100 | Verizon Communications Inc. | 187,680 | |||||
| 1,700 | VimpelCom Ltd. | 16,201 | |||||
| 6,500 | Windstream Corporation | 75,790 | |||||
| 1,878,825 | |||||||
| Telecommunication Services – Wireless — 0.5% | |||||||
| 1,600 | American Tower Corp.* | 86,080 | |||||
| 1,000 | China Mobile Limited - SP-ADR | 48,710 | |||||
| 1,500 | Crown Castle International Corp.* | 61,005 | |||||
| 3,500 | Leap Wireless International, Inc.* | 24,150 | |||||
| 20,700 | MetroPCS Communications, Inc.* | 180,297 | |||||
| 7,200 | Mobile TeleSystems - SP-ADR | 88,560 | |||||
| 2,100 | NII Holdings Inc.* | 56,595 | |||||
| 2,600 | NTT DOCOMO, Inc. - SP-ADR | 47,476 | |||||
| 1,000 | SBA Communications Corporation* | 34,480 | |||||
| 34,000 | Sprint Nextel Corp.* | 103,360 | |||||
| 10,700 | Vodafone Group PLC - SP-ADR | 274,455 | |||||
| 1,005,168 | |||||||
| Textiles, Apparel & Luxury Goods — 2.4% | |||||||
| 5,700 | Coach, Inc. | 295,431 | |||||
| 39,600 | Crocs, Inc.* | 937,332 | |||||
| 5,600 | Deckers Outdoor Corp.* | 522,256 | |||||
| 3,000 | Fossil, Inc.* | 243,180 | |||||
| 4,100 | Hanesbrands, Inc.* | 102,541 | |||||
| 6,600 | Iconix Brand Group, Inc.* | 104,280 | |||||
| 13,000 | Joe’s Jeans, Inc.* | 8,179 | |||||
| 16,500 | Liz Claiborne, Inc.* | 82,500 | |||||
| 5,900 | Lululemon Athletica Inc.* | 287,035 | |||||
| 7,400 | Luxottica Group SPA - SP-ADR | 186,332 | |||||
| 6,650 | Steven Madden, Ltd.* | 200,165 | |||||
| 5,900 | NIKE, Inc. Cl B | 504,509 | |||||
| 5,000 | PVH Corp. | 291,200 | |||||
| 2,500 | Ralph Lauren Corporation | 324,250 | |||||
| 4,400 | True Religion Apparel, Inc.* | 118,624 | |||||
| 5,200 | Under Armour, Inc.* | 345,332 | |||||
| 2,300 | VF Corp. | 279,496 | |||||
| 4,832,642 | |||||||
| Tobacco — 0.5% | |||||||
| 7,200 | Altria Group Inc. | 193,032 | |||||
| 500 | Lorillard, Inc. | 55,350 | |||||
| 8,800 | Philip Morris International Inc. | 548,944 | |||||
| 5,600 | Reynolds American Inc. | 209,888 | |||||
| 1,007,214 | |||||||
| Trading Companies & Distributors — 0.4% | |||||||
| 12,900 | Fastenal Co. | 429,312 | |||||
| 1,100 | W.W. Grainger, Inc. | 164,494 | |||||
| 1,000 | Kaman Corporation | 27,850 | |||||
| 1,400 | TAL International Group, Inc. | 34,916 | |||||
| 8,800 | Titan Machinery, Inc.* | 157,520 | |||||
| 900 | United Rentals, Inc.* | 15,156 | |||||
| 900 | WESCO International, Inc.* | 30,195 | |||||
| 859,443 | |||||||
| Water Utilities — 0.1% | |||||||
| 7,900 | American Water Works Co., Inc. | 238,422 | |||||
| Total common stocks | |||||||
| (cost $214,858,362) | 194,303,814 | ||||||
The accompanying notes to financial statements are an integral part of this schedule.
23
Reynolds Blue Chip Growth Fund
SCHEDULE OF INVESTMENTS (Continued)
September 30, 2011
| Shares | Value | ||||||
| LONG-TERM INVESTMENTS — 98.2% (a) (Continued) | |||||||
| PUBLICLY TRADED PARTNERSHIPS — 0.2% (a) | |||||||
| Capital Markets — 0.0% | |||||||
| 2,300 | Lazard Ltd. | $ | 48,530 | ||||
| Oil, Gas & Consumable Fuels — 0.2% | |||||||
| 7,500 | Linn Energy LLC | 267,450 | |||||
| Total publicly traded partnerships | |||||||
| (cost $377,506) | 315,980 | ||||||
| REITS — 0.3% (a) | |||||||
| Real Estate Investment Trusts — 0.3% | |||||||
| 1,800 | Annaly Capital Management Inc. | 29,934 | |||||
| 1,400 | Hatteras Financial Corp. | 35,224 | |||||
| 1,300 | OMEGA Healthcare Investors, Inc. | 20,709 | |||||
| 1,500 | Rayonier Inc. | 55,185 | |||||
| 700 | Simon Property Group, Inc. | 76,986 | |||||
| 2,500 | SL Green Realty Corp. | 145,375 | |||||
| 700 | Ventas, Inc. | 34,580 | |||||
| 12,700 | Weyerhaeuser Co. | 197,485 | |||||
| Total REITS | |||||||
| (cost $899,672) | 595,478 | ||||||
| WARRANTS — 0.0% (a) | |||||||
| 70 | Krispy Kreme Doughnuts, Inc.*, | ||||||
| Expiration Date - 03/02/12, | |||||||
| Exercise Price - $12.21 | 20 | ||||||
| 3,150 | American International Group, Inc.*, | ||||||
| Expiration Date - 01/19/21, | |||||||
| Exercise Price - $45.00 | 19,278 | ||||||
| Total warrants | |||||||
| (cost $47,259) | 19,298 | ||||||
| PREFERRED STOCKS — 0.2% (a) | |||||||
| Beverages — 0.2% | |||||||
| 12,600 | Companhia de Bebidas das | ||||||
| Americas Preferred - SP-ADR | 386,190 | ||||||
| Telecommunication Services – | |||||||
| Diversified — 0.0% | |||||||
| 1,550 | Telecomunicacoes | ||||||
| de Sao Paulo S.A. - SP-ADR | 40,998 | ||||||
| Total preferred stocks | |||||||
| (cost $409,890) | 427,188 | ||||||
Total investments — 98.2% | |||||||
| (cost $216,592,689) | 195,661,758 | ||||||
| Cash and receivables, | |||||||
less liabilities — 1.8% (a) | 3,520,781 | ||||||
TOTAL NET | |||||||
| ASSETS — 100.0% | $ | 199,182,539 | |||||
| * | Non-income producing security. |
| (a) | Percentages for the various classifications relate to net assets. |
ADR – American Depositary Receipts
PLC – Public Limited Company
N.V. – Dutch Public Limited Liability Co.
NYS – New York Registered Shares
S.A. – Sociedad Anónima
S.A.B. de C.V. – Sociedad Anónima Bursetil de Capital Variable
SP-ADR – Sponsored American Depositary Receipts
The Global Industry Classification Standard (“GICS®”) was developed by and/or is the exclusive property of MSCI, Inc. and Standard & Poor’s Financial Services LLC (“S&P”). GICS® is a service mark of MCSI and S&P and has been licensed for use by U.S. Bancorp Fund Services, LLC.
The accompanying notes to financial statements are an integral part of this schedule.
24
Reynolds Blue Chip Growth Fund
STATEMENT OF OPERATIONS
For the Year Ended September 30, 2011
| INVESTMENT INCOME: | ||||
| Dividends (net of foreign withholding tax of $35,768) | $ | 2,241,940 | ||
| Total investment income | 2,241,940 | |||
| EXPENSES: | ||||
| Management fees | 2,130,556 | |||
| Transfer agent fees | 269,863 | |||
| Administrative and accounting services | 247,056 | |||
| Distribution fees | 221,824 | |||
| Custodian fees | 134,099 | |||
| Registration fees | 62,633 | |||
| Insurance expense | 49,355 | |||
| Printing and postage expense | 48,511 | |||
| Professional fees | 47,920 | |||
| Board of Directors fees | 24,000 | |||
| Overdraft fees | 21,505 | |||
| Chief Compliance Officer fees | 21,000 | |||
| Other expenses | 15,221 | |||
| Total expenses | 3,293,543 | |||
| NET INVESTMENT LOSS | (1,051,603 | ) | ||
| NET REALIZED GAIN ON INVESTMENTS | 11,306,780 | |||
| NET DECREASE IN UNREALIZED APPRECIATION ON INVESTMENTS | (34,361,365 | ) | ||
| NET LOSS ON INVESTMENTS | (23,054,585 | ) | ||
| NET DECREASE IN NET ASSETS RESULTING FROM OPERATIONS | $ | (24,106,188 | ) | |
STATEMENTS OF CHANGES IN NET ASSETS
For the Years Ended September 30, 2011 and 2010
| 2011 | 2010 | |||||||
| OPERATIONS: | ||||||||
| Net investment loss | $ | (1,051,603 | ) | $ | (415,149 | ) | ||
| Net realized gain on investments | 11,306,780 | 5,960,177 | ||||||
| Net (decrease) increase in unrealized appreciation on investments | (34,361,365 | ) | 4,829,266 | |||||
| Net (decrease) increase in net assets resulting from operations | (24,106,188 | ) | 10,374,294 | |||||
| FUND SHARE ACTIVITIES: | ||||||||
| Proceeds from shares issued (4,121,709 and 1,781,997 shares, respectively) | 229,076,800 | 80,933,456 | ||||||
| Cost of shares redeemed (2,241,424 and 538,546 shares, respectively) | (121,830,577 | ) | (23,818,278 | ) | ||||
| Net increase in net assets derived from Fund share activities | 107,246,223 | 57,115,178 | ||||||
| TOTAL INCREASE | 83,140,035 | 67,489,472 | ||||||
| NET ASSETS AT THE BEGINNING OF THE YEAR | 116,042,504 | 48,553,032 | ||||||
| NET ASSETS AT THE END OF THE YEAR (Includes accumulated | ||||||||
| net investment income of $0 and $0, respectively) | $ | 199,182,539 | $ | 116,042,504 | ||||
The accompanying notes to financial statements are an integral part of these statements.
25
Reynolds Blue Chip Growth Fund
FINANCIAL HIGHLIGHTS
(Selected data for each share of the Fund outstanding throughout each year)
| Years Ended September 30, | ||||||||||||||||||||
| 2011 | 2010 | 2009 | 2008 | 2007 | ||||||||||||||||
| PER SHARE OPERATING PERFORMANCE: | ||||||||||||||||||||
| Net asset value, beginning of year | $ | 48.29 | $ | 41.87 | $ | 31.85 | $ | 32.05 | $ | 28.98 | ||||||||||
| Income from investment operations: | ||||||||||||||||||||
| Net investment (loss) income (a) | (0.27 | ) | (0.25 | ) | (0.42 | ) | (0.01 | ) | 0.17 | |||||||||||
| Net realized and unrealized (loss) gains on investments | (1.52 | ) | 6.67 | 10.44 | 0.02 | 2.90 | ||||||||||||||
| Total from investment operations | (1.79 | ) | 6.42 | 10.02 | 0.01 | 3.07 | ||||||||||||||
| Less distributions: | ||||||||||||||||||||
| Distributions from net investment income | — | — | — | (0.21 | ) | — | ||||||||||||||
| Distributions from net realized gains | — | — | — | — | — | |||||||||||||||
| Total from distributions | — | — | — | (0.21 | ) | — | ||||||||||||||
| Net asset value, end of year | $ | 46.50 | $ | 48.29 | $ | 41.87 | $ | 31.85 | $ | 32.05 | ||||||||||
| TOTAL RETURN | (3.71 | %) | 15.33 | % | 31.46 | % | (0.00 | %) | 10.59 | % | ||||||||||
| RATIOS/SUPPLEMENTAL DATA: | ||||||||||||||||||||
| Net assets, end of year (in 000’s $) | 199,183 | 116,043 | 48,553 | 22,151 | 26,670 | |||||||||||||||
| Ratio of expenses (after reimbursement) to average net assets* | 1.55 | % | 1.80 | % | 2.00 | % | 2.00 | % | 2.02 | % | ||||||||||
| Ratio of net investment (loss) income to average net assets** | (0.49 | %) | (0.55 | %) | (1.24 | %) | (0.03 | %) | 0.55 | % | ||||||||||
| Portfolio turnover rate | 55 | % | 80 | % | 527 | % | 364 | % | 313 | % | ||||||||||
| (a) | Amount calculated based on average shares outstanding throughout the year. |
| * | Computed after giving effect to adviser’s expense limitation undertaking. If the Fund had paid all of its expenses for the years ended September 30, 2009, 2008 and 2007, the ratios would have been 2.51%, 2.67% and 2.25%, respectively. |
| ** | If the Fund had paid all of its expenses for the years ended September 30, 2009, 2008 and 2007, the ratios would have been (1.75%), (0.70%) and 0.32%, respectively. |
The accompanying notes to financial statements are an integral part of this statement.
NOTES TO FINANCIAL STATEMENTS
September 30, 2011
(1) | Summary of Significant Accounting Policies — |
The following is a summary of significant accounting policies of the Reynolds Funds, Inc. (the “Company”), which is registered as a diversified, open-end management investment company under the Investment Company Act of 1940 (the “Act”), as amended. This Company consists of one fund: the Reynolds Blue Chip Growth Fund (the “Fund”). The Company was incorporated under the laws of Maryland on April 28,1988.
The investment objective of the Fund is to produce long-term growth of capital by investing in a diversified portfolio of common stocks issued by well-established growth companies commonly referred to as “blue chip” companies.
(a) Each security, excluding short-term investments, is valued at the last sale price reported by the principal security exchange on which the issue is traded, or if no sale is reported, the latest bid price. Securities which are traded on the Nasdaq National Markets are valued at the Nasdaq Official Closing Price, or if no sale is reported, the latest bid price. Short-term investments with maturities of 60 days or less are valued at amortized cost which approximates value. Securities for which quotations are not readily available are valued at fair value as determined by the investment adviser under the supervision of the Board of Directors. The fair value of a security is the amount which the Fund might receive upon a current sale. The fair value of a security may differ from the last quoted price and the Fund may not be able to sell a security at the fair value. Market quotations may not be available, for example, if trading in particular securities was halted during the day and not resumed prior to the close of trading on the New York Stock Exchange. Variable rate demand notes are recorded at par value which approximates fair value.
26
Reynolds Blue Chip Growth Fund
NOTES TO FINANCIAL STATEMENTS (Continued)
September 30, 2011
(1) | Summary of Significant Accounting Policies — (Continued) |
Under accounting principles generally accepted in the United States of America (“GAAP”), fair value is defined as the price that would be received to sell an asset or paid to transfer a liability (i.e., the “exit price”) in an orderly transaction between market participants at the measurement date.
In determining fair value, the Fund uses various valuation approaches. GAAP establishes a fair value hierarchy for inputs used in measuring fair value that maximizes the use of observable inputs and minimizes the use of unobservable inputs by generally requiring that the most observable inputs be used when available. Observable inputs are those that market participants would use in pricing the asset or liability based on market data obtained from sources independent of the Fund. Unobservable inputs reflect the Fund's assumptions about the inputs market participants would use in pricing the asset or liability developed based on the best information available in the circumstances. The inputs or methodologies used for valuing securities are not necessarily an indication of the risks associated with investing in those securities.
The fair value hierarchy is categorized into three levels based on the inputs as follows:
Level 1—Valuations based on unadjusted quoted prices in active markets for identical assets.
Level 2—-Valuations based on quoted prices for similar securities or in markets that are not active or for which all significant inputs are observable, either directly or indirectly.
Level 3—Valuations based on inputs that are unobservable and significant to the overall fair value measurement.
The following table summarizes the Fund’s investments as of September 30, 2011, based on the inputs used to value them:
| Valuation Inputs | Investments in Securities | |||||
| Level 1 — | Common Stocks | $ | 194,301,402 | |||
| Publicly Traded Partnerships | 315,980 | |||||
| REITS | 595,478 | |||||
| Warrants | 19,298 | |||||
| Preferred Stocks | 427,188 | |||||
| Total Level 1 | 195,659,346 | |||||
| Level 2 — | Common Stocks | 2,412 | ||||
| Level 3 — | — | |||||
| Total | $ | 195,661,758 | * | |||
It is the Fund’s policy to recognize transfers between levels at the end of the quarterly reporting period. There were no significant transfers between levels during the year ended September 30, 2011.
* Please refer to the Schedule of Investments to view common stocks, publicly traded partnerships and preferred stocks segregated by industry type.
(b) Investment transactions are accounted for on a trade date basis for financial reporting purposes. Net realized gains and losses on sales of securities are computed on the lowest amortized cost basis.
(c) The Fund records dividend income on the ex-dividend date and interest income on an accrual basis. Withholding taxes on foreign dividends have been provided for in accordance with the Fund’s understanding of the applicable country’s tax rules and regulations.
(d) The Fund may have investments in short-term variable rate demand notes, which are unsecured instruments. The Fund may be susceptible to credit risk with respect to these notes to the extent the issuer defaults on its payment obligation. The Fund’s policy is to monitor the creditworthiness of the issuer and nonperformance by these issuers is not anticipated.
(e) GAAP requires that permanent differences between income for financial reporting and tax purposes be reclassified in the capital accounts. For the year ended September 30, 2011, the Fund reclassified $1,051,603 of net investment loss and $(83,896) of accumulated realized losses to capital stock.
(f) The preparation of financial statements in conformity with GAAP requires management to make estimates and assumptions that affect the reported amounts of assets and liabilities and disclosure of contingent assets and liabilities at the date of the financial statements and the reported amounts of revenues and expenses during the reporting period. Actual results could differ from these estimates.
(g) No provision has been made for Federal income taxes since the Fund has elected to be taxed as a “regulated investment company” and intends to distribute substantially all net investment company taxable income and net capital gains to shareholders and otherwise comply with the provisions of the Internal Revenue Code applicable to regulated investment companies.
27
Reynolds Blue Chip Growth Fund
NOTES TO FINANCIAL STATEMENTS (Continued)
September 30, 2011
(1) | Summary of Significant Accounting Policies — (Continued) |
(h) The Fund has reviewed all open tax years and major jurisdictions, which include Federal and the state of Maryland, and concluded that there are no significant uncertain tax positions that would require recognition in the financial statements. Open tax years are those that are open for exam by taxing authorities and, as of September 30, 2011, open Federal tax years include the tax years ended September 30, 2008 through 2011. The Fund recognizes interest and penalties, if any, related to unrecognized tax benefits as income tax expense in the Fund’s Statement of Operations. During the year ended September 30, 2011, the Fund did not incur any interest or penalties. The Fund has no examinations in progress and is also not aware of any tax positions for which it is reasonably possible that the total amounts of unrecognized tax benefits will significantly change in the next twelve months.
(2) | Investment Adviser and Management Agreement and Transactions With Related Parties — |
The Fund has a management agreement with Reynolds Capital Management, LLC (“RCM”), to serve as investment adviser and manager. The sole owner of RCM is Mr. Frederick L. Reynolds. RCM is the successor to Reynolds Capital Management, a sole proprietorship for which Mr. Reynolds was sole proprietor. Mr. Reynolds is also an officer and interested director of the Fund. Under the terms of the agreement, the Fund will pay RCM a monthly management fee at the annual rate of 1% of the daily net assets.
The agreement further stipulates that RCM will reimburse the Fund for all expenses exceeding 2% of its daily average net assets (excluding interest, taxes, brokerage commissions and extraordinary items). The Fund is not obligated to reimburse RCM for any expenses reimbursed in previous fiscal years. No such reimbursements were required for the year ended September 30, 2011.
The Fund has adopted a Service and Distribution Plan (the “Plan”) pursuant to Rule 12b-1 under the Act. The Plan provides that the Fund may incur certain costs which may not exceed a maximum amount equal to 0.25% per annum of the Fund’s average daily net assets. Payments made pursuant to the Plan may only be used to pay distribution expenses incurred in the current year, and may be less than the maximum amount allowed by the Plan.
Under the Fund’s organizational documents, each director, officer, employee or other agent of the Fund (including the Fund’s investment manager) is indemnified, to the extent permitted by the Act, against certain liabilities that may arise out of performance of their duties to the Fund. Additionally, in the normal course of business, the Fund enters into contracts that contain a variety of indemnification clauses. The Fund’s maximum exposure under these arrangements is unknown as this would involve future claims that may be made against the Fund that have not yet occurred. However, the Fund has not had prior claims or losses pursuant to these contracts and believes the risk of loss to be remote.
(3) | Distributions to Shareholders — |
Net investment income and net realized gains, if any, for the Fund are distributed to shareholders at least annually and are recorded on the ex-dividend date.
(4) | Investment Transactions — |
For the year ended September 30, 2011, purchases and proceeds of sales of investment securities (excluding short-term securities) were $222,689,820 and $114,367,785, respectively.
(5) | Income Tax Information — |
The following information for the Fund is presented on an income tax basis as of September 30, 2011:
| Gross | Gross | Net Unrealized | Distributable | Distributable | ||
| Cost of | Unrealized | Unrealized | Depreciation | Ordinary | Long-Term | |
| Investments | Appreciation | Depreciation | on Investments | Income | Capital Gains | |
| $218,394,914 | $14,380,043 | $(37,113,199) | $(22,733,156) | $ — | $ — |
The difference, if any, between the cost amount for financial statement and federal income tax purposes is due primarily to timing differences in recognizing certain gains and losses in security transactions.
28
Reynolds Blue Chip Growth Fund
NOTES TO FINANCIAL STATEMENTS (Continued)
September 30, 2011
(5) | Income Tax Information — (Continued) |
The tax components of dividends paid during the year ended September 30, 2011, capital loss carryovers, which may be used to offset future capital gains, subject to Internal Revenue Code limitations (expiring on September 30, 2013), as of September 30, 2011, and tax basis post-October losses as of September 30, 2011, which are not recognized for tax purposes until the first day of the following fiscal year are:
| September 30, 2011 | September 30, 2010 | ||||||
| Ordinary | Long-Term | Net Capital | Ordinary | Long-Term | |||
| Income | Capital Gains | Loss | Post-October | Income | Capital Gains | ||
| Distributions | Distributions | Carryovers | Losses | Distributions | Distributions | ||
| $ — | $ — | $3,761,412 | $ — | $ — | $ — | ||
The Fund has utilized $11,856,959 of its capital loss carryovers during the year ended September 30, 2011.
Since there were no ordinary distributions paid for the year ended September 30, 2011, there were no distributions designated as qualifying for the dividends received deduction for corporate shareholders nor as qualified dividend income under the Jobs and Growth Tax Relief Act of 2003.
REPORT OF INDEPENDENT REGISTERED PUBLIC ACCOUNTING FIRM
The Shareholders and Board of Directors
Reynolds Funds, Inc.
We have audited the accompanying statement of assets and liabilities, including the schedule of investments, of Reynolds Funds, Inc., comprising Reynolds Blue Chip Growth Fund (the “Fund”), as of September 30, 2011, and the related statement of operations for the year then ended, the statements of changes in net assets for each of the two years in the period then ended, and the financial highlights for each of the three years in the period then ended. These financial statements and financial highlights are the responsibility of Fund management. Our responsibility is to express an opinion on these financial statements and financial highlights based on our audits. The financial highlights for the years indicated prior to September 30, 2009 were audited by another independent registered public accounting firm, who expressed unqualified opinions on those financial highlights.
We conducted our audits in accordance with the standards of the Public Company Accounting Oversight Board (United States). Those standards require that we plan and perform the audit to obtain reasonable assurance about whether the financial statements and financial highlights are free of material misstatement. An audit includes examining, on a test basis, evidence supporting the amounts and disclosures in the financial statements. Our procedures included confirmation of securities owned as of September 30, 2011, by correspondence with the custodian and broker. An audit also includes assessing the accounting principles used and significant estimates made by management, as well as evaluating the overall financial statement presentation. We believe that our audits provide a reasonable basis for our opinion.
In our opinion, the financial statements and financial highlights referred to above present fairly, in all material respects, the financial position of Reynolds Funds, Inc. as of September 30, 2011, the results of its operations for the year then ended, the changes in its net assets for each of the two years in the period then ended, and the financial highlights for each of the three years in the period then ended, in conformity with accounting principles generally accepted in the United States of America.
 |
Westlake, Ohio
November 23, 2011
29
Reynolds Blue Chip Growth Fund
DIRECTORS AND OFFICERS
| Other | |||||
| Term of | # of Funds | Directorships | |||
| Position(s) | Office and | in Complex | Held by | ||
| Name, Age | Held with | Length of | Principal Occupation(s) | Overseen | Director |
| and Address | the Fund | Time Served | During Past Five Years | by Director | or Officer |
| Non-Interested Directors: | |||||
| Dennis N. Moser, 69 | Director | Indefinite Term | Mr. Moser is a partner in Glenbrook Partner, | 1 | None |
| 77 Stockbridge | Since 2002 | LLC, a payments consulting firm. | |||
| Atherton, CA 94027 | |||||
| Robert E. Stauder, 81 | Director | Indefinite Term | Mr. Stauder is retired. He was a principal of | 1 | None |
| 436 Casabonne Lane | Since 1988 | Robinson Mills + Williams, an architectural | |||
| Sonoma, CA 95476 | and interior design firm, from 1991 until 1996. | ||||
| Interested Director: | |||||
| Frederick L. Reynolds,* 69 | Director, | Indefinite Term | Mr. Reynolds is the sole owner of | 1 | None |
| 3565 South Las Vegas | Since 1988 | the Adviser, which business commenced in 1985. | |||
| Blvd. #403 | President | One Year Term | |||
| Las Vegas, NV 89109 | and | Since 1988 | |||
| Treasurer | |||||
| Other Officer: | |||||
| N. Lynn Bowley, 53 | Chief | At Discretion | Mr. Bowley has been a Compliance Officer for | N/A | None |
| Northern Lights | Compliance | of Board | Northern Lights Compliance Services, LLC, | ||
| Compliance Services, LLC | Officer | Since 2007 | (f/k/a) Fund Compliance Services, LLC, since | ||
| 4020 S. 147th Street | 2007. | ||||
| Omaha, NE 68137 |
__________
| * | Mr. Reynolds is the only interested director of the Company as that term is defined in the Investment Company Act of 1940. Mr. Reynolds is an interested director of the Company by reason of his being an officer of the Company and the sole owner of the investment adviser. |
For additional information about the Directors and Officers or for a description of the policies and procedures that the Fund uses to determine how to vote proxies relating to portfolio securities, please call (800) 773-9665 and request a Statement of Additional Information. One will be mailed to you free of charge. The Statement of Additional Information is also available on the website of the Securities and Exchange Commission (the “Commission”) at http://www.sec.gov. Information on how the Fund voted proxies relating to portfolio securities is available on the Fund’s website at http://www.reynoldsfunds.com or the website of the Commission no later than August 31 for the prior 12 months ending June 30. The Fund files its complete schedule of portfolio holdings with the Commission for the first and third quarters of each fiscal year on Form N-Q. The Fund’s Form N-Q is available on the Commission’s website. The Fund’s Form N-Q may be reviewed and copied at the Commission’s Public Reference Room in Washington, D.C., and that information on the operation of the Public Reference Room may be obtained by calling 1-800-SEC-0330.
30
Reynolds Funds, Inc.
PRIVACY POLICY
We collect the following nonpublic personal information about you:
| • | Information we receive from you on or in applications or other forms, correspondence or conversations. |
| • | Information about your transactions with us, our affiliates, or others. |
We do not disclose any nonpublic personal information about our current or former shareholders to anyone, except as permitted by law. For example, we are permitted by law to disclose all of the information we collect, as described above, to our transfer agent to process your transactions. Furthermore, we restrict access to your nonpublic personal information to those persons who require such information to provide products or services to you. We maintain physical, electronic and procedural safeguards that comply with federal standards to guard your nonpublic personal information.
In the event that you hold shares of the Fund through a financial intermediary, including, but not limited to, a broker-dealer, bank or trust company, the privacy policy of your financial intermediary may govern how your nonpublic personal information would be shared with nonaffiliated third parties.
HOUSEHOLDING
In an effort to decrease costs, the Fund intends to reduce the number of duplicate prospectuses and annual and semi-annual reports you receive by sending only one copy of each to those addresses shared by two or more accounts and to shareholders the Fund reasonably believes are from the same family or household. Once implemented, if you would like to discontinue householding for your accounts, please call toll-free at 1-800-773-9665 to request individual copies of these documents. Once the Fund receives notice to stop householding, the Fund will begin sending individual copies 30 days after receiving your request. This policy does not apply to account statements.
31
REYNOLDS BLUE CHIP GROWTH FUND
c/o U.S. BANCORP FUND SERVICES, LLC
615 East Michigan Street
Milwaukee, Wisconsin 53202
www.reynoldsfunds.com
Board of Directors
DENNIS N. MOSER
FREDERICK L. REYNOLDS
ROBERT E. STAUDER
Investment Adviser
REYNOLDS CAPITAL MANAGEMENT, LLC
3565 South Las Vegas Boulevard, #403
Las Vegas, Nevada 89109
Transfer Agent,
Dividend Disbursing Agent,
Administrator and Accountant
U.S. BANCORP FUND SERVICES, LLC
615 East Michigan Street
Milwaukee, Wisconsin 53202
1-800-773-9665
or 1-800-7REYNOLDS
1-414-765-4124
Custodian
U.S. Bank, N.A.
1555 North RiverCenter Drive, Suite 302
Milwaukee, Wisconsin 53212
Independent Registered Public Accounting Firm
COHEN FUND AUDIT SERVICES, LTD.
800 Westpoint Parkway, Suite 1100
Westlake, Ohio 44145
Legal Counsel
FOLEY & LARDNER LLP
777 East Wisconsin Avenue
Milwaukee, Wisconsin 53202
Item 2. Code of Ethics.
Registrant has adopted a code of ethics. See attached Exhibit 12 (a) (1).
Item 3. Audit Committee Financial Expert.
Registrant’s Board of Directors has determined that it does not have an “audit committee financial expert” serving on its audit committee. While Registrant believes that each of the members of its audit committee has sufficient knowledge of accounting principles and financial statements to serve on the audit committee, none has the requisite experience to qualify as an “audit committee financial expert” as such term is defined by the Securities and Exchange Commission.
Item 4. Principal Accountant Fees and Services.
(a) Audit Fees
$14,000 (FY 2011) and $13,500 (FY 2010) are the aggregate fees billed for each of the last two fiscal years for professional services rendered by the principal accountant to the registrant for the audit of the registrant’s annual financial statements or services that are normally provided by the accountant in connection with statutory and regulatory filings or engagements for those fiscal years.
(b) Audit-Related Fees
There were no fees billed in the last two fiscal years for Audit-Related Fees.
| (c) | Tax Fees |
There were no fees billed in the last two fiscal years for professional services rendered by the principal accountant to the registrant for tax compliance, tax advice, tax planning and tax return preparation.
There were no fees billed in the last two fiscal years for professional services rendered by the principal accountant to registrant’s investment adviser for tax compliance, tax advice and tax planning that were required to be approved by the audit committee pursuant to paragraph (c)(7)(ii) of Rule 2-01 of Regulation S-X.
(d) All Other Fees
There were no other fees billed in each the last two fiscal years for products and services provided by the principal accountant to the registrant, other than the services reported in paragraphs (a) – (c) of this Item 4.
There were no fees billed in the last two fiscal years for products and services provided by the principal accountant to registrant’s investment adviser, which were required to be approved by the audit committee pursuant to paragraph (c)(7)(ii) or Rule 2-01 or Regulation S-X.
(e) (1) None
(e) (2) None
(f) Not applicable.
(g) See the tax fees disclosed in paragraph (c) of this Item 4.
(h) Not applicable, as no non-audit services were provided to registrant’s investment adviser.
Item 5. Audit Committee of Listed Registrants.
Not applicable.
Item 6. Schedule of Investments.
(a) The Schedule of Investments in securities of unaffiliated issuers is included as part of the report to shareholders filed under Item 1 of this Form.
(b) Not applicable.
Item 7. Disclosure of Proxy Voting Policies and Procedures for Closed-End Management Investment Companies.
Not applicable to open-end investment companies.
Item 8. Portfolio Managers of Closed-End Management Investment Companies.
Not applicable to open-end investment companies.
Item 9. Purchases of Equity Securities By Closed-End Management Investment Company and Affiliated Purchasers.
Not applicable to open-end investment companies.
Item 10. Submission of Matters to a Vote of Security Holders.
None.
Item 11. Controls and Procedures.
| (a) | The Registrant’s disclosure controls and procedures are periodically evaluated. As of October 18, 2011, the date of the last evaluation, the Registrant’s officers have concluded that the Registrant’s disclosure controls and procedures are adequate. |
| (b) | The Registrant’s internal controls are periodically evaluated. There were no changes in the Registrant’s internal control over financial reporting that occurred during the second fiscal quarter of the period covered by this report that have materially affected, or are reasonably likely to materially affect, such controls. |
Item 12. Exhibits.
| (a) | (1) Any code of ethics or amendment thereto. Filed herewith. |
(2) Certifications pursuant to Section 302 of the Sarbanes-Oxley Act of 2002. Filed herewith.
(3) Any written solicitation to purchase securities under Rule 23c-1 under the Act sent or given during the period covered by the report by or on behalf of the Registrant to 10 or more persons. Not applicable to open-end investment companies.
| (b) | Certification pursuant to Section 906 of the Sarbanes-Oxley Act of 2002. Furnished herewith. |
SIGNATURES
Pursuant to the requirements of the Securities Exchange Act of 1934 and the Investment Company Act of 1940, the registrant has duly caused this report to be signed on its behalf by the undersigned, thereunto duly authorized.
Reynolds Funds, Inc.
Registrant
By /s/Frederick L. Reynolds
Frederick L. Reynolds, Principal Executive Officer
Date December 7, 2011
Pursuant to the requirements of the Securities Exchange Act of 1934 and the Investment Company Act of 1940, this report has been signed below by the following persons on behalf of the registrant and in the capacities and on the dates indicated.
Reynolds Funds, Inc.
Registrant
By /s/Frederick L. Reynolds
Frederick L. Reynolds, Principal Executive Officer
Date December 7, 2011