UNITED STATES
SECURITIES AND EXCHANGE COMMISSION
Washington, D.C. 20549
FORM N-CSR
CERTIFIED SHAREHOLDER REPORT OF REGISTERED
MANAGEMENT INVESTMENT COMPANIES
Investment Company Act file number 811-05549
Reynolds Funds, Inc.
(Exact name of registrant as specified in charter)
c/o U.S. Bancorp Fund Services, LLC
615 E. Michigan Street
Milwaukee, WI 53202
(Address of principal executive offices) (Zip code)
Frederick L. Reynolds
Reynolds Capital Management
2580 Kekaa Drive #115
Lahaina, Hawaii 96761
(Name and address of agent for service)
(415) 461-7860
Registrant's telephone number, including area code:
Date of fiscal year end: September 30
Date of reporting period: September 30, 2009
Item 1. Reports to Stockholders.
ANNUAL REPORT
September 30, 2009
REYNOLDS BLUE CHIP GROWTH FUND Seeking Long-Term Capital Appreciation |
A No-Load Mutual Fund
1-800-773-9665
www.reynoldsfunds.com
REYNOLDS BLUE CHIP GROWTH FUND
November 9, 2009
Dear Fellow Shareholders:
Performance Highlights (September 30, 2009)
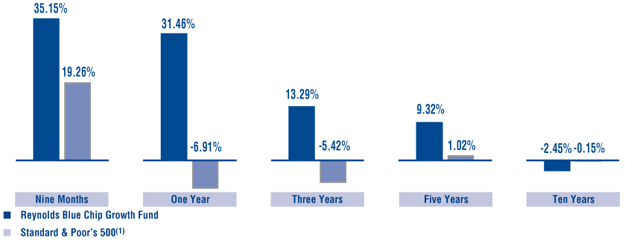
The performance of the Reynolds Blue Chip Growth Fund in the nine months ended September 30, 2009 was +35.15%. The performance of the Standard & Poor’s 500(1) Index during that same period was +19.26%. The average total returns of the Reynolds Blue Chip Growth Fund for the one year and annualized 3-year, 5-year and 10-year periods through September 30, 2009 were 31.46%, 13.29%, 9.32% and -2.45%, respectively. The average total returns for the Fund’s benchmark, the Standard & Poor’s 500, for the one year and annualized 3-year, 5-year and 10-year periods through September 30, 2009 were -6.91%, -5.42%, 1.02% and -0.15%, respectively.
 |
| (1) | The Standard & Poor’s 500 Index consists of 500 selected common stocks, most of which are listed on the New York Stock Exchange. The Standard & Poor’s Ratings Group designates the stocks to be included in the Index on a statistical basis. A particular stock’s weighting in the Index is based on its relative total market value (i.e. its market price per share times the number of shares outstanding.) Stocks may be added or deleted from the Index from time to time. |
Portfolio Strategy
Ideally I would always invest in stocks for the long-term and have low turnover. However, it is very important to closely analyze intermediate-term potential economic cycles and resulting stock market problems or positives. Two years ago in October 2007, I became increasingly concerned regarding several potential economic problems. I believed that one of these potential problems was high housing prices, and the increasingly speculative financial instruments that had evolved in this segment of the economy. As a result, I began implementing a strong “defensive investment strategy” for the Reynolds Blue Chip Growth Fund by selling equities held in the Fund and raising the cash position. The beginning of the implementation of this defensive investment strategy coincided within a few days of the intermediate top of the stock market in October 2007. I began purchasing equities for the Blue Chip Fund in March 2009, as I believed that the prices of many high quality equities had declined to attractive long-term buying ranges and the massive amount of stimulus that was being implemented worldwide would be a positive. The beginning of the implementation of this more “normal investment strategy” also coincided within a few days of the intermediate bottom of the stock market.
The U.S. Economy
The U.S. economy, helped by various stimulus measures, expanded at a 3.5% annual rate in the quarter ended September 30, 2009, after decreasing in each of the previous four quarters. The 3.8% contraction in the 12 months to June 30, 2009 marked the economy’s worst performance since the 1930’s. The Federal Reserve said “its 12 district banks saw stabilization or modest improvements” in many areas of the economy, led by housing and manufacturing, according to its Beige Book regional survey. “Reports of gains in economic activity generally
- 1 -
outnumber declines, but virtually every reference to improvement was qualified as either small or scattered”, the report said. Global stimulus programs should help to support economic growth next year and some governments may devote more funds to expansion. Many corporate heads have recently said the worst of the recession has passed. However, many economists wonder if this most recent quarterly growth can keep up at this rate as unemployment rises and consumers remain hesitant to spend. Also, some of the stimulus measures are non recurring.
There are many economic and investment negatives at the present time including: (1) more than 7.2 million jobs have been lost since the recession started in December 2007 and unemployment is above 10% percent, a 26-year high; (2) further job losses and increased unemployment is likely in the coming months; (3) both the Reuters/University of Michigan index of consumer sentiment and consumer spending recently weakened a bit signaling that consumers will make a limited contribution to the economic recovery without government incentives (consumer spending accounts for about 70% of every dollar of U.S. Gross Domestic Product); (4) conditions in commercial real estate continue to be poor; (5) mortgage rates are low but mortgage credit is still relatively tight; (6) risk aversion among lenders continues at high levels; (7) the large drop in U.S. exports and increase in imports that began last fall has hurt domestic production; and (8) many foreign economies are having some of the same financial problems as the U.S. In addition, now that global government stimulus programs of more than $2 trillion have occurred, eventually central banks will need to withdraw some of the stimulus and guard against inflation. However, compared with pouring money into the economy, draining money from the economy is a much tougher job for central banks. The dilemma is: if they tighten monetary policy, there is a high possibility of a “second dip” next year; and if a loose policy is continued another asset bubble may not be far away. The near term policy focus is to balance the need to maintain stable and relatively fast growth, the need to adjust the economic structure and the need to manage inflationary expectations.
There are currently many potential economic and investment positives: (1) business activity has recently improved somewhat and the Institute for Supply Management recently said that its business barometer increased to the highest level in 13 months; (2) the housing market has shown some signs of bottoming and stabilizing, and the housing credit for first time buyers has recently been extended; (3) businesses have been able to reduce some inventories and this liquidation should slow over the next few quarters; (4) business equipment investment has begun to pick up; (5) the various government programs to build confidence, increase liquidity in the financial system, and stimulate the economy are showing some positive effects; (6) inflation remains at moderate levels; (7) interest rates remain low; (8) investor sentiment and the functioning of financial markets have improved in both the U.S. and abroad; (9) U.S. economic growth has turned positive; (10) many companies recently reported better than expected earnings in their third quarter; (11) many companies reported revenue growth, not just earnings growth from cutting expenses in the third quarter; and (12) recent productivity gains have been quite strong and better than expected.
The economic recovery will be affected by a number of secular factors that will alter the pace and composition of growth. The outlook for 2010 will be affected by more government and less private sector contributions to growth, greater caution and less leverage for consumer spending, greater prudence and less speculation in lending and the importance of exports in moving the U.S. economy. Gross Domestic Product (GDP) increased 0.4% in calendar 2008, 2.1% in 2007, 2.8% in 2006, 3.1% in 2005, 3.9% in 2004, 2.7% in 2003, 1.9% in 2002, 0.8% in 2001 and 3.7% in 2000. GDP is forecast to decrease 2.5% in 2009 and increase 2.4% in 2010.
U.S. inflation numbers have been helped in the last few years by such factors as: (1) slowing U.S. and world economies; (2) global competition; (3) advances in technology resulting in increasing productivity; and (4) technology innovations that are helping to lower production and distribution costs. Reduced cost pressures and weakness in demand have continued to keep inflation low so far this year. Inflation should remain low in this environment. Inflation, as measured by the Consumer Price Index, increased 3.8% in 2008, 2.9% in 2007, 3.2% in 2006, 3.4% in 2005, 2.7% in 2004, 2.3% in 2003, 1.6% in 2002, 2.8% in 2001 and 3.4% in 2000. U.S. inflation is forecast to decrease 0.4% in 2009 and increase 1.8% in 2010.
The World Economy
Foreign economic growth slowed considerably in the period ending June 2009. However, many countries are now emerging from the recent recession. Many foreign countries had some of the same economic problems as the U.S., such as dislocations in credit markets. As a result, many foreign governments implemented some of the same financial policies and procedures as the U.S. Additionally, the International Monetary Fund (IMF) provided loans to some developing foreign countries that are in relatively better financial shape than other developing foreign countries. Many developing countries in the world have been growing faster than the U.S. in the last few years. Their economies continued to grow faster than the U.S. during the most recent worldwide economic slowdown.
The World Economy is forecast to decrease 1.0% in 2009 and increase 3.6% in 2010. Among “advanced economies”: (1) Japan is forecast to decrease 5.8% in 2009 and increase 1.8% in 2010; (2) the Eurozone is forecast to decrease 3.8% in 2009 and increase 1.8% in 2010; (3)
- 2 -
the United Kingdom is forecast to decrease 4.6% in 2009 and increase 1.6% in 2010; (4) Canada is forecast to decrease 2.5% in 2009 and increase 2.2% in 2010; and (5) Korea is forecast to decrease 0.1% in 2009 and increase 4.9% in 2010.
The biggest developing economies are many times referred to as the “BRIC” economies, which is short for Brazil, Russia, India, and China. China’s population is approximately 20% of the world’s total population of approximately 6.8 billion. It is the third largest economy in the world after the U.S. and Japan and it is the world’s fastest-growing major economy. Many economists believe that China has a particularly good long-term outlook and China was one of the first countries to show a pickup in growth. China’s economy expanded at the fastest pace in a year as stimulus spending and record lending growth helped the country lead the world out of recession. GDP rose 8.9% in the third quarter from a year earlier. Industrial production and retail sales accelerated in September. Surging auto sales helped industrial production rise 13.9% in September from a year earlier. There is concern that the acceleration in China’s growth will spur policy makers to consider withdrawing record fiscal and monetary stimulus in coming quarters. China now needs a transition for business and household spending to pick up following the lead from government stimulus. GDP is forecast to increase 8.3% in 2009 and increase 8.8% in 2010.
Brazil is Latin America’s biggest economy. Brazil emerged from its first recession since 2003 in the second quarter as GDP expanded at a faster than forecast 1.9% in the April-June period from the previous quarter. GDP is forecast to expand 0.1% in 2009 and increase 3.0% in 2010.
India’s population is approximately 17% of the world’s population. It is the world’s second fastest growing economy. India’s economy is forecast to increase 5.8% in 2009 and increase 7.1% in 2010. Russia’s economy is forecast to decrease 8.0% in 2009 and increase 2.6% in 2010.
Many worldwide larger multinational companies should be well positioned to benefit long-term from worldwide growth. To the extent that these companies’ U.S. earnings are growing slower, this could be somewhat offset by their possible stronger foreign earnings. The long-term strategy of the Reynolds Blue Chip Growth Fund is to be structured to benefit from this worldwide growth by investing in many of these worldwide leading multinational growth companies. The Blue Chip Fund is positioned to participate in long-term worldwide growth trends through investments in multinational U.S. headquartered companies. In addition, the Fund has investments in leading foreign headquartered companies, whose stocks or American Depositary Receipts (ADRs) trade in the United States. These ADR’s are denominated in dollars and they must use GAAP (Generally Accepted Accounting Principles) accounting to qualify as an ADR. The Blue Chip Fund may hold up to 25% of its assets in ADR’s.
Opportunistic Investing in Companies of Various Sizes
The Reynolds Blue Chip Growth Fund usually invests in companies of various sizes as classified by their market capitalizations. A company’s market capitalization is calculated by taking the number of shares the company has outstanding multiplied by its current market price. Other considerations in selecting companies for the Fund include revenue growth rates, product innovations, financial strength, management’s knowledge and experience plus the overall economic and geopolitical environments and interest rates.
Portfolio as of September 30, 2009
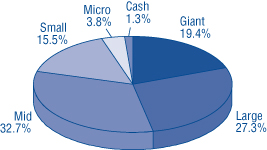
Source: Morningstar web site and Morningstar Market Cap Breakpoints
- 3 -
Morningstar separates stock portfolio holdings into five market-capitalization groups: Giant, Large, Mid, Small and Micro. Of the 5,000 largest domestic stocks in the equities database, the top 1% are categorized as Giant, the next 4% are Large, the next 15% are Mid, the next 30% are Small, and the remaining 50% are Micro. Stocks outside of the largest 5,000 are also classified as Micro.
Market caps are the minimum in each cap group; therefore, the minimum large market cap is the large-mid breakpoint and mid is the mid-small breakpoint, etc. As of September 30, 2009 the minimums in each cap group are as follows:
| (in millions) | ||||
| Giant | $ | 44,037.06 | ||
| Large | $ | 9,949.41 | ||
| Mid | $ | 1,925.95 | ||
| Small | $ | 533.20 | ||
| Micro | <$ | 533.20 | ||
The long-term strategy of the Reynolds Blue Chip Growth Fund is to emphasize investment in “blue chip” growth companies. In the long-term these companies build value as their earnings grow. This growth in value should ultimately be recognized in higher stock prices for these companies.
Low Long-Term Interest Rates by Historical Standards are a Significant Positive for Stock Valuations
Long-term interest rates remain near historically low levels. Low long-term interest rates usually result in higher stock valuations for many reasons including:
| (1) | Long-term borrowing costs of corporations are lower resulting in higher business confidence and profits. |
| (2) | Long-term borrowing costs of individuals are lower which increases consumer confidence and spending. |
| (3) | A company’s stock is usually valued by placing a present value on that company’s future stream of earnings and dividends. The present value is higher when interest and inflation rates are low. |
Linked Money Market Fund
The First American Treasury Obligations Fund is a money market fund offered by an affiliate of our transfer agent, U.S. Bancorp Fund Services, LLC. This Fund is offered as a money market alternative to our shareholders. The First American Treasury Obligations Fund offers many free shareholder conveniences including automatic investment and withdrawal plans and check writing access to your funds and is linked to your holdings in the Reynolds Blue Chip Growth Fund. This Fund is also included on your quarterly statements.
Information about the Reynolds Blue Chip Growth Fund and the First American Treasury Obligations Fund
Reynoldsfunds.com website: You can access current information about your investment holdings via our website, reynoldsfunds.com. You must first request a personal identification number (PIN) by calling our shareholder service representatives at (800) 773-9665. You will be able to view your account list, account detail (including balances), transaction history, distributions, and the current Reynolds Blue Chip Growth Fund net asset value. Additional information available (PIN number not needed) includes quarterly updates of the returns of the Blue Chip Fund, top ten holdings and industry percentages. Also, detailed statistics and graphs of past performances from a link to Morningstar for the Blue Chip Fund.
For automatic current daily net asset values: Call 1-800-773-9665 (1-800-7REYNOLDS) twenty-four hours a day, seven days a week and press “any key” then “1”. The updated current net asset value for the Blue Chip Fund is usually available each business day after 5 P.M. (PST).
For First American Treasury Obligations Fund current one and seven day yields: Call 1-800-773-9665 and press “any key” then “1”.
For shareholders to automatically access their current account information: Call 1-800-773-9665 (twenty-four hours a day, seven days a week), press “any key” then “2” and enter your 16 digit account number which appears at the top right of your statement.
To speak to a Fund representative regarding the current daily net asset value, current account information and any other questions: Call 1-800-773-9665 and press “0” from 6 A.M. to 5 P.M. (PST).
- 4 -
Shareholder statement frequency: Consolidated statements summarizing the Blue Chip Fund and First American Treasury Obligations Fund accounts held by a shareholder are sent quarterly. In addition, individual Blue Chip Fund statements are sent whenever a transaction occurs. These transactions are: (1) statements are sent for the Blue Chip Fund or First American Treasury Obligations Fund when a shareholder purchases or redeems shares; (2) Blue Chip Fund statements are sent twice a year if, and when, any ordinary income or capital gains are distributed.
Tax reporting: Individual 1099 forms, which summarize any dividend income and any long- or short-term capital gains, are sent annually to shareholders each January. The percentage of income earned from various government securities, if any, for the Blue Chip Fund and the First American Treasury Obligations Fund are also reported in January.
Minimum investment: $1,000 for regular and retirement accounts ($100 for additional investments for all accounts – except for the Automatic Investment Plan, which is $50 for regular and retirement plan accounts).
Retirement plans: All types are offered including Traditional IRA, Roth IRA, Coverdell Education Savings Account, SIMPLE IRA Plan, and SEP IRA.
Automatic Investment Plan: There is no charge to automatically debit your checking account to invest in the Blue Chip Fund or the First American Treasury Obligations Fund ($50 minimum for either of these Funds) at periodic intervals to make automatic purchases in either of these Funds. This is useful for dollar cost averaging for the Blue Chip Fund.
Systematic Withdrawal Plan: For shareholders with a $10,000 minimum starting balance, there is no charge to automatically redeem shares ($100 minimum) in the Blue Chip Fund or the First American Treasury Obligations Fund as often as monthly and send a check to you or transfer funds to your bank account.
Free Check Writing: Free check writing ($100 minimum) is offered for accounts invested in the First American Treasury Obligations Fund.
Exchanges or regular redemptions between the Blue Chip Fund and the First American Treasury Obligations Fund: As often as desired – no charge.
NASDAQ symbols: Reynolds Blue Chip Growth Fund – RBCGX and First American Treasury Obligations Fund – FATXX.
Portfolio Manager: Frederick Reynolds is the portfolio manager of the Reynolds Blue Chip Growth Fund.
The Reynolds Blue Chip Growth Fund and the First American Treasury Obligations Fund are No-Load: No front-end sales commissions or deferred sales charges (“loads”) are charged. Over 40% of all mutual funds impose these marketing charges that are ultimately paid by the shareholder. These marketing charges are either: (1) a front-end fee or “load” in which up to 5% of a shareholder’s assets are deducted from the original investment (some funds even charge a fee when a shareholder reinvests capital gains or dividends); or (2) a back-end penalty fee or “load” which is typically deducted from a shareholder’s account if a shareholder redeems within five years of the original investment. These fees reduce a shareholder’s return. The Blue Chip Fund and First American Treasury Obligations Fund are No-Load as they do not have these extra charges.
We appreciate your continued confidence in the Reynolds Blue Chip Growth Fund and would like to welcome our new shareholders. We look forward to strong results in the future.
Sincerely,

Frederick L. Reynolds
President
This report is not authorized for use as an offer of sale or a solicitation of an offer to buy shares of the Reynolds Blue Chip Growth Fund unless accompanied or preceded by the Fund’s current prospectus. Performance data quoted represents past performance; past performance does not guarantee future results. The investment return and principal value of an investment will fluctuate so that an investor’s shares, when redeemed, may be worth more or less than their original cost. Current performance of the Fund may be lower or higher than the performance quoted. Performance data current to the most recent month end may be obtained by visiting www.reynoldsfunds.com.
- 5 -
Reynolds Blue Chip Growth Fund
COST DISCUSSION (Unaudited)
As a shareholder of the Reynolds Blue Chip Growth Fund, you do not incur (except as described below) transaction costs, including sales charges (loads) on purchase payments, reinvested dividends, or other distributions; redemption fees; and exchange fees, but do incur ongoing costs, including management fees; distribution [and/or service] (12b-1) fees; and other Fund expenses. This example is intended to help you understand your ongoing costs (in dollars) of investing in the Fund and to compare these costs with the ongoing costs of investing in other mutual funds.
The example is based on an investment of $1,000 invested at the beginning of the period and held for the entire period from April 1, 2009 through September 30, 2009.
Actual Expenses
The first line of the table below provides information about actual account values and actual expenses. You may use the information in this line, together with the amount you invested, to estimate the expenses that you paid over the period. Simply divide your account value by $1,000 (for example, an $8,600 account value divided by $1,000 = 8.6), then multiply the result by the number in the first line under the heading entitled “Expenses Paid During Period” to estimate the expenses you paid on your account during this period.
In addition to the costs highlighted and described below, the only Fund transaction costs you might currently incur would be wire fees ($15 per wire), if you choose to have proceeds from a redemption wired to your bank account instead of receiving a check. Additionally, U.S. Bank charges an annual processing fee ($15) if you maintain an IRA account with the Fund. To determine your total costs of investing in the Fund, you would need to add any applicable wire or IRA processing fees you’ve incurred during the period to the costs provided in the example below.
Hypothetical Example for Comparison Purposes
The second line of the table below provides information about hypothetical account values and hypothetical expenses based on the Fund’s actual expense ratio and an assumed rate of return of 5% per year before expenses, which is not the Fund’s actual return. The hypothetical account values and expenses may not be used to estimate the actual ending account balance or expenses you paid for the period. You may use this information to compare the ongoing costs of investing in the Fund and other funds. To do so, compare this 5% hypothetical example with the 5% hypothetical examples that appear in the shareholder reports of the other funds.
Please note that the expenses shown in the table are meant to highlight your ongoing costs only and do not reflect any transactional costs, such as sales charges (loads), redemption or exchange fees. Therefore, the second line of the table is useful in comparing ongoing costs only, and will not help you determine the relative total costs of owning different funds. In addition, if these transactional costs were included, your costs would have been higher.
| Beginning Account | Ending Account | Expenses Paid During | |
| Value 4/01/09 | Value 9/30/09 | Period* 4/01/09-9/30/09 | |
| Reynolds Blue Chip Growth Fund Actual | $1,000.00 | $1,337.30 | $11.72 |
| Hypothetical (5% return before expenses) | $1,000.00 | $1,015.00 | $10.10 |
| * | Expenses are equal to the Fund’s annualized expense ratio of 2.00% multiplied by the average account value over the period, multiplied by 183/365 (to reflect the one-half year period between April 1, 2009 and September 30, 2009). |
- 6 -
Reynolds Blue Chip Growth Fund
MANAGEMENT’S DISCUSSION OF FUND PERFORMANCE (Unaudited)
The Reynolds Blue Chip Growth Fund’s performance was positively affected in the first half of its fiscal year ended September 30, 2009 because the Fund continued to maintain a temporary strong defensive position. This was accomplished by the Fund continuing to maintain a very high cash position. The Fund’s performance was positively affected in the second half of its fiscal year ended September 30, 2009 because just prior to the beginning of the period and during the period the Fund changed its temporary defensive position to a more normal invested position. The Fund was able to take advantage of the many buying opportunities that had occurred in the last year and one half by purchasing many stocks with very reasonable valuations just prior to and during the second half of its fiscal year.
COMPARISON OF CHANGE IN VALUE OF $10,000 INVESTMENT IN REYNOLDS BLUE CHIP GROWTH FUND AND S&P 500 INDEX(1) 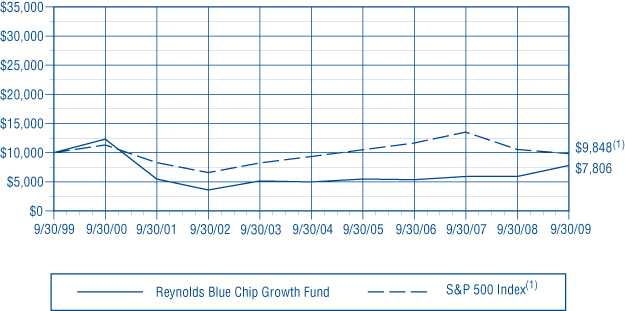 | ||
Past performance does not predict future performance. The graph and the table do not reflect the deduction of taxes that a shareholder would pay on Fund distributions or the redemption of Fund shares. |
| (1) | The S&P 500 is the Standard & Poor’s Composite Index of 500 stocks, a widely recognized unmanaged index of common stock prices and includes the reinvestment of all dividends. Investors cannot invest directly in an index or benchmark. |
| AVERAGE ANNUAL TOTAL RETURN | ||
| 1-YEAR | 5-YEAR | 10-YEAR |
| 31.46% | 9.32% | -2.45% |
- 7 -
Reynolds Blue Chip Growth Fund
STATEMENT OF ASSETS AND LIABILITIES
September 30, 2009
| ASSETS: | ||||
| Investments in securities, at value (cost $39,305,883) | $ | 47,907,051 | ||
| Cash | 542,922 | |||
| Receivable from investments sold | 314,806 | |||
| Receivable from shareholders for purchases | 630,892 | |||
| Dividends receivable | 30,943 | |||
| Total assets | $ | 49,426,614 | ||
| LIABILITIES: | ||||
| Payable to brokers for investments purchased | $ | 724,905 | ||
| Payable to shareholders for redemptions | 96,203 | |||
| Payable to adviser for management fees | 5,943 | |||
| Payable for distribution expenses | 2,868 | |||
| Other liabilities | 43,663 | |||
| Total liabilities | 873,582 | |||
| NET ASSETS: | ||||
| Capital Stock, $0.01 par value; 40,000,000 shares authorized; 1,159,711 shares outstanding | 129,138,623 | |||
| Net unrealized appreciation on investments | 8,601,168 | |||
| Accumulated net realized loss on investments | (89,186,759 | ) | ||
| Net assets | 48,553,032 | |||
| Total liabilities and net assets | $ | 49,426,614 | ||
| CALCULATION OF NET ASSET VALUE PER SHARE: | ||||
| Net asset value, offering and redemption price per share ($48,553,032 ÷ 1,159,711 shares outstanding) | $ | 41.87 | ||
The accompanying notes to financial statements are an integral part of this statement.
SCHEDULE OF INVESTMENTS
September 30, 2009
| Shares | Value | ||||||
| LONG-TERM INVESTMENTS — 98.7% (a) | |||||||
COMMON STOCKS — 98.7% (a) | |||||||
| Aerospace & Defense — 1.1% | |||||||
| 3,000 | BE Aerospace, Inc.* | $ | 60,420 | ||||
| 1,500 | The Boeing Co. | 81,225 | |||||
| 1,000 | General Dynamics Corp. | 64,600 | |||||
| 700 | Honeywell International Inc. | 26,005 | |||||
| 1,000 | L-3 Communications | ||||||
| Holdings, Inc. | 80,320 | ||||||
| 700 | Lockheed Martin Corp. | 54,656 | |||||
| 1,000 | Northrop Grumman Corp. | 51,750 | |||||
| 1,500 | Rockwell Collins, Inc. | 76,200 | |||||
| 1,000 | United Technologies Corp. | 60,930 | |||||
| 556,106 | |||||||
| Air Freight & Logistics — 0.4% | |||||||
| 1,500 | Expeditors International of | ||||||
| Washington, Inc. | 52,725 | ||||||
| 1,000 | FedEx Corp. | 75,220 | |||||
| 1,000 | United Parcel Service, Inc. Cl B | 56,470 | |||||
| 184,415 | |||||||
| Airlines — 1.4% | |||||||
| 15,000 | AMR Corp.* | 119,250 | |||||
| 3,000 | China Southern Airlines | ||||||
| Company Ltd. SP-ADR* | 47,460 | ||||||
| 4,000 | Continental Airlines, Inc. Cl B* | 65,760 | |||||
| 7,000 | Delta Air Lines, Inc.* | 62,720 | |||||
| 5,500 | GOL Intelligent Airlines Inc. SP-ADR | 56,485 | |||||
| 4,000 | Hawaiian Holdings, Inc.* | 33,040 | |||||
The accompanying notes to financial statements are an integral part of this schedule.
- 8 -
Reynolds Blue Chip Growth Fund
SCHEDULE OF INVESTMENTS (Continued)
September 30, 2009
| Shares | Value | ||||||
| LONG-TERM INVESTMENTS — 98.7% (a) (Continued) | |||||||
COMMON STOCKS — 98.7% (a) (Continued) | |||||||
| Airlines — 1.4% (Continued) | |||||||
| 5,000 | JetBlue Airways Corp.* | $ | 29,900 | ||||
| 42,000 | Mesa Air Group, Inc.* | 10,798 | |||||
| 13,000 | Southwest Airlines Co. | 124,800 | |||||
| 3,500 | Tam SA SP-ADR* | 45,185 | |||||
| 3,500 | UAL Corp.* | 32,270 | |||||
| 7,000 | US Airways Group, Inc.* | 32,900 | |||||
| 660,568 | |||||||
| Auto Components — 0.1% | |||||||
| 3,000 | The Goodyear Tire & Rubber Co.* | 51,090 | |||||
| Automobiles & Trucks — 0.6% | |||||||
| 5,000 | Ford Motor Co.* | 36,050 | |||||
| 2,000 | Harley-Davidson, Inc. | 46,000 | |||||
| 2,000 | Honda Motor Co., Ltd. SP-ADR | 60,620 | |||||
| 12,000 | Tata Motors Ltd. SP-ADR | 155,520 | |||||
| 298,190 | |||||||
| Beverages — 2.1% | |||||||
| 2,500 | The Coca-Cola Co. | 134,250 | |||||
| 1,100 | Coca-Cola Femsa, | ||||||
| S.A.B. de C.V. SP-ADR | 52,910 | ||||||
| 70,000 | Cott Corp.* | 514,500 | |||||
| 1,000 | Diageo PLC - SP-ADR | 61,490 | |||||
| 2,100 | Dr Pepper Snapple Group, Inc.* | 60,375 | |||||
| 1,000 | Fomento Económico Mexicano, | ||||||
| S.A.B. de C.V. SP-ADR | 38,050 | ||||||
| 2,500 | Hansen Natural Corp.* | 91,850 | |||||
| 1,000 | PepsiCo, Inc. | 58,660 | |||||
| 1,012,085 | |||||||
| Biotechnology — 1.0% | |||||||
| 24,000 | Cell Therapeutics, Inc.* | 29,520 | |||||
| 1,800 | Dendreon Corp.* | 50,382 | |||||
| 6,000 | Human Genome Sciences, Inc.* | 112,920 | |||||
| 4,000 | Incyte Corp.* | 27,000 | |||||
| 6,000 | Jazz Pharmaceuticals, Inc.* | 48,120 | |||||
| 5,000 | Novavax, Inc.* | 19,800 | |||||
| 15,000 | SciClone Pharmaceuticals, Inc.* | 63,900 | |||||
| 5,000 | Sequenom Inc.* | 16,150 | |||||
| 8,100 | Sinovac Biotech Ltd.* | 67,149 | |||||
| 1,000 | Vertex Pharmaceuticals Inc.* | 37,900 | |||||
| 4,000 | Vical Inc.* | 17,040 | |||||
| 20,000 | XOMA Ltd.* | 16,200 | |||||
| 506,081 | |||||||
| Building Products — 0.3% | |||||||
| 11,000 | Masco Corp. | 142,120 | |||||
| Capital Markets — 1.5% | |||||||
| 73,700 | E*TRADE Financial Corp.* | 128,975 | |||||
| 800 | The Goldman Sachs Group, Inc. | 147,480 | |||||
| 1,200 | Jefferies Group, Inc. | 32,676 | |||||
| 1,500 | Knight Capital Group, Inc.* | 32,625 | |||||
| 2,500 | Morgan Stanley | 77,200 | |||||
| 1,200 | Piper Jaffray Companies, Inc.* | 57,264 | |||||
| 6,000 | Charles Schwab Corp. | 114,900 | |||||
| 1,500 | State Street Corp. | 78,900 | |||||
| 2,500 | TD Ameritrade Holding Corp.* | 49,050 | |||||
| 719,070 | |||||||
| Chemicals — 1.7% | |||||||
| 2,700 | Agrium Inc.* | 134,433 | |||||
| 1,200 | Air Products and Chemicals, Inc. | 93,096 | |||||
| 1,000 | Airgas, Inc. | 48,370 | |||||
| 9,500 | The Dow Chemical Co. | 247,665 | |||||
| 1,000 | E.I. du Pont de Nemours and Co. | 32,140 | |||||
| 1,000 | The Lubrizol Corp. | 71,460 | |||||
| 1,000 | Monsanto Co. | 77,400 | |||||
| 4,000 | Olin Corp. | 69,760 | |||||
| 1,500 | Pall Corp. | 48,420 | |||||
| 822,744 | |||||||
| Commercial Banks — 1.3% | |||||||
| 2,500 | Barclays PLC - SP-ADR | 59,100 | |||||
| 14,000 | Fifth Third Bancorp | 141,820 | |||||
| 13,000 | Huntington Bancshares Inc. | 61,230 | |||||
| 800 | PNC Financial Services | ||||||
| Group, Inc. | 38,872 | ||||||
| 1,500 | The Toronto-Dominion Bank | 96,675 | |||||
| 1,500 | U.S. Bancorp | 32,790 | |||||
| 3,000 | Wells Fargo & Co. | 84,540 | |||||
| 6,500 | Zions Bancorporation | 116,805 | |||||
| 631,832 | |||||||
The accompanying notes to financial statements are an integral part of this schedule.
- 9 -
Reynolds Blue Chip Growth Fund
SCHEDULE OF INVESTMENTS (Continued)
September 30, 2009
| Shares | Value | ||||||
| LONG-TERM INVESTMENTS — 98.7% (a) (Continued) | |||||||
COMMON STOCKS — 98.7% (a) (Continued) | |||||||
| Commercial Services & Supplies — 0.7% | |||||||
| 4,000 | Avery Dennison Corp. | $ | 144,040 | ||||
| 1,300 | Pitney Bowes Inc. | 32,305 | |||||
| 12,000 | The Standard Register Co. | 70,560 | |||||
| 3,000 | Sykes Enterprises, Inc.* | 62,460 | |||||
| 1,400 | Tetra Tech, Inc.* | 37,142 | |||||
| 346,507 | |||||||
| Communications Equipment — 4.6% | |||||||
| 7,000 | Brocade Communications | ||||||
| Systems, Inc.* | 55,020 | ||||||
| 23,800 | Ciena Corp.* | 387,464 | |||||
| 10,800 | Cisco Systems, Inc.* | 254,232 | |||||
| 1,000 | F5 Networks, Inc.* | 39,630 | |||||
| 11,375 | Finisar Corp.* | 110,110 | |||||
| 15,000 | JDS Uniphase Corp.* | 106,650 | |||||
| 4,000 | Juniper Networks, Inc.* | 108,080 | |||||
| 16,000 | Motorola, Inc. | 137,440 | |||||
| 18,000 | Nextwave Wireless Inc.* | 16,020 | |||||
| 7,000 | Nokia Corp. SP-ADR | 102,340 | |||||
| 500 | QUALCOMM Inc. | 22,490 | |||||
| 7,600 | Research In Motion Ltd.* | 513,380 | |||||
| 29,500 | Sierra Wireless Inc.* | 294,410 | |||||
| 12,000 | Tellabs, Inc.* | 83,040 | |||||
| 2,230,306 | |||||||
| Computers & Peripherals — 5.8% | |||||||
| 9,000 | Apple Inc.* | 1,668,330 | |||||
| 6,000 | Dell Inc.* | 91,560 | |||||
| 6,000 | EMC Corp.* | 102,240 | |||||
| 3,000 | Hewlett-Packard Co. | 141,630 | |||||
| 1,500 | International Business | ||||||
| Machines Corp. | 179,415 | ||||||
| 2,000 | Logitech International S.A.* | 36,760 | |||||
| 4,000 | NetApp, Inc.* | 106,720 | |||||
| 2,200 | SanDisk Corp.* | 47,740 | |||||
| 11,000 | Seagate Technology | 167,310 | |||||
| 7,000 | Western Digital Corp.* | 255,710 | |||||
| 2,797,415 | |||||||
| Construction & Engineering — 0.7% | |||||||
| 3,000 | Fluor Corp. | 152,550 | |||||
| 2,500 | Foster Wheeler AG* | 79,775 | |||||
| 2,000 | Jacobs Engineering Group Inc.* | 91,900 | |||||
| 324,225 | |||||||
| Consumer Electronics — 0.4% | |||||||
| 4,000 | Garmin Ltd. | 150,960 | |||||
| 2,000 | Sony Corp. SP-ADR | 58,400 | |||||
| 209,360 | |||||||
| Consumer Finance — 0.5% | |||||||
| 3,700 | American Express Co. | 125,430 | |||||
| 1,000 | Capital One Financial Corp. | 35,730 | |||||
| 5,000 | Discover Financial Services | 81,150 | |||||
| 242,310 | |||||||
| Containers & Packaging — 0.1% | |||||||
| 12,500 | Boise, Inc.* | 66,000 | |||||
| Electrical Equipment — 0.7% | |||||||
| 1,400 | ABB Ltd. SP-ADR | 28,056 | |||||
| 45,000 | Capstone Turbine Corp.* | 59,400 | |||||
| 2,500 | Emerson Electric Co. | 100,200 | |||||
| 1,200 | Grainger (W.W.), Inc. | 107,232 | |||||
| 1,000 | Rockwell Automation, Inc. | 42,600 | |||||
| 337,488 | |||||||
| Electronic Equipment, Instruments | |||||||
| & Components — 1.0% | |||||||
| 2,000 | Agilent Technologies, Inc.* | 55,660 | |||||
| 9,000 | Brightpoint, Inc.* | 78,750 | |||||
| 16,500 | Flextronics International Ltd.* | 123,090 | |||||
| 4,000 | Molex Inc. | 83,520 | |||||
| 4,000 | Sanmina-SCI Corp.* | 34,400 | |||||
| 1,200 | Tech Data Corp.* | 49,932 | |||||
| 6,000 | Vishay Intertechnology, Inc.* | 47,400 | |||||
| 472,752 | |||||||
| Energy Equipment & Services — 3.8% | |||||||
| 1,200 | Atwood Oceanics, Inc.* | 42,324 | |||||
| 2,500 | Baker Hughes Inc. | 106,650 | |||||
| 5,500 | Cameron International Corp.* | 208,010 | |||||
| 10,000 | CGG Veritas SP-ADR* | 234,000 | |||||
| 1,500 | Diamond Offshore Drilling, Inc. | 143,280 | |||||
| 3,000 | Halliburton Co. | 81,360 | |||||
| 17,000 | Parker Drilling Co.* | 92,820 | |||||
| 9,000 | Rowan Companies, Inc. | 207,630 | |||||
The accompanying notes to financial statements are an integral part of this schedule.
- 10 -
Reynolds Blue Chip Growth Fund
SCHEDULE OF INVESTMENTS (Continued)
September 30, 2009
| Shares | Value | ||||||
| LONG-TERM INVESTMENTS — 98.7% (a) (Continued) | |||||||
COMMON STOCKS — 98.7% (a) (Continued) | |||||||
| Energy Equipment & Services — 3.8% (Continued) | |||||||
| 5,000 | Schlumberger Ltd. | $ | 298,000 | ||||
| 3,000 | Smith International, Inc. | 86,100 | |||||
| 4,200 | Transocean Ltd.* | 359,226 | |||||
| 1,859,400 | |||||||
| Financial Services-Diversified — 1.1% | |||||||
| 9,500 | Bank of America Corp. | 160,740 | |||||
| 44,500 | Citigroup Inc. | 215,380 | |||||
| 2,100 | JPMorgan Chase & Co. | 92,022 | |||||
| 2,500 | NYSE Euronext | 72,225 | |||||
| 540,367 | |||||||
| Food & Staples Retailing — 1.9% | |||||||
| 1,400 | BJ’s Wholesale Club, Inc.* | 50,708 | |||||
| 1,500 | Casey’s General Stores, Inc. | 47,070 | |||||
| 4,200 | Costco Wholesale Corp. | 237,132 | |||||
| 2,500 | CVS Caremark Corp. | 89,350 | |||||
| 9,800 | The Great Atlantic & Pacific | ||||||
| Tea Company, Inc.* | 87,318 | ||||||
| 29,000 | Rite Aid Corp.* | 47,560 | |||||
| 1,500 | Sysco Corp. | 37,275 | |||||
| 1,500 | Wal-Mart Stores, Inc. | 73,635 | |||||
| 1,500 | Walgreen Co. | 56,205 | |||||
| 6,000 | Whole Foods Market, Inc.* | 182,940 | |||||
| 909,193 | |||||||
| Food Products — 0.4% | |||||||
| 7,500 | Del Monte Foods Co. | 86,850 | |||||
| 1,900 | The Hain Celestial Group, Inc.* | 36,423 | |||||
| 800 | The J. M. Smucker Co. | 42,408 | |||||
| 4,000 | Sara Lee Corp. | 44,560 | |||||
| 210,241 | |||||||
| Health Care Equipment & Supplies — 0.4% | |||||||
| 900 | Becton, Dickinson and Co. | 62,775 | |||||
| 1,200 | IDEXX Laboratories, Inc.* | 60,000 | |||||
| 1,200 | Medtronic, Inc. | 44,160 | |||||
| 1,000 | Varian Medical Systems, Inc.* | 42,130 | |||||
| 209,065 | |||||||
| Health Care Providers & Services — 1.3% | |||||||
| 1,000 | AmerisourceBergen Corp. | 22,380 | |||||
| 1,500 | Cardinal Health, Inc. | 40,200 | |||||
| 1,200 | Community Health Systems Inc.* | 38,316 | |||||
| 1,000 | Express Scripts, Inc.* | 77,580 | |||||
| 6,000 | Health Management | ||||||
| Associates, Inc.* | 44,940 | ||||||
| 3,100 | McKesson Corp. | 184,605 | |||||
| 1,100 | Medco Health Solutions, Inc.* | 60,841 | |||||
| 21,000 | Tenet Healthcare Corp.* | 123,480 | |||||
| 1,000 | WellPoint Inc.* | 47,360 | |||||
| 639,702 | |||||||
| Health Care Technology — 0.2% | |||||||
| 800 | Cerner Corp.* | 59,840 | |||||
| 700 | Quality Systems, Inc. | 43,099 | |||||
| 102,939 | |||||||
| Home Builders — 1.4% | |||||||
| 10,000 | D.R. Horton, Inc. | 114,100 | |||||
| 1,200 | Gafisa S.A. SP-ADR | 36,432 | |||||
| 18,500 | Hovnanian Enterprises, Inc.* | 71,040 | |||||
| 3,500 | KB Home | 58,135 | |||||
| 4,500 | Lennar Corp. | 64,125 | |||||
| 800 | Meritage Homes Corp.* | 16,240 | |||||
| 8,875 | Pulte Homes, Inc. | 97,536 | |||||
| 5,200 | The Ryland Group, Inc. | 109,564 | |||||
| 7,000 | Standard Pacific Corp.* | 25,830 | |||||
| 4,500 | Toll Brothers, Inc.* | 87,930 | |||||
| 680,932 | |||||||
| Hotels, Restaurants & Leisure — 5.5% | |||||||
| 1,500 | Brinker International, Inc. | 23,595 | |||||
| 2,500 | Caribou Coffee Company, Inc.* | 18,050 | |||||
| 1,200 | Carnival Corp. | 39,936 | |||||
| 1,000 | The Cheesecake Factory Inc.* | 18,520 | |||||
| 700 | Chipotle Mexican Grill, Inc.* | 67,935 | |||||
| 1,500 | Cracker Barrel Old Country Store, Inc. | 51,600 | |||||
| 2,700 | Ctrip.com International, Ltd. SP-ADR* | 158,733 | |||||
| 1,500 | Darden Restaurants, Inc. | 51,195 | |||||
| 8,500 | Expedia, Inc.* | 203,575 | |||||
| 400 | Home Inns & Hotels | ||||||
| Management, Inc. SP-ADR* | 11,940 | ||||||
| 6,200 | International Game Technology | 133,176 | |||||
| 8,000 | Jamba, Inc.* | 14,880 | |||||
| 25,000 | Las Vegas Sands Corp.* | 421,000 | |||||
The accompanying notes to financial statements are an integral part of this schedule.
- 11 -
Reynolds Blue Chip Growth Fund
SCHEDULE OF INVESTMENTS (Continued)
September 30, 2009
| Shares | Value | ||||||
| LONG-TERM INVESTMENTS — 98.7% (a) (Continued) | |||||||
COMMON STOCKS — 98.7% (a) (Continued) | |||||||
| Hotels, Restaurants & Leisure — 5.5% (Continued) | |||||||
| 3,011 | Marriott International, Inc. | $ | 83,073 | ||||
| 1,000 | McDonald’s Corp. | 57,070 | |||||
| 14,500 | MGM MIRAGE* | 174,580 | |||||
| 3,000 | P.F. Chang’s China Bistro, Inc.* | 101,910 | |||||
| 1,500 | Panera Bread Co.* | 82,500 | |||||
| 2,400 | Royal Caribbean Cruises Ltd. | 57,792 | |||||
| 5,000 | Ruth’s Hospitality Group Inc.* | 21,100 | |||||
| 22,500 | Starbucks Corp.* | 464,625 | |||||
| 3,000 | Starwood Hotels & Resorts | ||||||
| Worldwide, Inc. | 99,090 | ||||||
| 5,000 | Wendy’s/Arby’s Group, Inc. | 23,650 | |||||
| 3,050 | Wynn Resorts Ltd.* | 216,215 | |||||
| 2,000 | Yum! Brands, Inc. | 67,520 | |||||
| 2,663,260 | |||||||
| Household Durables — 1.5% | |||||||
| 5,000 | The Black & Decker Corp. | 231,450 | |||||
| 1,500 | Harman International | ||||||
| Industries, Inc. | 50,820 | ||||||
| 12,000 | La-Z-Boy Inc. | 103,800 | |||||
| 1,000 | Mohawk Industries, Inc.* | 47,690 | |||||
| 7,000 | Newell Rubbermaid Inc. | 109,830 | |||||
| 3,000 | Tempur-Pedic International Inc.* | 56,820 | |||||
| 1,700 | Tupperware Brands Corp. | 67,864 | |||||
| 800 | Whirlpool Corp. | 55,968 | |||||
| 724,242 | |||||||
| Household Products — 0.2% | |||||||
| 2,000 | Kimberly-Clark Corp. | 117,960 | |||||
| Industrial Conglomerates — 1.4% | |||||||
| 2,700 | 3M Co. | 199,260 | |||||
| 15,200 | General Electric Co. | 249,584 | |||||
| 3,500 | McDermott International, Inc.* | 88,445 | |||||
| 7,100 | Textron Inc. | 134,758 | |||||
| 672,047 | |||||||
| Insurance — 1.3% | |||||||
| 900 | Aflac, Inc. | 38,466 | |||||
| 19,000 | Ambac Financial Group, Inc. | 31,920 | |||||
| 1,000 | American International | ||||||
| Group, Inc.* | 44,110 | ||||||
| 1,500 | China Life Insurance | ||||||
| Company, Ltd. SP-ADR | 98,565 | ||||||
| 5,000 | Genworth Financial Inc. | 59,750 | |||||
| 1,500 | Hartford Financial Services | ||||||
| Group, Inc. | 39,750 | ||||||
| 1,400 | Lincoln National Corp. | 36,274 | |||||
| 10,000 | MBIA Inc.* | 77,600 | |||||
| 2,500 | MetLife, Inc. | 95,175 | |||||
| 1,200 | Prudential Financial, Inc. | 59,892 | |||||
| 1,300 | The Travelers Companies, Inc. | 63,999 | |||||
| 645,501 | |||||||
| Internet & Catalog Retail — 0.9% | |||||||
| 1,500 | Amazon.com, Inc.* | 140,040 | |||||
| 2,100 | Netflix Inc.* | 96,957 | |||||
| 2,500 | Overstock.com, Inc.* | 36,675 | |||||
| 1,000 | Priceline.com Inc.* | 165,820 | |||||
| 439,492 | |||||||
| Internet Software & Services — 4.5% | |||||||
| 500 | Akamai Technologies, Inc.* | 9,840 | |||||
| 12,500 | Art Technology Group, Inc.* | 48,250 | |||||
| 1,150 | Baidu, Inc. SP-ADR* | 449,708 | |||||
| 9,000 | eBay Inc.* | 212,490 | |||||
| 1,400 | Google Inc.* | 694,190 | |||||
| 9,000 | Move, Inc.* | 24,300 | |||||
| 2,500 | NetEase.com Inc. SP-ADR* | 114,200 | |||||
| 1,000 | Openwave Systems Inc.* | 2,600 | |||||
| 6,000 | SAVVIS, Inc.* | 94,920 | |||||
| 4,500 | SINA Corp.* | 170,820 | |||||
| 2,000 | Sohu.com Inc.* | 137,560 | |||||
| 5,500 | ValueClick, Inc.* | 72,545 | |||||
| 2,000 | VeriSign, Inc.* | 47,380 | |||||
| 5,000 | Yahoo! Inc.* | 89,050 | |||||
| 2,167,853 | |||||||
| IT Services — 2.4% | |||||||
| 1,000 | Automatic Data Processing, Inc. | 39,300 | |||||
| 4,700 | Cognizant Technology | ||||||
| Solutions Corp.* | 181,702 | ||||||
| 1,500 | Fiserv, Inc.* | 72,300 | |||||
| 7,000 | Infosys Technologies | ||||||
| Ltd. SP-ADR* | 339,430 | ||||||
| 1,400 | Paychex, Inc. | 40,670 | |||||
The accompanying notes to financial statements are an integral part of this schedule.
- 12 -
Reynolds Blue Chip Growth Fund
SCHEDULE OF INVESTMENTS (Continued)
September 30, 2009
| Shares | Value | ||||||
| LONG-TERM INVESTMENTS — 98.7% (a) (Continued) | |||||||
COMMON STOCKS — 98.7% (a) (Continued) | |||||||
| IT Services — 2.4% (Continued) | |||||||
| 21,500 | Satyam Computer | ||||||
| Services Ltd. SP-ADR | $ | 141,470 | |||||
| 30,500 | Unisys Corp.* | 81,435 | |||||
| 9,500 | VeriFone Holdings, Inc.* | 150,955 | |||||
| 1,500 | Visa Inc. | 103,665 | |||||
| 1,700 | Western Union Co. | 32,164 | |||||
| 1,183,091 | |||||||
| Leisure Equipment & Products — 0.1% | |||||||
| 5,000 | Eastman Kodak Co. | 23,900 | |||||
| Life Sciences Tools & Services — 0.0% | |||||||
| 400 | Waters Corp.* | 22,344 | |||||
| Machinery — 3.0% | |||||||
| 1,000 | Bucyrus International, Inc. | 35,620 | |||||
| 5,700 | Caterpillar Inc. | 292,581 | |||||
| 2,000 | China Yuchai International Ltd. | 18,000 | |||||
| 4,500 | Deere & Co. | 193,140 | |||||
| 1,300 | Eaton Corp. | 73,567 | |||||
| 2,000 | Gardner Denver Inc.* | 69,760 | |||||
| 2,500 | Illinois Tool Works Inc. | 106,775 | |||||
| 2,500 | Ingersoll-Rand PLC | 76,675 | |||||
| 5,700 | Joy Global Inc. | 278,958 | |||||
| 500 | KUBOTA CORP. SP-ADR | 20,695 | |||||
| 2,500 | PACCAR Inc. | 94,275 | |||||
| 1,000 | Parker Hannifin Corp. | 51,840 | |||||
| 6,000 | Terex Corp.* | 124,380 | |||||
| 1,436,266 | |||||||
| Media — 2.6% | |||||||
| 10,000 | CBS Corp. Cl B Non-Voting | 120,500 | |||||
| 1,800 | DISH Network Corp.* | 34,668 | |||||
| 9,000 | The Walt Disney Co. | 247,140 | |||||
| 28,000 | Gannett Co., Inc. | 350,280 | |||||
| 2,500 | Martha Stewart Living | ||||||
| Omnimedia, Inc.* | 15,650 | ||||||
| 7,500 | The McClatchy Co. | 19,200 | |||||
| 5,000 | The New York Times Co. | 40,600 | |||||
| 5,000 | News Corp. Cl B | 69,950 | |||||
| 121,000 | Sirius XM Radio Inc.* | 76,835 | |||||
| 1,000 | Time Warner Inc. | 28,780 | |||||
| 6,500 | Viacom, Inc. Cl B* | 182,260 | |||||
| 3,900 | Virgin Media Inc. | 54,288 | |||||
| 1,240,151 | |||||||
| Metals & Mining — 4.0% | |||||||
| 2,000 | AK Steel Holding Corp. | 39,460 | |||||
| 15,000 | Alcoa Inc. | 196,800 | |||||
| 2,500 | Allegheny Technologies, Inc. | 87,475 | |||||
| 2,500 | Aluminum Corporation of | ||||||
| China Ltd. SP-ADR* | 68,475 | ||||||
| 1,200 | AngloGold Ashanti Ltd. SP-ADR | 48,912 | |||||
| 2,500 | ArcelorMittal NYS | 92,850 | |||||
| 1,200 | BHP Billiton Ltd. SP-ADR | 79,212 | |||||
| 18,000 | China Precision Steel, Inc.* | 48,960 | |||||
| 2,500 | Cliffs Natural Resources Inc. | 80,900 | |||||
| 10,000 | Commercial Metals Co. | 179,000 | |||||
| 1,500 | Freeport-McMoRan | ||||||
| Copper & Gold Inc. | 102,915 | ||||||
| 8,000 | Golden Star Resources Ltd.* | 26,960 | |||||
| 42,000 | Northgate Minerals Corp.* | 112,560 | |||||
| 3,000 | Nucor Corp. | 141,030 | |||||
| 5,500 | RTI International Metals, Inc.* | 137,005 | |||||
| 3,500 | Southern Copper Corp. | 107,415 | |||||
| 1,500 | Teck Resources Ltd. Cl B* | 41,355 | |||||
| 6,500 | Titanium Metals Corp. | 62,335 | |||||
| 3,000 | United States Steel Corp. | 133,110 | |||||
| 7,000 | Vale S.A. SP-ADR | 161,910 | |||||
| 1,948,639 | |||||||
| Multiline Retail — 1.8% | |||||||
| 6,000 | Dillard’s, Inc. | 84,600 | |||||
| 1,200 | Dollar Tree, Inc.* | 58,416 | |||||
| 2,500 | J.C. Penney Company, Inc. | 84,375 | |||||
| 2,000 | Kohl’s Corp.* | 114,100 | |||||
| 10,000 | Macy’s, Inc. | 182,900 | |||||
| 5,500 | Nordstrom, Inc. | 167,970 | |||||
| 6,000 | Saks, Inc.* | 40,920 | |||||
| 2,800 | Target Corp. | 130,704 | |||||
| 863,985 | |||||||
| Office Electronics — 0.1% | |||||||
| 6,000 | Xerox Corp. | 46,440 | |||||
The accompanying notes to financial statements are an integral part of this schedule.
- 13 -
Reynolds Blue Chip Growth Fund
SCHEDULE OF INVESTMENTS (Continued)
September 30, 2009
| Shares | Value | ||||||
| LONG-TERM INVESTMENTS — 98.7% (a) (Continued) | |||||||
COMMON STOCKS — 98.7% (a) (Continued) | |||||||
| Oil, Gas & Consumable Fuels — 6.3% | |||||||
| 2,000 | Anadarko Petroleum Corp. | $ | 125,460 | ||||
| 1,000 | Apache Corp. | 91,830 | |||||
| 3,500 | Brazilian Petroleum Corp. SP-ADR | 160,650 | |||||
| 31,100 | Brigham Exploration Co.* | 282,388 | |||||
| 5,000 | Cabot Oil & Gas Corp. | 178,750 | |||||
| 6,550 | Chesapeake Energy Corp. | 186,020 | |||||
| 1,500 | Clayton Williams Energy, Inc.* | 45,180 | |||||
| 2,500 | Devon Energy Corp. | 168,325 | |||||
| 6,000 | El Paso Corp. | 61,920 | |||||
| 4,500 | EnCana Corp. | 259,245 | |||||
| 1,500 | EOG Resources, Inc. | 125,265 | |||||
| 1,500 | Holly Corp. | 38,430 | |||||
| 28,000 | Ivanhoe Energy, Inc.* | 64,680 | |||||
| 8,000 | Massey Energy Co. | 223,120 | |||||
| 1,000 | Murphy Oil Corp. | 57,570 | |||||
| 1,500 | Noble Energy, Inc. | 98,940 | |||||
| 1,000 | Occidental Petroleum Corp. | 78,400 | |||||
| 5,500 | Peabody Energy Corp. | 204,710 | |||||
| 6,500 | Rentech, Inc.* | 10,530 | |||||
| 2,500 | Suncor Energy, Inc. | 86,400 | |||||
| 1,900 | Tesoro Corp. | 28,462 | |||||
| 1,500 | Valero Energy Corp. | 29,085 | |||||
| 4,000 | Western Refining, Inc.* | 25,800 | |||||
| 4,500 | Whiting Petroleum Corp.* | 259,110 | |||||
| 3,500 | The Williams Companies, Inc. | 62,545 | |||||
| 2,000 | XTO Energy, Inc. | 82,640 | |||||
| 3,035,455 | |||||||
| Paper & Forest Products — 1.2% | |||||||
| 17,500 | International Paper Co. | 389,025 | |||||
| 5,000 | Weyerhaeuser Co. | 183,250 | |||||
| 572,275 | |||||||
| Personal Products — 0.2% | |||||||
| 5,000 | Medifast, Inc.* | 108,600 | |||||
| Pharmaceuticals — 1.2% | |||||||
| 800 | Abbott Laboratories | 39,576 | |||||
| 1,500 | Bristol-Myers Squibb Co. | 33,780 | |||||
| 1,500 | Eli Lilly and Co. | 49,545 | |||||
| 31,000 | Generex Biotechnology Corp.* | 21,948 | |||||
| 1,000 | Johnson & Johnson | 60,890 | |||||
| 4,000 | Merck & Co., Inc. | 126,520 | |||||
| 2,500 | Mylan, Inc.* | 40,025 | |||||
| 2,000 | Perrigo Co. | 67,980 | |||||
| 6,000 | Pfizer Inc. | 99,300 | |||||
| 1,500 | Watson Pharmaceuticals, Inc.* | 54,960 | |||||
| 594,524 | |||||||
| Precious Metals — 1.8% | |||||||
| 2,000 | Barrick Gold Corp. | 75,800 | |||||
| 5,000 | Eldorado Gold Corp.* | 57,000 | |||||
| 6,500 | Gold Fields Ltd. SP-ADR | 89,570 | |||||
| 1,500 | Goldcorp, Inc. | 60,555 | |||||
| 6,000 | Harmony Gold Mining | ||||||
| Company Ltd. SP-ADR | 65,640 | ||||||
| 12,000 | Hecla Mining Co.* | 52,680 | |||||
| 3,500 | IAMGOLD Corp. | 49,490 | |||||
| 2,000 | Newmont Mining Corp. | 88,040 | |||||
| 2,500 | Pan American Silver Corp.* | 57,000 | |||||
| 3,500 | Silver Standard Resources Inc.* | 74,760 | |||||
| 9,000 | Silver Wheaton Corp.* | 113,310 | |||||
| 7,000 | Yamana Gold Inc. | 74,970 | |||||
| 858,815 | |||||||
| Professional Services — 0.0% | |||||||
| 4,000 | On Assignment, Inc.* | 23,400 | |||||
| Road & Rail — 1.1% | |||||||
| 700 | Burlington Northern | ||||||
| Santa Fe Corp. | 55,881 | ||||||
| 3,000 | Dollar Thrifty Automotive | ||||||
| Group, Inc.* | 73,770 | ||||||
| 8,000 | Hertz Global Holdings, Inc.* | 86,640 | |||||
| 1,500 | Norfolk Southern Corp. | 64,665 | |||||
| 1,500 | Ryder System, Inc. | 58,590 | |||||
| 1,500 | Union Pacific Corp. | 87,525 | |||||
| 19,000 | YRC Worldwide, Inc.* | 84,550 | |||||
| 511,621 | |||||||
| Semiconductors & Semiconductor | |||||||
| Equipment — 4.7% | |||||||
| 7,000 | Advanced Micro Devices, Inc.* | 39,620 | |||||
| 2,500 | Altera Corp. | 51,275 | |||||
| 2,500 | Analog Devices, Inc. | 68,950 | |||||
The accompanying notes to financial statements are an integral part of this schedule.
- 14 -
Reynolds Blue Chip Growth Fund
SCHEDULE OF INVESTMENTS (Continued)
September 30, 2009
| Shares | Value | ||||||
| LONG-TERM INVESTMENTS — 98.7% (a) (Continued) | |||||||
COMMON STOCKS — 98.7% (a) (Continued) | |||||||
| Semiconductors & Semiconductor | |||||||
| Equipment — 4.7% (Continued) | |||||||
| 5,000 | Applied Materials, Inc. | $ | 67,000 | ||||
| 2,300 | Applied Micro Circuits Corp.* | 22,977 | |||||
| 3,000 | ASML Holding N.V. NYS | 88,710 | |||||
| 3,000 | Broadcom Corp.* | 92,070 | |||||
| 1,700 | Cree, Inc.* | 62,475 | |||||
| 6,000 | Integrated Device | ||||||
| Technology, Inc.* | 40,560 | ||||||
| 7,500 | Intel Corp. | 146,775 | |||||
| 4,000 | KLA-Tencor Corp. | 143,440 | |||||
| 4,000 | Kopin Corp.* | 19,200 | |||||
| 7,000 | Kulicke and Soffa Industries, Inc.* | 42,210 | |||||
| 2,500 | Lam Research Corp.* | 85,400 | |||||
| 6,000 | LSI Corp.* | 32,940 | |||||
| 3,000 | Marvell Technology Group Ltd.* | 48,570 | |||||
| 2,700 | Microchip Technology Inc. | 71,550 | |||||
| 13,000 | Micron Technology, Inc.* | 106,600 | |||||
| 2,000 | Novellus Systems, Inc.* | 41,960 | |||||
| 7,500 | NVIDIA Corp.* | 112,725 | |||||
| 11,500 | ON Semiconductor Corp.* | 94,875 | |||||
| 5,000 | PMC-Sierra, Inc.* | 47,800 | |||||
| 9,000 | RF Micro Devices, Inc.* | 48,870 | |||||
| 6,000 | Skyworks Solutions, Inc.* | 79,440 | |||||
| 2,500 | Standard Microsystems Corp.* | 58,025 | |||||
| 16,000 | Teradyne, Inc.* | 148,000 | |||||
| 6,500 | Texas Instruments Inc. | 153,985 | |||||
| 37,000 | TranSwitch Corp.* | 25,900 | |||||
| 20,000 | TriQuint Semiconductor, Inc.* | 154,400 | |||||
| 1,500 | Veeco Instruments Inc.* | 34,980 | |||||
| 2,500 | Xilinx, Inc. | 58,550 | |||||
| 2,289,832 | |||||||
| Software — 2.8% | |||||||
| 2,700 | Adobe Systems Inc.* | 89,208 | |||||
| 1,000 | Advent Software, Inc.* | 40,250 | |||||
| 1,500 | Autodesk, Inc.* | 35,700 | |||||
| 1,400 | BMC Software, Inc.* | 52,542 | |||||
| 3,500 | CDC Corp.* | 9,170 | |||||
| 3,000 | Citrix Systems, Inc.* | 117,690 | |||||
| 2,500 | Informatica Corp.* | 56,450 | |||||
| 2,000 | Jack Henry & Associates, Inc. | 46,940 | |||||
| 2,000 | McAfee Inc.* | 87,580 | |||||
| 6,000 | Microsoft Corp. | 155,340 | |||||
| 4,000 | Oracle Corp. | 83,360 | |||||
| 3,000 | Quest Software, Inc.* | 50,550 | |||||
| 3,000 | Red Hat, Inc.* | 82,920 | |||||
| 3,000 | Salesforce.com, Inc.* | 170,790 | |||||
| 1,500 | SAP AG SP-ADR | 73,305 | |||||
| 2,500 | Solarwinds, Inc.* | 55,075 | |||||
| 5,000 | THQ Inc.* | 34,200 | |||||
| 2,500 | VMware Inc.* | 100,425 | |||||
| 1,341,495 | |||||||
| Solar — 0.6% | |||||||
| 9,000 | Evergreen Solar, Inc.* | 17,280 | |||||
| 6,000 | JA Solar Holdings | ||||||
| Co., Ltd. SP-ADR* | 24,180 | ||||||
| 6,500 | Suntech Power Holdings | ||||||
| Co., Ltd. SP-ADR* | 98,800 | ||||||
| 1,700 | Trina Solar Ltd.* | 54,689 | |||||
| 6,000 | Yingli Green Energy Holding | ||||||
| Company Ltd. SP-ADR* | 74,760 | ||||||
| 269,709 | |||||||
| Specialty Retail — 9.2% | |||||||
| 1,500 | Abercrombie & Fitch Co. | 49,320 | |||||
| 4,000 | Aeropostale, Inc.* | 173,880 | |||||
| 8,000 | American Eagle Outfitters, Inc. | 134,880 | |||||
| 10,000 | AnnTaylor Stores Corp.* | 158,900 | |||||
| 2,500 | bebe stores, inc. | 18,400 | |||||
| 5,100 | Bed Bath & Beyond Inc.* | 191,454 | |||||
| 10,000 | Best Buy Co., Inc. | 375,200 | |||||
| 74,000 | Blockbuster Inc.* | 79,180 | |||||
| 3,400 | Books-A-Million, Inc. | 40,936 | |||||
| 1,200 | The Buckle, Inc. | 40,968 | |||||
| 6,500 | CarMax, Inc.* | 135,850 | |||||
| 9,500 | Chico’s FAS, Inc.* | 123,500 | |||||
| 1,500 | The Children’s Place | ||||||
| Retail Stores, Inc.* | 44,940 | ||||||
| 4,000 | Coldwater Creek Inc.* | 32,800 | |||||
| 1,000 | Dick’s Sporting Goods, Inc.* | 22,400 | |||||
| 6,000 | The Gap, Inc. | 128,400 | |||||
| 1,500 | Guess?, Inc. | 55,560 | |||||
The accompanying notes to financial statements are an integral part of this schedule.
- 15 -
Reynolds Blue Chip Growth Fund
SCHEDULE OF INVESTMENTS (Continued)
September 30, 2009
| Shares | Value | ||||||
| LONG-TERM INVESTMENTS — 98.7% (a) (Continued) | |||||||
COMMON STOCKS — 98.7% (a) (Continued) | |||||||
| Specialty Retail — 9.2% (Continued) | |||||||
| 1,500 | The Gymboree Corp.* | $ | 72,570 | ||||
| 3,000 | The Home Depot, Inc. | 79,920 | |||||
| 2,500 | J. Crew Group, Inc.* | 89,550 | |||||
| 1,000 | Jos. A. Bank Clothiers, Inc.* | 44,770 | |||||
| 8,100 | Limited Brands, Inc. | 137,619 | |||||
| 8,000 | Lowe’s Companies, Inc. | 167,520 | |||||
| 69,000 | Office Depot, Inc.* | 456,780 | |||||
| 54,000 | OfficeMax Inc. | 679,320 | |||||
| 23,000 | Pier 1 Imports, Inc.* | 89,010 | |||||
| 2,800 | Ross Stores, Inc. | 133,756 | |||||
| 1,500 | The Sherwin-Williams Co. | 90,240 | |||||
| 13,500 | Stein Mart, Inc.* | 171,585 | |||||
| 3,000 | Tiffany & Co. | 115,590 | |||||
| 2,500 | The TJX Companies, Inc. | 92,875 | |||||
| 5,000 | Ulta Salon, Cosmetics & | ||||||
| Fragrance, Inc.* | 82,550 | ||||||
| 3,000 | Urban Outfitters, Inc.* | 90,510 | |||||
| 1,700 | Williams-Sonoma, Inc. | 34,391 | |||||
| 2,100 | Zumiez Inc.* | 34,461 | |||||
| 4,469,585 | |||||||
| Telecommunication Services-Diversified — 1.1% | |||||||
| 2,000 | BT Group PLC - SP-ADR | 41,620 | |||||
| 3,000 | China Unicom (Hong Kong) | ||||||
| Ltd. SP-ADR | 42,720 | ||||||
| 10,000 | Level 3 Communications, Inc.* | 13,900 | |||||
| 2,100 | Telephones of Mexico SP-ADR | 36,624 | |||||
| 4,000 | tw telecom inc.* | 53,800 | |||||
| 18,500 | Vimpel-Communications SP-ADR | 345,950 | |||||
| 10,000 | Vonage Holdings Corp.* | 13,900 | |||||
| 548,514 | |||||||
| Telecommunication Services-Wireless — 1.0% | |||||||
| 1,400 | American Tower Corp.* | 50,960 | |||||
| 2,500 | China Mobile Ltd. SP-ADR | 122,775 | |||||
| 700 | Leap Wireless International, Inc.* | 13,685 | |||||
| 4,400 | Mobile TeleSystems SP-ADR | 212,388 | |||||
| 4,000 | Sprint Nextel Corp.* | 15,800 | |||||
| 2,500 | Vodafone Group PLC - SP-ADR | 56,250 | |||||
| 471,858 | |||||||
| Textiles, Apparel & Luxury Goods — 1.5% | |||||||
| 2,500 | Coach, Inc. | 82,300 | |||||
| 29,000 | Crocs, Inc.* | 192,850 | |||||
| 4,000 | Jones Apparel Group, Inc. | 71,720 | |||||
| 7,000 | Liz Claiborne, Inc. | 34,510 | |||||
| 1,500 | NIKE, Inc. Cl B | 97,050 | |||||
| 1,200 | Phillips-Van Heusen Corp. | 51,348 | |||||
| 1,500 | Polo Ralph Lauren Corp. | 114,930 | |||||
| 1,500 | Under Armour, Inc.* | 41,745 | |||||
| 700 | VF Corp. | 50,701 | |||||
| 737,154 | |||||||
| Thrifts & Mortgage Finance — 0.2% | |||||||
| 33,500 | Federal Home Loan Mortgage Corp. | ||||||
| d/b/a Freddie Mac* | 60,300 | ||||||
| 37,000 | Federal National Mortgage Assoc. | ||||||
| d/b/a Fannie Mae* | 56,240 | ||||||
| 116,540 | |||||||
| Total common stocks | |||||||
| (cost $39,305,883) | 47,907,051 | ||||||
| WARRANTS — 0.0% (a) | |||||||
| 70 | Krispy Kreme Doughnuts, Inc., | ||||||
| Expiration Date - 3/02/12, | |||||||
| Exercise Price - $12.21 (b) | 0 | ||||||
Total investments — 98.7% | |||||||
| (cost $39,305,883) | 47,907,051 | ||||||
| Cash and receivables, | |||||||
less liabilities — 1.3% (a) | 645,981 | ||||||
| TOTAL NET | |||||||
| ASSETS — 100.0% | $ | 48,553,032 | |||||
| * | Non-income producing security. |
| (a) | Percentages for the various classifications relate to net assets. |
| (b) | This security was fair valued as determined by the adviser using procedures approved by the Board of Directors. The total fair value of such security at September 30, 2009 is $0 which represents 0.0% of total net assets. |
N.V. Netherlands Antilles Limited Liability Corp.
NYS – New York Registered Shares
SP-ADR – Sponsored American Depositary Receipts
The accompanying notes to financial statements are an integral part of this schedule.
- 16 -
Reynolds Blue Chip Growth Fund
STATEMENT OF OPERATIONS
For the Year Ended September 30, 2009
| INVESTMENT INCOME: | ||||
| Dividends (net of foreign withholding tax of $2,431) | $ | 186,751 | ||
| Interest | 30,132 | |||
| Total income | 216,883 | |||
| EXPENSES: | ||||
| Management fees | 283,912 | |||
| Transfer agent fees | 91,669 | |||
| Administrative and accounting services | 57,409 | |||
| Professional fees | 56,600 | |||
| Custodian fees | 48,565 | |||
| Insurance expense | 43,013 | |||
| Printing and postage expense | 32,060 | |||
| Registration fees | 31,767 | |||
| Distribution fees | 21,642 | |||
| Chief Compliance Officer fees | 20,000 | |||
| Board of Directors fees | 18,000 | |||
| Other expenses | 8,138 | |||
| Total expenses before reimbursement | 712,775 | |||
| Less expenses reimbursed by adviser | (143,589 | ) | ||
| Net expenses | 569,186 | |||
| NET INVESTMENT LOSS | (352,303 | ) | ||
| NET REALIZED GAIN ON INVESTMENTS | 1,479,604 | |||
| NET INCREASE IN UNREALIZED APPRECIATION ON INVESTMENTS | 8,520,213 | |||
| NET GAIN ON INVESTMENTS | 9,999,817 | |||
| NET INCREASE IN NET ASSETS RESULTING FROM OPERATIONS | $ | 9,647,514 | ||
STATEMENTS OF CHANGES IN NET ASSETS
For the Years Ended September 30, 2009 and 2008
| 2009 | 2008 | |||||||
| OPERATIONS: | ||||||||
| Net investment loss | $ | (352,303 | ) | $ | (7,103 | ) | ||
| Net realized gain on investments | 1,479,604 | 1,901,890 | ||||||
| Net increase (decrease) in unrealized appreciation on investments | 8,520,213 | (1,890,407 | ) | |||||
| Net increase in net assets resulting from operations | 9,647,514 | 4,380 | ||||||
| DISTRIBUTIONS TO SHAREHOLDERS: | ||||||||
| Distributions from net investment income ($0.210445 per share) | — | (171,260 | ) | |||||
| FUND SHARE ACTIVITIES: | ||||||||
| Proceeds from shares issued (626,906 and 17,522 shares, respectively) | 22,414,869 | 610,010 | ||||||
| Net asset value of shares issued in distributions reinvested (4,918 shares) | — | 164,990 | ||||||
| Cost of shares redeemed (162,666 and 159,033 shares, respectively) | (5,660,176 | ) | (5,127,068 | ) | ||||
| Net increase (decrease) in net assets derived from Fund share activities | 16,754,693 | (4,352,068 | ) | |||||
| TOTAL INCREASE (DECREASE) | 26,402,207 | (4,518,948 | ) | |||||
| NET ASSETS AT THE BEGINNING OF THE YEAR | 22,150,825 | 26,669,773 | ||||||
| NET ASSETS AT THE END OF THE YEAR (Includes accumulated | ||||||||
| net investment income of $0 and $0, respectively) | $ | 48,553,032 | $ | 22,150,825 | ||||
The accompanying notes to financial statements are an integral part of these statements.
- 17 -
Reynolds Blue Chip Growth Fund
FINANCIAL HIGHLIGHTS
(Selected data for each share of the Fund outstanding throughout each year)
| Years Ended September 30, | ||||||||||||||||||||
| 2009 | 2008 | 2007 | 2006 | 2005 | ||||||||||||||||
| PER SHARE OPERATING PERFORMANCE: | ||||||||||||||||||||
| Net asset value, beginning of year | $ | 31.85 | $ | 32.05 | $ | 28.98 | $ | 29.48 | $ | 26.98 | ||||||||||
| Income from investment operations: | ||||||||||||||||||||
Net investment (loss) income(a) | (0.42 | ) | (0.01 | ) | 0.17 | (0.17 | ) | (0.34 | ) | |||||||||||
| Net realized and unrealized gains (loss) on investments | 10.44 | 0.02 | 2.90 | (0.33 | ) | 2.84 | ||||||||||||||
| Total from investment operations | 10.02 | 0.01 | 3.07 | (0.50 | ) | 2.50 | ||||||||||||||
| Less distributions: | ||||||||||||||||||||
| Distributions from net investment income | — | (0.21 | ) | — | — | — | ||||||||||||||
| Distributions from net realized gains | — | — | — | — | — | |||||||||||||||
| Total from distributions | — | (0.21 | ) | — | — | — | ||||||||||||||
| Net asset value, end of year | $ | 41.87 | $ | 31.85 | $ | 32.05 | $ | 28.98 | $ | 29.48 | ||||||||||
| TOTAL RETURN | 31.46% | (0.00% | ) | 10.59% | (1.70% | ) | 9.27% | |||||||||||||
| RATIOS/SUPPLEMENTAL DATA: | ||||||||||||||||||||
| Net assets, end of year (in 000’s $) | 48,553 | 22,151 | 26,670 | 38,288 | 54,441 | |||||||||||||||
| Ratio of expenses (after reimbursement) to average net assets* | 2.00% | 2.00% | 2.02% | 2.01% | 1.80% | |||||||||||||||
| Ratio of net investment (loss) income to average net assets** | (1.24% | ) | (0.03% | ) | 0.55% | (0.55% | ) | (1.18% | ) | |||||||||||
| Portfolio turnover rate | 527% | 364% | 313% | 281% | 168% | |||||||||||||||
| (a) | Amount calculated based on average shares outstanding throughout the year. |
| * | Computed after giving effect to adviser's expense limitation undertaking. If the Fund had paid all of its expenses for the years ended September 30, 2009, 2008 and 2007, the ratios would have been 2.51%, 2.67% and 2.25%, respectively. |
| ** | If the Fund had paid all of its expenses for the years ended September 30, 2009, 2008 and 2007, the ratios would have been (1.75%), (0.70%) and 0.32%, respectively. |
The accompanying notes to financial statements are an integral part of this statement.
NOTES TO FINANCIAL STATEMENTS
September 30, 2009
| (1) | Summary of Significant Accounting Policies — |
The following is a summary of significant accounting policies of the Reynolds Funds, Inc. (the “Company”), which is registered as a diversified, open-end management investment company under the Investment Company Act of 1940 (the “Act”), as amended. This Company consists of one fund: the Reynolds Blue Chip Growth Fund (the “Fund”). The Company was incorporated under the laws of Maryland on April 28,1988.
The investment objective of the Fund is to produce long-term growth of capital by investing in a diversified portfolio of common stocks issued by well-established growth companies commonly referred to as “blue chip” companies.
(a) Each security, excluding short-term investments, is valued at the last sale price reported by the principal security exchange on which the issue is traded, or if no sale is reported, the latest bid price. Securities which are traded on the Nasdaq National Markets are valued at the Nasdaq Official Closing Price, or if no sale is reported, the latest bid price. Short-term investments with maturities of 60 days or less are valued at amortized cost which approximates value. Securities for which quotations are not readily available are valued at fair value as determined by the investment adviser under the supervision of the Board of Directors. The fair value of a security is the amount
- 18 -
Reynolds Blue Chip Growth Fund
NOTES TO FINANCIAL STATEMENTS (Continued)
September 30, 2009
| (1) | Summary of Significant Accounting Policies — (Continued) |
which the Fund might receive upon a current sale. The fair value of a security may differ from the last quoted price and the Fund may not be able to sell a security at the fair value. Market quotations may not be available, for example, if trading in particular securities was halted during the day and not resumed prior to the close of trading on the New York Stock Exchange. Variable rate demand notes are recorded at par value which approximates fair value.
The Fund adopted the provisions of the Financial Accounting Standards Board (“FASB”) Accounting Standards Codification “Fair Value Measurements and Disclosures” Topic 820 (“ASC 820”), effective October 1, 2008. Under ASC 820, fair value is defined as the price that would be received to sell an asset or paid to transfer a liability (i.e., the “exit price”) in an orderly transaction between market participants at the measurement date.
In determining fair value, the Fund uses various valuation approaches. ASC 820 establishes a fair value hierarchy for inputs used in measuring fair value that maximizes the use of observable inputs and minimizes the use of unobservable inputs by generally requiring that the most observable inputs be used when available. Observable inputs are those that market participants would use in pricing the asset or liability based on market data obtained from sources independent of the Fund. Unobservable inputs reflect the Fund's assumptions about the inputs market participants would use in pricing the asset or liability developed based on the best information available in the circumstances. The inputs or methodologies used for valuing securities are not necessarily an indication of the risks associated with investing in those securities.
The fair value hierarchy is categorized into three levels based on the inputs as follows:
| Level 1— | Valuations based on unadjusted quoted prices in active markets for identical assets. |
| Level 2— | Valuations based on quoted prices for similar securities or in markets that are not active or for which all significant inputs are observable, either directly or indirectly. |
| Level 3— | Valuations based on inputs that are unobservable and significant to the overall fair value measurement. |
The following table summarizes the Fund’s investments as of September 30, 2009, based on the inputs used to value them:
| Valuation Inputs | Investments in Securities | |||
| Level 1—Common Stocks* | $ | 47,907,051 | ||
| Level 2—Warrants | 0 | |||
| Level 3— | — | |||
| Total | $ | 47,907,051 | ||
| * | Please refer to the Schedule of Investments to view common stocks segregated by industry type. |
(b) Investment transactions are accounted for on a trade date basis for financial reporting purposes. Net realized gains and losses on sales of securities are computed on the identified cost basis.
(c) The Fund records dividend income on the ex-dividend date and interest income on an accrual basis. Withholding taxes on foreign dividends have been provided for in accordance with the Fund’s understanding of the applicable country’s tax rules and regulations.
(d) The Fund may have investments in short-term variable rate demand notes, which are unsecured instruments. The Fund may be susceptible to credit risk with respect to these notes to the extent the issuer defaults on its payment obligation. The Fund’s policy is to monitor the creditworthiness of the issuer and nonperformance by these issuers is not anticipated.
(e) Accounting principles generally accepted in the United States of America (“GAAP”) require that permanent differences between income for financial reporting and tax purposes be reclassified in the capital accounts. For the year ended September 30, 2009, the Fund reclassified $352,303 of net investment loss to capital stock.
- 19 -
Reynolds Blue Chip Growth Fund
NOTES TO FINANCIAL STATEMENTS (Continued)
September 30, 2009
| (1) | Summary of Significant Accounting Policies — (Continued) |
(f) The preparation of financial statements in conformity with GAAP requires management to make estimates and assumptions that affect the reported amounts of assets and liabilities and disclosure of contingent assets and liabilities at the date of the financial statements and the reported amounts of revenues and expenses during the reporting period. Actual results could differ from these estimates.
(g) No provision has been made for Federal income taxes since the Fund has elected to be taxed as a “regulated investment company” and intends to distribute substantially all net investment company taxable income and net capital gains to shareholders and otherwise comply with the provisions of the Internal Revenue Code applicable to regulated investment companies.
(h) The Fund has reviewed all open tax years and major jurisdictions, which include Federal and the state of Maryland, and concluded that there are no significant uncertain tax positions that would require recognition in the financial statements. Open tax years are those that are open for exam by taxing authorities and, as of September 30, 2009, open Federal tax years include the tax years ended September 30, 2006 through 2009. The Fund recognizes interest and penalties, if any, related to unrecognized tax benefits as income tax expense in the Fund’s Statement of Operations. During the year, the Fund did not incur any interest or penalties. The Fund has no examinations in progress and is also not aware of any tax positions for which it is reasonably possible that the total amounts of unrecognized tax benefits will significantly change in the next twelve months.
| (2) | Investment Adviser and Management Agreement and Transactions With Related Parties — |
The Fund has a management agreement with Reynolds Capital Management (“RCM”), to serve as investment adviser and manager. Mr. Frederick L. Reynolds, the sole proprietor of RCM, is also an officer and interested director of the Fund. Under the terms of the agreement, the Fund will pay RCM a monthly management fee at the annual rate of 1% of the daily net assets.
The agreement further stipulates that RCM will reimburse the Fund for all expenses exceeding 2% of its daily average net assets (excluding interest, taxes, brokerage commissions and extraordinary items). The Fund is not obligated to reimburse RCM for any expenses reimbursed in previous fiscal years. For the year ended September 30, 2009, RCM reimbursed the Fund $143,589.
The Fund has adopted a Service and Distribution Plan (the “Plan”) pursuant to Rule 12b-1 under the Act. The Plan provides that the Fund may incur certain costs which may not exceed a maximum amount equal to 0.25% per annum of the Fund’s average daily net assets. Payments made pursuant to the Plan may only be used to pay distribution expenses incurred in the current year.
Under the Fund’s organizational documents, each director, officer, employee or other agent of the Fund (including the Fund’s investment manager) is indemnified, to the extent permitted by the Act, against certain liabilities that may arise out of performance of their duties to the Fund. Additionally, in the normal course of business, the Fund enters into contracts that contain a variety of indemnification clauses. The Fund’s maximum exposure under these arrangements is unknown as this would involve future claims that may be made against the Fund that have not yet occurred. However, the Fund has not had prior claims or losses pursuant to these contracts and believes the risk of loss to be remote.
| (3) | Distributions to Shareholders — |
Net investment income and net realized gains, if any, for the Fund are distributed to shareholders at least annually and are recorded on the ex-dividend date.
| (4) | Investment Transactions — |
For the year ended September 30, 2009, purchases and proceeds of sales of investment securities (excluding short-term securities) were $127,966,352 and $90,044,257, respectively.
- 20 -
Reynolds Blue Chip Growth Fund
NOTES TO FINANCIAL STATEMENTS (Continued)
September 30, 2009
| (5) | Income Tax Information — |
The following information for the Fund is presented on an income tax basis as of September 30, 2009:
| Gross | Gross | Net Unrealized | Distributable | Distributable | ||||||||
| Cost of | Unrealized | Unrealized | Appreciation | Ordinary | Long-Term | |||||||
| Investments | Appreciation | Depreciation | on Investments | Income | Capital Gains | |||||||
| $40,110,985 | $8,388,573 | ($592,507) | $7,796,066 | $— | $— |
The difference, if any, between the cost amount for financial statement and federal income tax purposes is due primarily to timing differences in recognizing certain gains and losses in security transactions.
The tax components of dividends paid during the year ended September 30, 2009, capital loss carryovers, which may be used to offset future capital gains, subject to Internal Revenue Code limitations ($72,749,181 of which expires on September 30, 2010, $4,248,056 expiring on September 30, 2011 and $11,370,315 expiring on September 30, 2013), as of September 30, 2009, and tax basis post-October losses as of September 30, 2009, which are not recognized for tax purposes until the first day of the following fiscal year are:
| September 30, 2009 | September 30, 2008 | |||||||||||
| Ordinary | Long-Term | Net Capital | Ordinary | Long-Term | ||||||||
| Income | Capital Gains | Loss | Post-October | Income | Capital Gains | |||||||
| Distributions | Distributions | Carryovers | Losses | Distributions | Distributions | |||||||
| $— | $— | $88,367,552 | $— | $171,260 | $— | |||||||
The Fund has utilized $2,298,811 of its capital loss carryovers during the year ended September 30, 2009.
Since there were no ordinary distributions paid for the year ended September 30, 2009, there were no distributions designated as qualifying for the dividends received deduction for corporate shareholders nor as qualified dividend income under the Jobs and Growth Tax Relief Act of 2003.
| (6) | Subsequent Events |
Effective October 1, 2009, U.S. Bancorp Fund Services, LLC, began serving as the administrator and accounting services agent for the Fund. Subsequent events have been evaluated through November 20, 2009, which is the date the financial statements were issued. Subsequent events have not been evaluated after this date.
Change in Independent Registered Public Accounting Firm (Unaudited)
On November 21, 2008, Reynolds Funds, Inc. (the “Fund”) dismissed PricewaterhouseCoopers LLP as its independent registered public accounting firm. The Fund’s Audit Committee and its Board of Directors participated in and approved the decision to change its independent registered public accounting firm.
The reports of PricewaterhouseCoopers LLP on the financial statements of the Fund for the past two fiscal years contained no adverse opinion or disclaimer of opinion, and were not qualified or modified as to uncertainty, audit scope or accounting principle.
During the two most recent fiscal years through November 21, 2008, there were no disagreements with PricewaterhouseCoopers LLP on any matter of accounting principles or practices, financial statement disclosure, or auditing scope or procedure, which disagreements if not resolved to the satisfaction of PricewaterhouseCoopers LLP would have caused them to make reference thereto in their reports on the financial statements for such years.
The Fund, with the approval of its Board of Directors and its Audit Committee, engaged Cohen Fund Audit Services, Ltd. as its new independent registered public accounting firm on November 21, 2008.
- 21 -
REPORT OF INDEPENDENT REGISTERED PUBLIC ACCOUNTING FIRM
The Shareholders and Board of Directors
Reynolds Funds, Inc.
We have audited the accompanying statement of assets and liabilities, including the schedule of investments, of Reynolds Funds, Inc. (the “Fund”), comprising Reynolds Blue Chip Growth Fund, as of September 30, 2009, and the related statements of operations and changes in net assets, and financial highlights for the year then ended. These financial statements and financial highlights are the responsibility of Fund management. Our responsibility is to express an opinion on these financial statements and financial highlights based on our audit. The statement of changes in net assets for the year ended September 30, 2008 and financial highlights for the years indicated prior to September 30, 2009, were audited by another independent registered public accounting firm, who expressed an unqualified opinion on those statements and highlights.
We conducted our audit in accordance with the standards of the Public Company Accounting Oversight Board (United States). Those standards require that we plan and perform the audit to obtain reasonable assurance about whether the financial statements and financial highlights are free of material misstatement. An audit includes examining, on a test basis, evidence supporting the amounts and disclosures in the financial statements. Our procedures included confirmation of securities owned as of September 30, 2009 by correspondence with the Fund’s custodian and broker. An audit also includes assessing the accounting principles used and significant estimates made by management, as well as evaluating the overall financial statement presentation. We believe that our audit provides a reasonable basis for our opinion.
In our opinion, the financial statements and financial highlights referred to above present fairly, in all material respects, the financial position of Reynolds Funds, Inc. as of September 30, 2009, and the results of its operations, the changes in its net assets, and its financial highlights for the year then ended, in conformity with accounting principles generally accepted in the United States of America.

Westlake, Ohio
November 20, 2009
- 22 -
Reynolds Blue Chip Growth Fund
DIRECTORS AND OFFICERS
| Other | |||||
| Term of | # of Funds | Directorships | |||
| Position | Office and | in Complex | Held by | ||
| Name, Age | Held with | Length of | Principal Occupation(s) | Overseen | Director |
| and Address | the Fund | Time Served | During Past Five Years | by Director | or Officer |
| Non-Interested Directors: | |||||
| Dennis N. Moser, 67 | Director | Indefinite Term | Mr. Moser is a partner in Glenbrook Partner, | 1 | None |
| 77 Stockbridge | Since 2002 | LLC, a payments consulting firm. | |||
| Atherton, CA 94027 | |||||
| Robert E. Stauder, 79 | Director | Indefinite Term | Mr. Stauder is retired. He was a principal of | 1 | None |
| 436 Casabonne Lane | Since 1988 | Robinson Mills + Williams, an architectural | |||
| Sonoma, CA 95476 | and interior design firm, from 1991 until 1996. | ||||
| Interested Director: | |||||
| Frederick L. Reynolds,* 67 | Director, | Indefinite Term | Mr. Reynolds is the sole proprietor of | 1 | None |
| 2580 Kekaa Drive #115 | Since 1988 | the Adviser, which business commenced | |||
| Lahaina, HI 96761 | President | One Year Term | in 1985. | ||
| and | Since 1988 | ||||
| Treasurer | |||||
| Other Officers: | |||||
| N. Lynn Bowley, 51 | Chief | At Discretion | Mr. Bowley has been a Compliance Officer for | N/A | None |
| Northern Lights | Compliance | of Board | Northern Lights Compliance Services, LLC, | ||
| Compliance Services, LLC | Officer | Since 2007 | (f/k/a) Fund Compliance Services, LLC, since | ||
| 4020 S. 147th Street | 2007. From 2002 to 2006 he was Vice-President | ||||
| Omaha, NE 68137 | of Investment Support Services for Mutual of | ||||
| Omaha Companies. |
__________
| * | Mr. Reynolds is the only interested director of the Company as that term is defined in the Investment Company Act of 1940. Mr. Reynolds is an interested director of the Company by reason of his being an officer of the Company and the sole proprietor of the investment adviser. |
For additional information about the Directors and Officers or for a description of the policies and procedures that the Fund uses to determine how to vote proxies relating to portfolio securities, please call (800) 773-9665 and request a Statement of Additional Information. One will be mailed to you free of charge. The Statement of Additional Information is also available on the website of the Securities and Exchange Commission (the “Commission”) at http://www.sec.gov. Information on how the Fund voted proxies relating to portfolio securities is available on the Fund’s website at http://www.reynoldsfunds.com or the website of the Commission no later than August 31 for the prior 12 months ending June 30. The Fund files its complete schedule of portfolio holdings with the Commission for the first and third quarters of each fiscal year on Form N-Q. The Fund’s Form N-Q is available on the Commission’s website. The Fund’s Form N-Q may be reviewed and copied at the Commission’s Public Reference Room in Washington, D.C., and that information on the operation of the Public Reference Room may be obtained by calling 1-800-SEC-0330.
- 23 -
REYNOLDS BLUE CHIP GROWTH FUND
c/o U.S. BANCORP FUND SERVICES, LLC
615 East Michigan Street
Milwaukee, Wisconsin 53202
www.reynoldsfunds.com
Board of Directors
DENNIS N. MOSER
FREDERICK L. REYNOLDS
ROBERT E. STAUDER
Investment Adviser
REYNOLDS CAPITAL MANAGEMENT
2580 Kekaa Drive, #115
Lahaina, Hawaii 96761
Transfer Agent,
Dividend Disbursing Agent
and Administrator
U.S. BANCORP FUND SERVICES, LLC
615 East Michigan Street
Milwaukee, Wisconsin 53202
1-800-773-9665
or 1-800-7REYNOLDS
1-414-765-4124
Custodian
U.S. Bank, N.A.
1555 North RiverCenter Drive, Suite 302
Milwaukee, Wisconsin 53212
Independent Registered Public Accounting Firm
COHEN FUND AUDIT SERVICES, LTD.
800 Westpoint Parkway, Suite 1100
Westlake, Ohio 44145
Legal Counsel
FOLEY & LARDNER LLP
777 East Wisconsin Avenue
Milwaukee, Wisconsin 53202
Item 2. Code of Ethics.
Registrant has adopted a code of ethics. See attached Exhibit 12 (a) (1).
Item 3. Audit Committee Financial Expert.
Registrant’s Board of Directors has determined that it does not have an “audit committee financial expert” serving on its audit committee. While Registrant believes that each of the members of its audit committee has sufficient knowledge of accounting principles and financial statements to serve on the audit committee, none has the requisite experience to qualify as an “audit committee financial expert” as such term is defined by the Securities and Exchange Commission.
Item 4. Principal Accountant Fees and Services.
(a) Audit Fees
$15,600 (FY 2009) and $26,472 (FY 2008) are the aggregate fees billed for each of the last two fiscal years for professional services rendered by the principal accountant to the registrant for the audit of the registrant’s annual financial statements or services that are normally provided by the accountant in connection with statutory and regulatory filings or engagements for those fiscal years.
(b) Audit-Related Fees
There were no fees billed in the last two fiscal years for Audit-Related Fees.
| (c) | Tax Fees |
There were no fees billed in the last two fiscal years for professional services rendered by the principal accountant to the registrant for tax compliance, tax advice, tax planning and tax return preparation.
There were no fees billed in the last two fiscal years for professional services rendered by the principal accountant to registrant’s investment adviser for tax compliance, tax advice and tax planning that were required to be approved by the audit committee pursuant to paragraph (c)(7)(ii) of Rule 2-01 of Regulation S-X.
(d) All Other Fees
There were no fees billed in each the last two fiscal years for products and services provided by the principal accountant to the registrant, other than the services reported in paragraphs (a) – (c) of this Item 4.
There were no fees billed in the last two fiscal years for products and services provided by the principal accountant to registrant’s investment adviser, which were required to be approved by the audit committee pursuant to paragraph (c)(7)(ii) or Rule 2-01 or Regulation S-X.
(e) (1) None
(e) (2) None
(f) Not applicable.
(g) See the tax fees disclosed in paragraph (c) of this Item 4.
(h) Not applicable, as no non-audit services were provided to registrant’s investment adviser.
Item 5. Audit Committee of Listed Registrants.
Not applicable.
Item 6. Schedule of Investments.
(a) The Schedule of Investments in securities of unaffiliated issuers is included as part of the report to shareholders filed under Item 1 of this Form.
(b) Not applicable.
Item 7. Disclosure of Proxy Voting Policies and Procedures for Closed-End Management Investment Companies.
Not applicable.
Item 8. Portfolio Managers of Closed-End Management Investment Companies.
Not applicable.
Item 9. Purchases of Equity Securities By Closed-End Management Investment Company and Affiliated Purchasers.
Not applicable.
Item 10. Submission of Matters to a Vote of Security Holders.
None.
Item 11. Controls and Procedures.
| (a) | The disclosure controls and procedures of the Reynolds Funds, Inc. are periodically evaluated. As of September 30, 2009, the date of the last evaluation, we concluded that our disclosure controls and procedures are adequate. |
| (b) | The internal controls of the Reynolds Funds, Inc. are periodically evaluated. There were no changes to Reynolds Funds’ internal control over financial reporting that occurred during the second fiscal quarter of the period covered by this report that have materially affected, or are reasonably likely to materially affect, such controls. |
Item 12. Exhibits.
| (a) | (1) Any code of ethics or amendment thereto. Filed herewith. |
(2) Certifications pursuant to Section 302 of the Sarbanes-Oxley Act of 2002. Filed herewith.
(3) Any written solicitation to purchase securities under Rule 23c-1 under the Act sent or given during the period covered by the report by or on behalf of the Registrant to 10 or more persons. Not Applicable.
| (b) | Certification pursuant to Section 906 of the Sarbanes-Oxley Act of 2002. Furnished herewith. |
SIGNATURES
Pursuant to the requirements of the Securities Exchange Act of 1934 and the Investment Company Act of 1940, the registrant has duly caused this report to be signed on its behalf by the undersigned, thereunto duly authorized.
Reynolds Funds, Inc.
Registrant
By /s/Frederick L. Reynolds
Frederick L. Reynolds, Principal Executive Officer
Date November 24, 2009
Pursuant to the requirements of the Securities Exchange Act of 1934 and the Investment Company Act of 1940, this report has been signed below by the following persons on behalf of the registrant and in the capacities and on the dates indicated.
Reynolds Funds, Inc.
Registrant
By /s/Frederick L. Reynolds
Frederick L. Reynolds, Principal Financial Officer
Date November 24, 2009