UNITED STATES
SECURITIES AND EXCHANGE COMMISSION
Washington, D.C. 20549
FORM N-CSR
CERTIFIED SHAREHOLDER REPORT OF REGISTERED MANAGEMENT INVESTMENT COMPANIES
| | |
| |
Investment Company Act file number: | | 811-05594 |
| |
Exact name of registrant as specified in charter: | | Prudential Short-Term Corporate Bond Fund, Inc. |
| |
Address of principal executive offices: | | 655 Broad Street, 17th Floor Newark, New Jersey 07102 |
| |
Name and address of agent for service: | | Andrew R. French 655 Broad Street, 17th Floor Newark, New Jersey 07102 |
| |
Registrant’s telephone number, including area code: | | 800-225-1852 |
| |
Date of fiscal year end: | | 12/31/2021 |
| |
Date of reporting period: | | 12/31/2021 |
Item 1 – Reports to Stockholders

PGIM SHORT-TERM CORPORATE BOND FUND
ANNUAL REPORT
DECEMBER 31, 2021

To enroll in e-delivery, go to pgim.com/investments/resource/edelivery
Table of Contents
This report is not authorized for distribution to prospective investors unless preceded or accompanied by a current prospectus.
The views expressed in this report and information about the Fund’s portfolio holdings are for the period covered by this report and are subject to change thereafter.
Mutual funds are distributed by Prudential Investment Management Services LLC (PIMS), member SIPC. PGIM Fixed Income is a unit of PGIM, Inc. (PGIM), a registered investment adviser. PIMS and PGIM are Prudential Financial companies. © 2022 Prudential Financial, Inc. and its related entities. PGIM and the PGIM logo are service marks of Prudential Financial, Inc. and its related entities, registered in many jurisdictions worldwide.
| | |
| 2 | | Visit our website at pgim.com/investments |
Letter from the President
| | |
 | | Dear Shareholder: We hope you find the annual report for the PGIM Short-Term Corporate Bond Fund informative and useful. The report covers performance for the 12-month period ended December 31, 2021. The global economy and markets continued to recover throughout the period from the ongoing impact of the COVID-19 pandemic. The Federal Reserve (the Fed) slashed interest rates and kept them near zero to encourage borrowing. |
| | Congress passed stimulus bills worth several trillion dollars to help consumers and businesses. And several effective |
vaccines received regulatory approval. Those measures were enough to offset the fear of rising inflation, supply-chain challenges, and COVID-19 variants that threatened to disrupt growth.
At the start of the period, stocks had recovered most of the steep losses they had suffered at the onset of the pandemic. Equities rallied as states reopened their economies but became more volatile as investors worried that a surge in COVID-19 infections would stall the recovery. However, rising corporate profits and economic growth, along with the global rollout of approved vaccines, lifted equity markets to record levels and helped most stocks around the globe post gains for the full period.
While investors sought safety in fixed income early in the period, they turned cautious later due to concerns about higher inflation and the Fed reducing its bond-buying programs. During the period, investment-grade bonds in the US and the overall global bond market, along with emerging market debt, posted negative returns. US high yield corporate bonds posted gains.
Regarding your investments with PGIM, we believe it is important to maintain a diversified portfolio of funds consistent with your tolerance for risk, time horizon, and financial goals. Your financial advisor can help you create a diversified investment plan that may include funds covering all the basic asset classes and that reflects your personal investor profile and risk tolerance. However, diversification and asset allocation strategies do not assure a profit or protect against loss in declining markets.
At PGIM Investments, we consider it a great privilege and responsibility to help investors participate in opportunities across global markets while meeting their toughest investment challenges. PGIM is a top-10 global investment manager with more than $1.5 trillion in assets under management. This scale and investment expertise allow us to deliver actively managed funds and strategies to meet the needs of investors around the globe.
Thank you for choosing our family of funds.
Sincerely,

Stuart S. Parker, President
PGIM Short-Term Corporate Bond Fund
February 15, 2022
| | | | |
PGIM Short-Term Corporate Bond Fund | | | 3 | |
Your Fund’s Performance (unaudited)
Performance data quoted represent past performance. Past performance does not guarantee future results. The investment return and principal value of an investment will fluctuate so that an investor’s shares, when redeemed, may be worth more or less than their original cost. Current performance may be lower or higher than the past performance data quoted. An investor may obtain performance data as of the most recent month-end by visiting our website at pgim.com/investments or by calling (800) 225-1852.
| | | | | | | | | | | | | | |
| |
| | | Average Annual Total Returns as of 12/31/21 | |
| | | | |
| | | One Year (%) | | Five Years (%) | | | Ten Years (%) | | | Since Inception (%) | |
| | | | |
| Class A | | | | | | | | | | | | | | |
| | | | |
| (with sales charges) | | -2.79 | | | 2.16 | | | | 2.16 | | | | — | |
| | | | |
| (without sales charges) | | -0.56 | | | 2.62 | | | | 2.39 | | | | — | |
| | | | |
| Class C | | | | | | | | | | | | | | |
| | | | |
| (with sales charges) | | -2.29 | | | 1.89 | | | | 1.64 | | | | — | |
| | | | |
| (without sales charges) | | -1.31 | | | 1.89 | | | | 1.64 | | | | — | |
| | | | |
| Class R | | | | | | | | | | | | | | |
| | | | |
| (without sales charges) | | -0.99 | | | 2.30 | | | | 2.10 | | | | — | |
| | | | |
| Class Z | | | | | | | | | | | | | | |
| | | | |
| (without sales charges) | | -0.41 | | | 2.87 | | | | 2.65 | | | | — | |
| | | | |
| Class R2 | | | | | | | | | | | | | | |
| | | | |
| (without sales charges) | | -0.81 | | | N/A | | | | N/A | | | | 2.66 (12/27/2017) | |
| | | | |
| Class R4 | | | | | | | | | | | | | | |
| | | | |
| (without sales charges) | | -0.47 | | | N/A | | | | N/A | | | | 2.92 (12/27/2017) | |
| | | | |
| Class R6 | | | | | | | | | | | | | | |
| | | | |
| (without sales charges) | | -0.31 | | | 2.98 | | | | N/A | | | | 2.58 (03/02/2012) | |
| | | | |
| Bloomberg 1–5 Year US Credit Index | | | | | | | | | | | | | | |
| | | | |
| | | -0.55 | | | 2.90 | | | | 2.68 | | | | — | |
| | | | | | | | | | | | | | |
|
| Average Annual Total Returns as of 12/31/21 Since Inception (%) | |
| | | | | | | | Class R2, Class R4
(12/27/2017) | | | Class R6
(03/02/2012) | |
| | | | |
| Bloomberg 1–5 Year US Credit Index | | | | | | | | | 3.04 | | | | 2.51 | |
Since Inception returns are provided for any share class with less than 10 fiscal years of returns. Since Inception returns for the Index are measured from the closest month-end to the class’ inception date.
| | |
| 4 | | Visit our website at pgim.com/investments |
Growth of a $10,000 Investment (unaudited)
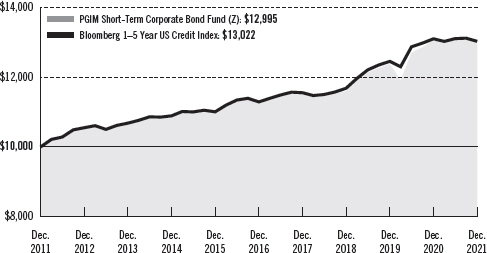
The graph compares a $10,000 investment in the Fund’s Class Z shares with a similar investment in the Bloomberg 1–5 Year US Credit Index by portraying the initial account values at the beginning of the 10-year period for Class Z shares (December 31, 2011) and the account values at the end of the current fiscal year (December 31, 2021), as measured on a quarterly basis. For purposes of the graph, and unless otherwise indicated, it has been assumed that (a) all recurring fees (including management fees) were deducted and (b) all dividends and distributions were reinvested. The line graph provides information for Class Z shares only. As indicated in the tables provided earlier, performance for other share classes will vary, due to the differing charges and expenses applicable to each share class (as indicated in the following paragraphs). Without waiver of fees and/or expense reimbursements, if any, the returns would have been lower.
Past performance does not predict future performance. Total returns and the ending account values in the graph include changes in share price and reinvestment of dividends and capital gains distributions in a hypothetical investment for the periods shown. The Fund’s total returns do not reflect the deduction of income taxes on an individual’s investment. Taxes may reduce your actual investment returns on income or gains paid by the Fund or any gains you may realize if you sell your shares.
| | | | |
PGIM Short-Term Corporate Bond Fund | | | 5 | |
Your Fund’s Performance (continued)
The returns in the tables do not reflect the deduction of taxes that a shareholder would pay on Fund distributions or following the redemption of Fund shares. The average annual total returns take into account applicable sales charges, which are described for each share class in the table below.
| | | | | | | | | | | | | | |
| | | | | | | | |
| | | Class A | | Class C | | Class R | | Class Z | | Class R2 | | Class R4 | | Class R6 |
| Maximum initial sales charge | | 2.25% of the public offering price | | None | | None | | None | | None | | None | | None |
| Contingent deferred sales charge (CDSC) (as a percentage of the lower of the original purchase price or the net asset value at redemption) | | 1.00% on sales of $500,000 or more made within 12 months of purchase | | 1.00% on sales made within 12 months of purchase | | None | | None | | None | | None | | None |
| Annual distribution or distribution and service (12b-1) fees (shown as a percentage of average daily net assets) | | 0.25% | | 1.00% | | 0.75% (0.50% currently) | | None | | 0.25% | | None | | None |
| Shareholder service fees | | None | | None | | None | | None | | 0.10%* | | 0.10%* | | None |
*Shareholder service fee reflects maximum allowable fees under a shareholder services plan.
Benchmark Definitions
Bloomberg 1–5 Year US Credit Index—The Bloomberg 1–5 Year US Credit Index is an unmanaged index of publicly issued US corporate and specified foreign debentures and secured notes that meet specific maturity (between one and five years), liquidity, and quality requirements. It gives an indication of how short- and intermediate-term bonds have performed.
Investors cannot invest directly in an index. The returns for the Index would be lower if they included the effects of sales charges, operating expenses of a mutual fund, or taxes that may be paid by an investor.
| | |
| 6 | | Visit our website at pgim.com/investments |
| | | | | | |
|
| Distributions and Yields as of 12/31/21 |
| | Total Distributions
Paid for 12 Months ($) | | SEC 30-Day
Subsidized Yield* (%) | | SEC 30-Day
Unsubsidized
Yield** (%) |
| | | |
| Class A | | 0.22 | | 1.04 | | 1.02 |
| | | |
| Class C | | 0.13 | | 0.24 | | 0.23 |
| | | |
| Class R | | 0.18 | | 0.65 | | 0.38 |
| | | |
| Class Z | | 0.24 | | 1.18 | | 1.10 |
| | | |
| Class R2 | | 0.20 | | 0.77 | | 3.38 |
| | | |
| Class R4 | | 0.23 | | 1.02 | | 7.52 |
| | | |
| Class R6 | | 0.25 | | 1.27 | | 1.25 |
*SEC 30-Day Subsidized Yield (%)—A standardized yield calculation created by the Securities and Exchange Commission, it reflects the income earned during a 30-day period, after the deduction of the Fund’s net expenses (net of any expense waivers or reimbursements). The investor experience is represented by the SEC 30-Day Subsidized Yield.
**SEC 30-Day Unsubsidized Yield (%)—A standardized yield calculation created by the Securities and Exchange Commission, it reflects the income earned during a 30-day period, after the deduction of the Fund’s gross expenses. The investor experience is represented by the SEC 30-Day Subsidized Yield.
| | | | |
|
| Credit Quality expressed as a percentage of total investments as of 12/31/21 (%) | |
| |
| AAA | | | 15.1 | |
| |
| AA | | | 9.3 | |
| |
| A | | | 24.1 | |
| |
| BBB | | | 45.1 | |
| |
| BB | | | 3.6 | |
| |
| Not Rated | | | 0.9 | |
| |
| Cash/Cash Equivalents | | | 1.9 | |
| | |
| Total | | | 100.0 | |
Credit ratings reflect the highest rating assigned by a nationally recognized statistical rating organization (NRSRO) such as Moody’s Investors Service, Inc. (Moody’s), S&P Global Ratings (S&P), or Fitch, Inc. (Fitch). Credit ratings reflect the common nomenclature used by both S&P and Fitch. Where applicable, ratings are converted to the comparable S&P/Fitch rating tier nomenclature. These rating agencies are independent and are widely used. The Not Rated category consists of securities that have not been rated by an NRSRO. Credit ratings are subject to change.
| | | | |
PGIM Short-Term Corporate Bond Fund | | | 7 | |
Strategy and Performance Overview (unaudited)
How did the Fund perform?
The PGIM Short-Term Corporate Bond Fund’s Class Z shares returned –0.41% in the 12-month reporting period that ended December 31, 2021, outperforming the –0.55% return of the Bloomberg 1–5 Year US Credit Index (the Index).
How did the short-term US investment-grade corporate bond sector perform?
| • | | The short-term investment-grade corporate bond sector, as measured by the Index, outperformed the broader credit market on a total return basis in the reporting period, posting a return of –0.55%, but it underperformed on an excess return basis, generating excess returns of 0.50% over US Treasuries. US corporate bonds of all durations, as measured by the Bloomberg Credit Index, returned –1.08% for the period, with an excess return to US Treasuries of 1.51%. Duration measures the sensitivity of the price (the value of principal) of a bond to a change in interest rates. |
| • | | Short-term corporate bonds outperformed the broader credit market in the first quarter of the period, as US corporate bonds generally delivered negative total returns. US Treasury yields rose sharply amid fears that renewed economic growth could lead to higher inflation. Outside of the inflation scare, fundamentals remained healthy, with management teams continuing to reduce expenses, pause share buybacks, and improve free cash flow. Technicals also remained favorable, with strong investor demand from yield-seeking US investors, as well as non-US investors, offsetting higher-than-expected issuance. |
| • | | US corporate bonds performed well in the second quarter of the period, supported by better-than-expected corporate earnings, positive COVID-19 vaccination progress, favorable credit fundamentals, an accommodative Federal Reserve (Fed), and a solid technical backdrop driven by strong demand and positive net flows. Technicals remained strong amid steady demand, which included buying from overseas investors and pensions, supported by a monetary system flush with cash, dwindling alternatives offering enhanced yields, and accommodative central banks. Meanwhile, demand for new issue remained elevated in light of reduced net issuance. |
| • | | US corporate bonds remained largely range-bound in the third quarter of the period, with spreads widening slightly, as the market faced growing concerns around the COVID-19 Delta variant, a slower growth outlook, the prospect of the Fed announcing a tapering of its monthly bond purchases, and stress in the Chinese property sector. (Corporate spreads are the yield differential between a corporate bond and a US Treasury security of the same maturity.) Still, the market remained supported by solid corporate earnings, favorable credit fundamentals, and a solid technical backdrop driven by strong demand and positive net flows that readily absorbed the heavy pace of new issues. By quality, BBB-rated bonds outperformed their higher-rated peers given the benefit of higher carry in the range-bound environment for spreads as well as shorter duration, on average, than higher-quality buckets. Fundamentals remained solid, with leverage back to pre-pandemic levels, above-trend earnings growth, and positive ratings trajectories. |
| | |
| 8 | | Visit our website at pgim.com/investments |
| • | | US corporate bonds underperformed in the fourth quarter of the period amid dealer balance sheet unwinds into year end, concerns around the COVID-19 Omicron variant, elevated corporate new primary issuance, and increased Fed hawkishness, with most of the spread widening occurring in November as long-end Treasury yields declined. Technicals remained solid, with steady demand supported by ongoing monetary policy stimulus and over $14 trillion of negative-yielding debt around the world. For the full period, mutual fund inflows totaled approximately $321 billion. Meanwhile, the primary market remained active, with more-than-typical December supply bringing full-year 2021 issuance to $1.4 trillion. While down 22% from the record hit in 2020, 2021 supply was up 26% from 2019. Fundamentals continued to improve, with revenue and earnings before interest, taxes, depreciation, and amortization (EBITDA) moving in a positive direction. Despite some initial signs that inflation was beginning to have an impact, profit margins also improved. Leverage of around three times was slightly lower than pre-pandemic levels. |
What worked?
| • | | The Fund continued to make modest allocations to out-of-Index fixed income sectors to diversify away from short-term investment-grade corporate bonds and to add incremental yield. The Fund’s out-of-Index exposure to short-duration, high-quality, high yield bonds was the largest contributor to performance during the period. |
| • | | The Fund’s overweight relative to the Index and security selection within investment-grade corporates, along with allocations to AAA-rated collateralized loan obligations and commercial mortgage-backed securities, also contributed to performance. Security selection within emerging markets was also a contributor. |
| • | | Within credit, security selection in upstream and midstream energy, foreign non-corporates, automotive, real estate investment trusts, and electric utilities added to performance. Overweights relative to the Index to Petroleos Mexicanos (foreign non-corporate), Occidental Petroleum Corp. (upstream energy), and Broadcom Inc. (technology) were among the top single-name contributors to performance. |
What didn’t work?
| • | | While overall security selection was positive for the period, security selection in Treasuries detracted from results. An underweight relative to the Index to emerging markets was also modestly negative. |
| • | | Within credit, positioning in finance companies detracted from performance. Overweights to Citigroup Inc. (banking) and IHS Markit Ltd. (technology) limited results. |
Did the Fund use derivatives?
The Fund utilized US Treasury futures to hedge interest rate risk relative to the Index to help immunize any impact from fluctuations in interest rates, which is more efficient than managing interest rate risk through the purchases and sales of cash corporate bonds. Overall, relative to the Index, security selection in Treasury futures detracted from performance for the reporting period.
| | | | |
PGIM Short-Term Corporate Bond Fund | | | 9 | |
Strategy and Performance Overview (continued)
Current outlook
| • | | Expectations are for modestly wider spreads by year-end as the fundamental backdrop becomes less favorable. Spreads remain close to their post-financial-crisis tights, supported by low default rates, strong demand, and attractive yields relative to many high-quality alternatives. Leverage should continue to decline with additional EBITDA growth, in PGIM Fixed Income’s view, with earnings growth moderating to about 10%. The rating agencies tend to lag improvement in credit fundamentals; thus, the positive ratings trend should continue, with rising stars potentially reaching more than $100 billion over the next 12 to 18 months. |
| • | | PGIM Fixed Income sees potential risks to the investment-grade market from rising geopolitical risks (especially regarding China and Russia), inflation concerns, higher US Treasury yields, an increase in merger-and-acquisition activity, an equity market correction, more shareholder-friendly management behavior, and less accommodative central banks. |
| • | | PGIM Fixed Income is looking to capitalize on the additional carry afforded by select higher-yielding BBB-rated bonds, solid credits in stressed industries, select improving cyclicals, and “off-the-run” bonds, and it favors more defensive financials and electric utilities over higher-quality industrials. (Newly issued securities are considered to be “on-the-run,” while older securities already issued and outstanding are referred to as “off-the-run.”). |
| • | | Within industrials, PGIM Fixed Income favors BBB-rated issuers that are focused on preserving or improving credit metrics over their higher-quality peers, which may be more likely to pursue aggressive financial policies at the expense of the balance sheet. PGIM Fixed Income is also optimistic on BBB-rated energy bonds, as the sector should continue to benefit from globally strengthening oil and natural gas demand. |
| | |
| 10 | | Visit our website at pgim.com/investments |
Fees and Expenses (unaudited)
As a shareholder of the Fund, you incur two types of costs: (1) transaction costs, including sales charges (loads) on purchase payments and redemptions, as applicable, and (2) ongoing costs, including management fees, distribution and/or service (12b-1) fees, and other Fund expenses, as applicable. This example is intended to help you understand your ongoing costs (in dollars) of investing in the Fund and to compare these costs with the ongoing costs of investing in other mutual funds.
The example is based on an investment of $1,000 held through the six-month period ended December 31, 2021. The example is for illustrative purposes only; you should consult the Prospectus for information on initial and subsequent minimum investment requirements.
Actual Expenses
The first line for each share class in the table on the following page provides information about actual account values and actual expenses. You may use the information on this line, together with the amount you invested, to estimate the expenses that you paid over the period. Simply divide your account value by $1,000 (for example, an $8,600 account value ÷ $1,000 = 8.6), then multiply the result by the number on the first line under the heading “Expenses Paid During the Six-Month Period” to estimate the expenses you paid on your account during this period.
Hypothetical Example for Comparison Purposes
The second line for each share class in the table on the following page provides information about hypothetical account values and hypothetical expenses based on the Fund’s actual expense ratio and an assumed rate of return of 5% per year before expenses, which is not the Fund’s actual return. The hypothetical account values and expenses may not be used to estimate the actual ending account balance or expenses you paid for the period. You may use this information to compare the ongoing costs of investing in the Fund and other funds. To do so, compare this 5% hypothetical example with the 5% hypothetical examples that appear in the shareholder reports of the other funds.
The Fund’s transfer agent may charge additional fees to holders of certain accounts that are not included in the expenses shown in the table on the following page. These fees apply to individual retirement accounts (IRAs) and Section 403(b) accounts. As of the close of the six-month period covered by the table, IRA fees included an annual maintenance fee of $15 per account (subject to a maximum annual maintenance fee of $25 for all accounts held by the same shareholder). Section 403(b) accounts are charged an annual $25 fiduciary maintenance fee. Some of the fees may vary in amount, or may be waived, based on your total account balance or the number of PGIM funds, including the Fund, that you own. You should consider the additional fees that were charged to your Fund account over the six-month period when you estimate the total ongoing expenses paid over the period and the impact of these fees on your ending account value, as these additional expenses are not reflected in the information
| | | | |
PGIM Short-Term Corporate Bond Fund | | | 11 | |
Fees and Expenses (continued)
provided in the expense table. Additional fees have the effect of reducing investment returns.
Please note that the expenses shown in the table are meant to highlight your ongoing costs only and do not reflect any transactional costs such as sales charges (loads). Therefore, the second line for each share class in the table is useful in comparing ongoing costs only and will not help you determine the relative total costs of owning different funds. In addition, if these transactional costs were included, your costs would have been higher.
| | | | | | | | | | |
| | | | |
PGIM Short-Term Corporate
Bond Fund | | Beginning
Account Value
July 1, 2021 | | Ending
Account Value
December 31, 2021 | | Annualized
Expense
Ratio Based on
the
Six-Month Period | | Expenses Paid
During the
Six-Month
Period* |
| | | | | |
Class A | | Actual | | $1,000.00 | | $ 994.42 | | 0.66% | | $3.32 |
| | | | | |
| | Hypothetical | | $1,000.00 | | $1,021.88 | | 0.66% | | $3.36 |
| | | | | |
Class C | | Actual | | $1,000.00 | | $ 990.46 | | 1.45% | | $7.27 |
| | | | | |
| | Hypothetical | | $1,000.00 | | $1,017.90 | | 1.45% | | $7.38 |
| | | | | |
Class R | | Actual | | $1,000.00 | | $ 991.59 | | 1.05% | | $5.27 |
| | | | | |
| | Hypothetical | | $1,000.00 | | $1,019.91 | | 1.05% | | $5.35 |
| | | | | |
Class Z | | Actual | | $1,000.00 | | $ 994.51 | | 0.47% | | $2.36 |
| | | | | |
| | Hypothetical | | $1,000.00 | | $1,022.84 | | 0.47% | | $2.40 |
| | | | | |
Class R2 | | Actual | | $1,000.00 | | $ 992.49 | | 0.88% | | $4.42 |
| | | | | |
| | Hypothetical | | $1,000.00 | | $1,020.77 | | 0.88% | | $4.48 |
| | | | | |
Class R4 | | Actual | | $1,000.00 | | $ 993.74 | | 0.63% | | $3.17 |
| | | | | |
| | Hypothetical | | $1,000.00 | | $1,022.03 | | 0.63% | | $3.21 |
| | | | | |
Class R6 | | Actual | | $1,000.00 | | $ 994.98 | | 0.38% | | $1.91 |
| | | | | |
| | | Hypothetical | | $1,000.00 | | $1,023.29 | | 0.38% | | $1.94 |
*Fund expenses (net of fee waivers or subsidies, if any) for each share class are equal to the annualized expense ratio for each share class (provided in the table), multiplied by the average account value over the period, multiplied by the 184 days in the six-month period ended December 31, 2021, and divided by the 365 days in the Fund’s fiscal year ended December 31, 2021 (to reflect the six-month period). Expenses presented in the table include the expenses of any underlying portfolios in which the Fund may invest.
| | |
| 12 | | Visit our website at pgim.com/investments |
Schedule of Investments
as of December 31, 2021
| | | | | | | | | | | | | | | | |
| | | | |
Description | | Interest
Rate | | | Maturity
Date | | | Principal
Amount
(000)# | | | Value | |
| | | | |
LONG-TERM INVESTMENTS 97.5% | | | | | | | | | | | | | | | | |
| | | | |
ASSET-BACKED SECURITIES 12.5% | | | | | | | | | | | | | | | | |
| | | | |
Collateralized Loan Obligations | | | | | | | | | | | | | | | | |
| | | | |
Allegro CLO Ltd. (Cayman Islands), | | | | | | | | | | | | | | | | |
Series 2018-02A, Class A, 144A, 3 Month LIBOR + 1.100% (Cap N/A, Floor 1.100%) | | | 1.224%(c) | | | | 07/15/31 | | | | 5,000 | | | $ | 4,998,485 | |
Anchorage Capital CLO Ltd. (Cayman Islands), | | | | | | | | | | | | | | | | |
Series 2013-01A, Class A1R, 144A, 3 Month LIBOR + 1.250% (Cap N/A, Floor 0.000%) | | | 1.371(c) | | | | 10/13/30 | | | | 5,000 | | | | 5,002,710 | |
Atlas Senior Loan Fund Ltd. (Cayman Islands), | | | | | | | | | | | | | | | | |
Series 2016-07A, Class A1R2, 144A, 3 Month LIBOR + 1.100% (Cap N/A, Floor 1.100%) | | | 1.276(c) | | | | 11/27/31 | | | | 65,000 | | | | 64,957,951 | |
Series 2018-11A, Class A1L, 144A, 3 Month LIBOR + 1.100% (Cap N/A, Floor 0.000%) | | | 1.225(c) | | | | 07/26/31 | | | | 10,000 | | | | 9,997,041 | |
Bain Capital Credit CLO Ltd. (Cayman Islands), | | | | | | | | | | | | | | | | |
Series 2019-02A, Class AR, 144A, 3 Month LIBOR + 1.100% (Cap N/A, Floor 1.100%) | | | 1.222(c) | | | | 10/17/32 | | | | 50,000 | | | | 49,980,770 | |
Battalion CLO Ltd., | | | | | | | | | | | | | | | | |
Series 2018-12A, Class A1, 144A, 3 Month LIBOR + 1.070% (Cap N/A, Floor 1.070%) | | | 1.228(c) | | | | 05/17/31 | | | | 14,000 | | | | 13,991,921 | |
Canyon Capital CLO Ltd. (Cayman Islands), | | | | | | | | | | | | | | | | |
Series 2019-01A, Class A1R, 144A, 3 Month LIBOR + 1.100% (Cap N/A, Floor 1.100%) | | | 1.224(c) | | | | 04/15/32 | | | | 45,000 | | | | 44,969,603 | |
Carlyle Global Market Strategies CLO Ltd. (Cayman Islands), | | | | | | | | | | | | | | | | |
Series 2015-04A, Class A1R, 144A, 3 Month LIBOR + 1.340% (Cap N/A, Floor 0.000%) | | | 1.472(c) | | | | 07/20/32 | | | | 32,500 | | | | 32,506,035 | |
Series 2015-05A, Class A1RR, 144A, 3 Month LIBOR + 1.080% (Cap N/A, Floor 1.080%) | | | 1.212(c) | | | | 01/20/32 | | | | 43,000 | | | | 42,985,247 | |
CBAM Ltd. (Cayman Islands), | | | | | | | | | | | | | | | | |
Series 2020-12A, Class AR, 144A, 3 Month LIBOR + 1.180% (Cap N/A, Floor 1.180%) | | | 1.312(c) | | | | 07/20/34 | | | | 19,500 | | | | 19,499,963 | |
CIFC Funding Ltd. (Cayman Islands), | | | | | | | | | | | | | | | | |
Series 2013-03RA, Class A1, 144A, 3 Month LIBOR + 0.980% (Cap N/A, Floor 0.980%) | | | 1.104(c) | | | | 04/24/31 | | | | 18,150 | | | | 18,139,898 | |
Series 2017-02A, Class AR, 144A, 3 Month LIBOR + 0.950% (Cap N/A, Floor 0.950%) | | | 1.082(c) | | | | 04/20/30 | | | | 99,000 | | | | 98,961,598 | |
Crown City CLO (Cayman Islands), | | | | | | | | | | | | | | | | |
Series 2020-01A, Class A1AR, 144A, 3 Month LIBOR + 1.190% (Cap N/A, Floor 1.190%) | | | 1.322(c) | | | | 07/20/34 | | | | 60,000 | | | | 59,966,574 | |
Elevation CLO Ltd. (Cayman Islands), | | | | | | | | | | | | | | | | |
Series 2014-02A, Class A1R, 144A, 3 Month LIBOR + 1.230% (Cap N/A, Floor 0.000%) | | | 1.354(c) | | | | 10/15/29 | | | | 10,000 | | | | 10,000,184 | |
See Notes to Financial Statements.
| | | | |
| PGIM Short-Term Corporate Bond Fund | | | 13 | |
Schedule of Investments (continued)
as of December 31, 2021
| | | | | | | | | | | | | | | | |
| | | | |
Description | | Interest
Rate | | | Maturity
Date | | | Principal
Amount
(000)# | | | Value | |
| | | | |
ASSET-BACKED SECURITIES (Continued) | | | | | | | | | | | | | | | | |
| | | | |
Collateralized Loan Obligations (cont’d.) | | | | | | | | | | | | | | | | |
| | | | |
Elevation CLO Ltd. (Cayman Islands), (cont’d.) | | | | | | | | | | | | | | | | |
Series 2017-06A, Class A1, 144A, 3 Month LIBOR + 1.280% (Cap N/A, Floor 0.000%) | | | 1.404%(c) | | | | 07/15/29 | | | | 20,000 | | | $ | 19,996,850 | |
Elmwood CLO Ltd. (Cayman Islands), | | | | | | | | | | | | | | | | |
Series 2019-01A, Class AR, 144A, 3 Month LIBOR + 1.450% (Cap N/A, Floor 1.450%) | | | 1.582(c) | | | | 10/20/33 | | | | 17,500 | | | | 17,521,175 | |
HPS Loan Management Ltd. (Cayman Islands), | | | | | | | | | | | | | | | | |
Series 10A-16, Class A1RR, 144A, 3 Month LIBOR + 1.140% (Cap N/A, Floor 1.140%) | | | 1.272(c) | | | | 04/20/34 | | | | 49,000 | | | | 48,975,769 | |
Jamestown CLO Ltd. (Cayman Islands), | | | | | | | | | | | | | | | | |
Series 2019-14A, Class A1AR, 144A, 3 Month LIBOR + 1.200% (Cap N/A, Floor 1.200%) | | | 1.332(c) | | | | 10/20/34 | | | | 50,000 | | | | 50,009,315 | |
Madison Park Funding Ltd. (Cayman Islands), | | | | | | | | | | | | | | | | |
Series 2018-30A, Class A, 144A, 3 Month LIBOR + 0.750% (Cap N/A, Floor 0.750%) | | | 0.874(c) | | | | 04/15/29 | | | | 10,245 | | | | 10,242,049 | |
Series 2019-34A, Class AR, 144A, 3 Month LIBOR + 1.120% (Cap N/A, Floor 1.120%) | | | 1.244(c) | | | | 04/25/32 | | | | 53,375 | | | | 53,337,184 | |
Marathon CLO Ltd. (Cayman Islands), | | | | | | | | | | | | | | | | |
Series 2020-15A, Class A1S, 144A, 3 Month LIBOR + 1.700% (Cap N/A, Floor 1.700%) | | | 1.856(c) | | | | 11/15/31 | | | | 35,000 | | | | 35,170,555 | |
MidOcean Credit CLO (Cayman Islands), | | | | | | | | | | | | | | | | |
Series 2014-03A, Class A1R, 144A, 3 Month LIBOR + 1.120% (Cap N/A, Floor 1.120%) | | | 1.250(c) | | | | 04/21/31 | | | | 29,645 | | | | 29,644,374 | |
Northwoods Capital Ltd. (Cayman Islands), | | | | | | | | | | | | | | | | |
Series 2017-15A, Class A1R, 144A, 3 Month LIBOR + 1.210% (Cap N/A, Floor 1.210%) | | | 1.424(c) | | | | 06/20/34 | | | | 40,000 | | | | 40,012,868 | |
Series 2020-22A, Class A1, 144A, 3 Month LIBOR + 1.920% (Cap N/A, Floor 1.920%) | | | 2.091(c) | | | | 09/01/31 | | | | 18,000 | | | | 18,024,818 | |
Oaktree CLO Ltd. (Cayman Islands), | | | | | | | | | | | | | | | | |
Series 2019-01A, Class A1R, 144A, 3 Month LIBOR + 1.110% (Cap N/A, Floor 1.110%) | | | 1.238(c) | | | | 04/22/30 | | | | 45,000 | | | | 44,998,290 | |
Ocean Trails CLO (Cayman Islands), | | | | | | | | | | | | | | | | |
Series 2019-07A, Class AR, 144A, 3 Month LIBOR + 1.010% (Cap N/A, Floor 1.010%) | | | 1.132(c) | | | | 04/17/30 | | | | 30,000 | | | | 29,999,961 | |
Octagon Investment Partners 31 LLC (Cayman Islands), | | | | | | | | | | | | | | | | |
Series 2017-01A, Class AR, 144A, 3 Month LIBOR + 1.050% (Cap N/A, Floor 1.050%) | | | 1.182(c) | | | | 07/20/30 | | | | 16,750 | | | | 16,746,617 | |
OZLM Ltd. (Cayman Islands), | | | | | | | | | | | | | | | | |
Series 2014-09A, Class A1A3, 144A, 3 Month LIBOR + 1.100% (Cap N/A, Floor 1.100%) | | | 1.232(c) | | | | 10/20/31 | | | | 75,000 | | | | 74,975,692 | |
Series 2015-11A, Class A1R, 144A, 3 Month LIBOR + 1.250% (Cap N/A, Floor 0.000%) | | | 1.382(c) | | | | 10/30/30 | | | | 34,622 | | | | 34,647,289 | |
See Notes to Financial Statements.
| | | | | | | | | | | | | | | | |
| | | | |
Description | | Interest
Rate | | | Maturity
Date | | | Principal
Amount
(000)# | | | Value | |
| | | | |
ASSET-BACKED SECURITIES (Continued) | | | | | | | | | | | | | | | | |
| | | | |
Collateralized Loan Obligations (cont’d.) | | | | | | | | | | | | | | | | |
| | | | |
Palmer Square CLO Ltd. (Cayman Islands), | | | | | | | | | | | | | | | | |
Series 2015-02A, Class A1R2, 144A, 3 Month LIBOR + 1.100% (Cap N/A, Floor 0.000%) | | | 1.232%(c) | | | | 07/20/30 | | | | 27,350 | | | $ | 27,336,399 | |
Series 2018-02A, Class A1A, 144A, 3 Month LIBOR + 1.100% (Cap N/A, Floor 0.000%) | | | 1.222(c) | | | | 07/16/31 | | | | 45,000 | | | | 45,000,967 | |
Regatta Funding Ltd. (Cayman Islands), | | | | | | | | | | | | | | | | |
Series 2017-01A, Class A, 144A, 3 Month LIBOR + 1.250% (Cap N/A, Floor 0.000%) | | | 1.372(c) | | | | 10/17/30 | | | | 35,000 | | | | 35,002,370 | |
Romark CLO Ltd. (Cayman Islands), | | | | | | | | | | | | | | | | |
Series 2018-02A, Class A1, 144A, 3 Month LIBOR + 1.175% (Cap N/A, Floor 1.175%) | | | 1.299(c) | | | | 07/25/31 | | | | 21,000 | | | | 21,000,006 | |
Signal Peak CLO Ltd. (Cayman Islands), | | | | | | | | | | | | | | | | |
Series 2018-05A, Class A, 144A, 3 Month LIBOR + 1.110% (Cap N/A, Floor 1.110%) | | | 1.234(c) | | | | 04/25/31 | | | | 10,000 | | | | 9,997,285 | |
Silver Creek CLO Ltd. (Cayman Islands), | | | | | | | | | | | | | | | | |
Series 2014-01A, Class AR, 144A, 3 Month LIBOR + 1.240% (Cap N/A, Floor 0.000%) | | | 1.372(c) | | | | 07/20/30 | | | | 19,708 | | | | 19,703,946 | |
Silver Rock CLO Ltd. (Cayman Islands), | | | | | | | | | | | | | | | | |
Series 2020-01A, Class A, 144A, 3 Month LIBOR + 1.650% (Cap N/A, Floor 1.650%) | | | 1.782(c) | | | | 10/20/31 | | | | 16,000 | | | | 16,024,795 | |
Sound Point CLO Ltd. (Cayman Islands), | | | | | | | | | | | | | | | | |
Series 2013-01A, Class A1R, 144A, 3 Month LIBOR + 1.070% (Cap N/A, Floor 1.070%) | | | 1.195(c) | | | | 01/26/31 | | | | 10,000 | | | | 9,997,402 | |
Series 2013-03RA, Class A, 144A, 3 Month LIBOR + 1.150% (Cap N/A, Floor 1.150%) | | | 1.272(c) | | | | 04/18/31 | | | | 21,243 | | | | 21,237,005 | |
Series 2014-03RA, Class A1R, 144A, 3 Month LIBOR + 1.070% (Cap N/A, Floor 1.070%) | | | 1.194(c) | | | | 10/23/31 | | | | 40,000 | | | | 39,987,128 | |
Series 2017-03A, Class A1R, 144A, 3 Month LIBOR + 0.980% (Cap N/A, Floor 0.980%) | | | 1.112(c) | | | | 10/20/30 | | | | 25,000 | | | | 24,988,003 | |
Series 2019-01A, Class AR, 144A, 3 Month LIBOR + 1.080% (Cap N/A, Floor 1.080%) | | | 1.212(c) | | | | 01/20/32 | | | | 60,000 | | | | 59,959,722 | |
Symphony CLO Ltd. (Cayman Islands), | | | | | | | | | | | | | | | | |
Series 2016-18A, Class A1RR, 144A, 3 Month LIBOR + 1.100% (Cap N/A, Floor 1.100%) | | | 1.229(c) | | | | 07/23/33 | | | | 45,000 | | | | 45,005,548 | |
TCW CLO Ltd. (Cayman Islands), | | | | | | | | | | | | | | | | |
Series 2017-01A, Class A1RR, 144A, 3 Month LIBOR + 1.180% (Cap N/A, Floor 1.180%) | | | 1.312(c) | | | | 10/29/34 | | | | 25,000 | | | | 24,999,985 | |
THL Credit Wind River CLO Ltd. (Cayman Islands), | | | | | | | | | | | | | | | | |
Series 2019-01A, Class AR, 144A, 3 Month LIBOR + 1.160% (Cap N/A, Floor 1.160%) | | | 1.292(c) | | | | 07/20/34 | | | | 39,500 | | | | 39,477,730 | |
See Notes to Financial Statements.
| | | | |
PGIM Short-Term Corporate Bond Fund | | | 15 | |
Schedule of Investments (continued)
as of December 31, 2021
| | | | | | | | | | | | | | | | |
| | | | |
Description | | Interest
Rate | | | Maturity
Date | | | Principal
Amount
(000)# | | | Value | |
|
ASSET-BACKED SECURITIES (Continued) | |
|
Collateralized Loan Obligations (cont’d.) | |
| | | | |
TICP CLO Ltd. (Cayman Islands), | | | | | | | | | | | | | | | | |
Series 2018-IA, Class A1, 144A, 3 Month LIBOR + 0.830% (Cap N/A, Floor 0.830%) | | | 0.955%(c) | | | | 04/26/28 | | | | 31,460 | | | $ | 31,453,529 | |
Tralee CLO Ltd. (Cayman Islands), | | | | | | | | | | | | | | | | |
Series 2021-07A, Class A1, 144A, 3 Month LIBOR + 1.320% (Cap N/A, Floor 1.320%) | | | 1.444(c) | | | | 04/25/34 | | | | 32,000 | | | | 32,033,782 | |
Trimaran Cavu Ltd. (Cayman Islands), | | | | | | | | | | | | | | | | |
Series 2019-01A, Class A1, 144A, 3 Month LIBOR + 1.460% (Cap N/A, Floor 1.460%) | | | 1.592(c) | | | | 07/20/32 | | | | 20,000 | | | | 20,029,932 | |
Trinitas CLO Ltd. (Cayman Islands), | | | | | | | | | | | | | | | | |
Series 2016-05A, Class ARR, 144A, 3 Month LIBOR + 1.030% (Cap N/A, Floor 1.030%) | | | 1.154(c) | | | | 10/25/28 | | | | 25,243 | | | | 25,232,009 | |
Venture CLO Ltd. (Cayman Islands), | | | | | | | | | | | | | | | | |
Series 2016-24A, Class ARR, 144A, 3 Month LIBOR + 0.900% (Cap N/A, Floor 0.900%) | | | 1.032(c) | | | | 10/20/28 | | | | 23,246 | | | | 23,238,862 | |
Voya CLO Ltd. (Cayman Islands), | | | | | | | | | | | | | | | | |
Series 2019-03A, Class AR, 144A, 3 Month LIBOR + 1.080% (Cap N/A, Floor 1.080%) | | | 1.193(c) | | | | 10/17/32 | | | | 25,000 | | | | 24,976,350 | |
Series 2020-02A, Class A1R, 144A, 3 Month LIBOR + 1.160% (Cap N/A, Floor 1.160%) | | | 1.284(c) | | | | 07/19/34 | | | | 30,000 | | | | 30,004,671 | |
Wellfleet CLO Ltd. (Cayman Islands), | | | | | | | | | | | | | | | | |
Series 2018-03A, Class A1A, 144A, 3 Month LIBOR + 1.250% (Cap N/A, Floor 1.250%) | | | 1.382(c) | | | | 01/20/32 | | | | 9,000 | | | | 9,002,039 | |
Whitebox CLO Ltd. (Cayman Islands), | | | | | | | | | | | | | | | | |
Series 2019-01A, Class ANAR, 144A, 3 Month LIBOR + 1.130% (Cap N/A, Floor 1.130%) | | | 1.254(c) | | | | 07/24/32 | | | | 30,500 | | | | 30,488,593 | |
Wind River CLO Ltd. (Cayman Islands), | | | | | | | | | | | | | | | | |
Series 2016-01KRA, Class A1R2, 144A, 3 Month LIBOR + 1.210% (Cap N/A, Floor 1.210%) | | | 1.334(c) | | | | 10/15/34 | | | | 25,000 | | | | 25,000,025 | |
Zais CLO Ltd. (Cayman Islands), | | | | | | | | | | | | | | | | |
Series 2017-02A, Class A, 144A, 3 Month LIBOR + 1.290% (Cap N/A, Floor 0.000%) | | | 1.414(c) | | | | 04/15/30 | | | | 24,432 | | | | 24,287,095 | |
| | | | | | | | | | | | | | | | |
| | | | |
TOTAL ASSET-BACKED SECURITIES
(cost $1,714,995,308) | | | | | | | | | | | | | | | 1,715,725,964 | |
| | | | | | | | | | | | | | | | |
|
COMMERCIAL MORTGAGE-BACKED SECURITIES 1.7% | |
Benchmark Mortgage Trust, | | | | | | | | | | | | | | | | |
Series 2020-IG03, Class A2, 144A | | | 2.475 | | | | 09/15/48 | | | | 66,200 | | | | 67,409,428 | |
Citigroup Commercial Mortgage Trust, | | | | | | | | | | | | | | | | |
Series 2016-C02, Class A3 | | | 2.575 | | | | 08/10/49 | | | | 12,800 | | | | 13,120,352 | |
See Notes to Financial Statements.
| | | | | | | | | | | | | | |
| | | | |
| Description | | Interest
Rate | | Maturity
Date | | | Principal
Amount
(000)# | | | Value | |
|
COMMERCIAL MORTGAGE-BACKED SECURITIES (Continued) | |
Commercial Mortgage Trust,
Series 2015-CR22, Class A3 | | 3.207% | | | 03/10/48 | | | | 27,750 | | | $ | 27,740,362 | |
Series 2015-DC01, Class A3 | | 3.219 | | | 02/10/48 | | | | 20,000 | | | | 19,993,718 | |
JPMBB Commercial Mortgage Securities Trust,
Series 2016-C01, Class A4 | | 3.311 | | | 03/15/49 | | | | 45,920 | | | | 48,427,482 | |
JPMorgan Chase Commercial Mortgage Securities Trust, | | | | | | | | | | | | | | |
Series 2016-JP03, Class A3 | | 2.523 | | | 08/15/49 | | | | 16,726 | | | | 16,764,998 | |
Morgan Stanley Bank of America Merrill Lynch Trust, | | | | | | | | | | | | | | |
Series 2016-C029, Class A3 | | 3.058 | | | 05/15/49 | | | | 10,148 | | | | 10,566,999 | |
Series 2016-C032, Class ASB | | 3.514 | | | 12/15/49 | | | | 6,898 | | | | 7,242,030 | |
Morgan Stanley Capital I Trust,
Series 2015-MS01, Class A3 | | 3.510 | | | 05/15/48 | | | | 7,575 | | | | 7,912,487 | |
Wells Fargo Commercial Mortgage Trust, | | | | | | | | | | | | | | |
Series 2015-NXS01, Class A3 | | 3.058 | | | 05/15/48 | | | | 5,791 | | | | 5,801,117 | |
Series 2016-BNK01, Class A2 | | 2.399 | | | 08/15/49 | | | | 10,436 | | | | 10,532,331 | |
| | | | | |
TOTAL COMMERCIAL MORTGAGE-BACKED SECURITIES
(cost $238,328,538) | | | | | | | | | | | | | 235,511,304 | |
| | | | | | | | | | | | | | |
| | | | |
CORPORATE BONDS 82.3% | | | | | | | | | | | | | | |
| | | | |
Aerospace & Defense 1.3% | | | | | | | | | | | | | | |
Boeing Co. (The), | | | | | | | | | | | | | | |
Sr. Unsec’d. Notes | | 1.167 | | | 02/04/23 | | | | 30,000 | | | | 30,005,053 | |
Sr. Unsec’d. Notes | | 2.700 | | | 02/01/27 | | | | 49,380 | | | | 50,342,565 | |
Sr. Unsec’d. Notes | | 4.508 | | | 05/01/23 | | | | 20,000 | | | | 20,864,405 | |
Sr. Unsec’d. Notes | | 4.875 | | | 05/01/25 | | | | 22,970 | | | | 25,153,725 | |
Sr. Unsec’d. Notes | | 7.950 | | | 08/15/24 | | | | 1,874 | | | | 2,166,413 | |
L3Harris Technologies, Inc.,
Sr. Unsec’d. Notes | | 3.850 | | | 06/15/23 | | | | 4,460 | | | | 4,634,179 | |
Raytheon Technologies Corp., | | | | | | | | | | | | | | |
Sr. Unsec’d. Notes | | 3.650 | | | 08/16/23 | | | | 405 | | | | 421,043 | |
Sr. Unsec’d. Notes | | 3.700 | | | 12/15/23 | | | | 4,380 | | | | 4,578,582 | |
Spirit AeroSystems, Inc.,
Sr. Sec’d. Notes(a) | | 3.850 | | | 06/15/26 | | | | 30,500 | | | | 31,315,872 | |
Teledyne Technologies, Inc.,
Gtd. Notes | | 2.250 | | | 04/01/28 | | | | 15,000 | | | | 15,056,169 | |
| | | | | | | | | | | | | | |
| | | | |
| | | | | | | | | | | | | 184,538,006 | |
| | | | |
Agriculture 1.3% | | | | | | | | | | | | | | |
Altria Group, Inc., | | | | | | | | | | | | | | |
Gtd. Notes | | 2.350 | | | 05/06/25 | | | | 10,505 | | | | 10,762,415 | |
Gtd. Notes | | 4.800 | | | 02/14/29 | | | | 3,161 | | | | 3,569,932 | |
See Notes to Financial Statements.
| | | | |
PGIM Short-Term Corporate Bond Fund | | | 17 | |
Schedule of Investments (continued)
as of December 31, 2021
| | | | | | | | | | | | | | |
| | | | |
| Description | | Interest
Rate | | Maturity
Date | | | Principal
Amount
(000)# | | | Value | |
|
CORPORATE BONDS (Continued) | |
|
Agriculture (cont’d.) | |
BAT Capital Corp. (United Kingdom), | | | | | | | | | | | | | | |
Gtd. Notes | | 3.557% | | | 08/15/27 | | | | 2,180 | | | $ | 2,288,337 | |
Gtd. Notes | | 4.700 | | | 04/02/27 | | | | 28,229 | | | | 31,106,465 | |
BAT International Finance PLC (United Kingdom),
Gtd. Notes(a) | | 1.668 | | | 03/25/26 | | | | 34,130 | | | | 33,542,448 | |
Gtd. Notes, 144A | | 3.950 | | | 06/15/25 | | | | 3,000 | | | | 3,195,194 | |
Philip Morris International, Inc., | | | | | | | | | | | | | | |
Sr. Unsec’d. Notes | | 0.875 | | | 05/01/26 | | | | 43,430 | | | | 41,964,010 | |
Sr. Unsec’d. Notes | | 1.500 | | | 05/01/25 | | | | 15,400 | | | | 15,450,776 | |
Reynolds American, Inc. (United Kingdom),
Gtd. Notes | | 4.450 | | | 06/12/25 | | | | 341 | | | | 368,220 | |
Viterra Finance BV (Netherlands),
Gtd. Notes, 144A | | 2.000 | | | 04/21/26 | | | | 35,200 | | | | 35,005,009 | |
| | | | | | | | | | | | | | |
| | | | |
| | | | | | | | | | | | | 177,252,806 | |
| | | | |
Airlines 0.9% | | | | | | | | | | | | | | |
American Airlines 2013-1 Class A Pass-Through Trust,
Pass-Through Certificates | | 4.000 | | | 01/15/27 | | | | 1,305 | | | | 1,260,270 | |
Continental Airlines 2007-1 Class A Pass-Through
Trust,
Pass-Through Certificates | | 5.983 | | | 10/19/23 | | | | 2,747 | | | | 2,778,794 | |
Delta Air Lines, Inc., | | | | | | | | | | | | | | |
Sr. Unsec’d. Notes | | 3.625 | | | 03/15/22 | | | | 20,670 | | | | 20,693,757 | |
Sr. Unsec’d. Notes(a) | | 3.800 | | | 04/19/23 | | | | 3,700 | | | | 3,779,610 | |
Delta Air Lines, Inc./SkyMiles IP Ltd.,
Sr. Sec’d. Notes, 144A | | 4.500 | | | 10/20/25 | | | | 20,455 | | | | 21,515,257 | |
Southwest Airlines Co., | | | | | | | | | | | | | | |
Sr. Unsec’d. Notes | | 4.750 | | | 05/04/23 | | | | 20,965 | | | | 21,962,648 | |
Sr. Unsec’d. Notes(a) | | 5.125 | | | 06/15/27 | | | | 14,215 | | | | 16,270,248 | |
Sr. Unsec’d. Notes | | 5.250 | | | 05/04/25 | | | | 13,915 | | | | 15,458,008 | |
United Airlines, Inc., | | | | | | | | | | | | | | |
Sr. Sec’d. Notes, 144A | | 4.375 | | | 04/15/26 | | | | 12,515 | | | | 13,058,119 | |
Sr. Sec’d. Notes, 144A | | 4.625 | | | 04/15/29 | | | | 4,540 | | | | 4,708,701 | |
| | | | | | | | | | | | | | |
| | | | |
| | | | | | | | | | | | | 121,485,412 | |
| | | | |
Apparel 0.4% | | | | | | | | | | | | | | |
Michael Kors USA, Inc.,
Gtd. Notes, 144A | | 4.500 | | | 11/01/24 | | | | 12,991 | | | | 13,711,019 | |
See Notes to Financial Statements.
| | | | | | | | | | | | | | |
| | | | |
| Description | | Interest
Rate | | Maturity
Date | | | Principal
Amount
(000)# | | | Value | |
|
CORPORATE BONDS (Continued) | |
| | | | |
Apparel (cont’d.) | | | | | | | | | | | | | | |
VF Corp., | | | | | | | | | | | | | | |
Sr. Unsec’d. Notes | | 2.050% | | | 04/23/22 | | | | 17,598 | | | $ | 17,677,523 | |
Sr. Unsec’d. Notes | | 2.400 | | | 04/23/25 | | | | 22,475 | | | | 23,107,950 | |
| | | | | | | | | | | | | | |
| | | | |
| | | | | | | | | | | | | 54,496,492 | |
| | | | |
Auto Manufacturers 4.5% | | | | | | | | | | | | | | |
Daimler Finance North America LLC (Germany), | | | | | | | | | | | | | | |
Gtd. Notes, 144A(a) | | 1.450 | | | 03/02/26 | | | | 27,845 | | | | 27,586,375 | |
Gtd. Notes, 144A | | 2.550 | | | 08/15/22 | | | | 14,575 | | | | 14,750,171 | |
Gtd. Notes, 144A | | 3.700 | | | 05/04/23 | | | | 25,000 | | | | 25,899,953 | |
Daimler Trucks Finance North America LLC (Germany), | | | | | | | | | | | | | | |
Gtd. Notes, 144A, SOFR + 0.750% | | 0.800(c) | | | 12/13/24 | | | | 10,870 | | | | 10,880,086 | |
Gtd. Notes, 144A | | 1.125 | | | 12/14/23 | | | | 15,000 | | | | 15,003,246 | |
Gtd. Notes, 144A | | 1.625 | | | 12/13/24 | | | | 7,460 | | | | 7,513,622 | |
Ford Motor Credit Co. LLC, | | | | | | | | | | | | | | |
Sr. Unsec’d. Notes | | 2.700 | | | 08/10/26 | | | | 50,000 | | | | 50,500,000 | |
Sr. Unsec’d. Notes | | 3.087 | | | 01/09/23 | | | | 17,580 | | | | 17,852,160 | |
Sr. Unsec’d. Notes, GMTN | | 4.389 | | | 01/08/26 | | | | 1,900 | | | | 2,044,705 | |
General Motors Co., | | | | | | | | | | | | | | |
Sr. Unsec’d. Notes | | 5.400 | | | 10/02/23 | | | | 7,750 | | | | 8,300,003 | |
Sr. Unsec’d. Notes(a) | | 6.800 | | | 10/01/27 | | | | 9,780 | | | | 12,026,343 | |
General Motors Financial Co., Inc., | | | | | | | | | | | | | | |
Gtd. Notes | | 3.150 | | | 06/30/22 | | | | 21,060 | | | | 21,278,711 | |
Gtd. Notes | | 3.250 | | | 01/05/23 | | | | 5,500 | | | | 5,620,224 | |
Gtd. Notes | | 3.700 | | | 05/09/23 | | | | 10,025 | | | | 10,326,115 | |
Gtd. Notes | | 3.950 | | | 04/13/24 | | | | 17,555 | | | | 18,487,381 | |
Gtd. Notes | | 4.350 | | | 01/17/27 | | | | 4,925 | | | | 5,424,679 | |
Sr. Unsec’d. Notes, SOFR + 1.200% | | 1.250(c) | | | 11/17/23 | | | | 14,355 | | | | 14,517,348 | |
Sr. Unsec’d. Notes | | 1.250 | | | 01/08/26 | | | | 39,885 | | | | 38,998,085 | |
Sr. Unsec’d. Notes | | 1.500 | | | 06/10/26 | | | | 9,390 | | | | 9,244,664 | |
Sr. Unsec’d. Notes | | 1.700 | | | 08/18/23 | | | | 20,255 | | | | 20,447,002 | |
Sr. Unsec’d. Notes | | 2.400 | | | 04/10/28 | | | | 11,815 | | | | 11,814,603 | |
Sr. Unsec’d. Notes | | 2.400 | | | 10/15/28 | | | | 23,040 | | | | 22,975,237 | |
Sr. Unsec’d. Notes | | 2.750 | | | 06/20/25 | | | | 26,520 | | | | 27,384,390 | |
Sr. Unsec’d. Notes | | 2.900 | | | 02/26/25 | | | | 4,580 | | | | 4,743,212 | |
Nissan Motor Acceptance Co. LLC, | | | | | | | | | | | | | | |
Sr. Unsec’d. Notes, 144A, MTN | | 1.125 | | | 09/16/24 | | | | 14,285 | | | | 14,056,086 | |
Sr. Unsec’d. Notes, 144A, MTN | | 1.850 | | | 09/16/26 | | | | 15,000 | | | | 14,634,589 | |
Nissan Motor Co. Ltd. (Japan), | | | | | | | | | | | | | | |
Sr. Unsec’d. Notes, 144A | | 3.043 | | | 09/15/23 | | | | 14,985 | | | | 15,380,064 | |
Sr. Unsec’d. Notes, 144A | | 3.522 | | | 09/17/25 | | | | 4,000 | | | | 4,191,906 | |
| | | | | | | | | |
| | | | | | |
See Notes to Financial Statements.
| | | | |
PGIM Short-Term Corporate Bond Fund | | | 19 | |
Schedule of Investments (continued)
as of December 31, 2021
| | | | | | | | | | | | | | |
| | | | |
| Description | | Interest
Rate | | Maturity
Date | | | Principal
Amount
(000)# | | | Value | |
|
CORPORATE BONDS (Continued) | |
|
Auto Manufacturers (cont’d.) | |
Stellantis Finance US, Inc., | | | | | | | | | | | | | | |
Gtd. Notes, 144A(a) | | 1.711% | | | 01/29/27 | | | | 18,920 | | | $ | 18,617,852 | |
Stellantis NV, | | | | | | | | | | | | | | |
Sr. Unsec’d. Notes | | 5.250 | | | 04/15/23 | | | | 53,358 | | | | 56,064,428 | |
Toyota Motor Credit Corp., | | | | | | | | | | | | | | |
Sr. Unsec’d. Notes, EMTN | | 3.200(cc) | | | 10/24/25 | | | | 10,000 | | | | 10,680,262 | |
Sr. Unsec’d. Notes, MTN | | 0.800 | | | 10/16/25 | | | | 63,290 | | | | 61,819,296 | |
Volkswagen Group of America Finance LLC (Germany), | | | | | | | | | | | | | | |
Gtd. Notes, 144A | | 0.750 | | | 11/23/22 | | | | 20,310 | | | | 20,307,483 | |
| | | | | | | | | | | | | | |
| | | | |
| | | | | | | | | | | | | 619,370,281 | |
| | | | |
Auto Parts & Equipment 0.3% | | | | | | | | | | | | | | |
BorgWarner, Inc., | | | | | | | | | | | | | | |
Sr. Unsec’d. Notes, 144A | | 5.000 | | | 10/01/25 | | | | 32,277 | | | | 36,045,438 | |
| | | | |
Banks 24.1% | | | | | | | | | | | | | | |
Banco Santander SA (Spain), | | | | | | | | | | | | | | |
Sr. Unsec’d. Notes, 3 Month LIBOR + 1.120% | | 1.241(c) | | | 04/12/23 | | | | 6,200 | | | | 6,262,056 | |
Sr. Unsec’d. Notes | | 1.722(ff) | | | 09/14/27 | | | | 20,400 | | | | 20,021,502 | |
Sr. Unsec’d. Notes | | 1.849 | | | 03/25/26 | | | | 26,200 | | | | 26,051,880 | |
Sr. Unsec’d. Notes | | 2.746 | | | 05/28/25 | | | | 10,000 | | | | 10,344,056 | |
Sr. Unsec’d. Notes | | 3.500 | | | 04/11/22 | | | | 13,600 | | | | 13,709,046 | |
Bank of America Corp., | | | | | | | | | | | | | | |
Jr. Sub. Notes, Series JJ | | 5.125(ff) | | | 06/20/24 | (oo) | | | 3,685 | | | | 3,839,735 | |
Jr. Sub. Notes, Series MM | | 4.300(ff) | | | 01/28/25 | (oo) | | | 12,815 | | | | 12,996,049 | |
Sr. Unsec’d. Notes | | 1.734(ff) | | | 07/22/27 | | | | 93,500 | | | | 92,793,798 | |
Sr. Unsec’d. Notes, MTN(a) | | 0.981(ff) | | | 09/25/25 | | | | 29,920 | | | | 29,569,217 | |
Sr. Unsec’d. Notes, MTN | | 1.197(ff) | | | 10/24/26 | | | | 56,790 | | | | 55,676,131 | |
Sr. Unsec’d. Notes, MTN | | 1.319(ff) | | | 06/19/26 | | | | 10,040 | | | | 9,935,508 | |
Sr. Unsec’d. Notes, MTN | | 2.015(ff) | | | 02/13/26 | | | | 52,845 | | | | 53,544,689 | |
Sr. Unsec’d. Notes, MTN | | 2.087(ff) | | | 06/14/29 | | | | 22,800 | | | | 22,666,915 | |
Sr. Unsec’d. Notes, MTN | | 2.456(ff) | | | 10/22/25 | | | | 22,420 | | | | 23,023,458 | |
Sr. Unsec’d. Notes, MTN | | 3.864(ff) | | | 07/23/24 | | | | 35,000 | | | | 36,472,136 | |
Sr. Unsec’d. Notes, Series N | | 1.658(ff) | | | 03/11/27 | | | | 65,520 | | | | 65,060,644 | |
Sub. Notes, MTN | | 4.000 | | | 01/22/25 | | | | 8,680 | | | | 9,282,115 | |
Sub. Notes, MTN | | 4.200 | | | 08/26/24 | | | | 20,000 | | | | 21,431,280 | |
Sub. Notes, Series L, MTN | | 3.950 | | | 04/21/25 | | | | 11,000 | | | | 11,761,503 | |
Bank of New York Mellon Corp. (The), | | | | | | | | | | | | | | |
Sr. Unsec’d. Notes, MTN | | 1.600 | | | 04/24/25 | | | | 26,025 | | | | 26,220,435 | |
Bank of Nova Scotia (The) (Canada), | | | | | | | | | | | | | | |
Jr. Sub. Notes, Series 2 | | 3.625(ff) | | | 10/27/81 | | | | 50,000 | | | | 48,294,105 | |
See Notes to Financial Statements.
| | | | | | | | | | | | | | |
| | | | |
| Description | | Interest
Rate | | Maturity
Date | | | Principal
Amount
(000)# | | | Value | |
| | | | |
CORPORATE BONDS (Continued) | | | | | | | | | | | | | | |
| | | | |
Banks (cont’d.) | | | | | | | | | | | | | | |
Banque Federative du Credit Mutuel SA (France), | | | | | | | | | | | | | | |
Sr. Unsec’d. Notes, 144A | | 3.750% | | | 07/20/23 | | | | 12,555 | | | $ | 13,098,090 | |
Barclays PLC (United Kingdom), | | | | | | | | | | | | | | |
Sr. Unsec’d. Notes(a) | | 2.279(ff) | | | 11/24/27 | | | | 1,445 | | | | 1,448,639 | |
Sr. Unsec’d. Notes | | 2.852(ff) | | | 05/07/26 | | | | 5,395 | | | | 5,561,294 | |
Sr. Unsec’d. Notes | | 3.932(ff) | | | 05/07/25 | | | | 66,446 | | | | 69,936,897 | |
Sr. Unsec’d. Notes, MTN | | 4.338(ff) | | | 05/16/24 | | | | 5,124 | | | | 5,336,878 | |
BNP Paribas SA (France), | | | | | | | | | | | | | | |
Sr. Unsec’d. Notes, 144A | | 1.323(ff) | | | 01/13/27 | | | | 22,690 | | | | 22,076,736 | |
Sr. Unsec’d. Notes, 144A | | 2.159(ff) | | | 09/15/29 | | | | 6,595 | | | | 6,460,442 | |
Sr. Unsec’d. Notes, 144A | | 2.219(ff) | | | 06/09/26 | | | | 4,580 | | | | 4,626,927 | |
Sr. Unsec’d. Notes, 144A | | 3.375 | | | 01/09/25 | | | | 27,787 | | | | 29,215,728 | |
BPCE SA (France), | | | | | | | | | | | | | | |
Sr. Unsec’d. Notes, 144A | | 2.045(ff) | | | 10/19/27 | | | | 13,595 | | | | 13,478,874 | |
Sr. Unsec’d. Notes, 144A | | 2.375 | | | 01/14/25 | | | | 15,075 | | | | 15,340,927 | |
Sr. Unsec’d. Notes, 144A | | 4.000 | | | 09/12/23 | | | | 6,390 | | | | 6,686,520 | |
Sub. Notes, 144A, MTN | | 4.500 | | | 03/15/25 | | | | 3,640 | | | | 3,923,286 | |
Sub. Notes, 144A, MTN | | 5.700 | | | 10/22/23 | | | | 10,000 | | | | 10,749,797 | |
Citigroup, Inc., | | | | | | | | | | | | | | |
Jr. Sub. Notes, Series V | | 4.700(ff) | | | 01/30/25 | (oo) | | | 26,675 | | | | 27,123,793 | |
Jr. Sub. Notes, Series W | | 4.000(ff) | | | 12/10/25 | (oo) | | | 15,000 | | | | 15,098,881 | |
Sr. Unsec’d. Notes | | 0.981(ff) | | | 05/01/25 | | | | 26,835 | | | | 26,642,349 | |
Sr. Unsec’d. Notes(a) | | 1.122(ff) | | | 01/28/27 | | | | 58,200 | | | | 56,712,612 | |
Sr. Unsec’d. Notes | | 1.462(ff) | | | 06/09/27 | | | | 81,450 | | | | 79,963,899 | |
Sr. Unsec’d. Notes | | 3.142(ff) | | | 01/24/23 | | | | 11,311 | | | | 11,325,925 | |
Sr. Unsec’d. Notes(a) | | 3.352(ff) | | | 04/24/25 | | | | 33,180 | | | | 34,659,957 | |
Sr. Unsec’d. Notes | | 4.044(ff) | | | 06/01/24 | | | | 8,140 | | | | 8,489,998 | |
Sr. Unsec’d. Notes | | 4.500 | | | 01/14/22 | | | | 2,400 | | | | 2,402,836 | |
Sub. Notes | | 4.300 | | | 11/20/26 | | | | 5,378 | | | | 5,951,178 | |
Sub. Notes | | 4.450 | | | 09/29/27 | | | | 2,780 | | | | 3,099,721 | |
Credit Agricole SA (France), | | | | | | | | | | | | | | |
Sr. Unsec’d. Notes, 144A | | 1.247(ff) | | | 01/26/27 | | | | 9,015 | | | | 8,759,766 | |
Sr. Unsec’d. Notes, 144A, MTN | | 1.907(ff) | | | 06/16/26 | | | | 7,005 | | | | 7,020,924 | |
Credit Suisse AG (Switzerland), | | | | | | | | | | | | | | |
Sr. Unsec’d. Notes | | 2.950 | | | 04/09/25 | | | | 18,380 | | | | 19,248,098 | |
Credit Suisse Group AG (Switzerland), | | | | | | | | | | | | | | |
Sr. Unsec’d. Notes | | 3.800 | | | 06/09/23 | | | | 25,000 | | | | 25,913,154 | |
Sr. Unsec’d. Notes, 144A | | 1.305(ff) | | | 02/02/27 | | | | 12,675 | | | | 12,251,375 | |
Sr. Unsec’d. Notes, 144A | | 2.193(ff) | | | 06/05/26 | | | | 3,250 | | | | 3,270,257 | |
Sr. Unsec’d. Notes, 144A(a) | | 2.593(ff) | | | 09/11/25 | | | | 19,500 | | | | 19,904,381 | |
Danske Bank A/S (Denmark), | | | | | | | | | | | | | | |
Sr. Unsec’d. Notes, 144A | | 1.171(ff) | | | 12/08/23 | | | | 16,640 | | | | 16,635,364 | |
| | | | | | | | | |
| | | | | | |
See Notes to Financial Statements.
| | | | |
PGIM Short-Term Corporate Bond Fund | | | 21 | |
Schedule of Investments (continued)
as of December 31, 2021
| | | | | | | | | | | | | | | | |
| | | | |
| Description | | Interest
Rate | | | Maturity
Date | | | Principal
Amount
(000)# | | | Value | |
| | | | |
CORPORATE BONDS (Continued) | | | | | | | | | | | | | | | | |
| | | | |
Banks (cont’d.) | | | | | | | | | | | | | | | | |
Danske Bank A/S (Denmark), (cont’d.) | | | | | | | | | | | | | | | | |
Sr. Unsec’d. Notes, 144A | | | 1.621%(ff) | | | | 09/11/26 | | | | 2,050 | | | $ | 2,023,546 | |
Sr. Unsec’d. Notes, 144A | | | 3.244(ff) | | | | 12/20/25 | | | | 2,500 | | | | 2,600,112 | |
Sr. Unsec’d. Notes, 144A | | | 5.000(ff) | | | | 01/12/23 | | | | 5,200 | | | | 5,204,421 | |
Sr. Unsec’d. Notes, 144A | | | 5.375 | | | | 01/12/24 | | | | 10,000 | | | | 10,768,474 | |
Deutsche Bank AG (Germany), | | | | | | | | | | | | | | | | |
Sr. Unsec’d. Notes, SOFR + 1.219% | | | 1.269(c) | | | | 11/16/27 | | | | 4,625 | | | | 4,620,481 | |
Sr. Unsec’d. Notes | | | 1.686 | | | | 03/19/26 | | | | 11,140 | | | | 11,109,895 | |
Sr. Unsec’d. Notes | | | 2.129(ff) | | | | 11/24/26 | | | | 1,935 | | | | 1,932,553 | |
Sr. Unsec’d. Notes | | | 2.311(ff) | | | | 11/16/27 | | | | 3,525 | | | | 3,524,277 | |
Sr. Unsec’d. Notes | | | 3.950 | | | | 02/27/23 | | | | 19,320 | | | | 19,927,158 | |
Sr. Unsec’d. Notes, Series D | | | 5.000 | | | | 02/14/22 | | | | 10,350 | | | | 10,397,040 | |
Discover Bank, | | | | | | | | | | | | | | | | |
Sr. Unsec’d. Notes | | | 2.450 | | | | 09/12/24 | | | | 7,500 | | | | 7,675,386 | |
Sr. Unsec’d. Notes | | | 3.350 | | | | 02/06/23 | | | | 9,710 | | | | 9,944,005 | |
DNB Bank ASA (Norway), | | | | | | | | | | | | | | | | |
Sr. Unsec’d. Notes, 144A(a) | | | 1.535(ff) | | | | 05/25/27 | | | | 32,540 | | | | 32,068,924 | |
First Horizon Corp., | | | | | | | | | | | | | | | | |
Sr. Unsec’d. Notes | | | 3.550 | | | | 05/26/23 | | | | 26,450 | | | | 27,262,910 | |
FNB Corp., | | | | | | | | | | | | | | | | |
Sr. Unsec’d. Notes | | | 2.200 | | | | 02/24/23 | | | | 11,845 | | | | 11,958,067 | |
Goldman Sachs Group, Inc. (The), | | | | | | | | | | | | | | | | |
Jr. Sub. Notes, Series U | | | 3.650(ff) | | | | 08/10/26 | (oo) | | | 16,130 | | | | 15,953,158 | |
Sr. Unsec’d. Notes, SOFR + 0.790% | | | 0.840(c) | | | | 12/09/26 | | | | 28,200 | | | | 28,222,105 | |
Sr. Unsec’d. Notes | | | 1.093(ff) | | | | 12/09/26 | | | | 28,400 | | | | 27,670,099 | |
Sr. Unsec’d. Notes | | | 1.431(ff) | | | | 03/09/27 | | | | 51,705 | | | | 50,642,217 | |
Sr. Unsec’d. Notes | | | 1.542(ff) | | | | 09/10/27 | | | | 72,845 | | | | 71,409,290 | |
Sr. Unsec’d. Notes | | | 2.908(ff) | | | | 06/05/23 | | | | 48,970 | | | | 49,380,354 | |
Sr. Unsec’d. Notes, EMTN | | | 3.500(cc) | | | | 05/31/24 | | | | 5,000 | | | | 5,285,930 | |
Sr. Unsec’d. Notes, MTN | | | 2.905(ff) | | | | 07/24/23 | | | | 25,800 | | | | 26,087,973 | |
Sub. Notes(a) | | | 5.950 | | | | 01/15/27 | | | | 13,224 | | | | 15,593,389 | |
HSBC Holdings PLC (United Kingdom), | | | | | | | | | | | | | | | | |
Sr. Unsec’d. Notes | | | 0.976(ff) | | | | 05/24/25 | | | | 17,105 | | | | 16,896,888 | |
ING Groep NV (Netherlands), | | | | | | | | | | | | | | | | |
Sr. Unsec’d. Notes | | | 3.550 | | | | 04/09/24 | | | | 5,400 | | | | 5,663,321 | |
Intesa Sanpaolo SpA (Italy), | | | | | | | | | | | | | | | | |
Sr. Unsec’d. Notes, 144A | | | 3.375 | | | | 01/12/23 | | | | 31,245 | | | | 31,961,048 | |
Sr. Unsec’d. Notes, Series XR, 144A | | | 3.250 | | | | 09/23/24 | | | | 17,300 | | | | 18,000,387 | |
JPMorgan Chase & Co., | | | | | | | | | | | | | | | | |
Jr. Sub. Notes, Series CC(a) | | | 4.625(ff) | | | | 11/01/22 | (oo) | | | 11,600 | | | | 11,549,126 | |
Jr. Sub. Notes, Series HH | | | 4.600(ff) | | | | 02/01/25 | (oo) | | | 15,824 | | | | 16,174,988 | |
Jr. Sub. Notes, Series I, 3 Month LIBOR + 3.470% | | | 3.599(c) | | | | 04/30/22 | (oo) | | | 6,846 | | | | 6,864,027 | |
| | | | | | | | | | | | | | | | |
See Notes to Financial Statements.
| | | | | | | | | | | | | | | | |
| | | | |
| Description | | Interest
Rate | | | Maturity
Date | | | Principal
Amount
(000)# | | | Value | |
| | | | |
CORPORATE BONDS (Continued) | | | | | | | | | | | | | | | | |
| | | | |
Banks (cont’d.) | | | | | | | | | | | | | | | | |
JPMorgan Chase & Co., (cont’d.) | | | | | | | | | | | | | | | | |
Jr. Sub. Notes, Series II | | | 4.000%(ff) | | | | 04/01/25 | (oo) | | | 5,225 | | | $ | 5,255,006 | |
Jr. Sub. Notes, Series V, 3 Month LIBOR + 3.320%(a) | | | 3.534(c) | | | | 04/01/22 | (oo) | | | 20,000 | | | | 20,009,708 | |
Sr. Unsec’d. Notes | | | 1.040(ff) | | | | 02/04/27 | | | | 20,000 | | | | 19,347,609 | |
Sr. Unsec’d. Notes(a) | | | 1.045(ff) | | | | 11/19/26 | | | | 59,970 | | | | 58,418,526 | |
Sr. Unsec’d. Notes | | | 1.470(ff) | | | | 09/22/27 | | | | 51,000 | | | | 50,000,545 | |
Sr. Unsec’d. Notes | | | 1.578(ff) | | | | 04/22/27 | | | | 73,755 | | | | 72,894,693 | |
Sr. Unsec’d. Notes | | | 2.005(ff) | | | | 03/13/26 | | | | 25,000 | | | | 25,309,920 | |
Sr. Unsec’d. Notes | | | 2.083(ff) | | | | 04/22/26 | | | | 24,675 | | | | 25,050,124 | |
Sr. Unsec’d. Notes | | | 2.301(ff) | | | | 10/15/25 | | | | 34,120 | | | | 34,878,120 | |
Sr. Unsec’d. Notes | | | 3.559(ff) | | | | 04/23/24 | | | | 48,980 | | | | 50,590,245 | |
Sr. Unsec’d. Notes | | | 3.797(ff) | | | | 07/23/24 | | | | 25,000 | | | | 26,055,310 | |
Sr. Unsec’d. Notes(a) | | | 4.023(ff) | | | | 12/05/24 | | | | 25,230 | | | | 26,575,640 | |
Sub. Notes | | | 3.375 | | | | 05/01/23 | | | | 10,000 | | | | 10,320,148 | |
Lloyds Banking Group PLC (United Kingdom), | | | | | | | | | | | | | | | | |
Sr. Unsec’d. Notes | | | 1.326(ff) | | | | 06/15/23 | | | | 15,410 | | | | 15,437,476 | |
Sr. Unsec’d. Notes | | | 2.438(ff) | | | | 02/05/26 | | | | 22,615 | | | | 23,091,854 | |
Sr. Unsec’d. Notes | | | 2.907(ff) | | | | 11/07/23 | | | | 21,300 | | | | 21,642,043 | |
Sr. Unsec’d. Notes | | | 3.870(ff) | | | | 07/09/25 | | | | 9,165 | | | | 9,688,171 | |
Sr. Unsec’d. Notes | | | 3.900 | | | | 03/12/24 | | | | 4,765 | | | | 5,029,878 | |
Mitsubishi UFJ Financial Group, Inc. (Japan), | | | | | | | | | | | | | | | | |
Sr. Unsec’d. Notes | | | 1.538(ff) | | | | 07/20/27 | | | | 65,830 | | | | 64,707,442 | |
Sr. Unsec’d. Notes | | | 2.193 | | | | 02/25/25 | | | | 22,430 | | | | 22,893,379 | |
Mizuho Financial Group, Inc. (Japan), | | | | | | | | | | | | | | | | |
Sr. Unsec’d. Notes | | | 0.849(ff) | | | | 09/08/24 | | | | 23,245 | | | | 23,145,393 | |
Sr. Unsec’d. Notes | | | 1.241(ff) | | | | 07/10/24 | | | | 36,740 | | | | 36,828,778 | |
Sr. Unsec’d. Notes | | | 1.554(ff) | | | | 07/09/27 | | | | 28,455 | | | | 27,945,480 | |
Morgan Stanley, | | | | | | | | | | | | | | | | |
Jr. Sub. Notes, Series H, 3 Month LIBOR + 3.610% | | | 3.734(c) | | | | 01/18/22 | (oo) | | | 17,375 | | | | 17,381,433 | |
Sr. Unsec’d. Notes | | | 0.790(ff) | | | | 05/30/25 | | | | 24,585 | | | | 24,260,458 | |
Sr. Unsec’d. Notes | | | 0.985(ff) | | | | 12/10/26 | | | | 50,880 | | | | 49,357,107 | |
Sr. Unsec’d. Notes | | | 1.593(ff) | | | | 05/04/27 | | | | 33,720 | | | | 33,374,394 | |
Sr. Unsec’d. Notes, GMTN | | | 1.512(ff) | | | | 07/20/27 | | | | 32,690 | | | | 32,173,825 | |
Sr. Unsec’d. Notes, MTN | | | 0.560(ff) | | | | 11/10/23 | | | | 32,670 | | | | 32,615,205 | |
Sr. Unsec’d. Notes, MTN | | | 2.720(ff) | | | | 07/22/25 | | | | 15,750 | | | | 16,235,068 | |
Sr. Unsec’d. Notes, Series F, MTN | | | 3.875 | | | | 04/29/24 | | | | 24,110 | | | | 25,580,543 | |
Sub. Notes, GMTN | | | 4.350 | | | | 09/08/26 | | | | 2,500 | | | | 2,769,058 | |
Sub. Notes, MTN | | | 4.100 | | | | 05/22/23 | | | | 35,000 | | | | 36,462,040 | |
National Securities Clearing Corp., | | | | | | | | | | | | | | | | |
Sr. Unsec’d. Notes, 144A | | | 1.200 | | | | 04/23/23 | | | | 23,855 | | | | 24,008,515 | |
NatWest Group PLC (United Kingdom), | | | | | | | | | | | | | | | | |
Sr. Unsec’d. Notes(a) | | | 1.642(ff) | | | | 06/14/27 | | | | 19,170 | | | | 18,879,506 | |
See Notes to Financial Statements.
| | | | |
PGIM Short-Term Corporate Bond Fund | | | 23 | |
Schedule of Investments (continued)
as of December 31, 2021
| | | | | | | | | | | | | | | | |
| | | | |
| Description | | Interest
Rate | | | Maturity
Date | | | Principal
Amount
(000)# | | | Value | |
| | | | |
CORPORATE BONDS (Continued) | | | | | | | | | | | | | | | | |
| | | | |
Banks (cont’d.) | | | | | | | | | | | | | | | | |
NatWest Group PLC (United Kingdom), (cont’d.) | | | | | | | | | | | | | | | | |
Sr. Unsec’d. Notes | | | 3.875% | | | | 09/12/23 | | | | 15,672 | | | $ | 16,341,631 | |
Sr. Unsec’d. Notes | | | 4.269(ff) | | | | 03/22/25 | | | | 12,290 | | | | 13,015,956 | |
Sr. Unsec’d. Notes | | | 4.519(ff) | | | | 06/25/24 | | | | 6,800 | | | | 7,115,795 | |
Nordea Bank Abp (Finland), | | | | | | | | | | | | | | | | |
Sr. Unsec’d. Notes, 144A(a) | | | 0.750 | | | | 08/28/25 | | | | 14,855 | | | | 14,501,007 | |
PNC Bank NA, | | | | | | | | | | | | | | | | |
Sub. Notes | | | 2.950 | | | | 01/30/23 | | | | 615 | | | | 628,847 | |
Royal Bank of Canada (Canada), | | | | | | | | | | | | | | | | |
Sr. Unsec’d. Notes, MTN | | | 1.150 | | | | 06/10/25 | | | | 39,830 | | | | 39,480,669 | |
Societe Generale SA (France), | | | | | | | | | | | | | | | | |
Sr. Unsec’d. Notes, 144A, MTN | | | 1.792(ff) | | | | 06/09/27 | | | | 12,690 | | | | 12,416,338 | |
Sr. Unsec’d. Notes, 144A, MTN | | | 2.625 | | | | 01/22/25 | | | | 23,170 | | | | 23,750,708 | |
Sr. Unsec’d. Notes, 144A, MTN | | | 3.875 | | | | 03/28/24 | | | | 29,090 | | | | 30,625,041 | |
Sumitomo Mitsui Financial Group, Inc. (Japan), | | | | | | | | | | | | | | | | |
Sr. Unsec’d. Notes(a) | | | 1.902 | | | | 09/17/28 | | | | 18,905 | | | | 18,545,542 | |
Sr. Unsec’d. Notes | | | 2.348 | | | | 01/15/25 | | | | 17,590 | | | | 18,017,805 | |
Sr. Unsec’d. Notes | | | 2.696 | | | | 07/16/24 | | | | 31,828 | | | | 32,888,257 | |
Sr. Unsec’d. Notes(a) | | | 3.102 | | | | 01/17/23 | | | | 7,795 | | | | 7,974,845 | |
Swedbank AB (Sweden), | | | | | | | | | | | | | | | | |
Sr. Unsec’d. Notes, 144A | | | 1.300 | | | | 06/02/23 | | | | 18,270 | | | | 18,376,998 | |
Truist Bank, | | | | | | | | | | | | | | | | |
Sr. Unsec’d. Notes | | | 1.500 | | | | 03/10/25 | | | | 11,000 | | | | 11,070,071 | |
Truist Financial Corp., | | | | | | | | | | | | | | | | |
Jr. Sub. Notes, Series N | | | 4.800(ff) | | | | 09/01/24 | (oo) | | | 5,500 | | | | 5,749,573 | |
Jr. Sub. Notes, Series P | | | 4.950(ff) | | | | 09/01/25 | (oo) | | | 4,500 | | | | 4,860,764 | |
UBS AG (Switzerland), | | | | | | | | | | | | | | | | |
Sr. Unsec’d. Notes, 144A | | | 1.250 | | | | 06/01/26 | | | | 35,460 | | | | 34,730,113 | |
UBS Group AG (Switzerland), | | | | | | | | | | | | | | | | |
Sr. Unsec’d. Notes, 144A | | | 1.008(ff) | | | | 07/30/24 | | | | 21,325 | | | | 21,265,218 | |
Sr. Unsec’d. Notes, 144A | | | 1.494(ff) | | | | 08/10/27 | | | | 16,550 | | | | 16,148,514 | |
Sr. Unsec’d. Notes, 144A | | | 3.491 | | | | 05/23/23 | | | | 21,667 | | | | 21,890,072 | |
UniCredit SpA (Italy), | | | | | | | | | | | | | | | | |
Sr. Unsec’d. Notes, 144A | | | 1.982(ff) | | | | 06/03/27 | | | | 17,600 | | | | 17,130,285 | |
Sr. Unsec’d. Notes, 144A | | | 2.569(ff) | | | | 09/22/26 | | | | 6,745 | | | | 6,752,369 | |
Sr. Unsec’d. Notes, 144A, MTN(a) | | | 4.625 | | | | 04/12/27 | | | | 2,250 | | | | 2,465,107 | |
Wells Fargo & Co., | | | | | | | | | | | | | | | | |
Sr. Unsec’d. Notes, MTN | | | 2.164(ff) | | | | 02/11/26 | | | | 126,625 | | | | 128,718,672 | |
Sr. Unsec’d. Notes, MTN | | | 3.196(ff) | | | | 06/17/27 | | | | 45,795 | | | | 48,364,664 | |
| | | | | | | | | | | | | | | | |
| | | | |
| | | | | | | | | | | | | | | 3,310,780,811 | |
See Notes to Financial Statements.
| | | | | | | | | | | | | | |
| | | | |
| Description | | Interest
Rate | | Maturity
Date | | | Principal
Amount
(000)# | | | Value | |
| | | | |
CORPORATE BONDS (Continued) | | | | | | | | | | | | | | |
| | | | |
Beverages 0.5% | | | | | | | | | | | | | | |
Bacardi Ltd. (Bermuda), | | | | | | | | | | | | | | |
Gtd. Notes, 144A | | 2.750% | | | 07/15/26 | | | | 25,340 | | | $ | 26,109,332 | |
Gtd. Notes, 144A | | 4.450 | | | 05/15/25 | | | | 18,070 | | | | 19,574,439 | |
Constellation Brands, Inc., | | | | | | | | | | | | | | |
Gtd. Notes | | 4.750 | | | 11/15/24 | | | | 8,215 | | | | 8,978,604 | |
JDE Peet’s NV (Netherlands), | | | | | | | | | | | | | | |
Gtd. Notes, 144A | | 1.375 | | | 01/15/27 | | | | 4,894 | | | | 4,723,188 | |
Keurig Dr. Pepper, Inc., | | | | | | | | | | | | | | |
Gtd. Notes | | 4.057 | | | 05/25/23 | | | | 2,012 | | | | 2,096,849 | |
Gtd. Notes | | 4.417 | | | 05/25/25 | | | | 5,745 | | | | 6,261,330 | |
| | | | | | | | | | | | | | |
| | | | |
| | | | | | | | | | | | | 67,743,742 | |
| | | | |
Biotechnology 0.1% | | | | | | | | | | | | | | |
Baxalta, Inc., | | | | | | | | | | | | | | |
Gtd. Notes | | 4.000 | | | 06/23/25 | | | | 7,300 | | | | 7,863,962 | |
| | | | |
Building Materials 0.5% | | | | | | | | | | | | | | |
Carrier Global Corp., | | | | | | | | | | | | | | |
Sr. Unsec’d. Notes | | 2.242 | | | 02/15/25 | | | | 38,920 | | | | 39,874,899 | |
Lennox International, Inc., | | | | | | | | | | | | | | |
Gtd. Notes | | 1.350 | | | 08/01/25 | | | | 6,120 | | | | 6,049,586 | |
Gtd. Notes | | 1.700 | | | 08/01/27 | | | | 2,530 | | | | 2,489,417 | |
Macmillan Bloedel Pembroke LP (Canada), | | | | | | | | | | | | | | |
Sr. Unsec’d. Notes | | 7.700 | | | 02/15/26 | | | | 3,000 | | | | 3,678,053 | |
Owens Corning, | | | | | | | | | | | | | | |
Sr. Unsec’d. Notes | | 3.400 | | | 08/15/26 | | | | 18,329 | | | | 19,407,041 | |
| | | | | | | | | | | | | | |
| | | | |
| | | | | | | | | | | | | 71,498,996 | |
| | | | |
Chemicals 1.7% | | | | | | | | | | | | | | |
Celanese US Holdings LLC, | | | | | | | | | | | | | | |
Gtd. Notes | | 4.625 | | | 11/15/22 | | | | 8,900 | | | | 9,183,327 | |
CF Industries, Inc., | | | | | | | | | | | | | | |
Gtd. Notes, 144A | | 4.500 | | | 12/01/26 | | | | 16,500 | | | | 18,332,805 | |
Chevron Phillips Chemical Co. LLC/Chevron Phillips | | | | | | | | | | | | | | |
Chemical Co. LP, | | | | | | | | | | | | | | |
Sr. Unsec’d. Notes, 144A | | 3.400 | | | 12/01/26 | | | | 11,559 | | | | 12,390,055 | |
Sr. Unsec’d. Notes, 144A | | 5.125 | | | 04/01/25 | | | | 25,000 | | | | 27,760,856 | |
Dow Chemical Co. (The), | | | | | | | | | | | | | | |
Sr. Unsec’d. Notes | | 3.625 | | | 05/15/26 | | | | 8,208 | | | | 8,845,351 | |
See Notes to Financial Statements.
| | | | |
PGIM Short-Term Corporate Bond Fund | | | 25 | |
Schedule of Investments (continued)
as of December 31, 2021
| | | | | | | | | | | | | | | | |
| | | | |
| Description | | Interest
Rate | | | Maturity
Date | | | Principal
Amount
(000)# | | | Value | |
| | | | |
CORPORATE BONDS (Continued) | | | | | | | | | | | | | | | | |
| | | | |
Chemicals (cont’d.) | | | | | | | | | | | | | | | | |
DuPont de Nemours, Inc., | | | | | | | | | | | | | | | | |
Sr. Unsec’d. Notes | | | 4.205% | | | | 11/15/23 | | | | 30,640 | | | $ | 32,400,438 | |
Eastman Chemical Co., | | | | | | | | | | | | | | | | |
Sr. Unsec’d. Notes | | | 7.250 | | | | 01/15/24 | | | | 13,400 | | | | 14,804,437 | |
FMC Corp., | | | | | | | | | | | | | | | | |
Sr. Unsec’d. Notes | | | 3.200 | | | | 10/01/26 | | | | 14,160 | | | | 14,986,281 | |
International Flavors & Fragrances, Inc., | | | | | | | | | | | | | | | | |
Sr. Unsec’d. Notes, 144A | | | 1.832 | | | | 10/15/27 | | | | 14,385 | | | | 14,159,694 | |
LYB International Finance III LLC, | | | | | | | | | | | | | | | | |
Gtd. Notes | | | 1.250 | | | | 10/01/25 | | | | 14,954 | | | | 14,735,075 | |
Mosaic Co. (The), | | | | | | | | | | | | | | | | |
Sr. Unsec’d. Notes | | | 3.250 | | | | 11/15/22 | | | | 43,215 | | | | 44,077,038 | |
Sasol Financing USA LLC (South Africa), | | | | | | | | | | | | | | | | |
Gtd. Notes | | | 5.875 | | | | 03/27/24 | | | | 14,245 | | | | 14,834,551 | |
Sherwin-Williams Co. (The), | | | | | | | | | | | | | | | | |
Sr. Unsec’d. Notes | | | 2.750 | | | | 06/01/22 | | | | 1,076 | | | | 1,083,720 | |
Westlake Chemical Corp., | | | | | | | | | | | | | | | | |
Sr. Unsec’d. Notes | | | 3.600 | | | | 07/15/22 | | | | 10,000 | | | | 10,076,098 | |
| | | | | | | | | | | | | | | | |
| | | | |
| | | | | | | | | | | | | | | 237,669,726 | |
| | | | |
Commercial Services 2.1% | | | | | | | | | | | | | | | | |
Ashtead Capital, Inc. (United Kingdom), | | | | | | | | | | | | | | | | |
Gtd. Notes, 144A(a) | | | 1.500 | | | | 08/12/26 | | | | 20,725 | | | | 20,322,162 | |
Automatic Data Processing, Inc., | | | | | | | | | | | | | | | | |
Sr. Unsec’d. Notes | | | 1.700 | | | | 05/15/28 | | | | 7,215 | | | | 7,199,111 | |
Equifax, Inc., | | | | | | | | | | | | | | | | |
Sr. Unsec’d. Notes | | | 2.600 | | | | 12/01/24 | | | | 3,975 | | | | 4,113,577 | |
Sr. Unsec’d. Notes | | | 2.600 | | | | 12/15/25 | | | | 7,000 | | | | 7,247,900 | |
Sr. Unsec’d. Notes | | | 3.950 | | | | 06/15/23 | | | | 13,415 | | | | 13,949,170 | |
ERAC USA Finance LLC, | | | | | | | | | | | | | | | | |
Gtd. Notes, 144A | | | 2.700 | | | | 11/01/23 | | | | 14,985 | | | | 15,369,641 | |
Gtd. Notes, 144A | | | 3.300 | | | | 12/01/26 | | | | 9,230 | | | | 9,796,136 | |
Gtd. Notes, 144A | | | 3.800 | | | | 11/01/25 | | | | 19,523 | | | | 21,013,079 | |
Global Payments, Inc., | | | | | | | | | | | | | | | | |
Sr. Unsec’d. Notes | | | 2.650 | | | | 02/15/25 | | | | 16,290 | | | | 16,753,584 | |
IHS Markit Ltd., | | | | | | | | | | | | | | | | |
Gtd. Notes, 144A | | | 4.750 | | | | 02/15/25 | | | | 20,739 | | | | 22,537,993 | |
Gtd. Notes, 144A | | | 5.000 | | | | 11/01/22 | | | | 15,876 | | | | 16,258,432 | |
Sr. Unsec’d. Notes(a) | | | 3.625 | | | | 05/01/24 | | | | 12,500 | | | | 13,104,286 | |
Sr. Unsec’d. Notes | | | 4.125 | | | | 08/01/23 | | | | 6,260 | | | | 6,536,029 | |
See Notes to Financial Statements.
| | | | | | | | | | | | | | | | |
| | | | |
| Description | | Interest
Rate | | | Maturity
Date | | | Principal
Amount
(000)# | | | Value | |
| | | | |
CORPORATE BONDS (Continued) | | | | | | | | | | | | | | | | |
| | | | |
Commercial Services (cont’d.) | | | | | | | | | | | | | | | | |
Leland Stanford Junior University (The), | | | | | | | | | | | | | | | | |
Unsec’d. Notes | | | 1.289% | | | | 06/01/27 | | | | 12,495 | | | $ | 12,352,410 | |
Moody’s Corp., | | | | | | | | | | | | | | | | |
Sr. Unsec’d. Notes | | | 3.750 | | | | 03/24/25 | | | | 68,500 | | | | 73,202,530 | |
RELX Capital, Inc. (United Kingdom), | | | | | | | | | | | | | | | | |
Gtd. Notes | | | 3.500 | | | | 03/16/23 | | | | 6,240 | | | | 6,424,993 | |
Verisk Analytics, Inc., | | | | | | | | | | | | | | | | |
Sr. Unsec’d. Notes | | | 4.000 | | | | 06/15/25 | | | | 16,325 | | | | 17,575,298 | |
Sr. Unsec’d. Notes | | | 4.125 | | | | 09/12/22 | | | | 5,899 | | | | 6,035,296 | |
| | | | | | | | | | | | | | | | |
| | | | |
| | | | | | | | | | | | | | | 289,791,627 | |
| | | | |
Computers 1.4% | | | | | | | | | | | | | | | | |
Apple, Inc., | | | | | | | | | | | | | | | | |
Sr. Unsec’d. Notes | | | 1.125 | | | | 05/11/25 | | | | 40,000 | | | | 39,913,797 | |
Sr. Unsec’d. Notes | | | 3.000 | | | | 02/09/24 | | | | 13,990 | | | | 14,575,558 | |
Sr. Unsec’d. Notes | | | 3.350 | | | | 02/09/27 | | | | 7,000 | | | | 7,607,484 | |
Dell International LLC/EMC Corp., | | | | | | | | | | | | | | | | |
Sr. Unsec’d. Notes | | | 5.850 | | | | 07/15/25 | | | | 22,500 | | | | 25,521,467 | |
Genpact Luxembourg Sarl, | | | | | | | | | | | | | | | | |
Gtd. Notes | | | 3.375 | | | | 12/01/24 | | | | 21,970 | | | | 23,146,534 | |
Gtd. Notes | | | 3.700 | | | | 04/01/22 | | | | 6,110 | | | | 6,137,809 | |
Genpact Luxembourg Sarl/Genpact USA, Inc., | | | | | | | | | | | | | | | | |
Gtd. Notes | | | 1.750 | | | | 04/10/26 | | | | 15,895 | | | | 15,852,711 | |
International Business Machines Corp., | | | | | | | | | | | | | | | | |
Sr. Unsec’d. Notes(a) | | | 1.700 | | | | 05/15/27 | | | | 22,200 | | | | 22,131,906 | |
Leidos, Inc., | | | | | | | | | | | | | | | | |
Gtd. Notes(a) | | | 2.950 | | | | 05/15/23 | | | | 7,040 | | | | 7,208,762 | |
Gtd. Notes | | | 3.625 | | | | 05/15/25 | | | | 8,205 | | | | 8,710,818 | |
NetApp, Inc., | | | | | | | | | | | | | | | | |
Sr. Unsec’d. Notes | | | 1.875 | | | | 06/22/25 | | | | 18,920 | | | | 19,126,898 | |
| | | | | | | | | | | | | | | | |
| | | | |
| | | | | | | | | | | | | | | 189,933,744 | |
|
Diversified Financial Services 1.5% | |
American Express Co., | | | | | | | | | | | | | | | | |
Jr. Sub. Notes | | | 3.550(ff) | | | | 09/15/26 | (oo) | | | 16,080 | | | | 16,124,341 | |
Ameriprise Financial, Inc., | | | | | | | | | | | | | | | | |
Sr. Unsec’d. Notes | | | 3.000 | | | | 04/02/25 | | | | 11,305 | | | | 11,809,852 | |
Cantor Fitzgerald LP, | | | | | | | | | | | | | | | | |
Sr. Unsec’d. Notes, 144A | | | 4.875 | | | | 05/01/24 | | | | 37,750 | | | | 40,358,217 | |
| | | | | | | | | | |
| | | | | | | |
See Notes to Financial Statements.
| | | | |
PGIM Short-Term Corporate Bond Fund | | | 27 | |
Schedule of Investments (continued)
as of December 31, 2021
| | | | | | | | | | | | | | | | |
| | | | |
| Description | | Interest
Rate | | | Maturity
Date | | | Principal
Amount
(000)# | | | Value | |
|
CORPORATE BONDS (Continued) | |
|
Diversified Financial Services (cont’d.) | |
Charles Schwab Corp. (The), | | | | | | | | | | | | | | | | |
Jr. Sub. Notes, Series G | | | 5.375%(ff) | | | | 06/01/25 | (oo) | | | 11,850 | | | $ | 12,925,277 | |
Citigroup Global Markets Holdings, Inc., | | | | | | | | | | | | | | | | |
Gtd. Notes, GMTN | | | 3.500(cc) | | | | 06/12/24 | | | | 3,870 | | | | 4,116,520 | |
Intercontinental Exchange, Inc., | | | | | | | | | | | | | | | | |
Sr. Unsec’d. Notes | | | 0.700 | | | | 06/15/23 | | | | 22,050 | | | | 22,031,295 | |
Nomura Holdings, Inc. (Japan), | | | | | | | | | | | | | | | | |
Sr. Unsec’d. Notes | | | 1.653 | | | | 07/14/26 | | | | 16,975 | | | | 16,693,759 | |
Sr. Unsec’d. Notes(a) | | | 2.172 | | | | 07/14/28 | | | | 6,100 | | | | 5,976,634 | |
Sr. Unsec’d. Notes | | | 2.648 | | | | 01/16/25 | | | | 17,985 | | | | 18,504,172 | |
Visa, Inc., | | | | | | | | | | | | | | | | |
Sr. Unsec’d. Notes(a) | | | 1.900 | | | | 04/15/27 | | | | 10,360 | | | | 10,529,195 | |
Western Union Co. (The), | | | | | | | | | | | | | | | | |
Sr. Unsec’d. Notes(a) | | | 1.350 | | | | 03/15/26 | | | | 45,050 | | | | 44,226,517 | |
| | | | | | | | | | | | | | | | |
| | | | |
| | | | | | | | | | | | | | | 203,295,779 | |
| | | | |
| Electric 7.2% | | | | | | | | | | | | |
Alexander Funding Trust, | | | | | | | | | | | | | | | | |
Sr. Sec’d. Notes, 144A | | | 1.841 | | | | 11/15/23 | | | | 20,000 | | | | 20,110,930 | |
Alliant Energy Finance LLC, | | | | | | | | | | | | | | | | |
Gtd. Notes, 144A | | | 1.400 | | | | 03/15/26 | | | | 18,650 | | | | 18,026,492 | |
Gtd. Notes, 144A | | | 3.750 | | | | 06/15/23 | | | | 24,100 | | | | 24,948,423 | |
Ameren Corp., | | | | | | | | | | | | | | | | |
Sr. Unsec’d. Notes | | | 1.750 | | | | 03/15/28 | | | | 18,710 | | | | 18,129,663 | |
Avangrid, Inc., | | | | | | | | | | | | | | | | |
Sr. Unsec’d. Notes | | | 3.150 | | | | 12/01/24 | | | | 6,018 | | | | 6,303,865 | |
Sr. Unsec’d. Notes | | | 3.200 | | | | 04/15/25 | | | | 14,245 | | | | 14,987,418 | |
Berkshire Hathaway Energy Co., | | | | | | | | | | | | | | | | |
Sr. Unsec’d. Notes(a) | | | 4.050 | | | | 04/15/25 | | | | 33,010 | | | | 35,750,846 | |
Calpine Corp., | | | | | | | | | | | | | | | | |
Sr. Unsec’d. Notes, 144A | | | 5.125 | | | | 03/15/28 | | | | 8,000 | | | | 8,128,927 | |
CenterPoint Energy, Inc., | | | | | | | | | | | | | | | | |
Sr. Unsec’d. Notes | | | 1.450 | | | | 06/01/26 | | | | 24,160 | | | | 23,757,360 | |
Sr. Unsec’d. Notes | | | 2.500 | | | | 09/01/24 | | | | 21,620 | | | | 22,229,178 | |
Cleveland Electric Illuminating Co. (The), | | | | | | | | | | | | | | | | |
First Mortgage | | | 5.500 | | | | 08/15/24 | | | | 5,925 | | | | 6,538,656 | |
CMS Energy Corp., | | | | | | | | | | | | | | | | |
Sr. Unsec’d. Notes | | | 2.950 | | | | 02/15/27 | | | | 2,445 | | | | 2,544,281 | |
Dominion Energy, Inc., | | | | | | | | | | | | | | | | |
Jr. Sub. Notes | | | 3.071 | | | | 08/15/24 | | | | 13,520 | | | | 14,009,595 | |
Jr. Sub. Notes, Series B | | | 4.650(ff) | | | | 12/15/24 | (oo) | | | 35,129 | | | | 36,507,314 | |
See Notes to Financial Statements.
| | | | | | | | | | | | | | |
| | | | |
| Description | | Interest
Rate | | Maturity
Date | | | Principal
Amount
(000)# | | | Value | |
|
CORPORATE BONDS (Continued) | |
|
Electric (cont’d.) | |
Dominion Energy, Inc., (cont’d.) | | | | | | | | | | | | | | |
Sr. Unsec’d. Notes, 144A | | 2.450% | | | 01/15/23 | | | | 10,000 | | | $ | 10,168,184 | |
Sr. Unsec’d. Notes, Series B | | 2.750 | | | 09/15/22 | | | | 10,000 | | | | 10,097,940 | |
DTE Energy Co., | | | | | | | | | | | | | | |
Sr. Unsec’d. Notes | | 2.250 | | | 11/01/22 | | | | 20,000 | | | | 20,250,832 | |
Sr. Unsec’d. Notes, Series C | | 2.529 | | | 10/01/24 | | | | 38,222 | | | | 39,402,389 | |
Sr. Unsec’d. Notes, Series F | | 1.050 | | | 06/01/25 | | | | 41,902 | | | | 41,122,313 | |
Duke Energy Corp., | | | | | | | | | | | | | | |
Jr. Sub. Notes | | 3.250(ff) | | | 01/15/82 | | | | 23,430 | | | | 22,869,784 | |
Duke Energy Progress LLC, | | | | | | | | | | | | | | |
First Mortgage | | 3.375 | | | 09/01/23 | | | | 6,690 | | | | 6,949,282 | |
Edison International, | | | | | | | | | | | | | | |
Sr. Unsec’d. Notes | | 4.950 | | | 04/15/25 | | | | 28,800 | | | | 31,403,690 | |
Enel Finance International NV (Italy), | | | | | | | | | | | | | | |
Gtd. Notes, 144A | | 1.375 | | | 07/12/26 | | | | 11,300 | | | | 11,028,651 | |
Gtd. Notes, 144A | | 1.875 | | | 07/12/28 | | | | 32,320 | | | | 31,524,048 | |
Entergy Corp., | | | | | | | | | | | | | | |
Sr. Unsec’d. Notes | | 0.900 | | | 09/15/25 | | | | 32,125 | | | | 31,182,321 | |
Sr. Unsec’d. Notes | | 4.000 | | | 07/15/22 | | | | 10,493 | | | | 10,617,121 | |
Entergy Gulf States Louisiana LLC, | | | | | | | | | | | | | | |
First Mortgage | | 5.590 | | | 10/01/24 | | | | 3,601 | | | | 3,973,349 | |
Evergy Metro, Inc., | | | | | | | | | | | | | | |
Sec’d. Notes | | 3.650 | | | 08/15/25 | | | | 15,750 | | | | 16,814,040 | |
Eversource Energy, | | | | | | | | | | | | | | |
Sr. Unsec’d. Notes, Series H | | 3.150 | | | 01/15/25 | | | | 2,330 | | | | 2,433,488 | |
Exelon Corp., | | | | | | | | | | | | | | |
Jr. Sub. Notes | | 3.497 | | | 06/01/22 | | | | 90,279 | | | | 91,093,744 | |
FirstEnergy Corp., | | | | | | | | | | | | | | |
Sr. Unsec’d. Notes, Series A | | 3.350 | | | 07/15/22 | | | | 25,000 | | | | 25,143,874 | |
Georgia Power Co., | | | | | | | | | | | | | | |
Sr. Unsec’d. Notes | | 5.750 | | | 04/15/23 | | | | 2,000 | | | | 2,114,502 | |
IPALCO Enterprises, Inc., | | | | | | | | | | | | | | |
Sr. Sec’d. Notes | | 3.700 | | | 09/01/24 | | | | 8,035 | | | | 8,419,133 | |
MidAmerican Energy Co., | | | | | | | | | | | | | | |
First Mortgage | | 3.100 | | | 05/01/27 | | | | 2,000 | | | | 2,131,988 | |
Monongahela Power Co., | | | | | | | | | | | | | | |
First Mortgage, 144A | | 4.100 | | | 04/15/24 | | | | 4,236 | | | | 4,460,038 | |
NextEra Energy Capital Holdings, Inc., | | | | | | | | | | | | | | |
Gtd. Notes, SOFR + 0.400% | | 0.450(c) | | | 11/03/23 | | | | 40,000 | | | | 39,949,834 | |
NRG Energy, Inc., | | | | | | | | | | | | | | |
Sr. Sec’d. Notes, 144A | | 3.750 | | | 06/15/24 | | | | 9,285 | | | | 9,702,189 | |
See Notes to Financial Statements.
| | | | |
PGIM Short-Term Corporate Bond Fund | | | 29 | |
Schedule of Investments (continued)
as of December 31, 2021
| | | | | | | | | | | | | | |
| | | | |
| Description | | Interest
Rate | | Maturity
Date | | | Principal
Amount
(000)# | | | Value | |
| | | | |
CORPORATE BONDS (Continued) | | | | | | | | | | | | | | |
| | | | |
Electric (cont’d.) | | | | | | | | | | | | | | |
Pacific Gas & Electric Co., | | | | | | | | | | | | | | |
First Mortgage | | 1.750% | | | 06/16/22 | | | | 28,700 | | | $ | 28,680,192 | |
First Mortgage(a) | | 3.000 | | | 06/15/28 | | | | 12,000 | | | | 12,023,616 | |
Pinnacle West Capital Corp., | | | | | | | | | | | | | | |
Sr. Unsec’d. Notes | | 1.300 | | | 06/15/25 | | | | 38,970 | | | | 38,357,224 | |
Public Service Enterprise Group, Inc., | | | | | | | | | | | | | | |
Sr. Unsec’d. Notes(a) | | 0.800 | | | 08/15/25 | | | | 26,665 | | | | 25,959,533 | |
Sr. Unsec’d. Notes | | 2.875 | | | 06/15/24 | | | | 14,045 | | | | 14,542,048 | |
Puget Energy, Inc., | | | | | | | | | | | | | | |
Sr. Sec’d. Notes | | 2.379 | | | 06/15/28 | | | | 9,809 | | | | 9,661,406 | |
Sr. Sec’d. Notes | | 5.625 | | | 07/15/22 | | | | 2,500 | | | | 2,534,913 | |
Sempra Energy, | | | | | | | | | | | | | | |
Jr. Sub. Notes | | 4.125(ff) | | | 04/01/52 | | | | 20,635 | | | | 20,852,342 | |
Southern California Edison Co., | | | | | | | | | | | | | | |
First Mortgage, Series D | | 3.400 | | | 06/01/23 | | | | 36,132 | | | | 37,158,564 | |
Southern Co. (The), | | | | | | | | | | | | | | |
Sr. Unsec’d. Notes, Series 21-B | | 1.750 | | | 03/15/28 | | | | 18,625 | | | | 18,122,971 | |
Tucson Electric Power Co., | | | | | | | | | | | | | | |
Sr. Unsec’d. Notes | | 3.050 | | | 03/15/25 | | | | 5,897 | | | | 6,149,421 | |
Vistra Corp., | | | | | | | | | | | | | | |
Jr. Sub. Notes, 144A | | 7.000(ff) | | | 12/15/26 | (oo) | | | 6,650 | | | | 6,747,000 | |
Vistra Operations Co. LLC, | | | | | | | | | | | | | | |
Sr. Sec’d. Notes, 144A | | 3.550 | | | 07/15/24 | | | | 20,525 | | | | 21,164,323 | |
Sr. Sec’d. Notes, 144A | | 3.700 | | | 01/30/27 | | | | 10,000 | | | | 10,392,297 | |
Xcel Energy, Inc., | | | | | | | | | | | | | | |
Sr. Unsec’d. Notes | | 1.750 | | | 03/15/27 | | | | 11,540 | | | | 11,458,095 | |
| | | | | | | | | | | | | | |
| | | | |
| | | | | | | | | | | | | 988,629,627 | |
| | | | |
Electronics 0.6% | | | | | | | | | | | | | | |
TD SYNNEX Corp., | | | | | | | | | | | | | | |
Sr. Unsec’d. Notes, 144A | | 1.250 | | | 08/09/24 | | | | 60,230 | | | | 59,537,145 | |
Trimble, Inc., | | | | | | | | | | | | | | |
Sr. Unsec’d. Notes | | 4.150 | | | 06/15/23 | | | | 16,030 | | | | 16,677,037 | |
| | | | | | | | | | | | | | |
| | | | |
| | | | | | | | | | | | | 76,214,182 | |
| | | | |
Foods 1.0% | | | | | | | | | | | | | | |
Campbell Soup Co., | | | | | | | | | | | | | | |
Sr. Unsec’d. Notes | | 3.950 | | | 03/15/25 | | | | 14,769 | | | | 15,806,424 | |
See Notes to Financial Statements.
| | | | | | | | | | | | | | |
| | | | |
| Description | | Interest
Rate | | Maturity
Date | | | Principal
Amount
(000)# | | | Value | |
| | | | |
CORPORATE BONDS (Continued) | | | | | | | | | | | | | | |
| | | | |
Foods (cont’d.) | | | | | | | | | | | | | | |
JBS USA LUX SA/JBS USA Food Co./JBS USA Finance, Inc., | | | | | | | | | | | | | | |
Gtd. Notes, 144A | | 6.500% | | | 04/15/29 | | | | 30,668 | | | $ | 33,778,856 | |
Kraft Heinz Foods Co., | | | | | | | | | | | | | | |
Gtd. Notes | | 3.000 | | | 06/01/26 | | | | 62,344 | | | | 65,250,593 | |
McCormick & Co., Inc., | | | | | | | | | | | | | | |
Sr. Unsec’d. Notes | | 2.700 | | | 08/15/22 | | | | 23,140 | | | | 23,400,577 | |
Tyson Foods, Inc., | | | | | | | | | | | | | | |
Sr. Unsec’d. Notes | | 3.900 | | | 09/28/23 | | | | 4,320 | | | | 4,516,533 | |
| | | | | | | | | | | | | | |
| | | | |
| | | | | | | | | | | | | 142,752,983 | |
| | | | |
Forest Products & Paper 0.2% | | | | | | | | | | | | | | |
Georgia-Pacific LLC, | | | | | | | | | | | | | | |
Sr. Unsec’d. Notes, 144A | | 1.750 | | | 09/30/25 | | | | 23,870 | | | | 23,992,083 | |
Smurfit Kappa Treasury Funding DAC (Ireland), | | | | | | | | | | | | | | |
Gtd. Notes | | 7.500 | | | 11/20/25 | | | | 3,902 | | | | 4,789,125 | |
| | | | | | | | | | | | | | |
| | | | |
| | | | | | | | | | | | | 28,781,208 | |
| | | | |
Gas 0.6% | | | | | | | | | | | | | | |
AmeriGas Partners LP/AmeriGas Finance Corp., | | | | | | | | | | | | | | |
Sr. Unsec’d. Notes | | 5.500 | | | 05/20/25 | | | | 16,559 | | | | 17,746,521 | |
Sr. Unsec’d. Notes | | 5.875 | | | 08/20/26 | | | | 4,950 | | | | 5,536,764 | |
CenterPoint Energy Resources Corp., | | | | | | | | | | | | | | |
Sr. Unsec’d. Notes(a) | | 0.700 | | | 03/02/23 | | | | 15,430 | | | | 15,362,002 | |
Eastern Energy Gas Holdings LLC, | | | | | | | | | | | | | | |
Sr. Unsec’d. Notes, Series A | | 2.500 | | | 11/15/24 | | | | 10,000 | | | | 10,340,092 | |
NiSource, Inc., | | | | | | | | | | | | | | |
Sr. Unsec’d. Notes | | 0.950 | | | 08/15/25 | | | | 29,120 | | | | 28,379,165 | |
| | | | | | | | | | | | | | |
| | | | |
| | | | | | | | | | | | | 77,364,544 | |
| | | | |
Healthcare-Products 0.2% | | | | | | | | | | | | | | |
Boston Scientific Corp., | | | | | | | | | | | | | | |
Sr. Unsec’d. Notes | | 3.450 | | | 03/01/24 | | | | 18,915 | | | | 19,785,079 | |
Sr. Unsec’d. Notes | | 4.125 | | | 10/01/23 | | | | 7,000 | | | | 7,314,826 | |
Thermo Fisher Scientific, Inc., | | | | | | | | | | | | | | |
Sr. Unsec’d. Notes, SOFR + 0.390% | | 0.439(c) | | | 10/18/23 | | | | 5,625 | | | | 5,632,587 | |
| | | | | | | | | | | | | | |
| | | | |
| | | | | | | | | | | | | 32,732,492 | |
See Notes to Financial Statements.
| | | | |
PGIM Short-Term Corporate Bond Fund | | | 31 | |
Schedule of Investments (continued)
as of December 31, 2021
| | | | | | | | | | | | | | |
| | | | |
| Description | | Interest
Rate | | Maturity
Date | | | Principal
Amount
(000)# | | | Value | |
|
CORPORATE BONDS (Continued) | |
|
Healthcare-Services 1.6% | |
Aetna, Inc., | | | | | | | | | | | | | | |
Sr. Unsec’d. Notes | | 2.800% | | | 06/15/23 | | | | 41,379 | | | $ | 42,397,942 | |
Anthem, Inc., | | | | | | | | | | | | | | |
Sr. Unsec’d. Notes | | 2.950 | | | 12/01/22 | | | | 22,580 | | | | 23,015,213 | |
Bon Secours Mercy Health, Inc., | | | | | | | | | | | | | | |
Sec’d. Notes | | 1.350 | | | 06/01/25 | | | | 2,775 | | | | 2,745,893 | |
Centene Corp., | | | | | | | | | | | | | | |
Sr. Unsec’d. Notes | | 2.450 | | | 07/15/28 | | | | 10,000 | | | | 9,891,899 | |
CommonSpirit Health, | | | | | | | | | | | | | | |
Sr. Sec’d. Notes | | 2.760 | | | 10/01/24 | | | | 23,576 | | | | 24,348,155 | |
HCA, Inc., | | | | | | | | | | | | | | |
Gtd. Notes | | 5.375 | | | 02/01/25 | | | | 35,000 | | | | 38,456,929 | |
Sr. Sec’d. Notes | | 4.750 | | | 05/01/23 | | | | 3,949 | | | | 4,138,001 | |
Sr. Sec’d. Notes | | 5.000 | | | 03/15/24 | | | | 7,500 | | | | 8,068,518 | |
Sr. Sec’d. Notes | | 5.250 | | | 04/15/25 | | | | 9,400 | | | | 10,414,124 | |
Health Care Service Corp. A Mutual Legal Reserve Co., | | | | | | | | | | | | | | |
Sr. Unsec’d. Notes, 144A(a) | | 1.500 | | | 06/01/25 | | | | 5,370 | | | | 5,365,818 | |
Humana, Inc., | | | | | | | | | | | | | | |
Sr. Unsec’d. Notes(a) | | 3.850 | | | 10/01/24 | | | | 3,500 | | | | 3,715,853 | |
Laboratory Corp. of America Holdings, | | | | | | | | | | | | | | |
Sr. Unsec’d. Notes | | 2.300 | | | 12/01/24 | | | | 15,525 | | | | 15,924,609 | |
Sr. Unsec’d. Notes | | 3.250 | | | 09/01/24 | | | | 2,320 | | | | 2,428,541 | |
PeaceHealth Obligated Group, | | | | | | | | | | | | | | |
Sr. Unsec’d. Notes, Series 2020 | | 1.375 | | | 11/15/25 | | | | 4,585 | | | | 4,561,253 | |
Quest Diagnostics, Inc., | | | | | | | | | | | | | | |
Sr. Unsec’d. Notes | | 3.450 | | | 06/01/26 | | | | 6,256 | | | | 6,694,587 | |
Roche Holdings, Inc. (Switzerland), | | | | | | | | | | | | | | |
Gtd. Notes, 144A | | 2.375 | | | 01/28/27 | | | | 10,800 | | | | 11,219,924 | |
Sutter Health, | | | | | | | | | | | | | | |
Unsec’d. Notes, Series 20A | | 1.321 | | | 08/15/25 | | | | 11,250 | | | | 11,207,026 | |
| | | | | | | | | | | | | | |
| | | | |
| | | | | | | | | | | | | 224,594,285 | |
| | | | |
Home Builders 0.3% | | | | | | | | | | | | | | |
D.R. Horton, Inc., | | | | | | | | | | | | | | |
Gtd. Notes | | 2.500 | | | 10/15/24 | | | | 20,165 | | | | 20,800,121 | |
Meritage Homes Corp., | | | | | | | | | | | | | | |
Gtd. Notes | | 5.125 | | | 06/06/27 | | | | 7,737 | | | | 8,538,554 | |
Gtd. Notes(a) | | 6.000 | | | 06/01/25 | | | | 1,644 | | | | 1,838,263 | |
Toll Brothers Finance Corp., | | | | | | | | | | | | | | |
Gtd. Notes | | 4.875 | | | 11/15/25 | | | | 10,000 | | | | 11,032,709 | |
| | | | | | | | | | | | | | |
| | | | |
| | | | | | | | | | | | | 42,209,647 | |
See Notes to Financial Statements.
| | | | | | | | | | | | | | |
| | | | |
| Description | | Interest
Rate | | Maturity
Date | | | Principal
Amount
(000)# | | | Value | |
|
CORPORATE BONDS (Continued) | |
|
Home Furnishings 0.4% | |
Panasonic Corp. (Japan), | | | | | | | | | | | | | | |
Sr. Unsec’d. Notes, 144A | | 2.536% | | | 07/19/22 | | | | 29,325 | | | $ | 29,573,110 | |
Sr. Unsec’d. Notes, 144A | | 2.679 | | | 07/19/24 | | | | 27,540 | | | | 28,380,408 | |
| | | | | | | | | | | | | | |
| | | | |
| | | | | | | | | | | | | 57,953,518 | |
| | | | |
Household Products/Wares 0.1% | | | | | | | | | | | | | | |
Church & Dwight Co., Inc., | | | | | | | | | | | | | | |
Sr. Unsec’d. Notes | | 2.450 | | | 08/01/22 | | | | 13,840 | | | | 13,969,214 | |
| | | | |
Housewares 0.4% | | | | | | | | | | | | | | |
Newell Brands, Inc., | | | | | | | | | | | | | | |
Sr. Unsec’d. Notes(a) | | 4.350 | | | 04/01/23 | | | | 30,200 | | | | 31,154,267 | |
Sr. Unsec’d. Notes(a) | | 4.700 | | | 04/01/26 | | | | 10,075 | | | | 10,988,681 | |
Sr. Unsec’d. Notes(a) | | 4.875 | | | 06/01/25 | | | | 7,500 | | | | 8,161,162 | |
| | | | | | | | | | | | | | |
| | | | |
| | | | | | | | | | | | | 50,304,110 | |
| | | | |
Insurance 1.2% | | | | | | | | | | | | | | |
American International Group, Inc., | | | | | | | | | | | | |
Sr. Unsec’d. Notes | | 3.900 | | | 04/01/26 | | | | 8,610 | | | | 9,346,997 | |
Sr. Unsec’d. Notes | | 4.125 | | | 02/15/24 | | | | 4,640 | | | | 4,927,327 | |
CNA Financial Corp., | | | | | | | | | | | | | | |
Sr. Unsec’d. Notes | | 3.450 | | | 08/15/27 | | | | 5,155 | | | | 5,553,431 | |
Sr. Unsec’d. Notes | | 3.950 | | | 05/15/24 | | | | 10,034 | | | | 10,591,008 | |
Great-West Lifeco US Finance 2020 LP (Canada), | | | | | | | | | | | | |
Gtd. Notes, 144A | | 0.904 | | | 08/12/25 | | | | 17,200 | | | | 16,707,581 | |
Liberty Mutual Group, Inc., | | | | | | | | | | | | | | |
Gtd. Notes, 144A | | 4.250 | | | 06/15/23 | | | | 14,168 | | | | 14,797,469 | |
Markel Corp., | | | | | | | | | | | | | | |
Sr. Unsec’d. Notes | | 4.900 | | | 07/01/22 | | | | 2,510 | | | | 2,562,422 | |
Principal Financial Group, Inc., | | | | | | | | | | | | | | |
Gtd. Notes | | 3.125 | | | 05/15/23 | | | | 3,500 | | | | 3,604,168 | |
Principal Life Global Funding II, | | | | | | | | | | | | |
Sr. Sec’d. Notes, 144A | | 0.875 | | | 01/12/26 | | | | 22,970 | | | | 22,258,124 | |
Protective Life Global Funding, | | | | | | | | | | | | | | |
Sec’d. Notes, 144A | | 1.082 | | | 06/09/23 | | | | 20,125 | | | | 20,186,083 | |
Unum Group, | | | | | | | | | | | | | | |
Sr. Unsec’d. Notes | | 4.000 | | | 03/15/24 | | | | 33,130 | | | | 34,976,036 | |
W.R. Berkley Corp., | | | | | | | | | | | | | | |
Sr. Unsec’d. Notes | | 4.625 | | | 03/15/22 | | | | 16,075 | | | | 16,197,239 | |
| | | | | | | | | | | | | | |
| | | | |
| | | | | | | | | | | | | 161,707,885 | |
See Notes to Financial Statements.
| | | | |
PGIM Short-Term Corporate Bond Fund | | | 33 | |
Schedule of Investments (continued)
as of December 31, 2021
| | | | | | | | | | | | | | |
| Description | | Interest
Rate | | Maturity
Date | | | Principal
Amount
(000)# | | | Value | |
| | | | |
CORPORATE BONDS (Continued) | | | | | | | | | | | | | | |
| | | | |
Internet 0.2% | | | | | | | | | | | | | | |
Amazon.com, Inc., | | | | | | | | | | | | | | |
Sr. Unsec’d. Notes(a) | | 1.650% | | | 05/12/28 | | | | 17,390 | | | $ | 17,376,585 | |
Expedia Group, Inc., | | | | | | | | | | | | | | |
Gtd. Notes | | 4.625 | | | 08/01/27 | | | | 14,500 | | | | 16,204,230 | |
| | | | | | | | | | | | | | |
| | | | |
| | | | | | | | | | | | | 33,580,815 | |
| | | | |
Iron/Steel 0.3% | | | | | | | | | | | | | | |
Reliance Steel & Aluminum Co., | | | | | | | | | | | | | | |
Sr. Unsec’d. Notes | | 1.300 | | | 08/15/25 | | | | 9,130 | | | | 9,000,930 | |
Steel Dynamics, Inc., | | | | | | | | | | | | | | |
Sr. Unsec’d. Notes | | 1.650 | | | 10/15/27 | | | | 7,750 | | | | 7,598,320 | |
Sr. Unsec’d. Notes | | 2.400 | | | 06/15/25 | | | | 3,100 | | | | 3,180,251 | |
Sr. Unsec’d. Notes | | 2.800 | | | 12/15/24 | | | | 16,543 | | | | 17,171,881 | |
| | | | | | | | | | | | | | |
| | | | |
| | | | | | | | | | | | | 36,951,382 | |
| | | | |
Lodging 0.7% | | | | | | | | | | | | | | |
Genting New York LLC/GENNY Capital, Inc., | | | | | | | | | | | | | | |
Sr. Unsec’d. Notes, 144A(a) | | 3.300 | | | 02/15/26 | | | | 1,750 | | | | 1,732,547 | |
Hyatt Hotels Corp., | | | | | | | | | | | | | | |
Sr. Unsec’d. Notes, SOFR + 1.050% | | 1.100(c) | | | 10/01/23 | | | | 14,695 | | | | 14,723,980 | |
Sr. Unsec’d. Notes | | 1.300 | | | 10/01/23 | | | | 11,760 | | | | 11,765,745 | |
Las Vegas Sands Corp., | | | | | | | | | | | | | | |
Sr. Unsec’d. Notes | | 3.200 | | | 08/08/24 | | | | 19,205 | | | | 19,516,290 | |
Marriott International, Inc., | | | | | | | | | | | | | | |
Sr. Unsec’d. Notes(a) | | 2.300 | | | 01/15/22 | | | | 36,420 | | | | 36,435,685 | |
Sr. Unsec’d. Notes, Series EE(a) | | 5.750 | | | 05/01/25 | | | | 9,250 | | | | 10,416,907 | |
MGM Resorts International, | | | | | | | | | | | | | | |
Gtd. Notes | | 6.000 | | | 03/15/23 | | | | 3,000 | | | | 3,151,147 | |
| | | | | | | | | | | | | | |
| | | | |
| | | | | | | | | | | | | 97,742,301 | |
| | | | |
Machinery-Construction & Mining 0.2% | | | | | | | | | | | | | | |
Weir Group PLC (The) (United Kingdom), | | | | | | | | | | | | | | |
Sr. Unsec’d. Notes, 144A | | 2.200 | | | 05/13/26 | | | | 28,970 | | | | 28,738,661 | |
| | | | |
Machinery-Diversified 0.4% | | | | | | | | | | | | | | |
Otis Worldwide Corp., | | | | | | | | | | | | | | |
Sr. Unsec’d. Notes(a) | | 2.293 | | | 04/05/27 | | | | 13,945 | | | | 14,218,944 | |
Westinghouse Air Brake Technologies Corp., | | | | | | | | | | | | | | |
Gtd. Notes | | 3.200 | | | 06/15/25 | | | | 4,000 | | | | 4,174,818 | |
Gtd. Notes | | 3.450 | | | 11/15/26 | | | | 25,396 | | | | 26,941,278 | |
See Notes to Financial Statements.
| | | | | | | | | | | | | | |
| | | | |
| Description | | Interest
Rate | | Maturity
Date | | | Principal
Amount
(000)# | | | Value | |
| | | | |
CORPORATE BONDS (Continued) | | | | | | | | | | | | | | |
| | | | |
Machinery-Diversified (cont’d.) | | | | | | | | | | | | | | |
Westinghouse Air Brake Technologies Corp., (cont’d.) | | | | | | | | | | | | | | |
Gtd. Notes | | 4.375% | | | 08/15/23 | | | | 1,720 | | | $ | 1,785,150 | |
Gtd. Notes | | 4.400 | | | 03/15/24 | | | | 3,900 | | | | 4,134,261 | |
Gtd. Notes | | 4.950 | | | 09/15/28 | | | | 8,770 | | | | 9,968,599 | |
| | | | | | | | | | | | | | |
| | | | |
| | | | | | | | | | | | | 61,223,050 | |
| | | | |
Media 1.9% | | | | | | | | | | | | | | |
Charter Communications Operating LLC/Charter | | | | | | | | | | | | | | |
Communications Operating Capital, | | | | | | | | | | | | | | |
Sr. Sec’d. Notes | | 2.250 | | | 01/15/29 | | | | 29,870 | | | | 29,213,912 | |
Sr. Sec’d. Notes | | 4.464 | | | 07/23/22 | | | | 49,305 | | | | 50,061,250 | |
Sr. Sec’d. Notes | | 4.908 | | | 07/23/25 | | | | 42,252 | | | | 46,537,973 | |
Comcast Corp., | | | | | | | | | | | | | | |
Gtd. Notes | | 3.375 | | | 08/15/25 | | | | 6,908 | | | | 7,371,461 | |
Gtd. Notes(a) | | 3.700 | | | 04/15/24 | | | | 11,340 | | | | 12,051,198 | |
Gtd. Notes | | 3.950 | | | 10/15/25 | | | | 23,007 | | | | 25,153,129 | |
Cox Communications, Inc., | | | | | | | | | | | | | | |
Sr. Unsec’d. Notes, 144A | | 3.150 | | | 08/15/24 | | | | 8,803 | | | | 9,174,205 | |
Sr. Unsec’d. Notes, 144A | | 3.350 | | | 09/15/26 | | | | 17,183 | | | | 18,271,969 | |
Sr. Unsec’d. Notes, 144A | | 3.500 | | | 08/15/27 | | | | 520 | | | | 559,124 | |
ViacomCBS, Inc., | | | | | | | | | | | | | | |
Jr. Sub. Notes(a) | | 5.875(ff) | | | 02/28/57 | | | | 5,449 | | | | 5,435,970 | |
Sr. Unsec’d. Notes | | 3.500 | | | 01/15/25 | | | | 5,000 | | | | 5,271,927 | |
Sr. Unsec’d. Notes | | 4.750 | | | 05/15/25 | | | | 41,757 | | | | 45,837,996 | |
| | | | | | | | | | | | | | |
| | | | |
| | | | | | | | | | | | | 254,940,114 | |
| | | | |
Mining 0.3% | | | | | | | | | | | | | | |
Kinross Gold Corp. (Canada), | | | | | | | | | | | | | | |
Gtd. Notes | | 5.950 | | | 03/15/24 | | | | 11,414 | | | | 12,385,323 | |
Teck Resources Ltd. (Canada), | | | | | | | | | | | | | | |
Sr. Unsec’d. Notes | | 3.750 | | | 02/01/23 | | | | 8,065 | | | | 8,181,661 | |
Sr. Unsec’d. Notes | | 4.750 | | | 01/15/22 | | | | 14,157 | | | | 14,168,101 | |
Yamana Gold, Inc. (Canada), | | | | | | | | | | | | | | |
Gtd. Notes | | 4.625 | | | 12/15/27 | | | | 1,925 | | | | 2,096,481 | |
| | | | | | | | | | | | | | |
| | | | |
| | | | | | | | | | | | | 36,831,566 | |
| | | | |
Miscellaneous Manufacturing 0.6% | | | | | | | | | | | | | | |
Hillenbrand, Inc., | | | | | | | | | | | | | | |
Gtd. Notes | | 5.000 | | | 09/15/26 | | | | 16,150 | | | | 17,989,267 | |
See Notes to Financial Statements.
| | | | |
PGIM Short-Term Corporate Bond Fund | | | 35 | |
Schedule of Investments (continued)
as of December 31, 2021
| | | | | | | | | | | | | | | | |
| | | | |
| Description | | Interest
Rate | | | Maturity
Date | | | Principal
Amount
(000)# | | | Value | |
|
CORPORATE BONDS (Continued) | |
|
Miscellaneous Manufacturing (cont’d.) | |
Pentair Finance Sarl, | | | | | | | | | | | | | | | | |
Gtd. Notes | | | 3.150% | | | | 09/15/22 | | | | 25,000 | | | $ | 25,086,423 | |
Siemens Financieringsmaatschappij NV (Germany), | | | | | | | | | | | | | | | | |
Gtd. Notes, 144A | | | 1.200 | | | | 03/11/26 | | | | 25,200 | | | | 24,847,724 | |
Gtd. Notes, 144A | | | 1.700 | | | | 03/11/28 | | | | 9,700 | | | | 9,604,780 | |
Textron, Inc., | | | | | | | | | | | | | | | | |
Sr. Unsec’d. Notes | | | 3.650 | | | | 03/15/27 | | | | 5,946 | | | | 6,388,920 | |
Sr. Unsec’d. Notes | | | 3.875 | | | | 03/01/25 | | | | 2,750 | | | | 2,932,967 | |
| | | | | | | | | | | | | | | | |
| | | | |
| | | | | | | | | | | | | | | 86,850,081 | |
| | | | |
Office/Business Equipment 0.3% | | | | | | | | | | | | | | | | |
CDW LLC/CDW Finance Corp., | | | | | | | | | | | | | | | | |
Gtd. Notes | | | 2.670 | | | | 12/01/26 | | | | 26,185 | | | | 26,869,884 | |
Gtd. Notes | | | 5.500 | | | | 12/01/24 | | | | 13,500 | | | | 14,778,098 | |
| | | | | | | | | | | | | | | | |
| | | | |
| | | | | | | | | | | | | | | 41,647,982 | |
| | | | |
Oil & Gas 3.6% | | | | | | | | | | | | | | | | |
Aker BP ASA (Norway), | | | | | | | | | | | | | | | | |
Sr. Unsec’d. Notes, 144A | | | 3.000 | | | | 01/15/25 | | | | 34,734 | | | | 36,070,961 | |
BP Capital Markets America, Inc., | | | | | | | | | | | | | | | | |
Gtd. Notes | | | 3.790 | | | | 02/06/24 | | | | 10,800 | | | | 11,399,148 | |
Canadian Natural Resources Ltd. (Canada), | | | | | | | | | | | | | | | | |
Sr. Unsec’d. Notes(a) | | | 2.950 | | | | 01/15/23 | | | | 11,400 | | | | 11,611,143 | |
Continental Resources, Inc., | | | | | | | | | | | | | | | | |
Gtd. Notes(a) | | | 3.800 | | | | 06/01/24 | | | | 29,715 | | | | 31,017,703 | |
Gtd. Notes(a) | | | 4.500 | | | | 04/15/23 | | | | 5,035 | | | | 5,198,153 | |
Gtd. Notes, 144A | | | 2.268 | | | | 11/15/26 | | | | 5,875 | | | | 5,834,108 | |
Devon Energy Corp., | | | | | | | | | | | | | | | | |
Sr. Unsec’d. Notes | | | 5.250 | | | | 10/15/27 | | | | 22,365 | | | | 23,556,514 | |
Sr. Unsec’d. Notes(a) | | | 5.875 | | | | 06/15/28 | | | | 4,000 | | | | 4,337,436 | |
Diamondback Energy, Inc., | | | | | | | | | | | | | | | | |
Gtd. Notes | | | 2.875 | | | | 12/01/24 | | | | 57,275 | | | | 59,461,751 | |
Gtd. Notes | | | 3.250 | | | | 12/01/26 | | | | 7,050 | | | | 7,441,994 | |
Exxon Mobil Corp., | | | | | | | | | | | | | | | | |
Sr. Unsec’d. Notes | | | 2.992 | | | | 03/19/25 | | | | 20,000 | | | | 21,037,451 | |
Lundin Energy Finance BV (Netherlands), | | | | | | | | | | | | | | | | |
Gtd. Notes, 144A | | | 2.000 | | | | 07/15/26 | | | | 34,855 | | | | 34,691,580 | |
Marathon Petroleum Corp., | | | | | | | | | | | | | | | | |
Sr. Unsec’d. Notes(a) | | | 3.800 | | | | 04/01/28 | | | | 7,265 | | | | 7,821,033 | |
Occidental Petroleum Corp., | | | | | | | | | | | | | | | | |
Sr. Unsec’d. Notes | | | 5.120(s) | | | | 10/10/36 | | | | 34,230 | | | | 19,433,651 | |
See Notes to Financial Statements.
| | | | | | | | | | | | | | | | |
| | | | |
| Description | | Interest
Rate | | | Maturity
Date | | | Principal
Amount
(000)# | | | Value | |
|
CORPORATE BONDS (Continued) | |
|
Oil & Gas (cont’d.) | |
| | | | |
Ovintiv Exploration, Inc., | | | | | | | | | | | | | | | | |
Gtd. Notes | | | 5.375% | | | | 01/01/26 | | | | 10,426 | | | $ | 11,569,769 | |
Gtd. Notes | | | 5.625 | | | | 07/01/24 | | | | 49,582 | | | | 54,633,187 | |
Parsley Energy LLC/Parsley Finance Corp., | | | | | | | | | | | | | | | | |
Gtd. Notes, 144A(a) | | | 5.625 | | | | 10/15/27 | | | | 22,598 | | | | 23,753,371 | |
Petroleos Mexicanos (Mexico), | | | | | | | | | | | | | | | | |
Gtd. Notes | | | 6.490 | | | | 01/23/27 | | | | 18,100 | | | | 19,301,248 | |
Gtd. Notes | | | 6.840 | | | | 01/23/30 | | | | 31,103 | | | | 32,253,014 | |
Pioneer Natural Resources Co., | | | | | | | | | | | | | | | | |
Sr. Unsec’d. Notes | | | 0.750 | | | | 01/15/24 | | | | 16,015 | | | | 15,832,401 | |
Sr. Unsec’d. Notes | | | 1.125 | | | | 01/15/26 | | | | 10,955 | | | | 10,655,642 | |
Sr. Unsec’d. Notes(a) | | | 4.450 | | | | 01/15/26 | | | | 25,000 | | | | 27,335,660 | |
Valero Energy Corp., | | | | | | | | | | | | | | | | |
Sr. Unsec’d. Notes(a) | | | 2.150 | | | | 09/15/27 | | | | 8,120 | | | | 8,108,230 | |
Sr. Unsec’d. Notes | | | 2.850 | | | | 04/15/25 | | | | 4,600 | | | | 4,778,859 | |
| | | | | | | | | | | | | | | | |
| | | | |
| | | | | | | | | | | | | | | 487,134,007 | |
| | | | |
Oil & Gas Services 0.2% | | | | | | | | | | | | | | | | |
| | | | |
Baker Hughes Holdings LLC/Baker Hughes Co-Obligor, Inc., | | | | | | | | | | | | | | | | |
Sr. Unsec’d. Notes | | | 2.773 | | | | 12/15/22 | | | | 21,720 | | | | 22,148,500 | |
| | | | |
Packaging & Containers 1.8% | | | | | | | | | | | | | | | | |
| | | | |
Ball Corp., | | | | | | | | | | | | | | | | |
Gtd. Notes(a) | | | 4.875 | | | | 03/15/26 | | | | 21,297 | | | | 23,438,300 | |
Gtd. Notes | | | 5.250 | | | | 07/01/25 | | | | 8,000 | | | | 8,812,581 | |
Berry Global, Inc., | | | | | | | | | | | | | | | | |
Sr. Sec’d. Notes | | | 0.950 | | | | 02/15/24 | | | | 11,905 | | | | 11,784,032 | |
Sr. Sec’d. Notes | | | 1.570 | | | | 01/15/26 | | | | 56,497 | | | | 55,296,530 | |
Graphic Packaging International LLC, | | | | | | | | | | | | | | | | |
Sr. Sec’d. Notes, 144A | | | 0.821 | | | | 04/15/24 | | | | 62,445 | | | | 61,468,705 | |
Sealed Air Corp., | | | | | | | | | | | | | | | | |
Gtd. Notes, 144A | | | 5.500 | | | | 09/15/25 | | | | 38,203 | | | | 42,262,740 | |
Sr. Sec’d. Notes, 144A | | | 1.573 | | | | 10/15/26 | | | | 12,875 | | | | 12,490,514 | |
Silgan Holdings, Inc., | | | | | | | | | | | | | | | | |
Sr. Sec’d. Notes, 144A | | | 1.400 | | | | 04/01/26 | | | | 11,575 | | | | 11,272,358 | |
WRKCo, Inc., | | | | | | | | | | | | | | | | |
Gtd. Notes | | | 3.375 | | | | 09/15/27 | | | | 4,950 | | | | 5,262,400 | |
Gtd. Notes | | | 3.750 | | | | 03/15/25 | | | | 10,190 | | | | 10,873,742 | |
| | | | | | | | | | | | | | | | |
| | | | |
| | | | | | | | | | | | | | | 242,961,902 | |
See Notes to Financial Statements.
| | | | |
PGIM Short-Term Corporate Bond Fund | | | 37 | |
Schedule of Investments (continued)
as of December 31, 2021
| | | | | | | | | | | | | | | | |
| | | | |
| Description | | Interest
Rate | | | Maturity
Date | | | Principal
Amount
(000)# | | | Value | |
| | | | |
CORPORATE BONDS (Continued) | | | | | | | | | | | | | | | | |
| | | | |
Pharmaceuticals 4.3% | | | | | | | | | | | | | | | | |
| | | | |
AbbVie, Inc., | | | | | | | | | | | | | | | | |
Sr. Unsec’d. Notes | | | 2.600% | | | | 11/21/24 | | | | 24,939 | | | $ | 25,865,871 | |
Sr. Unsec’d. Notes | | | 2.950 | | | | 11/21/26 | | | | 58,721 | | | | 61,855,437 | |
Sr. Unsec’d. Notes | | | 3.600 | | | | 05/14/25 | | | | 23,064 | | | | 24,510,720 | |
Sr. Unsec’d. Notes | | | 3.800 | | | | 03/15/25 | | | | 26,273 | | | | 28,026,921 | |
Sr. Unsec’d. Notes(a) | | | 3.850 | | | | 06/15/24 | | | | 36,962 | | | | 39,078,631 | |
Allergan Funding SCS, | | | | | | | | | | | | | | | | |
Gtd. Notes | | | 3.450 | | | | 03/15/22 | | | | 1,350 | | | | 1,351,461 | |
Gtd. Notes(a) | | | 3.800 | | | | 03/15/25 | | | | 13,136 | | | | 13,825,983 | |
Bayer US Finance II LLC (Germany), | | | | | | | | | | | | | | | | |
Gtd. Notes, 144A | | | 2.200 | | | | 07/15/22 | | | | 14,455 | | | | 14,509,065 | |
Gtd. Notes, 144A | | | 3.375 | | | | 07/15/24 | | | | 10,600 | | | | 11,041,831 | |
Gtd. Notes, 144A | | | 3.875 | | | | 12/15/23 | | | | 14,490 | | | | 15,151,029 | |
Gtd. Notes, 144A | | | 4.250 | | | | 12/15/25 | | | | 4,913 | | | | 5,330,601 | |
Becton, Dickinson & Co., | | | | | | | | | | | | | | | | |
Sr. Unsec’d. Notes | | | 3.363 | | | | 06/06/24 | | | | 11,327 | | | | 11,859,682 | |
Bristol-Myers Squibb Co., | | | | | | | | | | | | | | | | |
Sr. Unsec’d. Notes | | | 2.750 | | | | 02/15/23 | | | | 30,500 | | | | 31,149,175 | |
Sr. Unsec’d. Notes | | | 2.900 | | | | 07/26/24 | | | | 7,477 | | | | 7,816,458 | |
Sr. Unsec’d. Notes | | | 3.875 | | | | 08/15/25 | | | | 1,885 | | | | 2,040,736 | |
Cardinal Health, Inc., | | | | | | | | | | | | | | | | |
Sr. Unsec’d. Notes | | | 3.200 | | | | 03/15/23 | | | | 21,299 | | | | 21,847,354 | |
Cigna Corp., | | | | | | | | | | | | | | | | |
Gtd. Notes | | | 3.050 | | | | 11/30/22 | | | | 14,900 | | | | 15,188,069 | |
Gtd. Notes | | | 3.250 | | | | 04/15/25 | | | | 14,615 | | | | 15,399,021 | |
Gtd. Notes | | | 3.400 | | | | 03/01/27 | | | | 36,034 | | | | 38,774,415 | |
Gtd. Notes | | | 3.500 | | | | 06/15/24 | | | | 7,000 | | | | 7,347,663 | |
Gtd. Notes | | | 4.500 | | | | 02/25/26 | | | | 26,568 | | | | 29,438,442 | |
CVS Health Corp., | | | | | | | | | | | | | | | | |
Sr. Unsec’d. Notes | | | 3.875 | | | | 07/20/25 | | | | 19,000 | | | | 20,436,642 | |
Sr. Unsec’d. Notes | | | 4.300 | | | | 03/25/28 | | | | 16,373 | | | | 18,386,015 | |
Sr. Unsec’d. Notes | | | 5.000 | | | | 12/01/24 | | | | 28,966 | | | | 31,644,720 | |
Sr. Unsec’d. Notes | | | 6.250 | | | | 06/01/27 | | | | 1,000 | | | | 1,209,400 | |
EMD Finance LLC (Germany), | | | | | | | | | | | | | | | | |
Gtd. Notes, 144A | | | 3.250 | | | | 03/19/25 | | | | 5,000 | | | | 5,270,753 | |
Mylan, Inc., | | | | | | | | | | | | | | | | |
Gtd. Notes | | | 4.200 | | | | 11/29/23 | | | | 5,085 | | | | 5,332,768 | |
Gtd. Notes, 144A | | | 3.125 | | | | 01/15/23 | | | | 26,100 | | | | 26,678,255 | |
Perrigo Co. PLC, | | | | | | | | | | | | | | | | |
Sr. Unsec’d. Notes | | | 4.000 | | | | 11/15/23 | | | | 4,878 | | | | 5,017,618 | |
See Notes to Financial Statements.
| | | | | | | | | | | | | | | | |
| | | | |
| Description | | Interest
Rate | | | Maturity
Date | | | Principal
Amount
(000)# | | | Value | |
| | | | |
CORPORATE BONDS (Continued) | | | | | | | | | | | | | | | | |
| | | | |
Pharmaceuticals (cont’d.) | | | | | | | | | | | | | | | | |
| | | | |
Shire Acquisitions Investments Ireland DAC, | | | | | | | | | | | | | | | | |
Gtd. Notes | | | 2.875% | | | | 09/23/23 | | | | 31,385 | | | $ | 32,271,479 | |
Viatris, Inc., | | | | | | | | | | | | | | | | |
Gtd. Notes(a) | | | 2.300 | | | | 06/22/27 | | | | 17,625 | | | | 17,781,011 | |
| | | | | | | | | | | | | | | | |
| | | | |
| | | | | | | | | | | | | | | 585,437,226 | |
| | | | |
| Pipelines 2.8% | | | | | | | | | | | | |
| | | | |
El Paso Natural Gas Co. LLC, | | | | | | | | | | | | | | | | |
Gtd. Notes | | | 8.625 | | | | 01/15/22 | | | | 2,675 | | | | 2,681,459 | |
Energy Transfer LP, | | | | | | | | | | | | | | | | |
Jr. Sub. Notes, Series G | | | 7.125(ff) | | | | 05/15/30(oo) | | | | 12,892 | | | | 13,154,863 | |
Sr. Unsec’d. Notes | | | 4.050 | | | | 03/15/25 | | | | 2,092 | | | | 2,216,290 | |
Sr. Unsec’d. Notes | | | 5.875 | | | | 01/15/24 | | | | 64,160 | | | | 69,234,787 | |
EnLink Midstream Partners LP, | | | | | | | | | | | | | | | | |
Sr. Unsec’d. Notes | | | 4.400 | | | | 04/01/24 | | | | 3,675 | | | | 3,864,808 | |
Enterprise Products Operating LLC, | | | | | | | | | | | | | | | | |
Gtd. Notes, Series D | | | 4.875(ff) | | | | 08/16/77 | | | | 9,500 | | | | 8,924,082 | |
EQM Midstream Partners LP, | | | | | | | | | | | | | | | | |
Sr. Unsec’d. Notes(a) | | | 4.750 | | | | 07/15/23 | | | | 1,566 | | | | 1,627,209 | |
Kinder Morgan Energy Partners LP, | | | | | | | | | | | | | | | | |
Gtd. Notes | | | 3.950 | | | | 09/01/22 | | | | 10,000 | | | | 10,134,186 | |
Gtd. Notes | | | 4.150 | | | | 02/01/24 | | | | 16,886 | | | | 17,768,291 | |
Kinder Morgan, Inc., | | | | | | | | | | | | | | | | |
Gtd. Notes(a) | | | 1.750 | | | | 11/15/26 | | | | 9,165 | | | | 9,142,318 | |
Magellan Midstream Partners LP, | | | | | | | | | | | | | | | | |
Sr. Unsec’d. Notes | | | 3.200 | | | | 03/15/25 | | | | 2,900 | | | | 3,003,256 | |
Midwest Connector Capital Co. LLC, | | | | | | | | | | | | | | | | |
Gtd. Notes, 144A(a) | | | 3.625 | | | | 04/01/22 | | | | 3,165 | | | | 3,180,516 | |
Gtd. Notes, 144A | | | 3.900 | | | | 04/01/24 | | | | 5,090 | | | | 5,281,225 | |
MPLX LP, | | | | | | | | | | | | | | | | |
Sr. Unsec’d. Notes | | | 1.750 | | | | 03/01/26 | | | | 9,740 | | | | 9,672,955 | |
Sr. Unsec’d. Notes | | | 3.375 | | | | 03/15/23 | | | | 1,872 | | | | 1,919,986 | |
Sr. Unsec’d. Notes(a) | | | 4.125 | | | | 03/01/27 | | | | 11,570 | | | | 12,660,017 | |
Sr. Unsec’d. Notes | | | 4.500 | | | | 07/15/23 | | | | 7,725 | | | | 8,047,426 | |
Sr. Unsec’d. Notes | | | 4.875 | | | | 12/01/24 | | | | 12,760 | | | | 13,866,844 | |
Sr. Unsec’d. Notes | | | 4.875 | | | | 06/01/25 | | | | 12,500 | | | | 13,678,817 | |
ONEOK Partners LP, | | | | | | | | | | | | | | | | |
Gtd. Notes | | | 3.375 | | | | 10/01/22 | | | | 6,670 | | | | 6,756,017 | |
ONEOK, Inc., | | | | | | | | | | | | | | | | |
Gtd. Notes | | | 2.750 | | | | 09/01/24 | | | | 22,520 | | | | 23,199,936 | |
Gtd. Notes(a) | | | 5.850 | | | | 01/15/26 | | | | 11,177 | | | | 12,849,127 | |
See Notes to Financial Statements.
| | | | |
PGIM Short-Term Corporate Bond Fund | | | 39 | |
Schedule of Investments (continued)
as of December 31, 2021
| | | | | | | | | | | | | | | | |
| | | | |
| Description | | Interest
Rate | | | Maturity
Date | | | Principal
Amount
(000)# | | | Value | |
|
CORPORATE BONDS (Continued) | |
|
Pipelines (cont’d.) | |
| | | | |
Phillips 66 Partners LP, | | | | | | | | | | | | | | | | |
Sr. Unsec’d. Notes | | | 2.450% | | | | 12/15/24 | | | | 14,860 | | | $ | 15,221,132 | |
Sr. Unsec’d. Notes | | | 3.605 | | | | 02/15/25 | | | | 2,500 | | | | 2,634,884 | |
Sr. Unsec’d. Notes | | | 3.750 | | | | 03/01/28 | | | | 12,095 | | | | 12,995,059 | |
Plains All American Pipeline LP/PAA Finance Corp., | | | | | | | | | | | | | | | | |
Sr. Unsec’d. Notes | | | 2.850 | | | | 01/31/23 | | | | 7,555 | | | | 7,663,858 | |
Sr. Unsec’d. Notes | | | 3.600 | | | | 11/01/24 | | | | 10,000 | | | | 10,460,325 | |
Sr. Unsec’d. Notes(a) | | | 4.650 | | | | 10/15/25 | | | | 16,430 | | | | 17,922,503 | |
Rockies Express Pipeline LLC, | | | | | | | | | | | | | | | | |
Sr. Unsec’d. Notes, 144A | | | 3.600 | | | | 05/15/25 | | | | 12,970 | | | | 13,360,763 | |
Tennessee Gas Pipeline Co. LLC, | | | | | | | | | | | | | | | | |
Gtd. Notes | | | 7.000 | | | | 03/15/27 | | | | 3,575 | | | | 4,438,735 | |
Texas Eastern Transmission LP, | | | | | | | | | | | | | | | | |
Sr. Unsec’d. Notes, 144A | | | 2.800 | | | | 10/15/22 | | | | 1,500 | | | | 1,516,108 | |
Western Midstream Operating LP, | | | | | | | | | | | | | | | | |
Sr. Unsec’d. Notes | | | 4.000 | | | | 07/01/22 | | | | 13,191 | | | | 13,249,939 | |
Williams Cos., Inc. (The), | | | | | | | | | | | | | | | | |
Sr. Unsec’d. Notes | | | 3.350 | | | | 08/15/22 | | | | 2,078 | | | | 2,097,823 | |
Sr. Unsec’d. Notes | | | 4.300 | | | | 03/04/24 | | | | 22,995 | | | | 24,312,896 | |
Sr. Unsec’d. Notes | | | 4.500 | | | | 11/15/23 | | | | 10,697 | | | | 11,277,048 | |
| | | | | | | | | | | | | | | | |
| | | | |
| | | | | | | | | | | | | | | 390,015,488 | |
| | | | |
Real Estate 0.2% | | | | | | | | | | | | | | | | |
| | | | |
Ontario Teachers’ Cadillac Fairview Properties Trust (Canada), | | | | | | | | | | | | | | | | |
Sr. Unsec’d. Notes, 144A | | | 3.125 | | | | 03/20/22 | | | | 18,000 | | | | 18,059,458 | |
Sr. Unsec’d. Notes, 144A | | | 3.875 | | | | 03/20/27 | | | | 12,558 | | | | 13,733,705 | |
| | | | | | | | | | | | | | | | |
| | | | |
| | | | | | | | | | | | | | | 31,793,163 | |
| | | | |
Real Estate Investment Trusts (REITs) 2.8% | | | | | | | | | | | | | | | | |
| | | | |
AvalonBay Communities, Inc., | | | | | | | | | | | | | | | | |
Sr. Unsec’d. Notes, GMTN | | | 3.450 | | | | 06/01/25 | | | | 5,774 | | | | 6,136,992 | |
Brandywine Operating Partnership LP, | | | | | | | | | | | | | | | | |
Gtd. Notes | | | 3.950 | | | | 02/15/23 | | | | 5,450 | | | | 5,583,024 | |
Gtd. Notes | | | 4.100 | | | | 10/01/24 | | | | 15,500 | | | | 16,370,990 | |
Brixmor Operating Partnership LP, | | | | | | | | | | | | | | | | |
Sr. Unsec’d. Notes | | | 2.250 | | | | 04/01/28 | | | | 26,313 | | | | 26,267,257 | |
Corporate Office Properties LP, | | | | | | | | | | | | | | | | |
Gtd. Notes | | | 2.250 | | | | 03/15/26 | | | | 6,860 | | | | 6,931,211 | |
Crown Castle International Corp., | | | | | | | | | | | | | | | | |
Sr. Unsec’d. Notes | | | 1.350 | | | | 07/15/25 | | | | 8,630 | | | | 8,533,832 | |
See Notes to Financial Statements.
| | | | | | | | | | | | |
| | | | |
| Description | | Interest
Rate | | Maturity
Date | | Principal
Amount
(000)# | | | Value | |
|
CORPORATE BONDS (Continued) | |
| | | | |
Real Estate Investment Trusts (REITs) (cont’d.) | | | | | | | | | | | | |
|
CyrusOne LP/CyrusOne Finance Corp., | |
Gtd. Notes(a) | | 2.900% | | 11/15/24 | | | 14,450 | | | $ | 14,946,780 | |
Essex Portfolio LP, | | | | | | | | | | | | |
Gtd. Notes | | 1.700 | | 03/01/28 | | | 27,550 | | | | 26,887,758 | |
GLP Capital LP/GLP Financing II, Inc., | | | | | | | | | | | | |
Gtd. Notes | | 3.350 | | 09/01/24 | | | 15,603 | | | | 16,179,482 | |
Gtd. Notes | | 5.250 | | 06/01/25 | | | 28,802 | | | | 31,647,758 | |
Gtd. Notes(a) | | 5.375 | | 04/15/26 | | | 12,355 | | | | 13,799,823 | |
Host Hotels & Resorts LP, | | | | | | | | | | | | |
Sr. Unsec’d. Notes | | 3.875 | | 04/01/24 | | | 3,700 | | | | 3,871,421 | |
Sr. Unsec’d. Notes, Series F(a) | | 4.500 | | 02/01/26 | | | 4,000 | | | | 4,302,377 | |
Invitation Homes Operating Partnership LP, | | | | | | | | | | | | |
Gtd. Notes | | 2.300 | | 11/15/28 | | | 11,480 | | | | 11,364,380 | |
Kimco Realty Corp., | | | | | | | | | | | | |
Sr. Unsec’d. Notes | | 1.900 | | 03/01/28 | | | 35,310 | | | | 34,834,119 | |
Public Storage, | | | | | | | | | | | | |
Sr. Unsec’d. Notes(a) | | 1.950 | | 11/09/28 | | | 27,385 | | | | 27,342,116 | |
Realty Income Corp., | | | | | | | | | | | | |
Sr. Unsec’d. Notes | | 2.200 | | 06/15/28 | | | 11,225 | | | | 11,338,292 | |
Sr. Unsec’d. Notes(a) | | 3.400 | | 01/15/28 | | | 31,500 | | | | 33,998,788 | |
Sr. Unsec’d. Notes | | 4.600 | | 02/06/24 | | | 14,000 | | | | 14,886,272 | |
Sabra Health Care LP, | | | | | | | | | | | | |
Gtd. Notes(a) | | 5.125 | | 08/15/26 | | | 8,950 | | | | 9,860,069 | |
Simon Property Group LP, | | | | | | | | | | | | |
Sr. Unsec’d. Notes | | 2.000 | | 09/13/24 | | | 16,800 | | | | 17,106,789 | |
Spirit Realty LP, | | | | | | | | | | | | |
Gtd. Notes | | 2.100 | | 03/15/28 | | | 14,165 | | | | 13,853,993 | |
Welltower, Inc., | | | | | | | | | | | | |
Sr. Unsec’d. Notes | | 2.700 | | 02/15/27 | | | 6,385 | | | | 6,656,438 | |
Sr. Unsec’d. Notes | | 3.625 | | 03/15/24 | | | 4,900 | | | | 5,153,390 | |
Weyerhaeuser Co., | | | | | | | | | | | | |
Sr. Unsec’d. Notes | | 8.500 | | 01/15/25 | | | 7,400 | | | | 8,917,559 | |
WP Carey, Inc., | | | | | | | | | | | | |
Sr. Unsec’d. Notes | | 4.250 | | 10/01/26 | | | 1,100 | | | | 1,205,392 | |
| | | | | | | | | | | | |
| | | | |
| | | | | | | | | | | 377,976,302 | |
Retail 1.0% | | | | | | | | | | | | |
| | | | |
7-Eleven, Inc., | | | | | | | | | | | | |
Sr. Unsec’d. Notes, 144A | | 0.800 | | 02/10/24 | | | 16,850 | | | | 16,656,485 | |
Alimentation Couche-Tard, Inc. (Canada), | | | | | | | | | | | | |
Gtd. Notes, 144A | | 3.550 | | 07/26/27 | | | 24,993 | | | | 26,758,414 | |
See Notes to Financial Statements.
| | | | |
PGIM Short-Term Corporate Bond Fund | | | 41 | |
Schedule of Investments (continued)
as of December 31, 2021
| | | | | | | | | | | | | | | | |
| | | | |
| Description | | Interest
Rate | | | Maturity
Date | | | Principal
Amount
(000)# | | | Value | |
| | | | |
CORPORATE BONDS (Continued) | | | | | | | | | | | | | | | | |
| | | | |
Retail (cont’d.) | | | | | | | | | | | | | | | | |
| | | | |
AutoZone, Inc., | | | | | | | | | | | | | | | | |
Sr. Unsec’d. Notes | | | 3.125% | | | | 04/18/24 | | | | 28,390 | | | $ | 29,577,551 | |
Costco Wholesale Corp., | | | | | | | | | | | | | | | | |
Sr. Unsec’d. Notes(a) | | | 1.375 | | | | 06/20/27 | | | | 10,000 | | | | 9,928,004 | |
Dollar Tree, Inc., | | | | | | | | | | | | | | | | |
Sr. Unsec’d. Notes | | | 4.000 | | | | 05/15/25 | | | | 14,425 | | | | 15,503,324 | |
Ross Stores, Inc., | | | | | | | | | | | | | | | | |
Sr. Unsec’d. Notes(a) | | | 0.875 | | | | 04/15/26 | | | | 33,315 | | | | 32,342,544 | |
Sr. Unsec’d. Notes | | | 4.600 | | | | 04/15/25 | | | | 1,955 | | | | 2,140,438 | |
| | | | | | | | | | | | | | | | |
| | | | |
| | | | | | | | | | | | | | | 132,906,760 | |
| | | | |
Savings & Loans 0.2% | | | | | | | | | | | | | | | | |
| | | | |
Nationwide Building Society (United Kingdom), | | | | | | | | | | | | | | | | |
Sr. Unsec’d. Notes, 144A, MTN | | | 3.622(ff) | | | | 04/26/23 | | | | 23,490 | | | | 23,683,931 | |
| | | | |
Semiconductors 1.7% | | | | | | | | | | | | | | | | |
| | | | |
Broadcom, Inc., | | | | | | | | | | | | | | | | |
Sr. Unsec’d. Notes, 144A | | | 3.137 | | | | 11/15/35 | | | | 75,432 | | | | 75,824,822 | |
Sr. Unsec’d. Notes, 144A | | | 3.419 | | | | 04/15/33 | | | | 29,460 | | | | 30,755,376 | |
Microchip Technology, Inc., | | | | | | | | | | | | | | | | |
Gtd. Notes | | | 4.250 | | | | 09/01/25 | | | | 3,492 | | | | 3,627,194 | |
Sr. Sec’d. Notes(a) | | | 2.670 | | | | 09/01/23 | | | | 84,009 | | | | 85,859,626 | |
NXP BV/NXP Funding LLC (China), | | | | | | | | | | | | | | | | |
Gtd. Notes, 144A | | | 4.625 | | | | 06/01/23 | | | | 22,975 | | | | 24,057,676 | |
Skyworks Solutions, Inc., | | | | | | | | | | | | | | | | |
Sr. Unsec’d. Notes | | | 0.900 | | | | 06/01/23 | | | | 11,785 | | | | 11,725,897 | |
Sr. Unsec’d. Notes | | | 1.800 | | | | 06/01/26 | | | | 7,000 | | | | 6,933,663 | |
| | | | | | | | | | | | | | | | |
| | | | |
| | | | | | | | | | | | | | | 238,784,254 | |
| | | | |
Software 1.4% | | | | | | | | | | | | | | | | |
| | | | |
Fidelity National Information Services, Inc., | | | | | | | | | | | | | | | | |
Sr. Unsec’d. Notes | | | 1.150 | | | | 03/01/26 | | | | 14,320 | | | | 13,971,950 | |
Sr. Unsec’d. Notes | | | 1.650 | | | | 03/01/28 | | | | 14,285 | | | | 13,831,708 | |
Fiserv, Inc., | | | | | | | | | | | | | | | | |
Sr. Unsec’d. Notes | | | 3.800 | | | | 10/01/23 | | | | 7,805 | | | | 8,162,700 | |
Infor, Inc., | | | | | | | | | | | | | | | | |
Sr. Unsec’d. Notes, 144A | | | 1.450 | | | | 07/15/23 | | | | 4,810 | | | | 4,821,136 | |
Sr. Unsec’d. Notes, 144A | | | 1.750 | | | | 07/15/25 | | | | 6,934 | | | | 6,900,891 | |
Oracle Corp., | | | | | | | | | | | | | | | | |
Sr. Unsec’d. Notes | | | 2.500 | | | | 04/01/25 | | | | 88,696 | | | | 90,851,261 | |
See Notes to Financial Statements.
| | | | | | | | | | | | | | | | |
| | | | |
| Description | | Interest
Rate | | | Maturity
Date | | | Principal
Amount
(000)# | | | Value | |
|
CORPORATE BONDS (Continued) | |
|
Software (cont’d.) | |
| | | | |
Roper Technologies, Inc., | | | | | | | | | | | | | | | | |
Sr. Unsec’d. Notes | | | 1.000% | | | | 09/15/25 | | | | 35,570 | | | $ | 34,770,958 | |
Sr. Unsec’d. Notes | | | 3.650 | | | | 09/15/23 | | | | 14,750 | | | | 15,372,470 | |
| | | | | | | | | | | | | | | | |
| | | | |
| | | | | | | | | | | | | | | 188,683,074 | |
| | | | |
Telecommunications 2.3% | | | | | | | | | | | | | | | | |
| | | | |
AT&T, Inc., | | | | | | | | | | | | | | | | |
Sr. Unsec’d. Notes(a) | | | 1.650 | | | | 02/01/28 | | | | 26,730 | | | | 26,177,215 | |
Sr. Unsec’d. Notes(a) | | | 1.700 | | | | 03/25/26 | | | | 36,550 | | | | 36,399,437 | |
Sr. Unsec’d. Notes | | | 2.300 | | | | 06/01/27 | | | | 35,000 | | | | 35,670,562 | |
Level 3 Financing, Inc., | | | | | | | | | | | | | | | | |
Sr. Sec’d. Notes, 144A | | | 3.400 | | | | 03/01/27 | | | | 33,171 | | | | 34,249,268 | |
Motorola Solutions, Inc., | | | | | | | | | | | | | | | | |
Sr. Unsec’d. Notes(a) | | | 4.000 | | | | 09/01/24 | | | | 7,000 | | | | 7,463,503 | |
NTT Finance Corp. (Japan), | | | | | | | | | | | | | | | | |
Gtd. Notes, 144A | | | 1.162 | | | | 04/03/26 | | | | 31,055 | | | | 30,430,298 | |
Sprint Communications, Inc., | | | | | | | | | | | | | | | | |
Gtd. Notes | | | 6.000 | | | | 11/15/22 | | | | 15,000 | | | | 15,603,815 | |
Sprint Corp., | | | | | | | | | | | | | | | | |
Gtd. Notes | | | 7.125 | | | | 06/15/24 | | | | 18,655 | | | | 20,954,929 | |
Gtd. Notes | | | 7.625 | | | | 02/15/25 | | | | 6,950 | | | | 8,006,265 | |
T-Mobile USA, Inc., | | | | | | | | | | | | | | | | |
Sr. Sec’d. Notes | | | 2.050 | | | | 02/15/28 | | | | 6,765 | | | | 6,728,524 | |
Sr. Sec’d. Notes | | | 3.500 | | | | 04/15/25 | | | | 64,668 | | | | 68,530,574 | |
Verizon Communications, Inc., | | | | | | | | | | | | | | | | |
Sr. Unsec’d. Notes | | | 2.100 | | | | 03/22/28 | | | | 31,185 | | | | 31,280,226 | |
| | | | | | | | | | | | | | | | |
| | | | |
| | | | | | | | | | | | | | | 321,494,616 | |
| | | | |
| Transportation 0.4% | | | | | | | | | | | | |
| | | | |
Burlington Northern Santa Fe LLC, | | | | | | | | | | | | | | | | |
Sr. Unsec’d. Notes | | | 7.000 | | | | 12/15/25 | | | | 3,750 | | | | 4,525,010 | |
Ryder System, Inc., | | | | | | | | | | | | | | | | |
Sr. Unsec’d. Notes, MTN | | | 4.625 | | | | 06/01/25 | | | | 19,455 | | | | 21,329,297 | |
XPO Logistics, Inc., | | | | | | | | | | | | | | | | |
Gtd. Notes, 144A | | | 6.250 | | | | 05/01/25 | | | | 26,000 | | | | 27,244,797 | |
| | | | | | | | | | | | | | | | |
| | | | |
| | | | | | | | | | | | | | | 53,099,104 | |
See Notes to Financial Statements.
| | | | |
PGIM Short-Term Corporate Bond Fund | | | 43 | |
Schedule of Investments (continued)
as of December 31, 2021
| | | | | | | | | | | | |
| | | | |
| Description | | Interest
Rate | | Maturity
Date | | Principal
Amount
(000)# | | | Value | |
|
CORPORATE BONDS (Continued) | |
|
Trucking & Leasing 0.3% | |
Penske Truck Leasing Co. LP/PTL Finance Corp., | | | | | | | | | | | | |
Sr. Unsec’d. Notes, 144A(a) | | 1.200% | | 11/15/25 | | | 10,930 | | | $ | 10,660,772 | |
Sr. Unsec’d. Notes, 144A | | 1.700 | | 06/15/26 | | | 25,675 | | | | 25,444,534 | |
| | | | | | | | | | | | |
| | | | |
| | | | | | | | | | | 36,105,306 | |
| | | | | | | | | | | | |
| |
TOTAL CORPORATE BONDS
(cost $11,189,591,033) | | | | 11,279,710,102 | |
| | | | | | | | | | | | |
| | | | |
| RESIDENTIAL MORTGAGE-BACKED SECURITIES 0.8% | | | | | | | | | | |
MRA Issuance Trust, | | | | | | | | | | | | |
Series 2020-07, Class A, 144A, 1 Month LIBOR
+ 1.300% (Cap N/A, Floor 1.600%) | | 1.399(c) | | 09/15/22 | | | 34,720 | | | | 34,654,955 | |
Series 2020-07, Class A2X, 144A, 1 Month LIBOR +
1.300%^ | | 1.399(c) | | 09/15/22 | | | 15,000 | | | | 15,000,000 | |
Series 2021-10, Class A1X, 144A, 1 Month LIBOR +
1.500% (Cap N/A, Floor 1.500%) | | 1.599(c) | | 02/22/23 | | | 24,990 | | | | 25,001,673 | |
Series 2021-EBO03, Class A1X, 144A, 1 Month LIBOR +
1.750% (Cap N/A, Floor 1.750%) | | 1.849(c) | | 03/31/23 | | | 24,960 | | | | 24,993,596 | |
PMT Credit Risk Transfer Trust,
Series 2020-02R, Class A, 144A, 1 Month LIBOR +
3.815% (Cap N/A, Floor 3.815%) | | 3.917(c) | | 12/25/22 | | | 9,016 | | | | 9,038,120 | |
| | | | | |
| |
TOTAL RESIDENTIAL MORTGAGE-BACKED SECURITIES
(cost $108,685,689) | | | | 108,688,344 | |
| | | | | | | | | | | | |
| | | | |
| U.S. TREASURY OBLIGATIONS 0.2% | | | | | | | | | | |
U.S. Treasury Notes | | 1.125 | | 02/28/22(k) | | | 4,200 | | | | 4,206,563 | |
U.S. Treasury Notes | | 1.250 | | 03/31/28(k) | | | 3,545 | | | | 3,514,812 | |
U.S. Treasury Notes | | 1.500 | | 11/30/28 | | | 14,400 | | | | 14,460,750 | |
U.S. Treasury Notes | | 1.750 | | 06/15/22(k) | | | 605 | | | | 609,372 | |
U.S. Treasury Notes | | 1.750 | | 12/31/24(k) | | | 295 | | | | 301,776 | |
| | | | | | | | | | | | |
| |
TOTAL U.S. TREASURY OBLIGATIONS
(cost $23,125,638) | | | | 23,093,273 | |
| | | | | | | | | | | | |
See Notes to Financial Statements.
| | | | | | | | | | | | | | | | |
| | | | |
| Description | | | | | | | | Shares | | | Value | |
| PREFERRED STOCK 0.0% | | | | | | | | | | | | |
| | | | |
| Banks | | | | | | | | | | | | |
Citigroup Capital XIII, 6.499%(c), 3 Month LIBOR + 6.370%, Maturing 10/30/40(a) | | | | | | | | | | | | | |
(cost $3,342,000) | | | | | | | | | | | 132,000 | | | $ | 3,682,800 | |
| | | | | | | | | | | | | | | | |
| | | |
TOTAL LONG-TERM INVESTMENTS
(cost $13,278,068,206) | | | | | | | | | | | | 13,366,411,787 | |
| | | | | | | | | | | | | | | | |
| | | |
| SHORT-TERM INVESTMENTS 3.8% | | | | | | | | | | |
| | | |
| AFFILIATED MUTUAL FUNDS 3.8% | | | | | | | | | | |
| PGIM Core Ultra Short Bond Fund(wa) | | | | | | 261,424,714 | | | 261,424,714 | |
PGIM Institutional Money Market Fund
(cost $258,357,339; includes $258,338,413 of cash collateral for securities on loan)(b)(wa) | | | | | | | | | | | 258,574,420 | | | | 258,393,418 | |
| | | | | | | | | | | | | | | | |
| | | | |
TOTAL AFFILIATED MUTUAL FUNDS
(cost $519,782,053) | | | | | | | | | | | | | | | 519,818,132 | |
| | | | | | | | | | | | | | | | |
| | | | | | | | | | | | | | | | |
| | | | |
| | | Interest Rate | | | Maturity Date | | | Principal Amount (000)# | | | Value | |
| | | | |
| CORPORATE BOND 0.0% | | | | | | | | | | | | |
| | | | |
| Electric | | | | | | | | | | | | |
Pacific Gas & Electric Co.,
First Mortgage, SOFR + 1.150%
(cost $2,530,000) | | | 1.200%(c) | | | | 11/14/22 | | | | 2,530 | | | | 2,554,946 | |
| | | | | | | | | | | | | | | | |
| | | | |
TOTAL SHORT-TERM INVESTMENTS
(cost $522,312,053) | | | | | | | | | | | | | | | 522,373,078 | |
| | | | | | | | | | | | | | | | |
| | | | |
TOTAL INVESTMENTS 101.3%
(cost $13,800,380,259) | | | | | | | | | | | | | | | 13,888,784,865 | |
Liabilities in excess of other assets(z) (1.3)% | | | | | | | | | | | | (176,226,558 | ) |
| | | | | | | | | | | | | | | | |
| | | | |
NET ASSETS 100.0% | | | | | | | | | | | | | | $ | 13,712,558,307 | |
| | | | | | | | | | | | | | | | |
Below is a list of the abbreviation(s) used in the annual report:
USD—US Dollar
144A—Security was purchased pursuant to Rule 144A under the Securities Act of 1933 and, pursuant to the requirements of Rule 144A, may not be resold except to qualified institutional buyers.
A—Annual payment frequency for swaps
See Notes to Financial Statements.
| | | | |
PGIM Short-Term Corporate Bond Fund | | | 45 | |
Schedule of Investments (continued)
as of December 31, 2021
CLO—Collateralized Loan Obligation
EMTN—Euro Medium Term Note
GMTN—Global Medium Term Note
LIBOR—London Interbank Offered Rate
LP—Limited Partnership
MTN—Medium Term Note
OTC—Over-the-counter
Q—Quarterly payment frequency for swaps
REITs—Real Estate Investment Trust
SOFR—Secured Overnight Financing Rate
| # | Principal or notional amount is shown in U.S. dollars unless otherwise stated. |
| ^ | Indicates a Level 3 instrument. The aggregate value of Level 3 instruments is $15,000,000 and 0.1% of net assets. |
| (a) | All or a portion of security is on loan. The aggregate market value of such securities, including those sold and pending settlement, is $253,520,922; cash collateral of $258,338,413 (included in liabilities) was received with which the Fund purchased highly liquid short-term investments. In the event of significant appreciation in value of securities on loan on the last business day of the reporting period, the Fund may reflect a collateral value that is less than the market value of the loaned securities and such shortfall is remedied the following business day. |
| (b) | Represents security, or portion thereof, purchased with cash collateral received for securities on loan and includes dividend reinvestment. |
| (c) | Variable rate instrument. The interest rate shown reflects the rate in effect at December 31, 2021. |
| (cc) | Variable rate instrument. The rate shown is based on the latest available information as of December 31, 2021. Certain variable rate securities are not based on a published reference rate and spread but are determined by the issuer or agent and are based on current market conditions. These securities do not indicate a reference rate and spread in their description. |
| (ff) | Variable rate security. Security may be issued at a fixed coupon rate, which converts to a variable rate at a specified date. Rate shown is the rate in effect as of period end. |
| (k) | Represents security, or a portion thereof, segregated as collateral for centrally cleared/exchange-traded derivatives. (oo) Perpetual security. Maturity date represents next call date. |
| (s) | Represents zero coupon bond or principal only security. Rate represents yield to maturity at purchase date. |
| (wa) | PGIM Investments LLC, the manager of the Fund, also serves as manager of the PGIM Core Ultra Short Bond Fund and PGIM Institutional Money Market Fund, if applicable. |
| (z) | Includes net unrealized appreciation/(depreciation) and/or market value of the below holdings which are excluded from the Schedule of Investments: |
Futures contracts outstanding at December 31, 2021:
| | | | | | | | | | | | | | |
Number of
Contracts | | Type | | Expiration
Date | | | Current
Notional
Amount | | | Value /
Unrealized
Appreciation
(Depreciation) | |
| Long Positions: | | | | | | | | | |
| 10,129 | | 2 Year U.S. Treasury Notes | | | Mar. 2022 | | | $ | 2,209,862,932 | | | $ | (2,403,610 | ) |
| 3,332 | | 5 Year U.S. Treasury Notes | | | Mar. 2022 | | | | 403,093,898 | | | | 1,168,097 | |
| 242 | | 10 Year U.S. Treasury Notes | | | Mar. 2022 | | | | 31,573,437 | | | | 28,251 | |
| | | | | | | | | | | | | | |
| | | | | | | | | | | | | (1,207,262 | ) |
| | | | | | | | | | | | | | |
| Short Positions: | | | | | | | | | |
| 9 | | 10 Year U.S. Ultra Treasury Notes | | | Mar. 2022 | | | | 1,317,938 | | | | (22,527 | ) |
See Notes to Financial Statements.
Futures contracts outstanding at December 31, 2021 (continued):
| | | | | | | | | | | | | | | | | |
Number of Contracts | | Type | | Expiration
Date | | Current
Notional
Amount | | Value /
Unrealized
Appreciation
(Depreciation) |
| Short Positions (cont’d): | | | | | | | | | | | |
| 443 | | 20 Year U.S. Treasury Bonds | | | | Mar. 2022 | | | | $ | 71,073,812 | | | | $ | (524,883 | ) |
| 437 | | 30 Year U.S. Ultra Treasury Bonds | | | | Mar. 2022 | | | | | 86,143,625 | | | | | (1,229,998 | ) |
| | | | | | | | | | | | | | | | | |
| | | | | | | | | | | | | | | | (1,777,408 | ) |
| | | | | | | | | | | | | | | | | |
| | | | | | | | | | | | | | | $ | (2,984,670 | ) |
| | | | | | | | | | | | | | | | | |
Credit default swap agreements outstanding at December 31, 2021:
| | | | | | | | | | | | | | | | | | |
Reference Entity/ Obligation | | Termination
Date | | Fixed
Rate | | Notional
Amount
(000)#(3) | | Value at
Trade Date | | | Value at
December 31,
2021 | | | Unrealized
Appreciation
(Depreciation) |
Centrally Cleared Credit Default Swap Agreement on corporate and/or sovereign issues - Buy Protection(1): | |
Teck Resources Ltd. | | 06/20/23 | | 5.000%(Q) | | 8,065 | | $ | (458,373 | ) | | $ | (545,816 | ) | | $ | (87,443 | ) |
| | | | | | | | | | | | | | | | | | |
| | | | | | | | | | | | | | | | | | | | | | |
Reference Entity/ Obligation | | Termination
Date | | Fixed
Rate | | Notional
Amount
(000)#(3) | | | Implied Credit
Spread at
December 31,
2021(4) | | Value at
Trade Date | | | Value at
December 31,
2021 | | | Unrealized
Appreciation
(Depreciation) | |
Centrally Cleared Credit Default Swap Agreement on corporate and/or sovereign issues - Sell Protection(2): | |
Teck Resources Ltd. | | 06/20/26 | | 5.000%(Q) | | | 40,000 | | | 1.112% | | $ | 6,417,995 | | | $ | 6,766,079 | | | $ | 348,084 | |
| | | | | | | | | | | | | | | | | | | | | | |
| | | | | | | | | | | | | | | | | | | | | | | | | | |
Reference Entity/ Obligation | | Termination
Date | | | Fixed
Rate | | | Notional
Amount
(000)#(3) | | | Fair
Value | | | Upfront
Premiums
Paid
(Received) | | | Unrealized
Appreciation
(Depreciation) | | | Counterparty |
OTC Credit Default Swap Agreements on corporate and/or sovereign issues - Buy Protection(1): |
Eastman Chemical Co. | | | 12/20/23 | | | | 1.000%(Q) | | | | 7,950 | | | $ | (126,802 | ) | | $ | (77,427 | ) | | $ | (49,375 | ) | | Goldman Sachs International |
Host Hotels & Resorts LP | | | 12/20/25 | | | | 1.000%(Q) | | | | 4,250 | | | | (17,818 | ) | | | 114,941 | | | | (132,759 | ) | | Goldman Sachs International |
Marriott International, Inc. | | | 06/20/25 | | | | 1.000%(Q) | | | | 3,500 | | | | (56,110 | ) | | | 112,817 | | | | (168,927 | ) | | Morgan Stanley & Co. International PLC |
| | | | | | | | | | | | | | | | | | | | | | | | | | |
| | | | | | | | | | | | | | $ | (200,730 | ) | | $ | 150,331 | | | $ | (351,061 | ) | | |
| | | | | | | | | | | | | | | | | | | | | | | | | | |
See Notes to Financial Statements.
| | | | |
PGIM Short-Term Corporate Bond Fund | | | 47 | |
Schedule of Investments (continued)
as of December 31, 2021
Credit default swap agreements outstanding at December 31, 2021 (continued):
| | | | | | | | | | | | | | | | | | | | | | |
Reference
Entity/
Obligation | | Termination
Date | | Fixed
Rate | | Notional
Amount
(000)#(3) | | Implied
Credit
Spread at
December 31,
2021(4) | | | Fair
Value | | | Upfront
Premiums
Paid
(Received) | | | Unrealized
Appreciation
(Depreciation) | | Counterparty |
OTC Credit Default Swap Agreement on corporate and/or sovereign issues - Sell Protection(2): |
EQT Corp. | | 06/20/22 | | 5.000%(Q) | | 10,000 | | | 1.369 | % | | $ | 188,123 | | | $ | 169,097 | | | $19,026 | | Credit Suisse International |
| | | | | | | | | | | | | | | | | | | | | | |
The Fund entered into credit default swaps (“CDS”) to provide a measure of protection against defaults or to take an active long or short position with respect to the likelihood of a particular issuer’s default or the reference entity’s credit soundness. CDS contracts generally trade based on a spread which represents the cost a protection buyer has to pay the protection seller. The protection buyer is said to be short the credit as the value of the contract rises the more the credit deteriorates. The value of the CDS contract increases for the protection buyer if the spread increases.
| (1) | If the Fund is a buyer of protection, it pays the fixed rate. When a credit event occurs, as defined under the terms of that particular swap agreement, the Fund will either (i) receive from the seller of protection an amount equal to the notional amount of the swap and make delivery of the referenced obligation or underlying securities comprising the referenced index or (ii) receive a net settlement amount in the form of cash or securities equal to the notional amount of the swap less the recovery value of the referenced obligation or underlying securities comprising the referenced index. |
| (2) | If the Fund is a seller of protection, it receives the fixed rate. When a credit event occurs, as defined under the terms of that particular swap agreement, the Fund will either (i) pay to the buyer of protection an amount equal to the notional amount of the swap and take delivery of the referenced obligation or underlying securities comprising the referenced index or (ii) pay a net settlement amount in the form of cash or securities equal to the notional amount of the swap less the recovery value of the referenced obligation or underlying securities comprising the referenced index. |
| (3) | Notional amount represents the maximum potential amount the Fund could be required to pay as a seller of credit protection or receive as a buyer of credit protection if a credit event occurs as defined under the terms of that particular swap agreement. |
| (4) | Implied credit spreads, represented in absolute terms, utilized in determining the fair value of credit default swap agreements where the Fund is the seller of protection as of the reporting date serve as an indicator of the current status of the payment/ performance risk and represent the likelihood of risk of default for the credit derivative. The implied credit spread of a particular referenced entity reflects the cost of buying/selling protection and may include up-front payments required to be made to enter into the agreement. Wider credit spreads represent a deterioration of the referenced entity’s credit soundness and a greater likelihood of risk of default or other credit event occurring as defined under the terms of the agreement. |
See Notes to Financial Statements.
Interest rate swap agreements outstanding at December 31, 2021:
| | | | | | | | | | | | | | | | | | | | | | | | |
Notional
Amount
(000)# | | | Termination
Date | | | Fixed
Rate | | | Floating Rate | | Value at
Trade Date | | | Value at
December 31,
2021 | | | Unrealized
Appreciation
(Depreciation) | |
| | Centrally Cleared Interest Rate Swap Agreement: | |
| | 98,646 | | | | 08/15/28 | | | | 1.220%(A) | | | 1 Day SOFR(1)(A) | | $ | 290,461 | | | $ | (171,824 | ) | | $ | (462,285 | ) |
| | | | | | | | | | | | | | | | | | | | | | | | |
| (1) | The Fund pays the fixed rate and receives the floating rate. |
| (2) | The Fund pays the floating rate and receives the fixed rate. |
Balances Reported in the Statement of Assets and Liabilities for OTC Swap Agreements:
| | | | | | | | |
| | Premiums Paid | | Premiums Received | | Unrealized
Appreciation | | Unrealized
Depreciation |
| OTC Swap Agreements | | $396,855 | | $(77,427) | | $19,026 | | $(351,061) |
Summary of Collateral for Centrally Cleared/Exchange-traded Derivatives:
Cash and securities segregated as collateral, including pending settlement for closed positions, to cover requirements for centrally cleared/exchange-traded derivatives are listed by broker as follows:
| | | | | | | | | | | | | | | | | | | | | | | | |
Broker | | Cash and/or Foreign Currency | | | Securities Market Value | |
Citigroup Global Markets, Inc. | | | | | | $ | 34,275,000 | | | | | | | | | | | $ | 8,455,047 | | | | | |
| | | | | | | | | | | | | | | | | | | | | | | | |
Fair Value Measurements:
Various inputs are used in determining the value of the Fund’s investments. These inputs are summarized in the three broad levels listed below.
Level 1—unadjusted quoted prices generally in active markets for identical securities.
Level 2—quoted prices for similar securities, interest rates and yield curves, prepayment speeds, foreign currency exchange rates and other observable inputs.
Level 3—unobservable inputs for securities valued in accordance with Board approved fair valuation procedures.
The following is a summary of the inputs used as of December 31, 2021 in valuing such portfolio securities:
| | | | | | | | | | | | |
| | | Level 1 | | | Level 2 | | | Level 3 | |
Investments in Securities | | | | | | | | | | | | |
Assets | | | | | | | | | | | | |
Long-Term Investments | | | | | | | | | | | | |
Asset-Backed Securities | | | | | | | | | | | | |
Collateralized Loan Obligations. | | $ | — | | | $ | 1,715,725,964 | | | $ | — | |
Commercial Mortgage-Backed Securities | | | — | | | | 235,511,304 | | | | — | |
Corporate Bonds | | | — | | | | 11,279,710,102 | | | | — | |
Residential Mortgage-Backed Securities | | | — | | | | 93,688,344 | | | | 15,000,000 | |
U.S. Treasury Obligations | | | — | | | | 23,093,273 | | | | — | |
Preferred Stock | | | 3,682,800 | | | | — | | | | — | |
See Notes to Financial Statements.
| | | | |
PGIM Short-Term Corporate Bond Fund | | | 49 | |
Schedule of Investments (continued)
as of December 31, 2021
| | | | | | | | | | | | | | | | | | | | | | |
| | | | | Level 1 | | | | | | Level 2 | | | | | | Level 3 | |
Investments in Securities (continued) | | | | | | | | | | | | | | | | | | | | | | |
Assets (continued) | | | | | | | | | | | | | | | | | | | | | | |
Short-Term Investments | | | | | | | | | | | | | | | | | | | | | | |
Affiliated Mutual Funds | | | | $ | 519,818,132 | | | | | | | $ | — | | | | | | | $ | — | |
Corporate Bond | | | | | — | | | | | | | | 2,554,946 | | | | | | | | — | |
| | | | | | | | | | | | | | | | | | | | | | |
Total | | | | $ | 523,500,932 | | | | | | | $ | 13,350,283,933 | | | | | | | $ | 15,000,000 | |
| | | | | | | | | | | | | | | | | | | | | | |
| | | | | | |
Other Financial Instruments* | | | | | | | | | | | | | | | | | | | | | | |
| Assets | | | | | | | | | | | | | | | | | |
Futures Contracts | | | | $ | 1,196,348 | | | | | | | $ | — | | | | | | | $ | — | |
Centrally Cleared Credit Default Swap Agreement | | | | | — | | | | | | | | 348,084 | | | | | | | | — | |
OTC Credit Default Swap Agreement | | | | | — | | | | | | | | 188,123 | | | | | | | | — | |
| | | | | | | | | | | | | | | | | | | | | | |
Total | | | | $ | 1,196,348 | | | | | | | $ | 536,207 | | | | | | | $ | — | |
| | | | | | | | | | | | | | | | | | | | | | |
| | | | | | |
Liabilities | | | | | | | | | | | | | | | | | | | | | | |
Futures Contracts | | | | $ | (4,181,018 | ) | | | | | | $ | — | | | | | | | $ | — | |
Centrally Cleared Credit Default Swap Agreement | | | | | — | | | | | | | | (87,443 | ) | | | | | | | — | |
OTC Credit Default Swap Agreements | | | | | — | | | | | | | | (200,730 | ) | | | | | | | — | |
Centrally Cleared Interest Rate Swap Agreement | | | | | — | | | | | | | | (462,285 | ) | | | | | | | — | |
| | | | | | | | | | | | | | | | | | | | | | |
Total | | | | $ | (4,181,018 | ) | | | | | | $ | (750,458 | ) | | | | | | $ | — | |
| | | | | | | | | | | | | | | | | | | | | | |
| * | Other financial instruments are derivative instruments not reflected in the Schedule of Investments, such as futures, forwards and centrally cleared swap contracts, which are recorded at the unrealized appreciation (depreciation) on the instrument, and OTC swap contracts which are recorded at fair value. |
Industry Classification:
The industry classification of investments and liabilities in excess of other assets shown as a percentage of net assets as of December 31, 2021 were as follows (unaudited):
| | | | |
Banks | | | 24.1 | % |
Collateralized Loan Obligations | | | 12.5 | |
Electric | | | 7.2 | |
Auto Manufacturers | | | 4.5 | |
Pharmaceuticals | | | 4.3 | |
Affiliated Mutual Funds (1.9% represents investments purchased with collateral from securities on loan) | | | 3.8 | |
Oil & Gas | | | 3.6 | |
Pipelines | | | 2.8 | |
Real Estate Investment Trusts (REITs) | | | 2.8 | |
Telecommunications | | | 2.3 | |
Commercial Services | | | 2.1 | |
Media | | | 1.9 | |
Packaging & Containers | | | 1.8 | |
Semiconductors | | | 1.7 | |
Chemicals | | | 1.7 | |
Commercial Mortgage-Backed Securities | | | 1.7 | |
Healthcare-Services | | | 1.6 | |
Diversified Financial Services | | | 1.5 | |
| | | | |
Computers | | | 1.4 | % |
Software | | | 1.4 | |
Aerospace & Defense | | | 1.3 | |
Agriculture | | | 1.3 | |
Insurance | | | 1.2 | |
Foods | | | 1.0 | |
Retail | | | 1.0 | |
Airlines | | | 0.9 | |
Residential Mortgage-Backed Securities | | | 0.8 | |
Lodging | | | 0.7 | |
Miscellaneous Manufacturing | | | 0.6 | |
Gas | | | 0.6 | |
Electronics | | | 0.6 | |
Building Materials | | | 0.5 | |
Beverages | | | 0.5 | |
Machinery-Diversified | | | 0.4 | |
Home Furnishings | | | 0.4 | |
Apparel | | | 0.4 | |
Transportation | | | 0.4 | |
Housewares | | | 0.4 | |
Home Builders | | | 0.3 | |
See Notes to Financial Statements.
| | |
| Industry Classification (continued): | | |
| | | | |
Office/Business Equipment | | | 0.3 | % |
Iron/Steel | | | 0.3 | |
Mining | | | 0.3 | |
Trucking & Leasing | | | 0.3 | |
Auto Parts & Equipment | | | 0.3 | |
Internet | | | 0.2 | |
Healthcare-Products | | | 0.2 | |
Real Estate | | | 0.2 | |
Forest Products & Paper | | | 0.2 | |
Machinery-Construction & Mining | | | 0.2 | |
Savings & Loans | | | 0.2 | |
| | | | |
U.S. Treasury Obligations | | | 0.2 | % |
Oil & Gas Services | | | 0.2 | |
Household Products/Wares | | | 0.1 | |
Biotechnology | | | 0.1 | |
| | | | |
| | | 101.3 | |
Liabilities in excess of other assets | | | (1.3 | ) |
| | | | |
| | | 100.0 | % |
| | | | |
Effects of Derivative Instruments on the Financial Statements and Primary Underlying Risk Exposure:
The Fund invested in derivative instruments during the reporting period. The primary types of risk associated with these derivative instruments are credit contracts risk and interest rate contracts risk. See the Notes to Financial Statements for additional detail regarding these derivative instruments and their risks. The effect of such derivative instruments on the Fund’s financial position and financial performance as reflected in the Statement of Assets and Liabilities and Statement of Operations is presented in the summary below.
Fair values of derivative instruments as of December 31, 2021 as presented in the Statement of Assets and Liabilities:
| | | | | | | | | | | | |
| | | Asset Derivatives | | | Liability Derivatives | |
Derivatives not accounted for
as hedging instruments,
carried at fair value | | Statement of
Assets and
Liabilities Location | | Fair
Value | | | Statement of
Assets and
Liabilities Location | | Fair
Value | |
| Credit contracts | | Due from/to broker-variation margin swaps | | $ | 348,084 | * | | Due from/to broker-variation margin swaps | | $ | 87,443 | * |
| Credit contracts | | Premiums paid for OTC swap agreements | | | 396,855 | | | Premiums received for OTC swap agreements | | | 77,427 | |
| Credit contracts | | Unrealized appreciation on OTC swap agreements | | | 19,026 | | | Unrealized depreciation on OTC swap agreements | | | 351,061 | |
| Interest rate contracts | | Due from/to broker-variation margin futures | | | 1,196,348 | * | | Due from/to broker-variation margin futures | | | 4,181,018 | * |
| Interest rate contracts | | — | | | — | | | Due from/to broker-variation margin swaps | | | 462,285 | * |
| | | | | | | | | | | | |
| | | | $ | 1,960,313 | | | | | $ | 5,159,234 | |
| | | | | | | | | | | | |
| * | Includes cumulative appreciation (depreciation) as reported in the schedule of open futures and centrally cleared swap contracts. Only unsettled variation margin receivable (payable) is reported within the Statement of Assets and Liabilities. |
See Notes to Financial Statements.
| | | | |
PGIM Short-Term Corporate Bond Fund | | | 51 | |
Schedule of Investments (continued)
as of December 31, 2021
The effects of derivative instruments on the Statement of Operations for the year ended December 31, 2021 are as follows:
| | | | | | | | |
Amount of Realized Gain (Loss) on Derivatives Recognized in Income | |
Derivatives not accounted for as hedging
instruments, carried at fair value | | Futures | | | Swaps | |
Credit contracts | | $ | — | | | $ | 24,074 | |
Interest rate contracts | | | (3,493,949 | ) | | | — | |
| | | | | | | | |
| | |
Total | | $ | (3,493,949 | ) | | $ | 24,074 | |
| | | | | | | | |
| | | | | | | | |
Change in Unrealized Appreciation (Depreciation) on Derivatives Recognized in Income | |
Derivatives not accounted for
as hedging instruments,
carried at fair value | | Futures | | | Swaps | |
Credit contracts | | $ | — | | | $ | 313,681 | |
Interest rate contracts | | | (4,967,517 | ) | | | (462,285 | ) |
| | | | | | | | |
Total | | $ | (4,967,517 | ) | | $ | (148,604 | ) |
| | | | | | | | |
For the year ended December 31, 2021, the Fund’s average volume of derivative activities is as follows:
| | | | | | | | | | |
Futures
Contracts—
Long
Positions(1) | | | | | | Futures
Contracts—
Short
Positions(1) | |
| | $2,493,081,874 | | | | | | | | $553,495,552 | |
| | |
| | | | Interest Rate
Swap
Agreements(1) | | | | |
| | | | | $19,729,200 | | | | | |
| | |
Credit Default
Swap Agreements—
Buy Protection(1) | | | | | | Credit Default
Swap Agreements—
Sell Protection(1) | |
| | $23,765,000 | | | | | | | | $26,000,000 | |
| (1) | Notional Amount in USD. |
Average volume is based on average quarter end balances as noted for the year ended December 31, 2021.
See Notes to Financial Statements.
Financial Instruments/Transactions—Summary of Offsetting and Netting Arrangements:
The Fund invested in OTC derivatives and entered into financial instruments/transactions during the reporting period that are either offset in accordance with current requirements or are subject to enforceable master netting arrangements or similar agreements that permit offsetting. The information about offsetting and related netting arrangements for OTC derivatives and financial instruments/transactions where the legal right to set-off exists is presented in the summary below.
Offsetting of financial instrument/transaction assets and liabilities:
| | | | | | | | | | | | |
Description | | Gross Market
Value of
Recognized
Assets/(Liabilities) | | | Collateral
Pledged/(Received)(2) | | | Net
Amount | |
Securities on Loan | | $ | 253,520,922 | | | $ | (253,520,922 | ) | | $ | — | |
| | | | | | | | | | | | |
Offsetting of OTC derivative assets and liabilities:
| | | | | | | | | | | | | | | | | | | | | | | | | |
Counterparty | | Gross Amounts of
Recognized
Assets(1) | | Gross Amounts of
Recognized
Liabilities(1) | | Net Amounts of
Recognized
Assets/(Liabilities) | | Collateral
Pledged/(Received)(2) | | Net Amount |
Credit
Suisse
International | | $188,123 | | $— | | $188,123 | | $(188,123) | | $— |
Goldman
Sachs
International | | 114,941 | | (259,561) | | (144,620) | | — | | (144,620) |
Morgan
Stanley &
Co.
International
PLC | | 112,817 | | (168,927) | | (56,110) | | — | | (56,110) |
| | | | | | | | | | | | | | | | | | | | |
| | | $415,881 | | $(428,488) | | $(12,607) | | $(188,123) | | $(200,730) |
| | | | | | | | | | | | | | | | | | | | |
| (1) | Includes unrealized appreciation/(depreciation) on swaps and forwards, premiums paid/(received) on swap agreements and market value of purchased and written options, as represented on the Statement of Assets and Liabilities. |
| (2) | Collateral amount disclosed by the Fund is limited to the market value of financial instruments/transactions and the Fund’s OTC derivative exposure by counterparty. |
See Notes to Financial Statements.
| | | | |
PGIM Short-Term Corporate Bond Fund | | | 53 | |
Statement of Assets & Liabilities
as of December 31, 2021
| | | | |
Assets | | | | |
Investments at value, including securities on loan of $253,520,922: | | | | |
Unaffiliated investments (cost $13,280,598,206) | | $ | 13,368,966,733 | |
Affiliated investments (cost $519,782,053) | | | 519,818,132 | |
Dividends and interest receivable | | | 86,042,671 | |
Receivable for Fund shares sold | | | 40,119,912 | |
Deposit with broker for centrally cleared/exchange-traded derivatives | | | 34,275,000 | |
Premiums paid for OTC swap agreements | | | 396,855 | |
Unrealized appreciation on OTC swap agreements | | | 19,026 | |
Prepaid expenses | | | 63,188 | |
| | | | |
| |
Total Assets | | | 14,049,701,517 | |
| | | | |
| |
| Liabilities | | | |
Payable to broker for collateral for securities on loan | | | 258,338,413 | |
Payable for Fund shares purchased | | | 67,291,587 | |
Dividends payable | | | 4,126,977 | |
Management fee payable | | | 3,737,550 | |
Accrued expenses and other liabilities | | | 2,201,757 | |
Distribution fee payable | | | 704,459 | |
Unrealized depreciation on OTC swap agreements | | | 351,061 | |
Due to broker—variation margin futures | | | 210,246 | |
Premiums received for OTC swap agreements | | | 77,427 | |
Due to broker—variation margin swaps | | | 68,942 | |
Affiliated transfer agent fee payable | | | 34,791 | |
| | | | |
| |
Total Liabilities | | | 337,143,210 | |
| | | | |
| |
Net Assets | | $ | 13,712,558,307 | |
| | | | |
| |
| | | | |
Net assets were comprised of: | | | | |
Common stock, at par | | $ | 12,286,859 | |
Paid-in capital in excess of par | | | 13,994,894,801 | |
Total distributable earnings (loss) | | | (294,623,353 | ) |
| | | | |
| |
Net assets, December 31, 2021 | | $ | 13,712,558,307 | |
| | | | |
See Notes to Financial Statements.
| | | | | | | | |
| | |
Class A | | | | | | | | |
Net asset value and redemption price per share,
($1,665,931,188 ÷ 149,604,302 shares of common stock issued and outstanding) | | $ | 11.14 | | | | | |
Maximum sales charge (2.25% of offering price) | | | 0.26 | | | | | |
| | | | | | | | |
| | |
Maximum offering price to public | | $ | 11.40 | | | | | |
| | | | | | | | |
| | |
Class C | | | | | | | | |
Net asset value, offering price and redemption price per share,
($333,417,440 ÷ 29,941,965 shares of common stock issued and outstanding) | | $ | 11.14 | | | | | |
| | | | | | | | |
| | |
Class R | | | | | | | | |
Net asset value, offering price and redemption price per share,
($138,544,650 ÷ 12,442,395 shares of common stock issued and outstanding) | | $ | 11.13 | | | | | |
| | | | | | | | |
| | |
Class Z | | | | | | | | |
Net asset value, offering price and redemption price per share,
($8,985,210,612 ÷ 804,920,033 shares of common stock issued and outstanding) | | $ | 11.16 | | | | | |
| | | | | | | | |
| | |
Class R2 | | | | | | | | |
Net asset value, offering price and redemption price per share,
($1,941,473 ÷ 173,653 shares of common stock issued and outstanding) | | $ | 11.18 | | | | | |
| | | | | | | | |
| | |
Class R4 | | | | | | | | |
Net asset value, offering price and redemption price per share,
($1,019,951 ÷ 91,226 shares of common stock issued and outstanding) | | $ | 11.18 | | | | | |
| | | | | | | | |
| | |
Class R6 | | | | | | | | |
Net asset value, offering price and redemption price per share,
($2,586,492,993 ÷ 231,512,365 shares of common stock issued and outstanding) | | $ | 11.17 | | | | | |
| | | | | | | | |
See Notes to Financial Statements.
| | | | |
PGIM Short-Term Corporate Bond Fund | | | 55 | |
Statement of Operations
Year Ended December 31, 2021
| | | | |
Net Investment Income (Loss) | | | | |
Income | | | | |
Interest income | | $ | 291,401,867 | |
Affiliated dividend income | | | 399,123 | |
Income from securities lending, net (including affiliated income of $196,968) | | | 275,423 | |
Unaffiliated dividend income | | | 218,718 | |
| | | | |
| |
Total income | | | 292,295,131 | |
| | | | |
| |
Expenses | | | | |
Management fee | | | 50,984,947 | |
Distribution fee(a) | | | 9,462,841 | |
Shareholder servicing fees(a) | | | 2,436 | |
Transfer agent’s fees and expenses (including affiliated expense of $336,857)(a) | | | 11,862,683 | |
Custodian and accounting fees | | | 660,234 | |
Shareholders’ reports | | | 524,969 | |
Registration fees(a) | | | 396,041 | |
SEC registration fees | | | 185,309 | |
Directors’ fees | | | 153,450 | |
Legal fees and expenses | | | 87,382 | |
Audit fee | | | 42,000 | |
Miscellaneous | | | 163,835 | |
| | | | |
| |
Total expenses | | | 74,526,127 | |
Less: Fee waiver and/or expense reimbursement(a) | | | (3,756,989 | ) |
Distribution fee waiver(a) | | | (349,854 | ) |
| | | | |
| |
Net expenses | | | 70,419,284 | |
| | | | |
| |
Net investment income (loss) | | | 221,875,847 | |
| | | | |
| |
Realized And Unrealized Gain (Loss) On Investment And Foreign Currency Transactions | | | | |
Net realized gain (loss) on: | | | | |
Investment transactions (including affiliated of $(61,215)) | | | 71,483,302 | |
Futures transactions | | | (3,493,949 | ) |
Swap agreement transactions | | | 24,074 | |
| | | | |
| |
| | | 68,013,427 | |
| | | | |
Net change in unrealized appreciation (depreciation) on: | | | | |
Investments (including affiliated of $1,131) | | | (344,557,691 | ) |
Futures | | | (4,967,517 | ) |
Swap agreements | | | (148,604 | ) |
Foreign currencies | | | (1,576 | ) |
| | | | |
| |
| | | (349,675,388 | ) |
| | | | |
| |
Net gain (loss) on investment and foreign currency transactions | | | (281,661,961 | ) |
| | | | |
| |
Net Increase (Decrease) In Net Assets Resulting From Operations | | $ | (59,786,114 | ) |
| | | | |
See Notes to Financial Statements.
| (a) | Class specific expenses and waivers were as follows: |
| | | | | | | | | | | | | | | | | | | | | | | | | | | | |
| | | Class A | | | Class C | | | Class R | | | Class Z | | | Class R2 | | | Class R4 | | | Class R6 | |
Distribution fee | | | 4,518,091 | | | | 3,891,316 | | | | 1,049,562 | | | | — | | | | 3,872 | | | | — | | | | — | |
Shareholder servicing fees | | | — | | | | — | | | | — | | | | — | | | | 1,550 | | | | 886 | | | | — | |
Transfer agent’s fees and expenses | | | 1,295,023 | | | | 309,565 | | | | 218,965 | | | | 9,997,384 | | | | 2,738 | | | | 1,102 | | | | 37,906 | |
Registration fees | | | 72,345 | | | | 30,429 | | | | 16,809 | | | | 147,935 | | | | 15,060 | | | | 13,684 | | | | 99,779 | |
Fee waiver and/or expense reimbursement | | | (186,144 | ) | | | (40,080 | ) | | | (14,414 | ) | | | (3,114,925 | ) | | | (15,646 | ) | | | (13,554 | ) | | | (372,226 | ) |
Distribution fee waiver | | | — | | | | — | | | | (349,854 | ) | | | — | | | | — | | | | — | | | | — | |
See Notes to Financial Statements.
| | | | |
PGIM Short-Term Corporate Bond Fund | | | 57 | |
Statements of Changes in Net Assets
| | | | | | | | |
| |
| | | Year Ended
December 31, | |
| | |
| | | 2021 | | | 2020 | |
| | |
Increase (Decrease) in Net Assets | | | | | | | | |
Operations | | | | | | | | |
Net investment income (loss) | | $ | 221,875,847 | | | $ | 240,275,721 | |
Net realized gain (loss) on investment transactions | | | 68,013,427 | | | | 83,129,210 | |
Net change in unrealized appreciation (depreciation) on investments | | | (349,675,388 | ) | | | 286,673,377 | |
| | | | | | | | |
Net increase (decrease) in net assets resulting from operations | | | (59,786,114 | ) | | | 610,078,308 | |
| | | | | | | | |
| | |
Dividends and Distributions | | | | | | | | |
Distributions from distributable earnings | | | | | | | | |
Class A | | | (34,763,726 | ) | | | (45,602,484 | ) |
Class B | | | — | | | | (6,140 | ) |
Class C | | | (4,546,688 | ) | | | (8,399,708 | ) |
Class R | | | (2,211,836 | ) | | | (2,665,598 | ) |
Class Z | | | (191,696,050 | ) | | | (178,276,914 | ) |
Class R2 | | | (26,812 | ) | | | (9,782 | ) |
Class R4 | | | (17,580 | ) | | | (8,357 | ) |
Class R6 | | | (50,883,600 | ) | | | (39,118,669 | ) |
| | | | | | | | |
| | | (284,146,292 | ) | | | (274,087,652 | ) |
| | | | | | | | |
| | |
Fund share transactions (Net of share conversions) | | | | | | | | |
Net proceeds from shares sold | | | 5,596,275,206 | | | | 6,942,915,326 | |
Net asset value of shares issued in reinvestment of dividends and distributions | | | 236,856,865 | | | | 231,608,249 | |
Cost of shares purchased | | | (4,447,160,218 | ) | | | (4,708,746,606 | ) |
| | | | | | | | |
Net increase (decrease) in net assets from Fund share transactions | | | 1,385,971,853 | | | | 2,465,776,969 | |
| | | | | | | | |
Total increase (decrease) | | | 1,042,039,447 | | | | 2,801,767,625 | |
| | |
| Net Assets: | | | | | | |
Beginning of year | | | 12,670,518,860 | | | | 9,868,751,235 | |
| | | | | | | | |
End of year | | $ | 13,712,558,307 | | | $ | 12,670,518,860 | |
| | | | | | | | |
See Notes to Financial Statements.
Financial Highlights
| | | | | | | | | | | | | | | | | | | | |
| Class A Shares | |
| | | Year Ended December 31, | |
| | | 2021 | | | 2020 | | | 2019 | | | 2018 | | | 2017 | |
| Per Share Operating Performance(a): | | | | | | | | | | | | | | | | | | | | |
| Net Asset Value, Beginning of Year | | | $11.42 | | | | $11.11 | | | | $10.71 | | | | $10.95 | | | | $11.01 | |
| Income (loss) from investment operations: | | | | | | | | | | | | | | | | | | | | |
| Net investment income (loss) | | | 0.17 | | | | 0.22 | | | | 0.26 | | | | 0.24 | | | | 0.21 | |
| Net realized and unrealized gain (loss) on | | | | | | | | | | | | | | | | | | | | |
| investment transactions | | | (0.23 | ) | | | 0.34 | | | | 0.43 | | | | (0.20 | ) | | | - | |
| Total from investment operations | | | (0.06 | ) | | | 0.56 | | | | 0.69 | | | | 0.04 | | | | 0.21 | |
| Less Dividends and Distributions: | | | | | | | | | | | | | | | | | | | | |
| Dividends from net investment income | | | (0.22 | ) | | | (0.25 | ) | | | (0.29 | ) | | | (0.28 | ) | | | (0.27 | ) |
| Net asset value, end of year | | | $11.14 | | | | $11.42 | | | | $11.11 | | | | $10.71 | | | | $10.95 | |
| Total Return(b): | | | (0.56 | )% | | | 5.13 | % | | | 6.47 | % | | | 0.34 | % | | | 1.91 | % |
| | | | | | | | | | | | | | | | | | | | | |
| Ratios/Supplemental Data: | |
| Net assets, end of year (000) | | | $1,665,931 | | | | $1,837,307 | | | | $1,609,745 | | | | $1,173,934 | | | | $1,373,562 | |
| Average net assets (000) | | | $1,807,236 | | | | $2,048,213 | | | | $1,352,830 | | | | $1,273,713 | | | | $1,413,981 | |
| Ratios to average net assets(c)(d): | | | | | | | | | | | | | | | | | | | | |
| Expenses after waivers and/or expense reimbursement | | | 0.71 | % | | | 0.76 | % | | | 0.80 | % | | | 0.79 | % | | | 0.78 | % |
| Expenses before waivers and/or expense reimbursement | | | 0.72 | % | | | 0.77 | % | | | 0.80 | % | | | 0.79 | % | | | 0.78 | % |
| Net investment income (loss) | | | 1.46 | % | | | 1.93 | % | | | 2.33 | % | | | 2.20 | % | | | 1.90 | % |
| Portfolio turnover rate(e) | | | 32 | % | | | 36 | % | | | 60 | % | | | 36 | % | | | 50 | % |
| (a) | Calculated based on average shares outstanding during the year. |
| (b) | Total return does not consider the effects of sales loads. Total return is calculated assuming a purchase of a share on the first day and a sale on the last day of each year reported and includes reinvestment of dividends and distributions, if any. Total returns may reflect adjustments to conform to GAAP. |
| (c) | Does not include expenses of the underlying funds in which the Fund invests. |
| (d) | Effective October 1, 2017, class specific expenses include transfer agent fees and expenses and registration fees, which are charged to their respective share class. |
| (e) | The Fund’s portfolio turnover rate is calculated in accordance with regulatory requirements, without regard to transactions involving short-term investments, certain derivatives and in-kind transactions (if any). If such transactions were included, the Fund’s portfolio turnover rate may be higher. |
See Notes to Financial Statements.
| | | | |
PGIM Short-Term Corporate Bond Fund | | | 59 | |
Financial Highlights (continued)
| | | | | | | | | | | | | | | | | | | | |
| Class C Shares | |
| | | Year Ended December 31, | |
| | | 2021 | | | 2020 | | | 2019 | | | 2018 | | | 2017 | |
| Per Share Operating Performance(a): | | | | | | | | | | | | | | | | | | | | |
| Net Asset Value, Beginning of Year | | | $11.42 | | | | $11.11 | | | | $10.72 | | | | $10.95 | | | | $11.01 | |
| Income (loss) from investment operations: | | | | | | | | | | | | | | | | | | | | |
| Net investment income (loss) | | | 0.08 | | | | 0.14 | | | | 0.18 | | | | 0.16 | | | | 0.13 | |
| Net realized and unrealized gain (loss) on investment transactions | | | (0.23 | ) | | | 0.34 | | | | 0.42 | | | | (0.19 | ) | | | - | |
| Total from investment operations | | | (0.15 | ) | | | 0.48 | | | | 0.60 | | | | (0.03 | ) | | | 0.13 | |
| Less Dividends and Distributions: | | | | | | | | | | | | | | | | | | | | |
| Dividends from net investment income | | | (0.13 | ) | | | (0.17 | ) | | | (0.21 | ) | | | (0.20 | ) | | | (0.19 | ) |
| Net asset value, end of year | | | $11.14 | | | | $11.42 | | | | $11.11 | | | | $10.72 | | | | $10.95 | |
| Total Return(b): | | | (1.31 | )% | | | 4.40 | % | | | 5.63 | % | | | (0.27) | % | | | 1.16 | % |
| | | | | | | | | | | | | | | | | | | | | |
| Ratios/Supplemental Data: | | | | | | | | | | | | | | | |
| Net assets, end of year (000) | | | $333,417 | | | | $495,994 | | | | $599,005 | | | | $825,668 | | | | $1,138,547 | |
| Average net assets (000) | | | $389,132 | | | | $534,970 | | | | $722,408 | | | | $970,998 | | | | $1,298,103 | |
| Ratios to average net assets(c)(d): | | | | | | | | | | | | | | | | | | | | |
| Expenses after waivers and/or expense reimbursement | | | 1.47 | % | | | 1.47 | % | | | 1.49 | % | | | 1.49 | % | | | 1.52 | % |
| Expenses before waivers and/or expense reimbursement | | | 1.48 | % | | | 1.48 | % | | | 1.49 | % | | | 1.49 | % | | | 1.52 | % |
| Net investment income (loss) | | | 0.71 | % | | | 1.27 | % | | | 1.65 | % | | | 1.49 | % | | | 1.16 | % |
| Portfolio turnover rate(e) | | | 32 | % | | | 36 | % | | | 60 | % | | | 36 | % | | | 50 | % |
| (a) | Calculated based on average shares outstanding during the year. |
| (b) | Total return does not consider the effects of sales loads. Total return is calculated assuming a purchase of a share on the first day and a sale on the last day of each year reported and includes reinvestment of dividends and distributions, if any. Total returns may reflect adjustments to conform to GAAP. |
| (c) | Does not include expenses of the underlying funds in which the Fund invests. |
| (d) | Effective October 1, 2017, class specific expenses include transfer agent fees and expenses and registration fees, which are charged to their respective share class. |
| (e) | The Fund’s portfolio turnover rate is calculated in accordance with regulatory requirements, without regard to transactions involving short-term investments, certain derivatives and in-kind transactions (if any). If such transactions were included, the Fund’s portfolio turnover rate may be higher. |
See Notes to Financial Statements.
| | | | | | | | | | | | | | | | | | | | |
| Class R Shares | |
| | | Year Ended December 31, | |
| | | 2021 | | | 2020 | | | 2019 | | | 2018 | | | 2017 | |
| Per Share Operating Performance(a): | | | | | | | | | | | | | | | | | | | | |
| Net Asset Value, Beginning of Year | | | $11.42 | | | | $11.11 | | | | $10.72 | | | | $10.95 | | | | $11.01 | |
| Income (loss) from investment operations: | | | | | | | | | | | | | | | | | | | | |
| Net investment income (loss) | | | 0.13 | | | | 0.19 | | | | 0.22 | | | | 0.20 | | | | 0.18 | |
| Net realized and unrealized gain (loss) on investment transactions | | | (0.24 | ) | | | 0.34 | | | | 0.42 | | | | (0.19 | ) | | | - | |
| Total from investment operations | | | (0.11 | ) | | | 0.53 | | | | 0.64 | | | | 0.01 | | | | 0.18 | |
| Less Dividends and Distributions: | | | | | | | | | | | | | | | | | | | | |
| Dividends from net investment income | | | (0.18 | ) | | | (0.22 | ) | | | (0.25 | ) | | | (0.24 | ) | | | (0.24 | ) |
| Net asset value, end of year | | | $11.13 | | | | $11.42 | | | | $11.11 | | | | $10.72 | | | | $10.95 | |
| Total Return(b): | | | (0.99 | )% | | | 4.86 | % | | | 6.03 | % | | | 0.13 | % | | | 1.63 | % |
| | | | | | | | | | | | | | | | | | | | | |
| Ratios/Supplemental Data: | |
| Net assets, end of year (000) | | | $138,545 | | | | $143,094 | | | | $138,971 | | | | $143,370 | | | | $167,645 | |
| Average net assets (000) | | | $139,942 | | | | $133,401 | | | | $139,946 | | | | $156,009 | | | | $172,119 | |
| Ratios to average net assets(c)(d): | | | | | | | | | | | | | | | | | | | | |
| Expenses after waivers and/or expense reimbursement | | | 1.05 | % | | | 1.02 | % | | | 1.11 | % | | | 1.09 | % | | | 1.05 | % |
| Expenses before waivers and/or expense reimbursement | | | 1.31 | % | | | 1.28 | % | | | 1.36 | % | | | 1.34 | % | | | 1.30 | % |
| Net investment income (loss) | | | 1.12 | % | | | 1.70 | % | | | 2.02 | % | | | 1.90 | % | | | 1.62 | % |
| Portfolio turnover rate(e) | | | 32 | % | | | 36 | % | | | 60 | % | | | 36 | % | | | 50 | % |
| (a) | Calculated based on average shares outstanding during the year. |
| (b) | Total return is calculated assuming a purchase of a share on the first day and a sale on the last day of each year reported and includes reinvestment of dividends and distributions, if any. Total returns may reflect adjustments to conform to GAAP. |
| (c) | Does not include expenses of the underlying funds in which the Fund invests. |
| (d) | Effective October 1, 2017, class specific expenses include transfer agent fees and expenses and registration fees, which are charged to their respective share class. |
| (e) | The Fund’s portfolio turnover rate is calculated in accordance with regulatory requirements, without regard to transactions involving short-term investments, certain derivatives and in-kind transactions (if any). If such transactions were included, the Fund’s portfolio turnover rate may be higher. |
See Notes to Financial Statements.
| | | | |
PGIM Short-Term Corporate Bond Fund | | | 61 | |
Financial Highlights (continued)
| | | | | | | | | | | | | | | | | | | | |
| Class Z Shares | |
| | | Year Ended December 31, | |
| | | 2021 | | | 2020 | | | 2019 | | | 2018 | | | 2017 | |
| Per Share Operating Performance(a): | | | | | | | | | | | | | | | | | | | | |
| Net Asset Value, Beginning of Year | | | $11.45 | | | | $11.14 | | | | $10.74 | | | | $10.98 | | | | $11.04 | |
| Income (loss) from investment operations: | | | | | | | | | | | | | | | | | | | | |
| Net investment income (loss) | | | 0.19 | | | | 0.25 | | | | 0.29 | | | | 0.27 | | | | 0.24 | |
| Net realized and unrealized gain (loss) on investment transactions | | | (0.24 | ) | | | 0.35 | | | | 0.43 | | | | (0.21 | ) | | | - | |
| Total from investment operations | | | (0.05 | ) | | | 0.60 | | | | 0.72 | | | | 0.06 | | | | 0.24 | |
| Less Dividends and Distributions: | | | | | | | | | | | | | | | | | | | | |
| Dividends from net investment income | | | (0.24 | ) | | | (0.29 | ) | | | (0.32 | ) | | | (0.30 | ) | | | (0.30 | ) |
| Net asset value, end of year | | | $11.16 | | | | $11.45 | | | | $11.14 | | | | $10.74 | | | | $10.98 | |
| Total Return(b): | | | (0.41 | )% | | | 5.43 | % | | | 6.75 | % | | | 0.61 | % | | | 2.17 | % |
| | | | | | | | | | | | | | | | | | | | | |
| Ratios/Supplemental Data: | | | | | | | |
| Net assets, end of year (000) | | | $8,985,211 | | | | $8,371,100 | | | | $6,187,736 | | | | $5,716,205 | | | | $6,791,114 | |
| Average net assets (000) | | | $8,893,589 | | | | $7,069,401 | | | | $5,905,291 | | | | $6,387,796 | | | | $6,712,127 | |
| Ratios to average net assets(c)(d): | | | | | | | | | | | | | | | | | | | | |
| Expenses after waivers and/or expense reimbursement | | | 0.47 | % | | | 0.47 | % | | | 0.52 | % | | | 0.53 | % | | | 0.53 | % |
| Expenses before waivers and/or expense reimbursement | | | 0.51 | % | | | 0.50 | % | | | 0.53 | % | | | 0.53 | % | | | 0.53 | % |
| Net investment income (loss) | | | 1.69 | % | | | 2.22 | % | | | 2.61 | % | | | 2.46 | % | | | 2.15 | % |
| Portfolio turnover rate(e) | | | 32 | % | | | 36 | % | | | 60 | % | | | 36 | % | | | 50 | % |
| (a) | Calculated based on average shares outstanding during the year. |
| (b) | Total return is calculated assuming a purchase of a share on the first day and a sale on the last day of each year reported and includes reinvestment of dividends and distributions, if any. Total returns may reflect adjustments to conform to GAAP. |
| (c) | Does not include expenses of the underlying funds in which the Fund invests. |
| (d) | Effective October 1, 2017, class specific expenses include transfer agent fees and expenses and registration fees, which are charged to their respective share class. |
| (e) | The Fund’s portfolio turnover rate is calculated in accordance with regulatory requirements, without regard to transactions involving short-term investments, certain derivatives and in-kind transactions (if any). If such transactions were included, the Fund’s portfolio turnover rate may be higher. |
See Notes to Financial Statements.
| | | | | | | | | | | | | | | | | | | | | | | | |
| Class R2 Shares | | | |
| | | Year Ended December 31, | | | | | December 27, 2017(a)
through December 31, 2017 | | | |
| | | 2021 | | | 2020 | | | 2019 | | | 2018 | |
| Per Share Operating Performance(b): | | | | | | | | | | | | | | | | | | | | | | | | |
| Net Asset Value, Beginning of Period | | | $11.47 | | | | $11.15 | | | | $10.75 | | | | $10.99 | | | | | | $10.99 | | | |
| Income (loss) from investment operations: | | | | | | | | | | | | | | | | | | | | | | | | |
| Net investment income (loss) | | | 0.14 | | | | 0.20 | | | | 0.24 | | | | 0.23 | | | | | | -(c) | | | |
| Net realized and unrealized gain (loss) on investment transactions | | | (0.23 | ) | | | 0.36 | | | | 0.43 | | | | (0.21 | ) | | | | | -(c) | | | |
| Total from investment operations | | | (0.09 | ) | | | 0.56 | | | | 0.67 | | | | 0.02 | | | | | | - | | | |
| Less Dividends and Distributions: | | | | | | | | | | | | | | | | | | | | | | | | |
| Dividends from net investment income | | | (0.20 | ) | | | (0.24 | ) | | | (0.27 | ) | | | (0.26 | ) | | | | | -(c) | | | |
| Net asset value, end of period | | | $11.18 | | | | $11.47 | | | | $11.15 | | | | $10.75 | | | | | | $10.99 | | | |
| Total Return(d): | | | (0.81 | )% | | | 5.09 | % | | | 6.32 | % | | | 0.23 | % | | | | | 0.03% | | | |
| | | | | | | | | | | | | | | | | | | | | | | | | |
| Ratios/Supplemental Data: | | | | | | | | | | | | | | | | | | | |
| Net assets, end of period (000) | | | $1,941 | | | | $919 | | | | $188 | | | | $61 | | | | | | $10 | | | |
| Average net assets (000) | | | $1,549 | | | | $477 | | | | $91 | | | | $24 | | | | | | $10 | | | |
| Ratios to average net assets(e): | | | | | | | | | | | | | | | | | | | | | | | | |
| Expenses after waivers and/or expense reimbursement | | | 0.88 | % | | | 0.88 | % | | | 0.91 | % | | | 0.92 | % | | | | | 0.91%(f) | | | |
| Expenses before waivers and/or expense reimbursement | | | 1.89 | % | | | 6.58 | % | | | 22.41 | % | | | 83.41 | % | | | | | 174.19%(f) | | | |
| Net investment income (loss) | | | 1.27 | % | | | 1.74 | % | | | 2.20 | % | | | 2.13 | % | | | | | 1.82%(f) | | | |
| Portfolio turnover rate(g) | | | 32 | % | | | 36 | % | | | 60 | % | | | 36 | % | | | | | 50% | | | |
| (a) | Commencement of offering. |
| (b) | Calculated based on average shares outstanding during the period. |
| (c) | Amount rounds to zero. |
| (d) | Total return is calculated assuming a purchase of a share on the first day and a sale on the last day of each period reported and includes reinvestment of dividends and distributions, if any. Total returns may reflect adjustments to conform to GAAP. Total returns for periods less than one full year are not annualized. |
| (e) | Does not include expenses of the underlying funds in which the Fund invests. |
| (g) | The Fund’s portfolio turnover rate is calculated in accordance with regulatory requirements, without regard to transactions involving short-term investments, certain derivatives and in-kind transactions (if any). If such transactions were included, the Fund’s portfolio turnover rate may be higher. |
See Notes to Financial Statements.
| | | | |
PGIM Short-Term Corporate Bond Fund | | | 63 | |
Financial Highlights (continued)
| | | | | | | | | | | | | | | | | | | | | | | | |
| Class R4 Shares | | | |
| | | Year Ended December 31, | | | | | December 27, 2017(a)
through December 31, 2017 | | | |
| | | 2021 | | | 2020 | | | 2019 | | | 2018 | |
| Per Share Operating Performance(b): | | | | | | | | | | | | | | | | | | | | | | | | |
| Net Asset Value, Beginning of Period | | | $11.46 | | | | $11.15 | | | | $10.76 | | | | $10.99 | | | | | | $10.99 | | | |
| Income (loss) from investment operations: | | | | | | | | | | | | | | | | | | | | | | | | |
| Net investment income (loss) | | | 0.17 | | | | 0.24 | | | | 0.27 | | | | 0.26 | | | | | | -(c) | | | |
| Net realized and unrealized gain (loss) on investment transactions | | | (0.22 | ) | | | 0.34 | | | | 0.42 | | | | (0.20 | ) | | | | | -(c) | | | |
| Total from investment operations | | | (0.05 | ) | | | 0.58 | | | | 0.69 | | | | 0.06 | | | | | | - | | | |
| Less Dividends and Distributions: | | | | | | | | | | | | | | | | | | | | | | | | |
| Dividends from net investment income | | | (0.23 | ) | | | (0.27 | ) | | | (0.30 | ) | | | (0.29 | ) | | | | | -(c) | | | |
| Net asset value, end of period | | | $11.18 | | | | $11.46 | | | | $11.15 | | | | $10.76 | | | | | | $10.99 | | | |
| Total Return(d): | | | (0.47 | )% | | | 5.26 | % | | | 6.49 | % | | | 0.59 | % | | | | | 0.03% | | | |
| | | | | | | | | | | | | | | | | | | | | | | | | |
| Ratios/Supplemental Data: | | | | | | | | | | | | | | | | | | | |
| Net assets, end of period (000) | | | $1,020 | | | | $439 | | | | $546 | | | | $375 | | | | | | $10 | | | |
| Average net assets (000) | | | $887 | | | | $347 | | | | $585 | | | | $69 | | | | | | $10 | | | |
| Ratios to average net assets(e): | | | | | | | | | | | | | | | | | | | | | | | | |
| Expenses after waivers and/or expense reimbursement | | | 0.63 | % | | | 0.63 | % | | | 0.67 | % | | | 0.67 | % | | | | | 0.66%(f) | | | |
| Expenses before waivers and/or expense reimbursement | | | 2.16 | % | | | 8.45 | % | | | 4.00 | % | | | 29.85 | % | | | | | 173.93%(f) | | | |
| Net investment income (loss) | | | 1.52 | % | | | 2.11 | % | | | 2.46 | % | | | 2.45 | % | | | | | 2.08%(f) | | | |
| Portfolio turnover rate(g) | | | 32 | % | | | 36 | % | | | 60 | % | | | 36 | % | | | | | 50% | | | |
| (a) | Commencement of offering. |
| (b) | Calculated based on average shares outstanding during the period. |
| (c) | Amount rounds to zero. |
| (d) | Total return is calculated assuming a purchase of a share on the first day and a sale on the last day of each period reported and includes reinvestment of dividends and distributions, if any. Total returns may reflect adjustments to conform to GAAP. Total returns for periods less than one full year are not annualized. |
| (e) | Does not include expenses of the underlying funds in which the Fund invests. |
| (g) | The Fund’s portfolio turnover rate is calculated in accordance with regulatory requirements, without regard to transactions involving short-term investments, certain derivatives and in-kind transactions (if any). If such transactions were included, the Fund’s portfolio turnover rate may be higher. |
See Notes to Financial Statements.
| | | | | | | | | | | | | | | | | | | | |
| Class R6 Shares | |
| | | Year Ended December 31, | |
| | | 2021 | | | 2020 | | | 2019 | | | 2018 | | | 2017 | |
| Per Share Operating Performance(a): | | | | | | | | | | | | | | | | | | | | |
| Net Asset Value, Beginning of Year | | | $11.46 | | | | $11.14 | | | | $10.75 | | | | $10.99 | | | | $11.05 | |
| Income (loss) from investment operations: | | | | | | | | | | | | | | | | | | | | |
| Net investment income (loss) | | | 0.20 | | | | 0.26 | | | | 0.30 | | | | 0.28 | | | | 0.25 | |
| Net realized and unrealized gain (loss) on investment transactions | | | (0.24 | ) | | | 0.36 | | | | 0.42 | | | | (0.20 | ) | | | - | |
| Total from investment operations | | | (0.04 | ) | | | 0.62 | | | | 0.72 | | | | 0.08 | | | | 0.25 | |
| Less Dividends and Distributions: | | | | | | | | | | | | | | | | | | | | |
| Dividends from net investment income | | | (0.25 | ) | | | (0.30 | ) | | | (0.33 | ) | | | (0.32 | ) | | | (0.31 | ) |
| Net asset value, end of year | | | $11.17 | | | | $11.46 | | | | $11.14 | | | | $10.75 | | | | $10.99 | |
| Total Return(b): | | | (0.31 | )% | | | 5.62 | % | | | 6.76 | % | | | 0.72% | | | | 2.30 | % |
| | | | | | | | | | | | | | | | | | | | | |
| Ratios/Supplemental Data: | |
| Net assets, end of year (000) | | | $2,586,493 | | | | $1,821,666 | | | | $1,331,608 | | | | $1,216,253 | | | | $1,020,248 | |
| Average net assets (000) | | | $2,277,111 | | | | $1,498,054 | | | | $1,261,494 | | | | $1,139,003 | | | | $741,165 | |
| Ratios to average net assets(c)(d): | | | | | | | | | | | | | | | | | | | | |
| Expenses after waivers and/or expense reimbursement | | | 0.38 | % | | | 0.38 | % | | | 0.42 | % | | | 0.42 | % | | | 0.42 | % |
| Expenses before waivers and/or expense reimbursement | | | 0.40 | % | | | 0.40 | % | | | 0.42 | % | | | 0.42 | % | | | 0.42 | % |
| Net investment income (loss) | | | 1.77 | % | | | 2.31 | % | | | 2.71 | % | | | 2.58 | % | | | 2.27 | % |
| Portfolio turnover rate(e) | | | 32 | % | | | 36 | % | | | 60 | % | | | 36 | % | | | 50 | % |
| (a) | Calculated based on average shares outstanding during the year. |
| (b) | Total return is calculated assuming a purchase of a share on the first day and a sale on the last day of each year reported and includes reinvestment of dividends and distributions, if any. Total returns may reflect adjustments to conform to GAAP. |
| (c) | Does not include expenses of the underlying funds in which the Fund invests. |
| (d) | Effective October 1, 2017, class specific expenses include transfer agent fees and expenses and registration fees, which are charged to their respective share class. |
| (e) | The Fund’s portfolio turnover rate is calculated in accordance with regulatory requirements, without regard to transactions involving short-term investments, certain derivatives and in-kind transactions (if any). If such transactions were included, the Fund’s portfolio turnover rate may be higher. |
See Notes to Financial Statements.
| | | | |
PGIM Short-Term Corporate Bond Fund | | | 65 | |
Notes to Financial Statements
1. Organization
Prudential Short-Term Corporate Bond Fund, Inc. (the “Registered Investment Company” or “RIC”) is registered under the Investment Company Act of 1940, as amended (“1940 Act”), as an open-end management investment company. The RIC is organized as a Delaware Statutory Trust and PGIM Short-Term Corporate Bond Fund (the “Fund”) is the sole series of the RIC. The Fund is classified as a diversified fund for purposes of the 1940 Act.
The investment objective of the Fund is to seek high current income consistent with the preservation of principal.
2. Accounting Policies
The Fund follows the investment company accounting and reporting guidance of the Financial Accounting Standards Board (“FASB”) Accounting Standard Codification (“ASC”) Topic 946 Financial Services — Investment Companies. The following is a summary of significant accounting policies followed by the Fund in the preparation of its financial statements. The policies conform to U.S. generally accepted accounting principles (“GAAP”). The Fund consistently follows such policies in the preparation of its financial statements.
Securities Valuation: The Fund holds securities and other assets and liabilities that are fair valued at the close of each day (generally, 4:00 PM Eastern time) the New York Stock Exchange (“NYSE”) is open for trading. Fair value is the price that would be received to sell an asset or paid to transfer a liability in an orderly transaction between market participants on the measurement date. The RIC’s Board of Directors (the “Board”) has adopted valuation procedures for security valuation under which fair valuation responsibilities have been delegated to PGIM Investments LLC (“PGIM Investments” or the “Manager”). Pursuant to the Board’s delegation, the Manager has established a Valuation Committee responsible for supervising the fair valuation of portfolio securities and other assets and liabilities. The valuation procedures permit the Fund to utilize independent pricing vendor services, quotations from market makers, and alternative valuation methods when market quotations are either not readily available or not deemed representative of fair value. A record of the Valuation Committee’s actions is subject to the Board’s review, approval, and ratification at its next regularly scheduled quarterly meeting.
For the fiscal reporting year-end, securities and other assets and liabilities were fair valued at the close of the last U.S. business day. Trading in certain foreign securities may occur when the NYSE is closed (including weekends and holidays). Because such foreign securities trade in markets that are open on weekends and U.S. holidays, the values of some of the Fund’s foreign investments may change on days when investors cannot purchase or redeem Fund shares.
Various inputs determine how the Fund’s investments are valued, all of which are categorized according to the three broad levels (Level 1, 2, or 3) detailed in the Schedule of Investments and referred to herein as the “fair value hierarchy” in accordance with FASB ASC Topic 820 - Fair Value Measurement.
Common or preferred stocks, exchange-traded funds and derivative instruments, if applicable, that are traded on a national securities exchange are valued at the last sale price as of the close of trading on the applicable exchange where the security principally trades. Securities traded via NASDAQ are valued at the NASDAQ official closing price. To the extent these securities are valued at the last sale price or NASDAQ official closing price, they are classified as Level 1 in the fair value hierarchy. In the event that no sale or official closing price on valuation date exists, these securities are generally valued at the mean between the last reported bid and ask prices, or at the last bid price in the absence of an ask price. These securities are classified as Level 2 in the fair value hierarchy.
Investments in open-end funds (other than exchange-traded funds) are valued at their net asset values as of the close of the NYSE on the date of valuation. These securities are classified as Level 1 in the fair value hierarchy since they may be purchased or sold at their net asset values on the date of valuation.
Fixed income securities traded in the OTC market are generally classified as Level 2 in the fair value hierarchy. Such fixed income securities are typically valued using the market approach which generally involves obtaining data from an approved independent third-party vendor source. The Fund utilizes the market approach as the primary method to value securities when market prices of identical or comparable instruments are available. The third-party vendors’ valuation techniques used to derive the evaluated bid price are based on evaluating observable inputs, including but not limited to, yield curves, yield spreads, credit ratings, deal terms, tranche level attributes, default rates, cash flows, prepayment speeds, broker/dealer quotations and reported trades. Certain Level 3 securities are also valued using the market approach when obtaining a single broker quote or when utilizing transaction prices for identical securities that have been used in excess of five business days. During the reporting period, there were no changes to report with respect to the valuation approach and/or valuation techniques discussed above.
Securities and other assets that cannot be priced according to the methods described above are valued based on pricing methodologies approved by the Board. In the event that unobservable inputs are used when determining such valuations, the securities will be classified as Level 3 in the fair value hierarchy. Altering one or more unobservable inputs may result in a significant change to a Level 3 security’s fair value measurement.
When determining the fair value of securities, some of the factors influencing the valuation include: the nature of any restrictions on disposition of the securities; assessment of the general liquidity of the securities; the issuer’s financial condition and the markets in which it does business; the cost of the investment; the size of the holding and the capitalization of the issuer; the prices of any recent transactions or bids/offers for such securities or any
| | | | |
PGIM Short-Term Corporate Bond Fund | | | 67 | |
Notes to Financial Statements (continued)
comparable securities; any available analyst media or other reports or information deemed reliable by the Manager regarding the issuer or the markets or industry in which it operates. Using fair value to price securities may result in a value that is different from a security’s most recent closing price and from the price used by other unaffiliated mutual funds to calculate their net asset values.
Financial Futures Contracts: A financial futures contract is an agreement to purchase (long) or sell (short) an agreed amount of securities at a set price for delivery on a future date. Upon entering into a financial futures contract, the Fund is required to pledge to the broker an amount of cash and/or other assets equal to a certain percentage of the contract amount. This amount is known as the “initial margin.” Subsequent payments, known as “variation margin,” are made or received by the Fund each day, depending on the daily fluctuations in the value of the underlying security. Such variation margin is recorded for financial statement purposes on a daily basis as unrealized gain (loss). When the contract expires or is closed, the gain (loss) is realized and is presented in the Statement of Operations as net realized gain (loss) on futures transactions.
The Fund invested in financial futures contracts in order to hedge its existing portfolio securities, or securities the Fund intends to purchase, against fluctuations in value caused by changes in prevailing interest rates. Should interest rates move unexpectedly, the Fund may not achieve the anticipated benefits of the financial futures contracts and may realize a loss. The use of futures transactions involves the risk of imperfect correlation in movements in the price of futures contracts, interest rates and the underlying hedged assets. Since futures contracts are exchange-traded, there is minimal counterparty credit risk to the Fund since the exchanges’ clearinghouse acts as counterparty to all exchange-traded futures and guarantees the futures contracts against default.
Swap Agreements: The Fund entered into certain types of swap agreements detailed in the disclosures below. A swap agreement is an agreement to exchange the return generated by one instrument for the return generated by another instrument. Swap agreements are negotiated in the OTC market and may be executed either directly with a counterparty (“OTC-traded”) or through a central clearing facility, such as a registered exchange. Swap agreements are valued daily at current market value and any change in value is included in the net unrealized appreciation or depreciation on swap agreements. Centrally cleared swaps pay or receive an amount known as “variation margin”, based on daily changes in the valuation of the swap contract. For OTC-traded, upfront premiums paid and received are shown as swap premiums paid and swap premiums received in the Statement of Assets and Liabilities. Risk of loss may exceed amounts recognized on the Statement of Assets and Liabilities. Swap agreements outstanding at period end, if any, are listed on the Schedule of Investments.
Interest Rate Swaps: Interest rate swaps represent an agreement between counterparties to exchange cash flows based on the difference between two interest rates, applied to a notional principal amount for a specified period. The Fund is subject to interest rate risk exposure in the normal course of pursuing its investment objective. The Fund used interest rate swaps to maintain its ability to generate steady cash flow by receiving a stream of fixed rate payments or to increase exposure to prevailing market rates by receiving floating rate payments. The Fund’s maximum risk of loss from counterparty credit risk is the discounted net present value of the cash flows to be received from the counterparty over the contract’s remaining life.
Credit Default Swaps (“CDS”): CDS involve one party (the protection buyer) making a stream of payments to another party (the protection seller) in exchange for the right to receive a specified payment in the event of a default or as a result of a default (collectively a “credit event”) for the referenced entity (typically corporate issues or sovereign issues of an emerging country) on its obligation; or in the event of a write-down, principal shortfall, interest shortfall or default of all or part of the referenced entities comprising a credit index.
The Fund is subject to credit risk in the normal course of pursuing its investment objectives, and as such, has entered into CDS contracts to provide a measure of protection against defaults or to take an active long or short position with respect to the likelihood of a particular issuer’s default or the reference entity’s credit soundness. CDS contracts generally trade based on a spread which represents the cost a protection buyer has to pay the protection seller. The protection buyer is said to be short the credit as the value of the contract rises the more the credit deteriorates. The value of the CDS contract increases for the protection buyer if the spread increases. The Fund’s maximum risk of loss from counterparty credit risk for purchased CDS is the inability of the counterparty to honor the contract up to the notional value due to a credit event.
As a seller of protection on credit default swap agreements, the Fund generally receives an agreed upon payment from the buyer of protection throughout the term of the swap, provided no credit event occurs. As the seller, the Fund effectively increases its investment risk because, in addition to its total net assets, the Fund may be subject to investment exposure on the notional amount of the swap.
The maximum amount of the payment that the Fund, as a seller of protection, could be required to make under a credit default swap agreement would be equal to the notional amount of the underlying security or index contract as a result of a credit event. This potential amount will be partially offset by any recovery values of the respective referenced obligations, or net amounts received from the settlement of buy protection credit default swap agreements which the Fund entered into for the same referenced entity or index. As a buyer of protection, the Fund generally receives an amount up to the notional value of the swap if a credit event occurs.
Implied credit spreads, represented in absolute terms, utilized in determining the market value of credit default swap agreements where the Fund is the seller of protection as of
| | | | |
PGIM Short-Term Corporate Bond Fund | | | 69 | |
Notes to Financial Statements (continued)
period end are disclosed in the footnotes to the Schedule of Investments, if applicable. These spreads serve as indicators of the current status of the payment/performance risk and represent the likelihood of default risk for the credit derivative. The implied credit spread of a particular referenced entity reflects the cost of buying/selling protection and may include upfront payments required to enter into the agreement. Wider credit spreads and increased market value in absolute terms, when compared to the notional amount of the swap, represent a deterioration of the referenced entity’s credit soundness and a greater likelihood of risk of default or other credit event occurring as defined under the terms of the agreement.
Mortgage-Backed and Asset-Backed Securities: Mortgage-backed securities are pass-through securities, meaning that principal and interest payments made by the borrower on the underlying mortgages are passed through to the Fund. Asset-backed securities directly or indirectly represent a participation interest in, or are secured by and payable from, a stream of payments generated by particular assets such as motor vehicle or credit card receivables. Asset-backed securities may be classified as pass-through certificates or collateralized obligations, such as collateralized bond obligations, collateralized loan obligations and other similarly structured securities. The value of mortgage-backed and asset-backed securities varies with changes in interest rates and may be affected by changes in credit quality or value of the mortgage loans or other assets that support the securities.
Stripped mortgage-backed securities are usually structured with two classes that receive different proportions of the interest (“IO”) and principal (“PO”) distributions on a pool of mortgage assets. Payments received for IOs are included in interest income on the Statements of Operations. Because no principal will be received at the maturity of an IO, adjustments are made to the cost of the security on a monthly basis until maturity. These adjustments are included in interest income on the Statements of Operations. Payments received for POs are treated as reductions to the cost and par value of the securities.
Master Netting Arrangements: The RIC, on behalf of the Fund, is subject to various Master Agreements, or netting arrangements, with select counterparties. These are agreements which a subadviser may have negotiated and entered into on behalf of all or a portion of the Fund. A master netting arrangement between the Fund and the counterparty permits the Fund to offset amounts payable by the Fund to the same counterparty against amounts to be received; and by the receipt of collateral from the counterparty by the Fund to cover the Fund’s exposure to the counterparty. However, there is no assurance that such mitigating factors are easily enforceable. In addition to master netting arrangements, the right to set-off exists when all the conditions are met such that each of the parties owes the other determinable amounts, the reporting party has the right to set-off the amount owed with the
amount owed by the other party, the reporting party intends to set-off and the right of set-off is enforceable by law.
The RIC, on behalf of the Fund, is a party to International Swaps and Derivatives Association, Inc. (“ISDA”) Master Agreements with certain counterparties that govern OTC derivative and foreign exchange contracts entered into from time to time. The Master Agreements may contain provisions regarding, among other things, the parties’ general obligations, representations, agreements, collateral requirements, events of default and early termination. With respect to certain counterparties, in accordance with the terms of the Master Agreements, collateral posted to the Fund is held in a segregated account by the Fund’s custodian and with respect to those amounts which can be sold or re-pledged, is presented in the Schedule of Investments. Collateral pledged by the Fund is segregated by the Fund’s custodian and identified in the Schedule of Investments. Collateral can be in the form of cash or debt securities issued by the U.S. Government or related agencies or other securities as agreed to by the Fund and the applicable counterparty. Collateral requirements are determined based on the Fund’s net position with each counterparty. Termination events applicable to the Fund may occur upon a decline in the Fund’s net assets below a specified threshold over a certain period of time. Termination events applicable to counterparties may occur upon a decline in the counterparty’s long-term and short-term credit ratings below a specified level. In each case, upon occurrence, the other party may elect to terminate early and cause settlement of all derivative and foreign exchange contracts outstanding, including the payment of any losses and costs resulting from such early termination, as reasonably determined by the terminating party. Any decision by one or more of the Fund’s counterparties to elect early termination could impact the Fund’s future derivative activity.
In addition to each instrument’s primary underlying risk exposure (e.g. interest rate, credit, equity or foreign exchange, etc.), swap agreements involve, to varying degrees, elements of credit, market and documentation risk. Such risks involve the possibility that no liquid market for these agreements will exist, the counterparty to the agreement may default on its obligation to perform or disagree on the contractual terms of the agreement, and changes in net interest rates will be unfavorable. In connection with these agreements, securities in the portfolio may be identified or received as collateral from the counterparty in accordance with the terms of the respective swap agreements to provide or receive assets of value and to serve as recourse in the event of default or bankruptcy/insolvency of either party. Such OTC derivative agreements include conditions which, when materialized, give the counterparty the right to cause an early termination of the transactions under those agreements. Any election by the counterparty for early termination of the contract(s) may impact the amounts reported on financial statements.
Short sales and OTC contracts, including forward foreign currency exchange contracts, swaps, forward rate agreements and written options involve elements of both market and credit risk in excess of the amounts reflected on the Statement of Assets and Liabilities, if applicable. Such risks may be mitigated by engaging in master netting arrangements.
| | | | |
PGIM Short-Term Corporate Bond Fund | | | 71 | |
Notes to Financial Statements (continued)
Securities Lending: The Fund lends its portfolio securities to banks and broker-dealers. The loans are secured by collateral at least equal to the market value of the securities loaned. Collateral pledged by each borrower is invested in an affiliated money market fund and is marked to market daily, based on the previous day’s market value, such that the value of the collateral exceeds the value of the loaned securities. In the event of significant appreciation in value of securities on loan on the last business day of the reporting period, the financial statements may reflect a collateral value that is less than the market value of the loaned securities. Such shortfall is remedied as described above. Loans are subject to termination at the option of the borrower or the Fund. Upon termination of the loan, the borrower will return to the Fund securities identical to the loaned securities. The remaining maturities of the securities lending transactions are considered overnight and continuous. Should the borrower of the securities fail financially, the Fund has the right to repurchase the securities in the open market using the collateral.
The Fund recognizes income, net of any rebate and securities lending agent fees, for lending its securities in the form of fees or interest on the investment of any cash received as collateral. The borrower receives all interest and dividends from the securities loaned and such payments are passed back to the lender in amounts equivalent thereto, which are reflected in interest income or unaffiliated dividend income based on the nature of the payment on the Statement of Operations. The Fund also continues to recognize any unrealized gain (loss) in the market price of the securities loaned and on the change in the value of the collateral invested that may occur during the term of the loan. In addition, realized gain (loss) is recognized on changes in the value of the collateral invested upon liquidation of the collateral. Net earnings from securities lending are disclosed in the Statement of Operations.
Securities Transactions and Net Investment Income: Securities transactions are recorded on the trade date. Realized gains (losses) from investment and currency transactions are calculated on the specific identification method. Dividend income is recorded on the ex-date, or for certain foreign securities, when the Fund becomes aware of such dividends. Interest income, including amortization of premium and accretion of discount on debt securities, as required, is recorded on the accrual basis. Expenses are recorded on an accrual basis, which may require the use of certain estimates by management that may differ from actual. Net investment income or loss (other than class specific expenses and waivers, which are allocated as noted below) and unrealized and realized gains (losses) are allocated daily to each class of shares based upon the relative proportion of adjusted net assets of each class at the beginning of the day. Class specific expenses and waivers, where applicable, are charged to the respective share classes. Such class specific expenses and waivers include distribution fees and distribution fee waivers, shareholder servicing fees, transfer agent’s fees and expenses, registration fees and fee waivers and/or expense reimbursements, as applicable.
Taxes: It is the Fund’s policy to continue to meet the requirements of the Internal Revenue Code applicable to regulated investment companies and to distribute all of its taxable net investment income and capital gains, if any, to its shareholders. Therefore, no federal income tax provision is required. Withholding taxes on foreign dividends, interest and capital gains, if any, are recorded, net of reclaimable amounts, at the time the related income is earned.
Dividends and Distributions: The Fund expects to declare dividends of its net investment income daily and pay such dividends monthly. Distributions of net realized capital and currency gains, if any, are declared and paid at least annually. Dividends and distributions to shareholders, which are determined in accordance with federal income tax regulations and which may differ from GAAP, are recorded on the ex-date. Permanent book/tax differences relating to income and gain (loss) are reclassified between total distributable earnings (loss) and paid-in capital in excess of par, as appropriate.
Estimates: The preparation of financial statements requires management to make estimates and assumptions that affect the reported amounts and disclosures in the financial statements. Actual results could differ from those estimates.
3. Agreements
The RIC, on behalf of the Fund, has a management agreement with the Manager. Pursuant to this agreement, the Manager has responsibility for all investment advisory services and supervises the subadviser’s performance of such services.
The Manager has entered into a subadvisory agreement with PGIM, Inc., which provides subadvisory services to the Fund through its business unit PGIM Fixed Income, and PGIM Limited (the “subadviser”). The Manager pays for the services of the subadviser.
The management fee paid to the Manager is accrued daily and payable monthly at an annual rate of 0.38% of average daily net assets up to $10 billion and 0.37% of average daily net assets over $10 billion. The effective management fee rate before any waivers and/or expense reimbursements was 0.38% for the year ended December 31, 2021.
The Manager has contractually agreed, through April 30, 2023, to limit total annual fund operating expenses, after fee waivers and/or expense reimbursements to 0.47% of average daily net assets for Class Z shares, 0.88% of average daily net assets for Class R2 shares,
0.63% of average daily net assets for Class R4 shares, and 0.38% of average daily net assets for Class R6 shares. This contractual expense limitation excludes interest, brokerage, taxes (such as income and foreign withholding taxes, stamp duty and deferred tax expenses), acquired fund fees and expenses, extraordinary expenses, and certain other Fund expenses such as dividend and interest expense and broker charges on short sales.
Where applicable, the Manager agrees to waive management fees or shared operating expenses on any share class to the same extent that it waives such expenses on any other
| | | | |
PGIM Short-Term Corporate Bond Fund | | | 73 | |
Notes to Financial Statements (continued)
share class. In addition, total annual operating expenses for Class R6 shares will not exceed total annual operating expenses for Class Z shares. Fees and/or expenses waived and/or reimbursed by the Manager may be recouped by PGIM Investments within the same fiscal year during which such waiver and/or reimbursement is made if such recoupment can be realized without exceeding the expense limit in effect at the time of the recoupment for that fiscal year.
The RIC, on behalf of the Fund, has a distribution agreement with Prudential Investment Management Services LLC (“PIMS”), which acts as the distributor of the Class A, Class C, Class R, Class Z, Class R2, Class R4 and Class R6 shares of the Fund. The Fund compensates PIMS for distributing and servicing the Fund’s Class A, Class C, Class R and Class R2 shares, pursuant to the plans of distribution (the “Distribution Plans”), regardless of expenses actually incurred by PIMS.
Pursuant to the Distribution Plans, the Fund compensates PIMS for distribution related activities at an annual rate of up to 0.25%, 1%, 0.75% and 0.25% of the average daily net assets of the Class A, Class C, Class R and Class R2 shares, respectively. PIMS contractually agreed through April 30, 2023 to limit such fees to 0.50% of the average daily net assets of Class R shares. The distribution fees are accrued daily and payable monthly. No distribution or service fees are paid to PIMS as distributor of the Class Z, Class R4 or Class R6 shares of the Fund.
The Fund has adopted a Shareholder Services Plan with respect to Class R2 and Class R4 shares. Under the terms of the Shareholder Services Plan, Class R2 and Class R4 shares are authorized to pay to Prudential Mutual Fund Services LLC (“PMFS”), its affiliates or third-party service providers, as compensation for services rendered to the shareholders of such Class R2 or Class R4 shares, a shareholder service fee at an annual rate of up to 0.10% of the average daily net assets attributable to Class R2 and Class R4 shares. The shareholder service fee is accrued daily and paid monthly, as applicable.
For the year ended December 31, 2021, PIMS received $1,871,006 in front-end sales charges resulting from sales of Class A shares. Additionally, for the year ended December 31, 2021, PIMS received $207,803 and $75,357 in contingent deferred sales charges imposed upon redemptions by certain Class A and Class C shareholders, respectively. From these fees, PIMS paid such sales charges to broker-dealers, who in turn paid commissions to salespersons and incurred other distribution costs.
PGIM Investments, PGIM, Inc., PGIM Limited, PIMS and PMFS are indirect, wholly-owned subsidiaries of Prudential Financial, Inc. (“Prudential”).
4. Other Transactions with Affiliates
PMFS serves as the Fund’s transfer agent. Transfer agent’s fees and expenses in the Statement of Operations include certain out-of-pocket expenses paid to non-affiliates, where applicable.
The Fund may invest its overnight sweep cash in the PGIM Core Ultra Short Bond Fund (the “Core Fund”), and its securities lending cash collateral in the PGIM Institutional Money Market Fund (the “Money Market Fund”), each a fund of Prudential Investment Portfolios 2, registered under the 1940 Act and managed by PGIM Investments. PGIM Investments and/or its affiliates are paid fees or reimbursed for providing their services to the Core Fund and the Money Market Fund. In addition to the realized and unrealized gains on investments in the Core Fund and Money Market Fund, earnings from such investments are disclosed on the Statement of Operations as “Affiliated dividend income” and “Income from securities lending, net”, respectively.
The Fund may enter into certain securities purchase or sale transactions under Board approved Rule 17a-7 procedures. Rule 17a-7 is an exemptive rule under the 1940 Act, that subject to certain conditions, permits purchase and sale transactions among affiliated investment companies, or between an investment company and a person that is affiliated solely by reason of having a common (or affiliated) investment adviser, common directors/trustees, and/or common officers. For the year ended December 31, 2021, no 17a-7 transactions were entered into by the Fund.
5. Portfolio Securities
The aggregate cost of purchases and proceeds from sales of portfolio securities (excluding short-term investments and U.S. Government securities) for the year ended December 31, 2021, were $5,497,124,232 and $4,142,529,579, respectively.
A summary of the cost of purchases and proceeds from sales of shares of affiliated mutual funds for the year ended December 31, 2021, is presented as follows:
| | | | | | | | | | | | | | | | | | | | | | | | | | | | |
Value,
Beginning
of Year | | Cost of
Purchases | | | Proceeds
from Sales | | | Change in
Unrealized
Gain
(Loss) | | | Realized
Gain
(Loss) | | | Value,
End of Year | | | Shares,
End
of Year | | | Income | |
Short-Term Investments - Affiliated Mutual Funds: | |
PGIM Core Ultra Short Bond Fund(1)(wa) | |
$241,136,688 | | $ | 3,209,472,721 | | | $ | 3,189,184,695 | | | $ | — | | | $ | — | | | $ | 261,424,714 | | | | 261,424,714 | | | $ | 399,123 | |
|
PGIM Institutional Money Market Fund(1)(b)(wa) | |
304,276,942 | | | 1,362,523,196 | | | | 1,408,346,636 | | | | 1,131 | | | | (61,215 | ) | | | 258,393,418 | | | | 258,574,420 | | | | 196,968 | (2) |
| | | | | | | | | | | | | | | | | | | | | | | | | | | | |
$545,413,630 | | $ | 4,571,995,917 | | | $ | 4,597,531,331 | | | $ | 1,131 | | | $ | (61,215 | ) | | $ | 519,818,132 | | | | | | | $ | 596,091 | |
| | | | | | | | | | | | | | | | | | | | | | | | | | | | |
| (1) | The Fund did not have any capital gain distributions during the reporting period. |
| (2) | The amount, or a portion thereof, represents the affiliated securities lending income shown on the Statement of Operations. |
| | | | |
PGIM Short-Term Corporate Bond Fund | | | 75 | |
Notes to Financial Statements (continued)
| (b) | Represents security, or portion thereof, purchased with cash collateral received for securities on loan and includes dividend reinvestment. |
| (wa) | PGIM Investments LLC, the manager of the Fund, also serves as manager of the PGIM Core Ultra Short Bond Fund and PGIM Institutional Money Market Fund, if applicable. |
6. Distributions and Tax Information
Distributions to shareholders, which are determined in accordance with federal income tax regulations and which may differ from GAAP, are recorded on the ex-date.
For the years ended December 31, 2021 and December 31, 2020, the tax character of dividends paid by the Fund were $284,146,292 and $274,087,652 of ordinary income, respectively.
As of December 31, 2021, the accumulated undistributed earnings on a tax basis was $47,831 of distributable earnings.
The United States federal income tax basis of the Fund’s investments and the net unrealized depreciation as of December 31, 2021 were as follows:
| | | | | | |
| Tax Basis | | Gross
Unrealized
Appreciation | | Gross
Unrealized
Depreciation | | Net
Unrealized
Depreciation |
$13,926,979,209 | | $163,432,844 | | $(204,826,109) | | $(41,393,265) |
The difference between GAAP and tax basis were primarily attributable to the differences in the treatment of accreting market discount and premium amortization for GAAP and tax purposes, futures contracts and other GAAP to tax differences.
For federal income tax purposes, the Fund had a capital loss carryforward as of December 31, 2021 of approximately $253,278,000 which can be carried forward for an unlimited period. The Fund utilized approximately $52,420,000 of its capital loss carryforward to offset net taxable gains realized in the fiscal year ended December 31, 2021. No capital gains distributions are expected to be paid to shareholders until net gains have been realized in excess of such losses.
The Manager has analyzed the Fund’s tax positions taken on federal, state and local income tax returns for all open tax years and has concluded that no provision for income tax is required in the Fund’s financial statements for the current reporting period. Since tax authorities can examine previously filed tax returns, the Fund’s U.S. federal and state tax returns for each of the four fiscal years up to the most recent fiscal year ended December 31, 2021 are subject to such review.
7. Capital and Ownership
The Fund offers Class A, Class C, Class R, Class Z, Class R2, Class R4 and Class R6 shares. Class A shares are sold with a maximum front-end sales charge of 2.25%. Investors who purchase $500,000 or more of Class A shares and sell those shares within 12 months of purchase are subject to a contingent deferred sales charge (“CDSC”) of 1.00% on sales although these purchases are not subject to a front-end sales charge. The Class A CDSC is waived for certain retirement and/or benefit plans. A special exchange privilege is also available for shareholders who qualified to purchase Class A shares at net asset value. Effective June 26, 2020, all of the issued and outstanding Class B shares of the Fund converted into Class A shares. Class C shares are sold with a CDSC of 1% on sales made within 12 months of purchase. Class C shares will automatically convert to Class A shares on a monthly basis approximately eight years (ten years prior to January 22, 2021) after purchase. Class R shares are available to certain retirement plans, clearing and settlement firms. Class R, Class Z, Class R2, Class R4 and Class R6 shares are not subject to any sales or redemption charges and are available exclusively for sale to a limited group of investors.
Under certain circumstances, an exchange may be made from specified share classes of the Fund to one or more other share classes of the Fund as presented in the table of transactions in shares of common stock, below.
The RIC is authorized to issue 30,025,000,000 shares of capital stock, $0.01 par value per share, designated as shares of the Fund. The authorized shares of the Fund are currently classified and designated as follows:
| | | | | | |
| Class A | | | | | 3,500,000,000 | |
| Class B | | | | | 5,000,000 | |
| Class C | | | | | 700,000,000 | |
| Class R | | | | | 250,000,000 | |
| Class Z | | | | | 15,000,000,000 | |
| Class T | | | | | 170,000,000 | |
| Class R2 | | | | | 200,000,000 | |
| Class R4 | | | | | 200,000,000 | |
| Class R6 | | | | | 10,000,000,000 | |
The Fund currently does not have any Class B or Class T shares outstanding.
As of December 31, 2021, Prudential, through its affiliated entities, including affiliated funds (if applicable), owned shares of the Fund as follows:
| | | | | | |
| | | Number of Shares | | | Percentage of
Outstanding Shares |
Class A | | | 5,298 | | | 0.1% |
Class Z | | | 918 | | | 0.1% |
Class R6 | | | 519,051 | | | 0.2% |
| | | | |
PGIM Short-Term Corporate Bond Fund | | | 77 | |
Notes to Financial Statements (continued)
At the reporting period end, the number of shareholders holding greater than 5% of the Fund are as follows:
| | | | | | |
| Affiliated | | Unaffiliated |
Number of
Shareholders | | Percentage of
Outstanding Shares | | Number of
Shareholders | | Percentage of
Outstanding Shares |
— | | —% | | 8 | | 83.8% |
Transactions in shares of common stock were as follows:
| | | | | | | | |
Class A | | Shares | | | Amount | |
Year ended December 31, 2021: | | | | | | | | |
Shares sold | | | 47,013,598 | | | $ | 531,966,348 | |
Shares issued in reinvestment of dividends and distributions | | | 2,743,573 | | | | 30,960,017 | |
Shares purchased | | | (74,226,035 | ) | | | (839,128,363 | ) |
| | | | | | | | |
Net increase (decrease) in shares outstanding before conversion | | | (24,468,864 | ) | | | (276,201,998 | ) |
Shares issued upon conversion from other share class(es) | | | 16,651,015 | | | | 188,952,374 | |
Shares purchased upon conversion into other share class(es) | | | (3,446,414 | ) | | | (38,938,529 | ) |
| | | | | | | | |
Net increase (decrease) in shares outstanding | | | (11,264,263 | ) | | $ | (126,188,153 | ) |
| | | | | | | | |
Year ended December 31, 2020: | | | | | | | | |
Shares sold | | | 143,553,675 | | | $ | 1,597,601,403 | |
Shares issued in reinvestment of dividends and distributions | | | 3,808,559 | | | | 42,644,950 | |
Shares purchased | | | (142,590,346 | ) | | | (1,605,069,899 | ) |
| | | | | | | | |
Net increase (decrease) in shares outstanding before conversion | | | 4,771,888 | | | | 35,176,454 | |
Shares issued upon conversion from other share class(es) | | | 15,635,765 | | | | 175,539,385 | |
Shares purchased upon conversion into other share class(es) | | | (4,462,361 | ) | | | (50,131,802 | ) |
| | | | | | | | |
Net increase (decrease) in shares outstanding | | | 15,945,292 | | | $ | 160,584,037 | |
| | | | | | | | |
Class B | | | | | | |
Period ended June 26, 2020*: | | | | | | | | |
Shares sold | | | 5,160 | | | $ | 57,468 | |
Shares issued in reinvestment of dividends and distributions | | | 455 | | | | 5,010 | |
Shares purchased | | | (13,752 | ) | | | (151,158 | ) |
| | | | | | | | |
Net increase (decrease) in shares outstanding before conversion | | | (8,137 | ) | | | (88,680 | ) |
Shares purchased upon conversion into other share class(es) | | | (77,619 | ) | | | (865,799 | ) |
| | | | | | | | |
Net increase (decrease) in shares outstanding | | | (85,756 | ) | | $ | (954,479 | ) |
| | | | | | | | |
| | | | | | | | |
Class C | | Shares | | | Amount | |
Year ended December 31, 2021: | | | | | | | | |
Shares sold | | | 6,277,117 | | | $ | 71,043,813 | |
Shares issued in reinvestment of dividends and distributions | | | 361,858 | | | | 4,086,106 | |
Shares purchased | | | (7,401,573 | ) | | | (83,509,339 | ) |
| | | | | | | | |
Net increase (decrease) in shares outstanding before conversion | | | (762,598 | ) | | | (8,379,420 | ) |
Shares purchased upon conversion into other share class(es) | | | (12,721,732 | ) | | | (144,600,233 | ) |
| | | | | | | | |
Net increase (decrease) in shares outstanding | | | (13,484,330 | ) | | $ | (152,979,653 | ) |
| | | | | | | | |
Year ended December 31, 2020: | | | | | | | | |
Shares sold | | | 10,982,781 | | | $ | 123,047,035 | |
Shares issued in reinvestment of dividends and distributions | | | 647,468 | | | | 7,234,724 | |
Shares purchased | | | (9,319,665 | ) | | | (103,668,576 | ) |
| | | | | | | | |
Net increase (decrease) in shares outstanding before conversion | | | 2,310,584 | | | | 26,613,183 | |
Shares issued upon conversion from other share class(es) | | | 18 | | | | 204 | |
Shares purchased upon conversion into other share class(es) | | | (12,803,858 | ) | | | (143,814,385 | ) |
| | | | | | | | |
Net increase (decrease) in shares outstanding | | | (10,493,256 | ) | | $ | (117,200,998 | ) |
| | | | | | | | |
Class R | | | | | | |
Year ended December 31, 2021: | | | | | | | | |
Shares sold | | | 1,271,034 | | | $ | 14,337,201 | |
Shares issued in reinvestment of dividends and distributions | | | 195,715 | | | | 2,208,515 | |
Shares purchased | | | (1,552,783 | ) | | | (17,552,514 | ) |
| | | | | | | | |
Net increase (decrease) in shares outstanding before conversion | | | (86,034 | ) | | | (1,006,798 | ) |
Shares purchased upon conversion into other share class(es) | | | (1,144 | ) | | | (12,962 | ) |
| | | | | | | | |
Net increase (decrease) in shares outstanding | | | (87,178 | ) | | $ | (1,019,760 | ) |
| | | | | | | | |
Year ended December 31, 2020: | | | | | | | | |
Shares sold | | | 2,498,147 | | | $ | 28,154,067 | |
Shares issued in reinvestment of dividends and distributions | | | 236,257 | | | | 2,641,794 | |
Shares purchased | | | (2,631,683 | ) | | | (29,159,345 | ) |
| | | | | | | | |
Net increase (decrease) in shares outstanding before conversion | | | 102,721 | | | | 1,636,516 | |
Shares purchased upon conversion into other share class(es) | | | (84,062 | ) | | | (951,766 | ) |
| | | | | | | | |
Net increase (decrease) in shares outstanding | | | 18,659 | | | $ | 684,750 | |
| | | | | | | | |
Class Z | | | | | | |
Year ended December 31, 2021: | | | | | | | | |
Shares sold | | | 339,652,693 | | | $ | 3,850,635,089 | |
Shares issued in reinvestment of dividends and distributions | | | 13,240,005 | | | | 149,770,086 | |
Shares purchased | | | (265,907,331 | ) | | | (3,009,135,637 | ) |
| | | | | | | | |
Net increase (decrease) in shares outstanding before conversion | | | 86,985,367 | | | | 991,269,538 | |
Shares issued upon conversion from other share class(es) | | | 4,022,627 | | | | 45,581,721 | |
Shares purchased upon conversion into other share class(es) | | | (17,255,820 | ) | | | (195,736,960 | ) |
| | | | | | | | |
Net increase (decrease) in shares outstanding | | | 73,752,174 | | | $ | 841,114,299 | |
| | | | | | | | |
Year ended December 31, 2020: | | | | | | | | |
Shares sold | | | 395,661,265 | | | $ | 4,417,801,525 | |
Shares issued in reinvestment of dividends and distributions | | | 12,487,159 | | | | 140,242,032 | |
Shares purchased | | | (234,114,243 | ) | | | (2,600,728,287 | ) |
| | | | | | | | |
Net increase (decrease) in shares outstanding before conversion | | | 174,034,181 | | | | 1,957,315,270 | |
Shares issued upon conversion from other share class(es) | | | 5,421,136 | | | | 61,007,517 | |
Shares purchased upon conversion into other share class(es) | | | (3,964,019 | ) | | | (44,563,410 | ) |
| | | | | | | | |
Net increase (decrease) in shares outstanding | | | 175,491,298 | | | $ | 1,973,759,377 | |
| | | | | | | | |
| | | | |
PGIM Short-Term Corporate Bond Fund | | | 79 | |
Notes to Financial Statements (continued)
| | | | | | | | |
Class R2 | | Shares | | | Amount | |
Year ended December 31, 2021: | | | | | | | | |
Shares sold | | | 102,845 | | | $ | 1,170,345 | |
Shares issued in reinvestment of dividends and distributions | | | 2,367 | | | | 26,793 | |
Shares purchased | | | (11,695 | ) | | | (133,020 | ) |
| | | | | | | | |
Net increase (decrease) in shares outstanding | | | 93,517 | | | $ | 1,064,118 | |
| | | | | | | | |
Year ended December 31, 2020: | | | | | | | | |
Shares sold | | | 79,782 | | | $ | 901,413 | |
Shares issued in reinvestment of dividends and distributions | | | 864 | | | | 9,748 | |
Shares purchased | | | (10,763 | ) | | | (118,751 | ) |
| | | | | | | | |
Net increase (decrease) in shares outstanding before conversion | | | 69,883 | | | | 792,410 | |
Shares purchased upon conversion into other share class(es) | | | (6,594 | ) | | | (75,264 | ) |
| | | | | | | | |
Net increase (decrease) in shares outstanding | | | 63,289 | | | $ | 717,146 | |
| | | | | | | | |
Class R4 | | | | | | |
Year ended December 31, 2021: | | | | | | | | |
Shares sold | | | 100,439 | | | $ | 1,142,351 | |
Shares issued in reinvestment of dividends and distributions | | | 124 | | | | 1,400 | |
Shares purchased | | | (52,144 | ) | | | (592,176 | ) |
| | | | | | | | |
Net increase (decrease) in shares outstanding before conversion | | | 48,419 | | | | 551,575 | |
Shares issued upon conversion from other share class(es) | | | 4,509 | | | | 51,611 | |
| | | | | | | | |
Net increase (decrease) in shares outstanding | | | 52,928 | | | $ | 603,186 | |
| | | | | | | | |
Year ended December 31, 2020: | | | | | | | | |
Shares sold | | | 25,308 | | | $ | 282,911 | |
Shares issued in reinvestment of dividends and distributions | | | 47 | | | | 527 | |
Shares purchased | | | (45,833 | ) | | | (510,462 | ) |
| | | | | | | | |
Net increase (decrease) in shares outstanding before conversion | | | (20,478 | ) | | | (227,024 | ) |
Shares issued upon conversion from other share class(es) | | | 9,858 | | | | 112,678 | |
Shares purchased upon conversion into other share class(es) | | | (18 | ) | | | (204 | ) |
| | | | | | | | |
Net increase (decrease) in shares outstanding | | | (10,638 | ) | | $ | (114,550 | ) |
| | | | | | | | |
| | | | | | | | |
Class R6 | | Shares | | | Amount | |
Year ended December 31, 2021: | | | | | | | | |
Shares sold | | | 99,293,664 | | | $ | 1,125,980,059 | |
Shares issued in reinvestment of dividends and distributions | | | 4,401,155 | | | | 49,803,948 | |
Shares purchased | | | (43,902,494 | ) | | | (497,109,169 | ) |
| | | | | | | | |
Net increase (decrease) in shares outstanding before conversion | | | 59,792,325 | | | | 678,674,838 | |
Shares issued upon conversion from other share class(es) | | | 12,914,161 | | | | 146,715,935 | |
Shares purchased upon conversion into other share class(es) | | | (176,880 | ) | | | (2,012,957 | ) |
| | | | | | | | |
Net increase (decrease) in shares outstanding | | | 72,529,606 | | | $ | 823,377,816 | |
| | | | | | | | |
Year ended December 31, 2020: | | | | | | | | |
Shares sold | | | 68,882,667 | | | $ | 775,069,504 | |
Shares issued in reinvestment of dividends and distributions | | | 3,455,451 | | | | 38,829,464 | |
Shares purchased | | | (33,171,985 | ) | | | (369,340,128 | ) |
| | | | | | | | |
Net increase (decrease) in shares outstanding before conversion | | | 39,166,133 | | | | 444,558,840 | |
Shares issued upon conversion from other share class(es) | | | 381,771 | | | | 4,304,149 | |
Shares purchased upon conversion into other share class(es) | | | (49,903 | ) | | | (561,303 | ) |
| | | | | | | | |
Net increase (decrease) in shares outstanding | | | 39,498,001 | | | $ | 448,301,686 | |
| | | | | | | | |
| * | Effective June 26, 2020, all of the issued and outstanding Class B shares of the Fund converted into Class A shares. |
8. Borrowings
The RIC, on behalf of the Fund, along with other affiliated registered investment companies (the “Participating Funds”), is a party to a Syndicated Credit Agreement (“SCA”) with a group of banks. The purpose of the SCA is to provide an alternative source of temporary funding for capital share redemptions. The table below provides details of the current SCA in effect at the reporting period-end as well as the prior SCA.
| | | | |
| | Current SCA | | Prior SCA |
Term of Commitment | | 10/1/2021 – 9/29/2022 | | 10/2/2020 – 9/30/2021 |
Total Commitment | | $ 1,200,000,000 | | $ 1,200,000,000 |
| Annualized Commitment Fee on the Unused Portion of the SCA | | 0.15% | | 0.15% |
Annualized Interest Rate on Borrowings | | 1.20% plus the higher of (1) the effective federal funds rate, (2) the one-month LIBOR rate or (3) zero percent | | 1.30% plus the higher of (1) the effective federal funds rate, (2) the one-month LIBOR rate or (3) zero percent |
Certain affiliated registered investment companies that are parties to the SCA include portfolios that are subject to a predetermined mathematical formula used to manage certain benefit guarantees offered under variable annuity contracts. The formula may result in large scale asset flows into and out of these portfolios. Consequently, these portfolios may be more likely to utilize the SCA for purposes of funding redemptions. It may be possible for those portfolios to fully exhaust the committed amount of the SCA, thereby requiring the Manager to allocate available funding per a Board-approved methodology designed to treat the Participating Funds in the SCA equitably.
The Fund did not utilize the SCA during the year ended December 31, 2021.
| | | | |
PGIM Short-Term Corporate Bond Fund | | | 81 | |
Notes to Financial Statements (continued)
9. Risks of Investing in the Fund
The Fund’s risks include, but are not limited to, some or all of the risks discussed below. For further information on the Fund’s risks, please refer to the Fund’s Prospectus and Statement of Additional Information.
Credit Risk: This is the risk that the issuer, the guarantor or the insurer of a fixed income security, or the counterparty to a contract, may be unable or unwilling to make timely principal and interest payments, or to otherwise honor its obligations. Additionally, fixed income securities could lose value due to a loss of confidence in the ability of the issuer, guarantor, insurer or counterparty to pay back debt. The lower the credit quality of a bond, the more sensitive it is to credit risk.
Debt Obligations Risk: Debt obligations are subject to credit risk, market risk and interest rate risk. The Fund’s holdings, share price, yield and total return may also fluctuate in response to bond market movements. The value of bonds may decline for issuer-related reasons, including management performance, financial leverage and reduced demand for the issuer’s goods and services. Certain types of fixed income obligations also may be subject to “call and redemption risk,” which is the risk that the issuer may call a bond held by the Fund for redemption before it matures and the Fund may lose income.
Economic and Market Events Risk: Events in the U.S. and global financial markets, including actions taken by the U.S. Federal Reserve or foreign central banks to stimulate or stabilize economic growth or the functioning of the securities markets, may at times result in unusually high market volatility, which could negatively impact performance. Relatively reduced liquidity in credit and fixed income markets could adversely affect issuers worldwide.
Foreign Securities Risk: Investments in securities of non-U.S. issuers (including those denominated in U.S. dollars) may involve more risk than investing in securities of U.S. issuers. Foreign political, economic and legal systems, especially those in developing and emerging market countries, may be less stable and more volatile than in the United States. Foreign legal systems generally have fewer regulatory requirements than the U.S. legal system, particularly those of emerging markets. In general, less information is publicly available with respect to non-U.S. companies than U.S. companies. Non-U.S. companies generally are not subject to the same accounting, auditing, and financial reporting standards as are U.S. companies. Additionally, the changing value of foreign currencies and changes in exchange rates could also affect the value of the assets the Fund holds and the Fund’s performance. Certain foreign countries may impose restrictions on the ability of issuers of foreign securities to make payment of principal and interest or dividends to investors located outside the country, due to blockage of foreign currency exchanges or otherwise. Investments in emerging markets are subject to greater volatility and price declines.
In addition, the Fund’s investments in non-U.S. securities may be subject to the risks of nationalization or expropriation of assets, imposition of currency exchange controls or restrictions on the repatriation of non-U.S. currency, confiscatory taxation and adverse diplomatic developments. Special U.S. tax considerations may apply.
Increase in Expenses Risk: Your actual cost of investing in the Fund may be higher than the expenses shown in the expense table in the Fund’s prospectus for a variety of reasons. For example, expense ratios may be higher than those shown if average net assets decrease. Net assets are more likely to decrease and Fund expense ratios are more likely to increase when markets are volatile. Active and frequent trading of Fund securities can increase expenses.
Interest Rate Risk: The value of your investment may go down when interest rates rise. A rise in rates tends to have a greater impact on the prices of longer term or duration debt securities. For example, a fixed income security with a duration of three years is expected to decrease in value by approximately 3% if interest rates increase by 1%. This is referred to as “duration risk.��� When interest rates fall, the issuers of debt obligations may prepay principal more quickly than expected, and the Fund may be required to reinvest the proceeds at a lower interest rate. This is referred to as “prepayment risk.” When interest rates rise, debt obligations may be repaid more slowly than expected, and the value of the Fund’s holdings may fall sharply. This is referred to as “extension risk.” The Fund may lose money if short-term or long-term interest rates rise sharply or in a manner not anticipated by the subadviser.
Junk Bonds Risk: High-yield, high-risk bonds have predominantly speculative characteristics, including particularly high credit risk. Junk bonds tend to have lower market liquidity than higher-rated securities. The liquidity of particular issuers or industries within a particular investment category may shrink or disappear suddenly and without warning. The non-investment grade bond market can experience sudden and sharp price swings and become illiquid due to a variety of factors, including changes in economic forecasts, stock market activity, large sustained sales by major investors, a high profile default or a change in the market’s psychology.
Large Shareholder and Large Scale Redemption Risk: Certain individuals, accounts, funds (including funds affiliated with the Manager) or institutions, including the Manager and its affiliates, may from time to time own or control a substantial amount of the Fund’s shares. There is no requirement that these entities maintain their investment in the Fund. There is a risk that such large shareholders or that the Fund’s shareholders generally may redeem all or a substantial portion of their investments in the Fund in a short period of time, which could have a significant negative impact on the Fund’s NAV, liquidity, and brokerage costs. Large redemptions could also result in tax consequences to shareholders and impact the Fund’s ability to implement its investment strategy. The Fund’s ability to pursue its investment objective after one or more large scale redemptions may be impaired and, as a result, the Fund may invest a larger portion of its assets in cash or cash equivalents.
| | | | |
PGIM Short-Term Corporate Bond Fund | | | 83 | |
Notes to Financial Statements (continued)
Management Risk: The value of your investment may decrease if judgments by the subadviser about the attractiveness, value or market trends affecting a particular security, industry or sector or about market movements are incorrect.
Market Risk: Securities markets may be volatile and the market prices of the Fund’s securities may decline. Securities fluctuate in price based on changes in an issuer’s financial condition and overall market and economic conditions. If the market prices of the securities owned by the Fund fall, the value of your investment in the Fund will decline.
Market Disruption and Geopolitical Risks: International wars or conflicts and geopolitical developments in foreign countries, along with instability in regions such as Asia, Eastern Europe, and the Middle East, possible terrorist attacks in the United States or around the world, public health epidemics such as the outbreak of infectious diseases like the outbreak of COVID-19 globally in 2020 or the 2014–2016 outbreak in West Africa of the Ebola virus, and other similar events could adversely affect the U.S. and foreign financial markets, including increases in market volatility, reduced liquidity in the securities markets and government intervention, and may cause further long-term economic uncertainties in the United States and worldwide generally. The coronavirus pandemic and the related governmental and public responses have had and may continue to have an impact on the Fund’s investments and net asset value and have led and may continue to lead to increased market volatility and the potential for illiquidity in certain classes of securities and sectors of the market. Preventative or protective actions that governments may take in respect of pandemic or epidemic diseases may result in periods of business disruption, business closures, inability to obtain raw materials, supplies and component parts, and reduced or disrupted operations for the issuers in which the Fund invests. Government intervention in markets may impact interest rates, market volatility and security pricing. The occurrence, reoccurrence and pendency of such diseases could adversely affect the economies (including through changes in business activity and increased unemployment) and financial markets either in specific countries or worldwide.
Mortgage-Backed and Asset-Backed Securities Risk: Mortgage-backed and asset-backed securities tend to increase in value less than other debt securities when interest rates decline, but are subject to similar risk of decline in market value during periods of rising interest rates. The values of mortgage-backed and asset-backed securities become more volatile as interest rates rise. In a period of declining interest rates, the Fund may be required to reinvest more frequent prepayments on mortgage-backed and asset-backed securities in lower-yielding investments.
U.S. Government and Agency Securities Risk: U.S. Government and agency securities are subject to market risk, interest rate risk and credit risk. Not all U.S. Government securities are insured or guaranteed by the full faith and credit of the U.S. Government; some are only
insured or guaranteed by the issuing agency, which must rely on its own resources to repay the debt. Some agency securities carry no guarantee whatsoever and the risk of default associated with these securities would be borne by the Fund. The maximum potential liability of the issuers of some U.S. Government securities held by the Fund may greatly exceed their current resources, including their legal right to support from the U.S. Treasury. No assurance can be given that the U.S. government would provide financial support to any such issuers if it is not obligated to do so by law. It is possible that these issuers will not have the funds to meet their payment obligations in the future. In addition, the value of U.S. Government securities may be affected by changes in the credit rating of the U.S. Government.
10. Recent Accounting Pronouncement and Regulatory Developments
In March 2020, the FASB issued Accounting Standard Update (“ASU”) No. 2020-04, which provides optional guidance for applying GAAP to contract modifications, hedging relationships and other transactions affected by the reference rate reform if certain criteria are met. ASU 2020-04 is elective and is effective on March 12, 2020 through December 31, 2022. Management does not expect ASU 2020-04 to have a material impact on the financial statements.
On December 3, 2020, the SEC announced that it voted to adopt a new rule that establishes an updated regulatory framework for fund valuation practices (the “Rule”). The Rule, in part, provides (i) a framework for determining fair value in good faith and (ii) provides for a fund Board’s assignment of its responsibility for the execution of valuation-related activities to a fund’s investment adviser. Further, the SEC is rescinding previously issued guidance on related issues. The Rule took effect on March 8, 2021, with a compliance date of September 8, 2022. Management is currently evaluating the Rule and its impact to the Fund.
| | | | |
PGIM Short-Term Corporate Bond Fund | | | 85 | |
Report of Independent Registered Public Accounting Firm
To the Board of Directors of Prudential Short-Term Corporate Bond Fund, Inc. and Shareholders of PGIM Short-Term Corporate Bond Fund
Opinion on the Financial Statements
We have audited the accompanying statement of assets and liabilities, including the schedule of investments, of PGIM Short-Term Corporate Bond Fund (the “Fund”) as of December 31, 2021, the related statement of operations for the year ended December 31, 2021, the statement of changes in net assets for each of the two years in the period ended December 31, 2021, including the related notes, and the financial highlights for each of the two years in the period ended December 31, 2021 (collectively referred to as the “financial statements”). In our opinion, the financial statements present fairly, in all material respects, the financial position of the Fund as of December 31, 2021, the results of its operations for the year then ended, and the changes in its net assets and the financial highlights for each of the two years in the period ended December 31, 2021 in conformity with accounting principles generally accepted in the United States of America.
The financial statements of the Fund as of and for the year ended December 31, 2019 and the financial highlights for each of the periods ended on or prior to December 31, 2019 (not presented herein, other than the financial highlights) were audited by other auditors whose report dated February 14, 2020 expressed an unqualified opinion on those financial statements and financial highlights.
Basis for Opinion
These financial statements are the responsibility of the Fund’s management. Our responsibility is to express an opinion on the Fund’s financial statements based on our audits. We are a public accounting firm registered with the Public Company Accounting Oversight Board (United States) (PCAOB) and are required to be independent with respect to the Fund in accordance with the U.S. federal securities laws and the applicable rules and regulations of the Securities and Exchange Commission and the PCAOB.
We conducted our audits of these financial statements in accordance with the standards of the PCAOB. Those standards require that we plan and perform the audit to obtain reasonable assurance about whether the financial statements are free of material misstatement, whether due to error or fraud.
Our audits included performing procedures to assess the risks of material misstatement of the financial statements, whether due to error or fraud, and performing procedures that respond to those risks. Such procedures included examining, on a test basis, evidence regarding the amounts and disclosures in the financial statements. Our audits also included evaluating the accounting principles used and significant estimates made by management, as well as evaluating the overall presentation of the financial statements. Our procedures included confirmation of securities owned as of December 31, 2021 by correspondence with the custodian, transfer agent and brokers; when replies were not received from brokers, we performed other auditing procedures. We believe that our audits provide a reasonable basis for our opinion.
/s/PricewaterhouseCoopers LLP
New York, New York
February 15, 2022
We have served as the auditor of one or more investment companies in the PGIM Retail Funds complex since 2020.
Tax Information (unaudited)
For the year ended December 31, 2021, the Fund reports the maximum amount allowable but not less than 71.72% as interest related dividends in accordance with Sections 871(k)(1) and 881(e)(1) of the Internal Revenue Code.
| | | | |
PGIM Short-Term Corporate Bond Fund | | | 87 | |
INFORMATION ABOUT BOARD MEMBERS AND OFFICERS (unaudited)
Information about Board Members and Officers of the Fund is set forth below. Board Members who are not deemed to be “interested persons” of the Fund, as defined in the 1940 Act, are referred to as “Independent Board Members.” Board Members who are deemed to be “interested persons” of the Fund are referred to as “Interested Board Members.” The Board Members are responsible for the overall supervision of the operations of the Fund and perform the various duties imposed on the directors of investment companies by the 1940 Act. The Board in turn elects the Officers, who are responsible for administering the day-to-day operations of the Fund.
| | | | | | |
|
Independent Board Members |
Name
Year of Birth
Position(s)
Portfolios Overseen | | Principal Occupation(s)
During Past Five Years | | Other Directorships
Held During
Past Five Years | | Length of
Board Service |
Ellen S. Alberding 1958
Board Member Portfolios Overseen: 95 | | President and Board Member, The Joyce Foundation (charitable foundation) (since 2002); formerly Vice Chair, City Colleges of Chicago (community college system) (2011-2015); Trustee, National Park Foundation (charitable foundation for national park system) (2009-2018); Trustee, Economic Club of Chicago (2009-2016); Trustee, Loyola University (since 2018). | | None. | | Since September 2013 |
Kevin J. Bannon 1952 Board Member Portfolios Overseen: 95 | | Retired; formerly Managing Director (April 2008-May 2015) and Chief Investment Officer (October 2008-November 2013) of Highmount Capital LLC (registered investment adviser); formerly Executive Vice President and Chief Investment Officer (April 1993-August 2007) of Bank of New York Company; President (May 2003-May 2007) of BNY Hamilton Family of Mutual Funds. | | Director of Urstadt Biddle Properties (equity real estate investment trust) (since September 2008). | | Since July 2008 |
PGIM Short-Term Corporate Bond Fund
| | | | | | | | | | |
|
Independent Board Members |
| | | | | | |
Name Year of Birth Position(s) Portfolios Overseen | | Principal Occupation(s) During Past Five Years | | | | Other Directorships Held During Past Five Years | | | | Length of
Board Service |
| | | | | | |
Linda W. Bynoe 1952 Board Member Portfolios Overseen: 92 | | President and Chief Executive Officer (since March 1995) and formerly Chief Operating Officer (December 1989-February 1995) of Telemat Limited LLC (formerly Telemat Ltd) (management consulting); formerly Vice President (January 1985-June 1989) at Morgan Stanley & Co. (broker-dealer). | | | | Trustee of Equity Residential (residential real estate) (since December 2009); Director of Northern Trust Corporation (financial services) (since April 2006); formerly Director of Anixter International, Inc. (communication products distributor) (January 2006-June 2020). | | | | Since March 2005 |
| | | | | | |
Barry H. Evans 1960 Board Member Portfolios Overseen: 94 | | Retired; formerly President (2005-2016), Global Chief Operating Officer (2014-2016), Chief Investment Officer - Global Head of Fixed Income (1998-2014), and various portfolio manager roles (1986-2006), Manulife Asset Management (asset management). | | | | Formerly Director, Manulife Trust Company (2011-2018); formerly Director, Manulife Asset Management Limited (2015-2017); formerly Chairman of the Board of Directors of Manulife Asset Management U.S. (2005-2016); formerly Chairman of the Board, Declaration Investment Management and Research (2008-2016). | | | | Since September 2017 |
| | | | | | |
Keith F. Hartstein 1956 Board Member & Independent Chair Portfolios Overseen: 95 | | Retired; Member (since November 2014) of the Governing Council of the Independent Directors Council (IDC) (organization of independent mutual fund directors); formerly Executive Committee of the IDC Board of Governors (October 2019-December 2021); formerly President and Chief Executive Officer (2005-2012), Senior Vice President (2004-2005), Senior Vice President of Sales and Marketing (1997-2004), and various executive management positions (1990-1997), John Hancock Funds, LLC (asset management); Chairman, Investment Company Institute’s Sales Force Marketing Committee (2003-2008). | | | | None. | | | | Since September 2013 |
Visit our website at pgim.com/investments
| | | | | | | | | | |
|
Independent Board Members |
| | | | | | |
Name Year of Birth Position(s) Portfolios Overseen | | Principal Occupation(s) During Past Five Years | | | | Other Directorships Held During Past Five Years | | | | Length of Board Service |
| | | | | | |
Laurie Simon Hodrick 1962 Board Member Portfolios Overseen: 91 | | A. Barton Hepburn Professor Emerita of Economics in the Faculty of Business, Columbia Business School (since 2018); Visiting Fellow at the Hoover Institution, Stanford University (since 2015); Sole Member, ReidCourt LLC (since 2008) (a consulting firm); formerly Visiting Professor of Law, Stanford Law School (2015-2021); formerly A. Barton Hepburn Professor of Economics in the Faculty of Business, Columbia Business School (1996-2017); formerly Managing Director, Global Head of Alternative Investment Strategies, Deutsche Bank (2006-2008). | | | | Independent Director, Andela (since December 2021) (global talent network); Independent Director, Roku (since December 2020) (communication services); formerly Independent Director, Synnex Corporation (2019-2021) (information technology); formerly Independent Director, Kabbage, Inc. (2018-2020) (financial services); formerly Independent Director, Corporate Capital Trust (2017-2018) (a business development company). | | | | Since September 2017 |
| | | | | | |
Brian K. Reid 1961 Board Member Portfolios Overseen: 94 | | Retired; formerly Chief Economist for the Investment Company Institute (ICI) (2005-2017); formerly Senior Economist and Director of Industry and Financial Analysis at the ICI (1998-2004); formerly Senior Economist, Industry and Financial Analysis at the ICI (1996-1998); formerly Staff Economist at the Federal Reserve Board (1989-1996); Director, ICI Mutual Insurance Company (2012-2017). | | | | None. | | | | Since March 2018 |
PGIM Short-Term Corporate Bond Fund
| | | | | | | | | | | | | | |
Independent Board Members |
| | | | | | |
Name Year of Birth Position(s) Portfolios Overseen | | Principal Occupation(s) During Past Five Years | | | | | | Other Directorships Held During Past Five Years | | | | | | Length of Board Service |
| | | | | | |
Grace C. Torres 1959 Board Member Portfolios Overseen: 94 | | Retired; formerly Treasurer and Principal Financial and Accounting Officer of the PGIM Funds, Target Funds, Advanced Series Trust, Prudential Variable Contract Accounts and The Prudential Series Fund
(1998-June 2014); Assistant Treasurer (March 1999-June 2014) and Senior Vice President (September 1999-June 2014) of PGIM Investments LLC; Assistant Treasurer (May 2003-June 2014) and Vice President (June 2005-June 2014) of AST Investment Services, Inc.; Senior Vice President and Assistant Treasurer (May 2003-June 2014) of Prudential Annuities Advisory Services, Inc. | | | | | | Director (since January 2018) of OceanFirst Financial Corp. and OceanFirst Bank; formerly Director (July 2015-January 2018) of Sun Bancorp, Inc. N.A. and Sun National Bank. | | | | | | Since November
2014 |
|
|
|
|
|
|
|
|
|
|
|
|
|
|
|
|
|
|
|
|
| | | | | | | | | | | | | | |
Interested Board Members |
| | | | | | |
Name Year of Birth Position(s) Portfolios Overseen | | Principal Occupation(s) During Past Five Years | | | | | | Other Directorships Held During Past Five Years | | | | | | Length of Board Service |
|
|
|
| | | | | | |
Stuart S. Parker 1962 Board Member & President Portfolios Overseen: 94 | | President, Chief Executive Officer, Chief Operating Officer and Officer in Charge of PGIM Investments LLC (formerly known as Prudential Investments LLC) (since
January 2012); formerly Executive Vice President of Jennison Associates LLC and Head of Retail Distribution of PGIM Investments LLC (June 2005-December 2011); Investment Company Institute - Board of Governors (since May 2012). | | | | | | None. | | | | | | Since January 2012 |
|
|
|
|
|
|
|
|
|
|
|
|
|
|
Visit our website at pgim.com/investments
| | | | | | |
Interested Board Members |
| | | | |
Name Year of Birth Position(s) Portfolios Overseen | | Principal Occupation(s) During Past Five Years | | Other Directorships Held During Past Five Years | | Length of Board Service |
| | | | |
Scott E. Benjamin 1973 Board Member & Vice President Portfolios Overseen: 95 | | Executive Vice President (since May 2009) of PGIM Investments LLC; Vice President (since June 2012) of Prudential Investment Management Services LLC; Executive Vice President (since September 2009) of AST Investment Services, Inc.; Senior Vice President of Product Development and Marketing, PGIM Investments (since February 2006); formerly Vice President of Product Development and Product Management, PGIM Investments LLC (2003-2006). | | None. | | Since March 2010 |
| | | | | | |
| Fund Officers(a) | | | | | | |
Name Year of Birth Fund Position | | Principal Occupation(s) During Past Five Years | | Length of Service as Fund Officer |
| | | |
Claudia DiGiacomo 1974 Chief Legal Officer | | Chief Legal Officer, Executive Vice President and Secretary of PGIM Investments LLC (since August 2020); Chief Legal Officer of Prudential Mutual Fund Services LLC (since August 2020); Chief Legal Officer of PIFM Holdco, LLC (since August 2020); Vice President and Corporate Counsel (since January 2005) of Prudential; and Corporate Counsel of AST Investment Services, Inc. (since August 2020); formerly Vice President and Assistant Secretary of PGIM Investments LLC (2005-2020); formerly Associate at Sidley Austin Brown & Wood LLP (1999-2004). | | Since December 2005 |
| | | |
Dino Capasso 1974 Chief Compliance Officer | | Chief Compliance Officer (since July 2019) of PGIM Investments LLC; Chief Compliance Officer (since July 2019) of the PGIM Funds, Target Funds, Advanced Series Trust, The Prudential Series Fund, Prudential’s Gibraltar Fund, Inc., PGIM Global High Yield Fund, Inc., PGIM High Yield Bond Fund, Inc., and PGIM Short Duration High Yield Opportunities Fund; Vice President and Deputy Chief Compliance Officer (June 2017-2019) of PGIM Investments LLC; formerly Senior Vice President and Senior Counsel (January 2016-June 2017), and Vice President and Counsel (February 2012-December 2015) of Pacific Investment Management Company LLC. | | Since March 2018 |
PGIM Short-Term Corporate Bond Fund
| | | | | | |
| | | | |
| Fund Officers(a) | | | | | | |
| | | |
Name
Year of Birth
Fund Position | | Principal Occupation(s) During Past Five Years | | Length of
Service as Fund
Officer |
| | | |
Andrew R. French 1962 Secretary | | Vice President (since December 2018) of PGIM Investments LLC; formerly Vice President and Corporate Counsel (2010-2018) of Prudential; formerly Director and Corporate Counsel (2006-2010) of Prudential; Vice President and Assistant Secretary (since January 2007) of PGIM Investments LLC; Vice President and Assistant Secretary (since January 2007) of Prudential Mutual Fund Services LLC. | | Since October
2006 |
| | | |
Diana N. Huffman 1982 Assistant Secretary | | Vice President and Corporate Counsel (since September 2015) of Prudential; Vice President and Assistant Secretary (since August 2020) of PGIM Investments LLC; formerly Associate at Willkie Farr & Gallagher LLP (2009-2015). | | Since March
2019 |
| | | |
Melissa Gonzalez 1980 Assistant Secretary | | Vice President and Corporate Counsel (since September 2018) of Prudential; Vice President and Assistant Secretary (since August 2020) of PGIM Investments LLC; formerly Director and Corporate Counsel (March 2014-September 2018) of Prudential. | | Since March
2020 |
| | | |
Patrick E. McGuinness 1986 Assistant Secretary | | Vice President and Assistant Secretary (since August 2020) of PGIM Investments LLC; Director and Corporate Counsel (since February 2017) of Prudential; and Corporate Counsel (2012-2017) of IIL, Inc. | | Since June 2020 |
| | | |
Debra Rubano 1975 Assistant Secretary | | Vice President and Corporate Counsel (since November 2020) of Prudential; formerly Director and Senior Counsel of Allianz Global Investors U.S. Holdings LLC (2010-2020) and Assistant Secretary of numerous funds in the Allianz fund complex (2015-2020). | | Since December
2020 |
| | | |
Kelly A. Coyne 1968 Assistant Secretary | | Director, Investment Operations of Prudential Mutual Fund Services LLC (since 2010). | | Since March
2015 |
| | | |
Christian J. Kelly 1975 Treasurer and Principal Financial and Accounting Officer | | Vice President, Head of Fund Administration of PGIM Investments LLC (since November 2018); formerly Director of Fund Administration of Lord Abbett & Co. LLC (2009-2018), Treasurer and Principal Accounting Officer of the Lord Abbett Family of Funds (2017-2018); Director of Accounting, Avenue Capital Group (2008-2009); Senior Manager, Investment Management Practice of Deloitte & Touche LLP (1998-2007). | | Since January
2019 |
| | | |
Lana Lomuti 1967 Assistant Treasurer | | Vice President (since 2007) and Director (2005-2007), within PGIM Investments Fund Administration; formerly Assistant Treasurer (December 2007-February 2014) of The Greater China Fund, Inc. | | Since April
2014 |
| | | |
Russ Shupak 1973 Assistant Treasurer | | Vice President (since 2017) and Director (2013-2017), within PGIM Investments Fund Administration. | | Since October
2019 |
Visit our website at pgim.com/investments
| | | | | | |
| | | | |
| Fund Officers(a) | | | | | | |
| | | |
Name
Year of Birth
Fund Position | | Principal Occupation(s) During Past Five Years | | Length of
Service as Fund
Officer |
| | | |
Deborah Conway 1969 Assistant Treasurer | | Vice President (since 2017) and Director (2007-2017), within PGIM Investments Fund Administration. | | Since October
2019 |
| | | |
Elyse M. McLaughlin 1974 Assistant Treasurer | | Vice President (since 2017) and Director (2011-2017), within PGIM Investments Fund Administration. | | Since October
2019 |
| | | |
Jonathan Corbett 1983 Anti-Money Laundering Compliance Officer | | Vice President, Corporate Compliance, Global Compliance Programs and Compliance Risk Management (since August 2019) of Prudential; formerly Vice President and Head of Key Risk Areas Compliance (March 2016 to July 2019), Chief Privacy Officer (March 2016 to July 2019) and Head of Global Financial Crimes Unit (April 2014 to March 2016) at MetLife. | | Since October
2021 |
| (a) | Excludes Mr. Parker and Mr. Benjamin, interested Board Members who also serve as President and Vice President, respectively. |
Explanatory Notes to Tables:
 | Board Members are deemed to be “Interested,” as defined in the 1940 Act, by reason of their affiliation with PGIM Investments LLC and/or an affiliate of PGIM Investments LLC. |
| Unless otherwise noted, the address of all Board Members and Officers is c/o PGIM Investments LLC, 655 Broad Street, Newark,
New Jersey 07102-4410. |
| There is no set term of office for Board Members or Officers. The Board Members have adopted a retirement policy, which calls for the retirement of Board Members on December 31 of the year in which they reach the age of 75. |
| “Other Directorships Held” includes all directorships of companies required to register or file reports with the SEC under the 1934 Act (that is, “public companies”) or other investment companies registered under the 1940 Act. |
| “Portfolios Overseen” includes all investment companies managed by PGIM Investments LLC. The investment companies for which PGIM Investments LLC serves as manager include the PGIM Funds, Target Funds, The Prudential Variable Contract Accounts, PGIM ETF Trust, PGIM High Yield Bond Fund, Inc., PGIM Global High Yield Fund, Inc., PGIM Short Duration High Yield Opportunities Fund, The Prudential Series Fund, Prudential’s Gibraltar Fund, Inc. and the Advanced Series Trust. |
| As used in the Fund Officers table “Prudential” means The Prudential Insurance Company of America. |
PGIM Short-Term Corporate Bond Fund
| | | | |
| | | |
 MAIL MAIL | | TELEPHONE | | WEBSITE |
| | | |
655 Broad Street Newark, NJ 07102 | | (800) 225-1852 | | pgim.com/investments |
|
| |
| PROXY VOTING |
| |
| The Board of Directors of the Fund has delegated to the Fund’s subadvisers the responsibility for voting any proxies and maintaining proxy recordkeeping with respect to the Fund. A description of these proxy voting policies and procedures is available without charge, upon request, by calling (800) 225-1852 or by visiting the Securities and Exchange Commission’s website at sec.gov. Information regarding how the Fund voted proxies relating to portfolio securities during the most recent 12-month period ended June 30 is available on the Fund’s website and on the Securities and Exchange Commission’s website. |
|
| |
| DIRECTORS |
| |
| Ellen S. Alberding • Kevin J. Bannon • Scott E. Benjamin • Linda W. Bynoe • Barry H. Evans • Keith F. Hartstein • Laurie Simon Hodrick • Stuart S. Parker • Brian K. Reid • Grace C. Torres |
|
| |
| OFFICERS |
| |
| Stuart S. Parker, President • Scott E. Benjamin, Vice President • Christian J. Kelly, Treasurer and Principal Financial and Accounting Officer • Claudia DiGiacomo, Chief Legal Officer • Dino Capasso, Chief Compliance Officer • Jonathan Corbett, Anti-Money Laundering Compliance Officer • Andrew R. French, Secretary • Melissa Gonzalez, Assistant Secretary • Diana N. Huffman, Assistant Secretary • Kelly A. Coyne, Assistant Secretary • Patrick E. McGuinness, Assistant Secretary • Debra Rubano, Assistant Secretary • Lana Lomuti, Assistant Treasurer • Russ Shupak, Assistant Treasurer • Elyse M. McLaughlin, Assistant Treasurer • Deborah Conway, Assistant Treasurer |
| | | | |
| MANAGER | | PGIM Investments LLC | | 655 Broad Street
Newark, NJ 07102 |
|
| SUBADVISERS | | PGIM Fixed Income | | 655 Broad Street Newark, NJ 07102 |
| | |
| | PGIM Limited | | Grand Buildings, 1-3 Strand
Trafalgar Square
London, WC2N 5HR
United Kingdom |
|
| DISTRIBUTOR | | Prudential Investment
Management Services LLC | | 655 Broad Street
Newark, NJ 07102 |
|
| CUSTODIAN | | The Bank of New York
Mellon | | 240 Greenwich Street
New York, NY 10286 |
|
| TRANSFER AGENT | | Prudential Mutual Fund Services
LLC | | PO Box 9658
Providence, RI 02940 |
|
| INDEPENDENT REGISTERED PUBLIC ACCOUNTING FIRM | | PricewaterhouseCoopers
LLP | | 300 Madison Avenue
New York, NY 10017 |
|
| FUND COUNSEL | | Willkie Farr & Gallagher
LLP | | 787 Seventh Avenue
New York, NY 10019 |
|
|
| |
| An investor should consider the investment objectives, risks, charges, and expenses of the Fund carefully before investing. The prospectus and summary prospectus contain this and other information about the Fund. An investor may obtain the prospectus and summary prospectus by visiting our website at pgim.com/investments or by calling (800) 225-1852. The prospectus and summary prospectus should be read carefully before investing. |
|
| |
| E-DELIVERY |
| |
| To receive your mutual fund documents online, go to pgim.com/investments/resource/edelivery and enroll. Instead of receiving printed documents by mail, you will receive notification via email when new materials are available. You can cancel your enrollment or change your email address at any time by visiting the website address above. |
|
| |
| SHAREHOLDER COMMUNICATIONS WITH DIRECTORS |
| |
| Shareholders can communicate directly with the Board of Directors by writing to the Chair of the Board, PGIM Short-Term Corporate Bond Fund, PGIM Investments, Attn: Board of Directors, 655 Broad Street, Newark, NJ 07102. Shareholders can communicate directly with an individual Director by writing to that Director at the same address. Communications are not screened before being delivered to the addressee. |
|
| |
| AVAILABILITY OF PORTFOLIO HOLDINGS |
| |
| The Fund files its complete schedule of portfolio holdings with the Securities and Exchange Commission on Form N-PORT. The Fund’s Form N-PORT filings are available on the Commission’s website at sec.gov. Form N-PORT is filed with the Commission quarterly, and each Fund’s full portfolio holdings as of the first and third fiscal quarter-ends will be made publicly available 60 days after the end of each quarter at sec.gov. |
|
| |
| The Fund’s Statement of Additional Information contains additional information about the Fund’s Directors and is available without charge, upon request, by calling (800) 225-1852. |
Mutual Funds:
| | | | |
| | | |
ARE NOT INSURED BY THE FDIC OR ANY
FEDERAL GOVERNMENT AGENCY | | MAY LOSE VALUE | | ARE NOT A DEPOSIT OF OR GUARANTEED
BY ANY BANK OR ANY BANK AFFILIATE |

PGIM SHORT-TERM CORPORATE BOND FUND
| | | | | | | | | | | | | | |
| | | | | | | |
| SHARE CLASS | | A | | C | | R | | Z | | R2 | | R4 | | R6 |
| | | | | | | |
| NASDAQ | | PBSMX | | PIFCX | | JDTRX | | PIFZX | | PIFEX | | PIFGX | | PSTQX |
| | | | | | | |
| CUSIP | | 74441R102 | | 74441R300 | | 74441R409 | | 74441R508 | | 74441R805 | | 74441R888 | | 74441R607 |
MF140E
Item 2 – Code of Ethics — See Exhibit (a)
As of the end of the period covered by this report, the registrant has adopted a code of ethics (the “Section 406 Standards for Investment Companies – Ethical Standards for Principal Executive and Financial Officers”) that applies to the registrant’s Principal Executive Officer and Principal Financial Officer; the registrant’s Principal Financial Officer also serves as the Principal Accounting Officer.
The registrant hereby undertakes to provide any person, without charge, upon request, a copy of the code of ethics. To request a copy of the code of ethics, contact the registrant 800-225-1852, and ask for a copy of the Section 406 Standards for Investment Companies - Ethical Standards for Principal Executive and Financial Officers.
Item 3 – Audit Committee Financial Expert –
The registrant’s Board has determined that Ms. Grace C. Torres, member of the Board’s Audit Committee is an “audit committee financial expert,” and that she is “independent,” for purposes of this item.
Item 4 – Principal Accountant Fees and Services –
(a) Audit Fees
For the fiscal years ended December 31, 2021 and December 31, 2020, PricewaterhouseCoopers LLP (“PwC”), the Registrant’s principal accountant, billed the Registrant $38,000 and $38,000 respectively, for professional services rendered for the audit of the Registrant’s annual financial statements or services that are normally provided in connection with statutory and regulatory filings.
(b) Audit-Related Fees
For the fiscal years ended December 31, 2021 and December 31, 2020, PwC did not bill the Registrant for audit-related services.
For the fiscal year ended December 31, 2020, fees of $4,958 were billed to the Registrant for services rendered by KPMG LLP (the Registrant’s prior principal accountant) in connection with the auditor transition.
(c) Tax Fees
For the fiscal years ended December 31, 2021 and December 31, 2020: none.
(d) All Other Fees
For the fiscal years ended December 31, 2021 and December 31, 2020: none.
(e) (1) Audit Committee Pre-Approval Policies and Procedures
THE PGIM MUTUAL FUNDS
AUDIT COMMITTEE POLICY
on
Pre-Approval of Services Provided by the Independent
Accountants
The Audit Committee of each PGIM Mutual Fund is charged with the responsibility to monitor the independence of the Fund’s independent accountants. As part of this responsibility, the Audit Committee must pre-approve the independent accounting firm’s engagement to render audit and/or permissible non-audit services, as required by law. In evaluating a proposed engagement of the independent accountants, the Audit Committee will assess the effect that the engagement might reasonably be expected to have on the accountant’s independence. The Committee’s evaluation will be based on:
| | • | | a review of the nature of the professional services expected to be provided, |
| | • | | a review of the safeguards put into place by the accounting firm to safeguard independence, and |
| | • | | periodic meetings with the accounting firm. |
Policy for Audit and Non-Audit Services Provided to the Funds
On an annual basis, the scope of audits for each Fund, audit fees and expenses, and audit-related and non-audit services (and fees proposed in respect thereof) proposed to be performed by the Fund’s independent accountants will be presented by the Treasurer and the independent accountants to the Audit Committee for review and, as appropriate, approval prior to the initiation of such services.
Such presentation shall be accompanied by confirmation by both the Treasurer and the independent accountants that the proposed
non-audit services will not adversely affect the independence of the independent accountants. Such proposed non-audit services shall be described in sufficient detail to enable the Audit Committee to assess the appropriateness of such services and fees, and the compatibility of the provision of such services with the auditor’s independence. The Committee shall receive periodic reports on the progress of the audit and other services which are approved by the Committee or by the Committee Chair pursuant to authority delegated in this Policy.
The categories of services enumerated under “Audit Services”, “Audit-related Services”, and “Tax Services” are intended to provide guidance to the Treasurer and the independent accountants as to those categories of services which the Committee believes are generally consistent with the independence of the independent accountants and which the Committee (or the Committee Chair) would expect upon the presentation of specific proposals to pre-approve. The enumerated categories are not intended as an exclusive list of audit, audit-related or tax services, which the Committee (or the Committee Chair) would consider for pre-approval.
Audit Services
The following categories of audit services are considered to be consistent with the role of the Fund’s independent accountants:
| | • | | Annual Fund financial statement audits |
| | • | | Seed audits (related to new product filings, as required) |
| | • | | SEC and regulatory filings and consents |
Audit-related Services
The following categories of audit-related services are considered to be consistent with the role of the Fund’s independent accountants:
| | • | | Accounting consultations |
| | • | | Fund merger support services |
| | • | | Agreed Upon Procedure Reports |
| | • | | Other Internal Control Reports |
Individual audit-related services that fall within one of these categories (except for fund merger support services) and are not presented to the Audit Committee as part of the annual pre-approval process are subject to an authorized pre-approval by the
Audit Committee so long as the estimated fee for those services does not exceed $30,000. Any services provided under such pre-approval will be reported to the Audit Committee at its next regular meeting. Should the amount of such services exceed $30,000 any additional fees will be subject to pre-approval by the Committee Chair (or any other Committee member on whom this responsibility has been delegated). Fees related to fund merger support services are subject to a separate authorized pre-approval by the Audit Committee with fees determined on a per occurrence and merger complexity basis.
Tax Services
The following categories of tax services are considered to be consistent with the role of the Fund’s independent accountants:
| | • | | Tax compliance services related to the filing or amendment of the following: |
| | • | | Federal, state and local income tax compliance; and, |
| | • | | Sales and use tax compliance |
| | • | | Timely RIC qualification reviews |
| | • | | Tax distribution analysis and planning |
| | • | | Tax authority examination services |
| | • | | Tax appeals support services |
| | • | | Accounting methods studies |
| | • | | Fund merger support services |
| | • | | Tax consulting services and related projects |
Individual tax services that fall within one of these categories and are not presented to the Audit Committee as part of the annual pre-approval process are subject to an authorized pre-approval by the Audit Committee so long as the estimated fee for those services does not exceed $30,000. Any services provided under such pre-approval will be reported to the Audit Committee at its next regular meeting. Should the amount of such services exceed $30,000 any additional fees will be subject to pre-approval by the Committee Chair (or any other Committee member on whom this responsibility has been delegated).
Other Non-Audit Services
Certain non-audit services that the independent accountants are legally permitted to render will be subject to pre-approval by the Committee or by one or more Committee members to whom the Committee has delegated this authority and who will report to the full Committee any pre-approval decisions made pursuant to this Policy. Non-audit services presented for pre-approval pursuant to this paragraph will be accompanied by a confirmation from both the Treasurer and the independent accountants that the proposed services will not adversely affect the independence of the independent accountants.
Proscribed Services
The Fund’s independent accountants will not render services in the following categories of non-audit services:
| | • | | Bookkeeping or other services related to the accounting records or financial statements of the Fund |
| | • | | Financial information systems design and implementation |
| | • | | Appraisal or valuation services, fairness opinions, or contribution-in-kind reports |
| | • | | Internal audit outsourcing services |
| | • | | Management functions or human resources |
| | • | | Broker or dealer, investment adviser, or investment banking services |
| | • | | Legal services and expert services unrelated to the audit |
| | • | | Any other service that the Public Company Accounting Oversight Board determines, by regulation, is impermissible. |
Pre-approval of Non-Audit Services Provided to Other Entities Within the PGIM Fund Complex
Certain non-audit services provided to PGIM Investments LLC or any of its affiliates that also provide ongoing services to the PGIM Mutual Funds will be subject to pre-approval by the Audit Committee. The only non-audit services provided to these entities that will require pre-approval are those related directly to the operations and financial reporting of the Funds. Individual projects that are not presented to the Audit Committee as part of the annual pre-approval process will be subject to pre-approval by the Committee Chair (or any other Committee member on whom this responsibility has been delegated) so long as the estimated fee for those services does not exceed $30,000. Services presented for pre-approval pursuant to this paragraph will be accompanied by a confirmation from both the Treasurer and the independent accountants that the proposed services will not adversely affect the independence of the independent accountants.
Although the Audit Committee will not pre-approve all services provided to PGIM Investments LLC and its affiliates, the Committee will receive an annual report from the Fund’s independent accounting firm showing the aggregate fees for all services provided to PGIM Investments and its affiliates.
(e) (2) Percentage of services referred to in 4(b) – 4(d) that were approved by the audit committee –
For the fiscal years ended December 31, 2021 and December 31, 2020, 100% of the services referred to in Item 4(b) was approved by the audit committee.
(f) Percentage of hours expended attributable to work performed by other than full time employees of principal accountant if greater than 50%.
The percentage of hours expended on the principal accountant’s engagement to audit the registrant’s financial statements for the most recent fiscal year that were attributed to work performed by persons other than the principal accountant’s full-time, permanent employees was 0%.
(g) Non-Audit Fees
The aggregate non-audit fees billed by the Registrant’s principal accountant for services rendered to the registrant’s investment adviser and any entity controlling, controlled by, or under common control with the investment adviser that provides ongoing services to the registrant for the fiscal years ended December 31, 2021 and December 31, 2020 was $0 and $0, respectively.
(h) Principal Accountant’s Independence
Not applicable as the Registrant’s principal accountant has not provided non-audit services to the registrant’s investment adviser and any entity controlling, controlled by, or under common control with the investment adviser that provides ongoing services to the registrant that were not pre-approved pursuant to Rule 2-01(c)(7)(ii) of Regulation S-X.
Item 5 – Audit Committee of Listed Registrants – Not applicable.
Item 6 – Schedule of Investments – The schedule is included as part of the report to shareholders filed under Item 1 of this Form.
Item 7 – Disclosure of Proxy Voting Policies and Procedures for Closed-End Management Investment Companies – Not applicable.
Item 8 – Portfolio Managers of Closed-End Management Investment Companies – Not applicable.
Item 9 – Purchases of Equity Securities by Closed-End Management Investment Company and Affiliated Purchasers – Not applicable.
Item 10 – Submission of Matters to a Vote of Security Holders – There have been no material changes to these procedures.
Item 11 – Controls and Procedures
| | (a) | It is the conclusion of the registrant’s principal executive officer and principal financial officer that the |
| | effectiveness of the registrant’s current disclosure controls and procedures (such disclosure controls and procedures having been evaluated within 90 days of the date of this filing) provide reasonable assurance that the information required to be disclosed by the registrant has been recorded, processed, summarized and reported within the time period specified in the Commission’s rules and forms and that the information required to be disclosed by the registrant has been accumulated and communicated to the registrant’s principal executive officer and principal financial officer in order to allow timely decisions regarding required disclosure. |
| | (b) | There has been no significant change in the registrant’s internal control over financial reporting that occurred during the registrant’s most recent fiscal quarter of the period covered by this report that has materially affected, or is likely to materially affect, the registrant’s internal control over financial reporting. |
Item 12 – Controls and Procedures - Disclosure of Securities Lending Activities for Closed-End Management Investment Companies – Not applicable.
Item 13 – Exhibits
(a) (1) Code of Ethics – Attached hereto as Exhibit EX-99.CODE-ETH.
(2) Certifications pursuant to Section 302 of the Sarbanes-Oxley Act – Attached hereto as Exhibit EX-99.CERT.
(3) Any written solicitation to purchase securities under Rule 23c-1 – Not applicable.
(b) Certifications pursuant to Section 906 of the Sarbanes-Oxley Act – Attached hereto as Exhibit EX-99.906CERT.
SIGNATURES
Pursuant to the requirements of the Securities Exchange Act of 1934 and the Investment Company Act of 1940, the registrant has duly caused this report to be signed on its behalf by the undersigned, thereunto duly authorized.
Registrant: Prudential Short-Term Corporate Bond Fund, Inc.
| | |
| By: | | /s/ Andrew R. French |
| | Andrew R. French |
| | Secretary |
| |
| Date: | | February 15, 2022 |
Pursuant to the requirements of the Securities Exchange Act of 1934 and the Investment Company Act of 1940, this report has been signed below by the following persons on behalf of the registrant and in the capacities and on the dates indicated.
| | |
| By: | | /s/ Stuart S. Parker |
| | Stuart S. Parker |
| | President and Principal Executive Officer |
| |
| Date: | | February 15, 2022 |
| |
| By: | | /s/ Christian J. Kelly |
| | Christian J. Kelly |
| | Treasurer and Principal Financial and Accounting Officer |
| |
| Date: | | February 15, 2022 |