UNITED STATES
SECURITIES AND EXCHANGE COMMISSION
Washington, D.C. 20549
CERTIFIED SHAREHOLDER REPORT OF REGISTERED MANAGEMENT INVESTMENT COMPANIES
| | |
| Investment Company Act file number: | | 811-05594 |
| |
| Exact name of registrant as specified in charter: | | Prudential Short-Term Corporate Bond Fund, Inc. |
| |
| Address of principal executive offices: | | 655 Broad Street, 6 th Floor |
| | Newark, New Jersey 07102 |
| |
| Name and address of agent for service: | | Andrew R. French |
| | 655 Broad Street, 6 th Floor |
| | Newark, New Jersey 07102 |
| |
| Registrant’s telephone number, including area code: | | |
| |
| Date of fiscal year end: | | 12/31/2024 |
| |
| Date of reporting period: | | 12/31/2024 |
Item 1 – Reports to Stockholders
| | (a) | Report transmitted to stockholders pursuant to Rule 30e-1 under the Act (17 CFR 270.30e-1). |
PGIM Short-Term Corporate Bond Fund
ANNUAL SHAREHOLDER REPORT – December 31, 2024
This annual shareholder report contains important information about the Class A shares of PGIM Short-Term Corporate Bond Fund (the “Fund”)
for the period of January 1, 2024 to December 31, 2024.
You can find additional information about the Fund at
pgim.com/investments/mutual-funds/prospectuses-fact-sheets
. You can also request
this information by contacting us at (800) 225-1852 or (973) 367-3529 from outside the US.
WHAT WERE THE FUND COSTS FOR THE LAST YEAR?
(Based on a hypothetical $10,000 investment)
| Costs of a $10,000 investment | Costs paid as a percentage of a $10,000 investment |
PGIM Short-Term Corporate Bond Fund—Class A | | |
WHAT AFFECTED THE FUND’S PERFORMANCE DURING THE REPORTING PERIOD?
■
During the reporting period, market expectations for both the timing and number of rate cuts fluctuated significantly as inflation slowed and
employment data showed some signs of softening. The US Federal Reserve's easing cycle—which began in September of 2024 with a
50-basis-point (bp) rate cut followed by two separate 25-bp cuts—was preceded by a re-steepening of the US Treasury curve and greater
market volatility due to election and fiscal uncertainty. (One basis point equals 0.01%.) As demand for yield remained robust, credit spreads
largely tightened, and performance across fixed income sectors was positive.
■
The following contributed most to the Fund’s performance relative to the Bloomberg 1-5 Year US Credit Index (the Index) during the period:
security selection in US investment-grade corporates and US high yield corporates; positioning in AAA collateralized loan obligations (CLOs)
and non-agency AAA commercial mortgage-backed securities (CMBS); underweights to the sovereign credit and emerging-markets
investment-grade sectors; credit positioning in banking, electric utilities, healthcare & pharmaceuticals, midstream energy, and technology; and
having more risk over the period, on average, than the Index (from a market perspective).
■
The following detracted most from the Fund’s performance relative to the Index during the reporting period: security selection in US Treasuries,
largely driven by the use of futures.
■
During the period, the Fund utilized derivatives in the form of credit default swaps to manage credit risk, as well as financial futures, options,
and forwards to help
manage
duration positioning and yield curve exposure. Overall, the use of these derivatives had a negative impact
on performance.
HOW HAS THE FUND PERFORMED OVER THE PAST 10 YEARS?
The Fund’s past performance is not a good predictor of the Fund’s future performance.
The returns do not reflect the deduction of
taxes that a shareholder would pay on Fund distributions or redemption of Fund shares.
Visit
pgim.com/investments/mutual-funds/prospectuses-fact-sheets
or call
(800) 225-1852 or (973) 367-3529
from outside the US for more recent performance data.
The line graph reflects a hypothetical $10,000 investment in Class A shares and assumes that all recurring fees (including management fees)
were deducted and dividends and distributions were reinvested. Without waiver of fees and/or expense reimbursements, if any, the returns would
have been lower.
Cumulative Performance: December 31, 2014 to December 31, 2024 Initial Investment of $10,000 |
The line graph reflects the return on the Fund's Class A shares with sales charges.
Average Annual Total Returns as of 12/31/2024 |
| | | |
Class A with sales charges | | | |
Class A without sales charges | | | |
Bloomberg US Aggregate Bond Index* | | | |
Bloomberg 1-5 Year US Credit Index | | | |
*The Fund has added this broad-based index in response to
new
regulatory requirements.
WHAT ARE SOME KEY FUND STATISTICS AS OF 12/31/2024?
| |
| |
Total advisory fees paid for the year | |
Portfolio turnover rate for the year | |
WHAT
ARE
SOME CHARACTERISTICS OF THE FUND’S HOLDINGS AS OF 12/31/2024?
Credit Quality expressed as a percentage of total investments as of 12/31/2024 (%) |
| |
| |
| |
| |
| |
| |
| |
| |
| |
Credit ratings reflect the highest rating assigned by a nationally recognized statistical rating organization (NRSRO) such as Moody’s Investors Service, Inc. (Moody’s), S&P Global
Ratings (S&P), or Fitch Ratings, Inc. (Fitch). Credit ratings reflect the common nomenclature used by both S&P and Fitch. Where applicable, ratings are converted to the comparable
S&P/Fitch rating tier nomenclature. The Not Rated category consists of securities that have not been rated by an NRSRO. Credit ratings are subject to change.
You can find additional information at
pgim.com/investments/mutual-funds/prospectuses-fact-sheets
or by scanning the QR code below,
including the Fund’s prospectus, financial information, fund holdings, and proxy voting information. You can also request this information by
contacting us at (800) 225-1852 or (973) 367-3529 from outside the US.
To receive your fund documents online, go to
pgim.com/investments/resource/edelivery
and enroll.
PGIM Short-Term Corporate Bond Fund
PGIM Short-Term Corporate Bond Fund
ANNUAL SHAREHOLDER REPORT – December 31, 2024
This annual shareholder report contains important information about the Class C shares of PGIM Short-Term Corporate Bond Fund (the “Fund”)
for the period of January 1, 2024 to December 31, 2024.
You can find additional information about the Fund at
pgim.com/investments/mutual-funds/prospectuses-fact-sheets
. You can also request
this information by contacting us at (800) 225-1852 or (973) 367-3529 from outside the US.
WHAT WERE THE FUND COSTS FOR THE LAST YEAR?
(Based on a hypothetical $10,000 investment)
| Costs of a $10,000 investment | Costs paid as a percentage of a $10,000 investment |
PGIM Short-Term Corporate Bond Fund—Class C | | |
WHAT AFFECTED THE FUND’S PERFORMANCE DURING THE REPORTING PERIOD?
■
During the reporting period, market expectations for both the timing and number of rate cuts fluctuated significantly as inflation slowed and
employment data showed some signs of softening. The US Federal Reserve's easing cycle—which began in September of 2024 with a
50-basis-point (bp) rate cut followed by two separate 25-bp cuts—was preceded by a re-steepening of the US Treasury curve and greater
market volatility due to election and fiscal uncertainty. (One basis point equals 0.01%.) As demand for yield remained robust, credit spreads
largely tightened, and performance across fixed income sectors was positive.
■
The following contributed most to the Fund’s performance relative to the Bloomberg 1-5 Year US Credit Index (the Index) during the period:
security selection in US investment-grade corporates and US high yield corporates; positioning in AAA collateralized loan obligations (CLOs)
and non-agency AAA commercial mortgage-backed securities (CMBS); underweights to the sovereign credit and emerging-markets
investment-grade sectors; credit positioning in banking, electric utilities, healthcare & pharmaceuticals, midstream energy, and technology; and
having more risk over the period, on average, than the Index (from a market perspective).
■
The following detracted most from the Fund’s performance relative to the Index during the reporting period: security selection in US Treasuries,
largely driven by the use of futures.
■
During the
period
,
the
Fund utilized derivatives in the form of credit default swaps to manage credit risk, as well as financial futures, options,
and forwards to help manage duration positioning and yield curve exposure. Overall, the use of these derivatives had a negative impact
on performance.
HOW HAS THE FUND PERFORMED OVER THE PAST 10 YEARS?
The Fund’s past performance is not a good predictor of the Fund’s future performance.
The returns do not reflect the deduction of
taxes that a shareholder would pay on Fund distributions or redemption of Fund shares.
Visit
pgim.com/investments/mutual-funds/prospectuses-fact-sheets
or call (800) 225-1852 or (973) 367-3529 from outside the US for more recent performance data.
The line graph reflects a hypothetical $10,000 investment in Class C shares and assumes that all recurring fees (including management fees)
were deducted and dividends and distributions were reinvested. Without waiver of fees and/or expense reimbursements, if any, the returns would
have been lower.
Cumulative Performance: December 31, 2014 to December 31, 2024 Initial Investment of $10,000 |
Average Annual Total Returns as of 12/31/2024 |
| | | |
Class C with sales charges | | | |
Class C without sales charges | | | |
Bloomberg US Aggregate Bond Index* | | | |
Bloomberg 1-5 Year US Credit Index | | | |
*The Fund has added this broad-based index in
response
to new regulatory requirements.
WHAT ARE SOME KEY FUND
STATISTICS
AS OF 12/31/2024?
| |
| |
Total advisory fees paid for the year | |
Portfolio turnover rate for the year | |
WHAT
ARE
SOME CHARACTERISTICS OF THE FUND’S HOLDINGS AS OF 12/31/2024?
Credit Quality expressed as a percentage of total investments as of 12/31/2024 (%) |
| |
| |
| |
| |
| |
| |
| |
| |
| |
Credit ratings reflect the highest rating assigned by a nationally recognized statistical rating organization (NRSRO) such as Moody’s Investors Service, Inc. (Moody’s), S&P Global
Ratings (S&P), or Fitch Ratings, Inc. (Fitch). Credit ratings reflect the common nomenclature used by both S&P and Fitch. Where applicable, ratings are converted to the comparable
S&P/Fitch rating tier nomenclature. The Not Rated category consists of securities that have not been rated by an NRSRO. Credit ratings are subject to change.
You can find additional information at
pgim.com/investments/mutual-funds/prospectuses-fact-sheets
or by scanning the QR code below,
including the Fund’s prospectus, financial information, fund holdings, and proxy voting information. You can also request this information by
contacting us at (800) 225-1852 or (973) 367-3529 from outside the US.
To receive your fund documents online, go to
pgim.com/investments/resource/edelivery
and enroll.
PGIM Short-Term Corporate Bond Fund
PGIM Short-Term Corporate Bond Fund
ANNUAL SHAREHOLDER REPORT – December 31, 2024
This annual shareholder report contains important information about the Class R shares of PGIM Short-Term Corporate Bond Fund (the “Fund”)
for the period of January 1, 2024 to December 31, 2024.
You can find additional information about the Fund at
pgim.com/investments/mutual-funds/prospectuses-fact-sheets
. You can also request
this information by contacting us at (800) 225-1852 or (973) 367-3529 from outside the US.
WHAT WERE THE FUND COSTS FOR THE LAST YEAR?
(Based on a hypothetical $10,000 investment)
| Costs of a $10,000 investment | Costs paid as a percentage of a $10,000 investment |
PGIM Short-Term Corporate Bond Fund—Class R | | |
WHAT AFFECTED THE FUND’S PERFORMANCE DURING THE REPORTING PERIOD?
■
During the reporting period, market expectations for both the timing and number of rate cuts fluctuated significantly as inflation slowed and
employment data showed some signs of softening. The US Federal Reserve's easing cycle—which began in September of 2024 with a
50-basis-point (bp) rate cut followed by two separate 25-bp cuts—was preceded by a re-steepening of the US Treasury curve and greater
market volatility due to election and fiscal uncertainty. (One basis point equals 0.01%.) As demand for yield remained robust, credit spreads
largely tightened, and performance across fixed income sectors was positive.
■
The following contributed most to the Fund’s performance relative to the Bloomberg 1-5 Year US Credit Index (the Index) during the period:
security selection in US investment-grade corporates and US high yield corporates; positioning in AAA collateralized loan obligations (CLOs)
and non-agency AAA commercial mortgage-backed securities (CMBS); underweights to the sovereign credit and emerging-markets
investment-grade sectors; credit positioning in banking, electric utilities, healthcare & pharmaceuticals, midstream energy, and technology; and
having more risk over the period, on average, than the Index (from a market perspective).
■
The following detracted most from the Fund’s performance relative to the Index during the reporting period: security selection in US Treasuries,
largely driven by the use of futures.
■
During the period, the Fund utilized derivatives in the form of credit default swaps to manage credit risk, as well as financial futures, options,
and forwards to
help
manage duration positioning and yield curve exposure. Overall, the use of these derivatives had a negative impact
on performance.
HOW HAS THE FUND PERFORMED OVER THE PAST 10 YEARS?
The Fund’s past performance is not a good predictor of the Fund’s future performance.
The returns do not reflect the deduction of
taxes that a shareholder would pay on Fund distributions or redemption of Fund shares.
Visit
pgim.com/investments/mutual-funds/prospectuses-fact-sheets
or call (800) 225-1852 or (973) 367-3529 from outside the US for more recent performance data.
The line graph reflects a hypothetical $10,000 investment in Class R shares and assumes that all recurring fees (including management fees)
were deducted and dividends and distributions were reinvested. Without waiver of fees and/or expense reimbursements, if any, the returns would
have been lower.
Cumulative Performance: December 31, 2014 to December 31, 2024 Initial Investment of $10,000 |
Average Annual Total Returns as of 12/31/2024 |
| | | |
| | | |
Bloomberg US Aggregate Bond Index* | | | |
Bloomberg 1-5 Year US Credit Index | | | |
*The Fund has added this broad-based index in response to new regulatory
requirements
.
WHAT
ARE
SOME KEY FUND STATISTICS AS OF 12/31/2024?
| |
| |
Total advisory fees paid for the year | |
Portfolio turnover rate for the year | |
WHAT
ARE
SOME CHARACTERISTICS OF THE FUND’S HOLDINGS AS OF 12/31/2024?
Credit Quality expressed as a percentage of total investments as of 12/31/2024 (%) |
| |
| |
| |
| |
| |
| |
| |
| |
| |
Credit ratings reflect the highest rating assigned by a nationally recognized statistical rating organization (NRSRO) such as Moody’s Investors Service, Inc. (Moody’s), S&P Global
Ratings (S&P), or Fitch Ratings, Inc. (Fitch). Credit ratings reflect the common nomenclature used by both S&P and Fitch. Where applicable, ratings are converted to the comparable
S&P/Fitch rating tier nomenclature. The Not Rated category consists of securities that have not been rated by an NRSRO. Credit ratings are subject to change.
You can find additional information at
pgim.com/investments/mutual-funds/prospectuses-fact-sheets
or by scanning the QR code below,
including the Fund’s prospectus, financial information, fund holdings, and proxy voting information. You can also request this information by
contacting us at (800) 225-1852 or (973) 367-3529 from outside the US.
To receive your fund documents online, go to
pgim.com/investments/resource/edelivery
and enroll.
PGIM Short-Term Corporate Bond Fund
PGIM Short-Term Corporate Bond Fund
ANNUAL SHAREHOLDER REPORT – December 31, 2024
This annual shareholder report contains important information about the Class Z shares of PGIM Short-Term Corporate Bond Fund (the “Fund”)
for the period of January 1, 2024 to December 31, 2024.
You can find additional information about the Fund at
pgim.com/investments/mutual-funds/prospectuses-fact-sheets
. You can also request
this information by contacting us at (800) 225-1852 or (973) 367-3529 from outside the US.
WHAT WERE THE FUND COSTS FOR THE LAST YEAR?
(Based on a hypothetical $10,000 investment)
| Costs of a $10,000 investment | Costs paid as a percentage of a $10,000 investment |
PGIM Short-Term Corporate Bond Fund—Class Z | | |
WHAT
AFFECTED
THE FUND’S PERFORMANCE DURING THE REPORTING PERIOD?
■
During the reporting period, market expectations for both the timing and number of rate cuts fluctuated significantly as inflation slowed and
employment data showed some signs of softening. The US Federal Reserve's easing cycle—which began in September of 2024 with a
50-basis-point (bp) rate cut followed by two separate 25-bp cuts—was preceded by a re-steepening of the US Treasury curve and greater
market volatility due to election and fiscal uncertainty. (One basis point equals 0.01%.) As demand for yield remained robust, credit spreads
largely tightened, and performance across fixed income sectors was positive.
■
The following contributed most to the Fund’s performance relative to the Bloomberg 1-5 Year US Credit Index (the Index) during the period:
security selection in US investment-grade corporates and US high yield corporates; positioning in AAA collateralized loan obligations (CLOs)
and non-agency AAA commercial mortgage-backed securities (CMBS); underweights to the sovereign credit and emerging-markets
investment-grade sectors; credit positioning in banking, electric utilities, healthcare & pharmaceuticals, midstream energy, and technology; and
having more risk over the period, on average, than the Index (from a market perspective).
■
The following detracted most from the Fund’s performance relative to the Index during the reporting period: security selection in US Treasuries,
largely driven by the use of futures.
■
During the period, the Fund utilized derivatives in the form of credit default swaps to manage credit risk, as well as financial futures, options,
and forwards to help manage duration positioning and yield curve exposure. Overall, the use of these derivatives had a negative impact
on performance.
HOW HAS THE FUND PERFORMED OVER THE PAST 10 YEARS?
The Fund’s past performance is not a good predictor of the Fund’s future performance.
The returns do not reflect the deduction of
taxes that a shareholder would pay on Fund distributions or redemption of Fund shares.
Visit
pgim.com/investments/mutual-funds/prospectuses-fact-sheets
or call (800) 225-1852 or (973) 367-3529 from outside the US for more recent performance data.
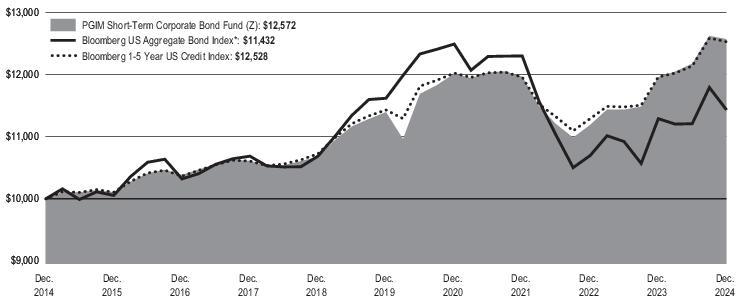
The line graph reflects a hypothetical $10,000 investment in Class Z shares and assumes that all recurring fees (including management fees)
were deducted and dividends and distributions were reinvested. Without waiver of fees and/or expense reimbursements, if any, the returns would
have been lower.
Cumulative Performance: December 31, 2014 to December 31, 2024 Initial Investment of $10,000 |
Average Annual Total Returns as of 12/31/2024 |
| | | |
| | | |
Bloomberg US Aggregate Bond Index* | | | |
Bloomberg 1-5 Year US Credit Index | | | |
*The Fund has added this broad-based index in response to new regulatory requirements.
WHAT ARE SOME KEY FUND STATISTICS AS OF 12/31/2024?
| |
| |
Total advisory fees paid for the year | |
Portfolio turnover rate for the year | |
WHAT ARE SOME CHARACTERISTICS OF THE FUND’S HOLDINGS AS OF 12/31/2024?
Credit Quality expressed as a percentage of total investments as of 12/31/2024 (%) |
| |
| |
| |
| |
| |
| |
| |
| |
| |
Credit ratings reflect the highest rating assigned by a nationally recognized statistical rating organization (NRSRO) such as Moody’s Investors Service, Inc. (Moody’s), S&P Global
Ratings (S&P), or Fitch Ratings, Inc. (Fitch). Credit ratings reflect the common nomenclature used by both S&P and Fitch. Where applicable, ratings are converted to the comparable
S&P/Fitch rating tier nomenclature. The Not Rated category consists of securities that have not been rated by an NRSRO. Credit ratings are subject to change.
You can find additional information at
pgim.com/investments/mutual-funds/prospectuses-fact-sheets
or by scanning the QR code below,
including the Fund’s prospectus, financial information, fund holdings, and proxy voting information. You can also request this information by
contacting us at (800) 225-1852 or (973) 367-3529 from outside the US.
To receive your fund documents online, go to
pgim.com/investments/resource/edelivery
and enroll.
PGIM Short-Term Corporate Bond Fund
PGIM Short-Term Corporate Bond Fund
ANNUAL SHAREHOLDER REPORT – December 31, 2024
This annual shareholder report contains important information about the Class R2 shares of PGIM Short-Term Corporate Bond Fund (the “Fund”)
for the period of January 1, 2024 to December 31, 2024.
You can find additional information about the Fund at
pgim.com/investments/mutual-funds/prospectuses-fact-sheets
. You can also request
this information by contacting us at (800) 225-1852 or (973) 367-3529 from outside the US.
WHAT WERE THE FUND COSTS FOR THE LAST YEAR?
(Based on a hypothetical $10,000 investment)
| Costs of a $10,000 investment | Costs paid as a percentage of a $10,000 investment |
PGIM Short-Term Corporate Bond Fund—Class R2 | | |
WHAT
AFFECTED
THE FUND’S PERFORMANCE DURING THE REPORTING PERIOD?
■
During the reporting period, market expectations for both the timing and number of rate cuts fluctuated significantly as inflation slowed and
employment data showed some signs of softening. The US Federal Reserve's easing cycle—which began in September of 2024 with a
50-basis-point (bp) rate cut followed by two separate 25-bp cuts—was preceded by a re-steepening of the US Treasury curve and greater
market volatility due to election and fiscal uncertainty. (One basis point equals 0.01%.) As demand for yield remained robust, credit spreads
largely tightened, and performance across fixed income sectors was positive.
■
The following contributed most to the Fund’s performance relative to the Bloomberg 1-5 Year US Credit Index (the Index) during the period:
security selection in US investment-grade corporates and US high yield corporates; positioning in AAA collateralized loan obligations (CLOs)
and non-agency AAA commercial mortgage-backed securities (CMBS); underweights to the sovereign credit and emerging-markets
investment-grade sectors; credit positioning in banking, electric utilities, healthcare & pharmaceuticals, midstream energy, and technology; and
having more risk over the period, on average, than the Index (from a market perspective).
■
The following detracted most from the Fund’s performance relative to the Index during the reporting period: security selection in US Treasuries,
largely driven by the use of futures.
■
During the period, the Fund utilized derivatives in the form of credit default swaps to manage credit risk, as well as financial futures, options,
and forwards to help manage duration positioning and yield curve exposure. Overall, the use of these derivatives had a negative impact
on performance.
HOW HAS THE FUND PERFORMED OVER THE PAST 10 YEARS?
The Fund’s past performance is not a good predictor of the Fund’s future performance.
The returns do not reflect the deduction of
taxes that a shareholder would pay on Fund distributions or redemption of Fund shares.
Visit
pgim.com/investments/mutual-funds/prospectuses-fact-sheets
or call (800) 225-1852 or (973) 367-3529 from outside the US for more recent performance data.
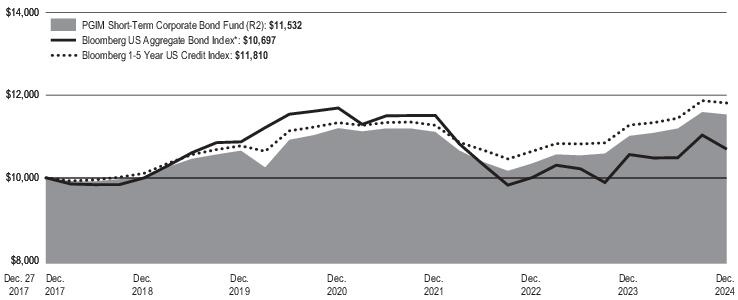
The line graph reflects a hypothetical $10,000 investment in Class R2 shares and assumes that all recurring fees (including management fees)
were deducted and dividends and distributions were reinvested. Without waiver of fees and/or expense reimbursements, if any, the returns would
have been lower.
Cumulative Performance: December 27, 2017 to December 31, 2024 Initial Investment of $10,000 |
Average Annual Total Returns as of 12/31/2024 |
| | | |
| | | |
Bloomberg US Aggregate Bond Index* | | | |
Bloomberg 1-5 Year US Credit Index | | | |
*The Fund has added this broad-based index in response to new regulatory r
equir
ements.
Since Inception returns are provided for the share class since it has less than 10 fiscal years of returns. Since Inception returns for the Indexes are measured from the month-end
closest to the class’s inception date.
WHAT ARE SOME KEY FUND STATISTICS AS OF 12/31/2024?
| |
| |
Total advisory fees paid for the year | |
Portfolio turnover rate for the year | |
WHAT ARE SOME CHARACTERISTICS OF THE FUND’S HOLDINGS AS OF 12/31/2024?
Credit Quality expressed as a percentage of total investments as of 12/31/2024 (%) |
| |
| |
| |
| |
| |
| |
| |
| |
| |
Credit ratings reflect the highest rating assigned by a nationally recognized statistical rating organization (NRSRO) such as Moody’s Investors Service, Inc. (Moody’s), S&P Global
Ratings (S&P), or Fitch Ratings, Inc. (Fitch). Credit ratings reflect the common nomenclature used by both S&P and Fitch. Where applicable, ratings are converted to the comparable
S&P/Fitch rating tier nomenclature. The Not Rated category consists of securities that have not been rated by an NRSRO. Credit ratings are subject to change.
You can find additional information at
pgim.com/investments/mutual-funds/prospectuses-fact-sheets
or by scanning the QR code below,
including the Fund’s prospectus, financial information, fund holdings, and proxy voting information. You can also request this information by
contacting us at (800) 225-1852 or (973) 367-3529 from outside the US.
To receive your fund documents online, go to
pgim.com/investments/resource/edelivery
and enroll.
PGIM
Short
-Term Corporate Bond Fund
PGIM Short-Term Corporate Bond Fund
ANNUAL SHAREHOLDER REPORT – December 31, 2024
This annual shareholder report contains important information about the Class R4 shares of PGIM Short-Term Corporate Bond Fund (the “Fund”)
for the period of January 1, 2024 to December 31, 2024.
You can find additional information about the Fund at
pgim.com/investments/mutual-funds/prospectuses-fact-sheets
. You can also request
this information by contacting us at (800) 225-1852 or (973) 367-3529 from outside the US.
WHAT WERE THE FUND COSTS FOR THE LAST YEAR?
(Based on a hypothetical $10,000 investment)
| Costs of a $10,000 investment | Costs paid as a percentage of a $10,000 investment |
PGIM Short-Term Corporate Bond Fund—Class R4 | | |
WHAT AFFECTED THE FUND’S PERFORMANCE DURING THE REPORTING PERIOD?
■
During
the reporting period, market expectations for both the timing and number of rate cuts fluctuated significantly as inflation slowed and
employment data showed some signs of softening. The US Federal Reserve's easing cycle—which began in September of 2024 with a
50-basis-point (bp) rate cut followed by two separate 25-bp cuts—was preceded by a re-steepening of the US Treasury curve and greater
market volatility due to election and fiscal uncertainty. (One basis point equals 0.01%.) As demand for yield remained robust, credit spreads
largely tightened, and performance across fixed income sectors was positive.
■
The following contributed most to the Fund’s performance relative to the Bloomberg 1-5 Year US Credit Index (the Index) during the period:
security selection in US investment-grade corporates and US high yield corporates; positioning in AAA collateralized loan obligations (CLOs)
and non-agency AAA commercial mortgage-backed securities (CMBS); underweights to the sovereign credit and emerging-markets
investment-grade sectors; credit positioning in banking, electric utilities, healthcare & pharmaceuticals, midstream energy, and technology; and
having more risk over the period, on average, than the Index (from a market perspective).
■
The following detracted most from the Fund’s performance relative to the Index during the reporting period: security selection in US Treasuries,
largely driven by the use of futures.
■
During the period, the Fund utilized derivatives in the form of credit default swaps to manage credit risk, as well as financial futures, options,
and forwards to help manage duration positioning and yield curve exposure. Overall, the use of these derivatives had a negative impact
on performance.
HOW HAS THE FUND PERFORMED OVER THE PAST 10 YEARS?
The Fund’s past performance is not a good predictor of the Fund’s future performance.
The returns do not reflect the deduction of
taxes that a shareholder would pay on Fund distributions or redemption of Fund shares.
Visit
pgim.com/investments/mutual-funds/prospectuses-fact-sheets
or call (800) 225-1852 or (973) 367-3529 from outside the US for more recent performance data.
The line graph reflects a hypothetical $10,000 investment in Class R4 shares and assumes that all recurring fees (including management fees)
were deducted and dividends and distributions were reinvested. Without waiver of fees and/or expense reimbursements, if any, the returns would
have been lower.
Cumulative Performance: December 27, 2017 to December 31, 2024 Initial Investment of $10,000 |

Average Annual Total Returns as of 12/31/2024 |
| | | |
| | | |
Bloomberg US Aggregate Bond Index* | | | |
Bloomberg 1-5 Year US Credit Index | | | |
*The Fund h
a
s added this broad-based index in response to new regulatory requirements.
Since Inception returns are provided for the share class since it has less than 10 fiscal years of returns. Since Inception returns for the Indexes are measured from the month-end
closest to the class’s inception date.
WHAT ARE SOME KEY FUND STATISTICS AS OF 12/31/2024?
| |
| |
Total advisory fees paid for the year | |
Portfolio turnover rate for the year | |
WHAT
ARE
SOME CHARACTERISTICS OF THE FUND’S HOLDINGS AS OF 12/31/2024?
Credit Quality expressed as a percentage of total investments as of 12/31/2024 (%) |
| |
| |
| |
| |
| |
| |
| |
| |
| |
Credit ratings reflect the highest rating assigned by a nationally recognized statistical rating organization (NRSRO) such as Moody’s Investors Service, Inc. (Moody’s), S&P Global
Ratings (S&P), or Fitch Ratings, Inc. (Fitch). Credit ratings reflect the common nomenclature used by both S&P and Fitch. Where applicable, ratings are converted to the comparable
S&P/Fitch rating tier nomenclature. The Not Rated category consists of securities that have not been rated by an NRSRO. Credit ratings are subject to change.
You can find additional information at
pgim.com/investments/mutual-funds/prospectuses-fact-sheets
or by scanning the QR code below,
including the Fund’s prospectus, financial information, fund holdings, and proxy voting information. You can also request this information by
contacting us at (800) 225-1852 or (973) 367-3529 from outside the US.
To receive your fund documents online, go to
pgim.com/investments/resource/edelivery
and enroll.
PGIM Short-Term Corporate Bond Fund
PGIM Short-Term Corporate Bond Fund
ANNUAL SHAREHOLDER REPORT – December 31, 2024
This annual shareholder report contains important information about the Class R6 shares of PGIM Short-Term Corporate Bond Fund (the “Fund”)
for the period of January 1, 2024 to December 31, 2024.
You can find additional information about the Fund at
pgim.com/investments/mutual-funds/prospectuses-fact-sheets
. You can also request
this information by contacting us at (800) 225-1852 or (973) 367-3529 from outside the US.
WHAT
WERE
THE FUND COSTS FOR THE LAST YEAR?
(Based on a hypothetical $10,000 investment)
| Costs of a $10,000 investment | Costs paid as a percentage of a $10,000 investment |
PGIM Short-Term Corporate Bond Fund—Class R6 | | |
WHAT
AFFECTED
THE FUND’S PERFORMANCE DURING THE REPORTING PERIOD?
■
During the reporting period, market expectations for both the timing and number of rate cuts fluctuated significantly as inflation slowed and
employment data showed some signs of softening. The US Federal Reserve's easing cycle—which began in September of 2024 with a
50-basis-point (bp) rate cut followed by two separate 25-bp cuts—was preceded by a re-steepening of the US Treasury curve and greater
market volatility due to election and fiscal uncertainty. (One basis point equals 0.01%.) As demand for yield remained robust, credit spreads
largely tightened, and performance across fixed income sectors was positive.
■
The following contributed most to the Fund’s performance relative to the Bloomberg 1-5 Year US Credit Index (the Index) during the period:
security selection in US investment-grade corporates and US high yield corporates; positioning in AAA collateralized loan obligations (CLOs)
and non-agency AAA commercial mortgage-backed securities (CMBS); underweights to the sovereign credit and emerging-markets
investment-grade sectors; credit positioning in banking, electric utilities, healthcare & pharmaceuticals, midstream energy, and technology; and
having more risk over the period, on average, than the Index (from a market perspective).
■
The following detracted most from the Fund’s performance relative to the Index during the reporting period: security selection in US Treasuries,
largely driven by the use of futures.
■
During the period, the Fund utilized derivatives in the form of credit default swaps to manage credit risk, as well as financial futures, options,
and forwards to help manage duration positioning and yield curve exposure. Overall, the use of these derivatives had a negative impact
HOW HAS THE FUND PERFORMED OVER THE PAST 10 YEARS?
The Fund’s past performance is not a good predictor of the Fund’s future performance.
The returns do not reflect the deduction of
taxes that a shareholder would pay on Fund distributions or redemption of Fund shares.
Visit
pgim.com/investments/mutual-funds/prospectuses-fact-sheets
or call (800) 225-1852 or (973) 367-3529 from outside the US for more recent performance data.
The line graph reflects a hypothetical $10,000 investment in Class R6 shares and assumes that all recurring fees (including management fees)
were deducted and dividends and distributions were reinvested. Without waiver of fees and/or expense reimbursements, if any, the returns would
have been lower.
Cumulative Performance: December 31, 2014 to December 31, 2024 Initial Investment of $10,000 |
Average Annual Total Returns as of 12/31/2024 |
| | | |
| | | |
Bloomberg US Aggregate Bond Index* | | | |
Bloomberg 1-5 Year US Credit Index | | | |
*The Fund has added this
broad
-based index in response to new regulatory requirements.
WHAT ARE
SOME
KEY FUND STATISTICS AS OF 12/31/2024?
| |
| |
Total advisory fees paid for the year | |
Portfolio turnover rate for the year | |
WHAT ARE SOME CHARACTERISTICS OF THE FUND’S HOLDINGS AS OF 12/31/2024?
Credit Quality expressed as a percentage of total investments as of 12/31/2024 (%) |
| |
| |
| |
| |
| |
| |
| |
| |
| |
Credit ratings reflect the highest rating assigned by a nationally recognized statistical rating organization (NRSRO) such as Moody’s Investors Service, Inc. (Moody’s), S&P Global
Ratings (S&P), or Fitch Ratings, Inc. (Fitch). Credit ratings reflect the common nomenclature used by both S&P and Fitch. Where applicable, ratings are converted to the comparable
S&P/Fitch rating tier nomenclature. The Not Rated category consists of securities that have not been rated by an NRSRO. Credit ratings are subject to change.
You can find additional information at
pgim.com/investments/mutual-funds/prospectuses-fact-sheets
or by scanning the QR code below,
including the Fund’s prospectus, financial information, fund holdings, and proxy voting information. You can also request this information by
contacting us at (800) 225-1852 or (973) 367-3529 from outside the US.
To receive your fund documents online, go to
pgim.com/investments/resource/edelivery
and enroll.
PGIM Short-Term Corporate Bond Fund
| | (b) | Copy of each notice transmitted to stockholders in reliance on Rule 30e-3 under the Act (17 CFR 270.30e-3) that contains disclosures specified by paragraph (c)(3) of that rule – Not applicable. |
Item 2 – Code of Ethics – See Exhibit (a)(1) of Item 19
As of the end of the period covered by this report, the registrant has adopted a code of ethics (the “Section 406 Standards for Investment Companies – Ethical Standards for Principal Executive and Financial Officers”) that applies to the registrant’s Principal Executive Officer, Principal Financial Officer and Principal Accounting Officer.
The registrant hereby undertakes to provide any person, without charge, upon request, a copy of the code of ethics. To request a copy of the code of ethics, contact the registrant 800-225-1852, and ask for a copy of the Section 406 Standards for Investment Companies - Ethical Standards for Principal Executive and Financial Officers.
Item 3 – Audit Committee Financial Expert –
The registrant’s Board has determined that Ms. Grace C. Torres, member of the Board’s Audit Committee is an “audit committee financial expert,” and that she is “independent,” for purposes of this item.
Item 4 – Principal Accountant Fees and Services –
For the fiscal years ended December 31, 2024, and December 31, 2023, PricewaterhouseCoopers LLP (“PwC”), the Registrant’s principal accountant, billed the Registrant $43,044 and $40,280, respectively, for professional services rendered for the audit of the Registrant’s annual financial statements or services that are normally provided in connection with statutory and regulatory filings.
For the fiscal years ended December 31, 2024, and December 31, 2023: none.
For the fiscal years ended December 31, 2024, and December 31, 2023: none.
For the fiscal years ended December 31, 2024, and December 31, 2023: none.
(e) (1) Audit Committee Pre-Approval Policies and Procedures
THE PGIM MUTUAL FUNDS
AUDIT COMMITTEE POLICY
on
Pre-Approval of Services Provided by the Independent
Accountants
The Audit Committee of each PGIM Mutual Fund is charged with the responsibility to monitor the independence of the Fund’s independent accountants. As part of this responsibility, the Audit Committee must pre-approve the independent accounting firm’s engagement to render audit and/or permissible non-audit services, as required by law. In evaluating a proposed engagement of the independent accountants, the Audit Committee will assess the effect that the engagement might reasonably be expected to have on the accountant’s independence. The Committee’s evaluation will be based on:
| | • | | a review of the nature of the professional services expected to be provided, |
| | • | | a review of the safeguards put into place by the accounting firm to safeguard independence, and |
| | • | | periodic meetings with the accounting firm. |
Policy for Audit and Non-Audit Services Provided to the Funds
On an annual basis, the scope of audits for each Fund, audit fees and expenses, and audit-related and non-audit services (and fees proposed in respect thereof) proposed to be performed by the Fund’s independent accountants will be presented by the Treasurer and the independent accountants to the Audit Committee for review and, as appropriate, approval prior to the initiation of such services.
Such presentation shall be accompanied by confirmation by both the Treasurer and the independent accountants that the proposed non-audit services will not adversely affect the independence of the independent accountants. Such proposed non-audit services shall be described in sufficient detail to enable the Audit Committee to assess the appropriateness of such services and fees, and the compatibility of the provision of such services with the auditor’s independence. The Committee shall receive periodic reports on the progress of the audit and other services which are approved by the Committee or by the Committee Chair pursuant to authority delegated in this Policy.
The categories of services enumerated under “Audit Services”, “Audit-related Services”, and “Tax Services” are intended to provide guidance to the Treasurer and the independent accountants as to those categories of services which the Committee believes are generally consistent with the independence of the independent accountants and which the Committee (or the Committee Chair) would expect upon the presentation of specific proposals to pre-approve. The enumerated categories are not intended as an exclusive list of audit, audit-related or tax services, which the Committee (or the Committee Chair) would consider for pre-approval.
Audit Services
The following categories of audit services are considered to be consistent with the role of the Fund’s independent accountants:
| | • | | Annual Fund financial statement audits |
| | • | | Seed audits (related to new product filings, as required) |
| | • | | SEC and regulatory filings and consents |
Audit-related Services
The following categories of audit-related services are considered to be consistent with the role of the Fund’s independent accountants:
| | • | | Accounting consultations |
| | • | | Fund merger support services |
| | • | | Agreed Upon Procedure Reports |
| | • | | Other Internal Control Reports |
Individual audit-related services that fall within one of these categories (except for fund merger support services) and are not presented to the Audit Committee as part of the annual pre-approval process are subject to an authorized pre-approval by the Audit Committee so long as the estimated fee for those services does not exceed $30,000. Any services provided under such pre-approval will be reported to the Audit Committee at its next regular meeting. Should the amount of such services exceed $30,000 any additional fees will be subject to pre-approval by the Committee Chair (or any other Committee member on whom this responsibility has been delegated). Fees related to fund merger support services are subject to a separate authorized pre-approval by the Audit Committee with fees determined on a per occurrence and merger complexity basis.
Tax Services
The following categories of tax services are considered to be consistent with the role of the Fund’s independent accountants:
| | • | | Tax compliance services related to the filing or amendment of the following: |
| | • | | Federal, state and local income tax compliance; and, |
| | • | | Sales and use tax compliance |
| | • | | Timely RIC qualification reviews |
| | • | | Tax distribution analysis and planning |
| | • | | Tax authority examination services |
| | • | | Tax appeals support services |
| | • | | Accounting methods studies |
| | • | | Fund merger support services |
| | • | | Tax consulting services and related project |
Individual tax services that fall within one of these categories and are not presented to the Audit Committee as part of the annual pre-approval process are subject to an authorized pre-approval by the Audit Committee so long as the estimated fee for those services does not exceed $30,000. Any services provided under such pre-approval will be reported to the Audit Committee at its next regular meeting. Should the amount of such services exceed $30,000 any additional fees will be subject to pre-approval by the Committee Chair (or any other Committee member on whom this responsibility has been delegated).
Other Non-Audit Services
Certain non-audit services that the independent accountants are legally permitted to render will be subject to pre-approval by the Committee or by one or more Committee members to whom the Committee has delegated this authority and who will report to the full Committee any pre-approval decisions made pursuant to this Policy. Non-audit services presented for pre-approval pursuant to this paragraph will be accompanied by a confirmation from both the Treasurer and the independent accountants that the proposed services will not adversely affect the independence of the independent accountants.
Proscribed Services
The Fund’s independent accountants will not render services in the following categories of non-audit services:
| | • | | Bookkeeping or other services related to the accounting records or financial statements of the Fund |
| | • | | Financial information systems design and implementation |
| | • | | Appraisal or valuation services, fairness opinions, or contribution-in-kind reports |
| | • | | Internal audit outsourcing services |
| | • | | Management functions or human resources |
| | • | | Broker or dealer, investment adviser, or investment banking services |
| | • | | Legal services and expert services unrelated to the audit |
| | • | | Any other service that the Public Company Accounting Oversight Board determines, by regulation, is impermissible. |
Pre-approval of Non-Audit Services Provided to Other Entities Within the PGIM Fund Complex
Certain non-audit services provided to PGIM Investments LLC or any of its affiliates that also provide ongoing services to the PGIM Mutual Funds will be subject to pre-approval by the Audit Committee. The only non-audit services provided to these entities that will require pre-approval are those related directly to the operations and financial reporting of the Funds. Individual projects that are not presented to the Audit Committee as part of the annual pre-approval process will be subject to pre-approval by the Committee Chair (or any other Committee member on whom this responsibility has been delegated) so long as the estimated fee for those services does not exceed $30,000. Services presented for pre-approval pursuant to this paragraph will be accompanied by a confirmation from both the Treasurer and the independent accountants that the proposed services will not adversely affect the independence of the independent accountants.
Although the Audit Committee will not pre-approve all services provided to PGIM Investments LLC and its affiliates, the Committee will receive an annual report from the Fund’s independent accounting firm showing the aggregate fees for all services provided to PGIM Investments and its affiliates.
(e) (2) Percentage of services described in each of paragraphs (b) through (d) of this Item that were approved by the audit committee pursuant to paragraph (c)(7)(i)(C) of Rule 2-01 of Regulation S-X –
| | | | | | | | |
| | | | Fiscal Year Ended December 31, 2024 | | Fiscal Year Ended December 31, 2023 | | |
| | 4(b) | | Not applicable. | | Not applicable. | | |
| | 4(c) | | Not applicable. | | Not applicable. | | |
| | 4(d) | | Not applicable. | | Not applicable. | | |
(f) Percentage of hours expended attributable to work performed by other than full time employees of principal accountant if greater than 50%.
The percentage of hours expended on the principal accountant’s engagement to audit the registrant’s financial statements for the most recent fiscal year that were attributed to work performed by persons other than the principal accountant’s full-time, permanent employees was 0%.
(g) Non-Audit Fees
The aggregate non-audit fees billed by the Registrant’s principal accountant for services rendered to the registrant’s investment adviser and any entity controlling, controlled by, or under common control with the investment adviser that provides ongoing services to the registrant for the fiscal years ended December 31, 2024, and December 31, 2023 was $0 and $0, respectively.
(h) Principal Accountant’s Independence
Not applicable as the Registrant’s principal accountant has not provided non-audit services to the registrant’s investment adviser and any entity controlling, controlled by, or under common control with the investment adviser that provides ongoing services to the registrant that were not pre-approved pursuant to Rule 2-01(c)(7)(ii) of Regulation S-X.
(i) Not applicable.
(j) Not applicable.
Item 5 – Audit Committee of Listed Registrants – Not applicable.
Item 6 – Investments – The registrant’s Schedule of Investments is included in the financial statements filed under Item 7
of this Form.
Items 7 – 11 (Refer to Report below)

PRUDENTIAL SHORT-TERM CORPORATE BOND FUND, INC.
PGIM Short-Term Corporate Bond Fund
FINANCIAL STATEMENTS AND OTHER INFORMATION
DECEMBER 31, 2024

| | | | |
| Table of Contents | | Financial Statements and Other Information | | December 31, 2024 |
| | | |
| | | | | |
Form N-CSR Item 7 - Financial Statements and Financial Highlights for Open-End Management Investment Companies.
Schedule of Investments
as of December 31, 2024
| | | | | | | | | | | | |
| | | | |
| Description | | Interest
Rate | | Maturity
Date | | Principal
Amount (000)# | | | Value | |
| | | | |
LONG-TERM INVESTMENTS 97.5% | | | | | | | | | | | | |
| | | | |
ASSET-BACKED SECURITIES 12.0% | | | | | | | | | | | | |
| | | | |
Collateralized Loan Obligations | | | | | | | | | | | | |
| | | | |
AGL CLO Ltd. (United Kingdom), | | | | | | | | | | | | |
Series 2022-22A, Class A1R, 144A, 3 Month SOFR + 1.190% (Cap N/A, Floor 1.190%) | | 5.750%(c) | | 01/20/37 | | | 25,300 | | | $ | 25,337,644 | |
Anchorage Capital CLO Ltd. (Cayman Islands), | | | | | | | | | | | | |
Series 2024-30A, Class A1, 144A, 3 Month SOFR + 1.300% (Cap N/A, Floor 1.300%) | | 5.615(c) | | 01/20/37 | | | 31,100 | | | | 31,105,256 | |
Atlas Senior Loan Fund Ltd. (Cayman Islands), | | | | | | | | | | | | |
Series 2016-07A, Class A1R2, 144A, 3 Month SOFR + 1.362% (Cap N/A, Floor 1.100%) | | 5.883(c) | | 11/27/31 | | | 39,235 | | | | 39,276,514 | |
Series 2018-11A, Class A1L, 144A, 3 Month SOFR + 1.362% (Cap N/A, Floor 0.000%) | | 5.979(c) | | 07/26/31 | | | 5,126 | | | | 5,129,933 | |
Battalion CLO Ltd. (Cayman Islands), | | | | | | | | | | | | |
Series 2018-12A, Class A1, 144A, 3 Month SOFR + 1.332% (Cap N/A, Floor 1.070%) | | 5.817(c) | | 05/17/31 | | | 9,763 | | | | 9,772,074 | |
Carlyle Global Market Strategies CLO Ltd. (Cayman Islands), | | | | | | | | | | | | |
Series 2012-04A, Class A1R4, 144A, 3 Month SOFR + 1.120% (Cap N/A, Floor 1.120%) | | 5.752(c) | | 04/22/32 | | | 8,923 | | | | 8,927,850 | |
CarVal CLO Ltd. (Cayman Islands), | | | | | | | | | | | | |
Series 2019-01A, Class AR2, 144A, 3 Month SOFR + 1.020% (Cap N/A, Floor 1.020%) | | 5.376(c) | | 04/20/32 | | | 39,500 | | | | 39,576,140 | |
CBAM Ltd. (Cayman Islands), | | | | | | | | | | | | |
Series 2020-12A, Class AR, 144A, 3 Month SOFR + 1.442% (Cap N/A, Floor 1.442%) | | 6.059(c) | | 07/20/34 | | | 19,500 | | | | 19,535,660 | |
CIFC Funding Ltd. (Cayman Islands), | | | | | | | | | | | | |
Series 2013-03RA, Class A1, 144A, 3 Month SOFR + 1.242% (Cap N/A, Floor 0.980%) | | 5.876(c) | | 04/24/31 | | | 11,780 | | | | 11,780,517 | |
Series 2017-02A, Class AR, 144A, 3 Month SOFR + 1.212% (Cap N/A, Floor 0.950%) | | 5.829(c) | | 04/20/30 | | | 43,323 | | | | 43,377,900 | |
Crown City CLO (Cayman Islands), | | | | | | | | | | | | |
Series 2020-01A, Class A1AR, 144A, 3 Month SOFR + 1.452% (Cap N/A, Floor 1.190%) | | 6.069(c) | | 07/20/34 | | | 60,000 | | | | 60,116,928 | |
HPS Loan Management Ltd. (Cayman Islands), | | | | | | | | | | | | |
Series 10A-16, Class A1R3, 144A, 3 Month SOFR + 1.120% (Cap N/A, Floor 1.120%) | | 5.737(c) | | 04/20/34 | | | 50,000 | | | | 50,029,165 | |
Jamestown CLO Ltd. (Cayman Islands), | | | | | | | | | | | | |
Series 2019-14A, Class A1AR, 144A, 3 Month SOFR + 1.462% (Cap N/A, Floor 1.200%) | | 6.079(c) | | 10/20/34 | | | 50,000 | | | | 50,074,805 | |
LCM Ltd. (Cayman Islands), | | | | | | | | | | | | |
Series 39A, Class A1R, 144A, 3 Month SOFR + 1.340% (Cap N/A, Floor 1.340%) | | 5.996(c) | | 10/15/34 | | | 48,400 | | | | 48,537,388 | |
See Notes to Financial Statements.
PGIM Short-Term Corporate Bond Fund 1
Schedule of Investments (continued)
as of December 31, 2024
| | | | | | | | | | | | |
| | | | |
| Description | | Interest
Rate | | Maturity
Date | | Principal
Amount
(000)# | | | Value | |
| | | | |
ASSET-BACKED SECURITIES (Continued) | | | | | | | | | | | | |
| | | | |
Collateralized Loan Obligations (cont’d.) | | | | | | | | | | | | |
| | | | |
MidOcean Credit CLO (Cayman Islands), | | | | | | | | | | | | |
Series 2014-03A, Class A1R, 144A, 3 Month SOFR + 1.382% (Cap N/A, Floor 1.120%) | | 5.999%(c) | | 04/21/31 | | | 7,592 | | | $ | 7,596,434 | |
Northwoods Capital Ltd. (Cayman Islands), | | | | | | | | | | | | |
Series 2017-15A, Class A1R, 144A, 3 Month SOFR + 1.472% (Cap N/A, Floor 1.472%) | | 5.826(c) | | 06/20/34 | | | 40,000 | | | | 40,062,480 | |
OCP CLO Ltd. (Cayman Islands), | | | | | | | | | | | | |
Series 2020-08RA, Class AR, 144A, 3 Month SOFR + 1.250% (Cap N/A, Floor 1.250%) | | 5.773(c) | | 10/17/36 | | | 18,000 | | | | 18,041,288 | |
Palmer Square CLO Ltd. (Cayman Islands), | | | | | | | | | | | | |
Series 2015-01A, Class A1A5, 144A, 3 Month SOFR + 1.050% (Cap N/A, Floor 1.050%) | | 0.000(c) | | 05/21/34 | | | 40,000 | | | | 40,000,000 | |
Shackleton CLO Ltd. (Cayman Islands), | | | | | | | | | | | | |
Series 2015-07RA, Class ARR, 144A, 3 Month SOFR + 1.100% (Cap N/A, Floor 1.100%) | | 5.756(c) | | 07/15/31 | | | 12,800 | | | | 12,824,530 | |
Sixth Street CLO Ltd. (Cayman Islands), | | | | | | | | | | | | |
Series 2017-08A, Class A1R2, 144A, 3 Month SOFR + 1.150% (Cap N/A, Floor 1.150%) | | 5.594(c) | | 10/20/34 | | | 45,000 | | | | 45,031,703 | |
Sound Point CLO Ltd. (Cayman Islands), | | | | | | | | | | | | |
Series 2013-01A, Class A1R, 144A, 3 Month SOFR + 1.332% (Cap N/A, Floor 1.332%) | | 5.949(c) | | 01/26/31 | | | 4,745 | | | | 4,749,491 | |
Series 2013-03RA, Class A, 144A, 3 Month SOFR + 1.412% (Cap N/A, Floor 1.150%) | | 6.044(c) | | 04/18/31 | | | 15,104 | | | | 15,132,648 | |
Series 2014-03RA, Class A1R, 144A, 3 Month SOFR + 1.332% (Cap N/A, Floor 1.070%) | | 5.958(c) | | 10/23/31 | | | 29,721 | | | | 29,756,262 | |
Series 2017-03A, Class A1R, 144A, 3 Month SOFR + 1.242% (Cap N/A, Floor 0.980%) | | 5.859(c) | | 10/20/30 | | | 8,436 | | | | 8,436,391 | |
TCW CLO Ltd. (Cayman Islands), | | | | | | | | | | | | |
Series 2017-01A, Class A1RR, 144A, 3 Month SOFR + 1.442% (Cap N/A, Floor 1.180%) | | 6.046(c) | | 10/29/34 | | | 25,000 | | | | 25,006,035 | |
Series 2020-01A, Class A1R3, 144A, 3 Month SOFR + 1.050% (Cap N/A, Floor 0.000%) | | 0.000(c) | | 04/20/34 | | | 40,000 | | | | 40,000,000 | |
THL Credit Wind River CLO Ltd. (Cayman Islands), | | | | | | | | | | | | |
Series 2019-01A, Class AR, 144A, 3 Month SOFR + 1.422% (Cap N/A, Floor 1.160%) | | 6.039(c) | | 07/20/34 | | | 39,500 | | | | 39,575,338 | |
Tralee CLO Ltd. (Cayman Islands), | | | | | | | | | | | | |
Series 2021-07A, Class A1, 144A, 3 Month SOFR + 1.582% (Cap N/A, Floor 1.320%) | | 6.207(c) | | 04/25/34 | | | 32,000 | | | | 32,019,270 | |
Trimaran Cavu Ltd., | | | | | | | | | | | | |
Series 2019-01A, Class A1R, 144A, 3 Month SOFR + 1.190% (Cap N/A, Floor 1.190%) | | 5.505(c) | | 01/20/37 | | | 44,851 | | | | 44,851,000 | |
See Notes to Financial Statements.
2
| | | | | | | | | | | | |
| | | | |
| Description | | Interest
Rate | | Maturity
Date | | Principal
Amount
(000)# | | | Value | |
| | | | |
ASSET-BACKED SECURITIES (Continued) | | | | | | | | | | | | |
| | | | |
Collateralized Loan Obligations (cont’d.) | | | | | | | | | | | | |
| | | | |
Trinitas CLO Ltd. (Cayman Islands), | | | | | | | | | | | | |
Series 2019-11A, Class A1RR, 144A, 3 Month SOFR + 1.190% (Cap N/A, Floor 1.190%) | | 5.757%(c) | | 07/15/34 | | | 40,000 | | | $ | 40,004,240 | |
Voya CLO Ltd. (Cayman Islands), | | | | | | | | | | | | |
Series 2019-03A, Class AR, 144A, 3 Month SOFR + 1.342% (Cap N/A, Floor 1.080%) | | 5.989(c) | | 10/17/32 | | | 25,000 | | | | 25,000,355 | |
Series 2020-02A, Class A1R, 144A, 3 Month SOFR + 1.422% (Cap N/A, Floor 1.160%) | | 6.039(c) | | 07/19/34 | | | 30,000 | | | | 30,000,000 | |
Wellfleet CLO Ltd. (Cayman Islands), | | | | | | | | | | | | |
Series 2019-XA, Class A1R2, 144A, 3 Month SOFR + 1.120% (Cap N/A, Floor 1.120%) | | 5.413(c) | | 07/20/32 | | | 26,650 | | | | 26,680,906 | |
Wind River CLO Ltd. (Cayman Islands), | | | | | | | | | | | | |
Series 2016-01KRA, Class A1R2, 144A, 3 Month SOFR + 1.472% (Cap N/A, Floor 1.210%) | | 6.128(c) | | 10/15/34 | | | 25,000 | | | | 25,023,143 | |
Zais CLO Ltd. (Cayman Islands), | | | | | | | | | | | | |
Series 2017-02A, Class A, 144A, 3 Month SOFR + 1.552% (Cap N/A, Floor 0.000%) | | 6.208(c) | | 04/15/30 | | | 2,715 | | | | 2,715,914 | |
| | | | | | | | | | | | |
| | | | |
TOTAL ASSET-BACKED SECURITIES
(cost $993,867,104) | | | | | | | | | | | 995,085,202 | |
| | | | | | | | | | | | |
| | | | |
COMMERCIAL MORTGAGE-BACKED SECURITIES 1.6% | | | | | | | | | | | | |
Benchmark Mortgage Trust, | | | | | | | | | | | | |
Series 2020-IG03, Class A2, 144A | | 2.475 | | 09/15/48 | | | 60,891 | | | | 60,621,638 | |
Citigroup Commercial Mortgage Trust, | | | | | | | | | | | | |
Series 2016-C02, Class A3 | | 2.575 | | 08/10/49 | | | 12,367 | | | | 12,033,725 | |
JPMBB Commercial Mortgage Securities Trust, | | | | | | | | | | | | |
Series 2016-C01, Class A4 | | 3.311 | | 03/17/49 | | | 34,783 | | | | 34,271,024 | |
Morgan Stanley Bank of America Merrill Lynch Trust, | | | | | | | | | | | | |
Series 2016-C29, Class A3 | | 3.058 | | 05/15/49 | | | 9,854 | | | | 9,684,416 | |
Series 2016-C32, Class ASB | | 3.514 | | 12/15/49 | | | 3,070 | | | | 3,030,715 | |
Morgan Stanley Capital I Trust, | | | | | | | | | | | | |
Series 2015-MS01, Class A3 | | 3.510 | | 05/15/48 | | | 6,766 | | | | 6,727,498 | |
Wells Fargo Commercial Mortgage Trust, | | | | | | | | | | | | |
Series 2016-BNK01, Class A2 | | 2.399 | | 08/15/49 | | | 10,436 | | | | 10,072,166 | |
| | | | | | | | | | | | |
| | | | |
TOTAL COMMERCIAL MORTGAGE-BACKED SECURITIES
(cost $142,826,534) | | | | | | | | | | | 136,441,182 | |
| | | | | | | | | | | | |
See Notes to Financial Statements.
PGIM Short-Term Corporate Bond Fund 3
Schedule of Investments (continued)
as of December 31, 2024
| | | | | | | | | | | | |
| | | | |
| Description | | Interest
Rate | | Maturity
Date | | Principal
Amount
(000)# | | | Value | |
| | | | |
CORPORATE BONDS 82.9% | | | | | | | | | | | | |
| | | | |
Aerospace & Defense 1.5% | | | | | | | | | | | | |
| | | | |
BAE Systems Finance, Inc. (United Kingdom), | | | | | | | | | | | | |
Gtd. Notes, 144A | | 7.500% | | 07/01/27 | | | 5,463 | | | $ | 5,788,713 | |
BAE Systems PLC (United Kingdom), | | | | | | | | | | | | |
Sr. Unsec’d. Notes, 144A | | 5.125 | | 03/26/29 | | | 7,755 | | | | 7,769,861 | |
Boeing Co. (The), | | | | | | | | | | | | |
Sr. Unsec’d. Notes | | 2.196 | | 02/04/26 | | | 8,700 | | | | 8,435,731 | |
Sr. Unsec’d. Notes | | 2.700 | | 02/01/27 | | | 37,574 | | | | 35,822,556 | |
Sr. Unsec’d. Notes | | 3.250 | | 02/01/28 | | | 27,812 | | | | 26,187,620 | |
Sr. Unsec’d. Notes | | 3.625 | | 02/01/31 | | | 4,745 | | | | 4,307,707 | |
Sr. Unsec’d. Notes | | 5.150 | | 05/01/30 | | | 15,603 | | | | 15,398,598 | |
Sr. Unsec’d. Notes | | 6.298 | | 05/01/29 | | | 5,210 | | | | 5,402,142 | |
L3Harris Technologies, Inc., | | | | | | | | | | | | |
Sr. Unsec’d. Notes | | 4.400 | | 06/15/28 | | | 4,720 | | | | 4,639,101 | |
Spirit AeroSystems, Inc., | | | | | | | | | | | | |
Sr. Sec’d. Notes | | 3.850 | | 06/15/26 | | | 12,300 | | | | 12,016,425 | |
| | | | | | | | | | | | |
| | | | |
| | | | | | | | | | | 125,768,454 | |
| | | | |
Agriculture 2.7% | | | | | | | | | | | | |
| | | | |
Archer-Daniels-Midland Co., | | | | | | | | | | | | |
Sr. Unsec’d. Notes | | 3.250 | | 03/27/30 | | | 33,645 | | | | 31,057,985 | |
BAT Capital Corp. (United Kingdom), | | | | | | | | | | | | |
Gtd. Notes | | 2.259 | | 03/25/28 | | | 5,000 | | | | 4,593,941 | |
Gtd. Notes | | 3.557 | | 08/15/27 | | | 4,524 | | | | 4,376,905 | |
Gtd. Notes | | 4.700 | | 04/02/27 | | | 8,054 | | | | 8,017,298 | |
Gtd. Notes | | 5.834 | | 02/20/31 | | | 8,995 | | | | 9,195,442 | |
BAT International Finance PLC (United Kingdom), | | | | | | | | | | | | |
Gtd. Notes | | 1.668 | | 03/25/26 | | | 26,865 | | | | 25,832,785 | |
Bunge Ltd. Finance Corp., | | | | | | | | | | | | |
Gtd. Notes(a) | | 2.750 | | 05/14/31 | | | 11,705 | | | | 10,114,657 | |
Imperial Brands Finance PLC (United Kingdom), | | | | | | | | | | | | |
Gtd. Notes, 144A | | 6.125 | | 07/27/27 | | | 12,610 | | | | 12,942,860 | |
Gtd. Notes, 144A, MTN | | 5.500 | | 02/01/30 | | | 13,600 | | | | 13,752,119 | |
Philip Morris International, Inc., | | | | | | | | | | | | |
Sr. Unsec’d. Notes | | 4.375 | | 11/01/27 | | | 28,750 | | | | 28,510,669 | |
Sr. Unsec’d. Notes(a) | | 4.875 | | 02/15/28 | | | 20,529 | | | | 20,574,123 | |
Sr. Unsec’d. Notes | | 5.125 | | 02/13/31 | | | 11,550 | | | | 11,558,276 | |
Sr. Unsec’d. Notes | | 5.250 | | 09/07/28 | | | 8,521 | | | | 8,644,656 | |
See Notes to Financial Statements.
4
| | | | | | | | | | | | |
| | | | |
| Description | | Interest
Rate | | Maturity
Date | | Principal
Amount
(000)# | | | Value | |
| | | |
CORPORATE BONDS (Continued) | | | | | | | | | | |
| | | | |
Agriculture (cont’d.) | | | | | | | | | | | | |
| | | | |
Reynolds American, Inc. (United Kingdom), | | | | | | | | | | | | |
Gtd. Notes | | 4.450% | | 06/12/25 | | | 212 | | | $ | 211,458 | |
Viterra Finance BV (Netherlands), | | | | | | | | | | | | |
Gtd. Notes, 144A | | 2.000 | | 04/21/26 | | | 35,200 | | | | 33,822,328 | |
| | | | | | | | | | | | |
| | | | |
| | | | | | | | | | | 223,205,502 | |
| | | | |
Airlines 0.8% | | | | | | | | | | | | |
| | | | |
American Airlines 2013-1 Class A Pass-Through Trust, | | | | | | | | | | | | |
Pass-Through Certificates | | 4.000 | | 01/15/27 | | | 954 | | | | 943,512 | |
Delta Air Lines, Inc./SkyMiles IP Ltd., | | | | | | | | | | | | |
Sr. Sec’d. Notes, 144A(a) | | 4.500 | | 10/20/25 | | | 8,446 | | | | 8,404,673 | |
Sr. Sec’d. Notes, 144A | | 4.750 | | 10/20/28 | | | 29,560 | | | | 29,136,405 | |
Southwest Airlines Co., | | | | | | | | | | | | |
Sr. Unsec’d. Notes | | 5.125 | | 06/15/27 | | | 7,215 | | | | 7,252,653 | |
United Airlines 2014-1 Class A Pass-Through Trust, | | | | | | | | | | | | |
Pass-Through Certificates | | 4.000 | | 10/11/27 | | | 2,891 | | | | 2,856,833 | |
United Airlines, Inc., | | | | | | | | | | | | |
Sr. Sec’d. Notes, 144A | | 4.375 | | 04/15/26 | | | 12,515 | | | | 12,300,722 | |
Sr. Sec’d. Notes, 144A | | 4.625 | | 04/15/29 | | | 4,540 | | | | 4,315,548 | |
| | | | | | | | | | | | |
| | | | |
| | | | | | | | | | | 65,210,346 | |
| | | | |
Apparel 0.3% | | | | | | | | | | | | |
| | | | |
VF Corp., | | | | | | | | | | | | |
Sr. Unsec’d. Notes(a) | | 2.400 | | 04/23/25 | | | 20,475 | | | | 20,285,300 | |
| | | | |
Auto Manufacturers 3.2% | | | | | | | | | | | | |
| | | | |
Ford Motor Credit Co. LLC, | | | | | | | | | | | | |
Sr. Unsec’d. Notes | | 2.700 | | 08/10/26 | | | 50,965 | | | | 48,948,753 | |
Sr. Unsec’d. Notes | | 4.000 | | 11/13/30 | | | 2,865 | | | | 2,579,222 | |
Sr. Unsec’d. Notes | | 4.271 | | 01/09/27 | | | 9,430 | | | | 9,237,065 | |
Sr. Unsec’d. Notes | | 5.800 | | 03/08/29 | | | 8,000 | | | | 8,000,595 | |
Sr. Unsec’d. Notes | | 5.850 | | 05/17/27 | | | 13,740 | | | | 13,882,529 | |
Sr. Unsec’d. Notes | | 6.950 | | 03/06/26 | | | 2,200 | | | | 2,238,818 | |
General Motors Financial Co., Inc., | | | | | | | | | | | | |
Sr. Unsec’d. Notes | | 1.250 | | 01/08/26 | | | 39,885 | | | | 38,427,508 | |
Sr. Unsec’d. Notes | | 1.500 | | 06/10/26 | | | 9,390 | | | | 8,949,308 | |
Sr. Unsec’d. Notes | | 2.350 | | 02/26/27 | | | 2,590 | | | | 2,454,286 | |
Sr. Unsec’d. Notes | | 2.400 | | 04/10/28 | | | 11,815 | | | | 10,855,300 | |
Sr. Unsec’d. Notes | | 2.400 | | 10/15/28 | | | 23,040 | | | | 20,888,903 | |
Sr. Unsec’d. Notes | | 5.400 | | 05/08/27 | | | 2,675 | | | | 2,703,146 | |
See Notes to Financial Statements.
PGIM Short-Term Corporate Bond Fund 5
Schedule of Investments (continued)
as of December 31, 2024
| | | | | | | | | | | | |
| | | | |
| Description | | Interest
Rate | | Maturity
Date | | Principal
Amount
(000)# | | | Value | |
| | | | |
CORPORATE BONDS (Continued) | | | | | | | | | | | | |
| | | | |
Auto Manufacturers (cont’d.) | | | | | | | | | | | | |
| | | | |
Hyundai Capital America, | | | | | | | | | | | | |
Sr. Unsec’d. Notes, 144A | | 5.275% | | 06/24/27 | | | 16,850 | | | $ | 16,971,000 | |
Sr. Unsec’d. Notes, 144A | | 6.100 | | 09/21/28 | | | 20,000 | | | | 20,572,403 | |
Nissan Motor Acceptance Co. LLC, | | | | | | | | | | | | |
Sr. Unsec’d. Notes, 144A, MTN | | 1.850 | | 09/16/26 | | | 15,000 | | | | 14,076,310 | |
Sr. Unsec’d. Notes, 144A, MTN | | 5.300 | | 09/13/27 | | | 6,590 | | | | 6,523,543 | |
Nissan Motor Co. Ltd. (Japan), | | | | | | | | | | | | |
Sr. Unsec’d. Notes, 144A | | 3.522 | | 09/17/25 | | | 4,000 | | | | 3,935,454 | |
Toyota Motor Credit Corp., | | | | | | | | | | | | |
Sr. Unsec’d. Notes, EMTN | | 4.050 | | 10/24/25 | | | 10,000 | | | | 9,907,949 | |
Volkswagen Group of America Finance LLC (Germany), | | | | | | | | | | | | |
Gtd. Notes, 144A(a) | | 4.950 | | 08/15/29 | | | 9,600 | | | | 9,359,131 | |
Gtd. Notes, 144A | | 5.300 | | 03/22/27 | | | 14,260 | | | | 14,266,756 | |
| | | | | | | | | | | | |
| | | | |
| | | | | | | | | | | 264,777,979 | |
| | | | |
Auto Parts & Equipment 0.2% | | | | | | | | | | | | |
| | | | |
Aptiv Swiss Holdings Ltd., | | | | | | | | | | | | |
Gtd. Notes | | 4.650 | | 09/13/29 | | | 1,665 | | | | 1,611,528 | |
Gtd. Notes(a) | | 6.875(ff) | | 12/15/54 | | | 13,340 | | | | 13,010,618 | |
| | | | | | | | | | | | |
| | | | |
| | | | | | | | | | | 14,622,146 | |
| | | | |
Banks 22.7% | | | | | | | | | | | | |
| | | | |
Banco Santander SA (Spain), | | | | | | | | | | | | |
Sr. Non-Preferred Notes | | 1.849 | | 03/25/26 | | | 13,400 | | | | 12,902,364 | |
Sr. Non-Preferred Notes | | 5.538(ff) | | 03/14/30 | | | 7,200 | | | | 7,230,355 | |
Sr. Preferred Notes(a) | | 5.439 | | 07/15/31 | | | 16,600 | | | | 16,545,521 | |
Bank of America Corp., | | | | | | | | | | | | |
Sr. Unsec’d. Notes | | 1.734(ff) | | 07/22/27 | | | 93,500 | | | | 89,140,307 | |
Sr. Unsec’d. Notes, MTN | | 2.087(ff) | | 06/14/29 | | | 32,800 | | | | 29,734,311 | |
Sr. Unsec’d. Notes, Series N | | 1.658(ff) | | 03/11/27 | | | 65,520 | | | | 63,119,136 | |
Bank of Nova Scotia (The) (Canada), | | | | | | | | | | | | |
Jr. Sub. Notes, Series 2 | | 3.625(ff) | | 10/27/81 | | | 50,000 | | | | 46,000,000 | |
Barclays PLC (United Kingdom), | | | | | | | | | | | | |
Sr. Unsec’d. Notes | | 4.942(ff) | | 09/10/30 | | | 9,620 | | | | 9,430,312 | |
Sr. Unsec’d. Notes | | 5.304(ff) | | 08/09/26 | | | 18,900 | | | | 18,933,572 | |
Sr. Unsec’d. Notes | | 5.501(ff) | | 08/09/28 | | | 4,295 | | | | 4,337,950 | |
Sr. Unsec’d. Notes | | 5.829(ff) | | 05/09/27 | | | 2,960 | | | | 2,990,646 | |
Sr. Unsec’d. Notes | | 6.496(ff) | | 09/13/27 | | | 32,530 | | | | 33,285,961 | |
BNP Paribas SA (France), | | | | | | | | | | | | |
Sr. Non-Preferred Notes, 144A | | 2.159(ff) | | 09/15/29 | | | 6,595 | | | | 5,899,966 | |
See Notes to Financial Statements.
6
| | | | | | | | | | | | |
| | | | |
| Description | | Interest
Rate | | Maturity
Date | | Principal
Amount
(000)# | | | Value | |
| | | | |
CORPORATE BONDS (Continued) | | | | | | | | | | | | |
| | | | |
Banks (cont’d.) | | | | | | | | | | | | |
| | | | |
BPCE SA (France), | | | | | | | | | | | | |
Sub. Notes, 144A, MTN | | 4.500% | | 03/15/25 | | | 3,640 | | | $ | 3,631,242 | |
CaixaBank SA (Spain), | | | | | | | | | | | | |
Sr. Non-Preferred Notes, 144A | | 6.684(ff) | | 09/13/27 | | | 15,790 | | | | 16,189,650 | |
Canadian Imperial Bank of Commerce (Canada), | | | | | | | | | | | | |
Jr. Sub. Notes(a) | | 6.950(ff) | | 01/28/85 | | | 25,145 | | | | 25,019,275 | |
Citigroup, Inc., | | | | | | | | | | | | |
Jr. Sub. Notes, Series CC | | 7.125(ff) | | 08/15/29(oo) | | | 24,710 | | | | 25,154,434 | |
Jr. Sub. Notes, Series EE | | 6.750(ff) | | 02/15/30(oo) | | | 12,600 | | | | 12,538,422 | |
Jr. Sub. Notes, Series V | | 4.700(ff) | | 01/30/25(oo) | | | 26,675 | | | | 26,553,996 | |
Sr. Unsec’d. Notes | | 1.462(ff) | | 06/09/27 | | | 81,450 | | | | 77,554,097 | |
Sr. Unsec’d. Notes | | 3.057(ff) | | 01/25/33 | | | 18,715 | | | | 16,071,933 | |
Sub. Notes | | 4.450 | | 09/29/27 | | | 8,160 | | | | 8,046,869 | |
Comerica, Inc., | | | | | | | | | | | | |
Sr. Unsec’d. Notes | | 5.982(ff) | | 01/30/30 | | | 44,920 | | | | 45,410,384 | |
Credit Agricole SA (France), | | | | | | | | | | | | |
Sr. Non-Preferred Notes, 144A, MTN | | 4.631(ff) | | 09/11/28 | | | 8,535 | | | | 8,419,548 | |
Danske Bank A/S (Denmark), | | | | | | | | | | | | |
Sr. Non-Preferred Notes, 144A | | 4.613(ff) | | 10/02/30 | | | 7,280 | | | | 7,059,369 | |
Deutsche Bank AG (Germany), | | | | | | | | | | | | |
Sr. Non-Preferred Notes | | 2.311(ff) | | 11/16/27 | | | 16,725 | | | | 15,895,489 | |
Sr. Non-Preferred Notes | | 2.552(ff) | | 01/07/28 | | | 4,522 | | | | 4,296,290 | |
Sr. Non-Preferred Notes | | 4.999(ff) | | 09/11/30 | | | 6,370 | | | | 6,214,431 | |
Sr. Non-Preferred Notes, SOFR + 1.219% | | 5.701(c) | | 11/16/27 | | | 4,625 | | | | 4,607,577 | |
Sr. Non-Preferred Notes | | 6.720(ff) | | 01/18/29 | | | 1,915 | | | | 1,986,002 | |
Sr. Non-Preferred Notes | | 6.819(ff) | | 11/20/29 | | | 20,510 | | | | 21,455,870 | |
Fifth Third Bancorp, | | | | | | | | | | | | |
Sr. Unsec’d. Notes | | 6.339(ff) | | 07/27/29 | | | 33,640 | | | | 34,887,116 | |
Goldman Sachs Bank USA, | | | | | | | | | | | | |
Sr. Unsec’d. Notes | | 5.414(ff) | | 05/21/27 | | | 19,650 | | | | 19,799,857 | |
Goldman Sachs Group, Inc. (The), | | | | | | | | | | | | |
Jr. Sub. Notes, Series U | | 3.650(ff) | | 08/10/26(oo) | | | 16,130 | | | | 15,404,257 | |
Jr. Sub. Notes, Series X | | 7.500(ff) | | 05/10/29(oo) | | | 15,620 | | | | 16,330,186 | |
Sr. Unsec’d. Notes | | 1.431(ff) | | 03/09/27 | | | 56,555 | | | | 54,273,705 | |
Sr. Unsec’d. Notes | | 1.542(ff) | | 09/10/27 | | | 72,845 | | | | 68,886,144 | |
Sr. Unsec’d. Notes | | 2.615(ff) | | 04/22/32 | | | 5,120 | | | | 4,364,092 | |
Sr. Unsec’d. Notes | | 3.615(ff) | | 03/15/28 | | | 6,630 | | | | 6,444,526 | |
Sr. Unsec’d. Notes | | 3.814(ff) | | 04/23/29 | | | 6,155 | | | | 5,918,594 | |
HSBC Holdings PLC (United Kingdom), | | | | | | | | | | | | |
Sr. Unsec’d. Notes | | 2.013(ff) | | 09/22/28 | | | 5,750 | | | | 5,299,983 | |
Sr. Unsec’d. Notes | | 2.804(ff) | | 05/24/32 | | | 28,670 | | | | 24,355,859 | |
Sr. Unsec’d. Notes | | 2.871(ff) | | 11/22/32 | | | 5,000 | | | | 4,213,630 | |
See Notes to Financial Statements.
PGIM Short-Term Corporate Bond Fund 7
Schedule of Investments (continued)
as of December 31, 2024
| | | | | | | | | | | | |
| | | | |
| Description | | Interest
Rate | | Maturity
Date | | Principal
Amount
(000)# | | | Value | |
| | | | |
CORPORATE BONDS (Continued) | | | | | | | | | | | | |
| | | | |
Banks (cont’d.) | | | | | | | | | | | | |
| | | | |
HSBC Holdings PLC (United Kingdom), (cont’d.) | | | | | | | | | | | | |
Sr. Unsec’d. Notes(a) | | 5.210%(ff) | | 08/11/28 | | | 900 | | | $ | 902,709 | |
Huntington Bancshares, Inc., | | | | | | | | | | | | |
Sr. Unsec’d. Notes | | 6.208(ff) | | 08/21/29 | | | 36,040 | | | | 37,191,240 | |
JPMorgan Chase & Co., | | | | | | | | | | | | |
Jr. Sub. Notes, Series CC, 3 Month SOFR + 2.842% | | 7.413(c) | | 02/01/25(oo) | | | 11,600 | | | | 11,661,669 | |
Jr. Sub. Notes, Series HH | | 4.600(ff) | | 02/01/25(oo) | | | 15,824 | | | | 15,760,739 | |
Jr. Sub. Notes, Series II | | 4.000(ff) | | 04/01/25(oo) | | | 5,225 | | | | 5,182,588 | |
Sr. Unsec’d. Notes | | 1.040(ff) | | 02/04/27 | | | 20,000 | | | | 19,205,292 | |
Sr. Unsec’d. Notes(a) | | 1.470(ff) | | 09/22/27 | | | 39,288 | | | | 37,153,947 | |
Sr. Unsec’d. Notes | | 1.578(ff) | | 04/22/27 | | | 64,714 | | | | 62,142,319 | |
Sr. Unsec’d. Notes | | 2.083(ff) | | 04/22/26 | | | 24,675 | | | | 24,464,258 | |
Sr. Unsec’d. Notes | | 4.995(ff) | | 07/22/30 | | | 32,810 | | | | 32,684,336 | |
Sr. Unsec’d. Notes | | 5.299(ff) | | 07/24/29 | | | 25,000 | | | | 25,231,066 | |
Sr. Unsec’d. Notes | | 5.581(ff) | | 04/22/30 | | | 25,605 | | | | 26,087,804 | |
KBC Group NV (Belgium), | | | | | | | | | | | | |
Sr. Unsec’d. Notes, 144A | | 4.932(ff) | | 10/16/30 | | | 6,305 | | | | 6,193,925 | |
KeyBank NA, | | | | | | | | | | | | |
Sub. Notes | | 6.950 | | 02/01/28 | | | 8,600 | | | | 8,952,718 | |
KeyCorp, | | | | | | | | | | | | |
Sr. Unsec’d. Notes, MTN | | 2.550 | | 10/01/29 | | | 5,570 | | | | 4,946,486 | |
Sr. Unsec’d. Notes, MTN | | 4.100 | | 04/30/28 | | | 9,513 | | | | 9,201,688 | |
Lloyds Banking Group PLC (United Kingdom), | | | | | | | | | | | | |
Sr. Unsec’d. Notes | | 5.985(ff) | | 08/07/27 | | | 9,050 | | | | 9,185,812 | |
Mitsubishi UFJ Financial Group, Inc. (Japan), | | | | | | | | | | | | |
Sr. Unsec’d. Notes | | 1.538(ff) | | 07/20/27 | | | 25,830 | | | | 24,562,153 | |
Mizuho Financial Group, Inc. (Japan), | | | | | | | | | | | | |
Sr. Unsec’d. Notes | | 2.869(ff) | | 09/13/30 | | | 24,524 | | | | 22,138,094 | |
Morgan Stanley, | | | | | | | | | | | | |
Sr. Unsec’d. Notes | | 0.985(ff) | | 12/10/26 | | | 50,880 | | | | 49,069,460 | |
Sr. Unsec’d. Notes(a) | | 1.593(ff) | | 05/04/27 | | | 33,720 | | | | 32,325,949 | |
Sr. Unsec’d. Notes | | 4.654(ff) | | 10/18/30 | | | 3,420 | | | | 3,347,355 | |
Sr. Unsec’d. Notes | | 5.449(ff) | | 07/20/29 | | | 17,800 | | | | 17,998,685 | |
Sr. Unsec’d. Notes | | 6.407(ff) | | 11/01/29 | | | 5,240 | | | | 5,473,940 | |
Sr. Unsec’d. Notes, GMTN | | 1.512(ff) | | 07/20/27 | | | 32,690 | | | | 31,108,782 | |
Sr. Unsec’d. Notes, GMTN | | 2.699(ff) | | 01/22/31 | | | 5,380 | | | | 4,777,537 | |
Sr. Unsec’d. Notes, MTN | | 1.928(ff) | | 04/28/32 | | | 23,731 | | | | 19,438,052 | |
Sr. Unsec’d. Notes, MTN | | 2.475(ff) | | 01/21/28 | | | 29,305 | | | | 27,910,385 | |
Sr. Unsec’d. Notes, MTN | | 5.164(ff) | | 04/20/29 | | | 24,090 | | | | 24,158,665 | |
Morgan Stanley Bank NA, | | | | | | | | | | | | |
Sr. Unsec’d. Notes | | 4.952(ff) | | 01/14/28 | | | 13,180 | | | | 13,194,261 | |
See Notes to Financial Statements.
8
| | | | | | | | | | | | |
| | | | |
| Description | | Interest
Rate | | Maturity
Date | | Principal
Amount
(000)# | | | Value | |
| | | | |
CORPORATE BONDS (Continued) | | | | | | | | | | | | |
| | | | |
Banks (cont’d.) | | | | | | | | | | | | |
| | | | |
Popular, Inc. (Puerto Rico), | | | | | | | | | | | | |
Sr. Unsec’d. Notes | | 7.250% | | 03/13/28 | | | 15,795 | | | $ | 16,240,419 | |
Royal Bank of Canada (Canada), | | | | | | | | | | | | |
Jr. Sub. Notes(a) | | 7.500(ff) | | 05/02/84 | | | 20,000 | | | | 20,700,000 | |
Societe Generale SA (France), | | | | | | | | | | | | |
Gtd. Notes, 144A | | 2.797(ff) | | 01/19/28 | | | 7,100 | | | | 6,736,599 | |
Sr. Non-Preferred Notes, 144A | | 2.889(ff) | | 06/09/32 | | | 4,225 | | | | 3,527,804 | |
Sr. Non-Preferred Notes, 144A | | 5.519(ff) | | 01/19/28 | | | 10,000 | | | | 10,021,882 | |
Sr. Non-Preferred Notes, 144A(a) | | 5.634(ff) | | 01/19/30 | | | 1,775 | | | | 1,769,999 | |
State Street Corp., | | | | | | | | | | | | |
Jr. Sub. Notes, Series J | | 6.700(ff) | | 09/15/29(oo) | | | 11,680 | | | | 11,928,332 | |
Sumitomo Mitsui Financial Group, Inc. (Japan), | | | | | | | | | | | | |
Sr. Unsec’d. Notes | | 1.902 | | 09/17/28 | | | 18,905 | | | | 16,937,131 | |
Toronto-Dominion Bank (The) (Canada), | | | | | | | | | | | | |
Jr. Sub. Notes | | 7.250(ff) | | 07/31/84 | | | 17,340 | | | | 17,578,425 | |
Truist Financial Corp., | | | | | | | | | | | | |
Sr. Unsec’d. Notes, MTN | | 4.873(ff) | | 01/26/29 | | | 33,415 | | | | 33,206,589 | |
Sr. Unsec’d. Notes, MTN(a) | | 5.435(ff) | | 01/24/30 | | | 10,955 | | | | 11,054,812 | |
Sr. Unsec’d. Notes, MTN | | 6.047(ff) | | 06/08/27 | | | 33,630 | | | | 34,161,684 | |
Sr. Unsec’d. Notes, MTN | | 7.161(ff) | | 10/30/29 | | | 2,030 | | | | 2,169,335 | |
U.S. Bancorp, | | | | | | | | | | | | |
Sr. Unsec’d. Notes | | 5.775(ff) | | 06/12/29 | | | 28,455 | | | | 29,125,664 | |
UBS Group AG (Switzerland), | | | | | | | | | | | | |
Sr. Unsec’d. Notes, 144A | | 1.494(ff) | | 08/10/27 | | | 16,550 | | | | 15,650,044 | |
Sr. Unsec’d. Notes, 144A | | 2.193(ff) | | 06/05/26 | | | 3,250 | | | | 3,209,375 | |
UniCredit SpA (Italy), | | | | | | | | | | | | |
Sr. Preferred Notes, 144A, MTN | | 4.625 | | 04/12/27 | | | 2,250 | | | | 2,218,921 | |
Wells Fargo & Co., | | | | | | | | | | | | |
Sr. Unsec’d. Notes | | 6.303(ff) | | 10/23/29 | | | 15,865 | | | | 16,493,315 | |
Sr. Unsec’d. Notes, MTN | | 3.196(ff) | | 06/17/27 | | | 12,330 | | | | 12,042,779 | |
Sr. Unsec’d. Notes, MTN | | 5.198(ff) | | 01/23/30 | | | 54,840 | | | | 55,021,177 | |
Sr. Unsec’d. Notes, MTN | | 5.574(ff) | | 07/25/29 | | | 25,945 | | | | 26,328,511 | |
| | | | | | | | | | | | |
| | | | |
| | | | | | | | | | | 1,883,607,939 | |
| | | | |
Beverages 0.4% | | | | | | | | | | | | |
| | | | |
Bacardi Ltd. (Bermuda), | | | | | | | | | | | | |
Gtd. Notes, 144A | | 2.750 | | 07/15/26 | | | 25,340 | | | | 24,433,667 | |
JDE Peet’s NV (Netherlands), | | | | | | | | | | | | |
Gtd. Notes, 144A | | 1.375 | | 01/15/27 | | | 4,894 | | | | 4,530,192 | |
| | | | | | | | | | | | |
| | | | |
| | | | | | | | | | | 28,963,859 | |
See Notes to Financial Statements.
PGIM Short-Term Corporate Bond Fund 9
Schedule of Investments (continued)
as of December 31, 2024
| | | | | | | | | | | | |
| | | | |
| Description | | Interest
Rate | | Maturity
Date | | Principal
Amount
(000)# | | | Value | |
| | | | |
CORPORATE BONDS (Continued) | | | | | | | | | | | | |
| | | | |
Biotechnology 0.1% | | | | | | | | | | | | |
| | | | |
Amgen, Inc., | | | | | | | | | | | | |
Sr. Unsec’d. Notes(a) | | 5.150% | | 03/02/28 | | | 6,515 | | | $ | 6,562,560 | |
| | | | |
Building Materials 0.8% | | | | | | | | | | | | |
| | | | |
CRH SMW Finance DAC, | | | | | | | | | | | | |
Gtd. Notes | | 5.200 | | 05/21/29 | | | 29,000 | | | | 29,185,797 | |
Lennox International, Inc., | | | | | | | | | | | | |
Gtd. Notes | | 5.500 | | 09/15/28 | | | 14,760 | | | | 14,999,083 | |
Macmillan Bloedel Pembroke LP (Canada), | | | | | | | | | | | | |
Sr. Unsec’d. Notes | | 7.700 | | 02/15/26 | | | 3,000 | | | | 3,090,106 | |
Owens Corning, | | | | | | | | | | | | |
Sr. Unsec’d. Notes | | 3.400 | | 08/15/26 | | | 18,329 | | | | 17,931,898 | |
Sr. Unsec’d. Notes | | 5.500 | | 06/15/27 | | | 4,375 | | | | 4,451,395 | |
| | | | | | | | | | | | |
| | | | |
| | | | | | | | | | | 69,658,279 | |
| | | | |
Chemicals 1.9% | | | | | | | | | | | | |
| | | | |
Celanese US Holdings LLC, | | | | | | | | | | | | |
Gtd. Notes | | 6.600 | | 11/15/28 | | | 13,000 | | | | 13,303,208 | |
CF Industries, Inc., | | | | | | | | | | | | |
Gtd. Notes, 144A | | 4.500 | | 12/01/26 | | | 33,450 | | | | 33,119,647 | |
Chevron Phillips Chemical Co. LLC/Chevron Phillips
Chemical Co. LP, | | | | | | | | | | | | |
Sr. Unsec’d. Notes, 144A | | 3.400 | | 12/01/26 | | | 19,417 | | | | 18,950,512 | |
DuPont de Nemours, Inc., | | | | | | | | | | | | |
Sr. Unsec’d. Notes | | 4.725 | | 11/15/28 | | | 49,115 | | | | 48,895,348 | |
EIDP, Inc., | | | | | | | | | | | | |
Sr. Unsec’d. Notes | | 4.500 | | 05/15/26 | | | 9,490 | | | | 9,479,193 | |
FMC Corp., | | | | | | | | | | | | |
Sr. Unsec’d. Notes | | 3.200 | | 10/01/26 | | | 3,728 | | | | 3,619,930 | |
Sr. Unsec’d. Notes | | 5.150 | | 05/18/26 | | | 12,810 | | | | 12,824,752 | |
LYB Finance Co. BV (Netherlands), | | | | | | | | | | | | |
Gtd. Notes, 144A | | 8.100 | | 03/15/27 | | | 1,008 | | | | 1,060,200 | |
Yara International ASA (Brazil), | | | | | | | | | | | | |
Sr. Unsec’d. Notes, 144A | | 3.148 | | 06/04/30 | | | 11,000 | | | | 9,802,870 | |
Sr. Unsec’d. Notes, 144A | | 4.750 | | 06/01/28 | | | 6,840 | | | | 6,725,225 | |
| | | | | | | | | | | | |
| | | | |
| | | | | | | | | | | 157,780,885 | |
| | | | |
Commercial Services 0.9% | | | | | | | | | | | | |
| | | | |
Ashtead Capital, Inc. (United Kingdom), | | | | | | | | | | | | |
Gtd. Notes, 144A(a) | | 1.500 | | 08/12/26 | | | 33,760 | | | | 31,881,415 | |
See Notes to Financial Statements.
10
| | | | | | | | | | | | |
| | | | |
| Description | | Interest
Rate | | Maturity
Date | | Principal
Amount
(000)# | | | Value | |
| | | | |
CORPORATE BONDS (Continued) | | | | | | | | | | | | |
| | | | |
Commercial Services (cont’d.) | | | | | | | | | | | | |
| | | | |
Equifax, Inc., | | | | | | | | | | | | |
Sr. Unsec’d. Notes | | 2.600% | | 12/15/25 | | | 10,900 | | | $ | 10,673,656 | |
ERAC USA Finance LLC, | | | | | | | | | | | | |
Gtd. Notes, 144A | | 3.300 | | 12/01/26 | | | 9,230 | | | | 8,991,352 | |
Gtd. Notes, 144A | | 4.600 | | 05/01/28 | | | 19,140 | | | | 19,000,810 | |
Quanta Services, Inc., | | | | | | | | | | | | |
Sr. Unsec’d. Notes | | 4.750 | | 08/09/27 | | | 1,730 | | | | 1,727,087 | |
Verisk Analytics, Inc., | | | | | | | | | | | | |
Sr. Unsec’d. Notes | | 4.000 | | 06/15/25 | | | 2,412 | | | | 2,400,623 | |
| | | | | | | | | | | | |
| | | | |
| | | | | | | | | | | 74,674,943 | |
| | | | |
Computers 0.8% | | | | | | | | | | | | |
| | | | |
Genpact Luxembourg Sarl/Genpact USA, Inc., | | | | | | | | | | | | |
Gtd. Notes | | 1.750 | | 04/10/26 | | | 18,395 | | | | 17,631,146 | |
Gtd. Notes | | 6.000 | | 06/04/29 | | | 365 | | | | 372,211 | |
Leidos, Inc., | | | | | | | | | | | | |
Gtd. Notes | | 3.625 | | 05/15/25 | | | 20,780 | | | | 20,676,641 | |
Gtd. Notes | | 4.375 | | 05/15/30 | | | 12,590 | | | | 12,039,767 | |
NetApp, Inc., | | | | | | | | | | | | |
Sr. Unsec’d. Notes | | 1.875 | | 06/22/25 | | | 10,742 | | | | 10,579,097 | |
Teledyne FLIR LLC, | | | | | | | | | | | | |
Sr. Unsec’d. Notes | | 2.500 | | 08/01/30 | | | 2,381 | | | | 2,081,249 | |
| | | | | | | | | | | | |
| | | | |
| | | | | | | | | | | 63,380,111 | |
| | | | |
Distribution/Wholesale 0.1% | | | | | | | | | | | | |
| | | | |
Ferguson Finance PLC, | | | | | | | | | | | | |
Sr. Unsec’d. Notes, 144A | | 4.250 | | 04/20/27 | | | 12,105 | | | | 11,846,909 | |
| | | | |
Diversified Financial Services 2.6% | | | | | | | | | | | | |
| | | | |
Ally Financial, Inc., | | | | | | | | | | | | |
Sr. Unsec’d. Notes | | 5.543(ff) | | 01/17/31 | | | 6,685 | | | | 6,588,149 | |
American Express Co., | | | | | | | | | | | | |
Jr. Sub. Notes | | 3.550(ff) | | 09/15/26(oo) | | | 16,080 | | | | 15,364,095 | |
Cantor Fitzgerald LP, | | | | | | | | | | | | |
Sr. Unsec’d. Notes, 144A(a) | | 4.500 | | 04/14/27 | | | 30,625 | | | | 29,986,046 | |
Sr. Unsec’d. Notes, 144A | | 7.200 | | 12/12/28 | | | 5,415 | | | | 5,658,931 | |
Capital One Financial Corp., | | | | | | | | | | | | |
Sr. Unsec’d. Notes | | 6.312(ff) | | 06/08/29 | | | 19,800 | | | | 20,451,770 | |
Sr. Unsec’d. Notes | | 7.624(ff) | | 10/30/31 | | | 7,105 | | | | 7,838,661 | |
See Notes to Financial Statements.
PGIM Short-Term Corporate Bond Fund 11
Schedule of Investments (continued)
as of December 31, 2024
| | | | | | | | | | | | |
| | | | |
| Description | | Interest
Rate | | Maturity
Date | | Principal
Amount
(000)# | | | Value | |
| | | | |
CORPORATE BONDS (Continued) | | | | | | | | | | | | |
| | | | |
Diversified Financial Services (cont’d.) | | | | | | | | | | | | |
| | | | |
Jefferies Financial Group, Inc., | | | | | | | | | | | | |
Sr. Unsec’d. Notes | | 5.875% | | 07/21/28 | | | 13,570 | | | $ | 13,873,344 | |
LPL Holdings, Inc., | | | | | | | | | | | | |
Gtd. Notes(a) | | 6.750 | | 11/17/28 | | | 39,652 | | | | 41,662,853 | |
LSEG US Fin Corp. (United Kingdom), | | | | | | | | | | | | |
Gtd. Notes, 144A(a) | | 4.875 | | 03/28/27 | | | 5,340 | | | | 5,337,591 | |
Nomura Holdings, Inc. (Japan), | | | | | | | | | | | | |
Sr. Unsec’d. Notes | | 1.653 | | 07/14/26 | | | 16,975 | | | | 16,144,668 | |
Sr. Unsec’d. Notes | | 2.172 | | 07/14/28 | | | 6,100 | | | | 5,517,596 | |
Sr. Unsec’d. Notes | | 2.329 | | 01/22/27 | | | 39,725 | | | | 37,621,200 | |
Nuveen LLC, | | | | | | | | | | | | |
Sr. Unsec’d. Notes, 144A | | 5.550 | | 01/15/30 | | | 2,845 | | | | 2,896,126 | |
Western Union Co. (The), | | | | | | | | | | | | |
Sr. Unsec’d. Notes(a) | | 1.350 | | 03/15/26 | | | 10,595 | | | | 10,134,333 | |
| | | | | | | | | | | | |
| | | | |
| | | | | | | | | | | 219,075,363 | |
| | | | |
Electric 7.4% | | | | | | | | | | | | |
| | | | |
AEP Texas, Inc., | | | | | | | | | | | | |
Sr. Unsec’d. Notes | | 5.450 | | 05/15/29 | | | 7,355 | | | | 7,454,876 | |
Algonquin Power & Utilities Corp. (Canada), | | | | | | | | | | | | |
Sr. Unsec’d. Notes | | 5.365 | | 06/15/26 | | | 10,345 | | | | 10,396,725 | |
Alliant Energy Finance LLC, | | | | | | | | | | | | |
Gtd. Notes, 144A | | 1.400 | | 03/15/26 | | | 18,650 | | | | 17,839,477 | |
Gtd. Notes, 144A | | 5.400 | | 06/06/27 | | | 9,595 | | | | 9,656,989 | |
Ameren Corp., | | | | | | | | | | | | |
Sr. Unsec’d. Notes | | 1.750 | | 03/15/28 | | | 18,710 | | | | 16,928,370 | |
American Electric Power Co., Inc., | | | | | | | | | | | | |
Jr. Sub. Notes | | 5.699 | | 08/15/25 | | | 14,580 | | | | 14,643,180 | |
Avangrid, Inc., | | | | | | | | | | | | |
Sr. Unsec’d. Notes | | 3.200 | | 04/15/25 | | | 14,245 | | | | 14,169,303 | |
Calpine Corp., | | | | | | | | | | | | |
Sr. Unsec’d. Notes, 144A | | 5.125 | | 03/15/28 | | | 8,000 | | | | 7,758,163 | |
CenterPoint Energy Houston Electric LLC, | | | | | | | | | | | | |
General Ref. Mortgage(a) | | 5.200 | | 10/01/28 | | | 13,640 | | | | 13,802,318 | |
CenterPoint Energy, Inc., | | | | | | | | | | | | |
Sr. Unsec’d. Notes | | 1.450 | | 06/01/26 | | | 24,160 | | | | 23,073,990 | |
Sr. Unsec’d. Notes | | 2.950 | | 03/01/30 | | | 6,519 | | | | 5,859,805 | |
Cleveland Electric Illuminating Co. (The), | | | | | | | | | | | | |
Sr. Unsec’d. Notes, 144A | | 3.500 | | 04/01/28 | | | 5,000 | | | | 4,758,985 | |
Sr. Unsec’d. Notes, 144A | | 4.550 | | 11/15/30 | | | 4,665 | | | | 4,492,672 | |
See Notes to Financial Statements.
12
| | | | | | | | | | | | | | | | |
| | | | | |
| Description | | Interest Rate | | | | | Maturity
Date | | Principal Amount (000)# | | | Value | |
| | | | | |
CORPORATE BONDS (Continued) | | | | | | | | | | | | | | | | |
| | | | | |
Electric (cont’d.) | | | | | | | | | | | | | | | | |
| | | | | |
CMS Energy Corp., | | | | | | | | | | | | | | | | |
Sr. Unsec’d. Notes | | 2.950% | | | | | | 02/15/27 | | | 2,445 | | | $ | 2,350,690 | |
Constellation Energy Generation LLC, | | | | | | | | | | | | | | | | |
Sr. Unsec’d. Notes | | 5.600 | | | | | | 03/01/28 | | | 5,798 | | | | 5,912,558 | |
DTE Energy Co., | | | | | | | | | | | | | | | | |
Sr. Unsec’d. Notes(a) | | 4.950 | | | | | | 07/01/27 | | | 8,080 | | | | 8,111,348 | |
Sr. Unsec’d. Notes | | 5.100 | | | | | | 03/01/29 | | | 2,820 | | | | 2,826,285 | |
Duke Energy Corp., | | | | | | | | | | | | | | | | |
Jr. Sub. Notes | | 3.250(ff) | | | | | | 01/15/82 | | | 23,430 | | | | 21,845,073 | |
Sr. Unsec’d. Notes | | 3.100 | | | | | | 06/15/28 | | EUR | 13,425 | | | | 13,931,561 | |
Edison International, | | | | | | | | | | | | | | | | |
Sr. Unsec’d. Notes | | 4.700 | | | | | | 08/15/25 | | | 15,000 | | | | 14,969,671 | |
Sr. Unsec’d. Notes | | 5.250 | | | | | | 11/15/28 | | | 9,355 | | | | 9,371,262 | |
Enel Finance International NV (Italy), | | | | | | | | | | | | | | | | |
Gtd. Notes, 144A | | 1.625 | | | | | | 07/12/26 | | | 11,300 | | | | 10,750,067 | |
Sr. Unsec’d. Notes, 144A | | 4.500 | | | | | | 06/15/25 | | | 4,700 | | | | 4,681,130 | |
Evergy Missouri West, Inc., | | | | | | | | | | | | | | | | |
First Mortgage, 144A | | 5.150 | | | | | | 12/15/27 | | | 12,220 | | | | 12,288,140 | |
FirstEnergy Pennsylvania Electric Co., | | | | | | | | | | | | | | | | |
Sr. Unsec’d. Notes, 144A | | 5.150 | | | | | | 03/30/26 | | | 7,026 | | | | 7,043,141 | |
Sr. Unsec’d. Notes, 144A | | 5.200 | | | | | | 04/01/28 | | | 26,650 | | | | 26,758,907 | |
FirstEnergy Transmission LLC, | | | | | | | | | | | | | | | | |
Sr. Unsec’d. Notes, 144A | | 2.866 | | | | | | 09/15/28 | | | 7,375 | | | | 6,829,875 | |
Fortis, Inc. (Canada), | | | | | | | | | | | | | | | | |
Sr. Unsec’d. Notes | | 3.055 | | | | | | 10/04/26 | | | 28,000 | | | | 27,101,878 | |
National Grid USA, | | | | | | | | | | | | | | | | |
Sr. Unsec’d. Notes | | 8.000 | | | | | | 11/15/30 | | | 9,000 | | | | 10,106,548 | |
NextEra Energy Capital Holdings, Inc., | | | | | | | | | | | | | | | | |
Gtd. Notes | | 4.900 | | | | | | 02/28/28 | | | 24,775 | | | | 24,796,094 | |
Gtd. Notes | | 5.749 | | | | | | 09/01/25 | | | 11,573 | | | | 11,641,046 | |
OGE Energy Corp., | | | | | | | | | | | | | | | | |
Sr. Unsec’d. Notes | | 5.450 | | | | | | 05/15/29 | | | 6,570 | | | | 6,668,497 | |
Pacific Gas & Electric Co., | | | | | | | | | | | | | | | | |
First Mortgage(a) | | 3.000 | | | | | | 06/15/28 | | | 12,000 | | | | 11,246,599 | |
First Mortgage | | 5.550 | | | | | | 05/15/29 | | | 35,380 | | | | 35,953,179 | |
PacifiCorp, | | | | | | | | | | | | | | | | |
First Mortgage | | 5.100 | | | | | | 02/15/29 | | | 13,750 | | | | 13,827,675 | |
PG&E Corp., | | | | | | | | | | | | | | | | |
Jr. Sub. Notes(a) | | 7.375(ff) | | | | | | 03/15/55 | | | 7,420 | | | | 7,609,104 | |
Pinnacle West Capital Corp., | | | | | | | | | | | | | | | | |
Sr. Unsec’d. Notes(a) | | 1.300 | | | | | | 06/15/25 | | | 27,312 | | | | 26,854,253 | |
See Notes to Financial Statements.
PGIM Short-Term Corporate Bond Fund 13
Schedule of Investments (continued)
as of December 31, 2024
| | | | | | | | | | | | |
| | | | |
| Description | | Interest
Rate | | Maturity
Date | | Principal
Amount
(000)# | | | Value | |
| | | | |
CORPORATE BONDS (Continued) | | | | | | | | | | | | |
| | | | |
Electric (cont’d.) | | | | | | | | | | | | |
| | | | |
Public Service Enterprise Group, Inc., | | | | | | | | | | | | |
Sr. Unsec’d. Notes | | 0.800% | | 08/15/25 | | | 16,823 | | | $ | 16,411,168 | |
SCE Recovery Funding LLC, | | | | | | | | | | | | |
Sr. Sec’d. Notes, Series A-1 | | 0.861 | | 11/15/33 | | | 2,688 | | | | 2,335,819 | |
Sempra, | | | | | | | | | | | | |
Jr. Sub. Notes | | 4.125(ff) | | 04/01/52 | | | 20,635 | | | | 19,761,824 | |
Sr. Unsec’d. Notes | | 5.400 | | 08/01/26 | | | 14,285 | | | | 14,403,223 | |
Southern California Edison Co., | | | | | | | | | | | | |
First Mortgage | | 5.300 | | 03/01/28 | | | 11,535 | | | | 11,679,688 | |
First Mortgage | | 5.450 | | 06/01/31 | | | 5,635 | | | | 5,724,636 | |
Southern Co. (The), | | | | | | | | | | | | |
Sr. Unsec’d. Notes, Series 21-B | | 1.750 | | 03/15/28 | | | 8,625 | | | | 7,824,764 | |
Virginia Power Fuel Securitization LLC, | | | | | | | | | | | | |
Sr. Sec’d. Notes, Series A-2 | | 4.877 | | 05/01/33 | | | 17,069 | | | | 17,053,293 | |
Vistra Operations Co. LLC, | | | | | | | | | | | | |
Gtd. Notes, 144A | | 5.000 | | 07/31/27 | | | 2,271 | | | | 2,227,635 | |
Sr. Sec’d. Notes, 144A | | 3.700 | | 01/30/27 | | | 32,711 | | | | 31,834,450 | |
Xcel Energy, Inc., | | | | | | | | | | | | |
Sr. Unsec’d. Notes | | 1.750 | | 03/15/27 | | | 11,540 | | | | 10,802,938 | |
| | | | | | | | | | | | |
| | | | |
| | | | | | | | | | | 614,368,872 | |
| | | | |
Electronics 0.2% | | | | | | | | | | | | |
| | | | |
Fortive Corp., | | | | | | | | | | | | |
Sr. Unsec’d. Notes | | 3.150 | | 06/15/26 | | | 19,766 | | | | 19,320,030 | |
| | | | |
Engineering & Construction 0.6% | | | | | | | | | | | | |
| | | | |
Jacobs Engineering Group, Inc., | | | | | | | | | | | | |
Gtd. Notes | | 6.350 | | 08/18/28 | | | 24,090 | | | | 25,060,924 | |
MasTec, Inc., | | | | | | | | | | | | |
Sr. Unsec’d. Notes | | 5.900 | | 06/15/29 | | | 7,625 | | | | 7,754,465 | |
Mexico City Airport Trust (Mexico), | | | | | | | | | | | | |
Sr. Sec’d. Notes, 144A | | 3.875 | | 04/30/28 | | | 5,065 | | | | 4,745,297 | |
Sr. Sec’d. Notes, 144A | | 4.250 | | 10/31/26 | | | 15,125 | | | | 14,747,177 | |
| | | | | | | | | | | | |
| | | | |
| | | | | | | | | | | 52,307,863 | |
| | | | |
Entertainment 0.4% | | | | | | | | | | | | |
| | | | |
Warnermedia Holdings, Inc., | | | | | | | | | | | | |
Gtd. Notes | | 3.755 | | 03/15/27 | | | 24,010 | | | | 23,133,840 | |
Gtd. Notes | | 4.054 | | 03/15/29 | | | 13,100 | | | | 12,187,086 | |
| | | | | | | | | | | | |
| | | | |
| | | | | | | | | | | 35,320,926 | |
See Notes to Financial Statements.
14
| | | | | | | | | | | | |
| | | | |
| Description | | Interest
Rate | | Maturity
Date | | Principal
Amount
(000)# | | | Value | |
| | | | |
CORPORATE BONDS (Continued) | | | | | | | | | | | | |
| | | | |
Foods 0.8% | | | | | | | | | | | | |
| | | | |
Bimbo Bakeries USA, Inc. (Mexico), | | | | | | | | | | | | |
Gtd. Notes, 144A | | 6.050% | | 01/15/29 | | | 5,125 | | | $ | 5,230,421 | |
JBS USA Holding Lux Sarl/JBS USA Food Co./JBS Lux Co. Sarl, | | | | | | | | | | | | |
Gtd. Notes | | 3.000 | | 02/02/29 | | | 18,510 | | | | 16,886,914 | |
Smithfield Foods, Inc., | | | | | | | | | | | | |
Gtd. Notes, 144A | | 4.250 | | 02/01/27 | | | 4,750 | | | | 4,645,664 | |
Sr. Unsec’d. Notes, 144A | | 2.625 | | 09/13/31 | | | 8,590 | | | | 7,056,614 | |
Sr. Unsec’d. Notes, 144A | | 3.000 | | 10/15/30 | | | 3,850 | | | | 3,328,091 | |
Sr. Unsec’d. Notes, 144A | | 5.200 | | 04/01/29 | | | 1,750 | | | | 1,711,851 | |
The Campbell’s Co., | | | | | | | | | | | | |
Sr. Unsec’d. Notes | | 5.200 | | 03/21/29 | | | 20,000 | | | | 20,166,064 | |
Tyson Foods, Inc., | | | | | | | | | | | | |
Sr. Unsec’d. Notes | | 5.400 | | 03/15/29 | | | 9,450 | | | | 9,556,772 | |
| | | | | | | | | | | | |
| | | | |
| | | | | | | | | | | 68,582,391 | |
| | | | |
Forest Products & Paper 0.1% | | | | | | | | | | | | |
| | | | |
Smurfit Kappa Treasury Funding DAC (Ireland), | | | | | | | | | | | | |
Gtd. Notes | | 7.500 | | 11/20/25 | | | 3,902 | | | | 3,981,839 | |
| | | | |
Gas 0.5% | | | | | | | | | | | | |
| | | | |
AmeriGas Partners LP/AmeriGas Finance Corp., | | | | | | | | | | | | |
Sr. Unsec’d. Notes | | 5.500 | | 05/20/25 | | | 4,113 | | | | 4,094,314 | |
Sr. Unsec’d. Notes | | 5.875 | | 08/20/26 | | | 4,950 | | | | 4,780,484 | |
NiSource, Inc., | | | | | | | | | | | | |
Sr. Unsec’d. Notes | | 5.200 | | 07/01/29 | | | 8,940 | | | | 9,004,558 | |
ONE Gas, Inc., | | | | | | | | | | | | |
Sr. Unsec’d. Notes | | 5.100 | | 04/01/29 | | | 10,960 | | | | 11,036,611 | |
Piedmont Natural Gas Co., Inc., | | | | | | | | | | | | |
Sr. Unsec’d. Notes | | 3.500 | | 06/01/29 | | | 16,551 | | | | 15,597,195 | |
| | | | | | | | | | | | |
| | | | |
| | | | | | | | | | | 44,513,162 | |
| | | | |
Hand/Machine Tools 0.3% | | | | | | | | | | | | |
| | | | |
Regal Rexnord Corp., | | | | | | | | | | | | |
Gtd. Notes | | 6.050 | | 02/15/26 | | | 2,916 | | | | 2,942,707 | |
Gtd. Notes | | 6.050 | | 04/15/28 | | | 25,000 | | | | 25,442,617 | |
| | | | | | | | | | | | |
| | | | |
| | | | | | | | | | | 28,385,324 | |
See Notes to Financial Statements.
PGIM Short-Term Corporate Bond Fund 15
Schedule of Investments (continued)
as of December 31, 2024
| | | | | | | | | | | | |
| | | | |
| Description | | Interest
Rate | | Maturity
Date | | Principal
Amount
(000)# | | | Value | |
| | | | |
CORPORATE BONDS (Continued) | | | | | | | | | | | | |
| | | | |
Healthcare-Products 0.7% | | | | | | | | | | | | |
| | | | |
Koninklijke Philips NV (Netherlands), | | | | | | | | | | | | |
Sr. Unsec’d. Notes | | 7.200% | | 06/01/26 | | | 15,000 | | | $ | 15,470,655 | |
Solventum Corp., | | | | | | | | | | | | |
Gtd. Notes, 144A | | 5.400 | | 03/01/29 | | | 16,735 | | | | 16,785,459 | |
Gtd. Notes, 144A | | 5.450 | | 02/25/27 | | | 17,580 | | | | 17,736,678 | |
Stryker Corp., | | | | | | | | | | | | |
Sr. Unsec’d. Notes | | 4.250 | | 09/11/29 | | | 9,700 | | | | 9,436,614 | |
| | | | | | | | | | | | |
| | | | |
| | | | | | | | | | | 59,429,406 | |
| | | | |
Healthcare-Services 3.6% | | | | | | | | | | | | |
| | | | |
Advocate Health & Hospitals Corp., | | | | | | | | | | | | |
Unsec’d. Notes, Series 2020 | | 2.211 | | 06/15/30 | | | 1,702 | | | | 1,482,638 | |
Bon Secours Mercy Health, Inc., | | | | | | | | | | | | |
Sec’d. Notes | | 1.350 | | 06/01/25 | | | 2,775 | | | | 2,720,333 | |
Cedars-Sinai Health System, | | | | | | | | | | | | |
Sec’d. Notes, Series 2021 | | 2.288 | | 08/15/31 | | | 5,821 | | | | 4,893,364 | |
Centene Corp., | | | | | | | | | | | | |
Sr. Unsec’d. Notes | | 2.450 | | 07/15/28 | | | 10,000 | | | | 9,011,367 | |
Sr. Unsec’d. Notes | | 3.375 | | 02/15/30 | | | 20,988 | | | | 18,697,302 | |
Cigna Group (The), | | | | | | | | | | | | |
Gtd. Notes | | 3.400 | | 03/01/27 | | | 28,034 | | | | 27,256,553 | |
CommonSpirit Health, | | | | | | | | | | | | |
Sr. Sec’d. Notes | | 5.205 | | 12/01/31 | | | 24,265 | | | | 24,175,189 | |
Elevance Health, Inc., | | | | | | | | | | | | |
Sr. Unsec’d. Notes | | 2.875 | | 09/15/29 | | | 15,390 | | | | 13,996,541 | |
Health Care Service Corp. A Mutual Legal Reserve Co., | | | | | | | | | | | | |
Sr. Unsec’d. Notes, 144A | | 1.500 | | 06/01/25 | | | 5,370 | | | | 5,285,382 | |
Sr. Unsec’d. Notes, 144A | | 5.200 | | 06/15/29 | | | 12,087 | | | | 12,135,595 | |
Icon Investments Six DAC, | | | | | | | | | | | | |
Sr. Sec’d. Notes | | 5.809 | | 05/08/27 | | | 7,735 | | | | 7,860,187 | |
Sr. Sec’d. Notes | | 5.849 | | 05/08/29 | | | 8,025 | | | | 8,165,883 | |
IQVIA, Inc., | | | | | | | | | | | | |
Sr. Sec’d. Notes | | 5.700 | | 05/15/28 | | | 19,795 | | | | 20,040,584 | |
Sr. Sec’d. Notes | | 6.250 | | 02/01/29 | | | 17,415 | | | | 17,989,237 | |
Laboratory Corp. of America Holdings, | | | | | | | | | | | | |
Gtd. Notes | | 4.350 | | 04/01/30 | | | 14,675 | | | | 14,150,997 | |
PeaceHealth Obligated Group, | | | | | | | | | | | | |
Sr. Unsec’d. Notes, Series 2020 | | 1.375 | | 11/15/25 | | | 4,585 | | | | 4,444,132 | |
Roche Holdings, Inc., | | | | | | | | | | | | |
Gtd. Notes, 144A(a) | | 4.909 | | 03/08/31 | | | 10,000 | | | | 9,977,163 | |
See Notes to Financial Statements.
16
| | | | | | | | | | | | |
| | | | |
| Description | | Interest
Rate | | Maturity
Date | | Principal
Amount
(000)# | | | Value | |
| | | | |
CORPORATE BONDS (Continued) | | | | | | | | | | | | |
| | | | |
Healthcare-Services (cont’d.) | | | | | | | | | | | | |
| | | | |
UnitedHealth Group, Inc., | | | | | | | | | | | | |
Sr. Unsec’d. Notes | | 2.300% | | 05/15/31 | | | 17,455 | | | $ | 14,843,194 | |
Sr. Unsec’d. Notes(a) | | 4.250 | | 01/15/29 | | | 50,510 | | | | 49,508,707 | |
Sr. Unsec’d. Notes(a) | | 4.800 | | 01/15/30 | | | 14,750 | | | | 14,680,692 | |
Sr. Unsec’d. Notes | | 4.900 | | 04/15/31 | | | 12,650 | | | | 12,583,364 | |
| | | | | | | | | | | | |
| | | | |
| | | | | | | | | | | 293,898,404 | |
| | | | |
Home Builders 0.4% | | | | | | | | | | | | |
| | | | |
Meritage Homes Corp., | | | | | | | | | | | | |
Gtd. Notes | | 5.125 | | 06/06/27 | | | 9,987 | | | | 10,014,688 | |
Toll Brothers Finance Corp., | | | | | | | | | | | | |
Gtd. Notes(a) | | 4.350 | | 02/15/28 | | | 10,000 | | | | 9,780,101 | |
Gtd. Notes | | 4.875 | | 03/15/27 | | | 15,635 | | | | 15,616,880 | |
| | | | | | | | | | | | |
| | | | |
| | | | | | | | | | | 35,411,669 | |
| | | | |
Household Products/Wares 0.3% | | | | | | | | | | | | |
| | | | |
Reckitt Benckiser Treasury Services PLC (United Kingdom), | | | | | | | | | | | | |
Gtd. Notes, 144A | | 3.000 | | 06/26/27 | | | 23,730 | | | | 22,718,034 | |
| | | | |
Insurance 2.5% | | | | | | | | | | | | |
| | | | |
Arthur J Gallagher & Co., | | | | | | | | | | | | |
Sr. Unsec’d. Notes | | 4.600 | | 12/15/27 | | | 12,600 | | | | 12,550,546 | |
CNA Financial Corp., | | | | | | | | | | | | |
Sr. Unsec’d. Notes | | 3.450 | | 08/15/27 | | | 5,155 | | | | 4,983,482 | |
Corebridge Financial, Inc., | | | | | | | | | | | | |
Sr. Unsec’d. Notes(a) | | 3.500 | | 04/04/25 | | | 10,510 | | | | 10,473,683 | |
Sr. Unsec’d. Notes | | 3.650 | | 04/05/27 | | | 9,435 | | | | 9,168,736 | |
Corebridge Global Funding, | | | | | | | | | | | | |
Sec’d. Notes, 144A | | 4.650 | | 08/20/27 | | | 10,785 | | | | 10,740,224 | |
Sec’d. Notes, 144A(a) | | 4.900 | | 12/03/29 | | | 12,455 | | | | 12,370,496 | |
Fairfax Financial Holdings Ltd. (Canada), | | | | | | | | | | | | |
Sr. Unsec’d. Notes | | 3.375 | | 03/03/31 | | | 2,452 | | | | 2,186,053 | |
Sr. Unsec’d. Notes | | 4.625 | | 04/29/30 | | | 21,300 | | | | 20,723,648 | |
Great-West Lifeco US Finance 2020 LP (Canada), | | | | | | | | | | | | |
Gtd. Notes, 144A | | 0.904 | | 08/12/25 | | | 12,200 | | | | 11,904,045 | |
Marsh & McLennan Cos., Inc., | | | | | | | | | | | | |
Sr. Unsec’d. Notes | | 4.650 | | 03/15/30 | | | 19,600 | | | | 19,362,316 | |
Principal Life Global Funding II, | | | | | | | | | | | | |
Sec’d. Notes, 144A, MTN(a) | | 5.500 | | 06/28/28 | | | 19,750 | | | | 19,981,591 | |
Sr. Sec’d. Notes, 144A | | 0.875 | | 01/12/26 | | | 22,970 | | | | 22,076,835 | |
See Notes to Financial Statements.
PGIM Short-Term Corporate Bond Fund 17
Schedule of Investments (continued)
as of December 31, 2024
| | | | | | | | | | | | |
| | | | |
| Description | | Interest
Rate | | Maturity
Date | | Principal
Amount
(000)# | | | Value | |
| | | | |
CORPORATE BONDS (Continued) | | | | | | | | | | | | |
| | | | |
Insurance (cont’d.) | | | | | | | | | | | | |
| | | | |
Principal Life Global Funding II, (cont’d.) | | | | | | | | | | | | |
Sr. Sec’d. Notes, 144A | | 3.000% | | 04/18/26 | | | 6,001 | | | $ | 5,873,915 | |
Protective Life Global Funding, | | | | | | | | | | | | |
Sec’d. Notes, 144A | | 4.335 | | 09/13/27 | | | 3,500 | | | | 3,463,195 | |
Sec’d. Notes, 144A | | 5.209 | | 04/14/26 | | | 29,250 | | | | 29,409,486 | |
Sec’d. Notes, 144A | | 5.467 | | 12/08/28 | | | 6,005 | | | | 6,101,232 | |
Unum Group, | | | | | | | | | | | | |
Sr. Unsec’d. Notes | | 7.250 | | 03/15/28 | | | 4,171 | | | | 4,421,802 | |
| | | | | | | | | | | | |
| | | | |
| | | | | | | | | | | 205,791,285 | |
| | | | |
Internet 0.2% | | | | | | | | | | | | |
| | | | |
Expedia Group, Inc., | | | | | | | | | | | | |
Gtd. Notes | | 4.625 | | 08/01/27 | | | 14,500 | | | | 14,441,573 | |
| | | | |
Iron/Steel 0.1% | | | | | | | | | | | | |
| | | | |
Reliance, Inc., | | | | | | | | | | | | |
Sr. Unsec’d. Notes | | 1.300 | | 08/15/25 | | | 9,130 | | | | 8,921,024 | |
| | | | |
Lodging 0.8% | | | | | | | | | | | | |
| | | | |
Hyatt Hotels Corp., | | | | | | | | | | | | |
Sr. Unsec’d. Notes | | 5.375 | | 12/15/31 | | | 18,000 | | | | 17,916,826 | |
Sr. Unsec’d. Notes | | 5.750 | | 01/30/27 | | | 9,180 | | | | 9,321,545 | |
Marriott International, Inc., | | | | | | | | | | | | |
Sr. Unsec’d. Notes | | 4.875 | | 05/15/29 | | | 1,193 | | | | 1,188,335 | |
Sr. Unsec’d. Notes | | 5.550 | | 10/15/28 | | | 30,640 | | | | 31,299,232 | |
Sr. Unsec’d. Notes, Series EE | | 5.750 | | 05/01/25 | | | 4,344 | | | | 4,352,102 | |
| | | | | | | | | | | | |
| | | | |
| | | | | | | | | | | 64,078,040 | |
| | | | |
Machinery-Construction & Mining 0.3% | | | | | | | | | | | | |
| | | | |
Weir Group PLC (The) (United Kingdom), | | | | | | | | | | | | |
Sr. Unsec’d. Notes, 144A | | 2.200 | | 05/13/26 | | | 28,970 | | | | 27,852,963 | |
| | | | |
Machinery-Diversified 1.0% | | | | | | | | | | | | |
| | | | |
AGCO Corp., | | | | | | | | | | | | |
Gtd. Notes | | 5.450 | | 03/21/27 | | | 4,455 | | | | 4,497,232 | |
CNH Industrial Capital LLC, | | | | | | | | | | | | |
Gtd. Notes | | 3.950 | | 05/23/25 | | | 1,564 | | | | 1,558,040 | |
Gtd. Notes | | 4.550 | | 04/10/28 | | | 11,795 | | | | 11,628,037 | |
Gtd. Notes | | 5.100 | | 04/20/29 | | | 10,500 | | | | 10,494,257 | |
Gtd. Notes | | 5.500 | | 01/12/29 | | | 17,980 | | | | 18,237,873 | |
See Notes to Financial Statements.
18
| | | | | | | | | | | | |
| | | | |
| Description | | Interest
Rate | | Maturity
Date | | Principal
Amount
(000)# | | | Value | |
| | | | |
CORPORATE BONDS (Continued) | | | | | | | | | | | | |
| | | | |
Machinery-Diversified (cont’d.) | | | | | | | | | | | | |
| | | | |
Ingersoll Rand, Inc., | | | | | | | | | | | | |
Sr. Unsec’d. Notes | | 5.400% | | 08/14/28 | | | 3,585 | | | $ | 3,643,617 | |
Westinghouse Air Brake Technologies Corp., | | | | | | | | | | | | |
Gtd. Notes | | 3.200 | | 06/15/25 | | | 4,000 | | | | 3,964,660 | |
Gtd. Notes | | 3.450 | | 11/15/26 | | | 25,396 | | | | 24,765,508 | |
| | | | | | | | | | | | |
| | | | |
| | | | | | | | | | | 78,789,224 | |
| | | | |
Media 1.2% | | | | | | | | | | | | |
| | | | |
Charter Communications Operating LLC/Charter
Communications Operating Capital, | | | | | | | | | | | | |
Sr. Sec’d. Notes | | 2.250 | | 01/15/29 | | | 24,025 | | | | 21,178,553 | |
Sr. Sec’d. Notes | | 4.908 | | 07/23/25 | | | 5,130 | | | | 5,122,814 | |
Comcast Corp., | | | | | | | | | | | | |
Gtd. Notes(a) | | 4.550 | | 01/15/29 | | | 22,875 | | | | 22,647,134 | |
Cox Communications, Inc., | | | | | | | | | | | | |
Gtd. Notes, 144A | | 1.800 | | 10/01/30 | | | 3,250 | | | | 2,676,580 | |
Sr. Unsec’d. Notes, 144A | | 3.350 | | 09/15/26 | | | 13,683 | | | | 13,367,359 | |
Sr. Unsec’d. Notes, 144A | | 3.850 | | 02/01/25 | | | 3,500 | | | | 3,496,407 | |
Discovery Communications LLC, | | | | | | | | | | | | |
Gtd. Notes | | 3.625 | | 05/15/30 | | | 5,962 | | | | 5,302,252 | |
Gtd. Notes | | 4.125 | | 05/15/29 | | | 21,568 | | | | 20,115,973 | |
Warner Media LLC, | | | | | | | | | | | | |
Gtd. Notes | | 2.950 | | 07/15/26 | | | 5,000 | | | | 4,790,933 | |
| | | | | | | | | | | | |
| | | | |
| | | | | | | | | | | 98,698,005 | |
| | | | |
Mining 1.4% | | | | | | | | | | | | |
| | | | |
Freeport Indonesia PT (Indonesia), | | | | | | | | | | | | |
Sr. Unsec’d. Notes, 144A, MTN | | 4.763 | | 04/14/27 | | | 23,245 | | | | 23,012,550 | |
Freeport Minerals Corp., | | | | | | | | | | | | |
Gtd. Notes | | 9.500 | | 06/01/31 | | | 5,000 | | | | 6,016,460 | |
Freeport-McMoRan, Inc., | | | | | | | | | | | | |
Gtd. Notes | | 4.125 | | 03/01/28 | | | 4,700 | | | | 4,567,714 | |
Gtd. Notes | | 4.375 | | 08/01/28 | | | 40,964 | | | | 39,832,800 | |
Newmont Corp./Newcrest Finance Pty Ltd., | | | | | | | | | | | | |
Gtd. Notes | | 3.250 | | 05/13/30 | | | 32,020 | | | | 29,408,678 | |
Rio Tinto Finance USA Ltd. (Australia), | | | | | | | | | | | | |
Gtd. Notes | | 7.125 | | 07/15/28 | | | 12,837 | | | | 13,757,155 | |
Yamana Gold, Inc. (Canada), | | | | | | | | | | | | |
Gtd. Notes | | 4.625 | | 12/15/27 | | | 1,925 | | | | 1,889,707 | |
| | | | | | | | | | | | |
| | | | |
| | | | | | | | | | | 118,485,064 | |
See Notes to Financial Statements.
PGIM Short-Term Corporate Bond Fund 19
Schedule of Investments (continued)
as of December 31, 2024
| | | | | | | | | | | | |
| | | | |
| Description | | Interest
Rate | | Maturity
Date | | Principal
Amount
(000)# | | | Value | |
| | | | |
CORPORATE BONDS (Continued) | | | | | | | | | | | | |
| | | | |
Miscellaneous Manufacturing 0.5% | | | | | | | | | | | | |
| | | | |
Hillenbrand, Inc., | | | | | | | | | | | | |
Gtd. Notes | | 5.000% | | 09/15/26 | | | 16,150 | | | $ | 16,017,049 | |
Teledyne Technologies, Inc., | | | | | | | | | | | | |
Gtd. Notes | | 2.250 | | 04/01/28 | | | 31,611 | | | | 29,077,943 | |
| | | | | | | | | | | | |
| | | | |
| | | | | | | | | | | 45,094,992 | |
| | | | |
Office/Business Equipment 0.5% | | | | | | | | | | | | |
| | | | |
CDW LLC/CDW Finance Corp., | | | | | | | | | | | | |
Gtd. Notes | | 2.670 | | 12/01/26 | | | 29,790 | | | | 28,571,552 | |
Gtd. Notes(a) | | 3.276 | | 12/01/28 | | | 9,800 | | | | 9,135,434 | |
Gtd. Notes | | 5.100 | | 03/01/30 | | | 3,250 | | | | 3,205,250 | |
| | | | | | | | | | | | |
| | | | |
| | | | | | | | | | | 40,912,236 | |
| | | | |
Oil & Gas 3.4% | | | | | | | | | | | | |
| | | | |
Aker BP ASA (Norway), | | | | | | | | | | | | |
Sr. Unsec’d. Notes, 144A(a) | | 4.000 | | 01/15/31 | | | 5,000 | | | | 4,597,557 | |
Sr. Unsec’d. Notes, 144A | | 5.600 | | 06/13/28 | | | 6,735 | | | | 6,816,806 | |
Burlington Resources LLC, | | | | | | | | | | | | |
Gtd. Notes | | 7.200 | | 08/15/31 | | | 6,900 | | | | 7,651,603 | |
Canadian Natural Resources Ltd. (Canada), | | | | | | | | | | | | |
Sr. Unsec’d. Notes, 144A(a) | | 5.000 | | 12/15/29 | | | 8,125 | | | | 8,035,136 | |
Continental Resources, Inc., | | | | | | | | | | | | |
Gtd. Notes, 144A | | 2.268 | | 11/15/26 | | | 5,875 | | | | 5,566,853 | |
Devon Energy Corp., | | | | | | | | | | | | |
Sr. Unsec’d. Notes | | 5.250 | | 10/15/27 | | | 22,365 | | | | 22,384,093 | |
Diamondback Energy, Inc., | | | | | | | | | | | | |
Gtd. Notes | | 3.250 | | 12/01/26 | | | 7,050 | | | | 6,864,514 | |
Gtd. Notes | | 5.150 | | 01/30/30 | | | 24,905 | | | | 24,953,736 | |
Hess Corp., | | | | | | | | | | | | |
Sr. Unsec’d. Notes | | 4.300 | | 04/01/27 | | | 44,486 | | | | 44,039,777 | |
Sr. Unsec’d. Notes | | 7.300 | | 08/15/31 | | | 12,250 | | | | 13,604,415 | |
Marathon Petroleum Corp., | | | | | | | | | | | | |
Sr. Unsec’d. Notes | | 3.800 | | 04/01/28 | | | 7,265 | | | | 7,015,750 | |
Occidental Petroleum Corp., | | | | | | | | | | | | |
Sr. Unsec’d. Notes | | 3.200 | | 08/15/26 | | | 6,726 | | | | 6,519,706 | |
Sr. Unsec’d. Notes | | 6.625 | | 09/01/30 | | | 2,355 | | | | 2,465,945 | |
Sr. Unsec’d. Notes | | 7.500 | | 10/15/26 | | | 9,578 | | | | 9,918,848 | |
Ovintiv, Inc., | | | | | | | | | | | | |
Gtd. Notes | | 5.650 | | 05/15/25 | | | 19,480 | | | | 19,520,515 | |
See Notes to Financial Statements.
20
| | | | | | | | | | | | |
| | | | |
| Description | | Interest
Rate | | Maturity
Date | | Principal
Amount
(000)# | | | Value | |
| | | | |
CORPORATE BONDS (Continued) | | | | | | | | | | | | |
| | | | |
Oil & Gas (cont’d.) | | | | | | | | | | | | |
| | | | |
Permian Resources Operating LLC, | | | | | | | | | | | | |
Gtd. Notes, 144A | | 6.250% | | 02/01/33 | | | 7,810 | | | $ | 7,711,323 | |
Phillips 66 Co., | | | | | | | | | | | | |
Gtd. Notes | | 3.750 | | 03/01/28 | | | 12,095 | | | | 11,708,803 | |
Gtd. Notes | | 4.950 | | 12/01/27 | | | 10,835 | | | | 10,923,757 | |
Pioneer Natural Resources Co., | | | | | | | | | | | | |
Gtd. Notes(a) | | 7.200 | | 01/15/28 | | | 6,176 | | | | 6,593,183 | |
Sr. Unsec’d. Notes | | 2.150 | | 01/15/31 | | | 9,072 | | | | 7,704,092 | |
Sr. Unsec’d. Notes | | 5.100 | | 03/29/26 | | | 8,225 | | | | 8,279,349 | |
Var Energi ASA (Norway), | | | | | | | | | | | | |
Sr. Unsec’d. Notes, 144A | | 7.500 | | 01/15/28 | | | 38,250 | | | | 40,381,340 | |
| | | | | | | | | | | | |
| | | | |
| | | | | | | | | | | 283,257,101 | |
| | | | |
Oil & Gas Services 0.3% | | | | | | | | | | | | |
| | | | |
Schlumberger Holdings Corp., | | | | | | | | | | | | |
Sr. Unsec’d. Notes, 144A | | 5.000 | | 11/15/29 | | | 21,080 | | | | 21,125,609 | |
| | | | |
Packaging & Containers 1.2% | | | | | | | | | | | | |
| | | | |
Berry Global, Inc., | | | | | | | | | | | | |
Sr. Sec’d. Notes | | 1.570 | | 01/15/26 | | | 28,607 | | | | 27,608,129 | |
Sr. Sec’d. Notes, 144A(a) | | 5.800 | | 06/15/31 | | | 15,200 | | | | 15,483,345 | |
Sealed Air Corp., | | | | | | | | | | | | |
Sr. Sec’d. Notes, 144A | | 1.573 | | 10/15/26 | | | 12,875 | | | | 12,115,006 | |
Silgan Holdings, Inc., | | | | | | | | | | | | |
Sr. Sec’d. Notes, 144A | | 1.400 | | 04/01/26 | | | 11,575 | | | | 11,038,398 | |
Smurfit Kappa Treasury ULC (Ireland), | | | | | | | | | | | | |
Gtd. Notes, 144A | | 5.200 | | 01/15/30 | | | 26,700 | | | | 26,755,637 | |
WRKCo, Inc., | | | | | | | | | | | | |
Gtd. Notes | | 3.375 | | 09/15/27 | | | 4,950 | | | | 4,765,193 | |
Gtd. Notes | | 3.750 | | 03/15/25 | | | 5,190 | | | | 5,174,498 | |
| | | | | | | | | | | | |
| | | | |
| | | | | | | | | | | 102,940,206 | |
| | | | |
Pharmaceuticals 1.7% | | | | | | | | | | | | |
| | | | |
AbbVie, Inc., | | | | | | | | | | | | |
Sr. Unsec’d. Notes | | 4.800 | | 03/15/29 | | | 14,535 | | | | 14,523,826 | |
Allergan Funding SCS, | | | | | | | | | | | | |
Gtd. Notes | | 3.800 | | 03/15/25 | | | 13,136 | | | | 13,103,010 | |
Bayer US Finance II LLC (Germany), | | | | | | | | | | | | |
Gtd. Notes, 144A | | 4.375 | | 12/15/28 | | | 35,986 | | | | 34,500,174 | |
See Notes to Financial Statements.
PGIM Short-Term Corporate Bond Fund 21
Schedule of Investments (continued)
as of December 31, 2024
| | | | | | | | | | | | |
| | | | |
| Description | | Interest
Rate | | Maturity
Date | | Principal
Amount
(000)# | | | Value | |
| | | | |
CORPORATE BONDS (Continued) | | | | | | | | | | | | |
| | | | |
Pharmaceuticals (cont’d.) | | | | | | | | | | | | |
| | | | |
Bayer US Finance LLC (Germany), | | | | | | | | | | | | |
Gtd. Notes, 144A(a) | | 6.125% | | 11/21/26 | | | 12,150 | | | $ | 12,371,753 | |
Gtd. Notes, 144A(a) | | 6.250 | | 01/21/29 | | | 9,300 | | | | 9,495,362 | |
CVS Health Corp., | | | | | | | | | | | | |
Jr. Sub. Notes | | 7.000(ff) | | 03/10/55 | | | 15,560 | | | | 15,620,892 | |
Sr. Unsec’d. Notes | | 1.750 | | 08/21/30 | | | 10,000 | | | | 8,144,828 | |
Sr. Unsec’d. Notes | | 1.875 | | 02/28/31 | | | 9,887 | | | | 7,975,764 | |
Sr. Unsec’d. Notes | | 5.000 | | 01/30/29 | | | 2,185 | | | | 2,155,393 | |
Utah Acquisition Sub, Inc., | | | | | | | | | | | | |
Gtd. Notes | | 3.950 | | 06/15/26 | | | 13,226 | | | | 13,028,459 | |
Viatris, Inc., | | | | | | | | | | | | |
Gtd. Notes | | 2.700 | | 06/22/30 | | | 10,735 | | | | 9,311,063 | |
| | | | | | | | | | | | |
| | | | |
| | | | | | | | | | | 140,230,524 | |
| | | | |
Pipelines 3.7% | | | | | | | | | | | | |
| | | | |
Columbia Pipelines Operating Co. LLC, | | | | | | | | | | | | |
Sr. Unsec’d. Notes, 144A | | 5.927 | | 08/15/30 | | | 5,650 | | | | 5,816,730 | |
Enbridge, Inc. (Canada), | | | | | | | | | | | | |
Gtd. Notes | | 5.300 | | 04/05/29 | | | 12,800 | | | | 12,883,607 | |
Gtd. Notes | | 6.000 | | 11/15/28 | | | 16,420 | | | | 16,972,150 | |
Energy Transfer LP, | | | | | | | | | | | | |
Gtd. Notes | | 5.250 | | 04/15/29 | | | 7,305 | | | | 7,332,766 | |
Gtd. Notes, 144A | | 6.000 | | 02/01/29 | | | 7,453 | | | | 7,561,313 | |
Jr. Sub. Notes, Series G | | 7.125(ff) | | 05/15/30(oo) | | | 12,892 | | | | 12,992,152 | |
Sr. Unsec’d. Notes | | 4.950 | | 06/15/28 | | | 10,179 | | | | 10,162,067 | |
Sr. Unsec’d. Notes | | 5.250 | | 07/01/29 | | | 8,800 | | | | 8,844,096 | |
Sr. Unsec’d. Notes | | 5.550 | | 02/15/28 | | | 2,559 | | | | 2,598,997 | |
Sr. Unsec’d. Notes | | 6.400 | | 12/01/30 | | | 20,305 | | | | 21,439,453 | |
EnLink Midstream LLC, | | | | | | | | | | | | |
Gtd. Notes | | 5.375 | | 06/01/29 | | | 6,085 | | | | 6,081,029 | |
Gtd. Notes, 144A(a) | | 6.500 | | 09/01/30 | | | 5,000 | | | | 5,234,045 | |
Enterprise Products Operating LLC, | | | | | | | | | | | | |
Gtd. Notes, 3 Month SOFR + 3.039% | | 7.538(c) | | 06/01/67 | | | 22,233 | | | | 22,131,120 | |
Gtd. Notes, Series D, 3 Month SOFR + 3.248% | | 7.733(c) | | 08/16/77 | | | 5,970 | | | | 5,941,969 | |
MPLX LP, | | | | | | | | | | | | |
Sr. Unsec’d. Notes | | 1.750 | | 03/01/26 | | | 13,761 | | | | 13,290,668 | |
Sr. Unsec’d. Notes | | 4.125 | | 03/01/27 | | | 6,570 | | | | 6,473,526 | |
Sr. Unsec’d. Notes | | 4.250 | | 12/01/27 | | | 5,034 | | | | 4,957,545 | |
ONEOK, Inc., | | | | | | | | | | | | |
Gtd. Notes | | 4.550 | | 07/15/28 | | | 6,000 | | | | 5,911,772 | |
Gtd. Notes | | 5.550 | | 11/01/26 | | | 11,145 | | | | 11,282,923 | |
Gtd. Notes | | 5.650 | | 11/01/28 | | | 9,015 | | | | 9,201,551 | |
See Notes to Financial Statements.
22
| | | | | | | | | | | | |
| | | | |
| Description | | Interest
Rate | | Maturity
Date | | Principal
Amount
(000)# | | | Value | |
| | | | |
CORPORATE BONDS (Continued) | | | | | | | | | | | | |
| | | | |
Pipelines (cont’d.) | | | | | | | | | | | | |
| | | | |
ONEOK, Inc., (cont’d.) | | | | | | | | | | | | |
Gtd. Notes | | 5.850% | | 01/15/26 | | | 7,610 | | | $ | 7,679,354 | |
Sr. Unsec’d. Notes | | 5.000 | | 03/01/26 | | | 6,000 | | | | 6,007,349 | |
Rockies Express Pipeline LLC, | | | | | | | | | | | | |
Sr. Unsec’d. Notes, 144A | | 3.600 | | 05/15/25 | | | 12,970 | | | | 12,841,207 | |
Targa Resources Corp., | | | | | | | | | | | | |
Gtd. Notes | | 6.150 | | 03/01/29 | | | 18,893 | | | | 19,601,714 | |
Tennessee Gas Pipeline Co. LLC, | | | | | | | | | | | | |
Gtd. Notes | | 7.000 | | 03/15/27 | | | 3,575 | | | | 3,729,305 | |
Transcontinental Gas Pipe Line Co. LLC, | | | | | | | | | | | | |
Sr. Unsec’d. Notes | | 7.250 | | 12/01/26 | | | 4,705 | | | | 4,894,779 | |
Western Midstream Operating LP, | | | | | | | | | | | | |
Sr. Unsec’d. Notes | | 4.500 | | 03/01/28 | | | 11,230 | | | | 10,992,626 | |
Sr. Unsec’d. Notes | | 4.650 | | 07/01/26 | | | 3,000 | | | | 2,986,339 | |
Sr. Unsec’d. Notes | | 4.750 | | 08/15/28 | | | 2,653 | | | | 2,604,918 | |
Sr. Unsec’d. Notes | | 6.350 | | 01/15/29 | | | 11,540 | | | | 11,952,664 | |
Williams Cos., Inc. (The), | | | | | | | | | | | | |
Sr. Unsec’d. Notes | | 4.900 | | 03/15/29 | | | 4,525 | | | | 4,491,040 | |
Sr. Unsec’d. Notes | | 5.400 | | 03/02/26 | | | 23,745 | | | | 23,910,290 | |
| | | | | | | | | | | | |
| | | | |
| | | | | | | | | | | 308,801,064 | |
| | | | |
Real Estate 0.4% | | | | | | | | | | | | |
| | | | |
Ontario Teachers’ Cadillac Fairview Properties Trust (Canada), | | | | | | | | | | | | |
Sr. Unsec’d. Notes, 144A | | 2.500 | | 10/15/31 | | | 11,996 | | | | 9,974,612 | |
Sr. Unsec’d. Notes, 144A | | 3.875 | | 03/20/27 | | | 14,558 | | | | 14,186,885 | |
Sr. Unsec’d. Notes, 144A | | 4.125 | | 02/01/29 | | | 11,678 | | | | 11,212,198 | |
| | | | | | | | | | | | |
| | | | |
| | | | | | | | | | | 35,373,695 | |
| | | | |
Real Estate Investment Trusts (REITs) 3.9% | | | | | | | | | | | | |
| | | | |
American Tower Corp., | | | | | | | | | | | | |
Sr. Unsec’d. Notes | | 3.800 | | 08/15/29 | | | 8,105 | | | | 7,674,800 | |
Sr. Unsec’d. Notes | | 3.950 | | 03/15/29 | | | 5,100 | | | | 4,885,956 | |
Sr. Unsec’d. Notes | | 5.800 | | 11/15/28 | | | 8,025 | | | | 8,231,539 | |
Brandywine Operating Partnership LP, | | | | | | | | | | | | |
Gtd. Notes(a) | | 3.950 | | 11/15/27 | | | 7,738 | | | | 7,340,159 | |
Brixmor Operating Partnership LP, | | | | | | | | | | | | |
Sr. Unsec’d. Notes | | 2.250 | | 04/01/28 | | | 26,313 | | | | 24,055,892 | |
Broadstone Net Lease LLC, | | | | | | | | | | | | |
Gtd. Notes | | 2.600 | | 09/15/31 | | | 4,206 | | | | 3,478,591 | |
See Notes to Financial Statements.
PGIM Short-Term Corporate Bond Fund 23
Schedule of Investments (continued)
as of December 31, 2024
| | | | | | | | | | | | |
| | | | |
| Description | | Interest
Rate | | Maturity
Date | | Principal
Amount
(000)# | | | Value | |
| | | | |
CORPORATE BONDS (Continued) | | | | | | | | | | | | |
| | | | |
Real Estate Investment Trusts (REITs) (cont’d.) | | | | | | | | | | | | |
| | | | |
COPT Defense Properties LP, | | | | | | | | | | | | |
Gtd. Notes | | 2.250% | | 03/15/26 | | | 6,860 | | | $ | 6,638,213 | |
Crown Castle, Inc., | | | | | | | | | | | | |
Sr. Unsec’d. Notes(a) | | 2.250 | | 01/15/31 | | | 13,500 | | | | 11,340,876 | |
Sr. Unsec’d. Notes | | 5.600 | | 06/01/29 | | | 12,495 | | | | 12,735,784 | |
Essex Portfolio LP, | | | | | | | | | | | | |
Gtd. Notes | | 1.700 | | 03/01/28 | | | 27,550 | | | | 24,901,186 | |
GLP Capital LP/GLP Financing II, Inc., | | | | | | | | | | | | |
Gtd. Notes | | 5.250 | | 06/01/25 | | | 28,802 | | | | 28,751,112 | |
Gtd. Notes | | 5.375 | | 04/15/26 | | | 12,355 | | | | 12,366,858 | |
Host Hotels & Resorts LP, | | | | | | | | | | | | |
Sr. Unsec’d. Notes, Series F | | 4.500 | | 02/01/26 | | | 4,000 | | | | 3,977,579 | |
Sr. Unsec’d. Notes, Series H | | 3.375 | | 12/15/29 | | | 1,750 | | | | 1,601,343 | |
Invitation Homes Operating Partnership LP, | | | | | | | | | | | | |
Gtd. Notes | | 2.300 | | 11/15/28 | | | 11,657 | | | | 10,519,698 | |
Gtd. Notes | | 5.450 | | 08/15/30 | | | 9,559 | | | | 9,682,948 | |
Kimco Realty OP LLC, | | | | | | | | | | | | |
Gtd. Notes | | 1.900 | | 03/01/28 | | | 25,310 | | | | 23,124,017 | |
Prologis LP, | | | | | | | | | | | | |
Sr. Unsec’d. Notes | | 4.875 | | 06/15/28 | | | 11,690 | | | | 11,721,244 | |
Realty Income Corp., | | | | | | | | | | | | |
Gtd. Notes | | 3.400 | | 01/15/30 | | | 4,500 | | | | 4,183,057 | |
Sr. Unsec’d. Notes | | 2.100 | | 03/15/28 | | | 14,165 | | | | 13,019,794 | |
Sr. Unsec’d. Notes(a) | | 2.200 | | 06/15/28 | | | 11,225 | | | | 10,264,767 | |
Sr. Unsec’d. Notes | | 3.400 | | 01/15/28 | | | 19,483 | | | | 18,687,487 | |
Sr. Unsec’d. Notes | | 4.700 | | 12/15/28 | | | 9,985 | | | | 9,927,053 | |
Sabra Health Care LP, | | | | | | | | | | | | |
Gtd. Notes | | 5.125 | | 08/15/26 | | | 8,950 | | | | 8,950,850 | |
Sun Communities Operating LP, | | | | | | | | | | | | |
Gtd. Notes | | 2.300 | | 11/01/28 | | | 7,705 | | | | 6,946,573 | |
Gtd. Notes | | 5.500 | | 01/15/29 | | | 15,737 | | | | 15,833,810 | |
VICI Properties LP/VICI Note Co., Inc., | | | | | | | | | | | | |
Gtd. Notes, 144A | | 4.500 | | 09/01/26 | | | 2,924 | | | | 2,893,022 | |
Gtd. Notes, 144A | | 5.750 | | 02/01/27 | | | 18,971 | | | | 19,138,904 | |
WP Carey, Inc., | | | | | | | | | | | | |
Sr. Unsec’d. Notes(a) | | 4.250 | | 10/01/26 | | | 2,261 | | | | 2,237,053 | |
| | | | | | | | | | | | |
| | | | |
| | | | | | | | | | | 325,110,165 | |
| | | | |
Retail 0.5% | | | | | | | | | | | | |
| | | | |
Alimentation Couche-Tard, Inc. (Canada), | | | | | | | | | | | | |
Gtd. Notes, 144A | | 3.550 | | 07/26/27 | | | 28,202 | | | | 27,258,522 | |
See Notes to Financial Statements.
24
| | | | | | | | | | | | |
| | | | |
| Description | | Interest
Rate | | Maturity
Date | | Principal
Amount (000)# | | | Value | |
| | | | |
CORPORATE BONDS (Continued) | | | | | | | | | | | | |
| | | | |
Retail (cont’d.) | | | | | | | | | | | | |
| | | | |
Alimentation Couche-Tard, Inc. (Canada), (cont’d.) | | | | | | | | | | | | |
Sr. Unsec’d. Notes, 144A | | 2.950% | | 01/25/30 | | | 9,075 | | | $ | 8,175,175 | |
AutoNation, Inc., | | | | | | | | | | | | |
Sr. Unsec’d. Notes | | 1.950 | | 08/01/28 | | | 9,000 | | | | 8,069,975 | |
| | | | | | | | | | | | |
| | | | |
| | | | | | | | | | | 43,503,672 | |
| | | | |
Semiconductors 0.9% | | | | | | | | | | | | |
| | | | |
Broadcom, Inc., | | | | | | | | | | | | |
Gtd. Notes, 144A | | 2.450 | | 02/15/31 | | | 15,700 | | | | 13,548,054 | |
Sr. Unsec’d. Notes | | 4.150 | | 02/15/28 | | | 24,250 | | | | 23,843,175 | |
Sr. Unsec’d. Notes | | 4.550 | | 02/15/32 | | | 2,480 | | | | 2,397,838 | |
Sr. Unsec’d. Notes | | 5.150 | | 11/15/31 | | | 15,525 | | | | 15,625,424 | |
Marvell Technology, Inc., | | | | | | | | | | | | |
Sr. Unsec’d. Notes | | 5.750 | | 02/15/29 | | | 8,385 | | | | 8,596,445 | |
Microchip Technology, Inc., | | | | | | | | | | | | |
Gtd. Notes | | 4.900 | | 03/15/28 | | | 7,895 | | | | 7,868,028 | |
| | | | | | | | | | | | |
| | | | |
| | | | | | | | | | | 71,878,964 | |
| | | | |
Shipbuilding 0.1% | | | | | | | | | | | | |
| | | | |
Huntington Ingalls Industries, Inc., | | | | | | | | | | | | |
Gtd. Notes | | 5.353 | | 01/15/30 | | | 6,190 | | | | 6,200,580 | |
| | | | |
Software 0.9% | | | | | | | | | | | | |
| | | | |
Activision Blizzard, Inc., | | | | | | | | | | | | |
Sr. Unsec’d. Notes | | 3.400 | | 06/15/27 | | | 4,600 | | | | 4,341,680 | |
AppLovin Corp., | | | | | | | | | | | | |
Sr. Unsec’d. Notes | | 5.125 | | 12/01/29 | | | 17,690 | | | | 17,635,646 | |
Fidelity National Information Services, Inc., | | | | | | | | | | | | |
Sr. Unsec’d. Notes | | 1.150 | | 03/01/26 | | | 10,190 | | | | 9,774,138 | |
Sr. Unsec’d. Notes | | 1.650 | | 03/01/28 | | | 4,285 | | | | 3,875,892 | |
Fiserv, Inc., | | | | | | | | | | | | |
Sr. Unsec’d. Notes | | 5.375 | | 08/21/28 | | | 5,398 | | | | 5,471,073 | |
Sr. Unsec’d. Notes | | 5.450 | | 03/02/28 | | | 13,929 | | | | 14,146,887 | |
Infor, Inc., | | | | | | | | | | | | |
Sr. Unsec’d. Notes, 144A | | 1.750 | | 07/15/25 | | | 6,934 | | | | 6,790,996 | |
Oracle Corp., | | | | | | | | | | | | |
Sr. Unsec’d. Notes | | 6.150 | | 11/09/29 | | | 9,000 | | | | 9,435,867 | |
| | | | | | | | | | | | |
| | | | |
| | | | | | | | | | | 71,472,179 | |
See Notes to Financial Statements.
PGIM Short-Term Corporate Bond Fund 25
Schedule of Investments (continued)
as of December 31, 2024
| | | | | | | | | | | | |
| | | | |
| Description | | Interest
Rate | | Maturity
Date | | Principal
Amount (000)# | | | Value | |
| | | | |
CORPORATE BONDS (Continued) | | | | | | | | | | | | |
| | | | |
Telecommunications 2.7% | | | | | | | | | | | | |
| | | | |
AT&T, Inc., | | | | | | | | | | | | |
Sr. Unsec’d. Notes | | 1.700% | | 03/25/26 | | | 26,550 | | | $ | 25,620,814 | |
Sr. Unsec’d. Notes | | 2.300 | | 06/01/27 | | | 25,645 | | | | 24,210,876 | |
Sr. Unsec’d. Notes(a) | | 4.100 | | 02/15/28 | | | 9,350 | | | | 9,147,714 | |
Deutsche Telekom International Finance BV (Germany), | | | | | | | | | | | | |
Gtd. Notes, 144A | | 4.375 | | 06/21/28 | | | 12,355 | | | | 12,099,328 | |
NBN Co. Ltd. (Australia), | | | | | | | | | | | | |
Sr. Unsec’d. Notes, 144A, MTN | | 4.000 | | 10/01/27 | | | 21,420 | | | | 20,997,103 | |
NTT Finance Corp. (Japan), | | | | | | | | | | | | |
Sr. Unsec’d. Notes, 144A | | 5.110 | | 07/02/29 | | | 20,000 | | | | 20,093,220 | |
Rogers Communications, Inc. (Canada), | | | | | | | | | | | | |
Gtd. Notes | | 5.000 | | 02/15/29 | | | 42,526 | | | | 42,208,637 | |
Sprint LLC, | | | | | | | | | | | | |
Gtd. Notes | | 7.625 | | 03/01/26 | | | 1,905 | | | | 1,948,137 | |
T-Mobile USA, Inc., | | | | | | | | | | | | |
Gtd. Notes | | 2.050 | | 02/15/28 | | | 2,470 | | | | 2,268,493 | |
Gtd. Notes | | 3.750 | | 04/15/27 | | | 44,311 | | | | 43,290,310 | |
Gtd. Notes | | 4.850 | | 01/15/29 | | | 16,010 | | | | 15,925,361 | |
Verizon Communications, Inc., | | | | | | | | | | | | |
Sr. Unsec’d. Notes | | 1.680 | | 10/30/30 | | | 3,900 | | | | 3,244,127 | |
| | | | | | | | | | | | |
| | | | |
| | | | | | | | | | | 221,054,120 | |
| | | | |
Transportation 0.1% | | | | | | | | | | | | |
| | | | |
Ryder System, Inc., | | | | | | | | | | | | |
Sr. Unsec’d. Notes, MTN | | 4.625 | | 06/01/25 | | | 9,455 | | | | 9,435,190 | |
| | | | |
Trucking & Leasing 0.3% | | | | | | | | | | | | |
| | | | |
Penske Truck Leasing Co. LP/PTL Finance Corp., | | | | | | | | | | | | |
Sr. Unsec’d. Notes, 144A | | 1.700 | | 06/15/26 | | | 25,675 | | | | 24,525,630 | |
| | | | | | | | | | | | |
| | | | |
TOTAL CORPORATE BONDS | | | | | | | | | | | | |
(cost $6,964,741,839) | | | | | | | | | | | 6,875,631,600 | |
| | | | | | | | | | | | |
| | | | |
MUNICIPAL BOND 0.3% | | | | | | | | | | | | |
| | | | |
Texas | | | | | | | | | | | | |
| | | | |
Texas Natural Gas Securitization Finance Corp. Revenue,
Taxable, Revenue Bonds, Series 2023-01, Class A1
(cost $21,162,184) | | 5.102 | | 04/01/35 | | | 21,078 | | | | 21,186,341 | |
| | | | | | | | | | | | |
See Notes to Financial Statements.
26
| | | | | | | | | | | | |
| | | | |
| Description | | Interest
Rate | | Maturity
Date | | Principal
Amount (000)# | | | Value | |
| | | | |
U.S. TREASURY OBLIGATIONS(k) 0.6% | | | | | | | | | | | | |
U.S. Treasury Notes | | 1.250% | | 03/31/28 | | | 3,545 | | | $ | 3,220,134 | |
U.S. Treasury Notes | | 1.750 | | 01/31/29 | | | 13,945 | | | | 12,594,078 | |
U.S. Treasury Notes | | 3.500 | | 09/30/26 | | | 1,515 | | | | 1,496,181 | |
U.S. Treasury Notes | | 3.625 | | 08/31/29 | | | 24,385 | | | | 23,617,254 | |
U.S. Treasury Notes | | 4.125 | | 10/31/26 | | | 200 | | | | 199,570 | |
U.S. Treasury Notes | | 4.125 | | 10/31/29 | | | 1,000 | | | | 988,750 | |
U.S. Treasury Notes(h) | | 4.250 | | 11/30/26 | | | 10,260 | | | | 10,259,599 | |
U.S. Treasury Notes | | 4.250 | | 12/31/26 | | | 600 | | | | 600,070 | |
| | | | | | | | | | | | |
| | | | |
TOTAL U.S. TREASURY OBLIGATIONS | | | | | | | | | | | | |
(cost $55,597,018) | | | | | | | | | | | 52,975,636 | |
| | | | | | | | | | | | |
| | | | |
| | | | | | | Shares | | | | |
| | | | |
PREFERRED STOCK 0.1% | | | | | | | | | | | | |
| | | | |
Banks | | | | | | | | | | | | |
| | | | |
Citigroup Capital XIII, 11.221%(c), 3 Month SOFR + 6.632%,
Maturing 10/30/40
(cost $3,342,000) | | | | | | | 132,000 | | | | 3,956,040 | |
| | | | | | | | | | | | |
| | | | |
TOTAL LONG-TERM INVESTMENTS | | | | | | | | | | | | |
(cost $8,181,536,679) | | | | | | | | | | | 8,085,276,001 | |
| | | | | | | | | | | | |
| | | | |
SHORT-TERM INVESTMENTS 3.9% | | | | | | | | | | | | |
| | | | |
AFFILIATED MUTUAL FUNDS 3.9% | | | | | | | | | | | | |
PGIM Core Government Money Market Fund (7-day effective yield 4.604%)(wb) | | | | | | | 212,330,466 | | | | 212,330,466 | |
PGIM Institutional Money Market Fund (7-day effective yield 4.649%)
(cost $110,652,151; includes $110,197,183 of cash collateral for securities on loan)(b)(wb) | | | | | | | 110,718,582 | | | | 110,652,151 | |
| | | | | | | | | | | | |
| | | | |
TOTAL AFFILIATED MUTUAL FUNDS | | | | | | | | | | | | |
(cost $322,982,617) | | | | | | | | | | | 322,982,617 | |
| | | | | | | | | | | | |
| | | | |
OPTION PURCHASED*~ 0.0% | | | | | | | | | | | | |
(cost $1,058,650) | | | | | | | | | | | 630,838 | |
| | | | | | | | | | | | |
| | | | |
TOTAL SHORT-TERM INVESTMENTS | | | | | | | | | | | | |
(cost $324,041,267) | | | | | | | | | | | 323,613,455 | |
| | | | | | | | | | | | |
| | | | |
TOTAL INVESTMENTS, BEFORE OPTIONS WRITTEN 101.4% | | | | | | | | | | | | |
(cost $8,505,577,946) | | | | | | | | | | | 8,408,889,456 | |
| | | | | | | | | | | | |
See Notes to Financial Statements.
PGIM Short-Term Corporate Bond Fund 27
Schedule of Investments (continued)
as of December 31, 2024
| | | | |
| |
| Description | | Value | |
| |
OPTIONS WRITTEN*~ (0.0)% | | | | |
(premiums received $990,350) | | $ | (574,240 | ) |
| | | | |
| |
TOTAL INVESTMENTS, NET OF OPTIONS WRITTEN 101.4% | | | | |
(cost $8,504,587,596) | | | 8,408,315,216 | |
Liabilities in excess of other assets(z) (1.4)% | | | (117,715,073 | ) |
| | | | |
| |
NET ASSETS 100.0% | | $ | 8,290,600,143 | |
| | | | |
Below is a list of the abbreviation(s) used in the annual report:
EUR—Euro
USD—US Dollar
144A—Security was purchased pursuant to Rule 144A under the Securities Act of 1933 and, pursuant to the requirements of Rule 144A, may not be resold except to qualified institutional buyers.
A—Annual payment frequency for swaps
BARC—Barclays Bank PLC
CDX—Credit Derivative Index
CGM—Citigroup Global Markets, Inc.
CLO—Collateralized Loan Obligation
DAC—Designated Activity Company
EMTN—Euro Medium Term Note
GMTN—Global Medium Term Note
GSI—Goldman Sachs International
JPM—JPMorgan Chase Bank N.A.
LP—Limited Partnership
MSI—Morgan Stanley & Co International PLC
MTN—Medium Term Note
N/A—Not Applicable
OTC—Over-the-counter
Q—Quarterly payment frequency for swaps
REITs—Real Estate Investment Trust
SCB—Standard Chartered Bank
SOFR—Secured Overnight Financing Rate
| * | Non-income producing security. |
| # | Principal or notional amount is shown in U.S. dollars unless otherwise stated. |
| ~ | See tables subsequent to the Schedule of Investments for options detail. Options with maturity dates greater than one year from date of acquisition would be considered long-term investments. |
| (a) | All or a portion of security is on loan. The aggregate market value of such securities, including those sold and pending settlement, is $107,997,088; cash collateral of $110,197,183 (included in liabilities) was received with which the Fund purchased highly liquid short-term investments. In the event of significant appreciation in value of securities on loan on the last business day of the reporting period, the Fund may reflect a collateral value that is less than the market value of the loaned securities and such shortfall is remedied the following business day. |
| (b) | Represents security, or portion thereof, purchased with cash collateral received for securities on loan and includes dividend reinvestment. |
| (c) | Variable rate instrument. The interest rate shown reflects the rate in effect at December 31, 2024. |
| (ff) | Variable rate security. Security may be issued at a fixed coupon rate, which converts to a variable rate at a specified date. Rate shown is the rate in effect as of period end. |
| (h) | Represents security, or a portion thereof, segregated as collateral for OTC derivatives. |
| (k) | Represents security, or a portion thereof, segregated as collateral for centrally cleared/exchange-traded derivatives. |
See Notes to Financial Statements.
28
| (oo) | Perpetual security. Maturity date represents next call date. |
| (wb) | Represents an investment in a Fund affiliated with the Manager. |
| (z) | Includes net unrealized appreciation/(depreciation) and/or market value of the below holdings which are excluded from the Schedule of Investments: |
Option Purchased:
OTC Swaptions
| | | | | | | | | | | | | | | | | | | | | | | | | | | | | | | | | | |
Description | | Call/
Put | | Counterparty | | Expiration
Date | | Strike | | Receive | | Pay | | Notional
Amount
(000)# | | Value |
| | | | | | | | |
CDX.NA.IG.43.V1, 12/20/29 | | Put | | JPM | | | | 02/19/25 | | | | | 0.55% | | | |
| CDX.NA.IG.43.
V1(Q) |
| | | | 1.00%(Q) | | | | | 683,000 | | | | $ | 630,838 | |
| | | | | | | | | | | | | | | | | | | | | | | | | | | | | | | | | | |
(cost $1,058,650) | | | | | | | | | | | | | | | | | | | | | | | | | | | | | | | | | | |
Options Written:
OTC Swaptions
| | | | | | | | | | | | | | | | | | | | | | | | | | | | | | | | | | |
Description | | Call/
Put | | Counterparty | | Expiration
Date | | Strike | | Receive | | Pay | | Notional
Amount
(000)# | | Value |
| | | | | | | | |
CDX.NA.IG.43.V1, 12/20/29 | | Call | | JPM | | | | 02/19/25 | | | | | 0.48% | | | |
| CDX.NA.IG.43.
V1(Q) |
| | | | 1.00%(Q) | | | | | 683,000 | | | | $ | (351,457) | |
| | | | | | | | |
CDX.NA.IG.43.V1, 12/20/29 | | Put | | JPM | | | | 02/19/25 | | | | | 0.70% | | | | | 1.00%(Q) | | | |
| CDX.NA.IG.43.
V1(Q) |
| | | | 683,000 | | | | | (222,783) | |
| | | | | | | | | | | | | | | | | | | | | | | | | | | | | | | | | | |
| | | | | |
Total Options Written (premiums received $990,350) | | | | | | | | | | | | | | | | | | | | | | | | $ | (574,240) | |
| | | | | | | | | | | | | | | | | | | | | | | | | | | | | | | | | | |
Futures contracts outstanding at December 31, 2024:
| | | | | | | | | | | | | | | | | | | | | | |
Number
of
Contracts | | Type | | Expiration
Date | | | Current
Notional
Amount | | | Value /
Unrealized
Appreciation
(Depreciation) | |
| | | | |
Long Positions: | | | | | | | | | | | | | | | | | |
1,119 | | 2 Year U.S. Treasury Notes | | | Mar. 2025 | | | $ | 230,076,892 | | | | | | | $ | (348,151 | ) | | | | |
10,982 | | 5 Year U.S. Treasury Notes | | | Mar. 2025 | | | | 1,167,438,106 | | | | | | | | (5,430,816 | ) | | | | |
| | | | | | | | | | | | | | | | | | | | | | |
| | | | | | | | | | | | | | | | | (5,778,967 | ) | | | | |
| | | | | | | | | | | | | | | | | | | | | | |
Short Positions: | | | | | | | | | | | | | | | | | | | | |
2,957 | | 10 Year U.S. Treasury Notes | | | Mar. 2025 | | | | 321,573,750 | | | | | | | | 3,156,414 | | | | | |
28 | | 10 Year U.S. Ultra Treasury Notes | | | Mar. 2025 | | | | 3,116,750 | | | | | | | | 43,711 | | | | | |
18 | | 20 Year U.S. Treasury Bonds | | | Mar. 2025 | | | | 2,049,188 | | | | | | | | 43,883 | | | | | |
32 | | 30 Year U.S. Ultra Treasury Bonds | | | Mar. 2025 | | | | 3,805,000 | | | | | | | | 142,296 | | | | | |
| | | | | | | | | | | | | | | | | | | | | | |
| | | | | | | | | | | | | | | | | 3,386,304 | | | | | |
| | | | | | | | | | | | | | | | | | | | | | |
| | | | | | | | | | | | | | | | $ | (2,392,663 | ) | | | | |
| | | | | | | | | | | | | | | | | | | | | | |
See Notes to Financial Statements.
PGIM Short-Term Corporate Bond Fund 29
Schedule of Investments (continued)
as of December 31, 2024
Forward foreign currency exchange contracts outstanding at December 31, 2024:
| | | | | | | | | | | | | | | | | | | | | | | | | | | | | | | | | | | | | | | | | | | | | | | | | | | | | | | |
| | | | | | | |
Sale
Contracts | | Counterparty | | | | Notional
Amount
(000) | | Value at
Settlement
Date | | Current
Value | | Unrealized
Appreciation | | Unrealized Depreciation |
| | |
OTC Forward Foreign Currency Exchange Contracts: | | | | | | | | | | | |
Euro, | | | | | | | | | | | | | | | | | | | | | | | | | | | | | | | | | | | | | | | | | | | | | | | | | | | | | | | |
Expiring 01/10/25 | | | | SCB | | | | | | | | | | EUR 13,063 | | | | $ | 13,633,373 | | | | $ | 13,537,179 | | | | | | | | | | $96,194 | | | | | | | | | | | | | | $ | — | | | | | | |
| | | | | | | | | | | | | | | | | | | | | | | | | | | | | | | | | | | | | | | | | | | | | | | | | | | | | | | |
Credit default swap agreements outstanding at December 31, 2024:
| | | | | | | | | | | | | | | | | | | | | | | | | | | | | | | | | | | | | | | | |
Reference Entity/ Obligation | | Termination
Date | | Fixed
Rate | | | Notional
Amount
(000)#(3) | | | Implied Credit
Spread at
December 31,
2024(4) | | Value at
Trade Date | | | | | | Value at
December 31,
2024 | | | | | | Unrealized
Appreciation
(Depreciation) | |
Centrally Cleared Credit Default Swap Agreement on corporate and/or sovereign issues - Sell Protection(2): | |
Teck Resources Ltd. | | 06/20/26 | | | 5.000%(Q) | | | | 40,000 | | | 0.279% | | $ | 2,105,228 | | | | | | | | | | | $ | 2,772,315 | | | | | | | | | | | $ | 667,087 | |
| | | | | | | | | | | | | | | | | | | | | | | | | | | | | | | | | | | | | | | | |
| | | | | | | | | | | | | | | | | | | | | | | | | | | | | | | | | | | | | | | | | | |
Reference Entity/ Obligation | | Termination
Date | | Fixed
Rate | | Notional
Amount
(000)#(3) | | Fair
Value | | Upfront
Premiums
Paid
(Received) | | Unrealized
Appreciation
(Depreciation) | | Counterparty |
OTC Credit Default Swap Agreements on corporate and/or sovereign issues - Buy Protection(1): | | | | | | | | |
Host Hotels & Resorts LP | | | | 12/20/25 | | | | | 1.000%(Q) | | | | | 4,250 | | | | $ | (32,656) | | | | $ | 28,001 | | | | | | | | | $ | (60,657) | | | | | | | | GSI |
Imperial Brands Finance PLC | | | | 06/20/27 | | | | | 1.000%(Q) | | | | | EUR 12,600 | | | | | (230,992 | ) | | | | 117,155 | | | | | | | | | | (348,147) | | | | | | | | JPM |
Marriott International, Inc. | | | | 06/20/25 | | | | | 1.000%(Q) | | | | | 3,500 | | | | | (15,621 | ) | | | | 15,149 | | | | | | | | | | (30,770) | | | | | | | | MSI |
| | | | | | | | | | | | | | | | | | | | | | | | | | | | | | | | | | | | | | | | | | |
| | | | | | | | | | | | | | | | | | $ | (279,269) | | | | $ | 160,305 | | | | | | | | | $ | (439,574) | | | | | | | | |
| | | | | | | | | | | | | | | | | | | | | | | | | | | | | | | | | | | | | | | | | | |
| | | | | | | | | | | | | | | | | | | | | | | | | | |
Reference
Entity/
Obligation | | Termination
Date | | | Fixed
Rate | | Notional
Amount
(000)#(3) | | | Implied
Credit
Spread at
December 31,
2024(4) | | | Fair
Value | | | Upfront
Premiums
Paid
(Received) | | | Unrealized
Appreciation
(Depreciation) | | Counterparty |
OTC Credit Default Swap Agreements on corporate and/or sovereign issues - Sell Protection(2): |
Ford Motor Co. | | | 12/20/28 | | | 5.000%(Q) | | | 20,000 | | | | 1.206% | | | $ | 2,767,071 | | | $ | 1,629,692 | | | $ 1,137,379 | | MSI |
Lincoln National Corp. | | | 12/20/29 | | | 1.000%(Q) | | | 15,000 | | | | 1.239% | | | | (152,258) | | | | (296,499) | | | 144,241 | | BARC |
| | | | | | | | | | | | | | | | | | | | | | | | | | |
| | | | | | | | | | | | | | | | $ | 2,614,813 | | | $ | 1,333,193 | | | $ 1,281,620 | | |
| | | | | | | | | | | | | | | | | | | | | | | | | | |
The Fund entered into credit default swaps (“CDS”) to provide a measure of protection against defaults or to take an active long or short position with respect to the likelihood of a particular issuer’s default or the reference entity’s credit soundness.
See Notes to Financial Statements.
30
CDS contracts generally trade based on a spread which represents the cost a protection buyer has to pay the protection seller. The protection buyer is said to be short the credit as the value of the contract rises the more the credit deteriorates. The value of the CDS contract increases for the protection buyer if the spread increases.
| (1) | If the Fund is a buyer of protection, it pays the fixed rate. When a credit event occurs, as defined under the terms of that particular swap agreement, the Fund will either (i) receive from the seller of protection an amount equal to the notional amount of the swap and make delivery of the referenced obligation or underlying securities comprising the referenced index or (ii) receive a net settlement amount in the form of cash or securities equal to the notional amount of the swap less the recovery value of the referenced obligation or underlying securities comprising the referenced index. |
| (2) | If the Fund is a seller of protection, it receives the fixed rate. When a credit event occurs, as defined under the terms of that particular swap agreement, the Fund will either (i) pay to the buyer of protection an amount equal to the notional amount of the swap and take delivery of the referenced obligation or underlying securities comprising the referenced index or (ii) pay a net settlement amount in the form of cash or securities equal to the notional amount of the swap less the recovery value of the referenced obligation or underlying securities comprising the referenced index. |
| (3) | Notional amount represents the maximum potential amount the Fund could be required to pay as a seller of credit protection or receive as a buyer of credit protection if a credit event occurs as defined under the terms of that particular swap agreement. |
| (4) | Implied credit spreads, represented in absolute terms, utilized in determining the fair value of credit default swap agreements where the Fund is the seller of protection as of the reporting date serve as an indicator of the current status of the payment/ performance risk and represent the likelihood of risk of default for the credit derivative. The implied credit spread of a particular referenced entity reflects the cost of buying/selling protection and may include up-front payments required to be made to enter into the agreement. Wider credit spreads represent a deterioration of the referenced entity’s credit soundness and a greater likelihood of risk of default or other credit event occurring as defined under the terms of the agreement. |
Interest rate swap agreements outstanding at December 31, 2024:
| | | | | | | | | | | | | | | | | | | | | | |
Notional
Amount
(000)# | | Termination
Date | | | Fixed
Rate | | | Floating Rate | | Value at
Trade Date | | | Value at
December 31,
2024 | | | Unrealized
Appreciation
(Depreciation) | |
Centrally Cleared Interest Rate Swap Agreements: | |
486,564 | | | 08/03/25 | | | | 4.811%(A) | | | 1 Day SOFR(2)(A)/
4.490% | | $ | — | | | $ | 1,142,631 | | | $ | 1,142,631 | |
707,950 | | | 05/13/27 | | | | 4.497%(A) | | | 1 Day SOFR(2)(A)/
4.490% | | | 172,788 | | | | 3,652,439 | | | | 3,479,651 | |
98,646 | | | 08/15/28 | | | | 1.220%(A) | | | 1 Day SOFR(1)(A)/
4.490% | | | 290,461 | | | | 10,766,561 | | | | 10,476,100 | |
440,900 | | | 05/13/29 | | | | 4.253%(A) | | | 1 Day SOFR(1)(A)/
4.490% | | | (389,047) | | | | (1,032,822 | ) | | | (643,775 | ) |
| | | | | | | | | | | | | | | | | | | | | | |
| | | | | | | | | �� | | | $ | 74,202 | | | $ | 14,528,809 | | | $ | 14,454,607 | |
| | | | | | | | | | | | | | | | | | | | | | |
| (1) | The Fund pays the fixed rate and receives the floating rate. |
| (2) | The Fund pays the floating rate and receives the fixed rate. |
See Notes to Financial Statements.
PGIM Short-Term Corporate Bond Fund 31
Schedule of Investments (continued)
as of December 31, 2024
Balances Reported in the Statement of Assets and Liabilities for OTC Swap Agreements:
| | | | | | | | |
| | | Premiums Paid | | Premiums Received | | Unrealized
Appreciation | | Unrealized
Depreciation |
OTC Swap Agreements | | $1,789,997 | | $(296,499) | | $1,281,620 | | $(439,574) |
Summary of Collateral for Centrally Cleared/Exchange-traded Derivatives:
Cash and securities segregated as collateral, including pending settlement for closed positions, to cover requirements for centrally cleared/exchange-traded derivatives are listed by broker as follows:
| | | | | | | | | | |
Broker | | Cash and/or Foreign Currency | | Securities Market Value |
CGM | | | $ | — | | | | $ | 52,235,978 | |
| | | | | | | | | | |
Fair Value Measurements:
Various inputs are used in determining the value of the Fund’s investments. These inputs are summarized in the three broad levels listed below.
Level 1—unadjusted quoted prices generally in active markets for identical securities.
Level 2—quoted prices for similar securities, interest rates and yield curves, prepayment speeds, foreign currency exchange rates and other observable inputs.
Level 3—unobservable inputs for securities valued in accordance with Board approved fair valuation procedures.
The following is a summary of the inputs used as of December 31, 2024 in valuing such portfolio securities:
| | | | | | | | | | | | | | | | | | | | |
| | | Level 1 | | | Level 2 | | | Level 3 | |
Investments in Securities | | | | | | | | | | | | | | | | | | | | |
Assets | | | | | | | | | | | | | | | | | | | | |
Long-Term Investments | | | | | | | | | | | | | | | | | | | | |
Asset-Backed Securities | | | | | | | | | | | | | | | | | | | | |
Collateralized Loan Obligations | | $ | — | | | $ | 995,085,202 | | | | | | | | $— | | | | | |
Commercial Mortgage-Backed Securities | | | — | | | | 136,441,182 | | | | | | | | — | | | | | |
Corporate Bonds | | | — | | | | 6,875,631,600 | | | | | | | | — | | | | | |
Municipal Bond | | | — | | | | 21,186,341 | | | | | | | | — | | | | | |
U.S. Treasury Obligations | | | — | | | | 52,975,636 | | | | | | | | — | | | | | |
Preferred Stock | | | 3,956,040 | | | | — | | | | | | | | — | | | | | |
Short-Term Investments | | | | | | | | | | | | | | | | | | | | |
Affiliated Mutual Funds | | | 322,982,617 | | | | — | | | | | | | | — | | | | | |
Option Purchased | | | — | | | | 630,838 | | | | | | | | — | | | | | |
| | | | | | | | | | | | | | | | | | | | |
Total | | $ | 326,938,657 | | | $ | 8,081,950,799 | | | | | | | | $— | | | | | |
| | | | | | | | | | | | |
| | | | | |
Liabilities | | | | | | | | | | | | | | | | | | | | |
Options Written | | $ | — | | | $ | (574,240 | ) | | | | | | | $— | | | | | |
| | | | | | | | | | | | |
| | | | | |
Other Financial Instruments* | | | | | | | | | | | | | | | | | | | | |
Assets | | | | | | | | | | | | | | | | | | | | |
Futures Contracts | | $ | 3,386,304 | | | $ | — | | | | | | | | $— | | | | | |
See Notes to Financial Statements.
32
| | | | | | | | | | | | | | | | | | | | |
| | | Level 1 | | | Level 2 | | | Level 3 | |
Other Financial Instruments* (continued) | | | | | | | | | | | | | | | | | | | | |
Assets (continued) | | | | | | | | | | | | | | | | | | | | |
OTC Forward Foreign Currency Exchange Contract | | $ | — | | | $ | 96,194 | | | | | | | | $— | | | | | |
Centrally Cleared Credit Default Swap Agreement | | | — | | | | 667,087 | | | | | | | | — | | | | | |
OTC Credit Default Swap Agreement | | | — | | | | 2,767,071 | | | | | | | | — | | | | | |
Centrally Cleared Interest Rate Swap Agreements | | | — | | | | 15,098,382 | | | | | | | | — | | | | | |
| | | | | | | | | | | | | | | | | | | | |
Total | | $ | 3,386,304 | | | $ | 18,628,734 | | | | | | | | $— | | | | | |
| | | | | | | | | | | | |
| | | | | |
Liabilities | | | | | | | | | | | | | | | | | | | | |
Futures Contracts | | $ | (5,778,967 | ) | | $ | — | | | | | | | | $— | | | | | |
OTC Credit Default Swap Agreements | | | — | | | | (431,527 | ) | | | | | | | — | | | | | |
Centrally Cleared Interest Rate Swap Agreement | | | — | | | | (643,775 | ) | | | | | | | — | | | | | |
| | | | | | | | | | | | | | | | | | | | |
Total | | $ | (5,778,967 | ) | | $ | (1,075,302 | ) | | | | | | | $— | | | | | |
| | | | | | | | | | | | |
| * | Other financial instruments are derivative instruments not reflected in the Schedule of Investments, such as futures, forwards and centrally cleared swap contracts, which are recorded at unrealized appreciation (depreciation) on the instrument, and OTC swap contracts which are recorded at fair value. |
Industry Classification:
The industry classification of investments and liabilities in excess of other assets shown as a percentage of net assets as of December 31, 2024 were as follows:
| | | | |
Banks | | | 22.8 | % |
Collateralized Loan Obligations | | | 12.0 | |
Electric | | | 7.4 | |
Real Estate Investment Trusts (REITs) | | | 3.9 | |
Affiliated Mutual Funds (1.3% represents investments purchased with collateral from securities on loan) | | | 3.9 | |
Pipelines | | | 3.7 | |
Healthcare-Services | | | 3.6 | |
Oil & Gas | | | 3.4 | |
Auto Manufacturers | | | 3.2 | |
Agriculture | | | 2.7 | |
Telecommunications | | | 2.7 | |
Diversified Financial Services | | | 2.6 | |
Insurance | | | 2.5 | |
Chemicals | | | 1.9 | |
Pharmaceuticals | | | 1.7 | |
Commercial Mortgage-Backed Securities | | | 1.6 | |
Aerospace & Defense | | | 1.5 | |
Mining | | | 1.4 | |
Packaging & Containers | | | 1.2 | |
Media | | | 1.2 | |
Machinery-Diversified | | | 1.0 | |
Commercial Services | | | 0.9 | |
Semiconductors | | | 0.9 | |
Software | | | 0.9 | |
Building Materials | | | 0.8 | |
Foods | | | 0.8 | |
Airlines | | | 0.8 | |
Lodging | | | 0.8 | |
| | | | |
Computers | | | 0.8 | % |
Healthcare-Products | | | 0.7 | |
U.S. Treasury Obligations | | | 0.6 | |
Engineering & Construction | | | 0.6 | |
Miscellaneous Manufacturing | | | 0.5 | |
Gas | | | 0.5 | |
Retail | | | 0.5 | |
Office/Business Equipment | | | 0.5 | |
Home Builders | | | 0.4 | |
Real Estate | | | 0.4 | |
Entertainment | | | 0.4 | |
Beverages | | | 0.4 | |
Hand/Machine Tools | | | 0.3 | |
Machinery-Construction & Mining | | | 0.3 | |
Trucking & Leasing | | | 0.3 | |
Household Products/Wares | | | 0.3 | |
Municipal Bond | | | 0.3 | |
Oil & Gas Services | | | 0.3 | |
Apparel | | | 0.3 | |
Electronics | | | 0.2 | |
Auto Parts & Equipment | | | 0.2 | |
Internet | | | 0.2 | |
Distribution/Wholesale | | | 0.1 | |
Transportation | | | 0.1 | |
Iron/Steel | | | 0.1 | |
Biotechnology | | | 0.1 | |
Shipbuilding | | | 0.1 | |
Forest Products & Paper | | | 0.1 | |
See Notes to Financial Statements.
PGIM Short-Term Corporate Bond Fund 33
Schedule of Investments (continued)
as of December 31, 2024
Industry Classification (continued):
| | | | |
Option Purchased | | | 0.0 | *% |
| | | | |
| | | 101.4 | |
Options Written | | | (0.0 | )* |
Liabilities in excess of other assets | | | (1.4 | ) |
| | | | |
| |
| | | 100.0 | % |
| | | | |
Effects of Derivative Instruments on the Financial Statements and Primary Underlying Risk Exposure:
The Fund invested in derivative instruments during the reporting period. The primary types of risk associated with these derivative instruments are credit risk, foreign exchange risk, and interest rate risk. See the Notes to Financial Statements for additional detail regarding these derivative instruments and their risks. The effect of such derivative instruments on the Fund’s financial position and financial performance as reflected in the Statement of Assets and Liabilities and Statement of Operations is presented in the summary below.
Fair values of derivative instruments as of December 31, 2024 as presented in the Statement of Assets and Liabilities:
| | | | | | | | | | | | |
| | | Asset Derivatives | | | Liability Derivatives | |
Derivatives not accounted
for as hedging instruments,
carried at fair value | | Statement of Assets and Liabilities Location | | Fair
Value | | | Statement of Assets and Liabilities Location | | Fair
Value | |
Credit contracts | | Due from/to broker-variation margin swaps | | $ | 667,087 | * | | — | | $ | — | |
Credit contracts | | Premiums paid for OTC swap agreements | | | 1,789,997 | | | Premiums received for OTC swap agreements | | | 296,499 | |
Credit contracts | | Unaffiliated investments | | | 630,838 | | | Options written outstanding, at value | | | 574,240 | |
Credit contracts | | Unrealized appreciation on OTC swap agreements | | | 1,281,620 | | | Unrealized depreciation on OTC swap agreements | | | 439,574 | |
Foreign exchange contracts | | Unrealized appreciation on OTC forward foreign currency exchange contracts | | | 96,194 | | | — | | | — | |
Interest rate contracts | | Due from/to broker-variation margin futures | | | 3,386,304 | * | | Due from/to broker-variation margin futures | | | 5,778,967 | * |
Interest rate contracts | | Due from/to broker-variation margin swaps | | | 15,098,382 | * | | Due from/to broker-variation margin swaps | | | 643,775 | * |
| | | | | | | | | | | | |
| | | | $ | 22,950,422 | | | | | $ | 7,733,055 | |
| | | | | | | | | | | | |
See Notes to Financial Statements.
34
| * | Includes cumulative appreciation (depreciation) as reported in the schedule of open futures and centrally cleared swap contracts. Only unsettled variation margin receivable (payable) is reported within the Statement of Assets and Liabilities. |
The effects of derivative instruments on the Statement of Operations for the year ended December 31, 2024 are as follows:
| | | | | | | | | | | | | | | | | | | | |
| Amount of Realized Gain (Loss) on Derivatives Recognized in Income | |
Derivatives not accounted for as hedging instruments, carried at fair value | | Options
Purchased(1) | | | Options
Written | | | Futures | | | Forward
Currency
Exchange
Contracts | | | Swaps | |
Credit contracts | | $ | (1,999,170 | ) | | $ | 2,006,000 | | | $ | — | | | $ | — | | | $ | (3,196,842 | ) |
Foreign exchange contracts | | | — | | | | — | | | | — | | | | 897,258 | | | | — | |
Interest rate contracts | | | — | | | | — | | | | (4,794,933 | ) | | | — | | | | 1,297,527 | |
| | | | | | | | | | | | | | | | | | | | |
Total | | $ | (1,999,170 | ) | | $ | 2,006,000 | | | $ | (4,794,933 | ) | | $ | 897,258 | | | $ | (1,899,315 | ) |
| | | | | | | | | | | | | | | | | | | | |
| (1) | Included in net realized gain (loss) on investment transactions in the Statement of Operations. |
| | | | | | | | | | | | | | | | | | | | |
| Change in Unrealized Appreciation (Depreciation) on Derivatives Recognized in Income | |
Derivatives not accounted for as hedging instruments, carried at fair value | | Options
Purchased(2) | | | Options
Written | | | Futures | | | Forward
Currency
Exchange
Contracts | | | Swaps | |
Credit contracts | | $ | (427,812 | ) | | $ | 416,110 | | | $ | — | | | $ | — | | | $ | 912,090 | |
Foreign exchange contracts | | | — | | | | — | | | | — | | | | 217,662 | | | | — | |
Interest rate contracts | | | — | | | | — | | | | (18,548,569 | ) | | | — | | | | 930,015 | |
| | | | | | | | | | | | | | | | | | | | |
Total | | $ | (427,812 | ) | | $ | 416,110 | | | $ | (18,548,569 | ) | | $ | 217,662 | | | $ | 1,842,105 | |
| | | | | | | | | | | | | | | | | | | | |
| (2) | Included in net change in unrealized appreciation (depreciation) on investments in the Statement of Operations. |
For the year ended December 31, 2024, the Fund’s average volume of derivative activities is as follows:
| | | | |
| Derivative Contract Type | | Average Volume of Derivative Activities* |
Options Purchased (1) | | | $ 611,564 | |
Options Written (2) | | | 706,400,000 | |
Futures Contracts - Long Positions (2) | | | 1,246,494,965 | |
Futures Contracts - Short Positions (2) | | | 326,115,701 | |
Forward Foreign Currency Exchange Contracts - Purchased (3) | | | 8,543,417 | |
Forward Foreign Currency Exchange Contracts - Sold (3) | | | 22,735,095 | |
Interest Rate Swap Agreements (2) | | | 1,274,520,000 | |
Credit Default Swap Agreements - Buy Protection (2) | | | 101,364,930 | |
Credit Default Swap Agreements - Sell Protection (2) | | | 63,000,000 | |
| * | Average volume is based on average quarter end balances for the year ended December 31, 2024. |
| (2) | Notional Amount in USD. |
| (3) | Value at Settlement Date. |
See Notes to Financial Statements.
PGIM Short-Term Corporate Bond Fund 35
Schedule of Investments (continued)
as of December 31, 2024
Financial Instruments/Transactions—Summary of Offsetting and Netting Arrangements:
The Fund invested in OTC derivatives and entered into financial instruments/transactions during the reporting period that are either offset in accordance with current requirements or are subject to enforceable master netting arrangements or similar agreements that permit offsetting. The information about offsetting and related netting arrangements for OTC derivatives and financial instruments/transactions where the legal right to set-off exists is presented in the summary below.
Offsetting of financial instrument/transaction assets and liabilities:
| | | | | | |
| Description | | Gross Market
Value of
Recognized
Assets/(Liabilities) | | Collateral
Pledged/(Received)(2) | | Net
Amount |
Securities on Loan | | $107,997,088 | | $(107,997,088) | | $— |
Offsetting of OTC derivative assets and liabilities:
| | | | | | | | | | | | | | | | | | | | | | | | | |
Counterparty | | Gross Amounts of
Recognized
Assets(1) | | Gross Amounts of
Recognized
Liabilities(1) | | Net Amounts of
Recognized
Assets/(Liabilities) | | Collateral
Pledged/(Received)(2) | | Net Amount |
BARC | | | $ | 144,241 | | | | $ | (296,499 | ) | | | $ | (152,258 | ) | | | $ | 148,501 | | | | $ | (3,757 | ) |
GSI | | | | 28,001 | | | | | (60,657 | ) | | | | (32,656 | ) | | | | — | | | | | (32,656 | ) |
JPM | | | | 747,993 | | | | | (922,387 | ) | | | | (174,394 | ) | | | | 174,394 | | | | | — | |
MSI | | | | 2,782,220 | | | | | (30,770 | ) | | | | 2,751,450 | | | | | (2,751,450 | ) | | | | — | |
SCB | | | | 96,194 | | | | | — | | | | | 96,194 | | | | | — | | | | | 96,194 | |
| | | | | | | | | | | | | | | | | | | | | | | | | |
| | | $ | 3,798,649 | | | | $ | (1,310,313 | ) | | | $ | 2,488,336 | | | | $ | (2,428,555 | ) | | | $ | 59,781 | |
| | | | | | | | | | | | | | | | | | | | | | | | | |
| (1) | Includes unrealized appreciation/(depreciation) on swaps and forwards, premiums paid/(received) on swap agreements and market value of purchased and written options, as represented on the Statement of Assets and Liabilities. |
| (2) | Collateral amount disclosed by the Fund is limited to the market value of financial instruments/transactions and the Fund’s OTC derivative exposure by counterparty. |
See Notes to Financial Statements.
36
Statement of Assets and Liabilities
as of December 31, 2024
| | | | |
Assets | | | | |
| |
Investments at value, including securities on loan of $107,997,088: | | | | |
Unaffiliated investments (cost $8,182,595,329) | | $ | 8,085,906,839 | |
Affiliated investments (cost $322,982,617) | | | 322,982,617 | |
Foreign currency, at value (cost $335,443) | | | 331,887 | |
Dividends and interest receivable | | | 83,330,978 | |
Receivable for Fund shares sold | | | 20,348,136 | |
Premiums paid for OTC swap agreements | | | 1,789,997 | |
Unrealized appreciation on OTC swap agreements | | | 1,281,620 | |
Receivable for investments sold | | | 1,039,487 | |
Due from broker—variation margin swaps | | | 136,306 | |
Unrealized appreciation on OTC forward foreign currency exchange contracts | | | 96,194 | |
Prepaid expenses and other assets | | | 56,389 | |
| | | | |
| |
Total Assets | | | 8,517,300,450 | |
| | | | |
| |
Liabilities | | | | |
| |
Payable to broker for collateral for securities on loan | | | 110,197,183 | |
Payable for investments purchased | | | 80,000,000 | |
Payable for Fund shares purchased | | | 27,118,588 | |
Dividends payable | | | 3,100,391 | |
Management fee payable | | | 2,473,706 | |
Accrued expenses and other liabilities | | | 1,735,683 | |
Options written outstanding, at value (premiums received $990,350) | | | 574,240 | |
Unrealized depreciation on OTC swap agreements | | | 439,574 | |
Due to broker—variation margin futures | | | 374,702 | |
Distribution fee payable | | | 365,110 | |
Premiums received for OTC swap agreements | | | 296,499 | |
Affiliated transfer agent fee payable | | | 24,631 | |
| | | | |
| |
Total Liabilities | | | 226,700,307 | |
| | | | |
| |
Net Assets | | $ | 8,290,600,143 | |
| | | | |
| |
| | | | | |
| |
Net assets were comprised of: | | | | |
Common stock, at par | | $ | 7,812,048 | |
Paid-in capital in excess of par | | | 9,349,025,226 | |
Total distributable earnings (loss) | | | (1,066,237,131 | ) |
| | | | |
| |
Net assets, December 31, 2024 | | $ | 8,290,600,143 | |
| | | | |
See Notes to Financial Statements.
PGIM Short-Term Corporate Bond Fund 37
Statement of Assets and Liabilities
as of December 31, 2024
| | | | | | | | |
Class A | | | | | | | | |
| | |
Net asset value and redemption price per share,
($ 1,068,886,619 ÷ 100,945,265 shares of common stock issued and outstanding) | | $ | 10.59 | | | | | |
Maximum sales charge (2.25% of offering price) | | | 0.24 | | | | | |
| | | | | | | | |
| | |
Maximum offering price to public | | $ | 10.83 | | | | | |
| | | | | | | | |
| | |
Class C | | | | | | | | |
| | |
Net asset value, offering price and redemption price per share,
($116,541,838 ÷ 11,006,708 shares of common stock issued and outstanding) | | $ | 10.59 | | | | | |
| | | | | | | | |
| | |
Class R | | | | | | | | |
| | |
Net asset value, offering price and redemption price per share,
($88,463,515 ÷ 8,354,967 shares of common stock issued and outstanding) | | $ | 10.59 | | | | | |
| | | | | | | | |
| | |
Class Z | | | | | | | | |
| | |
Net asset value, offering price and redemption price per share,
($5,209,649,345 ÷ 490,788,937 shares of common stock issued and outstanding) | | $ | 10.61 | | | | | |
| | | | | | | | |
| | |
Class R2 | | | | | | | | |
| | |
Net asset value, offering price and redemption price per share,
($1,453,408 ÷ 136,687 shares of common stock issued and outstanding) | | $ | 10.63 | | | | | |
| | | | | | | | |
| | |
Class R4 | | | | | | | | |
| | |
Net asset value, offering price and redemption price per share,
($1,935,120 ÷ 182,026 shares of common stock issued and outstanding) | | $ | 10.63 | | | | | |
| | | | | | | | |
| | |
Class R6 | | | | | | | | |
| | |
Net asset value, offering price and redemption price per share,
($1,803,670,298 ÷ 169,790,164 shares of common stock issued and outstanding) | | $ | 10.62 | | | | | |
| | | | | | | | |
See Notes to Financial Statements.
38
Statement of Operations
Year Ended December 31, 2024
| | | | |
Net Investment Income (Loss) | | | | |
| |
Income | | | | |
Interest income | | $ | 364,268,590 | |
Affiliated dividend income | | | 5,695,386 | |
Unaffiliated dividend income | | | 401,079 | |
Income from securities lending, net (including affiliated income of $318,584) | | | 338,886 | |
| | | | |
Total income | | | 370,703,941 | |
| | | | |
| |
Expenses | | | | |
Management fee | | | 32,916,060 | |
Distribution fee(a) | | | 4,785,164 | |
Shareholder servicing fees(a) | | | 2,987 | |
Transfer agent’s fees and expenses (including affiliated expense of $190,570)(a) | | | 6,582,548 | |
Shareholders’ reports | | | 439,274 | |
Custodian and accounting fees | | | 397,476 | |
Registration fees(a) | | | 250,665 | |
Directors’ fees | | | 117,440 | |
Professional fees | | | 91,096 | |
Audit fee | | | 43,044 | |
Miscellaneous | | | 149,730 | |
| | | | |
| |
Total expenses | | | 45,775,484 | |
Less: Fee waiver and/or expense reimbursement(a) | | | (2,153,264 | ) |
Distribution fee waiver(a) | | | (228,585 | ) |
| | | | |
| |
Net expenses | | | 43,393,635 | |
| | | | |
Net investment income (loss) | | | 327,310,306 | |
| | | | |
| |
Realized And Unrealized Gain (Loss) On Investment And Foreign Currency Transactions | | | | |
Net realized gain (loss) on: | | | | |
Investment transactions (including affiliated of $98,942) | | | (47,139,732 | ) |
Futures transactions | | | (4,794,933 | ) |
Forward currency contract transactions | | | 897,258 | |
Options written transactions | | | 2,006,000 | |
Swap agreement transactions | | | (1,899,315 | ) |
Foreign currency transactions | | | (11,340 | ) |
| | | | |
| | | (50,942,062 | ) |
| | | | |
Net change in unrealized appreciation (depreciation) on: | | | | |
Investments (including affiliated of $(132,290)) | | | 171,795,541 | |
Futures | | | (18,548,569 | ) |
Forward currency contracts | | | 217,662 | |
Options written | | | 416,110 | |
Swap agreements | | | 1,842,105 | |
Foreign currencies | | | (18,820 | ) |
| | | | |
| | | 155,704,029 | |
| | | | |
Net gain (loss) on investment and foreign currency transactions | | | 104,761,967 | |
| | | | |
Net Increase (Decrease) In Net Assets Resulting From Operations | | $ | 432,072,273 | |
| | | | |
See Notes to Financial Statements.
PGIM Short-Term Corporate Bond Fund 39
Statement of Operations
Year Ended December 31, 2024
| (a) | Class specific expenses and waivers were as follows: |
| | | | | | | | | | | | | | | | | | | | | | | | | | | | |
| | | Class A | | | Class C | | | Class R | | | Class Z | | | Class R2 | | | Class R4 | | | Class R6 | |
Distribution fee | | | 2,753,420 | | | | 1,342,613 | | | | 685,755 | | | | — | | | | 3,376 | | | | — | | | | — | |
Shareholder servicing fees | | | — | | | | — | | | | — | | | | — | | | | 1,350 | | | | 1,637 | | | | — | |
Transfer agent’s fees and expenses | | | 830,647 | | | | 122,510 | | | | 137,413 | | | | 5,401,729 | | | | 2,704 | | | | 3,170 | | | | 84,375 | |
Registration fees | | | 53,376 | | | | 20,475 | | | | 12,521 | | | | 90,941 | | | | 10,371 | | | | 8,021 | | | | 54,960 | |
Fee waiver and/or expense reimbursement | | | (160,226 | ) | | | (19,532 | ) | | | (13,302 | ) | | | (1,500,337 | ) | | | (11,237 | ) | | | (8,964 | ) | | | (439,666 | ) |
Distribution fee waiver | | | — | | | | — | | | | (228,585 | ) | | | — | | | | — | | | | — | | | | — | |
See Notes to Financial Statements.
40
Statements of Changes in Net Assets
| | | | | | | | |
| |
| | | Year Ended
December 31, | |
| | |
| | | 2024 | | | 2023 | |
| | |
Increase (Decrease) in Net Assets | | | | | | | | |
| | |
Operations | | | | | | | | |
Net investment income (loss) | | $ | 327,310,306 | | | $ | 299,457,523 | |
Net realized gain (loss) on investment and foreign currency transactions | | | (50,942,062 | ) | | | (181,895,924 | ) |
Net change in unrealized appreciation (depreciation) on investments and foreign currencies | | | 155,704,029 | | | | 492,945,073 | |
| | | | | | | | |
Net increase (decrease) in net assets resulting from operations | | | 432,072,273 | | | | 610,506,672 | |
| | | | | | | | |
| | |
Dividends and Distributions | | | | | | | | |
Distributions from distributable earnings | | | | | | | | |
Class A | | | (39,900,359 | ) | | | (38,287,770 | ) |
Class C | | | (3,819,334 | ) | | | (4,508,781 | ) |
Class R | | | (3,006,597 | ) | | | (2,905,614 | ) |
Class Z | | | (203,508,140 | ) | | | (202,074,998 | ) |
Class R2 | | | (46,625 | ) | | | (35,931 | ) |
Class R4 | | | (60,664 | ) | | | (44,895 | ) |
Class R6 | | | (81,622,705 | ) | | | (83,601,534 | ) |
| | | | | | | | |
| | |
| | | (331,964,424 | ) | | | (331,459,523 | ) |
| | | | | | | | |
| | |
Fund share transactions (Net of share conversions) | | | | | | | | |
Net proceeds from shares sold | | | 2,163,485,622 | | | | 2,880,971,062 | |
Net asset value of shares issued in reinvestment of dividends and distributions | | | 290,701,183 | | | | 287,138,171 | |
Cost of shares purchased | | | (3,319,069,317 | ) | | | (4,140,092,331 | ) |
| | | | | | | | |
Net increase (decrease) in net assets from Fund share transactions | | | (864,882,512 | ) | | | (971,983,098 | ) |
| | | | | | | | |
Total increase (decrease) | | | (764,774,663 | ) | | | (692,935,949 | ) |
| | |
Net Assets: | | | | | | | | |
| | |
Beginning of year | | | 9,055,374,806 | | | | 9,748,310,755 | |
| | | | | | | | |
End of year | | $ | 8,290,600,143 | | | $ | 9,055,374,806 | |
| | | | | | | | |
See Notes to Financial Statements.
PGIM Short-Term Corporate Bond Fund 41
Financial Highlights
| | | | | | | | | | | | | | | | | | | | |
| | | | | | |
Class A Shares | | | | | | | | | | | | | | | | | | | | |
| | | Year Ended December 31, | |
| | | | | | |
| | | 2024 | | | 2023 | | | 2022 | | | 2021 | | | 2020 | |
| | | | | | |
Per Share Operating Performance(a): | | | | | | | | | | | | | | | | | | | | |
Net Asset Value, Beginning of Year | | | $10.47 | | | | $10.15 | | | | $11.14 | | | | $11.42 | | | | $11.11 | |
Income (loss) from investment operations: | | | | | | | | | | | | | | | | | | | | |
Net investment income (loss) | | | 0.38 | | | | 0.30 | | | | 0.19 | | | | 0.17 | | | | 0.22 | |
Net realized and unrealized gain (loss) on investment and foreign currency transactions | | | 0.12 | | | | 0.36 | | | | (0.93 | ) | | | (0.23 | ) | | | 0.34 | |
Total from investment operations | | | 0.50 | | | | 0.66 | | | | (0.74 | ) | | | (0.06 | ) | | | 0.56 | |
Less Dividends and Distributions: | | | | | | | | | | | | | | | | | | | | |
Dividends from net investment income | | | (0.38 | ) | | | (0.34 | ) | | | (0.25 | ) | | | (0.22 | ) | | | (0.25 | ) |
Tax return of capital distributions | | | - | | | | - | | | | (- | )(b) | | | - | | | | - | |
Total dividends and distributions | | | (0.38 | ) | | | (0.34 | ) | | | (0.25 | ) | | | (0.22 | ) | | | (0.25 | ) |
Net asset value, end of year | | | $10.59 | | | | $10.47 | | | | $10.15 | | | | $11.14 | | | | $11.42 | |
Total Return(c): | | | 4.87 | % | | | 6.60 | % | | | (6.70 | )% | | | (0.56 | )% | | | 5.13 | % |
| | | | | | | | | | | | | | | | | | | | | |
Ratios/Supplemental Data: | | | | | | | | | | | | | | | | | | | | |
Net assets, end of year (000) | | | $1,068,887 | | | | $1,137,150 | | | | $1,204,480 | | | | $1,665,931 | | | | $1,837,307 | |
Average net assets (000) | | | $1,101,368 | | | | $1,161,410 | | | | $1,361,067 | | | | $1,807,236 | | | | $2,048,213 | |
Ratios to average net assets(d): | | | | | | | | | | | | | | | | | | | | |
Expenses after waivers and/or expense reimbursement | | | 0.71 | % | | | 0.71 | % | | | 0.71 | % | | | 0.71 | % | | | 0.76 | % |
Expenses before waivers and/or expense reimbursement | | | 0.72 | % | | | 0.73 | % | | | 0.72 | % | | | 0.72 | % | | | 0.77 | % |
Net investment income (loss) | | | 3.57 | % | | | 2.96 | % | | | 1.83 | % | | | 1.46 | % | | | 1.93 | % |
Portfolio turnover rate(e) | | | 46 | % | | | 35 | % | | | 14 | % | | | 32 | % | | | 36 | % |
| (a) | Calculated based on average shares outstanding during the year. |
| (b) | Amount rounds to zero. |
| (c) | Total return does not consider the effects of sales loads. Total return is calculated assuming a purchase of a share on the first day and a sale on the last day of each year reported and includes reinvestment of dividends and distributions, if any. Total returns may reflect adjustments to conform to GAAP. |
| (d) | Does not include expenses of the underlying funds in which the Fund invests. |
| (e) | The Fund’s portfolio turnover rate is calculated in accordance with regulatory requirements, without regard to transactions involving short-term investments, certain derivatives and in-kind transactions (if any). If such transactions were included, the Fund’s portfolio turnover rate may be higher. |
See Notes to Financial Statements.
42
| | | | | | | | | | | | | | | | | | | | |
| | | | | | |
Class C Shares | | | | | | | | | | | | | | | | | | | | |
| | | Year Ended December 31, | |
| | | | | | |
| | | 2024 | | | 2023 | | | 2022 | | | 2021 | | | 2020 | |
| | | | | | |
Per Share Operating Performance(a): | | | | | | | | | | | | | | | | | | | | |
Net Asset Value, Beginning of Year | | | $10.47 | | | | $10.15 | | | | $11.14 | | | | $11.42 | | | | $11.11 | |
Income (loss) from investment operations: | | | | | | | | | | | | | | | | | | | | |
Net investment income (loss) | | | 0.29 | | | | 0.22 | | | | 0.11 | | | | 0.08 | | | | 0.14 | |
Net realized and unrealized gain (loss) on investment and foreign currency transactions | | | 0.13 | | | | 0.36 | | | | (0.93 | ) | | | (0.23 | ) | | | 0.34 | |
Total from investment operations | | | 0.42 | | | | 0.58 | | | | (0.82 | ) | | | (0.15 | ) | | | 0.48 | |
Less Dividends and Distributions: | | | | | | | | | | | | | | | | | | | | |
Dividends from net investment income | | | (0.30 | ) | | | (0.26 | ) | | | (0.17 | ) | | | (0.13 | ) | | | (0.17 | ) |
Tax return of capital distributions | | | - | | | | - | | | | (- | )(b) | | | - | | | | - | |
Total dividends and distributions | | | (0.30 | ) | | | (0.26 | ) | | | (0.17 | ) | | | (0.13 | ) | | | (0.17 | ) |
Net asset value, end of year | | | $10.59 | | | | $10.47 | | | | $10.15 | | | | $11.14 | | | | $11.42 | |
Total Return(c): | | | 4.06 | % | | | 5.79 | % | | | (7.42 | )% | | | (1.31 | )% | | | 4.40 | % |
| | | | | | | | | | | | | | | | | | | | |
Ratios/Supplemental Data: | | | | | | | | | | | | | | | | | | | | |
Net assets, end of year (000) | | | $116,542 | | | | $155,936 | | | | $209,217 | | | | $333,417 | | | | $495,994 | |
Average net assets (000) | | | $134,261 | | | | $179,607 | | | | $262,486 | | | | $389,132 | | | | $534,970 | |
Ratios to average net assets(d): | | | | | | | | | | | | | | | | | | | | |
Expenses after waivers and/or expense reimbursement | | | 1.49 | % | | | 1.48 | % | | | 1.48 | % | | | 1.47 | % | | | 1.47 | % |
Expenses before waivers and/or expense reimbursement | | | 1.50 | % | | | 1.50 | % | | | 1.49 | % | | | 1.48 | % | | | 1.48 | % |
Net investment income (loss) | | | 2.79 | % | | | 2.17 | % | | | 1.04 | % | | | 0.71 | % | | | 1.27 | % |
Portfolio turnover rate(e) | | | 46 | % | | | 35 | % | | | 14 | % | | | 32 | % | | | 36 | % |
| (a) | Calculated based on average shares outstanding during the year. |
| (b) | Amount rounds to zero. |
| (c) | Total return does not consider the effects of sales loads. Total return is calculated assuming a purchase of a share on the first day and a sale on the last day of each year reported and includes reinvestment of dividends and distributions, if any. Total returns may reflect adjustments to conform to GAAP. |
| (d) | Does not include expenses of the underlying funds in which the Fund invests. |
| (e) | The Fund’s portfolio turnover rate is calculated in accordance with regulatory requirements, without regard to transactions involving short-term investments, certain derivatives and in-kind transactions (if any). If such transactions were included, the Fund’s portfolio turnover rate may be higher. |
See Notes to Financial Statements.
PGIM Short-Term Corporate Bond Fund 43
Financial Highlights (continued)
| | | | | | | | | | | | | | | | | | | | |
| | | | | | |
Class R Shares | | | | | | | | | | | | | | | | | | | | |
| | | Year Ended December 31, | |
| | | | | | |
| | | 2024 | | | 2023 | | | 2022 | | | 2021 | | | 2020 | |
| | | | | | |
Per Share Operating Performance(a): | | | | | | | | | | | | | | | | | | | | |
Net Asset Value, Beginning of Year | | | $10.47 | | | | $10.15 | | | | $11.13 | | | | $11.42 | | | | $11.11 | |
Income (loss) from investment operations: | | | | | | | | | | | | | | | | | | | | |
Net investment income (loss) | | | 0.34 | | | | 0.27 | | | | 0.15 | | | | 0.13 | | | | 0.19 | |
Net realized and unrealized gain (loss) on investment and foreign currency transactions | | | 0.13 | | | | 0.35 | | | | (0.92 | ) | | | (0.24 | ) | | | 0.34 | |
Total from investment operations | | | 0.47 | | | | 0.62 | | | | (0.77 | ) | | | (0.11 | ) | | | 0.53 | |
Less Dividends and Distributions: | | | | | | | | | | | | | | | | | | | | |
Dividends from net investment income | | | (0.35 | ) | | | (0.30 | ) | | | (0.21 | ) | | | (0.18 | ) | | | (0.22 | ) |
Tax return of capital distributions | | | - | | | | - | | | | (- | )(b) | | | - | | | | - | |
Total dividends and distributions | | | (0.35 | ) | | | (0.30 | ) | | | (0.21 | ) | | | (0.18 | ) | | | (0.22 | ) |
Net asset value, end of year | | | $10.59 | | | | $10.47 | | | | $10.15 | | | | $11.13 | | | | $11.42 | |
Total Return(c): | | | 4.52 | % | | | 6.25 | % | | | (6.94 | )% | | | (0.99 | )% | | | 4.86 | % |
| | | | | | | | | | | | | | | | | | | | | |
Ratios/Supplemental Data: | | | | | | | | | | | | | | | | | | | | |
Net assets, end of year (000) | | | $88,464 | | | | $94,762 | | | | $104,825 | | | | $138,545 | | | | $143,094 | |
Average net assets (000) | | | $91,434 | | | | $98,290 | | | | $119,891 | | | | $139,942 | | | | $133,401 | |
Ratios to average net assets(d): | | | | | | | | | | | | | | | | | | | | |
Expenses after waivers and/or expense reimbursement | | | 1.04 | % | | | 1.05 | % | | | 1.05 | % | | | 1.05 | % | | | 1.02 | % |
Expenses before waivers and/or expense reimbursement | | | 1.30 | % | | | 1.32 | % | | | 1.31 | % | | | 1.31 | % | | | 1.28 | % |
Net investment income (loss) | | | 3.23 | % | | | 2.62 | % | | | 1.48 | % | | | 1.12 | % | | | 1.70 | % |
Portfolio turnover rate(e) | | | 46 | % | | | 35 | % | | | 14 | % | | | 32 | % | | | 36 | % |
| (a) | Calculated based on average shares outstanding during the year. |
| (b) | Amount rounds to zero. |
| (c) | Total return is calculated assuming a purchase of a share on the first day and a sale on the last day of each year reported and includes reinvestment of dividends and distributions, if any. Total returns may reflect adjustments to conform to GAAP. |
| (d) | Does not include expenses of the underlying funds in which the Fund invests. |
| (e) | The Fund’s portfolio turnover rate is calculated in accordance with regulatory requirements, without regard to transactions involving short-term investments, certain derivatives and in-kind transactions (if any). If such transactions were included, the Fund’s portfolio turnover rate may be higher. |
See Notes to Financial Statements.
44
| | | | | | | | | | | | | | | | | | | | |
| | | | | | |
Class Z Shares | | | | | | | | | | | | | | | | | | | | |
| | | Year Ended December 31, | |
| | | | | | |
| | | 2024 | | | 2023 | | | 2022 | | | 2021 | | | 2020 | |
| | | | | | |
Per Share Operating Performance(a): | | | | | | | | | | | | | | | | | | | | |
Net Asset Value, Beginning of Year | | | $10.49 | | | | $10.17 | | | | $11.16 | | | | $11.45 | | | | $11.14 | |
Income (loss) from investment operations: | | | | | | | | | | | | | | | | | | | | |
Net investment income (loss) | | | 0.40 | | | | 0.33 | | | | 0.21 | | | | 0.19 | | | | 0.25 | |
Net realized and unrealized gain (loss) on investment and foreign currency transactions | | | 0.13 | | | | 0.35 | | | | (0.93 | ) | | | (0.24 | ) | | | 0.35 | |
Total from investment operations | | | 0.53 | | | | 0.68 | | | | (0.72 | ) | | | (0.05 | ) | | | 0.60 | |
Less Dividends and Distributions: | | | | | | | | | | | | | | | | | | | | |
Dividends from net investment income | | | (0.41 | ) | | | (0.36 | ) | | | (0.27 | ) | | | (0.24 | ) | | | (0.29 | ) |
Tax return of capital distributions | | | - | | | | - | | | | (- | )(b) | | | - | | | | - | |
Total dividends and distributions | | | (0.41 | ) | | | (0.36 | ) | | | (0.27 | ) | | | (0.24 | ) | | | (0.29 | ) |
Net asset value, end of year | | | $10.61 | | | | $10.49 | | | | $10.17 | | | | $11.16 | | | | $11.45 | |
Total Return(c): | | | 5.12 | % | | | 6.85 | % | | | (6.47 | )% | | | (0.41 | )% | | | 5.43 | % |
| | | | | | | | | | | | | | | | | | | | | |
Ratios/Supplemental Data: | | | | | | | | | | | | | | | | | | | | |
Net assets, end of year (000) | | | $5,209,649 | | | | $5,467,555 | | | | $5,743,080 | | | | $8,985,211 | | | | $8,371,100 | |
Average net assets (000) | | | $5,267,650 | | | | $5,711,815 | | | | $7,274,717 | | | | $8,893,589 | | | | $7,069,401 | |
Ratios to average net assets(d): | | | | | | | | | | | | | | | | | | | | |
Expenses after waivers and/or expense reimbursement | | | 0.47 | % | | | 0.47 | % | | | 0.47 | % | | | 0.47 | % | | | 0.47 | % |
Expenses before waivers and/or expense reimbursement | | | 0.50 | % | | | 0.49 | % | | | 0.50 | % | | | 0.51 | % | | | 0.50 | % |
Net investment income (loss) | | | 3.81 | % | | | 3.20 | % | | | 2.05 | % | | | 1.69 | % | | | 2.22 | % |
Portfolio turnover rate(e) | | | 46 | % | | | 35 | % | | | 14 | % | | | 32 | % | | | 36 | % |
| (a) | Calculated based on average shares outstanding during the year. |
| (b) | Amount rounds to zero. |
| (c) | Total return is calculated assuming a purchase of a share on the first day and a sale on the last day of each year reported and includes reinvestment of dividends and distributions, if any. Total returns may reflect adjustments to conform to GAAP. |
| (d) | Does not include expenses of the underlying funds in which the Fund invests. |
| (e) | The Fund’s portfolio turnover rate is calculated in accordance with regulatory requirements, without regard to transactions involving short-term investments, certain derivatives and in-kind transactions (if any). If such transactions were included, the Fund’s portfolio turnover rate may be higher. |
See Notes to Financial Statements.
PGIM Short-Term Corporate Bond Fund 45
Financial Highlights (continued)
| | | | | | | | | | | | | | | | | | | | |
| | | | | | |
Class R2 Shares | | | | | | | | | | | | | | | | | | | | |
| | | Year Ended December 31, | |
| | | | | | |
| | | 2024 | | | 2023 | | | 2022 | | | 2021 | | | 2020 | |
| | | | | | |
Per Share Operating Performance(a): | | | | | | | | | | | | | | | | | | | | |
Net Asset Value, Beginning of Year | | | $10.51 | | | | $10.19 | | | | $11.18 | | | | $11.47 | | | | $11.15 | |
Income (loss) from investment operations: | | | | | | | | | | | | | | | | | | | | |
Net investment income (loss) | | | 0.36 | | | | 0.29 | | | | 0.17 | | | | 0.14 | | | | 0.20 | |
Net realized and unrealized gain (loss) on investment and foreign currency transactions | | | 0.12 | | | | 0.35 | | | | (0.93 | ) | | | (0.23 | ) | | | 0.36 | |
Total from investment operations | | | 0.48 | | | | 0.64 | | | | (0.76 | ) | | | (0.09 | ) | | | 0.56 | |
Less Dividends and Distributions: | | | | | | | | | | | | | | | | | | | | |
Dividends from net investment income | | | (0.36 | ) | | | (0.32 | ) | | | (0.23 | ) | | | (0.20 | ) | | | (0.24 | ) |
Tax return of capital distributions | | | - | | | | - | | | | (- | )(b) | | | - | | | | - | |
Total dividends and distributions | | | (0.36 | ) | | | (0.32 | ) | | | (0.23 | ) | | | (0.20 | ) | | | (0.24 | ) |
Net asset value, end of year | | | $10.63 | | | | $10.51 | | | | $10.19 | | | | $11.18 | | | | $11.47 | |
Total Return(c): | | | 4.69 | % | | | 6.41 | % | | | (6.83 | )% | | | (0.81 | )% | | | 5.09 | % |
| | | | | | | | | | | | | | | | | | | | | |
Ratios/Supplemental Data: | | | | | | | | | | | | | | | | | | | | |
Net assets, end of year (000) | | | $1,453 | | | | $1,338 | | | | $916 | | | | $1,941 | | | | $919 | |
Average net assets (000) | | | $1,350 | | | | $1,138 | | | | $1,505 | | | | $1,549 | | | | $477 | |
Ratios to average net assets(d): | | | | | | | | | | | | | | | | | | | | |
Expenses after waivers and/or expense reimbursement | | | 0.88 | % | | | 0.88 | % | | | 0.88 | % | | | 0.88 | % | | | 0.88 | % |
Expenses before waivers and/or expense reimbursement | | | 1.71 | % | | | 1.87 | % | | | 1.84 | % | | | 1.89 | % | | | 6.58 | % |
Net investment income (loss) | | | 3.40 | % | | | 2.84 | % | | | 1.61 | % | | | 1.27 | % | | | 1.74 | % |
Portfolio turnover rate(e) | | | 46 | % | | | 35 | % | | | 14 | % | | | 32 | % | | | 36 | % |
| (a) | Calculated based on average shares outstanding during the year. |
| (b) | Amount rounds to zero. |
| (c) | Total return is calculated assuming a purchase of a share on the first day and a sale on the last day of each year reported and includes reinvestment of dividends and distributions, if any. Total returns may reflect adjustments to conform to GAAP. |
| (d) | Does not include expenses of the underlying funds in which the Fund invests. |
| (e) | The Fund’s portfolio turnover rate is calculated in accordance with regulatory requirements, without regard to transactions involving short-term investments, certain derivatives and in-kind transactions (if any). If such transactions were included, the Fund’s portfolio turnover rate may be higher. |
See Notes to Financial Statements.
46
| | | | | | | | | | | | | | | | | | | | |
| | | | | | |
Class R4 Shares | | | | | | | | | | | | | | | | | | | | |
| | | Year Ended December 31, | |
| | | | | | |
| | | 2024 | | | 2023 | | | 2022 | | | 2021 | | | 2020 | |
| | | | | | |
Per Share Operating Performance(a): | | | | | | | | | | | | | | | | | | | | |
Net Asset Value, Beginning of Year | | | $10.51 | | | | $10.19 | | | | $11.18 | | | | $11.46 | | | | $11.15 | |
Income (loss) from investment operations: | | | | | | | | | | | | | | | | | | | | |
Net investment income (loss) | | | 0.39 | | | | 0.31 | | | | 0.20 | | | | 0.17 | | | | 0.24 | |
Net realized and unrealized gain (loss) on investment and foreign currency transactions | | | 0.12 | | | | 0.36 | | | | (0.94 | ) | | | (0.22 | ) | | | 0.34 | |
Total from investment operations | | | 0.51 | | | | 0.67 | | | | (0.74 | ) | | | (0.05 | ) | | | 0.58 | |
Less Dividends and Distributions: | | | | | | | | | | | | | | | | | | | | |
Dividends from net investment income | | | (0.39 | ) | | | (0.35 | ) | | | (0.25 | ) | | | (0.23 | ) | | | (0.27 | ) |
Tax return of capital distributions | | | - | | | | - | | | | (- | )(b) | | | - | | | | - | |
Total dividends and distributions | | | (0.39 | ) | | | (0.35 | ) | | | (0.25 | ) | | | (0.23 | ) | | | (0.27 | ) |
Net asset value, end of year | | | $10.63 | | | | $10.51 | | | | $10.19 | | | | $11.18 | | | | $11.46 | |
Total Return(c): | | | 4.95 | % | | | 6.68 | % | | | (6.60 | )% | | | (0.47 | )% | | | 5.26 | % |
| | | | | | | | | | | | | | | | | | | | | |
Ratios/Supplemental Data: | | | | | | | | | | | | | | | | | | | | |
Net assets, end of year (000) | | | $1,935 | | | | $1,372 | | | | $1,400 | | | | $1,020 | | | | $439 | |
Average net assets (000) | | | $1,636 | | | | $1,327 | | | | $986 | | | | $887 | | | | $347 | |
Ratios to average net assets(d): | | | | | | | | | | | | | | | | | | | | |
Expenses after waivers and/or expense reimbursement | | | 0.63 | % | | | 0.63 | % | | | 0.63 | % | | | 0.63 | % | | | 0.63 | % |
Expenses before waivers and/or expense reimbursement | | | 1.18 | % | | | 1.43 | % | | | 1.66 | % | | | 2.16 | % | | | 8.45 | % |
Net investment income (loss) | | | 3.66 | % | | | 3.05 | % | | | 1.89 | % | | | 1.52 | % | | | 2.11 | % |
Portfolio turnover rate(e) | | | 46 | % | | | 35 | % | | | 14 | % | | | 32 | % | | | 36 | % |
| (a) | Calculated based on average shares outstanding during the year. |
| (b) | Amount rounds to zero. |
| (c) | Total return is calculated assuming a purchase of a share on the first day and a sale on the last day of each year reported and includes reinvestment of dividends and distributions, if any. Total returns may reflect adjustments to conform to GAAP. |
| (d) | Does not include expenses of the underlying funds in which the Fund invests. |
| (e) | The Fund’s portfolio turnover rate is calculated in accordance with regulatory requirements, without regard to transactions involving short-term investments, certain derivatives and in-kind transactions (if any). If such transactions were included, the Fund’s portfolio turnover rate may be higher. |
See Notes to Financial Statements.
PGIM Short-Term Corporate Bond Fund 47
Financial Highlights (continued)
| | | | | | | | | | | | | | | | | | | | |
| | | | | | |
Class R6 Shares | | | | | | | | | | | | | | | | | | | | |
| | | Year Ended December 31, | |
| | | | | | |
| | | 2024 | | | 2023 | | | 2022 | | | 2021 | | | 2020 | |
| | | | | | |
Per Share Operating Performance(a): | | | | | | | | | | | | | | | | | | | | |
Net Asset Value, Beginning of Year | | | $10.50 | | | | $10.18 | | | | $11.17 | | | | $11.46 | | | | $11.14 | |
Income (loss) from investment operations: | | | | | | | | | | | | | | | | | | | | |
Net investment income (loss) | | | 0.41 | | | | 0.34 | | | | 0.23 | | | | 0.20 | | | | 0.26 | |
Net realized and unrealized gain (loss) on investment and foreign currency transactions | | | 0.13 | | | | 0.35 | | | | (0.94 | ) | | | (0.24 | ) | | | 0.36 | |
Total from investment operations | | | 0.54 | | | | 0.69 | | | | (0.71 | ) | | | (0.04 | ) | | | 0.62 | |
Less Dividends and Distributions: | | | | | | | | | | | | | | | | | | | | |
Dividends from net investment income | | | (0.42 | ) | | | (0.37 | ) | | | (0.28 | ) | | | (0.25 | ) | | | (0.30 | ) |
Tax return of capital distributions | | | - | | | | - | | | | (- | )(b) | | | - | | | | - | |
Total dividends and distributions | | | (0.42 | ) | | | (0.37 | ) | | | (0.28 | ) | | | (0.25 | ) | | | (0.30 | ) |
Net asset value, end of year | | | $10.62 | | | | $10.50 | | | | $10.18 | | | | $11.17 | | | | $11.46 | |
Total Return(c): | | | 5.21 | % | | | 6.95 | % | | | (6.37 | )% | | | (0.31 | )% | | | 5.62 | % |
| | | | | | | | | | | | | | | | | | | | | |
Ratios/Supplemental Data: | | | | | | | | | | | | | | | | | | | | |
Net assets, end of year (000) | | | $1,803,670 | | | | $2,197,262 | | | | $2,484,393 | | | | $2,586,493 | | | | $1,821,666 | |
Average net assets (000) | | | $2,064,421 | | | | $2,305,753 | | | | $2,472,740 | | | | $2,277,111 | | | | $1,498,054 | |
Ratios to average net assets(d): | | | | | | | | | | | | | | | | | | | | |
Expenses after waivers and/or expense reimbursement | | | 0.38 | % | | | 0.38 | % | | | 0.38 | % | | | 0.38 | % | | | 0.38 | % |
Expenses before waivers and/or expense reimbursement | | | 0.40 | % | | | 0.40 | % | | | 0.40 | % | | | 0.40 | % | | | 0.40 | % |
Net investment income (loss) | | | 3.90 | % | | | 3.29 | % | | | 2.18 | % | | | 1.77 | % | | | 2.31 | % |
Portfolio turnover rate(e) | | | 46 | % | | | 35 | % | | | 14 | % | | | 32 | % | | | 36 | % |
| (a) | Calculated based on average shares outstanding during the year. |
| (b) | Amount rounds to zero. |
| (c) | Total return is calculated assuming a purchase of a share on the first day and a sale on the last day of each year reported and includes reinvestment of dividends and distributions, if any. Total returns may reflect adjustments to conform to GAAP. |
| (d) | Does not include expenses of the underlying funds in which the Fund invests. |
| (e) | The Fund’s portfolio turnover rate is calculated in accordance with regulatory requirements, without regard to transactions involving short-term investments, certain derivatives and in-kind transactions (if any). If such transactions were included, the Fund’s portfolio turnover rate may be higher. |
See Notes to Financial Statements.
48
Notes to Financial Statements
Prudential Short-Term Corporate Bond Fund, Inc. (the “Registered Investment Company” or “RIC”) is registered under the Investment Company Act of 1940, as amended (“1940 Act”), as an open-end management investment company. The RIC is organized as a Maryland Corporation and PGIM Short-Term Corporate Bond Fund (the “Fund”) is the sole series of the RIC. The Fund is classified as a diversified fund for purposes of the 1940 Act.
The investment objective of the Fund is to seek high current income consistent with the preservation of principal.
During the reporting period, the Fund adopted FASB Accounting Standards Update 2023-07, Segment Reporting (Topic 280) - Improvements to Reportable Segment Disclosures (“ASU 2023-07”). Adoption of ASU 2023-07 exclusively impacted financial statement disclosures only and did not affect the Fund’s financial position or performance. The intent of ASU 2023-07 is, through improved segment disclosures, to enable investors to better understand an entity’s overall performance. PGIM Investments LLC (“PGIM Investments” or the “Manager”) acts as the Fund’s chief operating decision maker (“CODM”). The CODM has determined that the Fund has a single operating segment as the CODM monitors the operating results of the Fund as a whole and the Fund’s long-term strategic asset allocation is pre-determined in accordance with the terms of its respective prospectus, based on a defined investment strategy which is executed by the Fund’s sub-advisor.
The CODM allocates resources and assesses performance based on the operating results of the Fund, which is consistent with the results presented in the Fund’s Schedule of Investments, Statement of Changes in Net Assets and Financial Highlights.
The Fund follows the investment company accounting and reporting guidance of the Financial Accounting Standards Board (“FASB”) Accounting Standard Codification (“ASC”) Topic 946 Financial Services — Investment Companies. The following is a summary of significant accounting policies followed by the Fund in the preparation of its financial statements. The policies conform to U.S. generally accepted accounting principles (“GAAP”). The Fund consistently follows such policies in the preparation of its financial statements.
Securities Valuation: The Fund holds securities and other assets and liabilities that are fair valued at the close of each day (generally, 4:00 PM Eastern time) the New York Stock Exchange (“NYSE”) is open for trading. Fair value is the price that would be received to sell an asset or paid to transfer a liability in an orderly transaction between market participants
PGIM Short-Term Corporate Bond Fund 49
Notes to Financial Statements (continued)
on the measurement date. The RIC’s Board of Directors (the “Board”) has approved the Fund’s valuation policies and procedures for security valuation and designated PGIM Investments LLC (“PGIM Investments” or the “Manager”) as the “Valuation Designee,” as defined by Rule 2a-5(b) under the 1940 Act, to perform the fair value determination relating to all Fund investments. Pursuant to the Board’s oversight, the Valuation Designee has established a Valuation Committee to perform the duties and responsibilities of the Valuation Designee under Rule 2a-5. The valuation procedures permit Fund to utilize independent pricing vendor services, quotations from market makers, and alternative valuation methods when market quotations are either not readily available or not deemed representative of fair value. A record of the Valuation Committee’s actions is subject to the Board’s review, approval, and ratification at its next regularly scheduled quarterly meeting.
For the fiscal reporting year-end, securities and other assets and liabilities were fair valued at the close of the last U.S. business day. Trading in certain foreign securities may occur when the NYSE is closed (including weekends and holidays). Because such foreign securities trade in markets that are open on weekends and U.S. holidays, the values of some of the Fund’s foreign investments may change on days when investors cannot purchase or redeem Fund shares.
Various inputs determine how the Fund’s investments are valued, all of which are categorized according to the three broad levels (Level 1, 2, or 3) detailed in the Schedule of Investments and referred to herein as the “fair value hierarchy” in accordance with FASB ASC Topic 820 Fair Value Measurement.
Common or preferred stocks, exchange-traded funds (“ETFs”) and derivative instruments, if applicable, that are traded on a national securities exchange are valued at the last sale price as of the close of trading on the applicable exchange where the security principally trades. Securities traded via NASDAQ are valued at the NASDAQ official closing price. To the extent these securities are valued at the last sale price or NASDAQ official closing price, they are classified as Level 1 in the fair value hierarchy. In the event that no sale or official closing price on a valuation date exists, these securities are generally valued at the mean between the last reported bid and ask prices, or at the last bid price in the absence of an ask price. These securities are classified as Level 2 in the fair value hierarchy.
Investments in open-end funds (other than ETFs) are valued at their net asset values as of the close of the NYSE on the date of valuation. These securities are classified as Level 1 in the fair value hierarchy since they may be purchased or sold at their net asset values on the date of valuation.
Fixed income securities traded in the over-the-counter (“OTC”) market are generally classified as Level 2 in the fair value hierarchy. Such fixed income securities are typically
50
valued using the market approach which generally involves obtaining data from an approved independent third-party vendor source. The Fund utilizes the market approach as the primary method to value securities when market prices of identical or comparable instruments are available. The third-party vendors’ valuation techniques used to derive the evaluated bid price are based on evaluating observable inputs, including but not limited to, yield curves, yield spreads, credit ratings, deal terms, tranche level attributes, default rates, cash flows, prepayment speeds, broker/dealer quotations and reported trades. Certain Level 3 securities are also valued using the market approach when obtaining a single broker quote or when utilizing transaction prices for identical securities that have been used in excess of five business days. During the reporting period, there were no changes to report with respect to the valuation approach and/or valuation techniques discussed above.
Securities and other assets that cannot be priced according to the methods described above are valued based on policies and procedures approved by the Board. In the event that unobservable inputs are used when determining such valuations, the securities will be classified as Level 3 in the fair value hierarchy. Altering one or more unobservable inputs may result in a significant change to a Level 3 security’s fair value measurement.
When determining the fair value of securities, some of the factors influencing the valuation include: the nature of any restrictions on disposition of the securities; assessment of the general liquidity of the securities; the issuer’s financial condition and the markets in which it does business; the cost of the investment; the size of the holding and the capitalization of the issuer; the prices of any recent transactions or bids/offers for such securities or any comparable securities; and any available analyst media or other reports or information deemed reliable by the Valuation Designee regarding the issuer or the markets or industry in which it operates. Using fair value to price securities may result in a value that is different from a security’s most recent closing price and from the price used by other unaffiliated mutual funds to calculate their net asset values.
Forward and Cross Currency Contracts: A forward currency contract is a commitment to purchase or sell a foreign currency at a future date at a negotiated forward rate. The Fund enters into forward currency contracts, as defined in the prospectus, in order to hedge its exposure to changes in foreign currency exchange rates on its foreign portfolio holdings or on specific receivables and payables denominated in a foreign currency and to gain exposure to certain currencies. The contracts are valued daily at current forward exchange rates and any unrealized gain (loss) is included in net unrealized appreciation or depreciation on forward and cross currency contracts. Gain (loss) is realized on the settlement date of the contract equal to the difference between the settlement value of the original and negotiated forward contracts. This gain (loss), if any, is included in net realized gain (loss) on forward and cross currency contract transactions. Risks may arise upon entering into these contracts from the potential inability of the counterparties to meet the terms of their contracts. Forward currency contracts involve risks from currency exchange rate and credit risk in excess of the amounts reflected on the Statement of Assets and Liabilities. The Fund’s maximum risk of loss from counterparty credit risk is the net value of the cash flows to be received from the counterparty at the end of the contract’s life. A cross
PGIM Short-Term Corporate Bond Fund 51
Notes to Financial Statements (continued)
currency contract is a forward contract where a specified amount of one foreign currency will be exchanged for a specified amount of another foreign currency.
Options: The Fund purchased and/or wrote options in order to hedge against adverse market movements or fluctuations in value caused by changes in prevailing interest rates, value of equities or foreign currency exchange rates with respect to securities or financial instruments which the Fund currently owns or intends to purchase. The Fund may also use options to gain additional market exposure. The Fund’s principal reason for writing options is to realize, through receipt of premiums, a greater current return than would be realized on the underlying security alone. When the Fund purchases an option, it pays a premium and an amount equal to that premium is recorded as an asset. When the Fund writes an option, it receives a premium and an amount equal to that premium is recorded as a liability. The asset or liability is adjusted daily to reflect the current market value of the option. If an option expires unexercised, the Fund realizes a gain (loss) to the extent of the premium received or paid. If an option is exercised, the premium received or paid is recorded as an adjustment to the proceeds from the sale or the cost of the purchase in determining whether the Fund has realized a gain (loss). The difference between the premium and the amount received or paid at the closing of a purchase or sale transaction is also treated as a realized gain (loss). Gain (loss) on purchased options is included in net realized gain (loss) on investment transactions. Gain (loss) on written options is presented separately as net realized gain (loss) on options written transactions.
The Fund, as writer of an option, may have no control over whether the underlying securities or financial instruments may be sold (called) or purchased (put). As a result, the Fund bears the market risk of an unfavorable change in the price of the security or financial instrument underlying the written option. The Fund, as purchaser of an OTC option, bears the risk of the potential inability of the counterparties to meet the terms of their contracts. With exchange-traded options contracts, there is minimal counterparty credit risk to the Fund since the exchanges’ clearinghouse acts as counterparty to all exchange-traded options and guarantees the options contracts against default.
When the Fund writes an option on a swap, an amount equal to any premium received by the Fund is recorded as a liability and is subsequently adjusted to the current market value of the written option on the swap. If a call option on a swap is exercised, the Fund becomes obligated to pay a fixed interest rate (noted as the strike price) and receive a variable interest rate on a notional amount. If a put option on a swap is exercised, the Fund becomes obligated to pay a variable interest rate and receive a fixed interest rate (noted as the strike price) on a notional amount. Premiums received from writing options on swaps that expire or are exercised are treated as realized gains upon the expiration or exercise of such options on swaps. The risk associated with writing put and call options on swaps is that the Fund will be obligated to be party to a swap agreement if an option on a swap is exercised. The Fund
52
entered into options on swaps that are executed through a central clearing facility, such as a registered exchange. Such options pay or receive an amount known as “variation margin”, based on daily changes in the valuation of the contract. The daily variation margin, rather than the contract market value, is recorded for financial statement purposes on the Statement of Assets and Liabilities.
Financial Futures Contracts: A financial futures contract is an agreement to purchase (long) or sell (short) an agreed amount of securities at a set price for delivery on a future date. Upon entering into a financial futures contract, the Fund is required to deposit collateral with a futures commission merchant an amount of cash and/or other assets equal to a certain percentage of the contract amount. This amount is known as the “initial margin.” Subsequent payments, known as “variation margin,” are made or received by the Fund each day, equal to the change in the mark-to-market value of the futures contract. Such variation margin is recorded for financial statement purposes on a daily basis as unrealized gain (loss). When the contract expires or is closed, the gain (loss) is realized and is presented in the Statement of Operations as net realized gain (loss) on futures transactions.
The Fund invested in financial futures contracts in order to hedge its existing portfolio securities, or securities the Fund intends to purchase, against fluctuations in value caused by changes in prevailing interest rates. Should interest rates move unexpectedly, the Fund may not achieve the anticipated benefits of the financial futures contracts and may realize a loss. The use of futures transactions involves the risk of imperfect correlation in movements in the price of futures contracts, interest rates and the underlying hedged assets. Since futures contracts are exchange-traded, there is minimal counterparty credit risk to the Fund since the exchanges’ clearinghouse acts as counterparty to all exchange-traded futures and guarantees the futures contracts against default.
Swap Agreements: The Fund entered into certain types of swap agreements detailed in the disclosures below. A swap agreement is an agreement to exchange the return generated by one instrument for the return generated by another instrument. Swap agreements are negotiated in the OTC market and may be executed either directly with a counterparty (“OTC-traded”) or through a central clearing facility, such as a registered exchange. Swap agreements are valued daily at current market value and any change in value is included in the net unrealized appreciation or depreciation on swap agreements. Centrally cleared swaps pay or receive an amount known as “variation margin”, based on daily changes in the valuation of the swap contract. For OTC-traded, upfront premiums paid and received are shown as swap premiums paid and swap premiums received in the Statement of Assets and Liabilities. Risk of loss may exceed amounts recognized on the Statement of Assets and Liabilities. Swap agreements outstanding at period end, if any, are listed on the Schedule of Investments.
Interest Rate Swaps: Interest rate swaps represent an agreement between counterparties to exchange cash flows based on the difference between two interest rates, applied to a notional principal amount for a specified period. The Fund is subject to interest rate risk exposure in the normal course of pursuing its investment objective. The Fund used interest
PGIM Short-Term Corporate Bond Fund 53
Notes to Financial Statements (continued)
rate swaps to maintain its ability to generate steady cash flow by receiving a stream of fixed rate payments or to increase exposure to prevailing market rates by receiving floating rate payments. The Fund’s maximum risk of loss from counterparty credit risk is the discounted net present value of the cash flows to be received from the counterparty over the contract’s remaining life.
Credit Default Swaps (“CDS”): CDS involve one party (the protection buyer) making a stream of payments to another party (the protection seller) in exchange for the right to receive a specified payment in the event of a default or as a result of a default (collectively, a “credit event”) for the referenced entity (typically corporate issues or sovereign issues of an emerging country) on its obligation; or in the event of a write-down, principal shortfall, interest shortfall or default of all or part of the referenced entities comprising a credit index.
The Fund is subject to credit risk in the normal course of pursuing its investment objectives, and as such, has entered into CDS contracts to provide a measure of protection against defaults or to take an active long or short position with respect to the likelihood of a particular issuer’s default or the reference entity’s credit soundness. CDS contracts generally trade based on a spread which represents the cost a protection buyer has to pay the protection seller. The protection buyer is said to be “short the credit” because the higher the contract value rises, the more the credit deteriorates. The value of the CDS contract increases for the protection buyer if the spread increases. The Fund’s maximum risk of loss from counterparty credit risk for purchased CDS is the inability of the counterparty to honor the contract up to the notional value due to a credit event.
As a seller of protection on credit default swap agreements, the Fund generally receives an agreed upon payment from the buyer of protection throughout the term of the swap, provided no credit event occurs. As the seller, the Fund effectively increases its investment risk because, in addition to its total net assets, the Fund may be subject to investment exposure on the notional amount of the swap.
The maximum amount of the payment that the Fund, as a seller of protection, could be required to make under a credit default swap agreement would be equal to the notional amount of the underlying security or index contract as a result of a credit event. This potential amount will be partially offset by any recovery values of the respective referenced obligations or net amounts received from the settlement of buy protection credit default swap agreements which the Fund entered into for the same referenced entity or index. As a buyer of protection, the Fund generally receives an amount up to the notional value of the swap if a credit event occurs.
Implied credit spreads, represented in absolute terms, utilized in determining the market value of credit default swap agreements where the Fund is the seller of protection as of
54
period end are disclosed in the footnotes to the Schedule of Investments, if applicable. These spreads serve as indicators of the current status of the payment/performance risk and represent the likelihood of default risk for the credit derivative. The implied credit spread of a particular referenced entity reflects the cost of buying/selling protection and may include upfront payments required to enter into the agreement. Wider credit spreads and increased market value in absolute terms, when compared to the notional amount of the swap, represent a deterioration of the referenced entity’s credit soundness and a greater likelihood of risk of default or other credit event occurring as defined under the terms of the agreement.
Mortgage-Backed and Asset-Backed Securities: Mortgage-backed securities are pass-through securities, meaning that principal and interest payments made by the borrower on the underlying mortgages are passed through to the Fund. Asset-backed securities directly or indirectly represent a participation interest in, or are secured by and payable from, a stream of payments generated by particular assets such as motor vehicle or credit card receivables. Asset-backed securities may be classified as pass-through certificates or collateralized obligations, such as collateralized bond obligations, collateralized loan obligations and other similarly structured securities. The value of mortgage-backed and asset-backed securities varies with changes in interest rates and may be affected by changes in credit quality or value of the mortgage loans or other assets that support the securities.
Stripped mortgage-backed securities are usually structured with two classes that receive different proportions of the interest (“IO”) and principal (“PO”) distributions on a pool of mortgage assets. Payments received for IOs are included in interest income on the Statements of Operations. Because no principal will be received at the maturity of an IO, adjustments are made to the cost of the security on a monthly basis until maturity. These adjustments are included in interest income on the Statements of Operations. Payments received for POs are treated as reductions to the cost and par value of the securities.
Master Netting Arrangements: The RIC, on behalf of the Fund, is subject to various Master Agreements, or netting arrangements, with select counterparties. These are agreements which a subadviser may have negotiated and entered into on behalf of all or a portion of the Fund. A master netting arrangement between the Fund and the counterparty permits the Fund to offset amounts payable by the Fund to the same counterparty against amounts to be received and by the receipt of collateral from the counterparty by the Fund to cover the Fund’s exposure to the counterparty. However, there is no assurance that such mitigating factors are easily enforceable. In addition to master netting arrangements, the right to set-off exists when all the conditions are met such that each of the parties owes the other determinable amounts, the reporting party has the right to set-off the amount owed with the amount owed by the other party, the reporting party intends to set-off and the right of set-off is enforceable by law.
The RIC, on behalf of the Fund, is a party to International Swaps and Derivatives Association, Inc. (“ISDA”) Master Agreements with certain counterparties that govern OTC
PGIM Short-Term Corporate Bond Fund 55
Notes to Financial Statements (continued)
derivative and foreign exchange contracts entered into from time to time. The Master Agreements may contain provisions regarding, among other things, the parties’ general obligations, representations, agreements, collateral requirements, events of default and early termination. With respect to certain counterparties, in accordance with the terms of the Master Agreements, collateral posted to the Fund is held in a segregated account by the Fund’s custodian and with respect to those amounts which can be sold or re-pledged, is presented in the Schedule of Investments. Collateral pledged by the Fund is segregated by the Fund’s custodian and identified in the Schedule of Investments. Collateral can be in the form of cash or debt securities issued by the U.S. Government or related agencies or other securities as agreed to by the Fund and the applicable counterparty. Collateral requirements are determined based on the Fund’s net position with each counterparty. Termination events applicable to the Fund may occur upon a decline in the Fund’s net assets below a specified threshold over a certain period of time. Termination events applicable to counterparties may occur upon a decline in the counterparty’s long-term and short-term credit ratings below a specified level. In each case, upon occurrence, the other party may elect to terminate early and cause settlement of all derivative and foreign exchange contracts outstanding, including the payment of any losses and costs resulting from such early termination, as reasonably determined by the terminating party. Any decision by one or more of the Fund’s counterparties to elect early termination could impact the Fund’s future derivative activity.
In addition to each instrument’s primary underlying risk exposure (e.g. interest rate, credit, equity or foreign exchange, etc.), swap agreements involve, to varying degrees, elements of credit, market and documentation risk. Such risks involve the possibility that no liquid market for these agreements will exist, the counterparty to the agreement may default on its obligation to perform or disagree on the contractual terms of the agreement, and changes in net interest rates will be unfavorable. In connection with these agreements, securities in the portfolio may be identified or received as collateral from the counterparty in accordance with the terms of the respective swap agreements to provide or receive assets of value and to serve as recourse in the event of default or bankruptcy/insolvency of either party. Such OTC derivative agreements include conditions which, when materialized, give the counterparty the right to cause an early termination of the transactions under those agreements. Any election by the counterparty for early termination of the contract(s) may impact the amounts reported on financial statements.
Short sales and OTC contracts, including forward foreign currency exchange contracts, swaps, forward rate agreements and written options involve elements of both market and credit risk in excess of the amounts reflected on the Statement of Assets and Liabilities, if applicable. Such risks may be mitigated by engaging in master netting arrangements.
Securities Lending: The Fund lends its portfolio securities to banks and broker-dealers. The loans are secured by collateral at least equal to the market value of the securities loaned.
56
Collateral pledged by each borrower is invested in an affiliated money market fund and is marked to market daily, based on the previous day’s market value, such that the value of the collateral exceeds the value of the loaned securities. In the event of significant appreciation in value of the securities on loan on the last business day of the reporting period, the financial statements may reflect a collateral value that is less than the market value of the loaned securities. Such shortfall is remedied as described above. Loans are subject to termination at the option of the borrower or the Fund. Upon termination of the loan, the borrower will return to the Fund securities identical to the loaned securities. The remaining open loans of the securities lending transactions are considered overnight and continuous. Should the borrower of the securities fail financially, the Fund has the right to repurchase the securities in the open market using the collateral.
The Fund recognizes income, net of any rebate and securities lending agent fees, for lending its securities in the form of fees or interest on the investment of any cash received as collateral. The borrower receives all interest and dividends from the securities loaned and such payments are passed back to the lender in amounts equivalent thereto, which are reflected in interest income or unaffiliated dividend income based on the nature of the payment on the Statement of Operations. The Fund also continues to recognize any unrealized gain (loss) in the market price of the securities loaned and on the change in the value of the collateral invested that may occur during the term of the loan. In addition, realized gain (loss) is recognized on changes in the value of the collateral invested upon liquidation of the collateral. Net earnings from securities lending are disclosed in the Statement of Operations.
Securities Transactions and Net Investment Income: Securities transactions are recorded on the trade date. Realized gains (losses) from investment and currency transactions are calculated on the specific identification method. Dividend income is recorded on the ex-date, or for certain foreign securities, when the Fund becomes aware of such dividends. Interest income, including amortization of premium and accretion of discount on debt securities, as required, is recorded on the accrual basis. Expenses are recorded on an accrual basis, which may require the use of certain estimates by management that may differ from actual expense amounts. Net investment income or loss (other than class specific expenses and waivers, which are allocated as noted below) and unrealized and realized gains (losses) are allocated daily to each class of shares based upon the relative proportion of adjusted net assets of each class at the beginning of the day. Class specific expenses and waivers, where applicable, are charged to the respective share classes. Such class specific expenses and waivers include distribution fees and distribution fee waivers, shareholder servicing fees, transfer agent’s fees and expenses, registration fees and fee waivers and/or expense reimbursements, as applicable.
Taxes: It is the Fund’s policy to continue to meet the requirements of the Internal Revenue Code applicable to regulated investment companies and to distribute all of its taxable net investment income and capital gains, if any, to its shareholders. Therefore, no federal
PGIM Short-Term Corporate Bond Fund 57
Notes to Financial Statements (continued)
income tax provision is required. Withholding taxes on foreign dividends, interest and capital gains, if any, are recorded, net of reclaimable amounts, at the time the related income is earned.
Dividends and Distributions: Dividends and distributions to shareholders, which are determined in accordance with federal income tax regulations and which may differ from GAAP, are recorded on the ex-date. Permanent book/tax differences relating to income and gain (loss) are reclassified between total distributable earnings (loss) and paid-in capital in excess of par, as appropriate. The chart below sets forth the expected frequency of dividend and capital gains distributions to shareholders. Various factors may impact the frequency of dividend distributions to shareholders, including but not limited to adverse market conditions or portfolio holding-specific events.
| | | | |
| | |
| Expected Distribution Schedule to Shareholders* | | Frequency | |
Net Investment Income | | | Monthly | |
Short-Term Capital Gains | | | Annually | |
Long-Term Capital Gains | | | Annually | |
| * | Under certain circumstances, the Fund may make more than one distribution of short-term and/or long-term capital gains during a fiscal year. |
Estimates: The preparation of financial statements requires management to make estimates and assumptions that affect the reported amounts and disclosures in the financial statements. Actual results could differ from those estimates.
The RIC, on behalf of the Fund, has entered into a management agreement with the Manager pursuant to which it has responsibility for all investment advisory services, including supervision of the subadviser’s performance of such services, and for rendering administrative services.
The Manager has entered into a subadvisory agreement with PGIM, Inc., which provides subadvisory services to the Fund through its business unit PGIM Fixed Income, and PGIM Limited (the “subadviser”). The Manager pays for the services of the subadviser.
Fees payable under the management agreement are computed daily and paid monthly. For the reporting period ended December 31, 2024, the contractual and effective management fee rates were as follows:
| | |
| | |
| Contractual Management Rate | | Effective Management Fee, before any waivers
and/or expense reimbursements |
0.380% on average daily net assets up to $10 billion; | | 0.38% |
58
| | | | |
| | |
| Contractual Management Rate | | Effective Management Fee, before any waivers
and/or expense reimbursements | |
0.370% on average daily net assets over $10 billion. | | | | |
The Manager has contractually agreed, through April 30, 2026, to limit total annual fund operating expenses, after fee waivers and/or expense reimbursements. This contractual expense limitation excludes interest, brokerage, taxes (such as income and foreign withholding taxes, stamp duty and deferred tax expenses), acquired fund fees and expenses, extraordinary expenses, and certain other Fund expenses such as dividend and interest expense and broker charges on short sales.
Where applicable, the Manager agrees to waive management fees or shared operating expenses on any share class to the same extent that it waives such expenses on any other share class. In addition, total annual operating expenses for Class R6 shares will not exceed total annual operating expenses for Class Z shares. Fees and/or expenses waived and/or reimbursed by the Manager for the purpose of preventing the expenses from exceeding a certain expense ratio limit may be recouped by the Manager within the same fiscal year during which such waiver and/or reimbursement is made if such recoupment can be realized without exceeding the expense limit in effect at the time of the waiver/reimbursement and/or recoupment for that fiscal year, as applicable. The expense limitations attributable to each class are as follows:
| | | | |
| | |
| Class | | Expense
Limitations |
A | | | — | % |
C | | | — | |
R | | | — | |
Z | | | 0.47 | |
R2 | | | 0.88 | |
R4 | | | 0.63 | |
R6 | | | 0.38 | |
The RIC, on behalf of the Fund, has a distribution agreement with Prudential Investment Management Services LLC (“PIMS”), which acts as the distributor of the Class A, Class C, Class R, Class Z, Class R2, Class R4 and Class R6 shares of the Fund. The Fund compensates PIMS for distributing and servicing the Fund’s Class A, Class C, Class R and Class R2 shares, pursuant to the plans of distribution (the “Distribution Plans”), regardless of expenses actually incurred by PIMS.
Pursuant to the Distribution Plans, the Fund compensates PIMS for distribution related activities at an annual rate based on average daily net assets per class. PIMS contractually agreed through April 30, 2026 to limit such fees on certain classes based on the daily net assets. The distribution fees are accrued daily and payable monthly.
The Fund has adopted a Shareholder Services Plan with respect to Class R2 and Class R4 shares. Under the terms of the Shareholder Services Plan, Class R2 and Class R4 shares are authorized to compensate Prudential Mutual Fund Services LLC (“PMFS”), its affiliates
PGIM Short-Term Corporate Bond Fund 59
Notes to Financial Statements (continued)
or third-party service providers for services rendered to the shareholders of such Class R2 or Class R4 shares. The shareholder service fee is accrued daily and paid monthly, as applicable.
The Fund’s annual gross and net distribution rates and maximum shareholder service fee, where applicable, are as follows:
| | | | | | | | | | | | | | | |
| | | | |
| Class | | Gross Distribution Fee | | Net Distribution Fee | | Shareholder Service Fee |
A | | | | 0.25 | % | | | | 0.25 | % | | | | N/A% | |
C | | | | 1.00 | | | | | 1.00 | | | | | N/A | |
R | | | | 0.75 | | | | | 0.50 | | | | | N/A | |
Z | | | | N/A | | | | | N/A | | | | | N/A | |
R2 | | | | 0.25 | | | | | 0.25 | | | | | 0.10 | |
R4 | | | | N/A | | | | | N/A | | | | | 0.10 | |
R6 | | | | N/A | | | | | N/A | | | | | N/A | |
For the year ended December 31, 2024, PIMS received front-end sales charges (“FESL”) resulting from sales of certain class shares and contingent deferred sales charges (“CDSC”) imposed upon redemptions by certain shareholders. From these fees, PIMS paid such sales charges to broker-dealers, who in turn paid commissions to salespersons and incurred other distribution costs. The sales charges are as follows where applicable:
| | | | | | | | |
| | | |
| Class | | FESL | | | CDSC | |
A | | | $331,198 | | | | $41,009 | |
C | | | — | | | | 11,392 | |
PGIM Investments, PGIM, Inc., PGIM Limited, PIMS and PMFS are indirect, wholly-owned subsidiaries of Prudential Financial, Inc. (“Prudential”).
| 4. | Other Transactions with Affiliates |
PMFS serves as the Fund’s transfer agent and shareholder servicing agent. Transfer agent’s and shareholder servicing agent’s fees and expenses in the Statement of Operations include certain out-of-pocket expenses paid to non-affiliates, where applicable.
The Fund may invest its overnight sweep cash in the PGIM Core Government Money Market Fund (the “Core Government Fund”), a series of the Prudential Government Money Market Fund, Inc., and its securities lending cash collateral in the PGIM Institutional Money Market Fund (“the Money Market Fund”), a series of Prudential Investment Portfolios 2, each registered under the 1940 Act and managed by PGIM Investments. PGIM Investments and/or its affiliates are paid fees or reimbursed for providing their services to the Core Government Fund and the Money Market Fund. In addition to the realized and unrealized gains on investments in the Core Government Fund and the Money Market Fund, earnings
60
from such investments are disclosed on the Statement of Operations as “Affiliated dividend income” and “Income from securities lending, net”, respectively.
The Fund may enter into certain securities purchase or sale transactions under Board approved Rule 17a-7 procedures. Rule 17a-7 is an exemptive rule under the 1940 Act that, subject to certain conditions, permits purchase and sale transactions among affiliated investment companies, or between an investment company and a person that is affiliated solely by reason of having a common (or affiliated) investment adviser, common directors/trustees, and/or common officers. For the year ended December 31, 2024, no Rule 17a-7 transactions were entered into by the Fund.
The aggregate cost of purchases and proceeds from sales of portfolio securities (excluding short-term investments and U.S. Government securities) for the year ended December 31, 2024, were as follows:
| | |
| | |
| Cost of Purchases | | Proceeds from Sales |
$3,857,742,123 | | $4,830,498,175 |
A summary of the cost of purchases and proceeds from sales of shares of affiliated mutual funds for the year ended December 31, 2024, is presented as follows:
| | | | | | | | | | | | | | | | | | | | | | | | | | | | | | | | | | | | | | | | | | |
| | | | | | | | | | | | | | |
Value,
Beginning of Year | | | | Cost of
Purchases | | | | Proceeds
from Sales | | | | Change in
Unrealized Gain (Loss) | | | | Realized Gain (Loss) | | | | Value, End of Year | | Shares, End of Year | | | | | Income | |
| | | | | | |
Short-Term Investments - Affiliated Mutual Funds: | | | | | | | | | | | | | | | | | | | | |
|
PGIM Core Government Money Market Fund (7-day effective yield 4.604%)(1)(wb) | |
| $ 22,302,705 | | | | $2,755,195,204 | | | | $2,565,167,443 | | | | $ — | | | | $ — | | | | $212,330,466 | | | | | | | 212,330,466 | | | | | | | | | | | | | | $5,695,386 | |
| | | |
PGIM Institutional Money Market Fund (7-day effective yield 4.649%)(1)(b)(wb) | | | | | | | | | | | |
| 194,188,636 | | | | 943,991,513 | | | | 1,027,494,650 | | | | (132,290) | | | | 98,942 | | | | 110,652,151 | | | | | | | 110,718,582 | | | | | | | | | | | | | | 318,584(2) | |
| $216,491,341 | | | | $3,699,186,717 | | | | $3,592,662,093 | | | | $(132,290) | | | | $98,942 | | | | $322,982,617 | | | | | | | | | | | | | | | | | | | | | $6,013,970 | |
| (1) | The Fund did not have any capital gain distributions during the reporting period. |
| (2) | The amount, or a portion thereof, represents the affiliated securities lending income shown on the Statement of Operations. |
| (b) | Represents security, or portion thereof, purchased with cash collateral received for securities on loan and includes dividend reinvestment. |
| (wb) | Represents an investment in a Fund affiliated with the Manager. |
| 6. | Distributions and Tax Information |
Distributions to shareholders, which are determined in accordance with federal income tax regulations and which may differ from GAAP, are recorded on the ex-date.
PGIM Short-Term Corporate Bond Fund 61
Notes to Financial Statements (continued)
For the year ended December 31, 2024, the tax character of dividends paid as reflected in the Statement of Changes in Net Assets were as follows:
| | | | | | | | |
| | | | | |
| | | Ordinary
Income | | Long-Term
Capital Gains | | Tax Return
of Capital | | Total Dividends
and Distributions |
| | | $331,964,424 | | $— | | $— | | $331,964,424 |
For the year ended December 31, 2023, the tax character of dividends paid as reflected in the Statement of Changes in Net Assets were as follows:
| | | | | | | | |
| | | | | |
| | | Ordinary
Income | | Long-Term
Capital Gains | | Tax Return
of Capital | | Total Dividends and Distributions |
| | | $331,459,523 | | $— | | $— | | $331,459,523 |
For the year ended December 31, 2024, the Fund had the following amounts of accumulated undistributed earnings on a tax basis:
| | |
| | |
Undistributed Ordinary Income | | Undistributed Long-Term Capital Gains |
$433,909 | | $— |
The United States federal income tax basis of the Fund’s investments and the net unrealized depreciation as of December 31, 2024 were as follows:
| | | | | | |
| | | | |
| Tax Basis | | Gross
Unrealized
Appreciation | | Gross
Unrealized
Depreciation | | Net
Unrealized
Depreciation |
| $8,622,037,019 | | $68,509,097 | | $(267,070,131) | | $(198,561,034) |
The difference between GAAP and tax basis were primarily attributable to deferred losses on wash sales, market discount accretion, bond premium amortization, mark-to-market of futures and swaps contracts and other GAAP to tax differences.
For federal income tax purposes, the Fund had an approximated capital loss carryforward as of December 31, 2024 which can be carried forward for an unlimited period. No capital gains distributions are expected to be paid to shareholders until net gains have been realized in excess of such losses.
| | |
| | |
Capital Loss
Carryforward | | Capital Loss
Carryforward Utilized |
$866,601,000 | | $— |
The Manager has analyzed the Fund’s tax positions taken on federal, state and local income tax returns for all open tax years and has concluded that no provision for income tax is required in the Fund’s financial statements for the current reporting period. Since tax
62
authorities can examine previously filed tax returns, the Fund’s U.S. federal and state tax returns for each of the four fiscal years up to the most recent fiscal year ended December 31, 2024 are subject to such review.
The Fund offers Class A, Class C, Class R, Class Z, Class R2, Class R4 and Class R6 shares. Class A shares are sold with a maximum front-end sales charge of 2.25%. Investors who purchase $250,000 or more of Class A shares and sell those shares within 18 months of purchase are subject to a contingent deferred sales charge (“CDSC”) of 1.00% on sales although these purchases are not subject to a front-end sales charge. The Class A CDSC is waived for certain retirement and/or benefit plans. A special exchange privilege is also available for shareholders who qualified to purchase Class A shares at net asset value. Class C shares are sold with a CDSC of 1% on sales made within 12 months of purchase. Class C shares will automatically convert to Class A shares on a monthly basis approximately eight years (ten years prior to January 22, 2021) after purchase. Class R shares are available to certain retirement plans, clearing and settlement firms. Class R, Class Z, Class R2, Class R4 and Class R6 shares are not subject to any sales or redemption charges and are available exclusively for sale to a limited group of investors.
Under certain circumstances, an exchange may be made from specified share classes of the Fund to one or more other share classes of the Fund as presented in the table of transactions in shares of common stock, below.
The RIC is authorized to issue 30,025,000,000 shares of capital stock, $0.01 par value per share, designated as shares of the Fund. The authorized shares of the Fund are currently classified and designated as follows:
| | | | |
| | |
| Class | | Number of Shares | |
A | | | 3,500,000,000 | |
B | | | 5,000,000 | |
C | | | 700,000,000 | |
R | | | 250,000,000 | |
Z | | | 15,000,000,000 | |
T | | | 170,000,000 | |
R2 | | | 200,000,000 | |
R4 | | | 200,000,000 | |
R6 | | | 10,000,000,000 | |
The Fund currently does not have any Class B or Class T shares outstanding.
As of December 31, 2024, Prudential, through its affiliated entities, including affiliated funds (if applicable), owned shares of the Fund as follows:
| | | | |
| | | |
| Class | | Number of Shares | | Percentage of Outstanding Shares |
Z | | 37,812 | | 0.1% |
PGIM Short-Term Corporate Bond Fund 63
Notes to Financial Statements (continued)
At the reporting period end, the number of shareholders holding greater than 5% of the Fund are as follows:
| | | | |
| | | |
| | | Number of Shareholders | | Percentage of Outstanding Shares |
Affiliated | | — | | —% |
Unaffiliated | | 9 | | 87.1 |
Transactions in shares of common stock were as follows:
| | | | | | | | | | |
| | | | |
| Share Class | | Shares | | | | | Amount | |
| | | |
Class A | | | | | | | | | | |
Year ended December 31, 2024: | | | | | | | | | | |
Shares sold | | | 19,169,283 | | | | | $ | 201,960,809 | |
Shares issued in reinvestment of dividends and distributions | | | 3,352,416 | | | | | | 35,298,966 | |
Shares purchased | | | (32,004,275 | ) | | | | | (336,710,531 | ) |
Net increase (decrease) in shares outstanding before conversion | | | (9,482,576 | ) | | | | | (99,450,756 | ) |
Shares issued upon conversion from other share class(es) | | | 4,988,853 | | | | | | 52,461,656 | |
Shares purchased upon conversion into other share class(es) | | | (3,213,040 | ) | | | | | (33,655,781 | ) |
Net increase (decrease) in shares outstanding | | | (7,706,763 | ) | | | | $ | (80,644,881 | ) |
| | | |
Year ended December 31, 2023: | | | | | | | | | | |
Shares sold | | | 19,833,644 | | | | | $ | 203,050,845 | |
Shares issued in reinvestment of dividends and distributions | | | 3,274,014 | | | | | | 33,551,585 | |
Shares purchased | | | (36,320,789 | ) | | | | | (371,922,677 | ) |
Net increase (decrease) in shares outstanding before conversion | | | (13,213,131 | ) | | | | | (135,320,247 | ) |
Shares issued upon conversion from other share class(es) | | | 6,109,264 | | | | | | 62,485,823 | |
Shares purchased upon conversion into other share class(es) | | | (2,915,322 | ) | | | | | (29,799,500 | ) |
Net increase (decrease) in shares outstanding | | | (10,019,189 | ) | | | | $ | (102,633,924 | ) |
| | | |
Class C | | | | | | | | | | |
Year ended December 31, 2024: | | | | | | | | | | |
Shares sold | | | 1,613,838 | | | | | $ | 17,008,077 | |
Shares issued in reinvestment of dividends and distributions | | | 320,462 | | | | | | 3,372,417 | |
Shares purchased | | | (3,189,774 | ) | | | | | (33,553,356 | ) |
Net increase (decrease) in shares outstanding before conversion | | | (1,255,474 | ) | | | | | (13,172,862 | ) |
Shares purchased upon conversion into other share class(es) | | | (2,637,586 | ) | | | | | (27,744,719 | ) |
Net increase (decrease) in shares outstanding | | | (3,893,060 | ) | | | | $ | (40,917,581 | ) |
64
| | | | | | | | | | |
| | | | |
| Share Class | | Shares | | | | | Amount | |
| | | |
Year ended December 31, 2023: | | | | | | | | | | |
Shares sold | | | 2,259,513 | | | | | $ | 23,137,523 | |
Shares issued in reinvestment of dividends and distributions | | | 390,384 | | | | | | 4,000,463 | |
Shares purchased | | | (5,265,509 | ) | | | | | (53,927,599 | ) |
Net increase (decrease) in shares outstanding before conversion | | | (2,615,612 | ) | | | | | (26,789,613 | ) |
Shares purchased upon conversion into other share class(es) | | | (3,097,995 | ) | | | | | (31,684,439 | ) |
Net increase (decrease) in shares outstanding | | | (5,713,607 | ) | | | | $ | (58,474,052 | ) |
| | | |
Class R | | | | | | | | | | |
Year ended December 31, 2024: | | | | | | | | | | |
Shares sold | | | 345,210 | | | | | $ | 3,635,989 | |
Shares issued in reinvestment of dividends and distributions | | | 285,167 | | | | | | 3,002,783 | |
Shares purchased | | | (1,330,178 | ) | | | | | (13,992,214 | ) |
Net increase (decrease) in shares outstanding | | | (699,801 | ) | | | | $ | (7,353,442 | ) |
| | | |
Year ended December 31, 2023: | | | | | | | | | | |
Shares sold | | | 371,724 | | | | | $ | 3,818,222 | |
Shares issued in reinvestment of dividends and distributions | | | 283,075 | | | | | | 2,900,753 | |
Shares purchased | | | (1,928,635 | ) | | | | | (19,722,506 | ) |
Net increase (decrease) in shares outstanding | | | (1,273,836 | ) | | | | $ | (13,003,531 | ) |
| | | |
Class Z | | | | | | | | | | |
Year ended December 31, 2024: | | | | | | | | | | |
Shares sold | | | 144,203,294 | | | | | $ | 1,521,582,813 | |
Shares issued in reinvestment of dividends and distributions | | | 16,687,191 | | | | | | 176,108,398 | |
Shares purchased | | | (190,869,920 | ) | | | | | (2,011,960,759 | ) |
Net increase (decrease) in shares outstanding before conversion | | | (29,979,435 | ) | | | | | (314,269,548 | ) |
Shares issued upon conversion from other share class(es) | | | 6,494,666 | | | | | | 68,698,574 | |
Shares purchased upon conversion into other share class(es) | | | (6,855,656 | ) | | | | | (72,895,848 | ) |
Net increase (decrease) in shares outstanding | | | (30,340,425 | ) | | | | $ | (318,466,822 | ) |
| | | |
Year ended December 31, 2023: | | | | | | | | | | |
Shares sold | | | 211,416,313 | | | | | $ | 2,171,195,873 | |
Shares issued in reinvestment of dividends and distributions | | | 16,907,020 | | | | | | 173,674,034 | |
Shares purchased | | | (269,532,947 | ) | | | | | (2,765,170,184 | ) |
Net increase (decrease) in shares outstanding before conversion | | | (41,209,614 | ) | | | | | (420,300,277 | ) |
Shares issued upon conversion from other share class(es) | | | 3,507,038 | | | | | | 35,948,306 | |
Shares purchased upon conversion into other share class(es) | | | (5,612,266 | ) | | | | | (57,452,222 | ) |
Net increase (decrease) in shares outstanding | | | (43,314,842 | ) | | | | $ | (441,804,193 | ) |
PGIM Short-Term Corporate Bond Fund 65
Notes to Financial Statements (continued)
| | | | | | | | | | |
| | | | |
| Share Class | | Shares | | | | | Amount | |
| | | |
Class R2 | | | | | | | | | | |
Year ended December 31, 2024: | | | | | | | | | | |
Shares sold | | | 29,959 | | | | | $ | 319,918 | |
Shares issued in reinvestment of dividends and distributions | | | 4,405 | | | | | | 46,596 | |
Shares purchased | | | (22,033 | ) | | | | | (233,595 | ) |
Net increase (decrease) in shares outstanding before conversion | | | 12,331 | | | | | | 132,919 | |
Shares purchased upon conversion into other share class(es) | | | (2,968 | ) | | | | | (31,133 | ) |
Net increase (decrease) in shares outstanding | | | 9,363 | | | | | $ | 101,786 | |
| | | |
Year ended December 31, 2023: | | | | | | | | | | |
Shares sold | | | 40,812 | | | | | $ | 419,149 | |
Shares issued in reinvestment of dividends and distributions | | | 3,492 | | | | | | 35,924 | |
Shares purchased | | | (6,802 | ) | | | | | (69,684 | ) |
Net increase (decrease) in shares outstanding | | | 37,502 | | | | | $ | 385,389 | |
| | | |
Class R4 | | | | | | | | | | |
Year ended December 31, 2024: | | | | | | | | | | |
Shares sold | | | 67,690 | | | | | $ | 718,122 | |
Shares issued in reinvestment of dividends and distributions | | | 3,509 | | | | | | 37,126 | |
Shares purchased | | | (19,782 | ) | | | | | (209,676 | ) |
Net increase (decrease) in shares outstanding | | | 51,417 | | | | | $ | 545,572 | |
| | | |
Year ended December 31, 2023: | | | | | | | | | | |
Shares sold | | | 31,281 | | | | | $ | 320,969 | |
Shares issued in reinvestment of dividends and distributions | | | 2,694 | | | | | | 27,707 | |
Shares purchased | | | (40,724 | ) | | | | | (418,445 | ) |
Net increase (decrease) in shares outstanding | | | (6,749 | ) | | | | $ | (69,769 | ) |
| | | |
Class R6 | | | | | | | | | | |
Year ended December 31, 2024: | | | | | | | | | | |
Shares sold | | | 39,631,866 | | | | | $ | 418,259,894 | |
Shares issued in reinvestment of dividends and distributions | | | 6,895,487 | | | | | | 72,834,897 | |
Shares purchased | | | (87,227,018 | ) | | | | | (922,409,186 | ) |
Net increase (decrease) in shares outstanding before conversion | | | (40,699,665 | ) | | | | | (431,314,395 | ) |
Shares issued upon conversion from other share class(es) | | | 4,918,425 | | | | | | 52,480,167 | |
Shares purchased upon conversion into other share class(es) | | | (3,695,093 | ) | | | | | (39,312,916 | ) |
Net increase (decrease) in shares outstanding | | | (39,476,333 | ) | | | | $ | (418,147,144 | ) |
66
| | | | | | | | | | | | |
| | | | |
| Share Class | | Shares | | | | | | Amount | |
| | | |
Year ended December 31, 2023: | | | | | | | | | | | | |
Shares sold | | | 46,625,714 | | | | | | | $ | 479,028,481 | |
Shares issued in reinvestment of dividends and distributions | | | 7,096,816 | | | | | | | | 72,947,705 | |
Shares purchased | | | (90,450,142 | ) | | | | | | | (928,861,236 | ) |
Net increase (decrease) in shares outstanding before conversion | | | (36,727,612 | ) | | | | | | | (376,885,050 | ) |
Shares issued upon conversion from other share class(es) | | | 2,478,830 | | | | | | | | 25,341,042 | |
Shares purchased upon conversion into other share class(es) | | | (471,238 | ) | | | | | | | (4,839,010 | ) |
Net increase (decrease) in shares outstanding | | | (34,720,020 | ) | | | | | | $ | (356,383,018 | ) |
8. Borrowings
The RIC, on behalf of the Fund, along with other affiliated registered investment companies (the “Participating Funds”), is a party to a Syndicated Credit Agreement (“SCA”) with a group of banks. The purpose of the SCA is to provide an alternative source of temporary funding for capital share redemptions. The table below provides details of the current SCA in effect at the reporting period-end as well as the prior SCA.
| | | | |
| | | |
| | | Current SCA | | Prior SCA |
| | |
Term of Commitment | | 9/27/2024 – 9/25/2025 | | 9/29/2023 – 9/26/2024 |
| | | |
Total Commitment | | $ 1,200,000,000 | | $ 1,200,000,000 |
| | |
Annualized Commitment Fee on the Unused Portion of the SCA | | 0.15% | | 0.15% |
| | |
Annualized Interest Rate on Borrowings | | 1.00% plus the higher of (1)
the effective federal funds
rate, (2) the daily SOFR
rate plus 0.10% or (3) zero
percent | | 1.00% plus the higher of (1)
the effective federal funds
rate, (2) the daily SOFR
rate plus 0.10% or (3) zero
percent |
Certain affiliated registered investment companies that are parties to the SCA include portfolios that are subject to a predetermined mathematical formula used to manage certain benefit guarantees offered under variable annuity contracts. The formula may result in large scale asset flows into and out of these portfolios. Consequently, these portfolios may be more likely to utilize the SCA for purposes of funding redemptions. It may be possible for those portfolios to fully exhaust the committed amount of the SCA, thereby requiring the Manager to allocate available funding per a Board-approved methodology designed to treat the Participating Funds in the SCA equitably.
The Fund did not utilize the SCA during the year ended December 31, 2024.
9. Risks of Investing in the Fund
The Fund’s principal risks include, but are not limited to, some or all of the risks discussed below. For further information on the Fund’s risks, please refer to the Fund’s Prospectus and Statement of Additional Information.
PGIM Short-Term Corporate Bond Fund 67
Notes to Financial Statements (continued)
Credit Risk: This is the risk that the issuer, the guarantor or the insurer of a fixed income security, or the counterparty to a contract, may be unable or unwilling to make timely principal and interest payments, or to otherwise honor its obligations. Additionally, fixed income securities could lose value due to a loss of confidence in the ability of the issuer, guarantor, insurer or counterparty to pay back debt. The lower the credit quality of a bond, the more sensitive it is to credit risk.
Debt Obligations Risk: Debt obligations are fixed income investments that are subject to credit risk, market risk and interest rate risk. The Fund’s holdings, share price, yield and total return may also fluctuate in response to bond market movements. The value of bonds may decline for issuer-related reasons, including management performance, financial leverage and reduced demand for the issuer’s goods and services. Certain types of fixed income obligations also may be subject to “call and redemption risk,” which is the risk that the issuer may call a bond held by the Fund for redemption before it matures and the Fund may not be able to reinvest at the same rate of interest and therefore would earn less income.
Derivatives Risk: Derivatives involve special risks and costs and may result in losses to the Fund. The successful use of derivatives requires sophisticated management, and, to the extent that derivatives are used, the Fund will depend on the subadviser’s ability to analyze and manage derivatives transactions. The prices of derivatives may move in unexpected ways, especially in abnormal market conditions. Some derivatives are “leveraged” or may create economic leverage for the Fund and therefore may magnify or otherwise increase investment losses to the Fund. The Fund’s use of derivatives may also increase the amount of taxes payable by shareholders.
Other risks arise from the potential inability to terminate or sell derivatives positions. A liquid secondary market may not always exist for the Fund’s derivatives positions. In fact, many over-the-counter derivative instruments will not have liquidity beyond the counterparty to the instrument. Over-the-counter derivative instruments also involve the risk that the other party will not meet its obligations to the Fund. The use of derivatives also exposes the Fund to operational issues, such as documentation and settlement issues, systems failures, inadequate control and human error.
Derivatives may also involve legal risks, such as insufficient documentation, the lack of capacity or authority of a counterparty to execute or settle a transaction, and the legality and enforceability of derivatives contracts. The U.S. Government and foreign governments have adopted (and may adopt further) regulations governing derivatives markets, including mandatory clearing of certain derivatives, margin and reporting requirements and risk
68
exposure limitations. Regulation of derivatives may make derivatives more costly, limit their availability or utility to the Fund, or otherwise adversely affect their performance or disrupt markets.
Economic and Market Events Risk: Events in the U.S. and global financial markets, including actions taken by the U.S. Federal Reserve or foreign central banks to stimulate or stabilize economic growth or the functioning of the securities markets, or otherwise reduce inflation may at times result in unusually high market volatility, which could negatively impact performance. Governmental efforts to curb inflation often have negative effects on the level of economic activity. Relatively reduced liquidity in credit and fixed income markets could adversely affect issuers worldwide.
Foreign Securities Risk: Investments in securities of non-U.S. issuers (including those denominated in U.S. dollars) may involve more risk than investing in securities of U.S. issuers. Foreign political, economic and legal systems, especially those in developing and emerging market countries, may be less stable and more volatile than in the United States. Foreign legal systems generally have fewer regulatory requirements than the U.S. legal system, particularly those of emerging markets. In general, less information is publicly available with respect to non-U.S. companies than U.S. companies. Non-U.S. companies generally are not subject to the same accounting, auditing, and financial reporting standards as are U.S. companies. Additionally, the changing value of foreign currencies and changes in exchange rates could also affect the value of the assets the Fund holds and the Fund’s performance. Certain foreign countries may impose restrictions on the ability of issuers of foreign securities to make payment of principal and interest or dividends to investors located outside the country, due to blockage of foreign currency exchanges or otherwise. Investments in emerging markets are subject to greater volatility and price declines.
In addition, the Fund’s investments in non-U.S. securities may be subject to the risks of nationalization or expropriation of assets, imposition of currency exchange controls or restrictions on the repatriation of non-U.S. currency, confiscatory taxation and adverse diplomatic developments. Special U.S. tax considerations may apply.
Increase in Expenses Risk: Your actual cost of investing in the Fund may be higher than the expenses shown in the expense table in the Fund’s prospectus for a variety of reasons. For example, expense ratios may be higher than those shown if average net assets decrease. Net assets are more likely to decrease and Fund expense ratios are more likely to increase when markets are volatile. Active and frequent trading of Fund securities can increase expenses.
Interest Rate Risk: The value of your investment may go down when interest rates rise. A rise in rates tends to have a greater impact on the prices of longer term or duration debt securities. Similarly, a rise in interest rates may also have a greater negative impact on the value of equity securities whose issuers expect earnings further out in the future. For example, a fixed income security with a duration of three years is expected to decrease in value by approximately 3% if interest rates increase by 1%. This is referred to as “duration
PGIM Short-Term Corporate Bond Fund 69
Notes to Financial Statements (continued)
risk.” When interest rates fall, the issuers of debt obligations may prepay principal more quickly than expected, and the Fund may be required to reinvest the proceeds at a lower interest rate. This is referred to as “prepayment risk.” In addition, if the Fund purchases a fixed income security at a premium (at a price that exceeds its stated par or principal value), the Fund may lose the amount of the premium paid in the event of prepayment. When interest rates rise, debt obligations may be repaid more slowly than expected, and the value of the Fund’s holdings may fall sharply. This is referred to as “extension risk.” The Fund may lose money if short-term or long-term interest rates rise sharply or in a manner not anticipated by the subadviser.
Junk Bonds Risk: High-yield, high-risk bonds have predominantly speculative characteristics, including particularly high credit risk. Junk bonds tend to have lower market liquidity than higher-rated securities. The liquidity of particular issuers or industries within a particular investment category may shrink or disappear suddenly and without warning. The non-investment grade bond market can experience sudden and sharp price swings and become illiquid due to a variety of factors, including changes in economic forecasts, stock market activity, large sustained sales by major investors, a high profile default or a change in the market’s psychology.
Large Shareholder and Large Scale Redemption Risk: Certain individuals, accounts, funds (including funds affiliated with the Manager) or institutions, including the Manager and its affiliates, may from time to time own or control a substantial amount of the Fund’s shares. There is no requirement that these entities maintain their investment in the Fund. There is a risk that such large shareholders or that the Fund’s shareholders generally may redeem all or a substantial portion of their investments in the Fund in a short period of time, which could have a significant negative impact on the Fund’s NAV, liquidity, and brokerage costs. Large redemptions could also result in tax consequences to shareholders and impact the Fund’s ability to implement its investment strategy. The Fund’s ability to pursue its investment objective after one or more large scale redemptions may be impaired and, as a result, the Fund may invest a larger portion of its assets in cash or cash equivalents.
Management Risk: Actively managed funds are subject to management risk. The subadviser will apply investment techniques and risk analyses in making investment decisions for the Fund, but the subadviser’s judgments about the attractiveness, value or market trends affecting a particular security, industry or sector or about market movements may be incorrect. Additionally, the investments selected for the Fund may underperform the markets in general, the Fund’s benchmark and other funds with similar investment objectives.
Market Disruption and Geopolitical Risks: Market disruption can be caused by economic, financial or political events and factors, including but not limited to, international wars or
70
conflicts (including Russia’s military invasion of Ukraine and the Israel-Hamas war), geopolitical developments (including trading and tariff arrangements, sanctions and cybersecurity attacks), instability in regions such as Asia, Eastern Europe and the Middle East, terrorism, natural disasters and public health epidemics (including the outbreak of COVID-19 globally).
The extent and duration of such events and resulting market disruptions cannot be predicted, but could be substantial and could magnify the impact of other risks to the Fund. These and other similar events could adversely affect the U.S. and foreign financial markets and lead to increased market volatility, reduced liquidity in the securities markets, significant negative impacts on issuers and the markets for certain securities and commodities and/or government intervention. They may also cause short- or long-term economic uncertainties in the United States and worldwide. As a result, whether or not the Fund invests in securities of issuers located in or with significant exposure to the countries directly affected, the value and liquidity of the Fund’s investments may be negatively impacted. Further, due to closures of certain markets and restrictions on trading certain securities, the value of certain securities held by the Fund could be significantly impacted, which could lead to such securities being valued at zero.
Market Risk: Securities markets may be volatile and the market prices of the Fund’s securities may decline. Securities fluctuate in price based on changes in an issuer’s financial condition and overall market and economic conditions. If the market prices of the securities owned by the Fund fall, the value of your investment in the Fund will decline.
Mortgage-Backed and Asset-Backed Securities Risk: Mortgage-backed and asset-backed securities tend to increase in value less than other debt securities when interest rates decline, but are subject to similar risk of decline in market value during periods of rising interest rates. The values of mortgage-backed and asset-backed securities become more volatile as interest rates rise. In a period of declining interest rates, the Fund may be required to reinvest more frequent prepayments on mortgage-backed and asset-backed securities in lower-yielding investments.
U.S. Government and Agency Securities Risk: U.S. Treasury obligations are backed by the “full faith and credit” of the U.S. Government. Securities issued or guaranteed by federal agencies or authorities and U.S. Government-sponsored instrumentalities or enterprises may or may not be backed by the full faith and credit of the U.S. Government. For example, securities issued by the Federal Home Loan Mortgage Corporation, the Federal National Mortgage Association and the Federal Home Loan Banks are neither insured nor guaranteed by the U.S. Government. These securities may be supported by the ability to borrow from the U.S. Treasury or only by the credit of the issuing agency, authority, instrumentality or enterprise and, as a result, are subject to greater credit risk than securities issued or guaranteed by the U.S. Treasury. Further, the U.S. Government and its agencies, authorities, instrumentalities and enterprises do not guarantee the market value of their securities; consequently, the value of such securities will fluctuate. This may be the case especially when there is any controversy or ongoing uncertainty regarding the status of
PGIM Short-Term Corporate Bond Fund 71
Notes to Financial Statements (continued)
negotiations in the U.S. Congress to increase the statutory debt ceiling. Such controversy or uncertainty could, among other things, result in the credit quality rating of the U.S. Government being downgraded and reduced prices of U.S. Treasury securities. If the U.S. Congress is unable to negotiate an adjustment to the statutory debt ceiling, there is also the risk that the U.S. Government may default on payments on certain U.S. Government securities, including those held by the Fund, which could have a negative impact on the Fund. An increase in demand for U.S. Government securities resulting from an increase in demand for government money market funds may lead to lower yields on such securities.
Yankee Obligations Risk: Foreign markets, economies and political systems, particularly those in developing countries, may not be as stable as those in the US. In addition, Yankee Obligations may be less liquid than US debt obligations. Differences in foreign laws, accounting standards, public information, custody and settlement practices may result in less reliable information on foreign investments and involve more risk. Investments in emerging markets securities are subject to greater volatility and price declines.
72
Report of Independent Registered Public Accounting Firm
To the Board of Directors of Prudential Short-Term Corporate Bond Fund, Inc. and Shareholders of PGIM Short-Term Corporate Bond Fund
Opinion on the Financial Statements
We have audited the accompanying statement of assets and liabilities, including the schedule of investments, of PGIM Short-Term Corporate Bond Fund (the “Fund”) as of December 31, 2024, the related statement of operations for the year ended December 31, 2024, the statements of changes in net assets for each of the two years in the period ended December 31, 2024, including the related notes, and the financial highlights for each of the five years in the period ended December 31, 2024 (collectively referred to as the “financial statements”). In our opinion, the financial statements present fairly, in all material respects, the financial position of the Fund as of December 31, 2024, the results of its operations for the year then ended, the changes in its net assets for each of the two years in the period ended December 31, 2024 and the financial highlights for each of the five years in the period ended December 31, 2024 in conformity with accounting principles generally accepted in the United States of America.
Basis for Opinion
These financial statements are the responsibility of the Fund’s management. Our responsibility is to express an opinion on the Fund’s financial statements based on our audits. We are a public accounting firm registered with the Public Company Accounting Oversight Board (United States) (PCAOB) and are required to be independent with respect to the Fund in accordance with the U.S. federal securities laws and the applicable rules and regulations of the Securities and Exchange Commission and the PCAOB.
We conducted our audits of these financial statements in accordance with the standards of the PCAOB. Those standards require that we plan and perform the audit to obtain reasonable assurance about whether the financial statements are free of material misstatement, whether due to error or fraud.
Our audits included performing procedures to assess the risks of material misstatement of the financial statements, whether due to error or fraud, and performing procedures that respond to those risks. Such procedures included examining, on a test basis, evidence regarding the amounts and disclosures in the financial statements. Our audits also included evaluating the accounting principles used and significant estimates made by management, as well as evaluating the overall presentation of the financial statements. Our procedures included confirmation of securities owned as of December 31, 2024 by correspondence with the custodian, transfer agent and brokers; when replies were not received from brokers, we performed other auditing procedures. We believe that our audits provide a reasonable basis for our opinion.
/s/ PricewaterhouseCoopers LLP
New York, New York
February 19, 2025
We have served as the auditor of one or more investment companies in the PGIM Retail Funds complex since 2020.
PGIM Short-Term Corporate Bond Fund 73
Other Information
Form N-CSR Item 8 - Changes in and Disagreements with Accountants for Open-End Management Investment Companies - None.
Form N-CSR Item 9 - Proxy Disclosures for Open-End Management Investment Companies - None.
Form N-CSR Item 10 - Remuneration Paid to Directors, Officers, and Others of Open-End Management Investment Companies - Included within the Statement of Operations of the financial statements filed under Item 7 of this Form.
Form N-CSR Item 11 - Statement Regarding Basis for Approval of Investment Advisory Contract. - None.
Item 12 – Disclosure of Proxy Voting Policies and Procedures for Closed-End Management Investment Companies – Not
applicable.
Item 13 – Portfolio Managers of Closed-End Management Investment Companies – Not applicable.
Item 14 – Purchases of Equity Securities by Closed-End Management Investment Company and Affiliated Purchasers –
Not applicable.
Item 15 – Submission of Matters to a Vote of Security Holders – There have been no material changes to the procedures by
which shareholders may recommend nominees to the registrant’s board of directors.
Item 16 – Controls and Procedures
| | (a) | It is the conclusion of the registrant’s principal executive officer and principal financial officer that the effectiveness of the registrant’s current disclosure controls and procedures (such disclosure controls and procedures having been evaluated within 90 days of the date of this filing) provide reasonable assurance that the information required to be disclosed by the registrant has been recorded, processed, summarized and reported within the time period specified in the Commission’s rules and forms and that the information required to be disclosed by the registrant has been accumulated and communicated to the registrant’s principal executive officer and principal financial officer in order to allow timely decisions regarding required disclosure. |
| | (b) | There has been no significant change in the registrant’s internal control over financial reporting (as defined in Rule 30a-3(d) under the Act (17 CFR 270.30a-3(d))) that occurred during the period covered by this report that has materially affected, or is reasonably likely to materially affect, the registrant’s internal control over financial reporting. |
Item 17 – Disclosure of Securities Lending Activities for Closed-End Management Investment Companies – Not applicable.
Item 18 – Recovery of Erroneously Awarded Compensation – Not applicable.
Item 19 – Exhibits
SIGNATURES
Pursuant to the requirements of the Securities Exchange Act of 1934 and the Investment Company Act of 1940, the registrant has duly caused this report to be signed on its behalf by the undersigned, thereunto duly authorized.
Registrant: Prudential Short-Term Corporate Bond Fund, Inc.
| | |
By: | | /s/ Andrew R. French |
| | Andrew R. French |
| | Secretary |
| |
Date: | | February 19, 2025 |
Pursuant to the requirements of the Securities Exchange Act of 1934 and the Investment Company Act of 1940, this report has been signed below by the following persons on behalf of the registrant and in the capacities and on the dates indicated.
| | |
By: | | /s/ Stuart S. Parker |
| | Stuart S. Parker |
| | President and Principal Executive Officer |
| |
Date: | | February 19, 2025 |
| |
By: | | /s/ Christian J. Kelly |
| | Christian J. Kelly |
| | Chief Financial Officer |
| | (Principal Financial Officer) |
| |
Date: | | February 19, 2025 |