UNITED STATES
SECURITIES AND EXCHANGE COMMISSION
Washington, D.C. 20549
FORM N-CSR
CERTIFIED SHAREHOLDER REPORT OF REGISTERED MANAGEMENT
INVESTMENT COMPANIES
Investment Company Act file number: 811-05576
Name of Fund: BlackRock Global Allocation Fund, Inc.
Fund Address: 100 Bellevue Parkway, Wilmington, DE 19809
Name and address of agent for service: John M. Perlowski, Chief Executive Officer, BlackRock Global Allocation Fund, Inc., 55 East 52nd Street, New York, NY 10055
Registrant’s telephone number, including area code: (800) 441-7762
Date of fiscal year end: 10/31/2015
Date of reporting period: 10/31/2015
Item 1 – Report to Stockholders
OCTOBER 31, 2015
| | | | |
ANNUAL REPORT | | | |  |
BlackRock Global Allocation Fund, Inc.
|
| Not FDIC Insured • May Lose Value • No Bank Guarantee |

| | | | | | |
| | | | | | | |
| 2 | | BLACKROCK GLOBAL ALLOCATION FUND, INC. | | OCTOBER 31, 2015 | | |
Dear Shareholder,
Diverging monetary policies and shifting economic outlooks across regions were the overarching themes driving financial markets during the 12-month period ended October 31, 2015. U.S. economic growth was picking up considerably toward the end of 2014, while the broader global economy showed signs of slowing. Investors favored the stability of U.S. assets despite expectations that the Federal Reserve (the “Fed”) would eventually be inclined to raise short-term interest rates, while international markets struggled even as the European Central Bank and the Bank of Japan eased monetary policy. Oil prices plummeted in late 2014 due to a global supply-and-demand imbalance, fueling a sell-off in energy-related assets and emerging markets. U.S. Treasury bonds benefited as their persistently low yields had become attractive as compared to the even lower yields on international sovereign debt.
Equity markets reversed in early 2015, with international markets outperforming the United States as global risks temporarily abated, and the U.S. economy hit a soft patch amid a harsh winter and a west coast port strike. High valuations took their toll on U.S. stocks, while bond yields fell to extreme lows. (Bond prices rise as yields fall.) In contrast, economic reports in Europe and Asia began to improve, and accommodative policies from central banks in those regions helped international equities rebound. Oil prices stabilized, providing some relief for emerging market stocks, although a stronger U.S. dollar posed another significant headwind for the asset class.
U.S. economic growth regained momentum in the second quarter, helping U.S. stocks resume an upward path; however, the improving data underscored the likelihood that the Fed would raise short-term rates before the end of 2015 and bond yields moved swiftly higher. The month of June brought a sharp, but temporary, sell-off across most asset classes as Greece’s long-brewing debt troubles came to an impasse. These concerns abated when the Greek parliament passed a series of austerity and reform measures in July. But the market’s calm was short-lived. Signs of weakness in China’s economy sparked extreme levels of volatility in Chinese equities despite policymakers’ attempts to stabilize the market.
Higher volatility spread through markets globally in the third quarter as further evidence of deceleration in China stoked worries about overall global growth. Weakening Chinese demand caused oil prices to slide once again and ignited another steep sell-off in emerging markets. Speculation as to whether the Fed would raise rates at its September meeting further fueled global volatility. Ultimately, the Fed postponed the rate hike, but this brought little relief in the markets as the central bank’s decision reinforced investors’ concerns about the state of the global economy. Stock markets finished the third quarter with the worst performance since 2011. High yield bonds also declined, while higher quality assets, including U.S. Treasury bonds, municipal bonds and investment grade credit benefited from investors seeking shelter amid global uncertainty.
The period ended with a strong October rally in risk assets. Given the recent scarcity of evidence of global growth, equity markets had become more reliant on central banks to drive performance. Although October brought generally soft economic data and lower growth estimates, global equities powered higher as China’s central bank provided more stimulus, the European Central Bank poised for more easing and soft U.S. data pushed back expectations for a Fed rate hike. Treasury bonds declined in October while all other asset classes benefited from investors’ increased risk appetite.
At BlackRock, we believe investors need to think globally, extend their scope across a broad array of asset classes and be prepared to move freely as market conditions change over time. We encourage you to talk with your financial advisor and visit blackrock.com for further insight about investing in today’s markets.
Sincerely,

Rob Kapito
President, BlackRock Advisors, LLC

Rob Kapito
President, BlackRock Advisors, LLC
| | | | | | | | |
| Total Returns as of October 31, 2015 | |
| | | 6-month | | | 12-month | |
U.S. large cap equities
(S&P 500® Index) | | | 0.77 | % | | | 5.20 | % |
U.S. small cap equities
(Russell 2000® Index) | | | (4.12 | ) | | | 0.34 | |
International equities
(MSCI Europe, Australasia,
Far East Index) | | | (6.44 | ) | | | (0.07 | ) |
Emerging market equities
(MSCI Emerging
Markets Index) | | | (17.75 | ) | | | (14.53 | ) |
3-month Treasury bills
(BofA Merrill Lynch 3-Month
U.S. Treasury Bill Index) | | | 0.01 | | | | 0.02 | |
U.S. Treasury securities
(BofA Merrill Lynch 10-Year
U.S. Treasury Index) | | | (0.02 | ) | | | 3.57 | |
U.S. investment-grade
bonds (Barclays
U.S. Aggregate Bond Index) | | | (0.10 | ) | | | 1.96 | |
Tax-exempt municipal
bonds (S&P Municipal
Bond Index) | | | 1.58 | | | | 2.87 | |
U.S. high yield bonds
(Barclays U.S.
Corporate High Yield 2%
Issuer Capped Index) | | | (3.38 | ) | | | (1.91 | ) |
| Past performance is no guarantee of future results. Index performance is shown for illustrative purposes only. You cannot invest directly in an index. | |
| | | | | | |
| | | | | | | |
| | THIS PAGE NOT PART OF YOUR FUND REPORT | | | | 3 |
| | | | |
| Fund Summary as of October 31, 2015 | | |
BlackRock Global Allocation Fund, Inc.’s (the “Fund”) investment objective is to provide high total investment return through a fully managed investment policy utilizing United States and foreign equity securities, debt and money market securities, the combination of which will be varied from time to time both with respect to types of securities and markets in response to changing market and economic trends. Total return means the combination of capital growth and investment income.
|
| Portfolio Management Commentary |
How did the Fund perform?
| • | | For the 12-month period ended October 31, 2015, the Fund underperformed its reference benchmark, which is comprised of the S&P 500® Index (36%), FTSE World (ex-US) Index (24%), BofA Merrill Lynch Current 5-Year U.S. Treasury Index (24%) and Citigroup Non-U.S. Dollar World Government Bond Index (16%) (the “Reference Benchmark”). For the same period, the Fund also underperformed the broad-based all-equity benchmark, the FTSE World Index. The Fund invests in both equities and bonds; therefore, the Reference Benchmark provides a truer representation of the Fund’s composition and a more comparable means for measurement. The following discussion of relative performance pertains to the Reference Benchmark. The commentary (and referenced allocation percentages) are based on the economic exposures of the Fund, which reflect adjustments for futures, swaps, options and convertible bonds, and may vary relative to the market value. |
What factors influenced performance?
| • | | Within equities, stock selection in the United States and Canada detracted from performance. From a sector perspective, stock selection and an overweight position in materials, as well as stock selection and an underweight position in consumer discretionary and consumer staples, weighed on returns. Stock selection in health care and an overweight position in energy also detracted. Commodity-related exposure, in particular to precious metals, and exposure in cash equivalents negatively impacted performance. |
| • | | Within equities, an overweight position in Japan contributed although this was partially offset by stock selection. An overweight position and stock selection in France was also additive. From a sector perspective, stock selection in information technology (“IT”) contributed to performance. From a currency perspective, an overweight position in the U.S. dollar positively impacted performance. |
| • | | The Fund uses derivatives, which may include options, futures, swaps and forward contracts both to enhance returns of the Fund and to hedge (or protect) against adverse movements in currency exchange rates, interest rates and movements in the securities markets. During the period, the Fund’s use of derivatives had a positive impact on the absolute performance of the Find. |
Describe recent portfolio activity.
| • | | During the 12-month period, the Fund’s overall equity allocation decreased from 62% to 58% of net assets. Within equities, the Fund |
| | | reduced exposure to Japan, the United States, Europe, and Latin America. On a sector basis, the Fund reduced exposures to financials, healthcare, energy, materials, industrials, utilities, and consumer discretionary, and increased exposures to consumer staples, IT, and telecommunication services (“telecom”). |
| • | | The Fund’s allocation to fixed income remained at 22% during the 12-month period. Within fixed income, the Fund increased exposure to U.S. corporate debt, while reducing exposure to government bonds, notably in Australia, Brazil, and Mexico. |
| • | | The Fund’s overall allocation to commodity-related securities increased from 1% to 2% during the 12-month period. |
| • | | Reflecting the changes in the Fund’s overall allocations to the equity, fixed income, and commodity-related asset classes during the 12-month period, the Fund’s cash and cash equivalent holdings increased from 15% to 18% of net assets. During the 12-month period, cash was used to help mitigate portfolio volatility and served as a source of funds for new investments. In addition, the Fund’s cash position helped keep overall portfolio duration (sensitivity to interest rate movements) relatively low. |
Describe portfolio positioning at period end.
| • | | Relative to its Reference Benchmark, the Fund ended the period slightly underweight in equities, significantly underweight in fixed income, overweight in commodity-related issues, and overweight in cash and cash equivalents. Within the equity segment, the Fund was underweight in the United States and overweight in Japan and Europe. Within Europe, the Fund was overweight in France, the Netherlands, and Italy, and underweight Germany and the United Kingdom. From a sector perspective, the Fund was overweight health care, telecom, energy, industrials, and materials, and underweight consumer staples, consumer discretionary, financials, and IT. |
| • | | Within fixed income, the Fund was underweight in U.S. Treasuries, European sovereign debt and Japanese government bonds, and overweight in government bonds in select Latin American countries. In addition, the Fund was overweight in corporate debt. |
| • | | With respect to currency exposure, the Fund was overweight in the U.S. dollar. The Fund was underweight in the euro, Japanese yen, Australian dollar, Canadian dollar, Korean won, Swiss franc, and the Taiwan dollar. |
The views expressed reflect the opinions of BlackRock as of the date of this report and are subject to change based on changes in market, economic or other conditions. These views are not intended to be a forecast of future events and are no guarantee of future results.
| | | | | | |
| | | | | | | |
| 4 | | BLACKROCK GLOBAL ALLOCATION FUND, INC. | | OCTOBER 31, 2015 | | |
|
| Total Return Based on a $10,000 Investment |
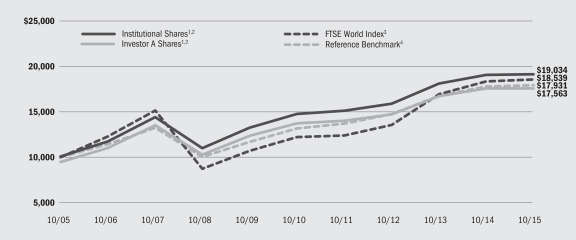
| | 1 | | Assuming maximum sales charges, if any, transaction costs and other operating expenses, including advisory fees. Institutional Shares do not have a sales charge. |
| | 2 | | The Fund invests in a portfolio of U.S. and foreign equity securities, debt and money market securities, the combination of which will be varied from time to time with respect to types of securities and markets in response to changing market and economic trends. |
| | 3 | | This unmanaged capitalization-weighted index is comprised of 2,531 equities from 35 countries in 4 regions, including the United States. |
| | 4 | | The Reference Benchmark is an unmanaged weighted index comprised as follows: 36% S&P 500® Index; 24% FTSE World (ex U.S.) Index; 24% BofA Merrill Lynch Current 5-Year U.S. Treasury Index; and 16% Citigroup Non-U.S. Dollar World Government Bond Index. |
| | | | Descriptions of these indexes can be found in the footnotes below. |
|
| Performance Summary for the Period Ended October 31, 2015 |
| | | | | | | | | | | | | | | | | | | | | | | | | | | | |
| | | | | | Average Annual Total Returns5 | |
| | | | | | 1 Year | | | 5 Years | | | 10 Years | |
| | | 6-Month
Total Returns | | | w/o sales
charge | | | w/sales
charge | | | w/o sales
charge | | | w/sales
charge | | | w/o sales charge | | | w/sales
charge | |
Institutional6 | | | (3.91 | )% | | | 0.31 | % | | | N/A | | | | 5.34 | % | | | N/A | | | | 6.65 | % | | | N/A | |
Investor A6 | | | (4.06 | ) | | | 0.02 | | | | (5.23 | )% | | | 5.06 | | | | 3.93 | % | | | 6.37 | | | | 5.79 | % |
Investor B6 | | | (4.47 | ) | | | (0.82 | ) | | | (4.92 | ) | | | 4.21 | | | | 3.87 | | | | 5.68 | | | | 5.68 | |
Investor C6 | | | (4.40 | ) | | | (0.73 | ) | | | (1.64 | ) | | | 4.27 | | | | 4.27 | | | | 5.56 | | | | 5.56 | |
Class R6 | | | (4.24 | ) | | | (0.37 | ) | | | N/A | | | | 4.69 | | | | N/A | | | | 6.01 | | | | N/A | |
FTSE World Index | | | (3.78 | ) | | | 1.00 | | | | N/A | | | | 8.73 | | | | N/A | | | | 6.37 | | | | N/A | |
Reference Benchmark | | | (1.67 | ) | | | 0.92 | | | | N/A | | | | 6.39 | | | | N/A | | | | 6.01 | | | | N/A | |
U.S. Stocks: S&P 500® Index7 | | | 0.77 | | | | 5.20 | | | | N/A | | | | 14.33 | | | | N/A | | | | 7.85 | | | | N/A | |
Non-U.S. Stocks: FTSE World (ex U.S.) Index8 | | | (8.24 | ) | | | (3.24 | ) | | | N/A | | | | 3.69 | | | | N/A | | | | 4.79 | | | | N/A | |
U.S. Bonds: BofA Merrill Lynch Current
5-Year U.S. Treasury Index9 | | | 0.72 | | | | 2.52 | | | | N/A | | | | 2.10 | | | | N/A | | | | 4.60 | | | | N/A | |
Non-U.S. Bonds: Citigroup Non-U.S. Dollar
World Government Bond Index10 | | | (1.59 | ) | | | (6.19 | ) | | | N/A | | | | (1.68 | ) | | | N/A | | | | 3.15 | | | | N/A | |
| | 5 | | Assuming maximum sales charges, if any. Average annual total returns with and without sales charges reflect reductions for distribution and service fees. See “About Fund Performance” on page 6 for a detailed description of share classes, including any related sales charges and fees. |
| | 6 | | For financial reporting purposes, the market value of certain investments was adjusted as of the report date. Accordingly, the net asset value (“NAV”) per share and total return performance based on NAV presented herein are different than the information previously published on October 31, 2015. |
| | 7 | | This unmanaged index covers 500 leading companies and captures approximately 80% coverage of available market capitalization. |
| | 8 | | This unmanaged capitalization-weighted index is comprised of 1,888 equities from 34 countries, excluding the United States. |
| | 9 | | This unmanaged index is designed to track the total return of the current coupon five-year U.S. Treasury bond. |
| | 10 | | This unmanaged market capitalization-weighted index tracks 22 government bond indexes, excluding the United States. |
| | | | N/A — Not applicable as share class and index do not have a sales charge. |
| | | | Past performance is not indicative of future results. |
| | | | | | |
| | | | | | | |
| | BLACKROCK GLOBAL ALLOCATION FUND, INC. | | OCTOBER 31, 2015 | | 5 |
| • | | Institutional Shares are not subject to any sales charge. These shares bear no ongoing distribution or service fees and are available only to eligible investors. |
| • | | Investor A Shares are subject to a maximum initial sales charge (front-end load) of 5.25% and a service fee of 0.25% per year (but no distribution fee). Certain redemptions of these shares may be subject to a contingent deferred sales charge (“CDSC”) where no initial sales charge was paid at the time of purchase. These shares are generally available through financial intermediaries. |
| • | | Investor B Shares are subject to a maximum CDSC of 4.50% declining to 0% after six years. In addition, these shares are subject to a distribution fee of 0.75% per year and a service fee of 0.25% per year. These shares automatically convert to Investor A Shares after approximately eight years. (There is no initial sales charge for automatic share conversions.) All returns for periods greater than eight years reflect this conversion. These shares are only available through exchanges and dividend reinvestment by existing shareholders or for purchase by certain employer-sponsored retirement plans. |
| • | | Investor C Shares are subject to a 1.00% CDSC if redeemed within one year of purchase. In addition, these shares are subject to a distribution fee of 0.75% per year and a service fee of 0.25% per year. These shares are generally available through financial intermediaries. |
| • | | Class R Shares are not subject to any sales charge. These shares are subject to a distribution fee of 0.25% per year and a service fee of 0.25% per year. These shares are available only to certain employer-sponsored retirement plans and other similar plans. |
Performance information reflects past performance and does not guarantee future results. Current performance may be lower or higher than the performance data quoted. Refer to www.blackrock.com/funds to obtain performance data current to the most recent month end. Performance results do not reflect the deduction of taxes that a shareholder would pay on fund distributions or the redemption of fund shares. Figures shown in the performance table on the previous page assume reinvestment of all distributions, if any, at NAV on the ex-dividend date. Investment return and principal value of shares will fluctuate so that shares, when redeemed, may be worth more or less than their original cost. Distributions paid to each class of shares will vary because of the different levels of service, distribution and transfer agency fees applicable to each class, which are deducted from the income available to be paid to shareholders.
BlackRock Advisors, LLC (the “Manager”), the Fund’s investment advisor waived a portion of its expenses. Without such waiver, the Fund’s performance would have been lower. The Manager is under no obligation to waive or to continue waiving the fees and such voluntary waiver may be reduced or discontinued at any time. See Note 6 of the Notes to Financial Statements for additional information on waivers.
Shareholders of the Fund may incur the following charges:
(a) transactional expenses, such as sales charges; and (b) operating expenses, including investment advisory fees, service and distribution fees, including 12b-1 fees, acquired fund fees and expenses, and other Fund expenses. The expense example shown below (which is based on a hypothetical investment of $1,000 invested on May 1, 2015 and held through October 31, 2015) is intended to assist shareholders both in calculating expenses based on an investment in the Fund and in comparing these expenses with similar costs of investing in other mutual funds.
The expense example provides information about actual account values and actual expenses. In order to estimate the expenses a shareholder paid during the period covered by this report, shareholders can divide their account value by $1,000 and then multiply the result by the number corresponding to their share class under the heading entitled “Expenses Paid During the Period.”
The expense example also provides information about hypothetical account values and hypothetical expenses based on the Fund’s actual expense ratio and an assumed rate of return of 5% per year before expenses. In order to assist shareholders in comparing the ongoing expenses of investing in the Fund and other funds, compare the 5% hypothetical example with the 5% hypothetical examples that appear in other funds’ shareholder reports.
The expenses shown in the expense example are intended to highlight shareholders’ ongoing costs only and do not reflect any transactional expenses, such as sales charges, if any. Therefore, the hypothetical example is useful in comparing ongoing expenses only, and will not help shareholders determine the relative total expenses of owning different funds. If these transactional expenses were included, shareholder expenses would have been higher.
| | | | | | | | | | | | | | | | | | | | | | | | | | | | | | | | | | | | |
| Global Allocation Fund | | | | | | | | | | | | | | | | | | | | | | | | | |
| | | Actual | | | Hypothetical3 | |
| | | | | | | | | Expenses Paid During the Period | | | | | | Including Dividend Expense and
Stock Loan Fees | | | Excluding Dividend Expense
and Stock Loan Fees | |
| | | Beginning
Account Value
May 1, 2015 | | | Ending
Account Value
October 31, 2015 | | | Including Dividend
Expense and Stock
Loan Fees1 | | | Excluding Dividend
Expense and Stock
Loan Fees2 | | | Beginning
Account Value
May 1, 2015 | | | Ending
Account Value
October 31, 2015 | | | Expenses Paid
During the
Period1 | | | Ending
Account Value
October 31, 2015 | | | Expenses
Paid During
the Period2 | |
Institutional | | $ | 1,000.00 | | | $ | 960.90 | | | $ | 3.90 | | | $ | 3.86 | | | $ | 1,000.00 | | | $ | 1,021.22 | | | $ | 4.02 | | | $ | 1,021.27 | | | $ | 3.97 | |
Investor A | | $ | 1,000.00 | | | $ | 959.40 | | | $ | 5.19 | | | $ | 5.14 | | | $ | 1,000.00 | | | | 1,019.91 | | | | 5.35 | | | | 1,019.96 | | | | 5.30 | |
Investor B | | $ | 1,000.00 | | | $ | 955.30 | | | $ | 9.02 | | | $ | 8.97 | | | $ | 1,000.00 | | | | 1,015.98 | | | | 9.30 | | | | 1,016.03 | | | | 9.25 | |
Investor C | | $ | 1,000.00 | | | $ | 956.00 | | | $ | 8.83 | | | $ | 8.78 | | | $ | 1,000.00 | | | | 1,016.18 | | | | 9.10 | | | | 1,016.23 | | | | 9.05 | |
Class R | | $ | 1,000.00 | | | $ | 957.60 | | | $ | 6.86 | | | $ | 6.81 | | | $ | 1,000.00 | | | | 1,018.20 | | | | 7.07 | | | | 1,018.25 | | | | 7.02 | |
| | 1 | | For each class of the Funds, expenses are equal to the annualized net expense ratio for the class (0.79% for Institutional, 1.05% for Investor A, 1.83% for Investor B, 1.79% for Investor C and 1.39% for Class R), multiplied by the average account value over the period, multiplied by 181/365 (to reflect the one-half year period shown). |
| | 2 | | For each class of the Funds, expenses are equal to the annualized net expense ratio for the class (0.78% for Institutional, 1.04% for Investor A, 1.82% for Investor B, 1.78% for Investor C and 1.38% for Class R), multiplied by the average account value over the period, multiplied by 181/365 (to reflect the one-half year period shown). |
| | 3 | | Hypothetical 5% annual return before expenses is calculated by pro rating the number of days in the most recent fiscal half year divided by 365. |
| | | | | | |
| | | | | | | |
| 6 | | BLACKROCK GLOBAL ALLOCATION FUND, INC. | | OCTOBER 31, 2015 | | |
| | | | | | | | | | | | |
| | | Percent of Fund’s Net Assets1 | | | Reference
Benchmark3
Percentages | |
| | | 10/31/15 | | | 10/31/142 | | |
| U.S. Equities | | | 27 | % | | | 28 | % | | | 35 | % |
| European Equities | | | 14 | | | | 15 | | | | 13 | |
| Asia Pacific Equities | | | 15 | | | | 16 | | | | 9 | |
| Other Equities | | | 2 | | | | 3 | | | | 3 | |
Total Equity Securities | | | 58 | | | | 62 | | | | 60 | |
| | | | | | | | | | | | | |
| U.S. Dollar Denominated Fixed Income Securities | | | 17 | | | | 13 | | | | 24 | |
U.S. Issuers | | | 12 | | | | 10 | | | | — | |
Non-U.S. Issuers | | | 5 | | | | 3 | | | | — | |
| Non-U.S. Dollar Denominated | | | 5 | | | | 9 | | | | 16 | |
Total Fixed Income Securities | | | 22 | | | | 22 | | | | 40 | |
| | | | | | | | | | | | | |
Commodity-Related Securities | | | 2 | | | | 1 | | | | — | |
| | | | | | | | | | | | | |
Cash & Short-Term Securities | | | 18 | | | | 15 | | | | — | |
| | 1 | | Exposure based on market value and adjusted for the economic value of futures, swaps, options and convertible bonds. |
| | 2 | | Prior period data is updated to reflect the economic value of options and convertible bonds and to present commodity-related exposure separately. |
| | 3 | | The Reference Benchmark is an unmanaged weighted index comprised as follows: 36% of the S&P 500 Index®; 24% FTSE World (ex U.S.) Index; 24% BofA Merrill Lynch Current 5-Year U.S. Treasury Index; and 16% Citigroup Non-U.S. Dollar World Government Bond Index. Descriptions of these indexes are found on page 5 of this report to shareholders in the “Performance Summary” section. |
| | | | |
| Geographic Allocation | | Percent of Long-Term Investments | |
United States | | | 53 | % |
Japan | | | 11 | |
United Kingdom | | | 7 | |
France | | | 4 | |
Netherlands | | | 2 | |
Italy | | | 2 | |
Switzerland | | | 2 | |
Canada | | | 2 | |
Ireland | | | 1 | |
Mexico | | | 1 | |
Singapore | | | 1 | |
Hong Kong | | | 1 | |
Germany | | | 1 | |
India | | | 1 | |
Brazil | | | 1 | |
Other4 | | | 10 | |
| | 4 | | Includes holdings within countries and geographic regions that are 1% or less of long-term investments. Please refer to the Consolidated Schedule of Investments for such countries. |
| | |
| Ten Largest Holdings (Equity Investments) | | Percent of Long-Term Investments |
| | | | |
Alphabet, Inc. | | | 1 | % |
Marathon Petroleum Corp. | | | 1 | |
Apple, Inc. | | | 1 | |
Wells Fargo & Co. | | | 1 | |
Verizon Communications, Inc. | | | 1 | |
SABMiller PLC. | | | 1 | |
HSBC Holdings PLC. | | | 1 | |
Citigroup, Inc. | | | 1 | |
Procter & Gamble Co. | | | 1 | |
JPMorgan Chase & Co. | | | 1 | |
| | | | | | |
| | | | | | | |
| | BLACKROCK GLOBAL ALLOCATION FUND, INC. | | OCTOBER 31, 2015 | | 7 |
| | | | |
| Derivative Financial Instruments | | |
The Fund may invest in various derivative financial instruments. Derivative financial instruments are used to obtain exposure to a security, index and/or market without owning or taking physical custody of securities or to manage market, equity, credit, interest rate, foreign currency exchange rate, commodity and/or other risks. Derivative financial instruments may give rise to a form of economic leverage. Derivative financial instruments also involve risks, including the imperfect correlation between the value of a derivative financial instrument and the underlying asset, possible default of the counterparty to the transaction or illiquidity of the derivative financial
instrument. The Fund’s ability to use a derivative financial instrument successfully depends on the investment advisor’s ability to predict pertinent market movements accurately, which cannot be assured. The use of derivative financial instruments may result in losses greater than if they had not been used, may limit the amount of appreciation the Fund can realize on an investment and/or may result in lower distributions paid to shareholders. The Fund’s investments in these instruments are discussed in detail in the Notes to Consolidated Financial Statements.
| | | | | | |
| | | | | | | |
| 8 | | BLACKROCK GLOBAL ALLOCATION FUND, INC. | | OCTOBER 31, 2015 | | |
| | |
Consolidated Schedule of Investments October 31, 2015 | | (Percentages shown are based on Net Assets) |
| | | | | | | | | | |
| | |
| Common Stocks | | Shares | | | Value | |
Australia — 0.1% | | | | | | | | | | |
Healthscope Ltd. | | | | | 25,161,175 | | | $ | 48,170,173 | |
Mesoblast Ltd. (a) | | | | | 4,469,788 | | | | 11,326,793 | |
Scentre Group | | | | | 869,540 | | | | 2,550,474 | |
Wesfarmers Ltd. | | | | | 53,432 | | | | 1,494,188 | |
| | | | | | | | | | |
| | | | | | | | | | 63,541,628 | |
Austria — 0.0% | | | | | | | | | | |
Oesterreichische Post AG | | | | | 42,236 | | | | 1,535,590 | |
Belgium — 0.2% | | | | | | | | | | |
Anheuser-Busch InBev NV | | | | | 421,747 | | | | 50,324,792 | |
BHF Kleinwort Benson | | | | | 890,354 | | | | 5,114,371 | |
BHF Kleinwort Benson Group (fka RHJ International) (a) | | | | | 2,830,379 | | | | 16,184,621 | |
bpost SA | | | | | 165,231 | | | | 4,135,339 | |
Colruyt SA | | | | | 133,871 | | | | 6,621,685 | |
Proximus | | | | | 475,460 | | | | 16,453,205 | |
Telenet Group Holding NV (a) | | | | | 75,886 | | | | 4,413,775 | |
| | | | | | | | | | |
| | | | | | | | | | 103,247,788 | |
Brazil — 0.1% | | | | | | | | | | |
Cyrela Brazil Realty SA | | | | | 2,224,324 | | | | 5,167,817 | |
Gerdau SA — ADR | | | | | 7,693,829 | | | | 10,694,422 | |
MRV Engenharia e Participacoes SA | | | | | 140,358 | | | | 270,049 | |
Petroleo Brasileiro SA — ADR (a)(b) | | | | | 4,772,631 | | | | 23,290,439 | |
SLC Agricola SA | | | | | 1,874,177 | | | | 8,368,445 | |
| | | | | | | | | | |
| | | | | | | | | | 47,791,172 | |
Canada — 1.0% | | | | | | | | | | |
Athabasca Oil Corp. (a)(b) | | | | | 7,153,235 | | | | 8,533,991 | |
Barrick Gold Corp. | | | | | 7,679,799 | | | | 59,057,654 | |
Brookfield Asset Management, Inc., Class A | | | | | 1,139,697 | | | | 39,849,979 | |
Cameco Corp. | | | | | 4,034,169 | | | | 57,164,175 | |
Canadian National Railway Co. | | | | | 483,544 | | | | 29,539,703 | |
Cenovus Energy, Inc. | | | | | 7,675,515 | | | | 114,346,155 | |
Eldorado Gold Corp. | | | | | 6,018,554 | | | | 21,034,561 | |
Enbridge, Inc. | | | | | 111,614 | | | | 4,770,653 | |
First Quantum Minerals Ltd. | | | | | 8,657,047 | | | | 46,211,523 | |
Goldcorp, Inc. | | | | | 3,749,652 | | | | 48,070,539 | |
Platinum Group Metals Ltd. (a)(b) | | | | | 25,092,228 | | | | 6,044,702 | |
Platinum Group Metals, Ltd. (a) | | | | | 14,966,812 | | | | 3,632,445 | |
Suncor Energy, Inc. | | | | | 492,230 | | | | 14,639,221 | |
Teck Resources Ltd., Class B | | | | | 1,406,062 | | | | 8,236,796 | |
Toronto-Dominion Bank | | | | | 1,766,411 | | | | 72,515,251 | |
TransCanada Corp. | | | | | 72,060 | | | | 2,424,778 | |
| | | | | | | | | | |
| | | | | | | | | | 536,072,126 | |
China — 0.3% | | | | | | | | | | |
Alibaba Group Holding Ltd. — SP ADR (a)(b) | | | | | 960,337 | | | | 80,505,051 | |
| | | | | | | | | | |
| | |
| Common Stocks | | Shares | | | Value | |
China (continued) | | | | | | | | | | |
CAR, Inc. (a)(b) | | | | | 14,843,459 | | | $ | 25,954,732 | |
Dongfeng Motor Group Co. Ltd., Class H | | | | | 7,244,700 | | | | 10,399,048 | |
Haitian International Holdings Ltd. | | | | | 13,062,600 | | | | 22,855,616 | |
Lenovo Group Ltd. | | | | | 2,922,000 | | | | 2,714,937 | |
SINA Corp. (a) | | | | | 570,031 | | | | 27,156,277 | |
Zhongsheng Group Holdings Ltd. (b) | | | | | 19,035,171 | | | | 7,886,921 | |
| | | | | | | | | | |
| | | | | | | | | | 177,472,582 | |
Cyprus — 0.0% | | | | | | | | | | |
Ocean Rig UDW, Inc. | | | | | 1,295,615 | | | | 2,772,616 | |
Egypt — 0.0% | | | | | | | | | | |
Integrated Diagnostics Holdings PLC (a)(c) | | | | | 1,813,626 | | | | 9,993,079 | |
France — 2.7% | | | | | | | | | | |
Accor SA | | | | | 739,623 | | | | 36,729,293 | |
Aeroports de Paris | | | | | 37,569 | | | | 4,719,570 | |
Air Liquide SA | | | | | 127,614 | | | | 16,509,029 | |
Airbus Group SE | | | | | 1,708,275 | | | | 118,956,146 | |
Alcatel-Lucent (a) | | | | | 1,434,220 | | | | 5,821,981 | |
AtoS | | | | | 955,960 | | | | 76,100,637 | |
AXA SA | | | | | 3,244,446 | | | | 86,588,141 | |
BNP Paribas SA | | | | | 890,429 | | | | 53,957,502 | |
Cie Generale des Etablissements Michelin | | | | | 55,095 | | | | 5,480,619 | |
Compagnie de Saint-Gobain | | | | | 800,381 | | | | 33,504,786 | |
Danone SA | | | | | 678,214 | | | | 47,135,904 | |
Dassault Aviation SA | | | | | 49,934 | | | | 57,820,165 | |
Elis SA | | | | | 441,247 | | | | 7,477,200 | |
Engie SA | | | | | 2,177,015 | | | | 38,099,493 | |
Eutelsat Communications SA | | | | | 285,250 | | | | 9,401,703 | |
Groupe Eurotunnel SE, Registered Shares | | | | | 627,825 | | | | 8,788,418 | |
Iliad SA | | | | | 79,729 | | | | 16,744,330 | |
L’Oreal SA | | | | | 210,074 | | | | 38,297,456 | |
Metropole Television SA | | | | | 101,207 | | | | 1,946,794 | |
Numericable-SFR (a) | | | | | 104,344 | | | | 4,714,891 | |
Orange SA | | | | | 1,384,687 | | | | 24,414,376 | |
Peugeot SA (a) | | | | | 2,336,643 | | | | 41,053,621 | |
Renault SA | | | | | 276,171 | | | | 26,021,962 | |
Safran SA | | | | | 1,510,634 | | | | 114,738,765 | |
Sanofi | | | | | 1,870,625 | | | | 188,700,828 | |
Societe Generale SA | | | | | 1,112,601 | | | | 51,672,752 | |
Societe Television Francaise 1 | | | | | 319,811 | | | | 4,108,497 | |
Sopra Steria Group | | | | | 48,637 | | | | 5,532,667 | |
TOTAL SA | | | | | 1,291,790 | | | | 62,469,438 | |
Total SA — ADR | | | | | 153,087 | | | | 7,383,386 | |
UbiSoft Entertainment SA (a) | | | | | 1,462,678 | | | | 43,823,762 | |
Unibail-Rodamco SE | | | | | 208,519 | | | | 58,037,269 | |
Vinci SA | | | | | 546,843 | | | | 36,816,884 | |
Vivendi SA | | | | | 749,530 | | | | 18,031,299 | |
| | | | | | | | | | |
| ADR | | American Depositary Receipts | | INR | | Indian Rupee | | PCL | | Public Company Limited |
| AUD | | Australian Dollar | | JPY | | Japanese Yen | | SGD | | Singapore Dollar |
| BRL | | Brazilian Real | | JSC | | Joint Stock Company | | S&P | | Standard and Poor’s |
| CLP | | Chilean Peso | | KRW | | South Korean Won | | SPDR | | Standard & Poor’s Depository Receipts |
| EUR | | Euro | | LIBOR | | London Interbank Offered Rate | | TWD | | Taiwan Dollar |
| EURIBOR | | Euro Interbank Offered Rate | | MSCI | | Morgan Stanley Capital International | | USD | | U.S. Dollar |
| FTSE | | Financial Times Stock Exchange | | MXN | | Mexican Peso | | WIBOR | | Warsaw Interbank Offered Rate |
| GDR | | Global Depositary Receipt | | MYR | | Malaysian Ringgit | | | | |
| IDR | | Indonesian Rupiah | | OTC | | Over-the-Counter | | | | |
See Notes to Consolidated Financial Statements.
| | | | | | |
| | | | | | | |
| | BLACKROCK GLOBAL ALLOCATION FUND, INC. | | OCTOBER 31, 2015 | | 9 |
| | |
Consolidated Schedule of Investments (continued) | | |
| | | | | | | | | | |
| | |
| Common Stocks | | Shares | | | Value | |
France (continued) | | | | | | | | | | |
Worldline SA (a)(c) | | | | | 1,978,401 | | | $ | 47,980,982 | |
| | | | | | | | | | |
| | | | | | | | | | 1,399,580,546 | |
Germany — 0.7% | | | | | | | | | | |
Axel Springer AG | | | | | 81,350 | | | | 4,571,848 | |
Bayer AG, Registered Shares | | | | | 489,883 | | | | 65,318,751 | |
Bayerische Motoren Werke AG | | | | | 364,978 | | | | 37,384,096 | |
Deutsche Bank AG, Registered Shares | | | | | 1,676,543 | | | | 46,924,420 | |
Deutsche Post AG, Registered Shares | | | | | 1,442,818 | | | | 42,860,873 | |
Deutsche Telekom AG, Registered Shares | | | | | 3,179,549 | | | | 59,557,993 | |
Fraport AG Frankfurt Airport Services Worldwide | | | | | 133,338 | | | | 8,453,986 | |
Linde AG | | | | | 130,375 | | | | 22,614,253 | |
ProSiebenSat.1 Media AG, Registered Shares | | | | | 356,514 | | | | 19,264,447 | |
SAP SE | | | | | 41,238 | | | | 3,251,000 | |
Stroeer SE | | | | | 74,225 | | | | 4,683,244 | |
Telefonica Deutschland Holding AG | | | | | 1,421,564 | | | | 9,151,534 | |
TUI AG | | | | | 907,737 | | | | 16,880,007 | |
United Internet AG, Registered Shares | | | | | 344,762 | | | | 17,901,033 | |
Volkswagen AG | | | | | 23,192 | | | | 3,211,428 | |
Vonovia SE | | | | | 673,336 | | | | 22,444,935 | |
| | | | | | | | | | |
| | | | | | | | | | 384,473,848 | |
Hong Kong — 0.9% | | | | | | | | | | |
AIA Group Ltd. | | | | | 8,435,000 | | | | 49,457,183 | |
Beijing Enterprises Holdings Ltd. | | | | | 9,925,232 | | | | 62,655,440 | |
Brilliance China Automotive Holdings Ltd. | | | | | 12,540,000 | | | | 17,388,503 | |
Chaoda Modern Agriculture Holdings Ltd. (a)(b) | | | | | 116,959,394 | | | | 5,324,017 | |
Cheung Kong Property Holdings Ltd. | | | | | 428,500 | | | | 2,998,274 | |
China Resources Land Ltd. | | | | | 21,564,000 | | | | 56,035,932 | |
Haier Electronics Group Co. Ltd. | | | | | 14,011,000 | | | | 27,078,352 | |
Sino Biopharmaceutical Ltd. | | | | | 18,854,153 | | | | 23,430,045 | |
Sun Hung Kai Properties Ltd. | | | | | 9,479,166 | | | | 126,620,782 | |
Wharf Holdings Ltd. | | | | | 15,369,000 | | | | 91,452,262 | |
| | | | | | | | | | |
| | | | | | | | | | 462,440,790 | |
India — 0.4% | | | | | | | | | | |
Coal India Ltd. | | | | | 4,072,359 | | | | 19,890,023 | |
Maruti Suzuki India Ltd. | | | | | 617,268 | | | | 42,010,292 | |
Oil & Natural Gas Corp. Ltd. | | | | | 10,338,972 | | | | 39,029,110 | |
Reliance Industries Ltd. | | | | | 5,321,643 | | | | 77,073,245 | |
| | | | | | | | | | |
| | | | | | | | | | 178,002,670 | |
Indonesia — 0.0% | | | | | | | | | | |
Siloam International Hospitals Tbk PT | | | | | 25,830,684 | | | | 20,531,249 | |
Ireland — 0.4% | | | | | | | | | | |
King Digital Entertainment PLC (b) | | | | | 4,406,488 | | | | 65,921,061 | |
Shire PLC | | | | | 870,534 | | | | 65,926,272 | |
XL Group PLC | | | | | 1,302,714 | | | | 49,607,349 | |
| | | | | | | | | | |
| | | | | | | | | | 181,454,682 | |
Israel — 0.5% | | | | | | | | | | |
Check Point Software Technologies Ltd. (a)(b) | | | | | 138,293 | | | | 11,746,608 | |
Mobileye NV (a)(b) | | | | | 2,931,104 | | | | 133,423,854 | |
Teva Pharmaceutical Industries Ltd. — ADR | | | | | 2,295,528 | | | | 135,872,302 | |
| | | | | | | | | | |
| | | | | | | | | | 281,042,764 | |
| | | | | | | | | | |
| | |
| Common Stocks | | Shares | | | Value | |
Italy — 0.7% | | | | | | | | | | |
Banco Popolare SC (a) | | | | | 260,127 | | | $ | 3,887,128 | |
Ei Towers SpA (d) | | | | | 1,333,706 | | | | 80,863,737 | |
Enel SpA | | | | | 8,918,925 | | | | 41,128,163 | |
Eni SpA | | | | | 332,905 | | | | 5,436,421 | |
Intesa Sanpaolo SpA | | | | | 28,159,342 | | | | 97,967,898 | |
Mediaset SpA | | | | | 3,600,070 | | | | 18,272,527 | |
RAI Way SpA (c) | | | | | 7,488,845 | | | | 38,128,563 | |
Telecom Italia SpA (a)(b) | | | | | 30,202,225 | | | | 42,134,558 | |
Telecom Italia SpA, Non-Convertible Savings Shares | | | | | 4,852,222 | | | | 5,453,443 | |
UniCredit SpA | | | | | 4,815,377 | | | | 31,093,203 | |
Unione di Banche Italiane SCpA | | | | | 612,325 | | | | 4,581,259 | |
| | | | | | | | | | |
| | | | | | | | | | 368,946,900 | |
Japan — 8.8% | | | | | | | | | | |
Aisin Seiki Co. Ltd. | | | | | 1,623,490 | | | | 64,434,680 | |
Ajinomoto Co., Inc. | | | | | 522,000 | | | | 11,627,021 | |
Alpine Electronics, Inc. | | | | | 289,900 | | | | 3,806,554 | |
Asahi Group Holdings Ltd. | | | | | 860,000 | | | | 26,527,724 | |
Asahi Kasei Corp. | | | | | 5,483,900 | | | | 33,652,663 | |
ASKUL Corp. | | | | | 10,700 | | | | 392,753 | |
Astellas Pharma, Inc. | | | | | 2,892,950 | | | | 41,989,626 | |
Autobacs Seven Co., Ltd. | | | | | 136,500 | | | | 2,393,606 | |
Bandai Namco Holdings, Inc. | | | | | 415,400 | | | | 10,210,626 | |
Bank of Yokohama Ltd. | | | | | 1,641,000 | | | | 10,241,661 | |
Benesse Holdings, Inc. | | | | | 62,900 | | | | 1,686,304 | |
Bridgestone Corp. | | | | | 2,796,200 | | | | 102,539,148 | |
Canon Marketing Japan, Inc. | | | | | 205,300 | | | | 3,121,119 | |
Chiba Bank Ltd. | | | | | 1,395,000 | | | | 10,176,567 | |
Chiyoda Corp. | | | | | 365,000 | | | | 2,776,144 | |
Chubu Electric Power Co., Inc. | | | | | 3,451,900 | | | | 53,100,555 | |
COMSYS Holdings Corp. | | | | | 126,700 | | | | 1,654,896 | |
Daikin Industries Ltd. | | | | | 931,500 | | | | 59,849,776 | |
Daikyo, Inc. | | | | | 2,773,000 | | | | 4,793,468 | |
Daito Trust Construction Co. Ltd. | | | | | 324,900 | | | | 35,169,220 | |
Daiwa House Industry Co. Ltd. | | | | | 99,900 | | | | 2,622,404 | |
Dena Co. Ltd. | | | | | 573,300 | | | | 9,198,189 | |
Denso Corp. | | | | | 2,898,580 | | | | 135,139,494 | |
East Japan Railway Co. | | | | | 1,447,573 | | | | 137,628,788 | |
Eisai Co. Ltd. | | | | | 326,600 | | | | 20,428,695 | |
Electric Power Development Co. Ltd. | | | | | 512,500 | | | | 16,895,037 | |
Exedy Corp. | | | | | 138,000 | | | | 3,173,744 | |
FamilyMart Co. Ltd. | | | | | 780,800 | | | | 31,916,573 | |
FANUC Corp. | | | | | 169,080 | | | | 29,832,718 | |
Fuji Heavy Industries Ltd. | | | | | 5,884,890 | | | | 227,589,917 | |
Fukuoka Financial Group, Inc. | | | | | 3,242,000 | | | | 17,059,889 | |
Futaba Industrial Co. Ltd. | | | | | 1,743,450 | | | | 7,495,425 | |
Gree, Inc. | | | | | 1,612,900 | | | | 8,169,985 | |
GS Yuasa Corp. | | | | | 5,603,000 | | | | 21,301,100 | |
GungHo Online Entertainment, Inc. (b) | | | | | 6,108,600 | | | | 19,894,593 | |
Hitachi Chemical Co. Ltd. | | | | | 2,265,000 | | | | 35,804,198 | |
Hitachi High-Technologies Corp. | | | | | 321,800 | | | | 8,654,184 | |
Hitachi Kokusai Electric, Inc. | | | | | 227,000 | | | | 3,134,184 | |
Hitachi Ltd. | | | | | 3,463,500 | | | | 19,980,202 | |
Honda Motor Co. Ltd. | | | | | 1,712,781 | | | | 56,659,542 | |
Hoya Corp. | | | | | 1,089,817 | | | | 44,973,222 | |
IHI Corp. | | | | | 6,684,000 | | | | 18,858,343 | |
Inpex Corp. | | | | | 9,024,900 | | | | 86,025,336 | |
Isuzu Motors Ltd. | | | | | 4,389,700 | | | | 51,269,582 | |
Japan Airlines Co. Ltd. | | | | | 3,936,300 | | | | 148,292,735 | |
See Notes to Consolidated Financial Statements.
| | | | | | |
| | | | | | | |
| 10 | | BLACKROCK GLOBAL ALLOCATION FUND, INC. | | OCTOBER 31, 2015 | | |
| | |
Consolidated Schedule of Investments (continued) | | |
| | | | | | | | | | |
| | |
| Common Stocks | | Shares | | | Value | |
Japan (continued) | | | | | | | | | | |
Japan Post Bank Co. Ltd. | | | | | 2,232,800 | | | $ | 26,829,867 | |
Japan Post Holdings Co. Ltd. | | | | | 2,231,700 | | | | 25,891,937 | |
Japan Tobacco, Inc. | | | | | 834,200 | | | | 28,873,154 | |
JGC Corp. | | | | | 1,237,630 | | | | 19,643,589 | |
JSR Corp. | | | | | 2,336,000 | | | | 36,893,121 | |
Kamigumi Co. Ltd. | | | | | 420,000 | | | | 3,608,493 | |
Kansai Electric Power Co., Inc. (a) | | | | | 504,200 | | | | 6,460,173 | |
KDDI Corp. | | | | | 2,298,000 | | | | 55,607,722 | |
Keyence Corp. | | | | | 32,900 | | | | 17,128,014 | |
Kinden Corp. | | | | | 457,800 | | | | 5,947,923 | |
Koito Manufacturing Co. Ltd. | | | | | 826,700 | | | | 31,316,064 | |
Komatsu Ltd. | | | | | 1,825,200 | | | | 30,001,701 | |
Kubota Corp. | | | | | 2,479,510 | | | | 38,436,005 | |
Kuraray Co. Ltd. | | | | | 2,266,620 | | | | 27,956,204 | |
Kyocera Corp. | | | | | 1,035,200 | | | | 46,826,901 | |
Kyushu Electric Power Co., Inc. (a) | | | | | 1,700,800 | | | | 20,526,498 | |
Mabuchi Motor Co. Ltd. | | | | | 217,200 | | | | 10,746,914 | |
Maeda Road Construction Co. Ltd. | | | | | 219,000 | | | | 3,980,865 | |
Medipal Holdings Corp. | | | | | 96,800 | | | | 1,689,359 | |
Mitsubishi Corp. | | | | | 3,039,030 | | | | 55,251,334 | |
Mitsubishi Electric Corp. | | | | | 10,038,000 | | | | 104,543,127 | |
Mitsubishi Estate Co. Ltd. | | | | | 4,024,000 | | | | 86,300,592 | |
Mitsubishi Heavy Industries Ltd. | | | | | 9,838,000 | | | | 49,597,956 | |
Mitsubishi UFJ Financial Group, Inc. | | | | | 12,317,400 | | | | 79,663,153 | |
Mitsui & Co. Ltd. | | | | | 4,674,234 | | | | 59,282,887 | |
Mitsui Fudosan Co. Ltd. | | | | | 152,000 | | | | 4,136,474 | |
Mizuho Financial Group, Inc. | | | | | 18,283,700 | | | | 37,661,576 | |
MS&AD Insurance Group Holdings, Inc. | | | | | 521,262 | | | | 15,367,114 | |
Murata Manufacturing Co. Ltd. | | | | | 149,740 | | | | 21,315,701 | |
Nabtesco Corp. | | | | | 547,000 | | | | 10,953,635 | |
NEC Corp. | | | | | 15,411,000 | | | | 47,542,654 | |
Nexon Co. Ltd. | | | | | 615,100 | | | | 8,532,046 | |
Nikon Corp. (b) | | | | | 4,456,400 | | | | 57,650,060 | |
Nintendo Co. Ltd. | | | | | 470,500 | | | | 75,217,235 | |
Nippo Corp. | | | | | 91,000 | | | | 1,585,754 | |
Nippon Express Co. Ltd. | | | | | 2,409,000 | | | | 12,410,417 | |
Nippon Steel & Sumitomo Metal | | | | | 830,500 | | | | 16,836,345 | |
Nippon Telegraph & Telephone Corp. | | | | | 1,471,300 | | | | 53,939,870 | |
Nitto Denko Corp. | | | | | 1,574,000 | | | | 100,931,776 | |
Nomura Holdings, Inc. | | | | | 6,641,100 | | | | 41,774,795 | |
NS Solutions Corp. | | | | | 23,800 | | | | 1,161,583 | |
Okumura Corp. | | | | | 5,533,620 | | | | 29,286,232 | |
Omron Corp. | | | | | 669,100 | | | | 22,155,806 | |
Otsuka Holdings Co. Ltd. | | | | | 1,171,800 | | | | 38,997,982 | |
Rinnai Corp. | | | | | 480,175 | | | | 38,066,373 | |
Rohm Co. Ltd. | | | | | 1,538,000 | | | | 76,025,737 | |
Sanrio Co. Ltd. (b) | | | | | 1,334,800 | | | | 35,460,566 | |
Sawai Pharmaceutical Co. Ltd. | | | | | 151,600 | | | | 9,705,049 | |
SCSK Corp. | | | | | 52,200 | | | | 2,001,346 | |
Secom Co. Ltd. | | | | | 120,200 | | | | 8,017,945 | |
Sega Sammy Holdings, Inc. | | | | | 2,639,200 | | | | 27,792,945 | |
Seino Holdings Co Ltd. | | | | | 638,900 | | | | 7,582,626 | |
Seven & I Holdings Co. Ltd. | | | | | 625,000 | | | | 28,390,504 | |
Shimamura Co. Ltd. | | | | | 58,500 | | | | 6,570,203 | |
Shin-Etsu Chemical Co. Ltd. | | | | | 2,217,440 | | | | 131,869,274 | |
Ship Healthcare Holdings, Inc. | | | | | 734,800 | | | | 17,799,217 | |
Shizuoka Bank Ltd. | | | | | 941,000 | | | | 9,439,888 | |
SHO-BOND Holdings Co. Ltd. | | | | | 20,000 | | | | 794,300 | |
SMC Corp. | | | | | 75,000 | | | | 19,293,150 | |
| | | | | | | | | | |
| | |
| Common Stocks | | Shares | | | Value | |
Japan (continued) | | | | | | | | | | |
Sohgo Security Services Co. Ltd. | | | | | 312,500 | | | $ | 15,076,018 | |
Sompo Japan Nipponkoa Holdings, Inc. | | | | | 292,400 | | | | 9,180,851 | |
Sony Financial Holdings, Inc. | | | | | 2,865,000 | | | | 51,348,173 | |
Stanley Electric Co. Ltd. | | | | | 230,200 | | | | 4,396,953 | |
Sumco Corp. | | | | | 2,578,600 | | | | 25,994,100 | |
Sumitomo Corp. | | | | | 4,185,400 | | | | 45,776,887 | |
Sumitomo Electric Industries Ltd. | | | | | 2,898,000 | | | | 39,551,754 | |
Sumitomo Mitsui Financial Group, Inc. | | | | | 1,782,600 | | | | 71,114,411 | |
Suntory Beverage & Food Ltd. | | | | | 418,100 | | | | 16,906,984 | |
Suzuki Motor Corp. | | | | | 2,190,408 | | | | 71,721,537 | |
Toda Corp. | | | | | 5,745,900 | | | | 31,256,386 | |
Tokio Marine Holdings, Inc. | | | | | 1,087,221 | | | | 41,892,446 | |
Tokyo Electric Power Co., Inc. (a) | | | | | 866,400 | | | | 5,910,083 | |
Tokyo Gas Co. Ltd. | | | | | 22,798,285 | | | | 112,825,503 | |
Toyota Industries Corp. | | | | | 2,837,780 | | | | 149,124,721 | |
Toyota Motor Corp. | | | | | 2,280,100 | | | | 139,689,028 | |
Toyota Tsusho Corp. | | | | | 844,300 | | | | 19,336,202 | |
Trend Micro, Inc. | | | | | 410,600 | | | | 16,001,673 | |
TV Asahi Corp. | | | | | 202,900 | | | | 3,386,122 | |
Ube Industries Ltd. | | | | | 16,675,500 | | | | 35,014,570 | |
Unicharm Corp. | | | | | 321,800 | | | | 6,872,447 | |
Yahoo! Japan Corp. | | | | | 5,064,500 | | | | 21,479,159 | |
Yamada Denki Co. Ltd. | | | | | 9,023,900 | | | | 40,595,286 | |
Yamaha Corp. | | | | | 569,400 | | | | 14,131,803 | |
Yamato Kogyo Co. Ltd. | | | | | 27,200 | | | | 724,529 | |
| | | | | | | | | | |
| | | | | | | | | | 4,520,719,547 | |
Kazakhstan — 0.0% | |
KazMunaiGas Exploration Production JSC — GDR | | | | | 1,895,369 | | | | 13,267,583 | |
Luxembourg — 0.0% | | | | | | | | | | |
RTL Group SA (a) | | | | | 103,018 | | | | 8,911,537 | |
Malaysia — 0.2% | | | | | | | | | | |
Axiata Group Bhd | | | | | 20,619,653 | | | | 29,544,522 | |
IHH Healthcare Bhd | | | | | 37,481,300 | | | | 55,077,444 | |
Telekom Malaysia Bhd | | | | | 9,253,334 | | | | 14,354,159 | |
| | | | | | | | | | |
| | | | | | | | | | 98,976,125 | |
Mexico — 0.3% | |
America Movil SAB de CV, Series L — ADR | | | | | 1,990,272 | | | | 35,446,744 | |
America Movil SAB de CV, Series L | | | | | 24,617,976 | | | | 21,983,263 | |
Fibra Uno Administracion SA de CV | | | | | 32,592,350 | | | | 71,586,438 | |
| | | | | | | | | | |
| | | | | | | | | | 129,016,445 | |
Netherlands — 1.2% | |
Akzo Nobel NV | | | | | 2,203,150 | | | | 155,829,598 | |
CNH Industrial NV, Special Voting Shares | | | | | 759,054 | | | | 5,153,977 | |
Constellium NV, Class A (a) | | | | | 3,054,035 | | | | 11,513,712 | |
ING Groep NV CVA | | | | | 4,070,874 | | | | 59,246,978 | |
Koninklijke KPN NV | | | | | 9,666,214 | | | | 35,418,950 | |
Koninklijke Philips Electronics NV | | | | | 3,314,111 | | | | 89,344,253 | |
PostNL NV (a) | | | | | 2,218,650 | | | | 9,140,246 | |
Randstad Holding NV | | | | | 542,301 | | | | 32,340,816 | |
Royal Dutch Shell PLC, Class A | | | | | 526,036 | | | | 13,733,405 | |
Royal Dutch Shell PLC, Class B | | | | | 327,775 | | | | 8,582,751 | |
SBM Offshore NV (a)(d) | | | | | 11,642,284 | | | | 159,060,116 | |
TomTom NV (a) | | | | | 1,012,013 | | | | 10,974,783 | |
Unilever NV CVA | | | | | 130,144 | | | | 5,884,802 | |
| | | | | | | | | | |
| | | | | | | | | | 596,224,387 | |
See Notes to Consolidated Financial Statements.
| | | | | | |
| | | | | | | |
| | BLACKROCK GLOBAL ALLOCATION FUND, INC. | | OCTOBER 31, 2015 | | 11 |
| | |
Consolidated Schedule of Investments (continued) | | |
| | | | | | | | | | |
| | |
| Common Stocks | | Shares | | | Value | |
Norway — 0.3% | |
Statoil ASA | | | | | 7,964,359 | | | $ | 128,737,965 | |
Peru — 0.2% | | | | | | | | | | |
Southern Copper Corp. (b) | | | | | 3,035,932 | | | | 84,277,472 | |
Portugal — 0.1% | | | | | | | | | | |
CTT — Correios de Portugal SA | | | | | 375,669 | | | | 4,267,078 | |
Zon Multimedia Servicos de Telecomunicacoes e Multimedia SGPS SA | | | | | 4,280,374 | | | | 35,520,896 | |
| | | | | | | | | | |
| | | | | | | | | | 39,787,974 | |
Singapore — 0.7% | |
Avago Technologies Ltd. | | | | | 16,034 | | | | 1,974,266 | |
CapitaLand Ltd. | | | | | 48,649,800 | | | | 107,317,174 | |
Global Logistic Properties Ltd. | | | | | 77,763,900 | | | | 124,375,834 | |
Keppel Corp. Ltd. (b) | | | | | 12,751,700 | | | | 64,188,211 | |
Raffles Medical Group Ltd. (b) | | | | | 5,340,200 | | | | 16,382,307 | |
Singapore Telecommunications Ltd. | | | | | 19,262,410 | | | | 54,729,362 | |
| | | | | | | | | | |
| | | | | | | | | | 368,967,154 | |
South Africa — 0.0% | |
Life Healthcare Group Holdings Ltd. | | | | | 5,469,200 | | | | 15,244,255 | |
South Korea — 0.5% | | | | | | | | | | |
Hyundai Motor Co. | | | | | 566,526 | | | | 77,384,385 | |
Hyundai Wia Corp. | | | | | 137,682 | | | | 16,076,292 | |
Samsung Electronics Co. Ltd. | | | | | 105,510 | | | | 126,551,397 | |
Samsung SDI Co., Ltd. | | | | | 104,158 | | | | 9,695,338 | |
SK Hynix, Inc. | | | | | 1,220,235 | | | | 32,656,203 | |
| | | | | | | | | | |
| | | | | | | | | | 262,363,615 | |
Spain — 0.6% | |
Aena SA (a)(c) | | | | | 153,310 | | | | 17,110,285 | |
Banco Popular Espanol SA | | | | | 2,403,750 | | | | 9,139,277 | |
Banco Santander SA | | | | | 9,665,971 | | | | 53,996,031 | |
Cellnex Telecom SAU (a)(c) | | | | | 4,973,025 | | | | 86,077,119 | |
Cia de Distribucion Integral Logista Holdings SA | | | | | 180,193 | | | | 3,596,869 | |
Distribuidora Internacional de Alimentacion SA | | | | | 5,106,324 | | | | 32,443,502 | |
Iberdrola SA | | | | | 1,506,709 | | | | 10,744,551 | |
Industria de Diseno Textil SA | | | | | 1,034,617 | | | | 38,740,567 | |
Mediaset Espana Comunicacion SA | | | | | 800,806 | | | | 9,716,599 | |
Merlin Properties Socimi SA | | | | | 2,311,433 | | | | 29,620,359 | |
| | | | | | | | | | |
| | | | | | | | | | 291,185,159 | |
Sweden — 0.1% | |
Getinge AB, Class B | | | | | 457,280 | | | | 11,428,177 | |
Lundin Petroleum AB (a) | | | | | 357,728 | | | | 5,178,106 | |
Svenska Handelsbanken AB, A Shares | | | | | 3,020,837 | | | | 41,027,401 | |
Telefonaktiebolaget LM Ericsson, Class B | | | | | 137,546 | | | | 1,338,667 | |
| | | | | | | | | | |
| | | | | | | | | | 58,972,351 | |
Switzerland — 1.4% | |
Credit Suisse Group AG, Registered Shares | | | | | 1,172,076 | | | | 29,233,004 | |
Glencore PLC | | | | | 35,982,122 | | | | 62,121,367 | |
Nestle SA, Registered Shares | | | | | 2,558,381 | | | | 195,393,624 | |
Novartis AG, Registered Shares | | | | | 802,879 | | | | 72,731,726 | |
Roche Holding AG | | | | | 471,281 | | | | 127,952,255 | |
Syngenta AG, Registered Shares | | | | | 272,321 | | | | 91,491,757 | |
TE Connectivity Ltd. | | | | | 25,833 | | | | 1,664,679 | |
UBS Group AG | | | | | 5,293,688 | | | | 105,727,795 | |
Zurich Insurance Group AG | | | | | 87,099 | | | | 22,985,419 | |
| | | | | | | | | | |
| | | | | | | | | | 709,301,626 | |
| | | | | | | | | | |
| | |
| Common Stocks | | Shares | | | Value | |
Taiwan — 0.2% | |
Cheng Shin Rubber Industry Co. Ltd. | | | | | 9,089,672 | | | $ | 16,457,798 | |
Delta Electronics, Inc. | | | | | 2,142,000 | | | | 10,891,181 | |
Far EasTone Telecommunications Co. Ltd. | | | | | 7,008,099 | | | | 15,205,242 | |
Hon Hai Precision Industry Co. Ltd. | | | | | 614,550 | | | | 1,633,510 | |
Taiwan Semiconductor Manufacturing Co. Ltd. | | | | | 11,459,000 | | | | 48,284,395 | |
Yulon Motor Co. Ltd. | | | | | 11,478,000 | | | | 12,150,050 | |
| | | | | | | | | | |
| | | | | | | | | | 104,622,176 | |
Thailand — 0.1% | |
Bangkok Dusit Medical Services PCL (b) | | | | | 62,627,200 | | | | 33,455,171 | |
Bumrungrad Hospital PCL | | | | | 4,512,900 | | | | 27,406,661 | |
| | | | | | | | | | |
| | | | | | | | | | 60,861,832 | |
United Arab Emirates — 0.2% | |
Al Noor Hospitals Group PLC | | | | | 2,508,104 | | | | 45,394,228 | |
NMC Health PLC | | | | | 4,251,472 | | | | 49,941,985 | |
| | | | | | | | | | |
| | | | | | | | | | 95,336,213 | |
United Kingdom — 3.3% | |
Antofagasta PLC | | | | | 9,210,496 | | | | 74,458,816 | |
AstraZeneca PLC | | | | | 1,985,770 | | | | 126,558,071 | |
AstraZeneca PLC — ADR | | | | | 744,393 | | | | 23,738,693 | |
Barclays PLC | | | | | 4,818,979 | | | | 17,168,959 | |
BG Group PLC | | | | | 454,895 | | | | 7,186,666 | |
BP PLC | | | | | 2,437,618 | | | | 14,486,728 | |
British American Tobacco PLC | | | | | 89,037 | | | | 5,289,648 | |
BT Group PLC | | | | | 7,638,555 | | | | 54,550,825 | |
Coats Group PLC (a) | | | | | 9,662,955 | | | | 4,387,046 | |
Delphi Automotive PLC | | | | | 1,234,373 | | | | 102,687,490 | |
Delta Topco Ltd., (Acquired 5/02/12, cost $48,436,537) (e) | | | | | 78,481,957 | | | | 37,278,930 | |
Diageo PLC | | | | | 119,892 | | | | 3,456,478 | |
Diageo PLC — ADR (f) | | | | | 565,847 | | | | 65,117,673 | |
HSBC Holdings PLC | | | | | 33,633,186 | | | | 262,774,921 | |
Imperial Tobacco Group PLC | | | | | 46,008 | | | | 2,477,439 | |
Land Securities Group PLC | | | | | 124,741 | | | | 2,569,877 | |
Legal & General Group PLC | | | | | 9,504,171 | | | | 38,273,292 | |
Liberty Global PLC, Class A (a) | | | | | 337,508 | | | | 15,025,856 | |
Lloyds Banking Group PLC | | | | | 20,115,056 | | | | 22,830,793 | |
National Grid PLC | | | | | 4,025,467 | | | | 57,342,282 | |
Ophir Energy PLC (a)(b) | | | | | 18,761,941 | | | | 27,673,441 | |
Prudential PLC | | | | | 3,691,363 | | | | 86,217,233 | |
Reckitt Benckiser Group PLC | | | | | 30,090 | | | | 2,936,497 | |
Rio Tinto PLC | | | | | 3,342,891 | | | | 121,832,413 | |
SABMiller PLC | | | | | 4,387,245 | | | | 269,479,404 | |
Spire Healthcare Group PLC (c) | | | | | 15,674,349 | | | | 90,510,384 | |
Standard Chartered PLC | | | | | 1,473,951 | | | | 16,361,791 | |
Vodafone Group PLC | | | | | 22,826,044 | | | | 75,118,962 | |
Vodafone Group PLC, ADR | | | | | 2,944,398 | | | | 97,076,802 | |
| | | | | | | | | | |
| | | | | | | | | | 1,724,867,410 | |
United States — 27.3% | |
3M Co. | | | | | 67,421 | | | | 10,599,255 | |
Abbott Laboratories | | | | | 1,053,360 | | | | 47,190,528 | |
AbbVie, Inc. | | | | | 2,463,047 | | | | 146,674,449 | |
Acadia Healthcare Co., Inc. (a) | | | | | 385,471 | | | | 23,671,774 | |
Accenture PLC, Class A | | | | | 171,254 | | | | 18,358,429 | |
ACE Ltd. | | | | | 77,119 | | | | 8,756,091 | |
Activision Blizzard, Inc. | | | | | 2,771,035 | | | | 96,321,177 | |
Adobe Systems, Inc. (a) | | | | | 183,100 | | | | 16,233,646 | |
See Notes to Consolidated Financial Statements.
| | | | | | |
| | | | | | | |
| 12 | | BLACKROCK GLOBAL ALLOCATION FUND, INC. | | OCTOBER 31, 2015 | | |
| | |
Consolidated Schedule of Investments (continued) | | |
| | | | | | | | | | |
| | |
| Common Stocks | | Shares | | | Value | |
United States (continued) | |
AES Corp. | | | | | 2,754,001 | | | $ | 30,156,311 | |
Aetna, Inc. (f) | | | | | 1,294,104 | | | | 148,537,257 | |
Air Products & Chemicals, Inc. | | | | | 98,614 | | | | 13,705,374 | |
Alexion Pharmaceuticals, Inc. (a) | | | | | 412,126 | | | | 72,534,176 | |
Alkermes PLC (a) | | | | | 255,111 | | | | 18,347,583 | |
Allergan PLC (a) | | | | | 502,027 | | | | 154,860,269 | |
Alliance Data Systems Corp. (a) | | | | | 35,529 | | | | 10,563,127 | |
Allstate Corp. | | | | | 1,028,444 | | | | 63,640,115 | |
Alphabet, Inc., Class A (a)(g) | | | | | 150,999 | | | | 111,345,153 | |
Alphabet, Inc., Class C (a)(g) | | | | | 546,822 | | | | 388,686,546 | |
Altria Group, Inc. | | | | | 129,869 | | | | 7,853,178 | |
Amdocs Ltd. | | | | | 206,593 | | | | 12,306,745 | |
American Airlines Group, Inc. | | | | | 1,285,576 | | | | 59,419,323 | |
American Electric Power Co., Inc. | | | | | 1,107,341 | | | | 62,730,868 | |
American International Group, Inc. | | | | | 1,729,537 | | | | 109,064,603 | |
American Tower Corp. | | | | | 87,080 | | | | 8,902,188 | |
American Water Works Co., Inc. | | | | | 1,053,738 | | | | 60,442,412 | |
Ameriprise Financial, Inc. | | | | | 84,539 | | | | 9,752,419 | |
AmerisourceBergen Corp. | | | | | 127,679 | | | | 12,322,300 | |
Amgen, Inc. | | | | | 509,523 | | | | 80,596,348 | |
Anadarko Petroleum Corp. | | | | | 3,295,638 | | | | 220,412,269 | |
Anthem, Inc. | | | | | 650,965 | | | | 90,581,780 | |
Apache Corp. | | | | | 509,187 | | | | 23,997,983 | |
Apple, Inc. | | | | | 2,514,867 | | | | 300,526,606 | |
Applied Materials, Inc. | | | | | 77,340 | | | | 1,296,992 | |
Archer-Daniels-Midland Co. | | | | | 316,598 | | | | 14,455,865 | |
AT&T, Inc. | | | | | 5,975,434 | | | | 200,236,793 | |
Automatic Data Processing, Inc. | | | | | 30,601 | | | | 2,661,981 | |
AvalonBay Communities, Inc. | | | | | 29,182 | | | | 5,101,889 | |
Axalta Coating Systems, Ltd. (a) | | | | | 1,632,426 | | | | 45,103,930 | |
Axis Capital Holdings Ltd. | | | | | 206,930 | | | | 11,174,220 | |
Baker Hughes, Inc. | | | | | 79,806 | | | | 4,204,180 | |
Bank of America Corp. | | | | | 14,567,676 | | | | 244,445,603 | |
Bank of New York Mellon Corp. | | | | | 978,226 | | | | 40,743,113 | |
Baxter International, Inc. | | | | | 866,424 | | | | 32,395,593 | |
Becton Dickinson & Co. | | | | | 25,689 | | | | 3,661,196 | |
Bed Bath & Beyond, Inc. (a) | | | | | 265,095 | | | | 15,807,615 | |
Berkshire Hathaway, Inc., Class A Class A (a) | | | | | 452 | | | | 92,477,392 | |
Berkshire Hathaway, Inc., Class B (a) | | | | | 1,105,934 | | | | 150,429,143 | |
Biogen, Inc. (a) | | | | | 267,157 | | | | 77,611,780 | |
Boeing Co. | | | | | 66,901 | | | | 9,906,031 | |
Boston Properties, Inc. | | | | | 33,826 | | | | 4,257,002 | |
Boulder Brands, Inc. (a) | | | | | 498,713 | | | | 4,418,597 | |
Bristol-Myers Squibb Co. | | | | | 2,064,107 | | | | 136,127,857 | |
Broadcom Corp., Class A | | | | | 34,643 | | | | 1,780,650 | |
Calpine Corp. (a) | | | | | 2,895,920 | | | | 44,915,719 | |
Cameron International Corp. (a) | | | | | 94,110 | | | | 6,400,421 | |
Capital One Financial Corp. | | | | | 145,632 | | | | 11,490,365 | |
Cardinal Health, Inc. | | | | | 651,200 | | | | 53,528,640 | |
Catalent, Inc. (a) | | | | | 2,278,735 | | | | 60,568,776 | |
Caterpillar, Inc. | | | | | 340,276 | | | | 24,836,745 | |
Celgene Corp. (a) | | | | | 277,306 | | | | 34,028,219 | |
Charles Schwab Corp. | | | | | 1,736,154 | | | | 52,987,420 | |
Chevron Corp. | | | | | 425,258 | | | | 38,647,447 | |
Chubb Corp. | | | | | 1,384,311 | | | | 179,060,628 | |
Cintas Corp. | | | | | 138,424 | | | | 12,885,890 | |
Cisco Systems, Inc. | | | | | 6,170,392 | | | | 178,015,809 | |
Citigroup, Inc. | | | | | 4,884,551 | | | | 259,711,577 | |
Citizens Financial Group, Inc. | | | | | 210,313 | | | | 5,110,606 | |
| | | | | | | | | | |
| | |
| Common Stocks | | Shares | | | Value | |
United States (continued) | |
CME Group, Inc. | | | | | 494,766 | | | $ | 46,740,544 | |
CNA Financial Corp. | | | | | 219,025 | | | | 8,007,554 | |
Coca-Cola Co. | | | | | 4,339,863 | | | | 183,793,198 | |
Coca-Cola Enterprises, Inc. | | | | | 93,339 | | | | 4,792,024 | |
Cognizant Technology Solutions Corp., Class A (a) | | | | | 38,670 | | | | 2,633,814 | |
Colfax Corp. (a)(b) | | | | | 1,619,553 | | | | 43,663,149 | |
Colgate-Palmolive Co. | | | | | 1,062,493 | | | | 70,496,411 | |
Comcast Corp., Class A | | | | | 2,293,522 | | | | 143,620,348 | |
Computer Sciences Corp. | | | | | 193,134 | | | | 12,860,793 | |
CONSOL Energy, Inc. | | | | | 8,488,148 | | | | 56,531,066 | |
Constellation Brands, Inc., Class A | | | | | 124,825 | | | | 16,826,410 | |
Corning, Inc. | | | | | 81,375 | | | | 1,513,575 | |
Costco Wholesale Corp. | | | | | 28,755 | | | | 4,546,741 | |
Crown Castle International Corp. | | | | | 584,924 | | | | 49,987,605 | |
CSX Corp. | | | | | 1,375,038 | | | | 37,112,276 | |
CVS Health Corp. | | | | | 811,950 | | | | 80,204,421 | |
DaVita HealthCare Partners, Inc. (a) | | | | | 436,429 | | | | 33,827,612 | |
Discover Financial Services | | | | | 185,760 | | | | 10,443,427 | |
DISH Network Corp., Class A (a) | | | | | 834,622 | | | | 52,556,147 | |
Dominion Resources, Inc. | | | | | 1,087,234 | | | | 77,661,125 | |
Dover Corp. | | | | | 87,373 | | | | 5,629,442 | |
Eaton Corp. PLC | | | | | 2,191,766 | | | | 122,541,637 | |
eBay, Inc. (a) | | | | | 1,095,074 | | | | 30,552,565 | |
Ecolab, Inc. | | | | | 138,456 | | | | 16,663,180 | |
Edgewell Personal Care Co. | | | | | 522,397 | | | | 44,252,250 | |
Electronic Arts, Inc. (a) | | | | | 194,398 | | | | 14,010,264 | |
Eli Lilly & Co. | | | | | 1,621,190 | | | | 132,240,468 | |
EMC Corp. | | | | | 129,215 | | | | 3,388,017 | |
Emerson Electric Co. | | | | | 1,261,133 | | | | 59,563,312 | |
EOG Resources, Inc. | | | | | 353,887 | | | | 30,381,199 | |
EQT Corp. | | | | | 1,348,497 | | | | 89,095,197 | |
Equinix, Inc. | | | | | 12,278 | | | | 3,642,637 | |
Equity Residential | | | | | 79,604 | | | | 6,154,981 | |
Essex Property Trust, Inc. | | | | | 13,890 | | | | 3,061,912 | |
Expedia, Inc. | | | | | 121,273 | | | | 16,529,510 | |
Exxon Mobil Corp. | | | | | 764,665 | | | | 63,268,382 | |
Facebook, Inc., Class A (a) | | | | | 1,158,413 | | | | 118,123,374 | |
FedEx Corp. | | | | | 932,939 | | | | 145,585,131 | |
Fidelity National Information Services, Inc. | | | | | 202,032 | | | | 14,732,173 | |
Fifth Third Bancorp | | | | | 271,226 | | | | 5,166,855 | |
Fitbit, Inc., Series A (a)(b) | | | | | 272,216 | | | | 11,035,637 | |
FMC Corp. | | | | | 959,516 | | | | 39,061,896 | |
Ford Motor Co. | | | | | 7,936,912 | | | | 117,545,667 | |
Freeport-McMoRan, Inc. | | | | | 2,492,815 | | | | 29,340,433 | |
Garmin Ltd. | | | | | 372,004 | | | | 13,194,982 | |
General Dynamics Corp. | | | | | 95,814 | | | | 14,236,044 | |
General Electric Co. | | | | | 6,491,566 | | | | 187,736,089 | |
General Growth Properties, Inc. | | | | | 125,172 | | | | 3,623,729 | |
General Mills, Inc. | | | | | 39,682 | | | | 2,305,921 | |
Gilead Sciences, Inc. | | | | | 805,884 | | | | 87,140,237 | |
Global Payments, Inc. | | | | | 35,643 | | | | 4,862,062 | |
GoDaddy, Inc., Class A (a)(b) | | | | | 570,991 | | | | 15,690,833 | |
Goldman Sachs Group, Inc. | | | | | 330,156 | | | | 61,904,250 | |
Goodyear Tire & Rubber Co. | | | | | 195,871 | | | | 6,432,404 | |
Halliburton Co. | | | | | 156,306 | | | | 5,999,024 | |
Hartford Financial Services Group, Inc. | | | | | 555,186 | | | | 25,682,904 | |
HCA Holdings, Inc. (a) | | | | | 869,757 | | | | 59,830,584 | |
HCP, Inc. | | | | | 95,005 | | | | 3,534,186 | |
See Notes to Consolidated Financial Statements.
| | | | | | |
| | | | | | | |
| | BLACKROCK GLOBAL ALLOCATION FUND, INC. | | OCTOBER 31, 2015 | | 13 |
| | |
Consolidated Schedule of Investments (continued) | | |
| | | | | | | | | | |
| | |
| Common Stocks | | Shares | | | Value | |
United States (continued) | |
Helmerich & Payne, Inc. | | | | | 117,423 | | | $ | 6,607,392 | |
Home Depot, Inc. | | | | | 87,953 | | | | 10,874,509 | |
Host Hotels & Resorts, Inc. | | | | | 156,007 | | | | 2,703,601 | |
HP, Inc. | | | | | 2,440,018 | | | | 65,782,885 | |
HTG Molecular Diagnostics, Inc. (a)(d) | | | | | 379,400 | | | | 1,999,438 | |
Ingersoll-Rand PLC | | | | | 193,026 | | | | 11,438,721 | |
Intel Corp. | | | | | 2,103,272 | | | | 71,216,790 | |
International Business Machines Corp. | | | | | 591,429 | | | | 82,847,374 | |
International Paper Co. | | | | | 207,631 | | | | 8,863,767 | |
Intuit, Inc. | | | | | 135,059 | | | | 13,158,798 | |
Invitae Corp., (Acquired 10/08/14, cost $25,135,944) (a)(d)(e) | | | | | 2,094,662 | | | | 15,961,324 | |
Johnson & Johnson | | | | | 1,955,678 | | | | 197,582,148 | |
JPMorgan Chase & Co. | | | | | 3,855,848 | | | | 247,738,234 | |
Kansas City Southern | | | | | 340,064 | | | | 28,143,697 | |
Kimberly-Clark Corp. | | | | | 489,555 | | | | 58,604,629 | |
Kinder Morgan, Inc. | | | | | 313,410 | | | | 8,571,764 | |
KLA-Tencor Corp. | | | | | 106,686 | | | | 7,160,764 | |
Kohl’s Corp. | | | | | 156,618 | | | | 7,223,222 | |
Kraft Heinz Co. | | | | | 344,524 | | | | 26,862,536 | |
Kroger Co. | | | | | 942,058 | | | | 35,609,792 | |
Las Vegas Sands Corp. | | | | | 545,902 | | | | 27,027,608 | |
Lear Corp. | | | | | 139,234 | | | | 17,412,604 | |
Liberty Broadband Corp., Class A (a) | | | | | 472,499 | | | | 25,779,545 | |
Liberty Broadband Corp., Class C (a) | | | | | 1,155,651 | | | | 62,139,354 | |
Liberty Media Corp., Class A (a) | | | | | 1,372,913 | | | | 55,959,934 | |
Liberty Media Corp., Class C (a) | | | | | 2,739,509 | | | | 107,251,777 | |
Lincoln National Corp. | | | | | 345,827 | | | | 18,505,203 | |
Lookout, Inc., (Acquired 3/4/15, cost $2,096,082) (e) | | | | | 183,495 | | | | 2,151,002 | |
Lowe’s Cos., Inc. | | | | | 135,950 | | | | 10,037,189 | |
LyondellBasell Industries NV, Class A | | | | | 488,286 | | | | 45,366,652 | |
Macerich Co. | | | | | 30,181 | | | | 2,557,538 | |
Macy’s, Inc. | | | | | 99,160 | | | | 5,055,177 | |
Marathon Petroleum Corp. | | | | | 7,080,505 | | | | 366,770,159 | |
Marsh & McLennan Cos., Inc. | | | | | 1,111,314 | | | | 61,944,642 | |
Mastercard, Inc., Class A | | | | | 950,684 | | | | 94,108,209 | |
McKesson Corp. | | | | | 722,215 | | | | 129,132,042 | |
Merck & Co., Inc. | | | | | 654,762 | | | | 35,789,291 | |
MetLife, Inc. | | | | | 827,659 | | | | 41,697,460 | |
Michael Kors Holdings Ltd. (a) | | | | | 1,061,663 | | | | 41,022,658 | |
Micron Technology, Inc. (a) | | | | | 2,991,869 | | | | 49,545,351 | |
Microsoft Corp. | | | | | 3,747,393 | | | | 197,262,768 | |
Mondelez International, Inc., Class A | | | | | 456,492 | | | | 21,071,671 | |
Monsanto Co. | | | | | 252,068 | | | | 23,497,779 | |
Morgan Stanley | | | | | 1,875,193 | | | | 61,825,113 | |
Mylan NV (a) | | | | | 3,152,260 | | | | 138,983,143 | |
NextEra Energy Partners LP | | | | | 1,341,601 | | | | 35,230,442 | |
NextEra Energy, Inc. | | | | | 905,683 | | | | 92,977,417 | |
NIKE, Inc., Class B | | | | | 51,911 | | | | 6,801,898 | |
Northrop Grumman Corp. | | | | | 85,195 | | | | 15,995,361 | |
NRG Energy, Inc. | | | | | 2,084,609 | | | | 26,870,610 | |
NRG Yield, Inc., Class A (b) | | | | | 353,730 | | | | 4,856,713 | |
NRG Yield, Inc., Class C | | | | | 386,407 | | | | 5,579,717 | |
Nuance Communications, Inc. (a) | | | | | 1,671,349 | | | | 28,362,793 | |
Occidental Petroleum Corp. | | | | | 143,081 | | | | 10,665,258 | |
Oceaneering International, Inc. | | | | | 1,942,686 | | | | 81,631,666 | |
Oracle Corp. | | | | | 3,534,556 | | | | 137,282,155 | |
PACCAR, Inc. | | | | | 774,260 | | | | 40,764,789 | |
| | | | | | | | | | |
| | |
| Common Stocks | | Shares | | | Value | |
United States (continued) | |
PayPal Holdings, Inc. (a) | | | | | 413,721 | | | $ | 14,898,093 | |
PepsiCo, Inc. | | | | | 866,293 | | | | 88,526,482 | |
Pfizer, Inc. | | | | | 2,828,477 | | | | 95,659,092 | |
Philip Morris International, Inc. (g) | | | | | 1,664,176 | | | | 147,113,158 | |
Pioneer Natural Resources Co. | | | | | 1,313,793 | | | | 180,173,572 | |
PPG Industries, Inc. | | | | | 139,782 | | | | 14,573,671 | |
Praxair, Inc. | | | | | 149,364 | | | | 16,592,847 | |
Procter & Gamble Co. | | | | | 3,313,705 | | | | 253,100,788 | |
Prologis, Inc. | | | | | 1,234,598 | | | | 52,754,373 | |
Prudential Financial, Inc. | | | | | 297,318 | | | | 24,528,735 | |
Public Storage | | | | | 31,233 | | | | 7,166,724 | |
Pure Storage, Inc., Class A Class A (a)(b)(d) | | | | | 1,587,708 | | | | 27,991,292 | |
Qorvo, Inc. (a) | | | | | 323,840 | | | | 14,226,291 | |
QUALCOMM, Inc. | | | | | 1,624,246 | | | | 96,512,697 | |
Raytheon Co. | | | | | 103,958 | | | | 12,204,669 | |
Realty Income Corp. | | | | | 51,056 | | | | 2,525,230 | |
Regeneron Pharmaceuticals, Inc. (a) | | | | | 36,616 | | | | 20,409,392 | |
Regions Financial Corp. | | | | | 3,838,250 | | | | 35,887,638 | |
Reinsurance Group of America, Inc. | | | | | 116,634 | | | | 10,525,052 | |
Reynolds American, Inc. | | | | | 54,136 | | | | 2,615,852 | |
Rockwell Automation, Inc. | | | | | 116,224 | | | | 12,687,012 | |
salesforce.com, Inc. (a)(g) | | | | | 37,256 | | | | 2,895,164 | |
Schlumberger Ltd. | | | | | 1,929,099 | | | | 150,778,378 | |
Scripps Networks Interactive, Inc., Class A | | | | | 47,461 | | | | 2,851,457 | |
Sealed Air Corp. | | | | | 102,322 | | | | 5,026,057 | |
Sempra Energy | | | | | 980,320 | | | | 100,394,571 | |
Simon Property Group, Inc. | | | | | 126,505 | | | | 25,485,697 | |
SL Green Realty Corp. | | | | | 21,811 | | | | 2,587,221 | |
St. Joe Co. (a)(d) | | | | | 6,750,883 | | | | 133,802,501 | |
Starbucks Corp. | | | | | 61,567 | | | | 3,852,247 | |
Stryker Corp. | | | | | 91,956 | | | | 8,792,833 | |
SunTrust Banks, Inc. | | | | | 658,347 | | | | 27,334,567 | |
Surgery Partners, Inc. (a) | | | | | 970,883 | | | | 16,330,252 | |
Tahoe Resources, Inc. | | | | | 4,917,823 | | | | 41,069,614 | |
Target Corp. | | | | | 675,303 | | | | 52,119,886 | |
Tenet Healthcare Corp. (a)(b) | | | | | 1,350,908 | | | | 42,377,984 | |
TerraForm Power, Inc., Class A | | | | | 1,155,752 | | | | 21,092,474 | |
TESARO, Inc. (a) | | | | | 302,330 | | | | 13,746,945 | |
Texas Instruments, Inc. | | | | | 493,218 | | | | 27,975,325 | |
Tiffany & Co. | | | | | 300,992 | | | | 24,813,780 | |
Time Warner Cable, Inc. | | | | | 222,288 | | | | 42,101,347 | |
Travelers Cos., Inc. | | | | | 255,766 | | | | 28,873,424 | |
Twitter, Inc. (a) | | | | | 2,537,477 | | | | 72,216,595 | |
Tyco International PLC | | | | | 1,649,906 | | | | 60,122,575 | |
Ultragenyx Pharmaceutical, Inc. (a) | | | | | 119,347 | | | | 11,857,124 | |
Union Pacific Corp. | | | | | 573,416 | | | | 51,234,720 | |
United Continental Holdings, Inc. (a) | | | | | 1,854,616 | | | | 111,851,891 | |
United Parcel Service, Inc., Class B | | | | | 919,159 | | | | 94,691,760 | |
United Rentals, Inc. (a) | | | | | 407,522 | | | | 30,507,097 | |
United Technologies Corp. (h) | | | | | 757,870 | | | | 74,581,987 | |
UnitedHealth Group, Inc. | | | | | 175,256 | | | | 20,641,652 | |
Univar, Inc. (a) | | | | | 2,114,485 | | | | 37,341,805 | |
Unum Group | | | | | 1,497,613 | | | | 51,892,290 | |
Urban Outfitters, Inc. (a) | | | | | 558,202 | | | | 15,964,577 | |
US Bancorp | | | | | 1,759,188 | | | | 74,202,550 | |
Valero Energy Corp. | | | | | 330,844 | | | | 21,809,236 | |
Veeva Systems, Inc., Class A (a)(b) | | | | | 3,228,996 | | | | 81,919,629 | |
Ventas, Inc. | | | | | 65,857 | | | | 3,537,838 | |
VeriSign, Inc. (a)(b) | | | | | 167,346 | | | | 13,488,088 | |
Verizon Communications, Inc. | | | | | 5,744,124 | | | | 269,148,335 | |
See Notes to Consolidated Financial Statements.
| | | | | | |
| | | | | | | |
| 14 | | BLACKROCK GLOBAL ALLOCATION FUND, INC. | | OCTOBER 31, 2015 | | |
| | |
Consolidated Schedule of Investments (continued) | | |
| | | | | | | | | | | | |
| | |
| Common Stocks | | Shares | | | Value | |
United States (continued) | |
Vertex Pharmaceuticals, Inc. (a) | | | | | | | 194,329 | | | $ | 24,240,599 | |
Visa, Inc., Class A | | | | | | | 1,888,315 | | | | 146,495,478 | |
VMware, Inc., Class A (a) | | | | | | | 174,937 | | | | 10,522,461 | |
Vornado Realty Trust | | | | | | | 35,910 | | | | 3,610,751 | |
WABCO Holdings, Inc. (a) | | | | | | | 610,655 | | | | 68,533,811 | |
Wal-Mart Stores, Inc. | | | | | | | 2,321,815 | | | | 132,900,691 | |
Walgreens Boots Alliance, Inc. | | | | | | | 1,016,384 | | | | 86,067,397 | |
Wells Fargo & Co. | | | | | | | 5,096,586 | | | | 275,929,166 | |
Welltower, Inc. | | | | | | | 77,769 | | | | 5,044,875 | |
Western Digital Corp. | | | | | | | 113,148 | | | | 7,560,549 | |
WestRock Co. | | | | | | | 454,144 | | | | 24,414,781 | |
Weyerhaeuser Co. | | | | | | | 105,880 | | | | 3,105,460 | |
Whirlpool Corp. | | | | | | | 395,398 | | | | 63,319,036 | |
Whiting Petroleum Corp. (a) | | | | | | | 4,980,720 | | | | 85,817,806 | |
Whole Foods Market, Inc. | | | | | | | 720,993 | | | | 21,600,950 | |
Williams Cos., Inc. | | | | | | | 124,041 | | | | 4,892,177 | |
Wyndham Worldwide Corp. | | | | | | | 127,786 | | | | 10,395,391 | |
Yahoo!, Inc. (a) | | | | | | | 781,645 | | | | 27,842,195 | |
Zoetis, Inc. | | | | | | | 809,692 | | | | 34,824,853 | |
| | | | | | | | | | | | |
| | | | | | | | | | | | 14,128,100,207 | |
| Total Common Stocks — 53.5% | | | | 27,658,641,063 | |
| | | | | | | | | | | | |
| | | | | | | | | | | | | |
| Corporate Bonds | | Par (000) | | | | |
Argentina — 0.3% | |
Empresa Distribuidora Y Comercializadora Norte, 9.75%, 10/25/22 (c) | | | USD | | | | 6,511 | | | | 5,879,433 | |
YPF SA (c): | | | | | | | | | | | | |
8.88%, 12/19/18 | | | | | | | 33,270 | | | | 34,351,275 | |
8.50%, 7/28/25 | | | | | | | 97,050 | | | | 95,400,150 | |
| | | | | | | | | | | | |
| | | | | | | | | | | | 135,630,858 | |
Australia — 0.1% | | | | | | | | | | | | |
TFS Corp. Ltd., 11.00%, 7/15/18 (c) | | | | | | | 68,396 | | | | 71,176,229 | |
Brazil — 0.2% | | | | | | | | | | | | |
Odebrecht Finance Ltd., 4.38%, 4/25/25 (c) | | | | | | | 30,805 | | | | 18,544,610 | |
Petrobras Global Finance BV: | | | | | | | | | | | | |
2.46%, 1/15/19 (i) | | | | | | | 75,101 | | | | 60,433,775 | |
6.25%, 3/17/24 | | | | | | | 9,435 | | | | 7,556,963 | |
| | | | | | | | | | | | |
| | | | | | | | | | | | 86,535,348 | |
Canada — 0.0% | | | | | | | | | | | | |
First Quantum Minerals, Ltd., 7.00%, 2/15/21 | | | | | | | 23,422 | | | | 17,332,280 | |
Chile — 0.1% | | | | | | | | | | | | |
Banco Santander Chile, 2.21%, 6/07/18 (c)(i) | | | | | | | 40,084 | | | | 40,124,084 | |
Inversiones Alsacia SA, 8.00%, 12/31/18 (c)(j) | | | | | | | 34,961 | | | | 9,789,138 | |
| | | | | | | | | | | | |
| | | | | | | | | | | | 49,913,222 | |
China — 0.2% | | | | | | | | | | | | |
Alibaba Group Holding Ltd. (c): | | | | | | | | | | | | |
3.13%, 11/28/21 | | | | | | | 45,929 | | | | 45,220,591 | |
3.60%, 11/28/24 | | | | | | | 21,175 | | | | 20,480,460 | |
| | | | | | | | | | | | |
| Corporate Bonds | | Par (000) | | | Value | |
China (continued) | | | | | | | | | | | | |
Celestial Nutrifoods Ltd., 0.01%, 6/12/49 (a)(h)(j) | | | SGD | | | | 88,600 | | | $ | 632,451 | |
China Milk Products Group Ltd., 0.00%, 1/15/49 (a)(j)(k) | | | USD | | | | 39,500 | | | | 395,000 | |
SINA Corp., 1.00%, 12/01/18 (h) | | | | | | | 29,594 | | | | 28,521,217 | |
| | | | | | | | | | | | |
| | | | | | | | | | | | 95,249,719 | |
France — 0.2% | | | | | | | | | | | | |
BNP Paribas SA, 2.40%, 12/12/18 | | | | | | | 80,980 | | | | 82,154,453 | |
Germany — 0.1% | | | | | | | | | | | | |
Deutsche Bank AG, 1.88%, 2/13/18 | | | | | | | 31,850 | | | | 31,717,122 | |
Unitymedia Hessen GmbH & Co. KG/Unitymedia NRW GmbH, 5.50%, 1/15/23 (c) | | | | | | | 13,784 | | | | 14,167,195 | |
| | | | | | | | | | | | |
| | | | | | | | | | | | 45,884,317 | |
Hong Kong — 0.1% | | | | | | | | | | | | |
Hutchison Whampoa International Ltd., 3.50%, 1/13/17 (c) | | | | | | | 27,479 | | | | 28,111,182 | |
Sun Hung Kai Properties Capital Market Ltd., 4.50%, 2/14/22 | | | | | | | 24,392 | | | | 26,129,393 | |
| | | | | | | | | | | | |
| | | | | | | | | | | | 54,240,575 | |
India — 0.2% | | | | | | | | | | | | |
REI Agro Ltd. (j): | | | | | | | | | | | | |
5.50%, 11/13/15 | | | | | | | 8,271 | | | | 165,420 | |
5.50%, 11/13/15 (c) | | | | | | | 46,516 | | | | 930,320 | |
Suzlon Energy, Ltd., Series SUEL, 3.25%, 7/16/19 (c)(h)(l) | | | | | | | 89,276 | | | | 124,651,615 | |
| | | | | | | | | | | | |
| | | | | | | | | | | | 125,747,355 | |
Italy — 0.2% | | | | | | | | | | | | |
Intesa Sanpaolo SpA: | | | | | | | | | | | | |
3.88%, 1/16/18 | | | | | | | 14,934 | | | | 15,414,740 | |
3.88%, 1/15/19 | | | | | | | 63,838 | | | | 66,386,477 | |
Telecom Italia SpA, 5.30%, 5/30/24 (c) | | | | | | | 43,375 | | | | 43,591,875 | |
| | | | | | | | | | | | |
| | | | | | | | | | | | 125,393,092 | |
Japan — 0.1% | | | | | | | | | | | | |
Sumitomo Mitsui Banking Corp., 2.45%, 1/10/19 | | | | | | | 36,080 | | | | 36,329,385 | |
Luxembourg — 0.2% | | | | | | | | | | | | |
Intelsat Jackson Holdings SA, 7.50%, 4/01/21 | | | | | | | 37,384 | | | | 33,739,060 | |
Telecom Italia Finance SpA, 6.13%, 11/15/16 (c)(h) | | | EUR | | | | 40,800 | | | | 71,157,052 | |
| | | | | | | | | | | | |
| | | | | | | | | | | | 104,896,112 | |
Mexico — 0.2% | | | | | | | | | | | | |
Petroleos Mexicanos: | | | | | | | | | | | | |
5.75%, 3/01/18 | | | USD | | | | 37,568 | | | | 39,902,851 | |
3.50%, 7/23/20 (c) | | | | | | | 52,831 | | | | 52,398,843 | |
Trust F/1401, 5.25%, 12/15/24 (c) | | | | | | | 19,282 | | | | 19,956,870 | |
| | | | | | | | | | | | |
| | | | | | | | | | | | 112,258,564 | |
Netherlands — 0.3% | | | | | | | | | | | | |
Bio City Development Co. BV, 8.00%, 7/06/18 (a)(c)(h)(j) | | | USD | | | | 140,850 | | | | 56,044,215 | |
See Notes to Consolidated Financial Statements.
| | | | | | |
| | | | | | | |
| | BLACKROCK GLOBAL ALLOCATION FUND, INC. | | OCTOBER 31, 2015 | | 15 |
| | |
Consolidated Schedule of Investments (continued) | | |
| | | | | | | | | | | | |
| Corporate Bonds | | Par (000) | | | Value | |
Netherlands (continued) | | | | | | | | | | | | |
Constellium NV (c): | | | | | | | | | | | | |
7.00%, 1/15/23 | | | EUR | | | | 20,901 | | | $ | 19,536,222 | |
8.00%, 1/15/23 | | | USD | | | | 5,675 | | | | 4,809,563 | |
Rabobank Nederland, 3.95%, 11/09/22 | | | | | | | 14,559 | | | | 14,719,411 | |
Volkswagen International Finance NV: | | | | | | | | | | | | |
5.50%, 11/09/15 (c)(h) | | | EUR | | | | 56,200 | | | | 46,597,462 | |
4.00%, 8/12/20 | | | USD | | | | 14,925 | | | | 15,231,097 | |
| | | | | | | | | | | | |
| | | | | | | | | | | | 156,937,970 | |
Singapore — 0.4% | | | | | | | | | | | | |
CapitaLand Ltd. (h): | | | | | | | | | | | | |
2.10%, 11/15/16 | | | SGD | | | | 57,500 | | | | 40,788,511 | |
1.95%, 10/17/23 (c) | | | | | | | 50,500 | | | | 36,652,063 | |
Global Logistic Properties, Ltd., 3.88%, 6/04/25 (c) | | | USD | | | | 82,057 | | | | 80,064,164 | |
Olam International Ltd., 6.00%, 10/15/16 (h) | | | | | | | 40,100 | | | | 40,851,875 | |
| | | | | | | | | | | | |
| | | | | | | | | | | | 198,356,613 | |
South Korea — 0.0% | | | | | | | | | | | | |
Export-Import Bank of Korea, 2.88%, 9/17/18 | | | | | | | 19,188 | | | | 19,658,183 | |
Spain — 0.2% | | | | | | | | | | | | |
Telefonica Participaciones SAU, Series TEF, 4.90%, 9/25/17 (h) | | | EUR | | | | 65,400 | | | | 73,786,976 | |
Telefonica SA, 6.00%, 7/14/17 | | | | | | | 19,200 | | | | 28,188,348 | |
| | | | | | | | | | | | |
| | | | | | | | | | | | 101,975,324 | |
Switzerland — 0.1% | | | | | | | | | | | | |
UBS AG/Stamford CT, 2.38%, 8/14/19 | | | USD | | | | 26,955 | | | | 27,090,179 | |
UBS Group Funding Jersey, Ltd., 4.13%, 9/24/25 (c) | | | | | | | 32,490 | | | | 32,633,476 | |
| | | | | | | | | | | | |
| | | | | | | | | | | | 59,723,655 | |
United Arab Emirates — 0.2% | | | | | | | | | | | | |
Dana Gas Sukuk Ltd., 7.00%, 10/31/17 (c)(h) | | | | | | | 96,220 | | | | 82,749,200 | |
United Kingdom — 0.2% | | | | | | | | | | | | |
Delta Topco Ltd., (Acquired 5/02/12, cost $73,552,638), 10.00%, 11/24/60 (e) | | | | | | | 72,398 | | | | 72,556,881 | |
Lloyds Bank PLC, 2.30%, 11/27/18 | | | | | | | 11,792 | | | | 11,935,037 | |
| | | | | | | | | | | | |
| | | | | | | | | | | | 84,491,918 | |
United States — 3.5% | | | | | | | | | | | | |
AbbVie, Inc., 2.50%, 5/14/20 | | | | | | | 56,567 | | | | 55,931,074 | |
Actavis Funding SCS, 3.00%, 3/12/20 | | | | | | | 45,635 | | | | 45,789,566 | |
Aliphcom, (Acquired 4/27/15 — 7/21/15, cost 204,855,000), 6.00%, 4/01/20 (e)(h) | | | | | | | 204,855 | | | | 180,067,545 | |
Ally Financial, Inc.: | | | | | | | | | | | | |
2.75%, 1/30/17 | | | | | | | 40,399 | | | | 40,600,995 | |
3.50%, 1/27/19 | | | | | | | 28,683 | | | | 28,862,269 | |
American Tower Corp., 3.40%, 2/15/19 | | | | | | | 12,677 | | | | 13,102,440 | |
AT&T, Inc.: | | | | | | | | | | | | |
2.38%, 11/27/18 | | | | | | | 70,749 | | | | 71,751,513 | |
3.00%, 6/30/22 | | | | | | | 107,955 | | | | 105,890,684 | |
| | | | | | | | | | | | |
| Corporate Bonds | | Par (000) | | | Value | |
United States (continued) | | | | | | | | | | | | |
Bank of America Corp.: | | | | | | | | | | | | |
2.00%, 1/11/18 | | | USD | | | | 36,760 | | | $ | 36,929,611 | |
1.39%, 3/22/18 (i) | | | | | | | 22,339 | | | | 22,473,928 | |
6.88%, 4/25/18 | | | | | | | 25,311 | | | | 28,251,050 | |
2.60%, 1/15/19 | | | | | | | 25,567 | | | | 25,868,588 | |
BioMarin Pharmaceutical, Inc. (h): | | | | | | | | | | | | |
0.75%, 10/15/18 | | | | | | | 11,220 | | | | 15,764,100 | |
1.50%, 10/15/20 | | | | | | | 11,220 | | | | 16,283,025 | |
Cablevision Systems Corp., 5.88%, 9/15/22 | | | | | | | 15,743 | | | | 13,066,690 | |
Capital One Bank USA NA, 2.15%, 11/21/18 | | | | | | | 30,565 | | | | 30,508,577 | |
Chesapeake Energy Corp., 3.57%, 4/15/19 (i) | | | | | | | 25,920 | | | | 16,718,400 | |
Citigroup, Inc., 1.80%, 2/05/18 | | | | | | | 77,465 | | | | 77,326,880 | |
Cobalt International Energy, Inc. (h): | | | | | | | | | | | | |
2.63%, 12/01/19 | | | | | | | 60,750 | | | | 43,740,000 | |
3.13%, 5/15/24 | | | | | | | 75,038 | | | | 48,258,814 | |
Discover Bank/Greenwood Delaware, 2.00%, 2/21/18 | | | | | | | 5,536 | | | | 5,494,513 | |
eBay, Inc., 2.20%, 8/01/19 | | | | | | | 17,707 | | | | 17,555,127 | |
Ford Motor Credit Co. LLC: | | | | | | | | | | | | |
1.72%, 12/06/17 | | | | | | | 42,878 | | | | 42,541,065 | |
2.38%, 1/16/18 | | | | | | | 28,603 | | | | 28,752,994 | |
5.00%, 5/15/18 | | | | | | | 36,496 | | | | 38,759,774 | |
Forest Laboratories, Inc. (c): | | | | | | | | | | | | |
4.38%, 2/01/19 | | | | | | | 34,570 | | | | 36,369,887 | |
5.00%, 12/15/21 | | | | | | | 24,088 | | | | 26,033,299 | |
GE Capital International Funding Co., 2.34%, 11/15/20 (c) | | | | | | | 17,390 | | | | 17,439,535 | |
General Electric Capital Corp., 5.55%, 5/04/20 | | | | | | | 5,989 | | | | 6,824,471 | |
General Motors Financial Co., Inc., 3.50%, 7/10/19 | | | | | | | 39,748 | | | | 40,173,463 | |
Gilead Sciences, Inc., Series D, 1.63%, 5/01/16 (h) | | | | | | | 19,481 | | | | 93,021,775 | |
Hewlett Packard Enterprise Co., 2.85%, 10/05/18 (c) | | | | | | | 108,114 | | | | 108,341,364 | |
HSBC USA, Inc., 1.63%, 1/16/18 | | | | | | | 27,837 | | | | 27,737,399 | |
Hughes Satellite Systems Corp., 7.63%, 6/15/21 | | | | | | | 9,375 | | | | 10,218,750 | |
Hyundai Capital America, 2.00%, 3/19/18 (c) | | | | | | | 17,360 | | | | 17,236,796 | |
Intel Corp., 3.25%, 8/01/39 (h) | | | | | | | 15,446 | | | | 25,408,670 | |
JPMorgan Chase & Co., 4.35%, 8/15/21 | | | | | | | 21,938 | | | | 23,511,788 | |
Medtronic, Inc., 3.15%, 3/15/22 | | | | | | | 60,300 | | | | 61,679,483 | |
Morgan Stanley, 7.30%, 5/13/19 | | | | | | | 18,163 | | | | 21,182,435 | |
Mylan, Inc., 2.55%, 3/28/19 | | | | | | | 36,077 | | | | 35,344,781 | |
QUALCOMM, Inc., 3.00%, 5/20/22 | | | | | | | 90,765 | | | | 89,628,441 | |
Sabine Pass Liquefaction LLC, 5.63%, 4/15/23 | | | | | | | 18,952 | | | | 18,442,665 | |
SunGard Data Systems, Inc., 7.38%, 11/15/18 | | | | | | | 10,413 | | | | 10,660,309 | |
Synchrony Financial, 3.75%, 8/15/21 | | | | | | | 14,086 | | | | 14,205,928 | |
Take-Two Interactive Software, Inc., 1.75%, 12/01/16 (h) | | | | | | | 23,050 | | | | 40,438,344 | |
Twitter, Inc., 1.00%, 9/15/21 (h) | | | | | | | 23,988 | | | | 21,094,447 | |
See Notes to Consolidated Financial Statements.
| | | | | | |
| | | | | | | |
| 16 | | BLACKROCK GLOBAL ALLOCATION FUND, INC. | | OCTOBER 31, 2015 | | |
| | |
Consolidated Schedule of Investments (continued) | | |
| | | | | | | | | | | | |
| Corporate Bonds | | Par (000) | | | Value | |
United States (continued) | | | | | | | | | | | | |
Volkswagen Group of America Finance LLC, 2.45%, 11/20/19 | | | USD | | | | 21,417 | | | $ | 20,481,720 | |
Xerox Corp., 6.35%, 5/15/18 | | | | | | | 17,876 | | | | 19,422,774 | |
| | | | | | | | | | | | |
| | | | | | | | | | | | 1,835,187,746 | |
| Total Corporate Bonds — 7.1% | | | | | | | | | | | 3,681,822,118 | |
| | | | | | | | | | | | |
| | | | | | | | | | | | | |
| | | |
| Credit Linked Notes | | | | | | | | | |
India — 0.3% | |
Credit Suisse AG, (Housing Development Finance Corporation Ltd.) AAA rated, due 1/15/16 (c) | | | | | | | 174,380 | | | | 174,355,936 | |
| | | | | | | | | | | | |
| | | | | | | | | | | | | |
| | | |
| Floating Rate Loan Interests (i) | | | | | | | | | |
Canada — 0.1% | |
Novelis, Inc., 2015 Term Loan B, 4.00%, 6/02/22 | | | | | | | 23,521 | | | | 23,062,390 | |
Cyprus — 0.0% | |
Drillships Ocean Ventures, Inc., Term Loan B, 5.50%, 7/25/21 | | | | | | | 27,762 | | | | 17,941,512 | |
Ireland — 0.1% | |
Grifols Worldwide Operations USA, Inc., Term Loan B, 3.19%, 2/27/21 | | | | | | | 68,266 | | | | 68,105,209 | |
Luxembourg — 0.1% | |
Endo Luxembourg Finance Co. I Sarl, 2015 Term Loan B, 3.75%, 9/26/22 | | | | | | | 40,440 | | | | 39,700,757 | |
Mallinckrodt International Finance SA, Term Loan B, 3.25%, 3/19/21 | | | | | | | 14,679 | | | | 13,914,855 | |
| | | | | | | | | | | | |
| | | | | | | | | | | | 53,615,612 | |
Netherlands — 0.2% | |
Promontoria Blue Holding 2 BV, Mezzanine, 7.25%, 4/17/20 | | | EUR | | | | 66,069 | | | | 72,652,898 | |
Norway — 0.0% | |
Drillships Financing Holding, Inc., Term Loan B1, 6.00%, 3/31/21 | | | USD | | | | 30,006 | | | | 17,193,456 | |
United Kingdom — 0.1% | |
Calpine Corp., Term Loan B5, 3.50%, 5/27/22 | | | | | | | 40,893 | | | | 40,417,751 | |
United States — 0.6% | |
AP One Channel Center Owner LP, Mezzanine Term Loan, 6.44%, 7/15/19 | | | | | | | 23,359 | | | | 23,359,000 | |
Fieldwood Energy LLC, 2nd Lien Term Loan, 8.38%, 9/30/20 | | | | | | | 41,969 | | | | 15,198,533 | |
Hilton Worldwide Finance LLC, Term Loan B2, 3.50%, 10/26/20 | | | | | | | 112,553 | | | | 112,728,583 | |
Obsidian Natural Gas Trust, Term Loan, 7.00%, 5/02/16 | | | | | | | 1,729 | | | | 1,712,177 | |
Seadrill Partners Finco LLC, Term Loan B, 4.00%, 2/21/21 | | | | | | | 55,256 | | | | 32,100,164 | |
| | | | | | | | | | | | |
| Floating Rate Loan Interests (i) | | Par (000) | | | Value | |
United States (continued) | |
Sheridan Investment Partners II LP: | | | | | | | | | | | | |
Term Loan A, 4.25%, 12/16/20 | | | USD | | | | 62,317 | | | $ | 37,389,901 | |
Term Loan B, 4.25%, 12/16/20 | | | | | | | 3,233 | | | | 1,939,733 | |
Term Loan M, 4.25%, 12/16/20 | | | | | | | 8,669 | | | | 5,201,212 | |
Univar Inc., 2015 Term Loan,
4.25%, 7/01/22 | | | | | | | 39,325 | | | | 38,749,282 | |
Univision Communications, Inc., Term Loan C4, 4.00%, 3/01/20 | | | | | | | 60,280 | | | | 59,858,145 | |
| | | | | | | | | | | | |
| | | | | | | | | | | | 328,236,730 | |
| Total Floating Rate Loan Interests — 1.2% | | | | 621,225,558 | |
| | | | | | | | | | | | |
| | | | | | | | | | | | | |
| | | |
| Foreign Agency Obligations | | | | | | | | | |
Argentina Bonar Bonds, 8.75%, 5/07/24 | | | | | | | 103,924 | | | | 105,036,744 | |
Brazil Notas do Tesouro Nacional: | | | | | | | | | | | | |
10.00%, 1/01/21 | | | BRL | | | | 765,426 | | | | 163,069,023 | |
10.00%, 1/01/25 | | | | | | | 376,177 | | | | 68,418,761 | |
Brazilian Government International Bond, 6.00%, 1/17/17 | | | USD | | | | 33,600 | | | | 35,011,200 | |
City of Buenos Aires Argentina, 8.95%, 2/19/21 (c) | | | | | | | 21,682 | | | | 22,874,510 | |
Colombia Government International Bond, 7.38%, 1/27/17 | | | | | | | 54,840 | | | | 58,870,740 | |
Export-Import Bank of Korea, 2.63%, 12/30/20 | | | | | | | 54,460 | | | | 55,099,197 | |
Hungary Government Bond, 5.50%, 6/24/25 | | | HUF | | | | 17,811,080 | | | | 73,757,000 | |
Hungary Government International Bond: | | | | | | | | | | | | |
4.13%, 2/19/18 | | | USD | | | | 57,522 | | | | 60,226,109 | |
6.38%, 3/29/21 | | | | | | | 53,904 | | | | 61,984,210 | |
Indonesia Government International Bond, 6.88%, 1/17/18 (c) | | | | | | | 33,037 | | | | 36,292,169 | |
Indonesia Treasury Bond: | | | | | | | | | | | | |
7.88%, 4/15/19 | | | IDR | | | | 1,250,375,000 | | | | 88,808,370 | |
8.25%, 7/15/21 | | | | | | | 443,140,000 | | | | 31,512,814 | |
8.38%, 3/15/24 | | | | | | | 190,060,000 | | | | 13,525,746 | |
Italy Buoni Poliennali Del Tesoro: | | | | | | | | | | | | |
2.50%, 12/01/24 | | | EUR | | | | 67,878 | | | | 81,225,494 | |
1.50%, 6/01/25 | | | | | | | 235,640 | | | | 259,539,822 | |
Japan Government Bond, 0.10%, 3/15/17 | | | JPY | | | | 11,078,850 | | | | 91,927,738 | |
Mexican Bonos, 6.50%, 6/10/21 | | | MXN | | | | 4,858,613 | | | | 309,853,133 | |
Mexico Government International Bond, 5.95%, 3/19/19 | | | USD | | | | 16,252 | | | | 18,275,374 | |
Poland Government Bond: | | | | | | | | | | | | |
5.25%, 10/25/20 | | | PLN | | | | 505,295 | | | | 150,116,818 | |
5.75%, 10/25/21 | | | | | | | 248,875 | | | | 76,800,351 | |
3.25%, 7/25/25 | | | | | | | 259,915 | | | | 70,640,772 | |
Turkey Government International Bond, 6.75%, 4/03/18 | | | USD | | | | 27,611 | | | | 30,026,962 | |
United Kingdom Gilt, 2.00%, 9/07/25 | | | GBP | | | | 397,025 | | | | 616,625,263 | |
| Total Foreign Agency Obligations — 5.0% | | | | 2,579,518,320 | |
See Notes to Consolidated Financial Statements.
| | | | | | |
| | | | | | | |
| | BLACKROCK GLOBAL ALLOCATION FUND, INC. | | OCTOBER 31, 2015 | | 17 |
| | |
Consolidated Schedule of Investments (continued) | | |
| | | | | | | | | | | | |
Non-Agency Mortgage-Backed
Securities | | Par (000) | | | Value | |
Commercial Mortgage-Backed Securities — 0.1% | |
Logistics UK 2015 PLC, 4.19%, 8/20/25 (c) | | | USD | | | | 30,423 | | | $ | 43,912,540 | |
| |
| U.S. Government Sponsored Agency Securities | | | | |
Mortgage-Backed Securities — 0.4% | |
Federal National Loan Mortgage Corp., 3.00%, 11/01/45 (m) | | | | | | | 189,051 | | | | 191,036,036 | |
| | | | | | | | | | | | |
| | | | | | | | | | | | | |
| | | |
| U.S. Treasury Obligations | | | | | | | | | |
Treasury Inflation Protected Security, 0.38%, 7/15/25 | | | | | | | 190,231 | | | | 185,544,617 | |
U.S. Treasury Inflation Indexed Bond: | | | | | | | | | | | | |
0.13%, 4/15/20 | | | | | | | 55,182 | | | | 54,765,264 | |
0.25%, 1/15/25 | | | | | | | 22,296 | | | | 21,422,447 | |
U.S. Treasury Notes: | | | | | | | | | | | | |
1.75%, 3/31/22 (f) | | | | | | | 216,250 | | | | 215,067,428 | |
1.88%, 8/31/22 (f) | | | | | | | 279,073 | | | | 278,986,129 | |
1.75%, 9/30/22 | | | | | | | 296,940 | | | | 294,295,452 | |
1.88%, 10/31/22 | | | | | | | 274,720 | | | | 274,419,456 | |
2.00%, 2/15/25 | | | | | | | 162,329 | | | | 160,449,583 | |
2.13%, 5/15/25 | | | | | | | 428,340 | | | | 427,436,731 | |
2.00%, 8/15/25 (f) | | | | | | | 1,417,288 | | | | 1,398,436,455 | |
| Total U.S. Treasury Obligations — 6.4% | | | | 3,310,823,562 | |
| Total Fixed Income Securities — 20.5% | | | | 10,602,694,070 | |
| | | | | | | | | | | | |
| | | | | | | | | | | | | |
| | | |
| Investment Companies (a)(n) | | | | | Shares | | | | |
United States — 1.0% | |
ETFS Gold Trust (d) | | | | | | | 1,201,717 | | | | 133,895,308 | |
ETFS Palladium Trust (d) | | | | | | | 390,434 | | | | 25,456,297 | |
ETFS Platinum Trust (d) | | | | | | | 329,619 | | | | 31,300,620 | |
iShares Gold Trust (o) | | | | | | | 11,663,809 | | | | 128,535,175 | |
SPDR Gold Shares | | | | | | | 1,642,959 | | | | 179,575,419 | |
| Total Investment Companies — 1.0% | | | | 498,762,819 | |
| | | | | | | | | | | | |
| | | | | | | | | | | | | |
| | |
| Preferred Securities | | Par (000) | | | | |
| | | |
| Capital Trusts | | | | | | | | | |
Germany — 0.0% | |
Deutsche Bank Capital Funding Trust VII, 5.63% (c)(i)(p) | | | | | | | 6,863 | | | | 6,735,005 | |
Netherlands — 0.0% | |
ING Groep NV, 6.00% (i)(p) | | | | | | | 22,155 | | | | 21,684,206 | |
Switzerland — 0.1% | |
Credit Suisse Group Guernsey I Ltd., 7.88%, 2/24/41 (i) | | | | | | | 27,444 | | | | 28,457,452 | |
United Kingdom — 0.5% | |
HSBC Holdings PLC, Series ., 6.38% (i)(p) | | | | | | | 87,920 | | | | 87,085,639 | |
Lloyds TSB Bank PLC, 13.00% (i)(p) | | | | | | | 51,874 | | | | 138,988,545 | |
Standard Chartered PLC, 6.50% (c)(i)(p) | | | | | | | 31,655 | | | | 31,238,547 | |
| | | | | | | | | | | | |
| | | | | | | | | | | | 257,312,731 | |
| | | | | | | | | | | | |
| Capital Trusts | | Par (000) | | | Value | |
United States — 1.0% | |
American Express Co., Series C, 4.90% (i)(p) | | | USD | | | | 28,840 | | | $ | 27,974,800 | |
Citigroup, Inc., 5.88% (i)(p) | | | | | | | 53,703 | | | | 53,153,081 | |
Citigroup, Inc., 5.95% (i)(p) | | | | | | | 18,328 | | | | 18,190,540 | |
General Electric Capital Corp., 6.38%, 11/15/67 (i) | | | | | | | 30,235 | | | | 32,290,980 | |
General Electric Capital Corp., Series B, 6.25% (i)(p) | | | | | | | 40,600 | | | | 45,252,760 | |
Goldman Sachs Group, Inc., Series L, 5.70% (i)(p) | | | | | | | 44,597 | | | | 45,210,209 | |
Goldman Sachs Group, Inc., Series M, 5.38% (i)(p) | | | | | | | 46,300 | | | | 45,837,000 | |
JPMorgan Chase & Co., Series Q, 5.15% (i)(p) | | | | | | | 51,341 | | | | 49,415,712 | |
JPMorgan Chase & Co., Series X, 6.10% (i)(p) | | | | | | | 102,277 | | | | 104,322,540 | |
Morgan Stanley, Series H, 5.45% (i)(p) | | | | | | | 32,669 | | | | 32,138,129 | |
NBCUniversal Enterprise, Inc., 5.25% (c)(p) | | | | | | | 24,311 | | | | 25,891,215 | |
USB Capital IX, 3.50% (i)(p) | | | | | | | 38,356 | | | | 30,483,853 | |
| | | | | | | | | | | | |
| | | | | | | | | | | | 510,160,819 | |
| Total Capital Trusts — 1.6% | | | | 824,350,213 | |
| | | |
| Preferred Stocks | | | | | Shares | | | | |
Brazil — 0.0% | |
Cia Brasileira de Distribuicao Grupo Pao de Acucar, Preference Shares, 0.00% | | | | | | | 741,479 | | | | 9,755,518 | |
Germany — 0.1% | |
Henkel AG & Co. KGaA, Preference Shares, 0.00% | | | | | | | 338,260 | | | | 36,685,458 | |
Volkswagen AG, 0.00% | | | | | | | 125,723 | | | | 15,091,166 | |
| | | | | | | | | | | | |
| | | | | | | | | | | | 51,776,624 | |
Ireland — 0.3% | | | | | | | | | | | | |
Allergan PLC, Series A, 5.50% | | | | | | | 145,192 | | | | 151,962,303 | |
South Korea — 0.1% | |
Samsung Electronics Co. Ltd., Preference Shares, 0.00% | | | | | | | 41,287 | | | | 43,123,429 | |
United Kingdom — 0.1% | | | | | | | | | | | | |
HSBC Holdings PLC, Series 2, 8.00% | | | | | | | 1,091,036 | | | | 28,366,936 | |
Royal Bank of Scotland Group PLC, Series T, 7.25% | | | | | | | 1,016,710 | | | | 25,905,771 | |
| | | | | | | | | | | | |
| | | | | | | | | | | | 54,272,707 | |
United States — 1.7% | | | | | | | | | | | | |
American Tower Corp., Series A, 5.25% (h) | | | | | | | 233,294 | | | | 24,822,482 | |
Anthem, Inc., 5.25% | | | | | | | 1,277,956 | | | | 59,476,072 | |
Cliffs Natural Resources, Inc., 7.00% (h) | | | | | | | 859,231 | | | | 2,079,339 | |
Crown Castle International Corp., Series A, 4.50% (h) | | | | | | | 596,072 | | | | 63,344,572 | |
Dominion Resources, Inc., 6.38% | | | | | | | 487,180 | | | | 24,178,744 | |
Domo, Inc., Series E, (Acquired 4/1/15, cost 81,820,921), 0.00% (a)(e) | | | | | | | 9,704,080 | | | | 82,877,695 | |
See Notes to Consolidated Financial Statements.
| | | | | | |
| | | | | | | |
| 18 | | BLACKROCK GLOBAL ALLOCATION FUND, INC. | | OCTOBER 31, 2015 | | |
| | |
Consolidated Schedule of Investments (continued) | | |
| | | | | | | | | | |
| | | |
| Preferred Stocks | | | | Shares | | | Value | |
United States (continued) | |
DropBox, Inc., Series C (Acquired 1/28/14, cost $150,070,985), 0.00% (a)(e) | | | | | 7,856,626 | | | $ | 97,265,030 | |
Fannie Mae, Series S, 8.25% (i) | | | | | 882,280 | | | | 4,169,655 | |
Forestar Group, Inc., 6.00% (h) | | | | | 1,016,445 | | | | 19,546,237 | |
Grand Rounds, Inc., Series C, (Acquired 3/31/15, cost 27,587,148), 0.00% (a)(e) | | | | | 9,935,944 | | | | 28,400,902 | |
Lookout, Inc., Series F (Acquired 9/19/14, cost $53,322,391), 0.00% (a)(e) | | | | | 4,667,944 | | | | 54,719,507 | |
Palantir Technologies, Inc., Series I (Acquired 3/27/14, cost $58,747,474), 0.00% (a)(e) | | | | | 9,583,601 | | | | 109,061,379 | |
Stanley Black & Decker, Inc., 6.25% (a)(h) | | | | | 132,832 | | | | 15,947,810 | |
Uber Technologies, Inc., Series D (Acquired 6/06/14, cost $90,664,966), 0.00% (a)(e) | | | | | 5,844,432 | | | | 247,016,087 | |
US Bancorp, 6.00% (i) | | | | | 579,854 | | | | 15,540,087 | |
US Bancorp, Series F, 6.50% (i) | | | | | 990,051 | | | | 28,691,678 | |
Wells Fargo & Co., Series L, 7.50% | | | | | 18,146 | | | | 21,503,010 | |
| | | | | | | | | | |
| | | | | 898,640,286 | |
| Total Preferred Stocks — 2.3% | | | | 1,209,530,867 | |
| | | | | | | | | | |
| | | | | | | | | | | |
| | | |
| Trust Preferreds | | | | | | | | |
United States — 0.5% | |
Citigroup Capital XIII, 10/30/40, 7.88% | | | | | 1,774,690 | | | | 44,203,646 | |
GMAC Capital Trust I, Series 2, 2/15/40, 8.13% | | | | | 2,390,820 | | | | 60,729,650 | |
RBS Capital Funding Trust V, 5.90% | | | | | 1,482,140 | | | | 36,534,751 | |
RBS Capital Funding Trust VII, 6.08% | | | | | 1,869,661 | | | | 46,317,735 | |
Welltower, Inc., Series I, 6.50% | | | | | 866,970 | | | | 51,246,597 | |
| Total Trust Preferreds — 0.5% | | | | | | | | | 239,032,379 | |
| Total Preferred Securities — 4.4% | | | | | | | | | 2,272,913,459 | |
| | | | | | | | | | |
| | | | | | | | | | | |
| | | |
| Warrants — 0.0% | | | | | | | | |
Australia — 0.0% | | | | | | | | | | |
TFS Corp. Ltd., (Issued/exercisable 8/01/11, 1 share for 1 warrant, Expires 7/15/18, Strike Price AUD 1.28) | | | | | 21,267,513 | | | | 9,467,595 | |
| | | | | | | | | | |
| | | | | | | | | | | |
| | | |
| Rights — 0.0% | | | | | | | | |
Spain — 0.0% | |
Banco Santander SA | | | | | 9,665,971 | | | | 531,459 | |
Total Long-Term Investments
(Cost — $37,757,547,701) — 79.4% | | | | 41,043,010,465 | |
| | | | | | | | | | |
| | | | | | | | | | | |
| | | | | | | | | | | | |
| Short-Term Securities | | | | | Par
(000) | | | Value | |
| Foreign Agency Obligations (q) | | | | |
Japan Treasury Discount Bill: | | | | | | | | | | | | |
(0.02%), 11/10/15 | | | JPY | | | | 16,450,000 | | | $ | 136,320,020 | |
(0.00%), 11/16/15 | | | | | | | 27,090,000 | | | | 224,492,071 | |
(0.01%), 11/24/15 | | | | | | | 32,540,000 | | | | 269,657,823 | |
(0.00%), 11/30/15 | | | | | | | 27,130,000 | | | | 224,828,268 | |
(0.02%), 12/10/15 | | | | | | | 21,680,000 | | | | 179,663,904 | |
(0.02%), 12/21/15 | | | | | | | 27,060,000 | | | | 224,248,846 | |
1.00%, 1/13/16 | | | | | | | 21,730,000 | | | | 180,079,339 | |
(0.01%), 1/25/16 | | | | | | | 21,520,000 | | | | 178,339,577 | |
(0.05%), 2/10/16 | | | | | | | 27,080,000 | | | | 224,416,608 | |
Mexico Cetes: | | | | | | | | | | | | |
3.21%, 11/12/15 | | | MXN | | | | 204,319 | | | | 123,561,257 | |
3.42%, 11/12/15 | | | | | | | 54,710 | | | | 33,085,741 | |
3.24%, 11/26/15 | | | | | | | 54,650 | | | | 33,010,524 | |
3.46%, 12/10/15 | | | | | | | 65,050 | | | | 39,246,678 | |
3.48%, 12/24/15 | | | | | | | 81,302 | | | | 48,994,637 | |
3.48%, 1/07/16 | | | | | | | 54,209 | | | | 32,625,562 | |
3.50%, 1/07/16 | | | | | | | 79,302 | | | | 47,727,446 | |
3.53%, 2/18/16 | | | | | | | 81,811 | | | | 49,042,822 | |
3.19%, 3/31/16 | | | | | | | 134,970 | | | | 80,570,336 | |
| Total Foreign Agency Obligations — 4.5% | | | | 2,329,911,459 | |
| | | | | | | | | | | | |
| | | | | | | | | | | | | |
| | | |
| Money Market Funds | | | | | Shares/
Beneficial
Interest | | | | |
BlackRock Liquidity Funds, TempFund, Institutional Class, 0.10% (o)(r) | | | | | | | 1,040,534 | | | | 1,040,534 | |
BlackRock Liquidity Series, LLC, Money Market Series, 0.25% (o)(r)(s) | | | USD | | | | 497,499,535 | | | | 497,499,535 | |
| Total Money Market Funds — 1.0% | | | | | | | | | | | 498,540,069 | |
| | | | | | | | | | | | |
| | | | | | | | | | | | | |
| | | |
| U.S. Treasury Obligations (q) | | | | | Par
(000) | | | | |
U.S. Treasury Bills: | | | | | | | | | | | | |
0.00% - 0.15%, 12/24/15 | | | | | | | 1,522,955 | | | | 1,522,862,100 | |
0.13%, 12/31/15 | | | | | | | 85,000 | | | | 84,992,690 | |
0.00% - 0.09%, 1/07/16 | | | | | | | 594,000 | | | | 593,925,156 | |
0.04% - 0.14%, 1/14/16 | | | | | | | 213,000 | | | | 212,962,725 | |
0.01% - 0.16%, 1/21/16 | | | | | | | 358,000 | | | | 357,944,152 | |
0.05% - 0.13%, 1/28/16 | | | | | | | 440,000 | | | | 439,913,760 | |
0.02% - 0.23%, 2/04/16 | | | | | | | 531,000 | | | | 530,847,072 | |
0.01% - 0.25%, 2/11/16 | | | | | | | 681,500 | | | | 681,342,573 | |
0.01% - 0.25%, 2/18/16 | | | | | | | 893,000 | | | | 892,812,470 | |
0.13% - 0.20%, 2/25/16 | | | | | | | 320,000 | | | | 319,918,080 | |
0.01% - 0.19%, 3/03/16 | | | | | | | 570,500 | | | | 570,296,902 | |
0.01% - 0.19%, 3/10/16 | | | | | | | 279,000 | | | | 278,901,234 | |
0.04% - 0.10%, 3/17/16 | | | | | | | 506,000 | | | | 505,784,950 | |
0.02% - 0.10%, 3/24/16 | | | | | | | 1,348,875 | | | | 1,348,145,258 | |
0.10%, 3/31/16 | | | | | | | 91,000 | | | | 90,932,205 | |
0.07%, 4/14/16 | | | | | | | 192,861 | | | | 192,695,140 | |
U.S. Treasury Notes, 0.38%, 3/15/16 (n) | | | | 185,536 | | | | 185,651,960 | |
| Total U.S. Treasury Obligations — 17.0% | | | | | | | | 8,809,928,427 | |
Total Short-Term Securities
(Cost — $11,631,424,545) — 22.5% | | | | 11,638,379,955 | |
See Notes to Consolidated Financial Statements.
| | | | | | |
| | | | | | | |
| | BLACKROCK GLOBAL ALLOCATION FUND, INC. | | OCTOBER 31, 2015 | | 19 |
| | |
Consolidated Schedule of Investments (continued) | | |
| | | | | | | | | | |
| | | |
| | | | | Shares | | | Value | |
Options Purchased
(Cost — $464,156,280) — 0.7% | | | $ | 389,626,709 | |
Total Investments Before Investments Sold Short and Options Written
(Cost — $49,853,128,526) — 102.6% | | | | 53,071,017,129 | |
| | | | | | | | | | |
| | | | | | | | | | | |
| |
| Investments Sold Short | | | | |
Aeon Co. Ltd. | | | | | (1,681,300 | ) | | | (24,910,560 | ) |
ConocoPhillips | | | | | (858,753 | ) | | | (45,814,473 | ) |
Franklin Resources, Inc. | | | | | (535,599 | ) | | | (21,831,015 | ) |
Gentex Corp. | | | | | (1,292,949 | ) | | | (21,191,434 | ) |
T Rowe Price Group, Inc. | | | | | (290,368 | ) | | | (21,957,628 | ) |
Waddell & Reed Financial, Inc. | | | | | (549,105 | ) | | | (20,283,939 | ) |
Total Investments Sold Short
(Proceeds — $147,743,718) — (0.3)% | | | | (155,989,049 | ) |
| | | | | | | | |
Options Written
(Premiums Received — $199,482,757) — (0.3)% | | $ | (173,011,677 | ) |
Total Investments, Net of Investments Sold Short and Options Written
(Cost — $49,505,902,051) — 102.0% | | | 52,742,016,403 | |
| Liabilities in Excess of Other Assets — (2.0)% | | | (1,051,907,926 | ) |
| | | | | | | | |
| Net Assets — 100.0% | | $ | 51,690,108,477 | |
| | | | | | | | |
|
| Notes to Consolidated Schedule of Investments |
| (a) | | Non-income producing security. |
| (b) | | Security, or a portion of security, is on loan. |
| (c) | | Security exempt from registration pursuant to Rule 144A under the Securities Act of 1933, as amended. These securities may be resold in transactions exempt from registration to qualified institutional investors. |
| (d) | | During the year ended October 31, 2015, investments in issuers (whereby the Fund held 5% or more of the companies’ outstanding securities) that were considered to be an affiliate, for purposes of Section 2(a)(3) of the Investment Company Act of 1940, as amended, were as follows: |
| | | | | | | | | | | | | | | | | | | | | | | | | | | | |
| Affiliate | | Shares Held at October 31, 2014 | | | Shares
Purchased | | | Shares
Sold | | | Shares Held at October 31, 2015 | | | Value at
October 31,
2015 | | | Income | | | Realized
Gain (Loss) | |
ETFS Gold Trust | | | 1,201,717 | | | | — | | | | — | | | | 1,201,717 | | | $ | 133,895,308 | | | | — | | | | — | |
ETFS Palladium Trust | | | 419,461 | | | | — | | | | (29,027 | ) | | | 390,434 | | | $ | 25,456,297 | | | | — | | | $ | 829,440 | |
ETFS Platinum Trust | | | 354,124 | | | | — | | | | (24,505 | ) | | | 329,619 | | | $ | 31,300,620 | | | | — | | | $ | (1,009,809 | ) |
HTG Molecular Diagnostics, Inc. | | | — | | | | 379,400 | | | | — | | | | 379,400 | | | $ | 1,999,438 | | | | — | | | | — | |
Invitae Corp. | | | — | | | | 2,094,662 | | | | — | | | | 2,094,662 | | | $ | 15,961,324 | | | | — | | | $ | (1,349,295 | ) |
SBM Offshore NV | | | 8,153,279 | | | | 4,135,315 | | | | (646,310 | ) | | | 11,642,284 | | | $ | 159,060,116 | | | | — | | | $ | (2,374,432 | ) |
St. Joe Co. | | | 9,138,361 | | | | — | | | | (2,387,478 | ) | | | 6,750,883 | | | $ | 133,802,501 | | | | — | | | $ | (18,922,088 | ) |
| (e) | | Restricted security as to resale, excluding 144A securities. As of report date, the Fund held restricted securities with a current value of $956,240,837 and an original cost of $816,290,086 which was 1.85% of its net assets. |
| (f) | | All or a portion of security has been pledged as collateral in connection with outstanding financial futures contracts. |
| (g) | | All or a portion of security has been pledged and/or segregated as collateral in connection with outstanding exchange-traded options written. |
| (h) | | Convertible security. |
| (i) | | Variable rate security. Rate shown is as of period end. |
| (j) | | Issuer filed for bankruptcy and/or is in default of interest payments. |
| (l) | | Represents a step-up bond that pays an initial coupon rate for the first period and then a higher coupon rate for the following periods. Rate shown is as of period end. |
See Notes to Consolidated Financial Statements.
| | | | | | |
| | | | | | | |
| 20 | | BLACKROCK GLOBAL ALLOCATION FUND, INC. | | OCTOBER 31, 2015 | | |
| | |
Consolidated Schedule of Investments (continued) | | |
| (m) | | Represents or includes a TBA transaction. As of period end, unsettled TBA transactions were as follows: |
| | | | |
| Counterparty | | Value | | Unrealized
Depreciation |
| Bank of America N.A. | | $191,036,036 | | $(732,573) |
| (n) | | All or a portion of Security is held by a wholly owned subsidiary. See Note 1 of the Notes to Consolidated Financial Statements for details on the wholly owned subsidiary. |
| (o) | | During the year ended October 31, 2015, investments in issuers considered to be an affiliate of the Fund for purposes of Section 2(a)(3) of the Investment Company Act of 1940, as amended, were as follows: |
| | | | | | | | | | | | | | | | | | | | | | | | | | | | |
| Affiliate | | Shares/
Beneficial Interest Held at October 31,
2014 | | | Shares/
Beneficial
Interest
Purchased | | | Shares/
Beneficial
Interest
Sold | | | Shares/ Beneficial Interest Held at
October 31, 2015 | | | Value at October 31, 2015 | | | Income | | | Realized
Gain (Loss) | |
BlackRock Liquidity Funds, TempFund, Institutional Class | | | 21,549,953 | | | | — | | | | (20,509,419 | )1 | | | 1,040,534 | | | $ | 1,040,534 | | | $ | 15,609 | | | | — | |
BlackRock Liquidity Series, LLC, Money Market Series | | $ | 436,475,361 | | | | 61,024,174 | 2 | | | — | | | $ | 497,499,535 | | | $ | 497,499,535 | | | $ | 7,628,864 | | | | — | |
iShares Gold Trust | | | 11,663,809 | | | | — | | | | — | | | | 11,663,809 | | | $ | 128,535,175 | | | | — | | | | — | |
1 Represents net shares sold. | | | | | | | | | | | | | |
2 Represents net beneficial interest purchased. | | | | | | | | | | | | | |
| (p) | | Security is perpetual in nature and has no stated maturity date. |
| (q) | | Rates shown are discount rates or a range of discount rates at the time of purchase. |
| (r) | | Represents the current yield as of period end. |
| (s) | | Security was purchased with the cash collateral from loaned securities. The Fund may withdraw up to 25% of its investment daily, although the manager of the BlackRock Liquidity Series, LLC, Money Market Series, in its sole discretion, may permit an investor to withdraw more than 25% on any one day. |
|
| Derivative Financial Instruments Outstanding as of Period End |
Financial Futures Contracts
| | | | | | | | | | | | | | | | |
Contracts
Short | | | Issue | | Expiration | | Notional
Value | | | Unrealized
Depreciation | | | |
| | (1,669 | ) | | Euro Stoxx 50 Index | | December 2015 | | $ | 62,455,816 | | | $ | (3,481,720 | ) | | |
| | (521 | ) | | FTSE 100 Index | | December 2015 | | $ | 50,760,548 | | | | (1,604,507 | ) | | |
| | (10,550 | ) | | Mini MSCI Emerging Markets Index | | December 2015 | | $ | 445,051,750 | | | | (11,455,735 | ) | | |
| | (788 | ) | | NASDAQ 100 E-Mini Index | | December 2015 | | $ | 73,177,620 | | | | (5,469,818 | ) | | |
| | (3,466 | ) | | Russell 2000 Mini Index | | December 2015 | | $ | 401,466,780 | | | | (4,317,714 | ) | | |
| | (7,659 | ) | | S&P 500 E-Mini Index | | December 2015 | | $ | 794,123,415 | | | | (34,087,039 | ) | | |
| | (219 | ) | | Topix Index | | December 2015 | | $ | 28,284,702 | | | | (1,146,628 | ) | | |
| | (2,699 | ) | | Yen Denom Nikkei Index | | December 2015 | | $ | 211,142,455 | | | | (1,561,167 | ) | | |
| | Total | | | | | | | | | | | $ | (63,124,328 | ) | | |
| | | | | | | | | | | | | |
Forward Foreign Currency Exchange Contracts
| | | | | | | | | | | | | | | | | | | | | | |
Currency Purchased | | | Currency Sold | | | Counterparty | | Settlement
Date | | | Unrealized
Appreciation
(Depreciation) | | | |
| USD | | | 112,098,008 | | | JPY | | | 13,443,802,000 | | | Morgan Stanley Capital Services LLC | | | 11/05/15 | | | $ | 687,537 | | | |
| USD | | | 91,202,323 | | | MXN | | | 1,545,396,000 | | | Credit Suisse International | | | 11/05/15 | | | | (2,350,455 | ) | | |
| USD | | | 90,800,097 | | | JPY | | | 10,912,401,000 | | | HSBC Bank USA N.A. | | | 11/06/15 | | | | 366,993 | | | |
| USD | | | 51,419,116 | | | SGD | | | 73,490,000 | | | Morgan Stanley Capital Services LLC | | | 11/06/15 | | | | (1,033,278 | ) | | |
| USD | | | 137,399,352 | | | JPY | | | 16,450,000,000 | | | BNP Paribas S.A. | | | 11/10/15 | | | | 1,071,092 | | | |
| USD | | | 132,493,821 | | | MXN | | | 2,043,187,210 | | | Deutsche Bank AG | | | 11/12/15 | | | | 8,868,088 | | | |
| USD | | | 32,285,286 | | | MXN | | | 547,100,000 | | | JPMorgan Chase Bank N.A. | | | 11/12/15 | | | | (817,720 | ) | | |
| USD | | | 45,758,954 | | | BRL | | | 187,177,000 | | | BNP Paribas S.A. | | | 11/13/15 | | | | (2,646,340 | ) | | |
| USD | | | 117,514,456 | | | JPY | | | 14,073,355,000 | | | BNP Paribas S.A. | | | 11/13/15 | | | | 879,675 | | | |
| USD | | | 25,212,980 | | | TWD | | | 841,105,000 | | | Credit Suisse International | | | 11/13/15 | | | | (690,045 | ) | | |
See Notes to Consolidated Financial Statements.
| | | | | | |
| | | | | | | |
| | BLACKROCK GLOBAL ALLOCATION FUND, INC. | | OCTOBER 31, 2015 | | 21 |
| | |
Consolidated Schedule of Investments (continued) | | |
Forward Foreign Currency Exchange Contracts (continued)
| | | | | | | | | | | | | | | | | | | | | | |
Currency Purchased | | | Currency Sold | | | Counterparty | | Settlement
Date | | | Unrealized
Appreciation
(Depreciation) | | | |
| USD | | | 87,623,172 | | | BRL | | | 340,933,000 | | | Goldman Sachs International | | | 11/16/15 | | | $ | (447,453 | ) | | |
| USD | | | 218,115,942 | | | JPY | | | 27,090,000,000 | | | HSBC Bank USA N.A. | | | 11/16/15 | | | | (6,402,227 | ) | | |
| USD | | | 51,571,000 | | | IDR | | | 744,066,388,000 | | | Credit Suisse International | | | 11/18/15 | | | | (2,507,864 | ) | | |
| USD | | | 178,041,545 | | | JPY | | | 21,341,840,000 | | | JPMorgan Chase Bank N.A. | | | 11/19/15 | | | | 1,158,422 | | | |
| USD | | | 45,600,494 | | | MXN | | | 775,140,000 | | | Deutsche Bank AG | | | 11/19/15 | | | | (1,275,013 | ) | | |
| USD | | | 104,053,977 | | | SGD | | | 146,893,000 | | | HSBC Bank USA N.A. | | | 11/19/15 | | | | (741,204 | ) | | |
| USD | | | 116,407,788 | | | JPY | | | 13,945,653,000 | | | Credit Suisse International | | | 11/20/15 | | | | 823,871 | | | |
| USD | | | 45,554,863 | | | MXN | | | 774,296,000 | | | BNP Paribas S.A. | | | 11/20/15 | | | | (1,265,989 | ) | | |
| USD | | | 50,000,000 | | | SGD | | | 71,890,000 | | | Deutsche Bank AG | | | 11/20/15 | | | | (1,285,559 | ) | | |
| USD | | | 271,646,576 | | | JPY | | | 32,540,000,000 | | | BNP Paribas S.A. | | | 11/24/15 | | | | 1,939,606 | | | |
| USD | | | 50,891,384 | | | CNH | | | 334,334,000 | | | JPMorgan Chase Bank N.A. | | | 11/27/15 | | | | (1,847,875 | ) | | |
| USD | | | 75,208,233 | | | CNH | | | 494,085,000 | | | JPMorgan Chase Bank N.A. | | | 11/27/15 | | | | (2,730,825 | ) | | |
| USD | | | 34,386,408 | | | MXN | | | 546,496,310 | | | Credit Suisse International | | | 11/27/15 | | | | 1,358,217 | | | |
| USD | | | 225,257,764 | | | JPY | | | 27,130,000,000 | | | HSBC Bank USA N.A. | | | 11/30/15 | | | | 378,963 | | | |
| EUR | | | 85,080,000 | | | USD | | | 96,890,380 | | | Deutsche Bank AG | | | 12/03/15 | | | | (3,297,249 | ) | | |
| USD | | | 94,107,839 | | | EUR | | | 85,080,000 | | | Deutsche Bank AG | | | 12/03/15 | | | | 514,708 | | | |
| USD | | | 124,708,781 | | | JPY | | | 14,940,112,000 | | | Citibank N.A. | | | 12/03/15 | | | | 867,731 | | | |
| USD | | | 51,624,000 | | | MXN | | | 857,970,230 | | | Citibank N.A. | | | 12/03/15 | | | | (204,504 | ) | | |
| USD | | | 52,198,000 | | | MYR | | | 219,377,754 | | | Credit Suisse International | | | 12/03/15 | | | | 1,233,253 | | | |
| EUR | | | 143,022,000 | | | USD | | | 163,301,804 | | | Credit Suisse International | | | 12/04/15 | | | | (5,965,227 | ) | | |
| EUR | | | 234,550,000 | | | USD | | | 256,813,017 | | | Goldman Sachs International | | | 12/04/15 | | | | 1,212,281 | | | |
| EUR | | | 98,569,000 | | | USD | | | 112,772,201 | | | JPMorgan Chase Bank N.A. | | | 12/04/15 | | | | (4,337,771 | ) | | |
| USD | | | 109,030,128 | | | EUR | | | 98,569,000 | | | Deutsche Bank AG | | | 12/04/15 | | | | 595,698 | | | |
| USD | | | 176,973,813 | | | JPY | | | 21,680,000,000 | | | Credit Suisse International | | | 12/10/15 | | | | (2,772,283 | ) | | |
| USD | | | 37,889,157 | | | MXN | | | 650,500,000 | | | HSBC Bank USA N.A. | | | 12/10/15 | | | | (1,387,508 | ) | | |
| USD | | | 51,010,000 | | | CLP | | | 35,559,071,000 | | | Goldman Sachs International | | | 12/11/15 | | | | (223,979 | ) | | |
| USD | | | 122,400,650 | | | KRW | | | 146,795,099,000 | | | Morgan Stanley Capital Services LLC | | | 12/11/15 | | | | (6,026,199 | ) | | |
| USD | | | 50,409,000 | | | BRL | | | 198,571,133 | | | Citibank N.A. | | | 12/14/15 | | | | (404,460 | ) | | |
| USD | | | 49,516,960 | | | BRL | | | 189,338,000 | | | Deutsche Bank AG | | | 12/14/15 | | | | 1,066,217 | | | |
| USD | | | 104,421,711 | | | BRL | | | 408,811,000 | | | Morgan Stanley Capital Services LLC | | | 12/15/15 | | | | (161,358 | ) | | |
| USD | | | 30,780,774 | | | AUD | | | 42,883,000 | | | Morgan Stanley Capital Services LLC | | | 12/17/15 | | | | 268,977 | | | |
| USD | | | 97,160,316 | | | JPY | | | 11,683,528,000 | | | Deutsche Bank AG | | | 12/17/15 | | | | 271,456 | | | |
| INR | | | 5,595,866,261 | | | USD | | | 85,485,277 | | | Credit Suisse International | | | 12/18/15 | | | | (522,217 | ) | | |
| USD | | | 49,631,593 | | | IDR | | | 684,915,987,000 | | | Credit Suisse International | | | 12/18/15 | | | | 444,422 | | | |
| USD | | | 83,605,245 | | | INR | | | 5,595,866,261 | | | Credit Suisse International | | | 12/18/15 | | | | (1,357,815 | ) | | |
| USD | | | 224,266,534 | | | JPY | | | 27,060,000,000 | | | Deutsche Bank AG | | | 12/21/15 | | | | (165,366 | ) | | |
| USD | | | 47,787,889 | | | MXN | | | 813,015,350 | | | Credit Suisse International | | | 12/24/15 | | | | (1,255,051 | ) | | |
| USD | | | 31,499,463 | | | MXN | | | 542,090,000 | | | HSBC Bank USA N.A. | | | 1/07/16 | | | | (1,169,515 | ) | | |
| USD | | | 46,589,040 | | | MXN | | | 793,015,340 | | | Morgan Stanley Capital Services LLC | | | 1/07/16 | | | | (1,201,919 | ) | | |
| EUR | | | 74,185,000 | | | USD | | | 81,176,936 | | | Deutsche Bank AG | | | 1/11/16 | | | | 505,637 | | | |
| EUR | | | 160,187,000 | | | USD | | | 175,577,767 | | | Goldman Sachs International | | | 1/11/16 | | | | 798,676 | | | |
| USD | | | 177,022,814 | | | EUR | | | 160,187,000 | | | Goldman Sachs International | | | 1/11/16 | | | | 646,371 | | | |
| USD | | | 177,733,065 | | | JPY | | | 21,730,000,000 | | | Morgan Stanley Capital Services LLC | | | 1/13/16 | | | | (2,601,058 | ) | | |
| USD | | | 181,534,438 | | | JPY | | | 21,520,000,000 | | | Goldman Sachs International | | | 1/25/16 | | | | 2,909,076 | | | |
| USD | | | 101,305,812 | | | KRW | | | 115,822,935,000 | | | Credit Suisse International | | | 1/25/16 | | | | 116,828 | | | |
| USD | | | 123,433,546 | | | KRW | | | 140,788,302,000 | | | Deutsche Bank AG | | | 1/25/16 | | | | 433,509 | | | |
| USD | | | 218,829,167 | | | JPY | | | 27,080,000,000 | | | Deutsche Bank AG | | | 2/10/16 | | | | (6,015,854 | ) | | |
| USD | | | 47,816,400 | | | MXN | | | 818,105,130 | | | BNP Paribas S.A. | | | 2/18/16 | | | | (1,335,634 | ) | | |
| USD | | | 80,699,552 | | | MXN | | | 1,349,700,000 | | | Goldman Sachs International | | | 3/31/16 | | | | (126,761 | ) | | |
| Total | | | | | | | | | | | | | | | | | | $ | (37,156,271 | ) | | |
| | | | | | | | | | | | | | | | | | | |
See Notes to Consolidated Financial Statements.
| | | | | | |
| | | | | | | |
| 22 | | BLACKROCK GLOBAL ALLOCATION FUND, INC. | | OCTOBER 31, 2015 | | |
| | |
Consolidated Schedule of Investments (continued) | | |
Exchange-Traded Options Purchased
| | | | | | | | | | | | | | | | | | | | | | |
| Description | | Put/
Call | | Expiration
Date | | | Strike Price | | | Contracts | | | Value | | | |
Alphabet, Inc. | | Call | | | 12/18/15 | | | USD | | | 700.00 | | | | 159 | | | $ | 743,325 | | | |
Salesforce.com, Inc. | | Call | | | 12/18/15 | | | USD | | | 70.00 | | | | 427 | | | | 413,123 | | | |
Salesforce.com, Inc. | | Call | | | 12/18/15 | | | USD | | | 72.50 | | | | 636 | | | | 500,850 | | | |
SPDR Gold Trust1 | | Call | | | 12/31/15 | | | USD | | | 110.00 | | | | 28,201 | | | | 6,246,521 | | | |
Amazon.com Inc. | | Call | | | 1/15/16 | | | USD | | | 580.00 | | | | 267 | | | | 1,591,320 | | | |
SPDR Gold Trust1 | | Call | | | 1/15/16 | | | USD | | | 111.00 | | | | 20,134 | | | | 4,298,609 | | | |
SPDR Gold Trust1 | | Call | | | 3/18/16 | | | USD | | | 113.00 | | | | 14,888 | | | | 3,908,100 | | | |
SPDR Gold Trust1 | | Call | | | 3/18/16 | | | USD | | | 114.00 | | | | 25,672 | | | | 5,891,724 | | | |
Total | | | | | | | | | | | | | | | | | | $ | 23,593,572 | | | |
| | | | | | | | | | | | | | | | | | | |
1 All or a portion of security is held by a wholly owned subsidiary. See Note 1 of the Notes to Financial Statements for details on the wholly-owned subsidiary. |
OTC Options Purchased
| | | | | | | | | | | | | | | | | | | | | | | | | | | | |
| Description | | Put/ Call | | Counterparty | | Expiration
Date | | | Strike
Price | | | Notional
Amount
(000) | | | Contracts | | | Value | |
USD Currency | | Call | | Deutsche Bank AG | | | 11/03/15 | | | JPY | | | 125.00 | | | USD | | | 53,622 | | | | — | | | | — | |
USD Currency | | Call | | Credit Suisse International | | | 11/03/15 | | | JPY | | | 125.00 | | | USD | | | 53,622 | | | | — | | | | — | |
USD Currency | | Call | | Credit Suisse International | | | 11/03/15 | | | JPY | | | 125.00 | | | USD | | | 53,622 | | | | — | | | | — | |
USD Currency | | Call | | Deutsche Bank AG | | | 11/03/15 | | | JPY | | | 125.00 | | | USD | | | 53,348 | | | | — | | | | — | |
USD Currency | | Call | | Deutsche Bank AG | | | 11/03/15 | | | JPY | | | 125.00 | | | USD | | | 53,622 | | | | — | | | | — | |
USD Currency | | Call | | Credit Suisse International | | | 11/19/15 | | | JPY | | | 125.00 | | | USD | | | 53,622 | | | | — | | | $ | 24,880 | |
USD Currency | | Call | | Credit Suisse International | | | 11/19/15 | | | JPY | | | 125.00 | | | USD | | | 53,622 | | | | — | | | | 24,880 | |
Freeport McMoran, Inc. | | Call | | Deutsche Bank AG | | | 11/20/15 | | | USD | | | 12.00 | | | | | | — | | | | 2,931,317 | | | | 1,714,820 | |
USD Currency | | Call | | Credit Suisse International | | | 11/25/15 | | | JPY | | | 123.00 | | | USD | | | 53,622 | | | | — | | | | 115,126 | |
USD Currency | | Call | | Credit Suisse International | | | 11/25/15 | | | JPY | | | 123.00 | | | USD | | | 53,622 | | | | — | | | | 115,126 | |
Morgan Stanley Japan Custom Index | | Call | | Morgan Stanley & Co. International PLC | | | 12/11/15 | | | JPY | | | 131.28 | | | | | | — | | | | 100,235,739 | | | | 16,029,578 | |
Morgan Stanley Japan Custom Index | | Call | | Morgan Stanley & Co. International PLC | | | 12/11/15 | | | JPY | | | 139.99 | | | | | | — | | | | 25,713,659 | | | | 4,478,038 | |
Topix Index | | Call | | Bank of America N.A. | | | 12/11/15 | | | JPY | | | 1,525.00 | | | | | | — | | | | 9,040,446 | | | | 4,563,895 | |
Topix Index | | Call | | Citibank N.A. | | | 12/11/15 | | | JPY | | | 1,550.00 | | | | | | — | | | | 19,311,652 | | | | 7,235,085 | |
Delta Air Lines, Inc. | | Call | | Morgan Stanley & Co. International PLC | | | 12/18/15 | | | USD | | | 47.50 | | | | | | — | | | | 138,488 | | | | 624,226 | |
United Continental Holdings, Inc. | | Call | | Morgan Stanley & Co. International PLC | | | 12/18/15 | | | USD | | | 61.50 | | | | | | — | | | | 63,919 | | | | 157,485 | |
Abbott Laboratories, Inc. | | Call | | Citibank N.A. | | | 1/15/16 | | | USD | | | 49.00 | | | | | | — | | | | 2,722,500 | | | | 846,943 | |
Activision Blizzard, Inc. | | Call | | Deutsche Bank AG | | | 1/15/16 | | | USD | | | 19.00 | | | | | | — | | | | 2,647,391 | | | | 41,564,039 | |
General Electric Co. | | Call | | Deutsche Bank AG | | | 1/15/16 | | | USD | | | 28.50 | | | | | | — | | | | 5,416,826 | | | | 6,524,567 | |
Gilead Sciences, Inc. | | Call | | Citibank N.A. | | | 1/15/16 | | | USD | | | 95.00 | | | | | | — | | | | 548,900 | | | | 7,876,715 | |
Goldman Sachs Group, Inc. | | Call | | Deutsche Bank AG | | | 1/15/16 | | | USD | | | 220.00 | | | | | | — | | | | 421,200 | | | | 128,466 | |
Ingersoll-Rand PLC | | Call | | Morgan Stanley & Co. International PLC | | | 1/15/16 | | | USD | | | 63.50 | | | | | | — | | | | 879,381 | | | | 639,864 | |
International Business Machines Corp. | | Call | | Deutsche Bank AG | | | 1/15/16 | | | USD | | | 182.00 | | | | | | — | | | | 557,357 | | | | 14,430 | |
International Business Machines Corp. | | Call | | Barclays Bank PLC | | | 1/15/16 | | | USD | | | 182.00 | | | | | | — | | | | 557,358 | | | | 14,430 | |
Merck & Co., Inc. | | Call | | Goldman Sachs International | | | 1/15/16 | | | USD | | | 59.00 | | | | | | — | | | | 5,455,879 | | | | 2,016,875 | |
Pfizer, Inc. | | Call | | Citibank N.A. | | | 1/15/16 | | | USD | | | 33.00 | | | | | | — | | | | 11,065,600 | | | | 21,411,936 | |
S&P 500 Index | | Call | | Morgan Stanley & Co. International PLC | | | 1/15/16 | | | USD | | | 2,100.00 | | | | | | — | | | | 63,663 | | | | 2,431,927 | |
Wells Fargo Co. | | Call | | Goldman Sachs International | | | 1/15/16 | | | USD | | | 60.00 | | | | | | — | | | | 1,404,000 | | | | 168,480 | |
S&P 500 Index | | Call | | Morgan Stanley & Co. International PLC | | | 2/19/16 | | | USD | | | 2,150.00 | | | | | | — | | | | 63,663 | | | | 1,632,956 | |
Baxter International | | Call | | Goldman Sachs International | | | 3/18/16 | | | USD | | | 72.75 | | | | | | — | | | | 1,083,364 | | | | 4,738,309 | |
S&P 500 Index | | Call | | Morgan Stanley & Co. International PLC | | | 3/18/16 | | | USD | | | 2,200.00 | | | | | | — | | | | 63,663 | | | | 1,044,073 | |
Topix Index | | Call | | Citibank N.A. | | | 4/08/16 | | | JPY | | | 1,625.00 | | | | | | — | | | | 20,592,708 | | | | 8,120,863 | |
Johnson & Johnson Co. | | Call | | Goldman Sachs International | | | 4/15/16 | | | USD | | | 103.00 | | | | | | — | | | | 5,410,539 | | | | 17,754,521 | |
Bank of New York Mellon Corp. | | Call | | Deutsche Bank AG | | | 5/20/16 | | | USD | | | 46.00 | | | | | | — | | | | 4,039,860 | | | | 3,478,683 | |
Goldman Sachs Group, Inc. | | Call | | Deutsche Bank AG | | | 5/20/16 | | | USD | | | 220.00 | | | | | | — | | | | 969,600 | | | | 1,666,180 | |
Gilead Sciences, Inc. | | Call | | Deutsche Bank AG | | | 5/20/16 | | | USD | | | 99.00 | | | | | | — | | | | 532,030 | | | | 7,545,973 | |
KeyCorp | | Call | | Deutsche Bank AG | | | 5/20/16 | | | USD | | | 15.75 | | | | | | — | | | | 5,386,481 | | | | 1,276,811 | |
Morgan Stanley & Co. LLC | | Call | | Deutsche Bank AG | | | 5/20/16 | | | USD | | | 40.75 | | | | | | — | | | | 4,039,859 | | | | 1,209,978 | |
Suntrust Banks, Inc. | | Call | | Deutsche Bank AG | | | 5/20/16 | | | USD | | | 45.50 | | | | | | — | | | | 4,039,800 | | | | 4,406,654 | |
Teva Pharmaceutical Industries Ltd. | | Call | | Deutsche Bank AG | | | 5/20/16 | | | USD | | | 63.50 | | | | | | — | | | | 1,079,500 | | | | 3,068,274 | |
Wells Fargo & Co. | | Call | | Deutsche Bank AG | | | 5/20/16 | | | USD | | | 59.00 | | | | | | — | | | | 4,039,860 | | | | 2,973,822 | |
Topix Index | | Call | | Morgan Stanley & Co. International PLC | | | 6/10/16 | | | JPY | | | 1,675.00 | | | | | | — | | | | 9,208,067 | | | | 3,198,974 | |
Topix Index | | Call | | Citibank N.A. | | | 6/10/16 | | | JPY | | | 1,675.00 | | | | | | — | | | | 17,327,007 | | | | 6,019,574 | |
See Notes to Consolidated Financial Statements.
| | | | | | |
| | | | | | | |
| | BLACKROCK GLOBAL ALLOCATION FUND, INC. | | OCTOBER 31, 2015 | | 23 |
| | |
Consolidated Schedule of Investments (continued) | | |
OTC Options Purchased (continued)
| | | | | | | | | | | | | | | | | | | | | | | | | | | | | | | | |
| Description | | Put/ Call | | | Counterparty | | Expiration
Date | | | Strike
Price | | | Notional
Amount
(000) | | | Contracts | | | Value | |
STOXX Europe 600 Index | | | Call | | | JPMorgan Chase Bank N.A. | | | 6/17/16 | | | | EUR | | | | 380.00 | | | | | | — | | | | 344,242 | | | $ | 5,213,286 | |
STOXX Europe 600 Index | | | Call | | | Credit Suisse International | | | 9/16/16 | | | | EUR | | | | 375.00 | | | | | | — | | | | 425,400 | | | | 9,525,078 | |
Taiwan Stock Exchange Weighted Index | | | Call | | | Citibank N.A. | | | 9/21/16 | | | | TWD | | | | 9,000.77 | | | | | | — | | | | 480,300 | | | | 3,336,033 | |
Euro STOXX 50 Index | | | Call | | | Morgan Stanley & Co. International PLC | | | 3/17/17 | | | | EUR | | | | 3,450.00 | | | | | | — | | | | 39,533 | | | | 10,410,380 | |
STOXX Europe 600 Index | | | Call | | | Credit Suisse International | | | 3/17/17 | | | | EUR | | | | 355.61 | | | | | | — | | | | 361,239 | | | | 14,179,472 | |
Euro STOXX 50 Index | | | Call | | | Citibank N.A. | | | 6/16/17 | | | | EUR | | | | 3,500.00 | | | | | | — | | | | 36,703 | | | | 9,236,685 | |
Euro STOXX 50 Index | | | Call | | | Bank of America N.A. | | | 9/15/17 | | | | EUR | | | | 3,600.00 | | | | | | — | | | | 39,432 | | | | 9,384,381 | |
STOXX Europe 600 Index | | | Call | | | JPMorgan Chase Bank N.A. | | | 9/15/17 | | | | EUR | | | | 372.06 | | | | | | — | | | | 234,650 | | | | 7,283,541 | |
Taiwan Stock Exchange Weighted Index | | | Call | | | Morgan Stanley & Co. International PLC | | | 9/20/17 | | | | TWD | | | | 9,000.00 | | | | | | — | | | | 424,064 | | | | 5,622,350 | |
Euro STOXX 50 Index | | | Call | | | Barclays Bank PLC | | | 12/15/17 | | | | EUR | | | | 3,500.00 | | | | | | — | | | | 40,448 | | | | 12,009,237 | |
Taiwan Stock Exchange Weighted Index | | | Call | | | Morgan Stanley & Co. International PLC | | | 12/20/17 | | | | TWD | | | | 9,000.00 | | | | | | — | | | | 432,159 | | | | 5,740,905 | |
Nikkei 225 Index | | | Call | | | Goldman Sachs International | | | 3/09/18 | | | | JPY | | | | 21,968.28 | | | | | | — | | | | 1,144,461 | | | | 10,761,060 | |
Euro STOXX 50 Index | | | Call | | | Goldman Sachs International | | | 3/16/18 | | | | EUR | | | | 3,500.00 | | | | | | — | | | | 33,589 | | | | 10,580,522 | |
Euro STOXX 50 Index | | | Call | | | UBS AG | | | 6/15/18 | | | | EUR | | | | 3,600.00 | | | | | | — | | | | 16,276 | | | | 4,597,335 | |
Euro STOXX 50 Index | | | Call | | | Deutsche Bank AG | | | 9/21/18 | | | | EUR | | | | 3,426.55 | | | | | | — | | | | 15,600 | | | | 5,885,846 | |
Russell 2000 Index | | | Put | | | Bank of America N.A. | | | 11/20/15 | | | | USD | | | | 1,130.00 | | | | | | — | | | | 233,220 | | | | 2,273,895 | |
S&P 500 Index | | | Put | | | Morgan Stanley & Co. International PLC | | | 11/20/15 | | | | USD | | | | 2,060.00 | | | | | | — | | | | 132,140 | | | | 2,276,772 | |
S&P 500 Index | | | Put | | | BNP Paribas SA | | | 12/18/15 | | | | USD | | | | 2,055.00 | | | | | | — | | | | 171,437 | | | | 5,467,126 | |
Ibovespa Brasil Sao Paulo Stock Exchange Index | | | Put | | | BNP Paribas SA | | | 2/17/16 | | | | BRL | | | | 46,600.00 | | | | | | — | | | | 2,773 | | | | 1,577,434 | |
Ibovespa Brasil Sao Paulo Stock Exchange Index | | | Put | | | Morgan Stanley & Co. International PLC | | | 2/17/16 | | | | BRL | | | | 47,000.00 | | | | | | — | | | | 3,198 | | | | 1,956,674 | |
Gentex Corp. | | | Put | | | Morgan Stanley & Co. International PLC | | | 3/18/16 | | | | USD | | | | 15.00 | | | | | | — | | | | 1,599,524 | | | | 799,762 | |
Gentex Corp. | | | Put | | | UBS AG | | | 3/18/16 | | | | USD | | | | 15.00 | | | | | | — | | | | 531,853 | | | | 265,926 | |
Ibovespa Brasil Sao Paulo Stock Exchange Index | | | Put | | | Bank of America N.A. | | | 8/17/16 | | | | BRL | | | | 49,122.00 | | | | | | — | | | | 2,895 | | | | 2,518,926 | |
Ibovespa Brasil Sao Paulo Stock Exchange Index | | | Put | | | Bank of America N.A. | | | 8/17/16 | | | | BRL | | | | 51,369.43 | | | | | | — | | | | 6,707 | | | | 7,431,268 | |
Ibovespa Brasil Sao Paulo Stock Exchange Index | | | Put | | | Goldman Sachs International | | | 8/17/16 | | | | BRL | | | | 51,370.00 | | | | | | — | | | | 2,254 | | | | 2,497,551 | |
Total | | | | | | | | | | | | | | | | | | | | | | | | | | | | | | $ | 337,688,901 | |
| | | | | | | | | | | | | | | | | | | | | | | | | | | | | | | | |
OTC Interest Rate Swaptions Purchased
| | | | | | | | | | | | | | | | | | | | | | | | | | | | | | | | | | |
| Description | | Counterparty | | Put/
Call | | | Exercise
Rate | | | Pay/Receive
Exercise Rate | | | Floating Rate Index | | | Expiration
Date | | | Notional
Amount
(000) | | | Value | |
5-Year Interest Rate Swap | | Goldman Sachs International | | | Call | | | | 1.45 | % | | | Receive | | | | 3-month USD LIBOR | | | | 11/24/15 | | | | USD | | | | 3,251,370 | | | $ | 6,360,362 | |
10-Year Interest Rate Swap | | Deutsche Bank AG | | | Call | | | | 0.90 | % | | | Receive | | | | 6-month EURIBOR | | | | 1/04/16 | | | | EUR | | | | 540,328 | | | | 5,044,311 | |
10-Year Interest Rate Swap | | Goldman Sachs International | | | Call | | | | 2.05 | % | | | Receive | | | | 3-month USD LIBOR | | | | 1/19/16 | | | | USD | | | | 1,619,400 | | | | 16,329,884 | |
10-Year Interest Rate Swap | | Goldman Sachs International | | | Put | | | | 1.35 | % | | | Pay | | | | 6-month JPY LIBOR | | | | 1/25/16 | | | | JPY | | | | 24,235,132 | | | | 20,947 | |
10-Year Interest Rate Swap | | Goldman Sachs International | | | Put | | | | 1.35 | % | | | Pay | | | | 6-month JPY LIBOR | | | | 1/25/16 | | | | JPY | | | | 12,066,812 | | | | 10,430 | |
10-Year Interest Rate Swap | | Deutsche Bank AG | | | Put | | | | 1.25 | % | | | Pay | | | | 6-month JPY LIBOR | | | | 7/29/16 | | | | JPY | | | | 14,080,590 | | | | 203,989 | |
5-Year Interest Rate Swap | | Deutsche Bank AG | | | Put | | | | 1.07 | % | | | Pay | | | | 6-month JPY LIBOR | | | | 4/04/18 | | | | JPY | | | | 12,739,074 | | | | 374,313 | |
Total | | | | | | | | | | | | | | | | | | | | | | | | | | | | | | | | $ | 28,344,236 | |
| | | | | | | | | | | | | | | | | | | | | | | | | | | | | | | | | | |
Exchange-Traded Options Written
| | | | | | | | | | | | | | | | | | | | | | | | |
| Description | | Put/
Call | | | Strike
Price | | | Expiration
Date | | | Contracts | | | Value | |
Alphabet, Inc. | | | Call | | | | USD | | | | 775.00 | | | | 12/18/15 | | | | 159 | | | $ | (112,095 | ) |
Philip Morris International, Inc. | | | Call | | | | USD | | | | 85.00 | | | | 12/18/15 | | | | 3,333 | | | | (1,608,173 | ) |
Philip Morris International, Inc. | | | Call | | | | USD | | | | 90.00 | | | | 12/18/15 | | | | 3,297 | | | | (407,179 | ) |
Salesforce.com, Inc. | | | Call | | | | USD | | | | 80.00 | | | | 12/18/15 | | | | 1,063 | | | | (387,995 | ) |
Amazon.com, Inc. | | | Call | | | | USD | | | | 660.00 | | | | 1/15/16 | | | | 267 | | | | (396,495 | ) |
Alphabet, Inc. | | | Put | | | | USD | | | | 635.00 | | | | 12/18/15 | | | | 132 | | | | (22,770 | ) |
Amazon.com, Inc. | | | Put | | | | USD | | | | 510.00 | | | | 1/15/16 | | | | 106 | | | | (33,655 | ) |
Total | | | | | | | | | | | | | | | | | | | | | | $ | (2,968,362 | ) |
| | | | | | | | | | | | | | | | | | | | | | | | |
See Notes to Consolidated Financial Statements.
| | | | | | |
| | | | | | | |
| 24 | | BLACKROCK GLOBAL ALLOCATION FUND, INC. | | OCTOBER 31, 2015 | | |
| | |
Consolidated Schedule of Investments (continued) | | |
OTC Barrier Put Options Written
| | | | | | | | | | | | | | | | | | | | | | | | | | | | |
| Description | | Type | | Counterparty | | Expiration
Date | | | Strike
Price | | | Barrier
Price/Range | | | Contracts | | | Value | |
Nikkei 225 Index | | Down-and-In | | Goldman Sachs International | | | 3/09/18 | | | JPY | | | 17,974.04 | | | JPY | | | 14,978.37 | | | | 1,144,461 | | | $ | (18,985,399 | ) |
Euro STOXX 50 Index | | Down-and-In | | Deutsche Bank AG | | | 9/21/18 | | | EUR | | | 2,586.07 | | | EUR | | | 2,165.83 | | | | 15,600 | | | | (3,017,893 | ) |
Total | | | | | | | | | | | | | | | | | | | | | | | | | | $ | (22,003,292 | ) |
| | | | | | | | | | | | | | | | | | | | | | | | | | | | |
OTC Options Written
| | | | | | | | | | | | | | | | | | | | | | | | |
| Description | | Put/
Call | | Counterparty | | Expiration
Date | | | Strike
Price | | | Contracts | | | Value | |
Freeport McMoran, Inc. | | Call | | Deutsche Bank AG | | | 11/20/15 | | | | USD | | | | 15.00 | | | | 2,931,317 | | | $ | (161,222 | ) |
Russell 2000 Index | | Call | | Bank of America N.A. | | | 11/20/15 | | | | USD | | | | 1,210.00 | | | | 116,609 | | | | (215,727 | ) |
S&P 500 Index | | Call | | Morgan Stanley & Co. International PLC | | | 11/20/15 | | | | USD | | | | 2,100.00 | | | | 132,140 | | | | (1,750,855 | ) |
Topix Index | | Call | | Citibank N.A. | | | 12/11/15 | | | | JPY | | | | 1,665.00 | | | | 19,311,652 | | | | (1,085,469 | ) |
Delta Air Lines, Inc. | | Call | | Morgan Stanley & Co. International PLC | | | 12/18/15 | | | | USD | | | | 54.00 | | | | 138,488 | | | | (127,039 | ) |
S&P 500 Index | | Call | | BNP Paribas SA | | | 12/18/15 | | | | USD | | | | 2,100.00 | | | | 171,437 | | | | (3,874,476 | ) |
United Continental Holdings, Inc. | | Call | | Morgan Stanley & Co. International PLC | | | 12/18/15 | | | | USD | | | | 70.00 | | | | 63,919 | | | | (26,526 | ) |
Abbott Laboratories | | Call | | Citibank N.A. | | | 1/15/16 | | | | USD | | | | 55.00 | | | | 2,722,500 | | | | (136,125 | ) |
Activision Blizzard Inc. | | Call | | Deutsche Bank AG | | | 1/15/16 | | | | USD | | | | 24.00 | | | | 2,647,391 | | | | (28,724,192 | ) |
Merck & Co., Inc. | | Call | | Goldman Sachs International | | | 1/15/16 | | | | USD | | | | 65.00 | | | | 5,455,879 | | | | (272,794 | ) |
Pfizer, Inc. | | Call | | Citibank N.A. | | | 1/15/16 | | | | USD | | | | 37.50 | | | | 11,065,600 | | | | (3,107,552 | ) |
United Continental Holdings, Inc. | | Call | | Citibank N.A. | | | 1/15/16 | | | | USD | | | | 60.00 | | | | 471,414 | | | | (1,838,515 | ) |
Ibovespa Brasil Sao Paulo Stock Exchange Index | | Call | | BNP Paribas SA | | | 2/17/16 | | | | BRL | | | | 51,000.00 | | | | 2,773 | | | | (780,294 | ) |
Ibovespa Brasil Sao Paulo Stock Exchange Index | | Call | | Morgan Stanley & Co. International PLC | | | 2/17/16 | | | | BRL | | | | 51,500.00 | | | | 3,198 | | | | (784,885 | ) |
Baxter International | | Call | | Goldman Sachs International | | | 3/18/16 | | | | USD | | | | 82.00 | | | | 1,083,364 | | | | (1,684,241 | ) |
Bank of New York Mellon Corp. | | Call | | Deutsche Bank AG | | | 5/20/16 | | | | USD | | | | 51.25 | | | | 4,039,860 | | | | (1,498,990 | ) |
Gilead Sciences, Inc. | | Call | | Deutsche Bank AG | | | 5/20/16 | | | | USD | | | | 107.50 | | | | 532,030 | | | | (4,958,892 | ) |
Goldman Sachs Group, Inc. | | Call | | Deutsche Bank AG | | | 5/20/16 | | | | USD | | | | 245.00 | | | | 969,600 | | | | (387,239 | ) |
KeyCorp | | Call | | Deutsche Bank AG | | | 5/20/16 | | | | USD | | | | 17.90 | | | | 5,386,481 | | | | (202,209 | ) |
Morgan Stanley & Co. LLC | | Call | | Deutsche Bank AG | | | 5/20/16 | | | | USD | | | | 46.00 | | | | 4,039,859 | | | | (250,471 | ) |
Suntrust Banks, Inc. | | Call | | Deutsche Bank AG | | | 5/20/16 | | | | USD | | | | 51.75 | | | | 4,039,800 | | | | (1,031,119 | ) |
Teva Pharmaceutical Industries Ltd. | | Call | | Deutsche Bank AG | | | 5/20/16 | | | | USD | | | | 73.00 | | | | 1,079,500 | | | | (742,653 | ) |
Wells Fargo & Co. | | Call | | Deutsche Bank AG | | | 5/20/16 | | | | USD | | | | 66.00 | | | | 4,039,860 | | | | (381,201 | ) |
Ibovespa Brasil Sao Paulo Stock Exchange Index | | Call | | Bank of America N.A. | | | 8/17/16 | | | | BRL | | | | 60,785.00 | | | | 2,895 | | | | (606,140 | ) |
Ibovespa Brasil Sao Paulo Stock Exchange Index | | Call | | Goldman Sachs International | | | 8/17/16 | | | | BRL | | | | 63,000.00 | | | | 2,254 | | | | (304,473 | ) |
Ibovespa Brasil Sao Paulo Stock Exchange Index | | Call | | Bank of America N.A. | | | 8/17/16 | | | | BRL | | | | 63,004.60 | | | | 6,707 | | | | (905,138 | ) |
Morgan Stanley Japan Custom Index | | Put | | Morgan Stanley & Co. International PLC | | | 12/11/15 | | | | JPY | | | | 128.68 | | | | 100,235,739 | | | | (211,071 | ) |
Morgan Stanley Japan Custom Index | | Put | | Morgan Stanley & Co. International PLC | | | 12/11/15 | | | | JPY | | | | 137.22 | | | | 25,713,659 | | | | (55,318 | ) |
Topix Index | | Put | | Bank of America N.A. | | | 12/11/15 | | | | JPY | | | | 1,525.00 | | | | 9,040,446 | | | | (2,072,102 | ) |
Topix Index | | Put | | Citibank N.A. | | | 12/11/15 | | | | JPY | | | | 1,535.00 | | | | 19,311,652 | | | | (4,974,578 | ) |
Delta Airlines, Inc. | | Put | | Morgan Stanley & Co. International PLC | | | 12/18/15 | | | | USD | | | | 43.00 | | | | 138,488 | | | | (46,393 | ) |
S&P 500 Index | | Put | | BNP Paribas SA | | | 12/18/15 | | | | USD | | | | 1,850.00 | | | | 171,437 | | | | (1,045,766 | ) |
United Continental Holdings, Inc. | | Put | | Morgan Stanley & Co. International PLC | | | 12/18/15 | | | | USD | | | | 55.00 | | | | 63,919 | | | | (73,507 | ) |
Ingersoll-Rand PLC | | Put | | Morgan Stanley & Co. International PLC | | | 1/15/16 | | | | USD | | | | 56.00 | | | | 879,381 | | | | (1,129,547 | ) |
Mylan, Inc. | | Put | | Barclays Bank PLC | | | 1/15/16 | | | | USD | | | | 60.00 | | | | 400,622 | | | | (6,450,014 | ) |
Twitter, Inc. | | Put | | Citibank N.A. | | | 1/15/16 | | | | USD | | | | 30.00 | | | | 905,741 | | | | (2,966,302 | ) |
Topix Index | | Put | | Citibank N.A. | | | 4/08/16 | | | | JPY | | | | 1,500.00 | | | | 20,592,708 | | | | (9,899,352 | ) |
Gilead Sciences, Inc. | | Put | | Deutsche Bank AG | | | 5/20/16 | | | | USD | | | | 90.00 | | | | 532,030 | | | | (1,633,332 | ) |
Teva Pharmaceutical Industries Ltd. | | Put | | Deutsche Bank AG | | | 5/20/16 | | | | USD | | | | 55.00 | | | | 1,079,500 | | | | (3,588,474 | ) |
Topix Index | | Put | | Morgan Stanley & Co. International PLC | | | 6/10/16 | | | | JPY | | | | 1,450.00 | | | | 9,208,067 | | | | (4,316,545 | ) |
Topix Index | | Put | | Citibank N.A. | | | 6/10/16 | | | | JPY | | | | 1,475.00 | | | | 8,663,504 | | | | (4,663,235 | ) |
Topix Index | | Put | | Citibank N.A. | | | 6/10/16 | | | | JPY | | | | 1,500.00 | | | | 8,663,503 | | | | (5,340,270 | ) |
Taiwan Stock Exchange Weighted Index | | Put | | Citibank N.A. | | | 9/21/16 | | | | TWD | | | | 8,100.70 | | | | 480,300 | | | | (6,858,316 | ) |
Taiwan Stock Exchange Weighted Index | | Put | | Morgan Stanley & Co. International PLC | | | 9/20/17 | | | | TWD | | | | 8,600.00 | | | | 424,064 | | | | (13,713,543 | ) |
Taiwan Stock Exchange Weighted Index | | Put | | Morgan Stanley & Co. International PLC | | | 12/20/17 | | | | TWD | | | | 8,600.00 | | | | 432,159 | | | | (15,568,128 | ) |
Total | | | | | | | | | | | | | | | | | | | | | | $ | (140,444,230 | ) |
| | | | | | | | | | | | | | | | | | | | | | | | |
See Notes to Consolidated Financial Statements.
| | | | | | |
| | | | | | | |
| | BLACKROCK GLOBAL ALLOCATION FUND, INC. | | OCTOBER 31, 2015 | | 25 |
| | |
Consolidated Schedule of Investments (continued) | | |
OTC Interest Rate Swaptions Written
| | | | | | | | | | | | | | | | | | | | | | | | | | |
| Description | | Counterparty | | Put/ Call | | Exercise Rate | | | Pay/Receive Exercise Rate | | Floating Rate
Index | | Expiration
Date | | | Notional Amount (000) | | | Value | |
5-Year Interest Rate Swap | | Goldman Sachs International | | Call | | | 1.25 | % | | Pay | | 3-month USD LIBOR | | | 11/24/15 | | | USD | | | 3,251,370 | | | $ | (885,868 | ) |
10-Year Interest Rate Swap | | Deutsche Bank AG | | Put | | | 1.25 | % | | Receive | | 6-month EURIBOR | | | 1/04/16 | | | EUR | | | 540,328 | | | | (894,692 | ) |
10-Year Interest Rate Swap | | Goldman Sachs International | | Put | | | 1.80 | % | | Receive | | 3-month USD LIBOR | | | 1/19/16 | | | USD | | | 1,619,400 | | | | (5,815,233 | ) |
Total | | | | | | | | | | | | | | | | | | | | | | | | $ | (7,595,793 | ) |
| | | | | | | | | | | | | | | | | | | | | | | | | | |
Centrally Cleared Credit Default Swaps — Sold Protection
| | | | | | | | | | | | | | | | | | | | | | | | | | | | |
| Issuer | | Receive
Fixed
Rate | | | Expiration
Date | | | Credit
Rating1 | | | | | | Notional
Amount
(000)2 | | | Market
Value | | | Unrealized
Appreciation | |
CDX North America Investment Grade, Series 25, Version 1 | | | 1.00 | % | | | 12/20/20 | | | | BBB+ | | | | USD | | | | 309,644 | | | $ | 3,222,896 | | | $ | 719,882 | |
Markit iTraxx XO, Series 24, Version 1 | | | 5.00 | % | | | 12/20/20 | | | | B | | | | EUR | | | | 214,556 | | | $ | 21,831,703 | | | | 7,445,324 | |
Total | | | | | | | | | | | | | | | | | | | | | | | | | | $ | 8,165,206 | |
| | | | | | | | | | | | | | | | | | | | | | | | | | | | |
1 Using S&P’s rating of the underlying securities of the index. | |
2 The maximum potential amount the Fund may pay should a negative credit event take place as defined under the terms of the agreement. | |
Centrally Cleared Interest Rate Swaps
| | | | | | | | | | | | | | | | | | | | | | | | |
| Fixed Rate | | Floating
Rate | | | Effective
Date | | | Expiration
Date | | | Notional
Amount
(000) | | | Unrealized
Appreciation
(Depreciation) | |
0.75%1 | | | 3 Month LIBOR | | | | N/A | | | | 3/11/17 | | | | USD | | | | 343,312 | | | $ | (314,936 | ) |
0.77%1 | | | 3 Month LIBOR | | | | N/A | | | | 4/07/17 | | | | USD | | | | 482,405 | | | | (606,915 | ) |
1.03%1 | | | 3 Month LIBOR | | | | N/A | | | | 3/11/17 | | | | USD | | | | 1,378,120 | | | | (6,586,067 | ) |
1.08%1 | | | 3 Month LIBOR | | | | N/A | | | | 4/07/17 | | | | USD | | | | 2,806,820 | | | | (15,471,790 | ) |
1.64%1 | | | 3 Month LIBOR | | | | N/A | | | | 10/19/22 | | | | USD | | | | 269,920 | | | | 2,601,603 | |
1.95%1 | | | 3 Month LIBOR | | | | N/A | | | | 9/11/22 | | | | USD | | | | 270,760 | | | | (3,182,402 | ) |
2.68%2 | | | 3 Month LIBOR | | | | 11/02/20 | 3 | | | 11/02/23 | | | | USD | | | | 538,935 | | | | 789,987 | |
1.55%2 | | | 6-month EURIBOR | | | | 10/20/20 | 3 | | | 10/20/25 | | | | EUR | | | | 539,514 | | | | 181,118 | |
1.88%2 | | | 3 Month LIBOR | | | | N/A | | | | 3/11/20 | | | | USD | | | | 526,316 | | | | 10,976,595 | |
2.22%2 | | | 3 Month LIBOR | | | | N/A | | | | 4/07/25 | | | | USD | | | | 571,550 | | | | 9,836,204 | |
2.66%2 | | | 3 Month LIBOR | | | | 10/13/20 | 3 | | | 10/13/23 | | | | USD | | | | 540,260 | | | | 647,498 | |
3.05%2 | | | 3 Month LIBOR | | | | 9/17/20 | 3 | | | 9/17/25 | | | | USD | | | | 270,645 | | | | 4,352,541 | |
1.83%1 | | | 3 Month LIBOR | | | | N/A | | | | 11/03/22 | | | | USD | | | | 269,320 | | | | (631,201 | ) |
| | | | | | | | | | | | | | | | | | | | | | | | |
Total | | | | | | | | | | | | | | | | | | | $ | 2,592,235 | |
| | | | | | | | | | | | | | | | | | | | | | | | |
1 Fund pays the fixed rate and receives the floating rate. | | | | | |
2 Fund pays the floating rate and receives the fixed rate. | | | | | |
3 Forward Swap. | | | | | |
OTC Currency Swaps
| | | | | | | | | | | | | | | | | | | | | | | | | | | | | | | | | | | | | | | | |
| | | | | | Notional Amount (000) | | | | | | | | | | | | | | | | |
| Fund Pays | | Fund
Receives | | | Fund Pays | | | Fund Receives | | | Counterparty | | | Expiration
Date | | |
Value | | | Premiums
Received | | | Unrealized
Appreciation | |
0.1% JPY | | | 1.23 | % | | | USD | | | | 2,066 | | | | JPY | | | | 11,078,850 | | | | Bank of America N.A. | | | | 3/15/17 | | | $ | 18,855 | | | $ | (18,117 | ) | | $ | 36,972 | |
See Notes to Consolidated Financial Statements.
| | | | | | |
| | | | | | | |
| 26 | | BLACKROCK GLOBAL ALLOCATION FUND, INC. | | OCTOBER 31, 2015 | | |
| | |
Consolidated Schedule of Investments (continued) | | |
OTC Interest Rate Swaps
| | | | | | | | | | | | | | | | | | | | | | | | | | | | | | | | | | | | |
| Fixed Rate | | Floating
Rate | | | Counterparty | | | Effective
Date | | | Expiration
Date | | | Notional
Amount
(000) | | | Value | | | Premiums
Paid
(Received) | | | Unrealized
Appreciation | |
2.06%1 | | | 6-month WIBOR | | | | Deutsche Bank AG | | | | 3/17/15 | | | | 3/17/20 | | | | PLN | | | | 164,277 | | | $ | 592,249 | | | | — | | | $ | 592,249 | |
2.05%1 | | | 6-month WIBOR | | | | Deutsche Bank AG | | | | 3/19/15 | | | | 3/19/20 | | | | PLN | | | | 54,759 | | | | 193,000 | | | | — | | | | 193,000 | |
| | | | | | | | | | | | | | | | | | | | | | | | | | | | | | | | | | | | |
Total | | | | | | | $ | 785,249 | | | | — | | | $ | 785,249 | |
| | | | | | | | | | | | | | | | | | | | | | | | | | | | |
1 Fund pays the floating rate and receives the fixed rate. | | | | | | | | | | | | | | | | | |
OTC Total Return Swaps
| | | | | | | | | | | | | | | | | | | | | | | | | | | | | | | | | | |
| Reference Entity | | Fixed Rate/ Floating Rate | | | Counterparty | | Expiration
Date | | | Notional
Amount
(000) | | | Value | | | Premiums
Paid
(Received) | | | Unrealized
Appreciation
(Depreciation) | |
Siloam International Hospitals | | | 1-month LIBOR +0.50%1 | | | Credit Suisse
International | | | 2/08/16 | | | | USD | | | | 14,193 | | | $ | (1,283,866 | ) | | | — | | | $ | (1,283,866 | ) |
SGX Nikkei Stock Average Dividend Point Index Future December 2015 | | | JPY | | | | 2,703,510,000 | 2 | | BNP Paribas S.A. | | | 3/31/16 | | | | JPY | | | | 1,026 | 3 | | | 5,229,054 | | | | — | | | | 5,229,054 | |
SGX Nikkei Stock Average Dividend Point Index Future December 2015 | | | JPY | | | | 2,773,800,000 | 2 | | BNP Paribas S.A. | | | 3/31/16 | | | | JPY | | | | 1,035 | 3 | | | 4,888,953 | | | | — | | | | 4,888,953 | |
SGX Nikkei Stock Average Dividend Point Index Future December 2016 | | | JPY | | | | 2,726,515,000 | 2 | | BNP Paribas S.A. | | | 3/31/17 | | | | JPY | | | | 979 | 3 | | | 7,058,341 | | | | — | | | | 7,058,341 | |
SGX Nikkei Stock Average Dividend Point Index Future December 2016 | | | JPY | | | | 2,778,300,000 | 2 | | BNP Paribas S.A. | | | 3/31/17 | | | | JPY | | | | 980 | 3 | | | 6,659,485 | | | | — | | | | 6,659,485 | |
Euro Stoxx 50 Index Dividend Future December 2017 | | | EUR | | | | 24,621,520 | 2 | | BNP Paribas S.A. | | | 12/15/17 | | | | EUR | | | | 2,156 | 3 | | | (806,088 | ) | | | — | | | | (806,088 | ) |
Euro Stoxx 50 Index Dividend Future December 2017 | | | EUR | | | | 24,702,982 | 2 | | BNP Paribas S.A. | | | 12/15/17 | | | | EUR | | | | 2,143 | 3 | | | (1,054,061 | ) | | | — | | | | (1,054,061 | ) |
Euro Stoxx 50 Index Dividend Future December 2018 | | | EUR | | | | 12,051,630 | 2 | | BNP Paribas S.A. | | | 12/21/18 | | | | EUR | | | | 1,077 | 3 | | | (521,102 | ) | | | — | | | | (521,102 | ) |
Euro Stoxx 50 Index Dividend Future December 2018 | | | EUR | | | | 13,288,800 | 2 | | BNP Paribas S.A. | | | 12/21/18 | | | | EUR | | | | 1,176 | 3 | | | (711,254 | ) | | | — | | | | (711,254 | ) |
Euro Stoxx 50 Index Dividend Future December 2018 | | | EUR | | | | 24,499,253 | 2 | | BNP Paribas S.A. | | | 12/21/18 | | | | EUR | | | | 2,159 | 3 | | | (1,418,552 | ) | | | — | | | | (1,418,552 | ) |
Total | | | $ | 18,040,910 | | | | — | | | $ | 18,040,910 | |
| | | | | | | | | | | | | | | | | | | | | | | | | | |
1 Fund receives the total return of the reference entity and pays the floating rate. Net payment at termination. | | | | | | | | | | | | | |
2 Fund receives the total return of the reference entity and pays the fixed amount. Net payment at termination. | | | | | | | | | | | | | |
3 Contract amount shown. | | | | | | | | | | | | | |
Transactions in Options Written for the Year Ended October 31, 2015
| | | | | | | | | | | | | | | | | | | | | | | | | | |
| | | Calls | | | | | Puts | |
| | | Contracts | | | Notional (000)1 | | | Premiums
Received | | | | | Contracts | | | Notional
(000)1 | | | Premiums
Received | |
Outstanding options, beginning of year | | | 108,880,928 | | | | 559,951 | | | $ | 99,250,140 | | | | | | 142,595,281 | | | | 559,951 | | | $ | 169,365,514 | |
Options written | | | 175,972,919 | | | | 27,750,969 | | | | 231,183,335 | | | | | | 422,381,707 | | | | 2,714,718 | | | | 299,581,703 | |
Options expired | | | (4,994,951 | ) | | | (4,349,390 | ) | | | (21,021,199 | ) | | | | | (1,873,591 | ) | | | — | | | | (16,102,740 | ) |
Options exercised | | | (12,949,270 | ) | | | — | | | | (30,558,643 | ) | | | | | (10,236,083 | ) | | | — | | | | (27,152,324 | ) |
Options closed | | | (196,444,980 | ) | | | (20,710,160 | ) | | | (214,176,915 | ) | | | | | (344,770,096 | ) | | | (1,114,941 | ) | | | (290,886,114 | ) |
| | | | | | | | | | |
Outstanding options, end of year | | | 70,464,646 | | | | 3,251,370 | | | $ | 64,676,718 | | | | | | 208,097,218 | | | | 2,159,728 | | | $ | 134,806,039 | |
| | | | | | | | | | |
1 Amount shown is in the currency in which the transaction was denominated. | | | | | | | | | | | | |
See Notes to Consolidated Financial Statements.
| | | | | | |
| | | | | | | |
| | BLACKROCK GLOBAL ALLOCATION FUND, INC. | | OCTOBER 31, 2015 | | 27 |
| | |
Consolidated Schedule of Investments (continued) | | |
|
| Derivative Financial Instruments Categorized by Risk Exposure |
The following is a summary of the Funds’s derivative financial instruments categorized by risk exposure. For information about the Funds’s investment risks regarding derivative financial instruments, refer to the Notes to Consolidated Financial Statements.
As of period end, the fair values of derivative financial instruments were as follows:
| | | | | | | | | | | | | | | | | | | | | | | | | | |
Statement of Assets and Liabilities Location Assets — Derivative Financial Instruments | | Commodity Contracts | | | Credit Contracts | | | Equity Contracts | | | Foreign Currency Exchange Contracts | | | Interest Rate Contracts | | | Total | |
Forward foreign currency exchange contracts | | Net unrealized appreciation on forward foreign currency exchange contracts | | | — | | | | — | | | | — | | | $ | 29,417,304 | | | | — | | | $ | 29,417,304 | |
Options purchased | | Investments at value — unaffiliated1 | | | — | | | | — | | | $ | 361,002,461 | | | | 280,012 | | | $ | 28,344,236 | | | | 389,626,709 | |
Swaps — OTC | | Unrealized appreciation on OTC swaps | | | — | | | | — | | | | 23,835,833 | | | | — | | | | 822,221 | | | | 24,658,054 | |
Swaps — centrally cleared | | Net unrealized appreciation2 | | | — | | | $ | 8,165,206 | | | | — | | | | — | | | | 29,385,546 | | | | 37,550,752 | |
Total | | | | | — | | | $ | 8,165,206 | | | $ | 384,838,294 | | | $ | 29,697,316 | | | $ | 58,552,003 | | | $ | 481,252,819 | |
| Liabilities — Derivative Financial Instruments | | | | | | | | | | | | | |
Financial futures contracts | | Net unrealized depreciation1 | | | — | | | | — | | | $ | 63,124,328 | | | | — | | | | — | | | $ | 63,124,328 | |
Forward foreign currency exchange contracts | | Net unrealized depreciation on forward foreign currency exchange contracts | | | — | | | | — | | | | — | | | $ | 66,573,575 | | | | — | | | | 66,573,575 | |
Options written | | Options written at value | | | — | | | | — | | | | 165,415,884 | | | | — | | | $ | 7,595,793 | | | | 173,011,677 | |
Swaps — OTC | | Unrealized depreciation on OTC swaps; Swap premiums received | | | — | | | | | | | | 5,794,923 | | | | — | | | | 18,117 | | | | 5,813,040 | |
Swaps — centrally cleared | | Net unrealized depreciation2 | | | — | | | | — | | | | — | | | | — | | | | 26,793,311 | | | | 26,793,311 | |
Total | | | | | — | | | | — | | | $ | 234,335,135 | | | $ | 66,573,575 | | | $ | 34,407,221 | | | $ | 335,315,931 | |
1 Includes options purchased at value as reported in the Consolidated Schedules of Investments. | |
2 Includes cumulative appreciation (depreciation) on financial futures contracts and centrally cleared swaps, if any, as reported in the Consolidated Schedule of Investments. Only current day’s variation margin is reported within the Consolidated Statement of Assets and Liabilities. | |
For the year ended October 31, 2015, the effect of derivative financial instruments in the Consolidated Statement of Operations was as follows:
| | | | | | | | | | | | | | | | | | | | | | | | |
| Net Realized Gain (Loss) from: | | Commodity Contracts | | | Credit Contracts | | | Equity Contracts | | | Foreign Currency Exchange Contracts | | | Interest Rate Contracts | | | Total | |
Financial futures contracts | | | — | | | | — | | | $ | 255,293,370 | | | | — | | | | — | | | $ | 255,293,370 | |
Forward foreign currency exchange contracts | | | — | | | | — | | | | — | | | $ | 994,837,167 | | | | — | | | | 994,837,167 | |
Options purchased1 | | | — | | | | — | | | | (40,526,706 | ) | | | 42,076,156 | | | $ | (35,126,018 | ) | | | (33,576,568 | ) |
Options written | | | — | | | | — | | | | 115,758,008 | | | | 3,022,568 | | | | (3,276,313 | ) | | | 115,504,263 | |
Swaps | | | — | | | $ | 20,240,666 | | | | (282,184 | ) | | | — | | | | 20,717,052 | | | | 40,675,534 | |
Total | | | — | | | $ | 20,240,666 | | | $ | 330,242,488 | | | $ | 1,039,935,891 | | | $ | (17,685,279 | ) | | $ | 1,372,733,766 | |
1 Options purchased are included in net realized gain (loss) from investments. | | | | | | | | | |
| | | | |
Net Change in Unrealized Appreciation (Depreciation) on: | | | | | | | | | | | | | | | | | |
Financial futures contracts | | | — | | | | — | | | $ | (57,668,334 | ) | | | — | | | | — | | | $ | (57,668,334 | ) |
Forward foreign currency exchange contracts | | | — | | | | — | | | | — | | | $ | (215,447,697 | ) | | | — | | | | (215,447,697 | ) |
Options purchased2 | | | — | | | | — | | | | (29,852,501 | ) | | | (19,574,014 | ) | | | 27,913,260 | | | | (21,513,255 | ) |
Options written | | | — | | | | — | | | | 70,794,906 | | | | (1,047,674 | ) | | | 11,654,753 | | | | 81,401,985 | |
Swaps | | | — | | | $ | 835,773 | | | | 6,912,050 | | | | — | | | | 1,628,102 | | | | 9,375,925 | |
Total | | | — | | | $ | 835,773 | | | $ | (9,813,879 | ) | | $ | (236,069,385 | ) | | $ | 41,196,115 | | | $ | (203,851,376 | ) |
2 Options purchased are included in net change in unrealized appreciation (depreciation) on investments. | | | | | | | | | |
See Notes to Consolidated Financial Statements.
| | | | | | |
| | | | | | | |
| 28 | | BLACKROCK GLOBAL ALLOCATION FUND, INC. | | OCTOBER 31, 2015 | | |
| | |
Consolidated Schedule of Investments (continued) | | |
|
| Average Quarterly Balances of Outstanding Derivative Financial Instruments |
For the year ended October 31, 2015, the average quarterly balances of outstanding derivative financial instruments were as follows:
| | | | |
Financial futures contracts: | | | | |
Average notional value of contracts — long | | $ | 272,562,798 | |
Average notional value of contracts — short | | $ | 2,388,124,222 | |
Forward foreign currency exchange contracts: | | | | |
Average amounts purchased — in USD | | $ | 6,432,741,453 | |
Average amounts sold — in USD | | $ | 1,182,398,524 | |
Options: | | | | |
Average value of option contracts purchased | | $ | 594,990,019 | |
Average value of option contracts written | | $ | 204,891,795 | |
Average notional value of swaption contracts purchased | | $ | 8,175,836,001 | |
Average notional value of swaption contracts written | | $ | 3,344,167,963 | |
Credit default swaps: | | | | |
Average notional value of contracts — long | | $ | 76,971,362 | |
Average notional value of contracts — short | | $ | 254,854,511 | |
Interest rate swaps: | | | | |
Average notional value — pays fixed rate | | $ | 6,883,079,250 | |
Average notional value — receives fixed rate | | $ | 2,447,592,063 | |
Cross Currency swaps: | | | | |
Average notional amount-pays fixed rate | | $ | 68,497,812 | |
Total return swaps: | | | | |
Average notional amount | | $ | 159,516,839 | |
|
| Derivative Financial Instruments — Offsetting as of Period End |
The Fund’s derivative assets and liabilities (by type) were as follows:
| | | | | | | | |
| | | Assets | | | Liabilities | |
| Derivative Financial Instruments: | | | | | | | | |
Financial futures contracts | | $ | 4,629,257 | | | | — | |
Forward foreign currency exchange contracts | | | 29,417,304 | | | $ | 66,573,575 | |
Options | | | 389,626,709 | 1 | | | 173,011,677 | |
Swaps — Centrally cleared | | | 5,046,169 | | | | 1,505,070 | |
Swaps — OTC2 | | | 24,658,054 | | | | 5,813,040 | |
| | | | |
Total derivative assets and liabilities in the Statement of Assets and Liabilities | | $ | 453,377,493 | | | $ | 246,903,362 | |
| | | | |
Derivatives not subject to a Master Netting Agreement or similar agreement (“MNA”) | | | (33,268,998 | ) | | | (4,473,432 | ) |
| | | | |
Total derivative assets and liabilities subject to an MNA | | $ | 420,108,495 | | | $ | 242,429,930 | |
| | | | |
1 Includes options purchased at value which is included in Investments at value—unaffiliated in the Consolidated Statement of Assets and Liabilities and reported in the Consolidated Schedule of Investments. | |
2 Includes unrealized appreciation (depreciation) on OTC swaps and swap premiums paid/received in the Consolidated Statement of Assets and Liabilities. | |
See Notes to Consolidated Financial Statements.
| | | | | | |
| | | | | | | |
| | BLACKROCK GLOBAL ALLOCATION FUND, INC. | | OCTOBER 31, 2015 | | 29 |
| | |
Consolidated Schedule of Investments (continued) | | |
The following table presents the Fund’s derivative assets and liabilities by counterparty net of amounts available for offset under an MNA and net of the related collateral received and pledged by the Fund:
| | | | | | | | | | | | | | | | | | | | | | |
| Counterparty | | Derivative Assets Subject to an MNA
by Counterparty | | | Derivatives Available for Offset1 | | | Non-cash
Collateral
Received | | | Cash Collateral Received2 | | | Net Amount of
Derivative Assets3 | | | |
Bank of America N.A. | | $ | 26,209,337 | | | $ | (3,817,224 | ) | | $ | (19,587,474 | ) | | | — | | | $ | 2,804,639 | | | |
Barclays Bank PLC | | | 12,023,667 | | | | (6,450,014 | ) | | | — | | | $ | (5,573,653 | ) | | | — | | | |
BNP Paribas S.A. | | | 34,770,766 | | | | (15,459,556 | ) | | | — | | | | (17,620,000 | ) | | | 1,691,210 | | | |
Citibank N.A. | | | 64,951,565 | | | | (41,478,678 | ) | | | — | | | | (23,472,887 | ) | | | — | | | |
Credit Suisse International | | | 27,961,153 | | | | (18,704,823 | ) | | | — | | | | (7,680,000 | ) | | | 1,576,330 | | | |
Deutsche Bank AG | | | 100,121,718 | | | | (59,511,620 | ) | | | — | | | | (40,610,098 | ) | | | — | | | |
Goldman Sachs International | | | 76,805,345 | | | | (28,746,201 | ) | | | — | | | | (48,059,144 | ) | | | — | | | |
HSBC Bank USA N.A. | | | 745,956 | | | | (745,956 | ) | | | — | | | | — | | | | — | | | |
JPMorgan Chase Bank N.A. | | | 13,655,249 | | | | (9,734,191 | ) | | | — | | | | (3,921,058 | ) | | | — | | | |
Morgan Stanley & Co. International PLC | | | 57,043,964 | | | | (37,803,357 | ) | | | — | | | | (18,251,000 | ) | | | 989,607 | | | |
Morgan Stanley Capital Services LLC | | | 956,514 | | | | (956,514 | ) | | | — | | | | — | | | | — | | | |
UBS AG | | | 4,863,261 | | | | — | | | | (4,558,305 | ) | | | (260,000 | ) | | | 44,956 | | | |
Total | | $ | 420,108,495 | | | $ | (223,408,134 | ) | | $ | (24,145,779 | ) | | $ | (165,447,840 | ) | | $ | 7,106,742 | | | |
| | | |
| | | | | | |
| Counterparty | | Derivative Liabilities Subject to an MNA by Counterparty | | | Derivatives Available for Offset1 | | | Non-cash
Collateral
Pledged | | | Cash Collateral
Pledged | | | Net Amount
of Derivative
Liabilities4 | | | |
Bank of America N.A. | | $ | 3,817,224 | | | $ | (3,817,224 | ) | | | — | | | | — | | | | — | | | |
Barclays Bank PLC | | | 6,450,014 | | | | (6,450,014 | ) | | | — | | | | — | | | | — | | | |
BNP Paribas S.A. | | | 15,459,556 | | | | (15,459,556 | ) | | | — | | | | — | | | | — | | | |
Citibank N.A. | | | 41,478,678 | | | | (41,478,678 | ) | | | — | | | | — | | | | — | | | |
Credit Suisse International | | | 18,704,823 | | | | (18,704,823 | ) | | | — | | | | — | | | | — | | | |
Deutsche Bank AG | | | 59,511,620 | | | | (59,511,620 | ) | | | — | | | | — | | | | — | | | |
Goldman Sachs International | | | 28,746,201 | | | | (28,746,201 | ) | | | — | | | | — | | | | — | | | |
HSBC Bank USA N.A. | | | 9,700,454 | | | | (745,956 | ) | | | — | | | | — | | | $ | 8,954,498 | | | |
JPMorgan Chase Bank N.A. | | | 9,734,191 | | | | (9,734,191 | ) | | | — | | | | — | | | | — | | | |
Morgan Stanley & Co. International PLC | | | 37,803,357 | | | | (37,803,357 | ) | | | — | | | | — | | | | — | | | |
Morgan Stanley Capital Services LLC | | | 11,023,812 | | | | (956,514 | ) | | | — | | | | — | | | | 10,067,298 | | | |
Total | | $ | 242,429,930 | | | $ | (223,408,134 | ) | | | — | | | | — | | | $ | 19,021,796 | | | |
| | | |
1 The amount of derivatives available for offset is limited to the amount of derivative assets and/or liabilities that are subject to an MNA. | | | |
2 Excess of collateral received from the individual counterparty is not shown for financial reporting purposes. | | | |
3 Net amount represents the net amount receivable from the counterparty in the event of default. | | | |
4 Net amount represents the net amount payable due to the counterparty in the event of default. Net amount may be offset further by the options written receivable/payable on the Consolidated Statement of Assets and Liabilities. | | | |
See Notes to Consolidated Financial Statements.
| | | | | | |
| | | | | | | |
| 30 | | BLACKROCK GLOBAL ALLOCATION FUND, INC. | | OCTOBER 31, 2015 | | |
| | |
Consolidated Schedule of Investments (continued) | | |
|
| Fair Value Hierarchy as of October 31, 2015 |
Various inputs are used in determining the fair value of investments and derivative financial instruments. For information about the Fund’s policy regarding valuation of investments and derivative financial instruments, refer to the Notes to Consolidated Financial Statements.
The following tables summarize the Fund’s investments and derivative financial instruments categorized in the disclosure hierarchy:
| | | | | | | | | | | | | | | | |
| | | Level 1 | | | Level 2 | | | Level 3 | | | Total | |
Assets: | | | | | | | | | | | | | | | | |
| Investments: | | | | | | | | | | | | | | | | |
| Common Stocks: | | | | | | | | | | | | | | | | |
Australia | | | — | | | $ | 63,541,628 | | | | — | | | $ | 63,541,628 | |
Austria | | | — | | | | 1,535,590 | | | | — | | | | 1,535,590 | |
Belgium | | $ | 16,184,621 | | | | 87,063,167 | | | | — | | | | 103,247,788 | |
Brazil | | | 47,791,172 | | | | — | | | | — | | | | 47,791,172 | |
Canada | | | 536,072,126 | | | | — | | | | — | | | | 536,072,126 | |
China | | | 107,661,328 | | | | 69,811,254 | | | | — | | | | 177,472,582 | |
Cyprus | | | 2,772,616 | | | | — | | | | — | | | | 2,772,616 | |
Egypt | | | 9,993,079 | | | | — | | | | — | | | | 9,993,079 | |
France | | | 72,680,752 | | | | 1,326,899,794 | | | | — | | | | 1,399,580,546 | |
Germany | | | — | | | | 384,473,848 | | | | — | | | | 384,473,848 | |
Hong Kong | | | — | | | | 462,440,790 | | | | — | | | | 462,440,790 | |
India | | | — | | | | 178,002,670 | | | | — | | | | 178,002,670 | |
Indonesia | | | — | | | | 20,531,249 | | | | — | | | | 20,531,249 | |
Ireland | | | 115,528,410 | | | | 65,926,272 | | | | — | | | | 181,454,682 | |
Israel | | | 281,042,764 | | | | — | | | | — | | | | 281,042,764 | |
Italy | | | 38,128,563 | | | | 330,818,337 | | | | — | | | | 368,946,900 | |
Japan | | | — | | | | 4,520,719,547 | | | | — | | | | 4,520,719,547 | |
Kazakhstan | | | 13,267,583 | | | | — | | | | — | | | | 13,267,583 | |
Luxembourg | | | — | | | | 8,911,537 | | | | — | | | | 8,911,537 | |
Malaysia | | | — | | | | 98,976,125 | | | | — | | | | 98,976,125 | |
Mexico | | | 129,016,445 | | | | — | | | | — | | | | 129,016,445 | |
Netherlands | | | 81,799,469 | | | | 514,424,918 | | | | — | | | | 596,224,387 | |
Norway | | | — | | | | 128,737,965 | | | | — | | | | 128,737,965 | |
Peru | | | 84,277,472 | | | | — | | | | — | | | | 84,277,472 | |
Portugal | | | — | | | | 39,787,974 | | | | — | | | | 39,787,974 | |
Singapore | | | 1,974,266 | | | | 366,992,888 | | | | — | | | | 368,967,154 | |
South Africa | | | — | | | | 15,244,255 | | | | — | | | | 15,244,255 | |
South Korea | | | — | | | | 262,363,615 | | | | — | | | | 262,363,615 | |
Spain | | | — | | | | 291,185,159 | | | | — | | | | 291,185,159 | |
Sweden | | | — | | | | 58,972,351 | | | | — | | | | 58,972,351 | |
Switzerland | | | 1,664,679 | | | | 707,636,947 | | | | — | | | | 709,301,626 | |
Taiwan | | | — | | | | 104,622,176 | | | | — | | | | 104,622,176 | |
Thailand | | | 60,861,832 | | | | — | | | | — | | | | 60,861,832 | |
United Arab Emirates | | | 49,941,985 | | | | 45,394,228 | | | | — | | | | 95,336,213 | |
United Kingdom | | | 303,646,514 | | | | 1,383,941,966 | | | $ | 37,278,930 | | | | 1,724,867,410 | |
United States | | | 14,099,834,666 | | | | 26,114,539 | | | | 2,151,002 | | | | 14,128,100,207 | |
Corporate Bonds | | | — | | | | 3,361,241,148 | | | | 320,580,970 | | | | 3,681,822,118 | |
Credit Linked Notes | | | — | | | | 174,355,936 | | | | — | | | | 174,355,936 | |
Floating Rate Loan Interests | | | — | | | | 478,970,637 | | | | 142,254,921 | | | | 621,225,558 | |
Foreign Agency Obligations | | | — | | | | 2,579,518,320 | | | | — | | | | 2,579,518,320 | |
Non-Agency Mortgage-Backed Securities | | | — | | | | — | | | | 43,912,540 | | | | 43,912,540 | |
U.S. Government Sponsored Agency Securities | | | — | | | | 191,036,036 | | | | — | | | | 191,036,036 | |
U.S. Treasury Obligations | | | — | | | | 3,310,823,562 | | | | — | | | | 3,310,823,562 | |
Investment Companies | | | 498,762,819 | | | | — | | | | — | | | | 498,762,819 | |
Preferred Securities | | | 734,322,593 | | | | 919,250,266 | | | | 619,340,600 | | | | 2,272,913,459 | |
Warrants | | | — | | | | 9,467,595 | | | | — | | | | 9,467,595 | |
Rights | | | 531,459 | | | | — | | | | — | | | | 531,459 | |
| Short-term Securities: | | | | | | | | | | | | | | | | |
Foreign Agency Obligations | | | — | | | | 2,329,911,459 | | | | — | | | | 2,329,911,459 | |
Money Market Funds | | | 1,040,534 | | | | 497,499,535 | | | | — | | | | 498,540,069 | |
U.S. Treasury Obligations | | | — | | | | 8,809,928,427 | | | | — | | | | 8,809,928,427 | |
See Notes to Consolidated Financial Statements.
| | | | | | |
| | | | | | | |
| | BLACKROCK GLOBAL ALLOCATION FUND, INC. | | OCTOBER 31, 2015 | | 31 |
| | |
Consolidated Schedule of Investments (continued) | | |
| | | | | | | | | | | | | | | | |
| | | Level 1 | | | Level 2 | | | Level 3 | | | Total | |
Assets (continued): | | | | | | | | | | | | | | | | |
| Options Purchased: | | | | | | | | | | | | | | | | |
Currency contracts | | | — | | | $ | 280,012 | | | | — | | | $ | 280,012 | |
Equity contracts | | $ | 23,593,572 | | | | 316,901,273 | | | $ | 20,507,616 | | | | 361,002,461 | |
Interest rate contracts | | | — | | | | 28,344,236 | | | | — | | | | 28,344,236 | |
Liabilities: | | | | | | | | | | | | | | | | |
| Investments: | | | | | | | | | | | | | | | | |
Investments Sold Short | | | (131,078,489 | ) | | | (24,910,560 | ) | | | — | | | | (155,989,049 | ) |
| | | | |
Total | | $ | 17,181,312,830 | | | $ | 34,547,688,671 | | | $ | 1,186,026,579 | | | $ | 52,915,028,080 | |
| | | | |
| | | | | | | | | | | | | | | | |
| | | Level 1 | | | Level 2 | | | Level 3 | | | Total | |
| Derivative Financial Instruments1 | | | | | | | | | | | | | | | | |
Assets: | | | | | | | | | | | | | | | | |
Credit contracts | | | — | | | $ | 8,165,206 | | | | — | | | $ | 8,165,206 | |
Equity contracts | | | — | | | | 23,835,833 | | | | — | | | | 23,835,833 | |
Foreign currency exchange contracts | | | — | | | | 29,417,304 | | | | — | | | | 29,417,304 | |
Interest contracts | | | — | | | | 30,207,767 | | | | — | | | | 30,207,767 | |
Liabilities: | | | | | | | | | | | | | | | | |
Credit contracts | | | — | | | | — | | | | — | | | | — | |
Equity contracts | | $ | (66,092,690 | ) | | | (167,976,056 | ) | | $ | (266,389 | ) | | | (234,335,135 | ) |
Foreign currency exchange contracts | | | — | | | | (66,573,575 | ) | | | — | | | | (66,573,575 | ) |
Interest contracts | | | — | | | | (34,389,104 | ) | | | — | | | | (34,389,104 | ) |
| | | | |
Total | | $ | (66,092,690 | ) | | $ | (177,312,625 | ) | | $ | (266,389 | ) | | $ | (243,671,704 | ) |
| | | | |
1 Derivative financial instruments are swaps, financial futures contracts, foreign currency exchange contracts and options written. Swaps, financial futures contracts and foreign currency exchange contracts are valued at the unrealized appreciation (depreciation) on the instrument and options written are shown at value. | |
The Fund may hold assets and/or liabilities in which the fair value approximates the carrying amount for financial statement purposes. As of period end, such assets and/or liabilities are categorized within the disclosure hierarchy as follows:
| | | | | | | | | | | | | | | | |
| | | Level 1 | | | Level 2 | | | Level 3 | | | Total | |
Assets: | | | | | | | | | | | | | | | | |
Cash pledged for centrally cleared swaps | | $ | 56,469,130 | | | | — | | | | — | | | $ | 56,469,130 | |
Foreign currency at value | | | 2,725,677 | | | | — | | | | — | | | | 2,725,677 | |
Cash held for investments sold short | | | 142,379,928 | | | | — | | | | — | | | | 142,379,928 | |
Liabilities: | | | | | | | | | | | | | | | | |
Bank overdraft | | | — | | | $ | (231,000 | ) | | | — | | | | (231,000 | ) |
Collateral on securities loaned at value | | | — | | | | (497,499,535 | ) | | | — | | | | (497,499,535 | ) |
Cash received as collateral for OTC derivatives | | | — | | | | (208,450,000 | ) | | | — | | | | (208,450,000 | ) |
| | | | |
Total | | $ | 201,574,735 | | | $ | (706,180,535 | ) | | | — | | | $ | (504,605,800 | ) |
| | | | |
A reconciliation of Level 3 investments is presented when the Fund had a significant amount of Level 3 investments at the beginning and/or end of the period in relation to net assets. The following table is a reconciliation of Level 3 investments for which significant unobservable inputs were used in determining fair value:
| | | | | | | | | | | | | | | | | | | | | | | | | | | | |
| | | Common
Stocks | | | Corporate Bonds | | | Floating Rate Loan Interests | | | Preferred
Securities | | | Non-Agency
Mortgage-Backed
Securities | | | Options
Purchased | | | Total | |
Assets: | | | | | | | | | | | | | | | | | | | | | | | | | | | | |
Opening Balance, as of October 31, 2014 | | $ | 45,990,427 | | | $ | 248,074,286 | | | $ | 45,883,966 | | | $ | 364,409,258 | | | | — | | | | — | | | $ | 704,357,937 | |
Transfers into Level 3 | | | — | | | | — | | | | 71,500,455 | | | | — | | | | — | | | | — | | | | 71,500,455 | |
Transfers out of Level 3 | | | — | | | | (83,308,291 | ) | | | — | | | | — | | | | — | | | | — | | | | (83,308,291 | ) |
Accrued discounts/premiums | | | — | | | | 709,473 | | | | 49,211 | | | | — | | | $ | 33,641 | | | | — | | | | 792,325 | |
Net realized gain (loss) | | | — | | | | (20,878,679 | ) | | | 369,907 | | | | — | | | | — | | | | — | | | | (20,508,772 | ) |
Net change in unrealized appreciation (depreciation)1 | | | (8,656,577 | ) | | | (67,461,367 | ) | | | (23,747,832 | ) | | | 173,913,653 | | | | (1,643,904 | ) | | $ | 8,590,790 | | | | 80,994,763 | |
Purchases | | | 2,096,082 | | | | 298,967,067 | | | | 76,432,637 | | | | 109,408,069 | | | | 45,522,803 | | | | 11,916,826 | | | | 544,343,484 | |
Sales | | | — | | | | (55,521,519 | ) | | | (28,233,423 | ) | | | (28,390,380 | ) | | | — | | | | — | | | | (112,145,322 | ) |
Closing Balance, as of October 31, 2015 | | $ | 39,429,932 | | | $ | 320,580,970 | | | $ | 142,254,921 | | | $ | 619,340,600 | | | $ | 43,912,540 | | | $ | 20,507,616 | | | $ | 1,186,026,579 | |
| | | | | | | | | | | | | | | | | | | | | | | | | | | | |
Net change in unrealized appreciation (depreciation) on investments still held at October 31, 20152 | | $ | (8,656,577 | ) | | $ | (88,350,460 | ) | | $ | (23,747,832 | ) | | $ | 173,913,653 | | | $ | (1,643,904 | ) | | $ | 8,590,790 | | | $ | 60,105,670 | |
| | | | | | | | | | | | | | | | | | | | | | | | | | | | |
1 Included in the related net change in unrealized appreciation (depreciation) in the Consolidated Statement of Operations. | |
2 Any difference between net change in unrealized appreciation (depreciation) and net change in unrealized appreciation (depreciation) on investments still held at October 31, 2015 is generally due to investments no longer held or categorized as Level 3 at period end. | |
See Notes to Consolidated Financial Statements.
| | | | | | |
| | | | | | | |
| 32 | | BLACKROCK GLOBAL ALLOCATION FUND, INC. | | OCTOBER 31, 2015 | | |
| | |
Consolidated Schedule of Investments (concluded) | | |
The following table is a reconciliation of Level 3 derivative financial instruments for which significant unobservable inputs were used in determining fair value:
| | | | |
| | | Equity Contracts | |
| | | Liabilities | |
Opening Balance, as of October 31, 2014 | | | — | |
Transfers into Level 3 | | | — | |
Transfers out of Level 3 | | | — | |
Accrued discounts/premiums | | | — | |
Net realized realized gain | | | — | |
Net change in unrealized appreciation/depreciation1,2 | | $ | 10,991,225 | |
Purchases | | | (11,257,614 | ) |
Sales | | | — | |
Closing Balance, as of October 31, 2015 | | $ | (266,389 | ) |
| | | | |
Net change in unrealized appreciation/depreciation on derivative financial instruments still held at October 31, 20151 | | $ | 10,991,225 | |
| | | | |
1 Included in the related net change in unrealized appreciation/depreciation in the Statements of Operations. | |
2 Any difference between Net change in unrealized appreciation/depreciation and Net change in unrealized appreciation/depreciation on investments still held at October 31, 2015 is generally due to investments no longer held or categorized as Level 3 at period end. | |
The Fund’s investments that are categorized as Level 3 were valued utilizing third party pricing information without adjustment. Such valuations are based on unobservable inputs. A significant change in third party information inputs could result in a significantly lower or higher value of such Level 3 investments.
The following table summarizes the valuation techniques used and unobservable inputs utilized by the BlackRock Global Valuation Methodologies Committee (the “Global Valuation Committee”) to determine the value of certain of the Fund’s Level 3 investments as of period end. The table does not include Level 3 investments with values based upon unadjusted third party pricing information in the amount of $217,954,955.
| | | | | | | | | | | | | | |
| | | Value | | | Valuation Techniques | | Unobservable Inputs | | Range of
Unobservable Inputs
Utilized | | Weighted Average of
Unobservable Inputs | |
Assets: | | | | | | | | | | | | | | |
Common Stocks | | $ | 39,429,932 | | | Market Comparable Companies | | Run Rate EBITDA Multiple1 | | 20.5x | |
| —
|
|
| | | | | | Probability-Weighted Expected Return Model | | Discount Rate2 | | 20% | | | — | |
| | | | | | | | IPO Exit Probablility2 | | 65% | | | — | |
| | | | | | | | Revenue Multiple1 | | 11.50x – 15.50x | | | — | |
| | | | | | | | Revenue Growth Rate1 | | 68.70% | | | — | |
| | | | | | | | Years to Exit2 | | 1-2 | | | — | |
Corporate Bonds3 | | | 309,301,092 | | | Discounted Cash Flow | | Discount rate2 | | 15.00% | | | — | |
| | | | | | Estimated Recovery Value | | Recovery Rate1 | | — | | | — | |
| | | | | | Market Comparable Companies | | Run Rate EBITDA Multiple1 | | 20.50x | | | — | |
| | | | | | Hybrid Approach | | Revenue Multiple1 | | 1.75x – 2.25x | | | — | |
| | | | | | | | Risk Free Rate2 | | 0.75% | | | — | |
| | | | | | | | Merger & Acquisition Probability | | 80% | | | — | |
| | | | | | | | Volatility1 | | 52.00% | | | — | |
| | | | | | | | Discount Rate | | 30.00% | | | — | |
| | | | | | | | Years to Exit2 | | 1-2 | | | — | |
Preferred Stocks | | | 619,340,600 | | | Market Comparable Companies | | Revenue Growth Rate1 | | 372.80% | | | — | |
| | | | | | | | Revenue Multiple1 | | 27.50% | | | — | |
| | | | | | | | Revenue Multiple1 | | 22.00x | | | — | |
| | | | | | | | Revenue Growth Rate1 | | 64.10% – 94.00% | | | 79.90 | % |
| | | | | | | | Revenue Multiple1 | | 6.50x | | | — | |
| | | | | | Probability-Weighted Expected Return Model | | Discount rate2 | | 20.00% – 25.00% | | | — | |
| | | | | | | | IPO Exit Probablility2 | | 65.00% – 85.00% | | | 75.84 | % |
| | | | | | | | Revenue Multiple1 | | 7.50x – 15.75x | | | 12.37 | x |
| | | | | | | | Revenue Growth Rate1 | | 68.70% | | | — | |
| | | | | | | | Revenue Growth Rate1 | | 159.00% – 182.00% | | | 164.87 | % |
| | | | | | | | Years to Exit2 | | 1-2 | | | — | |
| | | | | | | | Revenue Multiple1 | | 16.75x – 26.75x | | | — | |
| | | | | | | | | | | | | | |
Total | | $ | 968,071,624 | | | | | | | | | | | |
| | | | | | | | | | | | | | |
1 Increase in unobservable input may result in a significant increase to value, while a decrease in unobservable input may result in a significant decrease to value. | |
2 Decrease in unobservable input may result in a significant increase to value, while an increase in unobservable input may result in a significant decrease to value. | |
3 For the period ended October 31, 2015, the valuation technique for certain investments classified as corporate bonds changed to a Hybrid Approach. The investment was previously valued utilizing a market comparable company and option pricing model approach. A Hybrid Approach was considered to be a more relevant measure of fair value for this investment which leverages the market comparable company and option pricing model approach previously used along with a Probability-Weighted Expected Return Model. | |
See Notes to Consolidated Financial Statements.
| | | | | | |
| | | | | | | |
| | BLACKROCK GLOBAL ALLOCATION FUND, INC. | | OCTOBER 31, 2015 | | 33 |
| | |
| Consolidated Statement of Assets and Liabilities | | |
| | | | |
| October 31, 2015 | | | |
| | | | |
| Assets | | | | |
Investments at value — unaffiliated (including securities loaned at value of $486,201,795) (cost — $48,654,131,314) | | $ | 51,942,466,281 | |
Investments at value — affiliated (cost — $1,198,997,212) | | | 1,128,550,848 | |
Cash held for investments sold short | | | 142,379,928 | |
Cash pledged for centrally cleared swaps | | | 56,469,130 | |
Foreign currency at value (cost — $2,488,833) | | | 2,725,677 | |
| Receivables: | | | | |
Investments sold | | | 550,802,894 | |
Interest | | | 126,521,873 | |
Dividends | | | 72,846,205 | |
Capital shares sold | | | 58,156,642 | |
Options written | | | 49,887,023 | |
Securities lending income — affiliated | | | 949,119 | |
Swaps | | | 853,663 | |
| Unrealized appreciation on: | | | | |
Forward foreign currency exchange contracts | | | 29,417,304 | |
OTC swaps | | | 24,658,054 | |
Variation margin receivable on centrally cleared swaps | | | 5,046,169 | |
Variation margin receivable on financial futures contracts | | | 4,629,257 | |
Prepaid expenses | | | 359,219 | |
| | | | |
Total assets | | | 54,196,719,286 | |
| | | | |
| | | | |
| Liabilities | | | | |
Bank overdraft | | | 231,000 | |
Collateral on securities loaned at value | | | 497,499,535 | |
Cash received as collateral for OTC derivatives | | | 208,450,000 | |
Options written at value (premiums received — $199,482,757) | | | 173,011,677 | |
Investments sold short at value (proceeds — $147,743,718) | | | 155,989,049 | |
| Payables: | | | | |
Investments purchased | | | 1,222,757,137 | |
Capital shares redeemed | | | 91,625,195 | |
Investment advisory fees | | | 29,180,710 | |
Other accrued expenses | | | 18,840,729 | |
Options written | | | 17,966,041 | |
Service and distribution fees | | | 15,982,103 | |
Dividends on short sales | | | 871,592 | |
Swaps | | | 146,957 | |
Officer’s and Directors’ fees | | | 118,265 | |
Deferred foreign capital gain tax | | | 36,307 | |
Other affiliates | | | 12,827 | |
Swap premiums received | | | 18,117 | |
| Unrealized depreciation on: | | | | |
Forward foreign currency exchange contracts | | | 66,573,575 | |
OTC swaps | | | 5,794,923 | |
Variation margin payable on centrally cleared swaps | | | 1,505,070 | |
| | | | |
Total liabilities | | | 2,506,610,809 | |
| | | | |
Net Assets | | $ | 51,690,108,477 | |
| | | | |
| | | | |
| | | | | | |
| See Notes to Consolidated Financial Statements. | | | | |
| | | | | | | |
| 34 | | BLACKROCK GLOBAL ALLOCATION FUND, INC. | | OCTOBER 31, 2015 | | |
| | |
| Consolidated Statement of Assets and Liabilities (concluded) | | |
| | | | |
| Net Assets Consist of | | | | |
Paid-in capital | | $ | 45,208,482,929 | |
Distributions in excess of net investment income | | | (56,817,703 | ) |
Accumulated net realized gain | | | 3,376,747,143 | |
Net unrealized appreciation (depreciation) | | | 3,161,696,108 | |
| | | | |
Net Assets | | $ | 51,690,108,477 | |
| | | | |
| | | | |
| Net Asset Value | | | | |
Institutional — Based on net assets of $20,210,226,390 and 1,016,829,180 shares outstanding, 2 billion shares authorized, $0.10 par value | | $ | 19.88 | |
| | | | |
Investor A — Based on net assets of $16,016,233,865 and 810,601,639 shares outstanding, 2 billion shares authorized, $0.10 par value | | $ | 19.76 | |
| | | | |
Investor B — Based on net assets of $191,881,059 and 9,966,564 shares outstanding, 1.5 billion shares authorized, $0.10 par value. | | $ | 19.25 | |
| | | | |
Investor C — Based on net assets of $14,085,088,776 and 777,771,333 shares outstanding, 2 billion shares authorized, $0.10 par value | | $ | 18.11 | |
| | | | |
Class R — Based on net assets of $1,186,678,387 and 62,572,728 shares outstanding, 2 billion shares authorized, $0.10 par value | | $ | 18.96 | |
| | | | |
| | | | | | |
| See Notes to Consolidated Financial Statements. | | | | |
| | | | | | | |
| | BLACKROCK GLOBAL ALLOCATION FUND, INC. | | OCTOBER 31, 2015 | | 35 |
| | |
| Consolidated Statement of Operations | | |
| | | | |
| Year Ended October 31, 2015 | | | |
| | | | |
| Investment Income | |
Dividends — unaffiliated | | $ | 653,156,331 | |
Interest — unaffiliated | | | 494,017,564 | |
Securities lending — affiliated — net | | | 7,628,864 | |
Dividends — affiliated | | | 15,609 | |
Foreign taxes withheld | | | (34,297,786 | ) |
| | | | |
Total income | | | 1,120,520,582 | |
| | | | |
| | | | |
| Expenses | | | | |
Investment advisory | | | 407,768,884 | |
Service — Investor A | | | 42,509,970 | |
Service and distribution — Investor B | | | 2,601,326 | |
Service and distribution — Investor C | | | 150,877,080 | |
Service and distribution — Class R | | | 6,084,363 | |
Transfer agent — Institutional | | | 17,696,794 | |
Transfer agent — Investor A | | | 17,474,447 | |
Transfer agent — Investor B | | | 351,755 | |
Transfer agent — Investor C | | | 14,183,988 | |
Transfer agent — Class R | | | 2,397,485 | |
Custodian | | | 6,352,073 | |
Accounting services | | | 5,571,070 | |
Professional | | | 1,261,629 | |
Officer and Directors | | | 754,532 | |
Printing | | | 651,958 | |
Registration | | | 619,727 | |
Miscellaneous | | | 938,002 | |
| | | | |
Total expenses excluding dividend expense and stock loan fees | | | 678,095,083 | |
Dividend expense | | | 2,512,919 | |
Stock loan fees | | | 14,629 | |
| | | | |
Total expenses | | | 680,622,631 | |
Less fees waived by the Manager | | | (46,194,644 | ) |
| | | | |
Total expenses after fees waived | | | 634,427,987 | |
| | | | |
Net investment income | | | 486,092,595 | |
| | | | |
| | | | |
| Realized and Unrealized Gain (Loss) | | | | |
| Net realized gain (loss) from: | | | | |
Investments — unaffiliated (including $3,498,503 foreign capital gain tax) | | | 2,491,476,843 | |
Investments — affiliated | | | (22,826,184 | ) |
Financial futures contracts | | | 255,293,370 | |
Foreign currency transactions | | | 940,795,754 | |
Options written | | | 115,504,263 | |
Swaps | | | 40,675,534 | |
Short sales | | | (4,766,330 | ) |
| | | | |
| | | 3,816,153,250 | |
| | | | |
| Net change in unrealized appreciation (depreciation) on: | | | | |
Investments — unaffiliated (including $36,307 foreign capital gain tax) | | | (4,174,298,902 | ) |
Investments — affiliated | | | 36,373,871 | |
Financial futures contracts | | | (57,668,334 | ) |
Foreign currency translations | | | (214,318,630 | ) |
Options written | | | 81,401,985 | |
Swaps | | | 9,375,925 | |
Short sales | | | (8,014,576 | ) |
| | | | |
| | | (4,327,148,661 | ) |
| | | | |
Net realized and unrealized loss | | | (510,995,411 | ) |
| | | | |
Net Decrease in Net Assets Resulting from Operations | | $ | (24,902,816 | ) |
| | | | |
| | | | | | |
| See Notes to Consolidated Financial Statements. | | | | |
| | | | | | | |
| 36 | | BLACKROCK GLOBAL ALLOCATION FUND, INC. | | OCTOBER 31, 2015 | | |
| | |
| Consolidated Statements of Changes in Net Assets | | |
| | | | | | | | |
| | | Year Ended October 31, | |
| Increase (Decrease) in Net Assets: | | 2015 | | | 2014 | |
| | | | | | | | |
| Operations | | | | | | | | |
Net investment income | | $ | 486,092,595 | | | $ | 712,386,073 | |
Net realized gain | | | 3,816,153,250 | | | | 4,133,411,709 | |
Net change in unrealized appreciation (depreciation) | | | (4,327,148,661 | ) | | | (2,009,738,629 | ) |
| | | | | | | | |
Net increase (decrease) in net assets resulting from operations | | | (24,902,816 | ) | | | 2,836,059,153 | |
| | | | | | | | |
| | | | | | | | |
| Distributions to Shareholders1 | | | | | | | | |
| From net investment income: | |
Institutional | | | (446,831,157 | ) | | | (327,137,897 | ) |
Investor A | | | (319,418,730 | ) | | | (241,707,008 | ) |
Investor B | | | (3,234,467 | ) | | | (1,624,272 | ) |
Investor C | | | (198,975,386 | ) | | | (108,337,878 | ) |
Class R | | | (19,546,643 | ) | | | (12,766,828 | ) |
| Net realized gain: | | | | | | | | |
Institutional | | | (1,447,355,150 | ) | | | (923,415,222 | ) |
Investor A | | | (1,191,743,896 | ) | | | (833,382,646 | ) |
Investor B | | | (21,915,871 | ) | | | (21,372,435 | ) |
Investor C | | | (1,159,361,959 | ) | | | (768,908,083 | ) |
Class R | | | (88,285,445 | ) | | | (59,125,782 | ) |
| | | | | | | | |
Decrease in net assets resulting from distributions to shareholders | | | (4,896,668,704 | ) | | | (3,297,778,051 | ) |
| | | | | | | | |
| | | | | | | | |
| Capital Share Transactions | | | | | | | | |
Net increase (decrease) in net assets derived from capital share transactions | | | (838,291,796 | ) | | | 117,188,082 | |
| | | | | | | | |
| | | | | | | | |
| Net Assets | | | | | | | | |
Total decrease in net assets | | | (5,759,863,316 | ) | | | (344,530,816 | ) |
Beginning of year | | | 57,449,971,793 | | | | 57,794,502,609 | |
| | | | | | | | |
End of year | | $ | 51,690,108,477 | | | $ | 57,449,971,793 | |
| | | | | | | | |
Undistributed (distributions in excess of) net investment income, end of year | | $ | (56,817,703 | ) | | $ | 251,647,130 | |
| | | | | | | | |
| | 1 | | Distributions for annual periods determined in accordance with federal income tax regulations. |
| | | | | | |
| See Notes to Consolidated Financial Statements. | | | | |
| | | | | | | |
| | BLACKROCK GLOBAL ALLOCATION FUND, INC. | | OCTOBER 31, 2015 | | 37 |
| | |
| Consolidated Financial Highlights | | |
| | | | | | | | | | | | | | | | | | | | |
| | | Institutional | |
| | | Year Ended October 31, | |
| | | 2015 | | | 2014 | | | 2013 | | | 2012 | | | 2011 | |
| | | | | | | | | | | | | | | | | | | | |
| Per Share Operating Performance | | | | | | | | | | | | | | | | | | | | |
Net asset value, beginning of year | | $ | 21.77 | | | $ | 21.95 | | | $ | 19.54 | | | $ | 19.16 | | | $ | 19.07 | |
| | | | |
Net investment income1 | | | 0.26 | | | | 0.35 | | | | 0.28 | | | | 0.31 | | | | 0.38 | |
Net realized and unrealized gain (loss) | | | (0.22 | ) | | | 0.77 | | | | 2.43 | | | | 0.64 | | | | 0.08 | 2 |
| | | | |
Net increase from investment operations | | | 0.04 | | | | 1.12 | | | | 2.71 | | | | 0.95 | | | | 0.46 | |
| | | | |
| Distributions:3 | | | | | | | | | | | | | | | | | | | | |
From net investment income | | | (0.45 | ) | | | (0.33 | ) | | | (0.30 | ) | | | (0.38 | ) | | | (0.37 | ) |
From net realized gain | | | (1.48 | ) | | | (0.97 | ) | | | — | | | | (0.19 | ) | | | — | |
| | | | |
Total distributions | | | (1.93 | ) | | | (1.30 | ) | | | (0.30 | ) | | | (0.57 | ) | | | (0.37 | ) |
| | | | |
Net asset value, end of year | | $ | 19.88 | 4 | | $ | 21.77 | | | $ | 21.95 | | | $ | 19.54 | | | $ | 19.16 | |
| | | | |
| | | | | | | | | | | | | | | | | | | | |
| Total Return5 | | | | | | | | | | | | | | | | | | | | |
Based on net asset value | | | 0.31% | 4 | | | 5.35% | | | | 13.97% | | | | 5.20% | | | | 2.39% | |
| | | | |
| | | | | | | | | | | | | | | | | | | | |
| Ratios to Average Net Assets | | | | | | | | | | | | | | | | | | | | |
Total expenses | | | 0.87% | | | | 0.87% | | | | 0.87% | | | | 0.87% | | | | 0.87% | |
| | | | |
Total expenses after fees waived | | | 0.78% | | | | 0.78% | | | | 0.78% | | | | 0.79% | | | | 0.78% | |
| | | | |
Total expenses after fees waived and excluding interest expense, dividend expense and stock loan fees | | | 0.78% | | | | 0.78% | | | | 0.78% | | | | 0.79% | | | | 0.78% | |
| | | | |
Net investment income | | | 1.28% | | | | 1.60% | | | | 1.35% | | | | 1.61% | | | | 1.92% | |
| | | | |
| | | | | | | | | | | | | | | | | | | | |
| Supplemental Data | | | | | | | | | | | | | | | | | | | | |
Net assets, end of year (000) | | $ | 20,210,226 | | | $ | 22,075,330 | | | $ | 20,968,279 | | | $ | 18,657,773 | | | $ | 16,879,389 | |
| | | | |
Portfolio turnover rate6 | | | 84% | | | | 75% | | | | 50% | | | | 39% | | | | 31% | |
| | | | |
| | 1 | | Based on average shares outstanding. |
| | 2 | | Includes a redemption fee, which is less than $0.01 per share. |
| | 3 | | Distributions for annual periods determined in accordance with federal income tax regulations. |
| | 4 | | For financial reporting purposes, the market value of certain investments was adjusted as of the report date. Accordingly, the NAV per share and total return performance based on NAV presented herein are different than the information previously published on October 31, 2015. |
| | 5 | | Where applicable, assumes the reinvestment of distributions. |
| | 6 | | Includes mortgage dollar roll transactions (“MDRs”). Additional information regarding portfolio turnover rate is as follows: |
| | | | | | | | | | | | | | | | | | | | |
| | | Year Ended October 31, | |
| | | 2015 | | | 2014 | | | 2013 | | | 2012 | | | 2011 | |
| | | | | | | | | | | | | | | | | | | | |
Portfolio turnover rate (excluding MDRs) | | | 82% | | | | — | | | | — | | | | — | | | | — | |
| | | | | | | | | | | | | | | | | | | | |
| | | | | | |
| See Notes to Consolidated Financial Statements. | | | | |
| | | | | | | |
| 38 | | BLACKROCK GLOBAL ALLOCATION FUND, INC. | | OCTOBER 31, 2015 | | |
| | |
| Consolidated Financial Highlights (continued) | | |
| | | | | | | | | | | | | | | | | | | | |
| | | Investor A | |
| | | Year Ended October 31, | |
| | | 2015 | | | 2014 | | | 2013 | | | 2012 | | | 2011 | |
| | | | | | | | | | | | | | | | | | | | |
| Per Share Operating Performance | | | | | | | | | | | | | | | | | | | | |
Net asset value, beginning of year | | $ | 21.65 | | | $ | 21.83 | | | $ | 19.44 | | | $ | 19.06 | | | $ | 18.97 | |
| | | | |
Net investment income1 | | | 0.21 | | | | 0.29 | | | | 0.22 | | | | 0.25 | | | | 0.32 | |
Net realized and unrealized gain (loss) | | | (0.23 | ) | | | 0.77 | | | | 2.41 | | | | 0.65 | | | | 0.09 | 2 |
| | | | |
Net increase (decrease) from investment operations | | | (0.02 | ) | | | 1.06 | | | | 2.63 | | | | 0.90 | | | | 0.41 | |
| | | | |
| Distributions:3 | | | | | | | | | | | | | | | | | | | | |
From net investment income | | | (0.39 | ) | | | (0.27 | ) | | | (0.24 | ) | | | (0.33 | ) | | | (0.32 | ) |
From net realized gain | | | (1.48 | ) | | | (0.97 | ) | | | — | | | | (0.19 | ) | | | — | |
| | | | |
Total distributions | | | (1.87 | ) | | | (1.24 | ) | | | (0.24 | ) | | | (0.52 | ) | | | (0.32 | ) |
| | | | |
Net asset value, end of year | | $ | 19.76 | 4 | | $ | 21.65 | | | $ | 21.83 | | | $ | 19.44 | | | $ | 19.06 | |
| | | | |
| | | | | | | | | | | | | | | | | | | | |
| Total Return5 | | | | | | | | | | | | | | | | | | | | |
Based on net asset value | | | 0.02% | 4 | | | 5.10% | | | | 13.63% | | | | 4.92% | | | | 2.13% | |
| | | | |
| | | | | | | | | | | | | | | | | | | | |
| Ratios to Average Net Assets | | | | | | | | | | | | | | | | | | | | |
Total expenses | | | 1.14% | | | | 1.13% | | | | 1.13% | | | | 1.15% | | | | 1.14% | |
| | | | |
Total expenses after fees waived | | | 1.05% | | | | 1.04% | | | | 1.05% | | | | 1.07% | | | | 1.06% | |
| | | | |
Total expenses after fees waived and excluding interest expense, dividend expense and stock loan fees | | | 1.05% | | | | 1.04% | | | | 1.05% | | | | 1.07% | | | | 1.06% | |
| | | | |
Net investment income | | | 1.01% | | | | 1.33% | | | | 1.08% | | | | 1.33% | | | | 1.63% | |
| | | | |
| | | | | | | | | | | | | | | | | | | | |
| Supplemental Data | | | | | | | | | | | | | | | | | | | | |
Net assets, end of year (000) | | $ | 16,016,234 | | | $ | 17,792,885 | | | $ | 18,858,846 | | | $ | 17,292,587 | | | $ | 17,638,914 | |
| | | | |
Portfolio turnover rate6 | | | 84% | | | | 75% | | | | 50% | | | | 39% | | | | 31% | |
| | | | |
| | 1 | | Based on average shares outstanding. |
| | 2 | | Includes a redemption fee, which is less than $0.01 per share. |
| | 3 | | Distributions for annual periods determined in accordance with federal income tax regulations. |
| | 4 | | For financial reporting purposes, the market value of certain investments was adjusted as of the report date. Accordingly, the NAV per share and total return performance based on NAV presented herein are different than the information previously published on October 31, 2015. |
| | 5 | | Where applicable, excludes the effects of any sales charges and assumes the reinvestment of distributions. |
| | 6 | | Includes MDRs. Additional information regarding portfolio turnover rate is as follows: |
| | | | | | | | | | | | | | | | | | | | |
| | | Year Ended October 31, | |
| | | 2015 | | | 2014 | | | 2013 | | | 2012 | | | 2011 | |
| | | | | | | | | | | | | | | | | | | | |
Portfolio turnover rate (excluding MDRs) | | | 82% | | | | — | | | | — | | | | — | | | | — | |
| | | | | | | | | | | | | | | | | | | | |
| | | | | | |
| See Notes to Consolidated Financial Statements. | | | | |
| | | | | | | |
| | BLACKROCK GLOBAL ALLOCATION FUND, INC. | | OCTOBER 31, 2015 | | 39 |
| | |
| Consolidated Financial Highlights (continued) | | |
| | | | | | | | | | | | | | | | | | | | |
| | | Investor B | |
| | | Year Ended October 31, | |
| | | 2015 | | | 2014 | | | 2013 | | | 2012 | | | 2011 | |
| | | | | | | | | | | | | | | | | | | | |
| Per Share Operating Performance | | | | | | | | | | | | | | | | | | | | |
Net asset value, beginning of year | | $ | 21.13 | | | $ | 21.31 | | | $ | 18.96 | | | $ | 18.57 | | | $ | 18.49 | |
| | | | |
Net investment income1 | | | 0.04 | | | | 0.11 | | | | 0.06 | | | | 0.09 | | | | 0.10 | |
Net realized and unrealized gain (loss) | | | (0.22 | ) | | | 0.76 | | | | 2.35 | | | | 0.65 | | | | 0.14 | 2 |
| | | | |
Net increase (decrease) from investment operations | | | (0.18 | ) | | | 0.87 | | | | 2.41 | | | | 0.74 | | | | 0.24 | |
| | | | |
| Distributions:3 | | | | | | | | | | | | | | | | | | | | |
From net investment income | | | (0.22 | ) | | | (0.08 | ) | | | (0.06 | ) | | | (0.16 | ) | | | (0.16 | ) |
From net realized gain | | | (1.48 | ) | | | (0.97 | ) | | | — | | | | (0.19 | ) | | | — | |
| | | | |
Total distributions | | | (1.70 | ) | | | (1.05 | ) | | | (0.06 | ) | | | (0.35 | ) | | | (0.16 | ) |
| | | | |
Net asset value, end of year | | $ | 19.25 | 4 | | $ | 21.13 | | | $ | 21.31 | | | $ | 18.96 | | | $ | 18.57 | |
| | | | |
| | | | | | | | | | | | | | | | | | | | |
| Total Return5 | | | | | | | | | | | | | | | | | | | | |
Based on net asset value | | | (0.82)%4 | | | | 4.27% | | | | 12.75% | | | | 4.10% | | | | 1.25% | |
| | | | |
| | | | | | | | | | | | | | | | | | | | |
| Ratios to Average Net Assets | | | | | | | | | | | | | | | | | | | | |
Total expenses | | | 1.92% | | | | 1.93% | | | | 1.95% | | | | 1.95% | | | | 1.97% | |
| | | | |
Total expenses after fees waived | | | 1.84% | | | | 1.84% | | | | 1.86% | | | | 1.86% | | | | 1.87% | |
| | | | |
Total expenses after fees waived and excluding interest expense, dividend expense and stock loan fees | | | 1.84% | | | | 1.84% | | | | 1.86% | | | | 1.86% | | | | 1.87% | |
| | | | |
Net investment income | | | 0.22% | | | | 0.54% | | | | 0.28% | | | | 0.51% | | | | 0.50% | |
| | | | |
| | | | | | | | | | | | | | | | | | | | |
| Supplemental Data | | | | | | | | | | | | | | | | | | | | |
Net assets, end of year (000) | | $ | 191,881 | | | $ | 335,683 | | | $ | 500,197 | | | $ | 660,370 | | | $ | 930,028 | |
| | | | |
Portfolio turnover rate6 | | | 84% | | | | 75% | | | | 50% | | | | 39% | | | | 31% | |
| | | | |
| | 1 | | Based on average shares outstanding. |
| | 2 | | Includes a redemption fee, which is less than $0.01 per share. |
| | 3 | | Distributions for annual periods determined in accordance with federal income tax regulations. |
| | 4 | | For financial reporting purposes, the market value of certain investments was adjusted as of the report date. Accordingly, the NAV per share and total return performance based on NAV presented herein are different than the information previously published on October 31, 2015. |
| | 5 | | Where applicable, excludes the effects of any sales charges and assumes the reinvestment of distributions. |
| | 6 | | Includes MDRs. Additional information regarding portfolio turnover rate is as follows: |
| | | | | | | | | | | | | | | | | | | | |
| | | Year Ended October 31, | |
| | | 2015 | | | 2014 | | | 2013 | | | 2012 | | | 2011 | |
| | | | | | | | | | | | | | | | | | | | |
Portfolio turnover rate (excluding MDRs) | | | 82% | | | | — | | | | — | | | | — | | | | — | |
| | | | | | | | | | | | | | | | | | | | |
| | | | | | |
| See Notes to Consolidated Financial Statements. | | | | |
| | | | | | | |
| 40 | | BLACKROCK GLOBAL ALLOCATION FUND, INC. | | OCTOBER 31, 2015 | | |
| | |
| Consolidated Financial Highlights (continued) | | |
| | | | | | | | | | | | | | | | | | | | |
| | | Investor C | |
| | | Year Ended October 31, | |
| | | 2015 | | | 2014 | | | 2013 | | | 2012 | | | 2011 | |
| | | | | | | | | | | | | | | | | | | | |
| Per Share Operating Performance | | | | | | | | | | | | | | | | | | | | |
Net asset value, beginning of year | | $ | 20.00 | | | $ | 20.27 | | | $ | 18.06 | | | $ | 17.75 | | | $ | 17.70 | |
| | | | |
Net investment income1 | | | 0.05 | | | | 0.12 | | | | 0.06 | | | | 0.10 | | | | 0.16 | |
Net realized and unrealized gain (loss) | | | (0.21 | ) | | | 0.71 | | | | 2.26 | | | | 0.59 | | | | 0.08 | 2 |
| | | | |
Net increase (decrease) from investment operations | | | (0.16 | ) | | | 0.83 | | | | 2.32 | | | | 0.69 | | | | 0.24 | |
| | | | |
| Distributions:3 | | | | | | | | | | | | | | | | | | | | |
From net investment income | | | (0.25 | ) | | | (0.13 | ) | | | (0.11 | ) | | | (0.19 | ) | | | (0.19 | ) |
From net realized gain | | | (1.48 | ) | | | (0.97 | ) | | | — | | | | (0.19 | ) | | | — | |
| | | | |
Total distributions | | | (1.73 | ) | | | (1.10 | ) | | | (0.11 | ) | | | (0.38 | ) | | | (0.19 | ) |
| | | | |
Net asset value, end of year | | $ | 18.11 | 4 | | $ | 20.00 | | | $ | 20.27 | | | $ | 18.06 | | | $ | 17.75 | |
| | | | |
| | | | | | | | | | | | | | | | | | | | |
| Total Return5 | | | | | | | | | | | | | | | | | | | | |
Based on net asset value | | | (0.73)%4 | | | | 4.29% | | | | 12.86% | | | | 4.08% | | | | 1.34% | |
| | | | |
| | | | | | | | | | | | | | | | | | | | |
| Ratios to Average Net Assets | | | | | | | | | | | | | | | | | | | | |
Total expenses | | | 1.88% | | | | 1.87% | | | | 1.88% | | | | 1.90% | | | | 1.90% | |
| | | | |
Total expenses after fees waived | | | 1.79% | | | | 1.79% | | | | 1.80% | | | | 1.82% | | | | 1.81% | |
| | | | |
Total expenses after fees waived and excluding interest expense, dividend expense and stock loan fees | | | 1.79% | | | | 1.79% | | | | 1.80% | | | | 1.82% | | | | 1.81% | |
| | | | |
Net investment income | | | 0.27% | | | | 0.59% | | | | 0.33% | | | | 0.58% | | | | 0.89% | |
| | | | |
| | | | | | | | | | | | | | | | | | | | |
| Supplemental Data | | | | | | | | | | | | | | | | | | | | |
Net assets, end of year (000) | | $ | 14,085,089 | | | $ | 15,976,240 | | | $ | 16,170,658 | | | $ | 15,179,009 | | | $ | 15,853,615 | |
| | | | |
Portfolio turnover rate6 | | | 84% | | | | 75% | | | | 50% | | | | 39% | | | | 31% | |
| | | | |
| | 1 | | Based on average shares outstanding. |
| | 2 | | Includes a redemption fee, which is less than $0.01 per share. |
| | 3 | | Distributions for annual periods determined in accordance with federal income tax regulations. |
| | 4 | | For financial reporting purposes, the market value of certain investments was adjusted as of the report date. Accordingly, the NAV per share and total return performance based on NAV presented herein are different than the information previously published on October 31, 2015. |
| | 5 | | Where applicable, excludes the effects of any sales charges and assumes the reinvestment of distributions. |
| | 6 | | Includes MDRs. Additional information regarding portfolio turnover rate is as follows: |
| | | | | | | | | | | | | | | | | | | | |
| | | Year Ended October 31, | |
| | | 2015 | | | 2014 | | | 2013 | | | 2012 | | | 2011 | |
| | | | | | | | | | | | | | | | | | | | |
Portfolio turnover rate (excluding MDRs) | | | 82% | | | | — | | | | — | | | | — | | | | — | |
| | | | | | | | | | | | | | | | | | | | |
| | | | | | |
| See Notes to Consolidated Financial Statements. | | | | |
| | | | | | | |
| | BLACKROCK GLOBAL ALLOCATION FUND, INC. | | OCTOBER 31, 2015 | | 41 |
| | |
| Consolidated Financial Highlights (concluded) | | |
| | | | | | | | | | | | | | | | | | | | |
| | | Class R | |
| | | Year Ended October 31, | |
| | | 2015 | | | 2014 | | | 2013 | | | 2012 | | | 2011 | |
| | | | | | | | | | | | | | | | | | | | |
| Per Share Operating Performance | | | | | | | | | | | | | | | | | | | | |
Net asset value, beginning of year | | $ | 20.86 | | | $ | 21.08 | | | $ | 18.78 | | | $ | 18.44 | | | $ | 18.36 | |
| | | | |
Net investment income1 | | | 0.13 | | | | 0.21 | | | | 0.15 | | | | 0.18 | | | | 0.21 | |
Net realized and unrealized gain (loss) | | | (0.22 | ) | | | 0.74 | | | | 2.33 | | | | 0.62 | | | | 0.13 | 2 |
| | | | |
Net increase (decrease) from investment operations | | | (0.09 | ) | | | 0.95 | | | | 2.48 | | | | 0.80 | | | | 0.34 | |
| | | | |
| Distributions:3 | | | | | | | | | | | | | | | | | | | | |
From net investment income | | | (0.33 | ) | | | (0.20 | ) | | | (0.18 | ) | | | (0.27 | ) | | | (0.26 | ) |
From net realized gain | | | (1.48 | ) | | | (0.97 | ) | | | — | | | | (0.19 | ) | | | — | |
| | | | |
Total distributions | | | (1.81 | ) | | | (1.17 | ) | | | (0.18 | ) | | | (0.46 | ) | | | (0.26 | ) |
| | | | |
Net asset value, end of year | | $ | 18.96 | 4 | | $ | 20.86 | | | $ | 21.08 | | | $ | 18.78 | | | $ | 18.44 | |
| | | | |
| | | | | | | | | | | | | | | | | | | | |
| Total Return5 | | | | | | | | | | | | | | | | | | | | |
Based on net asset value | | | (0.37)%4 | | | | 4.73% | | | | 13.26% | | | | 4.52% | | | | 1.84% | |
| | | | |
| | | | | | | | | | | | | | | | | | | | |
| Ratios to Average Net Assets | | | | | | | | | | | | | | | | | | | | |
Total expenses | | | 1.48% | | | | 1.47% | | | | 1.48% | | | | 1.51% | | | | 1.47% | |
| | | | |
Total expenses after fees waived | | | 1.40% | | | | 1.38% | | | | 1.39% | | | | 1.43% | | | | 1.38% | |
| | | | |
Total expenses after fees waived and excluding interest expense, dividend expense and stock loan fees | | | 1.40% | | | | 1.38% | | | | 1.39% | | | | 1.43% | | | | 1.38% | |
| | | | |
Net investment income | | | 0.67% | | | | 0.99% | | | | 0.74% | | | | 0.97% | | | | 1.11% | |
| | | | |
| | | | | | | | | | | | | | | | | | | | |
| Supplemental Data | | | | | | | | | | | | | | | | | | | | |
Net assets, end of year (000) | | $ | 1,186,678 | | | $ | 1,269,833 | | | $ | 1,296,522 | | | $ | 1,171,179 | | | $ | 1,077,174 | |
| | | | |
Portfolio turnover rate6 | | | 84% | | | | 75% | | | | 50% | | | | 39% | | | | 31% | |
| | | | |
| | 1 | | Based on average shares outstanding. |
| | 2 | | Includes a redemption fee, which is less than $0.01 per share. |
| | 3 | | Distributions for annual periods determined in accordance with federal income tax regulations. |
| | 4 | | For financial reporting purposes, the market value of certain investments was adjusted as of the report date. Accordingly, the NAV per share and total return performance based on NAV presented herein are different than the information previously published on October 31, 2015. |
| | 5 | | Where applicable, assumes the reinvestment of distributions. |
| | 6 | | Includes MDRs. Additional information regarding portfolio turnover rate is as follows: |
| | | | | | | | | | | | | | | | | | | | |
| | | Year Ended October 31, | |
| | | 2015 | | | 2014 | | | 2013 | | | 2012 | | | 2011 | |
| | | | | | | | | | | | | | | | | | | | |
Portfolio turnover rate (excluding MDRs) | | | 82% | | | | — | | | | — | | | �� | — | | | | — | |
| | | | | | | | | | | | | | | | | | | | |
| | | | | | |
| See Notes to Consolidated Financial Statements. | | | | |
| | | | | | | |
| 42 | | BLACKROCK GLOBAL ALLOCATION FUND, INC. | | OCTOBER 31, 2015 | | |
| | | | |
| Notes to Consolidated Financial Statements | | |
1. Organization:
BlackRock Global Allocation Fund, Inc. (the “Fund”) is registered under the Investment Company Act of 1940, as amended (the “1940 Act”), as a diversified, open-end management investment company. The Fund is organized as a Maryland Corporation.
The Fund offers multiple classes of shares. All classes of shares have identical voting, dividend, liquidation and other rights and are subject to the same terms and conditions, except that certain classes bear expenses related to the shareholder servicing and distribution of such shares. Institutional Shares are sold only to certain eligible investors. Investor B Shares are only available through exchanges and distribution reinvestments by current holders and for purchase by certain employer-sponsored retirement plans. Investor A and Investor C Shares are generally available through financial intermediaries. Class R Shares are available only to certain employer-sponsored retirement plans. Each class has exclusive voting rights with respect to matters relating to its shareholder servicing and distribution expenditures (except that Investor B shareholders may vote on material changes to the Investor A distribution and service plan).
| | | | | | | | | | |
| Share Class | | Initial Sales Charge | | | CDSC | | | Conversion Privilege |
Institutional and Class R Shares | | | No | | | | No | | | None |
Investor A Shares .. | | | Yes | | | | No | 1 | | None |
Investor B Shares | | | No | | | | Yes | | | To Investor A Shares
after approximately
8 years |
Investor C Shares | | | No | | | | Yes | | | None |
| | 1 | | Investor A Shares may be subject to a CDSC where no initial sales charge was paid at the time of purchase. |
The Fund, together with certain other registered investment companies advised by the Manager or its affiliates, is included in a complex of open-end funds referred to as the Equity-Bond Complex.
Basis of Consolidation: The accompanying consolidated financial statements include the account of BlackRock Cayman Global Allocation Fund I, Ltd. (the “Subsidiary”), which is a wholly owned subsidiary of the Fund and primarily invests in commodity-related instruments and other derivatives. The Subsidiary enables the Fund to hold these commodity-related instruments and other derivatives and satisfy regulated investment company tax requirements. The Fund may invest up to 25% of its total assets in the Subsidiary. The accompanying Consolidated Schedule of Investments and Consolidated financial statements of the Fund includes the position and account, respectively, of its Subsidiary. Intercompany accounts and transactions, if any, have been eliminated. The Subsidiary is subject to the same investment policies and restrictions that apply to the Fund, except that the Subsidiary may invest without limitation in commodity-related instruments.
2. Significant Accounting Policies:
The consolidated financial statements are prepared in conformity with accounting principles generally accepted in the United States of America (“U.S. GAAP”), which may require management to make estimates and assumptions that affect the reported amounts of assets and liabilities in the consolidated financial statements, disclosure of contingent assets and liabilities at the date of the consolidated financial statements and the reported amounts of increases and decreases in net assets from operations during the reporting period. Actual results could differ from those estimates. The Fund is considered an investment company under U.S. GAAP and follows the accounting and reporting guidance applicable to investment companies. Below is a summary of significant accounting policies:
Foreign Currency: The Fund’s books and records are maintained in U.S. dollars. Purchases and sales of investments are recorded at the rates of exchange prevailing on the respective date of such transactions. Generally, when the U.S. dollar rises in value against a foreign currency, the investments denominated in that currency will lose value; the opposite effect occurs if the U.S. dollar falls in relative value.
The Fund does not isolate changes in the exchange rates from the changes in the market prices of investments held or sold for financial reporting purposes. Accordingly, the effects of changes in exchange rates on investments are not segregated in the Consolidated Statement of Operations from the effects of changes in market prices of those investments, but are included as a component of net realized and unrealized gain (loss) from investments. The Fund reports realized currency gains (losses) on foreign currency related transactions as components of net realized gain (loss) for financial reporting purposes, whereas such components are generally treated as ordinary income for federal income tax purposes.
Segregation and Collateralization: In cases where the Fund enters into certain investments (e.g., TBA sales commitments, financial futures contracts, forward foreign currency exchange contracts, options written, swaps, and short sales), that would be treated as “senior securities” for 1940 Act purposes, the Fund may segregate or designate on its books and records cash or liquid assets having a market value at least equal to the amount of
| | | | | | |
| | | | | | | |
| | BLACKROCK GLOBAL ALLOCATION FUND, INC. | | OCTOBER 31, 2015 | | 43 |
| | |
| Notes to Consolidated Financial Statements (continued) | | |
the it’s future obligations under such investments. Doing so allows the investment to be excluded from treatment as a “senior security.” Furthermore, if required by an exchange or counterparty agreement, the Fund may be required to deliver/deposit cash and/or securities to/with an exchange, or broker-dealer or custodian as collateral for certain investments or obligations.
Investment Transactions and Investment Income: For financial reporting purposes, investment transactions are recorded on the dates the transactions are entered into (the trade dates). Realized gains and losses on investment transactions are determined on the identified cost basis. Dividend income is recorded on the ex-dividend date. Dividends from foreign securities where the ex-dividend date may have passed are subsequently recorded when the Fund is informed of the ex-dividend date. Under the applicable foreign tax laws, a withholding tax at various rates may be imposed on capital gains, dividends and interest. Upon notification from issuers, some of the dividend income received from a real estate investment trust may be redesignated as a reduction of cost of the related investment and/or realized gain. Interest income, including amortization and accretion of premiums and discounts on debt securities, is recognized on the accrual basis. Income, expenses and realized and unrealized gains and losses are allocated daily to each class based on its relative net assets.
Distributions: Distributions paid by the Fund are recorded on the ex-dividend date. The character and timing of distributions are determined in accordance with federal income tax regulations, which may differ from U.S. GAAP.
Net income and realized gains from investments held by the Subsidiary are treated as ordinary income for tax purposes. If a net loss is realized by the Subsidiary in any taxable year, the loss will generally not be available to offset the Fund’s ordinary income and/or capital gains for that year.
Recent Accounting Standard: In June 2014, the Financial Accounting Standards Board issued guidance to improve the financial reporting of reverse repurchase agreements and other similar transactions. The guidance will require expanded disclosure for entities that enter into reverse repurchase agreements and similar transactions accounted for as secured borrowings. It is effective for financial statements with fiscal years beginning on or after December 15, 2014 and for interim periods beginning after March 15, 2015. Management is evaluating the impact, if any, of this guidance on the Fund’s financial statement disclosures.
Indemnifications: In the normal course of business, the Fund enters into contracts that contain a variety of representations that provide general indemnification. The Fund’s maximum exposure under these arrangements is unknown because it involves future potential claims against the Fund, which cannot be predicted with any certainty.
Other: Expenses directly related to the Fund or its classes are charged to the Fund or the applicable class. Other operating expenses shared by several funds, including other funds managed by the Manager, are prorated among those funds on the basis of relative net assets or other appropriate methods. Expenses directly related to the Fund and other shared expenses prorated to the Fund are allocated daily to each class based on its relative net assets or other appropriate methods.
The Fund an arrangement with its custodian whereby fees may be reduced by credits earned on uninvested cash balances, which, if applicable, are shown as fees paid indirectly in the Consolidated Statement of Operations. The custodian imposes fees on overdrawn cash balances, which can be offset by accumulated credits earned or may result in additional custody charges. Effective September 2015, the arrangement with its custodian for earning credits on uninvested cash balances has ceased and the custodian will be imposing fees on certain uninvested cash balances.
3. Investment Valuation and Fair Value Measurements:
Investment Valuation Policies: The Fund’s investments are valued at fair value (also referred to as “market value” within the financial statements) as of the close of trading on the New York Stock Exchange (“NYSE”) (generally 4:00 p.m., Eastern time) (or if the reporting date falls on a day the NYSE is closed, investments are valued at fair value as of the report date). U.S. GAAP defines fair value as the price the Fund would receive to sell an asset or pay to transfer a liability in an orderly transaction between market participants at the measurement date. The Fund determines the fair values of its financial instruments using independent dealers or pricing services under policies approved by the Board of Directors of the Fund (the “Board”). The Global Valuation Committee is the committee formed by management to develop global pricing policies and procedures and to provide oversight of the pricing function for the Fund for all financial instruments.
Fair Value Inputs and Methodologies: The following methods (or “techniques”) and inputs are used to establish the fair value of the Fund’s assets and liabilities:
| • | | Bond investments are valued on the basis of last available bid prices or current market quotations provided by dealers or pricing services. Floating rate loan interests are valued at the mean of the bid prices from one or more brokers or dealers as obtained from a pricing service. In determining the |
| | | | | | |
| | | | | | | |
| 44 | | BLACKROCK GLOBAL ALLOCATION FUND, INC. | | OCTOBER 31, 2015 | | |
| | | | |
| Notes to Consolidated Financial Statements (continued) | | |
| | value of a particular investment, pricing services may use certain information with respect to transactions in such investments, quotations from dealers, pricing matrixes, market transactions in comparable investments, various relationships observed in the market between investments and calculated yield measures. Asset-backed and mortgage-backed securities are valued by independent pricing services using models that consider estimated cash flows of each tranche of the security, establish a benchmark yield and develop an estimated tranche-specific spread to the benchmark yield based on the unique attributes of the tranche. |
| • | | Equity investments traded on a recognized securities exchange are valued at the official close price each day, if available. For equity investments traded on more than one exchange, the official close price on the exchange where the stock is primarily traded is used. Equity investments traded on a recognized exchange for which there were no sales on that day may be valued at the last available bid (long positions) or ask (short positions) price. |
| • | | Generally, trading in foreign instruments is substantially completed each day at various times prior to the close of business on the NYSE. Occasionally, events affecting the values of such instruments may occur between the foreign market close and the close of business on the NYSE that may not be reflected in the computation of the Fund’s net assets. Each business day, the Fund uses a pricing service to assist with the valuation of certain foreign exchange-traded equity securities and foreign exchange-traded and Over-the–Counter (“OTC”) options (the “Systematic Fair Value Price”). Using current market factors, the Systematic Fair Value Price is designed to value such foreign securities and foreign options at fair value as of the close of business on the NYSE, which follows the close of the local markets. |
| • | | Investments in open-end registered investment companies are valued at NAV each business day. |
| • | | The Fund values its investment in BlackRock Liquidity Series, LLC, Money Market Series (the “Money Market Series”) at fair value, which is ordinarily based upon its pro rata ownership in the underlying fund’s net assets. The Money Market Series seeks current income consistent with maintaining liquidity and preserving capital. Although the Money Market Series is not registered under the 1940 Act, its investments will follow the parameters of investments by a money market fund that is subject to Rule 2a-7 under the 1940 Act. The Fund may withdraw up to 25% of its investment daily, although the manager of the Money Market Series, in its sole discretion, may permit an investor to withdraw more than 25% on any one day. |
| • | | Credit-Linked Notes are valued utilizing quotes received daily by the Fund’s pricing service or through brokers. The Fund’s pricing service utilizes daily credit curves and valuation models that incorporate a number of market data factors, such as the performance of reference entities, trades and price of the underlying reference instruments. |
| • | | Financial futures contracts traded on exchanges are valued at their last sale price. |
| • | | Securities and other assets and liabilities denominated in foreign currencies are translated into U.S. dollars using exchange rates determined as of the close of business on the NYSE. Forward foreign currency exchange contracts are valued at the mean between the bid and ask prices and are determined as of the close of business on the NYSE. Interpolated values are derived when the settlement date of the contract is an interim date for which quotations are not available. |
| • | | Exchange-traded options are valued at the mean between the last bid and ask prices at the close of the options market in which the options trade. An exchange-traded option for which there is no mean price is valued at the last bid (long positions) or ask (short positions) price. If no bid or ask price is available, the prior day’s price will be used, unless it is determined that the prior day’s price no longer reflects the fair value of the option. OTC options and options on swaps (“swaptions”) are valued by an independent pricing service using a mathematical model, which incorporates a number of market data factors, such as the trades and prices of the underlying instruments. |
| • | | Swap agreements are valued utilizing quotes received daily by the Fund’s pricing service or through brokers, which are derived using daily swap curves and models that incorporate a number of market data factors, such as discounted cash flows, trades and values of the underlying reference instruments. |
| • | | Certain centrally cleared swaps are valued at the price determined by the relevant exchange or clearinghouse. |
| • | | To-be-announced (“TBA”) commitments are valued on the basis of last available bid prices or current market quotations provided by pricing services. |
If events (e.g., a company announcement, market volatility or a natural disaster) occur that are expected to materially affect the value of such instruments, or in the event that the application of these methods of valuation results in a price for an investment that is deemed not to be representative of the market value of such investment, or if a price is not available, the investment will be valued by the Global Valuation Committee, or its delegate, in accordance with a policy approved by the Board as reflecting fair value (“Fair Valued Investments”). When determining the price for Fair Valued
| | | | | | |
| | | | | | | |
| | BLACKROCK GLOBAL ALLOCATION FUND, INC. | | OCTOBER 31, 2015 | | 45 |
| | |
| Notes to Consolidated Financial Statements (continued) | | |
Investments, the Global Valuation Committee, or its delegate, seeks to determine the price that the Fund might reasonably expect to receive or pay from the current sale or purchase of that asset or liability in an arm’s-length transaction. Fair value determinations shall be based upon all available factors that the Global Valuation Committee, or its delegate, deems relevant consistent with the principles of fair value measurement, which include the market approach, income approach and/or in the case of recent investments, the cost approach, as appropriate. The market approach generally consists of using comparable market transactions. The income approach generally is used to discount future cash flows to present value and is adjusted for liquidity as appropriate. These factors include but are not limited to: (i) attributes specific to the investment or asset; (ii) the principal market for the investment or asset; (iii) the customary participants in the principal market for the investment or asset; (iv) data assumptions by market participants for the investment or asset, if reasonably available; (v) quoted prices for similar investments or assets in active markets; and (vi) other factors, such as future cash flows, interest rates, yield curves, volatilities, prepayment speeds, loss severities, credit risks, recovery rates, liquidation amounts and/or default rates. Due to the inherent uncertainty of valuations of such investments, the fair values may differ from the values that would have been used had an active market existed. The Global Valuation Committee, or its delegate, employs various methods for calibrating valuation approaches for investments where an active market does not exist, including regular due diligence of the Fund’s pricing vendors, regular reviews of key inputs and assumptions, transactional back-testing or disposition analysis to compare unrealized gains and losses to realized gains and losses, reviews of missing or stale prices and large movements in market values and reviews of any market related activity. The pricing of all Fair Valued Investments is subsequently reported to the Board or a committee thereof on a quarterly basis.
Fair Value Hierarchy: Various inputs are used in determining the fair value of investments and derivative financial instruments. These inputs to valuation techniques are categorized into a fair value hierarchy consisting of three broad levels for financial statement purposes as follows:
| • | | Level 1 — unadjusted price quotations in active markets/exchanges for identical assets or liabilities that the Fund has the ability to access |
| • | | Level 2 — other observable inputs (including, but not limited to, quoted prices for similar assets or liabilities in markets that are active, quoted prices for identical or similar assets or liabilities in markets that are not active, inputs other than quoted prices that are observable for the assets or liabilities (such as interest rates, yield curves, volatilities, prepayment speeds, loss severities, credit risks and default rates) or other market–corroborated inputs) |
| • | | Level 3 — unobservable inputs based on the best information available in the circumstances, to the extent observable inputs are not available (including the Fund’s own assumptions used in determining the fair value of investments and derivative financial instruments) |
The hierarchy gives the highest priority to unadjusted quoted prices in active markets for identical assets or liabilities (Level 1 measurements) and the lowest priority to unobservable inputs (Level 3 measurements). Accordingly, the degree of judgment exercised in determining fair value is greatest for instruments categorized in Level 3. The inputs used to measure fair value may fall into different levels of the fair value hierarchy. In such cases, for disclosure purposes, the fair value hierarchy classification is determined based on the lowest level input that is significant to the fair value measurement in its entirety. The significant unobservable inputs used by the Global Valuation Committee in determining the price for Fair Valued Investments are typically categorized as Level 3. The fair value hierarchy for the Fund’s investments and derivative financial instruments have been included in the Consolidated Schedule of Investments.
Changes in valuation techniques may result in transfers into or out of an assigned level within the hierarchy. In accordance with the Fund’s policy, transfers between different levels of the fair value hierarchy are deemed to have occurred as of the beginning of the reporting period. The categorization of a value determined for investments and derivative financial instruments is based on the pricing transparency of the investments and derivative financial instruments and is not necessarily an indication of the risks associated with investing in those securities.
4. Securities and Other Investments:
Asset-Backed and Mortgage-Backed Securities: Asset-backed securities are generally issued as pass-through certificates or as debt instruments. Asset-backed securities issued as pass-through certificates represent undivided fractional ownership interests in an underlying pool of assets. Asset-backed securities issued as debt instruments, which are also known as collateralized obligations, are typically issued as the debt of a special purpose entity organized solely for the purpose of owning such assets and issuing such debt. Asset-backed securities are often backed by a pool of assets representing the obligations of a number of different parties. The yield characteristics of certain asset-backed securities may differ from traditional debt securities. One such major difference is that all or a principal part of the obligations may be prepaid at any time because the underlying assets (i.e., loans) may be prepaid at any time. As a result, a decrease in interest rates in the market may result in increases in the level of prepayments as borrowers, particularly mortgagors, refinance and repay their loans. An increased prepayment rate with respect to an asset-backed security will have the effect of shortening the maturity of the security. In addition, the Fund may subsequently have to reinvest the proceeds at lower interest rates. If the
| | | | | | |
| | | | | | | |
| 46 | | BLACKROCK GLOBAL ALLOCATION FUND, INC. | | OCTOBER 31, 2015 | | |
| | | | |
| Notes to Consolidated Financial Statements (continued) | | |
Fund has purchased such an asset-backed security at a premium, a faster than anticipated prepayment rate could result in a loss of principal to the extent of the premium paid.
For mortgage pass through securities there are a number of important differences among the agencies and instrumentalities of the U.S. Government that issue mortgage-related securities and among the securities that they issue. For example, mortgage-related securities guaranteed by Ginnie Mae are guaranteed as to the timely payment of principal and interest by Ginnie Mae and such guarantee is backed by the full faith and credit of the United States. However, mortgage-related securities issued by Freddie Mac and Fannie Mae, including Freddie Mac and Fannie Mae guaranteed mortgage pass-through certificates, which are solely the obligations of Freddie Mac and Fannie Mae, are not backed by or entitled to the full faith and credit of the United States, but are supported by the right of the issuer to borrow from the U.S. Treasury.
Non-agency mortgage-backed securities are securities issued by non-governmental issuers and have no direct or indirect government guarantees of payment and are subject to various risks. Non-agency mortgage loans are obligations of the borrowers thereunder only and are not typically insured or guaranteed by any other person or entity. The ability of a borrower to repay a loan is dependent upon the income or assets of the borrower. A number of factors, including a general economic downturn, acts of God, terrorism, social unrest and civil disturbances, may impair a borrower’s ability to repay its loans.
Inflation-Indexed Bonds: Inflation-indexed bonds are fixed income securities whose principal value is periodically adjusted according to the rate of inflation. If the index measuring inflation rises or falls, the principal value of inflation-indexed bonds will be adjusted upward or downward, and consequently the interest payable on these securities (calculated with respect to a larger or smaller principal amount) will be increased or reduced, respectively. Any upward or downward adjustment in the principal amount of an inflation-indexed bond will be included as interest income in the Consolidated Statement of Operations, even though investors do not receive their principal until maturity. Repayment of the original bond principal upon maturity (as adjusted for inflation) is guaranteed in the case of U.S. Treasury inflation-indexed bonds. For bonds that do not provide a similar guarantee, the adjusted principal value of the bond repaid at maturity may be less than the original principal.
Zero-Coupon Bonds: Zero-coupon bonds are normally issued at a significant discount from face value and do not provide for periodic interest payments. These bonds may experience greater volatility in market value than other debt obligations of similar maturity which provide for regular interest payments.
Capital Trusts and Trust Preferred Securities: Capital trusts and/or trust preferred securities are typically issued by corporations, generally in the form of interest-bearing notes with preferred securities characteristics, or by an affiliated business trust of a corporation, generally in the form of beneficial interests in subordinated debentures or similarly structured securities. The securities can be structured as either fixed or adjustable coupon securities that can have either a perpetual or stated maturity date. For trust preferred securities, the issuing bank or corporation pays interest to the trust, which is then distributed to holders of the trust preferred securities as a dividend. Dividends can be deferred without creating an event of default or acceleration, although maturity cannot take place unless all cumulative payment obligations have been met. The deferral of payments does not affect the purchase or sale of these securities in the open market. Payments on these securities are treated as interest rather than dividends for federal income tax purposes. These securities generally are rated below that of the issuing company’s senior debt securities and are freely callable at the issuer’s option.
Preferred Stock: Preferred stock has a preference over common stock in liquidation (and generally in receiving dividends as well) but is subordinated to the liabilities of the issuer in all respects. As a general rule, the market value of preferred stock with a fixed dividend rate and no conversion element varies inversely with interest rates and perceived credit risk, while the market price of convertible preferred stock generally also reflects some element of conversion value. Because preferred stock is junior to debt securities and other obligations of the issuer, deterioration in the credit quality of the issuer will cause greater changes in the value of a preferred stock than in a more senior debt security with similar stated yield characteristics. Unlike interest payments on debt securities, preferred stock dividends are payable only if declared by the issuer’s board of directors. Preferred stock also may be subject to optional or mandatory redemption provisions.
Warrants: Warrants entitle the Fund to purchase a specified number of shares of common stock and are non-income producing. The purchase price and number of shares are subject to adjustment under certain conditions until the expiration date of the warrants, if any. If the price of the underlying stock does not rise above the exercise price before the warrant expires, the warrant generally expires without any value and the Fund will lose any amount it paid for the warrant. Thus, investments in warrants may involve more risk than investments in common stock. Warrants may trade in the same markets as their underlying stock; however, the price of the warrant does not necessarily move with the price of the underlying stock.
| | | | | | |
| | | | | | | |
| | BLACKROCK GLOBAL ALLOCATION FUND, INC. | | OCTOBER 31, 2015 | | 47 |
| | |
| Notes to Consolidated Financial Statements (continued) | | |
Credit-Linked Notes: The Fund may invest in credit-linked notes to help manage its credit portfolio as well as to protect against the potential loss arising from a counterparty default. In a credit-linked note, the Fund purchases a note from an issuer and in return, it receives payments during the term of the note. The risks of the note include default by the reference entity such as bankruptcy, insolvency, or failure to meet payment obligations. At maturity or when the note is redeemed, the Fund will receive payment of a cash settlement amount. However, if there is a credit event, the credit-linked note is redeemed early. The daily change in value is included in net change in unrealized appreciation/depreciation on investments on the Statement of Operations. Interest accruals are included in interest income on the Statement of Operations. The use of credit-linked notes involves the risk that the value of the note changes unfavorably due to movements in the value of the underlying reference instrument. The Fund must rely on the creditworthiness of the issuer for its investment returns.
Floating Rate Loan Interests: Floating rate loan interests are typically issued to companies (the “borrower”) by banks, other financial institutions, or privately and publicly offered corporations (the “lender”). Floating rate loan interests are generally non-investment grade, often involve borrowers whose financial condition is troubled or uncertain and companies that are highly leveraged. The Fund may invest in obligations of borrowers who are in bankruptcy proceedings. Floating rate loan interests may include fully funded term loans or revolving lines of credit. Floating rate loan interests are typically senior in the corporate capital structure of the borrower. Floating rate loan interests generally pay interest at rates that are periodically determined by reference to a base lending rate plus a premium. The base lending rates are generally the lending rate offered by one or more European banks, such as the London Interbank Offered Rate (“LIBOR”), the prime rate offered by one or more U.S. banks or the certificate of deposit rate. Floating rate loan interests may involve foreign borrowers, and investments may be denominated in foreign currencies. These investments are treated as investments in debt securities for purposes of the Fund’s investment policies.
When the Fund purchases a floating rate loan interest, it may receive a facility fee and when it sells a floating rate loan interest, it may pay a facility fee. On an ongoing basis, the Fund may receive a commitment fee based on the undrawn portion of the underlying line of credit amount of a floating rate loan interest. Facility and commitment fees are typically amortized to income over the term of the loan or term of the commitment, respectively. Consent and amendment fees are recorded to income as earned. Prepayment penalty fees, which may be received by the Fund upon the prepayment of a floating rate loan interest by a borrower, are recorded as realized gains. The Fund may invest in multiple series or tranches of a loan. A different series or tranche may have varying terms and carry different associated risks.
Floating rate loan interests are usually freely callable at the borrower’s option. The Fund may invest in such loans in the form of participations in loans (“Participations”) or assignments (“Assignments”) of all or a portion of loans from third parties. Participations typically will result in the Fund having a contractual relationship only with the lender, not with the borrower. The Fund has the right to receive payments of principal, interest and any fees to which it is entitled only from the lender selling the Participation and only upon receipt by the lender of the payments from the borrower. In connection with purchasing Participations, the Fund generally will have no right to enforce compliance by the borrower with the terms of the loan agreement, nor any rights of offset against the borrower. The Fund may not benefit directly from any collateral supporting the loan in which it has purchased the Participation. As a result, the Fund assumes the credit risk of both the borrower and the lender that is selling the Participation. The Fund’s investment in loan participation interests involves the risk of insolvency of the financial intermediaries who are parties to the transactions. In the event of the insolvency of the lender selling the Participation, the Fund may be treated as a general creditor of the lender and may not benefit from any offset between the lender and the borrower. Assignments typically result in the Fund having a direct contractual relationship with the borrower, and the Fund may enforce compliance by the borrower with the terms of the loan agreement.
Forward Commitments and When-Issued Delayed Delivery Securities: The Fund may purchase securities on a when-issued basis and may purchase or sell securities on a forward commitment basis. Settlement of such transactions normally occurs within a month or more after the purchase or sale commitment is made. The Fund may purchase securities under such conditions with the intention of actually acquiring them, but may enter into a separate agreement to sell the securities before the settlement date. Since the value of securities purchased may fluctuate prior to settlement, the Fund may be required to pay more at settlement than the security is worth. In addition, the Fund is not entitled to any of the interest earned prior to settlement. When purchasing a security on a delayed delivery basis, the Fund assumes the rights and risks of ownership of the security, including the risk of price and yield fluctuations. In the event of default by the counterparty, the Fund’s maximum amount of loss is the unrealized appreciation of unsettled when-issued transactions.
TBA Commitments: TBA commitments are forward agreements for the purchase or sale of mortgage-backed securities for a fixed price, with payment and delivery on an agreed upon future settlement date. The specific securities to be delivered are not identified at the trade date. However, delivered securities must meet specified terms, including issuer, rate and mortgage terms. When entering into TBA commitments, the Fund may take possession of or deliver the underlying mortgage-backed securities but can extend the settlement or roll the transaction. TBA commitments involve a risk of loss if the value of the security to be purchased or sold declines or increases, respectively, prior to settlement date. In order to better define contractual
| | | | | | |
| | | | | | | |
| 48 | | BLACKROCK GLOBAL ALLOCATION FUND, INC. | | OCTOBER 31, 2015 | | |
| | | | |
| Notes to Consolidated Financial Statements (continued) | | |
rights and to secure rights that will help the Fund mitigate its counterparty risk, TBA commitments may be entered into by the Fund under Master Securities Forward Transaction Agreements (each, an “MSFTA”). An MSFTA typically contains, among other things, collateral posting terms and netting provisions in the event of default and/or termination event. The collateral requirements are typically calculated by netting the mark-to-market amount for each transaction under such agreement and comparing that amount to the value of the collateral currently pledged by the Fund and the counterparty. Cash collateral that has been pledged to cover the obligations of the Fund and cash collateral received from the counterparty, if any, is reported separately on the Consolidated Statement of Assets and Liabilities as cash pledged as collateral for TBA commitments or cash received as collateral for TBA commitments, respectively. Non-cash collateral pledged by the Fund, if any, is noted in the Consolidated Schedule of Investments. Typically, the Fund is permitted to sell, repledge or use the collateral it receives; however, the counterparty is not permitted to do so. To the extent amounts due to the Fund is not fully collateralized, contractually or otherwise, the Fund bears the risk of loss from counterparty non-performance.
Mortgage Dollar Roll Transactions: The Fund may sell TBA mortgage-backed securities and simultaneously contract to repurchase substantially similar (i.e., same type, coupon and maturity) securities on a specific future date at an agreed upon price. During the period between the sale and repurchase, the Fund is not entitled to receive interest and principal payments on the securities sold. Mortgage dollar roll transactions are treated as purchases and sales and realizes gains and losses on these transactions. Mortgage dollar rolls involve the risk that the market value of the securities that the Fund is required to purchase may decline below the agreed upon repurchase price of those securities.
Short Sales: In short sale transactions the Fund sells a security it does not hold in anticipation of a decline in the market price of that security. When the Fund makes a short sale, it will borrow the security sold short from a broker/counterparty and deliver the security to the purchaser. To close out a short position, the Fund delivers the same security to the broker and records a liability to reflect the obligation to return the security to the broker. The amount of the liability is subsequently marked-to-market to reflect the market value of the short sale. The Fund maintains a segregated account of securities or deposits cash with the broker-dealer as collateral for the short sales. Cash deposited with the broker is recorded as an asset in the Consolidated Statement of Assets and Liabilities. Securities segregated as collateral are denoted in the Consolidated Schedule of Investments. The Fund may pay a financing fee for the difference between the market value of the short position and the cash collateral deposited with the broker which would be recorded as interest expense. The Fund is required to repay the counterparty any dividends received on the security sold short, which, if applicable, is shown as dividend expense in the Consolidated Statement of Operations. The Fund may pay a fee on the assets borrowed from the counterparty, which, if applicable, is shown as stock loan fees in the Consolidated Statement of Operations. The Fund is exposed to market risk based on the amount, if any, that the market value of the security increases beyond the market value at which the position was sold. Thus, a short sale of a security involves the risk that instead of declining, the price of the security sold short will rise. The short sale of securities involves the possibility of an unlimited loss since there is an unlimited potential for the market price of the security sold short to increase. A gain, limited to the price at which the Fund sold the security short. A realized gain or loss is recognized upon the termination of a short sale if the market price is either less than or greater than the proceeds originally received. There is no assurance the Fund will be able to close out a short position at a particular time or at an acceptable price.
Securities Lending: The Fund may lend its securities to approved borrowers, such as brokers, dealers and other financial institutions. The borrower pledges and maintains with the Fund collateral consisting of cash, an irrevocable letter of credit issued by a bank, or securities issued or guaranteed by the U.S. Government. The initial collateral received by the Fund is required to have a value of at least 102% of the current value of the loaned securities for securities traded on U.S. exchanges and a value of at least 105% for all other securities. The collateral is maintained thereafter, at a value equal to at least 100% of the current market value of the securities on loan. The market value of the loaned securities is determined at the close of each business day of the Fund and any additional required collateral is delivered to the Fund, or excess collateral returned by the Fund, on the next business day. During the term of the loan, the Fund is entitled to all distributions made on or in respect of the loaned securities. Loans of securities are terminable at any time and the borrower, after notice, is required to return borrowed securities within the standard time period for settlement of securities transactions.
The market value of securities on loan, all of which were classified as common stocks in the Fund’s Consolidated Schedule of Investments, and the value of the related collateral are shown separately in the Consolidated Statement of Assets and Liabilities as a component of investments at value-unaffiliated, and collateral on securities loaned at value, respectively. As of period end, any securities on loan were collateralized by cash. The cash collateral invested by the securities lending agent, BlackRock Investment Management, LLC (“BIM”), if any, is disclosed in the Consolidated Schedule of Investments.
Securities lending transactions are entered into by the Fund under Master Securities Lending Agreements (each, an “MSLA”) which provide the right, in the event of default (including bankruptcy or insolvency), for the non-defaulting party to liquidate the collateral and calculate a net exposure to the defaulting party or request additional collateral. In the event that a borrower defaults, the Fund, as lender, would offset the market value of the collateral received against the market value of the securities loaned. When the value of the collateral is greater than that of the market value of the secu-
| | | | | | |
| | | | | | | |
| | BLACKROCK GLOBAL ALLOCATION FUND, INC. | | OCTOBER 31, 2015 | | 49 |
| | |
| Notes to Consolidated Financial Statements (continued) | | |
rities loaned, the lender is left with a net amount payable to the defaulting party. However, bankruptcy or insolvency laws of a particular jurisdiction may impose restrictions on or prohibitions against such a right of offset in the event of an MSLA counterparty’s bankruptcy or insolvency. Under the MSLA, absent an event of default the borrower can resell or re-pledge the loaned securities, and the Fund can reinvest cash collateral received in connection with loaned securities. Upon an event of default, the parties’ obligations to return the securities or collateral to the other party are extinguished, and the parties can resell or re-pledge the loaned securities or the collateral received in connection with the loaned securities.
As of period end, the following table is a summary of the Fund’s securities lending agreements by counterparty which are subject to offset under an MSLA:
| | | | | | | | | | | | |
| Counterparty | | Securities
Loaned
at Value | | | Cash
Collateral
Received1 | | | Net
Amount | |
Barclays Capital, Inc. | | $ | 3,785,562 | | | $ | (3,785,562 | ) | | | — | |
BNP Paribas Prime Brokerage, Inc. | | $ | 16,107,620 | | | $ | (16,107,620 | ) | | | — | |
Citigroup Global Markets, Inc. | | $ | 54,456,575 | | | $ | (54,456,575 | ) | | | — | |
Credit Suisse Securities (USA) LLC | | $ | 38,277,432 | | | $ | (38,277,432 | ) | | | — | |
Deutsche Bank Securities , Inc. | | $ | 103,584 | | | $ | (103,584 | ) | | | — | |
Goldman Sachs & Co. | | $ | 38,352,206 | | | $ | (38,352,206 | ) | | | — | |
JP Morgan Clearing Corp. | | $ | 160,670,135 | | | $ | (160,670,135 | ) | | | — | |
Merrill Lynch, Pierce Fenner & Smith, Inc. | | $ | 7,602,338 | | | $ | (7,602,338 | ) | | | — | |
Morgan Stanley & Co. LLC | | $ | 54,936,515 | | | $ | (54,936,515 | ) | | | — | |
Morgan Stanley & Co. LLC (US Equity Sec Lending) | | $ | 99,578,984 | | | $ | (99,578,984 | ) | | | — | |
National Financial Services LLC | | $ | 5,983,285 | | | $ | (5,983,285 | ) | | | — | |
State Street Bank & Trust Company | | $ | 86,261 | | | $ | (86,261 | ) | | | — | |
UBS Securities LLC | | $ | 6,261,298 | | | $ | (6,261,298 | ) | | | — | |
| | | | | | | | | | | | |
Total | | $ | 486,201,795 | | | $ | (486,201,795 | ) | | | — | |
| | | | | | | | | | | | |
| | 1 | | Collateral with a value of $497,499,535 has been received in connection with securities lending agreements. Excess of collateral received from the individual counterparty is not shown for financial reporting purposes. |
The risks of securities lending include the risk that the borrower may not provide additional collateral when required or may not return the securities when due. To mitigate these risks, the Fund benefits from a borrower default indemnity provided by BIM. BIM’s indemnity allows for full replacement of the securities loaned if the collateral received does not cover the value on the securities loaned in the event of borrower default. The Fund could suffer a loss if the value of an investment purchased with cash collateral falls below the market value of loaned securities or if the value of an investment purchased with cash collateral falls below the value of the original cash collateral received.
5. Derivative Financial Instruments:
The Fund engages in various portfolio investment strategies using derivative contracts both to increase the returns of the Fund and/or to manage economically its exposure to certain risks such as credit risk, equity risk, interest rate risk, and foreign currency exchange risk. These contracts may be transacted on an exchange or OTC.
Financial Futures Contracts: The Fund invests in long and/or short positions in financial futures contracts and options on financial futures contracts to gain exposure to, or economically hedge against, changes in the value of equity securities (equity risk). Financial futures contracts are agreements between the Fund and a counterparty to buy or sell a specific quantity of an underlying instrument at a specified price and at a specified date. Depending on the terms of the particular contract, financial futures contracts are settled either through physical delivery of the underlying instrument on the settlement date or by payment of a cash settlement amount on the settlement date.
Upon entering into a financial futures contract, the Fund is required to deposit initial margin with the broker in the form of cash or securities in an amount that varies depending on a contract’s size and risk profile. The initial margin deposit must then be maintained at an established level over the life of the contract. Securities deposited as initial margin are designated on the Consolidated Schedule of Investments and cash deposited, if any, is recorded on the Consolidated Statement of Assets and Liabilities as cash pledged for financial futures contracts. Pursuant to the contract, the Fund agrees to receive from or pay to the broker an amount of cash equal to the daily fluctuation in value of the contract. Such receipts or payments are known as variation margin. Variation margin is recorded by the Fund as unrealized appreciation (depreciation) and, if applicable, as a receivable or payable for variation margin in the Consolidated Statement of Assets and Liabilities.
When the contract is closed, the Fund records a realized gain or loss equal to the difference between the value of the contract at the time it was opened and the value at the time it was closed. The use of financial futures contracts involves the risk of an imperfect correlation in the movements in the price of financial futures contracts, interest or foreign currency exchange rates and the underlying assets.
| | | | | | |
| | | | | | | |
| 50 | | BLACKROCK GLOBAL ALLOCATION FUND, INC. | | OCTOBER 31, 2015 | | |
| | | | |
| Notes to Consolidated Financial Statements (continued) | | |
Forward Foreign Currency Exchange Contracts: The Fund enters into forward foreign currency exchange contracts as an economic hedge against either specific transactions or portfolio instruments or to obtain exposure to, or hedge exposure away from, foreign currencies (foreign currency exchange rate risk). A forward foreign currency exchange contract is an agreement between two parties to buy and sell a currency at a set exchange rate on a future date. Forward foreign currency exchange contracts, when used by the Fund, help to manage the overall exposure to the currencies in which some of the investments held by the Fund are denominated. Non-deliverable forward foreign currency exchange contracts are settled with the counterparty in cash without the delivery of foreign currency. The contract is marked-to-market daily and the change in market value is recorded by the Fund as an unrealized gain or loss. When the contract is closed, the Fund records a realized gain or loss equal to the difference between the value at the time it was opened and the value at the time it was closed. The use of forward foreign currency exchange contracts involves the risk that the value of a forward foreign currency exchange contract changes unfavorably due to movements in the value of the referenced foreign currencies.
Options: The Fund purchases and writes call and put options to increase or decrease its exposure to underlying instruments (including equity risk, foreign currency exchange rate risk and/or interest rate risk) and/or, in the case of options written, to generate gains from options premiums. A call option gives the purchaser (holder) of the option the right (but not the obligation) to buy, and obligates the seller (writer) to sell (when the option is exercised) the underlying instrument at the exercise or strike price at any time or at a specified time during the option period. A put option gives the holder the right to sell and obligates the writer to buy the underlying instrument at the exercise or strike price at any time or at a specified time during the option period. When the Fund purchases (writes) an option, an amount equal to the premium paid (received) by the Fund is reflected as an asset (liability). The amount of the asset (liability) is subsequently marked-to-market to reflect the current market value of the option purchased (written). When an instrument is purchased or sold through an exercise of an option, the related premium paid (or received) is added to (or deducted from) the basis of the instrument acquired or deducted from (or added to) the proceeds of the instrument sold. When an option expires (or the Fund enters into a closing transaction), the Fund realizes a gain or loss on the option to the extent of the premiums received or paid (or gain or loss to the extent the cost of the closing transaction exceeds the premiums received or paid). When the Fund writes a call option, such option is “covered,” meaning that the Fund holds the underlying instrument subject to being called by the option counterparty. When the Fund writes a put option, such option is covered by cash in an amount sufficient to cover the obligation.
Options on swaps (“swaptions”) are similar to options on securities except that instead of selling or purchasing the right to buy or sell a security, the writer or purchaser of the swaptions is granting or buying the right to enter into a previously agreed upon interest rate or credit default swap agreement (interest rate risk and/or credit risk) at any time before the expiration of the option.
The Fund also purchases or sells listed or OTC foreign currency options, foreign currency futures and related options on foreign currency futures as a short or long hedge against possible variations in foreign exchange rates or to gain exposure to foreign currencies (foreign currency exchange rate risk). When foreign currency is purchased or sold through an exercise of a foreign currency option, the related premium paid (or received) is added to (or deducted from) the basis of the foreign currency acquired or deducted from (or added to) the proceeds of the foreign currency sold (receipts from the foreign currency purchased). Such transactions may be effected with respect to hedges on non-U.S. dollar denominated instruments owned by the Fund but not yet delivered, or committed or anticipated to be purchased by the Fund.
The Fund may also purchase and write a variety of options with non-standard payout structures or other features (“barrier options”). Barrier options are generally traded OTC. The Fund may invest in various types of barrier options including down-and-out options, down-and-in options, double no-touch options, one-touch options and up-and-out options. Down-and-out options are similar to standard options, except that the option expires worthless to the purchaser of the option if the price of the underlying instrument reaches a specific barrier price level prior to the option’s expiration date. Down-and-in options expire worthless to the purchaser of the option unless the price of the underlying instrument falls below a specific barrier price level prior to the option’s expiration date. Double no-touch options provide the purchaser of the option an agreed-upon payout if the price of the underlying instrument does not reach or surpass predetermined barrier price levels prior to the option’s expiration date. One-touch options provide the purchaser of the option an agreed-upon payout if the price of the underlying instrument reaches or surpasses predetermined barrier price level prior to the option’s expiration date. Up-and-out options expire worthless if the price of the underlying instrument increases beyond a predetermined barrier price level prior to the option’s expiration date. Barrier options may also be referred to as knockout options. In a reverse knockout option, the option expires worthless if the price of the underlying instrument decreases beyond a predetermined barrier price level prior to the option’s expiration date.
In purchasing and writing options, the Fund bears the risk of an unfavorable change in the value of the underlying instrument or the risk that the Fund may not be able to enter into a closing transaction due to an illiquid market. Exercise of a written option could result in the Fund purchasing or selling a security when it otherwise would not, or at a price different from the current market value.
As of October 31, 2015 the value of portfolio securities subject to covered call options written was $958,138,356.
| | | | | | |
| | | | | | | |
| | BLACKROCK GLOBAL ALLOCATION FUND, INC. | | OCTOBER 31, 2015 | | 51 |
| | |
| Notes to Consolidated Financial Statements (continued) | | |
The Fund may invest in structured options to increase or decrease their exposure to an underlying index or group of securities (equity risk). These structured options are European-style options and may consist of single or multiple OTC options which are priced as a single security. European-style options may only be exercised at the expiration date, but may be transferred/sold prior to the expiration date. The value of a structured option may either increase or decrease with the underlying index or group of securities, depending on the combination of options used. Structured options are issued in units whereby each unit represents a structure based on the specific index with an initial reference strike price. One type of structure involves the combination of selling a put while buying a call on a specific index. This option would rise in value as the underlying index increases and fall in value as the underlying index decreases. Alternatively, another structure involves the sale of a call and the purchase of a put. This option structure would rise in value as the underlying index decreases and fall in value as the underlying index increases. Upon the exercise of the structured option, the Fund will receive a payment from, or be required to remit a payment to the counterparty, depending on the value of the underlying index at exercise
Swaps: The Fund enters into swap agreements in which the Fund and a counterparty agree either to make periodic net payments on a specified notional amount or a net payment upon termination. Swap agreements are privately negotiated in the OTC market and may be entered into as a bilateral contract (“OTC swaps”) or centrally cleared (“centrally cleared swaps”). Swaps are marked-to-market daily and changes in value are recorded as unrealized appreciation (depreciation).
For OTC swaps, any upfront premiums paid are recorded as assets and any upfront fees received are recorded as liabilities and are shown as swap premiums paid and swap premiums received, respectively, in the Consolidated Statement of Assets and Liabilities and amortized over the term of the OTC swap. Payments received or made by the Fund for OTC swaps are recorded in the Consolidated Statement of Operations as realized gains or losses, respectively. When an OTC swap is terminated, the Fund will record a realized gain or loss equal to the difference between the proceeds from (or cost of) the closing transaction and the Fund’s basis in the contract, if any. Generally, the basis of the contract is the premium received or paid.
In a centrally cleared swap, immediately following execution of the swap agreement, the swap agreement is novated to a central counterparty (the “CCP”) and the Fund’s counterparty on the swap agreement becomes the CCP. The Fund is required to interface with the CCP through a broker. Upon entering into a centrally cleared swap, the Fund is required to deposit initial margin with the broker in the form of cash or securities in an amount that varies depending on the size and risk profile of the particular swap. Securities deposited as initial margin are designated on the Consolidated Schedule of Investments and cash deposited is recorded on the Consolidated Statement of Assets and Liabilities as cash pledged for centrally cleared swaps. The daily change in valuation of centrally cleared swaps is recorded as a receivable or payable for variation margin in the Consolidated Statement of Assets and Liabilities. Payments received from (paid to) the counterparty, including at termination, are recorded as realized gain (loss) in the Consolidated Statement of Operations.
Swap transactions involve, to varying degrees, elements of interest rate, credit and market risk in excess of the amounts recognized in the Consolidated Statement of Assets and Liabilities. Such risks involve the possibility that there will be no liquid market for these agreements, that the counterparty to the agreements may default on its obligation to perform or disagree as to the meaning of the contractual terms in the agreements, and that there may be unfavorable changes in interest rates and/or market values associated with these transactions.
| • | | Credit default swaps — The Fund enters into credit default swaps to manage its exposure to the market or certain sectors of the market, to reduce its risk exposure to defaults of corporate and/or sovereign issuers or to create exposure to corporate and/or sovereign issuers to which it is not otherwise exposed (credit risk). The Fund may either buy or sell (write) credit default swaps on single-name issuers (corporate or sovereign), a combination or basket of single-name issuers or traded indexes. Credit default swaps on single-name issuers are agreements in which the protection buyer pays fixed periodic payments to the seller in consideration for a guarantee from the protection seller to make a specific payment should a negative credit event take place with respect to the referenced entity (e.g., bankruptcy, failure to pay, obligation accelerators, repudiation, moratorium or restructuring). Credit default swaps on traded indexes are agreements in which the buyer pays fixed periodic payments to the seller in consideration for a guarantee from the seller to make a specific payment should a write-down, principal or interest shortfall or default of all or individual underlying securities included in the index occur. As a buyer, if an underlying credit event occurs, the Fund will either (i) receive from the seller an amount equal to the notional amount of the swap and deliver the referenced security or underlying securities comprising the index, or (ii) receive a net settlement of cash equal to the notional amount of the swap less the recovery value of the security or underlying securities comprising the index. As a seller (writer), if an underlying credit event occurs, the Fund will either pay the buyer an amount equal to the notional amount of the swap and take delivery of the referenced security or underlying securities comprising the index or pay a net settlement of cash equal to the notional amount of the swap less the recovery value of the security or underlying securities comprising the index. |
| • | | Total return swaps — The Fund enters into total return swaps to obtain exposure to a security or market without owning such security or investing directly in that market or to transfer the risk/return of one market (e.g., fixed income) to another market (e.g., equity or commodity prices) (equity |
| | | | | | |
| | | | | | | |
| 52 | | BLACKROCK GLOBAL ALLOCATION FUND, INC. | | OCTOBER 31, 2015 | | |
| | | | |
| Notes to Consolidated Financial Statements (continued) | | |
| | risk, commodity price risk and/or interest rate risk). Total return swaps are agreements in which there is an exchange of cash flows whereby one party commits to make payments based on the total return (coupons plus capital gains/losses) of an underlying instrument in exchange for fixed or floating rate interest payments. To the extent the total return of the instrument or index underlying the transaction exceeds or falls short of the offsetting interest rate obligation, the Fund will receive a payment from or make a payment to the counterparty. |
| • | | Interest rate swaps — The Fund enters into interest rate swaps to gain or reduce exposure to interest rates or to manage duration, the yield curve or interest rate risk by economically hedging the value of the fixed rate bonds, which may decrease when interest rates rise (interest rate risk). Interest rate swaps are agreements in which one party pays a stream of interest payments, either fixed or floating, for another party’s stream of interest payments, either fixed or floating, on the same notional amount for a specified period of time. In more complex swaps, the notional principal amount may decline (or amortize) over time. |
| • | | Currency swaps — The Fund enters into currency swaps to gain or reduce exposure to foreign currencies or as an economic hedge against either specific transactions or portfolio instruments (foreign currency exchange rate and/or interest rate risk). Currency swaps are interest rate swaps in which one party pays a stream of interest payments, either fixed or floating, in exchange for another party’s stream of interest payments, either fixed or floating, based on the notional amounts of two different currencies. The notional amounts are typically determined based on the spot exchange rates at the inception of the trade. Currency swaps may also involve an exchange of notional amounts at the start, during and/or at expiration of the contract, either at the current spot rate or another specified rate. |
| • | | Forward interest rate swaps — The Fund enters into forward interest rate swaps and forward total return swaps. In a forward swap, the Fund and the counterparty agree to make either periodic net payments beginning on a specified future effective date or a net payment at termination, unless terminated earlier. |
Master Netting Arrangements: In order to better define the Fund’s contractual rights and to secure rights that will help it mitigate its counterparty risk, the Fund may enter into an International Swaps and Derivatives Association, Inc. Master Agreement (“ISDA Master Agreement”) or similar agreement with its counterparties. An ISDA Master Agreement is a bilateral agreement between the Fund and a counterparty that governs certain OTC derivatives and typically contains, among other things, collateral posting terms and netting provisions in the event of a default and/or termination event. Under an ISDA Master Agreement, the Fund may, under certain circumstances, offset with the counterparty certain derivative financial instruments’ payables and/or receivables with collateral held and/or posted and create one single net payment. The provisions of the ISDA Master Agreement typically permit a single net payment in the event of default including the bankruptcy or insolvency of the counterparty. Bankruptcy or insolvency laws of a particular jurisdiction may restrict or prohibit the right of offset in bankruptcy, insolvency or other events. In addition, certain ISDA Master Agreements allow counterparties to terminate derivative contracts prior to maturity in the event the Fund’s net assets decline by a stated percentage or the Fund fails to meet the terms of its ISDA Master Agreements. The result would cause the Fund to accelerate payment of any net liability owed to the counterparty.
Collateral Requirements: For derivatives traded under an ISDA Master Agreement, the collateral requirements are typically calculated by netting the mark-to-market amount for each transaction under such agreement and comparing that amount to the value of any collateral currently pledged by the Fund and the counterparty.
Cash collateral that has been pledged to cover obligations of the Fund and cash collateral received from the counterparty, if any, is reported separately on the Consolidated Statement of Assets and Liabilities as cash pledged as collateral and cash received as collateral, respectively. Non-cash collateral pledged by the Fund, if any, is noted in the Consolidated Schedule of Investments. Generally, the amount of collateral due from or to a party has to exceed a minimum transfer amount threshold (typically either $250,000 or $500,000) before a transfer is required, which is determined at the close of business of the Fund. Any additional required collateral is delivered to/pledged by the Fund on the next business day. Typically, the Fund’s counterparty is not permitted to sell, re-pledge or use cash and non-cash collateral it receives. The Fund generally agrees not to use non-cash collateral that it receives but may, absent default or certain other circumstances defined in the underlying ISDA Master Agreement, be permitted to use cash collateral received. In such cases, the Fund may pay interest pursuant to the collateral arrangement with the counterparty. To the extent amounts due to the Fund from its counterparties are not fully collateralized, the Fund bears the risk of loss from counterparty non-performance. Likewise, to the extent the Fund has delivered collateral to a counterparty and stands ready to perform under the terms of its agreement with such counterparty, the Fund bears the risk of loss from a counterparty in the amount of the value of the collateral in the event the counterparty fails to return such collateral. Based on the terms of agreements, collateral may not be required to all derivative contracts.
6. Investment Advisory Agreement and Other Transactions with Affiliates:
The PNC Financial Services Group, Inc. is the largest stockholder and an affiliate of BlackRock Inc. (“BlackRock”) for 1940 Act purposes.
| | | | | | |
| | | | | | | |
| | BLACKROCK GLOBAL ALLOCATION FUND, INC. | | OCTOBER 31, 2015 | | 53 |
| | |
| Notes to Consolidated Financial Statements (continued) | | |
The Fund entered into an Investment Advisory Agreement with the Manager, the Fund’s investment advisor, an indirect, wholly owned subsidiary of BlackRock, to provide investment advisory and administration services. The Manager is responsible for the management of the Fund’s portfolio and provides the necessary personnel, facilities, equipment and certain other services necessary to the operations of the Fund. For such services, the Fund pays the Manager a monthly fee at an annual rate of 0.75% of the Fund’s average daily net assets.
The Manager voluntarily agreed to waive a portion of its fees payable by the Fund, which is included in fees waived by the Manager in the Consolidated Statement of Operations. Such fee was reduced for average daily net assets as follows:
| | | | |
In excess of $10 Billion, but not exceeding $15 Billion | | | 0.69% | |
In excess of $15 Billion, but not exceeding $20 Billion | | | 0.68% | |
In excess of $20 Billion, but not exceeding $25 Billion | | | 0.67% | |
In excess of $25 Billion, but not exceeding $30 Billion | | | 0.65% | |
In excess of $30 Billion, but not exceeding $40 Billion | | | 0.63% | |
In excess of $40 Billion, but not exceeding $60 Billion | | | 0.62% | |
In excess of $60 Billion, but not exceeding $80 Billion | | | 0.61% | |
Greater than $80 Billion | | | 0.60% | |
For the year ended October 31, 2015, the Manager waived $46,180,123, which is included in fees waived by the Manager in the Consolidated Statement of Operations. This voluntary waiver may be reduced or discontinued at any time without notice.
The Manager voluntarily agreed to waive its investment advisory fees by the amount of investment advisory fees the Fund pays to the Manager indirectly through its investment in affiliated money market funds. However, the Manager does not waive its investment advisory fees by the amount of investment advisory fees paid in connection with the Fund’s investment in other affiliated investment companies, if any. This amount is included in fees waived by the Manager in the Consolidated Statement of Operations. For the year ended October 31, 2015, the amount waived was $14,521.
The Manager provides investment management and other services to the Subsidiary. The Manager does not receive separate compensation from the Subsidiary for providing investment management or administrative services. However, the Fund pays the Manager based on the Fund’s net assets, which includes the assets of the Subsidiary.
For the year ended October 31, 2015, the Fund reimbursed the Manager $579,419 for certain accounting services, which is included in accounting services in the Consolidated Statement of Operations.
The Fund entered into a Distribution Agreement and a Distribution and Service Plan with BlackRock Investments, LLC (“BRIL”), an affiliate of the Manager. Pursuant to the Distribution and Service Plan and in accordance with Rule 12b-1 under the 1940 Act, the Fund pays BRIL ongoing service and distribution fees. The fees are accrued daily and paid monthly at annual rates based upon the average daily net assets of the shares of the Fund as follows:
| | | | | | | | | | | | | | | | |
| | | Investor A | | | Investor B | | | Investor C | | | Class R | |
Service Fee | | | 0.25% | | | | 0.25% | | | | 0.25% | | | | 0.25% | |
Distribution Fee | | | — | | | | 0.75% | | | | 0.75% | | | | 0.25% | |
Pursuant to sub-agreements with BRIL, broker-dealers and BRIL provide shareholder servicing and distribution services to the Fund. The ongoing service and/or distribution fee compensates BRIL and each broker-dealer for providing shareholder servicing and/or distribution related services to Investor A, Investor B, Investor C and Class R shareholders.
For the year ended October 31, 2015, affiliates earned underwriting discounts, direct commissions and dealer concessions on sales of the Fund’s Investor A Shares, which totaled $1,585,044.
For the year ended October 31, 2015, affiliates received CDSCs as follows:
| | | | |
Institutional | | $ | 1 | |
Investor A | | $ | 172,976 | |
Investor B | | $ | 27,484 | |
Investor C | | $ | 1,015,107 | |
The Manager maintains a call center, which is responsible for providing certain shareholder services to the Fund, such as responding to shareholder inquiries and processing transactions based upon instructions from shareholders with respect to the subscription and redemption of Fund shares. For
| | | | | | |
| | | | | | | |
| 54 | | BLACKROCK GLOBAL ALLOCATION FUND, INC. | | OCTOBER 31, 2015 | | |
| | | | |
| Notes to Consolidated Financial Statements (continued) | | |
the year ended October 31, 2015, the Fund reimbursed the Manager the following amounts for costs incurred in running the call center, which are included in transfer agent — class specific in the Consolidated Statement of Operations:
| | | | |
Institutional | | $ | 66,877 | |
Investor A | | $ | 299,065 | |
Investor B | | $ | 10,606 | |
Investor C | | $ | 223,316 | |
Class R | | $ | 1,555 | |
Pursuant to written agreements, certain financial intermediaries, some of which may be affiliates, provide the Fund with sub-accounting, recordkeeping, sub-transfer agency and other administrative services with respect to sub-accounts they service. For these services, these entities receive an asset-based fee or an annual fee per shareholder account, which will vary depending on share class and/or net assets.
The U.S. Securities and Exchange Commission has issued an exemptive order which permits BIM, an affiliate of the Manager, to serve as securities lending agent for the Fund, subject to applicable conditions. As securities lending agent, BIM bears all operational costs directly related to securities lending. The Fund is responsible for expenses in connection with the investment of cash collateral received for securities on loan (the “collateral investment expenses”). The cash collateral is invested in a private investment company managed by the Manager or its affiliates. However, BIM has agreed to cap the collateral investment expenses of the private investment company to an annual rate of 0.04%. The investment advisor to the private investment company will not charge any advisory fees with respect to shares purchased by the Fund.
Securities lending income is equal to the total of income earned from the reinvestment of cash collateral, net of fees and other payments to and from borrowers of securities, and less the collateral investment expenses. The Fund retains a portion of securities lending income and remits a remaining portion to BIM as compensation for its services as securities lending agent.
Pursuant to a securities lending agreement effective January 1, 2015, the Fund retains 80% of securities lending income, and this amount retained can never be less than 70% of the total of securities lending income plus the collateral investment expenses.
In addition, commencing the business day following the date that the aggregate securities lending income earned across the Equity-Bond Complex in a calendar year exceeds a specified threshold, the Fund, pursuant to the securities lending agreement, will retain for the remainder of that calendar year securities lending income as follows: 85% of securities lending income, and this amount retained can never be less than 70% of the total of securities lending income plus the collateral investment expenses.
For the period February 1, 2014 through May 31, 2014, the Fund retained 70% (75% commencing on the business day following the date that the aggregate securities lending income earned across the Equity-Bond Complex in the calendar year 2014 exceeded a specified threshold (the “Hurdle Date”) and for the remainder of that calendar year) of securities lending income, and this amount retained could never be less than 65% of the total of securities lending income plus the collateral investment expenses. For the period June 1, 2014 through December 31, 2014, the Fund retained 75% (80% commencing on the Hurdle Date and for the remainder of that calendar year) of securities lending income, and this amount retained could never be less than 65% of the total of securities lending income plus the collateral investment expenses.
The share of securities lending income earned by the Fund is shown as securities lending — affiliated — net in the Consolidated Statement of Operations. For the year ended October 31, 2015, the Fund paid BIM $1,763,889 for securities lending agent services.
Certain officers and/or directors of the Fund are officers and/or directors of BlackRock or its affiliates. The Fund reimburses the Manager for a portion of the compensation paid to the Fund’s Chief Compliance Officer, which is included in officer and directors in the Consolidated Statement of Operations.
The Fund may purchase securities from, or sell securities to, an affiliated fund provided the affiliation is solely due to having a common investment adviser, common officers, or common trustees. For the year ended October 31, 2015, the purchase and sale transactions with an affiliated fund in compliance with Rule 17a-7 under the 1940 Act were $36,682,599 and $45,960,043, respectively.
7. Purchases and Sales:
For the year ended October 31, 2015, purchases and sales of investments including paydowns and mortgage dollar rolls and excluding short-term securities for were as follows:
| | | | | | | | |
| | | Purchases | | | Sales | |
Non-U.S. Government Securities | | $ | 29,166,020,951 | | | $ | 35,241,100,562 | |
U.S. Government Securities | | $ | 7,884,581,723 | | | $ | 7,383,261,307 | |
| | | | | | |
| | | | | | | |
| | BLACKROCK GLOBAL ALLOCATION FUND, INC. | | OCTOBER 31, 2015 | | 55 |
| | |
| Notes to Consolidated Financial Statements (continued) | | |
Purchases and sales related to mortgage dollar rolls for the year ended October 31, 2015 were as follows:
| | | | | | | | |
| | | Purchases | | | Sales | |
MDRs | | $ | 967,542,979 | | | $ | 973,058,096 | |
8. Income Tax Information:
It is the Fund’s policy to comply with the requirements of the Internal Revenue Code of 1986, as amended, applicable to regulated investment companies, and to distribute substantially all of its taxable income to its shareholders. Therefore, no federal income tax provision is required.
The Fund files U.S. federal and various state and local tax returns. No income tax returns are currently under examination. The statute of limitations on the Fund’s U.S. federal tax returns remains open for each of the four years ended October 31, 2015. The statutes of limitations on the Fund’s state and local tax returns may remain open for an additional year depending upon the jurisdiction.
Management has analyzed tax laws and regulations and their application to the Fund as of October 31, 2015, inclusive of the open tax return years, and does not believe there are any uncertain tax positions that require recognition of a tax liability in the Fund’s financial statements.
U.S. GAAP requires that certain components of net assets be adjusted to reflect permanent differences between financial and tax reporting. These reclassifications have no effect on net assets or net asset values per share. As of period end, the following permanent differences attributable to foreign currency transactions, amortization methods on fixed income securities, income recognized from wholly owned subsidiary, the accounting for swap agreements, the classification of investments, income recognized from pass-through entities and the sale of stock of passive foreign investment companies were reclassified to the following accounts:
| | | | |
Paid-in capital | | $ | (32,980,581 | ) |
Distributions in excess of net investment income | | $ | 190,020,348 | |
Accumulated net realized gain | | $ | (157,039,767 | ) |
The tax character of distributions paid was as follows:
| | | | | | | | |
| | | 10/31/15 | | | 10/31/14 | |
Ordinary income | | $ | 1,550,317,254 | | | $ | 1,375,269,779 | |
Long-term capital gains | | | 3,346,351,450 | | | | 1,922,508,272 | |
| | | | |
Total | | $ | 4,896,668,704 | | | $ | 3,297,778,051 | |
| | | | |
As of period end, the tax components of accumulated net earnings were as follows:
| | | | |
Undistributed net investment income | | $ | 471,731,639 | |
Undistributed long-term capital gains | | | 3,645,776,054 | |
Net unrealized gains1 | | | 2,364,117,855 | |
| | | | |
Total | | $ | 6,481,625,548 | |
| | | | |
| | 1 | | The difference between book-basis and tax-basis net unrealized gains was attributable primarily to the tax deferral of losses on wash sales and straddles, the realization for tax purposes of unrealized gains/losses on certain futures, options and foreign currency contracts, the realization for tax purposes of unrealized gains on investments in passive foreign investment companies, amortization methods for premiums and discounts on fixed income securities, the accrual of income on securities in default, the accounting for swap agreements, the classification of investments, the timing and recognition of partnership income and the investment in a wholly owned subsidiary. |
As of period end, gross unrealized appreciation and depreciation based on cost for federal income tax purposes were as follows:
| | | | |
Tax cost | | $ | 50,388,479,013 | |
| | | | |
Gross unrealized appreciation | | $ | 6,034,024,326 | |
Gross unrealized depreciation | | | (3,351,486,210 | ) |
| | | | |
Net unrealized appreciation | | $ | 2,682,538,116 | |
| | | | |
9. Bank Borrowings:
The Fund, along with certain other funds managed by the Manager and its affiliates (“Participating Funds”), is a party to a 364-day, $2.1 billion credit agreement with a group of lenders, under which the Fund may borrow to fund shareholder redemptions. Excluding commitments designated for certain individual funds, the Participating Funds, including the Fund, can borrow up to an aggregate commitment amount of $1.6 billion at any time outstanding, subject to asset coverage and other limitations as specified in the agreement. The credit agreement has the following terms: a fee of 0.06% per annum on unused commitment amounts and interest at a rate equal to the higher of (a) one-month LIBOR (but, in any event, not less than 0.00%) on the date the loan is made plus 0.80% per annum or (b) the Fed Funds rate (but, in any event, not less than 0.00%) in effect from time to time plus 0.80% per annum on amounts borrowed. The agreement expires in April 2016 unless extended or renewed. Prior to November 25, 2014,
| | | | | | |
| | | | | | | |
| 56 | | BLACKROCK GLOBAL ALLOCATION FUND, INC. | | OCTOBER 31, 2015 | | |
| | | | |
| Notes to Consolidated Financial Statements (continued) | | |
the aggregate commitment amount was $1.1 billion, of which the Participating Funds, including the Fund, could borrow up to $650 million at any time outstanding, subject to asset coverage and other limitations as specified in the agreement. Participating Funds paid administration, legal and arrangement fees, which, if applicable, are included in miscellaneous expenses in the Consolidated Statement of Operations, and along with commitment fees, were allocated among such funds based upon portions of the aggregate commitment available to them and relative net assets of Participating Funds. During the year ended October 31, 2015, the Fund did not borrow under the credit agreement.
10. Principal Risks:
In the normal course of business, the Fund invests in securities and enters into transactions where risks exist due to fluctuations in the market (market risk) or failure of the issuer to meet all its obligations, including the ability to pay principal and interest when due (issuer credit risk). The value of securities held by the Fund may decline in response to certain events, including those directly involving the issuers of securities owned by the Fund. Changes arising from the general economy, the overall market and local, regional or global political or/and social instability, as well as currency, interest rate and price fluctuations, may also affect the securities’ value.
Prepayment Risk: The Fund may be exposed to prepayment risk, which is the risk that borrowers may exercise their option to prepay principal earlier than scheduled during periods of declining interest rates, which would force the Fund to reinvest in lower yielding securities. The Fund may also be exposed to reinvestment risk, which is the risk that income from the Fund’s portfolio will decline if the Fund invests the proceeds from matured, traded or called fixed income securities at market interest rates that are below the Fund portfolio’s current earnings rate.
Counterparty Credit Risk: Similar to issuer credit risk, the Fund may be exposed to counterparty credit risk, or the risk that an entity may fail to or be unable to perform on its commitments related to unsettled or open transactions. The Fund manages counterparty credit risk by entering into transactions only with counterparties that the Manager believes have the financial resources to honor their obligations and by monitoring the financial stability of those counterparties. Financial assets, which potentially expose the Fund to market, issuer and counterparty credit risks, consist principally of financial instruments and receivables due from counterparties. The extent of the Fund’s exposure to market, issuer and counterparty credit risks with respect to these financial assets is approximately their value recorded in the Consolidated Statement of Assets and Liabilities, less any collateral held by the Fund.
A derivative contract may suffer a mark-to-market loss if the value of the contract decreases due to an unfavorable change in the market rates or values of the underlying instrument. Losses can also occur if the counterparty does not perform under the contract.
The Fund’s risk of loss from counterparty credit risk on OTC derivatives is generally limited to the aggregate unrealized gain less the value of any collateral held by the Fund.
For OTC options purchased, the Fund bears the risk of loss of the amount of the premiums paid plus the positive change in market values net of any collateral held by the Fund should the counterparty fail to perform under the contracts. Options written by the Fund do not typically give rise to counterparty credit risk, as options written generally obligate the Fund, and not the counterparty, to perform, though the Fund may be exposed to counterparty credit risk with respect to options written to the extent the Fund deposits collateral with its counterparty to a written option.
With exchange-traded options purchased and futures and centrally cleared swaps, there is less counterparty credit risk to the Fund since the exchange or clearinghouse, as counterparty to such instruments, guarantees against a possible default. The clearinghouse stands between the buyer and the seller of the contract; therefore, credit risk is limited to failure of the clearinghouse. While offset rights may exist under applicable law, the Fund does not have a contractual right of offset against a clearing broker or clearinghouse in the event of a default (including the bankruptcy or insolvency. Additionally, credit risk exists in exchange-traded futures and centrally cleared swaps with respect to initial and variation margin that is held in a clearing broker’s customer accounts. While clearing brokers are required to segregate customer margin from their own assets, in the event that a clearing broker becomes insolvent or goes into bankruptcy and at that time there is a shortfall in the aggregate amount of margin held by the clearing broker for all its clients, typically the shortfall would be allocated on a pro rata basis across all the clearing broker’s customers, potentially resulting in losses to the Fund.
Concentration Risk:
The Fund invests a substantial amount of its assets in issuers located in a single country or a limited number of countries. When the Fund concentrates its investments in this manner, it assumes the risk that economic, political and social conditions in those countries may have a significant impact on their investment performance. Foreign issuers may not be subject to the same uniform accounting, auditing and financial reporting standards and practices as used in the United States. Foreign securities markets may also be less liquid, more volatile, and less subject to governmental supervision not typically associated with investing in U.S. securities. Investment percentages in specific countries are presented in the Consolidated Schedule of Investments.
| | | | | | |
| | | | | | | |
| | BLACKROCK GLOBAL ALLOCATION FUND, INC. | | OCTOBER 31, 2015 | | 57 |
| | |
| Notes to Consolidated Financial Statements (concluded) | | |
The Fund invests a significant portion of its assets in securities of issuers located in Europe or with significant exposure to European issuers or countries. The European financial markets have recently experienced volatility and adverse trends due to concerns about economic downturns in, rising government debt levels of, several European countries. These events may spread to other countries in Europe and may affect the value and liquidity of certain of the Fund’s investments.
As of period end, the Fund’s investments had the following industry classifications:
| | | | |
| Industry | | Percentage of
Long-Term Investments | |
Bank | | | 8 | % |
Oil, Gas & Consumable Fuels | | | 6 | |
Pharmaceuticals | | | 6 | |
Other1 . | | | 80 | |
| | 1 | | Consists of U.S. Treasury Obligations and Foreign Government Obligations (14%), all other industries less than 5% of long-term investments (66%). |
11. Capital Share Transactions:
Transactions in capital shares for each class were as follows:
| | | | | | | | | | | | | | | | | | |
| | | Year Ended
October 31, 2015 | | | | | Year Ended
October 31, 2014 | |
| | | Shares | | | Amount | | | | | Shares | | | Amount | |
| Institutional | | | | | | | | | | | | | | | | | | |
Shares sold | | | 198,137,831 | | | $ | 4,033,806,809 | | | | | | 267,936,698 | | | $ | 5,827,054,865 | |
Shares issued to shareholders in reinvestment of distributions | | | 88,541,465 | | | | 1,742,728,283 | | | | | | 54,549,228 | | | | 1,148,613,001 | |
Shares redeemed | | | (283,809,571 | ) | | | (5,808,229,917 | ) | | | | | (263,807,908 | ) | | | (5,716,577,951 | ) |
| | | | | | | | | | | | | | | | | | |
Net increase (decrease) | | | 2,869,725 | | | $ | (31,694,825 | ) | | | | | 58,678,018 | | | $ | 1,259,089,915 | |
| | | | | | | | | | | | | | | | | | |
| | | | | | | | | | | | | | | | | | |
| Investor A | | | | | | | | | | | | | | | | | | |
Shares sold | | | 104,279,701 | | | $ | 2,114,934,349 | | | | | | 132,532,020 | | | $ | 2,856,984,212 | |
Shares issued to shareholders in reinvestment of distributions | | | 72,294,043 | | | | 1,414,821,009 | | | | | | 48,122,202 | | | | 1,007,924,714 | |
Shares redeemed | | | (187,819,520 | ) | | | (3,805,078,899 | ) | | | | | (222,522,504 | ) | | | (4,822,660,092 | ) |
| | | | | | | | | | | | | | | | | | |
Net decrease | | | (11,245,776 | ) | | $ | (275,323,541 | ) | | | | | (41,868,282 | ) | | $ | (957,751,166 | ) |
| | | | | | | | | | | | | | | | | | |
| | | | | | | | | | | | | | | | | | |
| Investor B | | | | | | | | | | | | | | | | | | |
Shares sold | | | 79,111 | | | $ | 1,568,173 | | | | | | 156,982 | | | $ | 3,335,396 | |
Shares issued to shareholders in reinvestment of distributions | | | 1,204,126 | | | | 22,986,730 | | | | | | 1,024,822 | | | | 20,907,311 | |
Shares redeemed | | | (7,206,587 | ) | | | (143,331,269 | ) | | | | | (8,764,964 | ) | | | (184,509,072 | ) |
| | | | | | | | | | | | | | | | | | |
Net decrease | | | (5,923,350 | ) | | $ | (118,776,366 | ) | | | | | (7,583,160 | ) | | $ | (160,266,365 | ) |
| | | | | | | | | | | | | | | | | | |
| | | | | | | | | | | | | | | | | | |
| Investor C | | | | | | | | | | | | | | | | | | |
Shares sold | | | 73,316,764 | | | $ | 1,366,789,759 | | | | | | 95,880,065 | | | $ | 1,913,456,863 | |
Shares issued to shareholders in reinvestment of distributions | | | 70,612,958 | | | | 1,268,717,235 | | | | | | 42,231,571 | | | | 817,979,281 | |
Shares redeemed | | | (165,020,273 | ) | | | (3,074,566,720 | ) | | | | | (137,140,748 | ) | | | (2,740,323,509 | ) |
| | | | | | | | | | | | | | | | | | |
Net increase (decrease) | | | (21,090,551 | ) | | $ | (439,059,726 | ) | | | | | 970,888 | | | $ | (8,887,365 | ) |
| | | | | | | | | | | | | | | | | | |
| | | | | | | | | | | | | | | | | | |
| Class R | | | | | | | | | | | | | | | | | | |
Shares sold | | | 13,860,593 | | | $ | 268,625,117 | | | | | | 12,589,737 | | | $ | 262,113,249 | |
Shares issued to shareholders in reinvestment of distributions | | | 5,734,133 | | | | 107,765,431 | | | | | | 3,559,691 | | | | 71,864,086 | |
Shares redeemed | | | (17,907,156 | ) | | | (349,827,886 | ) | | | | | (16,772,524 | ) | | | (348,974,272 | ) |
| | | | | | | | | | | | | | | | | | |
Net increase (decrease) | | | 1,687,570 | | | $ | 26,562,662 | | | | | | (623,096 | ) | | $ | (14,996,937 | ) |
| | | | | | | | | | | | | | | | | | |
Total Net Increase (decrease) | | | (33,702,382 | ) | | $ | (838,291,796 | ) | | | | | 9,574,368 | | | $ | 117,188,082 | |
| | | | | | | | | | | | | | | | | | |
12. Subsequent Events:
Management has evaluated the impact of all subsequent events on the Fund through the date the consolidated financial statements were issued and has determined that there were no subsequent events requiring adjustment or additional disclosure in the consolidated financial statements.
| | | | | | |
| | | | | | | |
| 58 | | BLACKROCK GLOBAL ALLOCATION FUND, INC. | | OCTOBER 31, 2015 | | |
| | | | |
| Report of Independent Registered Public Accounting Firm | | |
To the Shareholders and Board of Directors of BlackRock Global Allocation Fund, Inc.:
We have audited the accompanying consolidated statement of assets and liabilities of BlackRock Global Allocation Fund, Inc. and Subsidiary (the “Fund”), including the consolidated schedule of investments, as of October 31, 2015, and the related consolidated statement of operations for the year then ended, the consolidated statements of changes in net assets for each of the two years in the period then ended, and the consolidated financial highlights for each of the five years in the period then ended. These financial statements and financial highlights are the responsibility of the Fund’s management. Our responsibility is to express an opinion on these financial statements and financial highlights based on our audits.
We conducted our audits in accordance with the standards of the Public Company Accounting Oversight Board (United States). Those standards require that we plan and perform the audit to obtain reasonable assurance about whether the financial statements and financial highlights are free of material misstatement. The Fund is not required to have, nor were we engaged to perform, an audit of its internal control over financial reporting. Our audits included consideration of internal control over financial reporting as a basis for designing audit procedures that are appropriate in the circumstances, but not for the purpose of expressing an opinion on the effectiveness of the Fund’s internal control over financial reporting. Accordingly, we express no such opinion. An audit also includes examining, on a test basis, evidence supporting the amounts and disclosures in the financial statements, assessing the accounting principles used and significant estimates made by management, as well as evaluating the overall financial statement presentation. Our procedures included confirmation of securities owned as of October 31, 2015, by correspondence with the custodian, brokers and agent banks; where replies were not received from brokers or agent banks, we performed other auditing procedures. We believe that our audits provide a reasonable basis for our opinion.
In our opinion, such consolidated financial statements and consolidated financial highlights referred to above present fairly, in all material respects, the consolidated financial position of BlackRock Global Allocation Fund, Inc. and Subsidiary as of October 31, 2015, the consolidated results of their operations for the year then ended, the consolidated changes in their net assets for each of the two years in the period then ended, and the consolidated financial highlights for each of the five years in the period then ended, in conformity with accounting principles generally accepted in the United States of America.
Deloitte & Touche LLP
Boston, Massachusetts
December 23, 2015
|
| Important Tax Information (Unaudited) |
During the fiscal year ended October 31, 2015 the following information is provided with respect to the ordinary income distributions paid by BlackRock Global Allocation Fund, Inc.
| | | | | | | | | | |
| | | Payable Date: | | December 17, 2014 | | | July 16, 2015 | |
Qualified Dividend Income for Individuals1 | | | | | 46.52% | | | | 59.50% | |
Dividends Qualifying for the Dividends Received Deduction for Corporations1 | | | | | 16.43% | | | | 12.39% | |
Federal Obligation Interest2 | | | | | 1.38% | | | | 1.50% | |
Interest-Related Dividends for Non-U.S. Residents3 | | | | | 37.36% | | | | 49.50% | |
| | 1 | | The Fund hereby designates the percentage indicated above or the maximum amount allowable by law. |
| | 2 | | The law varies in each state as to whether and what percentage of dividend income attributable to federal obligations is exempt from state income tax. We recommend that you consult your tax advisor to determine if any portion of the dividends you received is exempt from state income taxes. |
| | 3 | | Represents the portion of the taxable ordinary income dividends eligible for exemption from U.S. withholding tax for nonresident aliens and foreign corporations. |
Additionally, the Fund distributed long-term capital gains of $1.263436 per share to shareholders of record on December 16, 2014.
| | | | | | |
| | | | | | | |
| | BLACKROCK GLOBAL ALLOCATION FUND, INC. | | OCTOBER 31, 2015 | | 59 |
| | |
| Disclosure of Investment Advisory Agreement | | |
The Board of Directors (the “Board,” and the members of which are referred to as “Board Members”) of the BlackRock Global Allocation Fund, Inc. (the “Fund”) met in person on April 14, 2015 (the “April Meeting”) and May 12-13, 2015 (the “May Meeting”) to consider the approval of the Fund’s investment advisory agreement (the “Advisory Agreement” or the “Agreement”) with BlackRock Advisors, LLC (the “Manager” or “BlackRock”), the Fund’s investment advisor.
Activities and Composition of the Board
On the date of the April and May Meetings, the Board consisted of thirteen individuals, ten of whom were not “interested persons” of the Fund as defined in the Investment Company Act of 1940, as amended (the “1940 Act”) (the “Independent Board Members”). One of the Board Members is a non-management interested Board Member by virtue of his former positions with BlackRock, Inc. and its affiliates. The Board Members are responsible for the oversight of the operations of the Fund and perform the various duties imposed on the directors of investment companies by the 1940 Act. The Independent Board Members have retained independent legal counsel to assist them in connection with their duties. The Chairman of the Board is an Independent Board Member. The Board has established five standing committees: an Audit Committee, a Governance and Nominating Committee, a Compliance Committee, a Performance Oversight Committee and an Executive Committee, each of which is chaired by an Independent Board Member and composed of Independent Board Members (except for the Performance Oversight Committee and the Executive Committee, each of which also has one interested Board Member).
The Agreement
Pursuant to the 1940 Act, the Board is required to consider the continuation of the Agreement on an annual basis. The Board has four quarterly meetings per year, each extending over two days, a fifth one-day meeting to consider specific information surrounding the consideration of renewing the Agreement and additional in-person and telephonic meetings as needed. In connection with this year-long deliberative process, the Board assessed, among other things, the nature, extent and quality of the services provided to the Fund by BlackRock, BlackRock’s personnel and affiliates, including (as applicable): investment management services; administrative and shareholder services; the oversight of fund service providers; marketing services; risk oversight; compliance; and ability to meet applicable legal and regulatory requirements.
The Board, acting directly and through its committees, considers at each of its meetings, and from time to time as appropriate, factors that are relevant to its annual consideration of the renewal of the Agreement, including the services and support provided by BlackRock to the Fund and its shareholders. Among the matters the Board considered were: (a) investment performance for one-year, three-year, five-year and/or since inception periods, as applicable, against peer funds, applicable benchmark, and performance metrics, as applicable, as well as senior management’s and portfolio managers’ analysis of the reasons for any over-performance or underperformance relative to peers, benchmarks, and other performance metrics, as applicable; (b) fees, including advisory, administration, if applicable, and other amounts paid to BlackRock and its affiliates by the Fund for services, such as marketing and distribution, call center and fund accounting; (c) Fund operating expenses and how BlackRock allocates expenses to the Fund; (d) the resources devoted to, risk oversight of, and compliance reports relating to, implementation of the Fund’s investment objective(s), policies and restrictions, and meeting new regulatory requirements; (e) the Fund’s compliance with its compliance policies and procedures; (f) the nature, cost and character of non-investment management services provided by BlackRock and its affiliates; (g) BlackRock’s and other service providers’ internal controls and risk and compliance oversight mechanisms; (h) BlackRock’s implementation of the proxy voting policies approved by the Board; (i) the use of brokerage commissions and execution quality of portfolio transactions; (j) BlackRock’s implementation of the Fund’s valuation and liquidity procedures; (k) an analysis of management fees for products with similar investment mandates across the open-end fund, exchange-traded fund (“ETF”), closed-end fund and institutional account product channels, as applicable, and the similarities and differences between these products and the services provided as compared to the Fund; (l) BlackRock’s compensation methodology for its investment professionals and the incentives it creates, along with investment professionals’ investments in the fund(s) they manage; and (m) periodic updates on BlackRock’s business.
The Board has engaged in an ongoing strategic review with BlackRock of opportunities to consolidate funds and of BlackRock’s commitment to investment performance. BlackRock also furnished information to the Board in response to specific questions. These questions covered issues such as: BlackRock’s profitability; investment performance; subadvisory and advisory relationships with other clients (including mutual funds sponsored by third parties); the viability of specific funds; fund size and manager capacity; BlackRock’s research capabilities; portfolio managers’ investments in funds they manage; funds’ portfolio risk targets; and management fee levels and breakpoints. The Board further discussed with BlackRock: BlackRock’s management structure; portfolio turnover, execution quality and use of soft dollars; BlackRock’s portfolio manager compensation and performance accountability; marketing support for the funds; services provided to the funds by BlackRock affiliates; and BlackRock’s oversight of relationships with third party service providers.
| | | | | | |
| | | | | | | |
| 60 | | BLACKROCK GLOBAL ALLOCATION FUND, INC. | | OCTOBER 31, 2015 | | |
| | | | |
| Disclosure of Investment Advisory Agreement (continued) | | |
Board Considerations in Approving the Agreement
The Approval Process: Prior to the April Meeting, the Board requested and received materials specifically relating to the Agreement. The Board is continuously engaged in a process with its independent legal counsel and BlackRock to review the nature and scope of the information provided to better assist its deliberations. The materials provided in connection with the April Meeting included (a) information independently compiled and prepared by Lipper, Inc. (“Lipper”) on Fund fees and expenses as compared with a peer group of funds as determined by Lipper (“Expense Peers”) and the investment performance of the Fund as compared with a peer group of funds as determined by Lipper1 and certain performance metrics; (b) information on the profits realized by BlackRock and its affiliates pursuant to the Agreement and a discussion of fall-out benefits to BlackRock and its affiliates; (c) a general analysis provided by BlackRock concerning investment management fees charged to other clients, such as institutional clients, sub-advised mutual funds, ETFs and closed-end funds, under similar investment mandates, as well as the performance of such other clients, as applicable; (d) review of non-management fees; (e) the existence, impact and sharing of potential economies of scale; (f) a summary of aggregate amounts paid by the Fund to BlackRock; (g) sales and redemption data regarding the Fund’s shares; and (h) if applicable, a comparison of management fees to similar BlackRock open-end funds, as classified by Lipper.
At the April Meeting, the Board reviewed materials relating to its consideration of the Agreement. As a result of the discussions that occurred during the April Meeting, and as a culmination of the Board’s year-long deliberative process, the Board presented BlackRock with questions and requests for additional information. BlackRock responded to these requests with additional written information in advance of the May Meeting.
At the May Meeting, the Board, including the Independent Board Members, approved the continuation of the Advisory Agreement between the Manager and the Fund for a one-year term ending June 30, 2016. In approving the continuation of the Agreement, the Board considered: (a) the nature, extent and quality of the services provided by BlackRock; (b) the investment performance of the Fund and BlackRock; (c) the advisory fee and the cost of the services and profits to be realized by BlackRock and its affiliates from their relationship with the Fund; (d) the Fund’s costs to investors compared to the costs of Expense Peers and performance compared to the relevant performance comparison as previously discussed; (e) the sharing of potential economies of scale; (f) fall-out benefits to BlackRock and its affiliates as a result of its relationship with the Fund; and (g) other factors deemed relevant by the Board Members.
The Board also considered other matters it deemed important to the approval process, such as payments made to BlackRock or its affiliates relating to the distribution of Fund shares, securities lending and cash management, services related to the valuation and pricing of Fund portfolio holdings, direct and indirect benefits to BlackRock and its affiliates from their relationship with the Fund and advice from independent legal counsel with respect to the review process and materials submitted for the Board’s review. The Board noted the willingness of BlackRock personnel to engage in open, candid discussions with the Board. The Board did not identify any particular information as determinative, and each Board Member may have attributed different weights to the various items considered.
A. Nature, Extent and Quality of the Services Provided by BlackRock: The Board, including the Independent Board Members, reviewed the nature, extent and quality of services provided by BlackRock, including the investment advisory services and the resulting performance of the Fund. Throughout the year, the Board compared Fund performance to the performance of a comparable group of mutual funds, a relevant benchmark, and performance metrics, as applicable. The Board met with BlackRock’s senior management personnel responsible for investment activities, including the senior investment officers. The Board also reviewed the materials provided by the Fund’s portfolio management team discussing the Fund’s performance and the Fund’s investment objective(s), strategies and outlook.
The Board considered, among other factors, with respect to BlackRock: the number, education and experience of investment personnel generally and the Fund’s portfolio management team; BlackRock’s research capabilities; investments by portfolio managers in the funds they manage; portfolio trading capabilities; use of technology; commitment to compliance; credit analysis capabilities; risk analysis and oversight capabilities; and the approach to training and retaining portfolio managers and other research, advisory and management personnel. The Board engaged in a review of BlackRock’s compensation structure with respect to the Fund’s portfolio management team and BlackRock’s ability to attract and retain high-quality talent and create performance incentives.
In addition to advisory services, the Board considered the quality of the administrative and other non-investment advisory services provided to the Fund. BlackRock and its affiliates provide the Fund with certain administrative, shareholder and other services (in addition to any such services provided to the Fund by third parties) and officers and other personnel as are necessary for the operations of the Fund. In particular, BlackRock and its affiliates provide the Fund with the following administrative services including, among others: (i) preparing disclosure documents, such as the prospectus, the summary
| 1 | | Funds are ranked by Lipper in quartiles, ranging from first to fourth, where first is the most desirable quartile position and fourth is the least desirable. |
| | | | | | |
| | | | | | | |
| | BLACKROCK GLOBAL ALLOCATION FUND, INC. | | OCTOBER 31, 2015 | | 61 |
| | |
| Disclosure of Investment Advisory Agreement (continued) | | |
prospectus (as applicable), the statement of additional information and periodic shareholder reports; (ii) oversight of daily accounting and pricing; (iii) overseeing and coordinating the activities of other service providers; (iv) organizing Board meetings and preparing the materials for such Board meetings; (v) providing legal and compliance support; (vi) furnishing analytical and other support to assist the Board in its consideration of strategic issues such as the merger, consolidation or repurposing of certain open-end funds; and (vii) performing other administrative functions necessary for the operation of the Fund, such as tax reporting, fulfilling regulatory filing requirements and call center services. The Board reviewed the structure and duties of BlackRock’s fund administration, shareholder services, legal and compliance departments and considered BlackRock’s policies and procedures for assuring compliance with applicable laws and regulations.
B. The Investment Performance of the Fund and BlackRock: The Board, including the Independent Board Members, also reviewed and considered the performance history of the Fund. In preparation for the April Meeting, the Board worked with its independent legal counsel, BlackRock and Lipper to develop a template for, and was provided with, reports independently prepared by Lipper, which included a comprehensive analysis of the Fund’s performance. The Board also reviewed a narrative and statistical analysis of the Lipper data that was prepared by BlackRock. In connection with its review, the Board received and reviewed information regarding the investment performance of the Fund as compared to other funds in its applicable Lipper category and certain performance metrics. The Board was provided with a description of the methodology used by Lipper to select peer funds and periodically meets with Lipper representatives to review its methodology. The Board and its Performance Oversight Committee regularly review, and meet with Fund management to discuss, the performance of the Fund throughout the year.
In evaluating performance, the Board recognized that the performance data reflects a snapshot of a period or as of a particular date and that selecting a different performance period could produce significantly different results. Further, the Board recognized that it is possible that long-term performance can be adversely affected by even one period of significant underperformance so that a single investment decision or theme has the ability to affect long-term performance disproportionately.
The Board noted that for the one-, three- and five-year periods reported, the Fund ranked in the third, third and fourth quartiles, respectively, against its Lipper Performance Universe. The Board and BlackRock reviewed and discussed the reasons for the Fund’s underperformance during these periods. The Board was informed that, among other things, major detractors from performance during the one-, three- and five-year periods included stock selection and an underweight in the U.S., stock selection in Canada (largely attributed to gold-related securities), an overweight position to select emerging market countries such as Russia and Brazil, and an underweight to fixed income, notably U.S. Treasuries. Additionally, an overweight to cash negatively impacted performance as global equity and fixed income markets broadly advanced over the period.
C. Consideration of the Advisory/Management Fees and the Cost of the Services and Profits to be Realized by BlackRock and its Affiliates from their Relationship with the Fund: The Board, including the Independent Board Members, reviewed the Fund’s contractual management fee rate compared with the other funds in its Lipper category. The contractual management fee rate represents a combination of the advisory fee and any administrative fees, before taking into account any reimbursements or fee waivers. The Board also compared the Fund’s total expense ratio, as well as its actual management fee rate, to those of other funds in its Lipper category. The total expense ratio represents a fund’s total net operating expenses, including any 12b-1 or non 12b-1 service fees. The total expense ratio gives effect to any expense reimbursements or fee waivers that benefit a fund, and the actual management fee rate gives effect to any management fee reimbursements or waivers that benefit a fund. The Board considered the services provided and the fees charged by BlackRock and its affiliates to other types of clients with similar investment mandates, as applicable, including institutional accounts and sub-advised mutual funds.
The Board received and reviewed statements relating to BlackRock’s financial condition. The Board reviewed BlackRock’s profitability methodology and was also provided with a profitability analysis that detailed the revenues earned and the expenses incurred by BlackRock for services provided to the Fund. The Board reviewed BlackRock’s profitability with respect to the Fund and other funds the Board currently oversees for the year ended December 31, 2014 compared to available aggregate profitability data provided for the two prior years. The Board reviewed BlackRock’s profitability with respect to certain other U.S. fund complexes managed by the Manager and/or its affiliates. The Board reviewed BlackRock’s assumptions and methodology of allocating expenses in the profitability analysis, noting the inherent limitations in allocating costs among various advisory products. The Board recognized that profitability may be affected by numerous factors including, among other things, fee waivers and expense reimbursements by the Manager, the types of funds managed, precision of expense allocations and business mix. As a result, calculating and comparing profitability at individual fund levels is difficult.
The Board noted that, in general, individual fund or product line profitability of other advisors is not publicly available. The Board reviewed BlackRock’s overall operating margin, in general, compared to that of certain other publicly-traded asset management firms. The Board considered
| | | | | | |
| | | | | | | |
| 62 | | BLACKROCK GLOBAL ALLOCATION FUND, INC. | | OCTOBER 31, 2015 | | |
| | | | |
| Disclosure of Investment Advisory Agreement (concluded) | | |
the differences between BlackRock and these other firms, including the contribution of technology at BlackRock, BlackRock’s expense management, and the relative product mix.
In addition, the Board considered the cost of the services provided to the Fund by BlackRock, and BlackRock’s and its affiliates’ profits relating to the management and distribution of the Fund and the other funds advised by BlackRock and its affiliates. As part of its analysis, the Board reviewed BlackRock’s methodology in allocating its costs to the management of the Fund. The Board may periodically receive and review information from independent third parties as part of its annual evaluation. BlackRock retained an independent third party to evaluate its cost allocation methodologies in the context of BlackRock’s 1940 Act Fund business. The Board considered the results of that evaluation in connection with BlackRock’s profitability reporting. The Board also considered whether BlackRock has the financial resources necessary to attract and retain high quality investment management personnel to perform its obligations under the Agreement and to continue to provide the high quality of services that is expected by the Board. The Board further considered factors including but not limited to BlackRock’s commitment of time, assumption of risk and liability profile in servicing the Fund in contrast to what is required of BlackRock with respect to other products with similar investment mandates across the open-end fund, ETF, closed-end fund, sub-advised mutual fund and institutional account product channels, as applicable.
The Board noted that the Fund’s contractual management fee rate ranked in the third quartile, and that the actual management fee rate and total expense ratio each ranked in the second quartile, relative to the Fund’s Expense Peers. The Board also noted that the Fund has an advisory fee arrangement that includes voluntary breakpoints that adjust the fee rate downward as the size of the Fund increases above certain contractually specified levels.
D. Economies of Scale: The Board, including the Independent Board Members, considered the extent to which economies of scale might be realized as the assets of the Fund increase, as well as the existence of expense caps, as applicable. The Board also considered the extent to which the Fund benefits from such economies and whether there should be changes in the advisory fee rate or breakpoint structure in order to enable the Fund to participate in these economies of scale, for example through the use of contractual breakpoints and/or revised voluntary breakpoints in the advisory fee based upon the asset level of the Fund. In its consideration, the Board Members took into account the existence of any expense caps and further considered the continuation and/or implementation, as applicable, of such caps.
E. Other Factors Deemed Relevant by the Board Members: The Board, including the Independent Board Members, also took into account other ancillary or “fall-out” benefits that BlackRock or its affiliates may derive from their respective relationships with the Fund, both tangible and intangible, such as BlackRock’s ability to leverage its investment professionals who manage other portfolios and risk management personnel, an increase in BlackRock’s profile in the investment advisory community, and the engagement of BlackRock’s affiliates as service providers to the Fund, including for administrative, distribution, securities lending and cash management services. The Board also considered BlackRock’s overall operations and its efforts to expand the scale of, and improve the quality of, its operations. The Board also noted that BlackRock may use and benefit from third party research obtained by soft dollars generated by certain registered fund transactions to assist in managing all or a number of its other client accounts. The Board further noted that it had considered the investment by BlackRock’s funds in affiliated ETFs without any offset against the management fees payable by the funds to BlackRock.
In connection with its consideration of the Agreement, the Board also received information regarding BlackRock’s brokerage and soft dollar practices. The Board received reports from BlackRock which included information on brokerage commissions and trade execution practices throughout the year.
The Board noted the competitive nature of the open-end fund marketplace, and that shareholders are able to redeem their Fund shares if they believe that the Fund’s fees and expenses are too high or if they are dissatisfied with the performance of the Fund.
Conclusion
The Board, including the Independent Board Members, approved the continuation of the Advisory Agreement between the Manager and the Fund for a one-year term ending June 30, 2016. Based upon its evaluation of all of the aforementioned factors in their totality, the Board, including the Independent Board Members, was satisfied that the terms of the Agreement were fair and reasonable and in the best interest of the Fund and its shareholders. In arriving at its decision to approve the Agreement, the Board did not identify any single factor or group of factors as all-important or controlling, but considered all factors together, and different Board Members may have attributed different weights to the various factors considered. The Independent Board Members were also assisted by the advice of independent legal counsel in making this determination. The contractual fee arrangements for the Fund reflect the results of several years of review by the Board Members and predecessor Board Members, and discussions between such Board Members (and predecessor Board Members) and BlackRock. As a result, the Board Members’ conclusions may be based in part on their consideration of these arrangements in prior years.
| | | | | | |
| | | | | | | |
| | BLACKROCK GLOBAL ALLOCATION FUND, INC. | | OCTOBER 31, 2015 | | 63 |
| | | | | | | | | | |
Name, Address1 and Year of Birth | | Position(s) Held with
Fund | | Length of Time Served as a Director3 | | Principal Occupation(s) During Past Five Years | | Number of BlackRock-
Advised Registered
Investment Companies
(“RICs”) Consisting of
Investment Portfolios
(“Portfolios”) Overseen | | Public Directorships |
| Independent Directors2 |
Robert M. Hernandez 1944 | | Chair of the Board and Director | | Since 2007 | | Director, Vice Chairman and Chief Financial Officer of USX Corporation (energy and steel business) from 1991 to 2001; Director, TE Connectivity (electronics) from 2006 to 2012. | | 28 RICs consisting of 98 Portfolios | | ACE Limited (insurance company); Eastman Chemical Company |
Fred G. Weiss 1941 | | Vice Chair of the Board and Director | | Since 2007 | | Managing Director, FGW Consultancy LLC (consulting and investment company) since 1997; Director and Treasurer, Michael J. Fox Foundation for Parkinson’s Research since 2000; Director, BTG International plc (medical technology commercialization company) from 2001 to 2007. | | 28 RICs consisting of 98 Portfolios | | Allergan plc (pharmaceuticals) |
James H. Bodurtha 1944 | | Director | | Since 2007 | | Director, The China Business Group, Inc. (consulting and investing firm) from 1996 to 2013 and Executive Vice President thereof from 1996 to 2003; Chairman of the Board, Berkshire Holding Corporation since 1980. | | 28 RICs consisting of 98 Portfolios | | None |
Bruce R. Bond 1946 | | Director | | Since 2007 | | Trustee and Member of the Governance Committee, State Street Research Mutual Funds from 1997 to 2005; Board Member of Governance, Audit and Finance Committee, Avaya Inc. (computer equipment) from 2003 to 2007. | | 28 RICs consisting of 98 Portfolios | | None |
Valerie G. Brown 1956 | | Director | | Since 2015 | | Chief Executive Officer and Director, Cetera Financial Group (broker-dealer and registered investment adviser services) from 2010 to 2014; Director and Vice Chairman of the Board, Financial Services Institute (trade organization) from 2009 to 2014; Director and Committee Chair, Securities Industry and Financial Markets Association (trade organization) from 2006 to 2014. | | 28 RICs consisting of 98 Portfolios | | None |
Donald W. Burton 1944 | | Director | | Since 2007 | | Managing General Partner, The Burton Partnership, LP (an investment partnership) since 1979; Managing General Partner, The Burton Partnership (QP), LP (an investment partnership) since 2000; Managing General Partner, The South Atlantic Venture Funds from 1983 to 2012; Director, IDology, Inc. (technology solutions) since 2006; Director, Knology, Inc. (telecommunications) from 1996 to 2012; Director, Capital Southwest (financial) from 2006 to 2012. | | 28 RICs consisting of 98 Portfolios | | None |
Honorable Stuart E. Eizenstat 1943 | | Director | | Since 2007 | | Partner and Head of International Practice, Covington and Burling LLP (law firm) since 2001; International Advisory Board Member, The Coca-Cola Company from 2002 to 2011; Advisory Board Member, Veracity Worldwide, LLC (risk management) from 2007 to 2012; Member of the International Advisory Board GML Ltd. (energy) since 2003; Advisory Board Member, BT Americas (telecommunications) from 2004 to 2009. | | 28 RICs consisting of 98 Portfolios | | Alcatel-Lucent (tele- communications); Global Specialty Metallurgical; UPS Corporation (delivery service) |
Kenneth A. Froot 1957 | | Director | | Since 2007 | | Professor, Harvard University from 1993 to 2012. | | 28 RICs consisting of 98 Portfolios | | None |
John F. O’Brien 1943 | | Director | | Since 2007 | | Chairman, Woods Hole Oceanographic Institute since 2009 and Trustee thereof from 2003 to 2009. | | 28 RICs consisting of 98 Portfolios | | Cabot Corporation (chemicals); LKQ Corporation (auto parts manufacturing); TJX Companies, Inc. (retailer) |
Donald C. Opatrny 1952 | | Director | | Since 2015 | | Trustee, Member of the Executive Committee and Chair of the Investment Committee, Cornell University since 2004; Member of the Board and Investment Committee, University School since 2007; Member of the Investment Committee, Mellon Foundation from 2009 to 2015; President and Trustee, the Center for the Arts, Jackson Hole since 2011; Director, Athena Capital Advisors LLC (investment management firm) since 2013; Trustee and Chair of the Investment Committee, Community Foundation of Jackson Hole since 2014; Trustee, Artstor (a Mellon Foundation affiliate) since 2010; President, Trustee and Member of the Investment Committee, The Aldrich Contemporary Art Museum from 2007 to 2014. | | 28 RICs consisting of 98 Portfolios | | None |
| | | | | | |
| | | | | | | |
| 64 | | BLACKROCK GLOBAL ALLOCATION FUND, INC. | | OCTOBER 31, 2015 | | |
| | | | |
| Officers and Directors (continued) | | |
| | | | | | | | | | |
Name, Address1 and Year of Birth | | Position(s) Held with Fund | | Length of Time Served as a Director3 | | Principal Occupation(s) During Past Five Years | | Number of BlackRock-
Advised Registered
Investment Companies
(“RICs”) Consisting of
Investment Portfolios
(“Portfolios”) Overseen | | Public Directorships |
| Independent Directors2 (concluded) |
Roberta Cooper Ramo 1942 | | Director | | Since 2007 | | Shareholder and Attorney, Modrall, Sperling, Roehl, Harris & Sisk, P.A. (law firm) since 1993; Chairman of the Board, Cooper’s Inc. (retail) since 1999; Director, ECMC Group (service provider to students, schools and lenders) since 2001; President, The American Law Institute (non-profit) since 2008; Vice President, Santa Fe Opera (non-profit) since 2011; Chair, Think New Mexico (non-profit), since 2013. | | 28 RICs consisting of 98 Portfolios | | None |
David H. Walsh 1941 | | Director | | Since 2007 | | Director, National Museum of Wildlife Art since 2007; Trustee, University of Wyoming Foundation from 2008 to 2012; Director, The American Museum of Fly Fishing since 1997. | | 28 RICs consisting of 98 Portfolios | | None |
| | 1 The address of each Director is c/o BlackRock, Inc., 55 East 52nd Street, New York, NY 10055. |
| | 2 Each Independent Director holds office until his or her successor is duly elected and qualifies or until his or her earlier death, resignation, retirement or removal as provided by the Fund’s by-laws or charter or statute. In no event may an Independent Director hold office beyond December 31 of the year in which he or she turns 75. |
| | 3 Date shown is the earliest date a person has served for the Fund. Following the combination of Merrill Lynch Investment Managers, L.P. (“MLIM”) and BlackRock, Inc. (“BlackRock”) in September 2006, the various legacy MLIM and legacy BlackRock fund boards were realigned and consolidated into three new fund boards in 2007. As a result, although the chart shows certain Directors as joining the Corporation’s board in 2007, those Directors first became members of the boards of other legacy MLIM or legacy BlackRock funds as follows: James H. Bodurtha, 1995; Bruce R. Bond, 2005; Donald W. Burton, 2002; Honorable Stuart E. Eizenstat, 2001; Kenneth A. Froot, 2005; Robert M. Hernandez, 1996; John F. O’Brien, 2005; Roberta Cooper Ramo, 1999; David H. Walsh, 2003; and Fred G. Weiss, 1998. |
| Interested Directors4 |
Robert Fairbairn 1965 | | Director | | Since 2015 | | Senior Managing Director of BlackRock since 2010; Global Head of BlackRock’s Retail and iShares businesses since 2012; Member of BlackRock’s Global Executive and Global Operating Committees; Head of BlackRock’s Global Client Group from 2009 to 2012; Chairman of BlackRock’s international businesses from 2007 to 2010. | | 28 RICs consisting of 98 Portfolios | | None |
Henry Gabbay 1947 | | Director | | Since 2007 | | Consultant, BlackRock from 2007 to 2008; Managing Director, BlackRock from 1989 to 2007; Chief Administrative Officer, BlackRock Advisors, LLC from 1998 to 2007; President of BlackRock Funds and BlackRock Allocation Target Shares (formerly, BlackRock Bond Allocation Target Shares) from 2005 to 2007 and Treasurer of certain closed-end funds in the BlackRock fund complex from 1989 to 2006. | | 28 RICs consisting of 98 Portfolios | | None |
John M. Perlowski 1964 | | Director, President and Chief Executive Officer | | 2015 to present Director; 2010 to present President and Chief Executive Officer | | Managing Director of BlackRock since 2009; Head of BlackRock Global Fund Services since 2009; Managing Director and Chief Operating Officer of the Global Product Group at Goldman Sachs Asset Management, L.P. from 2003 to 2009; Treasurer of Goldman Sachs Mutual Funds from 2003 to 2009 and Senior Vice President thereof from 2007 to 2009; Director of Goldman Sachs Offshore Funds from 2002 to 2009; Director of Family Resource Network (charitable foundation) since 2009. | | 136 RICs consisting of 333 Portfolios | | None |
| | 4 Messrs. Fairbairn and Perlowski are both “interested persons,” as defined in the 1940 Act, of the Fund based on their positions with BlackRock and its affiliates. Mr. Gabbay may be deemed an “interested person” of the Fund based on his former positions with BlackRock and its affiliates. Mr. Gabbay does not currently serve as an officer or employee of BlackRock or its affiliates or own any securities of BlackRock or The PNC Financial Services Group, Inc. Mr. Gabbay is a non-management Interested Director. Interested Directors serve until their successor is duly elected and qualifies or until their earlier death, resignation, retirement or removal as provided by the Fund’s by-laws or charter or statute, or until December 31 of the year in which they turn 72. Officers of the Fund serve at the pleasure of the Board. |
| | | | | | |
| | | | | | | |
| | BLACKROCK GLOBAL ALLOCATION FUND, INC. | | OCTOBER 31, 2015 | | 65 |
| | |
| Officers and Directors (concluded) | | |
| | | | | | |
Name, Address1 and Year of Birth | | Position(s) Held with
Fund | | Length of Time Served as an Officer | | Principal Occupation(s) During Past Five Years |
| Officers2 |
John M. Perlowski 1964 | | Director, President and Chief Executive Officer | | 2015 to present Director; 2010 to present President and Chief Executive Officer | | Managing Director of BlackRock since 2009; Head of BlackRock Global Fund Services since 2009; Managing Director and Chief Operating Officer of the Global Product Group at Goldman Sachs Asset Management, L.P. from 2003 to 2009; Treasurer of Goldman Sachs Mutual Funds from 2003 to 2009 and Senior Vice President thereof from 2007 to 2009; Director of Goldman Sachs Offshore Funds from 2002 to 2009; Director of Family Resource Network (charitable foundation) since 2009. |
Jennifer McGovern 1977 | | Vice President | | Since 2014 | | Director of BlackRock since 2011; Head of Product Structure and Oversight for BlackRock’s U.S. Wealth Advisory Group since 2013; Vice President of BlackRock from 2008 to 2010. |
Neal Andrews 1966 | | Chief Financial Officer | | Since 2007 | | Managing Director of BlackRock since 2006; Senior Vice President and Line of Business Head of Fund Accounting and Administration at PNC Global Investment Servicing (U.S.) Inc. from 1992 to 2006. |
Jay Fife 1970 | | Treasurer | | Since 2007 | | Managing Director of BlackRock since 2007; Director of BlackRock in 2006; Assistant Treasurer of the MLIM and Fund Asset Management, L.P. advised funds from 2005 to 2006; Director of MLIM Fund Services Group from 2001 to 2006. |
Charles Park 1967 | | Chief Compliance Officer | | Since 2014 | | Anti-Money Laundering Compliance Officer for the BlackRock-advised Funds in the Equity-Bond Complex, the Equity-Liquidity Complex and the Closed-End Complex from 2014 to 2015; Chief Compliance Officer of BlackRock Advisors, LLC and the BlackRock-advised Funds in the Equity-Bond Complex, the Equity-Liquidity Complex and the Closed-End Complex since 2014; Principal of and Chief Compliance Officer for iShares® Delaware Trust Sponsor LLC since 2012 and BlackRock Fund Advisors (“BFA”) since 2006; Chief Compliance Officer for the BFA-advised iShares exchange traded funds since 2006; Chief Compliance Officer for BlackRock Asset Management International Inc. since 2012. |
Fernanda Piedra 1969 | | Anti-Money Laundering Compliance Officer | | Since 2015 | | Director of BlackRock since 2014; Anti-Money Laundering Compliance Officer and Regional Head of Financial Crime for the Americas at BlackRock since 2014; Head of Regulatory Changes and Remediation for the Asset Wealth Management Division of Deutsche Bank from 2010 to 2014; Vice President of Goldman Sachs (Anti-Money Laundering/Suspicious Activities Group) from 2004 to 2010. |
Benjamin Archibald 1975 | | Secretary | | Since 2012 | | Managing Director of BlackRock since 2014; Director of BlackRock from 2010 to 2013; Secretary of the iShares exchange traded funds since 2015; Secretary of the BlackRock-advised mutual funds since 2012. |
| | 1 The address of each Officer is c/o BlackRock, Inc., 55 East 52nd Street, New York, NY 10055. |
| | 2 Officers of the Fund serve at the pleasure of the Board. |
| | Further information about the Fund’s Officers and Directors is available in the Fund’s Statement of Additional Information, which can be obtained without charge by calling (800) 441-7762. |
| | | | | | |
| | | | |
Investment Advisor BlackRock Advisors, LLC Wilmington, DE 19809 | | Custodian Brown Brothers Harriman & Co. Boston, MA 02109 | | Distributor BlackRock Investments, LLC
New York, NY 10022 | | Address of the Fund
100 Bellevue Parkway
Wilmington, DE 19809 |
| | | |
| | Transfer Agent BNY Mellon Investment
Servicing (U.S.) Inc.
Wilmington, DE 19809 | | Independent Registered
Public Accounting Firm
Deloitte & Touche LLP
Boston, MA 02116 | | |
| | | |
| | Accounting Agent State Street Bank and Trust Company Boston, MA 02110 | | Legal Counsel Willkie Farr & Gallagher LLP New York, NY 10019 | | |
| | | | | | |
| | | | | | | |
| 66 | | BLACKROCK GLOBAL ALLOCATION FUND, INC. | | OCTOBER 31, 2015 | | |
Householding
The Fund will mail only one copy of shareholder documents, including prospectuses, annual and semi-annual reports and proxy statements, to shareholders with multiple accounts at the same address. This practice is commonly called “householding” and is intended to reduce expenses and eliminate duplicate mailings of shareholder documents. Mailings of your shareholder documents may be householded indefinitely unless you instruct us otherwise. If you do not want the mailing of these documents to be combined with those for other members of your household, please call the Fund at (800) 441-7762.
Availability of Quarterly Schedule of Investments
The Fund files its complete schedule of portfolio holdings with the SEC for the first and third quarters of each fiscal year on Form N-Q. The Fund’s Forms N-Q are available on the SEC’s website at http://www.sec.gov and may also be reviewed and copied at the SEC’s Public Reference Room in Washington, DC. Information on how to access documents on the SEC’s website without charge may be obtained by calling (800) SEC-0330. The Fund’s Forms N-Q may also be obtained upon request and without charge by calling (800) 441-7762.
Availability of Proxy Voting Policies and Procedures
A description of the policies and procedures that the Fund uses to determine how to vote proxies relating to portfolio securities is available upon request and without charge (1) by calling (800) 441-7762; (2) at http://www.blackrock.com; and (3) on the SEC’s website at http://www.sec.gov.
Availability of Proxy Voting Record
Information about how the Fund voted proxies relating to securities held in the Fund’s portfolio during the most recent 12-month period ended June 30 is available upon request and without charge (1) at http://www.blackrock.com or by calling (800) 441-7762 and (2) on the SEC’s website at http://www.sec.gov.
BlackRock’s Mutual Fund Family
BlackRock offers a diverse lineup of open-end mutual funds crossing all investment styles and managed by experts in equity, fixed income and tax-exempt investing. Visit http://www.blackrock.com for more information.
Account Information
Call us at (800) 441-7762 from 8:00 AM to 6:00 PM EST on any business day to get information about your account balances, recent transactions and share prices. You can also reach us on the Web at http://www.blackrock.com/funds.
Automatic Investment Plans
Investor Class shareholders who want to invest regularly can arrange to have $50 or more automatically deducted from their checking or savings account and invested in any of the BlackRock funds.
Systematic Withdrawal Plans
Investor Class shareholders can establish a systematic withdrawal plan and receive periodic payments of $50 or more from their BlackRock funds, as long as their account balance is at least $10,000.
Retirement Plans
Shareholders may make investments in conjunction with Traditional, Rollover, Roth, Coverdell, Simple IRAs, SEP IRAs and 403(b) Plans.
| | | | | | |
| | | | | | | |
| | BLACKROCK GLOBAL ALLOCATION FUND, INC. | | OCTOBER 31, 2015 | | 67 |
| | |
| Additional Information (concluded) | | |
|
| BlackRock Privacy Principles |
BlackRock is committed to maintaining the privacy of its current and former fund investors and individual clients (collectively, “Clients”) and to safeguarding their non-public personal information. The following information is provided to help you understand what personal information BlackRock collects, how we protect that information and why in certain cases we share such information with select parties.
If you are located in a jurisdiction where specific laws, rules or regulations require BlackRock to provide you with additional or different privacy-related rights beyond what is set forth below, then BlackRock will comply with those specific laws, rules or regulations.
BlackRock obtains or verifies personal non-public information from and about you from different sources, including the following: (i) information we receive from you or, if applicable, your financial intermediary, on applications, forms or other documents; (ii) information about your transactions with us, our affiliates, or others; (iii) information we receive from a consumer reporting agency; and (iv) from visits to our websites.
BlackRock does not sell or disclose to non-affiliated third parties any non-public personal information about its Clients, except as permitted by law or as is necessary to respond to regulatory requests or to service Client accounts. These non-affiliated third parties are required to protect the confidentiality and security of this information and to use it only for its intended purpose.
We may share information with our affiliates to service your account or to provide you with information about other BlackRock products or services that may be of interest to you. In addition, BlackRock restricts access to non-public personal information about its Clients to those BlackRock employees with a legitimate business need for the information. BlackRock maintains physical, electronic and procedural safeguards that are designed to protect the non-public personal information of its Clients, including procedures relating to the proper storage and disposal of such information.
| | | | | | |
| | | | | | | |
| 68 | | BLACKROCK GLOBAL ALLOCATION FUND, INC. | | OCTOBER 31, 2015 | | |
This report is intended for current holders. It is not authorized for use as an offer of sale or a solicitation of an offer to buy shares of the Fund unless preceded or accompanied by the Fund’s current prospectus. Past performance results shown in this report should not be considered a representation of future performance. Investment returns and principal value of shares will fluctuate so that shares, when redeemed, may be worth more or less than their original cost. Statements and other information herein are as dated and are subject to change.

| | |
| GA-10/15-AR | |  |
| Item 2 – | Code of Ethics – The registrant (or the “Fund”) has adopted a code of ethics, as of the end of the period covered by this report, applicable to the registrant’s principal executive officer, principal financial officer, principal accounting officer or controller, or persons performing similar functions. During the period covered by this report, the code of ethics was amended to update certain information and to make other non-material changes. During the period covered by this report, there have been no waivers granted under the code of ethics. The registrant undertakes to provide a copy of the code of ethics to any person upon request, without charge, by calling 1-800-441-7762. |
| Item 3 – | Audit Committee Financial Expert – The registrant’s board of directors (the “board of directors”), has determined that (i) the registrant has the following audit committee financial experts serving on its audit committee and (ii) each audit committee financial expert is independent: |
Robert M. Hernandez
Fred G. Weiss
Stuart E. Eizenstat
Bruce R. Bond
Under applicable securities laws, a person determined to be an audit committee financial expert will not be deemed an “expert” for any purpose, including without limitation for the purposes of Section 11 of the Securities Act of 1933, as a result of being designated or identified as an audit committee financial expert. The designation or identification of a person as an audit committee financial expert does not impose on such person any duties, obligations, or liabilities greater than the duties, obligations, and liabilities imposed on such person as a member of the audit committee and board of directors in the absence of such designation or identification.
| Item 4 – | Principal Accountant Fees and Services |
The following table presents fees billed by Deloitte & Touche LLP (“D&T”) in each of the last two fiscal years for the services rendered to the Fund:
| | | | | | | | | | | | | | | | |
| | | (a) Audit Fees | | (b) Audit-Related Fees1 | | (c) Tax Fees2 | | (d) All Other Fees3 |
| Entity Name | | Current
Fiscal Year
End | | Previous
Fiscal Year End | | Current
Fiscal Year End | | Previous
Fiscal Year End | | Current
Fiscal Year End | | Previous
Fiscal Year End | | Current
Fiscal Year End | | Previous
Fiscal Year End |
| BlackRock Global Allocation Fund, Inc. | | $97,688 | | $88,944 | | $0 | | $0 | | $20,000 | | $15,350 | | $0 | | $0 |
The following table presents fees billed by D&T that were required to be approved by the registrant’s audit committee (the “Committee”) for services that relate directly to the operations or financial reporting of the Fund and that are rendered on behalf of BlackRock Advisors, LLC (“Investment Adviser” or “BlackRock”) and entities controlling, controlled by, or under common control with BlackRock (not including any sub-adviser whose role is primarily portfolio management and is subcontracted with or overseen by another investment adviser) that provide ongoing services to the Fund (“Fund Service Providers”):
2
| | | | |
| | | Current Fiscal Year End | | Previous Fiscal Year End |
(b) Audit-Related Fees1 | | $0 | | $0 |
(c) Tax Fees2 | | $0 | | $0 |
(d) All Other Fees3 | | $2,391,000 | | $2,555,000 |
1 The nature of the services includes assurance and related services reasonably related to the performance of the audit of financial statements not included in Audit Fees.
2 The nature of the services includes tax compliance, tax advice and tax planning.
3 Aggregate fees borne by BlackRock in connection with the review of compliance procedures and attestation thereto performed by D&T with respect to all of the registered closed-end funds and some of the registered open-end funds advised by BlackRock.
(e)(1) Audit Committee Pre-Approval Policies and Procedures:
The Committee has adopted policies and procedures with regard to the pre-approval of services. Audit, audit-related and tax compliance services provided to the registrant on an annual basis require specific pre-approval by the Committee. The Committee also must approve other non-audit services provided to the registrant and those non-audit services provided to the Investment Adviser and Fund Service Providers that relate directly to the operations and the financial reporting of the registrant. Certain of these non-audit services that the Committee believes are (a) consistent with the SEC’s auditor independence rules and (b) routine and recurring services that will not impair the independence of the independent accountants may be approved by the Committee without consideration on a specific case-by-case basis (“general pre-approval”). The term of any general pre-approval is 12 months from the date of the pre-approval, unless the Committee provides for a different period. Tax or other non-audit services provided to the registrant which have a direct impact on the operations or financial reporting of the registrant will only be deemed pre-approved provided that any individual project does not exceed $10,000 attributable to the registrant or $50,000 per project. For this purpose, multiple projects will be aggregated to determine if they exceed the previously mentioned cost levels.
Any proposed services exceeding the pre-approved cost levels will require specific pre-approval by the Committee, as will any other services not subject to general pre-approval (e.g., unanticipated but permissible services). The Committee is informed of each service approved subject to general pre-approval at the next regularly scheduled in-person board meeting. At this meeting, an analysis of such services is presented to the Committee for ratification. The Committee may delegate to the Committee Chairman the authority to approve the provision of and fees for any specific engagement of permitted non-audit services, including services exceeding pre-approved cost levels.
(e)(2) None of the services described in each of Items 4(b) through (d) were approved by the Committee pursuant to the de minimis exception in paragraph (c)(7)(i)(C) of Rule 2-01 of Regulation S-X.
(f) Not Applicable
3
(g) The aggregate non-audit fees paid to the accountant for services rendered by the accountant to the registrant, the Investment Adviser and the Fund Service Providers were:
| | | | | | |
| | | Entity Name | | Current Fiscal Year End | | Previous Fiscal Year End |
| | BlackRock Global Allocation Fund, Inc. | | $20,000 | | $15,350 |
Additionally, SSAE 16 Review (Formerly, SAS No. 70) fees for the current and previous fiscal years of $2,391,000 and $2,555,000, respectively, were billed by D&T to the Investment Adviser.
(h) The Committee has considered and determined that the provision of non-audit services that were rendered to the Investment Adviser and the Fund Service Providers that were not pre-approved pursuant to paragraph (c)(7)(ii) of Rule 2-01 of Regulation S-X is compatible with maintaining the principal accountant’s independence.
| Item 5 – | Audit Committee of Listed Registrants – Not Applicable |
| | (a) The registrant’s Schedule of Investments is included as part of the Report to Stockholders filed under Item 1 of this Form. |
| | (b) Not Applicable due to no such divestments during the semi-annual period covered since the previous Form N-CSR filing. |
| Item 7 – | Disclosure of Proxy Voting Policies and Procedures for Closed-End Management Investment Companies – Not Applicable |
| Item 8 – | Portfolio Managers of Closed-End Management Investment Companies – Not Applicable |
| Item 9 – | Purchases of Equity Securities by Closed-End Management Investment Company and Affiliated Purchasers – Not Applicable |
| Item 10 – | Submission of Matters to a Vote of Security Holders – There have been no material changes to these procedures. |
| Item 11 – | Controls and Procedures |
| | (a) – The registrant’s principal executive and principal financial officers, or persons performing similar functions, have concluded that the registrant’s disclosure controls and procedures (as defined in Rule 30a-3(c) under the Investment Company Act of 1940, as amended (the “1940 Act”)) are effective as of a date within 90 days of the filing of this report based on the evaluation of these controls and procedures required by Rule 30a-3(b) under the 1940 Act and Rule 15d-15(b) under the Securities Exchange Act of 1934, as amended. | |
| | (b) – There were no changes in the registrant’s internal control over financial reporting (as defined in Rule 30a-3(d) under the 1940 Act) that occurred during the second fiscal quarter of the period covered by this report that have materially affected, or are reasonably likely to materially affect, the registrant’s internal control over financial reporting. | |
4
| Item 12 – | Exhibits attached hereto |
| | (a)(1) – Code of Ethics – See Item 2 |
| | (a)(2) – Certifications – Attached hereto |
| | (b) – Certifications – Attached hereto |
5
Pursuant to the requirements of the Securities Exchange Act of 1934 and the Investment Company Act of 1940, the registrant has duly caused this report to be signed on its behalf by the undersigned, thereunto duly authorized.
| | |
| BlackRock Global Allocation Fund, Inc. |
| |
| By: | | /s/ John M. Perlowski |
| | John M. Perlowski |
| | Chief Executive Officer (principal executive officer) of |
| | BlackRock Global Allocation Fund, Inc. |
Date: January 4, 2016
Pursuant to the requirements of the Securities Exchange Act of 1934 and the Investment Company Act of 1940, this report has been signed below by the following persons on behalf of the registrant and in the capacities and on the dates indicated.
| | |
| By: | | /s/ John M. Perlowski |
| | John M. Perlowski |
| | Chief Executive Officer (principal executive officer) of |
| | BlackRock Global Allocation Fund, Inc. |
Date: January 4, 2016
| | |
| By: | | /s/ Neal J. Andrews |
| | Neal J. Andrews |
| | Chief Financial Officer (principal financial officer) of |
| | BlackRock Global Allocation Fund, Inc. |
Date: January 4, 2016
6